Using leaf margin analysis to estimate the mid-Cretaceous (Albian) paleolatitude of the Baja BC block Ian M. Miller ⁎ , Mark T. Brandon, Leo J. Hickey Yale University, Department of Geology and Geophysics, P.O. Box 208109, New Haven, CT 06520-8109, USA Received 25 December 2004; received in revised form 1 February 2006; accepted 14 February 2006 Available online 19 April 2006 Editor: E. Boyle Abstract The “Baja BC hypothesis”, which postulates that western Washington State, British Columbia and southern Alaska originated at the latitude of Mexico, has pitted paleomagnetic results against long-held interpretations about the tectonic evolution of western North America. In this paper we develop a new paleobotanical method for estimating paleolatitude and apply it to this problem. We start by showing that the modern MAT field for North America is well correlated with latitude, demonstrating the feasibility of using MAT to estimate paleolatitude. A compilation of MAT and floral data from 84 modern sites in Central and North America is used to establish a new prediction relationship, MAT = 1.32 + 28.99P , where P is the proportion of smooth-margined species within a floral sample at a site. Our analysis also includes a more complete estimate of the uncertainties associated with estimating MAT from a measurement of P . Using modern data, we show that MAT and P can be used to estimate latitude as well. We then apply this approach to resolve the paleolatitude of Baja BC. Eleven floral sites from stable North America are used to establish the latitudinal MAT profile for North America during the Albian and Cenomanian. A floral site from the Winthrop Formation, a mid-Cretaceous (110–100 Ma) fluvial unit in the Methow basin of northern Washington State, is linked to the Baja BC block and predates its proposed northward offset. Forty- three morphospecies of dicotyledonous angiosperm leaves from the Winthrop Formation give P = 0.76, which is equivalent to a MAT of 23.4 °C, indicating a subtropical to tropical climate. We use the North American MAT profile to estimate a paleolatitude of 38.4°N for the Winthrop flora, indicating ∼ 2200 km of northward offset relative to stable North America. © 2006 Elsevier B.V. All rights reserved. Keywords: mean annual temperature; leaf margin analysis; Baja BC block; Winthrop Formation; Methow basin; Albian stage; Washington state; paleobotany 1. Introduction The geology of southern Alaska, western British Columbia, and western Washington State was assem- bled during a major accretionary event at 100 to 85 Ma. This event is marked by the collision of the Insular superterrane (orange unit in Fig. 1) and other smaller terranes with the west coast of North America (NA), and the formation of the Coast Mountains orogen (yellow unit), which extends from western Washington to southern Alaska [1]. Geologists have long recognized that, after this Late Cretaceous accretion, the more outboard parts of the Northwest Cordillera were displaced northward along the North American margin. Motion on recognized strike-slip faults (e.g., Pinchi fault, Rocky Mountain Trench, Tintina fault, Straight Creek−Fraser fault, Fig. 1) account for an estimated Earth and Planetary Science Letters 245 (2006) 95 – 114 www.elsevier.com/locate/epsl ⁎ Corresponding author. Fax: +1 203 432 3134. E-mail address: [email protected] (I.M. Miller). 0012-821X/$ - see front matter © 2006 Elsevier B.V. All rights reserved. doi:10.1016/j.epsl.2006.02.022

Welcome message from author
This document is posted to help you gain knowledge. Please leave a comment to let me know what you think about it! Share it to your friends and learn new things together.
Transcript
etters 245 (2006) 95–114www.elsevier.com/locate/epsl
Earth and Planetary Science L
Using leaf margin analysis to estimate the mid-Cretaceous (Albian)paleolatitude of the Baja BC block
Ian M. Miller ⁎, Mark T. Brandon, Leo J. Hickey
Yale University, Department of Geology and Geophysics, P.O. Box 208109, New Haven, CT 06520-8109, USA
Received 25 December 2004; received in revised form 1 February 2006; accepted 14 February 2006Available online 19 April 2006
Editor: E. Boyle
Abstract
The “Baja BC hypothesis”, which postulates that western Washington State, British Columbia and southern Alaska originated atthe latitude ofMexico, has pitted paleomagnetic results against long-held interpretations about the tectonic evolution of western NorthAmerica. In this paper we develop a new paleobotanical method for estimating paleolatitude and apply it to this problem. We start byshowing that the modernMAT field for North America is well correlated with latitude, demonstrating the feasibility of usingMAT toestimate paleolatitude. A compilation ofMAT and floral data from 84 modern sites in Central and North America is used to establish anew prediction relationship, MAT=1.32+28.99P, where P is the proportion of smooth-margined species within a floral sample at asite. Our analysis also includes a more complete estimate of the uncertainties associated with estimatingMAT from a measurement ofP. Using modern data, we show that MAT and P can be used to estimate latitude as well. We then apply this approach to resolve thepaleolatitude of Baja BC. Eleven floral sites from stable North America are used to establish the latitudinal MAT profile for NorthAmerica during the Albian and Cenomanian. A floral site from theWinthrop Formation, a mid-Cretaceous (110–100Ma) fluvial unitin the Methow basin of northern Washington State, is linked to the Baja BC block and predates its proposed northward offset. Forty-three morphospecies of dicotyledonous angiosperm leaves from the Winthrop Formation give P=0.76, which is equivalent to aMATof 23.4 °C, indicating a subtropical to tropical climate. We use the North AmericanMAT profile to estimate a paleolatitude of 38.4°Nfor the Winthrop flora, indicating ∼2200 km of northward offset relative to stable North America.© 2006 Elsevier B.V. All rights reserved.
Keywords: mean annual temperature; leaf margin analysis; Baja BC block; Winthrop Formation; Methow basin; Albian stage; Washington state;paleobotany
1. Introduction
The geology of southern Alaska, western BritishColumbia, and western Washington State was assem-bled during a major accretionary event at 100 to 85 Ma.This event is marked by the collision of the Insularsuperterrane (orange unit in Fig. 1) and other smaller
⁎ Corresponding author. Fax: +1 203 432 3134.E-mail address: [email protected] (I.M. Miller).
0012-821X/$ - see front matter © 2006 Elsevier B.V. All rights reserved.doi:10.1016/j.epsl.2006.02.022
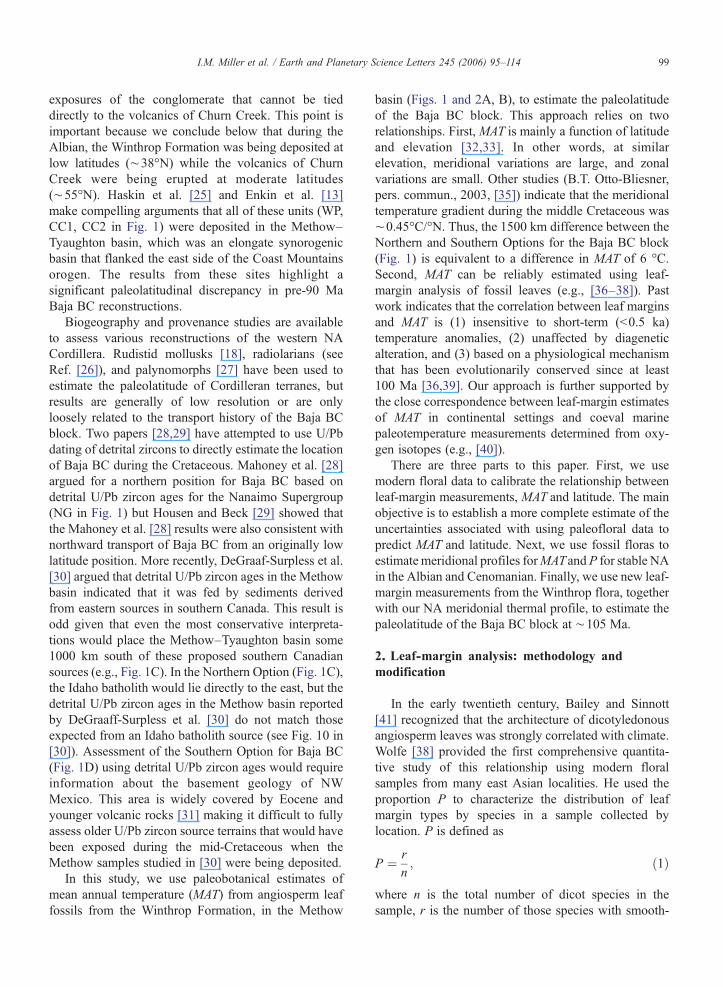
terranes with the west coast of North America (NA), andthe formation of the Coast Mountains orogen (yellowunit), which extends from western Washington tosouthern Alaska [1]. Geologists have long recognizedthat, after this Late Cretaceous accretion, the moreoutboard parts of the Northwest Cordillera weredisplaced northward along the North American margin.Motion on recognized strike-slip faults (e.g., Pinchifault, Rocky Mountain Trench, Tintina fault, StraightCreek−Fraser fault, Fig. 1) account for an estimated
96 I.M. Miller et al. / Earth and Planetary Science Letters 245 (2006) 95–114
∼500 to 1000 km of post-collisional northward motion[2,3].
A major problem with this interpretation is thatpaleomagnetic data accumulated over the last 30 yrsindicate much larger offsets after 85 Ma, involving∼2500 km of northward transport [4–13]. Some arguethat geologic evidence does not allow for such large,young offsets [3,14] but as of yet there are no definitivegeologic ties that preclude the proposed ∼2500 kmoffset of the Insular superterrane and the CoastMountain orogen [1,15]. Others contend that thediscrepancy is due to problems with paleomagneticmeasurements, such as unresolved tilting of plutons andinclination flattening in sedimentary units [16–18].These issues have been largely addressed [5,6,12] andthe corrected paleomagnetic data still show largenorthward transport. These results are also in agreement
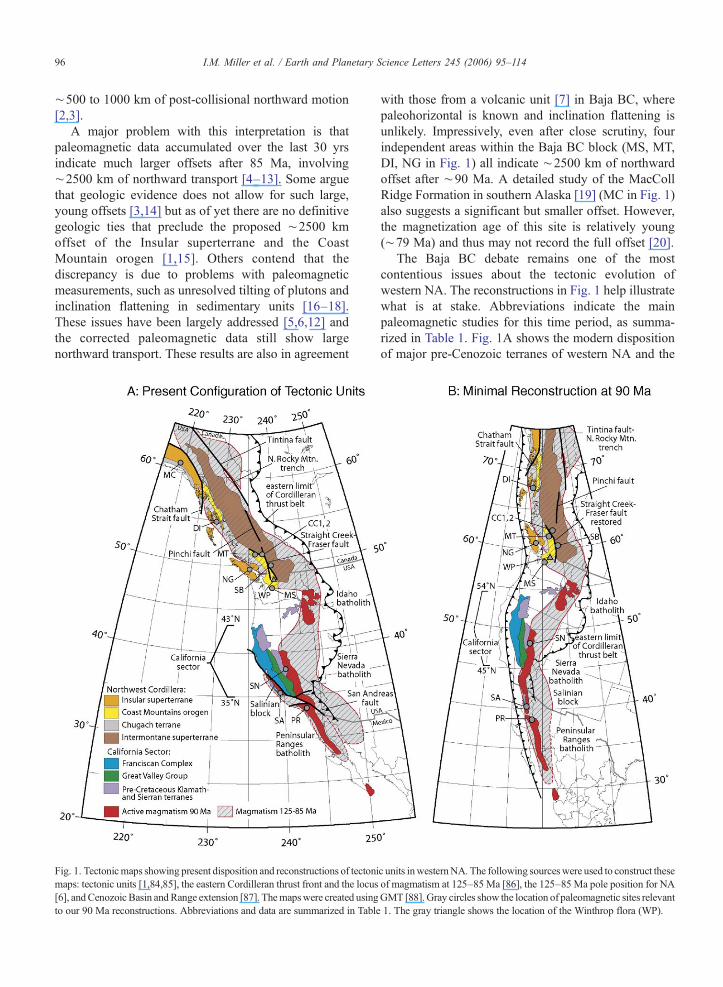
Fig. 1. Tectonicmaps showing present disposition and reconstructions of tectonimaps: tectonic units [1,84,85], the eastern Cordilleran thrust front and the locus[6], andCenozoic Basin andRange extension [87]. Themapswere created usingto our 90 Ma reconstructions. Abbreviations and data are summarized in Table
with those from a volcanic unit [7] in Baja BC, wherepaleohorizontal is known and inclination flattening isunlikely. Impressively, even after close scrutiny, fourindependent areas within the Baja BC block (MS, MT,DI, NG in Fig. 1) all indicate ∼2500 km of northwardoffset after ∼90 Ma. A detailed study of the MacCollRidge Formation in southern Alaska [19] (MC in Fig. 1)also suggests a significant but smaller offset. However,the magnetization age of this site is relatively young(∼79 Ma) and thus may not record the full offset [20].
The Baja BC debate remains one of the mostcontentious issues about the tectonic evolution ofwestern NA. The reconstructions in Fig. 1 help illustratewhat is at stake. Abbreviations indicate the mainpaleomagnetic studies for this time period, as summa-rized in Table 1. Fig. 1A shows the modern dispositionof major pre-Cenozoic terranes of western NA and the
c units inwesternNA. The following sourceswere used to construct theseof magmatism at 125–85 Ma [86], the 125–85 Ma pole position for NAGMT [88]. Gray circles show the location of paleomagnetic sites relevant1. The gray triangle shows the location of the Winthrop flora (WP).
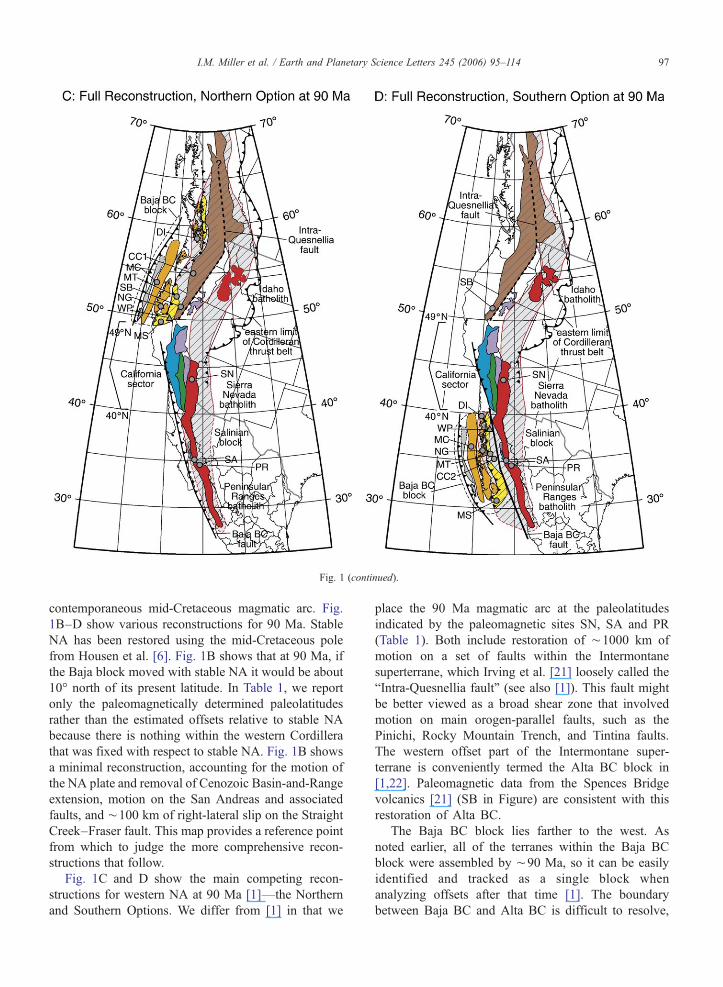
Fig. 1 (continued).
97I.M. Miller et al. / Earth and Planetary Science Letters 245 (2006) 95–114
contemporaneous mid-Cretaceous magmatic arc. Fig.1B–D show various reconstructions for 90 Ma. StableNA has been restored using the mid-Cretaceous polefrom Housen et al. [6]. Fig. 1B shows that at 90 Ma, ifthe Baja block moved with stable NA it would be about10° north of its present latitude. In Table 1, we reportonly the paleomagnetically determined paleolatitudesrather than the estimated offsets relative to stable NAbecause there is nothing within the western Cordillerathat was fixed with respect to stable NA. Fig. 1B showsa minimal reconstruction, accounting for the motion ofthe NA plate and removal of Cenozoic Basin-and-Rangeextension, motion on the San Andreas and associatedfaults, and ∼100 km of right-lateral slip on the StraightCreek–Fraser fault. This map provides a reference pointfrom which to judge the more comprehensive recon-structions that follow.
Fig. 1C and D show the main competing recon-structions for western NA at 90 Ma [1]—the Northernand Southern Options. We differ from [1] in that we
place the 90 Ma magmatic arc at the paleolatitudesindicated by the paleomagnetic sites SN, SA and PR(Table 1). Both include restoration of ∼1000 km ofmotion on a set of faults within the Intermontanesuperterrane, which Irving et al. [21] loosely called the“Intra-Quesnellia fault” (see also [1]). This fault mightbe better viewed as a broad shear zone that involvedmotion on main orogen-parallel faults, such as thePinichi, Rocky Mountain Trench, and Tintina faults.The western offset part of the Intermontane super-terrane is conveniently termed the Alta BC block in[1,22]. Paleomagnetic data from the Spences Bridgevolcanics [21] (SB in Figure) are consistent with thisrestoration of Alta BC.
The Baja BC block lies farther to the west. Asnoted earlier, all of the terranes within the Baja BCblock were assembled by ∼90 Ma, so it can be easilyidentified and tracked as a single block whenanalyzing offsets after that time [1]. The boundarybetween Baja BC and Alta BC is difficult to resolve,
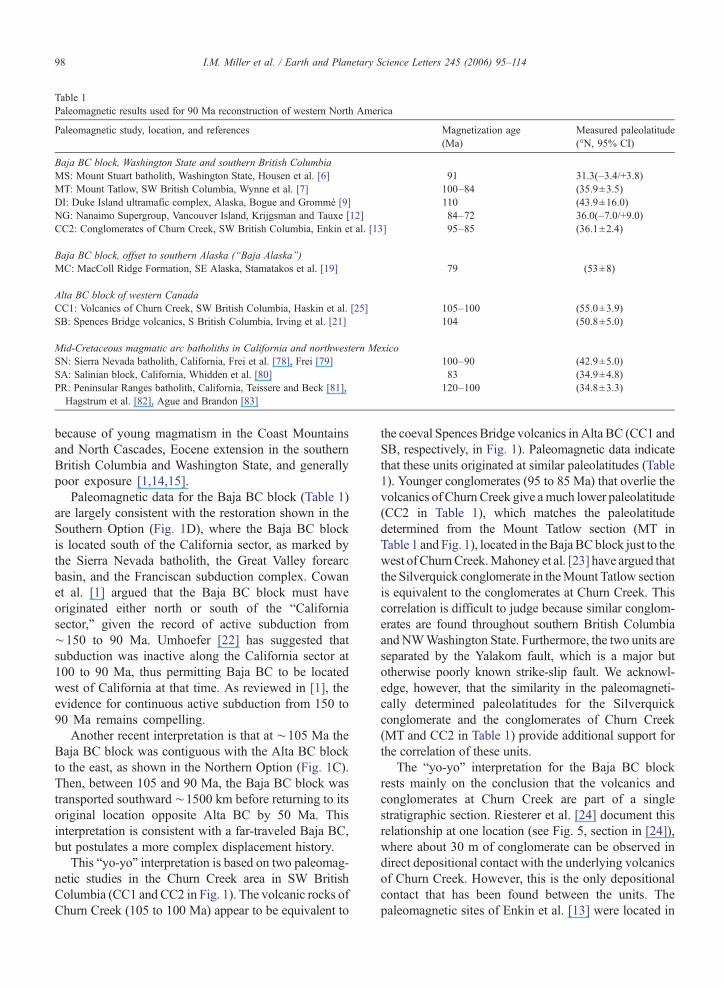
Table 1Paleomagnetic results used for 90 Ma reconstruction of western North America
Paleomagnetic study, location, and references Magnetization age(Ma)
Measured paleolatitude(°N, 95% CI)
Baja BC block, Washington State and southern British ColumbiaMS: Mount Stuart batholith, Washington State, Housen et al. [6] 91 31.3(–3.4/+3.8)MT: Mount Tatlow, SW British Columbia, Wynne et al. [7] 100–84 (35.9±3.5)DI: Duke Island ultramafic complex, Alaska, Bogue and Grommé [9] 110 (43.9±16.0)NG: Nanaimo Supergroup, Vancouver Island, Krijgsman and Tauxe [12] 84–72 36.0(–7.0/+9.0)CC2: Conglomerates of Churn Creek, SW British Columbia, Enkin et al. [13] 95–85 (36.1±2.4)
Baja BC block, offset to southern Alaska (“Baja Alaska”)MC: MacColl Ridge Formation, SE Alaska, Stamatakos et al. [19] 79 (53±8)
Alta BC block of western CanadaCC1: Volcanics of Churn Creek, SW British Columbia, Haskin et al. [25] 105–100 (55.0±3.9)SB: Spences Bridge volcanics, S British Columbia, Irving et al. [21] 104 (50.8±5.0)
Mid-Cretaceous magmatic arc batholiths in California and northwestern MexicoSN: Sierra Nevada batholith, California, Frei et al. [78], Frei [79] 100–90 (42.9±5.0)SA: Salinian block, California, Whidden et al. [80] 83 (34.9±4.8)PR: Peninsular Ranges batholith, California, Teissere and Beck [81],Hagstrum et al. [82], Ague and Brandon [83]
120–100 (34.8±3.3)
98 I.M. Miller et al. / Earth and Planetary Science Letters 245 (2006) 95–114
because of young magmatism in the Coast Mountainsand North Cascades, Eocene extension in the southernBritish Columbia and Washington State, and generallypoor exposure [1,14,15].
Paleomagnetic data for the Baja BC block (Table 1)are largely consistent with the restoration shown in theSouthern Option (Fig. 1D), where the Baja BC blockis located south of the California sector, as marked bythe Sierra Nevada batholith, the Great Valley forearcbasin, and the Franciscan subduction complex. Cowanet al. [1] argued that the Baja BC block must haveoriginated either north or south of the “Californiasector,” given the record of active subduction from∼150 to 90 Ma. Umhoefer [22] has suggested thatsubduction was inactive along the California sector at100 to 90 Ma, thus permitting Baja BC to be locatedwest of California at that time. As reviewed in [1], theevidence for continuous active subduction from 150 to90 Ma remains compelling.
Another recent interpretation is that at ∼105 Ma theBaja BC block was contiguous with the Alta BC blockto the east, as shown in the Northern Option (Fig. 1C).Then, between 105 and 90 Ma, the Baja BC block wastransported southward ∼1500 km before returning to itsoriginal location opposite Alta BC by 50 Ma. Thisinterpretation is consistent with a far-traveled Baja BC,but postulates a more complex displacement history.
This “yo-yo” interpretation is based on two paleomag-netic studies in the Churn Creek area in SW BritishColumbia (CC1 and CC2 in Fig. 1). The volcanic rocks ofChurn Creek (105 to 100 Ma) appear to be equivalent to
the coeval Spences Bridge volcanics in Alta BC (CC1 andSB, respectively, in Fig. 1). Paleomagnetic data indicatethat these units originated at similar paleolatitudes (Table1). Younger conglomerates (95 to 85 Ma) that overlie thevolcanics of Churn Creek give amuch lower paleolatitude(CC2 in Table 1), which matches the paleolatitudedetermined from the Mount Tatlow section (MT inTable 1 and Fig. 1), located in the BajaBCblock just to thewest of ChurnCreek.Mahoney et al. [23] have argued thatthe Silverquick conglomerate in theMount Tatlow sectionis equivalent to the conglomerates at Churn Creek. Thiscorrelation is difficult to judge because similar conglom-erates are found throughout southern British Columbiaand NWWashington State. Furthermore, the two units areseparated by the Yalakom fault, which is a major butotherwise poorly known strike-slip fault. We acknowl-edge, however, that the similarity in the paleomagneti-cally determined paleolatitudes for the Silverquickconglomerate and the conglomerates of Churn Creek(MT and CC2 in Table 1) provide additional support forthe correlation of these units.
The “yo-yo” interpretation for the Baja BC blockrests mainly on the conclusion that the volcanics andconglomerates at Churn Creek are part of a singlestratigraphic section. Riesterer et al. [24] document thisrelationship at one location (see Fig. 5, section in [24]),where about 30 m of conglomerate can be observed indirect depositional contact with the underlying volcanicsof Churn Creek. However, this is the only depositionalcontact that has been found between the units. Thepaleomagnetic sites of Enkin et al. [13] were located in
99I.M. Miller et al. / Earth and Planetary Science Letters 245 (2006) 95–114
exposures of the conglomerate that cannot be tieddirectly to the volcanics of Churn Creek. This point isimportant because we conclude below that during theAlbian, the Winthrop Formation was being deposited atlow latitudes (∼38°N) while the volcanics of ChurnCreek were being erupted at moderate latitudes(∼55°N). Haskin et al. [25] and Enkin et al. [13]make compelling arguments that all of these units (WP,CC1, CC2 in Fig. 1) were deposited in the Methow–Tyaughton basin, which was an elongate synorogenicbasin that flanked the east side of the Coast Mountainsorogen. The results from these sites highlight asignificant paleolatitudinal discrepancy in pre-90 MaBaja BC reconstructions.
Biogeography and provenance studies are availableto assess various reconstructions of the western NACordillera. Rudistid mollusks [18], radiolarians (seeRef. [26]), and palynomorphs [27] have been used toestimate the paleolatitude of Cordilleran terranes, butresults are generally of low resolution or are onlyloosely related to the transport history of the Baja BCblock. Two papers [28,29] have attempted to use U/Pbdating of detrital zircons to directly estimate the locationof Baja BC during the Cretaceous. Mahoney et al. [28]argued for a northern position for Baja BC based ondetrital U/Pb zircon ages for the Nanaimo Supergroup(NG in Fig. 1) but Housen and Beck [29] showed thatthe Mahoney et al. [28] results were also consistent withnorthward transport of Baja BC from an originally lowlatitude position. More recently, DeGraaf-Surpless et al.[30] argued that detrital U/Pb zircon ages in the Methowbasin indicated that it was fed by sediments derivedfrom eastern sources in southern Canada. This result isodd given that even the most conservative interpreta-tions would place the Methow–Tyaughton basin some1000 km south of these proposed southern Canadiansources (e.g., Fig. 1C). In the Northern Option (Fig. 1C),the Idaho batholith would lie directly to the east, but thedetrital U/Pb zircon ages in the Methow basin reportedby DeGraaff-Surpless et al. [30] do not match thoseexpected from an Idaho batholith source (see Fig. 10 in[30]). Assessment of the Southern Option for Baja BC(Fig. 1D) using detrital U/Pb zircon ages would requireinformation about the basement geology of NWMexico. This area is widely covered by Eocene andyounger volcanic rocks [31] making it difficult to fullyassess older U/Pb zircon source terrains that would havebeen exposed during the mid-Cretaceous when theMethow samples studied in [30] were being deposited.
In this study, we use paleobotanical estimates ofmean annual temperature (MAT) from angiosperm leaffossils from the Winthrop Formation, in the Methow
basin (Figs. 1 and 2A, B), to estimate the paleolatitudeof the Baja BC block. This approach relies on tworelationships. First, MAT is mainly a function of latitudeand elevation [32,33]. In other words, at similarelevation, meridional variations are large, and zonalvariations are small. Other studies (B.T. Otto-Bliesner,pers. commun., 2003, [35]) indicate that the meridionaltemperature gradient during the middle Cretaceous was∼0.45°C/°N. Thus, the 1500 km difference between theNorthern and Southern Options for the Baja BC block(Fig. 1) is equivalent to a difference in MAT of 6 °C.Second, MAT can be reliably estimated using leaf-margin analysis of fossil leaves (e.g., [36–38]). Pastwork indicates that the correlation between leaf marginsand MAT is (1) insensitive to short-term (<0.5 ka)temperature anomalies, (2) unaffected by diageneticalteration, and (3) based on a physiological mechanismthat has been evolutionarily conserved since at least100 Ma [36,39]. Our approach is further supported bythe close correspondence between leaf-margin estimatesof MAT in continental settings and coeval marinepaleotemperature measurements determined from oxy-gen isotopes (e.g., [40]).
There are three parts to this paper. First, we usemodern floral data to calibrate the relationship betweenleaf-margin measurements, MAT and latitude. The mainobjective is to establish a more complete estimate of theuncertainties associated with using paleofloral data topredict MAT and latitude. Next, we use fossil floras toestimate meridional profiles forMATand P for stable NAin the Albian and Cenomanian. Finally, we use new leaf-margin measurements from the Winthrop flora, togetherwith our NA meridonial thermal profile, to estimate thepaleolatitude of the Baja BC block at ∼105 Ma.
2. Leaf-margin analysis: methodology andmodification
In the early twentieth century, Bailey and Sinnott[41] recognized that the architecture of dicotyledonousangiosperm leaves was strongly correlated with climate.Wolfe [38] provided the first comprehensive quantita-tive study of this relationship using modern floralsamples from many east Asian localities. He used theproportion P to characterize the distribution of leafmargin types by species in a sample collected bylocation. P is defined as
P ¼ rn; ð1Þ
where n is the total number of dicot species in thesample, r is the number of those species with smooth-
100 I.M. Miller et al. / Earth and Planetary Science Letters 245 (2006) 95–114
margined leaves and (n− r) is the number of species withserrated or toothed-margined leaves. Sometimes a singlespecies will have both smooth and serrated leaves.These mixed character species are represented in r by ascore of 0.5, rather than 1.
Wolfe [38] found that P was most strongly correlatedwith MAT (R2 = 0.98 as reported by Wing andGreenwood [37]) and proposed that this relationshipwas the result of a physiological adaptation to localclimate, as represented by MAT. Wolfe [36,42] intro-duced an expanded method called the Climate LeafAnalysis Multivariate Program (CLAMP), which uses31 leaf physiognomic characters from a sample of leavesto predict climatic parameters, including MAT. Wolfe[42] found using an eigenvector analysis thatMAT and Pare the two most strongly correlated variables in theCLAMP dataset. Wilf [43] showed that MAT can beprecisely estimated using P alone. Thus, the strongcorrelation between P andMAT observed in modern leafstudies provides a confident basis for estimating paleo-MAT using fossil leaves (e.g., [40,45,46]).
Wilf [43] reported a more detailed analysis of therelationship of PwithMAT. His study included nine siteswith n ranging from 74 to 629. In comparison, Wolfe'sstudies typically had n ranging from 20 to 40. Thesedifferent studies provide an ideal basis to look at theerrors and uncertainties associated with estimating P andMAT. Fig. 2A shows a compilation of P andMAT values(N=84, where N indicates number of samples) formodern settings in North and Central America. Thesedata are from [36,43] and are compiled in Tables A1 andA2 (see Appendix A in data repository). Note that wehave excluded samples where n was not reported.
The plot shows an excellent correlation between Pand MAT supporting the inference of a linear relation-ship between these variables,
Pi ¼ a0 þ a1MATi þ ei; ð2Þ
where a0 and a1 are unknown parameters and εi is therandom error or misfit in the ith floral sample, where iruns from 1 to N. Our objective is to calibrate thisrelationship by applying the least-squares method to themodern floral data to find best-fit values for a0 and a1. Pi
is designed as the dependent variable for the least-squares fit, which means that the misfit εi is entirelyattributed to errors in Pi. Previous studies (e.g., [37,38])have regressed this relationship with MAT on the left,which implies that all of the misfit is due to error inMAT. This type of calibration will work just fine, but itdoes not allow a full evaluation of the errors (seeAppendix A for more on this topic). Our arrangement
for (2) is based on the fact that SE[P]≫ (dP / dMAT) SE[MAT], where SE[P] and SE[MAT] are the standarderrors (or uncertainties) for a pair of P and MATmeasurements. Below we show that SE[P] for the datain Fig. 2 is always >0.032 and SE[MAT] for NAtemperature data is ∼0.12 °C. Various least-squares fitsindicate that the trend in Fig. 2A has a slope dP /dMAT≈0.035 C−1. From this, we conclude that SE[P]is much greater than (dP / dMAT) SE[MAT] (compare>0.032 with 0.0042). We conclude that it is safe toassume that the misfit in the least-squares analysis ismainly the result of the larger errors associated withmeasuring P.
For calibration by least squares, it is important toaccount for the uncertainties associated with thedifferent P measurements in the modern calibrationdataset. The standard error SE[Pi] must include, atminimum, the natural variation or “sampling error”associated with estimating Pi from a sample of limitedsize. If this were the only source of error, then Pi wouldfollow a binomial distribution, so long as each leafspecies in the sample was drawn from independent butotherwise identically distributed (IID) populations. Inthis case, SE[Pi] would be defined by the binomialvariance function,
SE�Pi�2 ¼ Pið1−P1Þ
ni: ð3Þ
This uncertainty estimate was introduced for leaf-margin analysis by Wilf [43], but he emphasized that itonly represented part of the total uncertainty. A commonissue with binomial parameters, such as Pi, is over-dispersion [47,48], which means that the variation in Pi
is greater than that predicted by (3). We haveinvestigated several models for overdispersed binarydata and found that overdispersion in Pi is bestrepresented by the logistic normal distribution [48,49],which accounts for both fixed (binomial variation) andrandom (extrabinomial variation) effects. SE[Pi] isdefined by the logistic normal variance function,which can be approximated by
SE�Pi�2 ¼ 1þ φ ni−1ð ÞPi 1−Pið Þ½ �Pið1−PiÞ
ni; ð4Þ
when φ≪1 (see Refs. [48,49] for details). Over-dispersion is accounted for by the factor in squarebrackets. The degree of overdispersion is represented bythe overdispersion factor φ [38], which is assumed tohave a constant value for all of the P measurements.When φ=0, (4) reduces back to the standard binomialvariance function (3).
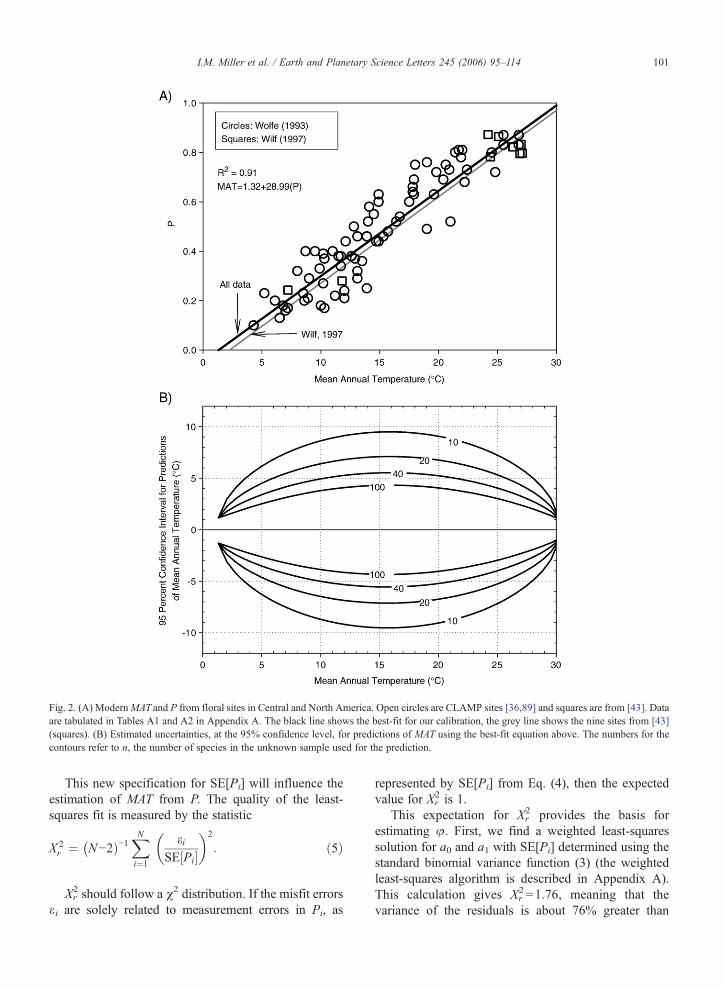
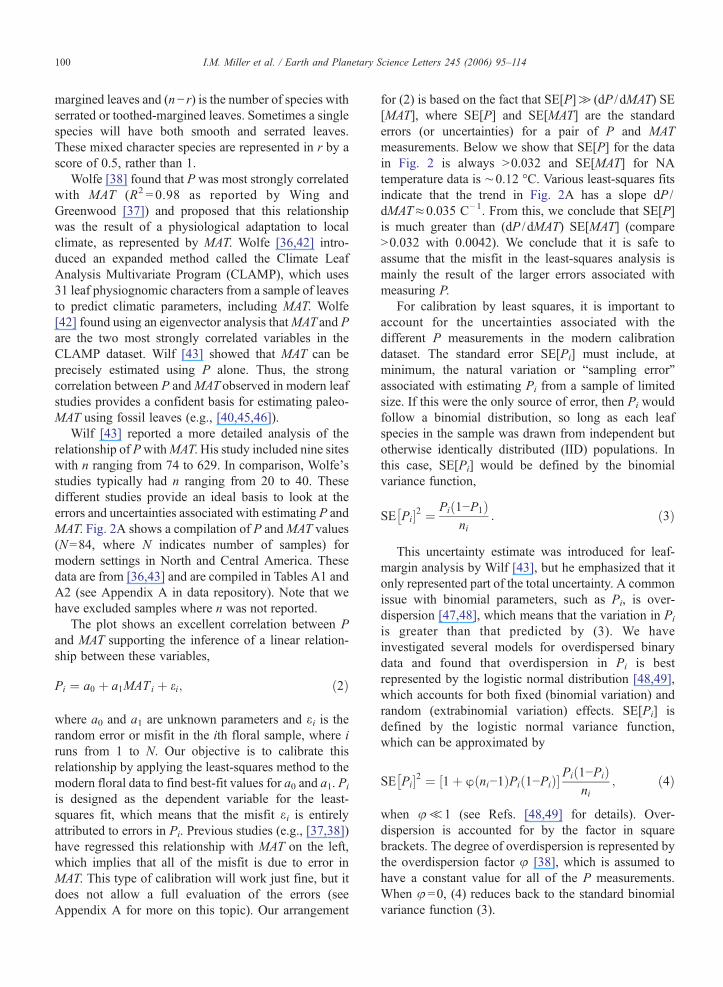
Fig. 2. (A) ModernMAT and P from floral sites in Central and North America. Open circles are CLAMP sites [36,89] and squares are from [43]. Dataare tabulated in Tables A1 and A2 in Appendix A. The black line shows the best-fit for our calibration, the grey line shows the nine sites from [43](squares). (B) Estimated uncertainties, at the 95% confidence level, for predictions of MAT using the best-fit equation above. The numbers for thecontours refer to n, the number of species in the unknown sample used for the prediction.
101I.M. Miller et al. / Earth and Planetary Science Letters 245 (2006) 95–114
This new specification for SE[Pi] will influence theestimation of MAT from P. The quality of the least-squares fit is measured by the statistic
X 2r ¼ �
N−2Þ−1XNi¼1
eiSE½Pi�
� �2
: ð5Þ
Xr2 should follow a χ2 distribution. If the misfit errors
εi are solely related to measurement errors in Pi, as
represented by SE[Pi] from Eq. (4), then the expectedvalue for Xr
2 is 1.This expectation for Xr
2 provides the basis forestimating φ. First, we find a weighted least-squaressolution for a0 and a1 with SE[Pi] determined using thestandard binomial variance function (3) (the weightedleast-squares algorithm is described in Appendix A).This calculation gives Xr
2 =1.76, meaning that thevariance of the residuals is about 76% greater than
102 I.M. Miller et al. / Earth and Planetary Science Letters 245 (2006) 95–114
predicted by (3). The χ2 distribution indicates that thisvalue for Xr
2 has a probability of P(χ2)=0.002%, whichmeans that there is insignificant probability that thisresult could occur by random chance alone. Theinference is that Pi measurements are overdispersed.
Next, we conduct an iterative search for a weightedleast-squares solution for a0, a1, and φ that gives Xr
2 =1[48]. The results are a0=−0.0456±0.0226, a1=0.0345±0.0012 (1 SE), and φ=0.052. The fit is very good(black line in Fig. 2A), with R2 =0.91. The increase inthe SE[Pi] that comes from corrections for overdisper-sion is, on average, about 10% to 20% (CLAMPsamples), but Pi values with ni>50 (samples from [43])show increases that range up to 160% (Fig. A1 in datarepository). The parameter estimates for the calibrationrelationship (2) are also affected by accounting foroverdispersion, given that samples with large n willhave less influence in the weighted least-squaressolution.
Overdispersion in binary variables is typicallyattributed to clustering in the sampled observations[49,50] (i.e., lack of independence or heterogeneity ofdata). For example, a forest will likely contain differentclusters of trees of different ages (i.e., height anddensity of trees, sun availability), located in differentmicroclimates, and growing under variable edaphicconditions. Thus, we would expect variations in themean P from leaves in these different clusters, sinceeach cluster provides a different temporal or spatialsample of the local conditions. The overdispersioneffect is clear in the Wilf [43] data because the largenumber of sampled species permits the random effectsto show up relative to the fixed effects (see Fig. A1Aand B in data repository). As noted above, we testedseveral overdispersion models and found that thelogistic normal model was the only one able tostabilize the variance of the residuals as a function ofPi and ni.
Our objective is to use P′ to predict an unknownMAT′. The calibration Eq. (2) is recast to give aprediction
MAT V¼ P V−a0a1
; ð6aÞ
or, using the parameters estimated above,
MAT V¼ 1:32þ 28:99P V: ð6bÞAppendix A provides an algorithm to calculate the
confidence interval for an estimate of MAT′. We haveused that calculation to construct Fig. 2B, which showsthe 95% confidence interval (CI) for estimates of MAT′.
The plot includes uncertainties related to estimating thecalibration Eq. (6b) and measuring P′, as given by SE[P′] using (4). The contour lines show that the 95% CIbecomes progressively smaller as n gets larger. Atypical study, with n≈40, will have an uncertainty of±6 °C when MAT is about 15 °C, and that uncertaintywill decrease to ±2 °C if MAT had a more extremevalue, such as 2° or 30 °C.
Our analysis here provides a full inventory of theinfluence of random errors on the measurements of Pand estimates of MAT using modern floras. Thisanalysis should hold for paleofloral data as long asthose flora are distributed in the same way as themodern flora used in the calibration dataset. Weacknowledge that estimates of MAT from paleofloralsamples may be subject to systematic errors [43,51],due, in large part, to different local forest environ-ments. For example, Burnham et al. [51] has foundthat in the modern tropics of Ecuador, localenvironments adjacent to lakes and rivers have leafdistributions that would result in an underestimate ofMAT by 3.5° to 5 °C. Further study is needed beforewe can fully assess how this kind of bias might affectuse of paleofloral data for estimates of MAT. Asimple test used here is to see if the misfit of thevariance of P in our merdional MAT reference profilefor the mid-Cretaceous of NA is similar to thatobserved in the modern calibration dataset. Differ-ences in variance would indicate that the paleofloraland modern floral datasets do not have the samedistribution.
3. Modern mean annual temperature and latitude
Modern MAT measurements for NA were takenfrom a global compilation of station data [52], whichcontains 1944 stations from North and CentralAmerica (Fig. A2 in data repository). MAT wascalculated from mean monthly temperatures for allyears where all months were available. The timeinterval was restricted to 1900 to 2002 AD. Stationdata had an average record length during this timeperiod of 69 yrs, with a range of 3 to 102 yrs. Thestandard deviation for MAT for each station averages0.85 °C, with a range of 0.3 °C to 1.8 °C. The averageuncertainty for the MAT values from this dataset is SE[MAT]∼0.12 °C.
The contour map in Fig. 3A shows the spatialvariation of MAT. Western NA shows considerableshort-wavelength variability, much of which is due totopography. Modern MAT is mainly a function oflatitude and elevation. Least-squares analysis was used
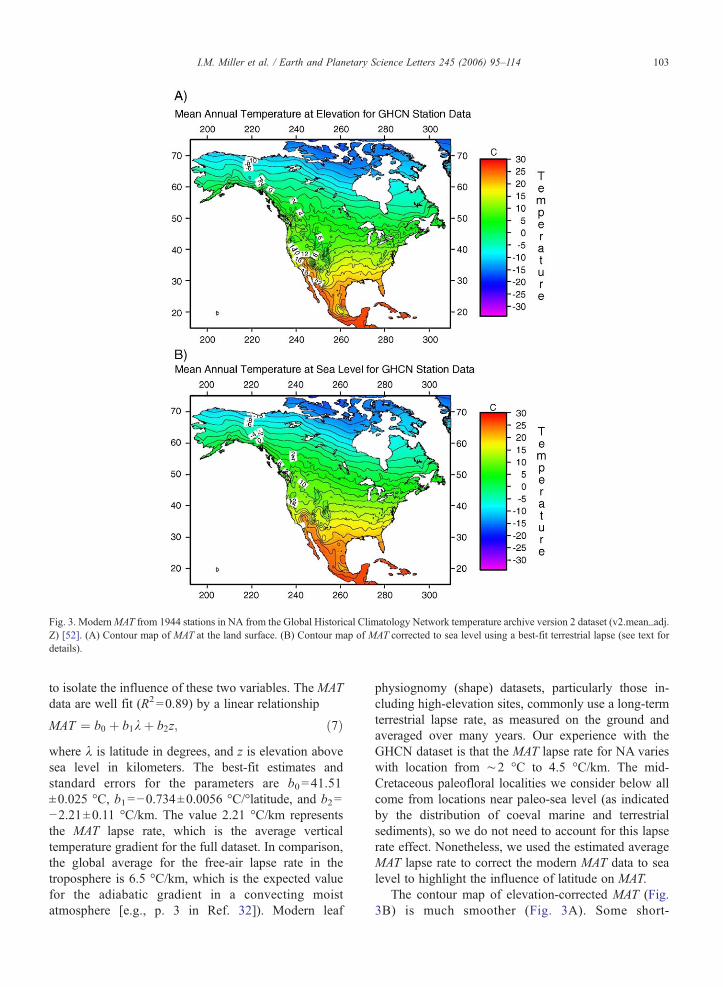
Fig. 3. ModernMAT from 1944 stations in NA from the Global Historical Climatology Network temperature archive version 2 dataset (v2.mean_adj.Z) [52]. (A) Contour map of MAT at the land surface. (B) Contour map of MAT corrected to sea level using a best-fit terrestrial lapse (see text fordetails).
103I.M. Miller et al. / Earth and Planetary Science Letters 245 (2006) 95–114
to isolate the influence of these two variables. The MATdata are well fit (R2 =0.89) by a linear relationship
MAT ¼ b0 þ b1kþ b2z; ð7Þwhere λ is latitude in degrees, and z is elevation abovesea level in kilometers. The best-fit estimates andstandard errors for the parameters are b0=41.51±0.025 °C, b1=−0.734±0.0056 °C/°latitude, and b2=−2.21±0.11 °C/km. The value 2.21 °C/km representsthe MAT lapse rate, which is the average verticaltemperature gradient for the full dataset. In comparison,the global average for the free-air lapse rate in thetroposphere is 6.5 °C/km, which is the expected valuefor the adiabatic gradient in a convecting moistatmosphere [e.g., p. 3 in Ref. 32]). Modern leaf
physiognomy (shape) datasets, particularly those in-cluding high-elevation sites, commonly use a long-termterrestrial lapse rate, as measured on the ground andaveraged over many years. Our experience with theGHCN dataset is that the MAT lapse rate for NA varieswith location from ∼2 °C to 4.5 °C/km. The mid-Cretaceous paleofloral localities we consider below allcome from locations near paleo-sea level (as indicatedby the distribution of coeval marine and terrestrialsediments), so we do not need to account for this lapserate effect. Nonetheless, we used the estimated averageMAT lapse rate to correct the modern MAT data to sealevel to highlight the influence of latitude on MAT.
The contour map of elevation-corrected MAT (Fig.3B) is much smoother (Fig. 3A). Some short-
104 I.M. Miller et al. / Earth and Planetary Science Letters 245 (2006) 95–114
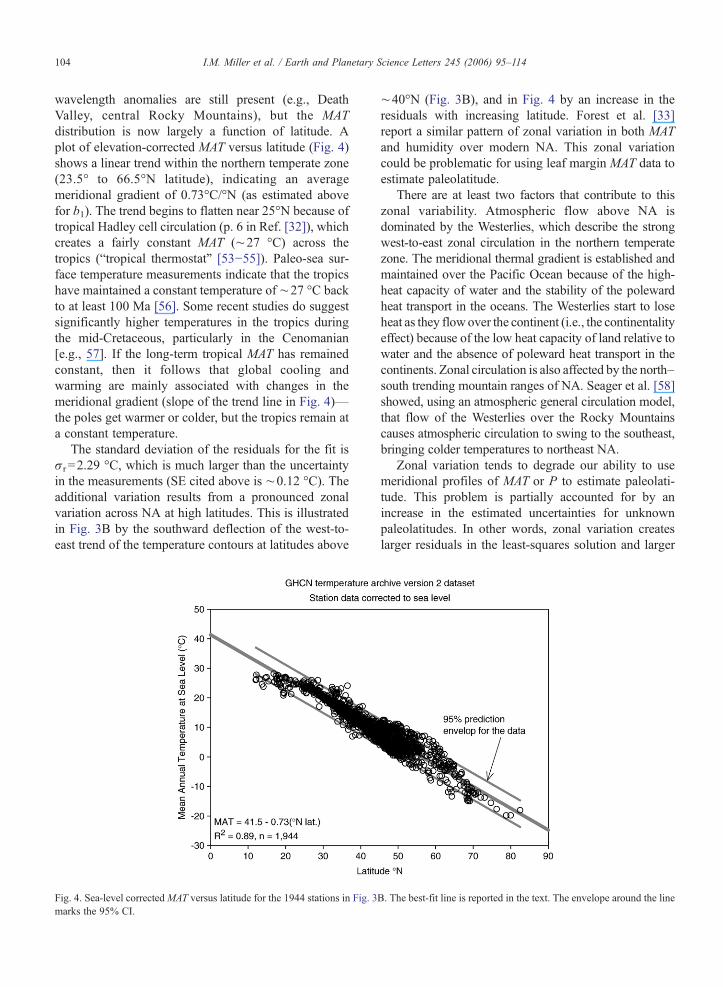
wavelength anomalies are still present (e.g., DeathValley, central Rocky Mountains), but the MATdistribution is now largely a function of latitude. Aplot of elevation-corrected MAT versus latitude (Fig. 4)shows a linear trend within the northern temperate zone(23.5° to 66.5°N latitude), indicating an averagemeridional gradient of 0.73°C/°N (as estimated abovefor b1). The trend begins to flatten near 25°N because oftropical Hadley cell circulation (p. 6 in Ref. [32]), whichcreates a fairly constant MAT (∼27 °C) across thetropics (“tropical thermostat” [53−55]). Paleo-sea sur-face temperature measurements indicate that the tropicshave maintained a constant temperature of ∼27 °C backto at least 100 Ma [56]. Some recent studies do suggestsignificantly higher temperatures in the tropics duringthe mid-Cretaceous, particularly in the Cenomanian[e.g., 57]. If the long-term tropical MAT has remainedconstant, then it follows that global cooling andwarming are mainly associated with changes in themeridional gradient (slope of the trend line in Fig. 4)—the poles get warmer or colder, but the tropics remain ata constant temperature.
The standard deviation of the residuals for the fit isσr =2.29 °C, which is much larger than the uncertaintyin the measurements (SE cited above is ∼0.12 °C). Theadditional variation results from a pronounced zonalvariation across NA at high latitudes. This is illustratedin Fig. 3B by the southward deflection of the west-to-east trend of the temperature contours at latitudes above
Fig. 4. Sea-level correctedMAT versus latitude for the 1944 stations in Fig. 3marks the 95% CI.
∼40°N (Fig. 3B), and in Fig. 4 by an increase in theresiduals with increasing latitude. Forest et al. [33]report a similar pattern of zonal variation in both MATand humidity over modern NA. This zonal variationcould be problematic for using leaf margin MAT data toestimate paleolatitude.
There are at least two factors that contribute to thiszonal variability. Atmospheric flow above NA isdominated by the Westerlies, which describe the strongwest-to-east zonal circulation in the northern temperatezone. The meridional thermal gradient is established andmaintained over the Pacific Ocean because of the high-heat capacity of water and the stability of the polewardheat transport in the oceans. The Westerlies start to loseheat as they flowover the continent (i.e., the continentalityeffect) because of the low heat capacity of land relative towater and the absence of poleward heat transport in thecontinents. Zonal circulation is also affected by the north–south trending mountain ranges of NA. Seager et al. [58]showed, using an atmospheric general circulation model,that flow of the Westerlies over the Rocky Mountainscauses atmospheric circulation to swing to the southeast,bringing colder temperatures to northeast NA.
Zonal variation tends to degrade our ability to usemeridional profiles of MAT or P to estimate paleolati-tude. This problem is partially accounted for by anincrease in the estimated uncertainties for unknownpaleolatitudes. In other words, zonal variation createslarger residuals in the least-squares solution and larger
B. The best-fit line is reported in the text. The envelope around the line
105I.M. Miller et al. / Earth and Planetary Science Letters 245 (2006) 95–114
uncertainties for the calibration equation, which trans-late into larger uncertainties for an estimate of anunknown paleolatitude. However, this result depends oncalibration samples that span the interior of NA fromwest to east and south to north, so that the zonalvariation is represented in the calibration dataset.
For comparison, we used leaf-estimated MAT and Pi
from the modern floral dataset (Fig. 2) to estimate themodernmeridional thermal gradient (Fig. 5A and B) (seedata repository for graphs of the confidence intervals). Inthis case, we used only those modern samples from the
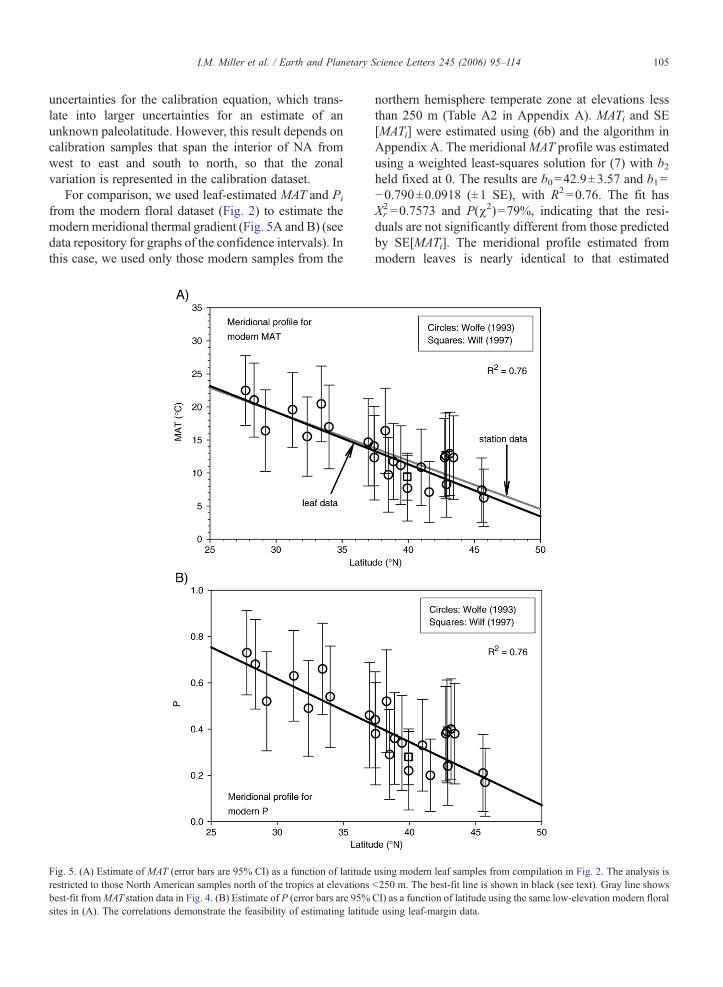
Fig. 5. (A) Estimate of MAT (error bars are 95% CI) as a function of latituderestricted to those North American samples north of the tropics at elevationsbest-fit fromMAT station data in Fig. 4. (B) Estimate of P (error bars are 95%sites in (A). The correlations demonstrate the feasibility of estimating latitud
northern hemisphere temperate zone at elevations lessthan 250 m (Table A2 in Appendix A). MATi and SE[MATi] were estimated using (6b) and the algorithm inAppendix A. The meridionalMAT profile was estimatedusing a weighted least-squares solution for (7) with b2held fixed at 0. The results are b0=42.9±3.57 and b1=−0.790±0.0918 (±1 SE), with R2 =0.76. The fit hasXr2 =0.7573 and P(χ2)=79%, indicating that the resi-
duals are not significantly different from those predictedby SE[MATi]. The meridional profile estimated frommodern leaves is nearly identical to that estimated
using modern leaf samples from compilation in Fig. 2. The analysis is<250 m. The best-fit line is shown in black (see text). Gray line showsCI) as a function of latitude using the same low-elevation modern florale using leaf-margin data.
106 I.M. Miller et al. / Earth and Planetary Science Letters 245 (2006) 95–114
directly from station data (grey line Fig. 5A). Thiscomparison may seem circular, but the station data usedto estimate modern MAT values are almost entirelyindependent of the station data used to calibrate therelationship between P and MAT in Fig. 2A.
4. Modern P and latitude
We have shown that, in the temperate zone,MAT hasa linear relationship with latitude (Fig. 4). Likewise, Phas a linear relationship with MAT (Fig. 2). Thus, P
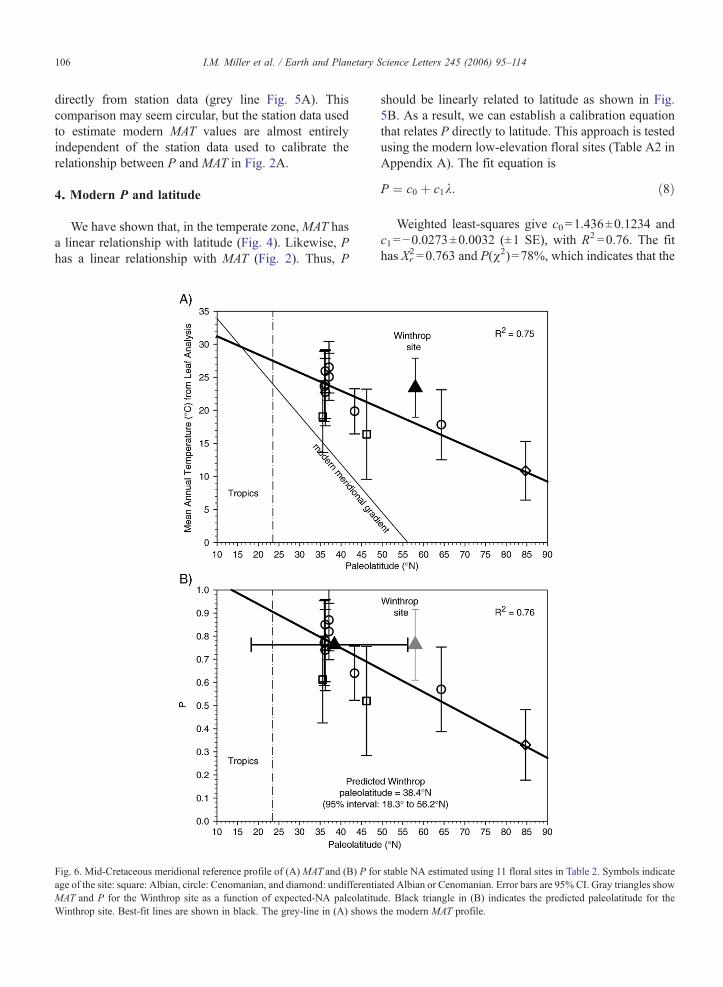
Fig. 6. Mid-Cretaceous meridional reference profile of (A)MAT and (B) P foage of the site: square: Albian, circle: Cenomanian, and diamond: undifferentiMAT and P for the Winthrop site as a function of expected-NA paleolatituWinthrop site. Best-fit lines are shown in black. The grey-line in (A) shows
should be linearly related to latitude as shown in Fig.5B. As a result, we can establish a calibration equationthat relates P directly to latitude. This approach is testedusing the modern low-elevation floral sites (Table A2 inAppendix A). The fit equation is
P ¼ c0 þ c1k: ð8Þ
Weighted least-squares give c0=1.436±0.1234 andc1=−0.0273±0.0032 (±1 SE), with R2 =0.76. The fithas Xr
2 =0.763 and P(χ2)=78%, which indicates that the
r stable NA estimated using 11 floral sites in Table 2. Symbols indicateated Albian or Cenomanian. Error bars are 95% CI. Gray triangles showde. Black triangle in (B) indicates the predicted paleolatitude for thethe modern MAT profile.
107I.M. Miller et al. / Earth and Planetary Science Letters 245 (2006) 95–114
residuals are comparable to those predicted by SE[Pi].Using the algorithm in Appendix A, we find that the95% CI indicates that this calibration is able to estimatean unknown λ′ to better than ±7°, similar to theprecision of latitudinal estimates provided by paleo-magnetic studies.
5. P and paleolatitude for mid-Cretaceous NorthAmerica
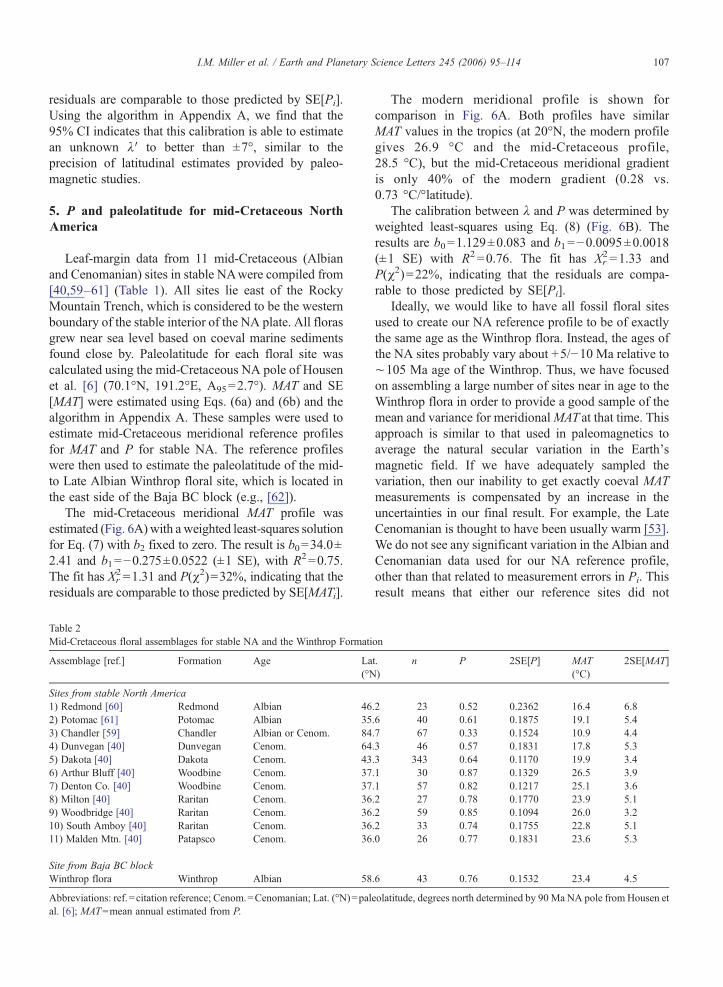
Leaf-margin data from 11 mid-Cretaceous (Albianand Cenomanian) sites in stable NAwere compiled from[40,59–61] (Table 1). All sites lie east of the RockyMountain Trench, which is considered to be the westernboundary of the stable interior of the NA plate. All florasgrew near sea level based on coeval marine sedimentsfound close by. Paleolatitude for each floral site wascalculated using the mid-Cretaceous NA pole of Housenet al. [6] (70.1°N, 191.2°E, A95=2.7°). MAT and SE[MAT] were estimated using Eqs. (6a) and (6b) and thealgorithm in Appendix A. These samples were used toestimate mid-Cretaceous meridional reference profilesfor MAT and P for stable NA. The reference profileswere then used to estimate the paleolatitude of the mid-to Late Albian Winthrop floral site, which is located inthe east side of the Baja BC block (e.g., [62]).
The mid-Cretaceous meridional MAT profile wasestimated (Fig. 6A)with a weighted least-squares solutionfor Eq. (7) with b2 fixed to zero. The result is b0=34.0±2.41 and b1=−0.275±0.0522 (±1 SE), with R2=0.75.The fit has Xr
2=1.31 and P(χ2)=32%, indicating that theresiduals are comparable to those predicted by SE[MATi].
Table 2Mid-Cretaceous floral assemblages for stable NA and the Winthrop Formati
Assemblage [ref.] Formation Age La(°N
Sites from stable North America1) Redmond [60] Redmond Albian 462) Potomac [61] Potomac Albian 353) Chandler [59] Chandler Albian or Cenom. 844) Dunvegan [40] Dunvegan Cenom. 645) Dakota [40] Dakota Cenom. 436) Arthur Bluff [40] Woodbine Cenom. 377) Denton Co. [40] Woodbine Cenom. 378) Milton [40] Raritan Cenom. 369) Woodbridge [40] Raritan Cenom. 3610) South Amboy [40] Raritan Cenom. 3611) Malden Mtn. [40] Patapsco Cenom. 36
Site from Baja BC blockWinthrop flora Winthrop Albian 58
Abbreviations: ref.=citation reference; Cenom.=Cenomanian; Lat. (°N)=palal. [6]; MAT=mean annual estimated from P.
The modern meridional profile is shown forcomparison in Fig. 6A. Both profiles have similarMAT values in the tropics (at 20°N, the modern profilegives 26.9 °C and the mid-Cretaceous profile,28.5 °C), but the mid-Cretaceous meridional gradientis only 40% of the modern gradient (0.28 vs.0.73 °C/°latitude).
The calibration between λ and P was determined byweighted least-squares using Eq. (8) (Fig. 6B). Theresults are b0=1.129±0.083 and b1=−0.0095±0.0018(±1 SE) with R2 =0.76. The fit has Xr
2 =1.33 andP(χ2)=22%, indicating that the residuals are compa-rable to those predicted by SE[Pi].
Ideally, we would like to have all fossil floral sitesused to create our NA reference profile to be of exactlythe same age as the Winthrop flora. Instead, the ages ofthe NA sites probably vary about +5/−10 Ma relative to∼105 Ma age of the Winthrop. Thus, we have focusedon assembling a large number of sites near in age to theWinthrop flora in order to provide a good sample of themean and variance for meridionalMAT at that time. Thisapproach is similar to that used in paleomagnetics toaverage the natural secular variation in the Earth'smagnetic field. If we have adequately sampled thevariation, then our inability to get exactly coeval MATmeasurements is compensated by an increase in theuncertainties in our final result. For example, the LateCenomanian is thought to have been usually warm [53].We do not see any significant variation in the Albian andCenomanian data used for our NA reference profile,other than that related to measurement errors in Pi. Thisresult means that either our reference sites did not
on
t.)
n P 2SE[P] MAT(°C)
2SE[MAT]
.2 23 0.52 0.2362 16.4 6.8
.6 40 0.61 0.1875 19.1 5.4
.7 67 0.33 0.1524 10.9 4.4
.3 46 0.57 0.1831 17.8 5.3
.3 343 0.64 0.1170 19.9 3.4
.1 30 0.87 0.1329 26.5 3.9
.1 57 0.82 0.1217 25.1 3.6
.2 27 0.78 0.1770 23.9 5.1
.2 59 0.85 0.1094 26.0 3.2
.2 33 0.74 0.1755 22.8 5.1
.0 26 0.77 0.1831 23.6 5.3
.6 43 0.76 0.1532 23.4 4.5
eolatitude, degrees north determined by 90 Ma NA pole from Housen et
108 I.M. Miller et al. / Earth and Planetary Science Letters 245 (2006) 95–114
sample the Late Cenomanian warming event, or that themagnitude of that warming event was small relative tothe intrinsic precision of our MAT measurements.
6. Leaf data from the Winthrop Formation
The Winthrop Formation was deposited in theMethow/Tyaughton foredeep basin, which formedduring the accretion of the Insular superterrane to NAat about 105 to 85 Ma [63,64]. The Methow basincorresponds to the southern half of this elongate basin.The Methow section begins with marine sediments,followed by fluvial sediments, and then ends withvolcanic deposits. We focus here on the fluvial Winthrop
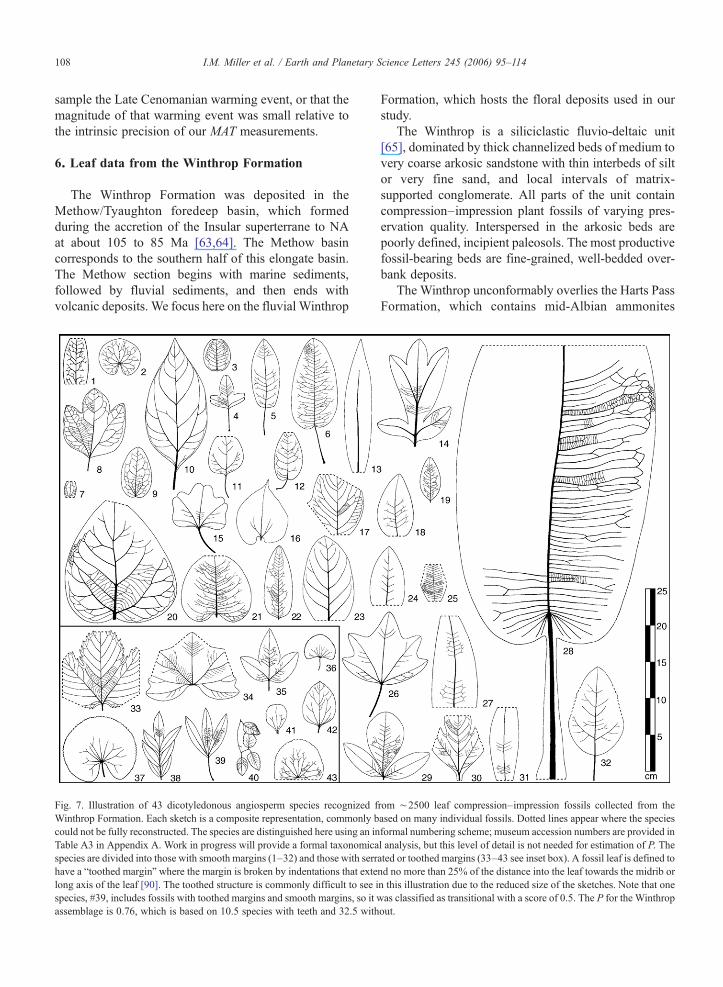
Fig. 7. Illustration of 43 dicotyledonous angiosperm species recognized fWinthrop Formation. Each sketch is a composite representation, commonly bcould not be fully reconstructed. The species are distinguished here using an inTable A3 in Appendix A. Work in progress will provide a formal taxonomicaspecies are divided into those with smooth margins (1–32) and those with serrhave a “toothed margin” where the margin is broken by indentations that extelong axis of the leaf [90]. The toothed structure is commonly difficult to see ispecies, #39, includes fossils with toothed margins and smooth margins, so itassemblage is 0.76, which is based on 10.5 species with teeth and 32.5 with
Formation, which hosts the floral deposits used in ourstudy.
The Winthrop is a siliciclastic fluvio-deltaic unit[65], dominated by thick channelized beds of medium tovery coarse arkosic sandstone with thin interbeds of siltor very fine sand, and local intervals of matrix-supported conglomerate. All parts of the unit containcompression–impression plant fossils of varying pres-ervation quality. Interspersed in the arkosic beds arepoorly defined, incipient paleosols. The most productivefossil-bearing beds are fine-grained, well-bedded over-bank deposits.
The Winthrop unconformably overlies the Harts PassFormation, which contains mid-Albian ammonites
rom ∼2500 leaf compression–impression fossils collected from theased on many individual fossils. Dotted lines appear where the speciesformal numbering scheme; museum accession numbers are provided inl analysis, but this level of detail is not needed for estimation of P. Theated or toothed margins (33–43 see inset box). A fossil leaf is defined tond no more than 25% of the distance into the leaf towards the midrib orn this illustration due to the reduced size of the sketches. Note that onewas classified as transitional with a score of 0.5. The P for the Winthropout.
109I.M. Miller et al. / Earth and Planetary Science Letters 245 (2006) 95–114
([66], R.A. Haugerud, pers. commun., 2004). Themegafloral assemblage of the Winthrop correlates tothe flora of upper subzone IIB in the PotomacFormation, which has been dated as mid-Albian(∼110–105 Ma) [68]. Especially important to assigningthis age is the high diversity of Sapindopsis species (14,29, 38, and 39 in Fig. 7), which, in our experience,requires an age no younger than late Albian (>100 Ma).The Winthrop is cut by a dike, which has a U/Pb zirconage of 97.5−3
+2 Ma ([69], as cited in [70]). As a result, weassign a mid- to Late Albian age (110 to 100 Ma) to theWinthrop Formation.
Three field seasons of quarrying in the WinthropFormation has produced a collection containing morethan 2500 identifiable plant specimens. The flora is verydiverse and includes bryophytes, horsetails, ferns,cycads, bennettites, conifers, and angiosperms, manyof which represent new species. Our specimens arearchived at the Denver Museum of Nature and Science,the Yale Peabody Museum, and the Burke Museum atthe University of Washington. We also consulted acollection at the Smithsonian Institution that was madeby I.C. Russell in 1896.
The flora was sorted into morphospecies, which arethe finest category of entities that can be recognized andcircumscribed as forming discrete populations within afossil assemblage. We have found 43 dicotyledonousleaf species with leaf margins well enough preserved foridentification and scoring (Fig. 7). The assemblage hasP=0.763±0.077 (±1 SE), which gives an estimatedMAT of 23.4 °C (±1 SE=21.2° to 25.7 °C) and anestimated paleolatitude of 38.4°N (95% CI=18.3°N to56.2°N) (Fig. 6B). The expected paleolatitude for theWinthrop Formation, if it had not moved relative tostable NA, is 58.6°N. The amount of northward offsetrelative to NA is given by the difference between theestimated paleolatitude and the expected-NA paleolati-tude. The northward offset is 2240 km, with a 95% CI of270 to 4470 km.
7. Discussion
The P value for the Winthrop flora indicates that itgrew in a subtropical to tropical climate [38]. Thisconclusion is supported by other aspects of this flora. Inparticular, the sizes of the angiosperm leaves inWinthrop flora are anomalously large relative to thosefound in modern temperate forests (see species #10, 20and especially 28 in Fig. 7). About 70% of the specieshave at least some specimens falling in the mesophyll-size class [see Ref. 71 for size-class definitions]. Theonly modern equivalents are tropical rainforests and
tropical seasonal forests where ∼70% to 90% of leavesare mesophylls [72]. Several species exhibit a deeplycordate base, which is a morphology typical of vines(see species #2, 16, 37 and others in Fig. 7) andindicative of a tropical forest guild structure [73]. TheWinthrop flora also exhibits a high diversity of bothangiosperms and ferns, which is characteristic ofmodern tropical forests. Finally, modern tropical forestsare the primary refugia for relict or nearly extinct taxa.Triassic and Jurassic relicts occur in the Winthrop flora;most notably, Neocalamites, which is globally wide-spread into the Early Jurassic but becomes endemic afterthat time. By the mid-Cretaceous, it is found in NorthAmerica at only one location in NE Mexico [74,75].Thus, the low paleolatitude estimated by our analysis isstrongly supported by this more comprehensive consid-eration of the floristic characteristics of the Winthropassemblage.
We now focus on the important constraint that theCalifornia sector provides on restoration of the Baja BCblock. Our objective is to use this constraint, togetherwith the Winthrop paleolatitude estimate, to determineprobabilities for competing restorations for the Baja BCblock (e.g., Fig. 1C and D). The California sectorconsists of four tectonostratigraphic units that arearranged in parallel belts within the western NACordillera (Fig. 1A). From east to west, these are: 1)the pre-Cretaceous Klamath and Sierran terranes,which are Paleozoic and earlyMesozoic oceanic terranesthat were accreted to NA during the Jurassic; 2) theCretaceous magmatic arc, representing the Mesozoic“Andean-style” arc of NA, with the Sierra Nevadabatholith as the type example; 3) theGreat Valley Group,which is the Late Jurassic–Early Cenozoic forearc basinthat formed outboard of the Sierra Nevada batholith; and4) the Franciscan Complex, representing the coevalsubduction complex that formed in association with theSierran arc and the Great Valley basin.
Western Washington and southwestern British Co-lumbia include tectonostratigraphic units that are fullyequivalent to those in the California sector. They arefound there in the large Late Cretaceous thrust nappes ofthe Coast Mountains orogen (yellow unit in Fig. 1),which marks the suture zone that formed when theInsular superterrane was accreted to NA between 100and 85 Ma. Cowan et al. [1] used this observation toconclude that the Insular superterrane collided with anextension of the Franciscan–Great Valley–Sierransubduction zone, either to the south or to the north ofthe California sector. The restorations in Fig. 1C and Dshow that the Franciscan and Great Valley stop at thesouthern end of the California sector, whereas the 90 Ma
110 I.M. Miller et al. / Earth and Planetary Science Letters 245 (2006) 95–114
magmatic arc extends at least 1600 km farther to thesouth. The Cretaceous forearc appears to be missing inthis area. This break may represent a truncation scar,where the Baja BC block was derived. This idea wouldaccount for occurrence of Franciscan and Great Valleyrocks in the Coast Mountain orogen [76,77]. Converse-ly, one might argue that the Franciscan and Great Valleyin the Coast Mountains orogen represents a naturalnorthward continuation of these units from the KlamathMountains. Garver [77] argues, based on detailedstratigraphic comparisons, that the southern location ismore likely.
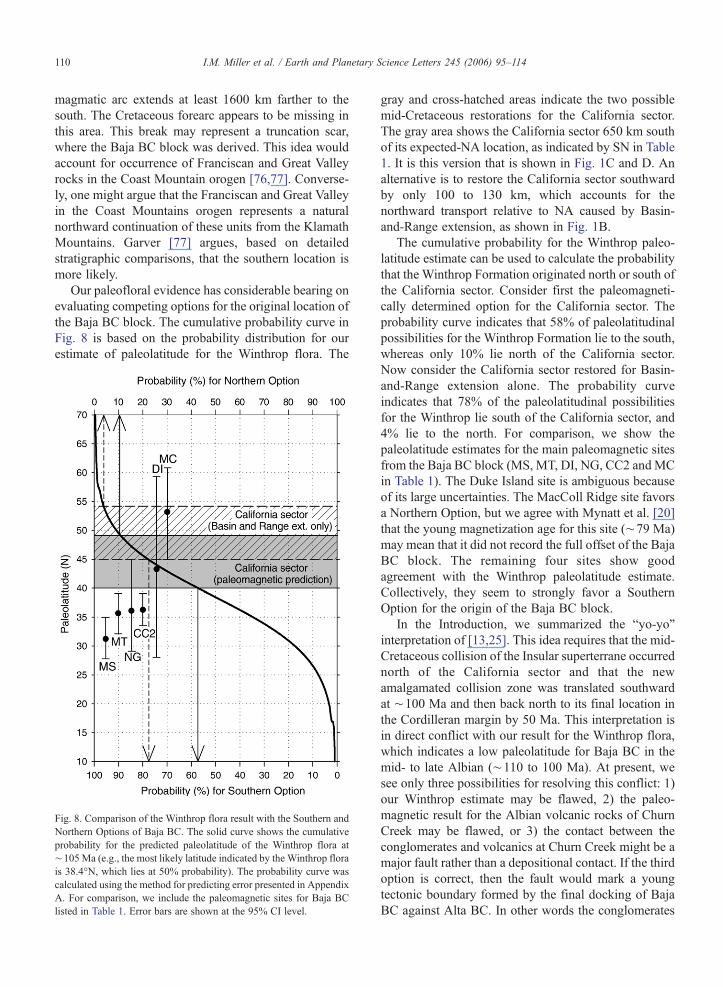
Our paleofloral evidence has considerable bearing onevaluating competing options for the original location ofthe Baja BC block. The cumulative probability curve inFig. 8 is based on the probability distribution for ourestimate of paleolatitude for the Winthrop flora. The
Fig. 8. Comparison of the Winthrop flora result with the Southern andNorthern Options of Baja BC. The solid curve shows the cumulativeprobability for the predicted paleolatitude of the Winthrop flora at∼105Ma (e.g., the most likely latitude indicated by the Winthrop florais 38.4°N, which lies at 50% probability). The probability curve wascalculated using the method for predicting error presented in AppendixA. For comparison, we include the paleomagnetic sites for Baja BClisted in Table 1. Error bars are shown at the 95% CI level.
gray and cross-hatched areas indicate the two possiblemid-Cretaceous restorations for the California sector.The gray area shows the California sector 650 km southof its expected-NA location, as indicated by SN in Table1. It is this version that is shown in Fig. 1C and D. Analternative is to restore the California sector southwardby only 100 to 130 km, which accounts for thenorthward transport relative to NA caused by Basin-and-Range extension, as shown in Fig. 1B.
The cumulative probability for the Winthrop paleo-latitude estimate can be used to calculate the probabilitythat the Winthrop Formation originated north or south ofthe California sector. Consider first the paleomagneti-cally determined option for the California sector. Theprobability curve indicates that 58% of paleolatitudinalpossibilities for the Winthrop Formation lie to the south,whereas only 10% lie north of the California sector.Now consider the California sector restored for Basin-and-Range extension alone. The probability curveindicates that 78% of the paleolatitudinal possibilitiesfor the Winthrop lie south of the California sector, and4% lie to the north. For comparison, we show thepaleolatitude estimates for the main paleomagnetic sitesfrom the Baja BC block (MS, MT, DI, NG, CC2 andMCin Table 1). The Duke Island site is ambiguous becauseof its large uncertainties. The MacColl Ridge site favorsa Northern Option, but we agree with Mynatt et al. [20]that the young magnetization age for this site (∼79 Ma)may mean that it did not record the full offset of the BajaBC block. The remaining four sites show goodagreement with the Winthrop paleolatitude estimate.Collectively, they seem to strongly favor a SouthernOption for the origin of the Baja BC block.
In the Introduction, we summarized the “yo-yo”interpretation of [13,25]. This idea requires that the mid-Cretaceous collision of the Insular superterrane occurrednorth of the California sector and that the newamalgamated collision zone was translated southwardat ∼100 Ma and then back north to its final location inthe Cordilleran margin by 50 Ma. This interpretation isin direct conflict with our result for the Winthrop flora,which indicates a low paleolatitude for Baja BC in themid- to late Albian (∼110 to 100 Ma). At present, wesee only three possibilities for resolving this conflict: 1)our Winthrop estimate may be flawed, 2) the paleo-magnetic result for the Albian volcanic rocks of ChurnCreek may be flawed, or 3) the contact between theconglomerates and volcanics at Churn Creek might be amajor fault rather than a depositional contact. If the thirdoption is correct, then the fault would mark a youngtectonic boundary formed by the final docking of BajaBC against Alta BC. In other words the conglomerates
111I.M. Miller et al. / Earth and Planetary Science Letters 245 (2006) 95–114
of Churn Creek would be part of the Baja BC block,equivalent to sediments in the Methow/Tyaughtonbasin, whereas the Albian volcanics of Churn Creekwould be equivalent to the Spences Bridge Volcanicsfound to the east in Alta BC.
More work is needed to resolve this issue. Nonethe-less, the conflict highlights the need for estimates forpaleolatitude for the Baja BC block prior to 90 Ma. TheDuke Island (DI) site has a magnetization age of110 Ma, but it lacks the precision to resolve the conflict.
Our work also demonstrates the potential for usingtemperature measurements to estimate paleolatitude.Leaf-margin analysis is one way to make the necessarytemperature measurements. However, geochemicalmethods may provide a faster and more precise methodfor measuring terrestrial surface temperatures andestimating paleolatitude.
8. Conclusion
The objective of this paper is to develop and apply amethod using fossil leaves to quantitatively estimatepaleolatitude. We start with a revised calibration of theprediction equation for estimation of MAT frommeasurements P. This analysis includes a more realisticassessment of the uncertainties for MAT estimates. Wethen show a strong correlation between P, MAT, andlatitude for modern NA. Finally, we apply our method toestimate the paleolatitude of the Baja BC block.Extensive collections of fossil leaves from the Albian(110–100Ma) Winthrop flora in the Methow basin yielda P value of 0.76. Using a paleolatitudinal referenceprofile of P determined from 11 Albian–Cenomanianfloral sites from stable NA, we determine that theWinthrop flora originated at 38.4°N. This resultprovides independent support for a far-traveled BajaBC block, originating south of the California sector at∼105 Ma.
Acknowledgements
Numerous people and institutions have been in-volved in this study. Kirk Johnson and museumvolunteers at the Denver Museum of Nature and Sciencehelped during the first year of this project. Help andsupport during later years came from Linda Klise andvolunteers at the Peabody Museum, Wesley Wehr at theUniversity of Washington Burke Museum, and ScottWing and Jon Wingeroth at the Smithsonian Institution.We are thankful for detailed discussions with DarrelCowan (University of Washington), John Garver (UnionCollege), Ted Irving (Geological Survey of Canada),
Ralph Haugerud (USGS), Bernie Housen (WesternWashington University), Steven Sherwood (Yale), LisaTauxe (Scripps), and Peter Wilf (Penn State). Webenefited from the critical reviews from Bernie Housenand an anonymous reviewer. We also thank RichardBeyer for logistical assistance and the Miller family forhard work on the outcrop. Miller's field work wassupported by two GSA student research grants, a SigmaXi research grant, and a YIBS Field Ecology grant. ThePeabody Museum and Denver Museum of Nature andScience contributed shipping costs and curation of thesamples.
Appendix A. Supplementary data
Supplementary data associated with this article canbe found, in the online version, at doi:10.1016/j.epsl.2006.02.022.
References
[1] D.S. Cowan, M.T. Brandon, J.I. Garver, Geologic tests ofhypotheses for large coastwise displacements—a critiqueillustrated by the Baja British Columbia controversy, Am. J.Sci. 297 (1997) 117–173.
[2] H. Gabrielse, Major dextral transcurrent displacements along theNorthern Rocky Mountain Trench and related lineaments innorth-central British Columbia, Geol. Soc. Amer. Bull. 96 (1985)1–14.
[3] R.A. Price, D.M. Carmichael, Geometric test for Late Creta-ceous–Paleogene intracontinental transform faulting in theCanadian Cordillera, Geology 14 (1986) 468–471.
[4] M.E.J. Beck, L. Noson, Anomalous paleolatitudes in Cretaceousgranitic rocks, Nature 235 (1972) 11–13.
[5] J.J. Ague, M.T. Brandon, Regional tilt of the Mt. Stuart batholith,Washington, determined using Al-in-hornblende barometry:implications for northward translation of Baja British Columbia,Geol. Soc. Amer. Bull. 108 (1996) 471–488.
[6] B.A. Housen, M.E. Beck Jr., R.F. Burmester, T. Fawcett, P.Petro, R. Sargent, K. Addis, K. Curtis, J. Ladd, N. Liner, B.Molitor, T. Montgomery, I. Mynatt, B. Palmer, D. Tucker, I.White, Paleomagnetism of the Mount Stuart batholith revisitedagain: what has been learned since 1972? Am. J. Sci. (2003)263–299.
[7] P.J. Wynne, E. Irving, J. Maxson, K.L. Kleinspehn, Paleomag-netism of the Upper Cretaceous strata of Mount Tatlow: evidencefor 3000 km of northward displacement of the eastern Coast Belt,British Columbia, J. Geophys. Res. 100 (1995) 6073–6092.
[8] E. Irving, P.J. Wynne, D.J. Thorkelson, P. Schiarizza, Large(1000 to 4000 km) northward movements of tectonic domains inthe northern Cordillera, 83 to 45Ma, J. Geophys. Res. 101 (1996)17901–17916.
[9] S.W. Bogue, C.S. Gromme, Structural correction of paleomag-netic vectors dispersed about two fold axes and application to theDuke Island (Alaska) ultramafic complex, J. Geophys. Res. 109(2004) 1–13.
[10] P.D. Ward, J.M. Hurtado, J.L. Kirschvink, K.L. Verosub,Measurements of the Cretaceous paleolatitude of Vancouver
112 I.M. Miller et al. / Earth and Planetary Science Letters 245 (2006) 95–114
Island: consistent with the Baja-British Columbia hypothesis,Science 277 (1997) 1642–1645.
[11] R.J. Enkin, J. Randolph, J. Baker, P.S. Mustard, Paleomagnetismof the Upper Cretaceous Nanaimo Group, southwestern Cana-dian Cordillera, Can. J. Earth Sci. 38 (2001) 1403–1422.
[12] W. Krijgsman, L. Tauxe, E/I corrected paleolatitudes from thesedimentary rocks of the Baja British Columbia hypothesis, EarthPlanet. Sci. Lett. 242 (2006) 205–216.
[13] R.J. Enkin, J.B. Mahoney, J. Baker, J. Riesterer, M.L. Haskin,Deciphering shallow paleomagnetic inclinations: 2. Implicationsfrom Late Cretaceous strata overlapping the Insular/IntermontaneSuperterrane boundary in the southern Canadian Cordillera, J.Geophys. Res. 108 (2003), doi:10.1029/2002JB001983.
[14] J.W.H. Monger, R.A. Price, in: P.J. Wynne, et al., (Eds.),Comment on: “Paleomagnetism of the Upper Cretaceous strata ofMount Tatlow: evidence for 3000 km of northward displacementof the eastern Coast Belt, British Columbia”, 1995;J.W.H. Monger, R.A. Price, in: E. Irving, et al., (Eds.),Paleomagnetism of the Spences Bridge Group and northwarddisplacement of the Intermontane Belt, British Columbia: asecond look, 1995;J.W.H. Monger, R.A. Price, J. Geophys. Res. 101 (1996).
[15] P.J. Wynne, D.J. Thorkelson, K.L. Kleinspehn, J.A. Maxon, E.Irving, in: P.J. Wynne, et al., (Eds.), Reply to: Comment on‘Paleomagnetism of the Upper Cretaceous strata of MountTatlow’, 1995;P.J. Wynne, D.J. Thorkelson, K.L. Kleinspehn, J.A. Maxon, E.Irving, in: E. Irving, et al., (Eds.), Paleomagetism of the SpencesBridge Group and northward displacement of the IntermontaneBelt, British Columbia: a second look, 1995;J.W.H. Monger, R.A. Price (Eds.), Journal of GeophysicalResearch, vol. 101, 1996, pp. 13801–13804.
[16] R.F. Butler, G.E. Gehrels, K.P. Kodama, A moderate translationalternative to the Baja British Columbia hypothesis, GSAToday11 (2001) 4–10.
[17] B. Kim, K.P. Kodama, A compaction correction for thepaleomagnetism of the Nanaimo Group sedimentary rocks:implications for the Baja British Columbia hypothesis, J.Geophys. Res. (2004), doi:10.1029/2003JB002696.
[18] K.P. Kodama, P.D. Ward, Compaction-corrected paleomagneticpaleolatitudes for Late Cretaceous rudists along the CretaceousCalifornia margin: evidence for less the 1500 km of post-LateCretaceous offset for Baja British Columbia, Geol. Soc. Amer.Bull. 113 (2001) 1171–1178.
[19] J.A. Stamatakos, J.M. Trop, K.D. Ridgway, Late Cretaceouspaleogeography of Wrangellia: paleomagnetism of the MacCollRidge Formation, southern Alaska, revisited, Geology 29 (2001)947–950.
[20] I. Mynatt, B.A. Housen, M.E. Beck Jr., in: J.A. Stamatakos, et al.,(Eds.), Comment on: “Late Cretaceous paleogeography ofWrangellia: paleomagnetism of the McColl Ridge Formation,southern Alaska, revisited”, 2001, Online Forum doi: 10.1130/0091-7613(2003)31<e13:LCPOWP>2.0.CO2 (2003).
[21] E. Irving, D.J. Thorkelson, P.M. Wheadon, R.J. Enkin,Paleomagnetism of the Spences Bridge Group and northwarddisplacement of the Intermontane Belt, British Columbia: asecond look, J. Geophys. Res. 100 (1995) 6057–6071.
[22] P.J. Umhoefer, A model for the North American Cordillera inthe Early Cretaceous: tectonic escape related to arc collision ofthe Guerrero terrane and a change in North American platemotion, in: S.E. Johnson, S.R. Paterson, J.M. Fletcher, G.H.Girty, D.L. Kimbrough, A. Martin-Barajas (Eds.), Tectonic
Evolution of Northwestern Mexico and the Southwestern USA,Spec. Pap.—Geol. Soc. Am. 374 (2003) 117–134.
[23] J.B. Mahoney, C.J. Hickson, P. van der Heyden, J.A. Hunt,The Late Albian–Early Cenomanian Silverquick conglomer-ate, Gang Ranch area: evidence for active basin tectonism,Current Research, Part A, Geol. Soc. Can. 91-1A (1992)249–260.
[24] J.W. Riesterer, J.B. Mahoney, P.K. Link, The conglomerate ofChurn Creek: Late Cretaceous basin evolution along the Insular–Intermontane superterrane boundary, southern British Columbia,Can. J. Earth Sci. 38 (2001) 59–73.
[25] M.L. Haskin, R.J. Enkin, J.B. Mahoney, P.S. Mustard, J.Baker, Deciphering shallow paleomagnetic inclinations: 1.Implications from correlation of Albian volcanic rocks alongthe Insular/Intermontane Superterrane boundary in the southernCanadian Cordillera, J. Geophys. Res. 108 (2003),doi:10.1029/2002JB001982.
[26] R.A. Kerr, How far did the west wander? Science 268 (1995)635–637.
[27] J.M. Trop, K.D. Ridgway, A.R. Sweet, P.W. Layer, Submarinefan deposystems and tectonics of a Late Cretaceous forearc basinalong an accretionary convergent plate boundary, MacColl RidgeFormation, Wrangell Mountains, Alaska, Can. J. Earth Sci. 36(1999) 433–457.
[28] J.B. Mahoney, P.S. Mustard, J.W. Haggart, R.M. Friedman, M.C.Fanning, V.J. McNicoll, Archean zircons in Cretaceous strata ofthe western Canadian Cordillera: the “Baja BC” hypothesis fails a“crucial test”, Geology 27 (1999) 195–198.
[29] B.A. Housen, M.E. Beck Jr., Testing terrane transport: aninclusive approach to the Baja BC controversy, Geology 27(1999) 1143–1146.
[30] K. DeGraaff-Surpless, J.B. Mahoney, J.L. Wooden, M.O. McWil-liams, Lithofacies control in detrital zircon provenance studies:insights from the Cretaceous Methow basin, southern CanadianCordillera, Geol. Soc. Amer. Bull. 115 (2003) 899–915.
[31] L. Ferrari, G. Pasquarè, S. Venegas-Salgado, F. Romero-Rios,Geology of the western Mexican Volcanic Belt and adjacentSierra Madre Occidental and Jalisco block, Spec. Pap.—Geol.Soc. Am. 334 (1999) 65–83.
[32] D.L. Hartmann, Global Physical Climatology, Academic Press,San Diego, 1994, 411 pp.
[33] C.E. Forest, J.A. Wolfe, P. Molnar, K.A. Emanuel, Paleoalti-metry incorporating atmospheric physics and botanicalestimates of paleoclimate, Geol. Soc. Amer. Bull. 111 (1999)497–511.
[35] B.T. Otto-Bliesner, E.C. Brady, C. Shields, Late Cretaceousocean: coupled simulations with the National Center forAtmospheric Research Climate System Model, J. Geophys.Res. 107 (2002) 11-1–11-14.
[36] J.A. Wolfe, A method of obtaining climatic parameters from leafassemblages, U.S.G.S. Prof. Pap. 1106 (1993) 1–37.
[37] S.L. Wing, D.R. Greenwood, Fossils and fossil climate: the casefor equable continental interiors in the Eocene, Philos. Trans. R.Soc. Lond., B 341 (1993) 243–252.
[38] J.A. Wolfe, Temperature parameters of humid to mesic forests ofeastern Asia and relation to forests of other regions of thenorthern hemisphere and Australasia, U.S.G.S. Prof. Pap. 1106(1979) 1–37.
[39] D.L. Royer, P. Wilf, Why do toothed leaves correlate with coldclimates? Gas exchange at leaf margins provides new insights intoa classic paleotemperature proxy. Int. J. Plant Sci. 167 (2006)11–18.
113I.M. Miller et al. / Earth and Planetary Science Letters 245 (2006) 95–114
[40] J.A. Wolfe, G.R. Upchurch, North American nonmarine climatesand vegetation during the Late Cretaceous, Palaeogeogr.Palaeoclimatol. Palaeoecol. 61 (1987) 33–77.
[41] I.W. Bailey, E.W. Sinnott, A botanical index of Cretaceous andTertiary climates, Science 41 (1915) 831–834.
[42] J.A. Wolfe, Paleoclimate estimates from Tertiary leaf assem-blages, Annu. Rev. Earth Planet. Sci. 2040 (1995) 1–71.
[43] P. Wilf, When are leaves good thermometers? A new case for leafmargin analysis, Paleobiology 23 (1997) 373–390.
[45] D.R. Greenwood, S.L. Wing, Eocene continental climates andlatitudinal temperature gradients, Geology 23 (1995) 1044–1048.
[46] P. Wilf, K.R. Johnson, B.T. Huber, Correlated terrestrial andmarine evidence for global climate changes before massextinction at the Cretaceous–Paleogene boundary, Proc. Natl.Acad. Sci. U. S. A. 100 (2003) 599–604.
[47] P. McCullagh, J.A. Nelder, Generalized Linear Models, Chap-man and Hall, London, 1989, 511 pp.
[48] J. Hinde, C.G.B. Demetrio, Overdispersion: models andestimation, Comput. Stat. Data Anal. 27 (1998) 151–170.
[49] D.A. Williams, Extra-binomial variation in logistic linearmodels, Appl. Stat. 31 (1982) 144–148.
[50] A. Agresti, Categorical Data Analysis, John Wiley & Sons,Hoboken, 2002, 710 pp.
[51] R.J. Burnham, N. Pitman, K.R. Johnson, P. Wilf, Habitat-relatederror in estimating temperatures from leaf margins in a humidtropical forest, Am. J. Bot. 88 (2001) 1096–1102.
[52] T.C. Peterson, R.S. Vose, An overview of the Global HistoricalClimatology Network temperature database, 2001, http://lwf.ncdc.noaa.gov/oa/climate/research/ghcn/ghcnoverview.htmlData archive is at: http://dss.ucar.edu/datasets/ds564.0/data/ver2/ghcnftp.html2001.
[53] R.D. Norris, K.L. Bice, E.A. Magno, P.A. Wilson, Jiggling thetropical thermostat in the Cretaceous hothouse, Geology 30(2002) 299–302.
[54] D.Z. Sun, Z. Liu, Dynamic ocean–atmosphere coupling: athermostat for the tropics, Science 272 (1996) 1148–1150.
[55] I.M. Held, A.Y. Hou, Nonlinear axially symmetric circulationsin a nearly inviscid atmosphere, J. Atmos. Sci. 37 (1980)515–533.
[56] T.J. Crowley, J.C. Zachos, Comparison of zonal temperatureprofiles for past warm time periods, in: B.T. Huber, K.G.MacLeod, S.L. Wing (Eds.), Warm Climates in Earth History,Cambridge University Press, 2000.
[57] S. Schouten, E.C. Hopmans, A. Forster, Y.v. Breugel, M.M.Kuypers, J.S. Damste, Extremely high sea-surface temperatures atlow latitudes during the middle Cretaceous as revealed byarchaeal membrane lipids, Geology (Boulder) 31 (2003)1069–1072.
[58] R. Seager, D.S. Battisit, J. Yin, N. Gordon, N. Naik, A.C.Clement, M.A. Cane, Is the Gulf Stream responsible forEurope's mild winters? Q. J. R. Meteorol. Soc. 128 (2002)2563–2586.
[59] J.T. Parrish, R.A. Spicer, Late Cretaceous terrestrial vegetation: anear-polar temperature curve, Geology 16 (1988) 22–25.
[60] L.J. Hickey, T.B. Armstrong, A mid-Cretaceous (Cenomanian)Flora from the Interior of the Canadian Shield in WesternLabrador, Annual Meeting, vol. 49 (26.8), American Institute ofBiological Sciences, 1998.
[61] L.J. Hickey. Potomac flora (unpublished data).[62] J.M. Journeay, R.M. Friedman, The Coast Belt thrust system:
evidence for Late Cretaceous shortening in southwest BritishColumbia, Tectonics 12 (1993) 756–775.
[63] M.E. Tennyson, M.R. Cole, Upper Mesozoic Methow–Pasaytonsequence northeastern Cascade Range, Washington and BritishColumbia, Washington Division of Geology and Earth ResourcesBulletin, vol. 77, 1987, pp. 73–84.
[64] M.F. McGroder, Structural geometry and kinematic evolution ofthe eastern Cascades foldblet, Washington and British Columbia,Can. J. Earth Sci. 26 (1989) 1586–1602.
[65] R.L. Rau, Sedimentology of the Upper Cretaceous WinthropSandstone, Northeastern Cascade Range, Washington, Masters,Eastern Washington University, 1987, 196 pp.
[66] B.E. Crowley, Early Cretaceous (Albian) Ammonites from theHarts Pass Formation, Methow Basin, Washington, Masters,University of Washington, 1993, 46 pp.
[68] L.J. Hickey, J.A. Doyle, Early Cretaceous fossil evidence forangiosperm evolution, Bot. Rev. 43 (1977) 3–104.
[69] R.A. Haugerud, J.B. Mahoney, J.D. Dragovich, Geology of themethow block, Northwest Geological Society Meeting, North-west Geological Society, Seattle, WA, 1996.
[70] R.J. Enkin, J.B. Mahoney, J. Baker, M. Kiessling, R.A.Haugerud, Syntectonic remagnetization in the southern Methowblock: resolving large displacements in the southern CanadianCordillera, Tectonics 21 (2002) 18-1–18-18.
[71] C. Raunkiaer, The Life Forms of Plants and Statistical PlantGeography, Clarendon Press, Oxford, 1934, 632 pp.
[72] P.W. Richards, The Tropical Rain Forest: An Ecological Study,Cambridge University Press, London, 1952, 450 pp.
[73] T. Givnish, On the adaptive significance of leaf form, in:O.T. Solbrig, S. Jain, G.B. Johnson, P. Raven (Eds.), Topicsin Plant Population Biology, Columbia University Press,1979, pp. 375–407;T. Givnish, G. Vermeij, Sizes and shapes of liane leaves, Am.Nat. 110 (1976) 743–778.
[74] M.M. Koerdell, Nueva equisetal del Cretacico superior deChoahuila, Mexico, Bull. Assoc.Mex. Pet. Geol. 1 (1949) 27–34.
[75] E. Boureau, Sphenophyta and Noeggerathiophyta, Masson,Paris, 1964, 1–544 pp.
[76] M.T. Brandon, D.S. Cowan, J.A. Vance, The Late CretaceousSan Juan thrust system, San Juan Islands, Washington, Spec.Pap.—Geol. Soc. Am. 221 (1988) 1–81.
[77] J.I. Garver, Fragment of the Coast Range ophiolite and the GreatValley sequence in the San Juan Islands, Washington, Geology16 (1988) 948–951.
[78] L.S. Frei, J.R. Magill, A. Cox, Paleomagnetic results from thecentral Sierra Nevada: constraints on reconstructions of thewestern United States, Tectonics 3 (1984) 157–177.
[79] L.S. Frei, Additional paleomagnetic results from the SierraNevada: further constraints on Basin and Range extension andnorthward displacement in the western United States, Geol. Soc.Amer. Bull. 97 (1986) 840–849.
[80] K.J. Whidden, S.P. Lund, D.J. Bottjer, D. Champion, D.G.Howell, Paleomagnetic evidence that the central block of Salinia(California) is not a far-traveled terrane, Tectonics 12 (1998)329–343.
[81] R.F. Teissere, M.E. Beck Jr., Divergent Cretaceous paleomag-netic pole position for the southern California batholith, USA,Earth Planet. Sci. Lett. 18 (1973) 296–300.
[82] J.T. Hagstrum, M. McWilliams, D.G. Howell, C.S. Gromme,Mesozoic paleomagnetism and northward translation of the BajaCalifornia Peninsula, Geol. Soc.Amer. Bull. 96 (1985) 1077–1090.
[83] J.J. Ague, M.T. Brandon, Tilt and northward offset of Cordilleranbatholiths resolved using igneous barometry, Nature 360 (1992)146–149.
114 I.M. Miller et al. / Earth and Planetary Science Letters 245 (2006) 95–114
[84] K.C. Bayer, Generalized structural lithologic and physiographicprovinces in the fold and thrust belts of the United States:exclusive of Alaska and Hawaii, U.S. Geological Survey, 1983.
[85] N.J. Silberling, D.L. Jones, J.W.H. Monger, P.J. Coney,Lithotectonic Terrane Map of the North American Cordillera,U.S. Geological Survey, 1992.
[86] R.L. Armstrong, P.L. Ward, Late Triassic to earliest Eocenemagmatism in the North American Cordillera: implications forthe Western Interior Basin, in: W.G.E. Caldwell, E.G. Kauffmann(Eds.), Evolution of the Western Interior Basin, GeologicalAssociation of Canada, vol. 39, 1993, pp. 49–72.
[87] J.K. Snow, B. Wernicke, Cenozoic tectonism in the central Basinand Range; magnitude, rate, and distribution of upper crustalstrain, Am. J. Sci. 300 (2000) 659–719.
[88] P. Wessel, W.F. Smith, New, improved version of the GenericMapping Tools released, EOS, Trans. 79 (1998) 579.
[89] R.A. Spicer, http://tabitha.open.ac.uk/spicer/CLAMP/Clampset1.html2003, 2003.
[90] Leaf Architecture Working Group, Manual of Leaf Architecture—Morphological Description and Categorization of Dicotyle-donous and Net-Veined Monocotyledonous Angiosperms, 1999,65 pp.
Related Documents


