Tucholke, B.E., Sibuet, J.-C., and Klaus, A. (Eds.) Proceedings of the Ocean Drilling Program, Scientific Results Volume 210 15. PALEOLATITUDE INFERRED FROM CRETACEOUS SEDIMENTARY AND IGNEOUS CORES RECOVERED FROM LEG 210, NEWFOUNDLAND MARGIN 1 Xixi Zhao, 2 Bruno Galbrun, 3 Heike Delius, 4 and Qingsong Liu 5 ABSTRACT We conducted an integrated paleomagnetic and rock magnetic study on cores recovered from Ocean Drilling Program Sites 1276 and 1277 of the Newfoundland Basin. Stable components of magnetization are de- termined from Cretaceous-aged sedimentary and basement cores after detailed thermal and alternating-field demagnetization. Results from a series of rock magnetic measurements corroborate the demagnetization behavior and show that titanomagnetites are the main magnetic carrier. In view of the normal polarity of magnetization and radiometric dates for the sills at Site 1276 (~98 and ~105 Ma, both within the Cretaceous Normal Superchron) and for a gabbro intrusion in peridotite at Site 1277 (~126 Ma, Chron M1), our results suggest that the primary magne- tization of the Cretaceous rocks is likely retained in these rocks. The overall magnetic inclination of lithologic Unit 2 in Hole 1277A be- tween 143 and 180 meters below seafloor is 38°, implying significant (~35° counterclockwise, viewed to the north) rotation of the basement around a horizontal axis parallel to the rift axis (010°). The paleomag- netic rotational estimates should help refine models for the tectonic evolution of the basement. The mean inclinations for Sites 1276 and 1277 rocks imply paleolatitudes of 30.3° ± 5.1° and 22.9° ± 12.0°, re- spectively, with the latter presumably influenced by tectonic rotation. These values are consistent with those inferred from the mid-Creta- ceous reference poles for North America, suggesting that the inclination determinations are reliable and consistent with a drill site on a location 1 Zhao, X., Galbrun, B., Delius, H., and Liu, Q., 2007. Paleolatitude inferred from Cretaceous sedimentary and igneous cores recovered from Leg 210, Newfoundland margin. In Tucholke, B.E., Sibuet, J.-C., and Klaus, A. (Eds.), Proc. ODP, Sci. Results, 210: College Station, TX (Ocean Drilling Program), 1–37. doi:10.2973/ odp.proc.sr.210.114.2007 2 Center for Study of Imaging and Dynamics of the Earth, Institute of Geophysics and Planetary Physics, University of California, Santa Cruz CA 95064, USA. [email protected] 3 Département de Géologie Sédimentaire, Université Paris VI, 75252 Paris Cedex 5, France. 4 Department of Geology, University of Leicester, University Road, Leicester LE1 7RH, United Kingdom. 5 School of Ocean and Earth Science, University of Southampton, National Oceanography Centre, European Way, Southampton SO14 3ZH, United Kingdom. Initial receipt: 10 March 2006 Acceptance: 5 March 2007 Web publication: 19 July 2007 Ms 210SR-114

Welcome message from author
This document is posted to help you gain knowledge. Please leave a comment to let me know what you think about it! Share it to your friends and learn new things together.
Transcript

Tucholke, B.E., Sibuet, J.-C., and Klaus, A. (Eds.)Proceedings of the Ocean Drilling Program, Scientific Results Volume 210
15. PALEOLATITUDE INFERRED FROM CRETACEOUS SEDIMENTARY AND IGNEOUS CORES RECOVERED FROM LEG 210, NEWFOUNDLAND MARGIN1
Xixi Zhao,2 Bruno Galbrun,3 Heike Delius,4 and Qingsong Liu5
ABSTRACT
We conducted an integrated paleomagnetic and rock magnetic studyon cores recovered from Ocean Drilling Program Sites 1276 and 1277 ofthe Newfoundland Basin. Stable components of magnetization are de-termined from Cretaceous-aged sedimentary and basement cores afterdetailed thermal and alternating-field demagnetization. Results from aseries of rock magnetic measurements corroborate the demagnetizationbehavior and show that titanomagnetites are the main magnetic carrier.In view of the normal polarity of magnetization and radiometric datesfor the sills at Site 1276 (~98 and ~105 Ma, both within the CretaceousNormal Superchron) and for a gabbro intrusion in peridotite at Site1277 (~126 Ma, Chron M1), our results suggest that the primary magne-tization of the Cretaceous rocks is likely retained in these rocks. Theoverall magnetic inclination of lithologic Unit 2 in Hole 1277A be-tween 143 and 180 meters below seafloor is 38°, implying significant(~35° counterclockwise, viewed to the north) rotation of the basementaround a horizontal axis parallel to the rift axis (010°). The paleomag-netic rotational estimates should help refine models for the tectonicevolution of the basement. The mean inclinations for Sites 1276 and1277 rocks imply paleolatitudes of 30.3° ± 5.1° and 22.9° ± 12.0°, re-spectively, with the latter presumably influenced by tectonic rotation.These values are consistent with those inferred from the mid-Creta-ceous reference poles for North America, suggesting that the inclinationdeterminations are reliable and consistent with a drill site on a location
1Zhao, X., Galbrun, B., Delius, H., and Liu, Q., 2007. Paleolatitude inferred from Cretaceous sedimentary and igneous cores recovered from Leg 210, Newfoundland margin. In Tucholke, B.E., Sibuet, J.-C., and Klaus, A. (Eds.), Proc. ODP, Sci. Results, 210: College Station, TX (Ocean Drilling Program), 1–37. doi:10.2973/odp.proc.sr.210.114.20072Center for Study of Imaging and Dynamics of the Earth, Institute of Geophysics and Planetary Physics, University of California, Santa Cruz CA 95064, USA. [email protected]épartement de Géologie Sédimentaire, Université Paris VI, 75252 Paris Cedex 5, France.4Department of Geology, University of Leicester, University Road, Leicester LE1 7RH, United Kingdom.5School of Ocean and Earth Science, University of Southampton, National Oceanography Centre, European Way, Southampton SO14 3ZH, United Kingdom.
Initial receipt: 10 March 2006Acceptance: 5 March 2007Web publication: 19 July 2007Ms 210SR-114
X. ZHAO ET AL.PALEOLATITUDE INFERRED FROM CRETACEOUS CORES 2
in the North America plate since at least the mid-Cretaceous. The com-bined paleolatitude results from Leg 210 sites indicate that the New-foundland Basin was some 1800 km south of its current position in themid-Cretaceous. Assuming a constant rate of motion, the paleolatitudedata would suggest a rate of 12.1 mm/yr for the interval from ~130 Ma(Site 1276 age) to present, and 19.6 mm/yr for the interval from 126 Ma(Site 1277 age) to recent. The paleolatitude and rotational data fromthis study are consistent with the possibility that Site 1276 may havepassed over the Canary and Madeira hotspots that formed the New-foundland Seamounts in the mid-Cretaceous.
INTRODUCTION
The mid-Cretaceous (124–84 Ma) was a period of unrest in geologichistory. In the mid-Cretaceous, the breakup of the supercontinentGondwana into separate continents was still under way, which causedthe rift between South America and Africa (Van der Voo, 1993). Geolog-ical evidence points toward an unusually high rate of volcanic activityin the mid-Cretaceous (Larson, 1991). Crustal-growth events termed“large igneous provinces” (LIPs) made very important contributions tothe lithosphere during the mid-Cretaceous (Eldholm and Coffin, 2000).Several large LIPs in the world such as the Ontong Java Plateau (120Ma) (Neal et al., 1997; Mahoney and Coffin, 1997), the main portion ofthe Kerguelen Plateau (115–80 Ma) (Coffin, Frey, Wallace, et al., 2000),the Madagascar LIP (84–91 Ma) (Storey et al., 1997), the High Arctic LIP(85–95 Ma) (Brinkman and Tarduno, 2005), and the Caribbean LIP (87–90 Ma) (Kerr et al., 1997) were formed during this time. This globalmagmatism is marked as well by increases in production of oceanic pla-teaus and seamount chains, such as the Newfoundland Seamounts(97.7 Ma) (Sullivan and Keen, 1977) (Fig. F1). A key piece in this mid-Cretaceous geologic puzzle is the Cretaceous Normal Superchron (CNS),a period during which Earth’s magnetic field was so uncharacteristicallysteady that it did not switch from normal to reversed polarity for ~40m.y. (Aptian–Santonian, 124–84 Ma on the geologic timescale of Grad-stein et al., 2004, used here). These geological and geophysical signalsin the mid-Cretaceous have excited high interest in the geosciencecommunity, leading many to suggest a connection between all of thesephenomena and deep-mantle convection (e.g., Vogt, 1975; Larson andKincaid, 1996; Besse and Courtillot, 2002).
Several interpretations suggest that North Atlantic extension be-tween North America and Europe continued throughout the entireEarly Cretaceous into Aptian time (mid-Cretaceous) (see Tucholke et al.,in press, for a thorough discussion). The Atlantic Ocean is still expand-ing today. Global Positioning System measurements with very longbaseline interferometry techniques show that the distance between On-sala (Sweden) and Westford (Massachusetts, USA) is widening by 13.4 ±0.7 mm/yr (Van der Voo, 1993). The original plate tectonic setting(paleolatitude) and the rate of relative plate motion over the interval ofthe mid-Cretaceous are, however, largely unconstrained. The New-foundland-Iberia rift lies between North America and European platesand is a key location to examine these questions.
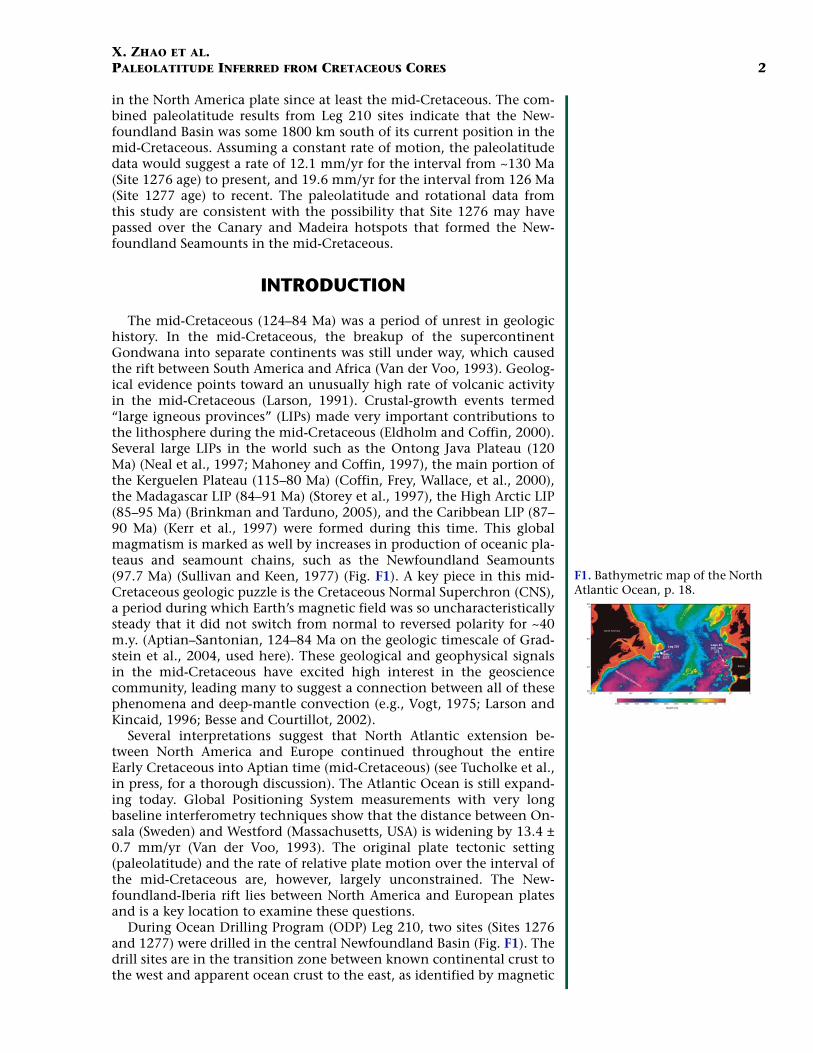
During Ocean Drilling Program (ODP) Leg 210, two sites (Sites 1276and 1277) were drilled in the central Newfoundland Basin (Fig. F1). Thedrill sites are in the transition zone between known continental crust tothe west and apparent ocean crust to the east, as identified by magnetic
North America
Iberia
Leg 210 Legs 47,103, 149,
173Site1276
Site1277
60°N
50°
40°
30°80°W 70° 60°
6000 5000 4500 4000 3500 3000 2500 2000 1500 1000 500 0
50° 40° 30° 20° 10° 0°
Depth (m)
New England Seamounts
F1. Bathymetric map of the North Atlantic Ocean, p. 18.

X. ZHAO ET AL.PALEOLATITUDE INFERRED FROM CRETACEOUS CORES 3
Anomalies M3–M0 (Barremian–Aptian; 129–125 Ma), and they arealong a transect exactly conjugate to the ODP Leg 149/173 drilling siteson the Iberia margin. Extensive geophysical work and deep-sea drillinghave shown that the transition zone on the conjugate Iberia margin isexhumed continental mantle that is strongly serpentinized in its upperpart (Whitmarsh, Sawyer, Klaus, and Masson, 1996). Transition zonecrust on the Newfoundland side, however, is typically a kilometer ormore shallower and has much smoother topography (Tucholke and Si-buet, 2003). Major goals of Leg 210 were to investigate these differencesand to better understand the rifting history by sampling basement anda strong basinwide reflection (U) overlying basement. Recovered rocksfrom Leg 210 include Cretaceous-age claystone, black shale, sills, ba-salts, and serpentinized peridotites (Tucholke, Sibuet, Klaus, et al.,2004).
Here we present results from paleomagnetic and rock magnetic mea-surements from Sites 1276 and 1277, including both Cretaceous sedi-mentary and igneous rocks. We first describe the results and focus onthe cores that provided the most readily interpretable data. We thensummarize the data and assess the origin and stability of remanentmagnetization. The data are used to establish the paleolatitudes of theNewfoundland Basin during the mid-Cretaceous and to assess possibletectonic rotation of the basement ridge drilled at Site 1277. The paleo-latitude constraints are used to infer tectonic drift of the region.
SITE SETTING, LITHOLOGY, SEDIMENTATION RATES, AND AGES
The site locations (Fig. F1) and drilling results are documented in de-tail in the site chapters of the Leg 210 Initial Reports volume and otherappropriate papers (see Tucholke, Sibuet, Klaus, et al., 2004; Karner andShillington, 2005; Tucholke et al., in press). We briefly note the geologicsetting, lithology, and core ages of the drill sites here, restricted to Cre-taceous-aged rocks.
At Site 1276, we drilled from 800 to 1737 meters below seafloor(mbsf) with excellent recovery throughout the entire cored interval (Tu-cholke, Sibuet, Klaus, et al., 2004). Five lithologic units are recognizedthat range from uppermost Aptian–lowermost Albian to lower Oli-gocene sediments (see fig. F18 in Shipboard Scientific Party, 2004a).Both calcareous nannofossils and planktonic foraminifers provided bio-stratigraphic control for most of the Site 1276 sections. Based on firstand last occurrence datums of microfossils, an age-depth model for Site1276 was constructed (see fig. F141 in Shipboard Scientific Party,2004b). The age-depth plot reveals a number of marked changes in sed-imentation rate; at least one, and possibly two, unconformities; andtwo condensed intervals. The changes in slope correspond closely tolithologic unit boundaries. The Cretaceous sedimentary successions areconfined to lithologic Units 4 and 5 (see fig. F6 in Shipboard ScientificParty, 2004b). Sediments in Unit 4 are mainly sandy mudstones andmuddy sandstones that accumulated slowly (~2 m/m.y.) during Campa-nian–middle Turonian time (Shipboard Scientific Party, 2004b). Thecharacteristic color of Unit 4 is moderate brown, which is perhaps re-lated to the presence of fine-grained iron oxides (Shipboard ScientificParty, 2004b). Sedimentary cores from Unit 5 are lower Turonian to Al-bian–uppermost Aptian claystone and mudstone. Finely laminated

X. ZHAO ET AL.PALEOLATITUDE INFERRED FROM CRETACEOUS CORES 4
claystones (black shales) are well developed and numerous throughoutUnit 5 (fig. F6 in Shipboard Scientific Party, 2004b). Unit 5 accumulatedat relatively rapid rates of 15–100 m/m.y., with higher rates downhole.Subunit 5A is dominated by graded sandstone, siltstone, and mudstoneintervals that were rapidly emplaced from gravity flows plus very bur-rowed olive-gray hemipelagic sediment. In contrast, Subunit 5B is com-posed of mainly burrowed hemipelagic sediments. Subunit 5B includesvery finely laminated, calcareous, carbon-rich sediments (black shales).Subunit 5C, like Subunit 5A, is dominated by thick to very thick, grayto greenish black gravity-flow deposits with little true hemipelagic sedi-ment. Subunit 5C is intruded by two major diabase sills, the shallowerof which is at a depth equivalent to the “U reflection,” a bright horizon-tal reflection that overlies transitional crust throughout the Newfound-land Basin (fig. F6 in Shipboard Scientific Party, 2004b). Lithologicfeatures of sedimentary contacts with the sill show that the sills wereintruded at shallow levels within highly porous sediments. Hydrother-mal alteration in the sills ranges from high to complete at the marginsto moderate toward the centers (Tucholke, Sibuet, Klaus, et al., 2004).The upper sill (Subunit 5C1) extends from 1612.72 to 1623.00 mbsf(Section 210-1276A-87R-6, 72 cm, to Section 88R-7, 117 cm) (Tucholke,Sibuet, Klaus, et al., 2004). The rocks are aphanitic to fine-grained aphy-ric diabase. The upper sill is ~10 m thick and preserves chilled marginsat its upper and lower contacts. The sediments show a baked contact atthe top of the sill, which is well preserved in Section 210-1276A-87R-6.The lower contact of the sill was not recovered and no baked contact ispreserved in the underlying sediments. The lower sill (Subunit 5C2) isan igneous complex extending from Sections 210-1276A-97R-3 to102R-1 at the base of the hole. The rocks forming the sill complex areaphanitic to medium-grained aphyric to seriate diabase, which are ob-served in five intervals (intervals 210-1276A-97R-3, 141–150 cm; 97R-4,0–3 cm; 98R-1, 112–137 cm; 98R-2, 1–31 cm; and from 98R-CC, 10 cm,to the last recovery in 102R-1, 0–2 cm [see Shipboard Scientific Party,2004b]). In the first four intervals, the sills range in thickness from deci-meters to a few centimeters; the thinner sills may represent small apo-physies (magmatic fingers) related to the larger sills. From Core 210-1276A-98R to the base of the hole, low recovery and strong drilling dis-turbance make it difficult to determine if this complex is a single thicksill or several thinner sills. The age-depth plot for Site 1276 suggeststhat the host sediments for the upper and lower sills are lower Albian–uppermost Aptian (see fig. F141 in Shipboard Scientific Party, 2004b).The 40Ar-39Ar ages of two samples (Samples 210-1276A-88R-2, 88–92cm, and 88R-3, 76–80 cm) from the upper sill (Subunit 5C1) are 104.7 ±1.7 Ma and 105.9 ± 1.8 Ma (Hart and Blusztajn, in press). The age of theupper sill emplacement is also independently estimated to be 99.9–105.2 Ma by porosity-age curves (Karner and Shillington, 2005). Excel-lent 40Ar-39Ar radiometric results from two lower sill (Subunit 5C2) sam-ples (Samples 210-1276A-99R-3, 19–22 cm, and 99R-6, 24–30 cm) yieldages of 95.9 ± 2.0 Ma and 99.7 ± 1.8 Ma, respectively (Hart and Blusz-tajn, in press). Thus, the sills are substantially younger than the pre-sumed age of the seafloor at Site 1276 (~130 Ma) and are also youngerthan the host sediments (110–112 Ma). Paleomagnetic samples used inthis study are mainly from Unit 5.
Site 1277 is located about 40 km southeast of Site 1276, near mag-netic Anomaly M1 on crust that may be oceanic (Shillington et al.,2004, Van Avendonk et al., 2006). Leg 210 drilled Site 1277 to test theinference that the site location was on an oceanic crust formed by early

X. ZHAO ET AL.PALEOLATITUDE INFERRED FROM CRETACEOUS CORES 5
seafloor spreading in the Newfoundland Basin. However, because of thetime constraints for the final operation of the leg, only two units werecored at Site 1277 from 103.9 to 180.3 mbsf (see Shipboard ScientificParty, 2004a). The upper ~57 m of recovered basement (Unit 1) is a sed-imentary and volcanic succession, with at least three basaltic flows sep-arated by volcaniclastic and ferruginous sedimentary interbeds (see fig.F2 in Shipboard Scientific Party, 2004c). Variably deformed gabbroicrocks and coarse breccia containing clasts of gabbro and serpentiniteare also recovered from this unit. In contrast, the bottom ~38 m con-sists entirely of variably foliated serpentinized peridotites (fig. F2 inShipboard Scientific Party, 2004c). These yellow- and green-colored ser-pentinized peridotites (tectonized harzburgite and serpentinite mylo-nite) are all cut pervasively by several stages of veining and mineralprecipitation. The serpentinized peridotite drilled at Site 1277 is inter-preted to be basement that represents tectonically exhumed mantle.This interpretation is compatible with the observation that the serpen-tinite in Unit 2 shows pervasive brittle deformation and hydrothermalalteration that decreases downhole (Tucholke, Sibuet, Klaus, et al.,2004). The downhole decrease in alteration may explain increasing corerecovery with depth, from <9.28% at the top of the serpentinite (Core210-1277A-6R) to 105.73% at the bottom of the hole (Core 210-1277A-9R, the last core of ODP). An 40Ar-39Ar age of biotite from a gabbro in-trusion in peridotite sample from Site 1277 (Sample 210-1277A-9R-1,20–23 cm) yields an age of 126.5 ± 0.1 Ma (Jagoutz et al., submitted[N1]), which is compatible with a seafloor spreading age (about Anom-aly M1, 126 Ma on the geologic timescale of Gradstein et al., 2004).
MAGNETIC MEASUREMENTS, DATA ANALYSIS, AND RESULTS
The paleomagnetic data presented in this paper are of two differenttypes: (1) those obtained using the shipboard pass-through cryogenicmagnetometer and (2) those derived from analysis of discrete samplesboth on the ship and on shore. In order to more fully understand thenature and origin of the remanence carriers within the Cretaceousrocks, supplementary rock magnetic and petrologic characterization ofselected samples were also performed at University of California SantaCruz, University of Minnesota, and University of Leicester. Data fromdifferent laboratories are found to be in excellent agreement with eachother. The data include shipboard split-core data that are available inthe ODP database but were not archived in the Leg 210 Initial Reportsvolume, as well as data collected since Leg 210 (Table T1). Table T2summarizes the rock magnetic results of this study. Below, we outlinethe laboratory measurement procedure and data analysis methods anddescribe the data.
Split-Core Results from Shipboard Measurements
The laboratory procedure and results of shipboard paleomagneticmeasurements are described in detail in the site chapters of Tucholke,Sibuet, Klaus, et al. (2004). Briefly, magnetic measurements were per-formed by passing continuous archive-half core sections of the splitcores through a 2G cryogenic magnetometer. Remanence measure-ments were made at 2-cm intervals on all archive-half core pieces
T1. Paleomagnetic data, p. 27.
T2. Rock magnetic properties, p. 33

X. ZHAO ET AL.PALEOLATITUDE INFERRED FROM CRETACEOUS CORES 6
longer than ~6 cm. Typically, archive-half cores were subjected to step-wise alternating-field (AF) demagnetization at 5- to 10-mT steps up tomaximum peak fields of 60 mT. The characteristic remanent magnetiza-tion (ChRM) directions were calculated by principal component analy-sis (Kirschvink, 1980) at all measurement points along the core pieceswhere stable vector components could be identified on vector demag-netization plots (Zijderveld, 1967).
Split-core paleomagnetic data obtained at Sites 1276 and 1277 ex-hibit considerable variations in demagnetization behavior among vari-ous lithologies. A remagnetization imparted by the coring process iscommonly encountered, as observed in many previous legs (e.g., Ade-Hall and Johnson, 1976; Gee et al., 1989; Zhao et al., 1994). This remag-netization is characterized by natural remanent magnetization (NRM)inclinations that are strongly biased toward a vertical value (+90) inmost cores. In most cases, the drilling overprint can be removed with10- to 30-mT AF demagnetization, and the ChRM direction can be iso-lated using stepwise demagnetization at higher fields. The effect of re-moval of this overprint by AF cleaning is a significant decrease inintensity and a shift toward shallower inclination. Examples of good-quality AF demagnetization results are shown in Figure F2. As shown inFigure F2, marble Sample 210-1276A-87R-6, 62 cm, from just above thesill of Subunit 5C1, has the same ChRM inclination as the thermally al-tered meta-grainstone Sample 210-1276A-87R-6, 72 cm, from sedimentscontacting the chilled margin of the upper diabase sill, indicating theyacquired primary magnetization during the intrusion of the sill.
Sandy mudstones and muddy sandstones in Unit 4 of Site 1276 havea mean NRM intensity of 3 × 10⁻² A/m and magnetic susceptibility of 1× 10⁻⁴ SI units. A strong drilling-induced overprint is present through-out Unit 4, which severely limits paleomagnetic work. Sedimentarycores from Unit 5 have lower NRM intensity (mean ~2.5 × 10⁻³ A/m)and magnetic susceptibility (mean ~8 × 10⁻⁵ SI units). The magnetiza-tion of dark claystones (black shale) is typically an order of magnitude(in some cases even two orders) weaker than the light-colored sedi-ments. Nevertheless, the ChRM directions can still be defined fromthese black shales using stepwise demagnetization.
For the two diabase sills of Site 1276, we performed detailed AF de-magnetization on all coherent pieces that could be oriented unambigu-ously with respect to the top of the core. For a majority of the cases, theChRM direction can be isolated at higher AF fields (e.g., Fig. F3). The in-clinations of the ChRM direction for these two diabase sills are all posi-tive. Although the NRM intensities and inclinations are quite variable,we identified distinct differences between the upper and lower diabasesills. The lower sill (Sections 210-1276A-99R-1 to 99R-6; ~1719–1725mbsf) is generally more weakly magnetized; the average intensity andmagnetic susceptibility are 0.8 A/m and 3.2 × 10⁻³ SI units, respectively.The upper sill (Sections 210-1276A-87R-6 through 88R-7; ~1613–1623mbsf), however, is more magnetic and has average intensity and mag-netic susceptibility values consistently above 3.8 A/m and 5.6 × 10⁻² SIunits, respectively. The average Königsberger ratio Q (defined as the ra-tio of the NRM intensity to the induced magnetization in the localEarth’s field) for the upper sill is ~1.9, whereas Q values in the lower sillhave a mean of 9.5.
Paleomagnetic data obtained by pass-through cryogenic magnetome-ter measurements for Site 1277 indicate that the greenish gabbro cata-clasite in Core 210-1277A-2R has the lowest NRM intensity (~0.02–0.3
Sample 210-1276A-87R-6, 62 cm Sample 210-1276A-87R-6, 72 cm
W Up W Up
E Down E Down
S N S N60 mT
60 mT
20 mT20 mT
NRM
NRM
A B
F2. AF demagnetization for split-core samples, p. 19.
Sample 210-1276A-88R-4, 60 cm Sample 210-1276A-99R-1, 125 cm
W Up W Up
E Down E Down
S NS N
20 mT
20 mT
40 mT
60 mT
10 mT
5 mT
NRM
NRM
A B
F3. AF demagnetization for dia-base sills, p. 20.

X. ZHAO ET AL.PALEOLATITUDE INFERRED FROM CRETACEOUS CORES 7
A/m) compared with relatively fresh aphyric basalt in Cores 210-1277A-1R, 3R, and 5R (~1–4 A/m), gabbro at the base of Core 210-1277A-4Rand in the lower part of Core 210-1277A-5R (~0.2–0.5 A/m), and serpen-tinized peridotites in Core 210-1277A-9R (1–9 A/m). It is encouraging tonote that a basaltic sample (Sample 210-1277A-1W-2, 28 cm) and adja-cent sediment (Sample 210-1277A-1W-2, 94 cm) have the same stableinclination values (Table T1). The green breccia, on the other hand, dis-played variable inclinations, which is consistent with the expectationthat the breccia is unsorted and there should be a great variation in in-clinations of the clasts. This observation suggests that there was no ther-mal or other event that completely remagnetized both breccia andbasalts. Shipboard observation suggests that rocks in Unit 1 are largelyallochthonous. The consistent ChRM inclinations in the basalt and sed-iments, however, suggest that they might have been deposited in situ.The serpentine peridotites in Core 210-1277A-9R showed a variable de-gree of overprinting, but AF demagnetization easily removed the over-printing and isolated the ChRM direction. ChRM inclinations obtainedfrom different parts of long, coherent pieces generally agree within a fewdegrees and cluster around a mean of 40°, which is in general agreementwith inclinations from the basalt, gabbro, and sediments in Unit 1.
Although many of the data from the shipboard pass-through mea-surements probably contain valid estimates of the ChRM of sedimen-tary and igneous rocks (Fig. F4), assessing which intervals are accuraterecorders is not always easy because of the presence of the drilling re-magnetization, coring disturbance, and possible inclination shallowingbecause of compaction, tectonic rotation, or both. Nevertheless, ship-board data do provide a framework for the identification of specific in-tervals where more extensive shore-based paleomagnetic analyses arerequired. The higher resolution of the split-core data (compared withminicore data) is also useful in assessing the independence of strati-graphically adjacent igneous units in sampling geomagnetic secularvariation.
In order to obtain reliable estimates of the ChRM from the split-coredata of sedimentary and igneous rocks, we devised several criteria toavoid overprinted and magnetically unstable intervals. Our criteria in-cluded
1. Rejecting any measurements with inclination steeper than ±65°,a very likely sign that the drilling-induced remagnetization isstill present;
2. Accepting samples with principal component maximum angulardeviation angles <10°; and
3. Rejecting samples with inclinations less than ±10°, whose mag-netization was likely affected by inclination shallowing, paleose-cular variation, tilt of drill holes, and/or tectonic rotations.
We generally accept data where there is agreement between the split-core and discrete inclinations from a similar interval (Table T1). A totalof 178 split-core paleomagnetic determinations satisfy the above-men-tioned acceptance criteria for further analyses and paleolatitude esti-mates.
AF and Thermal Demagnetization of Discrete Samples
Discrete paleomagnetic samples were used for both shipboard andshore-based paleomagnetic studies. These 2.5-cm cylindrical samples
Sample 210-1276A-29R-1, 127-129 cm Sample 210-1276A-36R-5, 125-127 cm
W Up W Up
E Down
W Up
E Down
E Down
S N
S N 200 mT
30 mT
10 mT
NRM
T450°
T200° T100°
T450°
T200°
T100°
NRM
NRM
A
Sample 210-1276A-79R-2, 57-59 cm C
B
S N
F4. AF and thermal demagnetiza-tion for samples, p. 21.

X. ZHAO ET AL.PALEOLATITUDE INFERRED FROM CRETACEOUS CORES 8
were drilled from core sections that contained long pieces and generallywere taken from the least-altered parts. In all cases, the uphole directionwas recorded on the sample by means of an orientation arrow before re-moval from the core section. All samples were kept in a low-field envi-ronment (field-free room) to prevent viscous remanence acquisition;the NRM intensity or direction of the minicore samples did not changesignificantly (<5%) after zero-field storage for 2 weeks. Samples werethen stepwise AF or thermally demagnetized. During thermal demagne-tization, the initial susceptibility was monitored between each tempera-ture step as a means of assessing any irreversible mineralogical changesassociated with heating. Apart from small insignificant fluctuations, thesusceptibility of minicore samples generally did not change until afterthey had been heated to 350°C. Above this temperature, many samplesshowed a decrease or increase in susceptibility and some samples exhib-ited unstable demagnetization behavior.
Whenever possible, demagnetization was continued until an unam-biguous and reliable determination of the stable component of magne-tization had been achieved. As with the long core pieces, a vectordiagram was used for each minicore sample to identify the magneticcomponents of magnetization that were present. For samples that gavereliable demagnetization results, magnetic components were deter-mined by fitting least-squares lines to segments of the vector demagne-tization plots (Kirschvink, 1980) that were linear in three-dimensionalspace. Figure F4 illustrates the demagnetization behavior of severalsamples from different lithologic units. These samples demonstrate theremoval of the vertically directed drilling-induced magnetization com-ponent and the isolation of a stable component that is univectoriallydecaying toward the origin of the vector plots (Zijderveld, 1967). Thesedemagnetization behaviors are typical of the majority of samples in thisstudy. A significant number of samples from the upper sill of Site 1276maintained much steeper inclination values after progressive demagne-tization, which may be because of an overprint that has not been com-pletely removed or because of paleosecular variation. In contrast, themagnetization of the lower sill samples is quite stable and well behaved.A small, random component of magnetization was easily removed bydemagnetization and the characteristic component quickly revealed it-self. Mean ChRM inclination of the lower sill is ~50°, which is similar toinclinations of sediments above the sill.
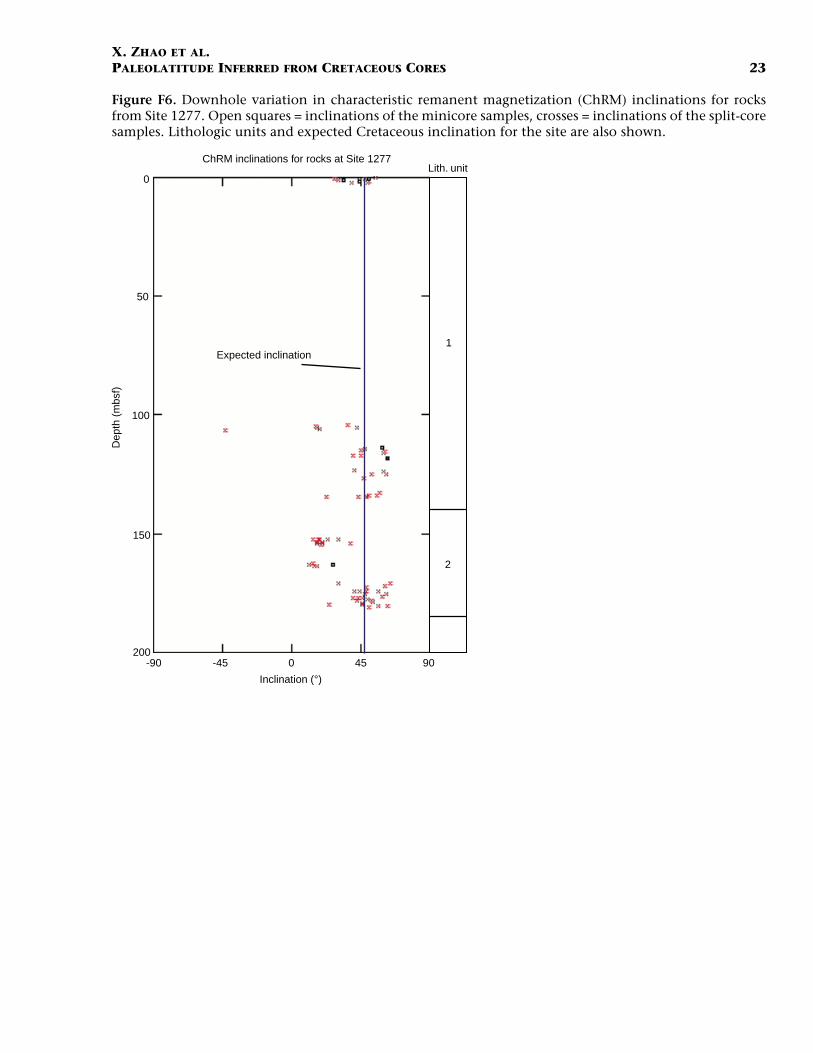
We always define the ChRM direction based on the higher tempera-ture or AF demagnetization steps. We used the same criteria by whichwe accepted the split-core data, namely, excluding those samples withinclinations greater than ±65° or less than ±10° from the mean calcula-tion. In addition, we also rejected demagnetization results from samplesthat altered significantly during thermal cleaning (those marked unsta-ble in Table T1). A total of 106 minicore data are accepted data. Thecombined data sets are plotted against depth in Figures F5 and F6.
Rock Magnetic Characterization
In order to more fully understand the nature and origin of the rema-nence carriers within the Cretaceous rocks, supplementary rock mag-netic characterization of selected discrete samples was performed at thepaleomagnetism laboratories at University of California Santa Cruz andat the Institute for Rock Magnetism of the University of Minnesota. Atotal of 32 samples were subjected to a wide range of rock magneticmeasurements, including
1000
1100
1500
1400
1300
1200
1600
1700
1800 -90 -45 0 45 90
Inclination (°)
Dep
th (
mbs
f)
Lith. unit
Expected inclination
3
4
5A
5B
5C
ChRM inclinations for rocks at Site 1276
F5. Downhole variation in ChRM inclinations, Site 1276, p. 22.
Expected inclination
Dep
th (
mbs
f)
-90 -45 0 45 90
Inclination (°)
0
50
150
100
200
Lith. unit
1
2
ChRM inclinations for rocks at Site 1277
F6. Downhole variation in ChRM inclinations, Site 1277, p. 23.

X. ZHAO ET AL.PALEOLATITUDE INFERRED FROM CRETACEOUS CORES 9
1. Curie temperature determinations using both low and high ap-plied fields (0.05 mT and 1 T, respectively);
2. Hysteresis loop parameter measurements: saturation magnetiza-tion (Js), saturation remanence (Jr), coercivity (Bc), and remanentcoercivity (Bcr) determined from 10 to 400 K; and
3. Saturation isothermal remanent magnetization as a function oftemperature (10–300 K).
Transitions in the magnetic properties of magnetite, pyrrhotite, and he-matite occur at low temperatures and they provide a potential means ofmagnetic mineral identification. Magnetite exhibits a crystallographicphase transition from cubic to monoclinic at 110–120 K, known as theVerwey transition (Verwey et al., 1947).
As summarized in Table T2, the diabase sill samples of Site 1276 areuniformly characterized by a single magnetic phase with Curie temper-atures between 515°C and 580°C (Table T2), compatible with Ti-poormagnetite. They also display quite uniform low-temperature properties,with distinct Verwey transition temperatures ~120 K and show similarhysteresis properties that are compatible with pseudosingle domain(PSD) particles, with intermediate grain sizes (0.08–9 µm). These resultsare consistent with those of Fe-Ti oxide analysis on Leg 210 cores(H. Delius, pers. comm., 2007), which suggests that titanomagnetiteand ilmenite are the two dominant minerals in the sill samples.
Curie temperature measurements on the brown dunite samples inHole 1277A display a significant drop of magnetic moment around420°C (Fig. F7A), most likely attributable to the presence of maghemite.The low-temperature curves for the yellow-brown colored peridotitesdid not show any Verwey transition (Fig. F7B), suggesting that the mag-netic carrier in these samples is not magnetite. In contrast, the dark-col-ored peridotite samples exhibit a strong Verwey transition in thevicinity of 110 K (Fig. F7D), which is indicative of the presence of titan-omagnetite. The Curie temperatures for these dark-colored peridotitesare between 550°C and 580°C, suggesting that titanomagnetite is themagnetic carrier (Fig. F7C). The thermomagnetic curves of these sam-ples exhibit very little difference between heating and cooling of thesamples, signifying that the magnetite underwent no chemical alter-ation during heating. Room-temperature hysteresis parameters furtherindicate that the magnetites in the serpentinized peridotite samples arepredominantly PSD grains (Fig. F8).
Taken together, the rock magnetic properties corroborate the demag-netization behavior and suggest that the igneous rocks in Sites 1276and 1277 are probably good paleomagnetic recorders that can preserveoriginal magnetization. The generally good magnetic stability exhibitedby these titanomagnetite-bearing rocks suggests that their stable incli-nations (and corresponding paleolatitudes) may be reliable for tectonicreconstructions.
Age of Magnetization
Determining the age of magnetization is absolutely critical and oftennot always straightforward. This has been a challenging problem inpaleomagnetic research on ODP core materials. The directions associ-ated with the ChRM in the two diabase sills in Site 1276 displayed highconsistency and were isolated after removal of a secondary overprint,leading us to interpret them as primary. The agreement between thesplit-core data and discrete inclinations from the same intervals is ex-
Sample 210-1277A-9R-2, 51-53 cm Sample 210-1277A-9R-4, 19-21 cm
Sample 210-1277A-9R-2, 51-53 cm Sample 210-1277A-9R-6, 35-37 cm
Brown dunite(maghemite)
Dark peridotite(magnetite)
0.14
0.12
0.10
0.08
0.06
0.04
0.02
0.005
0.010
0.015
0.020
00 0 100 200 300 0 100 200 300
0 100 200 300 400 500 60000
1
0
1
100 200 300 400 500 600N
orm
aliz
ed J
s
Nor
mal
ized
Js
A C
B D
~170.0 mbsf 178.0 mbsf
Temperature (°C) Temperature (°C)
SIR
M
F7. Temperature dependence of magnetization curves, p. 24.
SD Basalt
Serpentinized peridotite
SP + SD
MD
PSD or SD + MD
1
0.01
0.1
1
10
Hcr/Hc
J rs/J
s
F8. Hysteresis ratios plotted on a Day-type diagram, p. 25.

X. ZHAO ET AL.PALEOLATITUDE INFERRED FROM CRETACEOUS CORES 10
cellent. Thus, the split-core data from sill cores also provide accurate es-timates of the ChRM inclinations. The inclinations of the ChRMdirection for these two diabase sills are all positive. The simplest expla-nation of the positive inclinations is that they represent normal polar-ity magnetization, probably acquired within the CNS (84–124 Ma).Indeed, the radiometric ages indicate that the two sills were emplacedat ~98 Ma and ~105 Ma (Hart and Blusztajn, in press). Thus, the normalpolarity observed in the sill samples is consistent both with the CNSand the age of the rocks. The biostratigraphic ages for sedimentary suc-cessions in Units 4 and 5 are Albian–Santonian, which is also withinthe CNS. Cores in Units 4 and 5 are mostly normally magnetized (>97%of the selected data). This normal polarity is consistent with magnetiza-tion that should have been acquired during the CNS. In view of thenormal polarity and inclination values of magnetization identifiedfrom the sill samples, the ChRM of sediments is probably within thebroad age of the CNS as well.
At Site 1277, the magnetically cleaned inclinations in the basalts(Unit 1) and serpentinized peridotites (Unit 2) are systematically shal-lower than the inclination expected today (64°) at the drill site, indicat-ing that the ChRM is not a recent overprint. The similar inclinationvalues observed in basalt, sedimentary interbeds, and peridotites (ex-cepting significantly different inclination from the chaotic breccias) arenecessary but not sufficient proof that the stable magnetization re-corded by these rocks is original. The available radiometric age (126.5Ma) of gabbro in the Site 1277 peridotites puts direct age constraints onthe magnetization. The mean ChRM inclinations are statistically indis-tinguishable from the inclinations of rocks from Site 1276 and also arecompatible with shallow inclinations observed at ODP Leg 173 sites onthe conjugate margin (Zhao, 2001), leading us to believe that the char-acteristic components can be regarded as recorders of the paleofieldsometime in the Cretaceous. As described below, the estimated paleolat-itudes from the mean inclinations observed in both Units 1 and 2 are inagreement with the expected Cretaceous paleolatitudes for both Iberiaand North America. For all of these reasons, plus the straightforward de-magnetization behavior, we believe that the mean inclination from Site1277 is plausible, and even likely, near primary magnetization acquiredwhen the rocks were formed.
Paleosecular Variation
Before the paleomagnetic data can be converted to paleolatitudes forpaleogeographic reconstructions, it is important to ensure that paleose-cular variation has been averaged out so that the mean inclination rep-resents a time-averaged geocentric axial dipole field. For Site 1276,sedimentation rates are generally low (~2 m/m.y. for sedimentary rocksin Unit 4 and 15–100 m/m.y. for sediments in Unit 5); thus, the inclina-tion from a single sample represents a partially time-averaged geomag-netic field and samples spanning a depth interval of 2–50 m should besufficient to average secular variation.
Igneous samples from a single cooling unit only give an instanta-neous measure of the geomagnetic field. The time interval betweencooling units is rarely known. The number of independent units, how-ever, can be estimated from the pattern and differences among flowmeans (Cox and Gordon, 1984; Sager, 2006). If the difference betweenflow means is small (less than ~10), then these means are consideredcorrelated and should be averaged. Tarduno and Cottrell (1997) and Ac-
X. ZHAO ET AL.PALEOLATITUDE INFERRED FROM CRETACEOUS CORES 11
ton et al. (2000) have suggested that generally more than ~10 indepen-dent cooling units are considered sufficient to average secular variation.In this regard, the numbers of cooling units represented by the threebasalt flows of Unit 1 at Site 1277 as well as the upper sill (Subunit 5C1)at Site 1276 certainly are not large enough to ensure averaging of secu-lar variation. It is also difficult to ascertain whether the paleosecularvariation has been fully averaged from the lower sill complex of Site1276 and the serpenitinized peridotites at Site 1277. However, we notethat for each sill unit in Hole 1276A, the mean inclinations of sill sam-ples are statistically indistinguishable from those of overlying Creta-ceous sediments, both baked and unbaked. This observation is perhapsthe most compelling argument for isolating the primary ChRM thatmay represent a time-averaged field, although this observation is notsufficient by itself.
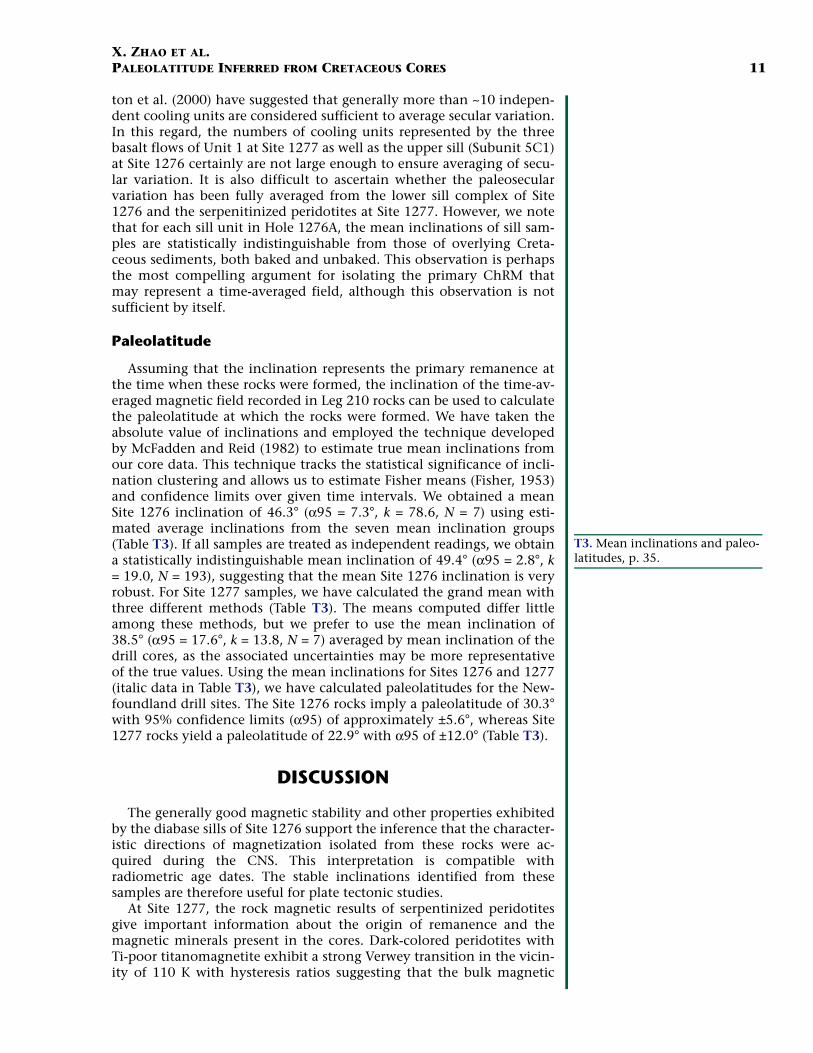
Paleolatitude
Assuming that the inclination represents the primary remanence atthe time when these rocks were formed, the inclination of the time-av-eraged magnetic field recorded in Leg 210 rocks can be used to calculatethe paleolatitude at which the rocks were formed. We have taken theabsolute value of inclinations and employed the technique developedby McFadden and Reid (1982) to estimate true mean inclinations fromour core data. This technique tracks the statistical significance of incli-nation clustering and allows us to estimate Fisher means (Fisher, 1953)and confidence limits over given time intervals. We obtained a meanSite 1276 inclination of 46.3° (α95 = 7.3°, k = 78.6, N = 7) using esti-mated average inclinations from the seven mean inclination groups(Table T3). If all samples are treated as independent readings, we obtaina statistically indistinguishable mean inclination of 49.4° (α95 = 2.8°, k= 19.0, N = 193), suggesting that the mean Site 1276 inclination is veryrobust. For Site 1277 samples, we have calculated the grand mean withthree different methods (Table T3). The means computed differ littleamong these methods, but we prefer to use the mean inclination of38.5° (α95 = 17.6°, k = 13.8, N = 7) averaged by mean inclination of thedrill cores, as the associated uncertainties may be more representativeof the true values. Using the mean inclinations for Sites 1276 and 1277(italic data in Table T3), we have calculated paleolatitudes for the New-foundland drill sites. The Site 1276 rocks imply a paleolatitude of 30.3°with 95% confidence limits (α95) of approximately ±5.6°, whereas Site1277 rocks yield a paleolatitude of 22.9° with α95 of ±12.0° (Table T3).
DISCUSSION
The generally good magnetic stability and other properties exhibitedby the diabase sills of Site 1276 support the inference that the character-istic directions of magnetization isolated from these rocks were ac-quired during the CNS. This interpretation is compatible withradiometric age dates. The stable inclinations identified from thesesamples are therefore useful for plate tectonic studies.
At Site 1277, the rock magnetic results of serpentinized peridotitesgive important information about the origin of remanence and themagnetic minerals present in the cores. Dark-colored peridotites withTi-poor titanomagnetite exhibit a strong Verwey transition in the vicin-ity of 110 K with hysteresis ratios suggesting that the bulk magnetic
T3. Mean inclinations and paleo-latitudes, p. 35.

X. ZHAO ET AL.PALEOLATITUDE INFERRED FROM CRETACEOUS CORES 12
grain size is in the PSD range. Therefore, the dark-colored peridotites aremost likely good paleomagnetic recorders and probably have preservedoriginal and stable magnetic remanences. Similar inclination values ob-served in basalt, sedimentary interbeds, and peridotites (excepting dif-ferent inclinations from breccias) are necessary but not sufficient proofthat the stable magnetization recorded by these rocks is original. How-ever, the mean inclinations of these samples are close to the theoreti-cally predicted values for the paleolatitude of the drilling sites,indicating that they may represent primary magnetization. Availableage data constrain the magnetization (and hence, paleolatitude) to havebeen acquired in the Cretaceous.
The Cretaceous apparent polar wander path for North America iswell determined, and its reference paleopoles can be used to predictpaleomagnetic directions for a given age at a given site (Van der Voo,1993). In order to compare our paleomagnetic inclination data withother North American data, it is necessary to transform the results intopole space. Because our data are azimuthally unoriented, we cannot de-fine a paleomagneic pole for Leg 210 drill sites. However, the pole mustlie on a small circle centered on the site and with a radius of the paleo-magnetic paleocolatitude. As shown in Figure F9, the paleocolatitudesof the two Leg 210 sites are comparable with those inferred from themid-Cretaceous reference poles for North America (also see Table T4),which is consistent with the Leg 210 sites having resided on the NorthAmerican plate since the Cretaceous.
Taken together, the paleomagnetic results from Sites 1276 and 1277give a clear indication of the change of paleolatitude of the Newfound-land Basin since the mid-Cretaceous. The 30.3° ± 5.1° paleolatitude esti-mated from the Cretaceous sediments and sills implies that Site 1276has drifted northward 15.1° since ~130 m.y. ago. For Site 1277, al-though the match of the basalt paleolatitude and the serpenitinized pe-ridotites paleolatitude might be fortuitous, the combined paleolatitudeof basalt and peridotite suggests that Site 1277 has undergone a 22.3°northward displacement since ~126 Ma. The averaged paleolatitude forLeg 210 sites indicates that the Newfoundland Basin has drifted some1800 km since the mid-Cretaceous. Assuming a constant rate of mo-tion, the paleolatitude data would suggest a rate of 12.1 mm/yr for theinterval from ~130 Ma (Site 1276 age) to present and 19.6 mm/yr forthe interval from 126 Ma (Site 1277 age) to recent.
The origin and nature of the Newfoundland transitional crust arestill intensively debated. Three tectonic hypotheses have been ad-vanced to explain the crustal structure and rift history of the New-foundland and Iberia transition zones (see Tucholke, Sibuet, Klaus, etal., 2004), including (1) the transition zone is composed of largely ofvery slow spreading oceanic crust, (2) the transition zone was formedby extreme extension and mantle exhumation in an amagmatic rift,and (3) the transition zone is strongly thinned continental crust. Al-though our data do not allow us to discriminate among these hypothe-ses, the paleomagnetic data do provide constraints for the possiblerotation history of the fault block on which Site 1277 was drilled. Weperformed a simple exercise to find out how much rotation is needed tochange the expected Cretaceous inclination to the observed inclina-tion. Small-circle paths of the presumed starting Cretaceous inclinationabout a specified rotation axis were calculated to find when the inclina-tions could coincide. The results suggest that the variably foliated ser-pentinized peridotites in the bottom ~38 m (Unit 2) of Hole 1277Acould be rotated counterclockwise (with respect to today’s north) up to
Site 1277
Site 1276
180°E
220°E
60°E
0°E
50°N
70°N
F9. Paleocolatitudes for Sites 1276 and 1277, p. 26.
T4. Paleolatitudes obtained from this study, p. 36.
X. ZHAO ET AL.PALEOLATITUDE INFERRED FROM CRETACEOUS CORES 13
~35° parallel to the rift axis (010°) without exceeding the bounds of theobserved inclination. Thus, it seems clear that significant rotations areacceptable for at least some of the data from Site 1277. Given that Sites1276 and 1277 are presently separated by 0.20° latitude, tectonic rota-tion at Site 1277 may best explain the large (7.4°) latitude separation be-tween the sites suggested by the paleomagnetic results. We speculatethat the counterclockwise rotations may be associated with the intra-plate tensional tectonics prior to the onset of seafloor spreading as pro-posed in Tucholke et al. (in press).
As mentioned in the “Introduction,” p. 2, the mid-Cretaceous wascharacterized by widespread rifting, continental breakup, and globalmagmatism. LIP emplacement peaked near mid-Cretaceous time, al-though there has been no satisfactory explanation as to why this peakoccurred. Trachytes from the Newfoundland Seamounts give ages of97.7 ± 1.5 Ma (Sullivan and Keen, 1977). Thus, it would seem that theages of emplacement of the two sills at Site 1276 are possibly related tothe emplacement of the Newfoundland Seamounts (Karner and Shil-lington, 2005), and the paleolatitude data from this study are consis-tent with the possibility that Site 1276 may have passed over theNewfoundland Seamounts hotspot in the mid-Cretaceous. Recentgeochemical studies also show that Site 1276 sills are not derived fromtypical mid-ocean-ridge basalt (asthenoshpheric) upper mantle but arebroadly similar to oceanic hotspot basalts (Hart and Blusztajn, in press).Whether the basalt at Site 1277 is also coeval with the Newfoundlandhotspot activity is not certain at this time, although the basalt stable in-clinations and normal polarities are suggestive that this is so. Radiomet-ric dating of the basalts and future drilling in the Newfoundland Basinare needed to answer such questions.
CONCLUSION
The Cretaceous sedimentary and igneous rocks recovered from Sites1276 and 1277 preserve a magnetic memory of the mid-Cretaceous geo-magnetic field and provide paleolatitudinal constraints for paleogeo-graphic reconstructions. The combined paleolatitude results from Leg210 sites provide evidence that the Newfoundland Basin was positionedsome 1800 km south of its current position in the mid-Cretaceous andthen migrated northward to its position today. The paleolatitude dataand radiometric dates for the sills at Site 1276 are consistent with thenotion that the sills not only reflect significant postrift magmatism butalso may have been coeval with Newfoundland Seamount hotspot ac-tivity. The overall magnetic inclination of rocks in Hole 1277A between143 and 180 mbsf allows for significant (~35° counterclockwise) rota-tion of basement parallel to the rift axis. The paleomagnetic rotationalestimates are consistent with the recent proposal that intraplate exten-sion may have occurred during opening of the Newfoundland–Iberiarift (Tucholke et al., in press).
ACKNOWLEDGMENTS
This research benefited from useful suggestions and encouragementprovided by Leg 210 Co-Chief scientists Brian Tucholke and Jean-Claude Sibuet and Staff Scientist Adam Klaus, as well as the collabora-tive research efforts of the shipboard scientists who sailed on the Leg

X. ZHAO ET AL.PALEOLATITUDE INFERRED FROM CRETACEOUS CORES 14
210 cruise. We thank Will Sager, Gary Acton, and Brian Tucholke fortheir helpful reviews and insightful comments that significantly im-proved this manuscript. We also thank the ODP marine technicians,the crew of the JOIDES Resolution, and the Catermar staff for their helpand company during ODP Leg 210. X. Zhao extends special thanks tothe paleomagnetism group of the Institute for Rock Magnetism at theUniversity of Minnesota for their support and insightful discussions,and to Zhong Zheng, Peter Riisager, and Maodu Yan for assisting withseveral figures. This paper is based on research that used samples anddata provided by the Ocean Drilling Program (ODP), which is spon-sored by the U.S. National Science Foundation (NSF) and participatingcountries under management of Joint Oceanographic Institutions (JOI),Inc. Financial support for various parts of this research was provided bygrants from the U.S. Science Support Program of Joint OceanographicInstitutions, Inc., and NSF grants OCE 032743 and EAR 0310309 to X.Zhao. Funding was also provided by the Center for the Study of Imag-ing and Dynamics of the Earth, Institute of Geophysics and PlanetaryPhysics at the University of California Santa Cruz, from which this iscontribution number 489.

X. ZHAO ET AL.PALEOLATITUDE INFERRED FROM CRETACEOUS CORES 15
REFERENCES
Acton, G.D., Galbrun, B., and King, J.W., 2000. Paleolatitude of the Caribbean platesince the Late Cretaceous. In Leckie, R.M., Sigurdsson, H., Acton, G.D., and Draper,G. (Eds.), Proc. ODP, Sci. Results, 165: College Station, TX (Ocean Drilling Program),149–173. doi:10.2973/odp.proc.sr.165.001.2000
Ade-Hall, J.M., and Johnson, H.P., 1976. Paleomagnetism of basalts, Leg 34. In Yeats,R.S., Hart, S.R., et al., Init. Repts. DSDP, 34: Washington (U.S. Govt. Printing Office),513–532. doi:10.2973/dsdp.proc.34.143.1976
Besse, J., and Courtillot, V., 2002. Apparent and true polar wander and the geometryof the geomagnetic field over the last 200 Myr. J. Geophys. Res. [Solid Earth Planets],107:11. doi:10.1029/2000JB000050
Brinkman, D.B., and Tarduno, J.A., 2005. A Late Cretaceous (Turonian–Coniacian)high-latitude turtle assemblage from the Canadian Arctic. Can. J. Earth Sci.,42(12):2073–2080. doi:10.1139/e05-074
Coffin, M.F., Frey, F.A., Wallace, P.J., et al., 2000. Proc. ODP, Init. Repts., 183: CollegeStation, TX (Ocean Drilling Program). doi:10.2973/odp.proc.ir.183.2000
Cox, A., and Gordon, R.G., 1984. Paleolatitudes determined from paleomagnetic datafrom vertical cores. Rev. Geophys. Space Phys., 22:47–72.
Day, R., Fuller, M., and Schmidt, V.A., 1977. Hysteresis properties of titanomagnetites:grain-size and compositional dependence. Phys. Earth Planet. Inter., 13(4):260–267.doi:10.1016/0031-9201(77)90108-X
Dunlop, D.J., 2002. Theory and application of the Day plot (Mrs/Ms versus Hcr/Hc), 1.Theoretical curves and tests using titanomagnetite data. J. Geophys. Res.,107(B3):2056. doi:10.1029/2001JB000486
Eldholm, O., and Coffin, M.F., 2000. Large igneous provinces and plate tectonics. InRichards, M.A., Gordon, R.G., and van der Hilst, R.D. (Eds.), The History andDynamics of Global Plate Motions. Geophys. Monogr., 121:309–326.
Fisher, R.A., 1953. Dispersion on a sphere. Proc. R. Soc. London, Ser. A, 217:295–305.Gee, J., Staudigel, H., and Tauxe, L., 1989. Contribution of induced magnetization to
magnetization of seamounts. Nature (London, U. K.), 342(6246):170–173.doi:10.1038/342170a0
Gradstein, F.M., Ogg, J.G., and Smith, A. (Eds.), 2004. A Geologic Time Scale 2004:Cambridge (Cambridge Univ. Press).
Hart, S.R., and Blusztajn, J., in press. Age and geochemistry of the mafic sills, ODPSite 1276, Newfoundland margin. Geochem. Geol.
Karner, G.D., and Shillington, D.J., 2005. Basalt sills of the U reflector, NewfoundlandBasin: a serendipitous dating technique. Geology, 33(12):985–988. doi:10.1130/G21971.1
Kerr, A.C., Tarney, J., Marriner, G.F., Nivia, A., and Saunders, A.D., 1997. The Carib-bean-Colombian Cretaceous igneous province: the internal anatomy of an oceanicplateau. In Mahoney, J.J., and Coffin, M.F. (Eds.), Large Igneous Provinces: Continen-tal, Oceanic, and Planetary Flood Volcanism. Geophys. Monogr., 100:123–144.
Kirschvink, J.L., 1980. The least-squares line and plane and the analysis of palaeo-magnetic data. Geophys. J. R. Astron. Soc., 62(3):699–718.
Larson, R.L., 1991. Latest pulse of Earth: evidence for a mid-Cretaceous superplume.Geology, 19(6):547–550. doi:10.1130/0091-7613(1991)019<0547:LPOEEF>2.3.CO;2
Larson, R.L., and Kincaid, C., 1996. Onset of mid-Cretaceous volcanism by elevationof the 670 km thermal boundary layer. Geology, 24(6):551–554. doi:10.1130/0091-7613(1996)024<0551:OOMCVB>2.3.CO;2
Mahoney, J.J., and Coffin M.F. (Eds.), 1997. Large Igneous Provinces: Continental,Oceanic, and Planetary Flood Volcanism. Geophys. Monogr., 100.
McElhinny, M.W., and McFadden, P.L., 1999. Paleomagnetism: Continents and Oceans:San Diego (Academic Press).
X. ZHAO ET AL.PALEOLATITUDE INFERRED FROM CRETACEOUS CORES 16
McFadden, P.L., and Reid, A.B., 1982. Analysis of paleomagnetic inclination data.Geophys. J. R. Astron. Soc., 69:307–319.
Neal, C.R., Mahoney, J.J., Kroenke, L.W., Duncan, R.A., and Petterson, M.G., 1997.The Ontong Java Plateau. In Mahoney, J.J., and Coffin, M.J. (Eds.), Large IgneousProvinces: Continental, Oceanic, and Planetary Flood Volcanism. Geophys. Monogr.,100:183–216.
Sager, W.W., 2006. Cretaceous paleomagnetic apparent polar wander path for thePacific plate calculated from Deep Sea Drilling Project and Ocean Drilling Programbasalt cores. In Sager, W.W., Acton, G.D., Clement, B.M., and Fuller, M. (Eds.), ODPContributions to Paleomagnetism. Phys. Earth Planet. Int., 156(3–4):329–349.doi:10.1016/j.pepi.2005.09.014
Shillington, D.J., Holbrook, W.S., Tucholke, B.E., Hopper, J.R., Louden, K.E., Larsen,H.C., Van Avendonk, H.J.A., Deemer, S., and Hall, J., 2004. Data report: marinegeophysical data on the Newfoundland nonvolcanic rifted margin aroundSCREECH transect 2. In Tucholke, B.E., Sibuet, J.-C., Klaus, A., et al., Proc. ODP, Init.Repts., 210: College Station, TX (Ocean Drilling Program), 1–36. doi:10.2973/odp.proc.ir.210.105.2004
Shipboard Scientific Party, 2004a. Leg 210 summary. In Tucholke, B.E., Sibuet, J.-C.,Klaus, A., et al., Proc. ODP, Init. Repts., 210: College Station, TX (Ocean Drilling Pro-gram), 1–78. doi:10.2973/odp.proc.ir.210.101.2004
Shipboard Scientific Party, 2004b. Site 1276. In Tucholke, B.E., Sibuet, J.-C., Klaus, A.,et al., Proc. ODP, Init. Repts., 210: College Station, TX (Ocean Drilling Program), 1–358. doi:10.2973/odp.proc.ir.210.103.2004
Shipboard Scientific Party, 2004c. Site 1277. In Tucholke, B.E., Sibuet, J.-C., Klaus, A.,et al., Proc. ODP, Init. Repts., 210: College Station, TX (Ocean Drilling Program), 1–39. doi:10.2973/odp.proc.ir.210.104.2004
Storey, M., Mahoney, J.J., and Saunders, A.D., 1997. Cretaceous basalts in Madagascarand the transition between plumes and continental lithosphere mantle sources. InMahoney, J.J., and Coffin, M.F. (Eds.), Large Igneous Provinces: Continental, Oceanicand Planetary Flood Volcanism. Geophys. Monogr., 100:96–122.
Sullivan, K.D., and Keen, C.E., 1977. Newfoundland Seamounts—petrology andgeochemistry. In Baragar, W.R.A., Coleman, L.C., and Hall, J.M. (Eds), VolcanicRegimes of Canada. Geol. Assoc. Can. Spec. Pap., 16:461–476.
Tarduno, J.A., and Cottrell, R.D., 1997. Paleomagnetic evidence for motion of theHawaiian hotspot during formation of the Emperor Seamounts. Earth Planet. Sci.Lett., 153(3–4):171–180. doi:10.1016/S0012-821X(97)00169-6
Tucholke, B.E., Sawyer, D.S., and Sibuet, J.-C., in press. Breakup of the Newfound-land-Iberia rift. In Karner, G., Manatschal, G., and Pinheiro, L. (Eds.), Imaging, Map-ping and Modelling Continental Lithosphere Extension and Breakup. Geol. Soc. Spec.Publ.
Tucholke, B.E., and Sibuet, J., 2003. ODP Leg 210 drills the Newfoundland margin inthe Newfoundland-Iberia non-volcanic rift. Eos, Trans. Am. Geophys. Union,84(46)(Suppl.):T11E-05. (Abstract)
Tucholke, B.E., Sibuet, J.-C., Klaus, A., et al., 2004. Proc. ODP, Init. Repts., 210: CollegeStation, TX (Ocean Drilling Program). doi:10.2973/odp.proc.ir.210.2004
Van Avendonk, H.J.A., Holbrook, W.S., Nunes, G.T., Shillington, D.J., Tucholke, B.E.,Louden, K.E., Larsen, H.C., and Hopper, J.R., 2006. Seismic velocity structure of therifted margin of the eastern Grand Banks of Newfoundland, Canada. J. Geophys.Res., 111(B11):B11404. doi:10.1029/2005JB004156
Van der Voo, R., 1993. Paleomagnetism of the Atlantic, Tethys and Iapetus Oceans: Cam-bridge (Cambridge Univ. Press).
Verwey, E.J., Haayman, P.W., and Romeijn, F.C., 1947. Physical properties and cationarrangements of oxides with spinal structures, II. Electronic conductivity. J. Chem.Phys., 15(4):181–187. doi:10.1063/1.1746466

X. ZHAO ET AL.PALEOLATITUDE INFERRED FROM CRETACEOUS CORES 17
Vogt, P.R., 1975. Changes in geomagnetic reversal frequency at times of tectonicchange: evidence for coupling between core and upper mantle processes. EarthPlanet. Sci. Lett., 25(3):313–321. doi:10.1016/0012-821X(75)90247-2
Whitmarsh, R.B., Sawyer, D.S., Klaus, A., and Masson, D.G. (Eds.), 1996. Proc. ODP,Sci. Results, 149: College Station, TX (Ocean Drilling Program). doi:10.2973/odp.proc.sr.149.1996
Zhao, X., 2001. Paleomagnetic and rock magnetic results from serpentinized perido-tites beneath the Iberia Abyssal Plain. In Wilson, R.C.L., Whitmarsh, R.B., Taylor,B., and Froitzheim, N. (Eds.), Non-volcanic Rifting of Continental Margins: A Compari-son of Evidence From Land and Sea. Geol. Soc. Spec. Publ., 187:209–234.
Zhao, X., Roperch, P., and Stokking, L.B., 1994. Magnetostratigraphy of the NorthAoba Basin. In Greene, H.G., Collot, J.-Y., Stokking, L.B., et al., Proc. ODP, Sci.Results, 134: College Station, TX (Ocean Drilling Program), 457–474. doi:10.2973/odp.proc.sr.134.025.1994
Zijderveld, J.D.A., 1967. AC demagnetization of rocks: analysis of results. In Collin-son, D.W., Creer, K.M., and Runcorn, S.K. (Eds.), Methods in Palaeomagnetism: NewYork (Elsevier), 254–286.

X. ZHAO ET AL.PALEOLATITUDE INFERRED FROM CRETACEOUS CORES 18
Figure F1. Bathymetric map of the North Atlantic Ocean showing locations of Sites 1276 and 1277 in theNewfoundland Basin and Deep Sea Drilling Project and ODP drill sites on the western and southern mar-gins of Galicia Bank on the conjugate Iberia margin (Legs 47B, 103, 149, and 173). Modified from Tucholke,Sibuet, Klaus, et al. (2004).
North America
Iberia
Leg 210 Legs 47,103, 149,
173Site1276
Site1277
60°N
50°
40°
30°80°W 70° 60°
6000 5000 4500 4000 3500 3000 2500 2000 1500 1000 500 0
50° 40° 30° 20° 10° 0°
Depth (m)
New England Seamounts

X. ZHAO ET AL.PALEOLATITUDE INFERRED FROM CRETACEOUS CORES 19
Figure F2. Representative vector endpoint diagrams (Zijderveld, 1967) showing the results of AF demagne-tization for split-core samples from just above the sill of Subunit 5C1. A. Sample 210-1276A-87R-6, 62 cm,from marble. B. Sample 210-1276A-87R-6, 72 cm, from sediments contacting the chilled margin of the up-per diabase sill. The baked sedimentary rock has the same ChRM inclination in both samples. Open squares= vector endpoints projected onto the vertical plane, solid squares = vector endpoints projected onto thehorizontal plane. NRM = natural remanent magnetization.
Sample 210-1276A-87R-6, 62 cm Sample 210-1276A-87R-6, 72 cm
W Up W Up
E Down E Down
S N S N60 mT
60 mT
20 mT20 mT
NRM
NRM
A B

X. ZHAO ET AL.PALEOLATITUDE INFERRED FROM CRETACEOUS CORES 20
Figure F3. Representative vector endpoint diagrams (Zijderveld, 1967) showing the results of AF demagne-tization for diabase sills. A. Sample 210-1276A-88R-4, 60 cm, from the upper sill. B. Sample 210-1276A-99R-1, 125 cm, from the lower sill. Open squares = vector endpoints projected onto the vertical plane, solidsquares = vector endpoints projected onto the horizontal plane. NRM = natural remanent magnetization.
Sample 210-1276A-88R-4, 60 cm Sample 210-1276A-99R-1, 125 cm
W Up W Up
E Down E Down
S NS N
20 mT
20 mT
40 mT
60 mT
10 mT
5 mT
NRM
NRM
A B

X. ZHAO ET AL.PALEOLATITUDE INFERRED FROM CRETACEOUS CORES 21
Figure F4. Examples of vector endpoint diagrams for samples from different lithologic units during AF andthermal demagnetization, demonstrating the removal of a normal component of magnetization eithercaused by drilling or a present geomagnetic field overprint, as well as the isolation of a more stable compo-nent that is univectorially decaying toward the origin of the vector plots. A. Sample 210-1276A-29R-1, 127–129 cm, from Unit 4. B. Black shale Sample 210-1276A-36R-5, 125–127 cm, from Subunit 5B. C. Sample210-1276A-79R-2, 57–59 cm, from Subunit 5C. Open squares = vector endpoints projected onto the verticalplane, solid squares = vector endpoints projected onto the horizontal plane. NRM = natural remanent mag-netization.
Sample 210-1276A-29R-1, 127-129 cm Sample 210-1276A-36R-5, 125-127 cm
W Up W Up
E Down
W Up
E Down
E Down
S N
S N 200 mT
30 mT
10 mT
NRM
T450°
T200° T100°
T450°
T200°
T100°
NRM
NRM
A
Sample 210-1276A-79R-2, 57-59 cm C
B
S N

X. ZHAO ET AL.PALEOLATITUDE INFERRED FROM CRETACEOUS CORES 22
Figure F5. Downhole variation in characteristic remanent magnetization (ChRM) inclinations for rocksand sediments from Site 1276. Open squares = inclinations of the minicore samples, crosses = inclinationsof the split-core samples. Lithologic units and expected Cretaceous inclination for the site are also shown.
1000
1100
1500
1400
1300
1200
1600
1700
1800 -90 -45 0 45 90
Inclination (°)
Dep
th (
mbs
f)
Lith. unit
Expected inclination
3
4
5A
5B
5C
ChRM inclinations for rocks at Site 1276
X. ZHAO ET AL.PALEOLATITUDE INFERRED FROM CRETACEOUS CORES 23
Figure F6. Downhole variation in characteristic remanent magnetization (ChRM) inclinations for rocksfrom Site 1277. Open squares = inclinations of the minicore samples, crosses = inclinations of the split-coresamples. Lithologic units and expected Cretaceous inclination for the site are also shown.
Expected inclination
Dep
th (
mbs
f)
-90 -45 0 45 90
Inclination (°)
0
50
150
100
200
Lith. unit
1
2
ChRM inclinations for rocks at Site 1277

X. ZHAO ET AL.PALEOLATITUDE INFERRED FROM CRETACEOUS CORES 24
Figure F7. Temperature dependence of magnetization curves for representative (A) brown dunite and(C) dark-colored serpentinized peridotite. Low-temperature thermal demagnetization of saturation isother-mal remanent magnetization (SIRM) acquired at 10 K (red circles) and cooling curve of SIRM acquired at300 K (blue circles) for (B) brown dunite and (D) serpentinized peridotite. Arrows show the heating andcooling directions.
Sample 210-1277A-9R-2, 51-53 cm Sample 210-1277A-9R-4, 19-21 cm
Sample 210-1277A-9R-2, 51-53 cm Sample 210-1277A-9R-6, 35-37 cm
Brown dunite(maghemite)
Dark peridotite(magnetite)
0.14
0.12
0.10
0.08
0.06
0.04
0.02
0.005
0.010
0.015
0.020
00 0 100 200 300 0 100 200 300
0 100 200 300 400 500 60000
1
0
1
100 200 300 400 500 600
Nor
mal
ized
Js
Nor
mal
ized
Js
A C
B D
~170.0 mbsf 178.0 mbsf
Temperature (°C) Temperature (°C)
SIR
M

X. ZHAO ET AL.PALEOLATITUDE INFERRED FROM CRETACEOUS CORES 25
Figure F8. Hysteresis ratios plotted on a Day-type diagram (Day et al., 1977; Dunlop, 2002) for igneous sam-ples from Site 1277. The darker and light ellipsoids mark serpentinized peridotite and overlying basalt sam-ples, respectively. Js = saturation magnetization, Jr = saturation remanent magnetization, Hc = coercivity, Hcr
= remanent coercive force. The plot is usually divided into regions: SD = single domain (for Js/Jr > 0.5 andHcr/Hc < 1.5), MD = multidomain (for Js/Jr < 0.05 and Hcr/Hc > 4), PSD = pseudosingle domain (in betweenSD and MD, SP = super paramagnetic.
SD Basalt
Serpentinized peridotite
SP + SD
MD
PSD or SD + MD
1
0.01
0.1
1
10
Hcr/Hc
J rs/
J s

X. ZHAO ET AL.PALEOLATITUDE INFERRED FROM CRETACEOUS CORES 26
Figure F9. Leg 210 drill Sites 1276 and 1277 (star) and their corresponding paleocolatitudes (small circles),with 95% confidence interval (dark and light gray areas, respectively). Also shown are the Cretaceous paleo-magnetic poles of North America and their 95% confidence intervals (data from Table T4, p. 36).
Site 1277
Site 1276
180°E
220°E
60°E
0°E
50°N
70°N
X. ZHAO ET AL.PALEOLATITUDE INFERRED FROM CRETACEOUS CORES 27
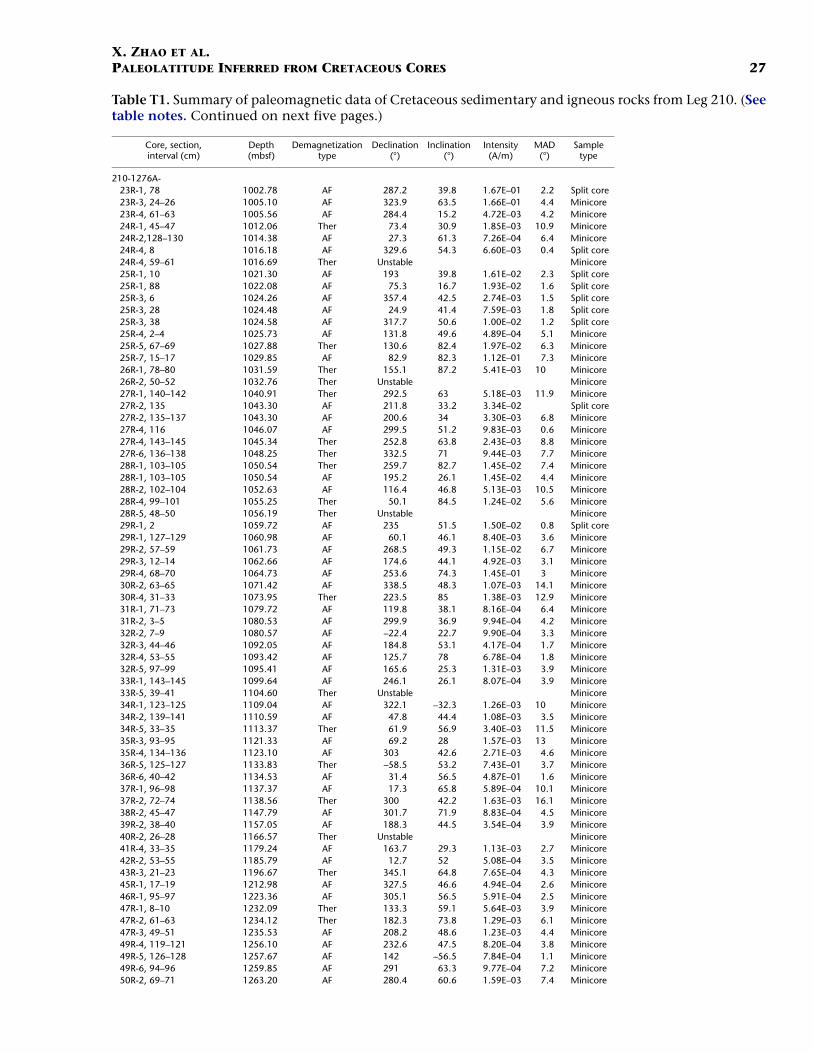
Table T1. Summary of paleomagnetic data of Cretaceous sedimentary and igneous rocks from Leg 210. (Seetable notes. Continued on next five pages.)
Core, section, interval (cm)
Depth (mbsf)
Demagnetization type
Declination (°)
Inclination (°)
Intensity (A/m)
MAD (°)
Sample type
210-1276A-23R-1, 78 1002.78 AF 287.2 39.8 1.67E–01 2.2 Split core23R-3, 24–26 1005.10 AF 323.9 63.5 1.66E–01 4.4 Minicore23R-4, 61–63 1005.56 AF 284.4 15.2 4.72E–03 4.2 Minicore24R-1, 45–47 1012.06 Ther 73.4 30.9 1.85E–03 10.9 Minicore24R-2,128–130 1014.38 AF 27.3 61.3 7.26E–04 6.4 Minicore24R-4, 8 1016.18 AF 329.6 54.3 6.60E–03 0.4 Split core24R-4, 59–61 1016.69 Ther Unstable Minicore25R-1, 10 1021.30 AF 193 39.8 1.61E–02 2.3 Split core25R-1, 88 1022.08 AF 75.3 16.7 1.93E–02 1.6 Split core25R-3, 6 1024.26 AF 357.4 42.5 2.74E–03 1.5 Split core25R-3, 28 1024.48 AF 24.9 41.4 7.59E–03 1.8 Split core25R-3, 38 1024.58 AF 317.7 50.6 1.00E–02 1.2 Split core25R-4, 2–4 1025.73 AF 131.8 49.6 4.89E–04 5.1 Minicore25R-5, 67–69 1027.88 Ther 130.6 82.4 1.97E–02 6.3 Minicore25R-7, 15–17 1029.85 AF 82.9 82.3 1.12E–01 7.3 Minicore26R-1, 78–80 1031.59 Ther 155.1 87.2 5.41E–03 10 Minicore26R-2, 50–52 1032.76 Ther Unstable Minicore27R-1, 140–142 1040.91 Ther 292.5 63 5.18E–03 11.9 Minicore27R-2, 135 1043.30 AF 211.8 33.2 3.34E–02 Split core27R-2, 135–137 1043.30 AF 200.6 34 3.30E–03 6.8 Minicore27R-4, 116 1046.07 AF 299.5 51.2 9.83E–03 0.6 Minicore27R-4, 143–145 1045.34 Ther 252.8 63.8 2.43E–03 8.8 Minicore27R-6, 136–138 1048.25 Ther 332.5 71 9.44E–03 7.7 Minicore28R-1, 103–105 1050.54 Ther 259.7 82.7 1.45E–02 7.4 Minicore28R-1, 103–105 1050.54 AF 195.2 26.1 1.45E–02 4.4 Minicore28R-2, 102–104 1052.63 AF 116.4 46.8 5.13E–03 10.5 Minicore28R-4, 99–101 1055.25 Ther 50.1 84.5 1.24E–02 5.6 Minicore28R-5, 48–50 1056.19 Ther Unstable Minicore29R-1, 2 1059.72 AF 235 51.5 1.50E–02 0.8 Split core29R-1, 127–129 1060.98 AF 60.1 46.1 8.40E–03 3.6 Minicore29R-2, 57–59 1061.73 AF 268.5 49.3 1.15E–02 6.7 Minicore29R-3, 12–14 1062.66 AF 174.6 44.1 4.92E–03 3.1 Minicore29R-4, 68–70 1064.73 AF 253.6 74.3 1.45E–01 3 Minicore30R-2, 63–65 1071.42 AF 338.5 48.3 1.07E–03 14.1 Minicore30R-4, 31–33 1073.95 Ther 223.5 85 1.38E–03 12.9 Minicore31R-1, 71–73 1079.72 AF 119.8 38.1 8.16E–04 6.4 Minicore31R-2, 3–5 1080.53 AF 299.9 36.9 9.94E–04 4.2 Minicore32R-2, 7–9 1080.57 AF –22.4 22.7 9.90E–04 3.3 Minicore32R-3, 44–46 1092.05 AF 184.8 53.1 4.17E–04 1.7 Minicore32R-4, 53–55 1093.42 AF 125.7 78 6.78E–04 1.8 Minicore32R-5, 97–99 1095.41 AF 165.6 25.3 1.31E–03 3.9 Minicore33R-1, 143–145 1099.64 AF 246.1 26.1 8.07E–04 3.9 Minicore33R-5, 39–41 1104.60 Ther Unstable Minicore34R-1, 123–125 1109.04 AF 322.1 –32.3 1.26E–03 10 Minicore34R-2, 139–141 1110.59 AF 47.8 44.4 1.08E–03 3.5 Minicore34R-5, 33–35 1113.37 Ther 61.9 56.9 3.40E–03 11.5 Minicore35R-3, 93–95 1121.33 AF 69.2 28 1.57E–03 13 Minicore35R-4, 134–136 1123.10 AF 303 42.6 2.71E–03 4.6 Minicore36R-5, 125–127 1133.83 Ther –58.5 53.2 7.43E–01 3.7 Minicore36R-6, 40–42 1134.53 AF 31.4 56.5 4.87E–01 1.6 Minicore37R-1, 96–98 1137.37 AF 17.3 65.8 5.89E–04 10.1 Minicore37R-2, 72–74 1138.56 Ther 300 42.2 1.63E–03 16.1 Minicore38R-2, 45–47 1147.79 AF 301.7 71.9 8.83E–04 4.5 Minicore39R-2, 38–40 1157.05 AF 188.3 44.5 3.54E–04 3.9 Minicore40R-2, 26–28 1166.57 Ther Unstable Minicore41R-4, 33–35 1179.24 AF 163.7 29.3 1.13E–03 2.7 Minicore42R-2, 53–55 1185.79 AF 12.7 52 5.08E–04 3.5 Minicore43R-3, 21–23 1196.67 Ther 345.1 64.8 7.65E–04 4.3 Minicore45R-1, 17–19 1212.98 AF 327.5 46.6 4.94E–04 2.6 Minicore46R-1, 95–97 1223.36 AF 305.1 56.5 5.91E–04 2.5 Minicore47R-1, 8–10 1232.09 Ther 133.3 59.1 5.64E–03 3.9 Minicore47R-2, 61–63 1234.12 Ther 182.3 73.8 1.29E–03 6.1 Minicore47R-3, 49–51 1235.53 AF 208.2 48.6 1.23E–03 4.4 Minicore49R-4, 119–121 1256.10 AF 232.6 47.5 8.20E–04 3.8 Minicore49R-5, 126–128 1257.67 AF 142 –56.5 7.84E–04 1.1 Minicore49R-6, 94–96 1259.85 AF 291 63.3 9.77E–04 7.2 Minicore50R-2, 69–71 1263.20 AF 280.4 60.6 1.59E–03 7.4 Minicore

X. ZHAO ET AL.PALEOLATITUDE INFERRED FROM CRETACEOUS CORES 28
50R-4, 5–7 1265.56 AF 17 51.7 2.96E–03 6 Minicore53R-3, 109–111 1294.10 AF 253.3 74.3 6.45E–04 3.9 Minicore54R-3, 137–139 1303.98 AF 163.1 68.6 1.90E–03 3.3 Minicore55R-2, 80–82 1311.51 Ther Unstable Minicore56R-1, 89–91 1319.70 AF 111.8 77.6 3.01E–03 6.4 Minicore56R-3, 34–36 1322.14 AF 59.7 57.3 3.41E–03 3.5 Minicore57R-1, 86–88 1329.37 AF 61.3 51.7 1.04E–03 5.7 Minicore59R-2, 147–149 1347.08 AF 287.5 43.5 2.09E–03 5 Minicore59R-5, 35–37 1350.46 Ther Unstable Minicore59R-7, 51–53 1353.12 AF 331.6 46.5 1.20E–03 2.7 Minicore64R-1, 21–23 1392.41 AF 108.3 –37.3 9.52E–03 13.7 Minicore64R-4, 139–141 1397.10 Ther 296 60.8 2.94E–03 10.7 Minicore65R-1, 12–14 1401.93 AF 145 54.6 1.25E–03 12.6 Minicore65R-6, 100–102 1410.31 AF 124.8 37 8.78E–04 11.6 Minicore66R-2, 76–78 1413.57 AF 12.2 51 9.93E–04 8.4 Minicore67R-5, 101–103 1427.92 AF 44.5 –70.3 9.41E–04 8.3 Minicore67R-7, 37–39 1429.78 AF 245.3 46.8 1.67E–03 3.3 Minicore68R-4, 104–106 1436.04 Ther 207.1 53.1 2.66E–03 5.7 Minicore69R-5, 16–18 1445.96 AF 167.6 47.3 1.18E–03 5.3 Minicore72R-2, 54–56 1470.95 AF 242.9 –47.6 1.79E–03 5.6 Minicore73R-6, 56–58 1486.57 AF 209.1 22.8 3.53E–03 1.7 Minicore74R-4, 133–135 1493.94 AF 23.6 34.5 2.57E–03 2.2 Minicore76R-2, 49–51 1509.30 Ther 343 28.9 6.15E–03 6.5 Minicore76R-4, 116–118 1512.97 Ther Unstable Minicore76R-7, 36–38 1516.47 Ther Unstable Minicore77R-4, 31–33 1521.72 Ther Unstable Minicore78R-6, 121–123 1535.21 Ther 288.8 64.4 2.67E–03 14.2 Minicore79R-2, 5–7 1537.76 Ther 42.5 31.7 2.77E–03 7.3 Minicore79R-3, 44 1539.64 AF 1.8 43.9 1.34E–03 1.8 Split core79R-3, 86–88 1540.06 Ther 105.6 35.3 6.34E–03 6.1 Minicore79R-5, 70–72 1542.91 AF 101.1 29.1 1.51E–03 6.8 Minicore79R-6, 36–38 1544.07 AF 357.7 29.6 1.47E–03 4.4 Minicore80R-1, 117–119 1546.98 AF 54.8 64.8 8.86E–04 2.7 Minicore80R-3, 102–104 1549.83 AF 189.3 59.6 3.04E–03 6.1 Minicore80R-4, 80 1551.10 AF 356.3 58.8 4.10E–03 0.6 Split core80R-5, 12–14 1551.93 Ther 206.7 42.1 2.10E–03 10.2 Minicore80R-6, 33–35 1553.14 Ther 209.5 60.3 2.08E–03 3.1 Minicore81R-1, 38–40 1557.79 Ther 202.3 13 4.05E–03 4.9 Minicore81R-3, 6–8 1558.47 AF 345.4 61.9 2.62E–03 3.1 Minicore81R-3, 99–101 1559.40 AF 8.5 66.6 3.73E–03 1.3 Minicore81R-5, 66–68 1561.90 Ther 201.8 14.6 3.68E–03 6.1 Minicore83R-3, 57–59 1578.07 Ther 178.6 43.3 2.84E–03 1.2 Minicore84R-1, 23–25 1584.43 Ther –0.7 30.2 7.00E–03 2 Minicore84R-1, 100–102 1585.21 AF 342.8 73 6.39E–03 1.8 Minicore85R-1, 47–49 1588.18 AF 4.7 50.9 2.48E–03 1.7 Minicore86R-5, 94–96 1601.75 AF 238.8 47.2 4.46E–03 1.3 Minicore86R-6, 20–22 1602.01 AF 342.5 –39.1 5.21E–03 2.4 Minicore87R-1, 17–19 1604.68 AF 314.6 57.6 2.02E–03 2.9 Minicore87R-2, 135–137 1606.36 AF 191.6 21.3 2.28E–03 3.3 Minicore87R-5, 138–140 1610.89 AF 162.1 48 4.80E–03 1.8 Minicore87R-6, 0 1612.11 AF 343.3 40.7 2.60E–03 2.2 Split core87R-6, 8 1612.19 AF 299.8 58.9 4.68E–03 3.3 Split core87R-6, 20 1612.31 AF –40 52.8 3.38E–03 1.7 Split core87R-6, 24 1612.35 AF –40.1 54.8 3.40E–03 0.7 Split core87R-6, 30 1612.41 AF –43.1 48.4 3.98E–03 0.6 Split core87R-6, 40 1612.51 AF 317.4 40 4.46E–03 0.7 Split core87R-6, 46 1612.57 AF 163.3 39.3 4.39E–03 0.9 Split core87R-6, 50 1612.61 AF 157.7 20.8 4.95E–03 0.3 Split core87R-6, 60 1612.71 AF 21 45.7 5.53E–03 0.5 Split core87R-6, 62 1612.73 AF 31.9 38.7 6.41E–03 0.4 Split core87R-6, 66 1612.77 AF 47.9 56.2 7.46E–03 0.6 Split core87R-6 (Piece 2A, 69–71) 1612.80 AF 48 56.2 7.46E–03 0.6 Minicore87R-6, 70 1612.81 AF 189.2 50.4 1.05E–02 0.9 Split core87R-6, 72 1612.83 AF 193.2 38.5 1.33E–02 1.1 Split core87R-6, 74 1612.83 AF 195.3 35 1.67E–02 1.8 Split core87R-6 (Piece 4A, 80–82) 1612.91 AF 297 43 5.76E–02 1.9 Minicore87R-6 (Piece 4A, 82) 1612.93 AF 291.2 42.9 9.60E–02 2.4 Split core87R-6 (Piece 4A, 84) 1612.95 AF 247.5 51.4 1.48E–01 13.8 Split core87R-6 (Piece 4A, 86) 1612.97 AF –88.3 52.4 2.01E–01 5.4 Split core
Core, section, interval (cm)
Depth (mbsf)
Demagnetization type
Declination (°)
Inclination (°)
Intensity (A/m)
MAD (°)
Sample type
Table T1 (continued).

X. ZHAO ET AL.PALEOLATITUDE INFERRED FROM CRETACEOUS CORES 29
87R-6 (Piece 4A, 88) 1612.99 AF –83.8 64.6 2.84E–01 5.6 Split core87R-6 (Piece 5A, 90) 1613.01 AF –36.3 72.7 6.42E–01 0.4 Split core87R-6 (Piece 5A, 92) 1613.03 AF –5.6 63.3 1.37E+00 2.2 Split core87R-6 (Piece 5A, 112) 1613.23 AF 50.8 86.8 2.84E+00 1.4 Split core87R-6 (Piece 6A, 132) 1613.43 AF 169.1 74.3 2.80E+00 1.7 Split core87R-7 (Piece 1A, 2) 1613.53 AF 34.4 75.3 2.13E+00 1.2 Split core87R-7 (Piece 1A, 12) 1613.63 AF 194.7 59.7 1.64E+00 0.6 Split core87R-7 (Piece 2A, 18) 1613.69 AF 3.7 57.2 2.37E+00 1.4 Split core88R-1 (Piece 2A, 4) 1614.14 AF 27.7 64.5 2.47E+00 2.5 Split core88R-1 (Piece 2A, 58) 1614.68 AF 125.8 64.8 2.08E+00 3 Split core88R-1, 94–96 1615.05 AF 162.2 77 1.11E–01 1.8 Minicore88R-2 (Piece 1A, 26) 1615.38 AF 108 74.8 3.47E+00 0.9 Split core88R-2 (Piece 1B, 55–57) 1615.66 AF 285.7 76.8 4.84E+00 2.1 Minicore88R-2 (Piece 3A, 80) 1615.92 AF 8.4 73.5 3.68E+00 0.7 Split core88R-2 (Piece 4B, 114) 1616.26 AF 216.4 70.2 3.87E+00 1.5 Split core88R-2 (Piece 5A, 122) 1616.34 AF –24.8 61.2 3.74E+00 1.4 Split core88R-2 (Piece 6A, 140) 1616.52 AF 193.4 68 2.81E+00 2.8 Split core88R-3 (Piece 2A, 22) 1616.78 AF 179.9 71.8 3.63E+00 2 Split core88R-3 (Piece 5A, 42) 1616.98 AF 356.2 68.2 5.41E+00 1.8 Split core88R-3 (Piece 6A, 56) 1617.12 AF 67.5 74.9 3.35E+00 2.1 Split core88R-3 (Piece 7A, 72) 1617.28 AF 37.3 76.8 5.37E+00 1.3 Split core88R-3 (Piece 8A, 92) 1617.48 AF 348.6 74.9 5.51E+00 0.7 Split core88R-3 (Piece 9A, 106) 1617.62 AF 19.6 70.5 5.67E+00 1.7 Split core88R-3 (Piece 10A, 120) 1617.76 AF 288.1 71.2 4.47E+00 2.4 Split core88R-3 (Piece 11A, 134) 1617.90 AF 349.8 72.9 5.58E+00 1.7 Split core88R-3 (Piece 12A, 142) 1617.98 AF 30 86.2 3.43E+00 1.8 Split core88R-4 (Piece 1A, 8) 1618.14 AF –61.6 72.1 4.24E+00 2.2 Split core88R-4 (Piece 2A, 28) 1618.34 AF 59 82.3 3.59E+00 2.2 Split core88R-4 (Piece 8A, 60) 1618.66 AF 19.9 65.4 1.70E+00 0.3 Split core88R-4 (Piece 9A, 80) 1618.86 AF 304.1 70.7 3.78E+00 2 Split core88R-4 (Piece 10A, 100) 1619.06 AF 151 83.2 4.04E+00 2 Split core88R-4 (Piece 11A, 122) 1619.28 AF 319.4 73.2 4.66E+00 2 Split core88R-4 (Piece 12A, 142) 1619.48 AF 201.3 82.1 3.65E+00 2.2 Split core88R-5 (Piece 1A, 8) 1619.61 AF 54.5 79.1 4.39E+00 1.7 Split core88R-5 (Piece 1B, 22) 1619.75 AF 60.9 76.7 5.45E+00 1.8 Split core88R-5 (Piece 2A, 38) 1619.91 AF 312.7 80.2 5.35E+00 2.1 Split core88R-5 (Piece 3A, 60) 1620.13 AF 36 77.4 5.59E+00 2.1 Split core88R-5 (Piece 3B, 90) 1620.43 AF 50.7 81.1 4.53E+00 1.3 Split core88R-6 (Piece 1A, 42) 1621.04 AF 74.9 86.1 3.73E+00 0.9 Split core88R-6 (Piece 1A, 60–62) 1621.23 AF 292.7 78.7 5.20E+00 1.5 Minicore88R-6 (Piece 2A, 78) 1621.40 AF 91.2 82.9 3.34E+00 1.6 Split core88R-6 (Piece 3A, 102) 1621.64 AF 150.6 79.2 3.02E+00 0.6 Split core88R-7 (Piece 1A, 9) 1621.92 AF 211.8 81.8 3.71E+00 0.9 Split core88R-7 (Piece 2A, 48) 1622.31 AF 85.9 80.3 3.79E+00 2 Split core88R-7 (Piece 3A, 84) 1622.67 AF 52.1 73 3.39E+00 1.6 Split core88R-7 (Piece 5A, 111) 1622.94 AF 84.4 75.5 2.34E+00 0.4 Split core88R-8, 20 1623.24 AF 0.7 57.2 1.70E–03 3.3 Split core88R-8, 32 1623.36 AF 13.5 54.5 1.21E–03 3.7 Split core88R-8, 46–48 1623.52 AF 12.3 49.7 2.85E–03 1.7 Minicore88R-8, 50 1623.54 AF 168.5 44.6 2.14E–03 1.3 Split core88R-8, 80 1623.84 AF 254.5 53.7 3.34E–03 2.3 Split core88R-8, 90 1623.94 AF –35.5 54.2 3.30E–03 6.3 Split core89R-1, 12 1623.72 AF 131.9 37.2 2.77E–03 2.6 Split core89R-1, 54 1624.14 AF 28.9 44.5 2.43E–03 2.5 Split core89R-2, 104–106 1625.15 AF 216.8 60.6 5.69E–03 1.4 Minicore89R-2, 119–121 1626.30 AF 128.6 58.8 2.17E–03 3 Minicore89R-5, 132–134 1629.98 AF 86.3 54.3 1.61E–03 5.8 Minicore90R-1, 17–19 1633.48 AF 30.5 42.4 1.91E–03 4 Minicore90R-2, 2 1634.82 AF 23.6 56 1.46E–03 2.1 Split core90R-2, 50 1635.30 AF –33.9 63.5 1.68E–03 3.3 Split core90R-3, 54 1636.81 AF –66.8 62.7 1.82E–03 1.1 Split core90R-3, 128–130 1637.59 AF 52.2 54.5 1.54E–03 4.2 Minicore90R-4, 92–94 1638.73 AF 81 –69.9 2.11E–03 7.2 Minicore90R-5, 124 1640.51 AF –2.5 59.4 2.52E–03 6.3 Split core90R-6, 38 1641.15 AF –77.3 63.8 1.93E–03 2.4 Split core90R-6, 74 1641.51 AF –30.4 63 6.49E–03 4.8 Split core90R-6, 84–86 1641.65 AF 99 75.3 1.60E–03 5.7 Minicore90R-7, 56 1642.23 AF 56.7 51.3 5.35E–03 4 Split core91R-1, 20 1643.00 AF 108.7 42 1.25E–03 1.9 Split core
Core, section, interval (cm)
Depth (mbsf)
Demagnetization type
Declination (°)
Inclination (°)
Intensity (A/m)
MAD (°)
Sample type
Table T1 (continued).

X. ZHAO ET AL.PALEOLATITUDE INFERRED FROM CRETACEOUS CORES 30
91R-1, 68 1643.48 AF 228.2 54.6 5.31E–03 3.7 Split core91R-2, 50–52 1644.81 AF 115.8 70.2 2.09E–03 3.9 Minicore91R-2, 96 1645.26 AF 58 40.3 1.47E–03 2.1 Split core91R-3, 102 1646.82 AF 198.6 48.1 2.41E–03 9.3 Split core91R-3, 123–125 1647.04 AF 351.6 54.8 4.20E–03 2.8 Minicore91R-4, 109–111 1647.40 Ther 54.6 65.5 1.46E–03 5.2 Minicore91R-5, 22 1649.02 AF –42.9 50.3 8.89E–04 3.2 Split core91R-5, 30–32 1649.11 AF 52.1 58.8 1.09E–03 8.5 Minicore91R-5, 60 1649.40 AF 125.6 66 1.44E–03 1.5 Split core92R-1, 118 1653.68 AF 302.5 36 3.82E–03 8.6 Split core92R-3, 142–144 1656.93 AF 38.5 66.5 2.04E–03 6.8 Minicore92R-CC, 49–51 1661.48 AF 265.5 83.1 2.82E–03 9.1 Minicore93R-1, 82 1662.92 AF 91.2 50.2 2.88E–03 4 Split core93R-2, 24 1663.84 AF 10.1 56.7 3.26E–03 2.9 Split core93R-4, 76 1667.36 AF 64.9 61.2 1.07E–02 3 Split core93R-5, 99–101 1669.10 AF 56.3 63.2 2.57E–03 1.6 Minicore94R-1, 20–22 1672.01 AF 320.6 55.7 4.42E–03 2.8 Minicore94R-1, 20 1672.01 AF 132.1 58.6 3.55E–03 0.7 Split core94R-1, 78 1672.58 AF 128.1 65.6 2.98E–03 3.9 Split core94R-3, 92 1675.57 AF 27.5 55.1 4.53E–03 3.9 Split core94R-5, 30 1677.89 AF 0.4 60.7 1.62E–02 2 Split core94R-5, 76 1678.35 AF 237.3 60.5 4.30E–03 1.9 Split core94R-5, 106 1678.65 AF 225.4 61.5 3.75E–03 1.4 Split core94R-6, 67–69 1679.78 AF 250 66.7 3.22E–03 3 Minicore95R-1, 26 1681.66 AF 3.8 49.4 9.57E–03 9.5 Split core95R-2, 54 1683.10 AF 176.7 57 1.46E–03 0.5 Split core95R-3, 5–7 1684.12 AF 306.1 49.6 1.66E–03 5.8 Minicore95R-3, 74 1684.80 AF 146 50.6 4.97E–03 1.6 Split core95R-3, 108 1685.14 AF 240.7 57.9 1.77E–03 4 Split core95R-3, 150 1685.56 AF 288.6 28 3.09E–04 3.4 Split core95R-5, 24 1687.20 AF 8.2 60.9 7.94E–04 1.8 Split core95R-5, 34 1687.30 AF 18.3 58.1 8.02E–04 2.5 Split core95R-5, 130 1688.26 AF 102.1 54.5 1.02E–03 1.3 Split core96R-1, 18 1691.08 AF 135.5 71.8 3.56E–03 0.5 Split core96R-1, 55–57 1691.46 AF 96.2 62.1 3.94E–03 7.9 Minicore96R-1, 80 1691.70 AF –17.6 69.3 3.18E–03 1.6 Split core96R-2, 78–80 1693.12 AF 187.6 –61.6 4.07E–03 2.7 Minicore96R-3, 136–138 1695.20 AF 179.4 59.8 4.42E–03 2.7 Minicore97R-1, 24 1700.74 AF 133.2 59.8 3.72E–03 2.6 Split core97R-1, 94–96 1701.45 AF 119.2 45.6 5.13E–04 5.5 Minicore97R-2, 86–88 1702.86 AF 85.9 59.2 4.24E–04 0.5 Minicore98R-1, 38 1710.48 AF –13.9 66.9 8.64E–04 0.9 Split core98R-1, 100–102 1711.10 AF –5.2 53.7 6.93E–04 2.9 Minicore98R-1, 120–122 1711.31 AF 83 56.1 8.59E–03 9.5 Minicore99R-1 (Piece 4A, 20) 1719.60 AF 221.3 44.1 1.66E–01 0.1 Split core99R-1 (Piece 9A, 44) 1719.84 AF 69.1 43.4 1.12E–01 0.3 Split core99R-1 (Piece 18A, 86) 1720.26 AF 49.3 40.4 1.43E–01 0.7 Split core99R-1 (Piece 18A, 87–89) 1720.28 AF 216.9 52.9 2.97E–01 0.9 Minicore99R-1 (Piece 18A, 90) 1720.31 AF 24.9 56 1.39E–01 0.2 Split core99R-1 (Piece 18A, 94) 1720.34 AF 12.6 74.8 9.47E–02 0.2 Split core99R-1, 99–101 1720.39 AF 53.6 57.2 4.14E–03 0.4 Minicore99R-1 (Piece 19A, 104) 1720.44 AF 68.8 52.5 1.46E–01 0.3 Split core99R-1 (Piece 20A, 117–119) 1720.58 AF 202.8 62.8 2.92E–01 0.4 Minicore99R-1 (Piece 21A, 126) 1720.66 AF 14.7 55.8 2.14E–01 0.2 Split core99R-2 (Piece 1A, 6) 1720.89 AF 153.6 52.2 1.41E–01 0.3 Split core99R-2 (Piece 3A, 22) 1721.05 AF 192.7 40.4 1.15E–01 0.3 Split core99R-2 (Piece 5A, 36) 1721.19 AF 269.7 49.9 1.78E–01 0.2 Split core99R-2 (Piece 8A, 49–51) 1721.33 AF 340.7 54.5 2.99E–01 0.7 Minicore99R-2 (Piece 8A, 56) 1721.39 AF 161.4 54 1.70E–01 0.1 Split core99R-2 (Piece 10A, 76) 1721.59 AF 118.7 48.4 1.78E–01 0.2 Split core99R-2 (Piece 11A, 86–88) 1721.69 AF 85.9 59.2 4.84E–01 0.5 Minicore99R-2 (Piece 11A, 86) 1721.69 AF 265 37 4.84E–01 0.4 Split core99R-2 (Piece 18A, 136) 1722.19 AF 99.4 48.8 1.65E–01 0.3 Split core99R-3 (Piece 1A, 8) 1722.37 AF 183.5 58.5 1.56E–01 1.1 Split core99R-3, 13–15 1722.43 AF 344.3 63.9 2.50E–01 0.8 Minicore99R-3 (Piece 2A, 26) 1722.55 AF 273.4 49.4 1.63E–01 0.3 Split core99R-3 (Piece 4A, 46) 1722.75 AF 147.3 48.7 2.14E–01 0.6 Split core99R-3 (Piece 8A, 72) 1723.01 AF 120 50.1 2.07E–01 0.4 Split core99R-3, 83–85 1723.12 AF 119.7 –4.8 1.39E–01 0.3 Minicore
Core, section, interval (cm)
Depth (mbsf)
Demagnetization type
Declination (°)
Inclination (°)
Intensity (A/m)
MAD (°)
Sample type
Table T1 (continued).

X. ZHAO ET AL.PALEOLATITUDE INFERRED FROM CRETACEOUS CORES 31
99R-3 (Piece 10A, 94) 1723.23 AF 224.6 44.7 2.09E–01 0.1 Split core99R-3 (Piece 11A, 106) 1723.35 AF 355.7 27 2.22E–01 0.4 Split core99R-3 (Piece 12A, 116) 1723.45 AF –89.5 49.8 1.99E–01 0.4 Split core99R-3 (Piece 13A, 126) 1723.55 AF 36.8 52.2 1.80E–01 0.3 Split core99R-3 (Piece 14A, 140) 1723.69 AF 230.8 49.8 2.06E–01 0.3 Split core99R-3 (Piece 14A, 148) 1723.77 AF 215.7 50.3 8.95E–02 0.2 Split core99R-5 (Piece 1A, 2) 1723.98 AF 7.6 50.4 1.34E+00 2.9 Split core99R-5, 26 1724.22 AF 4 61.8 3.21E+00 2.2 Split core99R-5, 27–29 1724.24 AF 142 52.6 3.72E+00 1 Minicore99R-5 (Piece 1B, 34) 1724.30 AF –46.4 6 3.42E+00 4.9 Split core99R-5 (Piece 1C, 38) 1724.34 AF –38.6 63.8 3.18E+00 3.8 Split core99R-5 (Piece 2A, 56) 1724.52 AF 124 59.8 3.85E–01 1.8 Split core99R-5, 90 1724.86 AF 182.5 47.3 8.76E–01 2.1 Split core99R-5, 110 1725.06 AF –56.6 50.8 2.78E+00 3.9 Split core99R-5, 111–113 1725.08 AF 109.5 61.5 3.51E+00 0.6 Minicore99R-6 (Piece 1A, 4) 1725.20 AF 70.2 41.3 3.44E–01 2.3 Split core99R-6, 10–12 1725.27 AF 42.4 65.9 5.57E+00 1.2 Minicore99R-6, 14 1725.30 AF 267.3 59.8 2.50E+00 5.6 Split core99R-6, 18 1725.34 AF –77.7 65.7 3.16E+00 4.9 Split core99R-6, 26 1725.42 AF 246.9 55.9 2.81E+00 4.4 Split core
210-1277A-1W-1, 24 0.25* AF 318.17 54.28 5.25E–01 3.3 Split core1W-1 (Piece 6A, 48) 0.49* AF –60.8 47.4 5.57E–01 4.7 Split core1W-1 (Piece 6A, 56) 0.57* AF 181.5 27.7 4.41E–01 3.1 Split core1W-1 (Piece 8A, 83–85) 0.74* AF 162.6 50.5 3.51E–03 2.7 Minicore1W-1 (Piece 9A, 102) 1.03* AF 245.4 44.2 2.97E+00 2.1 Split core1W-1 (Piece 10A, 108) 1.09* AF 28.58 44.51 1.35E+00 1.6 Split core1W-1 (Piece 10A, 110) 1.11* AF 32.5 30.4 2.39E+00 1.6 Split core1W-1 (Piece 11A, 118–120) 1.19* AF 218 33.8 3.68E–03 2.6 Minicore1W-2 (Piece 1A, 6–8) 1.43* AF 127.4 44.5 1.96E–03 4.9 Minicore1W-2 (Piece 1B, 28) 1.65* AF –53.1 50.3 3.42E+00 2.4 Split core1W-2 (Piece 6A, 94) 2.31* AF 186.1 49 2.37E–01 7.6 Split core1W-2 (Piece 6A, 100) 2.37* AF 202.1 38.8 4.28E–01 2.7 Split core2R-1 (Piece 4A, 28) 104.19 AF –9.22 36.39 6.92E–01 0.9 Split core2R-1 (Piece 12A, 114) 105.05 AF 137.3 15.49 2.16E–01 0.8 Split core2R-1 (Piece 12A, 116) 105.07 AF 148 16.2 2.07E–01 0.5 Split core2R-2 (Piece 3A, 26) 105.56 AF 140.2 42.7 5.47E–02 0.6 Split core2R-2 (Piece 9A, 62) 105.92 AF 92.2 18.6 2.59E–02 1.7 Split core2R-2 (Piece 18A, 102) 106.32 AF 137.1 –43.2 7.23E–01 2.2 Split core2R-2 (Piece 18A, 116) 106.46 AF 115.6 –42.9 6.42E–01 4.1 Split core3R-1 (Piece 1B, 6–8) 113.67 AF 18.1 59.3 1.47E–03 0.7 Minicore3R-1 (Piece 9A, 80) 114.41 AF 127 47.4 1.62E+00 4 Split core3R-1 (Piece 10A, 100) 114.61 AF –25.3 45 1.35E+00 3.5 Split core3R-2 (Piece 6A, 44) 115.46 AF 111.6 60.4 5.26E–01 4.1 Split core3R-2 (Piece 12A, 116) 116.18 AF 163.6 59.9 6.27E–01 5.7 Split core3R-3 (Piece 5A, 50) 117.02 AF 257.6 45 1.23E+00 2.5 Split core3R-3 (Piece 5B, 54) 117.06 AF 240.9 40 1.03E+00 2 Split core3R-3 (Piece 13A, 128) 117.80 AF 142.6 75.4 2.55E+00 1.5 Split core3R-4 (Piece 1A, 2–4) 117.99 AF 354.1 62.2 2.03E–03 0.9 Minicore3R-4 (Piece 1A, 10) 118.07 AF 190.4 62.6 2.31E+00 2.6 Split core3R-4 (Piece 2A, 34) 118.31 AF –31.4 70.6 2.31E+00 2 Split core4R-1 (Piece 3A, 18) 123.19 AF 198 40.7 1.10E+00 2.6 Split core4R-1 (Piece 4A, 66) 123.67 AF 130.6 59.6 5.27E+00 6.3 Split core4R-1 (Piece 11A, 140) 124.41 AF 218.8 –0.9 2.36E–04 1.4 Minicore4R-2 (Piece 5A, 35) 124.80 AF 307.9 61.3 8.64E–06 1.4 Split core4R-2 (Piece 6A, 50) 124.95 AF 190.9 51.9 1.98E–01 1.3 Split core4R-3 (Piece 1A, 6) 126.61 AF 5.1 46.5 1.80E+00 0.6 Split core5R-1 (Piece 2A, 12) 132.73 AF 146.5 57.5 1.79E+00 2.7 Split core5R-1 (Piece 6A, 88) 133.49 AF 206.6 67.6 1.56E+00 1 Split core5R-2 (Piece 1A, 4) 134.08 AF 39.9 50 5.35E–01 3.6 Split core5R-2 (Piece 2A, 10) 134.14 AF 353.29 55.52 1.56E–01 1.1 Split core5R-2 (Piece 2A, 12) 134.16 AF 285.06 –4.2 1.55E–01 1.7 Split core5R-2 (Piece 4A, 24) 134.28 AF 61.31 48.41 2.39E–01 5.5 Split core5R-2 (Piece 5A, 30) 134.34 AF 79.93 42.97 6.98E–01 3.5 Split core5R-2 (Piece 9A, 66) 134.70 AF 193.75 22.66 1.07E+00 1.7 Split core5R-3 (Piece 9A, 57–59) 136.10 AF 22.7 –3.1 4.74E+00 1.3 Minicore6R-1 (Piece 13B, 98) 143.09 AF 206.4 7.2 1.35E+00 2.3 Split core7R-1 (Piece 11A, 50) 152.31 AF 8.7 18.5 2.65E+00 4.4 Split core7R-1 (Piece 11B, 56) 152.37 AF 318.86 23.41 2.25E+00 2.4 Split core
Core, section, interval (cm)
Depth (mbsf)
Demagnetization type
Declination (°)
Inclination (°)
Intensity (A/m)
MAD (°)
Sample type
Table T1 (continued).
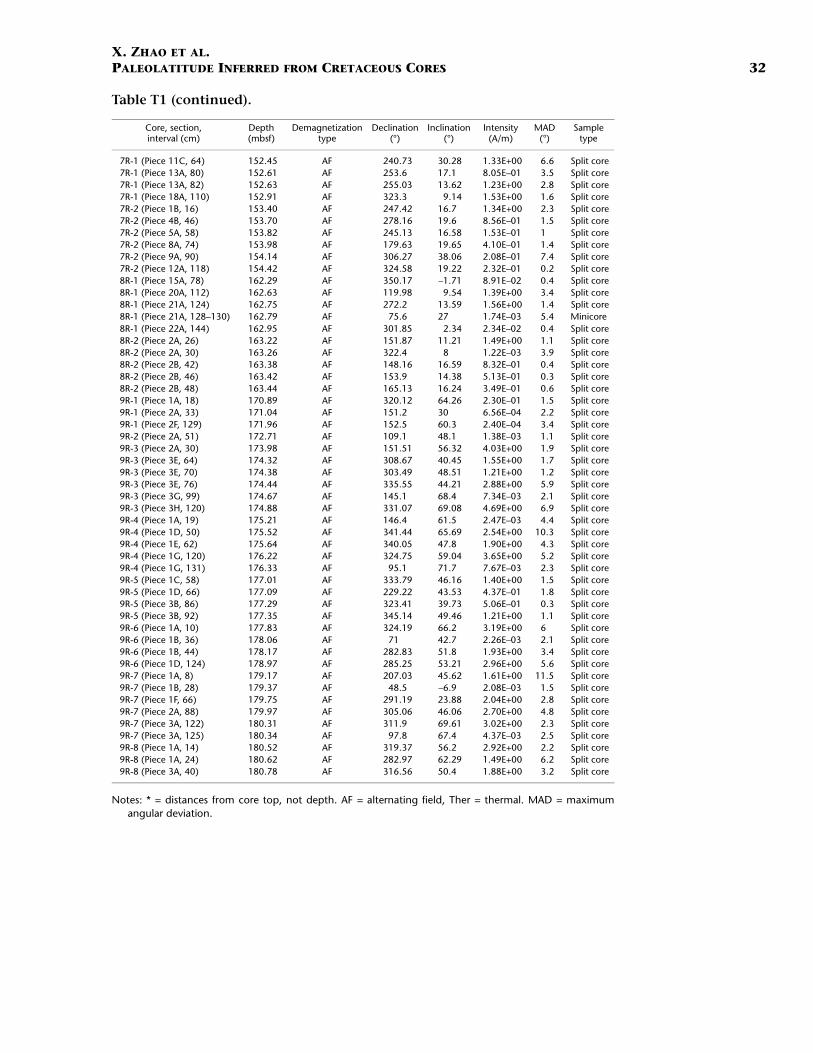
X. ZHAO ET AL.PALEOLATITUDE INFERRED FROM CRETACEOUS CORES 32
Notes: * = distances from core top, not depth. AF = alternating field, Ther = thermal. MAD = maximumangular deviation.
7R-1 (Piece 11C, 64) 152.45 AF 240.73 30.28 1.33E+00 6.6 Split core7R-1 (Piece 13A, 80) 152.61 AF 253.6 17.1 8.05E–01 3.5 Split core7R-1 (Piece 13A, 82) 152.63 AF 255.03 13.62 1.23E+00 2.8 Split core7R-1 (Piece 18A, 110) 152.91 AF 323.3 9.14 1.53E+00 1.6 Split core7R-2 (Piece 1B, 16) 153.40 AF 247.42 16.7 1.34E+00 2.3 Split core7R-2 (Piece 4B, 46) 153.70 AF 278.16 19.6 8.56E–01 1.5 Split core7R-2 (Piece 5A, 58) 153.82 AF 245.13 16.58 1.53E–01 1 Split core7R-2 (Piece 8A, 74) 153.98 AF 179.63 19.65 4.10E–01 1.4 Split core7R-2 (Piece 9A, 90) 154.14 AF 306.27 38.06 2.08E–01 7.4 Split core7R-2 (Piece 12A, 118) 154.42 AF 324.58 19.22 2.32E–01 0.2 Split core8R-1 (Piece 15A, 78) 162.29 AF 350.17 –1.71 8.91E–02 0.4 Split core8R-1 (Piece 20A, 112) 162.63 AF 119.98 9.54 1.39E+00 3.4 Split core8R-1 (Piece 21A, 124) 162.75 AF 272.2 13.59 1.56E+00 1.4 Split core8R-1 (Piece 21A, 128–130) 162.79 AF 75.6 27 1.74E–03 5.4 Minicore8R-1 (Piece 22A, 144) 162.95 AF 301.85 2.34 2.34E–02 0.4 Split core8R-2 (Piece 2A, 26) 163.22 AF 151.87 11.21 1.49E+00 1.1 Split core8R-2 (Piece 2A, 30) 163.26 AF 322.4 8 1.22E–03 3.9 Split core8R-2 (Piece 2B, 42) 163.38 AF 148.16 16.59 8.32E–01 0.4 Split core8R-2 (Piece 2B, 46) 163.42 AF 153.9 14.38 5.13E–01 0.3 Split core8R-2 (Piece 2B, 48) 163.44 AF 165.13 16.24 3.49E–01 0.6 Split core9R-1 (Piece 1A, 18) 170.89 AF 320.12 64.26 2.30E–01 1.5 Split core9R-1 (Piece 2A, 33) 171.04 AF 151.2 30 6.56E–04 2.2 Split core9R-1 (Piece 2F, 129) 171.96 AF 152.5 60.3 2.40E–04 3.4 Split core9R-2 (Piece 2A, 51) 172.71 AF 109.1 48.1 1.38E–03 1.1 Split core9R-3 (Piece 2A, 30) 173.98 AF 151.51 56.32 4.03E+00 1.9 Split core9R-3 (Piece 3E, 64) 174.32 AF 308.67 40.45 1.55E+00 1.7 Split core9R-3 (Piece 3E, 70) 174.38 AF 303.49 48.51 1.21E+00 1.2 Split core9R-3 (Piece 3E, 76) 174.44 AF 335.55 44.21 2.88E+00 5.9 Split core9R-3 (Piece 3G, 99) 174.67 AF 145.1 68.4 7.34E–03 2.1 Split core9R-3 (Piece 3H, 120) 174.88 AF 331.07 69.08 4.69E+00 6.9 Split core9R-4 (Piece 1A, 19) 175.21 AF 146.4 61.5 2.47E–03 4.4 Split core9R-4 (Piece 1D, 50) 175.52 AF 341.44 65.69 2.54E+00 10.3 Split core9R-4 (Piece 1E, 62) 175.64 AF 340.05 47.8 1.90E+00 4.3 Split core9R-4 (Piece 1G, 120) 176.22 AF 324.75 59.04 3.65E+00 5.2 Split core9R-4 (Piece 1G, 131) 176.33 AF 95.1 71.7 7.67E–03 2.3 Split core9R-5 (Piece 1C, 58) 177.01 AF 333.79 46.16 1.40E+00 1.5 Split core9R-5 (Piece 1D, 66) 177.09 AF 229.22 43.53 4.37E–01 1.8 Split core9R-5 (Piece 3B, 86) 177.29 AF 323.41 39.73 5.06E–01 0.3 Split core9R-5 (Piece 3B, 92) 177.35 AF 345.14 49.46 1.21E+00 1.1 Split core9R-6 (Piece 1A, 10) 177.83 AF 324.19 66.2 3.19E+00 6 Split core9R-6 (Piece 1B, 36) 178.06 AF 71 42.7 2.26E–03 2.1 Split core9R-6 (Piece 1B, 44) 178.17 AF 282.83 51.8 1.93E+00 3.4 Split core9R-6 (Piece 1D, 124) 178.97 AF 285.25 53.21 2.96E+00 5.6 Split core9R-7 (Piece 1A, 8) 179.17 AF 207.03 45.62 1.61E+00 11.5 Split core9R-7 (Piece 1B, 28) 179.37 AF 48.5 –6.9 2.08E–03 1.5 Split core9R-7 (Piece 1F, 66) 179.75 AF 291.19 23.88 2.04E+00 2.8 Split core9R-7 (Piece 2A, 88) 179.97 AF 305.06 46.06 2.70E+00 4.8 Split core9R-7 (Piece 3A, 122) 180.31 AF 311.9 69.61 3.02E+00 2.3 Split core9R-7 (Piece 3A, 125) 180.34 AF 97.8 67.4 4.37E–03 2.5 Split core9R-8 (Piece 1A, 14) 180.52 AF 319.37 56.2 2.92E+00 2.2 Split core9R-8 (Piece 1A, 24) 180.62 AF 282.97 62.29 1.49E+00 6.2 Split core9R-8 (Piece 3A, 40) 180.78 AF 316.56 50.4 1.88E+00 3.2 Split core
Core, section, interval (cm)
Depth (mbsf)
Demagnetization type
Declination (°)
Inclination (°)
Intensity (A/m)
MAD (°)
Sample type
Table T1 (continued).
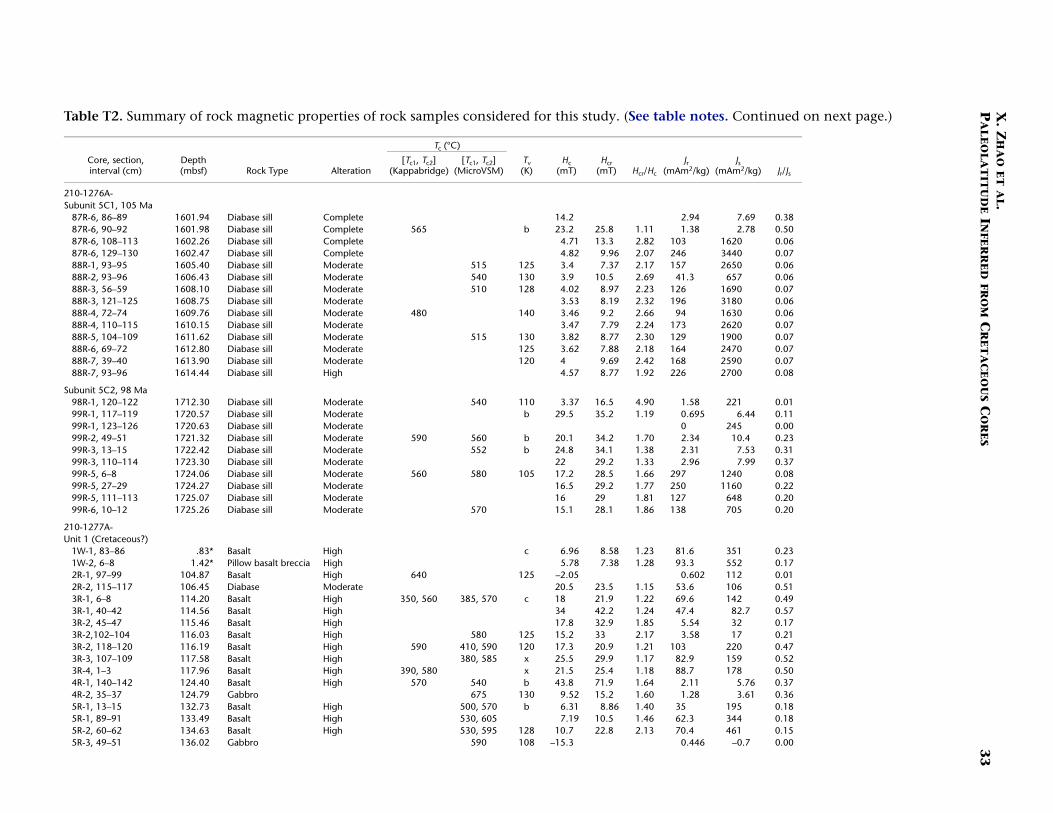
X. Z
HA
O E
T AL.
PA
LE
OL
AT
ITU
DE IN
FER
RE
D FR
OM
CR
ET
AC
EO
US C
OR
ES
33
Table nued on next page.)
Corint Jr/Js
210-1276Subunit 5
87R-6, 0.3887R-6, 0.5087R-6, 0.0687R-6, 0.0788R-1, 0.0688R-2, 0.0688R-3, 0.0788R-3, 0.0688R-4, 0.0688R-4, 0.0788R-5, 0.0788R-6, 0.0788R-7, 0.0788R-7, 0.08
Subunit 598R-1, 0.0199R-1, 0.1199R-1, 0.0099R-2, 0.2399R-3, 0.3199R-3, 0.3799R-5, 0.0899R-5, 0.2299R-5, 0.2099R-6, 0.20
210-1277Unit 1 (C
1W-1, 8 0.231W-2, 6 0.172R-1, 9 0.012R-2, 1 0.513R-1, 6 0.493R-1, 4 0.573R-2, 4 0.173R-2,10 0.213R-2, 1 0.473R-3, 1 0.523R-4, 1 0.504R-1, 1 0.374R-2, 3 0.365R-1, 1 0.185R-1, 8 0.185R-2, 6 0.155R-3, 4 0.00
T2. Summary of rock magnetic properties of rock samples considered for this study. (See table notes. Conti
e, section, erval (cm)
Depth (mbsf) Rock Type Alteration
Tc (°C)
Tv (K)
Hc (mT)
Hcr (mT) Hcr/Hc
Jr (mAm2/kg)
Js (mAm2/kg)
[Tc1, Tc2] (Kappabridge)
[Tc1, Tc2] (MicroVSM)
A-C1, 105 Ma86–89 1601.94 Diabase sill Complete 14.2 2.94 7.6990–92 1601.98 Diabase sill Complete 565 b 23.2 25.8 1.11 1.38 2.78108–113 1602.26 Diabase sill Complete 4.71 13.3 2.82 103 1620129–130 1602.47 Diabase sill Complete 4.82 9.96 2.07 246 344093–95 1605.40 Diabase sill Moderate 515 125 3.4 7.37 2.17 157 265093–96 1606.43 Diabase sill Moderate 540 130 3.9 10.5 2.69 41.3 65756–59 1608.10 Diabase sill Moderate 510 128 4.02 8.97 2.23 126 1690121–125 1608.75 Diabase sill Moderate 3.53 8.19 2.32 196 318072–74 1609.76 Diabase sill Moderate 480 140 3.46 9.2 2.66 94 1630110–115 1610.15 Diabase sill Moderate 3.47 7.79 2.24 173 2620104–109 1611.62 Diabase sill Moderate 515 130 3.82 8.77 2.30 129 190069–72 1612.80 Diabase sill Moderate 125 3.62 7.88 2.18 164 247039–40 1613.90 Diabase sill Moderate 120 4 9.69 2.42 168 259093–96 1614.44 Diabase sill High 4.57 8.77 1.92 226 2700
C2, 98 Ma120–122 1712.30 Diabase sill Moderate 540 110 3.37 16.5 4.90 1.58 221117–119 1720.57 Diabase sill Moderate b 29.5 35.2 1.19 0.695 6.44123–126 1720.63 Diabase sill Moderate 0 24549–51 1721.32 Diabase sill Moderate 590 560 b 20.1 34.2 1.70 2.34 10.413–15 1722.42 Diabase sill Moderate 552 b 24.8 34.1 1.38 2.31 7.53110–114 1723.30 Diabase sill Moderate 22 29.2 1.33 2.96 7.996–8 1724.06 Diabase sill Moderate 560 580 105 17.2 28.5 1.66 297 124027–29 1724.27 Diabase sill Moderate 16.5 29.2 1.77 250 1160111–113 1725.07 Diabase sill Moderate 16 29 1.81 127 64810–12 1725.26 Diabase sill Moderate 570 15.1 28.1 1.86 138 705
A-retaceous?)3–86 .83* Basalt High c 6.96 8.58 1.23 81.6 351–8 1.42* Pillow basalt breccia High 5.78 7.38 1.28 93.3 552
7–99 104.87 Basalt High 640 125 –2.05 0.602 11215–117 106.45 Diabase Moderate 20.5 23.5 1.15 53.6 106–8 114.20 Basalt High 350, 560 385, 570 c 18 21.9 1.22 69.6 1420–42 114.56 Basalt High 34 42.2 1.24 47.4 82.75–47 115.46 Basalt High 17.8 32.9 1.85 5.54 322–104 116.03 Basalt High 580 125 15.2 33 2.17 3.58 17
18–120 116.19 Basalt High 590 410, 590 120 17.3 20.9 1.21 103 22007–109 117.58 Basalt High 380, 585 x 25.5 29.9 1.17 82.9 159–3 117.96 Basalt High 390, 580 x 21.5 25.4 1.18 88.7 17840–142 124.40 Basalt High 570 540 b 43.8 71.9 1.64 2.11 5.765–37 124.79 Gabbro 675 130 9.52 15.2 1.60 1.28 3.613–15 132.73 Basalt High 500, 570 b 6.31 8.86 1.40 35 1959–91 133.49 Basalt High 530, 605 7.19 10.5 1.46 62.3 3440–62 134.63 Basalt High 530, 595 128 10.7 22.8 2.13 70.4 4619–51 136.02 Gabbro 590 108 –15.3 0.446 –0.7

X. Z
HA
O E
T AL.
PA
LE
OL
AT
ITU
DE IN
FER
RE
D FR
OM
CR
ET
AC
EO
US C
OR
ES
34
Notes: * ration are from Tucholke, Sibuet, Klaus, et al. (2004), see text for references. Tc = Curie temperature, Tc1 = lowCurie agnetometer. Tv = Verwey transition; b, c, x = groups of low-temperature magnetometry, see text.
Unit 2 (128R-1, 12 560, 620 11.3 17.5 1.55 106 520 0.218R-2, 30 555 110 11.5 18.8 1.63 202 1170 0.179R-1, 33 455 7.28 18 2.47 17.8 205 0.099R-1, 12 c 6.62 17.6 2.66 110 1390 0.089R-2, 51 c 9.69 20.1 2.07 243 1980 0.129R-2, 14 625 6.25 9.96 1.59 33.7 218 0.169R-3, 99 500, 570 102 5.62 11.4 2.03 140 1470 0.109R-4, 19 585 6.29 12.2 1.94 123 1170 0.119R-4, 13 110 7.73 15.9 2.06 133 1290 0.109R-5, 5– 560 105 5.89 14.1 2.39 116 1600 0.079R-5, 10 9.24 17.4 1.88 73.9 615 0.129R-6, 36 554 107 5.79 14.9 2.57 86.7 1330 0.079R-6, 11 585 8.59 16.2 1.89 93.7 790 0.129R-7, 28 560 105 11.2 17.5 1.56 162 947 0.079R-8, 40 580 7.88 14.2 1.80 132 1170 0.119R-8, 43 8.33 14.5 1.74 228 1980 0.12
Coreinte
(°C)
Tv (K)
Hc (mT)
Hcr (mT) Hcr/Hc
Jr (mAm2/kg)
Js (mAm2/kg) Jr/Jse)
[Tc1, Tc2] (MicroVSM)
Table T
= distances from core top, not depth. The rock type and degrees of alte temperature, Tc2 = high Curie temperature, VSM = vibrating sample m
6 Ma)8–130 162.78 Darker peridotite Serpentinized–32 163.25 Darker peridotite Serpentinized 410, 585–35 171.00 Brown dunite Serpentinized9–131 171.96 Brown dunite Serpentinized–53 172.71 Brown dunite Serpentinized1–143 173.60 Brown dunite Serpentinized–101 174.66 Darker peridotite Serpentinized–21 175.20 Darker peridotite Serpentinized1–133 176.32 Darker peridotite Serpentinized7 176.47 Darker peridotite Serpentinized 405, 5903–106 177.45 Darker peridotite Serpentinized–38 178.08 Darker peridotite Serpentinized 400, 5952–114 178.84 Darker peridotite Serpentinized–31 179.36 Darker peridotite Serpentinized 400, 590–42 180.77 Darker peridotite Serpentinized–45 180.80 Darker peridotite Serpentinized
, section, rval (cm)
Depth (mbsf) Rock Type Alteration
Tc
[Tc1, Tc2] (Kappabridg
2 (continued).

X. Z
HA
O E
T AL.
PA
LE
OL
AT
ITU
DE IN
FER
RE
D FR
OM
CR
ET
AC
EO
US C
OR
ES
35
Table nd Basin.
Note: * = average of Unit 4, Subunits 5A and 5B, and 4 intervals within Subunit 5C; ‡ =omit board biostratigraphic studies and post-cruise Ar-Ar isotopic dating (see text forrefer sion parameter, r = resultant vector, F{0.975} = F-statistics at 97.5% confidence.Mea , bold = paleolatitude estimates.
Mean paleolatitude
F{0.975}(°) α95 k r
Site 1276Unit 4 28.7 8.0 33.0 10.6965 f(1,10)~6.94
Subuni 23.3 7.0 38.1 11.7113 f(1,11)~6.72
Subuni 31.2 3.6 47.7 29.3923 f(1,29)~5.59
Sedime 26.8 4.7 25.4 31.7400 f(1,32)~5.54Sill 1 (S
and b35.2 6.7 34.5 13.6228 f(1,13)~6.41
Sedime 35.5 2.3 60.3 54.1049 f(1,54)~5.33Sill 2 (S 32.7 2.7 63.9 37.4212 f(1,37)~5.47Subuni 32.2 2.2 27.4 134.9189 f(1,139)~5.11Subuni 28.9 13.9 74.5 3.9597 f(1,3)~17.44
Subuni 29.2 9.1 98.0 4.9592 f(1,4)~12.22
Subuni 29.0 7.6 95.4 5.9476 f(1,5)~10.01
Mean A 31.3 1.8 29.2 186.4347 f(1,192)~4.99Mean B 30.3 5.1 162.6 6.9631 f(1,6)~8.81
Site 1277Unit 1 28.64 5.0 27.8 26.07 f(1,26)~5.66
27.65 3.7 34.7 37.905 f(1,38)~5.45
Unit 2 22.11 4.5 21.9 39.1742 f(1,40)~5.4224.2 5.1 21.6 32.4748 f(1,33)~5.53
Units 1 26.1 3.6 23.5 58.451 f(1,60)~5.29Units 1 24.9 3.0 25.4 76.8952 f(1,79)~5.25Units 1 22.9 12.0 29.0 6.7933 f(1,6)~8.81
T3. Mean inclinations and paleolatitudes of Sites 1276 and 1277, Newfoundla
= average of Subunit 5C1 (Sills 1), Subunit 5C2 (Sill 2) and two sediment intervals within Subunit 5C; †ted samples in Core 1W; ** = omitted dark dunite samples. Age = approximate age estimates from shipences), N = number of samples or units, α95 = radius of circle of 95% confidence, k = estimated precin inclination calculated by the method of McFadden and Reid (1982). Italics = used for Table T4, p. 36
DescriptionDepths of samples
(mbsf) Age N
Mean inclination
(°) α95 k r
(45°24.3198′N, 44°47.1496′W) 1040.50–1062.53 Turonian–Santonian 11 46.3 9.5 23.7 10.5776
t 5A 1071.42–1123.1 Cenomanian–Turonian 12 39.5 9.5 21.1 11.4784
t 5B 1133.88–1493.94 Albian–Cenomanian 30 49.5 4.4 33.9 29.1452
nts above Sill 1 1508.8–1612.77 Albian 33 43.3 6.3 15.5 30.9287ubunit 5C1) aked sediment
1612.81–1622.94 105 Ma 14 53.5 7.2 30.6 13.5744
nts above Sill 2 1623.24–1711.31 Albian–Aptian(?) 55 54.3 2.6 51.9 53.96ubunit 5C2) 1719.6–1725.42 98 Ma 38 51.4 3.1 51.7 37.2837t 5C 1508.8–1725.42 Albian–Aptian(?) 140 50.4 3.4 17.6 132.115t 5C 1508.8–1725.42 Albian–Aptian(?) 4* 47.3 16.7 51.8 3.942
ts 5B and 5C 1133.88–1725.42 Cenomanian–Aptian(?) 5 47.7 10.9 67.6 4.9408
t 5 1071.42–1725.42 Turonian–Aptian(?) 6 46.4 9.2 65.5 5.9236
1040.5–1725.4 Santonian–Aptian(?) 193 49.4 2.8 19.0 182.8981040.5–1725.4 Santonian–Aptian(?) 7† 46.3 7.3 78.6 6.9237
(45°11.8002′N, 44°22.5999′W)104.19–136.1 Cretaceous? 27‡ 45.8 6.8 16.6 25.4322
Cretaceous? 39 44.9 5 20.8 37.1755
143.09–180.78 126 Ma 41 36.67 6.7 11.4 37.4873143.09–180.78 126 Ma 34** 39.6 7.3 11.4 31.1004
and 2‡, ** 104.19–180.78 Cretaceous–126 Ma 61 42.4 5.3 12.9 56.3523 and 2 (All samples) 104.19–180.78 Cretaceous–126 Ma 80 40.7 4.5 13.7 74.2399 and 2 (Core means‡) 104.19–180.78 Cretaceous–126 Ma 7 38.5 17.6 13.8 6.5664

X. ZHAO ET AL.PALEOLATITUDE INFERRED FROM CRETACEOUS CORES 36
Table T4. Summary of paleolatitudes obtained from this study and inferredfrom mid-Cretaceous paleomagnetic poles for North America, Europe, andthe Avalon Terrane.
Notes: Plat = north latitude of paleomagnetic pole positions, Plong = east longitude of paleomag-netic pole position, α95 = radius of circle of 95% confidence about the pole position in degrees,Paleolat = paleolatitudes of Sites 1276 and 1277 calculated from the corresponding paleomag-netic pole position. Bold = paleolatitude estimates.
Age rangePlat (°)
Plong (°)
α95 (°)
Paleolat (°) Source of data
Laurentia (combined N. America-Greenland)125 Ma 70.5 192.5 3.5 33.0 ± 3.1 Besse and Courtillot (2002)120 Ma 71.2 194.2 3.1 33.9 ± 2.7 Besse and Courtillot (2002)100 Ma 76.4 197.7 0.4 38.0 ± 5.1 Besse and Courtillot (2002)90 Ma 75.3 196.4 3.5 37.1 ± 2.8 Besse and Courtillot (2002)90–125 Ma 73.4 194.9 3.4 35.2 ± 2.8 Average of above 4, this study97–130 Ma 72.7 191.1 2.1 34.2 ± 1.8 McElhinny and McFadden (1999)98–144 Ma 71.0 190.0 5.4 32.8 ± 4.8 Van der Voo (1993)
Europe125 Ma 75.7 192.4 3.5 36.6 ± 2.9 Besse and Courtillot (2002)120 Ma 76.5 193.5 3.1 37.3 ± 2.5 Besse and Courtillot (2002)100 Ma 85.1 144.5 11.5 40.6 ± 8.8 Besse and Courtillot (2002)90 Ma 80.8 185.8 3.5 39.2 ± 2.7 Besse and Courtillot (2002)90–125 Ma 79.9 186.1 6.1 38.4 ± 3.8 Average of above 4, this study97–146 Ma 70.5 206.5 7.3 36.6 ± 6.0 McElhinny and McFadden (1999)98–144 Ma 76.0 194.0 5.0 36.5 ± 4.1 Van der Voo (1993)
Avalon Terrane (= Avalon Peninsula of eastern Newfoundland)67–97 Ma 73.0 193.0 9.7 35.3 ± 8.3 Van der Voo (1993)115–144 Ma 67.0 212.0 4.0 35.7 ± 3.3 Van der Voo (1993)
Newfoundland BasinSantonian–Aptian (84–125 Ma) 30.3 ± 5.1 This studyLower Cretaceous–126 Ma 22.9 ± 12.0 This study

X. ZHAO ET AL.PALEOLATITUDE INFERRED FROM CRETACEOUS CORES 37
*Dates reflect file corrections or revisions.
CHAPTER NOTE*
N1. Jagoutz, O., Muntener, O., Manatschal, G., Rubatto, D., Peron-Pinvidic, G., Tur-rin, B.D., and Villa, I.M., submitted. The rift-to-drift transition in the southernNorth Atlantic: a stuttering start for the MORB engine? Geology.
Related Documents