Using CINET NSF Software Development for CyberInfrastructure Grant OCI1032677 Additional support by grants from DTRA V&V, DTRA CNIMS, NSF NetSE, NSF DIBBS Team Virginia Tech, Indiana Uni., SUNY Albany, Jackson State, Argonne Na>onal Lab, U. Chicago, NCAT, U. Houston Downtown

Welcome message from author
This document is posted to help you gain knowledge. Please leave a comment to let me know what you think about it! Share it to your friends and learn new things together.
Transcript
Using CINET
NSF Software Development for CyberInfrastructure Grant OCI-‐1032677 Additional support by grants from DTRA V&V, DTRA CNIMS, NSF NetSE,
NSF DIBBS Team
Virginia Tech, Indiana Uni., SUNY Albany, Jackson State, Argonne Na>onal Lab, U. Chicago, NCAT, U. Houston Downtown
CINET
2
CINET: Applica2ons
• Granite – Network structural analyses.
• GDS Calculator (GDSC) – Complete network dynamics on networks.
• EDISON – Forward trajectory (dynamics) on networks.
3
GRANITE
4
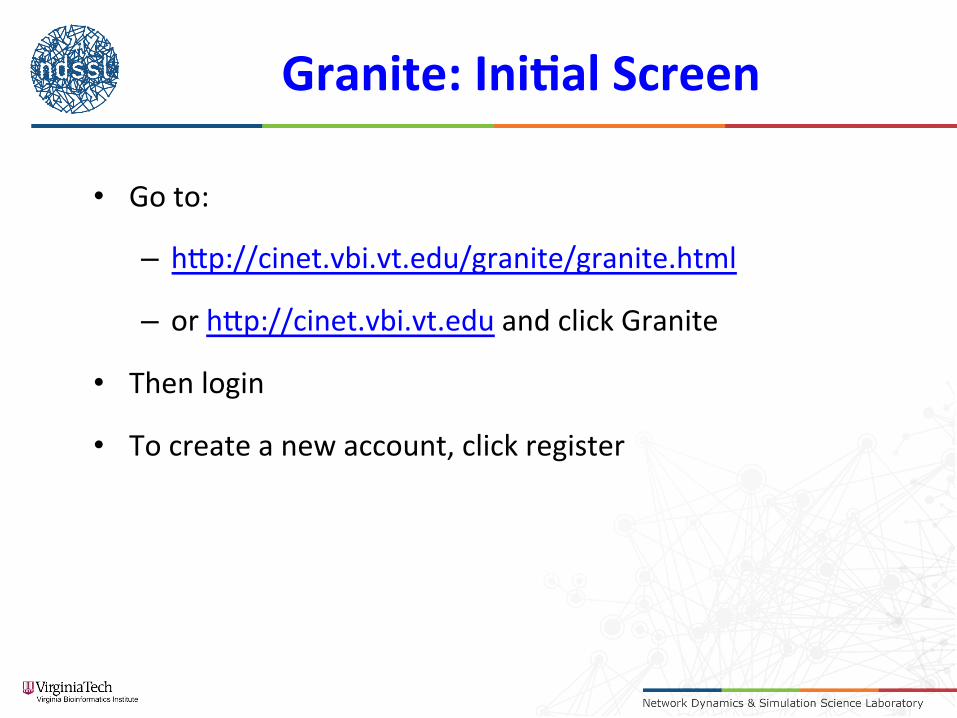
Granite: Ini>al Screen
• Go to:
– hGp://cinet.vbi.vt.edu/granite/granite.html
– or hGp://cinet.vbi.vt.edu and click Granite
• Then login
• To create a new account, click register
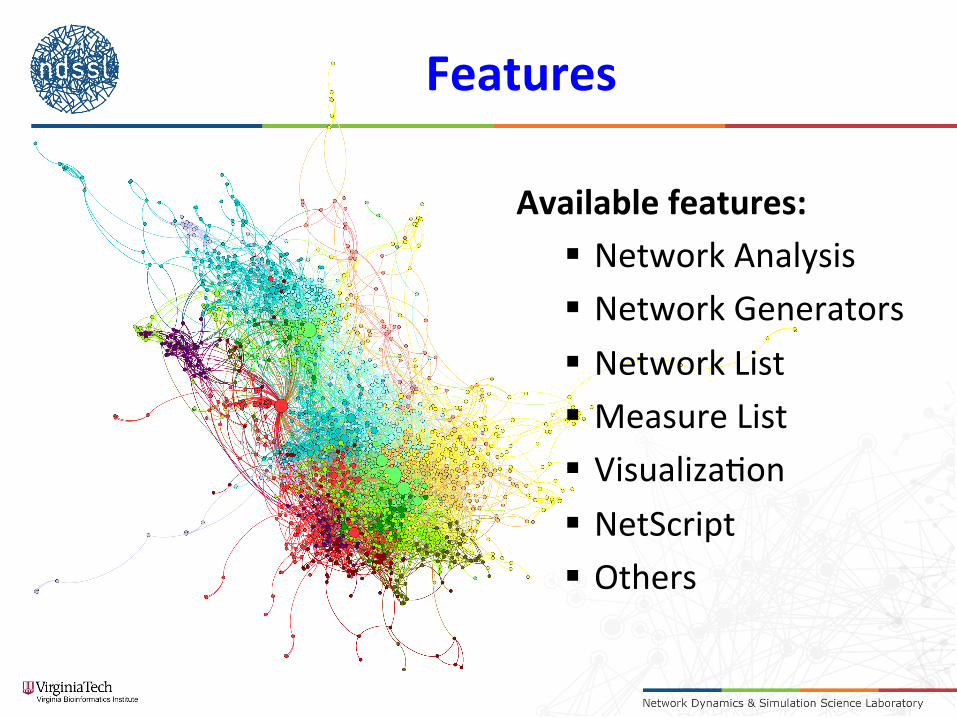
Features
Available features: § Network Analysis § Network Generators § Network List § Measure List § Visualiza2on § NetScript § Others
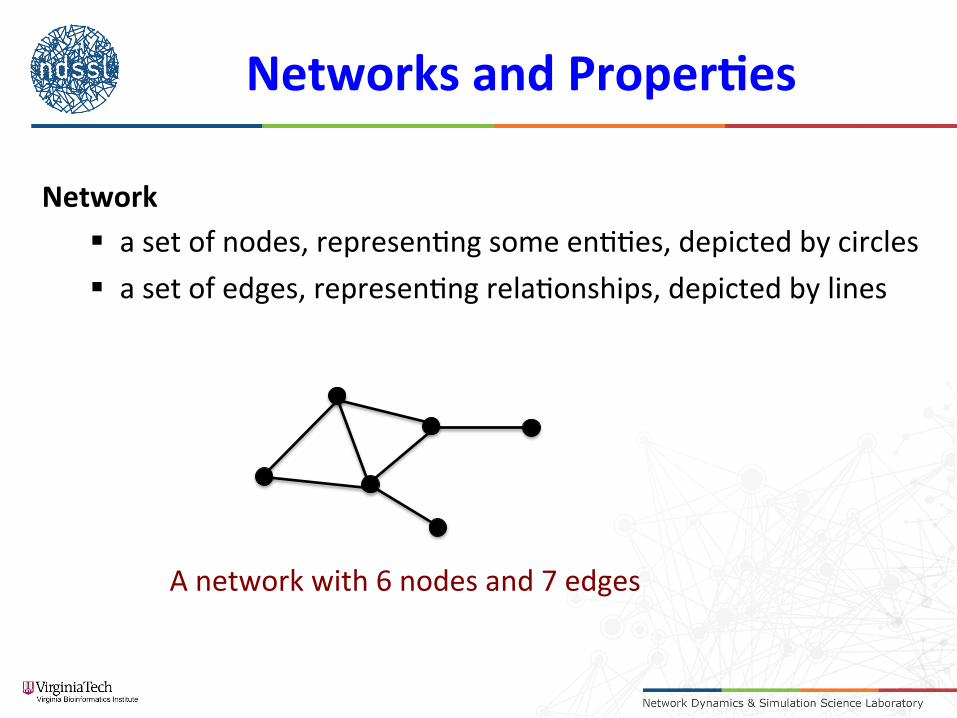
Networks and Proper>es
Network § a set of nodes, represen2ng some en22es, depicted by circles § a set of edges, represen2ng rela2onships, depicted by lines
A network with 6 nodes and 7 edges
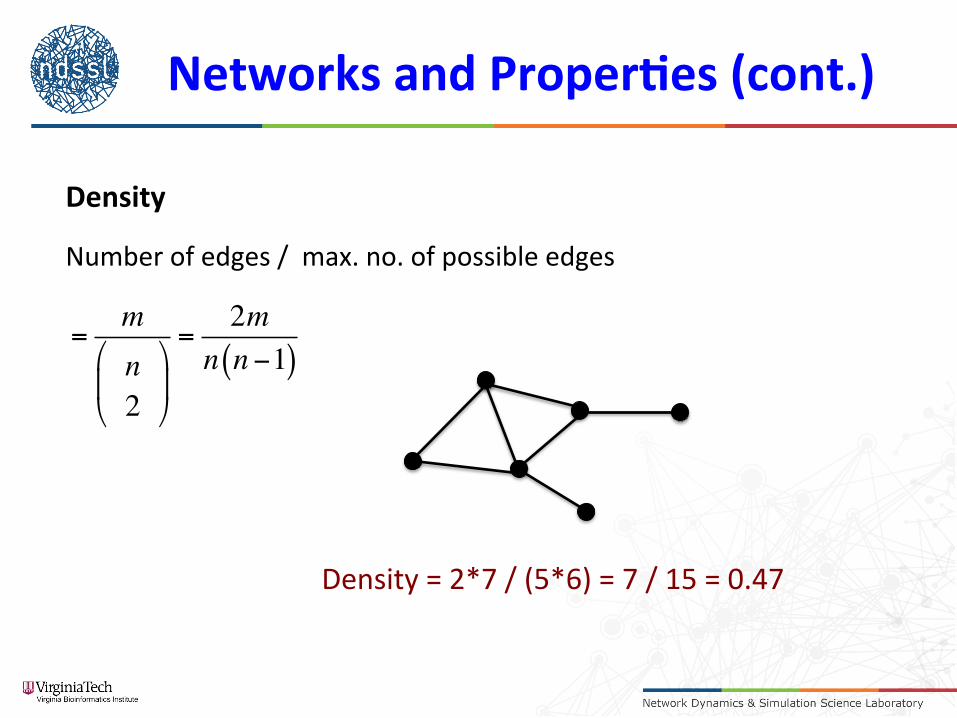
Networks and Proper>es (cont.)
Density
Number of edges / max. no. of possible edges
Density = 2*7 / (5*6) = 7 / 15 = 0.47
=mn2
!
"#
$
%&
=2m
n n−1( )
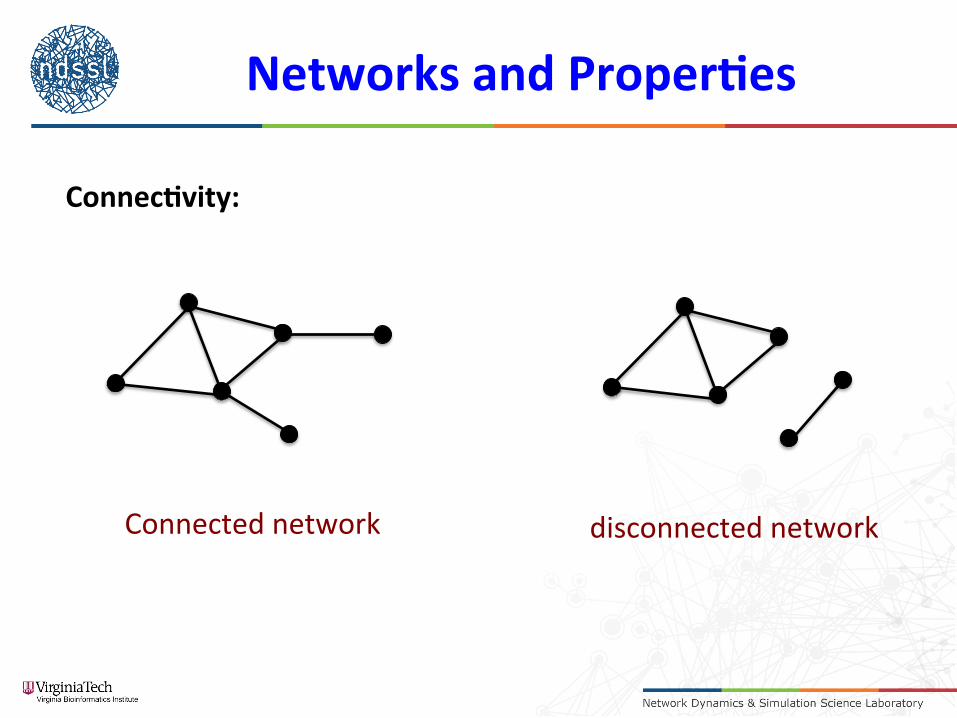
Networks and Proper>es
Connec>vity:
Connected network disconnected network
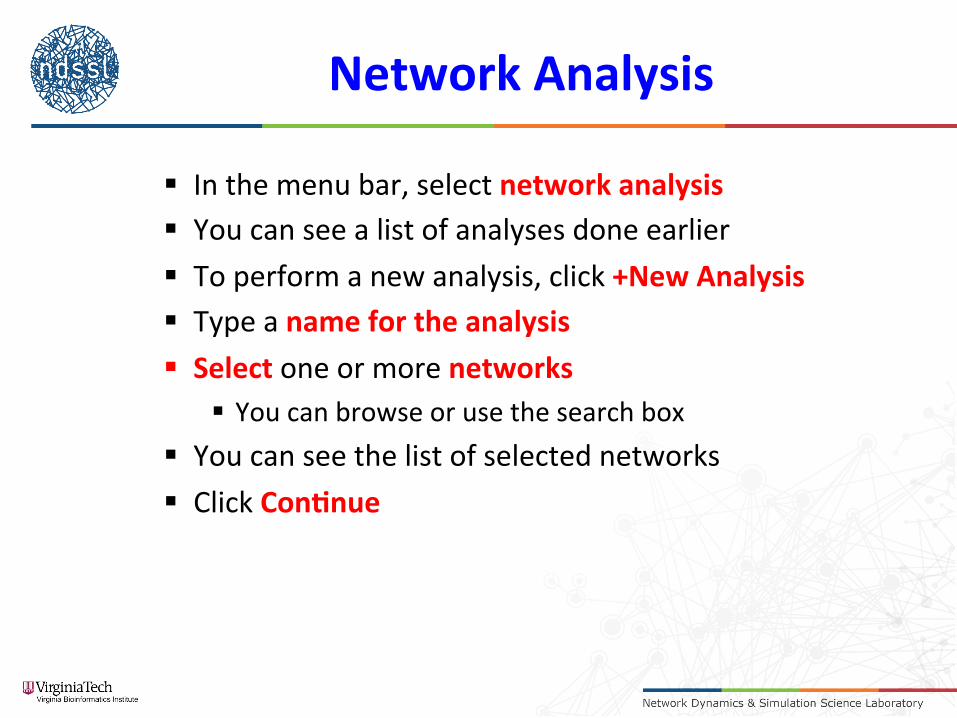
Network Analysis
§ In the menu bar, select network analysis § You can see a list of analyses done earlier § To perform a new analysis, click +New Analysis § Type a name for the analysis § Select one or more networks
§ You can browse or use the search box § You can see the list of selected networks § Click Con>nue

Network Analysis (cont.)
§ Select one or more measures § You can browse or use the search box § You can see some details of the measures § If necessary, provide parameter values
§ You can see the list of selected measures § Click Analyze § The new analysis is now in the list § Look at the status § When it is COMPLETED, click View Report. § See the results in the report sec2on § To download the results, click Download.
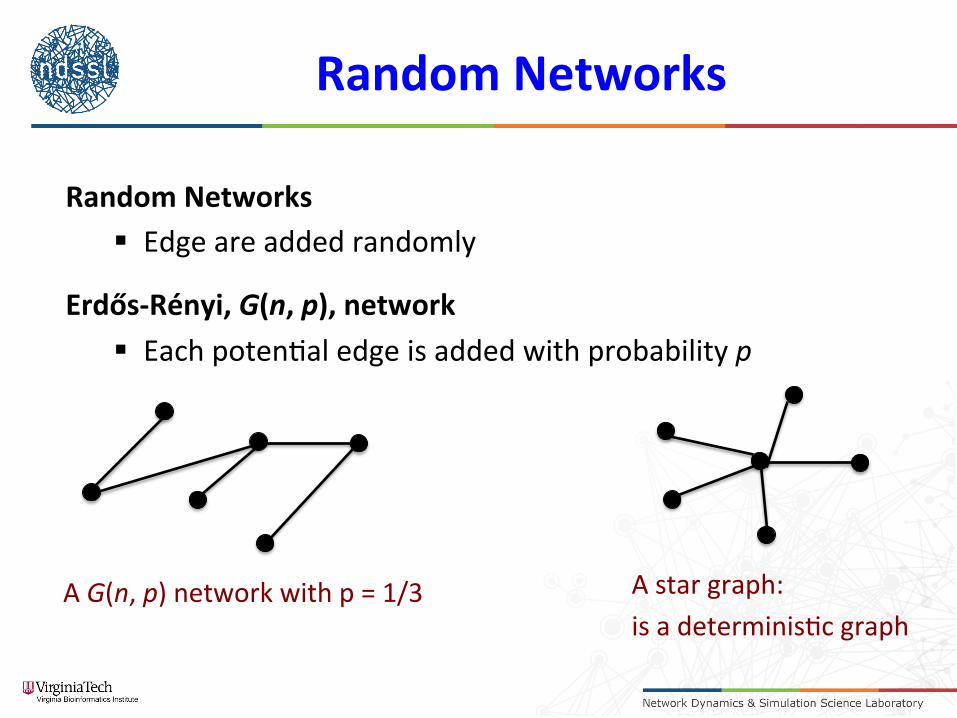
Random Networks
Random Networks § Edge are added randomly
Erdős-‐Rényi, G(n, p), network § Each poten2al edge is added with probability p
A G(n, p) network with p = 1/3 A star graph: is a determinis2c graph
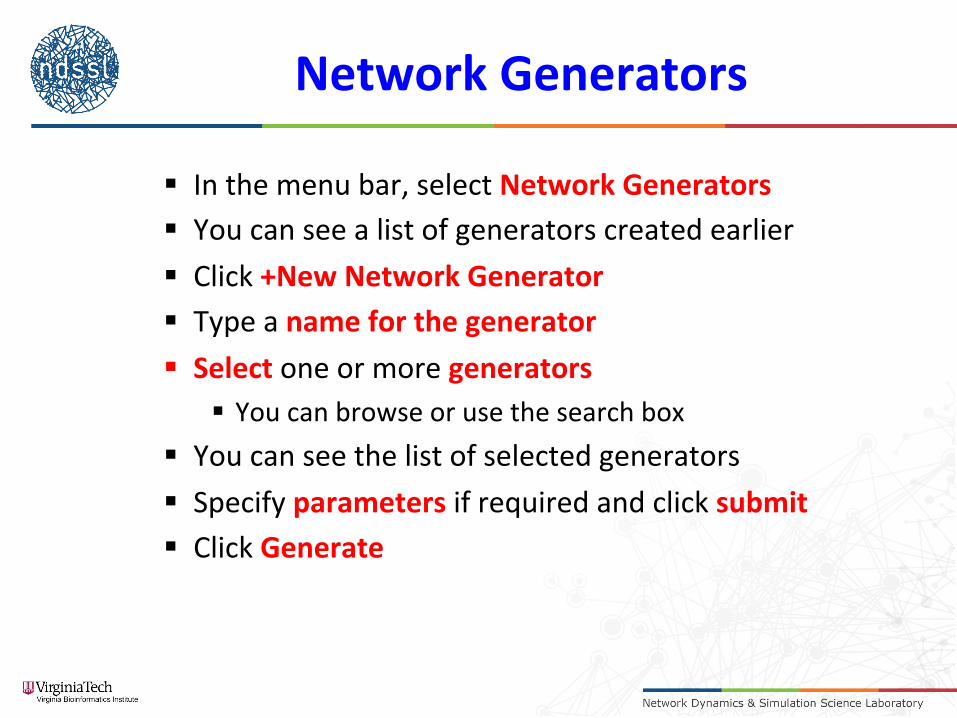
Network Generators
§ In the menu bar, select Network Generators § You can see a list of generators created earlier § Click +New Network Generator § Type a name for the generator § Select one or more generators
§ You can browse or use the search box § You can see the list of selected generators § Specify parameters if required and click submit § Click Generate
Network Generators (cont.)
§ The new generator is now in the list of generators § Look at the status § When it is COMPLETED, click View Report. § See the results in the report sec2on § To download the network, click Download.
Add a New Network
§ In the menu bar, select Networks § Click +New Network § Select Directly upload a file § Click Done § Click Choose File § Provide a name of the network and other info § Click Save § Now you can see the added network in the list
Network Visualiza>on
§ In the menu bar, select Networks § You can see the list of networks § Click on a network name to visualize § Click visualiza>on (on the right hand side) § Click +Add Visualiza>on § Select visualiza2on parameters
§ leave them as they are to use the default values § Click Generate
GDS CALCULATOR (GDSC)
17
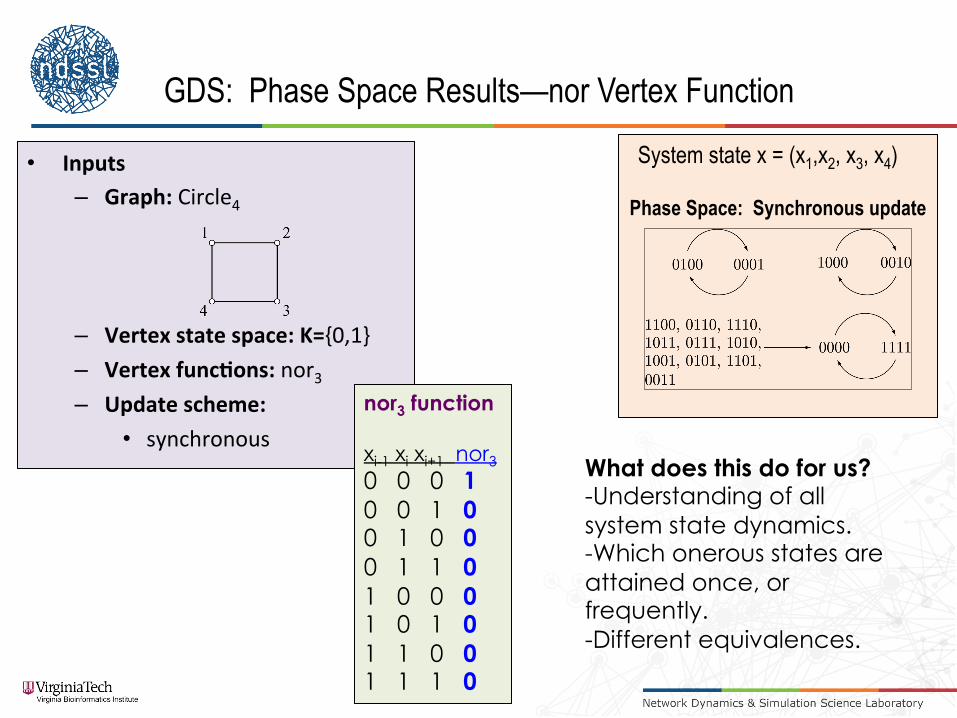
GDS: Phase Space Results—nor Vertex Function
• Inputs – Graph: Circle4
– Vertex state space: K={0,1} – Vertex func>ons: nor3 – Update scheme:
• synchronous
Phase Space: Synchronous update
System state x = (x1,x2, x3, x4)
nor3 function xi-1 xi xi+1 nor3
0 0 0 1 0 0 1 0 0 1 0 0 0 1 1 0 1 0 0 0 1 0 1 0 1 1 0 0 1 1 1 0
What does this do for us? -Understanding of all system state dynamics. -Which onerous states are attained once, or frequently. -Different equivalences.
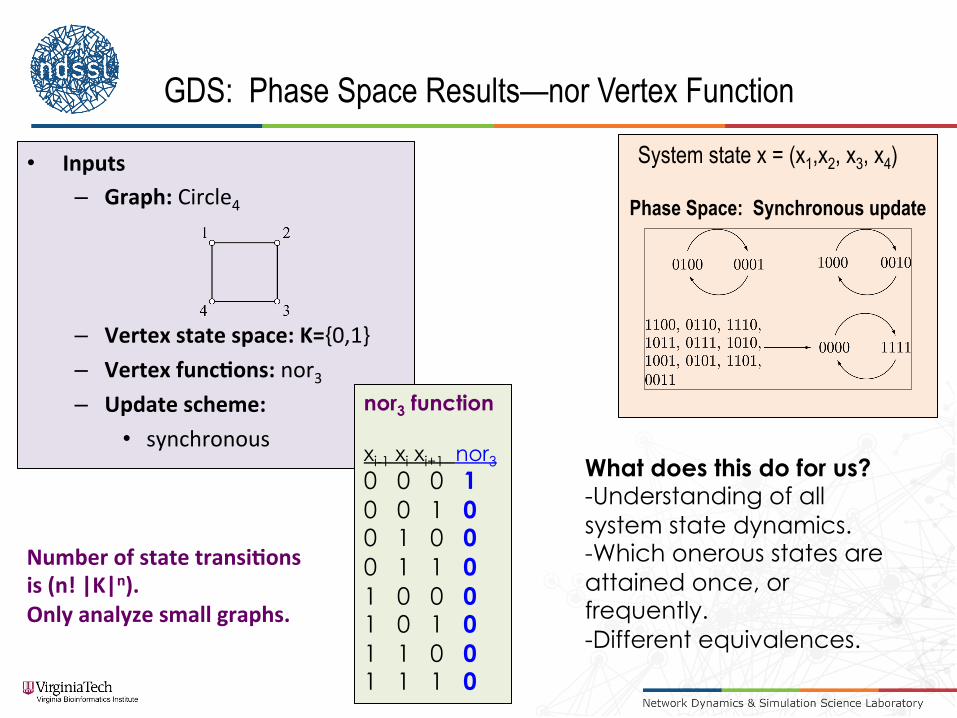
Number of state transi>ons is (n! |K|n). Only analyze small graphs.

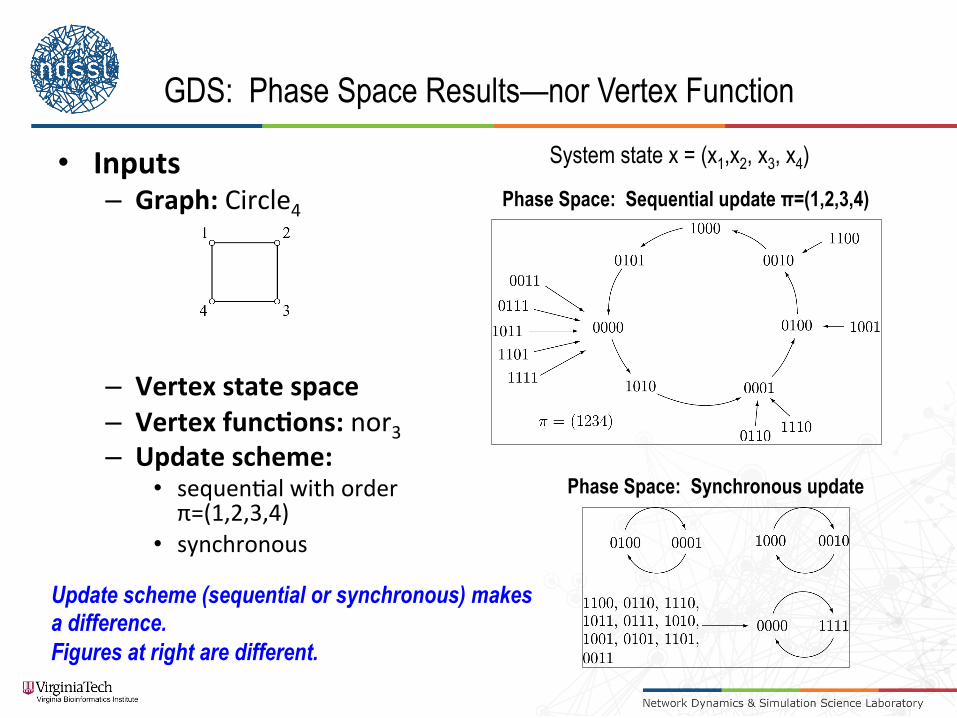
GDS: Phase Space Results—nor Vertex Function
• Inputs – Graph: Circle4
– Vertex state space – Vertex func>ons: nor3 – Update scheme:
• sequen2al with order π=(1,2,3,4)
• synchronous
Phase Space: Sequential update π=(1,2,3,4)
Phase Space: Synchronous update
System state x = (x1,x2, x3, x4)
Update scheme (sequential or synchronous) makes a difference. Figures at right are different.
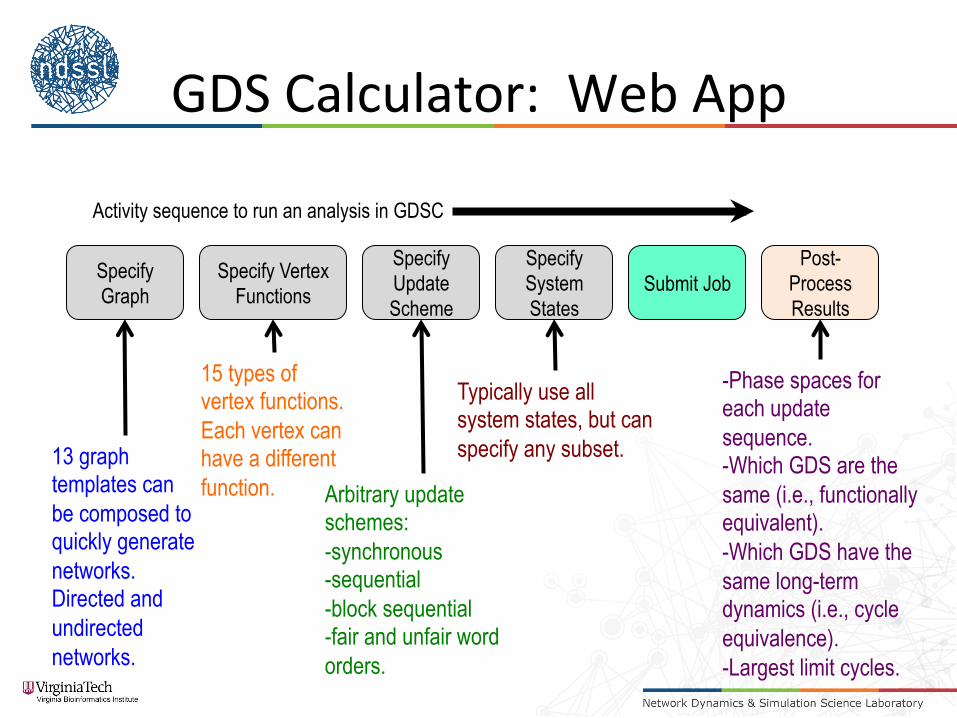
GDS Calculator: Web App
Specify Graph
Specify Vertex Functions
Specify Update Scheme
Specify System States
Post-Process Results
Submit Job
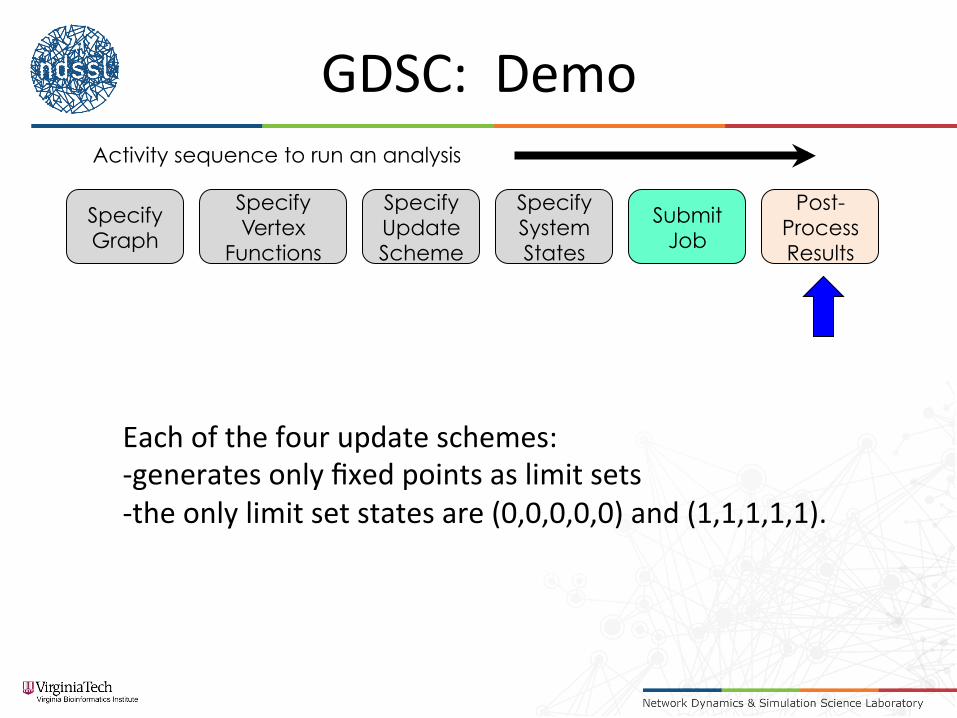
Activity sequence to run an analysis in GDSC
13 graph templates can be composed to quickly generate networks. Directed and undirected networks.
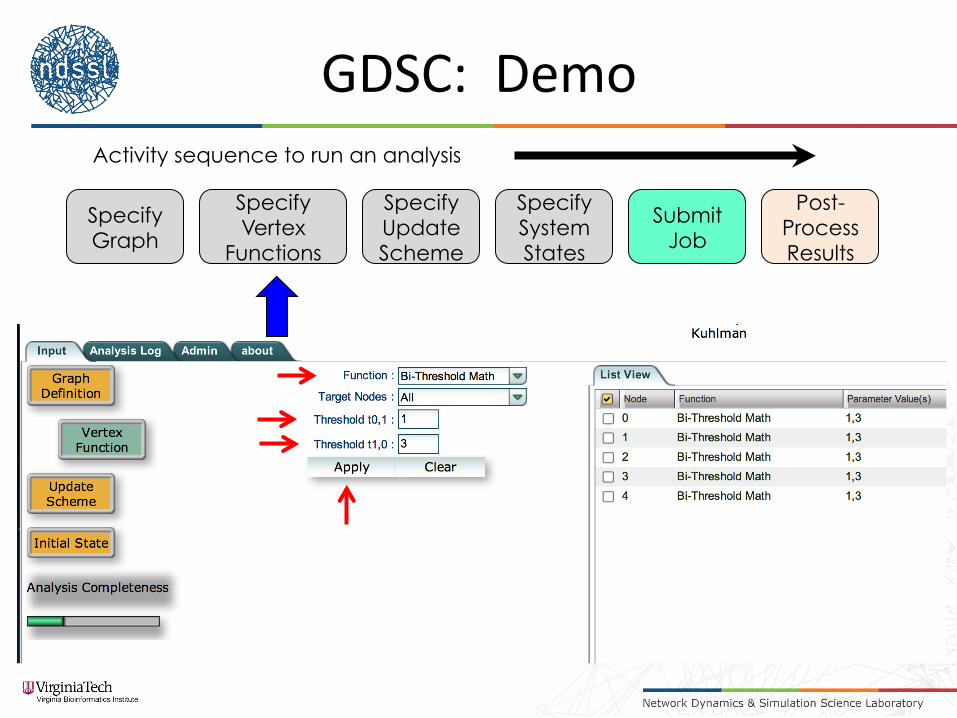
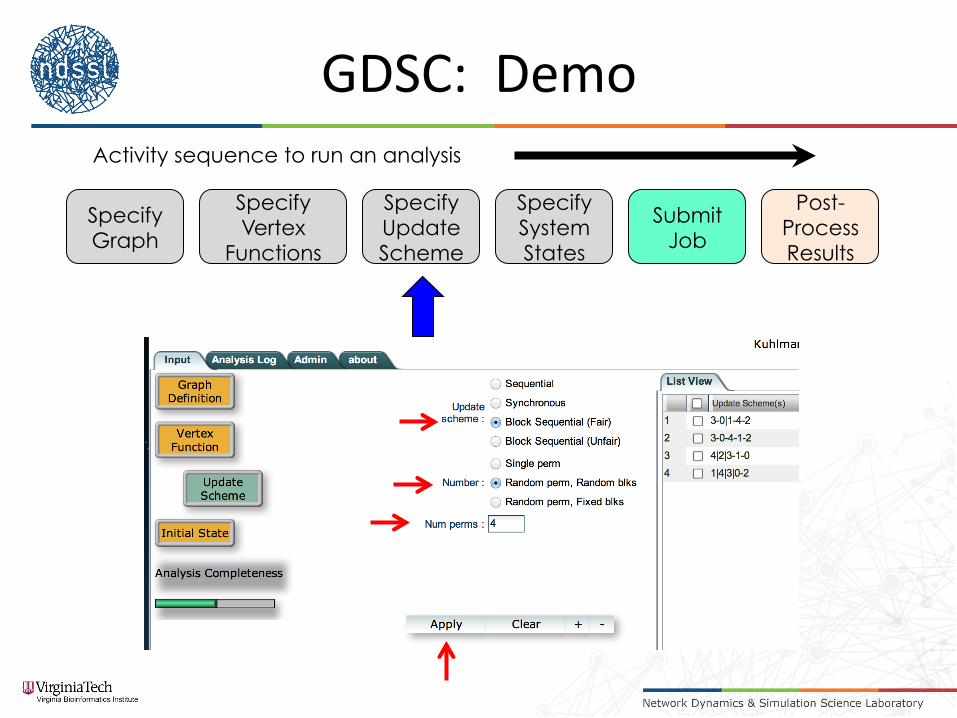
15 types of vertex functions. Each vertex can have a different function. Arbitrary update
schemes: -synchronous -sequential -block sequential -fair and unfair word orders.
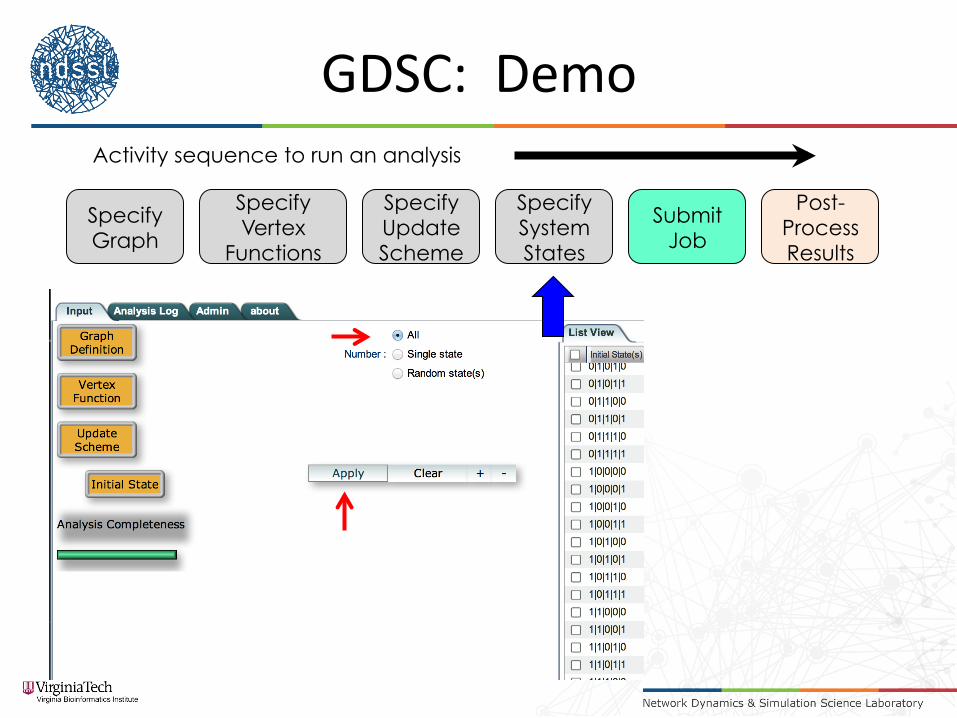
Typically use all system states, but can specify any subset.
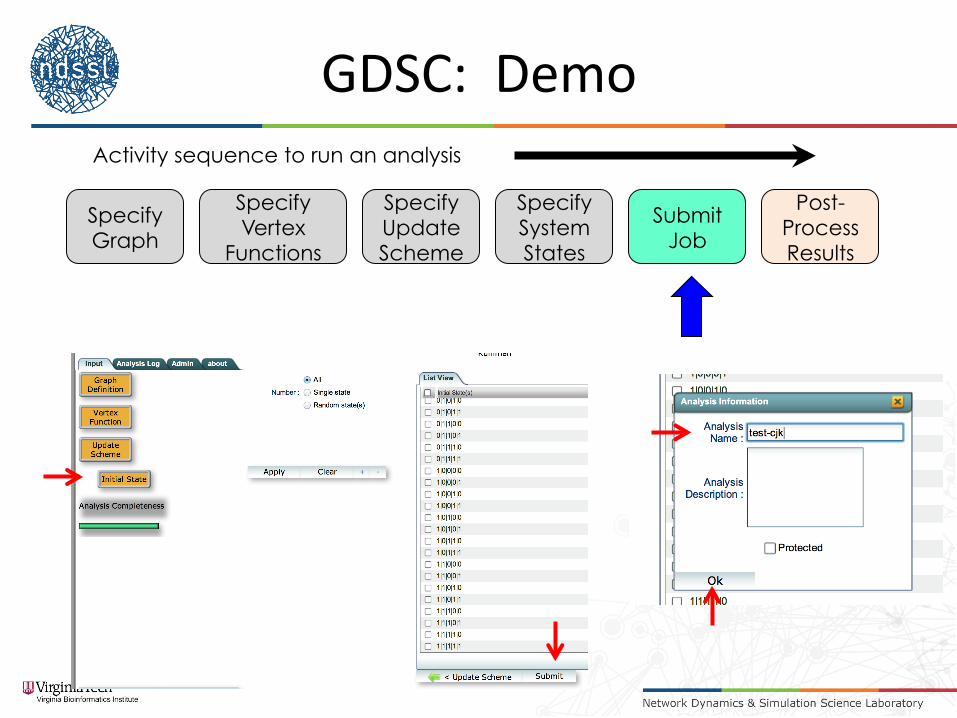
-Phase spaces for each update sequence. -Which GDS are the same (i.e., functionally equivalent). -Which GDS have the same long-term dynamics (i.e., cycle equivalence). -Largest limit cycles.
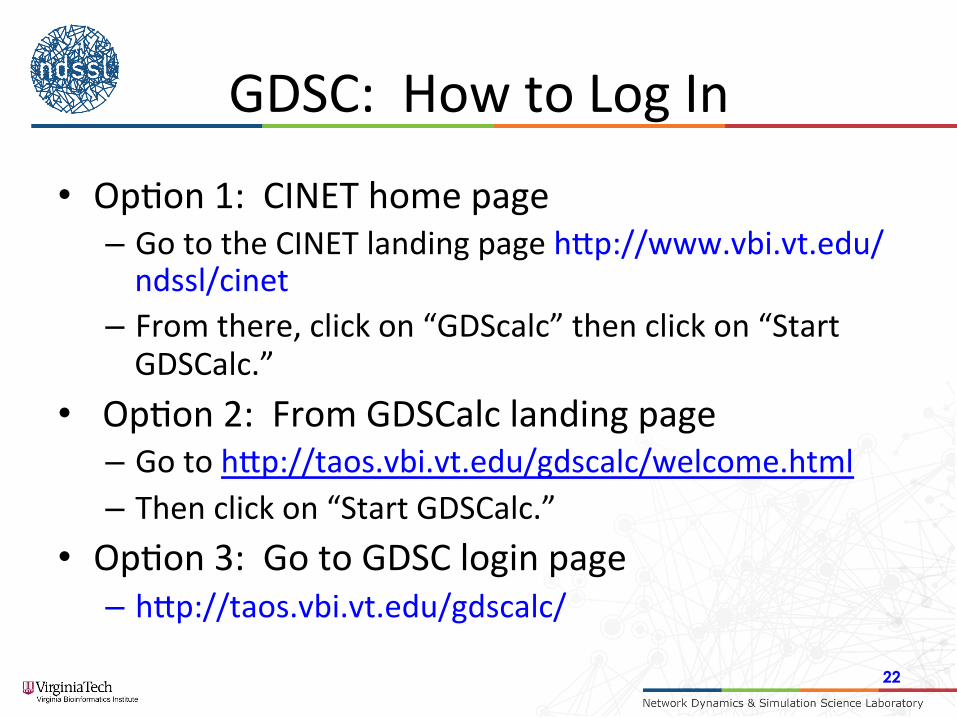
GDSC: How to Log In
• Op2on 1: CINET home page – Go to the CINET landing page hGp://www.vbi.vt.edu/ndssl/cinet
– From there, click on “GDScalc” then click on “Start GDSCalc.”
• Op2on 2: From GDSCalc landing page – Go to hGp://taos.vbi.vt.edu/gdscalc/welcome.html – Then click on “Start GDSCalc.”
• Op2on 3: Go to GDSC login page – hGp://taos.vbi.vt.edu/gdscalc/
22

Specify Graph
Specify Vertex
Functions
Specify Update Scheme
Specify System States
Post-Process Results
Submit Job
Activity sequence to run an analysis
GDSC: Demo
Specify Graph
Specify Vertex
Functions
Specify Update Scheme
Specify System States
Post-Process Results
Submit Job
Activity sequence to run an analysis
GDSC: Demo
Specify Graph
Specify Vertex
Functions
Specify Update Scheme
Specify System States
Post-Process Results
Submit Job
Activity sequence to run an analysis
GDSC: Demo
Specify Graph
Specify Vertex
Functions
Specify Update Scheme
Specify System States
Post-Process Results
Submit Job
Activity sequence to run an analysis
GDSC: Demo
Specify Graph
Specify Vertex
Functions
Specify Update Scheme
Specify System States
Post-Process Results
Submit Job
Activity sequence to run an analysis
GDSC: Demo
Specify Graph
Specify Vertex
Functions
Specify Update Scheme
Specify System States
Post-Process Results
Submit Job
Activity sequence to run an analysis
GDSC: Demo
Each of the four update schemes: -‐generates only fixed points as limit sets -‐the only limit set states are (0,0,0,0,0) and (1,1,1,1,1).
How is GDS Calculator Useful?
• Educa2on: understanding dynamics. • Research:
– Running web app enables us to build intui2on about problems.
– Convert concrete results into abstract theorems (that are applicable to much large [finite] systems).
– Crucial element of experimental mathema.cs, or computa.onal mathema.cs.
Take Aways • Dynamics on graphs. • Evalua2on of all system state transi2ons. • Small graphs because number of state transi2ons exponen2al in
number of ver2ces; problem size explodes. • Understand complete dynamics. • Elements
– Graph. – Vertex state set. – Vertex func2ons. – Update schemes for vertex func2ons.
• Three published works using this system: Automata 2011, Theore2cal Computer Science 2014, J. Cellular Automata 2015.
30
EDISON
31
GDS: Phase Space Results—nor Vertex Function
• Inputs – Graph: Circle4
– Vertex state space – Vertex func>ons: nor3 – Update scheme:
• sequen2al with order π=(1,2,3,4)
• synchronous
Phase Space: Sequential update π=(1,2,3,4)
Phase Space: Synchronous update
System state x = (x1,x2, x3, x4)
Update scheme (sequential or synchronous) makes a difference. Figures at right are different.
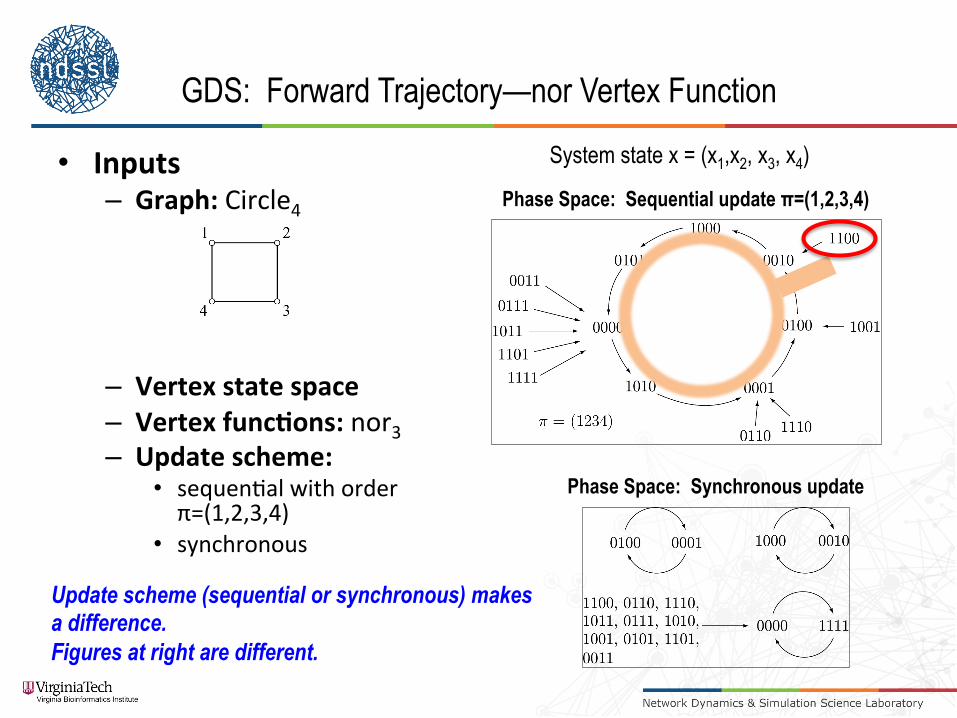
GDS: Forward Trajectory—nor Vertex Function
• Inputs – Graph: Circle4
– Vertex state space – Vertex func>ons: nor3 – Update scheme:
• sequen2al with order π=(1,2,3,4)
• synchronous
Phase Space: Sequential update π=(1,2,3,4)
Phase Space: Synchronous update
System state x = (x1,x2, x3, x4)
Update scheme (sequential or synchronous) makes a difference. Figures at right are different.
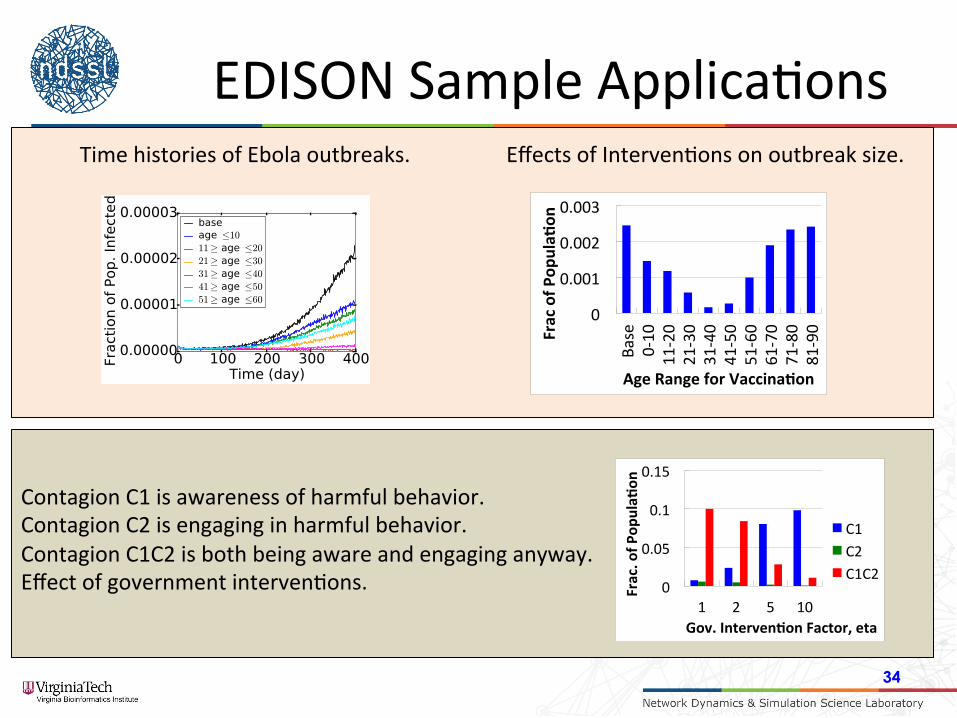
EDISON Sample Applica2ons
34
0"
0.001"
0.002"
0.003"
Base"
0+10"
11+20"
21+30"
31+40"
41+50"
51+60"
61+70"
71+80"
81+90"Frac%of%P
opula,
on%
Age%Range%for%Vaccina,on%
Time histories of Ebola outbreaks. Effects of Interven2ons on outbreak size.
0"
0.05"
0.1"
0.15"
1" 2" 5" 10"Frac.&o
f&Pop
ula-
on&
Gov.&Interven-on&Factor,&eta&
C1"C2"C1C2"
Contagion C1 is awareness of harmful behavior. Contagion C2 is engaging in harmful behavior. Contagion C1C2 is both being aware and engaging anyway. Effect of government interven2ons.
EDISON
• We demonstrate some of the features of the UI.
• The backend compute engine (hybrid mul2-‐thread, MPI) has been used in several works.
35
36
END
Related Documents