User Experiments with Tree Visualization Systems Alfred Kobsa University of California, Irvine ABSTRACT * This paper describes a comparative experiment with five well- known tree visualization systems, and Windows Explorer as a baseline system. Subjects performed tasks relating to the structure of a directory hierarchy, and to attributes of files and directories. Task completion times, correctness and user satisfaction were measured, and video recordings of subjects’ interaction with the systems were made. Significant system and task type effects and an interaction between system and task type were found. Qualitative analyses of the video recordings were thereupon conducted to determine reasons for the observed differences, resulting in several findings and design recommendations as well as implications for future experiments with tree visualization systems. CR Categories 1998: H.5.2 [User Interfaces]: Graphical User Interfaces (GUI) H.1.2 [User/Machine Systems]: Human factors I.3.6 [Methodology and Techniques]: Interaction Techniques Keywords: information visualization, experimental comparison, task performance, accuracy, user satisfaction, user interaction, design recommendations 1 INTRODUCTION Comparisons between information visualization systems can provide valuable information about the effectiveness and the ease of use of such systems. An analysis of the reasons behind observed differences in effectiveness can help identify both points of weakness and success factors of visualization systems. Relatively few such studies have been conducted so far (see Section 6 for an overview). In this paper, we describe a between- subjects experiment in which we compared five well-known visualization systems for (strict) trees, and Windows Explorer as a baseline system. While the five systems are in principle able to visualize any tree structure, their functionality suggests that they were mostly designed for the visualization of file directories and websites. Section 2 provides a brief overview of these systems. Section 3 describes the observational and analytic methods of our study. E-mail: [email protected], WWW: http://www.ics.uci.edu/~kobsa. The work described here has been partly supported by a grant of the UCI Center for Research on Information Technology and Organizations (CRITO). The author wishes to thank Frank van Ham, Catherine Plaisant, Ramana Rao, Ben Shneiderman and Jarke van Wijk for making their systems available and providing valuable input on the experimental tasks, and to F. Agagu, R. Krishna, S. Ratanotayanon, I. Seredkin, N. Su, S. Sun, T. Shubha, T. Zhengming and M. Yeh for their assistance in the experimental analysis. Thanks are also due to the reviewers of this paper for their helpful recommendations. Section 4 presents the overall quantitative results with respect to correctness, speed of task performance and user satisfaction. Section 5 discusses the quantitative and qualitative results and their implications individually for each system. Section 6 reviews related work, and Section 7 summarizes the conclusions from this study and proposes implications for future experiments with tree visualization systems. 2 VISUALIZATION SYSTEMS USED IN THIS STUDY 2.1 Treemap 3.2 1 Treemap [6, 21] is a space-filling visualization that depicts sub- ordination of tree nodes through recursive subdivision of rectangles that represent these nodes. The size of a rectangle is proportional to the size of the corresponding node, and users can choose among several partitioning algorithms. Labels and color inside the visualization convey user-selectable information about files. Filtering of files by size and age grays them out, and filtering by depth of nesting removes undesired substructures. Figure 1 shows our test tree when viewed with Treemap. Figure 1. Test tree seen with Treemap (different colors denote different file types) 2.2 SequoiaView 1.3 SequoiaView (formerly Cushion Treemaps [25]) visualizes trees in a similar manner as Treemap. It goes beyond Treemap though by supporting a 2 1/2D appearance through shading and spot- lighting. SequoiaView also provides additional functionality for filtering, sorting, highlighting and explicit inclusion or exclusion of files. Filtering does not grey out but omits the filtered files. Figure 2 shows our test hierarchy when viewed with SequoiaView in the default “squarified cushion treemap” visualization. 1 A more recent release, Treemap 4.0, was not yet available at the time of this experiment.

Welcome message from author
This document is posted to help you gain knowledge. Please leave a comment to let me know what you think about it! Share it to your friends and learn new things together.
Transcript
User Experiments with Tree Visualization Systems
Alfred Kobsa
University of California, Irvine
ABSTRACT*
This paper describes a comparative experiment with five well-known tree visualization systems, and Windows Explorer as abaseline system. Subjects performed tasks relating to the structureof a directory hierarchy, and to attributes of files and directories.Task completion times, correctness and user satisfaction weremeasured, and video recordings of subjects’ interaction with thesystems were made. Significant system and task type effects andan interaction between system and task type were found.Qualitative analyses of the video recordings were thereuponconducted to determine reasons for the observed differences,resulting in several findings and design recommendations as wellas implications for future experiments with tree visualizationsystems.
CR Categories 1998: H.5.2 [User Interfaces]: Graphical UserInterfaces (GUI) H.1.2 [User/Machine Systems]: Human factorsI.3.6 [Methodology and Techniques]: Interaction Techniques
Keywords: information visualization, experimental comparison,task performance, accuracy, user satisfaction, user interaction,design recommendations
1 INTRODUCTION
Comparisons between information visualization systems canprovide valuable information about the effectiveness and the easeof use of such systems. An analysis of the reasons behindobserved differences in effectiveness can help identify both pointsof weakness and success factors of visualization systems.
Relatively few such studies have been conducted so far (seeSection 6 for an overview). In this paper, we describe a between-subjects experiment in which we compared five well-knownvisualization systems for (strict) trees, and Windows Explorer as abaseline system. While the five systems are in principle able tovisualize any tree structure, their functionality suggests that theywere mostly designed for the visualization of file directories andwebsites.
Section 2 provides a brief overview of these systems. Section 3describes the observational and analytic methods of our study. E-mail: [email protected], WWW: http://www.ics.uci.edu/~kobsa. The workdescribed here has been partly supported by a grant of the UCI Center forResearch on Information Technology and Organizations (CRITO). Theauthor wishes to thank Frank van Ham, Catherine Plaisant, Ramana Rao,Ben Shneiderman and Jarke van Wijk for making their systems availableand providing valuable input on the experimental tasks, and to F. Agagu,R. Krishna, S. Ratanotayanon, I. Seredkin, N. Su, S. Sun, T. Shubha, T.Zhengming and M. Yeh for their assistance in the experimental analysis.Thanks are also due to the reviewers of this paper for their helpfulrecommendations.
Section 4 presents the overall quantitative results with respect tocorrectness, speed of task performance and user satisfaction.Section 5 discusses the quantitative and qualitative results andtheir implications individually for each system. Section 6 reviewsrelated work, and Section 7 summarizes the conclusions from thisstudy and proposes implications for future experiments with treevisualization systems.
2 VISUALIZATION SYSTEMS USED IN THIS STUDY
2.1 Treemap 3.21
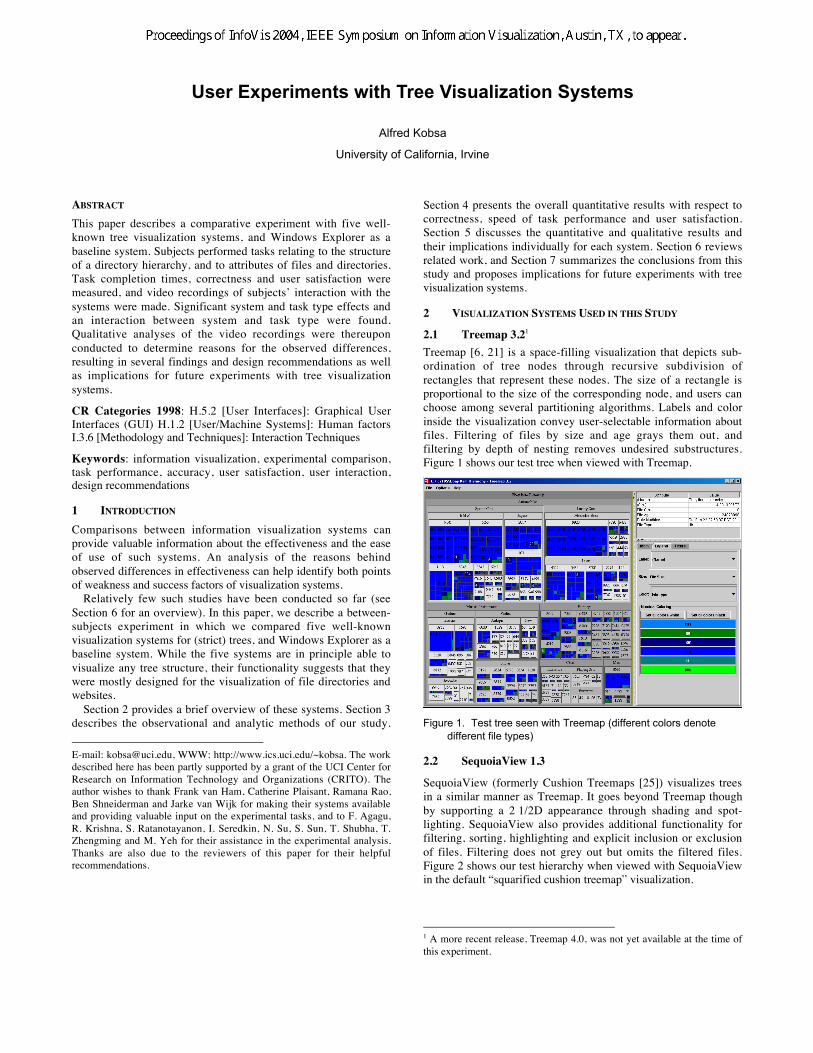
Treemap [6, 21] is a space-filling visualization that depicts sub-ordination of tree nodes through recursive subdivision ofrectangles that represent these nodes. The size of a rectangle isproportional to the size of the corresponding node, and users canchoose among several partitioning algorithms. Labels and colorinside the visualization convey user-selectable information aboutfiles. Filtering of files by size and age grays them out, andfiltering by depth of nesting removes undesired substructures.Figure 1 shows our test tree when viewed with Treemap.
Figure 1. Test tree seen with Treemap (different colors denotedifferent file types)
2.2 SequoiaView 1.3
SequoiaView (formerly Cushion Treemaps [25]) visualizes treesin a similar manner as Treemap. It goes beyond Treemap thoughby supporting a 2 1/2D appearance through shading and spot-lighting. SequoiaView also provides additional functionality forfiltering, sorting, highlighting and explicit inclusion or exclusionof files. Filtering does not grey out but omits the filtered files.Figure 2 shows our test hierarchy when viewed with SequoiaViewin the default “squarified cushion treemap” visualization.
1 A more recent release, Treemap 4.0, was not yet available at the time ofthis experiment.
Alfred Kobsa
Proceedings of InfoVis 2004, IEEE Symposium on Information Visualization, Austin, TX, to appear.
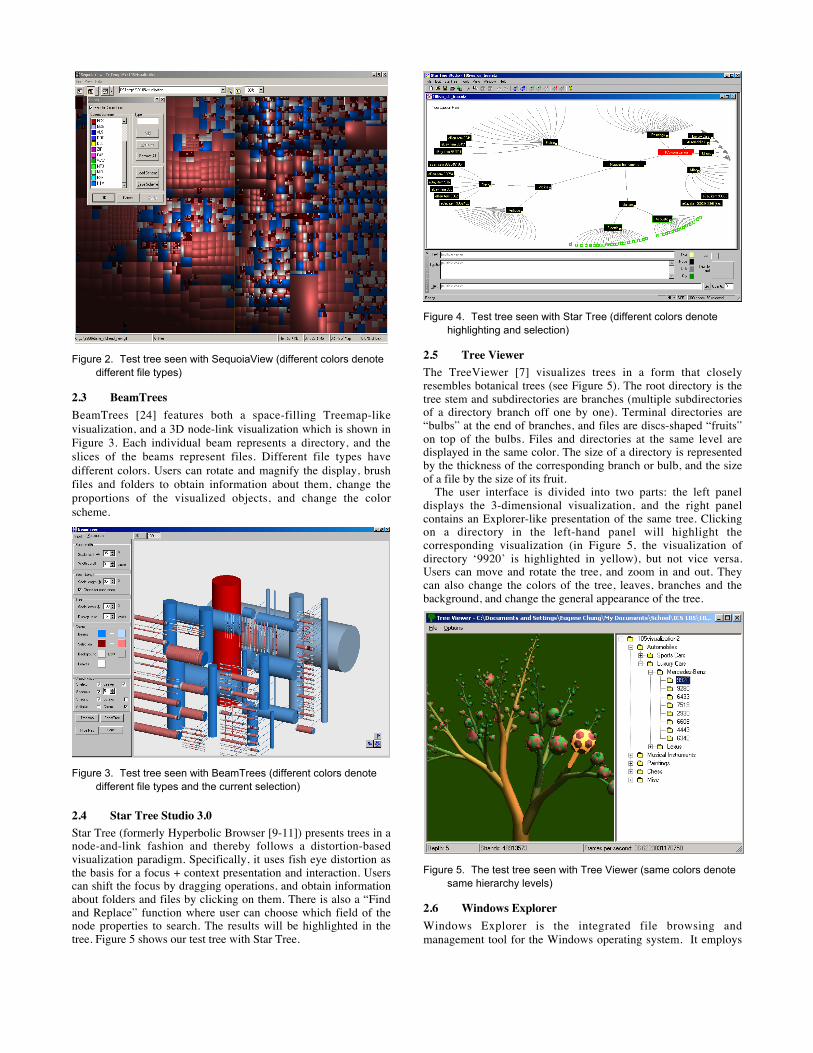
Figure 2. Test tree seen with SequoiaView (different colors denote
different file types)
2.3 BeamTreesBeamTrees [24] features both a space-filling Treemap-likevisualization, and a 3D node-link visualization which is shown inFigure 3. Each individual beam represents a directory, and theslices of the beams represent files. Different file types havedifferent colors. Users can rotate and magnify the display, brushfiles and folders to obtain information about them, change theproportions of the visualized objects, and change the colorscheme.
Figure 3. Test tree seen with BeamTrees (different colors denotedifferent file types and the current selection)
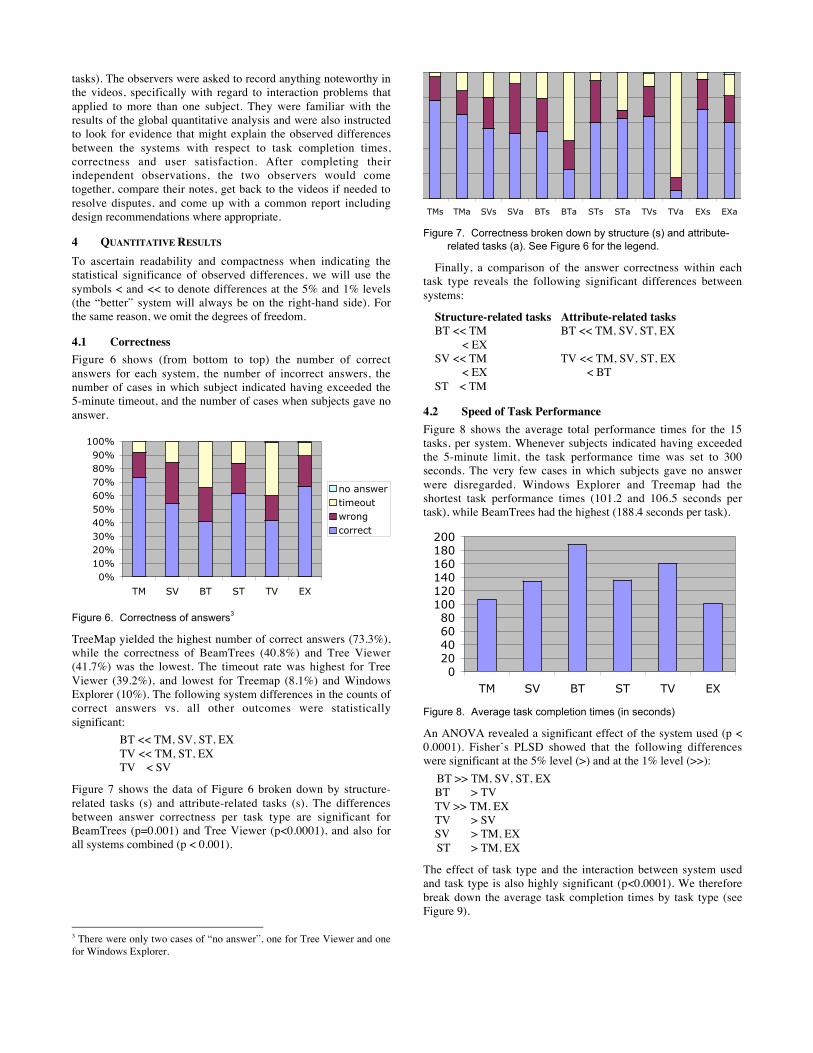
2.4 Star Tree Studio 3.0Star Tree (formerly Hyperbolic Browser [9-11]) presents trees in anode-and-link fashion and thereby follows a distortion-basedvisualization paradigm. Specifically, it uses fish eye distortion asthe basis for a focus + context presentation and interaction. Userscan shift the focus by dragging operations, and obtain informationabout folders and files by clicking on them. There is also a “Findand Replace” function where user can choose which field of thenode properties to search. The results will be highlighted in thetree. Figure 5 shows our test tree with Star Tree.
Figure 4. Test tree seen with Star Tree (different colors denotehighlighting and selection)
2.5 Tree ViewerThe TreeViewer [7] visualizes trees in a form that closelyresembles botanical trees (see Figure 5). The root directory is thetree stem and subdirectories are branches (multiple subdirectoriesof a directory branch off one by one). Terminal directories are“bulbs” at the end of branches, and files are discs-shaped “fruits”on top of the bulbs. Files and directories at the same level aredisplayed in the same color. The size of a directory is representedby the thickness of the corresponding branch or bulb, and the sizeof a file by the size of its fruit.
The user interface is divided into two parts: the left paneldisplays the 3-dimensional visualization, and the right panelcontains an Explorer-like presentation of the same tree. Clickingon a directory in the left-hand panel will highlight thecorresponding visualization (in Figure 5, the visualization ofdirectory ‘9920’ is highlighted in yellow), but not vice versa.Users can move and rotate the tree, and zoom in and out. Theycan also change the colors of the tree, leaves, branches and thebackground, and change the general appearance of the tree.
Figure 5. The test tree seen with Tree Viewer (same colors denotesame hierarchy levels)
2.6 Windows ExplorerWindows Explorer is the integrated file browsing andmanagement tool for the Windows operating system. It employs

an expandable tree structure to represent the directory hierarchy,folder icons to represent directories, and different icons torepresent files. For file management, Windows Explorer providesfunctions such as sorting, searching, and file detail viewing.
The window is divided into two panes. The left pane displays aview of the folder structure. The right pane shows details of thefiles and folders within a particular selected folder. Above thesetwo panes is a toolbar with shortcuts for controlling Explorerfeatures. The area along the bottom of the window givesinformation about objects currently selected within the folder andfile detail panes. A menu bar at the top of the window providesaccess to the full set of commands and options of WindowsExplorer.
3 EXPERIMENT
3.1 GoalsThe aim of the experiment was to determine whether solving tasksin the six systems differs with respect to task completion times,accuracy and user satisfaction, and why this may be the case. Thenull hypothesis was that there are no such differences. Thepurpose of the experiment was not to pit the systems against eachother, but rather to use observed quantitative differences as foci ofinterest in a subsequent qualitative analysis. A video analysis thatwas conducted as part of the experiment therefore aimed atidentifying problems that subjects seemed to encounter and, ifpossible, at relating them to the quantitative results. Such findingscan then provide an empirical basis for design recommendations.
3.2 Test HierarchyThe test hierarchy was a subset of a taxonomy of items on eBay.It contained 5 levels and a total of 5799 nodes. Figures 1-5 showthe hierarchy in the five different graphical visualization systems.The second-level subtrees were automobiles, musical instruments,paintings, chess, and miscellaneous (in order of the total numberof nodes). The specific subset was chosen since the node namesand their hierarchical relationships seemed easily understandablewithout special domain knowledge.
3.3 Tasks EmployedUsers had to solve 15 tasks in the test hierarchy. Tasks weregenerated and selected by the experimenters in an iterativebrainstorming process based on whether or not they wereinteresting and would naturally occur in the analysis of therespective data sets by a hypothetical eBay vendor, and would notrequire specific domain knowledge. The task selection was alsoinformed by a very early version of the InfoVis 2003 contesttasks. In some cases, questions had to be rephrased using a moretechnical terminology in order to make them unambiguous. Thefollowing 15 tasks were eventually selected:Q1. What is the maximum depth of the eBay hierarchy?Q2. Is the tree balanced or unbalanced? (A tree is unbalanced if its depth
in one branch is at least two more than in another branch).Q3. Find the name of the parent directory of the directory "BMW".Q4. Which directory has the greatest number of immediate
subdirectories?Q5. Which file was modified most recently?Q6. Find the total number of bottom-level directories under
"Automobiles".Q7. Which bottom-level directory of the eBay item hierarchy has the
largest number of files?Q8. Find a file of type .css and write down its name.Q9. Find the directory that contains the most .png type files.Q10. Find all files added on Feb. 19, 2003. Write down their file names.
Q11. Locate the file labeled 1990.htm.Q12. What is the name of the largest file in the eBay items hierarchy?Q13. Find the number of directories WITHOUT a file of type .js.Q14. Which directory includes a deeper hierarchy: "Flutes" or "Guitars"?Q15. Find the two duplicate occurrences of the directory "1869". Indicate
their pathnames.
Questions 1-4, 6, 7, 9, 14 and 15 refer to the structure of the treehierarchy, while Questions 5, 8 and 10-13 refer to attributes ofsubdirectories or files. In the following, we will refer to these twodifferent task types as “structure-related tasks” and “attribute-related tasks”.
3.4 Subjects48 subjects participated in the experiment. They were studentswith a major or minor in Information and Computer Science orEngineering who had at least one year of experience working withcomputers. Prior studies with the adoption of informationvisualization systems by administrative data analysts [4, 5] hadindicated that this subject population was reasonablyrepresentative for the target user group, due to the analyticalcapabilities they have in common. In another preliminaryexperiment, 20 sample subjects from the same population allranked in the 90th percentile in a half-hour online spatial abilitiestest by H. J. Eysenck (most of them even in the 95th percentile).2Spatial ability was consequently not controlled for any more inthe remainder of the experiment.
The data of one subject had to be discarded since this persondid not follow the instructions thoroughly enough.
3.5 Experimental DesignThe experiment took place in a small laboratory on the campus ofthe University of California, Irvine. A between-subjects designwas used, with the visualization system as the independentvariable. The 48 subjects were randomly assigned to one of thesix conditions. Groups of 2-4 students received half an hour ofinstruction on the visualization system they were assigned to, andfamiliarized themselves with the eBay hierarchy. Thereafter theysolved controlled practice tasks for another twenty minutes.During this practical training they received additional instructionfrom 2-3 experimenters.
Subjects then began the experiment. They had to answer eachof the 15 questions, write down the answer(s), and self-time theduration of task completion. Subjects were instructed to abortunsolved tasks after 5 minutes and to note down this fact. Theirinteraction was recorded by screen capture software. At the end ofthe experiment, they completed a final satisfaction questionnairefor about 10 minutes.
In the quantitative analysis, the correctness of users' taskperformance and their task completion times were measuredbased on their answers in the answer sheet. The user satisfactiondata were taken from the final questionnaire. A pair-wise Chisquare test was performed to measure the effect of the systemused on task correctness, and an ANOVA (with Fisher's PLSD) toanalyze the system effect on task completion times and usersatisfaction. All significant differences found will be discussedbelow.
In the qualitative video analysis, two observers independentlywatched the recording of subjects’ screen interaction during theexperiment (they also viewed the preceding controlled practice 2 The result is not very surprising since “proficiency in spatial ability haslong been associated with success in cognitively demanding educationaltracks and occupations such as engineering, architecture, physics,chemistry, and medical surgery” [20].
tasks). The observers were asked to record anything noteworthy inthe videos, specifically with regard to interaction problems thatapplied to more than one subject. They were familiar with theresults of the global quantitative analysis and were also instructedto look for evidence that might explain the observed differencesbetween the systems with respect to task completion times,correctness and user satisfaction. After completing theirindependent observations, the two observers would cometogether, compare their notes, get back to the videos if needed toresolve disputes, and come up with a common report includingdesign recommendations where appropriate.
4 QUANTITATIVE RESULTS
To ascertain readability and compactness when indicating thestatistical significance of observed differences, we will use thesymbols < and << to denote differences at the 5% and 1% levels(the “better” system will always be on the right-hand side). Forthe same reason, we omit the degrees of freedom.
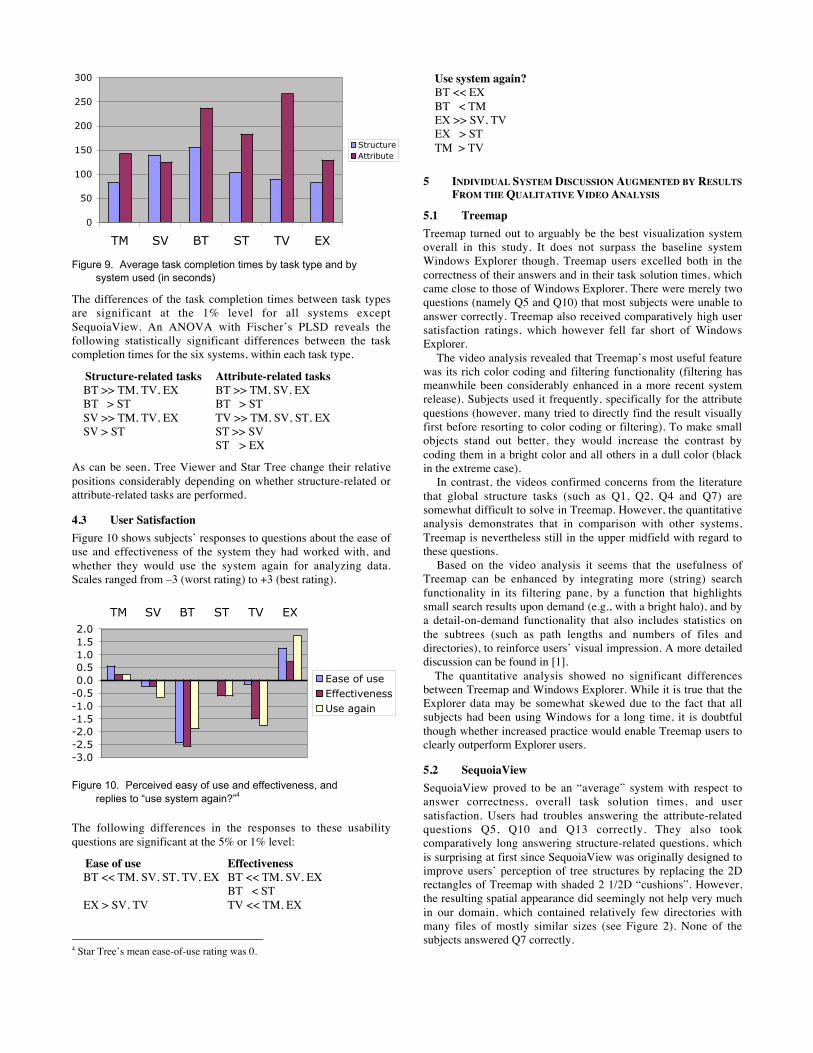
4.1 CorrectnessFigure 6 shows (from bottom to top) the number of correctanswers for each system, the number of incorrect answers, thenumber of cases in which subject indicated having exceeded the5-minute timeout, and the number of cases when subjects gave noanswer.
0%10%20%30%40%50%60%70%80%90%
100%
TM SV BT ST TV EX
no answertimeoutwrongcorrect
Figure 6. Correctness of answers3
TreeMap yielded the highest number of correct answers (73.3%),while the correctness of BeamTrees (40.8%) and Tree Viewer(41.7%) was the lowest. The timeout rate was highest for TreeViewer (39.2%), and lowest for Treemap (8.1%) and WindowsExplorer (10%). The following system differences in the counts ofcorrect answers vs. all other outcomes were statisticallysignificant:
BT << TM, SV, ST, EXTV << TM, ST, EXTV < SV
Figure 7 shows the data of Figure 6 broken down by structure-related tasks (s) and attribute-related tasks (s). The differencesbetween answer correctness per task type are significant forBeamTrees (p=0.001) and Tree Viewer (p<0.0001), and also forall systems combined (p < 0.001).
3 There were only two cases of “no answer”, one for Tree Viewer and onefor Windows Explorer.
TMs TMa SVs SVa BTs BTa STs STa TVs TVa EXs EXa
Figure 7. Correctness broken down by structure (s) and attribute-related tasks (a). See Figure 6 for the legend.
Finally, a comparison of the answer correctness within eachtask type reveals the following significant differences betweensystems:
Structure-related tasks Attribute-related tasksBT << TM BT << TM, SV, ST, EX
< EXSV << TM TV << TM, SV, ST, EX
< EX < BTST < TM
4.2 Speed of Task PerformanceFigure 8 shows the average total performance times for the 15tasks, per system. Whenever subjects indicated having exceededthe 5-minute limit, the task performance time was set to 300seconds. The very few cases in which subjects gave no answerwere disregarded. Windows Explorer and Treemap had theshortest task performance times (101.2 and 106.5 seconds pertask), while BeamTrees had the highest (188.4 seconds per task).
020406080100120140160180200
TM SV BT ST TV EX
Figure 8. Average task completion times (in seconds)
An ANOVA revealed a significant effect of the system used (p <0.0001). Fisher’s PLSD showed that the following differenceswere significant at the 5% level (>) and at the 1% level (>>):
BT >> TM, SV, ST, EXBT > TVTV >> TM, EXTV > SVSV > TM, EXST > TM, EX
The effect of task type and the interaction between system usedand task type is also highly significant (p<0.0001). We thereforebreak down the average task completion times by task type (seeFigure 9).
0
50
100
150
200
250
300
TM SV BT ST TV EX
StructureAttribute
Figure 9. Average task completion times by task type and bysystem used (in seconds)
The differences of the task completion times between task typesare significant at the 1% level for all systems exceptSequoiaView. An ANOVA with Fischer’s PLSD reveals thefollowing statistically significant differences between the taskcompletion times for the six systems, within each task type.
Structure-related tasks Attribute-related tasksBT >> TM, TV, EX BT >> TM, SV, EXBT > ST BT > STSV >> TM, TV, EX TV >> TM, SV, ST, EXSV > ST ST >> SV
ST > EX
As can be seen, Tree Viewer and Star Tree change their relativepositions considerably depending on whether structure-related orattribute-related tasks are performed.
4.3 User SatisfactionFigure 10 shows subjects’ responses to questions about the ease ofuse and effectiveness of the system they had worked with, andwhether they would use the system again for analyzing data.Scales ranged from –3 (worst rating) to +3 (best rating).
-3.0-2.5-2.0-1.5-1.0-0.50.00.51.01.52.0
TM SV BT ST TV EX
Ease of useEffectivenessUse again
Figure 10. Perceived easy of use and effectiveness, andreplies to “use system again?”4
The following differences in the responses to these usabilityquestions are significant at the 5% or 1% level:
Ease of use EffectivenessBT << TM, SV, ST, TV, EX BT << TM, SV, EX
BT < STEX > SV, TV TV << TM, EX
4 Star Tree’s mean ease-of-use rating was 0.
Use system again?BT << EXBT < TMEX >> SV, TVEX > STTM > TV
5 INDIVIDUAL SYSTEM DISCUSSION AUGMENTED BY RESULTSFROM THE QUALITATIVE VIDEO ANALYSIS
5.1 TreemapTreemap turned out to arguably be the best visualization systemoverall in this study. It does not surpass the baseline systemWindows Explorer though. Treemap users excelled both in thecorrectness of their answers and in their task solution times, whichcame close to those of Windows Explorer. There were merely twoquestions (namely Q5 and Q10) that most subjects were unable toanswer correctly. Treemap also received comparatively high usersatisfaction ratings, which however fell far short of WindowsExplorer.
The video analysis revealed that Treemap’s most useful featurewas its rich color coding and filtering functionality (filtering hasmeanwhile been considerably enhanced in a more recent systemrelease). Subjects used it frequently, specifically for the attributequestions (however, many tried to directly find the result visuallyfirst before resorting to color coding or filtering). To make smallobjects stand out better, they would increase the contrast bycoding them in a bright color and all others in a dull color (blackin the extreme case).
In contrast, the videos confirmed concerns from the literaturethat global structure tasks (such as Q1, Q2, Q4 and Q7) aresomewhat difficult to solve in Treemap. However, the quantitativeanalysis demonstrates that in comparison with other systems,Treemap is nevertheless still in the upper midfield with regard tothese questions.
Based on the video analysis it seems that the usefulness ofTreemap can be enhanced by integrating more (string) searchfunctionality in its filtering pane, by a function that highlightssmall search results upon demand (e.g., with a bright halo), and bya detail-on-demand functionality that also includes statistics onthe subtrees (such as path lengths and numbers of files anddirectories), to reinforce users’ visual impression. A more detaileddiscussion can be found in [1].
The quantitative analysis showed no significant differencesbetween Treemap and Windows Explorer. While it is true that theExplorer data may be somewhat skewed due to the fact that allsubjects had been using Windows for a long time, it is doubtfulthough whether increased practice would enable Treemap users toclearly outperform Explorer users.
5.2 SequoiaViewSequoiaView proved to be an “average” system with respect toanswer correctness, overall task solution times, and usersatisfaction. Users had troubles answering the attribute-relatedquestions Q5, Q10 and Q13 correctly. They also tookcomparatively long answering structure-related questions, whichis surprising at first since SequoiaView was originally designed toimprove users’ perception of tree structures by replacing the 2Drectangles of Treemap with shaded 2 1/2D “cushions”. However,the resulting spatial appearance did seemingly not help very muchin our domain, which contained relatively few directories withmany files of mostly similar sizes (see Figure 2). None of thesubjects answered Q7 correctly.
The video analysis confirmed that subjects had indeed problemswith structure-related questions, specifically regarding level andsibling detection. To figure out the tree structure, users tended tomove the mouse around (to prompt the system to delineate thecurrent file and embedding directory), or would use the depth-limiting function that the system provides.
Subjects frequently employed SequoiaView’s powerful filteringmechanisms (even though its interface challenged them quite abit); system functions that deliver meta-information about thecurrent file or directory (such as its path, number of files andsubdirectory, creation date, etc.); and options for changing themaximum visible depth of the tree. They used color coding farless than Treemap users, which may be explained by the fact thatit is far less powerful than in Treemap.
Setting filter options, color options or a maximum depth inSequoiaView introduces a hidden state, and there is no indicationof this state at the interface level nor a reset button to return to a“factory configuration”. We saw that a majority of usersoccasionally forgot the current state. Sometimes they would recallit after running into problems and losing time, but sometimes theywould also inadvertently make mistakes. More observed problemsand design recommendations are discussed in [1].
5.3 BeamTreesBeamTrees arguably achieved the worst quantitative results in ourexperiment, both with respect to correctness, task performancetimes and user satisfaction. Figure 7 shows however that as far asthe correctness of structure-related tasks is concerned, BeamTreescompares quite well with other systems.
The video analysis confirms these quantitative results andprovides more insights into the underlying reasons. The visualrepresentation of local structural relationships certainly belongs tothe strengths of the system. Users had few problems answeringQ1-Q4 and also did this comparatively quickly. They had farmore troubles though analyzing global structures in the 3Dvisualization, which seems to be due to the fact that beams at thesame level did not appear to be at the same level in thevisualization, and vice versa. This problem affected particularlyquestions like Q2. A second problem for global structure-relatedtasks may have been the fact that the lengths and sizes of beamsbear little relationship with properties of the visualized directories.The reason for users’ problems with attribute-related questions,finally, is mostly the lack of functionality beyond the display ofpath and size information.
Current strengths of the system that are usually frequentlyexploited by users include magnification, rotation andhighlighting of beams, and “tooltips” that give limited informationabout beams and disks within beams. Users seemingly missed anundo function and/or a system reset option. [1] makes a number ofadditional design recommendations.
5.4 Star TreeThe Star Tree performance was “average”, not only on a globallevel but also for nearly every individual question. The only majorexceptions are Q5, Q6, Q7, Q9 and Q12, for which the correctnesswas very low. These tasks require subjects to rotate the treestructure in order to scan bottom-level files and directories, andfor some tasks to additionally obtain file details that are notvisually represented. The videos showed that subjects overlookedsubtrees and files when performing these operations. Some userswould occasionally try to better visualize the tree structure byusing the “Bottom Orientation” instead (which puts the root nodeon top rather than the center). We noticed though that deep
subtrees were nevertheless too much splayed over to the sides,requiring users to still rotate along the tree structure to browse it,and thereby making errors.
Another problem that we noticed is that nodes with the samedistance from the center are not necessarily on the same tree level.This makes comparisons not entirely trivial and thus counting oflevels is sometimes needed. Like in BeamTrees, users overall hadfew problems though solving local search problems once theyidentified the right neighborhood, and parent-child relationshipswere very easy to see.
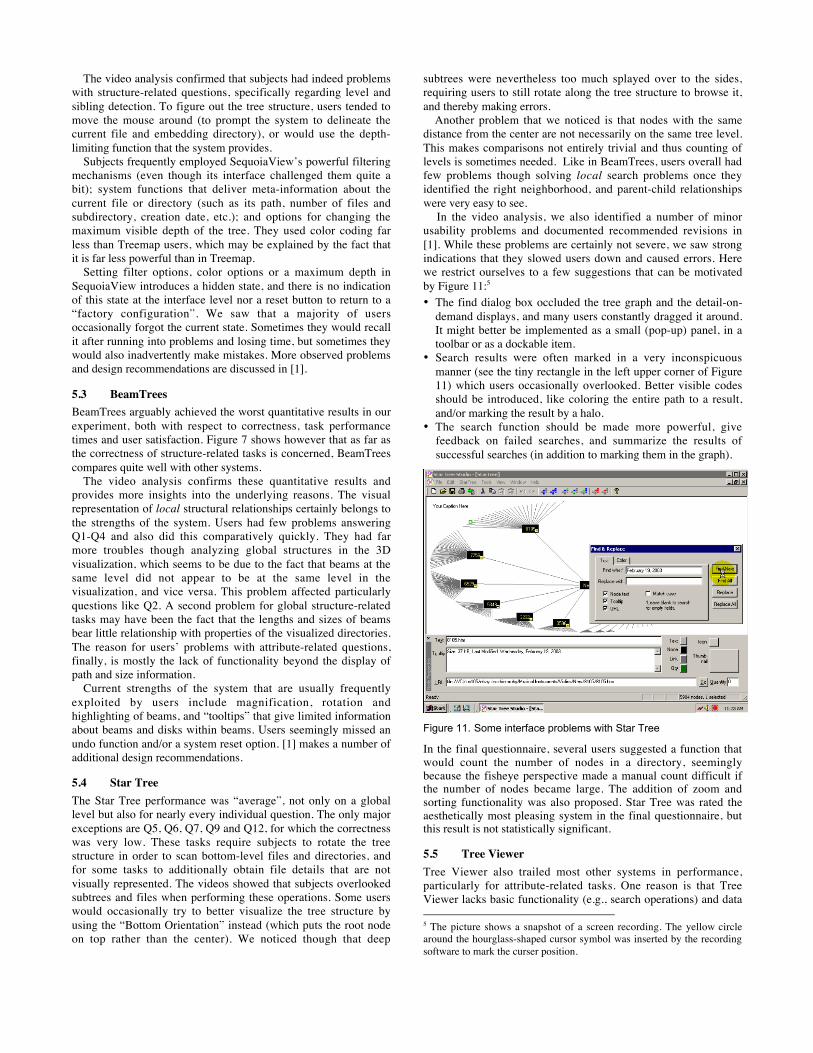
In the video analysis, we also identified a number of minorusability problems and documented recommended revisions in[1]. While these problems are certainly not severe, we saw strongindications that they slowed users down and caused errors. Herewe restrict ourselves to a few suggestions that can be motivatedby Figure 11:5
• The find dialog box occluded the tree graph and the detail-on-demand displays, and many users constantly dragged it around.It might better be implemented as a small (pop-up) panel, in atoolbar or as a dockable item.
• Search results were often marked in a very inconspicuousmanner (see the tiny rectangle in the left upper corner of Figure11) which users occasionally overlooked. Better visible codesshould be introduced, like coloring the entire path to a result,and/or marking the result by a halo.
• The search function should be made more powerful, givefeedback on failed searches, and summarize the results ofsuccessful searches (in addition to marking them in the graph).
Figure 11. Some interface problems with Star Tree
In the final questionnaire, several users suggested a function thatwould count the number of nodes in a directory, seeminglybecause the fisheye perspective made a manual count difficult ifthe number of nodes became large. The addition of zoom andsorting functionality was also proposed. Star Tree was rated theaesthetically most pleasing system in the final questionnaire, butthis result is not statistically significant.
5.5 Tree ViewerTree Viewer also trailed most other systems in performance,particularly for attribute-related tasks. One reason is that TreeViewer lacks basic functionality (e.g., search operations) and data 5 The picture shows a snapshot of a screen recording. The yellow circlearound the hourglass-shaped cursor symbol was inserted by the recordingsoftware to mark the curser position.
displays (e.g., of file attributes) that are required or at least veryhelpful in some tasks. Subjects therefore found Q5 and Q7-Q13impossible or extremely difficult to answer.
The video recordings revealed that Tree Viewer’s Explorer-likelisting of directories on the right-hand side was used veryfrequently (subjects also indicated this in the final questionnaire).On the one hand, this Explorer-like panel was employed in alltasks that cannot be answered in the tree visualization at all, oronly in a very cumbersome manner (such as when the solutionwas visible in the tree, but the answer still required finding itsname, which was difficult since there was no direct link from thevisualization into the Explorer hierarchy but only in the oppositedirection). On the other hand, the directory panel was alsofrequently used for questions like Q14, which one would expect tobe solved in the visualization proper. The reason for relying onthe directory nesting seems that continuing branches representinga directory cannot be easily followed at the branching points. Tofigure out what part of a branch constitutes a directory, subjectswould click on the directory in the Explorer panel, and thenfrequently remain in this panel to complete the task.
An unexpected result of the video analysis was that users ofTree Viewer had serious troubles with Q2: those who tried thevisualization all got the answer wrong while those who used theExplorer-like panel all got it right. The quantitative data hadoriginally not identified this question as a problem spot. Q2 isindeed very hard to answer in the visualization. In general, thetree does appear to be fairly balanced. The different sizes ofbranches, the turns that branches take, the fact that same-levelbranches split off at different heights, and finally the occlusion ofbranches all make it difficult to tell which two branches are onequal levels. While these characteristics make the visualizationmore natural in appearance, the end result is that users have a hardtime assessing the global structural characteristics of a tree.
Design recommendations based on the video analysis includedetail-on-demand for tree constituents, two-way tight couplingbetween the tree visualization and the Explorer panel, more color-coding options, search facilities, and the possibility for left/rightshifts of the visualization. For more details and additionalrecommendations see [1].
The rating for aesthetical appeal of Tree Viewer was slightlyabove average (0.25 on a scale from –3 to 3). However, thestandard deviation of these ratings was by far the highest for allsystems (1.98). User comments ranged from “I like the treedesign” to “I hate this tree”.
5.6 Windows ExplorerWindows Explorer showed a very good overall performance, bothwith regard to correctness, speed of task completion, and usersatisfaction. Any comparison with other systems must be viewedwith a grain of salt though since the subjects can be assumed to behighly skilled at least in its basic functionality. On the other hand,one should not overestimate the potential practice effects for theother systems since all tested visualization systems are relativelysimple and since the training was quite thorough.
Explorer users had considerable difficulties with Q13 since itrequired expanding and scanning all directories until a solution isfound. None of our subjects was able to solve the problem. Forsimilar reasons, they also had troubles with Q7. They also did notwell for Q2, which required them to compare the depth ofdifferent subtrees.
6 RELATED WORK
[8] compared three commercial information visualization systemsfor multidimensional data with respect to task completion timesand error rate. [12-14] extended this comparison to two differentforms of synchronous collaborative data visualization. [26]analyzes the extent to which three 3-D browsers for hierarchiessupport the seven central tasks of information visualizationsystems postulated by [22].
[23] compared two space-filling visualizations for directoryhierarchies with regard to task correctness, task completion timesand user satisfaction: a Treemap-style visualization, and Sunburstwhich depicts hierarchies in concentric rings. The innermost ringthereby represents the root directory, and is divided into sectorswhose angles correspond to the sizes of its files andsubdirectories. The angles of subdirectory sectors are thenprojected onto the next outer ring and become again subdivided inthe described way. While participants in the study preferred thecircular visualization, the quantitative results of the study wereinconclusive.
[2] compared four different visualization paradigms (amongthem a Treemap-like approach) with respect to their ability tocommunicate the topology of the tree and support comparisons ofnode size. The Treemap-style visualization turned out to be theslowest for most tasks.
It is difficult though to compare these two results aboutTreemap-like visualizations with our findings for Treemap 3.2since the visualizations used are too different. The tested proto-types in these studies were not full-fledged visualization systemsas in our case, but merely demonstrated the “bare bones” of thedifferent visualization paradigms. For instance, Treemap 3.2 usessuperpositioned hierarchical bars with directory labels that makethe hierarchical structure more noticeable. This is completelylacking in the simplified reconstruction of [23] and [2].
[19] compared an older version of Star Tree, WindowsExplorer, and SpaceTree which is a graph visualizer that allowssubtrees to be dynamically expanded and contracted. The authorsfound statistically significant differences in the error rates andtask completion times of different task types and were often ableto explain them by properties of the visualizations that facilitatedor impaired these tasks. No general pattern across task types couldbe found though.
[3, 11, 16] evaluated various versions of Star View andstandard 2-D browsers similar to Windows Explorer, but wereunable to find performance differences. [16-18] foundperformance gains of Star View though when the informationscent (i.e., clues to the direction and proximity of soughtinformation) was high, and performance losses otherwise. Finally,The Great CHI ’97 Browse-Off contest [15] yielded Star View asthe winner, ahead of Windows Explorer. [18] shows however thatindividual differences between subjects have a considerablehigher effect on performance than differences between the twobrowsers, which may explain this outcome.
7 SUMMARY AND CONCLUSION
This study compared several information visualization systems fortree hierarchies in a between-subjects experiment. It unveiledstatistically significant differences with respect to accuracy of taskperformance, task completion times and user satisfaction. Itexplained differences by referring to characteristics of thevisualization paradigm, interface problems and missingfunctionality that make certain types of tasks difficult and/or slowdown users. The study also showed a significant interaction
between system used, and structure-related versus attribute-relatedtask types.
While at least one system achieved the same performance asWindows Explorer, none of them showed benefits for users thatwent significantly beyond this baseline. The systems are alsostand-alone rather than tightly integrated (e.g. into a file orwebsite management system). [4, 5] however found that theintegration into users’ current work environment is an extremelyimportant factor for the adoption of a visualization system by dataanalysts.
Two more conclusions can be drawn from the results, whichmay be relevant for future experiments. First, this study showedthe merits of distinguishing structure and attribute-related tasks,for which some systems behave differently. So far, onlylocal/global retrieval/comparison tasks have been distinguished inpure concept hierarchies [16-18]. It is unclear though whether thedetected performance differences of all systems in these two tasktypes can be attributed to a higher innate difficulty of attribute-related tasks, or due to the fact that the design of currentvisualization systems lends itself more to the appropriatevisualization of structure than the appropriate visualization ofattributes (which is somewhat at odds with the fact that Explorersubjects exhibited the same differences).
A second observation that may have consequences for futureexperiments is that the extreme outliers in the Tree Viewer andBeamTrees data have mostly been caused by a lack offunctionality beyond the pure visualization. Once this problem iscorrected, the effect size of differences in the visualizationparadigms is likely to become smaller. This fact will have to betaken into account when planning the design, and specifically thesample size, of future experiments with tree visualization systems.
REFERENCES
[1] F. Agagu, R. Krishna, S. Ratanotayanon, I. Seredkin, N. Su, S. Sun,S. Tandon, Z. Tang, and M. Yeh, "Video Analysis of TreeVisualisation Systems," School of Information and ComputerScience, University of California, Irvine, CA, Memo 2004.
[2] T. Barlow and P. Neville, "A Comparison of 2-D Visualizations ofHierarchies", IEEE InfoVis, San Diego, CA, 2001, pp. 131-138.
[3] M. P. Czerwinski and K. Larson, "The New Web Browsers: They’reCool But are They Useful?" People and Computers XII: Proceedingsof the HCI ’97 Conference, 1997
[4] V. González and A. Kobsa, "Benefits of Information VisualizationSystems for Administrative Data Analysts", Sixth InternationalConference on Information Visualisation (IV03), London, England,2003, pp. 331-336. http://www.ics.uci.edu/~kobsa/papers/2003-IV-kobsa.pdf
[5] V. González and A. Kobsa, "A Workplace Study of the Adoption ofInformation Visualization Systems", I-KNOW'03: 3rd InternationalConference on Knowledge Management, Graz, Austria, 2003.http://www.ics.uci.edu/~kobsa/papers/2003-KIV-kobsa.pdf
[6] B. Johnson and B. Shneiderman, "Treemaps: A Space-fillingApproach to the Visualization of Hierarchical Information", IEEEVisualization'91, San Diego, CA, 1991, pp. 284-291.
[7] E. Kleiberg, H. van de Wetering, and J. J. van Wijk, "BotanicalVisualization of Huge Hierarchies", InfoVis 2001: IEEE Symposiumon Information Visualization, San Diego, CA, 2001, pp. 87-94.
[8] A. Kobsa, "An Empirical Comparison of Three CommercialInformation Visualization Systems", IEEE Symposium onInformation Visualization, San Diego, CA, 2001, pp. 123-130.http://www.ics.uci.edu/~kobsa/papers/2001-INFOVIS-kobsa.pdf
[9] J. Lamping and R. Rao, "The Hyperbolic Browser: A Focus +Context Technique for Visualizing Large Hierarchies," Journal ofVisual Languages and Computing, vol. 7, pp. 33-55, 1996.
[10] J. Lamping, R. Rao, and P. Pirolli, "A Focus+Context TechniqueBased in Hyperbolic Geometry for Visualizing Large Hierarchies",CHI'95 ACM Conference on Human Factors in Computing Systems,1991, pp. 189-194.
[11] J. Lamping, R. Rao, and P. Pirolli, "A Focus + Context TechniqueBased on Hyperbolic Geometry for Visualizing Large Hierarchies",CHI’95, ACM Conference on Human Factors in ComputingSystems, Denver, CO, 1995, pp. 401-408.
[12] G. Mark, K. Carpenter, and A. Kobsa, "A Model of SynchronousCollaborative Information Visualization", Sixth InternationalConference on Information Visualisation (IV03), London, England,2003, pp. 373-381. http://www.ics.uci.edu/~kobsa/papers/2003-IV-mark-kobsa.pdf
[13] G. Mark and A. Kobsa, "The Effects of Collaboration and SystemTransparency on CIVE Usage: An Empirical Study and Model,"Presence, vol. 14, 2005, http://www.ics.uci.edu/~kobsa/papers/2005-presence-kobsa.pdf
[14] G. Mark, A. Kobsa, and V. González, "Do Four Eyes See Better thanTwo? Collaborative versus Individual Discovery in Data Visuali-zation Systems", Proceedings of the Sixth International Conferenceon Information Visualisation, London, England, 2002, 249-255.http://www.ics.uci.edu/~kobsa/papers/2002-IV-kobsa.pdf
[15] K. Mullet, C. Fry, and D. Schiano, "On Your Marks, Get Set,Browse! (The Great CHI'97 Browse Off)", Human Factors inComputing Systems, CHI ’97 (Extended Abstracts), Atlanta, GA,1997. http://www.acm.org/sigchi/chi97/proceedings/panel/kem.htm
[16] P. Pirolli, S. K. Card, and M. M. Van Der Wege, "The Effect ofInformation Scent on Searching Information Visualizations of LargeTree Structures", Advanced Visual Interfaces, AVI 2000, Palermo,Italy, 2000, pp. 261-272.
[17] P. Pirolli, S. K. Card, and M. M. Van Der Wege, "VisualInformation Foraging in a Focus + Context Visualization", CHI-2001, Seattle, WA, 2001
[18] P. Pirolli, S. K. Card, and M. M. Van Der Wege, "The Effects ofInformation Scent on Visual Search in the Hyperbolic TreeBrowser," ACM Transactions on Computer-Human Interaction(TOCHI), vol. 10, pp. 20-53, 2003.
[19] C. Plaisant, J. Grosjean, and B. B. Bederson, "SpaceTree:Supporting Exploration in Large Node Link Tree, Design Evolutionand Empirical Evaluation", IEEE Symposium on InformationVisualization (InfoVis'02), Boston, MA, 2002, pp. 57-64.
[20] D. L. Shea, D. Lubinski, and C. P. Benbow, "Importance ofAssessing Spatial Ability in Intellectually Talented YoungAdolescents: A 20-Year Longitudinal Study," Journal ofEducational Psychology, vol. 93, pp. 604-614, 2001.
[21] B. Shneiderman, "Tree Visualization with Tree-Maps: 2-D Space-Filling Approach," ACM Transactions on Graphics, vol. 11, pp. 92-99, 1992.
[22] B. Shneiderman, "The Eyes Have It: a Task by Data TypeTaxonomy for Information Visualizations", IEEE Symposium onVisual Languages, Boulder, CO, 1996, pp. 336-333.
[23] John T. Stasko, R. Catrambone, M. Guzdial, and K. McDonald, "AnEvaluation of Space-Filling Information Visualizations for DepictingHierarchical Structures," International Journal of Human-ComputerStudies, vol. 53, pp. 663-694, 2000.
[24] F. van Ham and J. J. van Wijk, "Beamtrees: Compact Visualizationof Large Hierarchies", InfoVis 2002, Boston, MA, 2002, pp. 93-100.
[25] J. J. van Wijk and H. van de Wetering, "Cushion Treemaps:Visualization of Hierarchical Information", IEEE Symposium onInformation Visualization (INFOVIS’99), San Francisco, CA, 1999
[26] U. Wiss, D. A. Carr, and H. Jonsson, "Evaluating Three-Dimensional Information Visualization Designs: a Case Study ofThree Designs", IEEE Conference on Information Visualization,London, England, 1998, pp. 137 -144.
Related Documents