Use of Secondary Ion Mass Spectrometry (SIMS) to identify fly ash mineral spatial and particulate distribution in epoxy polymer Shahad Ibraheem a , Sheila Devasahayam b , Owen Standard a , Sri Bandyopadhyay a, ⁎ a UNSW Australia, School of Materials Science & Engineering, b Federation University of Australia, FOST, Ballarat, Australia abstract article info Article history: Received 30 September 2014 Received in revised form 27 April 2015 Accepted 29 April 2015 Available online xxxx Keywords: Fly ash–epoxy composites SIMS EDS Dispersion Fly ash from coal power stations consists typically of a series of oxide minerals. These minerals can have beneficial effects when used as reinforcement in a plastic matrix. In this work the advanced technique SIMS has been utilised to identify the spatial distribution of the various minerals in fly ash in an epoxy matrix with fly ash weights of 10% and 50%. It is observed that SIMS, which can scan normally to a precision of 0.5 to 0.05 wt.%, could positively identify the distribution of the fly ash mineral elements in the epoxy. Attempts were also made to identify the fly ash element distribution in the epoxy using a composition analysis method, namely, EDS. However, it is observed that in the present fly ash–epoxy composites, EDS could not identify the fly ash elements demonstrating SIMS is a much preferred identification technique than the popular EDS method. © 2015 Elsevier B.V. All rights reserved. 1. Introduction Fly ash (FA) is a ‘waste by-product’ from coal electric power stations. Owing to being very cheap, light weight, abundantly available as waste material and equivalent or superior to other virgin ceramic oxide mate- rials (The American Coal Ash Association (ACAA); Raask, 1968), FA is used as reinforcement in cement/concrete, flowable fill, bricks/roofing tiles, structural fill/embankment road base/sub-base, paints, mineral fill, blasting grit, mining applications, gypsum panel products, waste stabilization, aggregate, and as filler in wood and plastic products (McKerall et al., 1982). The most commonly used thermoset plastic in polymer matrix com- posites (PMC) is epoxy resin (Singla and Chawla, 2010). It is a thermoset- ting polymer formed by the reaction typically of a low molecular weight chain with the diamine “hardener” (Wikipedia, 2012). The resin consists of short chain polymers with an epoxide group at either end (Wikipedia, 2012). Epoxy resins have low curing shrinkage [typically 2–3%] due to the reaction products which are not given off when they cure (Singla and Chawla, 2010). Generally, epoxy resins are produced by reaction between epichlorohydrin and bisphenol-A (Singla and Chawla, 2010; Wikipedia, 2012; Epoxy Resins. http://pslc.ws/macrog/epoxy.htm). Epoxies are attractive as structural matrix materials thanks to their excellent adhesion to other materials, high chemical & heat resistance, as well as good mechanical properties (Singla and Chawla, 2010; Crosslinking, 2005) together with electrical insulating characteristics (Singla and Chawla, 2010; Crosslinking, 2005). Due to their excellent material properties ep- oxies find applications in optoelectronics, dentistry, industrial tooling, re- pair material for marine applications, as well as paints and coatings (http://www.wisegeek.com/what-is-epoxy-resin.htm; Srivastava and Shembekar, 1990). Fly ash as filler in epoxy matrix helps further improve the resulting polymer properties (Kishore, 2001; Von Ardenne, 1938), at the same time reducing the cost of the composite product (Kishore, 2001) and the weight (Singla and Chawla, 2010). The structure and properties of reinforcement matrix interface plays a major role in mechanical and physical properties of the composite materials. This is because the large difference between the elastic properties of the matrix and rein- forcement has to be communicated through interface (Singla and Chawla, 2010). The distribution/dispersion of the different elements in the fly ash in the polymer matrix would thus enhance the mechanical and physical properties of the composite materials. Secondary Ion Mass Spectroscopy (SIMS) is a highly sensitive surface analysis technique because it can detect elements present in parts per billion ranges (http://en.wikipedia.org/wiki/Secondary_ion_mass_ spectrometry). SIMS technique is now being used in materials science and surface science, to analyze the composition of solid surfaces and thin films and to determine the spatial distribution of phases in compos- ites (http://www.appropedia.org/Secondary_Ion_Mass_Spectroscopy_ at_Western_University#Introduction). Dynamic SIMS has been used in this work. In Dynamic SIMS, using high-energy and high primary beam densities a volume of a 100 to 1000 μm 3 is analyzed. Worth noting in static SIMS using low energy and low primary beam densities, the material sputtered is exceedingly small, with surface mono-layers lasting hours or days. International Journal of Mineral Processing xxx (2015) xxx–xxx ⁎ Corresponding author. E-mail address: [email protected] (S. Bandyopadhyay). MINPRO-02750; No of Pages 8 http://dx.doi.org/10.1016/j.minpro.2015.04.025 0301-7516/© 2015 Elsevier B.V. All rights reserved. Contents lists available at ScienceDirect International Journal of Mineral Processing journal homepage: www.elsevier.com/locate/ijminpro Please cite this article as: Ibraheem, S., et al., Use of Secondary Ion Mass Spectrometry (SIMS) to identify fly ash mineral spatial and particulate distribution in epoxy polymer, Int. J. Miner. Process. (2015), http://dx.doi.org/10.1016/j.minpro.2015.04.025

Welcome message from author
This document is posted to help you gain knowledge. Please leave a comment to let me know what you think about it! Share it to your friends and learn new things together.
Transcript

International Journal of Mineral Processing xxx (2015) xxx–xxx
MINPRO-02750; No of Pages 8
Contents lists available at ScienceDirect
International Journal of Mineral Processing
j ourna l homepage: www.e lsev ie r .com/ locate / i jm inpro
Use of Secondary Ion Mass Spectrometry (SIMS) to identify fly ashmineral spatial and particulate distribution in epoxy polymer
Shahad Ibraheem a, Sheila Devasahayam b, Owen Standard a, Sri Bandyopadhyay a,⁎a UNSW Australia, School of Materials Science & Engineering,b Federation University of Australia, FOST, Ballarat, Australia
⁎ Corresponding author.E-mail address: [email protected] (S. Ba
http://dx.doi.org/10.1016/j.minpro.2015.04.0250301-7516/© 2015 Elsevier B.V. All rights reserved.
Please cite this article as: Ibraheem, S., et al.distribution in epoxy polymer, Int. J. Miner.
a b s t r a c t
a r t i c l e i n f oArticle history:Received 30 September 2014Received in revised form 27 April 2015Accepted 29 April 2015Available online xxxx
Keywords:Fly ash–epoxy compositesSIMSEDSDispersion
Fly ash fromcoal power stations consists typically of a series of oxideminerals. Theseminerals can have beneficialeffects when used as reinforcement in a plastic matrix. In this work the advanced technique SIMS has beenutilised to identify the spatial distribution of the various minerals in fly ash in an epoxy matrix with fly ashweights of 10% and 50%. It is observed that SIMS, which can scan normally to a precision of 0.5 to 0.05 wt.%,could positively identify the distribution of the fly ash mineral elements in the epoxy. Attempts were alsomade to identify the fly ash element distribution in the epoxy using a composition analysis method, namely,EDS. However, it is observed that in the present fly ash–epoxy composites, EDS could not identify the fly ashelements demonstrating SIMS is a much preferred identification technique than the popular EDS method.
© 2015 Elsevier B.V. All rights reserved.
1. Introduction
Fly ash (FA) is a ‘waste by-product’ from coal electric power stations.Owing to being very cheap, light weight, abundantly available as wastematerial and equivalent or superior to other virgin ceramic oxide mate-rials (The American Coal Ash Association (ACAA); Raask, 1968), FA isused as reinforcement in cement/concrete, flowable fill, bricks/roofingtiles, structural fill/embankment road base/sub-base, paints, mineralfill, blasting grit, mining applications, gypsum panel products, wastestabilization, aggregate, and as filler in wood and plastic products(McKerall et al., 1982).
The most commonly used thermoset plastic in polymer matrix com-posites (PMC) is epoxy resin (Singla and Chawla, 2010). It is a thermoset-ting polymer formed by the reaction typically of a low molecular weightchain with the diamine “hardener” (Wikipedia, 2012). The resin consistsof short chain polymers with an epoxide group at either end (Wikipedia,2012). Epoxy resins have low curing shrinkage [typically 2–3%] due to thereaction products which are not given off when they cure (Singla andChawla, 2010). Generally, epoxy resins are produced by reaction betweenepichlorohydrin and bisphenol-A (Singla and Chawla, 2010; Wikipedia,2012; Epoxy Resins. http://pslc.ws/macrog/epoxy.htm). Epoxies areattractive as structuralmatrixmaterials thanks to their excellent adhesionto other materials, high chemical & heat resistance, as well as goodmechanical properties (Singla and Chawla, 2010; Crosslinking, 2005)together with electrical insulating characteristics (Singla and Chawla,
ndyopadhyay).
, Use of Secondary Ion Mass SProcess. (2015), http://dx.doi.
2010; Crosslinking, 2005). Due to their excellent material properties ep-oxies find applications in optoelectronics, dentistry, industrial tooling, re-pair material for marine applications, as well as paints and coatings(http://www.wisegeek.com/what-is-epoxy-resin.htm; Srivastava andShembekar, 1990).
Fly ash as filler in epoxy matrix helps further improve the resultingpolymer properties (Kishore, 2001; Von Ardenne, 1938), at the sametime reducing the cost of the composite product (Kishore, 2001) andthe weight (Singla and Chawla, 2010). The structure and properties ofreinforcement matrix interface plays a major role in mechanical andphysical properties of the composite materials. This is because thelarge difference between the elastic properties of the matrix and rein-forcement has to be communicated through interface (Singla andChawla, 2010). The distribution/dispersion of the different elements inthe fly ash in the polymer matrix would thus enhance the mechanicaland physical properties of the composite materials.
Secondary IonMass Spectroscopy (SIMS) is a highly sensitive surfaceanalysis technique because it can detect elements present in parts perbillion ranges (http://en.wikipedia.org/wiki/Secondary_ion_mass_spectrometry). SIMS technique is now being used in materials scienceand surface science, to analyze the composition of solid surfaces andthin films and to determine the spatial distribution of phases in compos-ites (http://www.appropedia.org/Secondary_Ion_Mass_Spectroscopy_at_Western_University#Introduction).
Dynamic SIMS has been used in this work. In Dynamic SIMS, usinghigh-energy and high primary beam densities a volume of a 100 to1000 μm3 is analyzed. Worth noting in static SIMS using low energyand low primary beam densities, the material sputtered is exceedinglysmall, with surface mono-layers lasting hours or days.
pectrometry (SIMS) to identify fly ash mineral spatial and particulateorg/10.1016/j.minpro.2015.04.025

Table 1Constituents and their percentage in the Tarong fly ash (Zaeniet al., 2010) by ICP-AES.
Elements %
SiO2 66.44Al2O3 28.96Fe2O3 0.57TiO2 1.82CaO 0.00Na2O 0.24MgO 0.27K2O 0.28SO3 0.00Cr2O3 0.05P2O5 0.09BaO 0.05SrO 0.01LOI (loss on ignition) 0.99Total 99.77
2 S. Ibraheem et al. / International Journal of Mineral Processing xxx (2015) xxx–xxx
1.1. The SIMS technique offers the following advantages (http://www.geos.ed.ac.uk/facilities/ionprobe/SIMS4.pdf)
• Little or no sample preparation may be needed.• Can detect elements from Hydrogen (H) to Uranium (U).• Most elements may be detected down to concentrations of 1 ppm to1 ppb.
• Canmeasure isotopic ratios, normally to a precision of 0.5 to 0.05wt.%.• 2-Dimensional ion images may be acquired. A secondary ion leavesthe surface at a point close to its original location. This enableslocalized analysis of the sample to be undertaken and is the corner-stone of ion imaging. 3-Dimensional ion images may be acquired byscanning (rastering) the primary beam and detecting the ion signalas the sample is gradually eroded (http://www.geos.ed.ac.uk/facilities/ionprobe/SIMS4.pdf).
1.2. Energy Dispersive X-ray Spectrometry (EDS)
Energy Dispersive X-ray Spectroscopy (EDS, EDX, or XEDS) is ananalytical technique used for the elemental analysis or chemicalcharacterization of a sample (http://en.wikipedia.org/wiki/Energy-dispersive_X-ray_spectroscopy) to find what elements are present ina specimen by identifying the lines in the X-ray spectra (http://micron.ucr.edu/public/manuals/EDS-intro.pdf). EDS makes use of theX-ray spectrum emitted by a solid sample bombarded with a focusedbeam of electrons to obtain a localized chemical analysis(http://en.wikipedia.org/wiki/Energy-dispersive_X-ray_spectroscopy;http://micron.ucr.edu/public/manuals/EDS-intro.pdf). Its characteriza-tion capabilities are due in large part to the fundamental principlethat each element has a unique atomic structure allowing unique setof peaks on its X-ray spectrum (http://en.wikipedia.org/wiki/Energy-dispersive_X-ray_spectroscopy). To stimulate the emission of charac-teristic X-rays from a specimen, a high-energy beam of chargedparticles such as electrons or protons or a beam of X-rays, is focusedinto the sample being studied. However, EDS cannot identify elementsany less than 1%, which makes EDS testing semi-quantitative values(not fully quantitative) (APM (Testing Advanced Plastic and MetalTesting); Bruker, 2015).
2. Aims/objectives: the aims of this work include
a) Use themethod SIMS to identify the dispersion of fly ash ingredientsin fly ash–epoxy composites with different compositions (fly ashcontents 10 and 50 wt.%), and
b) Compare and correlate the SIMS results with EDS analysis toascertain the relative accuracy of each.
Table 2Percentages of fly ash and epoxy in samples.
Material designation Fly ash(wt.%)
Resin(wt.%)
S1 10 90S2 50 50
3. Materials and methods
3.1. Epoxy resin
The epoxy resin used was diglycidyl ether of bisphenol A (DGEBA)which has base of formulated bisphenol A. The hardener used was cy-cloaliphatic polyamine containing mainly carbon, oxygen and hydro-gen. The epoxy system was supplied by The Barnes, NSW, Australia. Itwas a clear colour liquid with low viscosity (500–1000 mPa.s at 25 °C)with the hardener's viscosity being 100–300 mPa.s at 25 °C. The resinand hardener were gently handmixed in 100:50 parts (by volume) tak-ing care that there was minimum air entrapped in the mixture. Also adegassing technique was adopted to remove any trapped air.
Please cite this article as: Ibraheem, S., et al., Use of Secondary Ion Mass Sdistribution in epoxy polymer, Int. J. Miner. Process. (2015), http://dx.doi
3.2. Fly ash
Fly ash class F sample was obtained from Cement Australia Brisbanefrom their Tarong power plant Queensland, Australia. The elementalanalysis is shown in Table 1 by ICP-AES method (inductively coupledplasma-atomic emission spectrometry (Zaeni et al., 2010).
3.3. Fabrication of composites
Two composites were fabricated as per Table 2.
3.4. Casting/curing
Casting was done inside silicone rubber dogbone shape moulds oftypical dimensions 165 mm × 19 mm × 5 mm. The dough preparedwas transferred to mould cavity taking care that the mould cavity wasthoroughly filled. Levelling was done to uniformly fill the cavity.
Curing was carried out at 120 °C for 2 h in an oven. After curing themould was cooled down slowly to room temperature in the furnace.After cooling, the mould was opened, then samples were taken out ofthe mould and cleaned.
3.5. Material characterization
Surface study of epoxy–fly ash composites was carried out using:
a) Secondary Ion Mass Spectrometry (SIMS), andb) Energy Dispersive X-ray Spectroscopy (EDS).
The experimental programme included SIMS and EDS analyses ofsurfaces of selected unpolished moulded specimens fly ash–epoxycomposites. Two samples were examined for 10% FA–epoxy composite,and 50% FA–epoxy composite systems.
SIMS quantified several elements of importance Si, Mg, Fe, S, Ca, K,Al, Mn and O, as these are the usual constituents of the fly ash phases.Samples were cut to dimensions of 10 mm × 10 mm × 5 mm, andwere cleaned in propanol and Decon detergent before analysis. The
pectrometry (SIMS) to identify fly ash mineral spatial and particulate.org/10.1016/j.minpro.2015.04.025

Fig. 2. EDS spectra for pure epoxy showing the presence of carbon and oxygen only.
Fig. 1. Shows the EDS spectra for pure fly ash, showing the presence of Al, Si and O.
3S. Ibraheem et al. / International Journal of Mineral Processing xxx (2015) xxx–xxx
surfaces of the samples were flat enough for the ion beam to hit thesample surface at specific angle and reflect it in a specific angle. Thetested surface was given gold coating 30 μm thick, and then the goldcoating was removed to a thinner layer. The samples were then fittedinto the holder. The imageswere acquired after about 5min of rastering.The tested area dimensions were 250 μm× 200 μm. The 10% FA–epoxyand 50% FA–epoxy samples were analyzed using SIMS in order to quan-titatively identify the spatial distribution of the various elemental com-ponents of fly ash such as Si, Mg, Fe, S, Ca, K, Al, Mn and O. In addition,EDS analysis was also undertaken in an attempt to examine the flyash–epoxy composites' elemental content/distribution.
Fig. 3. SIMS irradiated 10% FA–epoxy sample: the dark rectangle containing a “+” signrepresents the SIMS ion beam irradiated zone.
4. Results and discussion
Fig. 1 shows the EDS spectra of (100%) pure fly ash sampleconfirming the presence of Si, O and Al which are in quantities signifi-cantly higher than 1% (see Table 1 as quantified by ICP-AES), so EDScould easily quantify these elements. Fig. 2 shows EDS of pure epoxy
Please cite this article as: Ibraheem, S., et al., Use of Secondary Ion Mass Spectrometry (SIMS) to identify fly ash mineral spatial and particulatedistribution in epoxy polymer, Int. J. Miner. Process. (2015), http://dx.doi.org/10.1016/j.minpro.2015.04.025

Fig. 4. SIMS results for elements Si, Mg, Fe, S, Ca, K and Al in 10% fly ash–epoxy.
4 S. Ibraheem et al. / International Journal of Mineral Processing xxx (2015) xxx–xxx
Please cite this article as: Ibraheem, S., et al., Use of Secondary Ion Mass Spectrometry (SIMS) to identify fly ash mineral spatial and particulatedistribution in epoxy polymer, Int. J. Miner. Process. (2015), http://dx.doi.org/10.1016/j.minpro.2015.04.025
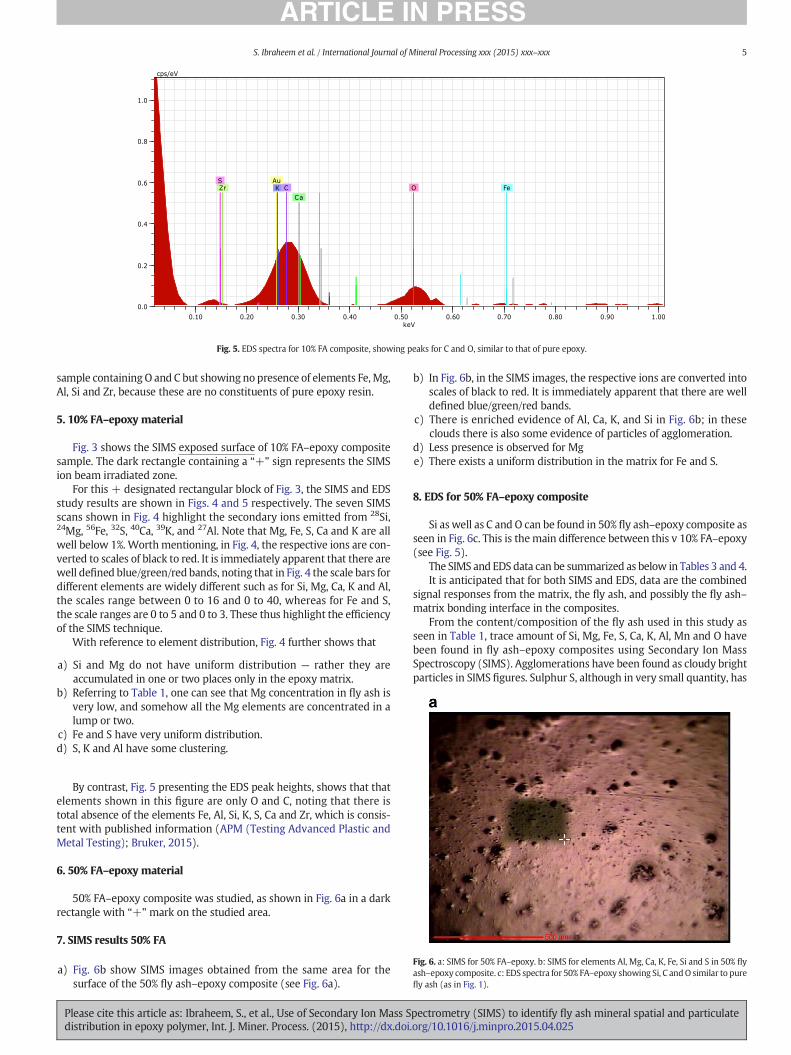
Fig. 5. EDS spectra for 10% FA composite, showing peaks for C and O, similar to that of pure epoxy.
Fig. 6. a: SIMS for 50% FA–epoxy. b: SIMS for elements Al, Mg, Ca, K, Fe, Si and S in 50% flyash–epoxy composite. c: EDS spectra for 50% FA–epoxy showing Si, C andO similar to purefly ash (as in Fig. 1).
5S. Ibraheem et al. / International Journal of Mineral Processing xxx (2015) xxx–xxx
sample containing O and C but showing no presence of elements Fe, Mg,Al, Si and Zr, because these are no constituents of pure epoxy resin.
5. 10% FA–epoxy material
Fig. 3 shows the SIMS exposed surface of 10% FA–epoxy compositesample. The dark rectangle containing a “+” sign represents the SIMSion beam irradiated zone.
For this + designated rectangular block of Fig. 3, the SIMS and EDSstudy results are shown in Figs. 4 and 5 respectively. The seven SIMSscans shown in Fig. 4 highlight the secondary ions emitted from 28Si,24Mg, 56Fe, 32S, 40Ca, 39K, and 27Al. Note that Mg, Fe, S, Ca and K are allwell below 1%. Worthmentioning, in Fig. 4, the respective ions are con-verted to scales of black to red. It is immediately apparent that there arewell defined blue/green/red bands, noting that in Fig. 4 the scale bars fordifferent elements are widely different such as for Si, Mg, Ca, K and Al,the scales range between 0 to 16 and 0 to 40, whereas for Fe and S,the scale ranges are 0 to 5 and 0 to 3. These thus highlight the efficiencyof the SIMS technique.
With reference to element distribution, Fig. 4 further shows that
a) Si and Mg do not have uniform distribution — rather they areaccumulated in one or two places only in the epoxy matrix.
b) Referring to Table 1, one can see that Mg concentration in fly ash isvery low, and somehow all the Mg elements are concentrated in alump or two.
c) Fe and S have very uniform distribution.d) S, K and Al have some clustering.
By contrast, Fig. 5 presenting the EDS peak heights, shows that thatelements shown in this figure are only O and C, noting that there istotal absence of the elements Fe, Al, Si, K, S, Ca and Zr, which is consis-tent with published information (APM (Testing Advanced Plastic andMetal Testing); Bruker, 2015).
6. 50% FA–epoxy material
50% FA–epoxy composite was studied, as shown in Fig. 6a in a darkrectangle with “+” mark on the studied area.
7. SIMS results 50% FA
a) Fig. 6b show SIMS images obtained from the same area for thesurface of the 50% fly ash–epoxy composite (see Fig. 6a).
Please cite this article as: Ibraheem, S., et al., Use of Secondary Ion Mass Sdistribution in epoxy polymer, Int. J. Miner. Process. (2015), http://dx.doi.
b) In Fig. 6b, in the SIMS images, the respective ions are converted intoscales of black to red. It is immediately apparent that there are welldefined blue/green/red bands.
c) There is enriched evidence of Al, Ca, K, and Si in Fig. 6b; in theseclouds there is also some evidence of particles of agglomeration.
d) Less presence is observed for Mge) There exists a uniform distribution in the matrix for Fe and S.
8. EDS for 50% FA–epoxy composite
Si as well as C and O can be found in 50% fly ash–epoxy composite asseen in Fig. 6c. This is themain difference between this v 10% FA–epoxy(see Fig. 5).
The SIMS and EDS data can be summarized as below in Tables 3 and 4.It is anticipated that for both SIMS and EDS, data are the combined
signal responses from the matrix, the fly ash, and possibly the fly ash–matrix bonding interface in the composites.
From the content/composition of the fly ash used in this study asseen in Table 1, trace amount of Si, Mg, Fe, S, Ca, K, Al, Mn and O havebeen found in fly ash–epoxy composites using Secondary Ion MassSpectroscopy (SIMS). Agglomerations have been found as cloudy brightparticles in SIMS figures. Sulphur S, although in very small quantity, has
pectrometry (SIMS) to identify fly ash mineral spatial and particulateorg/10.1016/j.minpro.2015.04.025
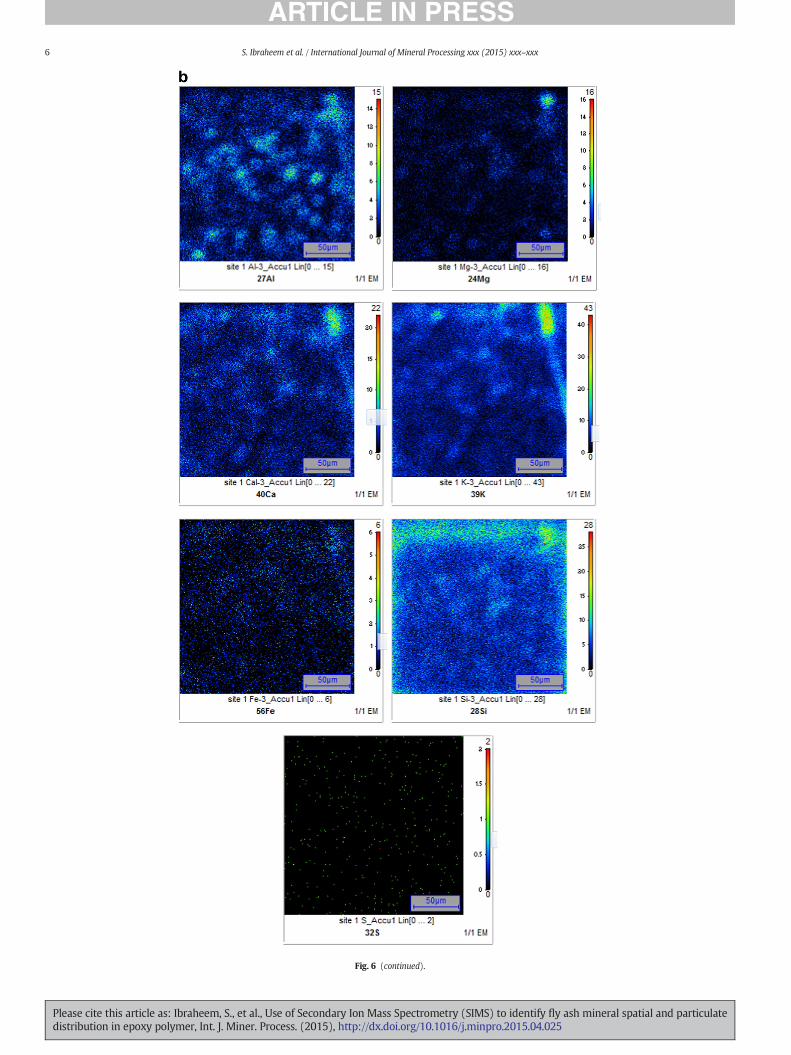
Fig. 6 (continued).
6 S. Ibraheem et al. / International Journal of Mineral Processing xxx (2015) xxx–xxx
Please cite this article as: Ibraheem, S., et al., Use of Secondary Ion Mass Spectrometry (SIMS) to identify fly ash mineral spatial and particulatedistribution in epoxy polymer, Int. J. Miner. Process. (2015), http://dx.doi.org/10.1016/j.minpro.2015.04.025

c
Fig. 6 (continued).
Table 450 wt.% fly ash–epoxy composite.
Elements identified SIMS EDS
Al Yes NoMg Yes NoCa Yes NoK Yes NoFe Yes NoSi Yes YesS Yes No
7S. Ibraheem et al. / International Journal of Mineral Processing xxx (2015) xxx–xxx
the most uniform distribution of all elements. It may have come fromthe epoxy matrix and/or contamination.
EDS detected C and O in the 10% FA composite and C, O and Si in the50% FA composite. In general EDS could detect C, O and Si only for allcompositions.
9. Conclusions
1. This project utilised SIMS to generate a total knowledge regardingcomposition as well as distribution and surface contamination forthe fly ash material constituents in epoxy resin composites.
2. Fly ash–epoxy composites were fabricated using DGEBA epoxy andcrosslinking agent cycloaliphatic polyamine cured at 120 °C for2 h — using as-received Australian fly ash (Tarong, Hopper 4) in theproportion 10, and 50 wt.%.
3. SIMS and EDS studies of as-fabricated (but unbroken) surfaces of twocomposites provided good comparative information.
4. Trace amounts of Si, Mg, Fe, S, Ca, K, Al, Mn and O have been found infly ash–epoxy composites using SIMS.
5. Si as well as C and O were found by EDS in the 50% fly ash–epoxycomposite as seen in Fig. 6c. This is the main difference betweenthis and the (10% FA–epoxy) using EDS.
6. SIMS is a very advanced equipment for getting elemental distributionas well as surface contamination.
7. Notably, whilst Table 1 did not find any sulphur in the fly ash (as alsoconfirmed by EDS), SIMS appears to identify some sulphur, may befrom epoxy constituents.
Table 310 wt.% fly ash–epoxy composite.
Elements identified SIMS EDS
Si Yes NoMg Yes NoK Yes NoAl Yes NoCa Yes NoFe Yes NoS Yes NoO No YesC No Yes
Please cite this article as: Ibraheem, S., et al., Use of Secondary Ion Mass Sdistribution in epoxy polymer, Int. J. Miner. Process. (2015), http://dx.doi.
Acknowledgement
This researchwas fortunate to receive anAINSE fund to use the SIMSequipment offered by AINSE/ANSTO. This opportunity was greatlyappreciated and applied in this project. The authors are grateful to theUniversity of Western Sydney for providing access to the SIMSequipment. Fly ash samples were provided by Cement AustraliaBrisbane. The EDS and SEM facilities were available to be used in theSchool ofMaterials Science & Engineering, UNSWAustralia. The authorsfinally acknowledge the Australia–China Joint Research Centre forMinerals, Metallurgy and Materials who organised the 2nd Australia–China Joint Symposium on Minerals and metallurgy at UNSWAustralia during 23–25 July 2014. Special thanks are due to Prof AibingYu, Dr Ruiping Zou and Dr Yansong Shen.
References
APM (Testing Advanced Plastic and Metal Testing), d. “EDS analysis–EDS analysis testingservices” copyright 2009 by APMhttp://www.apmtesting.com/testing-services/test-methods/EDS-manual.php.
Bruker, 2015. EDXRF, EDX, EDS analysis: energy dispersive XRF spectroscopy. BrukerCorporation (https://www.bruker.com/products/x-ray-diffraction-and-elemental-analysis/handheld-xrf/edxrf-edx-eds-analysis.html).
Crosslinking, 2005. http://pcls.ws/macrog/xlink.htm.Epoxy Resins. http://pslc.ws/macrog/epoxy.htm.http://en.wikipedia.org/wiki/Energy-dispersive_X-ray_spectroscopy, d. http://en.wikipedia.
org/wiki/Energy-dispersive_X-ray_spectroscopy.http://en.wikipedia.org/wiki/Secondary_ion_mass_spectrometry, d. http://en.wikipedia.
org/wiki/Secondary_ion_mass_spectrometry.http://micron.ucr.edu/public/manuals/EDS-intro.pdf, d. http://micron.ucr.edu/public/
manuals/EDS-intro.pdf.http://www.appropedia.org/Secondary_Ion_Mass_Spectroscopy_at_Western_
University#Introduction, d. http://www.appropedia.org/Secondary_Ion_Mass_Spectroscopy_at_Western_University#Introduction.
pectrometry (SIMS) to identify fly ash mineral spatial and particulateorg/10.1016/j.minpro.2015.04.025

8 S. Ibraheem et al. / International Journal of Mineral Processing xxx (2015) xxx–xxx
http://www.geos.ed.ac.uk/facilities/ionprobe/SIMS4.pdf, d. http://www.geos.ed.ac.uk/facilities/ionprobe/SIMS4.pdf.
http://www.wisegeek.com/what-is-epoxy-resin.htm, d. http://www.wisegeek.com/what-is-epoxy-resin.htm.
Kishore, S.M. Kulkarni, 2001. Studies on fly ash–filled epoxy-cast slabs under compres-sion. J. Appl. Polym. Sci. 84 (13), 2404–2410.
McKerall, W.C., Ledbetter, W.B., Teague, D.J., 1982. Analysis of fly ashes produced in Texas.Texas Transportation Institute, Research Report No. 240-1. Texas A&M, University,College Station, Texas.
Raask, E., 1968. Cenospheres in pulverized-fuel ash. J. Inst. Fuel 41 (332), 339–344.Singla, Manoj, Chawla, Vikas, 2010. Mechanical properties of epoxy resin–fly ash compos-
ite. J. Miner. Mater. Charact. Eng. 9 (3), 120–199.
Please cite this article as: Ibraheem, S., et al., Use of Secondary Ion Mass Sdistribution in epoxy polymer, Int. J. Miner. Process. (2015), http://dx.doi
Srivastava, V.K., Shembekar, P.S., 1990. Tensile and fracture properties of epoxy resin filledwith fly ash particles. J. Mater. Sci. 3513–3516 (pp.).
The American Coal Ash Association (ACAA). http://www.acaa-usa.org/About-Coal-Ash/What-are-CCPs/Fly-ash
Von Ardenne, Manfred, 1938. Das Elektronen-Rastermikroskop. TheoretischeGrundlagen. Z. Phys. 109 (9–10), 553–572. http://dx.doi.org/10.1007/BF01341584((in German). Bibcode:1938ZPhy.109.553 V).
Wikipedia, 2012. Epoxy. http://en.wikipedia.org/wiki/Epoxy (25 April).Zaeni, Akhmad, Bandyopadhyay, Sri, Aibing, Yu., Rider, John, Sorrell, Chris S., Dain,
Stephen, Blackburn, Daryl, White, Chris, 2010. Colour control in fly ash as combinedfunction of particle size and chemical composition. Fuel 89, 399–404.
pectrometry (SIMS) to identify fly ash mineral spatial and particulate.org/10.1016/j.minpro.2015.04.025
Related Documents


