Biogeosciences, 17, 5355–5364, 2020 https://doi.org/10.5194/bg-17-5355-2020 © Author(s) 2020. This work is distributed under the Creative Commons Attribution 4.0 License. Use of optical absorption indices to assess seasonal variability of dissolved organic matter in Amazon floodplain lakes Maria Paula da Silva 1,a , Lino A. Sander de Carvalho 2,b , Evlyn Novo 1 , Daniel S. F. Jorge 1,c , and Claudio C. F. Barbosa 2 1 Remote Sensing Division, National Institute for Space Research – INPE, 12227-010 São José dos Campos, Brazil 2 Image Processing Division, National Institute for Space Research – INPE, 12227-010 São José dos Campos, Brazil a now at: Department of Analytical Chemistry, BioGeoOmics research group, Helmholtz Centre for Environmental Research – UFZ, 04318 Leipzig, Germany b now at: Department of Meteorology, Geoscience institute, Federal University of Rio de Janeiro, 21941-916 Rio de Janeiro, Brazil c now at: Laboratoire d’Océanologie et de Géosciences – LOG, Université du Littoral-Côte-d’Opale, CNRS, Université de Lille, 62930 Wimereux, France Correspondence: Maria Paula da Silva ([email protected]) Received: 22 August 2019 – Discussion started: 1 October 2019 Revised: 23 July 2020 – Accepted: 2 September 2020 – Published: 9 November 2020 Abstract. Given the importance of dissolved organic matter (DOM) in the carbon cycling of aquatic ecosystems, infor- mation on its seasonal variability is crucial. In this study we assess the use of optical absorption indices available in the literature based on in situ data to both characterize the sea- sonal variability of DOM in a highly complex environment and for application in large-scale studies using remote sens- ing data. The study area comprises four lakes located in the Mamirauá Sustainable Development Reserve (MSDR). Sam- ples for the determination of colored dissolved organic mat- ter (CDOM) and measurements of remote sensing reflectance (R rs ) were acquired in situ. The R rs was used to simulate the response of the visible bands of the Sentinel-2 MultiSpectral Instrument (MSI), which was used in the proposed models. Differences between lakes were tested using the CDOM in- dices. The results highlight the role of the flood pulse in the DOM dynamics at the floodplain lakes. The validation results show that the use of the absorption coefficient of CDOM (a CDOM ) as a proxy of the spectral slope between 275 and 295 nm (S 275–295 ) during rising water is worthwhile, demon- strating its potential application to Sentinel-2 MSI imagery data for studying DOM dynamics on the large scale. 1 Introduction Floodplain is a type of wetland that is characterized by a mosaic of landscapes, and it oscillates periodically between aquatic and terrestrial systems. This oscillation represents a key aspect in the biogeochemistry, ecology and hydrology of floodplain lakes (Junk et al., 1989; Moreira-Turq et al., 2003). Among other effects, the flood pulse (sensu Junk et al., 1989) affects the proportion of autochthonous and al- lochthonous sources contributing to the dissolved organic matter (DOM) pool in floodplain lakes throughout the year (de Melo et al., 2020). DOM represents the largest pool of organic carbon in the aquatic environment, and it has an important role in the ecosystem carbon budgets (Seekell et al., 2018; Tranvik et al., 2009; Richey et al., 2002). Moreover, DOM also controls light availability in the water column, playing a vital role in the primary productivity of aquatic ecosystems and, conse- quently, fisheries and other food webs (Hastie et al., 2019; Maia and Volpato, 2013; Volpato et al., 2004). Nonetheless, the role of DOM in the environment changes according to its quality (Inamdar et al., 2012). The DOM concentration in the environment is usually de- termined by the concentration of dissolved organic carbon (DOC; Coble, 2007). However, simple measurement of the DOC concentration can limit the study of the seasonal varia- Published by Copernicus Publications on behalf of the European Geosciences Union.

Welcome message from author
This document is posted to help you gain knowledge. Please leave a comment to let me know what you think about it! Share it to your friends and learn new things together.
Transcript
Biogeosciences, 17, 5355–5364, 2020https://doi.org/10.5194/bg-17-5355-2020© Author(s) 2020. This work is distributed underthe Creative Commons Attribution 4.0 License.
Use of optical absorption indices to assess seasonal variability ofdissolved organic matter in Amazon floodplain lakesMaria Paula da Silva1,a, Lino A. Sander de Carvalho2,b, Evlyn Novo1, Daniel S. F. Jorge1,c, and Claudio C. F. Barbosa2
1Remote Sensing Division, National Institute for Space Research – INPE, 12227-010 São José dos Campos, Brazil2Image Processing Division, National Institute for Space Research – INPE, 12227-010 São José dos Campos, Brazilanow at: Department of Analytical Chemistry, BioGeoOmics research group, Helmholtz Centre for EnvironmentalResearch – UFZ, 04318 Leipzig, Germanybnow at: Department of Meteorology, Geoscience institute, Federal University of Rio de Janeiro,21941-916 Rio de Janeiro, Brazilcnow at: Laboratoire d’Océanologie et de Géosciences – LOG, Université du Littoral-Côte-d’Opale, CNRS,Université de Lille, 62930 Wimereux, France
Correspondence: Maria Paula da Silva ([email protected])
Received: 22 August 2019 – Discussion started: 1 October 2019Revised: 23 July 2020 – Accepted: 2 September 2020 – Published: 9 November 2020
Abstract. Given the importance of dissolved organic matter(DOM) in the carbon cycling of aquatic ecosystems, infor-mation on its seasonal variability is crucial. In this study weassess the use of optical absorption indices available in theliterature based on in situ data to both characterize the sea-sonal variability of DOM in a highly complex environmentand for application in large-scale studies using remote sens-ing data. The study area comprises four lakes located in theMamirauá Sustainable Development Reserve (MSDR). Sam-ples for the determination of colored dissolved organic mat-ter (CDOM) and measurements of remote sensing reflectance(Rrs) were acquired in situ. The Rrs was used to simulate theresponse of the visible bands of the Sentinel-2 MultiSpectralInstrument (MSI), which was used in the proposed models.Differences between lakes were tested using the CDOM in-dices. The results highlight the role of the flood pulse in theDOM dynamics at the floodplain lakes. The validation resultsshow that the use of the absorption coefficient of CDOM(aCDOM) as a proxy of the spectral slope between 275 and295 nm (S275–295) during rising water is worthwhile, demon-strating its potential application to Sentinel-2 MSI imagerydata for studying DOM dynamics on the large scale.
1 Introduction
Floodplain is a type of wetland that is characterized by amosaic of landscapes, and it oscillates periodically betweenaquatic and terrestrial systems. This oscillation represents akey aspect in the biogeochemistry, ecology and hydrologyof floodplain lakes (Junk et al., 1989; Moreira-Turq et al.,2003). Among other effects, the flood pulse (sensu Junk etal., 1989) affects the proportion of autochthonous and al-lochthonous sources contributing to the dissolved organicmatter (DOM) pool in floodplain lakes throughout the year(de Melo et al., 2020).
DOM represents the largest pool of organic carbon in theaquatic environment, and it has an important role in theecosystem carbon budgets (Seekell et al., 2018; Tranvik etal., 2009; Richey et al., 2002). Moreover, DOM also controlslight availability in the water column, playing a vital role inthe primary productivity of aquatic ecosystems and, conse-quently, fisheries and other food webs (Hastie et al., 2019;Maia and Volpato, 2013; Volpato et al., 2004). Nonetheless,the role of DOM in the environment changes according to itsquality (Inamdar et al., 2012).
The DOM concentration in the environment is usually de-termined by the concentration of dissolved organic carbon(DOC; Coble, 2007). However, simple measurement of theDOC concentration can limit the study of the seasonal varia-
Published by Copernicus Publications on behalf of the European Geosciences Union.
5356 M. P. da Silva et al.: Seasonal variability of DOM in Amazon floodplain lakes
tion in the DOM quality (e.g., composition) and origin as it isrelated only to the DOM bulk (Jaffé et al., 2008). Qualitativeparameters are needed to better understand DOM dynamics.Ultraviolet (UV) and visible absorption measurements andfluorescence can be applied in this case as an alternative tocostly laboratory analysis (Li and Hur, 2017). Water absorp-tion has been widely used to study DOM dynamics in streamsand lakes. Based on UV and visible measurements, Helms etal. (2008) showed that the spectral slope calculated in therange between 275 and 295 nm (S275–295) is an indicator ofthe DOM molecular weight and a tracer of the degradationprocesses. S275–295, the absorption coefficient of colored dis-solved organic matter (CDOM) at 350 nm (aCDOM (350)) andthe DOC concentration have also been used to study the dy-namics of dissolved organic matter between rivers and flood-plains (Spencer et al., 2008; Shen et al., 2012).
To study DOM dynamics over a wide spatial–temporalscale, satellite images have been assessed as a source of opti-cal information on CDOM. Many studies have used Land-sat images to investigate aCDOM at different wavelengths,most commonly at 350, 440 and 420 nm (Fichot et al.,2013; Kutser et al., 2005; Zhu et al., 2014; Brezonik etal., 2015). Fichot et al. (2013) also estimated S275–295 fromsatellite data, using MODIS marine reflectance. However,the reflectance of water in the visible bands may not reflectchanges in the spectral slope of CDOM in the UV domain(Vantrepotte et al., 2015). Therefore, Vantrepotte et al. (2015)proposed the use of aCDOM as a proxy for S275–295 as itproved to be less affected by the water optical quality andatmospheric correction. Both studies (Fichot et al., 2013;Vantrepotee et al., 2015) used MODIS data whose spatialresolution (250–1000 m) restricts their application to inlandwater studies. In recent years the availability of MultiSpectralInstrument (MSI) images, onboard Sentinel-2A (June/2015)and Sentinel-2B (March 2017), has expanded the potentialof remote sensing application for DOM monitoring due toits high spatial (10 and 20 m), temporal (5 d) and radiomet-ric (12 bit) resolutions (Toming et al., 2016). Nonetheless, itremains unclear if the optical absorption indices proposed inthe literature can be used to study DOM dynamics in a highlycomplex system such as the Amazon floodplain lakes.
The main objectives of this study are (i) to investigate thevariability of aCDOM in floodplain lakes during the recedingand rising limbs of the Solimões River, (ii) to examine thepotential of S275–295 for distinguishing differences in DOMby comparing it in two hydrograph stages and (iii) to proposean algorithm to estimate aCDOM (440) as a proxy for S275–295using simulated MSI Sentinel-2 bands to support the futureapplication of satellite remote sensing for inland DOM stud-ies.
2 Material and methods
2.1 Study area
The study sites are four lakes located in the floodplain builtat the confluence between the Solimões and Japurá rivers,near Tefé and inside the Mamirauá Sustainable DevelopmentReserve (MSDR; Fig. 1b), which is a well-preserved floodedforest under low human pressure (Ayres, 1995; Castello etal., 2009; Mori et al., 2019; Queiroz, 2007). In this area, theseasonal flood is caused by both rainfall (in the upper Ama-zon Basin and locally – from December to May, with an av-erage of 300 mm per month) and the annual melt of the An-des mountain range during austral summer (Junk, 1989). Inthe MSDR, the variation in the water level is 12 m on aver-age between the wet and dry seasons (Queiroz, 2007). Theincrease in the water level (the rising stage) begins in Jan-uary and continues until late April; the water begins to re-cede (the receding stage) in July. During the flood period,which begins in May, the floodplain is occupied by wateruntil the beginning of the receding stage (Affonso et al.,2011). The study lakes were selected according to criteriadefined in Jorge et al. (2017a): guaranteed access to themthroughout the hydrological year and sizes compatible withthe spatial resolution of the visible bands of MSI Sentinel-2A(10 and 20 m). Additionally, the lakes have intrinsic differ-ences: two of them (Buabuá and Mamirauá) are small peren-nial lakes surrounded by flood forest, whereas the other two(Pantaleão and Pirarara) are lakes connected to the JapuráRiver throughout the hydrological year, with variable sizeand depth in response to the flood pulse of the river.
2.2 Data source
Data were acquired in the Buabuá, Mamirauá, Pantaleão andPirarara lakes by the Instrumentation Laboratory for AquaticSystems team (LabISA – http://www.dpi.inpe.br/labisa, lastaccess: 26 October 2020) of the National Institute for SpaceResearch (INPE-Brazil). More details about the fieldworkand measurements are provided in Jorge et al. (2017a, b).
The field campaigns were carried out in March–April andJuly–August of 2016; these periods correspond to the risingand receding stages of the Solimões River, respectively. Intotal, 87 samples were collected among the lakes and sea-sons.
2.3 Measurements
2.3.1 Remote sensing reflectance
The radiometric measurements to derive the remote sensingreflectance (Rrs) were carried out for all sampling points us-ing three intercalibrated RAMSES–TriOS sensors. The sen-sors measured above-water radiance, sky radiance and watersurface irradiance, between 350 and 900 nm. During the mea-surements, the sensors were positioned with azimuth angles
Biogeosciences, 17, 5355–5364, 2020 https://doi.org/10.5194/bg-17-5355-2020
M. P. da Silva et al.: Seasonal variability of DOM in Amazon floodplain lakes 5357
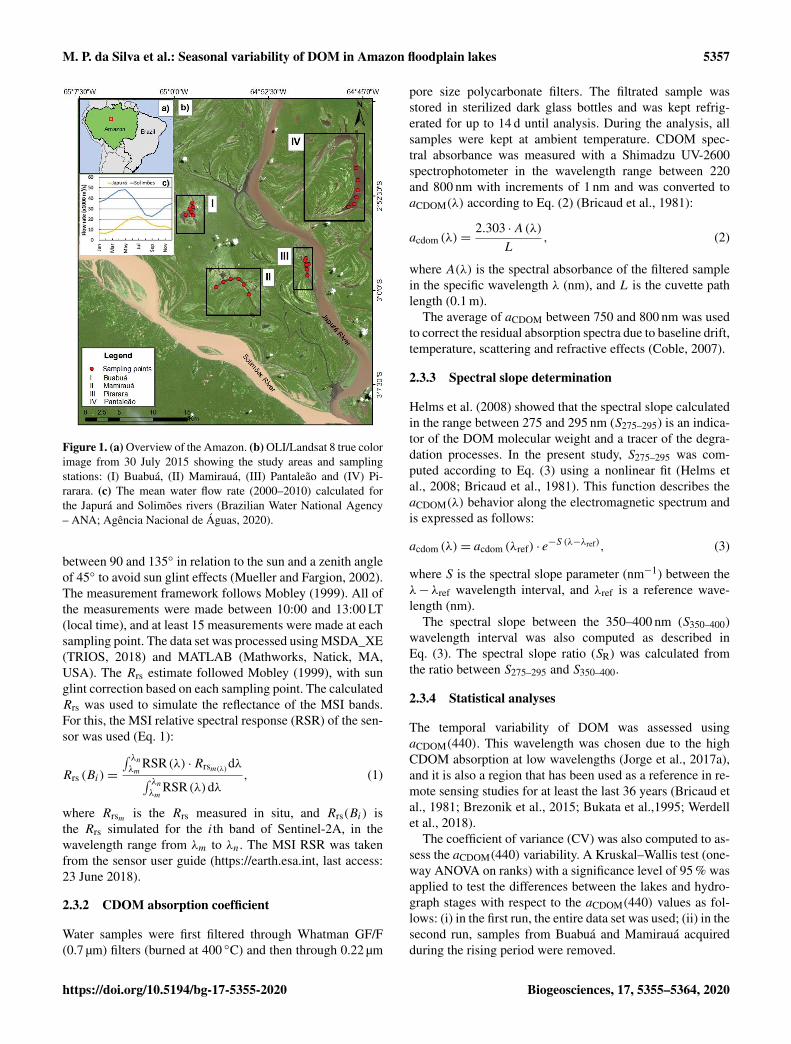
Figure 1. (a) Overview of the Amazon. (b) OLI/Landsat 8 true colorimage from 30 July 2015 showing the study areas and samplingstations: (I) Buabuá, (II) Mamirauá, (III) Pantaleão and (IV) Pi-rarara. (c) The mean water flow rate (2000–2010) calculated forthe Japurá and Solimões rivers (Brazilian Water National Agency– ANA; Agência Nacional de Águas, 2020).
between 90 and 135◦ in relation to the sun and a zenith angleof 45◦ to avoid sun glint effects (Mueller and Fargion, 2002).The measurement framework follows Mobley (1999). All ofthe measurements were made between 10:00 and 13:00 LT(local time), and at least 15 measurements were made at eachsampling point. The data set was processed using MSDA_XE(TRIOS, 2018) and MATLAB (Mathworks, Natick, MA,USA). The Rrs estimate followed Mobley (1999), with sunglint correction based on each sampling point. The calculatedRrs was used to simulate the reflectance of the MSI bands.For this, the MSI relative spectral response (RSR) of the sen-sor was used (Eq. 1):
Rrs (Bi)=
∫ λnλm
RSR(λ) ·Rrsm(λ)dλ∫ λnλm
RSR(λ)dλ, (1)
where Rrsm is the Rrs measured in situ, and Rrs(Bi) isthe Rrs simulated for the ith band of Sentinel-2A, in thewavelength range from λm to λn. The MSI RSR was takenfrom the sensor user guide (https://earth.esa.int, last access:23 June 2018).
2.3.2 CDOM absorption coefficient
Water samples were first filtered through Whatman GF/F(0.7 µm) filters (burned at 400 ◦C) and then through 0.22 µm
pore size polycarbonate filters. The filtrated sample wasstored in sterilized dark glass bottles and was kept refrig-erated for up to 14 d until analysis. During the analysis, allsamples were kept at ambient temperature. CDOM spec-tral absorbance was measured with a Shimadzu UV-2600spectrophotometer in the wavelength range between 220and 800 nm with increments of 1 nm and was converted toaCDOM(λ) according to Eq. (2) (Bricaud et al., 1981):
acdom (λ)=2.303 ·A(λ)
L, (2)
where A(λ) is the spectral absorbance of the filtered samplein the specific wavelength λ (nm), and L is the cuvette pathlength (0.1 m).
The average of aCDOM between 750 and 800 nm was usedto correct the residual absorption spectra due to baseline drift,temperature, scattering and refractive effects (Coble, 2007).
2.3.3 Spectral slope determination
Helms et al. (2008) showed that the spectral slope calculatedin the range between 275 and 295 nm (S275–295) is an indica-tor of the DOM molecular weight and a tracer of the degra-dation processes. In the present study, S275–295 was com-puted according to Eq. (3) using a nonlinear fit (Helms etal., 2008; Bricaud et al., 1981). This function describes theaCDOM(λ) behavior along the electromagnetic spectrum andis expressed as follows:
acdom (λ)= acdom (λref) · e−S (λ−λref), (3)
where S is the spectral slope parameter (nm−1) between theλ− λref wavelength interval, and λref is a reference wave-length (nm).
The spectral slope between the 350–400 nm (S350–400)wavelength interval was also computed as described inEq. (3). The spectral slope ratio (SR) was calculated fromthe ratio between S275–295 and S350–400.
2.3.4 Statistical analyses
The temporal variability of DOM was assessed usingaCDOM(440). This wavelength was chosen due to the highCDOM absorption at low wavelengths (Jorge et al., 2017a),and it is also a region that has been used as a reference in re-mote sensing studies for at least the last 36 years (Bricaud etal., 1981; Brezonik et al., 2015; Bukata et al.,1995; Werdellet al., 2018).
The coefficient of variance (CV) was also computed to as-sess the aCDOM(440) variability. A Kruskal–Wallis test (one-way ANOVA on ranks) with a significance level of 95 % wasapplied to test the differences between the lakes and hydro-graph stages with respect to the aCDOM(440) values as fol-lows: (i) in the first run, the entire data set was used; (ii) in thesecond run, samples from Buabuá and Mamirauá acquiredduring the rising period were removed.
https://doi.org/10.5194/bg-17-5355-2020 Biogeosciences, 17, 5355–5364, 2020
5358 M. P. da Silva et al.: Seasonal variability of DOM in Amazon floodplain lakes
The mean S275–295 of the 2 months representing the samehydrograph stages (e.g., July and August for receding; Marchand April for rising) was computed for each sampling pointin order to analyze their variability within each lake and hy-drograph stage. All of the statistical analyses were performedusing MATLAB software (Mathworks, Natick, MA, USA).
2.3.5 Model calibration and validation
When estimating aCDOM from Rrs in complex environments,there is always the challenge of distinguishing the CDOMsignal from the non-algal particle (NAP) signal (Matsuokaet al., 2009, 2012). In this study, we propose a new modelfor estimating aCDOM(440) that includes the ratio betweenthe near-infrared (NIR) bands in order to remove the NAPcontribution. The rationale for introducing this ratio is thenull signal of CDOM and the dominance of NAP in the NIRrange (Kirk, 2011). Previous studies have also shown that theinclusion of bands at wavelengths> 600 nm increases the ac-curacy of the CDOM estimation model (Chen et al., 2017;Zhu et al., 2014). Thus, to determine aCDOM(440), the ex-ponential of the ratio between bands 6 (λ central wavelength(λcw)= 740 nm) and 5 (λcw= 705 nm) are subtracted fromthe exponential of the ratio between bands 2 (λcw= 490 nm)and 3 (λcw= 560 nm) (Eq. 4):
acdom (440)= x · e(B2/B3)− (y · e(B6/B5)+ z), (4)
where, x, y and z are the coefficients, and B2, B3, B5 and B6are the MSI sensor-simulated bands 2, 3, 5 and 6.
The Monte Carlo method was applied to Eq. (4) to cali-brate the model. From 42 samples collected during the risinglimb, 29 were randomly selected for model calibration. Thisprocess was repeated 10 000 times, and the mean square er-ror (MSE) and equation coefficients (x and y) were recordedat each iteration.
The final model selection (the most representative modelbased on the MSE modal value) follows the procedure fromAugusto-Silva et al. (2014): (i) construct a histogram ofthe MSE, (ii) compute the mean and standard deviations ofthe model’s coefficients in the most frequent error interval,(iii) rank the coefficients in the range of the mean± standarddeviation according to their MSE and (iv) select the modelwith the smallest MSE.
The chosen model was validated using the 13 remainingsamples (not used in the calibration process), and the finalaccuracy was assessed using the following metrics: the coef-ficient of determination (r2), the MSE and normalized rootmean square error as a percentage (%NRMSE).
3 Results
3.1 Seasonal and spatial variability of DOM
The water level of the Solimões River during the samplingcampaigns in the rising and receding limbs was very simi-
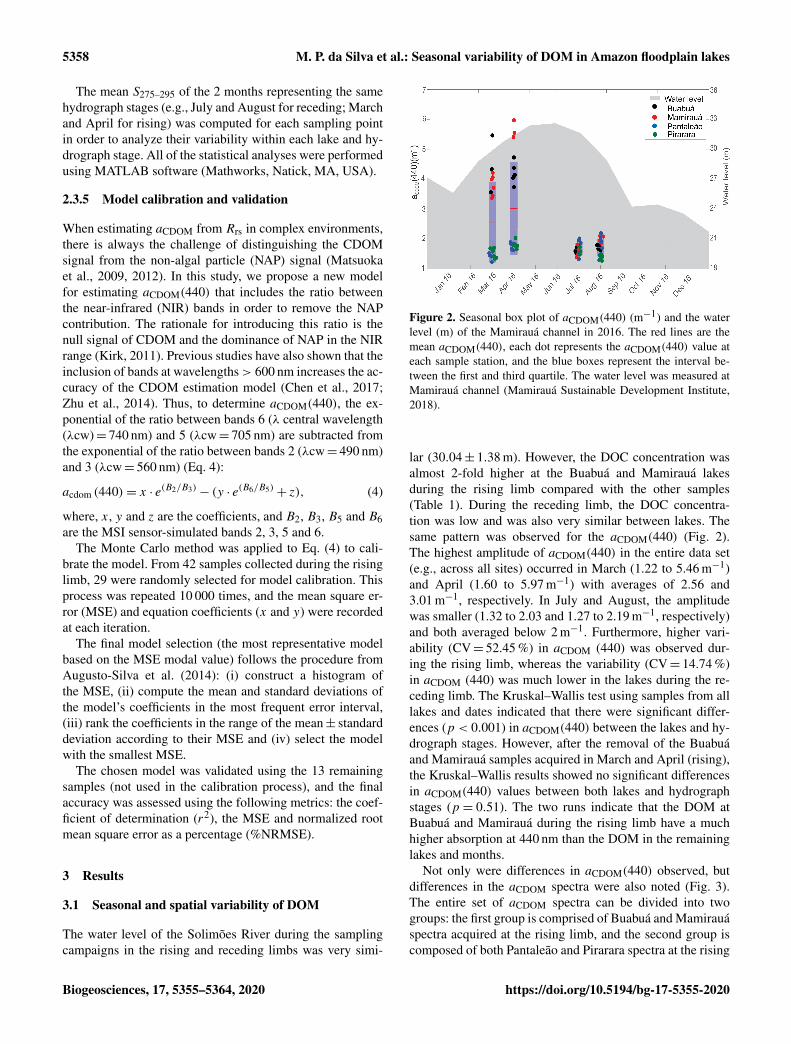
Figure 2. Seasonal box plot of aCDOM(440) (m−1) and the waterlevel (m) of the Mamirauá channel in 2016. The red lines are themean aCDOM(440), each dot represents the aCDOM(440) value ateach sample station, and the blue boxes represent the interval be-tween the first and third quartile. The water level was measured atMamirauá channel (Mamirauá Sustainable Development Institute,2018).
lar (30.04± 1.38 m). However, the DOC concentration wasalmost 2-fold higher at the Buabuá and Mamirauá lakesduring the rising limb compared with the other samples(Table 1). During the receding limb, the DOC concentra-tion was low and was also very similar between lakes. Thesame pattern was observed for the aCDOM(440) (Fig. 2).The highest amplitude of aCDOM(440) in the entire data set(e.g., across all sites) occurred in March (1.22 to 5.46 m−1)and April (1.60 to 5.97 m−1) with averages of 2.56 and3.01 m−1, respectively. In July and August, the amplitudewas smaller (1.32 to 2.03 and 1.27 to 2.19 m−1, respectively)and both averaged below 2 m−1. Furthermore, higher vari-ability (CV= 52.45 %) in aCDOM (440) was observed dur-ing the rising limb, whereas the variability (CV= 14.74 %)in aCDOM (440) was much lower in the lakes during the re-ceding limb. The Kruskal–Wallis test using samples from alllakes and dates indicated that there were significant differ-ences (p < 0.001) in aCDOM(440) between the lakes and hy-drograph stages. However, after the removal of the Buabuáand Mamirauá samples acquired in March and April (rising),the Kruskal–Wallis results showed no significant differencesin aCDOM(440) values between both lakes and hydrographstages (p = 0.51). The two runs indicate that the DOM atBuabuá and Mamirauá during the rising limb have a muchhigher absorption at 440 nm than the DOM in the remaininglakes and months.
Not only were differences in aCDOM(440) observed, butdifferences in the aCDOM spectra were also noted (Fig. 3).The entire set of aCDOM spectra can be divided into twogroups: the first group is comprised of Buabuá and Mamirauáspectra acquired at the rising limb, and the second group iscomposed of both Pantaleão and Pirarara spectra at the rising
Biogeosciences, 17, 5355–5364, 2020 https://doi.org/10.5194/bg-17-5355-2020
M. P. da Silva et al.: Seasonal variability of DOM in Amazon floodplain lakes 5359
Table 1. Overview of the sampling points.
Lake DOC (mg L−1) aCDOM (440) (m−1) S275–295 (nm−1) SUVA254 (L mgC−1 m−1)
Rising Receding Rising Receding Rising Receding Rising Receding
Buabuá 8.20± 0.88 3.96± 0.17 4.27± 0.56 1.71± 0.13 0.0147± 0.0002 0.0160± 0.0003 9.44± 0.43 8.43± 0.52Mamirauá 8.58± 1.00 4.33± 0.29 4.41± 0.97 1.80± 0.25 0.0145± 0.0002 0.0161± 0.0002 8.87± 1.09 8.22± 1.12Pantaleão 5.89± 2.40 3.68± 0.35 1.59± 0.97 1.74± 0.30 0.0145± 0.0002 0.0150± 0.0000 8.32± 1.10 8.55± 1.50Pirarara 4.15± 1.50 4.06± 0.42 1.66± 0.20 1.45± 0.14 0.0153± 0.0003 0.154± 0.0004 8.19± 1.73 6.98± 0.81
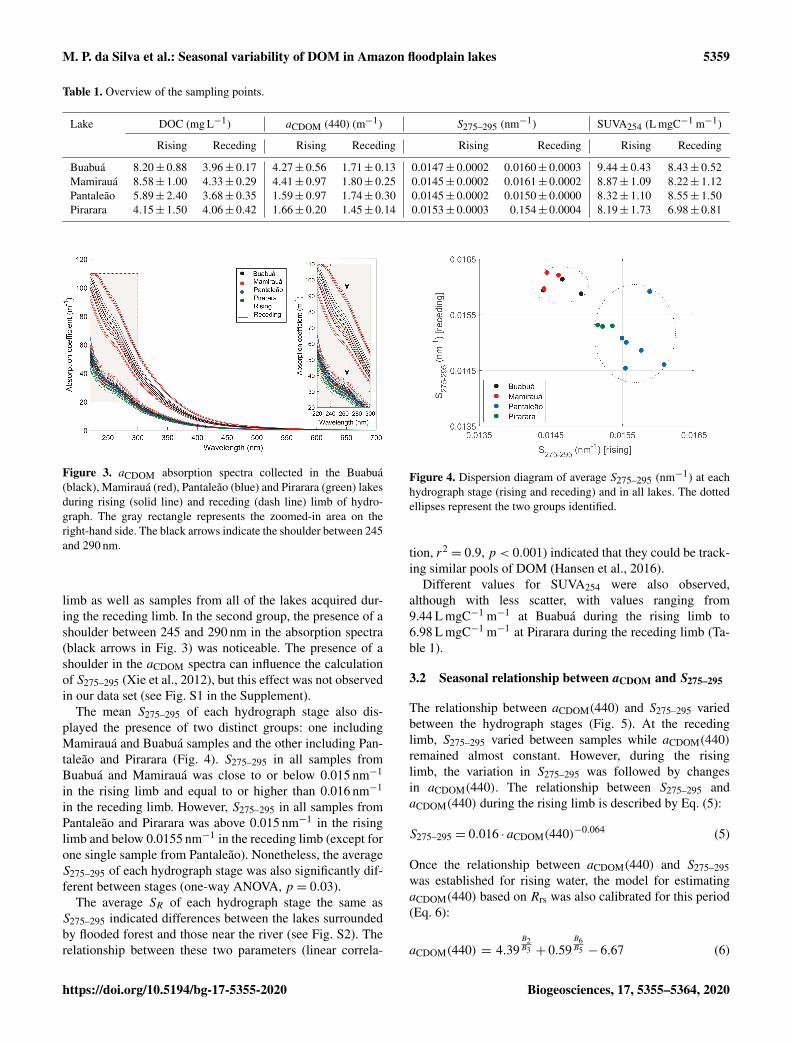
Figure 3. aCDOM absorption spectra collected in the Buabuá(black), Mamirauá (red), Pantaleão (blue) and Pirarara (green) lakesduring rising (solid line) and receding (dash line) limb of hydro-graph. The gray rectangle represents the zoomed-in area on theright-hand side. The black arrows indicate the shoulder between 245and 290 nm.
limb as well as samples from all of the lakes acquired dur-ing the receding limb. In the second group, the presence of ashoulder between 245 and 290 nm in the absorption spectra(black arrows in Fig. 3) was noticeable. The presence of ashoulder in the aCDOM spectra can influence the calculationof S275–295 (Xie et al., 2012), but this effect was not observedin our data set (see Fig. S1 in the Supplement).
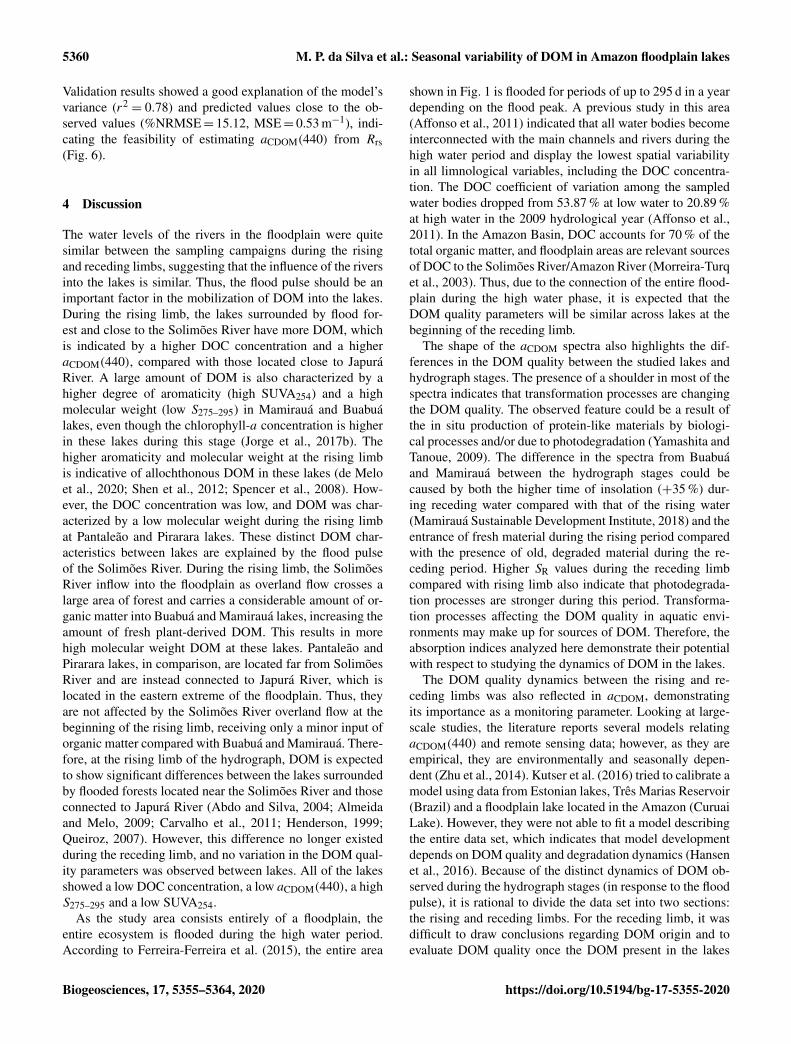
The mean S275–295 of each hydrograph stage also dis-played the presence of two distinct groups: one includingMamirauá and Buabuá samples and the other including Pan-taleão and Pirarara (Fig. 4). S275–295 in all samples fromBuabuá and Mamirauá was close to or below 0.015 nm−1
in the rising limb and equal to or higher than 0.016 nm−1
in the receding limb. However, S275–295 in all samples fromPantaleão and Pirarara was above 0.015 nm−1 in the risinglimb and below 0.0155 nm−1 in the receding limb (except forone single sample from Pantaleão). Nonetheless, the averageS275–295 of each hydrograph stage was also significantly dif-ferent between stages (one-way ANOVA, p = 0.03).
The average SR of each hydrograph stage the same asS275–295 indicated differences between the lakes surroundedby flooded forest and those near the river (see Fig. S2). Therelationship between these two parameters (linear correla-
Figure 4. Dispersion diagram of average S275–295 (nm−1) at eachhydrograph stage (rising and receding) and in all lakes. The dottedellipses represent the two groups identified.
tion, r2= 0.9, p < 0.001) indicated that they could be track-
ing similar pools of DOM (Hansen et al., 2016).Different values for SUVA254 were also observed,
although with less scatter, with values ranging from9.44 L mgC−1 m−1 at Buabuá during the rising limb to6.98 L mgC−1 m−1 at Pirarara during the receding limb (Ta-ble 1).
3.2 Seasonal relationship between aCDOM and S275–295
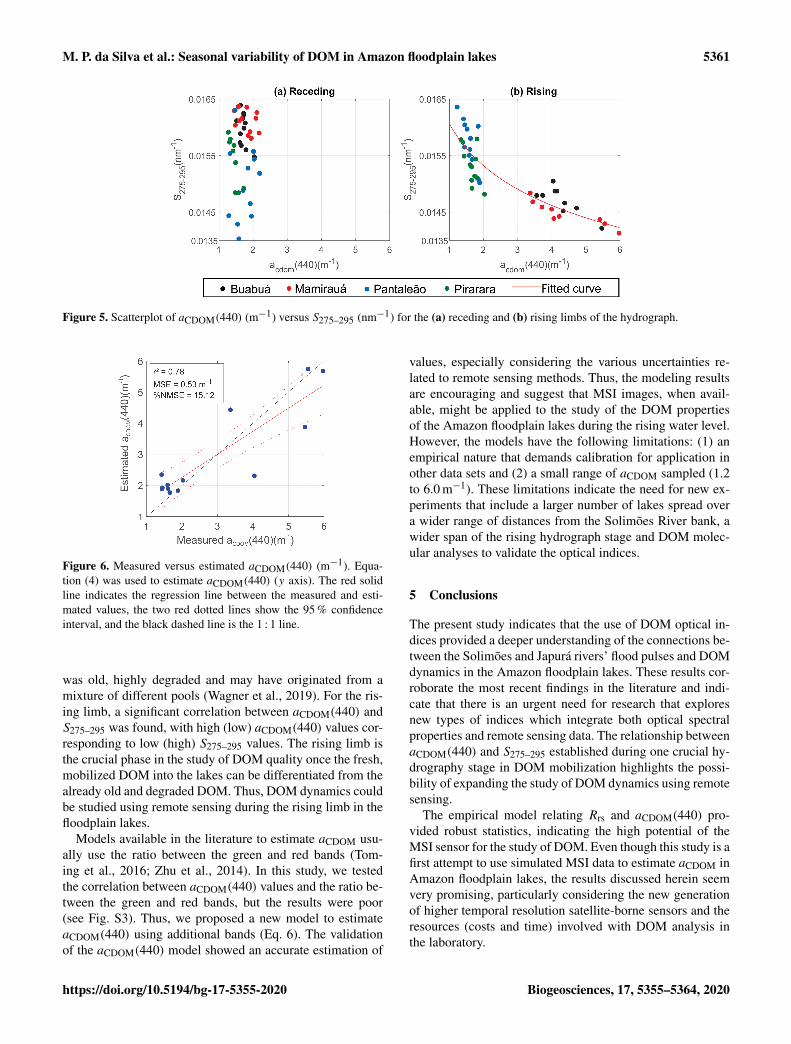
The relationship between aCDOM(440) and S275–295 variedbetween the hydrograph stages (Fig. 5). At the recedinglimb, S275–295 varied between samples while aCDOM(440)remained almost constant. However, during the risinglimb, the variation in S275–295 was followed by changesin aCDOM(440). The relationship between S275–295 andaCDOM(440) during the rising limb is described by Eq. (5):
S275–295 = 0.016 · aCDOM(440)−0.064 (5)
Once the relationship between aCDOM(440) and S275–295was established for rising water, the model for estimatingaCDOM(440) based on Rrs was also calibrated for this period(Eq. 6):
aCDOM(440) = 4.39B2B3 + 0.59
B6B5 − 6.67 (6)
https://doi.org/10.5194/bg-17-5355-2020 Biogeosciences, 17, 5355–5364, 2020
5360 M. P. da Silva et al.: Seasonal variability of DOM in Amazon floodplain lakes
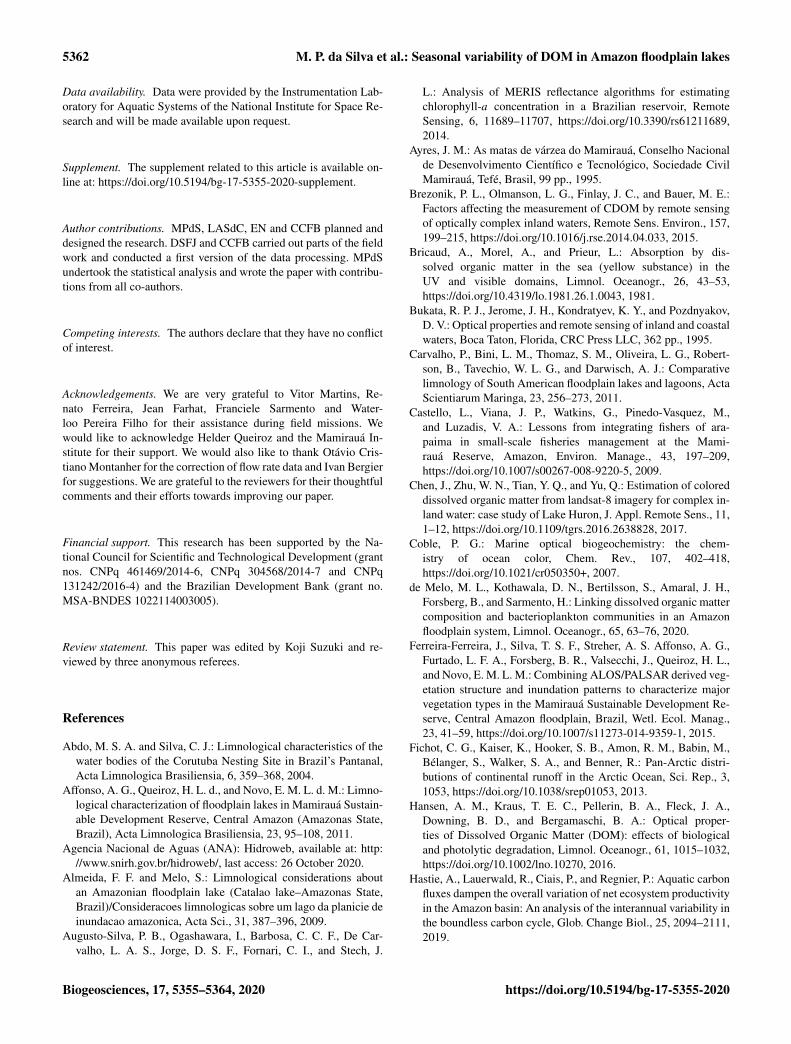
Validation results showed a good explanation of the model’svariance (r2
= 0.78) and predicted values close to the ob-served values (%NRMSE= 15.12, MSE= 0.53 m−1), indi-cating the feasibility of estimating aCDOM(440) from Rrs(Fig. 6).
4 Discussion
The water levels of the rivers in the floodplain were quitesimilar between the sampling campaigns during the risingand receding limbs, suggesting that the influence of the riversinto the lakes is similar. Thus, the flood pulse should be animportant factor in the mobilization of DOM into the lakes.During the rising limb, the lakes surrounded by flood for-est and close to the Solimões River have more DOM, whichis indicated by a higher DOC concentration and a higheraCDOM(440), compared with those located close to JapuráRiver. A large amount of DOM is also characterized by ahigher degree of aromaticity (high SUVA254) and a highmolecular weight (low S275–295) in Mamirauá and Buabuálakes, even though the chlorophyll-a concentration is higherin these lakes during this stage (Jorge et al., 2017b). Thehigher aromaticity and molecular weight at the rising limbis indicative of allochthonous DOM in these lakes (de Meloet al., 2020; Shen et al., 2012; Spencer et al., 2008). How-ever, the DOC concentration was low, and DOM was char-acterized by a low molecular weight during the rising limbat Pantaleão and Pirarara lakes. These distinct DOM char-acteristics between lakes are explained by the flood pulseof the Solimões River. During the rising limb, the SolimõesRiver inflow into the floodplain as overland flow crosses alarge area of forest and carries a considerable amount of or-ganic matter into Buabuá and Mamirauá lakes, increasing theamount of fresh plant-derived DOM. This results in morehigh molecular weight DOM at these lakes. Pantaleão andPirarara lakes, in comparison, are located far from SolimõesRiver and are instead connected to Japurá River, which islocated in the eastern extreme of the floodplain. Thus, theyare not affected by the Solimões River overland flow at thebeginning of the rising limb, receiving only a minor input oforganic matter compared with Buabuá and Mamirauá. There-fore, at the rising limb of the hydrograph, DOM is expectedto show significant differences between the lakes surroundedby flooded forests located near the Solimões River and thoseconnected to Japurá River (Abdo and Silva, 2004; Almeidaand Melo, 2009; Carvalho et al., 2011; Henderson, 1999;Queiroz, 2007). However, this difference no longer existedduring the receding limb, and no variation in the DOM qual-ity parameters was observed between lakes. All of the lakesshowed a low DOC concentration, a low aCDOM(440), a highS275–295 and a low SUVA254.
As the study area consists entirely of a floodplain, theentire ecosystem is flooded during the high water period.According to Ferreira-Ferreira et al. (2015), the entire area
shown in Fig. 1 is flooded for periods of up to 295 d in a yeardepending on the flood peak. A previous study in this area(Affonso et al., 2011) indicated that all water bodies becomeinterconnected with the main channels and rivers during thehigh water period and display the lowest spatial variabilityin all limnological variables, including the DOC concentra-tion. The DOC coefficient of variation among the sampledwater bodies dropped from 53.87 % at low water to 20.89 %at high water in the 2009 hydrological year (Affonso et al.,2011). In the Amazon Basin, DOC accounts for 70 % of thetotal organic matter, and floodplain areas are relevant sourcesof DOC to the Solimões River/Amazon River (Morreira-Turqet al., 2003). Thus, due to the connection of the entire flood-plain during the high water phase, it is expected that theDOM quality parameters will be similar across lakes at thebeginning of the receding limb.
The shape of the aCDOM spectra also highlights the dif-ferences in the DOM quality between the studied lakes andhydrograph stages. The presence of a shoulder in most of thespectra indicates that transformation processes are changingthe DOM quality. The observed feature could be a result ofthe in situ production of protein-like materials by biologi-cal processes and/or due to photodegradation (Yamashita andTanoue, 2009). The difference in the spectra from Buabuáand Mamirauá between the hydrograph stages could becaused by both the higher time of insolation (+35 %) dur-ing receding water compared with that of the rising water(Mamirauá Sustainable Development Institute, 2018) and theentrance of fresh material during the rising period comparedwith the presence of old, degraded material during the re-ceding period. Higher SR values during the receding limbcompared with rising limb also indicate that photodegrada-tion processes are stronger during this period. Transforma-tion processes affecting the DOM quality in aquatic envi-ronments may make up for sources of DOM. Therefore, theabsorption indices analyzed here demonstrate their potentialwith respect to studying the dynamics of DOM in the lakes.
The DOM quality dynamics between the rising and re-ceding limbs was also reflected in aCDOM, demonstratingits importance as a monitoring parameter. Looking at large-scale studies, the literature reports several models relatingaCDOM(440) and remote sensing data; however, as they areempirical, they are environmentally and seasonally depen-dent (Zhu et al., 2014). Kutser et al. (2016) tried to calibrate amodel using data from Estonian lakes, Três Marias Reservoir(Brazil) and a floodplain lake located in the Amazon (CuruaiLake). However, they were not able to fit a model describingthe entire data set, which indicates that model developmentdepends on DOM quality and degradation dynamics (Hansenet al., 2016). Because of the distinct dynamics of DOM ob-served during the hydrograph stages (in response to the floodpulse), it is rational to divide the data set into two sections:the rising and receding limbs. For the receding limb, it wasdifficult to draw conclusions regarding DOM origin and toevaluate DOM quality once the DOM present in the lakes
Biogeosciences, 17, 5355–5364, 2020 https://doi.org/10.5194/bg-17-5355-2020
M. P. da Silva et al.: Seasonal variability of DOM in Amazon floodplain lakes 5361
Figure 5. Scatterplot of aCDOM(440) (m−1) versus S275–295 (nm−1) for the (a) receding and (b) rising limbs of the hydrograph.
Figure 6. Measured versus estimated aCDOM(440) (m−1). Equa-tion (4) was used to estimate aCDOM(440) (y axis). The red solidline indicates the regression line between the measured and esti-mated values, the two red dotted lines show the 95 % confidenceinterval, and the black dashed line is the 1 : 1 line.
was old, highly degraded and may have originated from amixture of different pools (Wagner et al., 2019). For the ris-ing limb, a significant correlation between aCDOM(440) andS275–295 was found, with high (low) aCDOM(440) values cor-responding to low (high) S275–295 values. The rising limb isthe crucial phase in the study of DOM quality once the fresh,mobilized DOM into the lakes can be differentiated from thealready old and degraded DOM. Thus, DOM dynamics couldbe studied using remote sensing during the rising limb in thefloodplain lakes.
Models available in the literature to estimate aCDOM usu-ally use the ratio between the green and red bands (Tom-ing et al., 2016; Zhu et al., 2014). In this study, we testedthe correlation between aCDOM(440) values and the ratio be-tween the green and red bands, but the results were poor(see Fig. S3). Thus, we proposed a new model to estimateaCDOM(440) using additional bands (Eq. 6). The validationof the aCDOM(440) model showed an accurate estimation of
values, especially considering the various uncertainties re-lated to remote sensing methods. Thus, the modeling resultsare encouraging and suggest that MSI images, when avail-able, might be applied to the study of the DOM propertiesof the Amazon floodplain lakes during the rising water level.However, the models have the following limitations: (1) anempirical nature that demands calibration for application inother data sets and (2) a small range of aCDOM sampled (1.2to 6.0 m−1). These limitations indicate the need for new ex-periments that include a larger number of lakes spread overa wider range of distances from the Solimões River bank, awider span of the rising hydrograph stage and DOM molec-ular analyses to validate the optical indices.
5 Conclusions
The present study indicates that the use of DOM optical in-dices provided a deeper understanding of the connections be-tween the Solimões and Japurá rivers’ flood pulses and DOMdynamics in the Amazon floodplain lakes. These results cor-roborate the most recent findings in the literature and indi-cate that there is an urgent need for research that exploresnew types of indices which integrate both optical spectralproperties and remote sensing data. The relationship betweenaCDOM(440) and S275–295 established during one crucial hy-drography stage in DOM mobilization highlights the possi-bility of expanding the study of DOM dynamics using remotesensing.
The empirical model relating Rrs and aCDOM(440) pro-vided robust statistics, indicating the high potential of theMSI sensor for the study of DOM. Even though this study is afirst attempt to use simulated MSI data to estimate aCDOM inAmazon floodplain lakes, the results discussed herein seemvery promising, particularly considering the new generationof higher temporal resolution satellite-borne sensors and theresources (costs and time) involved with DOM analysis inthe laboratory.
https://doi.org/10.5194/bg-17-5355-2020 Biogeosciences, 17, 5355–5364, 2020
5362 M. P. da Silva et al.: Seasonal variability of DOM in Amazon floodplain lakes
Data availability. Data were provided by the Instrumentation Lab-oratory for Aquatic Systems of the National Institute for Space Re-search and will be made available upon request.
Supplement. The supplement related to this article is available on-line at: https://doi.org/10.5194/bg-17-5355-2020-supplement.
Author contributions. MPdS, LASdC, EN and CCFB planned anddesigned the research. DSFJ and CCFB carried out parts of the fieldwork and conducted a first version of the data processing. MPdSundertook the statistical analysis and wrote the paper with contribu-tions from all co-authors.
Competing interests. The authors declare that they have no conflictof interest.
Acknowledgements. We are very grateful to Vitor Martins, Re-nato Ferreira, Jean Farhat, Franciele Sarmento and Water-loo Pereira Filho for their assistance during field missions. Wewould like to acknowledge Helder Queiroz and the Mamirauá In-stitute for their support. We would also like to thank Otávio Cris-tiano Montanher for the correction of flow rate data and Ivan Bergierfor suggestions. We are grateful to the reviewers for their thoughtfulcomments and their efforts towards improving our paper.
Financial support. This research has been supported by the Na-tional Council for Scientific and Technological Development (grantnos. CNPq 461469/2014-6, CNPq 304568/2014-7 and CNPq131242/2016-4) and the Brazilian Development Bank (grant no.MSA-BNDES 1022114003005).
Review statement. This paper was edited by Koji Suzuki and re-viewed by three anonymous referees.
References
Abdo, M. S. A. and Silva, C. J.: Limnological characteristics of thewater bodies of the Corutuba Nesting Site in Brazil’s Pantanal,Acta Limnologica Brasiliensia, 6, 359–368, 2004.
Affonso, A. G., Queiroz, H. L. d., and Novo, E. M. L. d. M.: Limno-logical characterization of floodplain lakes in Mamirauá Sustain-able Development Reserve, Central Amazon (Amazonas State,Brazil), Acta Limnologica Brasiliensia, 23, 95–108, 2011.
Agencia Nacional de Aguas (ANA): Hidroweb, available at: http://www.snirh.gov.br/hidroweb/, last access: 26 October 2020.
Almeida, F. F. and Melo, S.: Limnological considerations aboutan Amazonian floodplain lake (Catalao lake–Amazonas State,Brazil)/Consideracoes limnologicas sobre um lago da planicie deinundacao amazonica, Acta Sci., 31, 387–396, 2009.
Augusto-Silva, P. B., Ogashawara, I., Barbosa, C. C. F., De Car-valho, L. A. S., Jorge, D. S. F., Fornari, C. I., and Stech, J.
L.: Analysis of MERIS reflectance algorithms for estimatingchlorophyll-a concentration in a Brazilian reservoir, RemoteSensing, 6, 11689–11707, https://doi.org/10.3390/rs61211689,2014.
Ayres, J. M.: As matas de várzea do Mamirauá, Conselho Nacionalde Desenvolvimento Científico e Tecnológico, Sociedade CivilMamirauá, Tefé, Brasil, 99 pp., 1995.
Brezonik, P. L., Olmanson, L. G., Finlay, J. C., and Bauer, M. E.:Factors affecting the measurement of CDOM by remote sensingof optically complex inland waters, Remote Sens. Environ., 157,199–215, https://doi.org/10.1016/j.rse.2014.04.033, 2015.
Bricaud, A., Morel, A., and Prieur, L.: Absorption by dis-solved organic matter in the sea (yellow substance) in theUV and visible domains, Limnol. Oceanogr., 26, 43–53,https://doi.org/10.4319/lo.1981.26.1.0043, 1981.
Bukata, R. P. J., Jerome, J. H., Kondratyev, K. Y., and Pozdnyakov,D. V.: Optical properties and remote sensing of inland and coastalwaters, Boca Taton, Florida, CRC Press LLC, 362 pp., 1995.
Carvalho, P., Bini, L. M., Thomaz, S. M., Oliveira, L. G., Robert-son, B., Tavechio, W. L. G., and Darwisch, A. J.: Comparativelimnology of South American floodplain lakes and lagoons, ActaScientiarum Maringa, 23, 256–273, 2011.
Castello, L., Viana, J. P., Watkins, G., Pinedo-Vasquez, M.,and Luzadis, V. A.: Lessons from integrating fishers of ara-paima in small-scale fisheries management at the Mami-rauá Reserve, Amazon, Environ. Manage., 43, 197–209,https://doi.org/10.1007/s00267-008-9220-5, 2009.
Chen, J., Zhu, W. N., Tian, Y. Q., and Yu, Q.: Estimation of coloreddissolved organic matter from landsat-8 imagery for complex in-land water: case study of Lake Huron, J. Appl. Remote Sens., 11,1–12, https://doi.org/10.1109/tgrs.2016.2638828, 2017.
Coble, P. G.: Marine optical biogeochemistry: the chem-istry of ocean color, Chem. Rev., 107, 402–418,https://doi.org/10.1021/cr050350+, 2007.
de Melo, M. L., Kothawala, D. N., Bertilsson, S., Amaral, J. H.,Forsberg, B., and Sarmento, H.: Linking dissolved organic mattercomposition and bacterioplankton communities in an Amazonfloodplain system, Limnol. Oceanogr., 65, 63–76, 2020.
Ferreira-Ferreira, J., Silva, T. S. F., Streher, A. S. Affonso, A. G.,Furtado, L. F. A., Forsberg, B. R., Valsecchi, J., Queiroz, H. L.,and Novo, E. M. L. M.: Combining ALOS/PALSAR derived veg-etation structure and inundation patterns to characterize majorvegetation types in the Mamirauá Sustainable Development Re-serve, Central Amazon floodplain, Brazil, Wetl. Ecol. Manag.,23, 41–59, https://doi.org/10.1007/s11273-014-9359-1, 2015.
Fichot, C. G., Kaiser, K., Hooker, S. B., Amon, R. M., Babin, M.,Bélanger, S., Walker, S. A., and Benner, R.: Pan-Arctic distri-butions of continental runoff in the Arctic Ocean, Sci. Rep., 3,1053, https://doi.org/10.1038/srep01053, 2013.
Hansen, A. M., Kraus, T. E. C., Pellerin, B. A., Fleck, J. A.,Downing, B. D., and Bergamaschi, B. A.: Optical proper-ties of Dissolved Organic Matter (DOM): effects of biologicaland photolytic degradation, Limnol. Oceanogr., 61, 1015–1032,https://doi.org/10.1002/lno.10270, 2016.
Hastie, A., Lauerwald, R., Ciais, P., and Regnier, P.: Aquatic carbonfluxes dampen the overall variation of net ecosystem productivityin the Amazon basin: An analysis of the interannual variability inthe boundless carbon cycle, Glob. Change Biol., 25, 2094–2111,2019.
Biogeosciences, 17, 5355–5364, 2020 https://doi.org/10.5194/bg-17-5355-2020
M. P. da Silva et al.: Seasonal variability of DOM in Amazon floodplain lakes 5363
Helms, J. R., Stubbins, A., Ritchie, J. D., Minor, E. C., Kieber, D.J., and Mopper, K.: Absorption spectral slopes and slope ratiosas indicators of molecular weight, source, and photobleaching ofchromophoric dissolved organic matter, Limonol. Oceanogr., 53,955–969, https://doi.org/10.4319/lo.2008.53.3.0955, 2008.
Henderson, P. A.: O ambiente aquático da Reserva Mamirauá, in:Estratégias de Manejo de recursos Pesqueiros em Mamirauá,edited by: Queiroz, H. L. and Crampton, W. G. R., SCM, MCT-CNPq. Brasília, Cap. 1, 1–9, 1999.
Inamdar, S., Finger, N., Singh, S., Mitchell, M., Levia,D., Bais, H., Scott, D., and McHale, P.: Dissolved or-ganic matter (DOM) concentration and quality in a forestedmid-Atlantic watershed, USA, Biogeochemistry, 108, 55–76,https://doi.org/10.1007/s10533-011-9572-4, 2012.
Jaffé, R., McKnight, D., Maie, N., Cory, R., McDowell, W. H., andCampbell, J. L.: Spatial and temporal variations in DOM compo-sition in ecosystems: The importance of long-term monitoringof optical properties, J. Geophys. Res.-Biogeo., 113, G04032,https://doi.org/10.1029/2008JG000683, 2008.
Jorge, D. S. F., Barbosa, C. C., Affonso, A. G., and Novo, E. M. L.d. M.: Spatial-temporal characterization of optical properties of 4lakes in the Mamirauá Sustainable Development Reserve – AM(MSDR), in: Anais XVIII Simpósio Brasileiro de SensoriamentoRemoto, Santos – SP, 2017a.
Jorge, D. S. F., Barbosa, C. C., Carvalho, L. S. d., Affonso, A. G.,Lobo, F. d. L., and Novo, E. M. L. d. M.: SNR (signal-to-noiseratio) impact on water constituent retrieval from simulated im-ages of optically complex amazon lakes, Remote Sensing, 9, 644,https://doi.org/10.3390/rs9070644, 2017b.
Junk, W. J., Bayley, P. B., and Sparks, R. E.: The flood pulse conceptin river-floodplain systems, in: Proceedings of the InternationalLarge River Symposium, edited by: Dodge, D. P., Canadian Gov-ernment Publishing Centre, Ottawa, 110–127, Special Publica-tion of the Canadian Journal of Fisheries and Aquatic Sciences,no. 106, 1989.
Kirk, J. T. O.: Light and photosynthesis in aquatic ecosystems, 3rdEdn., Cambridge University Press, Cambridge, England, 528 pp.,2011.
Kutser, T., Pierson, D. C., Kallio, K. Y., Reinart, A., and Sobek, S.:Mapping lake CDOM by satellite remote sensing, Remote Sens.Environ., 94, 535–540, 2005.
Kutser, T., Casal Pascual, G., Barbosa, C., Paavel, B., Ferreira, R.,Carvalho, L., and Toming, K.: Mapping inland water carbon con-tent with Landsat 8 data, Int. J. Remote Sens., 37, 2950–2961,2016.
Li, P. and Hur, J.: Utilization of UV-Vis spectroscopy and relateddata analyses for dissolved organic matter (DOM) studies: A re-view, Crit. Rev. Environ. Sci. Technol., 47, 131–154, 2017.
Maia, C. M. and Volpato, G. L.: Environmental light color af-fects the stress response of Nile tilapia, Zoology, 116, 64–66,https://doi.org/10.1016/j.zool.2012.08.001, 2013.
Mamirauá Sustainable Development Institute: Database offluviometric data from Mamirauá Sustainable Develop-ment Reserve, available at: http://mamiraua.org.br/pt-br/pesquisa-e-monitoramento/monitoramento/fluviometrico/, lastaccess: 23 June 2018.
Matsuoka, A., Larouche, P., Poulin, M., Vinvent, W., and Hattori,H.: Phytoplankton community adaptation to changing light lev-
els in the southern Beaufort Sea, Canadian Arctic, Estuar. Coast.Shelf S., 82, 537–546, 2009.
Matsuoka, A., Bricaud, A., Benner, R., Para, J., Sempéré, R., Prieur,L., Bélanger, S., and Babin, M.: Tracing the transport of col-ored dissolved organic matter in water masses of the South-ern Beaufort Sea: relationship with hydrographic characteristics,Biogeosciences, 9, 925–940, https://doi.org/10.5194/bg-9-925-2012, 2012.
Mobley, C. D.: Estimation of the remote-sensing reflectance fromabove-surface measurements, Appl. Optics, 38, 7442–7455,https://doi.org/10.1364/ao.38.007442, 1999.
Moreira-Turcq, P., Seyler, P., Guyot, J. L., and Etcheber, H.: Ex-portation of organic carbon from the Amazon River and its maintributaries, Hydrol. Process., 17, 1329–1344, 2003.
Mori, G. B., Schietti, J., Poorter, L., and Piedade, M. T.F.: Trait divergence and habitat specialization in tropi-cal floodplain forests trees, PLoS ONE, 14, e0212232,https://doi.org/10.1371/journal.pone.0212232, 2019.
Mueller, J. L. and Fargion, G. S.: Ocean Optics Protocols for Satel-lite Ocean Color Sensor Validation, Revision 3, NASA TM 2002-210004, NASA Goddard Space Flight Center, Greenbelt, MD,USA, p. 308, 2002.
Queiroz, H. L.: Classification of water bodies based on biotic andabiotic parameters at the várzeas of Mamirauá Reserve, CentralAmazon, Uakari, 3, 19–34, 2007.
Richey, J. E., Melack, J. M., Aufdenkampe, A. K., Ballester, V. M.,and Hess, L. L.: Outgassing from Amazonian rivers and wetlandsas a large tropical source of atmospheric CO2, Nature, 416, 617–620, https://doi.org/10.1038/416617a, 2002.
Seekell, D. A., Lapierre, J.-F., and Cheruvelil, K. S.: A geographyof lake carbon cycling, Limnol. Oceanogr. Lett., 3, 49–56, 2018.
Shen, Y., Fichot, C. G., and Benner, R.: Floodplain influenceon dissolved organic matter composition and export from theMississippi-Atchafalaya River system to the Gulf of Mexico,Limnol. Oceanogr., 57, 1149–1160, 2012.
Spencer, R. G., Aiken, G. R., Wickland, K. P., Striegl, R. G.,and Hernes, P. J.: Seasonal and spatial variability in dis-solved organic matter quantity and composition from the YukonRiver basin, Alaska, Global Biogeochem. Cy., 22, GB4002,https://doi.org/10.1029/2008GB003231, 2008.
Toming, K., Kutser, T., Laas, A., Sepp, M., Paavel, B., and No-ges, T.: First experiences in mapping lake water quality param-eters with Sentinel-2 MSI imagery, Remote Sensing, 8, 1–14,https://doi.org/10.3390/rs8080640, 2016.
Tranvik, L. J., Downing, J. A., Cotner, J. B., Loiselle, S. A.,Striegl, R. G., Ballatore, T. J., Dillon, P., Finlay, K., Fortino,K., Knoll, L. B., Kortelainen, P. L., Kutser, T., Larsen, S., Lau-rion, I., Leech, D. M., McCallister, S. L., McKnight, D. M.,Melack, J. M., Overholt, E., Porter, J. A., Prairie, Y., Renwick,W. H., Roland, F., Sherman, B. S., Schindler, D. W., Sobek,S., Tremblay, A., Vanni, M. J., Verschoor, A. M., von Wachen-feldt, E., and Weyhenmeyer, G. A.: Lakes and reservoirs as reg-ulators of carbon cycling and climate, Limnol. Oceanogr., 54,https://doi.org/10.4319/lo.2009.54.6_part_2.2298, 2009.
TRIOS: Trios sensor, avaliable at: https://www.trios.de/en/ (last ac-cess: 26 October 2020), 2018.
Vantrepotte, V., Danhiez, F. P., Loisel, H., Ouillon, S., Mériaux,X., Cauvin, A., and Dessailly, D.: CDOM-DOC relationshipin contrasted coastal waters: implication for doc retrieval from
https://doi.org/10.5194/bg-17-5355-2020 Biogeosciences, 17, 5355–5364, 2020
5364 M. P. da Silva et al.: Seasonal variability of DOM in Amazon floodplain lakes
ocean color remote sensing observation, Opt. Express, 23, 33–54, https://doi.org/10.1364/oe.23.000033, 2015.
Volpato, G. L., Duarte, C. R. A., and Luchiari, A. C.: En-vironmental color affects Nile tilapia reproduction, Braz. J.Med. Biol. Res., 37, 479–483, https://doi.org/10.1590/s0100-879x2004000400004, 2004.
Wagner, S., Fair, J. H., Matt, S., Hosen, J. D., Raymond, P., Saiers,J., Shanley, J. B., Dittmar, T., and Stubbins, A.: Molecular Hys-teresis: Hydrologically Driven Changes in Riverine DissolvedOrganic Matter Chemistry During a Storm Event, J. Geophys.Res.-Biogeo., 124, 759–774, 2019.
Werdell, J., McKinna, L. I. W., Boss, E., Ackleson, S. G., Craig,S. E., Gregg, W. W., Lee, Z., Maritorena, S., Roesler, C. S.,Rousseaux, C. S., Stramski, D., Sullivan, J. M., Twardowski, M.S., Tzortziou, M., and Zhang, X.: An overview of approachesand challenges for retrieving marine inherent optical propertiesfrom ocean color remote sensing, Prog. Oceanogr., 160, 186–212, https://doi.org/10.1016/j.pocean.2018.01.001, 2018.
Xie, H., Aubry, C., Bélanger, S., and Song, G.: The dynamicsof absorption coefficients of CDOM and particles in the St.Lawrence estuarine system: Biogeochemical and physical impli-cations, Mar. Chem., 128, 44–56, 2012.
Yamashita, Y. and Tanoue, E.: Basin scale distribution of chro-mophoric dissolved organic matter in the Pacific Ocean, Limnol.Oceanogr., 54, 598–609, 2009.
Zhu, W., Yu, Q., Tian, Y. Q., Becker, B. L., Zheng, T.,and Carrick, H. J.: An assessment of remote sensing algo-rithms for colored dissolved organic matter in complex fresh-water environments, Remote Sens. Environ., 140, 766–778,https://doi.org/10.1016/j.rse.2013.10.015, 2014.
Biogeosciences, 17, 5355–5364, 2020 https://doi.org/10.5194/bg-17-5355-2020
Related Documents