Annual Report 2019 Uscom Limited ASX: UCM www.uscom.com.au

Welcome message from author
This document is posted to help you gain knowledge. Please leave a comment to let me know what you think about it! Share it to your friends and learn new things together.
Transcript

Annual Report 2019Uscom Limited ASX: UCMwww.uscom.com.au
CONTENTS
CHAIRMAN’S LETTER ................................................................................................................ 2-9
ANNOUNCEMENTS FY 2019 .............................................................................................. 10
DIRECTORS REPORT ..................................................................................................... 11-17
FINANCIAL REPORT
AUDITORS INDEPENDENCE DECLARATION ....................................................................... 18
STATEMENT OF PROFIT AND LOSS & OTHER COMPREHENSIVE INCOME ................... 19
STATEMENT OF FINANCIAL POSITION ................................................................................ 20
STATEMENT OF CHANGES IN EQUITY ................................................................................. 21
STATEMENT OF CASH FLOWS .............................................................................................. 22
NOTES TO FINANCIAL STATEMENTS ............................................................................. 23-42
DIRECTORS DECLARATION ............................................................................................... 43
INDEPENDENT AUDIT REPORT ................................................................................... 44-47
SHAREHOLDER INFORMATION .................................................................................. 48-49
ANNUAL REPORT 2019 | Uscom Limited | Page 2
CHAIRMAN’S LETTER
DEAR INVESTORS, CUSTOMERS, PARTNERS, AND EMPLOYEES:
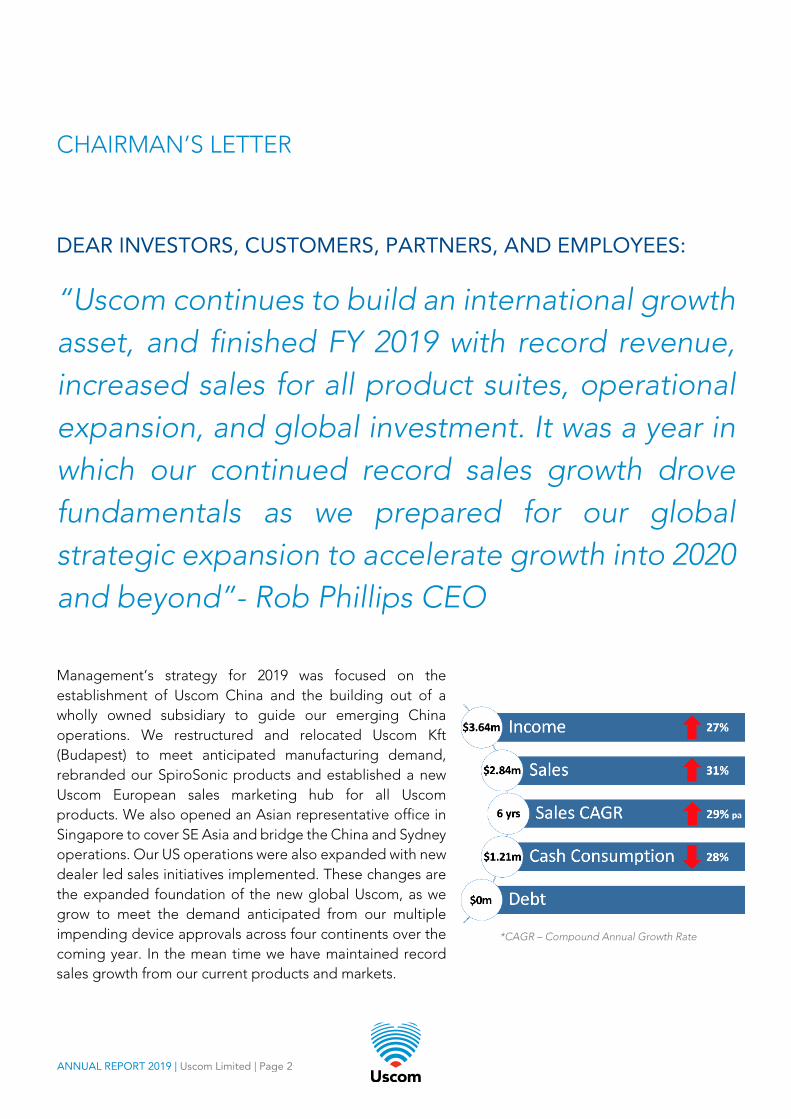
“Uscom continues to build an international growth asset, and finished FY 2019 with record revenue, increased sales for all product suites, operational expansion, and global investment. It was a year in which our continued record sales growth drove fundamentals as we prepared for our global strategic expansion to accelerate growth into 2020 and beyond”- Rob Phillips CEO
Management’s strategy for 2019 was focused on the establishment of Uscom China and the building out of a wholly owned subsidiary to guide our emerging China operations. We restructured and relocated Uscom Kft (Budapest) to meet anticipated manufacturing demand, rebranded our SpiroSonic products and established a new Uscom European sales marketing hub for all Uscom products. We also opened an Asian representative office in Singapore to cover SE Asia and bridge the China and Sydney operations. Our US operations were also expanded with new dealer led sales initiatives implemented. These changes are the expanded foundation of the new global Uscom, as we grow to meet the demand anticipated from our multiple impending device approvals across four continents over the coming year. In the mean time we have maintained record sales growth from our current products and markets.
*CAGR – Compound Annual Growth Rate
CHAIRMAN’S LETTER Continued
ANNUAL REPORT 2019 | Uscom Limited | Page 3
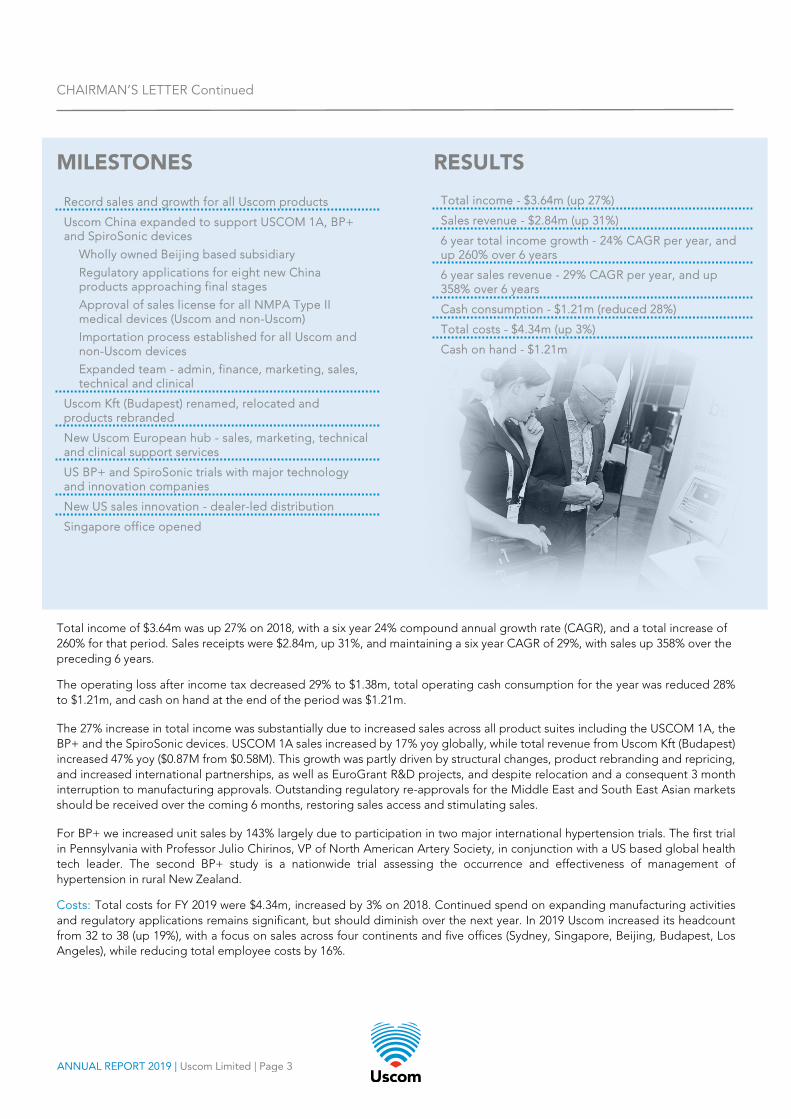
MILESTONES
RESULTS
Total income of $3.64m was up 27% on 2018, with a six year 24% compound annual growth rate (CAGR), and a total increase of 260% for that period. Sales receipts were $2.84m, up 31%, and maintaining a six year CAGR of 29%, with sales up 358% over the preceding 6 years.
The operating loss after income tax decreased 29% to $1.38m, total operating cash consumption for the year was reduced 28% to $1.21m, and cash on hand at the end of the period was $1.21m.
The 27% increase in total income was substantially due to increased sales across all product suites including the USCOM 1A, the BP+ and the SpiroSonic devices. USCOM 1A sales increased by 17% yoy globally, while total revenue from Uscom Kft (Budapest) increased 47% yoy ($0.87M from $0.58M). This growth was partly driven by structural changes, product rebranding and repricing, and increased international partnerships, as well as EuroGrant R&D projects, and despite relocation and a consequent 3 month interruption to manufacturing approvals. Outstanding regulatory re-approvals for the Middle East and South East Asian markets should be received over the coming 6 months, restoring sales access and stimulating sales.
For BP+ we increased unit sales by 143% largely due to participation in two major international hypertension trials. The first trial in Pennsylvania with Professor Julio Chirinos, VP of North American Artery Society, in conjunction with a US based global health tech leader. The second BP+ study is a nationwide trial assessing the occurrence and effectiveness of management of hypertension in rural New Zealand.
Costs: Total costs for FY 2019 were $4.34m, increased by 3% on 2018. Continued spend on expanding manufacturing activities and regulatory applications remains significant, but should diminish over the next year. In 2019 Uscom increased its headcount from 32 to 38 (up 19%), with a focus on sales across four continents and five offices (Sydney, Singapore, Beijing, Budapest, Los Angeles), while reducing total employee costs by 16%.
Record sales and growth for all Uscom products
Uscom China expanded to support USCOM 1A, BP+ and SpiroSonic devices
Wholly owned Beijing based subsidiary
Regulatory applications for eight new China products approaching final stages
Approval of sales license for all NMPA Type II medical devices (Uscom and non-Uscom)
Importation process established for all Uscom and non-Uscom devices
Expanded team - admin, finance, marketing, sales, technical and clinical
Uscom Kft (Budapest) renamed, relocated and products rebranded
New Uscom European hub - sales, marketing, technical and clinical support services
US BP+ and SpiroSonic trials with major technology and innovation companies
New US sales innovation - dealer-led distribution
Singapore office opened
Total income - $3.64m (up 27%)
Sales revenue - $2.84m (up 31%)
6 year total income growth - 24% CAGR per year, and up 260% over 6 years
6 year sales revenue - 29% CAGR per year, and up 358% over 6 years
Cash consumption - $1.21m (reduced 28%)
Total costs - $4.34m (up 3%)
Cash on hand - $1.21m
CHAIRMAN’S LETTER Continued
ANNUAL REPORT 2019 | Uscom Limited | Page 4
China: In 2019, we established a wholly owned subsidiary, Uscom China, in Chaoyang, Beijing. This was a significant task that involved:
1. registering Uscom China as a business entity 2. opening a Beijing office 3. opening trading and capital bank accounts 4. advancing our NMPA applications covering
eight products 5. submitting a new spirometry device for
regulatory approval 6. receiving type II medical device sales
certification 7. establishing a medical device importation
system 8. employing 6 clinical, financial, admin and
technical staff 9. applying for 20 China trademarks and
copyrights (3 received and 6 approved so far), 10. restructuring our sales and dealer models 11. developing China specific marketing materials
to support distributors and dealers 12. hosting our first national ICU congress 13. initiating discussions with potential Chinese
partners for local manufacturing and strategic partnerships.
China remains our strategic growth platform, and we are focused on advancing our NMPA applications of eight new products into the most accessible, and largest and fastest growing medical device market in the world, a not trivial feat. We are also developing new distribution and dealer relationships to more efficiently deliver sales. This year we have disrupted our established distribution model and introduced a more direct pathway via our Uscom China operations allowing us to reclaim margin and increase volume, and importantly expand our access to more of the 10,000 major Hospitals in China. The year ahead should see this strategy improve revenue and profit in Uscom China.
Europe: Uscom Budapest was formally renamed Uscom Kft and relocated to larger premises in Budapest, a move which was accompanied by rebranding and repricing of products, and restructuring of the operation. This year we also released the new SpiroSonic AIR device and initiated sales, marketing, and clinical and technical support activities for all Uscom products in Europe, creating a new Uscom European hub. Uscom Kft will continue its R&D function and continues to expand its manufacturing capacity to meet the anticipated demand once NMPA approvals are received. Expansion of our European operations will increase access to the European market, providing diversification and mitigating against regional economic and currency fluctuations.
USA: Uscom maintained its presence in the US despite a health care system with an unresolved future. We have revised the Uscom sales strategy, and are now re-engaging directly with dealers across the US with a new commission only model. We continue to make key USCOM 1A sales and preserve key relationships as we prepare for the FDA approvals of BP+ and SpiroSonic devices.
Singapore and Los Angeles: Uscom Limited has also registered representative offices in Singapore and Los Angeles.
Products: Uscom continued supporting our NMPA regulatory submissions in China for the BP+, BP+ Reporter, the SpiroSonic FLO, SMART, MOBILE, and the SpiroReporter, and the resubmission for the USCOM 1A. We also added the new SpiroSonic AIR digital ultrasonic spirometer to our NMPA application, taking the total of new products in regulatory approval to eight. The SpiroSonic AIR is the most advanced digital ultrasonic spirometer available and has been specifically developed for the home care asthma and COPD market in China. The NMPA process continues to progress and we are approaching certification, despite the slow pace of review. The time and cost to register eight products is significant, however registered products are revenue generators, and the approval of these new devices in China is anticipated to rapidly generate revenue, particularly as our current operations are approaching break even.
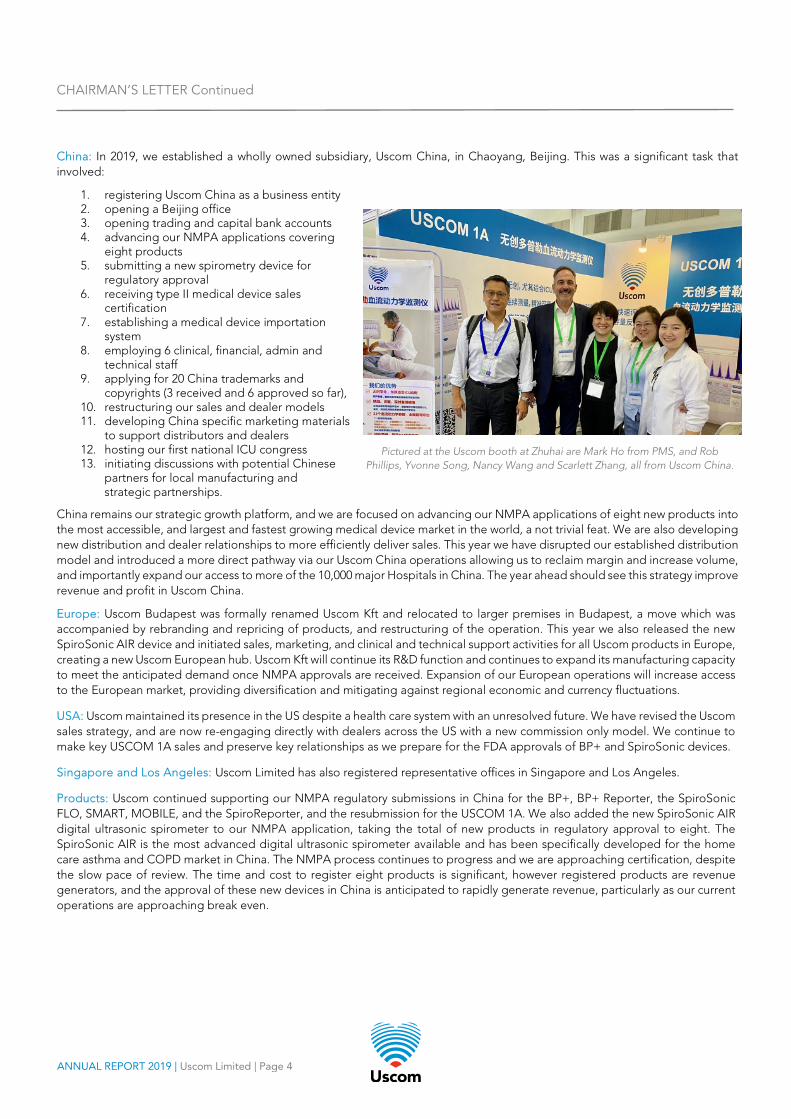
Pictured at the Uscom booth at Zhuhai are Mark Ho from PMS, and Rob Phillips, Yvonne Song, Nancy Wang and Scarlett Zhang, all from Uscom China.
CHAIRMAN’S LETTER Continued
ANNUAL REPORT 2019 | Uscom Limited | Page 5
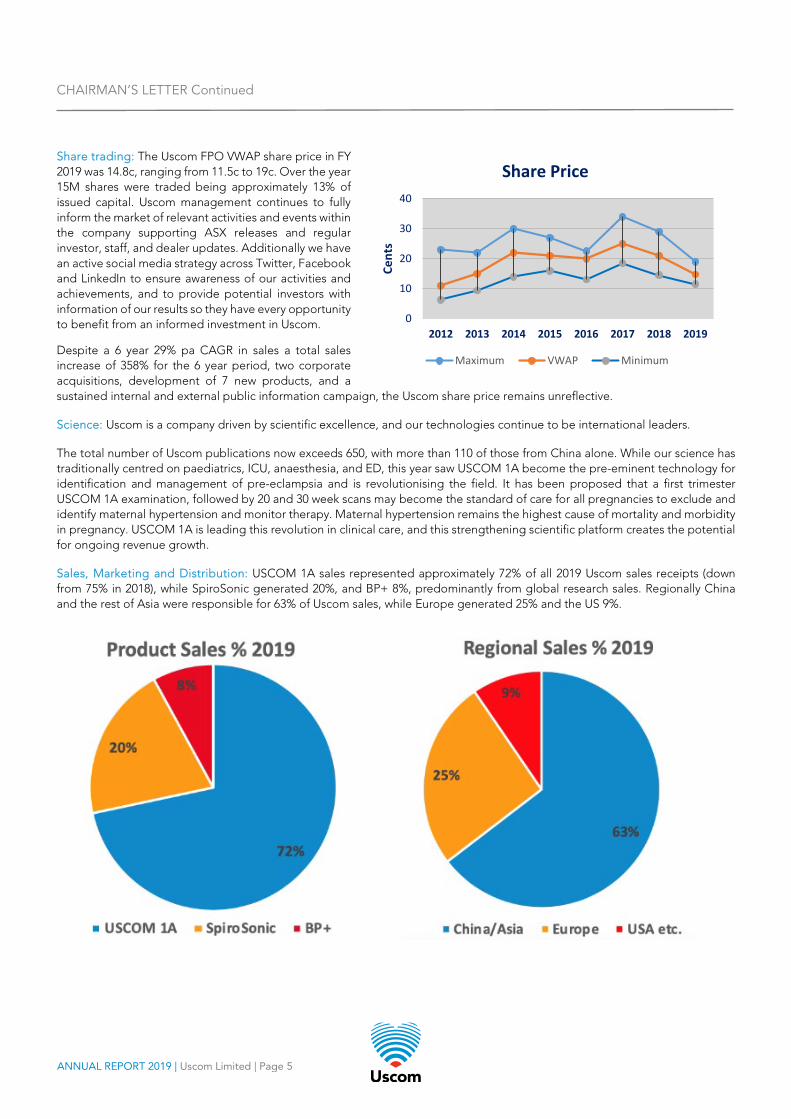
Share trading: The Uscom FPO VWAP share price in FY 2019 was 14.8c, ranging from 11.5c to 19c. Over the year 15M shares were traded being approximately 13% of issued capital. Uscom management continues to fully inform the market of relevant activities and events within the company supporting ASX releases and regular investor, staff, and dealer updates. Additionally we have an active social media strategy across Twitter, Facebook and LinkedIn to ensure awareness of our activities and achievements, and to provide potential investors with information of our results so they have every opportunity to benefit from an informed investment in Uscom.
Despite a 6 year 29% pa CAGR in sales a total sales increase of 358% for the 6 year period, two corporate acquisitions, development of 7 new products, and a sustained internal and external public information campaign, the Uscom share price remains unreflective.
Science: Uscom is a company driven by scientific excellence, and our technologies continue to be international leaders.
The total number of Uscom publications now exceeds 650, with more than 110 of those from China alone. While our science has traditionally centred on paediatrics, ICU, anaesthesia, and ED, this year saw USCOM 1A become the pre-eminent technology for identification and management of pre-eclampsia and is revolutionising the field. It has been proposed that a first trimester USCOM 1A examination, followed by 20 and 30 week scans may become the standard of care for all pregnancies to exclude and identify maternal hypertension and monitor therapy. Maternal hypertension remains the highest cause of mortality and morbidity in pregnancy. USCOM 1A is leading this revolution in clinical care, and this strengthening scientific platform creates the potential for ongoing revenue growth.
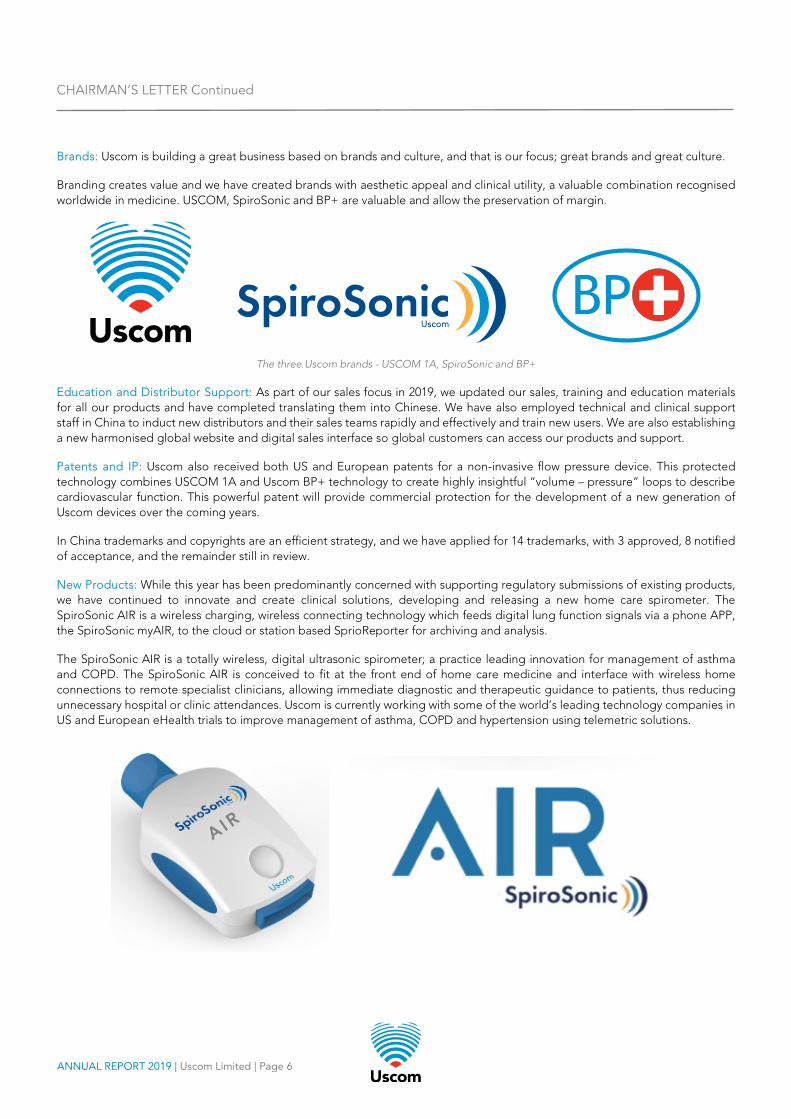
Sales, Marketing and Distribution: USCOM 1A sales represented approximately 72% of all 2019 Uscom sales receipts (down from 75% in 2018), while SpiroSonic generated 20%, and BP+ 8%, predominantly from global research sales. Regionally China and the rest of Asia were responsible for 63% of Uscom sales, while Europe generated 25% and the US 9%.
0
10
20
30
40
2012 2013 2014 2015 2016 2017 2018 2019
Cent
s
Share Price
Maximum VWAP Minimum
CHAIRMAN’S LETTER Continued
ANNUAL REPORT 2019 | Uscom Limited | Page 6
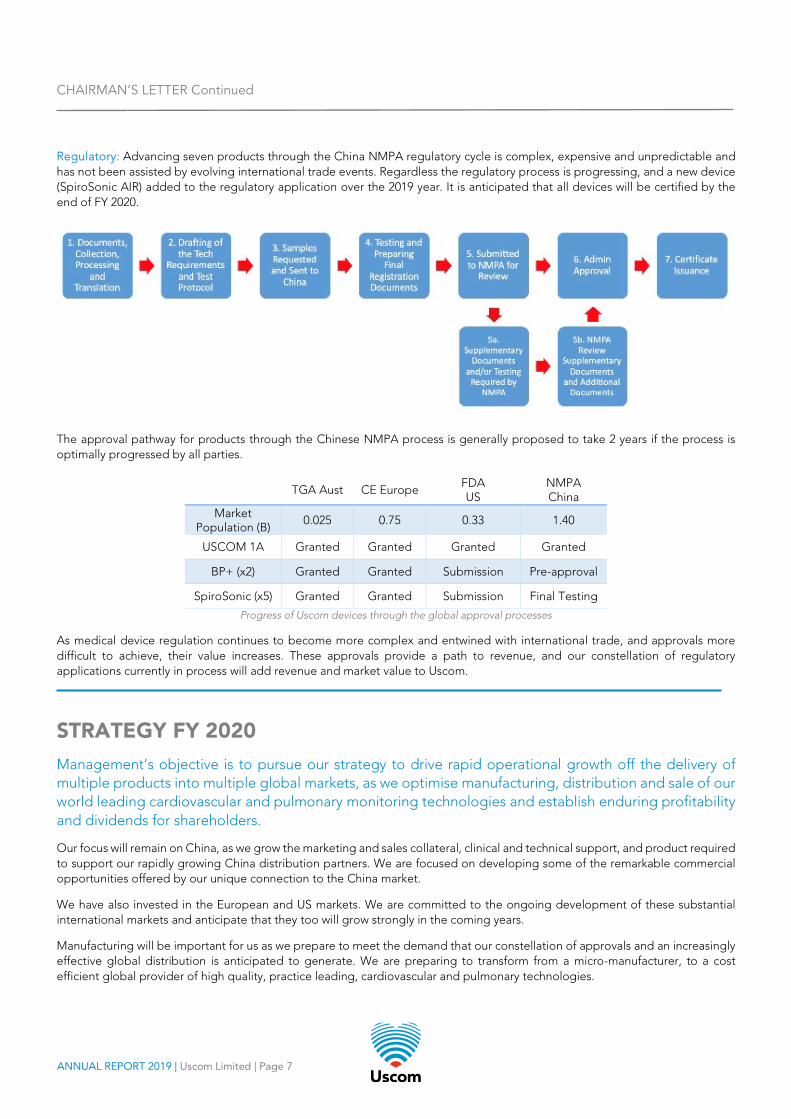
Brands: Uscom is building a great business based on brands and culture, and that is our focus; great brands and great culture.
Branding creates value and we have created brands with aesthetic appeal and clinical utility, a valuable combination recognised worldwide in medicine. USCOM, SpiroSonic and BP+ are valuable and allow the preservation of margin.
The three Uscom brands - USCOM 1A, SpiroSonic and BP+
Education and Distributor Support: As part of our sales focus in 2019, we updated our sales, training and education materials for all our products and have completed translating them into Chinese. We have also employed technical and clinical support staff in China to induct new distributors and their sales teams rapidly and effectively and train new users. We are also establishing a new harmonised global website and digital sales interface so global customers can access our products and support.
Patents and IP: Uscom also received both US and European patents for a non-invasive flow pressure device. This protected technology combines USCOM 1A and Uscom BP+ technology to create highly insightful “volume – pressure” loops to describe cardiovascular function. This powerful patent will provide commercial protection for the development of a new generation of Uscom devices over the coming years.
In China trademarks and copyrights are an efficient strategy, and we have applied for 14 trademarks, with 3 approved, 8 notified of acceptance, and the remainder still in review.
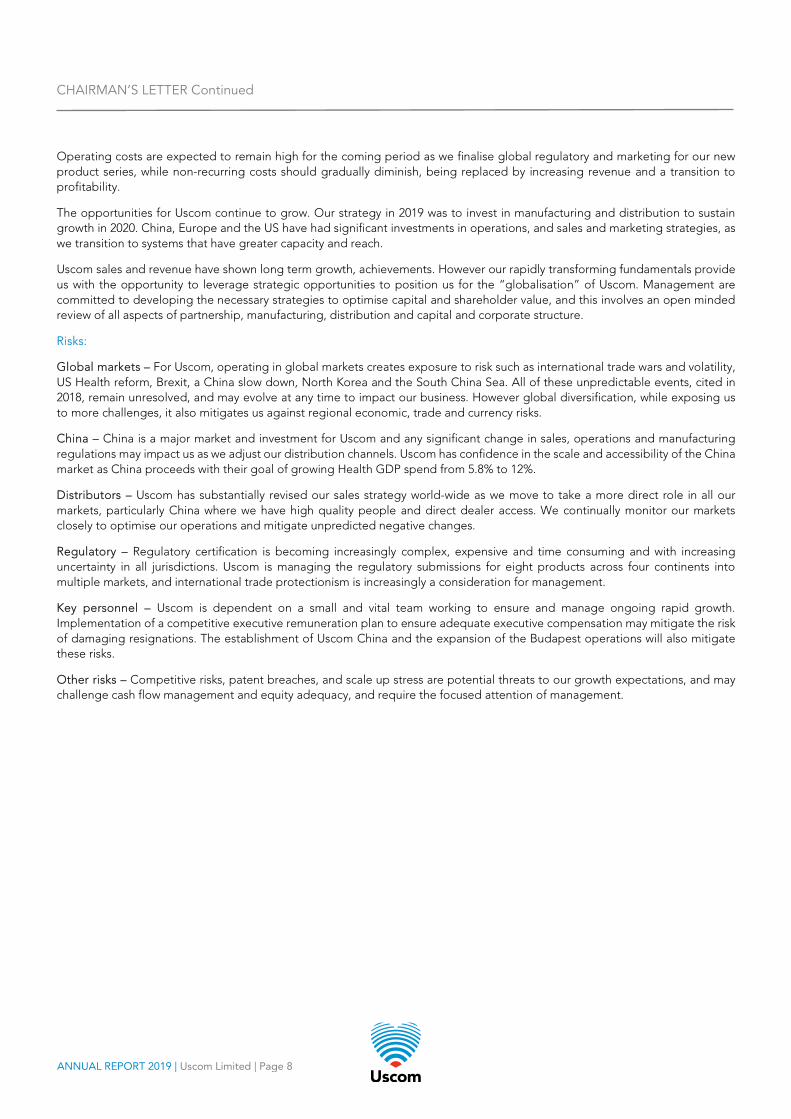
New Products: While this year has been predominantly concerned with supporting regulatory submissions of existing products, we have continued to innovate and create clinical solutions, developing and releasing a new home care spirometer. The SpiroSonic AIR is a wireless charging, wireless connecting technology which feeds digital lung function signals via a phone APP, the SpiroSonic myAIR, to the cloud or station based SprioReporter for archiving and analysis.
The SpiroSonic AIR is a totally wireless, digital ultrasonic spirometer; a practice leading innovation for management of asthma and COPD. The SpiroSonic AIR is conceived to fit at the front end of home care medicine and interface with wireless home connections to remote specialist clinicians, allowing immediate diagnostic and therapeutic guidance to patients, thus reducing unnecessary hospital or clinic attendances. Uscom is currently working with some of the world’s leading technology companies in US and European eHealth trials to improve management of asthma, COPD and hypertension using telemetric solutions.
CHAIRMAN’S LETTER Continued
ANNUAL REPORT 2019 | Uscom Limited | Page 7
Regulatory: Advancing seven products through the China NMPA regulatory cycle is complex, expensive and unpredictable and has not been assisted by evolving international trade events. Regardless the regulatory process is progressing, and a new device (SpiroSonic AIR) added to the regulatory application over the 2019 year. It is anticipated that all devices will be certified by the end of FY 2020.
The approval pathway for products through the Chinese NMPA process is generally proposed to take 2 years if the process is optimally progressed by all parties.
TGA Aust CE Europe FDA US
NMPA China
Market Population (B)
0.025 0.75 0.33 1.40
USCOM 1A Granted Granted Granted Granted
BP+ (x2) Granted Granted Submission Pre-approval
SpiroSonic (x5) Granted Granted Submission Final Testing
Progress of Uscom devices through the global approval processes
As medical device regulation continues to become more complex and entwined with international trade, and approvals more difficult to achieve, their value increases. These approvals provide a path to revenue, and our constellation of regulatory applications currently in process will add revenue and market value to Uscom.
STRATEGY FY 2020
Management’s objective is to pursue our strategy to drive rapid operational growth off the delivery of multiple products into multiple global markets, as we optimise manufacturing, distribution and sale of our world leading cardiovascular and pulmonary monitoring technologies and establish enduring profitability and dividends for shareholders.
Our focus will remain on China, as we grow the marketing and sales collateral, clinical and technical support, and product required to support our rapidly growing China distribution partners. We are focused on developing some of the remarkable commercial opportunities offered by our unique connection to the China market.
We have also invested in the European and US markets. We are committed to the ongoing development of these substantial international markets and anticipate that they too will grow strongly in the coming years.
Manufacturing will be important for us as we prepare to meet the demand that our constellation of approvals and an increasingly effective global distribution is anticipated to generate. We are preparing to transform from a micro-manufacturer, to a cost efficient global provider of high quality, practice leading, cardiovascular and pulmonary technologies.
CHAIRMAN’S LETTER Continued
ANNUAL REPORT 2019 | Uscom Limited | Page 8
Operating costs are expected to remain high for the coming period as we finalise global regulatory and marketing for our new product series, while non-recurring costs should gradually diminish, being replaced by increasing revenue and a transition to profitability.
The opportunities for Uscom continue to grow. Our strategy in 2019 was to invest in manufacturing and distribution to sustain growth in 2020. China, Europe and the US have had significant investments in operations, and sales and marketing strategies, as we transition to systems that have greater capacity and reach.
Uscom sales and revenue have shown long term growth, achievements. However our rapidly transforming fundamentals provide us with the opportunity to leverage strategic opportunities to position us for the “globalisation” of Uscom. Management are committed to developing the necessary strategies to optimise capital and shareholder value, and this involves an open minded review of all aspects of partnership, manufacturing, distribution and capital and corporate structure.
Risks:
Global markets – For Uscom, operating in global markets creates exposure to risk such as international trade wars and volatility, US Health reform, Brexit, a China slow down, North Korea and the South China Sea. All of these unpredictable events, cited in 2018, remain unresolved, and may evolve at any time to impact our business. However global diversification, while exposing us to more challenges, it also mitigates us against regional economic, trade and currency risks.
China – China is a major market and investment for Uscom and any significant change in sales, operations and manufacturing regulations may impact us as we adjust our distribution channels. Uscom has confidence in the scale and accessibility of the China market as China proceeds with their goal of growing Health GDP spend from 5.8% to 12%.
Distributors – Uscom has substantially revised our sales strategy world-wide as we move to take a more direct role in all our markets, particularly China where we have high quality people and direct dealer access. We continually monitor our markets closely to optimise our operations and mitigate unpredicted negative changes.
Regulatory – Regulatory certification is becoming increasingly complex, expensive and time consuming and with increasing uncertainty in all jurisdictions. Uscom is managing the regulatory submissions for eight products across four continents into multiple markets, and international trade protectionism is increasingly a consideration for management.
Key personnel – Uscom is dependent on a small and vital team working to ensure and manage ongoing rapid growth. Implementation of a competitive executive remuneration plan to ensure adequate executive compensation may mitigate the risk of damaging resignations. The establishment of Uscom China and the expansion of the Budapest operations will also mitigate these risks.
Other risks – Competitive risks, patent breaches, and scale up stress are potential threats to our growth expectations, and may challenge cash flow management and equity adequacy, and require the focused attention of management.
CHAIRMAN’S LETTER Continued
ANNUAL REPORT 2019 | Uscom Limited | Page 9
CONCLUSION Uscom continues to build an international growth asset based on great culture and great brands, and finished FY 2019 with record revenue, increased sales for all product suites, operational expansion, and global investment. It was a year in which our continued record sales growth drove fundamentals as we prepared for our global strategic expansion to accelerate growth into 2020 and beyond.
We continued to grow a global medical device company with a strong clinical and operational footprint across four continents with a rapidly expanding portfolio of non-invasive cardiovascular and pulmonary medical devices. We have created the foundations to become a clinical and industry leader.
Thanks to shareholders for their loyalty and patience as we continue to build a better business. Management are committed to ensuring that the recognition of these achievements occur sooner rather than later. Kind Regards
Professor Rob Phillips Uscom Chairman
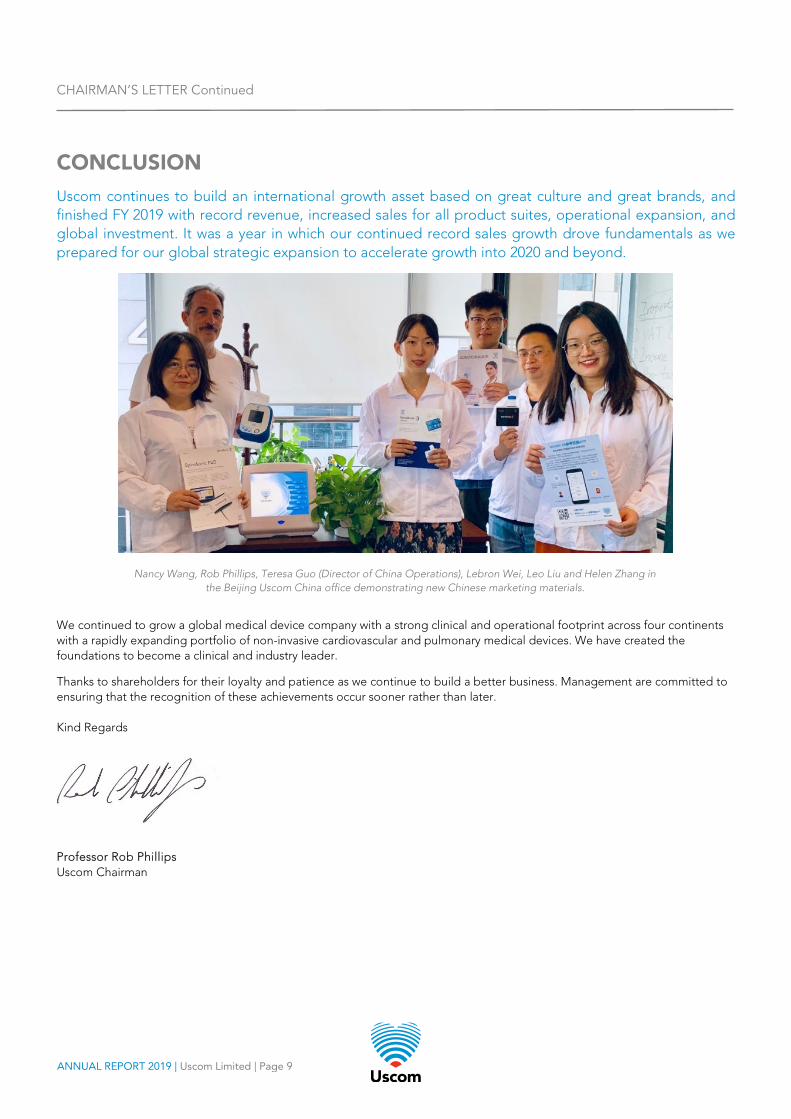
Nancy Wang, Rob Phillips, Teresa Guo (Director of China Operations), Lebron Wei, Leo Liu and Helen Zhang in the Beijing Uscom China office demonstrating new Chinese marketing materials.
ANNUAL REPORT 2019 | Uscom Limited | Page 10
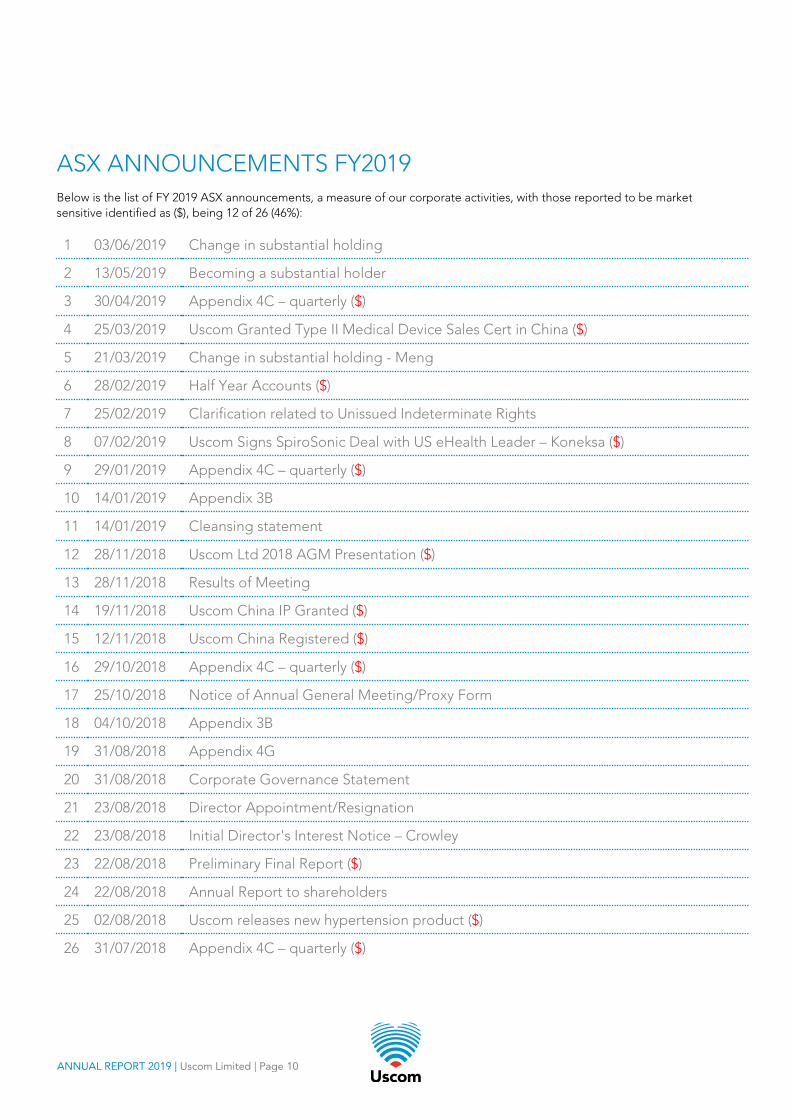
ASX ANNOUNCEMENTS FY2019 Below is the list of FY 2019 ASX announcements, a measure of our corporate activities, with those reported to be market sensitive identified as ($), being 12 of 26 (46%):
1 03/06/2019 Change in substantial holding
2 13/05/2019 Becoming a substantial holder
3 30/04/2019 Appendix 4C – quarterly ($)
4 25/03/2019 Uscom Granted Type II Medical Device Sales Cert in China ($)
5 21/03/2019 Change in substantial holding - Meng
6 28/02/2019 Half Year Accounts ($)
7 25/02/2019 Clarification related to Unissued Indeterminate Rights
8 07/02/2019 Uscom Signs SpiroSonic Deal with US eHealth Leader – Koneksa ($)
9 29/01/2019 Appendix 4C – quarterly ($)
10 14/01/2019 Appendix 3B
11 14/01/2019 Cleansing statement
12 28/11/2018 Uscom Ltd 2018 AGM Presentation ($)
13 28/11/2018 Results of Meeting
14 19/11/2018 Uscom China IP Granted ($)
15 12/11/2018 Uscom China Registered ($)
16 29/10/2018 Appendix 4C – quarterly ($)
17 25/10/2018 Notice of Annual General Meeting/Proxy Form
18 04/10/2018 Appendix 3B
19 31/08/2018 Appendix 4G
20 31/08/2018 Corporate Governance Statement
21 23/08/2018 Director Appointment/Resignation
22 23/08/2018 Initial Director's Interest Notice – Crowley
23 22/08/2018 Preliminary Final Report ($)
24 22/08/2018 Annual Report to shareholders
25 02/08/2018 Uscom releases new hypertension product ($)
26 31/07/2018 Appendix 4C – quarterly ($)
ANNUAL REPORT 2019 | Uscom Limited | Page 11
DIRECTOR’S REPORT The Directors present their report on Uscom Ltd and its Controlled Entities for the financial year ended 30 June 2019. Directors The following persons were Directors of Uscom Ltd during the whole of the financial year and up to the date of this report, unless otherwise stated.
Associate Professor R A Phillips Executive Director - Chairman Mr C Bernecker Non-Executive Director Mr B Crowley Non-Executive Director (Appointed on 23 August 2018) Ms S Jack Non-Executive Director (Resigned on 23 August 2018)
Directors’ qualifications and experience Associate Professor Rob Phillips (Chairman and Executive Director) Rob Phillips is the founder of Uscom Ltd, the Chief Executive Officer, Executive Director and Chief Scientist of the Company. Rob has 16 years’ experience as Executive Chairman of the Company, having taken Uscom to IPO in 2003, and has over 20 years in executive corporate management and capital raising. Rob has overseen the company’s acquisition of two international medical device companies in 2013 and 2016. Rob has a Doctor of Philosophy and a Master of Philosophy in Cardiovascular Medicine from The University of Queensland and is an Adjunct Associate Professor with the Critical Care Research Group, at the School of Medicine, The University of Queensland. He is an Australian Post Graduate Award recipient and was a finalist in the Time-Google-CNN-Science-NYSE World Health and Medicine Technology Awards in 2004. Rob has pioneered novel clinical approaches to cardiovascular assessment having authored over 30 patents and patent applications and is an internationally recognised author, teacher and examiner in the field of cardiac ultrasound, cardiovascular function and circulation. Mr Christian Bernecker (Non-executive Director) Mr Christian Bernecker is a Non-Executive Director of Uscom Ltd since November 2011. Christian is Non-Executive Director of Stream Group Limited and has more than 10 years of broad investment experience across capital raising, acquisitions and divestments. Christian qualified as a Chartered Accountant in Australia and holds a Bachelor of Commerce from Ballarat University. Mr Brett Crowley (Non-executive Director and Company Secretary) Brett Crowley was appointed as a Non-Executive Director of Uscom Ltd on 23 August 2018. He is a practicing solicitor and a former Partner of Ernst & Young in Hong Kong and Australia, and of KPMG in Hong Kong, and has worked in China establishing and managing JV companies there. Mr Crowley is an experienced chairman, finance director and company secretary of ASX-listed companies, and is a former Senior Legal Member of the NSW Civil and Administrative Tribunal. Ms Sheena Jack Ms Sheena Jack is a Non-Executive Director of Uscom Ltd since November 2011 and resigned on 23 August 2018. Sheena is the CEO of HCF and has over 25 years’ experience as a finance professional and corporate executive. She has had experience across a range of corporate organisations including ASX listed companies, government and not for profit in both mature and start-up businesses. Sheena has significant experience in mergers and acquisitions, business integration, strategy development and implementation, capital markets and organisational transformation. Sheena is a Chartered Accountant and a graduate member of the Australian Institute of Company Directors. Company Secretary’s qualifications and experience Mr Brett Crowley Brett Crowley is also the Company Secretary since 24 May 2016. Meetings of Directors
Directors Board of Directors Meetings held while a Director No. of meetings attended R A Phillips 7 7 C Bernecker 7 7 B Crowley 5 5 S Jack 2 2
DIRECTOR’S REPORT Continued
ANNUAL REPORT 2019 | Uscom Limited | Page 12
Principal activities Uscom Ltd is engaged in the development, design, manufacture and marketing of premium non-invasive cardiovascular and pulmonary medical devices. Uscom Ltd owns a portfolio of intellectual property relating to the technology and techniques associated with these devices and manages a worldwide network of distribution partners for the sale of its equipment to hospitals and other medical care locations. Uscom Ltd owns 100% of Uscom Inc a company engaged in the sale and promotion of Uscom products primarily in the United States, and owns 100% of Uscom Kft, a company that manufactures respiratory devices based in Hungary. Uscom Ltd owns 100% of Beijing Uscom Consulting Co. Ltd, a company that manages and sells Uscom products in China. Operating result The loss of the Consolidated Entity after providing for income tax amounted to $1,389,398 (2018: $1,960,923). Dividends No dividends were declared or recommended for the financial year ended 30 June 2019 (2018: nil). Significant changes in state of affairs There were no significant changes in state of affairs during the financial year. Corporate Governance Statement Refer to the investor page of Uscom Limited’s website www.uscom.com.au/for-investors. Operating and financial review The operating and financial review is stated per the Chairman’s letter on pages 2-10. Events after the reporting date No matters or circumstances have arisen since the end of the financial year to the date of this report, that has significantly affected or may significantly affect the activities of the Consolidated Entity, the results of those activities or the state of affairs of the Consolidated Entity in the ensuing or any subsequent financial year. Future developments Other than the business activities described in the annual report and, in particular, those matters discussed in the Operating and Financial Review, the Board is not aware of any likely developments in the foreseeable future which may materially impact on the financial outlook of the Consolidated Entity. Environmental regulations The Consolidated Entity’s operations are not subject to significant environmental regulation under the law of the Commonwealth and State. Indemnifying officers The Consolidated Entity has paid premiums to insure all Directors and Executives against liabilities for costs and expenses incurred by them in defending any legal proceedings arising out of their conduct while acting in the capacity of Director of the Company, other than conduct involving a wilful breach of duty in relation to the Company. Indemnity of auditors To the extent permitted by law, the Company has not agreed to indemnify its auditors, BDO East Coast Partnership, as part of the terms of its audit engagement agreement against claims by third parties arising from the audit [for an unspecified amount]. No payment has been made to indemnify BDO East Coast Partnership during or since the financial year. Proceedings on behalf of the Consolidated Entity No person has applied to the Court under section 237 of the Corporations Act 2001 for leave to bring proceedings on behalf of the Consolidated Entity, or to intervene in any proceedings to which the Consolidated Entity is a party, for the purpose of taking responsibility on behalf of the Consolidated Entity for all or part of those proceedings. No proceedings have been brought or intervened in on behalf of the Consolidated Entity with leave of the Court under section 237 of the Corporations Act 2001.
DIRECTOR’S REPORT Continued
ANNUAL REPORT 2019 | Uscom Limited | Page 13
Non-audit services The Consolidated Entity may decide to employ the auditor on assignments additional to their audit duties where the auditor’s expertise and experience with the Consolidated Entity are important. The Directors are of the opinion that the provision of non-audit services as disclosed in Note 25 in the financial report does not compromise the external auditor’s independence as outlined in the Corporations Act 2001 for the following reasons:
• All non-audit services have been reviewed and approved to ensure that they do not impact the integrity and objectivity of the auditor, and
• None of the services undermine the general principles relating to auditor independence as set out in the Code of Conduct APES110 Code of Ethics of Professional Accountants issued by the Accounting.
• Professional and Ethical Standards Board, including reviewing or auditing the auditor’s own work, acting in management decision making capacity for the Company, acting as advocate for the Company or jointly sharing -economic risks and rewards.
Refer to Note 25 of the financial statements on page 41 for details of auditors’ remuneration. The auditor’s independence declaration as required under section 307C of the Corporation Act is set out on page 18 and forms part of the Directors’ Report. BDO East Coast Partnership continues in office in accordance with section 327 of the Corporations Act 2001. Remuneration report (Audited) This remuneration report has been prepared by the Directors of Uscom Ltd to comply with the Corporations Act 2001 and the key management personnel (KMP) disclosures required under Australian Accounting Standards AASB 124 – Related Party Disclosures. Key management personnel The following were key management personnel of the Entity at the start of the financial year to the date of this report unless otherwise stated: Non-Executive Directors Christian Bernecker, Non-Executive Director Brett Crowley, Non-Executive Director (Appointed on 23 August 2018) Sheena Jack, Non-Executive Director (Resigned on 23 August 2018) Executive Directors Rob Phillips, Executive Director, Chairman, Chief Executive Officer Senior Executives Nick Schicht, General Manager In the Directors’ opinion, there are no other Executives of the Entity. Remuneration policies The Board is responsible for reviewing the remuneration policies and practices of the Consolidated Entity, including the compensation arrangements of Executive Directors, Non-Executive Directors and Senior Executives. The Consolidated Entity has adopted remuneration policies based on performance and contribution for determining the nature and amount of emoluments of Board Members and Senior Executives. The objective of these policies is to: • Make Uscom Ltd and its Controlled Entities an employer of choice • Attract and retain the highest calibre personnel • Encourage a culture of reward for effort and contribution • Set incentives that reward short and medium term performance for the Consolidated Entity • Encourage professional and personal development In the case of Senior Executives, a recommendation for compensation review will be made by the Chairman to the Board, which will conduct a performance review.
DIRECTOR’S REPORT Continued
ANNUAL REPORT 2019 | Uscom Limited | Page 14
Non-Executive Directors The Board determines the Non-Executive Director remuneration by independent market data for comparative Companies. As at the date of this report the maximum aggregate remuneration payable out of the funds of the Entity to Non-Executive Directors of the Consolidated Entity for their services as Directors including their service on a committee of Directors is $165,000 per annum. Non-Executive Directors do not receive any performance related remuneration, therefore they do not receive bonuses or non-cash benefits. Non-Executive Directors’ retirement payments are limited to compulsory employer superannuation. Executive Directors and Senior Executives remuneration The Consolidated Entity’s remuneration policy directs that the remuneration package appropriately reflects the Executives’ duties and responsibilities and that remuneration levels attract and retain high calibre Executives with the skills necessary to successfully manage the Consolidated Entity’s operations and achieve its strategic and financial objectives. The total remuneration packages of Executive Directors and Senior Executives are on a salary basis. In addition to base salary, the Company has a policy of rewarding extraordinary contribution to the growth of the Company with the grant of an annual discretionary cash bonus and options under the Consolidated Entity’s Employee Share Option Plan. Executives are also entitled to be paid for their reasonable travel, accommodation and other expenses incurred in consequence on the execution of duties. Other than the Uscom Ltd Employee Share Option Plan, the Consolidated Entity does not provide any other non-cash benefits in lieu of base salary to Executives. Remuneration packages for Executive Directors and Senior Executives generally consist of three components: • Fixed remuneration which is made up of cash salary, salary sacrifice components and superannuation • Short term incentives • Long term incentives which include issuing options pursuant to the Uscom Ltd Employee Share Option Plan. Fixed remuneration Senior Executives who possess a high level of skill and experience are offered a competitive base salary. The performance of each Executive will be reviewed annually. Following the review, the Consolidated Entity may in its sole discretion increase the salary based on that Executive’s performance, productivity and such other matters as the Board considers relevant. Superannuation contribution by the Consolidated Entity is limited to the statutory level of wages and salaries. Short-term incentives The remuneration of Uscom Ltd Senior Executives does not include any short-term incentive bonuses as part of their employment conditions. The Board may however approve discretionary bonuses to Executives in relation to certain milestones being achieved. Long-term incentives The Consolidated Entity has adopted an Equity Incentive Plan for the benefit of the Executive Director, an employee, contractor, consultant or any other person whom the Board determines to be eligible to participate in the Plans. The Board, at its discretion, may approve the issue of options and rights under the Equity Incentive Plan to the Senior Executives. The vesting of options and rights issued may be conditional upon the achievement of performance hurdles determined by the Board from time to time. The Board may propose the issue of options and rights to Directors, however this will be subject to shareholder approval at the Annual General Meeting. Independent data from applicable sources may be requested by the Board to assess whether the performance hurdles have been met. Service agreements The Consolidated Entity has entered into an employment agreement with the Executives that
• Outlines the components of remuneration payable; and • Specifies termination conditions. Details of the employment agreement are as follows:
DIRECTOR’S REPORT Continued
ANNUAL REPORT 2019 | Uscom Limited | Page 15
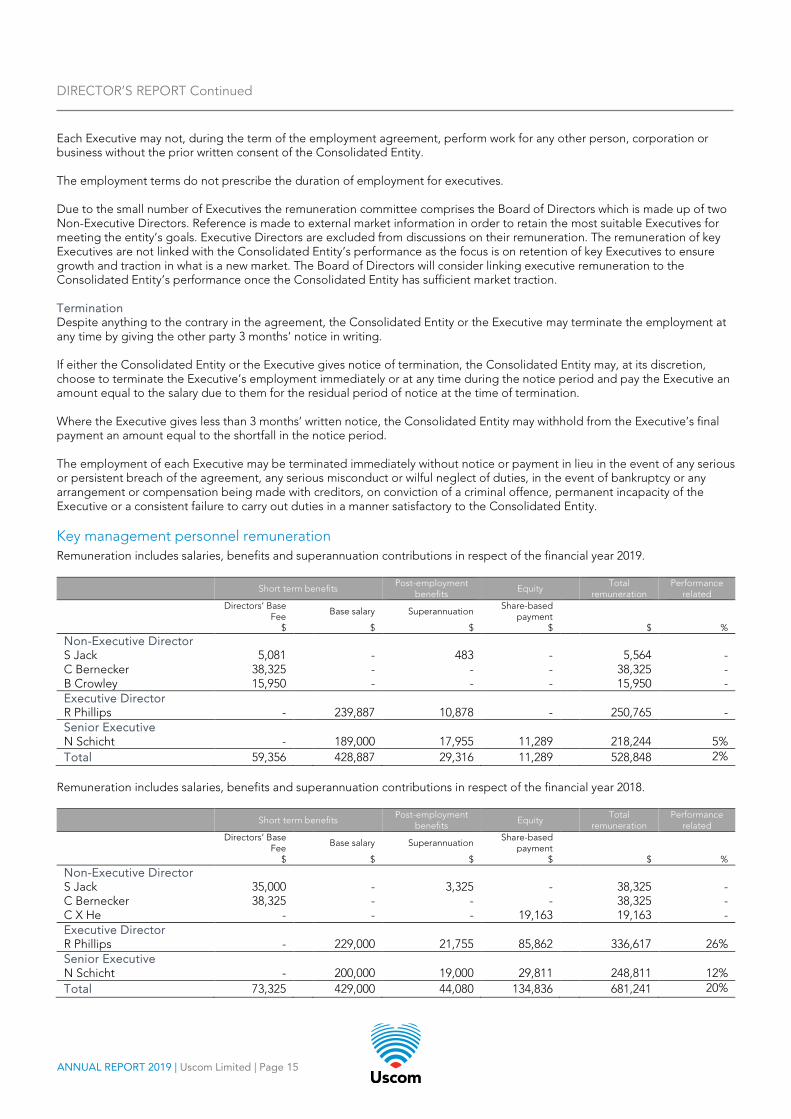
Each Executive may not, during the term of the employment agreement, perform work for any other person, corporation or business without the prior written consent of the Consolidated Entity. The employment terms do not prescribe the duration of employment for executives. Due to the small number of Executives the remuneration committee comprises the Board of Directors which is made up of two Non-Executive Directors. Reference is made to external market information in order to retain the most suitable Executives for meeting the entity’s goals. Executive Directors are excluded from discussions on their remuneration. The remuneration of key Executives are not linked with the Consolidated Entity’s performance as the focus is on retention of key Executives to ensure growth and traction in what is a new market. The Board of Directors will consider linking executive remuneration to the Consolidated Entity’s performance once the Consolidated Entity has sufficient market traction. Termination Despite anything to the contrary in the agreement, the Consolidated Entity or the Executive may terminate the employment at any time by giving the other party 3 months’ notice in writing. If either the Consolidated Entity or the Executive gives notice of termination, the Consolidated Entity may, at its discretion, choose to terminate the Executive’s employment immediately or at any time during the notice period and pay the Executive an amount equal to the salary due to them for the residual period of notice at the time of termination. Where the Executive gives less than 3 months’ written notice, the Consolidated Entity may withhold from the Executive’s final payment an amount equal to the shortfall in the notice period. The employment of each Executive may be terminated immediately without notice or payment in lieu in the event of any serious or persistent breach of the agreement, any serious misconduct or wilful neglect of duties, in the event of bankruptcy or any arrangement or compensation being made with creditors, on conviction of a criminal offence, permanent incapacity of the Executive or a consistent failure to carry out duties in a manner satisfactory to the Consolidated Entity. Key management personnel remuneration Remuneration includes salaries, benefits and superannuation contributions in respect of the financial year 2019.
Short term benefits Post-employment
benefits Equity Total
remuneration Performance
related
Directors’ Base Fee Base salary Superannuation
Share-based payment
$ $ $ $ $ %
Non-Executive Director S Jack 5,081 - 483 - 5,564 - C Bernecker 38,325 - - - 38,325 - B Crowley 15,950 - - - 15,950 - Executive Director R Phillips - 239,887 10,878 - 250,765 - Senior Executive N Schicht - 189,000 17,955 11,289 218,244 5% Total 59,356 428,887 29,316 11,289 528,848 2%
Remuneration includes salaries, benefits and superannuation contributions in respect of the financial year 2018.
Short term benefits Post-employment
benefits Equity Total
remuneration Performance
related
Directors’ Base Fee Base salary Superannuation
Share-based payment
$ $ $ $ $ %
Non-Executive Director S Jack 35,000 - 3,325 - 38,325 - C Bernecker 38,325 - - - 38,325 - C X He - - - 19,163 19,163 - Executive Director R Phillips - 229,000 21,755 85,862 336,617 26% Senior Executive N Schicht - 200,000 19,000 29,811 248,811 12% Total 73,325 429,000 44,080 134,836 681,241 20%
DIRECTOR’S REPORT Continued
ANNUAL REPORT 2019 | Uscom Limited | Page 16
Equity Incentive Plan The Consolidated Entity has adopted an Equity Incentive Plan for the benefit of an employee, contractor, consultant or executive director of the Group or any other person whom the Board determines to be eligible to participate in the Plans. The purpose of the Plan is to:
• provide Eligible Persons with an incentive plan which recognises ongoing contribution to the achievement by the Company of its strategic goals thereby encouraging the mutual interdependence of Participants and the Company;
• align the interests of Participants with shareholders of the Company through the sharing of a personal interest in the future growth and development of the Company as represented in the price of the Company’s ordinary fully paid shares;
• encourage Eligible Persons to improve the performance of the Company and its total return to Shareholders; and • provide a means of attracting and retaining skilled and experienced employees.
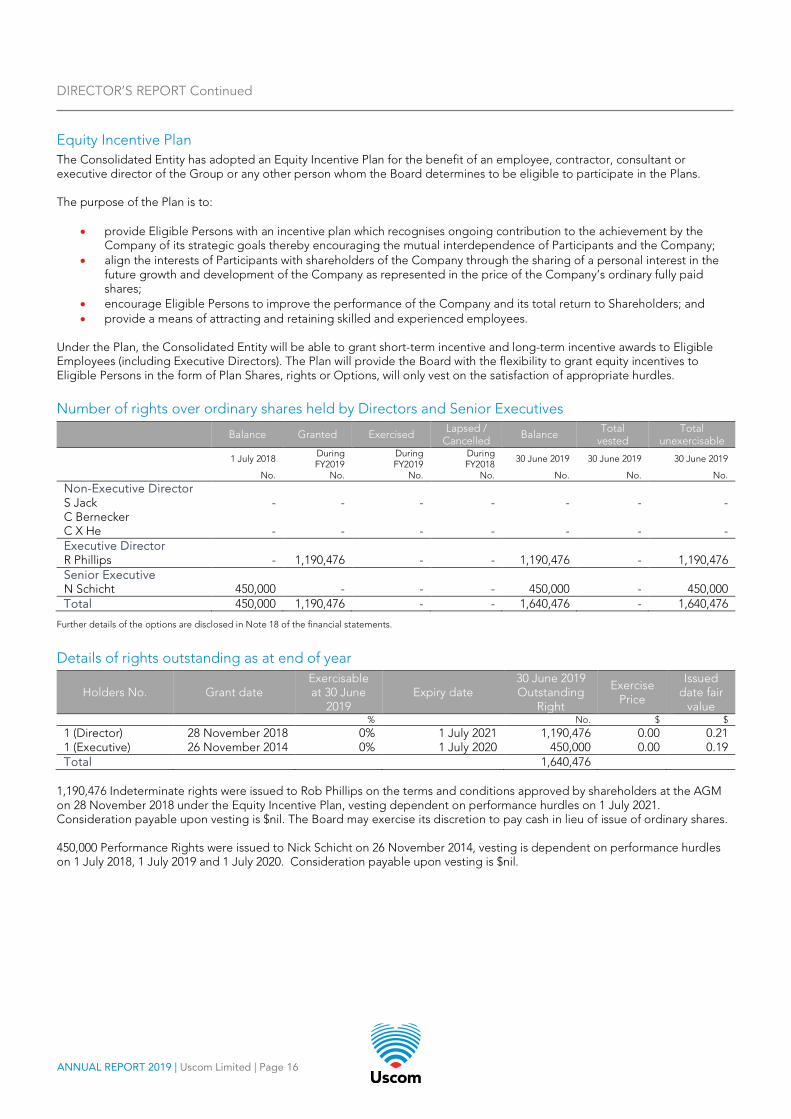
Under the Plan, the Consolidated Entity will be able to grant short-term incentive and long-term incentive awards to Eligible Employees (including Executive Directors). The Plan will provide the Board with the flexibility to grant equity incentives to Eligible Persons in the form of Plan Shares, rights or Options, will only vest on the satisfaction of appropriate hurdles. Number of rights over ordinary shares held by Directors and Senior Executives
Balance Granted Exercised Lapsed / Cancelled
Balance Total vested
Total unexercisable
1 July 2018 During FY2019
During FY2019
During FY2018
30 June 2019 30 June 2019 30 June 2019
No. No. No. No. No. No. No.
Non-Executive Director S Jack - - - - - - - C Bernecker C X He - - - - - - - Executive Director R Phillips - 1,190,476 - - 1,190,476 - 1,190,476 Senior Executive N Schicht 450,000 - - - 450,000 - 450,000 Total 450,000 1,190,476 - - 1,640,476 - 1,640,476
Further details of the options are disclosed in Note 18 of the financial statements.
Details of rights outstanding as at end of year
Holders No. Grant date Exercisable at 30 June
2019 Expiry date
30 June 2019 Outstanding
Right
Exercise Price
Issued date fair
value % No. $ $
1 (Director) 28 November 2018 0% 1 July 2021 1,190,476 0.00 0.21 1 (Executive) 26 November 2014 0% 1 July 2020 450,000 0.00 0.19 Total 1,640,476
1,190,476 Indeterminate rights were issued to Rob Phillips on the terms and conditions approved by shareholders at the AGM on 28 November 2018 under the Equity Incentive Plan, vesting dependent on performance hurdles on 1 July 2021. Consideration payable upon vesting is $nil. The Board may exercise its discretion to pay cash in lieu of issue of ordinary shares. 450,000 Performance Rights were issued to Nick Schicht on 26 November 2014, vesting is dependent on performance hurdles on 1 July 2018, 1 July 2019 and 1 July 2020. Consideration payable upon vesting is $nil.
DIRECTOR’S REPORT Continued
ANNUAL REPORT 2019 | Uscom Limited | Page 17
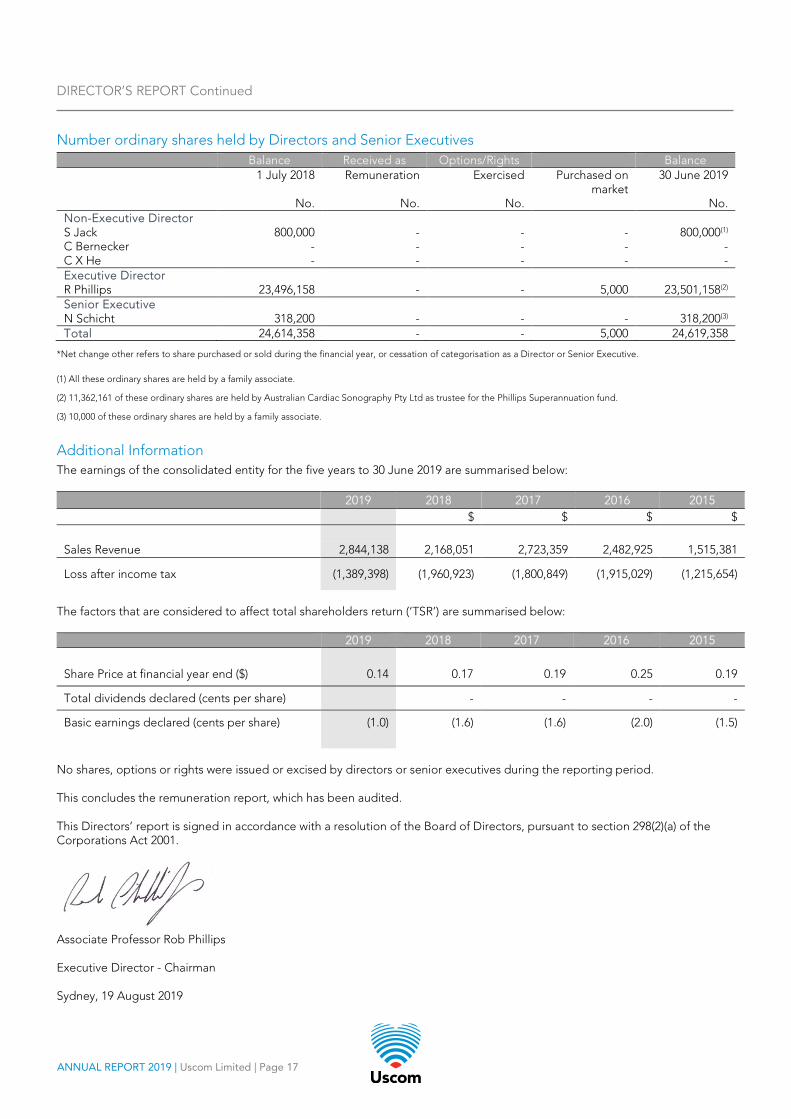
Number ordinary shares held by Directors and Senior Executives Balance Received as Options/Rights Balance
1 July 2018 Remuneration Exercised Purchased on market
30 June 2019
No. No. No. No. Non-Executive Director S Jack 800,000 - - - 800,000(1) C Bernecker - - - - - C X He - - - - - Executive Director R Phillips 23,496,158 - - 5,000 23,501,158(2) Senior Executive N Schicht 318,200 - - - 318,200(3) Total 24,614,358 - - 5,000 24,619,358
*Net change other refers to share purchased or sold during the financial year, or cessation of categorisation as a Director or Senior Executive.
(1) All these ordinary shares are held by a family associate.
(2) 11,362,161 of these ordinary shares are held by Australian Cardiac Sonography Pty Ltd as trustee for the Phillips Superannuation fund.
(3) 10,000 of these ordinary shares are held by a family associate.
Additional Information The earnings of the consolidated entity for the five years to 30 June 2019 are summarised below:
2019 2018 2017 2016 2015 $ $ $ $ Sales Revenue 2,844,138 2,168,051 2,723,359 2,482,925 1,515,381
Loss after income tax (1,389,398) (1,960,923) (1,800,849) (1,915,029) (1,215,654)
The factors that are considered to affect total shareholders return (‘TSR’) are summarised below:
2019 2018 2017 2016 2015
Share Price at financial year end ($) 0.14 0.17 0.19 0.25 0.19
Total dividends declared (cents per share) - - - -
Basic earnings declared (cents per share) (1.0) (1.6) (1.6) (2.0) (1.5)
No shares, options or rights were issued or excised by directors or senior executives during the reporting period. This concludes the remuneration report, which has been audited. This Directors’ report is signed in accordance with a resolution of the Board of Directors, pursuant to section 298(2)(a) of the Corporations Act 2001. Associate Professor Rob Phillips Executive Director - Chairman Sydney, 19 August 2019
ANNUAL REPORT 2019 | Uscom Limited | Page 18
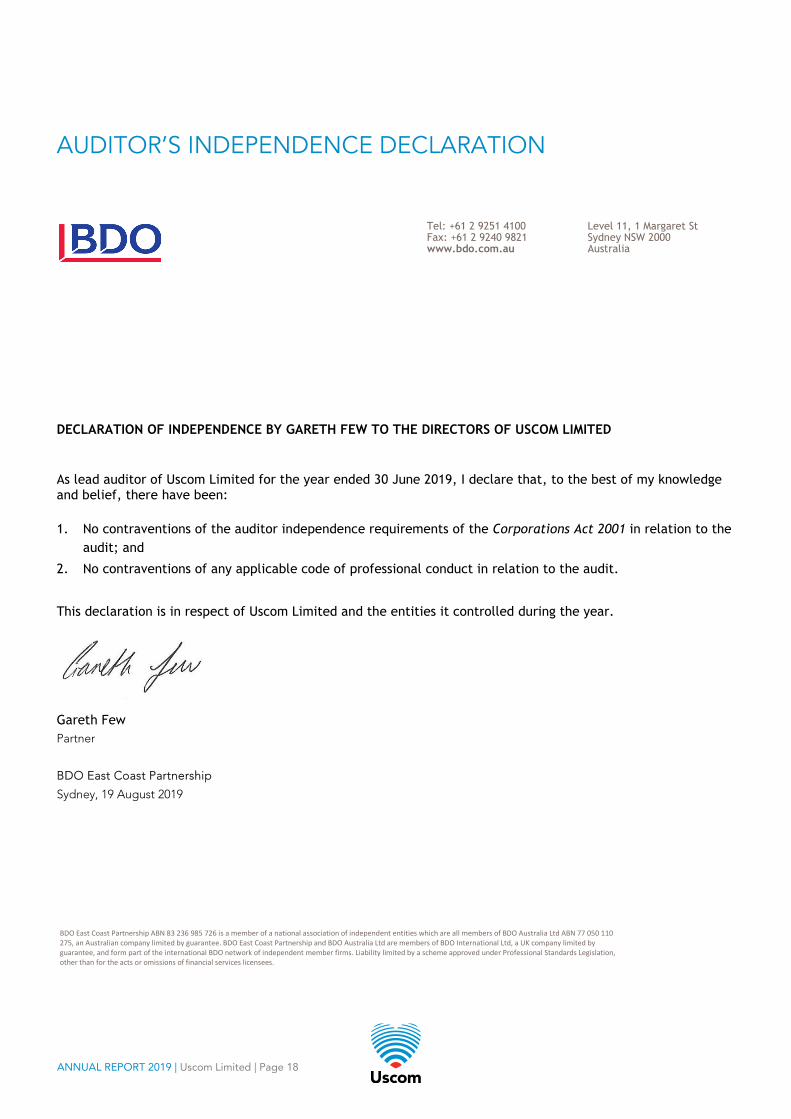
AUDITOR’S INDEPENDENCE DECLARATION
DECLARATION OF INDEPENDENCE BY GARETH FEW TO THE DIRECTORS OF USCOM LIMITED
As lead auditor of Uscom Limited for the year ended 30 June 2019, I declare that, to the best of my knowledge and belief, there have been: 1. No contraventions of the auditor independence requirements of the Corporations Act 2001 in relation to the
audit; and
2. No contraventions of any applicable code of professional conduct in relation to the audit.
This declaration is in respect of Uscom Limited and the entities it controlled during the year.
Gareth Few Partner
BDO East Coast Partnership
Sydney, 19 August 2019
Tel: +61 2 9251 4100 Fax: +61 2 9240 9821 www.bdo.com.au
Level 11, 1 Margaret St Sydney NSW 2000 Australia
BDO East Coast Partnership ABN 83 236 985 726 is a member of a national association of independent entities which are all members of BDO Australia Ltd ABN 77 050 110 275, an Australian company limited by guarantee. BDO East Coast Partnership and BDO Australia Ltd are members of BDO International Ltd, a UK company limited by guarantee, and form part of the international BDO network of independent member firms. Liability limited by a scheme approved under Professional Standards Legislation, other than for the acts or omissions of financial services licensees.
ANNUAL REPORT 2019 | Uscom Limited | Page 19
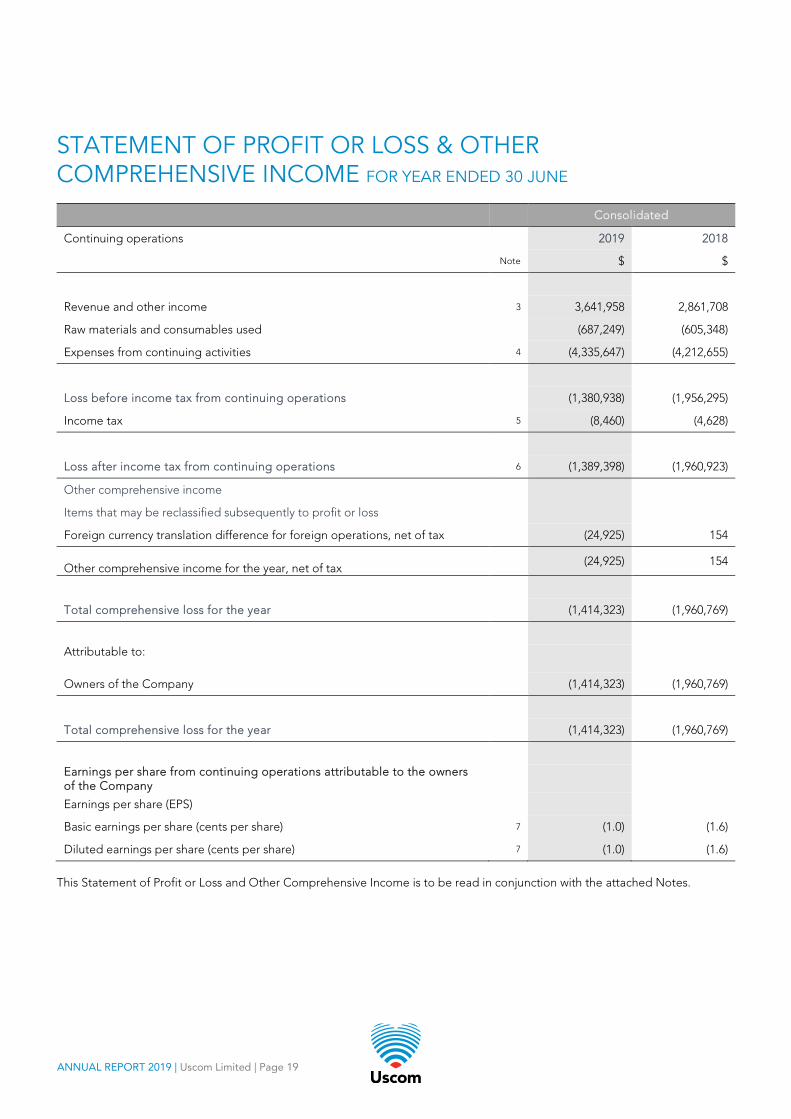
STATEMENT OF PROFIT OR LOSS & OTHER COMPREHENSIVE INCOME FOR YEAR ENDED 30 JUNE
Consolidated
Continuing operations 2019 2018
Note $ $
Revenue and other income 3 3,641,958 2,861,708
Raw materials and consumables used (687,249) (605,348)
Expenses from continuing activities 4 (4,335,647) (4,212,655)
Loss before income tax from continuing operations (1,380,938) (1,956,295)
Income tax 5 (8,460) (4,628)
Loss after income tax from continuing operations 6 (1,389,398) (1,960,923)
Other comprehensive income
Items that may be reclassified subsequently to profit or loss
Foreign currency translation difference for foreign operations, net of tax (24,925) 154
Other comprehensive income for the year, net of tax
(24,925) 154
Total comprehensive loss for the year (1,414,323) (1,960,769)
Attributable to:
Owners of the Company (1,414,323) (1,960,769)
Total comprehensive loss for the year (1,414,323) (1,960,769)
Earnings per share from continuing operations attributable to the owners of the Company
Earnings per share (EPS)
Basic earnings per share (cents per share) 7 (1.0) (1.6)
Diluted earnings per share (cents per share) 7 (1.0) (1.6)
This Statement of Profit or Loss and Other Comprehensive Income is to be read in conjunction with the attached Notes.
ANNUAL REPORT 2019 | Uscom Limited | Page 20
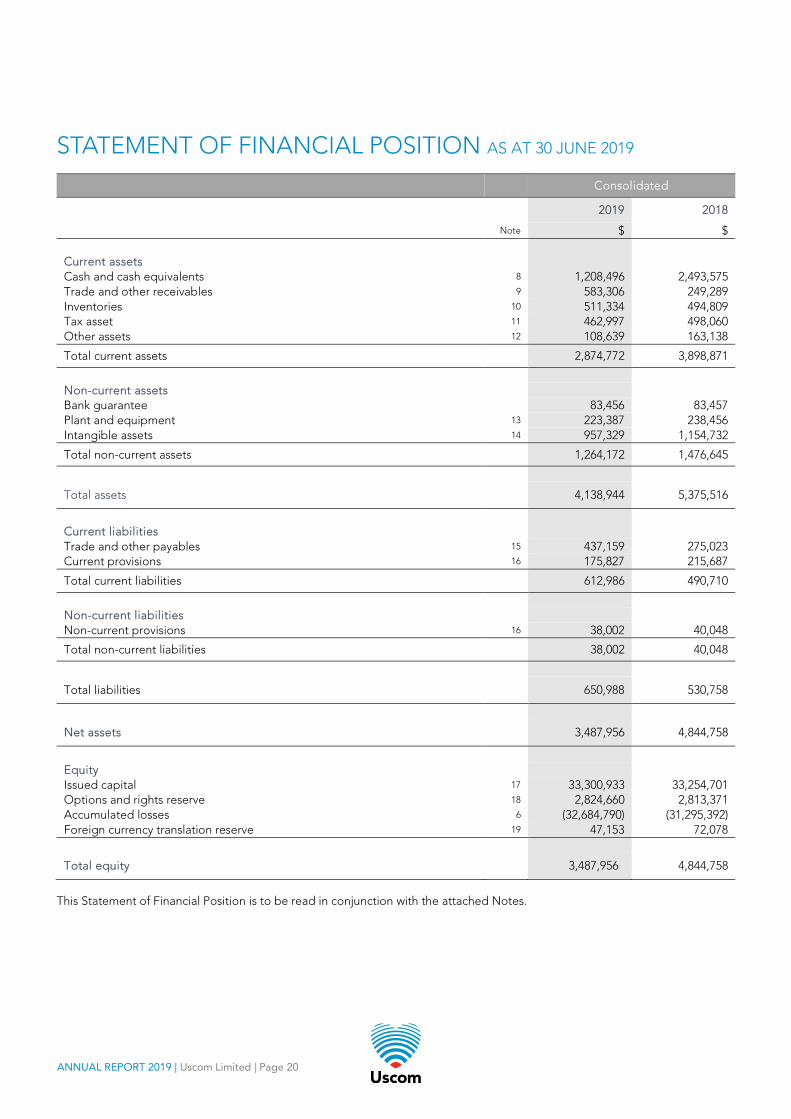
STATEMENT OF FINANCIAL POSITION AS AT 30 JUNE 2019
Consolidated
2019 2018
Note $ $ Current assets Cash and cash equivalents 8 1,208,496 2,493,575 Trade and other receivables 9 583,306 249,289 Inventories 10 511,334 494,809 Tax asset 11 462,997 498,060 Other assets 12 108,639 163,138
Total current assets 2,874,772 3,898,871
Non-current assets Bank guarantee 83,456 83,457 Plant and equipment 13 223,387 238,456 Intangible assets 14 957,329 1,154,732
Total non-current assets 1,264,172 1,476,645
Total assets 4,138,944 5,375,516
Current liabilities Trade and other payables 15 437,159 275,023 Current provisions 16 175,827 215,687
Total current liabilities 612,986 490,710
Non-current liabilities Non-current provisions 16 38,002 40,048
Total non-current liabilities 38,002 40,048
Total liabilities 650,988 530,758
Net assets 3,487,956 4,844,758
Equity Issued capital 17 33,300,933 33,254,701 Options and rights reserve 18 2,824,660 2,813,371 Accumulated losses 6 (32,684,790) (31,295,392) Foreign currency translation reserve 19 47,153 72,078
Total equity 3,487,956 4,844,758
This Statement of Financial Position is to be read in conjunction with the attached Notes.
ANNUAL REPORT 2019 | Uscom Limited | Page 21
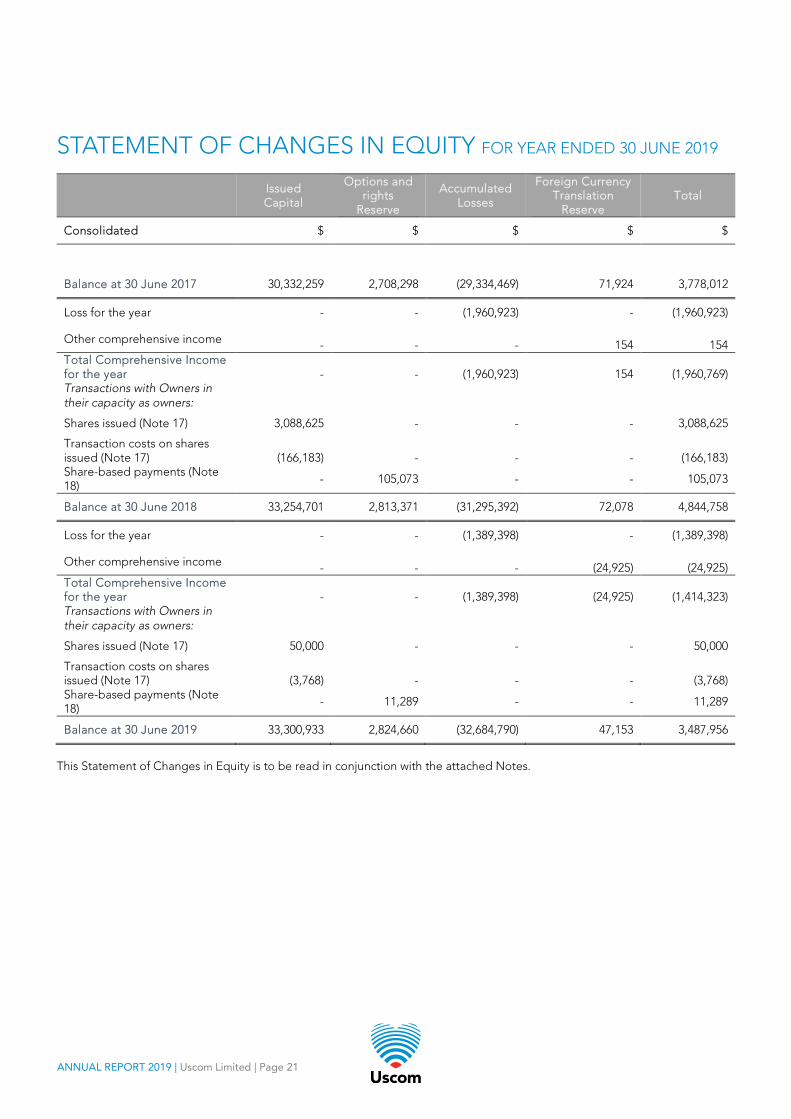
STATEMENT OF CHANGES IN EQUITY FOR YEAR ENDED 30 JUNE 2019
Issued Capital
Options and rights
Reserve
Accumulated Losses
Foreign Currency Translation
Reserve Total
Consolidated $ $ $ $ $
Balance at 30 June 2017 30,332,259 2,708,298 (29,334,469) 71,924 3,778,012
Loss for the year - - (1,960,923) - (1,960,923)
Other comprehensive income - - - 154 154 Total Comprehensive Income for the year - - (1,960,923) 154 (1,960,769) Transactions with Owners in their capacity as owners:
Shares issued (Note 17) 3,088,625 - - - 3,088,625
Transaction costs on shares issued (Note 17) (166,183) - - - (166,183) Share-based payments (Note 18) - 105,073 - - 105,073
Balance at 30 June 2018 33,254,701 2,813,371 (31,295,392) 72,078 4,844,758
Loss for the year - - (1,389,398) - (1,389,398)
Other comprehensive income - - - (24,925) (24,925) Total Comprehensive Income for the year - - (1,389,398) (24,925) (1,414,323) Transactions with Owners in their capacity as owners:
Shares issued (Note 17) 50,000 - - - 50,000
Transaction costs on shares issued (Note 17) (3,768) - - - (3,768) Share-based payments (Note 18)
- 11,289 - - 11,289
Balance at 30 June 2019 33,300,933 2,824,660 (32,684,790) 47,153 3,487,956
This Statement of Changes in Equity is to be read in conjunction with the attached Notes.
ANNUAL REPORT 2019 | Uscom Limited | Page 22
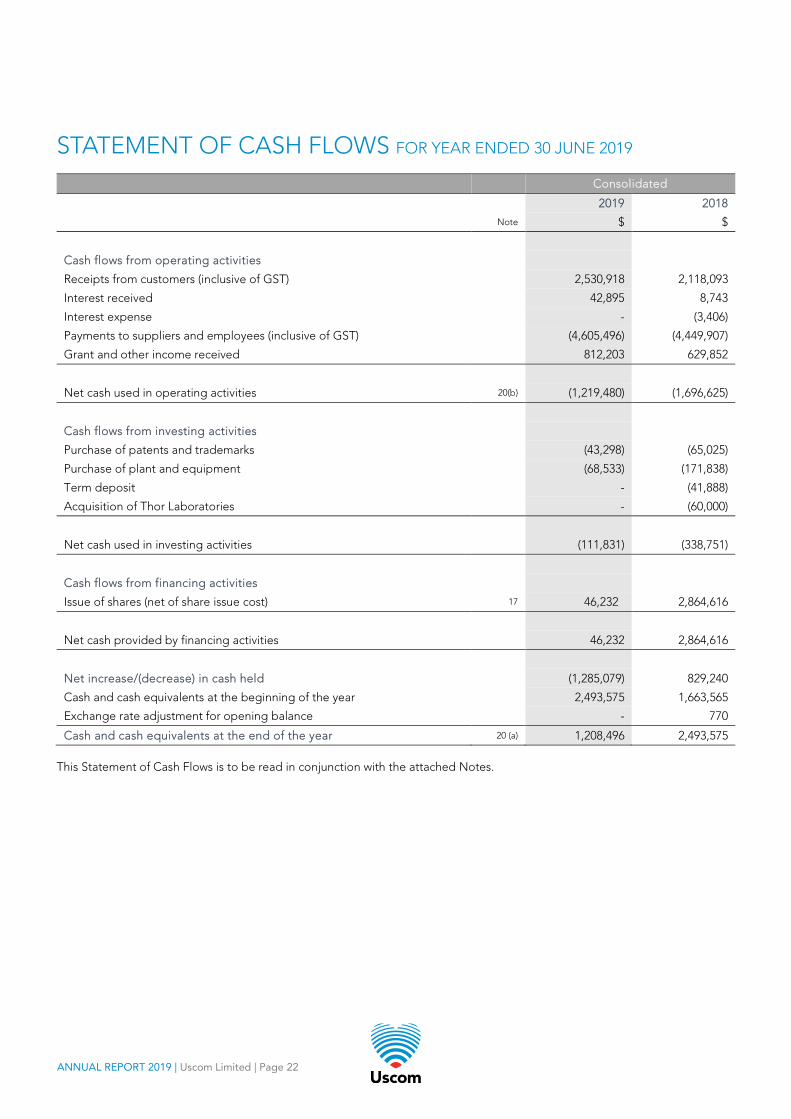
STATEMENT OF CASH FLOWS FOR YEAR ENDED 30 JUNE 2019
Consolidated
2019 2018
Note $ $
Cash flows from operating activities
Receipts from customers (inclusive of GST) 2,530,918 2,118,093
Interest received 42,895 8,743
Interest expense - (3,406)
Payments to suppliers and employees (inclusive of GST) (4,605,496) (4,449,907)
Grant and other income received 812,203 629,852
Net cash used in operating activities 20(b) (1,219,480) (1,696,625)
Cash flows from investing activities
Purchase of patents and trademarks (43,298) (65,025)
Purchase of plant and equipment (68,533) (171,838)
Term deposit - (41,888)
Acquisition of Thor Laboratories - (60,000)
Net cash used in investing activities (111,831) (338,751)
Cash flows from financing activities
Issue of shares (net of share issue cost) 17 46,232 2,864,616
Net cash provided by financing activities 46,232 2,864,616
Net increase/(decrease) in cash held (1,285,079) 829,240
Cash and cash equivalents at the beginning of the year 2,493,575 1,663,565
Exchange rate adjustment for opening balance - 770
Cash and cash equivalents at the end of the year 20 (a) 1,208,496 2,493,575 This Statement of Cash Flows is to be read in conjunction with the attached Notes.
ANNUAL REPORT 2019 | Uscom Limited | Page 23
NOTES TO FINANCIAL STATEMENTS Note 1: Summary of significant accounting policies The principal accounting policies adopted in the preparation of the financial report are set out below. The financial report covers the Consolidated Entity of Uscom Ltd and its Controlled Entities. Uscom Ltd is a listed public company, incorporated and domiciled in Australia. The following is a summary of the material accounting policies adopted by the consolidated Group in the preparation of the financial report. The accounting policies have been consistently applied to all years presented, unless otherwise stated. Basis of preparation The financial report is a general purpose financial report that has been prepared in accordance with Australian Accounting Standards and interpretations issued by the Australian Accounting Standard Board [“AASB’] and the Corporations Act 2001, as appropriate for-profit oriented entities. (i) Statement of Compliance These financial statements also comply with International Financial Reporting Standards (IFRS) as issued by the International Accounting Standards Board [“IASB”]. (ii) Historical cost convention The financial report has been prepared on an accrual basis under the historical cost convention. The financial report is presented in Australian dollars, which is the Parent Company’s functional and presentational currency. The financial statements have been approved and authorised for issue by the Board of Directors on the 19th August 2019. Going concern The consolidated entity incurred an operating cash outflow of $1,219,480 during the year ended 30 June 2019 (2018: $1,696,625). The total comprehensive loss for the year ended 30 June 2019 was $1,414,323 (2018: $1,960,769) and the cash on hand as at 30 June 2019 was $1,208,496. These conditions indicate the existence of a material uncertainty which may cast significant doubt over the consolidated entity’s ability to continue as a going concern. The consolidated entity’s forecasts and projections for the next twelve months take into account the current status, operational changes and projected future trading performance, and indicate that, in the directors’ opinion, the consolidated entity will be able to operate as a going concern. The timing and sales volumes may vary from those forecast by management as the timing of the regulatory approvals from the US and China is unpredictable. As such the timing of operating cash flows may differ to those forecast by management. Should the timing of operating cash flow be significantly different to those forecast the consolidated entity may need to seek alternative financing to enable it to settle its labilities as they fall due. The Directors have historically been successful in obtaining financing through equity raises and are actively managing the expenditure of the company to ensure that cash is maintained whilst executing the strategy and are confident that should the need arise further funding can be raised through either debt or equity. Should the company be unable to continue as a going concern it may be required to realise its assets and discharge its liabilities other than in the normal course of business and at amounts different to those stated in the financial statements. The financial statements do not include any adjustments relating to the recoverability and classification of assets carrying amount or the amount of liabilities that might result should the company be unable to continue as a going concern and meet its debts as and when they fall due. Significant judgment and key assumptions The Directors evaluate estimates and judgements incorporated into the financial report based on historical knowledge and best available current information. Estimates assume a reasonable expectation of future events and are based on current trends and economic data, obtained both externally and within the company. Information on material estimates and judgements used in applying the accounting policies can be found in Note 14 - Carrying value of intangible.
NOTES TO FINANCIAL STATEMENTS Continued
ANNUAL REPORT 2019 | Uscom Limited | Page 24
Note 1: Summary of significant accounting policies (continued) Principles of consolidation A Controlled Entity is any entity Uscom Ltd has the power to control the financial and operating policies of so as to obtain benefits from its activities. A list of Controlled Entities is contained in Note 22 to the financial statements. All Controlled Entities have a June financial year-end. All inter-company balances and transactions between Entities in the Consolidated Group, including any unrealised profits or losses, have been eliminated on consolidation. Accounting policies of Subsidiaries have been changed where necessary to ensure consistencies with those polices applied by the Parent Entity. On consolidation, the assets and liabilities of the Consolidated Entity’s overseas operations are translated at exchange rates prevailing at the reporting dates. Income and expense items are translated at the average exchange rates for the period unless exchange rates fluctuate significantly. Exchange differences arising, if any, are recognised in the foreign currency translation reserve, and are recognised in statement of profit or loss and other comprehensive income on disposal of the foreign operation. Goods and services tax (GST) Revenues, expenses and assets are recognised net of the amount of GST, except where the amount of GST incurred is not recoverable from the Australian Tax Office. In these circumstances the GST is recognised as part of the cost of acquisition of the asset or as part of an item of the expense. Receivables and payables in the Statement of Financial Position are shown inclusive of GST. Note 2: New accounting standards and interpretations The Group has adopted AASB 15 Revenue from Contracts with Customers and AASB 9 Financial Instruments from 1 July 2018. A number of new standards and amendments to standards are effective for annual periods beginning after 1 July 2018. Whilst earlier application is permitted, the Group has not early adopted the following new or amended standards in preparing these consolidated financial statements. A discussion of those future requirements and their impact on the Group is as follows: AASB 9: Financial Instruments Mandatory date of application: 1st July 2018 The Standard replaces AASB 139 Financial Instruments: Recognition and Measurement. AASB 9 includes revised guidance on the classification and measurement of financial instruments, including a new expected credit loss model for calculation of impairment on financial assets and new general hedge accounting requirements. It also carried forward guidance on recognition and derecognition of financial instruments from AASB139. Assessment of Impact The Group has assessed the new standard and based on its financial assets and liabilities, the key impact of the standard on the Group will be in relation to trade debtors and the assessment of the provision for doubtful debts under the expected credit loss model. The expected credit loss model requires an entity to account for expected credit losses and changes in those expected credit losses at each reporting date to reflect changes. The Group has adopted a simplified approach for trade receivables on the initial transition date (1 July 2018) and as there hasn’t been a significant increase in credit risk since initial recognition of these assets an amount equal to 12-month ECL is to be recognised. As the ECL assessment has resulted in an immaterial credit loss no impairment allowance has been recognised by the Group. AASB 15: Revenue from Contracts with Customers Mandatory date of application: 1st July 2018 AASB 15 establishes a single comprehensive five-step model for entities to use in accounting for revenue arising from contracts with customers. AASB 15 will supersede the current revenue recognition guidance including AASB 118 Revenue, AASB 111 Construction Contracts and the related interpretations when it becomes effective.
NOTES TO FINANCIAL STATEMENTS Continued
ANNUAL REPORT 2019 | Uscom Limited | Page 25
Note 2: New accounting standards and interpretations (continued) Assessment of Impact The Group has adopted AASB 15 using the cumulative effect method (by recognising the cumulative effect of initially applying AASB 15 as an adjustment to the opening balance of equity at 1 July 2018). The transition exercise on adopting AASB 15 did not result in an adjustment to the opening balance of equity at 1 July 2018 due to the major component of the Group’s revenue encompassing revenue arising from the sale of goods. Revenue for these activities are recognised when the customers obtain control of these assets at the time of delivery of the goods. As this reflects the underlying performance obligation under AASB 15, the application of AASB 15 has not had a material impact on the Group’s financial statements. Comparative information has not been restated and continues to be reported under AASB 118. AASB 16: Leases Mandatory date of application: 1st July 2019 AASB 16 introduces a comprehensive model for the identification of lease arrangements and accounting treatments for both lessors and lessees. AASB16 will supersede the current lease guidance including AASB 117 Leases and the related interpretations when it becomes effective. AASB 16 distinguishes leases and service contracts on the basis of whether an identified asset is controlled by a customer. Distinctions of operating leases (off balance sheet) and finance leases (on balance sheet) are removed for lessee accounting, and are replaced by a mode where a right-of-use asset and a corresponding liability have to be recognised for all leases by lessees (i.e. all on balance sheet) except for short-term leases and leases of low value assets. Assessment of Impact As at 30 June 2019, the Group has non-cancellable operating lease commitments of $830,485 (Note 24). The Group is in the process of completing an assessment of the impact of adoption of AASB 16 on these commitments. The full financial impact of adopting AASB 16 has not yet been determined, however the following impacts are expected on implementation date:
• A material right-of-use asset and a lease liability will be recognised on the Balance Sheet. • Finance costs will increase due to the impact of the interest component of the lease liability. • Depreciation expense will increase due to depreciation of the right-of-use asset over the lease term. • Lease rental operating expenses will reduce to nil. • In the Cash Flow Statement, operating cash outflows will decrease and financing cash outflows will increase as
repayment of the principal balance in the lease liability will be classified as a financing activity.
Consolidated 2019 2018 $ $
Note 3: Revenue and other income
Operating revenue Sale of goods 2,844,138 2,168,051 Other revenue Interest received 20,539 31,100 Other income Grants – R&D tax incentive 421,000 489,126 Grants – EU research grant 295,499 148,969 Grants – Business growth grant 9,000 3,850 Foreign exchange gain 46,443 15,500 Sundry income 5,339 5,112 Total other income 777,281 662,557
Total revenues and other income from continuing operations 3,641,958 2,861,708
NOTES TO FINANCIAL STATEMENTS Continued
ANNUAL REPORT 2019 | Uscom Limited | Page 26
Note 3: Revenue and other income (continued) Recognition and Measurement Revenue is measured at the fair value of the consideration received or receivable. Amounts are disclosed as revenue net of returns, discounts, allowances and goods and services tax (GST). • Sale of goods
Revenue from the sale of goods is recognised at which time control of the asset passes to the customer. (i.e. goods delivered to the customers)
• Revenue from rendering of services Rendering of services consists of training, repair and product maintenance supplied to customers. Revenue is recognised when contractual obligations are expired and services are provided.
• Interest revenue Interest revenue is recognised on a proportional basis taking into account the interest rates applicable to the financial assets.
• Government grants Government grants revenue is recognised at fair value when there is reasonable assurance that the grant will be received and the grant conditions will be met.
Consolidated 2019 2018 $ $
Note 4: Expenses from continuing activities Depreciation and amortisation expenses 334,672 304,303 Employee benefits expense 1,440,409 1,711,313 Research and development expenses 759,565 845,436 Advertising and marketing expenses 852,015 519,658 Occupancy expenses 209,562 197,445 Auditors remuneration (audit and review) 79,991 65,522 Regulatory expenses 182,231 105,066 Administrative expenses 475,746 459,002 Finance costs 1,456 4,910 Total expenses from continuing activities, excluding finance costs 4,335,647 4,212,655
Employee Benefits Expenses Employer contributions to defined contribution superannuation plans are recognised as an expense in the profit or loss as they are paid or payable. Refer to Note 16 for details on provisions for employee benefits. Share based expenses of $46,232 in 2019 (2018: $142,898) are included in employee benefits expenses above. Research and development expenses Research & development costs are charged to the statement of profit or loss and other comprehensive income as incurred, or deferred where it is probable that sufficient future benefits will be derived so as to recover those deferred costs. Lease Operating lease payments, where the lessors effectively retain substantially all the risks and benefits of ownership of the lease items, are included in the determination of profit or loss in equal instalments over the period of the lease. Lease incentives received are recognised as an integral part of the total lease payments made and are spread on a basis representative of the pattern of benefits expected to be derived from the leased asset. Lease expenses of $226,445 in 2019 (2018: $197,445) are included in occupancy expenses above. The lease commitment disclosed in Note 24.
NOTES TO FINANCIAL STATEMENTS Continued
ANNUAL REPORT 2019 | Uscom Limited | Page 27
Consolidated
2019 2018 $ $ Note 5: Income tax
Major components of income tax Current income tax (8,460) (4,628)
Income tax (8,460) (4,628)
Reconciliation between income tax credit and prima facie tax on accounting loss
Accounting loss before income tax 1,380,938 1,956,295
Tax benefit at 27.5% in Australia, 15% in USA, 12% in Hungary, 25% in China (2018: 27.5% in Australia, 15% in USA, 12% in Hungary)
238,407 462,679
Tax effect on non-taxable income and non-deductible expenses (159,877) (208,320) Temporary differences (7,470) (12,589) Deferred tax asset not brought to account (79,520) (246,398)
Income tax (8,460) (4,628)
As at 30 June 2019, the Consolidated Entity had estimated unrecouped operating income tax losses of $20,224,587 (2018: $20,012,191). The benefit of these losses of $5,393,850 (2018: $5,329,094) has not been brought to account as it is not probable that the Consolidated Entity will have sufficient future gains available against which the deferred tax asset could be utilised. Note 6: Accumulated losses
Accumulated losses at the beginning of the financial year (31,295,392) (29,334,469) Net loss attributable to members of the Entity (1,389,398) (1,960,923)
Accumulated losses at the end of the financial year (32,684,790) (31,295,392)
Note 7: Earnings per share
Loss after tax used in calculation of basic and diluted EPS (1,389,398) (1,960,923)
Number Number Weighted average number of ordinary shares during the year used in calculation of basic EPS 137,483,354 125,569,613
Weighted average number of options outstanding - - Weighted average number of rights outstanding - - Weighted average number of ordinary shares outstanding during the year used in calculation of diluted EPS 137,483,354 125,569,613
Basic earnings per share (cents per share) (1.0) (1.6) Diluted earnings per share (cents per share) (1.0) (1.6)
The options and rights in existence have an anti-dilutive effect on EPS, therefore there is no difference between basic earnings per share and diluted earnings per share as shown above. Note 8: Cash and cash equivalents
Cash on hand 118 1,569 Bank: Cheque accounts 1,138,270 479,906 Bank: Cash management 55,016 28,551 Bank: Term deposits 15,092 1,983,549 Total cash and cash equivalents 1,208,496 2,493,575
Cash and cash equivalents comprise cash on hand and at call deposits with banks or financial institutions.
NOTES TO FINANCIAL STATEMENTS Continued
ANNUAL REPORT 2019 | Uscom Limited | Page 28
Consolidated
2019 2018 $ $ Note 9: Trade and other receivables
Current Trade receivables 583,306 249,289 Total current receivables 583,306 249,289
Trade receivables are non-interest bearing and on an average of 45 day terms. Details of trade receivables past due but not impaired are disclosed in Note 21. Trade receivables and other receivables represent the principal amounts due at reporting date plus accrued interest and less, where applicable, any unearned income and provision for doubtful accounts. An estimated doubtful debt is made when collection of the full amount is no longer probable. Collectability of trade receivables is reviewed on an ongoing basis in accordance with the expected credit loss (“ECL”) model. The ECL assessment completed by the Group as at 30 June 2019 has resulted in an immaterial credit loss and no impairment allowance has been recognised by the Group (2018: $Nil). Note 10: Inventories
Current inventories at cost Raw materials 441,490 262,016 Work in Progress 696 128,406 Finished products 69,148 104,387
Total inventories 511,334 494,809
Inventories are measured at the lower of cost or net realisable value. Costs are assigned on the basis of weighted average costs. Cost comprises all costs of purchase and conversion and an appropriate proportion of fixed and variable overheads, net of settlement discounts. Overheads are applied on the basis of normal operative capacity. The costs are recognised when materials are delivered to the Consolidated Entity. Note 11: Tax asset
Income tax credit 41,997 8,934 R & D tax incentive 421,000 489,126
Total tax asset 462,997 498,060
Income tax Income taxes are accounted for using the Balance Sheet liability method whereby: • The tax consequences of recovering (settling) all assets (liabilities) are reflected in the financial statements; • Current and deferred tax is recognised as income or expenses except to the extent that the tax relates to equity items or to
a business combination; • A deferred tax asset is recognised to the extent that it is probable that future taxable profit will be available to realise the
asset; • Deferred tax assets and liabilities are measured at the tax rates that are expected to apply to the period when the asset is
realised or the liability settled. The charge for current income tax expense/credit is based on the profit or loss for the year adjusted for any non- assessable or disallowed items. It is credited using tax rates that have been enacted or are substantively enacted by the reporting date. Deferred tax is accounted for using the Balance Sheet liability method in respect of temporary differences arising between the tax bases of assets and liabilities and their carrying amounts in the financial statements. Deferred tax is calculated at the tax rates that are expected to apply to the period when the asset is realised or liability is settled. Deferred tax is credited in the income statement except where it relates to items that may be credited directly to equity, in which case the deferred tax is adjusted directly against equity. Deferred income tax assets are recognised to the extent that it is probable that future tax profits will be available against which deductible temporary differences can be utilised.
NOTES TO FINANCIAL STATEMENTS Continued
ANNUAL REPORT 2019 | Uscom Limited | Page 29
Note 11: Tax asset (continued) The amount of benefits brought to account or which may be realised in the future is based on the assumption that no adverse change will occur in income taxation legislation and the anticipation that the Consolidated Entity will derive sufficient future assessable income to enable the benefit to be realised and comply with the conditions of deductibility imposed by the law. R & D tax incentive Where the Consolidated Entity is entitled to a research and development tax offset, this is treated as other income in the period to which the entitlement relates.
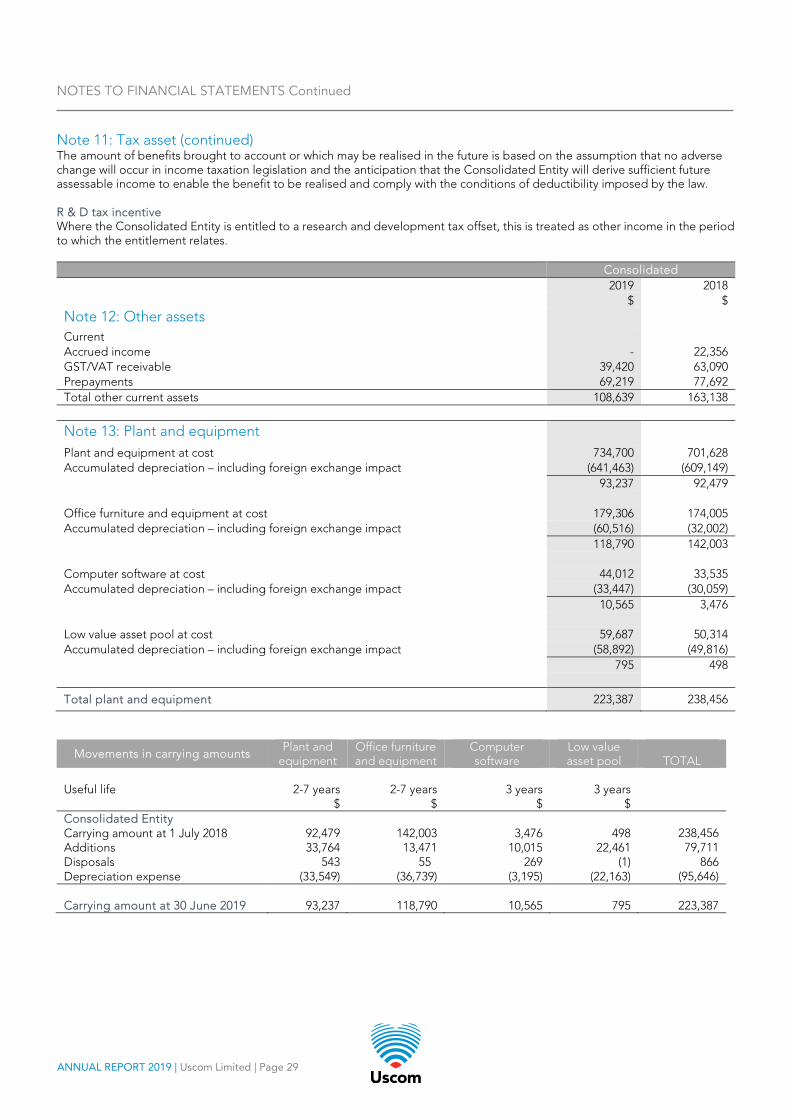
Consolidated 2019 2018 $ $ Note 12: Other assets
Current Accrued income - 22,356 GST/VAT receivable 39,420 63,090 Prepayments 69,219 77,692 Total other current assets 108,639 163,138
Note 13: Plant and equipment
Plant and equipment at cost 734,700 701,628 Accumulated depreciation – including foreign exchange impact (641,463) (609,149) 93,237 92,479 Office furniture and equipment at cost 179,306 174,005 Accumulated depreciation – including foreign exchange impact (60,516) (32,002) 118,790 142,003 Computer software at cost 44,012 33,535 Accumulated depreciation – including foreign exchange impact (33,447) (30,059) 10,565 3,476 Low value asset pool at cost 59,687 50,314 Accumulated depreciation – including foreign exchange impact (58,892) (49,816) 795 498
Total plant and equipment 223,387 238,456
Movements in carrying amounts Plant and equipment
Office furniture and equipment
Computer software
Low value asset pool
TOTAL
Useful life 2-7 years 2-7 years 3 years 3 years $ $ $ $ Consolidated Entity Carrying amount at 1 July 2018 92,479 142,003 3,476 498 238,456 Additions 33,764 13,471 10,015 22,461 79,711 Disposals 543 55 269 (1) 866 Depreciation expense (33,549) (36,739) (3,195) (22,163) (95,646) Carrying amount at 30 June 2019
93,237
118,790
10,565
795
223,387
NOTES TO FINANCIAL STATEMENTS Continued
ANNUAL REPORT 2019 | Uscom Limited | Page 30
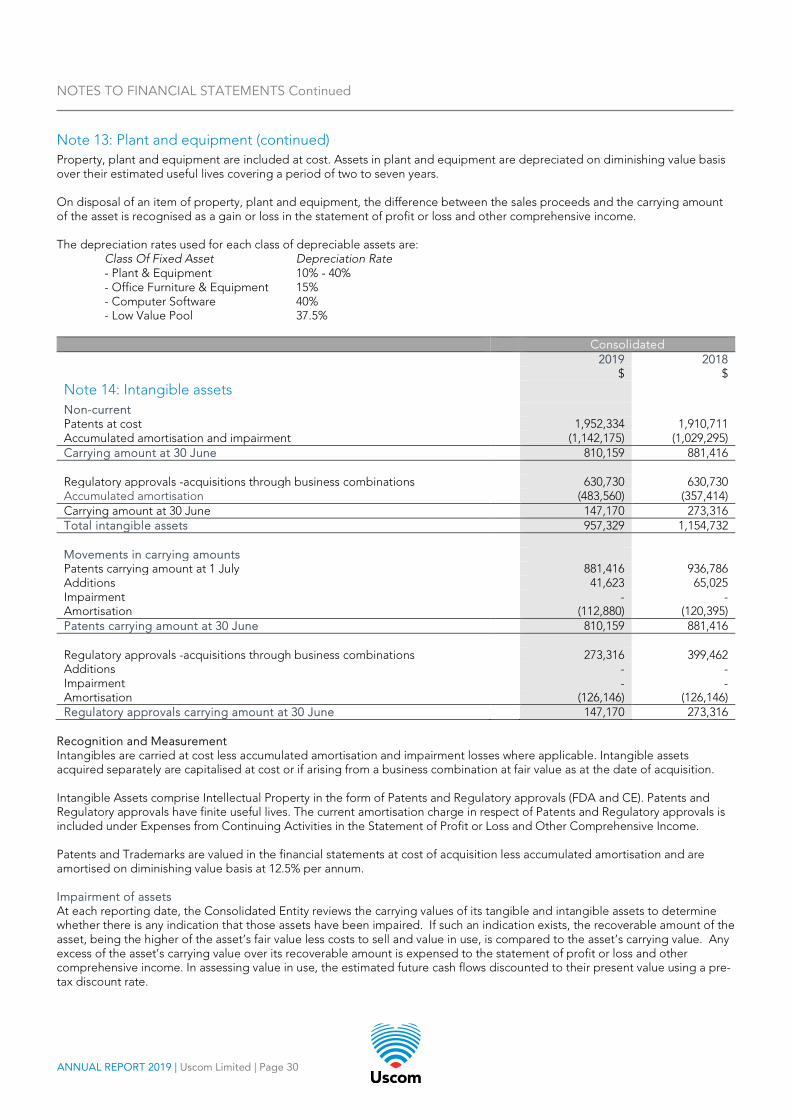
Note 13: Plant and equipment (continued) Property, plant and equipment are included at cost. Assets in plant and equipment are depreciated on diminishing value basis over their estimated useful lives covering a period of two to seven years. On disposal of an item of property, plant and equipment, the difference between the sales proceeds and the carrying amount of the asset is recognised as a gain or loss in the statement of profit or loss and other comprehensive income. The depreciation rates used for each class of depreciable assets are:
Class Of Fixed Asset Depreciation Rate - Plant & Equipment 10% - 40% - Office Furniture & Equipment 15% - Computer Software 40% - Low Value Pool 37.5%
Consolidated 2019 2018 $ $ Note 14: Intangible assets
Non-current Patents at cost 1,952,334 1,910,711 Accumulated amortisation and impairment (1,142,175) (1,029,295) Carrying amount at 30 June 810,159 881,416 Regulatory approvals -acquisitions through business combinations 630,730 630,730 Accumulated amortisation (483,560) (357,414) Carrying amount at 30 June 147,170 273,316 Total intangible assets 957,329 1,154,732 Movements in carrying amounts Patents carrying amount at 1 July 881,416 936,786 Additions 41,623 65,025 Impairment - - Amortisation (112,880) (120,395) Patents carrying amount at 30 June 810,159 881,416 Regulatory approvals -acquisitions through business combinations 273,316 399,462 Additions - - Impairment - - Amortisation (126,146) (126,146) Regulatory approvals carrying amount at 30 June 147,170 273,316
Recognition and Measurement Intangibles are carried at cost less accumulated amortisation and impairment losses where applicable. Intangible assets acquired separately are capitalised at cost or if arising from a business combination at fair value as at the date of acquisition. Intangible Assets comprise Intellectual Property in the form of Patents and Regulatory approvals (FDA and CE). Patents and Regulatory approvals have finite useful lives. The current amortisation charge in respect of Patents and Regulatory approvals is included under Expenses from Continuing Activities in the Statement of Profit or Loss and Other Comprehensive Income. Patents and Trademarks are valued in the financial statements at cost of acquisition less accumulated amortisation and are amortised on diminishing value basis at 12.5% per annum. Impairment of assets At each reporting date, the Consolidated Entity reviews the carrying values of its tangible and intangible assets to determine whether there is any indication that those assets have been impaired. If such an indication exists, the recoverable amount of the asset, being the higher of the asset’s fair value less costs to sell and value in use, is compared to the asset’s carrying value. Any excess of the asset’s carrying value over its recoverable amount is expensed to the statement of profit or loss and other comprehensive income. In assessing value in use, the estimated future cash flows discounted to their present value using a pre-tax discount rate.
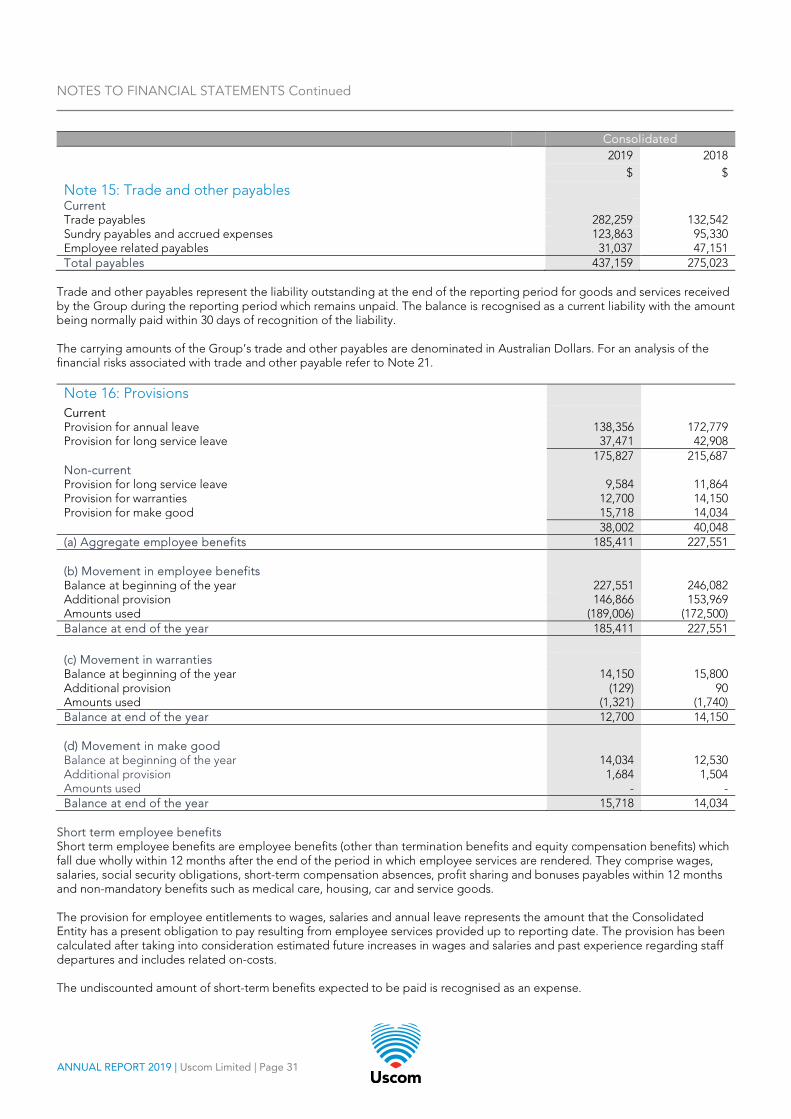
NOTES TO FINANCIAL STATEMENTS Continued
ANNUAL REPORT 2019 | Uscom Limited | Page 31
Consolidated 2019 2018
$ $
Note 15: Trade and other payables Current Trade payables 282,259 132,542 Sundry payables and accrued expenses 123,863 95,330 Employee related payables 31,037 47,151 Total payables 437,159 275,023
Trade and other payables represent the liability outstanding at the end of the reporting period for goods and services received by the Group during the reporting period which remains unpaid. The balance is recognised as a current liability with the amount being normally paid within 30 days of recognition of the liability. The carrying amounts of the Group’s trade and other payables are denominated in Australian Dollars. For an analysis of the financial risks associated with trade and other payable refer to Note 21. Note 16: Provisions
Current Provision for annual leave 138,356 172,779 Provision for long service leave 37,471 42,908 175,827 215,687 Non-current Provision for long service leave 9,584 11,864 Provision for warranties 12,700 14,150 Provision for make good 15,718 14,034 38,002 40,048 (a) Aggregate employee benefits 185,411 227,551 (b) Movement in employee benefits Balance at beginning of the year 227,551 246,082 Additional provision 146,866 153,969 Amounts used (189,006) (172,500) Balance at end of the year 185,411 227,551 (c) Movement in warranties Balance at beginning of the year 14,150 15,800 Additional provision (129) 90 Amounts used (1,321) (1,740) Balance at end of the year 12,700 14,150 (d) Movement in make good Balance at beginning of the year 14,034 12,530 Additional provision 1,684 1,504 Amounts used - - Balance at end of the year 15,718 14,034
Short term employee benefits Short term employee benefits are employee benefits (other than termination benefits and equity compensation benefits) which fall due wholly within 12 months after the end of the period in which employee services are rendered. They comprise wages, salaries, social security obligations, short-term compensation absences, profit sharing and bonuses payables within 12 months and non-mandatory benefits such as medical care, housing, car and service goods. The provision for employee entitlements to wages, salaries and annual leave represents the amount that the Consolidated Entity has a present obligation to pay resulting from employee services provided up to reporting date. The provision has been calculated after taking into consideration estimated future increases in wages and salaries and past experience regarding staff departures and includes related on-costs. The undiscounted amount of short-term benefits expected to be paid is recognised as an expense.
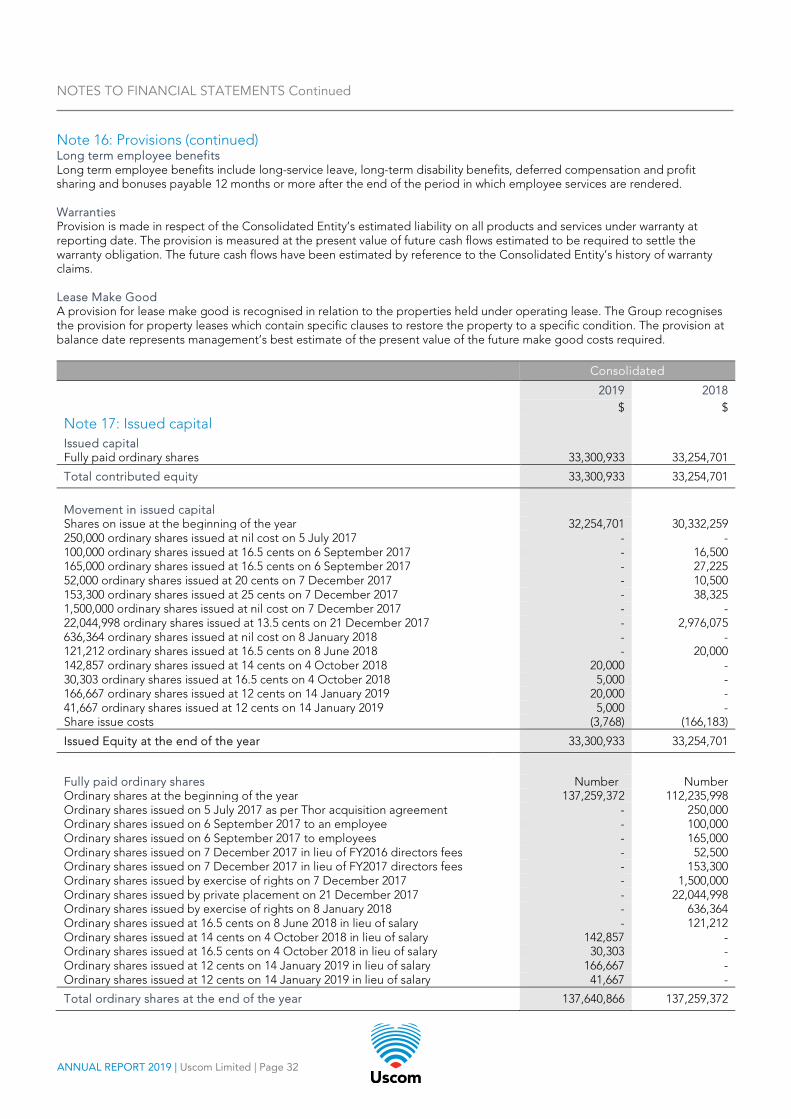
NOTES TO FINANCIAL STATEMENTS Continued
ANNUAL REPORT 2019 | Uscom Limited | Page 32
Note 16: Provisions (continued) Long term employee benefits Long term employee benefits include long-service leave, long-term disability benefits, deferred compensation and profit sharing and bonuses payable 12 months or more after the end of the period in which employee services are rendered. Warranties Provision is made in respect of the Consolidated Entity’s estimated liability on all products and services under warranty at reporting date. The provision is measured at the present value of future cash flows estimated to be required to settle the warranty obligation. The future cash flows have been estimated by reference to the Consolidated Entity’s history of warranty claims. Lease Make Good A provision for lease make good is recognised in relation to the properties held under operating lease. The Group recognises the provision for property leases which contain specific clauses to restore the property to a specific condition. The provision at balance date represents management’s best estimate of the present value of the future make good costs required.
Consolidated
2019 2018
$ $
Note 17: Issued capital
Issued capital Fully paid ordinary shares 33,300,933 33,254,701
Total contributed equity 33,300,933 33,254,701
Movement in issued capital Shares on issue at the beginning of the year 32,254,701 30,332,259 250,000 ordinary shares issued at nil cost on 5 July 2017 - - 100,000 ordinary shares issued at 16.5 cents on 6 September 2017 - 16,500 165,000 ordinary shares issued at 16.5 cents on 6 September 2017 - 27,225 52,000 ordinary shares issued at 20 cents on 7 December 2017 - 10,500 153,300 ordinary shares issued at 25 cents on 7 December 2017 - 38,325 1,500,000 ordinary shares issued at nil cost on 7 December 2017 - - 22,044,998 ordinary shares issued at 13.5 cents on 21 December 2017 - 2,976,075 636,364 ordinary shares issued at nil cost on 8 January 2018 - - 121,212 ordinary shares issued at 16.5 cents on 8 June 2018 - 20,000 142,857 ordinary shares issued at 14 cents on 4 October 2018 20,000 - 30,303 ordinary shares issued at 16.5 cents on 4 October 2018 5,000 - 166,667 ordinary shares issued at 12 cents on 14 January 2019 20,000 - 41,667 ordinary shares issued at 12 cents on 14 January 2019 5,000 - Share issue costs (3,768) (166,183)
Issued Equity at the end of the year 33,300,933 33,254,701
Fully paid ordinary shares Number Number Ordinary shares at the beginning of the year 137,259,372 112,235,998 Ordinary shares issued on 5 July 2017 as per Thor acquisition agreement - 250,000 Ordinary shares issued on 6 September 2017 to an employee - 100,000 Ordinary shares issued on 6 September 2017 to employees - 165,000 Ordinary shares issued on 7 December 2017 in lieu of FY2016 directors fees - 52,500 Ordinary shares issued on 7 December 2017 in lieu of FY2017 directors fees - 153,300 Ordinary shares issued by exercise of rights on 7 December 2017 - 1,500,000 Ordinary shares issued by private placement on 21 December 2017 - 22,044,998 Ordinary shares issued by exercise of rights on 8 January 2018 - 636,364 Ordinary shares issued at 16.5 cents on 8 June 2018 in lieu of salary - 121,212 Ordinary shares issued at 14 cents on 4 October 2018 in lieu of salary 142,857 - Ordinary shares issued at 16.5 cents on 4 October 2018 in lieu of salary 30,303 - Ordinary shares issued at 12 cents on 14 January 2019 in lieu of salary 166,667 - Ordinary shares issued at 12 cents on 14 January 2019 in lieu of salary 41,667 -
Total ordinary shares at the end of the year 137,640,866 137,259,372
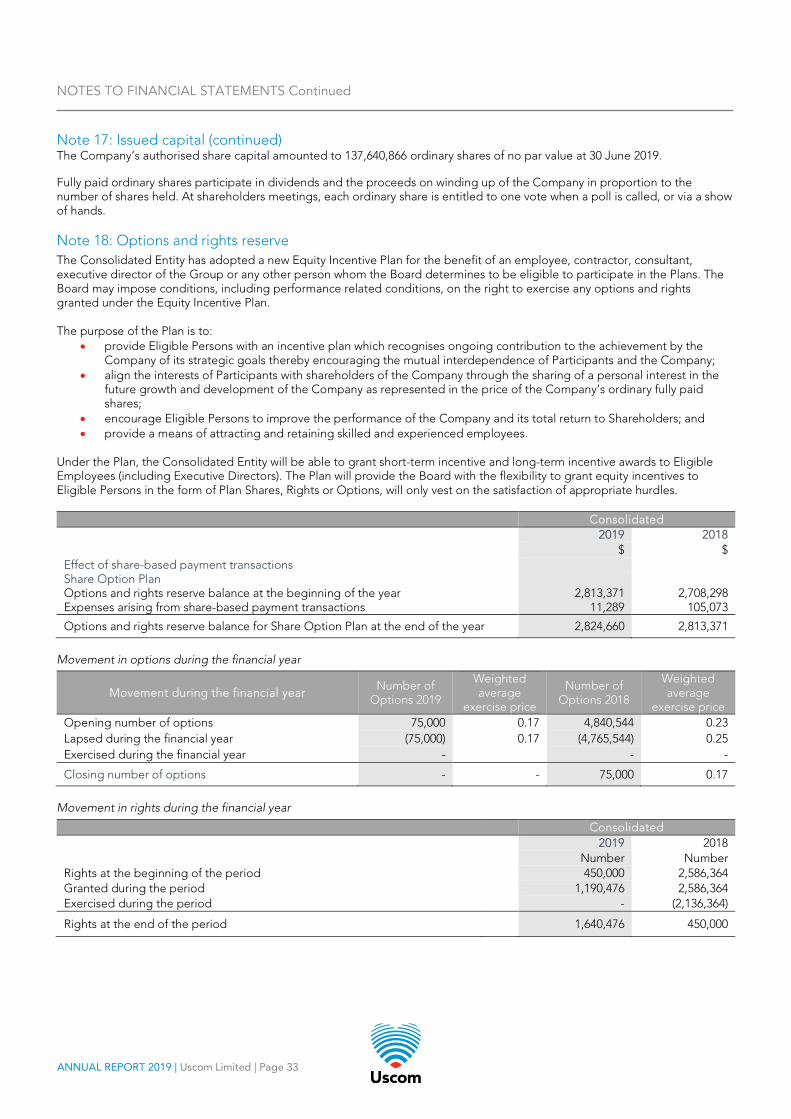
NOTES TO FINANCIAL STATEMENTS Continued
ANNUAL REPORT 2019 | Uscom Limited | Page 33
Note 17: Issued capital (continued) The Company’s authorised share capital amounted to 137,640,866 ordinary shares of no par value at 30 June 2019. Fully paid ordinary shares participate in dividends and the proceeds on winding up of the Company in proportion to the number of shares held. At shareholders meetings, each ordinary share is entitled to one vote when a poll is called, or via a show of hands. Note 18: Options and rights reserve The Consolidated Entity has adopted a new Equity Incentive Plan for the benefit of an employee, contractor, consultant, executive director of the Group or any other person whom the Board determines to be eligible to participate in the Plans. The Board may impose conditions, including performance related conditions, on the right to exercise any options and rights granted under the Equity Incentive Plan. The purpose of the Plan is to:
• provide Eligible Persons with an incentive plan which recognises ongoing contribution to the achievement by the Company of its strategic goals thereby encouraging the mutual interdependence of Participants and the Company;
• align the interests of Participants with shareholders of the Company through the sharing of a personal interest in the future growth and development of the Company as represented in the price of the Company’s ordinary fully paid shares;
• encourage Eligible Persons to improve the performance of the Company and its total return to Shareholders; and • provide a means of attracting and retaining skilled and experienced employees.
Under the Plan, the Consolidated Entity will be able to grant short-term incentive and long-term incentive awards to Eligible Employees (including Executive Directors). The Plan will provide the Board with the flexibility to grant equity incentives to Eligible Persons in the form of Plan Shares, Rights or Options, will only vest on the satisfaction of appropriate hurdles.
Consolidated 2019 2018 $ $ Effect of share-based payment transactions Share Option Plan Options and rights reserve balance at the beginning of the year 2,813,371 2,708,298 Expenses arising from share-based payment transactions 11,289 105,073
Options and rights reserve balance for Share Option Plan at the end of the year 2,824,660 2,813,371
Movement in options during the financial year
Movement during the financial year Number of
Options 2019
Weighted average
exercise price
Number of Options 2018
Weighted average
exercise price Opening number of options 75,000 0.17 4,840,544 0.23 Lapsed during the financial year (75,000) 0.17 (4,765,544) 0.25 Exercised during the financial year - - -
Closing number of options - - 75,000 0.17
Movement in rights during the financial year
Consolidated 2019 2018 Number Number Rights at the beginning of the period 450,000 2,586,364 Granted during the period 1,190,476 2,586,364 Exercised during the period - (2,136,364)
Rights at the end of the period 1,640,476 450,000
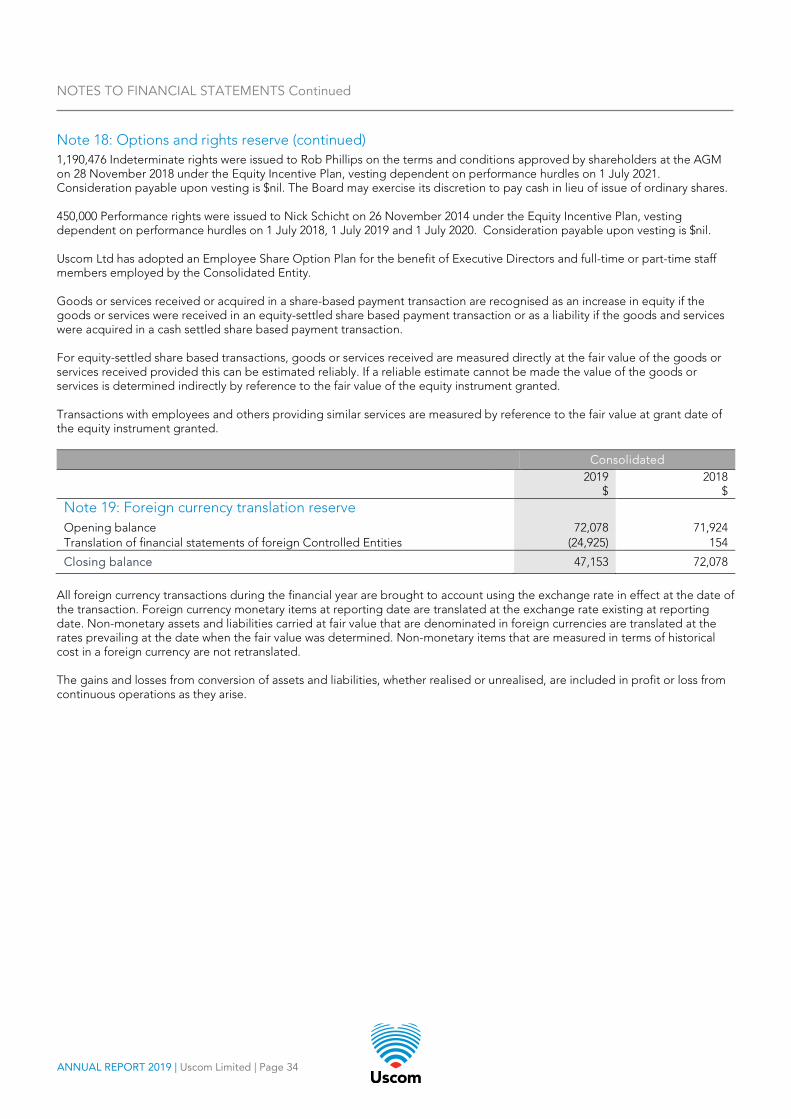
NOTES TO FINANCIAL STATEMENTS Continued
ANNUAL REPORT 2019 | Uscom Limited | Page 34
Note 18: Options and rights reserve (continued) 1,190,476 Indeterminate rights were issued to Rob Phillips on the terms and conditions approved by shareholders at the AGM on 28 November 2018 under the Equity Incentive Plan, vesting dependent on performance hurdles on 1 July 2021. Consideration payable upon vesting is $nil. The Board may exercise its discretion to pay cash in lieu of issue of ordinary shares. 450,000 Performance rights were issued to Nick Schicht on 26 November 2014 under the Equity Incentive Plan, vesting dependent on performance hurdles on 1 July 2018, 1 July 2019 and 1 July 2020. Consideration payable upon vesting is $nil. Uscom Ltd has adopted an Employee Share Option Plan for the benefit of Executive Directors and full-time or part-time staff members employed by the Consolidated Entity. Goods or services received or acquired in a share-based payment transaction are recognised as an increase in equity if the goods or services were received in an equity-settled share based payment transaction or as a liability if the goods and services were acquired in a cash settled share based payment transaction. For equity-settled share based transactions, goods or services received are measured directly at the fair value of the goods or services received provided this can be estimated reliably. If a reliable estimate cannot be made the value of the goods or services is determined indirectly by reference to the fair value of the equity instrument granted. Transactions with employees and others providing similar services are measured by reference to the fair value at grant date of the equity instrument granted.
Consolidated
2019
$ 2018
$ Note 19: Foreign currency translation reserve
Opening balance 72,078 71,924 Translation of financial statements of foreign Controlled Entities (24,925) 154
Closing balance 47,153 72,078
All foreign currency transactions during the financial year are brought to account using the exchange rate in effect at the date of the transaction. Foreign currency monetary items at reporting date are translated at the exchange rate existing at reporting date. Non-monetary assets and liabilities carried at fair value that are denominated in foreign currencies are translated at the rates prevailing at the date when the fair value was determined. Non-monetary items that are measured in terms of historical cost in a foreign currency are not retranslated. The gains and losses from conversion of assets and liabilities, whether realised or unrealised, are included in profit or loss from continuous operations as they arise.
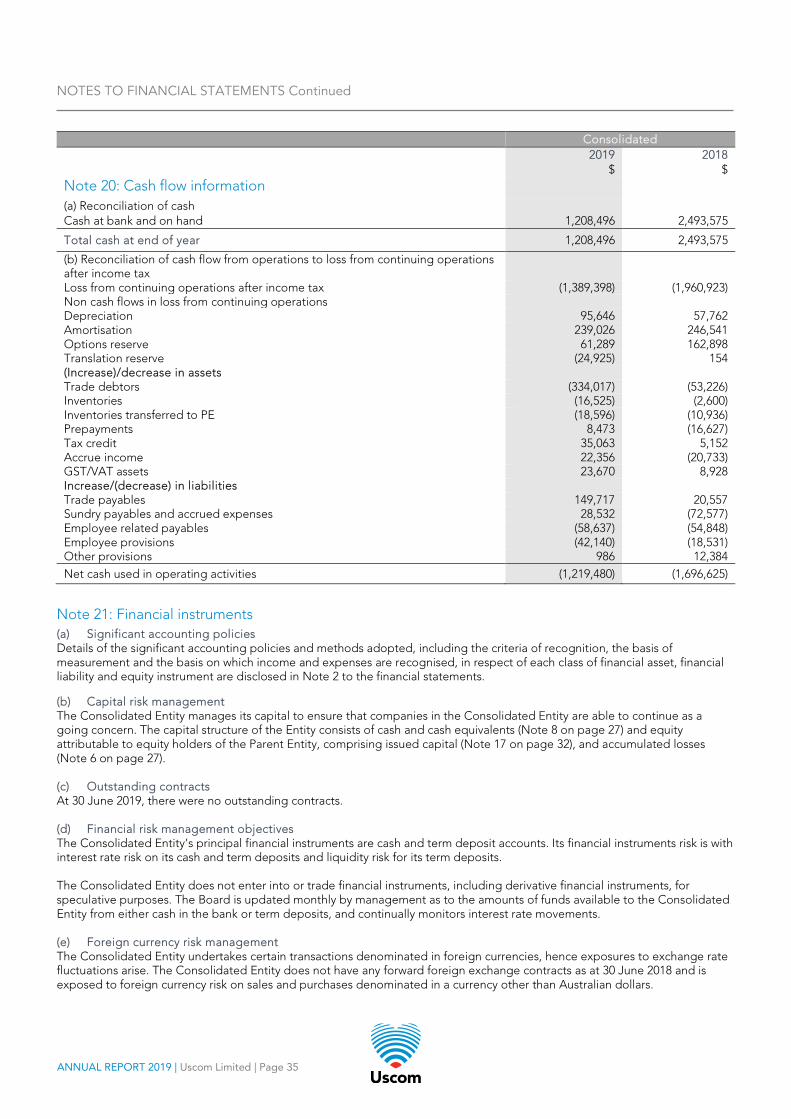
NOTES TO FINANCIAL STATEMENTS Continued
ANNUAL REPORT 2019 | Uscom Limited | Page 35
Consolidated
2019 2018
$ $
Note 20: Cash flow information
(a) Reconciliation of cash Cash at bank and on hand 1,208,496 2,493,575
Total cash at end of year 1,208,496 2,493,575
(b) Reconciliation of cash flow from operations to loss from continuing operations after income tax
Loss from continuing operations after income tax (1,389,398) (1,960,923) Non cash flows in loss from continuing operations Depreciation 95,646 57,762 Amortisation 239,026 246,541 Options reserve 61,289 162,898 Translation reserve (24,925) 154 (Increase)/decrease in assets Trade debtors (334,017) (53,226) Inventories (16,525) (2,600) Inventories transferred to PE (18,596) (10,936) Prepayments 8,473 (16,627) Tax credit 35,063 5,152 Accrue income 22,356 (20,733) GST/VAT assets 23,670 8,928 Increase/(decrease) in liabilities Trade payables 149,717 20,557 Sundry payables and accrued expenses 28,532 (72,577) Employee related payables (58,637) (54,848) Employee provisions (42,140) (18,531) Other provisions 986 12,384 Net cash used in operating activities (1,219,480) (1,696,625)
Note 21: Financial instruments (a) Significant accounting policies Details of the significant accounting policies and methods adopted, including the criteria of recognition, the basis of measurement and the basis on which income and expenses are recognised, in respect of each class of financial asset, financial liability and equity instrument are disclosed in Note 2 to the financial statements. (b) Capital risk management The Consolidated Entity manages its capital to ensure that companies in the Consolidated Entity are able to continue as a going concern. The capital structure of the Entity consists of cash and cash equivalents (Note 8 on page 27) and equity attributable to equity holders of the Parent Entity, comprising issued capital (Note 17 on page 32), and accumulated losses (Note 6 on page 27). (c) Outstanding contracts At 30 June 2019, there were no outstanding contracts. (d) Financial risk management objectives The Consolidated Entity’s principal financial instruments are cash and term deposit accounts. Its financial instruments risk is with interest rate risk on its cash and term deposits and liquidity risk for its term deposits. The Consolidated Entity does not enter into or trade financial instruments, including derivative financial instruments, for speculative purposes. The Board is updated monthly by management as to the amounts of funds available to the Consolidated Entity from either cash in the bank or term deposits, and continually monitors interest rate movements. (e) Foreign currency risk management The Consolidated Entity undertakes certain transactions denominated in foreign currencies, hence exposures to exchange rate fluctuations arise. The Consolidated Entity does not have any forward foreign exchange contracts as at 30 June 2018 and is exposed to foreign currency risk on sales and purchases denominated in a currency other than Australian dollars.
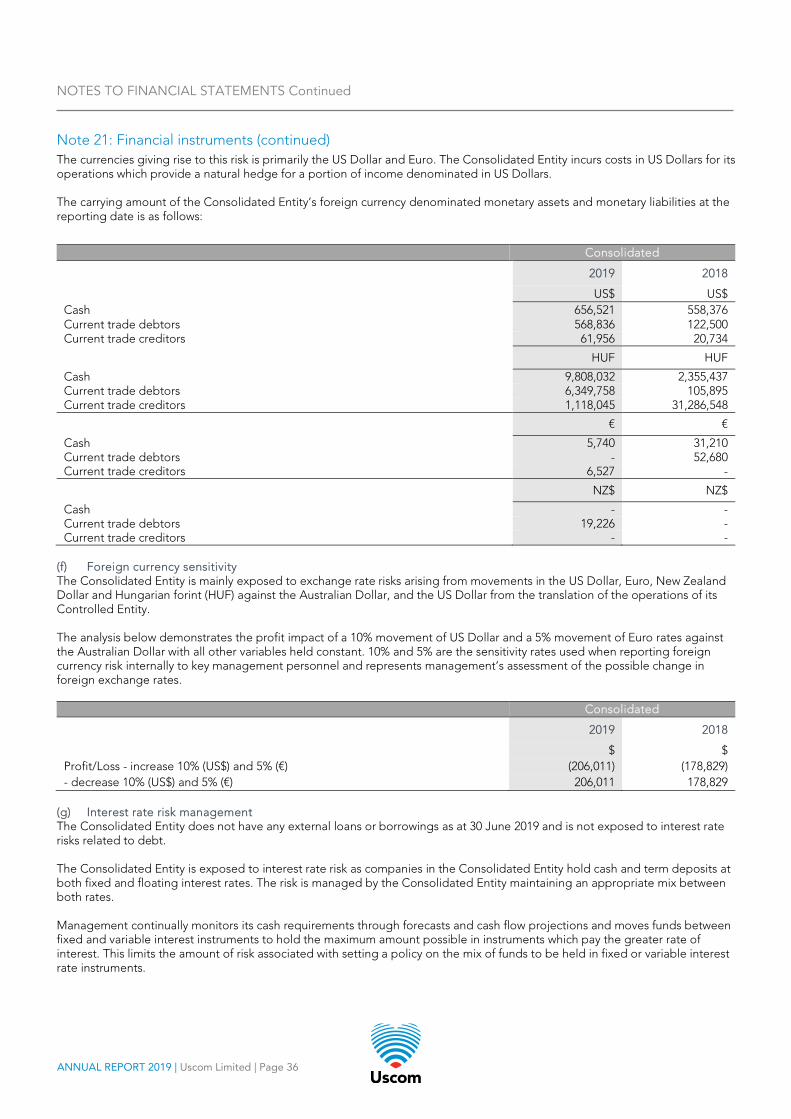
NOTES TO FINANCIAL STATEMENTS Continued
ANNUAL REPORT 2019 | Uscom Limited | Page 36
Note 21: Financial instruments (continued) The currencies giving rise to this risk is primarily the US Dollar and Euro. The Consolidated Entity incurs costs in US Dollars for its operations which provide a natural hedge for a portion of income denominated in US Dollars. The carrying amount of the Consolidated Entity’s foreign currency denominated monetary assets and monetary liabilities at the reporting date is as follows:
Consolidated
2019 2018
US$ US$ Cash 656,521 558,376 Current trade debtors 568,836 122,500 Current trade creditors 61,956 20,734
HUF HUF
Cash 9,808,032 2,355,437 Current trade debtors 6,349,758 105,895 Current trade creditors 1,118,045 31,286,548
€ €
Cash 5,740 31,210 Current trade debtors - 52,680 Current trade creditors 6,527 -
NZ$ NZ$
Cash - - Current trade debtors 19,226 - Current trade creditors - -
(f) Foreign currency sensitivity The Consolidated Entity is mainly exposed to exchange rate risks arising from movements in the US Dollar, Euro, New Zealand Dollar and Hungarian forint (HUF) against the Australian Dollar, and the US Dollar from the translation of the operations of its Controlled Entity. The analysis below demonstrates the profit impact of a 10% movement of US Dollar and a 5% movement of Euro rates against the Australian Dollar with all other variables held constant. 10% and 5% are the sensitivity rates used when reporting foreign currency risk internally to key management personnel and represents management’s assessment of the possible change in foreign exchange rates.
Consolidated
2019 2018
$ $ Profit/Loss - increase 10% (US$) and 5% (€) (206,011) (178,829) - decrease 10% (US$) and 5% (€) 206,011 178,829
(g) Interest rate risk management The Consolidated Entity does not have any external loans or borrowings as at 30 June 2019 and is not exposed to interest rate risks related to debt. The Consolidated Entity is exposed to interest rate risk as companies in the Consolidated Entity hold cash and term deposits at both fixed and floating interest rates. The risk is managed by the Consolidated Entity maintaining an appropriate mix between both rates. Management continually monitors its cash requirements through forecasts and cash flow projections and moves funds between fixed and variable interest instruments to hold the maximum amount possible in instruments which pay the greater rate of interest. This limits the amount of risk associated with setting a policy on the mix of funds to be held in fixed or variable interest rate instruments.
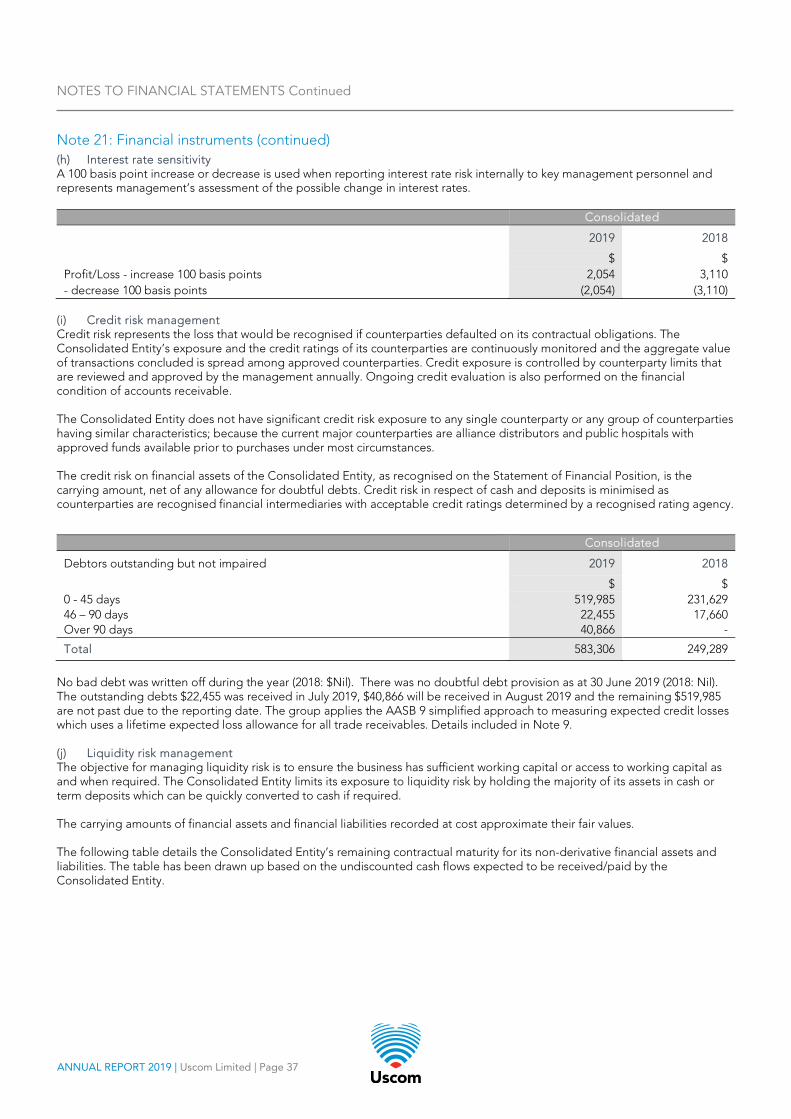
NOTES TO FINANCIAL STATEMENTS Continued
ANNUAL REPORT 2019 | Uscom Limited | Page 37
Note 21: Financial instruments (continued) (h) Interest rate sensitivity A 100 basis point increase or decrease is used when reporting interest rate risk internally to key management personnel and represents management’s assessment of the possible change in interest rates.
Consolidated
2019 2018
$ $ Profit/Loss - increase 100 basis points 2,054 3,110 - decrease 100 basis points (2,054) (3,110)
(i) Credit risk management Credit risk represents the loss that would be recognised if counterparties defaulted on its contractual obligations. The Consolidated Entity’s exposure and the credit ratings of its counterparties are continuously monitored and the aggregate value of transactions concluded is spread among approved counterparties. Credit exposure is controlled by counterparty limits that are reviewed and approved by the management annually. Ongoing credit evaluation is also performed on the financial condition of accounts receivable. The Consolidated Entity does not have significant credit risk exposure to any single counterparty or any group of counterparties having similar characteristics; because the current major counterparties are alliance distributors and public hospitals with approved funds available prior to purchases under most circumstances. The credit risk on financial assets of the Consolidated Entity, as recognised on the Statement of Financial Position, is the carrying amount, net of any allowance for doubtful debts. Credit risk in respect of cash and deposits is minimised as counterparties are recognised financial intermediaries with acceptable credit ratings determined by a recognised rating agency.
Consolidated
Debtors outstanding but not impaired 2019 2018
$ $ 0 - 45 days 519,985 231,629 46 – 90 days 22,455 17,660 Over 90 days 40,866 -
Total 583,306 249,289
No bad debt was written off during the year (2018: $Nil). There was no doubtful debt provision as at 30 June 2019 (2018: Nil). The outstanding debts $22,455 was received in July 2019, $40,866 will be received in August 2019 and the remaining $519,985 are not past due to the reporting date. The group applies the AASB 9 simplified approach to measuring expected credit losses which uses a lifetime expected loss allowance for all trade receivables. Details included in Note 9. (j) Liquidity risk management The objective for managing liquidity risk is to ensure the business has sufficient working capital or access to working capital as and when required. The Consolidated Entity limits its exposure to liquidity risk by holding the majority of its assets in cash or term deposits which can be quickly converted to cash if required. The carrying amounts of financial assets and financial liabilities recorded at cost approximate their fair values. The following table details the Consolidated Entity’s remaining contractual maturity for its non-derivative financial assets and liabilities. The table has been drawn up based on the undiscounted cash flows expected to be received/paid by the Consolidated Entity.
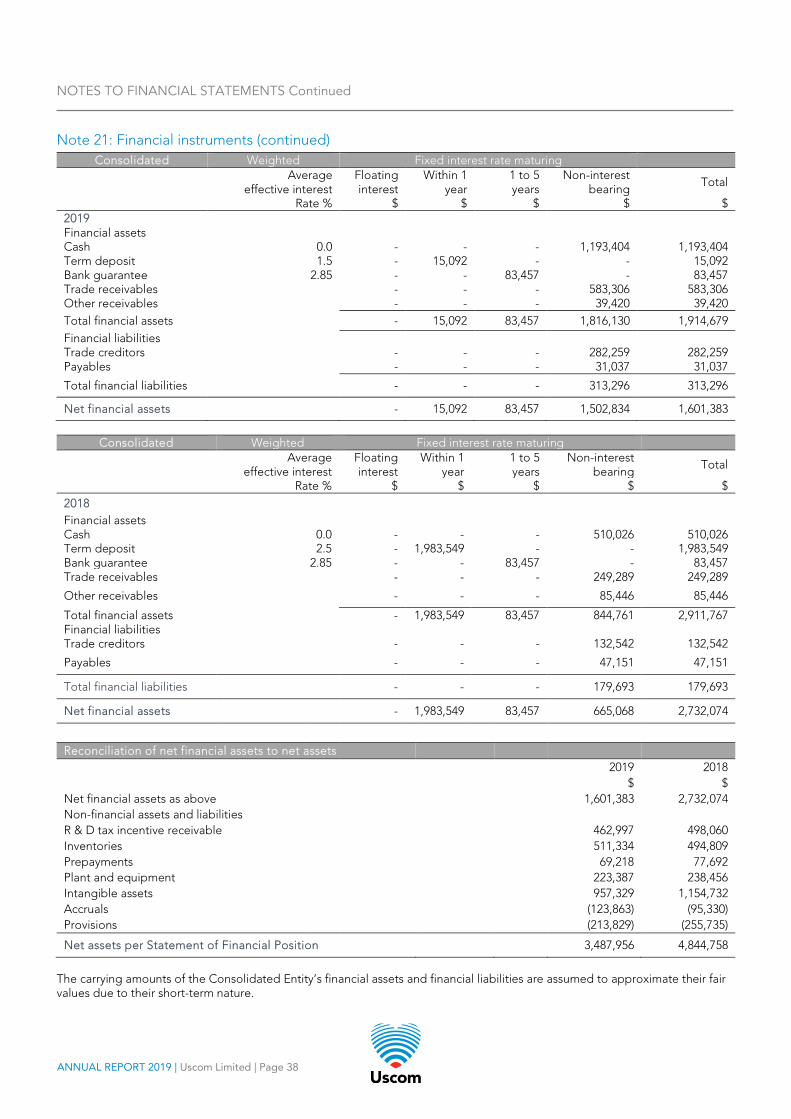
NOTES TO FINANCIAL STATEMENTS Continued
ANNUAL REPORT 2019 | Uscom Limited | Page 38
Note 21: Financial instruments (continued) Consolidated Weighted Fixed interest rate maturing
Average effective interest
Floating interest
Within 1 year
1 to 5 years
Non-interest bearing
Total
Rate % $ $ $ $ $ 2019 Financial assets Cash 0.0 - - - 1,193,404 1,193,404 Term deposit 1.5 - 15,092 - - 15,092 Bank guarantee 2.85 - - 83,457 - 83,457 Trade receivables - - - 583,306 583,306 Other receivables - - - 39,420 39,420 Total financial assets - 15,092 83,457 1,816,130 1,914,679 Financial liabilities Trade creditors - - - 282,259 282,259 Payables - - - 31,037 31,037
Total financial liabilities - - - 313,296 313,296
Net financial assets - 15,092 83,457 1,502,834 1,601,383
Consolidated Weighted Fixed interest rate maturing
Average effective interest
Floating interest
Within 1 year
1 to 5 years
Non-interest bearing
Total
Rate % $ $ $ $ $ 2018 Financial assets Cash 0.0 - - - 510,026 510,026 Term deposit 2.5 - 1,983,549 - - 1,983,549 Bank guarantee 2.85 - - 83,457 - 83,457 Trade receivables - - - 249,289 249,289
Other receivables - - - 85,446 85,446
Total financial assets - 1,983,549 83,457 844,761 2,911,767 Financial liabilities Trade creditors - - - 132,542 132,542
Payables - - - 47,151 47,151
Total financial liabilities - - - 179,693 179,693
Net financial assets - 1,983,549 83,457 665,068 2,732,074
Reconciliation of net financial assets to net assets 2019 2018 $ $ Net financial assets as above 1,601,383 2,732,074 Non-financial assets and liabilities R & D tax incentive receivable 462,997 498,060 Inventories 511,334 494,809 Prepayments 69,218 77,692 Plant and equipment 223,387 238,456 Intangible assets 957,329 1,154,732 Accruals (123,863) (95,330) Provisions (213,829) (255,735)
Net assets per Statement of Financial Position 3,487,956 4,844,758
The carrying amounts of the Consolidated Entity’s financial assets and financial liabilities are assumed to approximate their fair values due to their short-term nature.
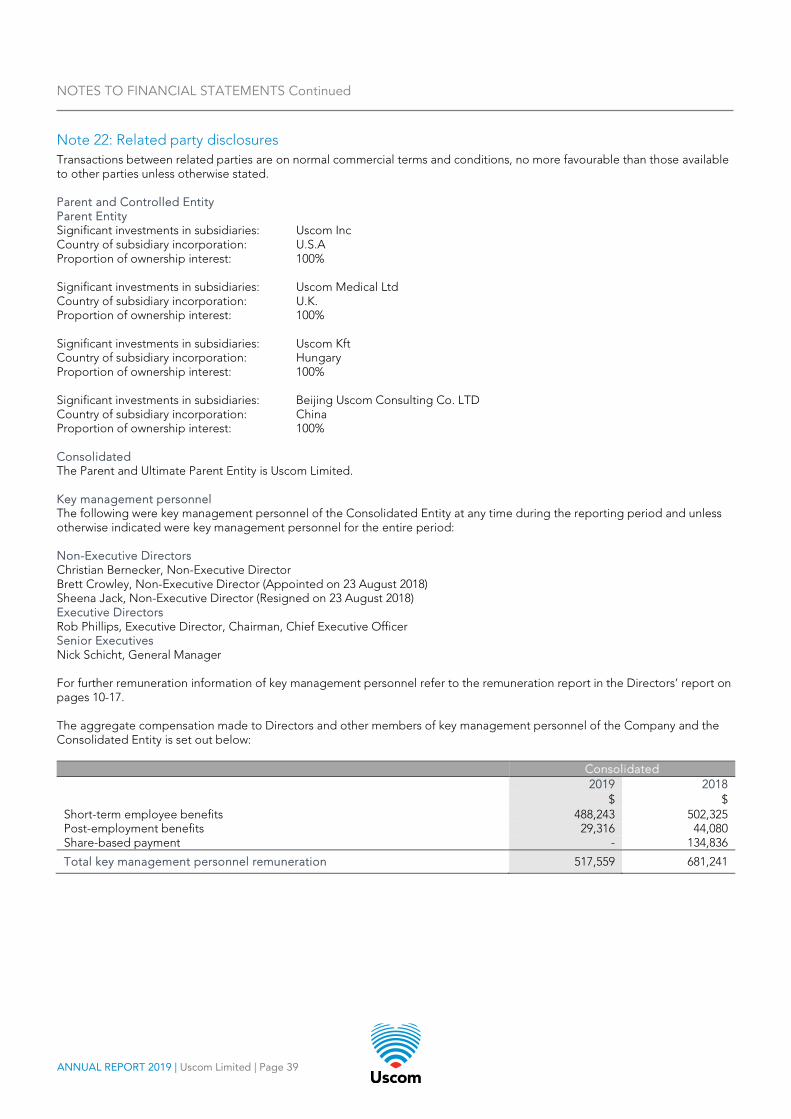
NOTES TO FINANCIAL STATEMENTS Continued
ANNUAL REPORT 2019 | Uscom Limited | Page 39
Note 22: Related party disclosures Transactions between related parties are on normal commercial terms and conditions, no more favourable than those available to other parties unless otherwise stated. Parent and Controlled Entity Parent Entity Significant investments in subsidiaries: Uscom Inc Country of subsidiary incorporation: U.S.A Proportion of ownership interest: 100% Significant investments in subsidiaries: Uscom Medical Ltd Country of subsidiary incorporation: U.K. Proportion of ownership interest: 100% Significant investments in subsidiaries: Uscom Kft Country of subsidiary incorporation: Hungary Proportion of ownership interest: 100% Significant investments in subsidiaries: Beijing Uscom Consulting Co. LTD Country of subsidiary incorporation: China Proportion of ownership interest: 100% Consolidated The Parent and Ultimate Parent Entity is Uscom Limited. Key management personnel The following were key management personnel of the Consolidated Entity at any time during the reporting period and unless otherwise indicated were key management personnel for the entire period: Non-Executive Directors Christian Bernecker, Non-Executive Director Brett Crowley, Non-Executive Director (Appointed on 23 August 2018) Sheena Jack, Non-Executive Director (Resigned on 23 August 2018) Executive Directors Rob Phillips, Executive Director, Chairman, Chief Executive Officer Senior Executives Nick Schicht, General Manager For further remuneration information of key management personnel refer to the remuneration report in the Directors’ report on pages 10-17. The aggregate compensation made to Directors and other members of key management personnel of the Company and the Consolidated Entity is set out below:
Consolidated 2019 2018 $ $ Short-term employee benefits 488,243 502,325 Post-employment benefits 29,316 44,080 Share-based payment - 134,836
Total key management personnel remuneration 517,559 681,241
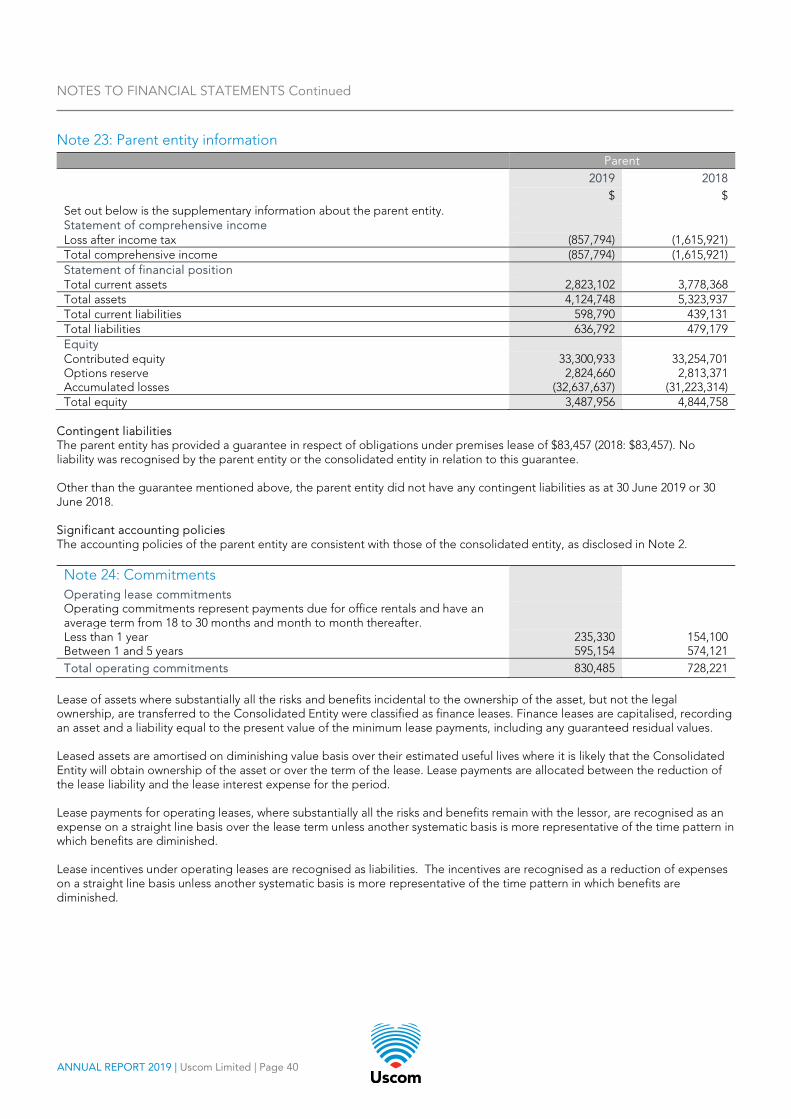
NOTES TO FINANCIAL STATEMENTS Continued
ANNUAL REPORT 2019 | Uscom Limited | Page 40
Note 23: Parent entity information Parent 2019 2018 $ $ Set out below is the supplementary information about the parent entity. Statement of comprehensive income Loss after income tax (857,794) (1,615,921) Total comprehensive income (857,794) (1,615,921) Statement of financial position Total current assets 2,823,102 3,778,368 Total assets 4,124,748 5,323,937 Total current liabilities 598,790 439,131 Total liabilities 636,792 479,179 Equity Contributed equity 33,300,933 33,254,701 Options reserve 2,824,660 2,813,371 Accumulated losses (32,637,637) (31,223,314) Total equity 3,487,956 4,844,758
Contingent liabilities The parent entity has provided a guarantee in respect of obligations under premises lease of $83,457 (2018: $83,457). No liability was recognised by the parent entity or the consolidated entity in relation to this guarantee. Other than the guarantee mentioned above, the parent entity did not have any contingent liabilities as at 30 June 2019 or 30 June 2018. Significant accounting policies The accounting policies of the parent entity are consistent with those of the consolidated entity, as disclosed in Note 2. Note 24: Commitments Operating lease commitments Operating commitments represent payments due for office rentals and have an average term from 18 to 30 months and month to month thereafter.
Less than 1 year 235,330 154,100 Between 1 and 5 years 595,154 574,121 Total operating commitments 830,485 728,221
Lease of assets where substantially all the risks and benefits incidental to the ownership of the asset, but not the legal ownership, are transferred to the Consolidated Entity were classified as finance leases. Finance leases are capitalised, recording an asset and a liability equal to the present value of the minimum lease payments, including any guaranteed residual values. Leased assets are amortised on diminishing value basis over their estimated useful lives where it is likely that the Consolidated Entity will obtain ownership of the asset or over the term of the lease. Lease payments are allocated between the reduction of the lease liability and the lease interest expense for the period. Lease payments for operating leases, where substantially all the risks and benefits remain with the lessor, are recognised as an expense on a straight line basis over the lease term unless another systematic basis is more representative of the time pattern in which benefits are diminished. Lease incentives under operating leases are recognised as liabilities. The incentives are recognised as a reduction of expenses on a straight line basis unless another systematic basis is more representative of the time pattern in which benefits are diminished.
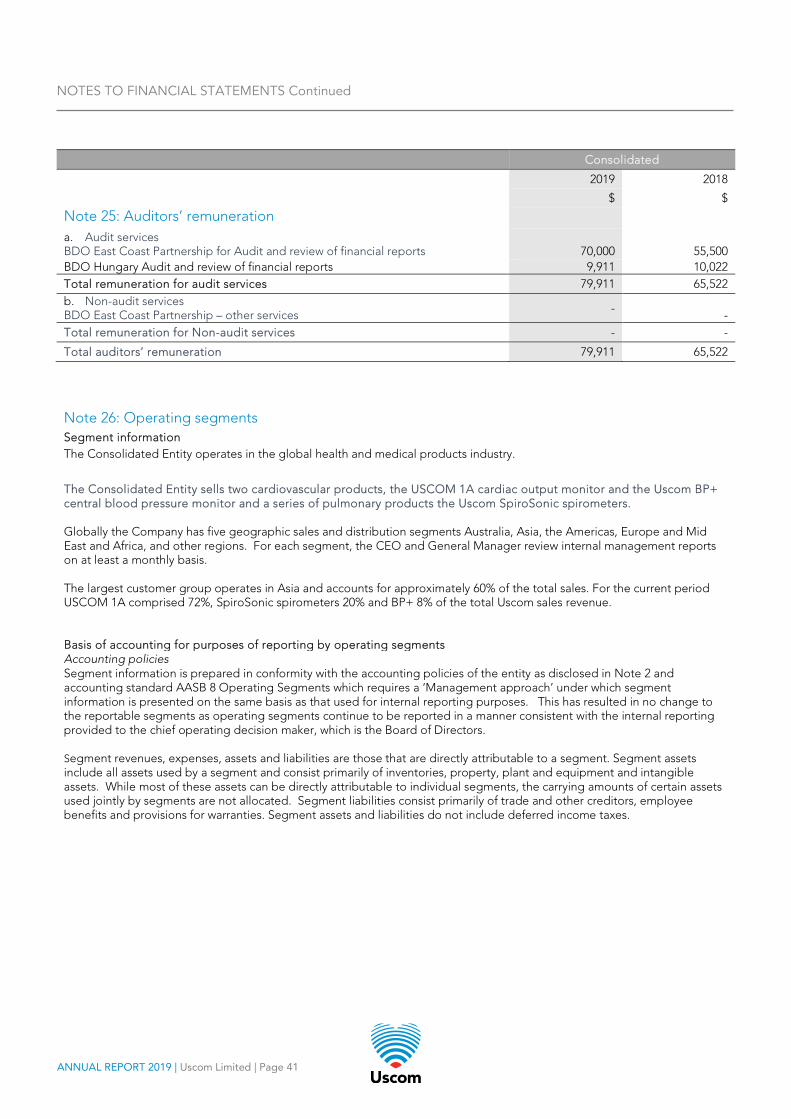
NOTES TO FINANCIAL STATEMENTS Continued
ANNUAL REPORT 2019 | Uscom Limited | Page 41
Consolidated
2019 2018
$ $
Note 25: Auditors’ remuneration
a. Audit services BDO East Coast Partnership for Audit and review of financial reports
70,000
55,500
BDO Hungary Audit and review of financial reports 9,911 10,022 Total remuneration for audit services 79,911 65,522 b. Non-audit services BDO East Coast Partnership – other services -
- Total remuneration for Non-audit services - -
Total auditors’ remuneration 79,911 65,522
Note 26: Operating segments Segment information
The Consolidated Entity operates in the global health and medical products industry.
The Consolidated Entity sells two cardiovascular products, the USCOM 1A cardiac output monitor and the Uscom BP+ central blood pressure monitor and a series of pulmonary products the Uscom SpiroSonic spirometers. Globally the Company has five geographic sales and distribution segments Australia, Asia, the Americas, Europe and Mid East and Africa, and other regions. For each segment, the CEO and General Manager review internal management reports on at least a monthly basis. The largest customer group operates in Asia and accounts for approximately 60% of the total sales. For the current period USCOM 1A comprised 72%, SpiroSonic spirometers 20% and BP+ 8% of the total Uscom sales revenue. Basis of accounting for purposes of reporting by operating segments Accounting policies Segment information is prepared in conformity with the accounting policies of the entity as disclosed in Note 2 and accounting standard AASB 8 Operating Segments which requires a ‘Management approach’ under which segment information is presented on the same basis as that used for internal reporting purposes. This has resulted in no change to the reportable segments as operating segments continue to be reported in a manner consistent with the internal reporting provided to the chief operating decision maker, which is the Board of Directors. Segment revenues, expenses, assets and liabilities are those that are directly attributable to a segment. Segment assets include all assets used by a segment and consist primarily of inventories, property, plant and equipment and intangible assets. While most of these assets can be directly attributable to individual segments, the carrying amounts of certain assets used jointly by segments are not allocated. Segment liabilities consist primarily of trade and other creditors, employee benefits and provisions for warranties. Segment assets and liabilities do not include deferred income taxes.
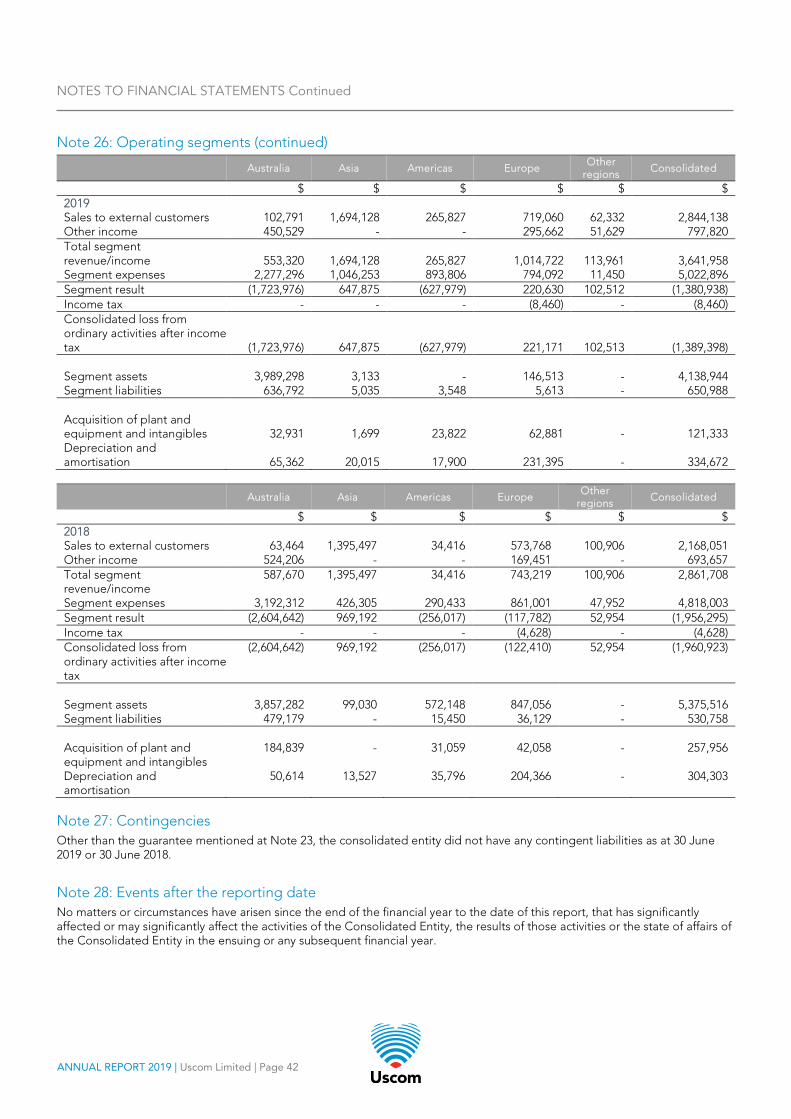
NOTES TO FINANCIAL STATEMENTS Continued
ANNUAL REPORT 2019 | Uscom Limited | Page 42
Note 26: Operating segments (continued)
Australia Asia Americas Europe Other
regions Consolidated
$ $ $ $ $ $ 2019 Sales to external customers 102,791 1,694,128 265,827 719,060 62,332 2,844,138 Other income 450,529 - - 295,662 51,629 797,820 Total segment revenue/income 553,320 1,694,128 265,827 1,014,722 113,961 3,641,958 Segment expenses 2,277,296 1,046,253 893,806 794,092 11,450 5,022,896 Segment result (1,723,976) 647,875 (627,979) 220,630 102,512 (1,380,938) Income tax - - - (8,460) - (8,460) Consolidated loss from ordinary activities after income tax (1,723,976) 647,875 (627,979) 221,171 102,513 (1,389,398) Segment assets 3,989,298 3,133 - 146,513 - 4,138,944 Segment liabilities 636,792 5,035 3,548 5,613 - 650,988 Acquisition of plant and equipment and intangibles 32,931 1,699 23,822 62,881 - 121,333 Depreciation and amortisation 65,362 20,015 17,900 231,395 - 334,672
Australia Asia Americas Europe Other
regions Consolidated
$ $ $ $ $ $ 2018 Sales to external customers 63,464 1,395,497 34,416 573,768 100,906 2,168,051 Other income 524,206 - - 169,451 - 693,657 Total segment revenue/income
587,670 1,395,497 34,416 743,219 100,906 2,861,708
Segment expenses 3,192,312 426,305 290,433 861,001 47,952 4,818,003 Segment result (2,604,642) 969,192 (256,017) (117,782) 52,954 (1,956,295) Income tax - - - (4,628) - (4,628) Consolidated loss from ordinary activities after income tax
(2,604,642) 969,192 (256,017) (122,410) 52,954 (1,960,923)
Segment assets 3,857,282 99,030 572,148 847,056 - 5,375,516 Segment liabilities 479,179 - 15,450 36,129 - 530,758 Acquisition of plant and equipment and intangibles
184,839 - 31,059 42,058 - 257,956
Depreciation and amortisation
50,614 13,527 35,796 204,366 - 304,303
Note 27: Contingencies Other than the guarantee mentioned at Note 23, the consolidated entity did not have any contingent liabilities as at 30 June 2019 or 30 June 2018.
Note 28: Events after the reporting date No matters or circumstances have arisen since the end of the financial year to the date of this report, that has significantly affected or may significantly affect the activities of the Consolidated Entity, the results of those activities or the state of affairs of the Consolidated Entity in the ensuing or any subsequent financial year.
ANNUAL REPORT 2019 | Uscom Limited | Page 43
DIRECTORS DECLARATION Uscom Limited and its Controlled Entity 1. The directors of the company declare that: The financial statements, comprising the statement of comprehensive income,
statement of financial position, statement of cash flows, statement of changes in equity, accompanying Notes, are in accordance with the Corporations Act 2001 and:
a. comply with Accounting Standards and the Corporations Regulations 2001; and
b. give a true and fair view of the consolidated entity’s financial position as at 30 June 2019 and of its performance
for the year ended on that date. 2. The company has included in the Notes to the financial statements an explicit and unreserved statement of compliance
with International Financial Reporting Standards. 3. In the directors’ opinion, there are reasonable grounds to believe that the company will be able to pay its debts as and
when they become due and payable. 4. The directors have been given the declarations required by section 295A. This declaration is made in accordance with a resolution of the Board of Directors and is signed for and on behalf of the directors by: Associate Professor Rob Phillips Executive Director - Chairman Sydney, 19 August 2019
ANNUAL REPORT 2019 | Uscom Limited | Page 44
INDEPENDENT AUDIT REPORT
To the members of Uscom Limited
Report on the Audit of the Financial Report Opinion
We have audited the financial report of Uscom Limited (the Company) and its subsidiaries (the Group), which comprises the consolidated statement of financial position as at 30 June 2019, the consolidated statement of profit or loss and other comprehensive income, the consolidated statement of changes in equity and the consolidated statement of cash flows for the year then ended, and notes to the financial report, including a summary of significant accounting policies and the directors’ declaration.
In our opinion the accompanying financial report of the Group, is in accordance with the Corporations Act 2001, including:
(i) Giving a true and fair view of the Group’s financial position as at 30 June 2019 and of its financial performance for the year ended on that date; and
(ii) Complying with Australian Accounting Standards and the Corporations Regulations 2001.
Basis for opinion
We conducted our audit in accordance with Australian Auditing Standards. Our responsibilities under those standards are further described in the Auditor’s responsibilities for the audit of the Financial Report section of our report. We are independent of the Group in accordance with the Corporations Act 2001 and the ethical requirements of the Accounting Professional and Ethical Standards Board’s APES 110 Code of Ethics for Professional Accountants (the Code) that are relevant to our audit of the financial report in Australia. We have also fulfilled our other ethical responsibilities in accordance with the Code.
We confirm that the independence declaration required by the Corporations Act 2001, which has been given to the directors of the Company, would be in the same terms if given to the directors as at the time of this auditor’s report.
We believe that the audit evidence we have obtained is sufficient and appropriate to provide a basis for our opinion.
Tel: +61 2 9251 4100 Fax: +61 2 9240 9821 www.bdo.com.au
Level 11, 1 Margaret St Sydney NSW 2000 Australia
BDO East Coast Partnership ABN 83 236 985 726 is a member of a national association of independent entities which are all members of BDO Australia Ltd ABN 77 050 110 275, an Australian company limited by guarantee. BDO East Coast Partnership and BDO Australia Ltd are members of BDO International Ltd, a UK company limited by guarantee, and form part of the international BDO network of independent member firms. Liability limited by a scheme approved under Professional Standards Legislation, other than for the acts or omissions of financial services licensees.
INDEPENDENT AUDIT REPORT Continued
ANNUAL REPORT 2019 | Uscom Limited | Page 45
Material uncertainty related to going concern
We draw attention to Note 2 in the financial report which describes the events and/or conditions which give rise to the existence of a material uncertainty that may cast significant doubt about the group’s ability to continue as a going concern and therefore the group may be unable to realise its assets and discharge its liabilities in the normal course of business. Our opinion is not modified in respect of this matter.
Key audit matters
Key audit matters are those matters that, in our professional judgement, were of most significance in our audit of the financial report of the current period. These matters were addressed in the context of our audit of the financial report as a whole, and in forming our opinion thereon, and we do not provide a separate opinion on these matters. In addition to the matter described in the Material uncertainty related to going concern section, we have determined the matters described below to be the key audit matters to be communicated in our report.
Impairment and carrying value of intangible assets - Patents and regulatory approvals
Key audit matter How the matter was addressed in our audit
As disclosed in note 14 of the financial report, the carrying value of the intangibles was considered significant to our audit as the carrying value of $957,329 at 30 June 2019 is material to the financial statements and requires considerable judgement and estimation by management based on uncertain outcomes of regulatory approvals. The intangible assets relate to patents held in connection with the BP+ and Uscom 1A products and regulatory approvals of the SpiroSonic devices.
Our audit procedures included amongst others:
• Re-performance of valuation assessment to determine whether the carrying value was impaired. This was done through the assessment of estimated future discounted cash flows.
• Verified movements in the carrying value of intangibles.
• Scrutinised the inputs to the forecasts provided by management and agreed to supporting documentation, such as historical data and distribution agreements, where appropriate.
• Reviewed the status of regulatory submissions when assessing any potential impairment indicators.
INDEPENDENT AUDIT REPORT Continued
ANNUAL REPORT 2019 | Uscom Limited | Page 46
Existence and Valuation of Inventory
Key audit matter How the matter was addressed in our audit
As disclosed in Note 10, the Group held inventories of $511,334 as at 30 June 2019, which consisted of a combination of raw materials, work in progress and finished goods.
This matter was considered significant to our audit given the relative size of the balance in the consolidated statement of financial position, the estimates and judgements involved in assessing net realisable value and the significant effort required in auditing this balance.
Our audit procedures included amongst others:
• Attended the year end stock-take in order to validate the existence and condition of inventories held.
• Performed detailed testing of a sample of goods despatched and goods received to ensure the transactions around the year end were recorded in the correct period.
• Selected a sample of inventory items to ensure inventory was recorded at the lower of cost and net realisable value, by reference to recent sales.
• Evaluated the inventory obsolescence provision through consideration of the composition of inventory on hand, historic sales trends and repair costs.
Other information
The directors are responsible for the other information. The other information comprises the information in the Group’s annual report for the year ended 30 June 2019, but does not include the financial report and the auditor’s report thereon.
Our opinion on the financial report does not cover the other information and we do not express any form of assurance conclusion thereon.
In connection with our audit of the financial report, our responsibility is to read the other information and, in doing so, consider whether the other information is materially inconsistent with the financial report or our knowledge obtained in the audit or otherwise appears to be materially misstated.
If, based on the work we have performed, we conclude that there is a material misstatement of this other information, we are required to report that fact. We have nothing to report in this regard.
Responsibilities of the directors for the Financial Report
The directors of the Company are responsible for the preparation of the financial report that gives a true and fair view in accordance with Australian Accounting Standards and the Corporations Act 2001 and for such internal control as the directors determine is necessary to enable the preparation of the financial report that gives a true and fair view and is free from material misstatement, whether due to fraud or error.
INDEPENDENT AUDIT REPORT Continued
ANNUAL REPORT 2019 | Uscom Limited | Page 47
In preparing the financial report, the directors are responsible for assessing the ability of the group to continue as a going concern, disclosing, as applicable, matters related to going concern and using the going concern basis of accounting unless the directors either intend to liquidate the Group or to cease operations, or has no realistic alternative but to do so.
Auditor’s responsibilities for the audit of the Financial Report
Our objectives are to obtain reasonable assurance about whether the financial report as a whole is free from material misstatement, whether due to fraud or error, and to issue an auditor’s report that includes our opinion. Reasonable assurance is a high level of assurance, but is not a guarantee that an audit conducted in accordance with the Australian Auditing Standards will always detect a material misstatement when it exists. Misstatements can arise from fraud or error and are considered material if, individually or in the aggregate, they could reasonably be expected to influence the economic decisions of users taken on the basis of this financial report.
A further description of our responsibilities for the audit of the financial report is located at the Auditing and Assurance Standards Board website at:
http://www.auasb.gov.au/auditors_responsibilities/ar1.pdf
This description forms part of our auditor’s report.
Report on the Remuneration Report Opinion on the Remuneration Report
We have audited the Remuneration Report included in the directors’ report for the year ended 30 June 2019.
In our opinion, the Remuneration Report of Uscom Limited, for the year ended 30 June 2018, complies with section 300A of the Corporations Act 2001.
Responsibilities
The directors of the Company are responsible for the preparation and presentation of the Remuneration Report in accordance with section 300A of the Corporations Act 2001. Our responsibility is to express an opinion on the Remuneration Report, based on our audit conducted in accordance with Australian Auditing Standards.
BDO East Coast Partnership
Gareth Few Partner
Sydney, 19 August 2019
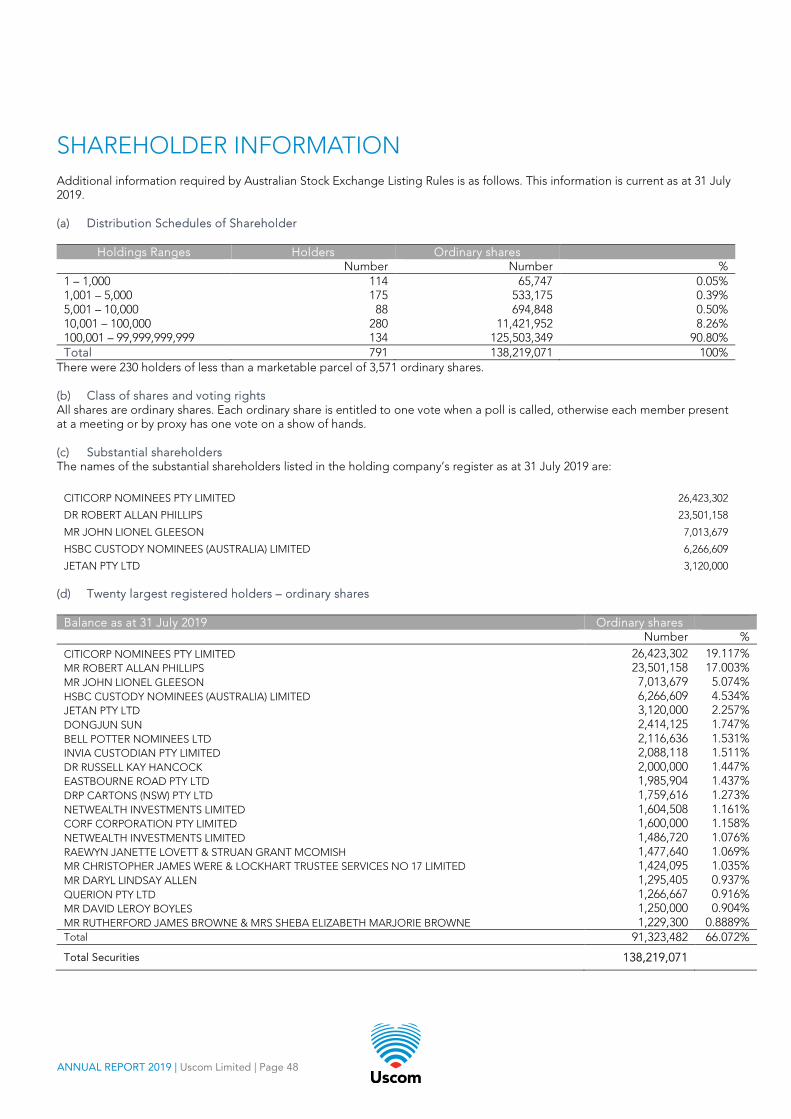
ANNUAL REPORT 2019 | Uscom Limited | Page 48
SHAREHOLDER INFORMATION Additional information required by Australian Stock Exchange Listing Rules is as follows. This information is current as at 31 July 2019. (a) Distribution Schedules of Shareholder
Holdings Ranges Holders Ordinary shares Number Number % 1 – 1,000 114 65,747 0.05% 1,001 – 5,000 175 533,175 0.39% 5,001 – 10,000 88 694,848 0.50% 10,001 – 100,000 280 11,421,952 8.26% 100,001 – 99,999,999,999 134 125,503,349 90.80% Total 791 138,219,071 100%
There were 230 holders of less than a marketable parcel of 3,571 ordinary shares. (b) Class of shares and voting rights All shares are ordinary shares. Each ordinary share is entitled to one vote when a poll is called, otherwise each member present at a meeting or by proxy has one vote on a show of hands. (c) Substantial shareholders The names of the substantial shareholders listed in the holding company’s register as at 31 July 2019 are:
CITICORP NOMINEES PTY LIMITED 26,423,302
DR ROBERT ALLAN PHILLIPS 23,501,158
MR JOHN LIONEL GLEESON 7,013,679
HSBC CUSTODY NOMINEES (AUSTRALIA) LIMITED 6,266,609
JETAN PTY LTD 3,120,000
(d) Twenty largest registered holders – ordinary shares
Balance as at 31 July 2019 Ordinary shares Number % CITICORP NOMINEES PTY LIMITED 26,423,302 19.117% MR ROBERT ALLAN PHILLIPS 23,501,158 17.003% MR JOHN LIONEL GLEESON 7,013,679 5.074% HSBC CUSTODY NOMINEES (AUSTRALIA) LIMITED 6,266,609 4.534% JETAN PTY LTD 3,120,000 2.257% DONGJUN SUN 2,414,125 1.747% BELL POTTER NOMINEES LTD 2,116,636 1.531% INVIA CUSTODIAN PTY LIMITED 2,088,118 1.511% DR RUSSELL KAY HANCOCK 2,000,000 1.447% EASTBOURNE ROAD PTY LTD 1,985,904 1.437% DRP CARTONS (NSW) PTY LTD 1,759,616 1.273% NETWEALTH INVESTMENTS LIMITED 1,604,508 1.161% CORF CORPORATION PTY LIMITED 1,600,000 1.158% NETWEALTH INVESTMENTS LIMITED 1,486,720 1.076% RAEWYN JANETTE LOVETT & STRUAN GRANT MCOMISH 1,477,640 1.069% MR CHRISTOPHER JAMES WERE & LOCKHART TRUSTEE SERVICES NO 17 LIMITED 1,424,095 1.035% MR DARYL LINDSAY ALLEN 1,295,405 0.937% QUERION PTY LTD 1,266,667 0.916% MR DAVID LEROY BOYLES 1,250,000 0.904% MR RUTHERFORD JAMES BROWNE & MRS SHEBA ELIZABETH MARJORIE BROWNE 1,229,300 0.8889% Total 91,323,482 66.072%
Total Securities 138,219,071
SHAREHOLDER INFORMATION Continued
ANNUAL REPORT 2019 | Uscom Limited | Page 49
Registered office and principal place of office Level 8, Suite 2, 66 Clarence Street Sydney NSW 2000 Australia Tel: 02 9247 4144 Fax: 02 9247 8157 Company Secretary Brett Crowley Registers of securities Boardroom Pty Limited Level 12, 225 George Street Sydney NSW 2000 Australia GPO Box 3993 Sydney NSW 2001 Australia Tel: 1300 737 760 Fax: 1300 653 459 www.boardroomlimited.com.au Stock exchange listing Quotation has been granted for 138,219,071 ordinary shares of the Company as at 31 July 2019 on all Member Exchanges of the Australian Stock Exchange Limited. Unquoted securities Rights over unissued shares as at 31 July 2019 A total of 1,1940,476 rights over ordinary shares are on issue to a director and 450,000 rights over ordinary shares are on issue to an executive under the new Equity Incentive Plan.
Related Documents