Article US Immigration Westernizes the Human Gut Microbiome Graphical Abstract Highlights d US immigration is associated with loss of gut microbiome diversity d US immigrants lose bacterial enzymes associated with plant fiber degradation d Bacteroides strains displace Prevotella strains according to time spent in the USA d Loss of diversity increases with obesity and is compounded across generations Authors Pajau Vangay, Abigail J. Johnson, Tonya L. Ward, ..., Purna C. Kashyap, Kathleen A. Culhane-Pera, Dan Knights Correspondence [email protected] In Brief Migration from a non-western nation to the United States is found to be associated with a loss in gut microbiome diversity and function in a manner that may predispose individuals to metabolic disease. Vangay et al., 2018, Cell 175, 962–972 November 1, 2018 ª 2018 Elsevier Inc. https://doi.org/10.1016/j.cell.2018.10.029

Welcome message from author
This document is posted to help you gain knowledge. Please leave a comment to let me know what you think about it! Share it to your friends and learn new things together.
Transcript
Article
US Immigration Westernizes the Human Gut
MicrobiomeGraphical Abstract
Highlights
d US immigration is associated with loss of gut microbiome
diversity
d US immigrants lose bacterial enzymes associated with plant
fiber degradation
d Bacteroides strains displace Prevotella strains according to
time spent in the USA
d Loss of diversity increases with obesity and is compounded
across generations
Vangay et al., 2018, Cell 175, 962–972November 1, 2018 ª 2018 Elsevier Inc.https://doi.org/10.1016/j.cell.2018.10.029
Authors
Pajau Vangay, Abigail J. Johnson,
Tonya L. Ward, ..., Purna C. Kashyap,
Kathleen A. Culhane-Pera, Dan Knights
In Brief
Migration from a non-western nation to
the United States is found to be
associated with a loss in gut microbiome
diversity and function in a manner that
may predispose individuals to metabolic
disease.
Article
US Immigration Westernizesthe Human Gut MicrobiomePajau Vangay,1 Abigail J. Johnson,2 Tonya L. Ward,2 Gabriel A. Al-Ghalith,1 Robin R. Shields-Cutler,2
Benjamin M. Hillmann,3 Sarah K. Lucas,4 Lalit K. Beura,4 Emily A. Thompson,4 Lisa M. Till,5 Rodolfo Batres,6 Bwei Paw,6
Shannon L. Pergament,6 Pimpanitta Saenyakul,6 Mary Xiong,6 Austin D. Kim,7 Grant Kim,8 David Masopust,4
Eric C. Martens,9 Chaisiri Angkurawaranon,10 Rose McGready,11,12 Purna C. Kashyap,5 Kathleen A. Culhane-Pera,6
and Dan Knights1,2,3,13,*1Bioinformatics and Computational Biology Program, University of Minnesota, Minneapolis, MN 55455, USA2Biotechnology Institute, University of Minnesota, Minneapolis, MN 55455, USA3Department of Computer Science and Engineering, University of Minnesota, Minneapolis, MN 55455, USA4Center for Immunology, Department of Microbiology and Immunology, University of Minnesota, Minneapolis, MN 55455, USA5Division of Gastroenterology and Hepatology, Department of Internal Medicine, Mayo Clinic, Rochester, MN 55902, USA6Somali, Latino, and Hmong Partnership for Health and Wellness, West Side Community Health Services, St. Paul, MN 55106, USA7Department of Mathematics, Statistics, and Computer Science, Macalester College, St. Paul, MN 55105, USA8College of Biological Sciences, University of Minnesota, Minneapolis, MN 55455, USA9Department of Microbiology & Immunology, University of Michigan, Ann Arbor, MI 48109, USA10Department of Family Medicine, Faculty of Medicine, Chiang Mai University, Chiang Mai 50200, Thailand11Shoklo Malaria Research Unit, Mahidol-Oxford Tropical Medicine Research Unit, Faculty of Tropical Medicine, Mahidol University,
Mae Sot 63110, Thailand12Centre for Tropical Medicine and Global Health, Nuffield Department of Medicine, University of Oxford, Old Road Campus,
Oxford OX3 7BN, UK13Lead Contact
*Correspondence: [email protected]
https://doi.org/10.1016/j.cell.2018.10.029
SUMMARY
Many US immigrant populations develop metabolicdiseases post immigration, but the causes are notwell understood. Although the microbiome plays arole in metabolic disease, there have been no studiesmeasuring the effects of US immigration on the gutmicrobiome. We collected stool, dietary recalls, andanthropometrics from 514 Hmong and Karen indi-viduals living in Thailand and the United States,including first- and second-generation immigrantsand 19 Karen individuals sampled before and afterimmigration, as well as from 36 US-born EuropeanAmerican individuals. Using 16S and deep shotgunmetagenomic DNA sequencing, we found thatmigra-tion from a non-Western country to the United Statesis associated with immediate loss of gut microbiomediversity and function in which US-associatedstrains and functions displace native strains andfunctions. These effects increase with duration ofUS residence and are compounded by obesity andacross generations.
INTRODUCTION
Previous work has established that diet and geographical envi-
ronment are two principal determinants of microbiome structure
and function (De Filippo et al., 2010; Febinia, 2017; Gomez et al.,
962 Cell 175, 962–972, November 1, 2018 ª 2018 Elsevier Inc.
2016; Kwok et al., 2014; Obregon-Tito et al., 2015; Rothschild
et al., 2018; Schnorr et al., 2014; Yatsunenko et al., 2012). Rural
indigenous populations have been found to harbor substantial
biodiversity in their gut microbiomes, including novel microbial
taxa not found in industrialized populations (Clemente et al.,
2015; Gomez et al., 2016; Obregon-Tito et al., 2015; Schnorr
et al., 2014; Smits et al., 2017; Yatsunenko et al., 2012). This
loss of indigenous microbes or ‘‘disappearing microbiota’’
(Blaser and Falkow, 2009) may be critical in explaining the rise
of chronic diseases in the modern world. Despite the frequent
migration of people across national borders in an increasingly
interconnected world, little is known about how humanmigration
affects the human microbiome.
The United States hosts the largest number of immigrants in
the world (49.8 million or 19% of the world’s total immigrants
and approximately 21% of the US population) (United Nations,
2017). Epidemiological evidence has shown that residency in
the United States increases the risk of obesity and other chronic
diseases among immigrants relative to individuals of the same
ethnicity that continue to reside in their country of birth, with
some groups experiencing up to a 4-fold increase in obesity after
15 years (Goel et al., 2004; Lauderdale and Rathouz, 2000).
Refugees, in particular, appear to be more vulnerable to rapid
weight gain (Heney et al., 2014; Hervey et al., 2009), with South-
east Asian refugees exhibiting the highest average increases in
body mass index (BMI) after relocation to the United States
(Careyva et al., 2015). The Hmong, a minority ethnic group
from China who also reside in Southeast Asia, make up the
largest refugee group in Minnesota (22,033 total refugees as
of 2014) (Minnesota Department of Health, 2017; Pfeifer and
Pre 0 1 2 3 4 5 6 7 8 9 10
0
20
40
60
Karen
ObeseOverweight
B
A
C
Pre-Immigration US-born
Controlsn = 36
Hmong2ndn = 54
Post-Immigration
Cross-sectionalstudy
N = 550 24-hr dietary recall
Anthropometrics
Stool sample
Migration historyLongitudinal
sub-studyn = 19
M1 M2 M3 M4 M5 M6M0
KarenThain = 84
HmongThain = 95
Hmong1stn = 137
Karen1stn = 144
Pre 0 5 10 15 25 30 35 40 45 2nd
0
20
40
60
Hmong
PorkchopPorkchop
White rice
Chicken breast
Chinese cabbage
Coffee
Carbonated citrus drink
Darkness of bar indicates average consumption of specific food in this study group
Most prevalent foods consumed per group are highlighted in red for select food groups
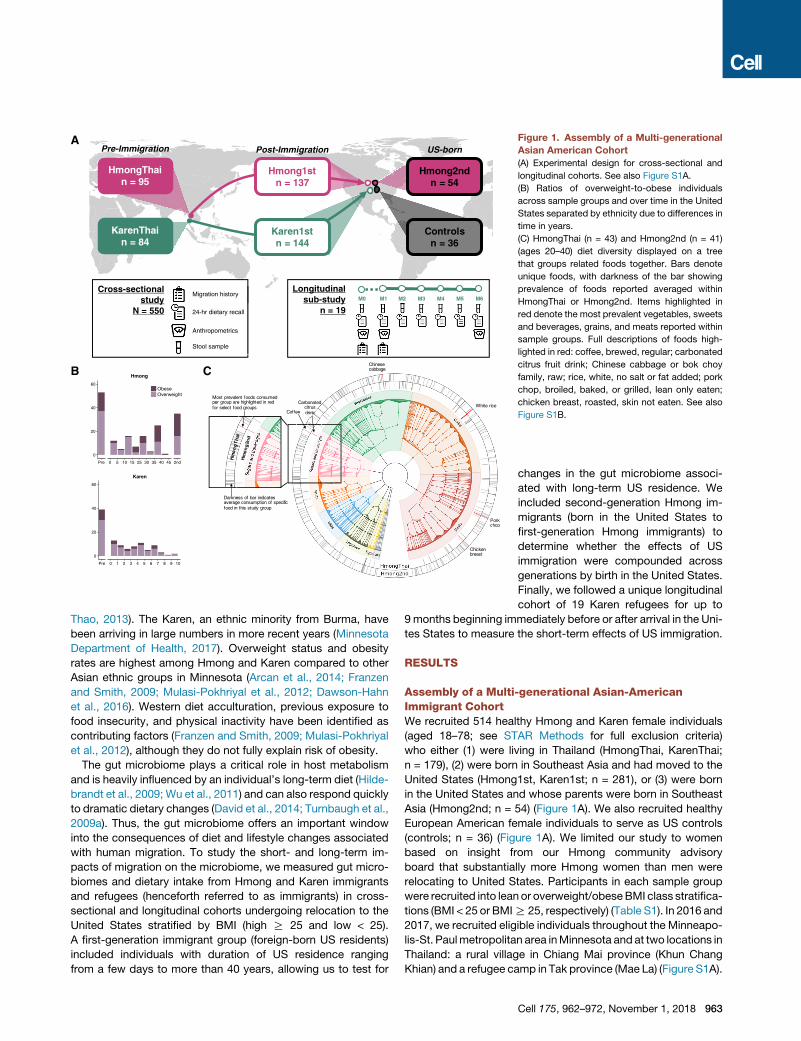
Figure 1. Assembly of a Multi-generational
Asian American Cohort
(A) Experimental design for cross-sectional and
longitudinal cohorts. See also Figure S1A.
(B) Ratios of overweight-to-obese individuals
across sample groups and over time in the United
States separated by ethnicity due to differences in
time in years.
(C) HmongThai (n = 43) and Hmong2nd (n = 41)
(ages 20–40) diet diversity displayed on a tree
that groups related foods together. Bars denote
unique foods, with darkness of the bar showing
prevalence of foods reported averaged within
HmongThai or Hmong2nd. Items highlighted in
red denote the most prevalent vegetables, sweets
and beverages, grains, and meats reported within
sample groups. Full descriptions of foods high-
lighted in red: coffee, brewed, regular; carbonated
citrus fruit drink; Chinese cabbage or bok choy
family, raw; rice, white, no salt or fat added; pork
chop, broiled, baked, or grilled, lean only eaten;
chicken breast, roasted, skin not eaten. See also
Figure S1B.
Thao, 2013). The Karen, an ethnic minority from Burma, have
been arriving in large numbers in more recent years (Minnesota
Department of Health, 2017). Overweight status and obesity
rates are highest among Hmong and Karen compared to other
Asian ethnic groups in Minnesota (Arcan et al., 2014; Franzen
and Smith, 2009; Mulasi-Pokhriyal et al., 2012; Dawson-Hahn
et al., 2016). Western diet acculturation, previous exposure to
food insecurity, and physical inactivity have been identified as
contributing factors (Franzen and Smith, 2009; Mulasi-Pokhriyal
et al., 2012), although they do not fully explain risk of obesity.
The gut microbiome plays a critical role in host metabolism
and is heavily influenced by an individual’s long-term diet (Hilde-
brandt et al., 2009; Wu et al., 2011) and can also respond quickly
to dramatic dietary changes (David et al., 2014; Turnbaugh et al.,
2009a). Thus, the gut microbiome offers an important window
into the consequences of diet and lifestyle changes associated
with human migration. To study the short- and long-term im-
pacts of migration on the microbiome, we measured gut micro-
biomes and dietary intake from Hmong and Karen immigrants
and refugees (henceforth referred to as immigrants) in cross-
sectional and longitudinal cohorts undergoing relocation to the
United States stratified by BMI (high R 25 and low < 25).
A first-generation immigrant group (foreign-born US residents)
included individuals with duration of US residence ranging
from a few days to more than 40 years, allowing us to test for
changes in the gut microbiome associ-
ated with long-term US residence. We
included second-generation Hmong im-
migrants (born in the United States to
first-generation Hmong immigrants) to
determine whether the effects of US
immigration were compounded across
generations by birth in the United States.
Finally, we followed a unique longitudinal
cohort of 19 Karen refugees for up to
9months beginning immediately before or after arrival in the Uni-
tes States to measure the short-term effects of US immigration.
RESULTS
Assembly of a Multi-generational Asian-AmericanImmigrant CohortWe recruited 514 healthy Hmong and Karen female individuals
(aged 18–78; see STAR Methods for full exclusion criteria)
who either (1) were living in Thailand (HmongThai, KarenThai;
n = 179), (2) were born in Southeast Asia and had moved to the
United States (Hmong1st, Karen1st; n = 281), or (3) were born
in the United States and whose parents were born in Southeast
Asia (Hmong2nd; n = 54) (Figure 1A). We also recruited healthy
European American female individuals to serve as US controls
(controls; n = 36) (Figure 1A). We limited our study to women
based on insight from our Hmong community advisory
board that substantially more Hmong women than men were
relocating to United States. Participants in each sample group
were recruited into lean or overweight/obeseBMI class stratifica-
tions (BMI < 25 or BMIR 25, respectively) (Table S1). In 2016 and
2017, we recruited eligible individuals throughout the Minneapo-
lis-St. Paulmetropolitan area inMinnesota and at two locations in
Thailand: a rural village in Chiang Mai province (Khun Chang
Khian) and a refugee camp in Tak province (Mae La) (Figure S1A).
Cell 175, 962–972, November 1, 2018 963
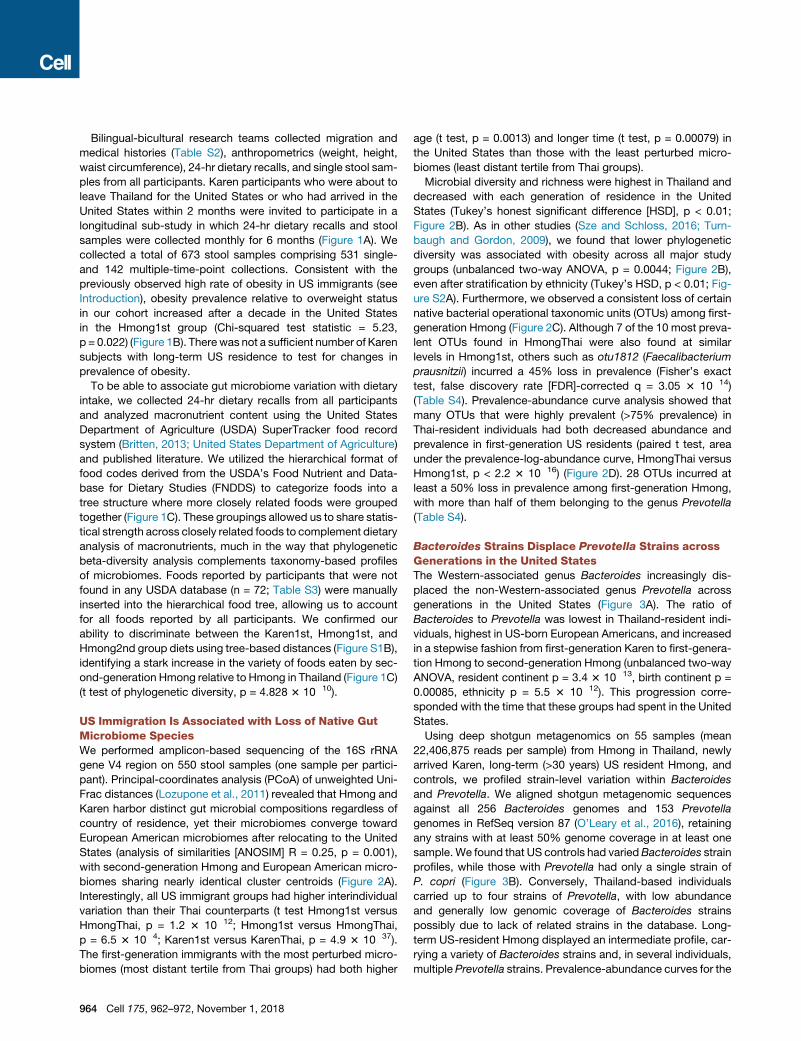
Bilingual-bicultural research teams collected migration and
medical histories (Table S2), anthropometrics (weight, height,
waist circumference), 24-hr dietary recalls, and single stool sam-
ples from all participants. Karen participants who were about to
leave Thailand for the United States or who had arrived in the
United States within 2 months were invited to participate in a
longitudinal sub-study in which 24-hr dietary recalls and stool
samples were collected monthly for 6 months (Figure 1A). We
collected a total of 673 stool samples comprising 531 single-
and 142 multiple-time-point collections. Consistent with the
previously observed high rate of obesity in US immigrants (see
Introduction), obesity prevalence relative to overweight status
in our cohort increased after a decade in the United States
in the Hmong1st group (Chi-squared test statistic = 5.23,
p = 0.022) (Figure 1B). Therewas not a sufficient number of Karen
subjects with long-term US residence to test for changes in
prevalence of obesity.
To be able to associate gut microbiome variation with dietary
intake, we collected 24-hr dietary recalls from all participants
and analyzed macronutrient content using the United States
Department of Agriculture (USDA) SuperTracker food record
system (Britten, 2013; United States Department of Agriculture)
and published literature. We utilized the hierarchical format of
food codes derived from the USDA’s Food Nutrient and Data-
base for Dietary Studies (FNDDS) to categorize foods into a
tree structure where more closely related foods were grouped
together (Figure 1C). These groupings allowed us to share statis-
tical strength across closely related foods to complement dietary
analysis of macronutrients, much in the way that phylogenetic
beta-diversity analysis complements taxonomy-based profiles
of microbiomes. Foods reported by participants that were not
found in any USDA database (n = 72; Table S3) were manually
inserted into the hierarchical food tree, allowing us to account
for all foods reported by all participants. We confirmed our
ability to discriminate between the Karen1st, Hmong1st, and
Hmong2nd group diets using tree-based distances (Figure S1B),
identifying a stark increase in the variety of foods eaten by sec-
ond-generation Hmong relative to Hmong in Thailand (Figure 1C)
(t test of phylogenetic diversity, p = 4.828 3 10�10).
US Immigration Is Associated with Loss of Native GutMicrobiome SpeciesWe performed amplicon-based sequencing of the 16S rRNA
gene V4 region on 550 stool samples (one sample per partici-
pant). Principal-coordinates analysis (PCoA) of unweighted Uni-
Frac distances (Lozupone et al., 2011) revealed that Hmong and
Karen harbor distinct gut microbial compositions regardless of
country of residence, yet their microbiomes converge toward
European American microbiomes after relocating to the United
States (analysis of similarities [ANOSIM] R = 0.25, p = 0.001),
with second-generation Hmong and European American micro-
biomes sharing nearly identical cluster centroids (Figure 2A).
Interestingly, all US immigrant groups had higher interindividual
variation than their Thai counterparts (t test Hmong1st versus
HmongThai, p = 1.2 3 10�12; Hmong1st versus HmongThai,
p = 6.5 3 10�4; Karen1st versus KarenThai, p = 4.9 3 10�37).
The first-generation immigrants with the most perturbed micro-
biomes (most distant tertile from Thai groups) had both higher
964 Cell 175, 962–972, November 1, 2018
age (t test, p = 0.0013) and longer time (t test, p = 0.00079) in
the United States than those with the least perturbed micro-
biomes (least distant tertile from Thai groups).
Microbial diversity and richness were highest in Thailand and
decreased with each generation of residence in the United
States (Tukey’s honest significant difference [HSD], p < 0.01;
Figure 2B). As in other studies (Sze and Schloss, 2016; Turn-
baugh and Gordon, 2009), we found that lower phylogenetic
diversity was associated with obesity across all major study
groups (unbalanced two-way ANOVA, p = 0.0044; Figure 2B),
even after stratification by ethnicity (Tukey’s HSD, p < 0.01; Fig-
ure S2A). Furthermore, we observed a consistent loss of certain
native bacterial operational taxonomic units (OTUs) among first-
generation Hmong (Figure 2C). Although 7 of the 10 most preva-
lent OTUs found in HmongThai were also found at similar
levels in Hmong1st, others such as otu1812 (Faecalibacterium
prausnitzii) incurred a 45% loss in prevalence (Fisher’s exact
test, false discovery rate [FDR]-corrected q = 3.05 3 10�14)
(Table S4). Prevalence-abundance curve analysis showed that
many OTUs that were highly prevalent (>75% prevalence) in
Thai-resident individuals had both decreased abundance and
prevalence in first-generation US residents (paired t test, area
under the prevalence-log-abundance curve, HmongThai versus
Hmong1st, p < 2.2 3 10�16) (Figure 2D). 28 OTUs incurred at
least a 50% loss in prevalence among first-generation Hmong,
with more than half of them belonging to the genus Prevotella
(Table S4).
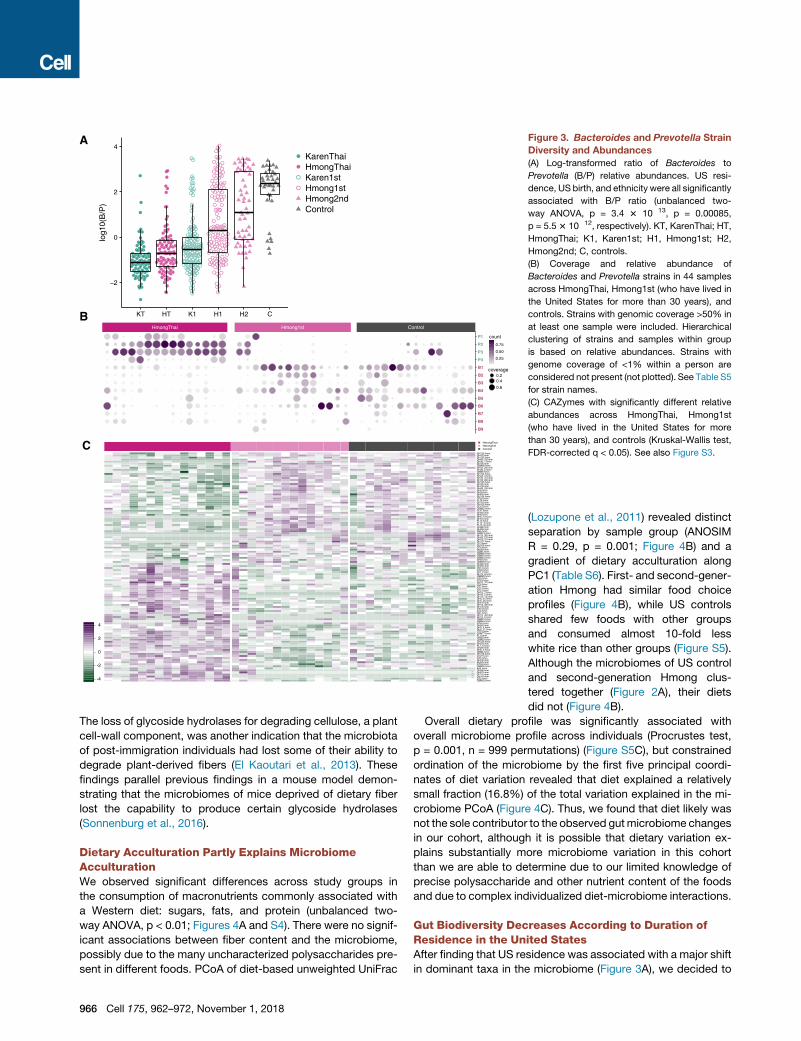
Bacteroides Strains Displace Prevotella Strains acrossGenerations in the United StatesThe Western-associated genus Bacteroides increasingly dis-
placed the non-Western-associated genus Prevotella across
generations in the United States (Figure 3A). The ratio of
Bacteroides to Prevotella was lowest in Thailand-resident indi-
viduals, highest in US-born European Americans, and increased
in a stepwise fashion from first-generation Karen to first-genera-
tion Hmong to second-generation Hmong (unbalanced two-way
ANOVA, resident continent p = 3.4 3 10�13, birth continent p =
0.00085, ethnicity p = 5.5 3 10�12). This progression corre-
sponded with the time that these groups had spent in the United
States.
Using deep shotgun metagenomics on 55 samples (mean
22,406,875 reads per sample) from Hmong in Thailand, newly
arrived Karen, long-term (>30 years) US resident Hmong, and
controls, we profiled strain-level variation within Bacteroides
and Prevotella. We aligned shotgun metagenomic sequences
against all 256 Bacteroides genomes and 153 Prevotella
genomes in RefSeq version 87 (O’Leary et al., 2016), retaining
any strains with at least 50% genome coverage in at least one
sample. We found that US controls had variedBacteroides strain
profiles, while those with Prevotella had only a single strain of
P. copri (Figure 3B). Conversely, Thailand-based individuals
carried up to four strains of Prevotella, with low abundance
and generally low genomic coverage of Bacteroides strains
possibly due to lack of related strains in the database. Long-
term US-resident Hmong displayed an intermediate profile, car-
rying a variety of Bacteroides strains and, in several individuals,
multiple Prevotella strains. Prevalence-abundance curves for the
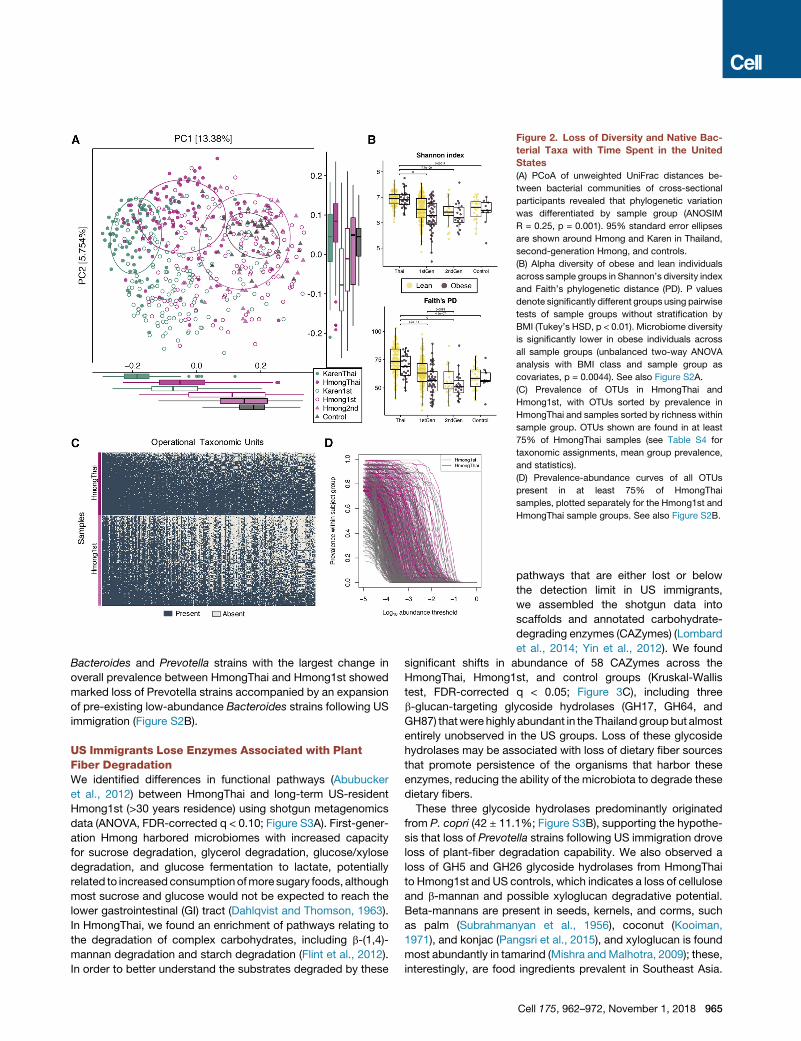
Figure 2. Loss of Diversity and Native Bac-
terial Taxa with Time Spent in the United
States
(A) PCoA of unweighted UniFrac distances be-
tween bacterial communities of cross-sectional
participants revealed that phylogenetic variation
was differentiated by sample group (ANOSIM
R = 0.25, p = 0.001). 95% standard error ellipses
are shown around Hmong and Karen in Thailand,
second-generation Hmong, and controls.
(B) Alpha diversity of obese and lean individuals
across sample groups in Shannon’s diversity index
and Faith’s phylogenetic distance (PD). P values
denote significantly different groups using pairwise
tests of sample groups without stratification by
BMI (Tukey’s HSD, p < 0.01). Microbiome diversity
is significantly lower in obese individuals across
all sample groups (unbalanced two-way ANOVA
analysis with BMI class and sample group as
covariates, p = 0.0044). See also Figure S2A.
(C) Prevalence of OTUs in HmongThai and
Hmong1st, with OTUs sorted by prevalence in
HmongThai and samples sorted by richness within
sample group. OTUs shown are found in at least
75% of HmongThai samples (see Table S4 for
taxonomic assignments, mean group prevalence,
and statistics).
(D) Prevalence-abundance curves of all OTUs
present in at least 75% of HmongThai
samples, plotted separately for the Hmong1st and
HmongThai sample groups. See also Figure S2B.
Bacteroides and Prevotella strains with the largest change in
overall prevalence between HmongThai and Hmong1st showed
marked loss of Prevotella strains accompanied by an expansion
of pre-existing low-abundance Bacteroides strains following US
immigration (Figure S2B).
US Immigrants Lose Enzymes Associated with PlantFiber DegradationWe identified differences in functional pathways (Abubucker
et al., 2012) between HmongThai and long-term US-resident
Hmong1st (>30 years residence) using shotgun metagenomics
data (ANOVA, FDR-corrected q < 0.10; Figure S3A). First-gener-
ation Hmong harbored microbiomes with increased capacity
for sucrose degradation, glycerol degradation, glucose/xylose
degradation, and glucose fermentation to lactate, potentially
related to increasedconsumptionofmoresugary foods, although
most sucrose and glucose would not be expected to reach the
lower gastrointestinal (GI) tract (Dahlqvist and Thomson, 1963).
In HmongThai, we found an enrichment of pathways relating to
the degradation of complex carbohydrates, including b-(1,4)-
mannan degradation and starch degradation (Flint et al., 2012).
In order to better understand the substrates degraded by these
pathways that are either lost or below
the detection limit in US immigrants,
we assembled the shotgun data into
scaffolds and annotated carbohydrate-
degrading enzymes (CAZymes) (Lombard
et al., 2014; Yin et al., 2012). We found
significant shifts in abundance of 58 CAZymes across the
HmongThai, Hmong1st, and control groups (Kruskal-Wallis
test, FDR-corrected q < 0.05; Figure 3C), including three
b-glucan-targeting glycoside hydrolases (GH17, GH64, and
GH87) thatwere highly abundant in the Thailandgroupbut almost
entirely unobserved in the US groups. Loss of these glycoside
hydrolases may be associated with loss of dietary fiber sources
that promote persistence of the organisms that harbor these
enzymes, reducing the ability of the microbiota to degrade these
dietary fibers.
These three glycoside hydrolases predominantly originated
from P. copri (42 ± 11.1%; Figure S3B), supporting the hypothe-
sis that loss of Prevotella strains following US immigration drove
loss of plant-fiber degradation capability. We also observed a
loss of GH5 and GH26 glycoside hydrolases from HmongThai
to Hmong1st and US controls, which indicates a loss of cellulose
and b-mannan and possible xyloglucan degradative potential.
Beta-mannans are present in seeds, kernels, and corms, such
as palm (Subrahmanyan et al., 1956), coconut (Kooiman,
1971), and konjac (Pangsri et al., 2015), and xyloglucan is found
most abundantly in tamarind (Mishra andMalhotra, 2009); these,
interestingly, are food ingredients prevalent in Southeast Asia.
Cell 175, 962–972, November 1, 2018 965
A
HmongThai Hmong1st Control
B9
B8
B7
B6
B5
B4
B3
B2
B1
P4
P3
P2
P1
B
C
0.25
0.50
0.75
count
coverage0.20.4
0.6
2
0
2
4
KT HT K1 H1 H2 C
log1
0(B
/P)
KarenThaiHmongThaiKaren1stHmong1stHmong2ndControl
HmongThaiHmong1stControl
CBM50.hmmGT2.hmmGH19.hmmGH17.hmmGH87.hmmGH64.hmmAA4.hmmCBM26.hmmGT39.hmmGH24.hmmGH23.hmmGT5.hmmGT27.hmmGH128.hmmCBM4.hmmGH5_2.hmmGH25.hmmPL1_6.hmmGH53.hmmGH133.hmmCBM53.hmmGH85.hmmPL1.hmmCBM77.hmmGT51.hmmGH5_37.hmmGH5_4.hmmGH26.hmmGT46.hmmCBM45.hmmCBM31.hmmGH13_6.hmmGH13_42.hmmCE7.hmmGT9.hmmGT19.hmmGH73.hmmGH13_38.hmmGH57.hmmGH5_25.hmmGH5_21.hmmGH13_12.hmmGH43_5.hmmGH13_7.hmmGT21.hmmGT13.hmmGT7.hmmCE8.hmmGH13_37.hmmGT23.hmmGT3.hmmCBM20.hmmGH13_8.hmmCE11.hmmGT30.hmmCE14.hmmGH95.hmmGH84.hmmCBM48.hmmGH8.hmmCBM54.hmmCBM22.hmmCBM46.hmmCBM5.hmmGH38.hmmGT6.hmmGH109.hmmCE3.hmmGH121.hmmGH43_22.hmmGH43_27.hmmGH13_30.hmmCBM73.hmmCE6.hmmGH92.hmmGH88.hmmPL15_2.hmmPL12_2.hmmPL13.hmmGH91.hmmGH5_13.hmmGH5.hmmGH55.hmmPL27.hmmCBM62.hmmCE15.hmmGH139.hmmGH15.hmmPL26.hmmGT20.hmmGH145.hmmGH63.hmmGH3.hmmGH2.hmmGH43_24.hmmGH78.hmmGH43.hmmGH127.hmmGH43_28.hmmGH43_31.hmmGH43_3.hmmGH144.hmmCBM9.hmmGH30_6.hmmGH43_26.hmmCBM66.hmmGH18.hmmGH30_1.hmmGH43_33.hmmGH125.hmmGH42.hmmGH120.hmm
4
2
0
-2
-4
Figure 3. Bacteroides and Prevotella Strain
Diversity and Abundances
(A) Log-transformed ratio of Bacteroides to
Prevotella (B/P) relative abundances. US resi-
dence, US birth, and ethnicity were all significantly
associated with B/P ratio (unbalanced two-
way ANOVA, p = 3.4 3 10�13, p = 0.00085,
p = 5.53 10�12, respectively). KT, KarenThai; HT,
HmongThai; K1, Karen1st; H1, Hmong1st; H2,
Hmong2nd; C, controls.
(B) Coverage and relative abundance of
Bacteroides and Prevotella strains in 44 samples
across HmongThai, Hmong1st (who have lived in
the United States for more than 30 years), and
controls. Strains with genomic coverage >50% in
at least one sample were included. Hierarchical
clustering of strains and samples within group
is based on relative abundances. Strains with
genome coverage of <1% within a person are
considered not present (not plotted). See Table S5
for strain names.
(C) CAZymes with significantly different relative
abundances across HmongThai, Hmong1st
(who have lived in the United States for more
than 30 years), and controls (Kruskal-Wallis test,
FDR-corrected q < 0.05). See also Figure S3.
The loss of glycoside hydrolases for degrading cellulose, a plant
cell-wall component, was another indication that the microbiota
of post-immigration individuals had lost some of their ability to
degrade plant-derived fibers (El Kaoutari et al., 2013). These
findings parallel previous findings in a mouse model demon-
strating that the microbiomes of mice deprived of dietary fiber
lost the capability to produce certain glycoside hydrolases
(Sonnenburg et al., 2016).
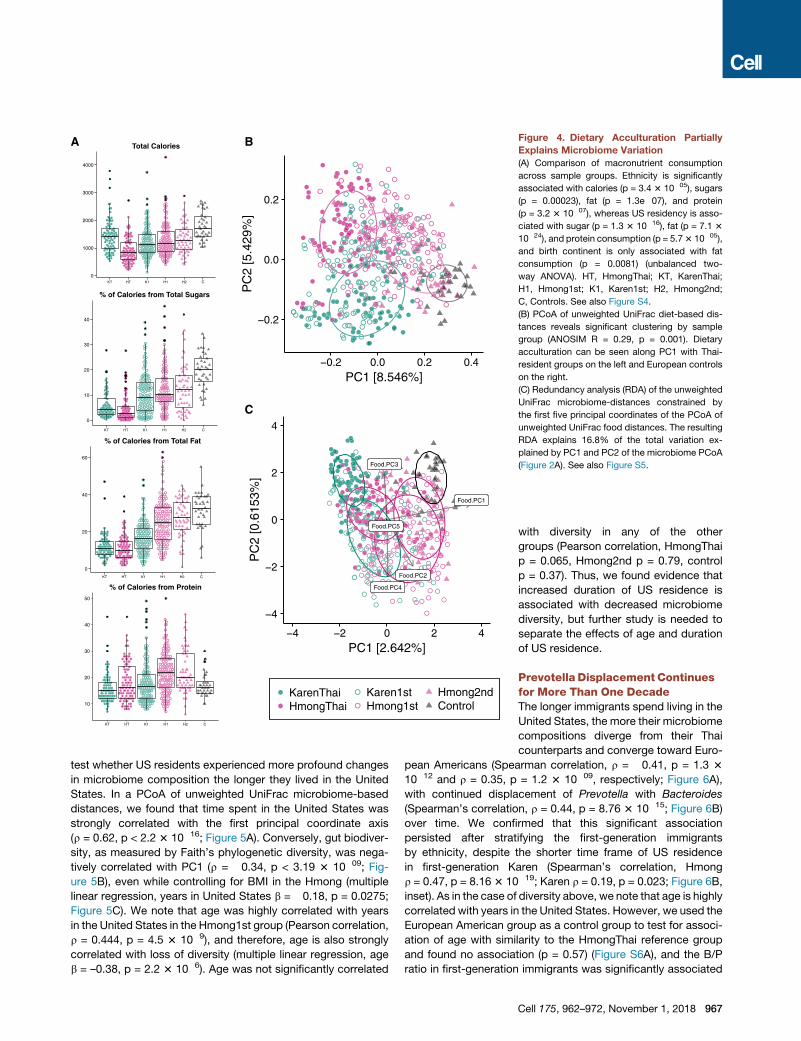
Dietary Acculturation Partly Explains MicrobiomeAcculturationWe observed significant differences across study groups in
the consumption of macronutrients commonly associated with
a Western diet: sugars, fats, and protein (unbalanced two-
way ANOVA, p < 0.01; Figures 4A and S4). There were no signif-
icant associations between fiber content and the microbiome,
possibly due to the many uncharacterized polysaccharides pre-
sent in different foods. PCoA of diet-based unweighted UniFrac
966 Cell 175, 962–972, November 1, 2018
(Lozupone et al., 2011) revealed distinct
separation by sample group (ANOSIM
R = 0.29, p = 0.001; Figure 4B) and a
gradient of dietary acculturation along
PC1 (Table S6). First- and second-gener-
ation Hmong had similar food choice
profiles (Figure 4B), while US controls
shared few foods with other groups
and consumed almost 10-fold less
white rice than other groups (Figure S5).
Although the microbiomes of US control
and second-generation Hmong clus-
tered together (Figure 2A), their diets
did not (Figure 4B).
Overall dietary profile was significantly associated with
overall microbiome profile across individuals (Procrustes test,
p = 0.001, n = 999 permutations) (Figure S5C), but constrained
ordination of the microbiome by the first five principal coordi-
nates of diet variation revealed that diet explained a relatively
small fraction (16.8%) of the total variation explained in the mi-
crobiome PCoA (Figure 4C). Thus, we found that diet likely was
not the sole contributor to the observed gutmicrobiome changes
in our cohort, although it is possible that dietary variation ex-
plains substantially more microbiome variation in this cohort
than we are able to determine due to our limited knowledge of
precise polysaccharide and other nutrient content of the foods
and due to complex individualized diet-microbiome interactions.
Gut Biodiversity Decreases According to Duration ofResidence in the United StatesAfter finding that US residence was associated with a major shift
in dominant taxa in the microbiome (Figure 3A), we decided to
0.2
0.0
0.2
0.2 0.0 0.2 0.4PC1 [8.546%]
PC
2 [5
.429
%]
A B
C
0
1000
2000
3000
4000
KT HT K1 H1 H2 C
Total Calories
0
10
20
30
40
KT HT K1 H1 H2 C
% of Calories from Total Sugars
0
20
40
60
KT HT K1 H1 H2 C
% of Calories from Total Fat
10
20
30
40
50
KT HT K1 H1 H2 C
% of Calories from Protein
Food.PC1
Food.PC2
Food.PC3
Food.PC4
Food.PC5
4
2
0
2
4
4 2 0 2 4PC1 [2.642%]
PC
2 [0
.615
3%]
Karen1stHmong1st
Hmong2ndControl
KarenThaiHmongThai
Figure 4. Dietary Acculturation Partially
Explains Microbiome Variation
(A) Comparison of macronutrient consumption
across sample groups. Ethnicity is significantly
associated with calories (p = 3.4 3 10�05), sugars
(p = 0.00023), fat (p = 1.3e�07), and protein
(p = 3.2 3 10�07), whereas US residency is asso-
ciated with sugar (p = 1.3 3 10�16), fat (p = 7.1 3
10�24), and protein consumption (p = 5.73 10�05),
and birth continent is only associated with fat
consumption (p = 0.0081) (unbalanced two-
way ANOVA). HT, HmongThai; KT, KarenThai;
H1, Hmong1st; K1, Karen1st; H2, Hmong2nd;
C, Controls. See also Figure S4.
(B) PCoA of unweighted UniFrac diet-based dis-
tances reveals significant clustering by sample
group (ANOSIM R = 0.29, p = 0.001). Dietary
acculturation can be seen along PC1 with Thai-
resident groups on the left and European controls
on the right.
(C) Redundancy analysis (RDA) of the unweighted
UniFrac microbiome-distances constrained by
the first five principal coordinates of the PCoA of
unweighted UniFrac food distances. The resulting
RDA explains 16.8% of the total variation ex-
plained by PC1 and PC2 of the microbiome PCoA
(Figure 2A). See also Figure S5.
test whether US residents experienced more profound changes
in microbiome composition the longer they lived in the United
States. In a PCoA of unweighted UniFrac microbiome-based
distances, we found that time spent in the United States was
strongly correlated with the first principal coordinate axis
(⍴ = 0.62, p < 2.2 3 10�16; Figure 5A). Conversely, gut biodiver-
sity, as measured by Faith’s phylogenetic diversity, was nega-
tively correlated with PC1 (⍴ = �0.34, p < 3.19 3 10�09; Fig-
ure 5B), even while controlling for BMI in the Hmong (multiple
linear regression, years in United States b = �0.18, p = 0.0275;
Figure 5C). We note that age was highly correlated with years
in the United States in the Hmong1st group (Pearson correlation,
r = 0.444, p = 4.5 3 10�9), and therefore, age is also strongly
correlated with loss of diversity (multiple linear regression, age
b = –0.38, p = 2.2 3 10�6). Age was not significantly correlated
with diversity in any of the other
groups (Pearson correlation, HmongThai
p = 0.065, Hmong2nd p = 0.79, control
p = 0.37). Thus, we found evidence that
increased duration of US residence is
associated with decreased microbiome
diversity, but further study is needed to
separate the effects of age and duration
of US residence.
Prevotella Displacement Continuesfor More Than One DecadeThe longer immigrants spend living in the
United States, the more their microbiome
compositions diverge from their Thai
counterparts and converge toward Euro-
pean Americans (Spearman correlation, r = �0.41, p = 1.3 3
10�12 and r = 0.35, p = 1.2 3 10�09, respectively; Figure 6A),
with continued displacement of Prevotella with Bacteroides
(Spearman’s correlation, r = 0.44, p = 8.76 3 10�15; Figure 6B)
over time. We confirmed that this significant association
persisted after stratifying the first-generation immigrants
by ethnicity, despite the shorter time frame of US residence
in first-generation Karen (Spearman’s correlation, Hmong
r = 0.47, p = 8.163 10�19; Karen r = 0.19, p = 0.023; Figure 6B,
inset). As in the case of diversity above, we note that age is highly
correlated with years in the United States. However, we used the
European American group as a control group to test for associ-
ation of age with similarity to the HmongThai reference group
and found no association (p = 0.57) (Figure S6A), and the B/P
ratio in first-generation immigrants was significantly associated
Cell 175, 962–972, November 1, 2018 967
A B
C
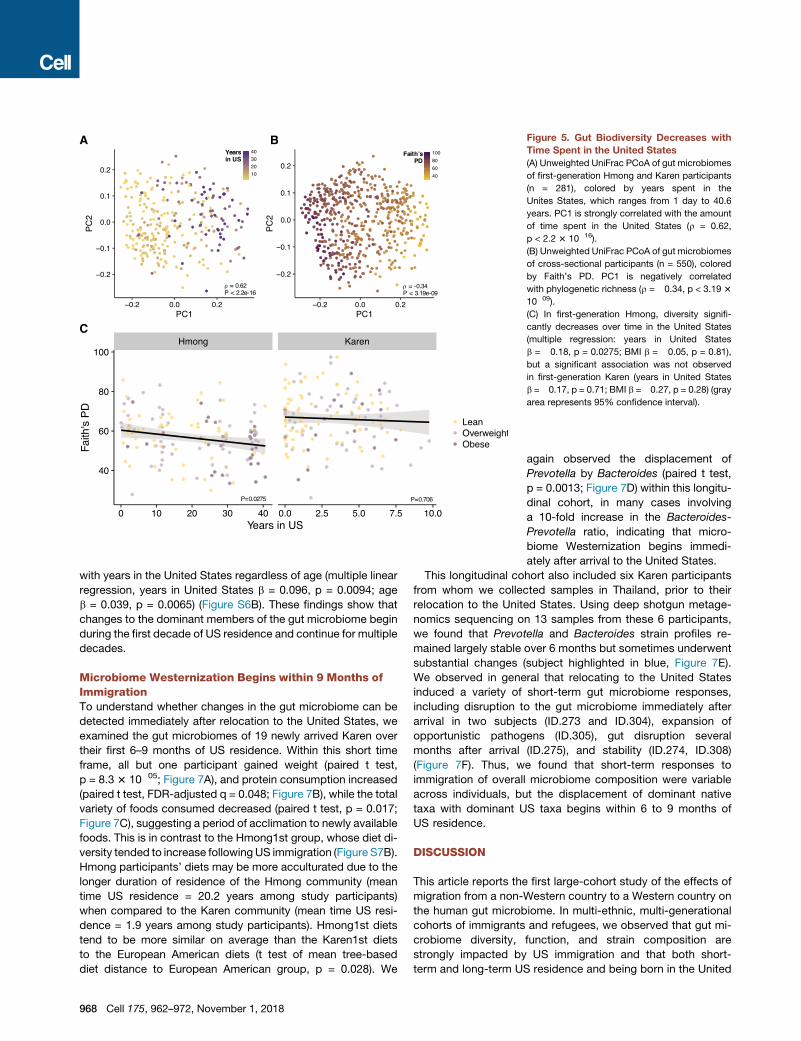
Figure 5. Gut Biodiversity Decreases with
Time Spent in the United States
(A) Unweighted UniFrac PCoA of gut microbiomes
of first-generation Hmong and Karen participants
(n = 281), colored by years spent in the
Unites States, which ranges from 1 day to 40.6
years. PC1 is strongly correlated with the amount
of time spent in the United States (⍴ = 0.62,
p < 2.2 3 10�16).
(B) Unweighted UniFrac PCoA of gut microbiomes
of cross-sectional participants (n = 550), colored
by Faith’s PD. PC1 is negatively correlated
with phylogenetic richness (⍴ = �0.34, p < 3.19 3
10�09).
(C) In first-generation Hmong, diversity signifi-
cantly decreases over time in the United States
(multiple regression: years in United States
b = �0.18, p = 0.0275; BMI b = �0.05, p = 0.81),
but a significant association was not observed
in first-generation Karen (years in United States
b =�0.17, p = 0.71; BMI b =�0.27, p = 0.28) (gray
area represents 95% confidence interval).
with years in the United States regardless of age (multiple linear
regression, years in United States b = 0.096, p = 0.0094; age
b = 0.039, p = 0.0065) (Figure S6B). These findings show that
changes to the dominant members of the gut microbiome begin
during the first decade of US residence and continue for multiple
decades.
Microbiome Westernization Begins within 9 Months ofImmigrationTo understand whether changes in the gut microbiome can be
detected immediately after relocation to the United States, we
examined the gut microbiomes of 19 newly arrived Karen over
their first 6–9 months of US residence. Within this short time
frame, all but one participant gained weight (paired t test,
p = 8.3 3 10�05; Figure 7A), and protein consumption increased
(paired t test, FDR-adjusted q = 0.048; Figure 7B), while the total
variety of foods consumed decreased (paired t test, p = 0.017;
Figure 7C), suggesting a period of acclimation to newly available
foods. This is in contrast to the Hmong1st group, whose diet di-
versity tended to increase followingUS immigration (Figure S7B).
Hmong participants’ diets may be more acculturated due to the
longer duration of residence of the Hmong community (mean
time US residence = 20.2 years among study participants)
when compared to the Karen community (mean time US resi-
dence = 1.9 years among study participants). Hmong1st diets
tend to be more similar on average than the Karen1st diets
to the European American diets (t test of mean tree-based
diet distance to European American group, p = 0.028). We
968 Cell 175, 962–972, November 1, 2018
again observed the displacement of
Prevotella by Bacteroides (paired t test,
p = 0.0013; Figure 7D) within this longitu-
dinal cohort, in many cases involving
a 10-fold increase in the Bacteroides-
Prevotella ratio, indicating that micro-
biome Westernization begins immedi-
ately after arrival to the United States.
This longitudinal cohort also included six Karen participants
from whom we collected samples in Thailand, prior to their
relocation to the United States. Using deep shotgun metage-
nomics sequencing on 13 samples from these 6 participants,
we found that Prevotella and Bacteroides strain profiles re-
mained largely stable over 6 months but sometimes underwent
substantial changes (subject highlighted in blue, Figure 7E).
We observed in general that relocating to the United States
induced a variety of short-term gut microbiome responses,
including disruption to the gut microbiome immediately after
arrival in two subjects (ID.273 and ID.304), expansion of
opportunistic pathogens (ID.305), gut disruption several
months after arrival (ID.275), and stability (ID.274, ID.308)
(Figure 7F). Thus, we found that short-term responses to
immigration of overall microbiome composition were variable
across individuals, but the displacement of dominant native
taxa with dominant US taxa begins within 6 to 9 months of
US residence.
DISCUSSION
This article reports the first large-cohort study of the effects of
migration from a non-Western country to a Western country on
the human gut microbiome. In multi-ethnic, multi-generational
cohorts of immigrants and refugees, we observed that gut mi-
crobiome diversity, function, and strain composition are
strongly impacted by US immigration and that both short-
term and long-term US residence and being born in the United
A
B
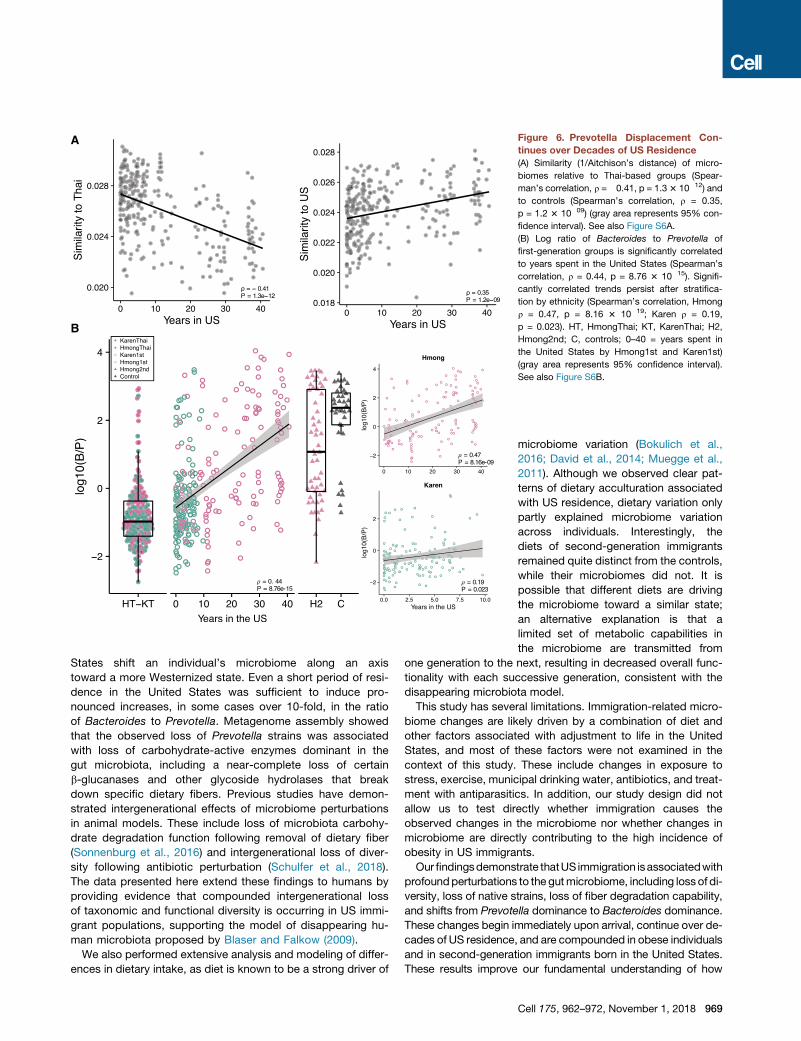
Figure 6. Prevotella Displacement Con-
tinues over Decades of US Residence
(A) Similarity (1/Aitchison’s distance) of micro-
biomes relative to Thai-based groups (Spear-
man’s correlation, r =�0.41, p = 1.33 10�12) and
to controls (Spearman’s correlation, r = 0.35,
p = 1.2 3 10�09) (gray area represents 95% con-
fidence interval). See also Figure S6A.
(B) Log ratio of Bacteroides to Prevotella of
first-generation groups is significantly correlated
to years spent in the United States (Spearman’s
correlation, r = 0.44, p = 8.76 3 10�15). Signifi-
cantly correlated trends persist after stratifica-
tion by ethnicity (Spearman’s correlation, Hmong
r = 0.47, p = 8.16 3 10�19; Karen r = 0.19,
p = 0.023). HT, HmongThai; KT, KarenThai; H2,
Hmong2nd; C, controls; 0–40 = years spent in
the United States by Hmong1st and Karen1st)
(gray area represents 95% confidence interval).
See also Figure S6B.
States shift an individual’s microbiome along an axis
toward a more Westernized state. Even a short period of resi-
dence in the United States was sufficient to induce pro-
nounced increases, in some cases over 10-fold, in the ratio
of Bacteroides to Prevotella. Metagenome assembly showed
that the observed loss of Prevotella strains was associated
with loss of carbohydrate-active enzymes dominant in the
gut microbiota, including a near-complete loss of certain
b-glucanases and other glycoside hydrolases that break
down specific dietary fibers. Previous studies have demon-
strated intergenerational effects of microbiome perturbations
in animal models. These include loss of microbiota carbohy-
drate degradation function following removal of dietary fiber
(Sonnenburg et al., 2016) and intergenerational loss of diver-
sity following antibiotic perturbation (Schulfer et al., 2018).
The data presented here extend these findings to humans by
providing evidence that compounded intergenerational loss
of taxonomic and functional diversity is occurring in US immi-
grant populations, supporting the model of disappearing hu-
man microbiota proposed by Blaser and Falkow (2009).
We also performed extensive analysis and modeling of differ-
ences in dietary intake, as diet is known to be a strong driver of
microbiome variation (Bokulich et al.,
2016; David et al., 2014; Muegge et al.,
2011). Although we observed clear pat-
terns of dietary acculturation associated
with US residence, dietary variation only
partly explained microbiome variation
across individuals. Interestingly, the
diets of second-generation immigrants
remained quite distinct from the controls,
while their microbiomes did not. It is
possible that different diets are driving
the microbiome toward a similar state;
an alternative explanation is that a
limited set of metabolic capabilities in
the microbiome are transmitted from
one generation to the next, resulting in decreased overall func-
tionality with each successive generation, consistent with the
disappearing microbiota model.
This study has several limitations. Immigration-related micro-
biome changes are likely driven by a combination of diet and
other factors associated with adjustment to life in the United
States, and most of these factors were not examined in the
context of this study. These include changes in exposure to
stress, exercise, municipal drinking water, antibiotics, and treat-
ment with antiparasitics. In addition, our study design did not
allow us to test directly whether immigration causes the
observed changes in the microbiome nor whether changes in
microbiome are directly contributing to the high incidence of
obesity in US immigrants.
Ourfindingsdemonstrate thatUS immigration isassociatedwith
profoundperturbations to the gutmicrobiome, including lossof di-
versity, loss of native strains, loss of fiber degradation capability,
and shifts from Prevotella dominance to Bacteroides dominance.
These changes begin immediately upon arrival, continue over de-
cades of US residence, and are compounded in obese individuals
and in second-generation immigrants born in the United States.
These results improve our fundamental understanding of how
Cell 175, 962–972, November 1, 2018 969
A B C D
E F
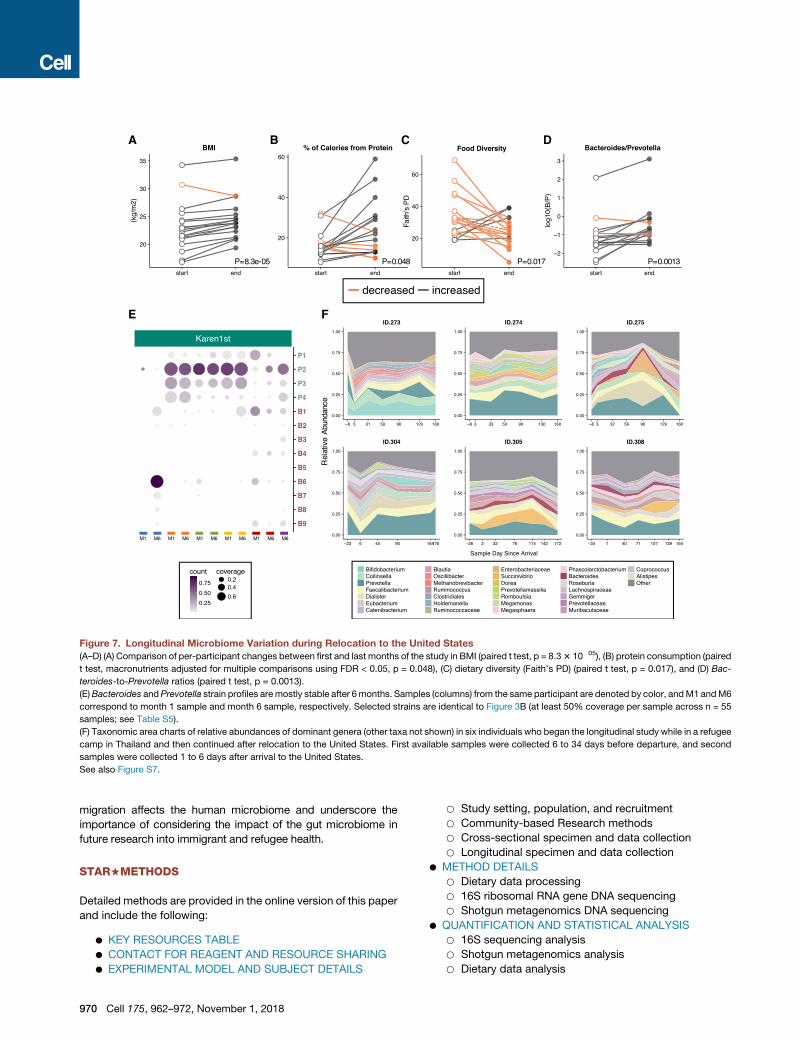
Figure 7. Longitudinal Microbiome Variation during Relocation to the United States
(A–D) (A) Comparison of per-participant changes between first and last months of the study in BMI (paired t test, p = 8.33 10�05), (B) protein consumption (paired
t test, macronutrients adjusted for multiple comparisons using FDR < 0.05, p = 0.048), (C) dietary diversity (Faith’s PD) (paired t test, p = 0.017), and (D) Bac-
teroides-to-Prevotella ratios (paired t test, p = 0.0013).
(E)Bacteroides andPrevotella strain profiles aremostly stable after 6months. Samples (columns) from the same participant are denoted by color, andM1 andM6
correspond to month 1 sample and month 6 sample, respectively. Selected strains are identical to Figure 3B (at least 50% coverage per sample across n = 55
samples; see Table S5).
(F) Taxonomic area charts of relative abundances of dominant genera (other taxa not shown) in six individuals who began the longitudinal study while in a refugee
camp in Thailand and then continued after relocation to the United States. First available samples were collected 6 to 34 days before departure, and second
samples were collected 1 to 6 days after arrival to the United States.
See also Figure S7.
migration affects the human microbiome and underscore the
importance of considering the impact of the gut microbiome in
future research into immigrant and refugee health.
STAR+METHODS
Detailed methods are provided in the online version of this paper
and include the following:
d KEY RESOURCES TABLE
d CONTACT FOR REAGENT AND RESOURCE SHARING
d EXPERIMENTAL MODEL AND SUBJECT DETAILS
970 Cell 175, 962–972, November 1, 2018
B Study setting, population, and recruitment
B Community-based Research methods
B Cross-sectional specimen and data collection
B Longitudinal specimen and data collection
d METHOD DETAILS
B Dietary data processing
B 16S ribosomal RNA gene DNA sequencing
B Shotgun metagenomics DNA sequencing
d QUANTIFICATION AND STATISTICAL ANALYSIS
B 16S sequencing analysis
B Shotgun metagenomics analysis
B Dietary data analysis
d DATA AND SOFTWARE AVAILABILITY
B Software
B Data Resources
SUPPLEMENTAL INFORMATION
Supplemental Information includes seven figures and six tables and can be
found with this article online at https://doi.org/10.1016/j.cell.2018.10.029.
ACKNOWLEDGMENTS
We thank all of the participants in this study.We also thank themembers of our
community advisory boards, who provided critical feedback throughout the
study: Bu Bu, Jamiey Cha, Yoha Christiansen, Pa Chua Vang, Duachi Her,
Ku Ku Paw Lynn, Mayly Lochungvu, Mudah Takoni, Aye Mi San, Yeng
Moua, Ko Nay Oo, Donna Vue Lee, Houa Vue-Her, Pakou Xiong, and Shoua
Yang. Our work in Thailand would not have been possible without Ntxawm
Lis, Yi Lis, Blooming Zion, Htoo Lay Paw, Moo Kho Paw, See Thoj, and Wira-
chon Yangyuenkun. We also thank Nurul Quratulaini Abd Salim Nast, Domi-
nique Sabas, and Max Abramson for their assistance in the lab. We thank
Ryan Hunter for his advice and assistance with planning. This work was sup-
ported by the University of Minnesota Clinical and Translational Science Insti-
tute; the University of Minnesota Healthy Foods, Healthy Lives Institute; the
University ofMinnesotaOffice of Diversity; and theGraduate School at theUni-
versity of Minnesota.
AUTHOR CONTRIBUTIONS
Conceptualization, P.V., K.A.C.-P., and D.K.; Methodology, P.V., K.A.C.-P.,
R.B., S.L.P., C.A., T.L.W., L.M.T., L.K.B., S.K.L., D.M., R.M., P.C.K., and
D.K.; Software, G.A.A.-K., B.M.H., and A.D.K.; Formal Analysis, P.V.,
R.R.S.-C., A.J.J., and D.K.; Investigation, C.A., R.M., P.V., B.P., E.C.M.,
P.S., and M.X.; Data Curation, G.K.; Writing—Original Draft, P.V. and D.K.;
Writing—Review and Editing, K.A.C.-P., S.L.P., C.A., L.K.B., S.K.L., E.A.T.,
E.C.M., D.M., P.C.K., R.R.S.-C., P.V., and D.K.; Visualization, P.V.,
R.R.S.-C., A.J.J., and D.K.; Supervision, D.K., K.A.C.P, and S.L.P.; Project
Administration, P.V.; Funding Acquisition: P.V. and D.K.
DECLARATION OF INTERESTS
D.K. serves as CEO and holds equity in CoreBiome, a company involved in
the commercialization of microbiome analysis. The University of Minnesota
also has financial interests in CoreBiome under the terms of a license agree-
ment with CoreBiome. These interests have been reviewed and managed by
the University of Minnesota in accordance with its Conflict-of-Interest
policies.
Received: August 22, 2018
Revised: September 10, 2018
Accepted: October 12, 2018
Published: November 1, 2018
REFERENCES
Abubucker, S., Segata, N., Goll, J., Schubert, A.M., Izard, J., Cantarel, B.L.,
Rodriguez-Mueller, B., Zucker, J., Thiagarajan, M., Henrissat, B., et al.
(2012). Metabolic reconstruction for metagenomic data and its application to
the human microbiome. PLoS Comput. Biol. 8, e1002358.
Al-Ghalith, G., and Knights, D. (2017). BURST enables optimal exhaustive DNA
alignment for big data (Zenodo).
Al-Ghalith, G., and Knights, D. (2018). aKronyMer enables database-free
metagenome comparison (Zenodo).
Al-Ghalith, G.A., Hillmann, B., Ang, K., Shields-Cutler, R., and Knights, D.
(2018). SHI7 Is a Self-Learning Pipeline for Multipurpose Short-Read DNA
Quality Control. mSystems 3.
Allen, M.L., Culhane-Pera, K.A., Call, K.T., and Pergament, S.L. (2011).
Partners in research: curricula to prepare community and faculty for CBPR
partnerships. CES4healthinfo.
Arcan, C., Larson, N., Bauer, K., Berge, J., Story, M., and Neumark-Sztainer,
D. (2014). Dietary and weight-related behaviors and body mass index among
Hispanic, Hmong, Somali, and white adolescents. J. Acad. Nutr. Diet. 114,
375–383.
Asnicar, F., Weingart, G., Tickle, T.L., Huttenhower, C., and Segata, N. (2015).
Compact graphical representation of phylogenetic data and metadata with
GraPhlAn. PeerJ 3, e1029.
Blaser, M.J., and Falkow, S. (2009). What are the consequences of the disap-
pearing human microbiota? Nat. Rev. Microbiol. 7, 887–894.
Bokulich, N.A., Chung, J., Battaglia, T., Henderson, N., Jay,M., Li, H., D Lieber,
A., Wu, F., Perez-Perez, G.I., Chen, Y., et al. (2016). Antibiotics, birth mode,
and diet shape microbiome maturation during early life. Sci. Transl. Med. 8,
343ra82.
Britten, P. (2013). SuperTracker Incorporates Food Composition Data into
Innovative Online Consumer Tool. Procedia Food Sci. 2, 172–179.
Bureau of Population, Refugees and Migration (2004). Long Wait is Over:
Hmong from Wat Tham Krabok Begin Arriving in U.S. U.S. Refugee Admis-
sions Program News 2.
Caporaso, J.G., Kuczynski, J., Stombaugh, J., Bittinger, K., Bushman, F.D.,
Costello, E.K., Fierer, N., Pena, A.G., Goodrich, J.K., Gordon, J.I., et al.
(2010). QIIME allows analysis of high-throughput community sequencing
data. Nat. Methods 7, 335–336.
Careyva, B., LaNoue, M., Bangura, M., de la Paz, A., Gee, A., Patel, N., and
Mills, G. (2015). The effect of living in the United States on body mass index
in refugee patients. J. Health Care Poor Underserved 26, 421–430.
Caspi, R., Foerster, H., Fulcher, C.A., Kaipa, P., Krummenacker, M., Laten-
dresse, M., Paley, S., Rhee, S.Y., Shearer, A.G., Tissier, C., et al. (2008). The
MetaCyc Database of metabolic pathways and enzymes and the BioCyc
collection of Pathway/GenomeDatabases. Nucleic AcidsRes. 36, D623–D631.
Center for Disease Control (2007). National Health and Nutrition Examination
Survey (NHANES): Anthropometry Procedures Manual.
Clemente, J.C., Pehrsson, E.C., Blaser, M.J., Sandhu, K., Gao, Z., Wang, B.,
Magris, M., Hidalgo, G., Contreras, M., Noya-Alarcon, O., et al. (2015). The
microbiome of uncontacted Amerindians. Sci. Adv. 1.
Dahlqvist, A., and Thomson, D.L. (1963). The digestion and absorption of
sucrose by the intact rat. J. Physiol. 167, 193–209.
David, L.A., Maurice, C.F., Carmody, R.N., Gootenberg, D.B., Button, J.E.,
Wolfe, B.E., Ling, A.V., Devlin, A.S., Varma, Y., Fischbach, M.A., et al.
(2014). Diet rapidly and reproducibly alters the human gut microbiome. Nature
505, 559–563.
Dawson-Hahn, E., Pak-Gorstein, S., Matheson, J., Zhou, C., Yun, K., Scott, K.,
Payton, C., Stein, E., Holland, A., Grow, H.M., and Mendoza, J.A. (2016).
Growth Trajectories of Refugee and Nonrefugee Children in the United States.
Pediatrics 138, 138.
De Filippo, C., Cavalieri, D., Di Paola, M., Ramazzotti, M., Poullet, J.B.,
Massart, S., Collini, S., Pieraccini, G., and Lionetti, P. (2010). Impact of diet
in shaping gut microbiota revealed by a comparative study in children from
Europe and rural Africa. Proc. Natl. Acad. Sci. USA 107, 14691–14696.
El Kaoutari, A., Armougom, F., Gordon, J.I., Raoult, D., and Henrissat, B.
(2013). The abundance and variety of carbohydrate-active enzymes in the
human gut microbiota. Nat. Rev. Microbiol. 11, 497–504.
Faith, D.P. (1992). Conservation evaluation and phylogenetic diversity. Biol.
Conserv. 61, 1–10.
Febinia, C.A. (2017). The Gut Microbiota of Bali among the World Populations:
Connecting Diet, Urbanisation, and Obesity (University of Sydney).
Flint, H.J., Scott, K.P., Duncan, S.H., Louis, P., and Forano, E. (2012). Microbial
degradation of complex carbohydrates in the gut. Gut Microbes 3, 289–306.
Franzen, L., and Smith, C. (2009). Acculturation and environmental change
impacts dietary habits among adult Hmong. Appetite 52, 173–183.
Cell 175, 962–972, November 1, 2018 971
Goel,M.S.,McCarthy, E.P., Phillips, R.S., andWee, C.C. (2004). Obesity among
US immigrant subgroups by duration of residence. JAMA 292, 2860–2867.
Gohl, D.M., Vangay, P., Garbe, J., MacLean, A., Hauge, A., Becker, A., Gould,
T.J., Clayton, J.B., Johnson, T.J., Hunter, R., et al. (2016). Systematic improve-
ment of ampliconmarker genemethods for increased accuracy in microbiome
studies. Nat. Biotechnol. 34, 942–949.
Gomez, A., Petrzelkova, K.J., Burns, M.B., Yeoman, C.J., Amato, K.R.,
Vlckova, K., Modry, D., Todd, A., Jost Robinson, C.A., Remis, M.J., et al.
(2016). Gut Microbiome of Coexisting BaAka Pygmies and Bantu Reflects
Gradients of Traditional Subsistence Patterns. Cell Rep. 14, 2142–2153.
Heney, J.H., Dimock, C.C., Friedman, J.F., and Lewis, C. (2014). Pediatric ref-
ugees in Rhode Island: increases in BMI percentile, overweight, and obesity
following resettlement. R.I. Med. J. (2013) 98, 43–47.
Hervey, K., Vargas, D., Klesges, L., Fischer, P.R., Trippel, S., and Juhn, Y.J.
(2009). Overweight among refugee children after arrival in the United States.
J. Health Care Poor Underserved 20, 246–256.
Hildebrandt, M.A., Hoffmann, C., Sherrill-Mix, S.A., Keilbaugh, S.A., Hamady,
M., Chen, Y.Y., Knight, R., Ahima, R.S., Bushman, F., and Wu, G.D. (2009).
High-fat diet determines the composition of the murine gut microbiome inde-
pendently of obesity. Gastroenterology 137, 1716–1724.
Kooiman, P. (1971). Structures of the galactomannans from seeds of Annona
muricata, Arenga saccharifera, Cocos nucifera, Convolvulus tricolor, and
Sophora japonica. Carbohydr. Res. 20, 329–337.
Kwok, L.-Y., Zhang, J., Guo, Z., Gesudu, Q., Zheng, Y., Qiao, J., Huo, D., and
Zhang, H. (2014). Characterization of fecal microbiota across seven Chinese
ethnic groups by quantitative polymerase chain reaction. PLoS ONE 9,
e93631.
Lauderdale, D.S., and Rathouz, P.J. (2000). Body mass index in a US national
sample of Asian Americans: effects of nativity, years since immigration and
socioeconomic status. Int. J. Obes. Relat. Metab. Disord. 24, 1188–1194.
Lombard, V., Golaconda Ramulu, H., Drula, E., Coutinho, P.M., and Henrissat,
B. (2014). The carbohydrate-active enzymes database (CAZy) in 2013. Nucleic
Acids Res. 42, D490–D495.
Lozupone, C., Lladser, M.E., Knights, D., Stombaugh, J., and Knight, R. (2011).
UniFrac: an effective distance metric for microbial community comparison.
ISME J. 5, 169–172.
Minnesota Department of Health (2017). Refugee Health Statistics. http://
www.health.state.mn.us/refugee/stats/.
Mishra, A., and Malhotra, A.V. (2009). Tamarind xyloglucan: a polysaccharide
with versatile application potential. J. Mater. Chem. 19, 8528–8536.
Muegge, B.D., Kuczynski, J., Knights, D., Clemente, J.C., Gonzalez, A.,
Fontana, L., Henrissat, B., Knight, R., and Gordon, J.I. (2011). Diet drives
convergence in gut microbiome functions across mammalian phylogeny and
within humans. Science 332, 970–974.
Mulasi-Pokhriyal, U., Smith, C., and Franzen-Castle, L. (2012). Investigating di-
etary acculturation and intake among US-born and Thailand/Laos-born
Hmong-American children aged 9-18 years. Public Health Nutr. 15, 176–185.
Nurk, S., Meleshko, D., Korobeynikov, A., and Pevzner, P.A. (2017). meta-
SPAdes: a new versatile metagenomic assembler. Genome Res. 27, 824–834.
O’Leary, N.A., Wright, M.W., Brister, J.R., Ciufo, S., Haddad, D., McVeigh, R.,
Rajput, B., Robbertse, B., Smith-White, B., Ako-Adjei, D., et al. (2016). Refer-
ence sequence (RefSeq) database at NCBI: current status, taxonomic expan-
sion, and functional annotation. Nucleic Acids Res. 44 (D1), D733–D745.
Obregon-Tito, A.J., Tito, R.Y., Metcalf, J., Sankaranarayanan, K., Clemente,
J.C., Ursell, L.K., Zech Xu, Z., Van Treuren, W., Knight, R., Gaffney, P.M.,
et al. (2015). Subsistence strategies in traditional societies distinguish gut mi-
crobiomes. Nat. Commun. 6, 6505.
Pangsri, P., Piwpankaew, Y., Ingkakul, A., Nitisinprasert, S., and Keawsom-
pong, S. (2015). Characterization of mannanase from Bacillus circulans NT
6.7 and its application in mannooligosaccharides preparation as prebiotic.
Springerplus 4, 771.
Pawlowsky-Glahn, V., and Buccianti, A. (2011). Compositional Data Analysis:
Theory and Applications (John Wiley & Sons).
972 Cell 175, 962–972, November 1, 2018
Pfeifer, M.E., and Thao, B.K. (2013). State of the Hmong American Community
(Hmong National Development).
Rothschild, D., Weissbrod, O., Barkan, E., Kurilshikov, A., Korem, T., Zeevi, D.,
Costea, P.I., Godneva, A., Kalka, I.N., Bar, N., et al. (2018). Environment domi-
natesoverhostgenetics inshapinghumangutmicrobiota.Nature555, 210–215.
Schnorr, S.L., Candela, M., Rampelli, S., Centanni, M., Consolandi, C., Basa-
glia, G., Turroni, S., Biagi, E., Peano, C., Severgnini, M., et al. (2014). Gut mi-
crobiome of the Hadza hunter-gatherers. Nat. Commun. 5, 3654.
Schulfer, A.F., Battaglia, T., Alvarez, Y., Bijnens, L., Ruiz, V.E., Ho, M., Robin-
son, S., Ward, T., Cox, L.M., Rogers, A.B., et al. (2018). Intergenerational trans-
fer of antibiotic-perturbed microbiota enhances colitis in susceptible mice.
Nat. Microbiol. 3, 234–242.
Seemann, T. (2014). Prokka: rapid prokaryotic genome annotation. Bioinfor-
matics 30, 2068–2069.
Shannon, P., Markiel, A., Ozier, O., Baliga, N.S.,Wang, J.T., Ramage, D., Amin,
N., Schwikowski, B., and Ideker, T. (2003). Cytoscape: a software environment
for integrated models of biomolecular interaction networks. Genome Res. 13,
2498–2504.
Smits, S.A., Leach, J., Sonnenburg, E.D., Gonzalez, C.G., Lichtman, J.S.,
Reid, G., Knight, R., Manjurano, A., Changalucha, J., Elias, J.E., et al. (2017).
Seasonal cycling in the gut microbiome of the Hadza hunter-gatherers of
Tanzania. Science 357, 802–806.
Sonnenburg, E.D., Smits, S.A., Tikhonov, M., Higginbottom, S.K., Wingreen,
N.S., and Sonnenburg, J.L. (2016). Diet-induced extinctions in the gut micro-
biota compound over generations. Nature 529, 212–215.
Speek, A.J., Speek-Saichua, S., and Schreurs, W.H.P. (1991). Determination
of macronutrient and micronutrient levels in thai foods: An evaluation of the
Thai Food Composition Table. Food Chem. 40, 251–262.
Subrahmanyan, V., Bains, G.S., Natarajan, C.P., and Bhatia, D.S. (1956). The
carbohydrates of tender kernel of palmyra palm (Borassus flabellifer, L.). Arch.
Biochem. Biophys. 60, 27–34.
Suzek, B.E., Wang, Y., Huang, H., McGarvey, P.B., and Wu, C.H.; UniProt
Consortium (2015). UniRef clusters: a comprehensive and scalable alternative
for improving sequence similarity searches. Bioinformatics 31, 926–932.
Sze, M.A., and Schloss, P.D. (2016). Looking for a Signal in the Noise: Revisit-
ing Obesity and the Microbiome. MBio 7.
Tatusova, T., DiCuccio, M., Badretdin, A., Chetvernin, V., Ciufo, S., and Li, W.
(2013). The NCBI handbook (National Center for Biotechnology Information).
Tippett, K.S., Enns, C.W., and Moshfegh, A.J. (1999). Food consumption sur-
veys in the US Department of Agriculture. Nutr. Today 34, 33–46.
Turnbaugh, P.J., and Gordon, J.I. (2009). The core gut microbiome, energy
balance and obesity. J. Physiol. 587, 4153–4158.
Turnbaugh, P.J., Ridaura, V.K., Faith, J.J., Rey, F.E., Knight, R., and Gordon,
J.I. (2009a). The effect of diet on the human gut microbiome: a metagenomic
analysis in humanized gnotobiotic mice. Sci. Transl. Med. 1, 6ra14.
United Nations (2017). International Migration Report 2017. http://www.un.org/
en/development/desa/population/migration/publications/migrationreport/docs/
MigrationReport2017_Highlights.pdf.
United States Department of Agriculture. USDA Food Composition Data-
bases. https://ndb.nal.usda.gov/ndb/.
van Rossum, G., and Drake, F.L. (2011). The Python Language Reference
Manual (Network Theory Ltd.).
Wu, G.D., Chen, J., Hoffmann, C., Bittinger, K., Chen, Y.-Y., Keilbaugh, S.A.,
Bewtra, M., Knights, D., Walters, W.A., Knight, R., et al. (2011). Linking long-
term dietary patterns with gut microbial enterotypes. Science 334, 105–108.
Yatsunenko, T., Rey, F.E., Manary, M.J., Trehan, I., Dominguez-Bello, M.G.,
Contreras, M., Magris, M., Hidalgo, G., Baldassano, R.N., Anokhin, A.P.,
et al. (2012). Human gut microbiome viewed across age and geography.
Nature 486, 222–227.
Yin, Y., Mao, X., Yang, J., Chen, X., Mao, F., and Xu, Y. (2012). dbCAN: a web
resource for automated carbohydrate-active enzyme annotation. Nucleic
Acids Res. 40, W445-51.
STAR+METHODS
KEY RESOURCES TABLE
REAGENT or RESOURCE SOURCE IDENTIFIER
Deposited Data
16S rRNA gene and shotgun metagenomics
DNA sequencing data
European Nucleotide Archive Primary accession # PRJEB28687; RRID: SCR_006515
RefSeq version 87 O’Leary et al., 2016 ftp://ftp.ncbi.nlm.nih.gov/genomes/refseq/bacteria
Software and Algorithms
Custom analysis scripts This paper https://github.com/knights-lab/IMP_analyses
BURST DNA aligner Al-Ghalith and Knights, 2017 https://github.com/knights-lab/BURST
HUMAnN2 metabolic pathway annotation Abubucker et al., 2012 http://huttenhower.sph.harvard.edu/humann
CONTACT FOR REAGENT AND RESOURCE SHARING
Further information and requests for resources and reagents should be directed to and will be fulfilled by the Lead Contact, Dan
Knights ([email protected]).
EXPERIMENTAL MODEL AND SUBJECT DETAILS
Study setting, population, and recruitmentOur inclusion criteria included individuals who were Hmong or Karen, female, at least 18 years old, and either were born and are
currently living in Thailand, were born in Southeast Asia and moved to the U.S., or were born in the U.S. but whose parents were
born in Southeast Asia. Our inclusion criteria for controls included European American females at least 18 years of age who were
born in the U.S. and whose parents and grandparents were also born in the U.S. Our exclusion criteria consisted of use of any
antibiotics in the previous 6 months, current use of probiotic supplements, known presence of gastrointestinal, cancer, immunode-
ficiency or autoimmune disorders, adults lacking capacity to consent, or pregnancy. Additionally, control subjects could not have
traveled outside of the U.S. within the last 12 months. We recruited using multiple methods which included flyers, emails, social me-
dia, oral presentations, tabling, letters followed by phone calls toWest Side Community Health Services (West Side) patients whomet
criteria, and by word of mouth. We recruited throughout the Minneapolis-St. Paul metro area at local community centers, faith-based
organizations, adult education centers, health care centers, and health fairs. We recruited in Thailand at Khun Chang Khian (KCK), a
rural Hmong village located one hour fromChiang Mai city, as well as fromMae La (ML) Camp, a Burmese refugee camp in Tak prov-
ince located on the Myanmar-Thailand border (Figure S1). Interested subjects were then screened and interviewed privately or as a
group, as preferred by the participants. Interviews and body measurements were conducted by trained Hmong and Karen commu-
nity researchers and a graduate student researcher. This study was approved for human subject research by the University of
Minnesota Institutional Review Board (1510S79446), and the Thailand-based portion of the study was additionally approved for
human subject research by the Chiang Mai University Institutional Review Board (475/2015) and the Chiang Mai Public Health Office
(0032.002/9930). Informed consent was obtained from all subjects.
Community-based Research methodsThis project used a community-based participatory action research (CBPAR) approach, with a multidisciplinary team composed of
academic researchers, Hmong and Karen community researchers, and staff from the Somali, Latino and Hmong Partnership for
Health and Wellness (SoLaHmo). SoLaHmo is a multi-ethnic, community-driven CBPAR program of West Side Community Health
Services, whosemission is to build upon the unique cultural strengths of ethnic communities to promote health and wellness through
research, education and policy. All SoLaHmo members are trained in qualitative research processes using a previously developed
training curriculum (Allen et al., 2011). In addition, all phases of our project were further guided by community advisory boards (CABs)
composed of Hmong and Karen health professionals and community experts. The study design, recruitmentmethods and strategies,
and dissemination of results were developed in partnership with both academic and community researchers, and through multiple
discussions with the CABs. As noted in Results, we learned from the Hmong CAB and research team members that substantially
more Hmong women than men were relocating to U.S. in recent years. Thus, to ensure feasibility of recruitment for this study we
limited our population to women. In Thailand, we used a modified CPBAR approach in that Thai community researchers were mem-
bers of the communities that we worked with, and were trained with qualitative research methods, recruitment, and sample and data
collection, but were not directly involved with study design. We note that Hmong refugee camps have long been closed (Bureau of
Cell 175, 962–972.e1–e3, November 1, 2018 e1
Population, Refugees and Migration, 2004), hence Hmong in Khun Chang Khian are not refugees but serve as acceptable pre-
immigration representatives available for US-based Hmong.
Cross-sectional specimen and data collectionFor U.S. sample collection, research team members obtained informed consent and conducted interviews in the participants’
preferred languages (English, Hmong, or Karen), and recorded participants’ responses onto an English paper survey. Weights
were measured using standard electronic scales, heights were measured against a wall using a pre-positioned measuring tape,
and waist circumferences were measured with a tape measure at the uppermost lateral border of the iliac crest (Center for Disease
Control, 2007). 24-hour dietary recalls were conducted using a multiple pass system (Tippett et al., 1999) with food models and
measuring cups and spoons for portion size estimations. Participants were provided with a stool collection kit and instructions
describing how to collect a stool sample. Stool samples were collected into preservative (see below) and were either returned to
the research staff by mail or were stored at room temperature for up to 5 days before they were collected by the research team.
Procedures for consent, interviews, anthropometrics, and stool sampling in Thailand were as described above for the cross-
sectional specimen and data collection. 24-hour dietary recalls and sample collections were conducted as described previously.
Stool samples from KCK were transported on dry ice then placed in a �20C freezer for 2 days then transferred to a �80C freezer.
Stool samples from ML were placed in a �20C freezer for up to 8 hours then transferred to a �80C freezer. All samples collected in
Thailand were shipped overnight on dry ice from Thailand to the U.S., and stored in a �80C freezer in the U.S.
Research teammembers instructedparticipants in stool collection, using an instructional video,written visual instructions, and verbal
reinforcement. Participants placed their stool sample onto a FecesCatcher (Tag Hemi VOF) and 1 g was collected using a sterile swab
into a 1.5 mL cryogenic tube pre-filled with 900 ul of RNALater and mixed thoroughly. Larger samples (longitudinal first and last month
samples) were collected using a Sarstedt 80.9924.014/CS500 tube and scoop without mixing or RNALater. Large samples collected in
the U.S. were aliquoted into 1.5 mL tubes with and without 50% glycerol upon arrival and stored at�80C. Large samples collected in
Thailandwerestoredat�80Cuntil arrival to theU.S., atwhichpoint theywere thawedover ice,aliquoted,andstored in thesamemanner.
Longitudinal specimen and data collectionProcedures for consent, interviews, anthropometrics, and stool sampling were as described above for the cross-sectional specimen
and data collection. Once permonth over sixmonths, 24-hour dietary recalls were conducted as described previously. Month 1 and 6
samples were stored in a home freezer and picked up within 24 hours of stool collection. These samples were transported with an ice
pack and immediately placed in a �80C freezer. Month 2-5 samples were stored in preservative (see below), mailed to the research
team in prepaid mailers at room temperature, and placed in a �80C freezer upon receipt.
METHOD DETAILS
Dietary data processingDe-identified survey data was entered into an electronic spreadsheet. Foods and portions from 24-hour dietary recalls were entered
into theUSDASuperTracker system (Britten, 2013). Foods that were not found in theUSDAdatabasewere studied individually (Speek
et al., 1991) formacronutrient content and entered in as custom foods. SuperTrackermacronutrient and food grouping summaries, as
well as foods and their respective portions were downloaded directly from the SuperTracker website or using custom Python (van
Rossum and Drake, 2011) scripts. Foods and portions were mapped to the SuperTracker and USDA databases to obtain respective
foodandportion identification numbers; foodandportion identification numberswereused in tree-based foodanalysis. Custom foods
not in the USDA database were manually assigned appropriate existing or new food identification numbers by group consensus. Mi-
cronutrients were excluded from dietary analyses due to the high number of custom foods with limited information onmicronutrients.
16S ribosomal RNA gene DNA sequencingAll fecal samples were submitted to the University of Minnesota Genomics Center (UMGC) for DNA extraction, amplification, and
sequencing. 16S ribosomal rRNA gene sequences were extracted and amplified following the UMGC-developed protocol (Gohl
et al., 2016).
Shotgun metagenomics DNA sequencingShotgun DNA sequencing was performed on the Illumina HiSeq platform. All fecal samples were submitted to the UMN Genomics
Center for DNA extraction, amplification, and sequencing. Amplification, quantification, and normalization of extracted DNAwas per-
formed using the Illumina NeoPrep Library System. A HiSeq 2x125 cycle v4 kit was used to sequence samples.
QUANTIFICATION AND STATISTICAL ANALYSIS
16S sequencing analysisWe trimmed and processed all 16S marker-gene sequencing data for quality using SHI7 (Al-Ghalith et al., 2018) and picked de novo
operational-taxonomic units (OTUs) as follows. We first filtered for reads with at least 100 exact duplicates as representative
e2 Cell 175, 962–972.e1–e3, November 1, 2018
sequences, and assigned taxonomy by alignment at 0% to the NCBI RefSeq 16 s reference database (O’Leary et al., 2016) using the
BURST (Al-Ghalith and Knights, 2017) OTU-picking algorithm in CAPITALIST mode, which ensures optimal alignment of sequences
andminimizes the set of aligned reference genomes. All original sequenceswere then re-alignedwith BURST (Al-Ghalith andKnights,
2017) in CAPITALIST mode at 98% identity against this representative set, resulting in 93.54% of all available sequences aligned.
Singleton OTUs and samples with depth less than 2,143 were removed using the Quantitative Insights IntoMicrobial Ecology (QIIME)
software package (Caporaso et al., 2010). Using QIIME, we measured within-sample biodiversity (alpha diversity) with rarefied OTU
tables (at 2,143 sequences/sample) using whole-tree phylogenetic diversity (Faith, 1992) and a custom generated phylogeny con-
structed with the representative sequences using aKronyMer (Al-Ghalith and Knights, 2018). To quantify differences in composition
between subjects, we calculated the phylogeny-based UniFrac distance (Lozupone et al., 2011) between all pairs of samples. To
visualize between-subject differences (beta diversity) and to obtain principal components for subsequent statistical testing, we per-
formed dimensionality reduction using principal coordinates analysis (Caporaso et al., 2010). Aitchison’s distances were calculated
by first imputing zeros from an abundance OTU table, then applying a centered log ratio transform using the robCompositions R
package (Pawlowsky-Glahn and Buccianti, 2011). To enable tests for shifts in the relative abundances of Bacteroides and Prevotella,
we collapsed the reference-based OTUs according to taxonomy at the genus level. P values, sample numbers, and names of sta-
tistical tests are provided in the main text and figure legends for Figures 2A, 2B, 3A, 3C, 4A, 4B, 5A–5C, 6A–6C, and 7A–7D.
Shotgun metagenomics analysisShotgun metagenomics sequences were identified at the species level via genomic alignment against a custom database created
from aligning human samples from various public datasets against the comprehensive NCBI RefSeq database (Tatusova et al.,
2013) release 87, and all matched bacterial species, as well as all species in matched representative genera, were included. Genome
coverage estimates were calculated using the bcov utility from BURST (Al-Ghalith and Knights, 2017). Functional annotations were
obtained using the HUMAnN2 (Abubucker et al., 2012) pipeline with UniRef50 (Suzek et al., 2015). Resulting functional pathways
were mapped to and colored by the top-level categories of the MetaCyc (Caspi et al., 2008) ontology. CAZyme annotations were
obtained usingmetaSPAdes (Nurk et al., 2017), filtered for scaffolds withminimum1000 bp, then further processedwith Prokka (See-
mann, 2014), dbCAN (Yin et al., 2012) with E-value < 1e�5, and the CAZy database (Lombard et al., 2014). Taxonomic contributions
of differentiated glycoside hydrolases were identified as follows: (1) scaffolds that contributed to GH17, GH64, GH87 were identified
and respective DNA sequences were obtained and used as a reference database, (2) shotgun metagenomic reads were quality
filtered as described previously, (3) quality reads were aligned against the scaffold reference database using BURST (Al-Ghalith
and Knights, 2017) at 95% identity, (4) quality filtered reads from step 2 were aligned with BURST at 98% identity against the pre-
viously described custom database with taxonomy assigned from the NCBI database, (5) sequences that hit both the scaffolds refer-
ence and the custom NCBI-based reference were used to construct an OTU table.
Dietary data analysisFood tree visualizations were generated with GraPhlAn (Asnicar et al., 2015). Dietary record and food item associations were gener-
ated using custom scripts, then visualized in Cytoscape (Shannon et al., 2003). Food-Microbiome Procrustes distance association
P values are from the ‘‘vegan’’ implementation in function ‘‘protest’’ with 999 permutations (performed for each of the permuted data
structures).
DATA AND SOFTWARE AVAILABILITY
SoftwareSoftware used to perform statistical testing and generate figures for this manuscript are available here: https://github.com/
knights-lab/IMP_analyses.
Data ResourcesThe 16S rRNA gene and shotgun metagenomic sequencing data have been deposited in the European Nucleotide Archive under
accession number PRJEB28687.
Cell 175, 962–972.e1–e3, November 1, 2018 e3
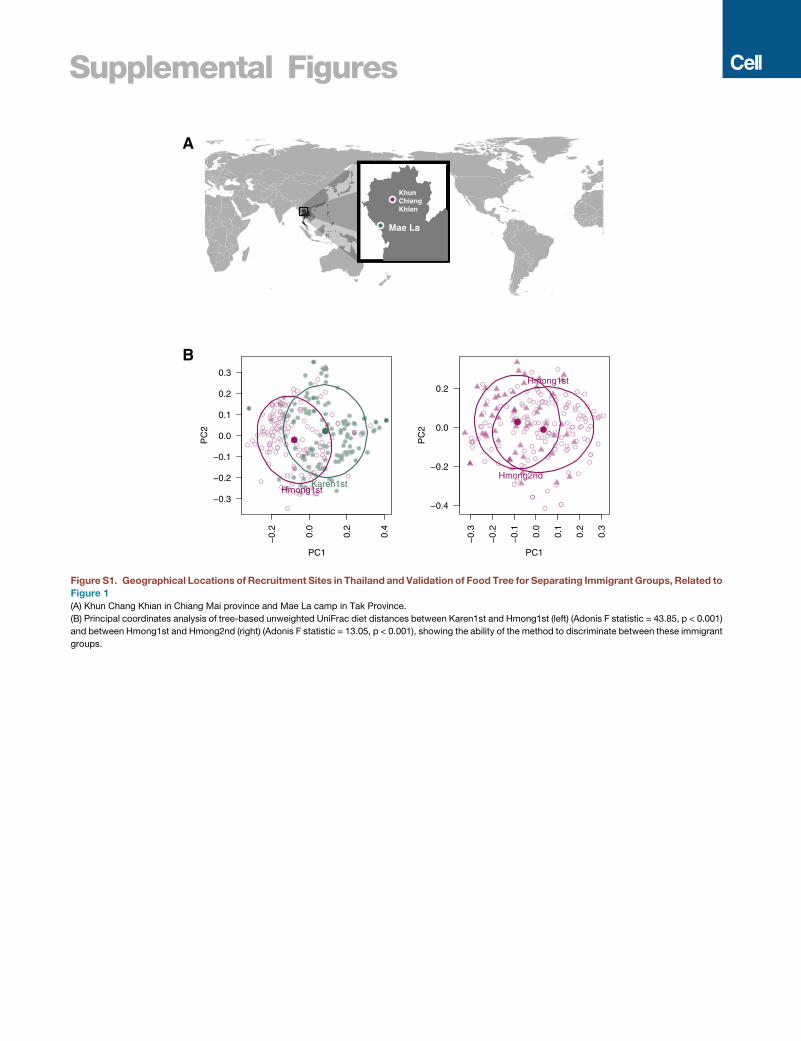
Supplemental Figures
KhunChiang Khian
Mae La
−0.
2
0.0
0.2
0.4
−0.3
−0.2
−0.1
0.0
0.1
0.2
0.3
PC1
PC
2
Hmong1stKaren1st
−0.
3
−0.
2
−0.
1
0.0
0.1
0.2
0.3
−0.4
−0.2
0.0
0.2
PC1
PC
2
Hmong1st
Hmong2nd
A
B
Figure S1. Geographical Locations of Recruitment Sites in Thailand and Validation of Food Tree for Separating Immigrant Groups, Related to
Figure 1
(A) Khun Chang Khian in Chiang Mai province and Mae La camp in Tak Province.
(B) Principal coordinates analysis of tree-based unweighted UniFrac diet distances between Karen1st and Hmong1st (left) (Adonis F statistic = 43.85, p < 0.001)
and between Hmong1st and Hmong2nd (right) (Adonis F statistic = 13.05, p < 0.001), showing the ability of the method to discriminate between these immigrant
groups.
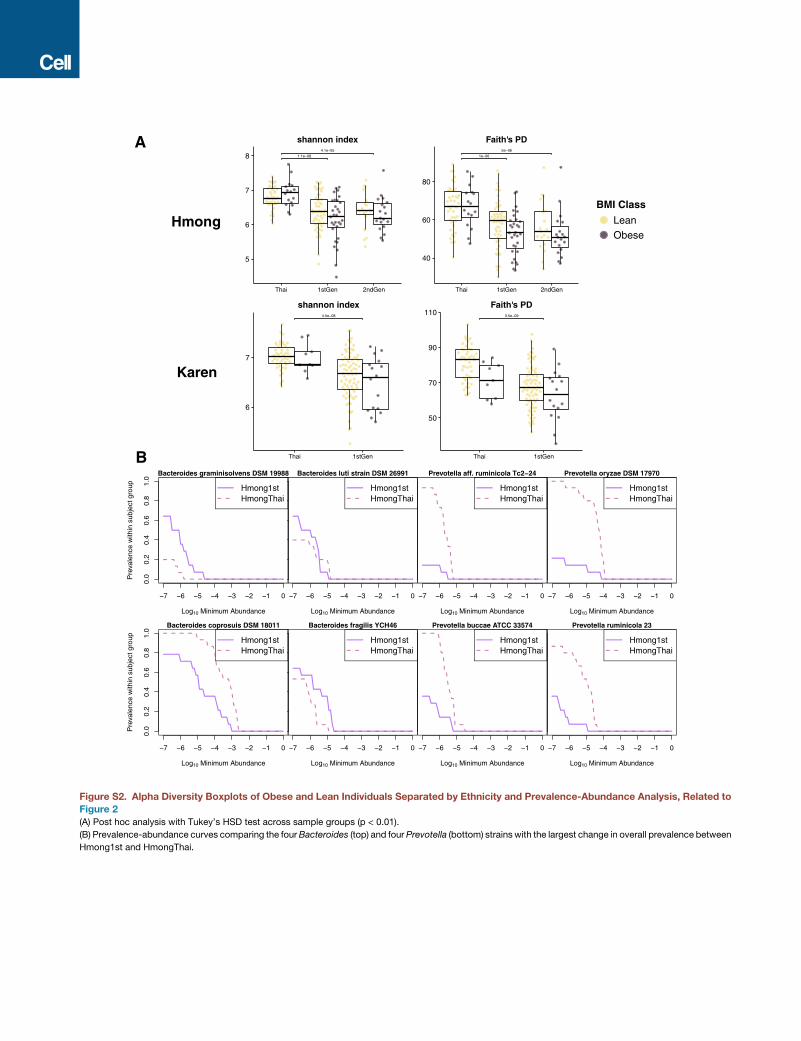
1.1e−08
4.1e−05
5
6
7
8
Thai 1stGen 2ndGen
shannon index
1e−06
5e−06
40
60
80
Thai 1stGen 2ndGen
Faith's PD
4.5e−08
6
7
Thai 1stGen
shannon index3.5e−09
50
70
90
110
Thai 1stGen
Faith's PD
BMI Class
LeanObese
Karen
Hmong
−7 −6 −5 −4 −3 −2 −1 0
0.0
0.2
0.4
0.6
0.8
1.0
Bacteroides graminisolvens DSM 19988
Log10 Minimum Abundance
Pre
vale
nce
with
in s
ubje
ct g
roup Hmong1st
HmongThai
−7 −6 −5 −4 −3 −2 −1 0
0.0
0.2
0.4
0.6
0.8
1.0
Bacteroides coprosuis DSM 18011
Log10 Minimum Abundance
Pre
vale
nce
with
in s
ubje
ct g
roup Hmong1st
HmongThai
−7 −6 −5 −4 −3 −2 −1 0
Bacteroides luti strain DSM 26991
Log10 Minimum Abundance
Hmong1stHmongThai
−7 −6 −5 −4 −3 −2 −1 0
Bacteroides fragilis YCH46
Log10 Minimum Abundance
Hmong1stHmongThai
−7 −6 −5 −4 −3 −2 −1 0
Prevotella aff. ruminicola Tc2−24
Log10 Minimum Abundance
Hmong1stHmongThai
−7 −6 −5 −4 −3 −2 −1 0
Prevotella buccae ATCC 33574
Log10 Minimum Abundance
Hmong1stHmongThai
−7 −6 −5 −4 −3 −2 −1 0
Prevotella oryzae DSM 17970
Log10 Minimum Abundance
Hmong1stHmongThai
−7 −6 −5 −4 −3 −2 −1 0
Prevotella ruminicola 23
Log10 Minimum Abundance
Hmong1stHmongThai
A
B
Figure S2. Alpha Diversity Boxplots of Obese and Lean Individuals Separated by Ethnicity and Prevalence-Abundance Analysis, Related to
Figure 2
(A) Post hoc analysis with Tukey’s HSD test across sample groups (p < 0.01).
(B) Prevalence-abundance curves comparing the fourBacteroides (top) and four Prevotella (bottom) strains with the largest change in overall prevalence between
Hmong1st and HmongThai.
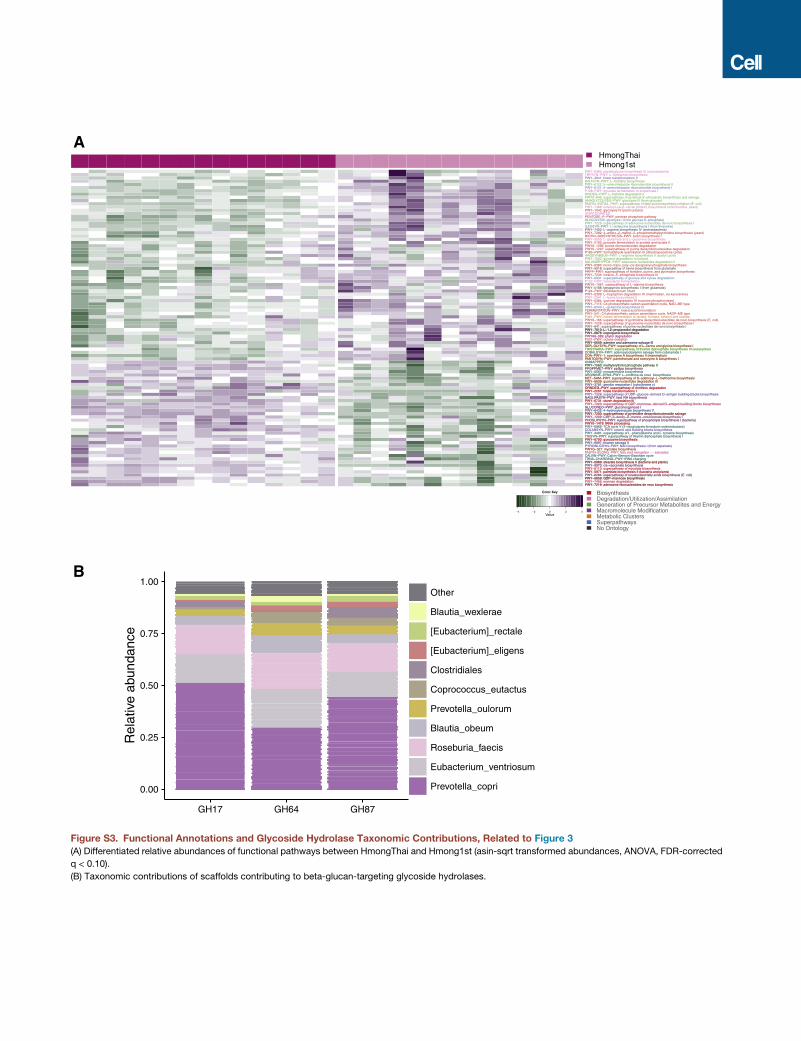
PWY−7219: adenosine ribonucleotides de novo biosynthesisPWY−7456: mannan degradationPWY−5659: GDP−mannose biosynthesisPWY−6284: superpathway of unsaturated fatty acids biosynthesis (E. coli)PWY−5971: palmitate biosynthesis II (bacteria and plants)PWY−6113: superpathway of mycolate biosynthesisPWY−5973: cis−vaccenate biosynthesisPWY−5989: stearate biosynthesis II (bacteria and plants)TRNA−CHARGING−PWY: tRNA chargingCALVIN−PWY: Calvin−Benson−Bassham cycleFASYN−ELONG−PWY: fatty acid elongation −− saturatedPWYG−321: mycolate biosynthesisPYRIDNUCSYN−PWY: NAD biosynthesis I (from aspartate)PWY−6897: thiamin salvage IIPWY−6700: queuosine biosynthesisTHISYN−PWY: superpathway of thiamin diphosphate biosynthesis IPWY−3481: superpathway of L−phenylalanine and L−tyrosine biosynthesisCOLANSYN−PWY: colanic acid building blocks biosynthesisPWY−6969: TCA cycle V (2−oxoglutarate:ferredoxin oxidoreductase)PWY0−1479: tRNA processingPHOSLIPSYN−PWY: superpathway of phospholipid biosynthesis I (bacteria)PWY−1269: CMP−3−deoxy−D−manno−octulosonate biosynthesis IPWY−7200: superpathway of pyrimidine deoxyribonucleoside salvagePWY−6435: 4−hydroxybenzoate biosynthesis VGLUCONEO−PWY: gluconeogenesis IPWY−7323: superpathway of GDP−mannose−derived O−antigen building blocks biosynthesisPWY−6731: starch degradation IIINAGLIPASYN−PWY: lipid IVA biosynthesisPWY−7328: superpathway of UDP−glucose−derived O−antigen building blocks biosynthesisPWY−2201: folate transformations IORNDEG−PWY: superpathway of ornithine degradationPWY−3781: aerobic respiration I (cytochrome c)PWY−6608: guanosine nucleotides degradation IIIMET−SAM−PWY: superpathway of S−adenosyl−L−methionine biosynthesisARGININE−SYN4−PWY: L−ornithine de novo biosynthesisPWY−6562: norspermidine biosynthesisPPGPPMET−PWY: ppGpp biosynthesisPWY−7560: methylerythritol phosphate pathway IIUNMAPPEDPANTOSYN−PWY: pantothenate and coenzyme A biosynthesis ICOA−PWY−1: coenzyme A biosynthesis II (mammalian)COBALSYN−PWY: adenosylcobalamin salvage from cobinamide ITHISYNARA−PWY: superpathway of thiamin diphosphate biosynthesis III (eukaryotes)SER−GLYSYN−PWY: superpathway of L−serine and glycine biosynthesis IPWY−6609: adenine and adenosine salvage IIIP221−PWY: octane oxidationPWY66−389: phytol degradationPWY−6876: isopropanol biosynthesisPWY−7013: L−1,2−propanediol degradationPWY−841: superpathway of purine nucleotides de novo biosynthesis IPWY−7228: superpathway of guanosine nucleotides de novo biosynthesis IPWY0−166: superpathway of pyrimidine deoxyribonucleotides de novo biosynthesis (E. coli)P461−PWY: hexitol fermentation to lactate, formate, ethanol and acetatePWY−241: C4 photosynthetic carbon assimilation cycle, NADP−ME typeFERMENTATION−PWY: mixed acid fermentationPWY−6549: L−glutamine biosynthesis IIIPWY−7115: C4 photosynthetic carbon assimilation cycle, NAD−ME typePWY−5384: sucrose degradation IV (sucrose phosphorylase)PWY−2941: L−lysine biosynthesis IIPWY−6309: L−tryptophan degradation XI (mammalian, via kynurenine)P124−PWY: Bifidobacterium shuntPWY−5188: tetrapyrrole biosynthesis I (from glutamate)PWY0−1061: superpathway of L−alanine biosynthesisP122−PWY: heterolactic fermentationPWY−6901: superpathway of glucose and xylose degradationPWY−7234: inosine−5'−phosphate biosynthesis IIIPRPP−PWY: superpathway of histidine, purine, and pyrimidine biosynthesisPWY−5918: superpathay of heme biosynthesis from glutamatePWY−6383: mono−trans, poly−cis decaprenyl phosphate biosynthesisSALVADEHYPOX−PWY: adenosine nucleotides degradation IIPWY−7003: glycerol degradation to butanolARGSYNBSUB−PWY: L−arginine biosynthesis II (acetyl cycle)P185−PWY: formaldehyde assimilation III (dihydroxyacetone cycle)PWY0−1297: superpathway of purine deoxyribonucleosides degradationPWY0−1296: purine ribonucleosides degradationPWY−5100: pyruvate fermentation to acetate and lactate IIPWY−5505: L−glutamate and L−glutamine biosynthesisBIOTIN−BIOSYNTHESIS−PWY: biotin biosynthesis IPWY−7282: 4−amino−2−methyl−5−phosphomethylpyrimidine biosynthesis (yeast)PWY−7400: L−arginine biosynthesis IV (archaebacteria)ILEUSYN−PWY: L−isoleucine biosynthesis I (from threonine)PWY−7229: superpathway of adenosine nucleotides de novo biosynthesis IGLYCOLYSIS: glycolysis I (from glucose 6−phosphate)PENTOSE−P−PWY: pentose phosphate pathwayUNINTEGRATEDPWY−1042: glycolysis IV (plant cytosol)PWY−7388: octanoyl−[acyl−carrier protein] biosynthesis (mitochondria, yeast)FASYN−INITIAL−PWY: superpathway of fatty acid biosynthesis initiation (E. coli)ANAGLYCOLYSIS−PWY: glycolysis III (from glucose)PWY0−845: superpathway of pyridoxal 5'−phosphate biosynthesis and salvageHISDEG−PWY: L−histidine degradation IP108−PWY: pyruvate fermentation to propanoate IPWY−6121: 5−aminoimidazole ribonucleotide biosynthesis IPWY−6122: 5−aminoimidazole ribonucleotide biosynthesis IIHISTSYN−PWY: L−histidine biosynthesisPWY−3841: folate transformations IITRPSYN−PWY: L−tryptophan biosynthesisPWY−6385: peptidoglycan biosynthesis III (mycobacteria)
PWY−7219: adenosine ribonucleotides de novo biosynthesisPWY−7456: mannan degradationPWY−5659: GDP−mannose biosynthesisPWY−6284: superpathway of unsaturated fatty acids biosynthesis (E. coli)PWY−5971: palmitate biosynthesis II (bacteria and plants)PWY−6113: superpathway of mycolate biosynthesisPWY−5973: cis−vaccenate biosynthesisPWY−5989: stearate biosynthesis II (bacteria and plants)TRNA−CHARGING−PWY: tRNA chargingCALVIN−PWY: Calvin−Benson−Bassham cycleFASYN−ELONG−PWY: fatty acid elongation −− saturatedPWYG−321: mycolate biosynthesisPYRIDNUCSYN−PWY: NAD biosynthesis I (from aspartate)PWY−6897: thiamin salvage IIPWY−6700: queuosine biosynthesisTHISYN−PWY: superpathway of thiamin diphosphate biosynthesis IPWY−3481: superpathway of L−phenylalanine and L−tyrosine biosynthesisCOLANSYN−PWY: colanic acid building blocks biosynthesisPWY−6969: TCA cycle V (2−oxoglutarate:ferredoxin oxidoreductase)PWY0−1479: tRNA processingPHOSLIPSYN−PWY: superpathway of phospholipid biosynthesis I (bacteria)PWY−1269: CMP−3−deoxy−D−manno−octulosonate biosynthesis IPWY−7200: superpathway of pyrimidine deoxyribonucleoside salvagePWY−6435: 4−hydroxybenzoate biosynthesis VGLUCONEO−PWY: gluconeogenesis IPWY−7323: superpathway of GDP−mannose−derived O−antigen building blocks biosynthesisPWY−6731: starch degradation IIINAGLIPASYN−PWY: lipid IVA biosynthesisPWY−7328: superpathway of UDP−glucose−derived O−antigen building blocks biosynthesisPWY−2201: folate transformations IORNDEG−PWY: superpathway of ornithine degradationPWY−3781: aerobic respiration I (cytochrome c)PWY−6608: guanosine nucleotides degradation IIIMET−SAM−PWY: superpathway of S−adenosyl−L−methionine biosynthesisARGININE−SYN4−PWY: L−ornithine de novo biosynthesisPWY−6562: norspermidine biosynthesisPPGPPMET−PWY: ppGpp biosynthesisPWY−7560: methylerythritol phosphate pathway IIUNMAPPEDPANTOSYN−PWY: pantothenate and coenzyme A biosynthesis ICOA−PWY−1: coenzyme A biosynthesis II (mammalian)COBALSYN−PWY: adenosylcobalamin salvage from cobinamide ITHISYNARA−PWY: superpathway of thiamin diphosphate biosynthesis III (eukaryotes)SER−GLYSYN−PWY: superpathway of L−serine and glycine biosynthesis IPWY−6609: adenine and adenosine salvage IIIP221−PWY: octane oxidationPWY66−389: phytol degradationPWY−6876: isopropanol biosynthesisPWY−7013: L−1,2−propanediol degradation
Biosynthesis Degradation/Utilization/Assimilation Generation of Precursor Metabolites and Energy Macromolecule Modification Metabolic Clusters Superpathways No Ontology
−4 −2 0 2 4Value
Color Key
HmongThaiHmong1st
A
B
0.00
0.25
0.50
0.75
1.00
GH17 GH64 GH87
Rel
ativ
e ab
unda
nce
Other
Blautia_wexlerae
[Eubacterium]_rectale
[Eubacterium]_eligens
Clostridiales
Coprococcus_eutactus
Prevotella_oulorum
Blautia_obeum
Roseburia_faecis
Eubacterium_ventriosum
Prevotella_copri
Figure S3. Functional Annotations and Glycoside Hydrolase Taxonomic Contributions, Related to Figure 3
(A) Differentiated relative abundances of functional pathways between HmongThai and Hmong1st (asin-sqrt transformed abundances, ANOVA, FDR-corrected
q < 0.10).
(B) Taxonomic contributions of scaffolds contributing to beta-glucan-targeting glycoside hydrolases.
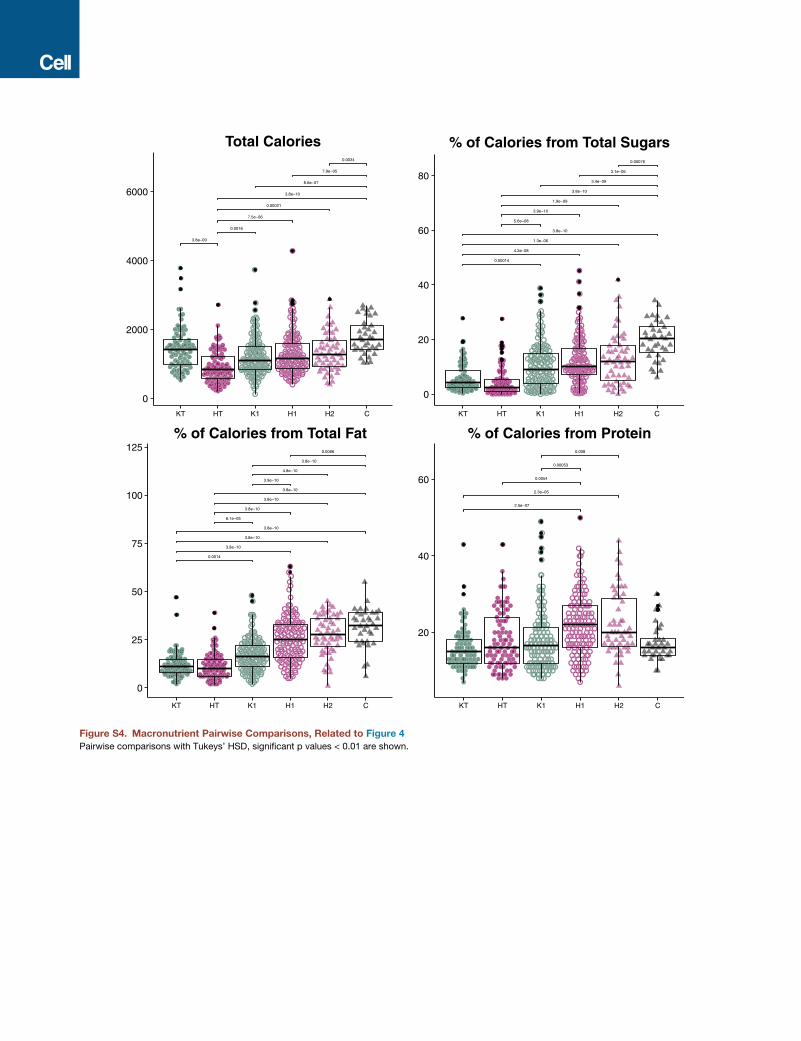
3.8e−09
0.0016
7.5e−06
0.00021
3.8e−10
8.6e−07
7.9e−05
0.0034
0
2000
4000
6000
KT HT K1 H1 H2 C
Total Calories
0.00014
5.6e−08
4.2e−08
3.9e−10
1.3e−06
1.9e−09
3.8e−10
3.8e−10
3.4e−09
3.1e−06
0.00076
0
20
40
60
80
KT HT K1 H1 H2 C
% of Calories from Total Sugars
0.0014
6.1e−05
3.8e−10
3.8e−10
3.9e−10
3.8e−10
3.8e−10
4.8e−10
3.8e−10
3.8e−10
3.8e−10
0.0066
0
25
50
75
100
125
KT HT K1 H1 H2 C
% of Calories from Total Fat
2.5e−07
0.0054
0.00053
2.3e−05
0.008
20
40
60
KT HT K1 H1 H2 C
% of Calories from Protein
Figure S4. Macronutrient Pairwise Comparisons, Related to Figure 4
Pairwise comparisons with Tukeys’ HSD, significant p values < 0.01 are shown.
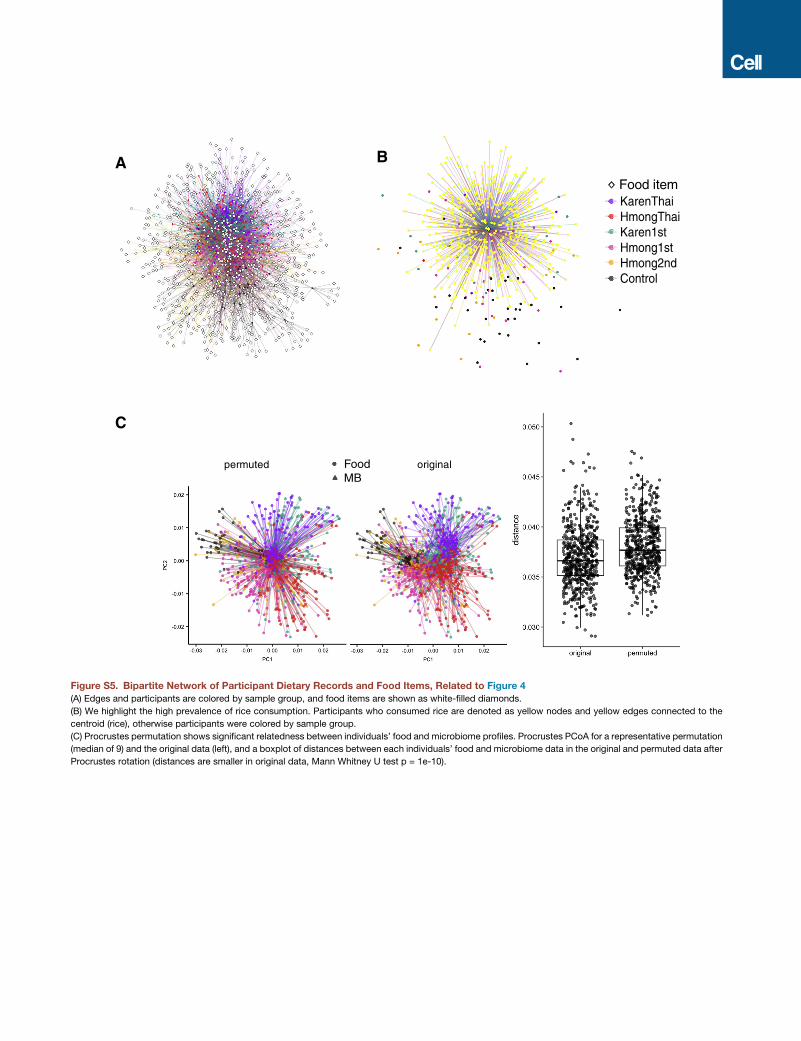
KarenThaiHmongThaiKaren1stHmong1stHmong2ndControl
Food item
A B
C
FoodMB
lanigirodetumrep
Figure S5. Bipartite Network of Participant Dietary Records and Food Items, Related to Figure 4
(A) Edges and participants are colored by sample group, and food items are shown as white-filled diamonds.
(B) We highlight the high prevalence of rice consumption. Participants who consumed rice are denoted as yellow nodes and yellow edges connected to the
centroid (rice), otherwise participants were colored by sample group.
(C) Procrustes permutation shows significant relatedness between individuals’ food and microbiome profiles. Procrustes PCoA for a representative permutation
(median of 9) and the original data (left), and a boxplot of distances between each individuals’ food and microbiome data in the original and permuted data after
Procrustes rotation (distances are smaller in original data, Mann Whitney U test p = 1e-10).
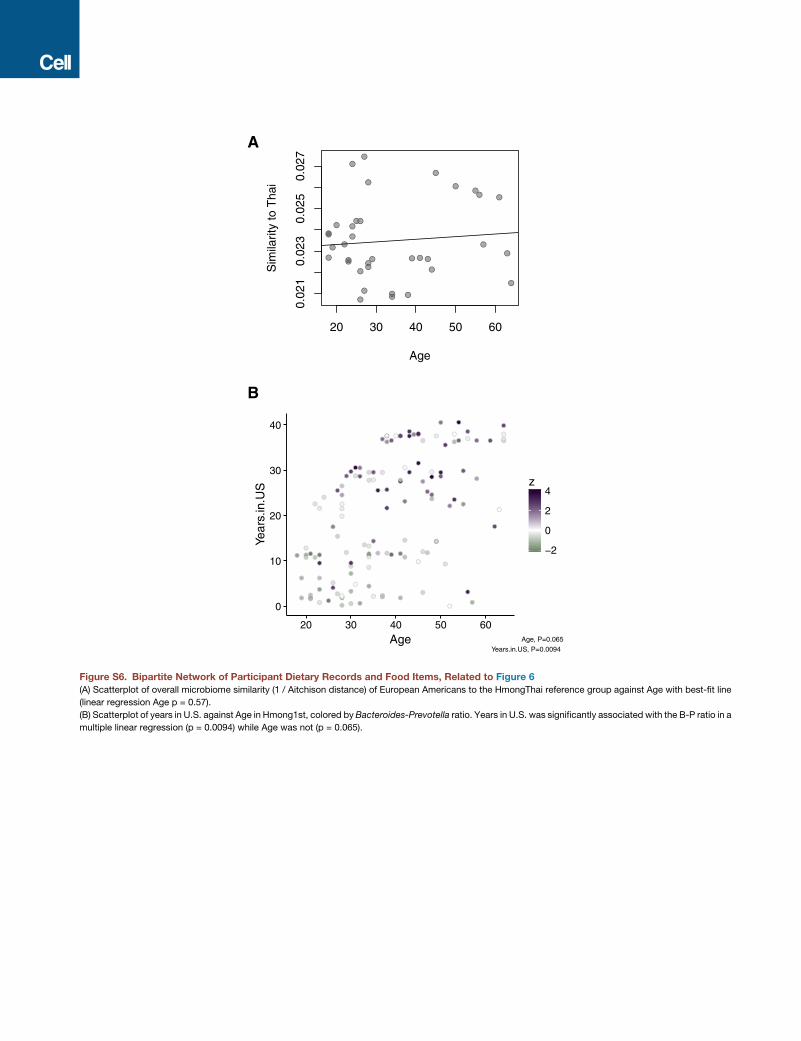
0
10
20
30
40
20 30 40 50 60
Age
Year
s.in
.US
−2
0
2
4z
Age, P=0.065
Years.in.US, P=0.0094
20 30 40 50 60
0.02
10.
023
0.02
50.
027
Age
Sim
ilarit
y to
Tha
i
A
B
Figure S6. Bipartite Network of Participant Dietary Records and Food Items, Related to Figure 6
(A) Scatterplot of overall microbiome similarity (1 / Aitchison distance) of European Americans to the HmongThai reference group against Age with best-fit line
(linear regression Age p = 0.57).
(B) Scatterplot of years in U.S. against Age in Hmong1st, colored byBacteroides-Prevotella ratio. Years in U.S. was significantly associated with the B-P ratio in a
multiple linear regression (p = 0.0094) while Age was not (p = 0.065).
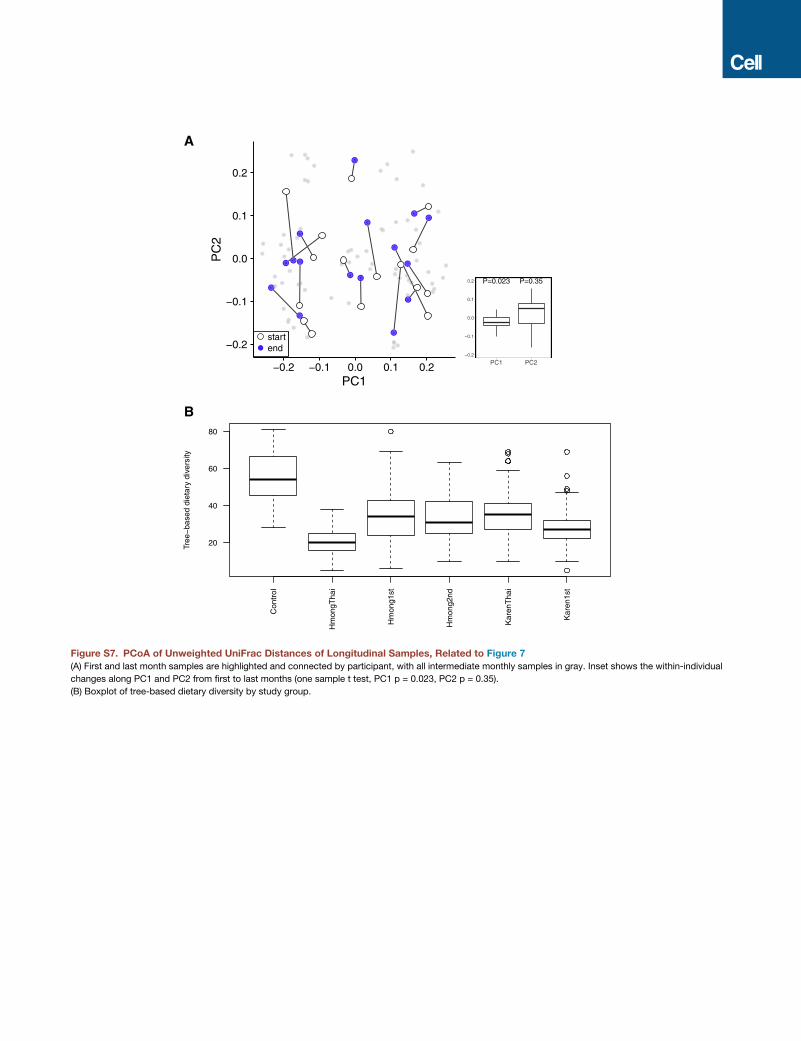
P=0.023 P=0.35
−0.2
−0.1
0.0
0.1
0.2
PC1 PC2
−0.2
−0.1
0.0
0.1
0.2
−0.2 −0.1 0.0 0.1 0.2PC1
PC
2
startend
Con
trol
Hm
ongT
hai
Hm
ong1
st
Hm
ong2
nd
Kar
enT
hai
Kar
en1s
t
20
40
60
80
Tree
−ba
sed
diet
ary
dive
rsity
A
B
Figure S7. PCoA of Unweighted UniFrac Distances of Longitudinal Samples, Related to Figure 7
(A) First and last month samples are highlighted and connected by participant, with all intermediate monthly samples in gray. Inset shows the within-individual
changes along PC1 and PC2 from first to last months (one sample t test, PC1 p = 0.023, PC2 p = 0.35).
(B) Boxplot of tree-based dietary diversity by study group.
Related Documents