U.S. Census Bureau’s Budget Estimates Fiscal Year 2012 As Presented to Congress February 2011 2012

Welcome message from author
This document is posted to help you gain knowledge. Please leave a comment to let me know what you think about it! Share it to your friends and learn new things together.
Transcript

U.S. Census Bureau’s Budget Estimates
Fiscal Year2012As Presented to Congress
February 20112012

Exhibit 1
Department of Commerce U.S. Census Bureau
BUDGET ESTIMATES, FISCAL YEAR 2012
CONGRESSIONAL SUBMISSION
Table of Contents
Exhibit Number
Exhibit
Page Number
2 Organization Chart CEN-1 3 Executive Summary CEN-3 3A Annual Performance Plan CEN-11 Salaries and Expenses: 5 Summary of resource requirements (Discretionary) CEN-25 5 Summary of resource requirements (Mandatory) CEN-26 7 Summary of financing CEN-27 9 Justification of adjustments to base CEN-28 Current surveys and statistics 10 Program and Performance: direct obligations CEN-32 12-15 Program Justification CEN-35 Survey of program dynamics 10 Program and Performance: direct obligations CEN-89 12-15 Program Justification CEN-90 State children’s health insurance program 10 Program and Performance: direct obligations CEN-91 12-15 Program Justification CEN-92 16 Summary of requirements by object class (Discretionary) CEN-94 16 Summary of requirements by object class (Mandatory) CEN-96 32 Justification of proposed language changes CEN-98 33 Appropriation Language and Code Citations CEN-99
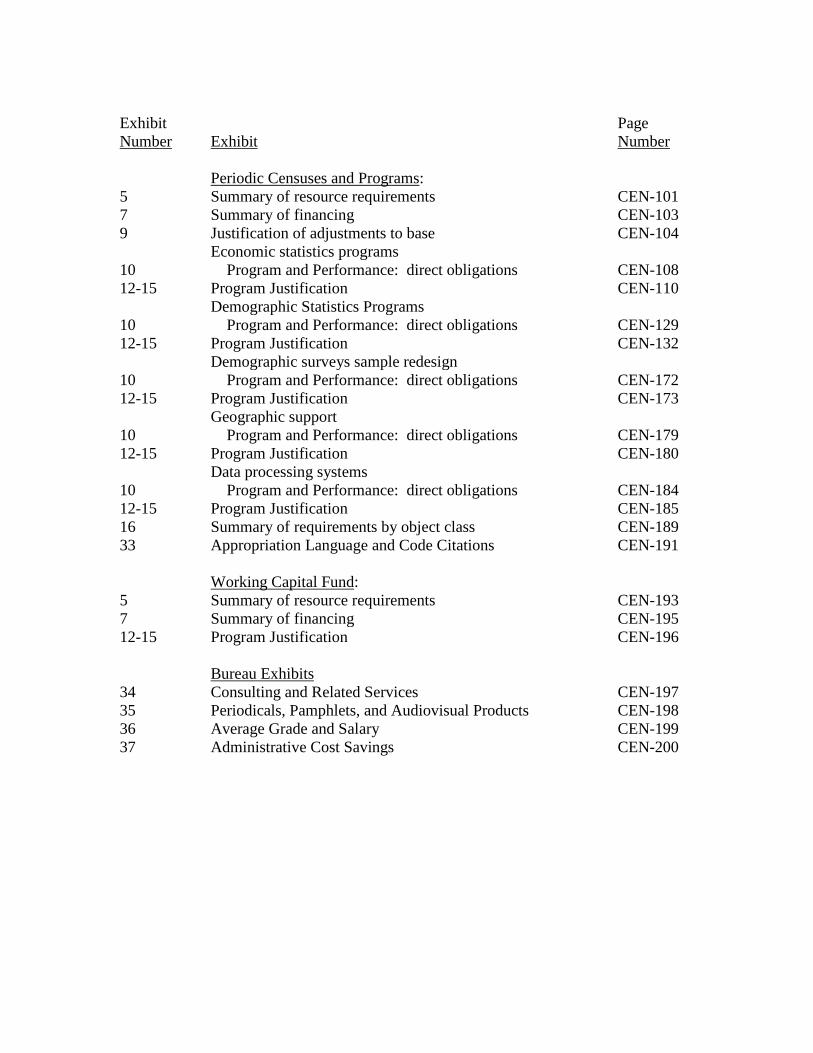
Exhibit Number
Exhibit
Page Number
Periodic Censuses and Programs: 5 Summary of resource requirements CEN-101 7 Summary of financing CEN-103 9 Justification of adjustments to base CEN-104 Economic statistics programs 10 Program and Performance: direct obligations CEN-108 12-15 Program Justification CEN-110 Demographic Statistics Programs 10 Program and Performance: direct obligations CEN-129 12-15 Program Justification CEN-132 Demographic surveys sample redesign 10 Program and Performance: direct obligations CEN-172 12-15 Program Justification CEN-173 Geographic support 10 Program and Performance: direct obligations CEN-179 12-15 Program Justification CEN-180 Data processing systems 10 Program and Performance: direct obligations CEN-184 12-15 Program Justification CEN-185 16 Summary of requirements by object class CEN-189 33 Appropriation Language and Code Citations CEN-191 Working Capital Fund: 5 Summary of resource requirements CEN-193 7 Summary of financing CEN-195 12-15 Program Justification CEN-196 Bureau Exhibits 34 Consulting and Related Services CEN-197 35 Periodicals, Pamphlets, and Audiovisual Products CEN-198 36 Average Grade and Salary CEN-199 37 Administrative Cost Savings CEN-200

U.S
. Dep
artm
ent o
f Com
mer
ceB
urea
u of
the
Cen
sus
Asso
ciat
e D
irect
or
for M
etho
dolo
gy &
St
anda
rds
Stat
istic
al
Res
earc
h D
ivis
ion
Plan
ning
, Res
earc
h,
and
Eva
luat
ion
Div
isio
n
Com
pute
r A
ssis
ted
Sur
vey
Res
earc
h O
ffice
Ass
ocia
te D
irect
or
for
Dem
ogra
phic
Pr
ogra
ms
Dem
ogra
phic
S
urve
ys D
ivis
ion
Dem
ogra
phic
S
tatis
tical
Met
hods
D
ivis
ion
Popu
latio
n D
ivis
ion
Hou
sing
&
Hou
seho
ld E
cono
mic
S
tatis
tics
Div
isio
n
Asso
ciat
e D
irect
or fo
r D
ecen
nial
Cen
sus
Ass
ista
nt D
irect
or fo
r A
CS
and
D
ecen
nial
Cen
sus
Ass
ista
nt D
irect
or fo
r D
ecen
nial
Info
rmat
ion
Tech
nolo
gy a
nd
Geo
grap
hic
Sys
tem
s
Dec
enni
al
Sta
tistic
al
Stud
ies
Div
isio
n
Dec
enni
al
Man
agem
ent
Div
isio
n
Am
eric
an
Com
mun
ity
Surv
ey O
ffice
Man
ufac
turin
g an
d C
onst
ruct
ion
Div
isio
n
Ass
ocia
te D
irect
or fo
r Ec
onom
ic P
rogr
ams
Ass
ista
nt D
irect
or fo
r Ec
onom
ic P
rogr
ams
Com
pany
Sta
tistic
s D
ivis
ion
Ser
vice
Sec
tor
Sta
tistic
s D
ivis
ion
Fore
ign
Trad
e D
ivis
ion
Gov
ernm
ents
D
ivis
ion
Eco
nom
ic P
lann
ing
and
Coo
rdin
atio
n D
ivis
ion
Eco
nom
ic
Sta
tistic
al M
etho
ds
and
Pro
gram
min
g D
ivis
ion
Cen
ter f
or
Eco
nom
ic S
tudi
es
Pol
icy
Offi
ce
Asso
ciat
e D
irect
or fo
r C
omm
unic
atio
ns
Pub
lic In
form
atio
n O
ffice
Con
gres
sion
al
Affa
irs O
ffice
Asso
ciat
e D
irect
or
for I
nfor
mat
ion
Tech
nolo
gy a
nd C
hief
In
form
atio
n O
ffice
r
Com
pute
r Ser
vice
sD
ivis
ion
Tele
com
mun
icat
ions
O
ffice
Info
rmat
ion
Sys
tem
s S
uppo
rt an
d R
evie
w O
ffice
Sys
tem
s S
uppo
rt D
ivis
ion
Tech
nolo
gies
M
anag
emen
t O
ffice
Reg
iona
l Offi
ces:
Bos
ton,
MA
New
Yor
k, N
YPh
ilade
lphi
a, P
AD
etro
it, M
IC
hica
go, I
LKa
nsas
City
, KS
Sea
ttle,
WA
Cha
rlotte
, NC
Atla
nta,
GA
Dal
las,
TX
Den
ver,
CO
Los
Ange
les,
CA
Fiel
d D
ivis
ion
Nat
iona
l P
roce
ssin
g C
ente
r
Asso
ciat
e D
irect
or
for
Fiel
d O
pera
tions
Asso
ciat
e D
irect
or fo
r Ad
min
istra
tion
and
Chi
ef F
inan
cial
Offi
cer
Com
ptro
ller
Bud
get D
ivis
ion
Fina
nce
Div
isio
n
Acq
uisi
tion
Div
isio
n
Adm
inis
trativ
e an
d C
usto
mer
Ser
vice
s D
ivis
ion
Adm
inis
trativ
e an
d M
anag
emen
t S
yste
ms
Div
isio
n
Hum
an R
esou
rces
D
ivis
ion
Equa
l Em
ploy
men
t O
ppor
tuni
ty O
ffice
DIR
EC
TOR
DE
PU
TY D
IRE
CTO
R
Dec
enni
al S
yste
ms
and
Con
tract
s M
anag
emen
t Offi
ce
Geo
grap
hy
Div
isio
n
Ass
ista
nt D
irect
or fo
r M
arke
ting
and
Cus
tom
er L
iais
on
Cen
sus
2010
P
ublic
ity O
ffice
Exhi
bit 2
CEN-1

THIS
PAG
E IN
TEN
TIO
NA
LLY
LEFT
BLA
NK
CEN-2

Exhibit 3
U.S. Census Bureau Executive Summary
The Fiscal Year (FY) 2012 budget request reflects the resources needed for the U.S. Census Bureau to support the Department of Commerce’s Science and Information general goal 14, “To improve understanding of the US economy, society and environment by providing timely, relevant, trusted and accurate data, standards and services enabling entities to make informed decisions.” The Census Bureau’s mission is to serve as the leading source of quality data about the Nation’s people and economy. We honor privacy, protect confidentiality, share our expertise globally, and conduct our work openly. The Census Bureau performance goals are to provide timely, relevant, and accurate current and benchmark measures of the U.S. population, economy, and governments in order to facilitate this mission. Budget and Financial Management Discretionary Domestic Spending: The Census Bureau requests appropriations for domestic discretionary spending totaling $1.0 billion. Mandatory Domestic Spending: The Census Bureau expects to receive $30.0 million in mandatory domestic spending in FY 2012 for the State Children’s Health Insurance Program and the Survey of Program Dynamics. Reimbursable Program Funding: The Census Bureau anticipates that it will receive $274.4 million in reimbursable funding from other federal and non-federal organizations to perform work for those entities. Administrative Savings The Administration is pursuing an aggressive government-wide effort to curb non-essential administrative spending called the Administrative Efficiency Initiative. In order to be good stewards of taxpayer money the Federal Government should continue to seek ways to improve the efficiency of programs without reducing their effectiveness. As such, the President directed each agency to analyze its administrative costs and identify savings where possible. After reviewing its administrative costs, the Census Bureau has identified $20,000,000 in administrative savings, of which $991,000 is savings identified through the Department’s Working Capital Fund (see the Departmental Management Working Capital Fund section for more details). The Census Bureau has targeted a number of areas to achieve its savings. Acquisition plans for FY 2012 account for $9,920,000 in savings. In the area of human capital, the Census Bureau expects to reduce its costs by $6,397,000 through position management and control and reduced workers compensation costs. Another $1,357,000 in administrative savings has been identified in logistics plans and in general administrative support by limiting discretionary travel and printing. The Census Bureau has also identified $1,335,000 in savings tied to IT related items, through the closing of a data center established for the 2010 Census ahead of schedule. The $20,000,000 in administrative savings identified above represent real reductions to the Census Bureau’s funding level and will help reduce overall spending by the Federal government.
CEN-3

FY 2012 Program Changes The requested funding reflects the resources needed to implement program enhancements and cyclical changes in operational requirements between FY 2011 and FY 2012 for the 2010 Census, the Economic Census, and the Census of Governments. It also includes program increases to revitalize Government Statistics, to begin research and testing for the 2020 Census, and a planned decrease in the Survey of Income and Program Participation. • American Community Survey (ACS) (Base Funding 2,544 FTE and $247.5 million; Program Change
122 FTE and $5.2 million): Fiscal Year 2012 funds will continue the implementation of the ACS at a fully expanded sample size of 3.5 million housing units, including data quality improvement activities. This program change reflects a decrease of $3.7 million and 8 FTE for administrative savings
• Economic Census (Base Funding 601 FTE and $113.5 million; Program Change 61 FTE and $10.8
million): The Census Bureau conducts the economic census every five years. It is integral to the Bureau of Economic Analysis (BEA) estimates of Gross Domestic Product (GDP) and industry inputs and outputs. It provides decision-makers with comprehensive, detailed, and authoritative facts about the structure and functioning of the U.S. economy. It is the foundation of the nation’s economic statistics programs, providing core information on virtually all non-farm businesses and related data on business expenditures, commodity flows, minority and women-owned businesses, and other topics. Fiscal Year 2012 is the third year of the six-year 2012 Economic Census funding cycle. The focus of activity for FY 2012 is the development of the collection instruments and processing systems to be used in the 2012 Economic Census. Specific activities include outreach with over 1,500 of the largest companies about the census, development and creation of electronic tools and the Business Help Site to service respondent needs, conduct of a classification mailing in preparation of the census mail list, creation of the mail frame through the processing of 100+ million administrative records, printing of millions of report forms, and development of the processing systems to be used in the 2012 Economic Census. This program change reflects a decrease of $1.9 million and 4 FTE reflecting administrative savings.
• 2020 Decennial Census program (Base Funding 0 FTE and $0; Program Change 284 FTE and $67.0
million): Fiscal Year 2012 is the first year of a three-year research and testing phase of the 2020 Census. The request for FY 2012 will be used to initiate the research and testing phase for the 2020 Census. The FY 2012 key program activities lay the foundation for managing and testing new decennial census systems and methods. Consequently, the 2020 Census program management, systems engineering, and research and testing efforts in FY 2012 center on:
• Finalizing critical plans for ensuring integrated and effective management of the 2020 Census
program, such as risk management; • Completing systems engineering activities for laying the foundation to development standards
and methods as well as beginning architectural development, placing the IT infrastructure for the 2020 Census within the Census Bureau’s architecture;
• Developing qualitative and field test plans for operationalizing and assessing the research agenda;
• Developing study plans and conducting qualitative tests for evaluating response options, including electronic modes;
• Developing administrative records research plans and supporting alternative systems to focus on decennial needs;
• Benchmarking the integrated IT infrastructure and field automation logic and high-level requirements for early prototyping; and
CEN-4

• Developing study plans and concept models for measuring the error in the Master Address File in support of the Geographic Support program.
This program change reflects a decrease of $2.3 million and 12 FTE representing administrative savings.
• Census of Governments (Base Funding 61 FTE and $8.2 million; Program Change 17 FTE and $2.3
million): The Census Bureau conducts a census of governments every five years. Like the Economic Census, it is integral to the BEA’s estimates of GDP. It is the only source of comprehensive and uniformly classified data on the economic activities of more than 90,000 state and local governments, which account for about 12 percent of GDP and nearly 16 percent of the U.S. workforce. The 2012 Census of Governments consists of three components: government organization, public employment, and government finances. Fiscal Year 2012 funding is requested primarily for data collection and processing in the organization component; data preparation and initiation of data collection and processing in the employment component; and the preparation for and start of data collection and processing in the finance component. Key objectives of the FY 2012 work are the identification of the universe, collection of data about the universe characteristics, and the start of employment and finance data collection.
This program change reflects a decrease of $0.4 million representing administrative savings.
• Revitalize Government Statistics (Base Funding 10 FTE and $1.2 million; Program Change 19 FTE
and $2.9 million): The Census Bureau requests an increase to revitalize the Government Statistics program by developing new methodologies for measuring revenues, expenditures, and financial assets for publicly sponsored defined contribution pension plans and for measuring costs and liabilities for other post-employment benefits (OPEB) (e.g. health insurance) for public employees. Little information exists on the full scale of unfunded liabilities associated with public pensions and OPEBs, nor are there comprehensive official statistics on these data. Developing new collection efforts in this area will provide public policymakers with a new data source in which to assess trillions in estimated liabilities of state and local governments.
• Current Population Survey (Base Funding 110 FTE and $11.6 million; Program Change 36 FTE and
$5 million): The Census Bureau proposes an increase of $5 million to support the development of a supplemental statistical poverty measure from the Current Population Survey to complement the current official measure. The initiative will work in conjunction with a complementary initiative being proposed by the Bureau of Labor Statistics. A more comprehensive supplemental measure of poverty will enhance analysts’ and policymakers’ perspectives on modeling changes to their programs and improving the evaluation of the effectiveness of programs for the disadvantaged.
• Enhancing the Federal Statistical System’s Ability to Use Administrative Records (Base Funding 0
FTE and $0; Program Change 40 FTE and $9.0 million): This program initiative will allow us to enhance the ability of the Federal statistical system to utilize administrative records. We will expand the Census Bureau’s administrative records infrastructure to support various cross-cutting administrative records initiatives, including a 2010 Census simulation and a health pilot project involving the National Center for Health Statistics. The Economic Research Service (ERS) will also partner with researchers to analyze food security issues and program participation using relevant state-level administrative data. The Census Bureau shares an interest in these issues, which will improve our understanding of Title 13 nutrition assistance survey data, and may enhance the Supplemental Poverty Measure. The ERS proposes several projects using linked administrative data. These pilot projects are designed to address existing barriers to more complete use of administrative data while at the same time contributing substantive topical knowledge in critical fields.
CEN-5

• Survey of Income and Program Participation (SIPP) (Base Funding 519 FTE and $51.4 million;
Program Change -34 FTE and -$1.0 million): The Census Bureau requests a decrease to reflect the completion of the Event History Calendar field tests. The remaining funding will allow the Census Bureau to continue collecting SIPP at the full sample size, and continue the reengineering process.
2010 Decennial Census program (except ACS – see description above) (Base Funding 3,028 FTE and $469.1 million; Program Change -2,238 FTE and -$290.9 million): As mandated in the U.S. Constitution, the decennial census provides the official population counts for determining the allocation to states of seats in the U.S. House of Representatives, and for determining how the districts are defined for those seats. The program also provides data for small geographic areas and population groups that federal agencies need to implement legally mandated programs. In FY 2012, activities will focus on continuing the evaluations, assessments, and experiments related to 2010 Census operations; conducting the Count Question Resolution Program; developing and disseminating the 2010 Census data products; working to archive response data and questionnaire images; conducting ongoing maintenance and support of the Data Access and Dissemination System (DADS), including continued incremental implementation of the DADS II system; and conducting closeout activities of 2010 Census contracts. This program change reflects a decrease of $6.1 million and 36 FTE representing administrative savings.
Program Terminations and Reductions In order to fund higher priority programs within the Census Bureau and the Department of Commerce, the FY 2012 request includes the following terminations and reductions, which are described in greater detail in the budget submission. • Terminate Current Industrial Reports – a decrease of $4.0 million (-35 FTE)
• Reduce Demographic Surveys Sample Redesign – a decrease of $1.5 million (-9 FTE)
• Terminate Foreign Research and Analyses – a decrease of $1.5 million (-12 FTE) • Terminate Federal Financial Statistics – a decrease of $0.7 millon (-6 FTE)
• Reduce Data Processing Systems – a decrease of $1.7 million (-0 FTE)
• Reduce Measuring E-business – a decrease of $1.5 million (-0 FTE)
• Terminate Statistical Abstract – a decrease of $2.9 million (-24 FTE)
• Terminate Demographic Call Center – a decrease of $0.9 million (-5 FTE)
• Terminate Population Distributions – a decrease of $1.2 million (-6 FTE)
CEN-6

Other Program Highlights The Census Bureau programs described below provide important data about the Nation’s population and economy on an ongoing basis. Wherever possible, the Census Bureau seeks to improve the functioning of these programs within existing funds. Economic Programs Highlights/Overview • Current economic statistics (amount includes program change described above) –
1,252 FTE and $184.6 million: More than 100 annual, quarterly, and monthly surveys provide key national economic statistics on a current basis, including business, construction, manufacturing, federal expenditures, and general economic statistics. The Census Bureau’s trade statistics collection program provides the closely watched monthly trade numbers. Federal agencies, like the Federal Reserve Board and the BEA and other stakeholders, are major users of these data. These data also are used to develop the GDP, production indices, and economic projections. These data allow users to gauge competition, calculate market share, prepare operating ratios, and analyze changes in the Nation’s economic structure. This funding level reflects administrative savings of $0.4 million and 4 FTE.
Demographic Programs Highlights/Overview • Current demographic statistics (amount includes program change described above) –
712 FTE and $78.5 million: The current demographic statistics programs collect demographic information on diverse topics such as income and poverty, health insurance coverage, housing, voting, families, and childcare. This funding level reflects administrative savings of $0.2 million and 2 FTE. Intercensal demographic estimates – 71 FTE and $10.1 million: The intercensal demographic estimates program provides decision-makers with annual population estimates for states, counties, cities, and towns in the years between decennial censuses. Annually, hundreds of billions in federal funds are distributed based on these estimates. The requested funding level includes no program changes for FY 2012. This funding level reflects administrative savings of $0.5 million.
• Demographic surveys sample redesign (amount includes program change described
above) – 62 FTE and $9.9 million: The demographic surveys sample redesign activity updates the samples for the major recurring household surveys to reflect America’s mobile population and complex socioeconomic environment. Fiscal Year 2012 funding is requested to continue efforts to focus on shifting the demographic surveys sample redesign towards using a continually updated Master Address File and American Community Survey data to select household survey samples, rather than relying on the once-a-decade availability of decennial census data. This funding total reflects administrative savings of $0.4 million.
CEN-7

Mandatory Demographic Programs: The following mandatory funding for demographic programs is anticipated in FY 2012: • Survey of program dynamics – 57 FTE and $10.0 million:
This program provides socioeconomic data and information, which can be used by federal and state public policymakers to evaluate the effects of the Personal Responsibility and Work Opportunity Reconciliation Act of 1996 that established the Temporary Assistance for Needy Families Program.
• State children’s health insurance program – 217 FTE and $20.0 million: This program provides statistically reliable annual data for each state on the number of low-income children who do not have health insurance coverage. These data are used to allocate funds to states.
Other Census Bureau Programs - Highlights/Overview There are several other Census Bureau programs that do not fall within either the demographic or economic areas. These programs are highlighted below. • Survey development and data services (amount includes program change described
above) – 47 FTE and $11.6 million: The survey development and data services program funds research into survey design and estimation, time series analysis, error reduction, privacy protection, and special experimental and evaluation studies. These activities continually improve the Census Bureau’s survey and census activities and provide statistical information to the public. This funding total reflects administrative savings of $26 thousand.
• Geographic support – 361 FTE and $67.7 million: The Census Bureau has developed the computer-based Geographic Support System, which integrates large volumes of information from many external sources to establish and maintain accurate geographic boundaries, address ranges, and other map information. These data are stored in an address list and associated geographic databases. This information must be updated on a regular basis to meet the needs of the economic census, the current demographic statistics programs, and the intercensal demographic estimates program. This funding total reflects administrative savings of $1.4 million and 1 FTE.
• Data processing systems (amount includes program change described above) – 0 FTE and $32.4 million: The data processing systems activity funds information technology services supporting Census Bureau enterprise needs. Economies of scale are achieved through centralized information technology contracts and services in accordance with Department of Commerce guidelines and a comprehensive Information Technology Plan. This saves taxpayers money, while helping the Census Bureau to accomplish its mission. This funding total reflects administrative savings of $1.7 million.
Reimbursable Programs The Census Bureau also conducts work on a reimbursable funding basis for other federal agencies, such as the collection of labor force and consumer expenditure data for the Bureau of Labor Statistics, data on experience of crime for the Department of Justice, education data for the Department of Education,
CEN-8

health measures for the Department of Health and Human Services, and housing data for the Department of Housing and Urban Development.
SUMMARY OF RESOURCES The following summary provides a comparison between the Annualized FY 2011 CR Level and the
FY 2012 Estimate (Budget Authority in Thousands)
2011 CR
(Annualized) FY 2012 Estimate Difference FTE Amount FTE Amount FTE Amount Salaries & Expenses 2,024 $259,024 1,992 $272,054 -32 $13,030 Periodic Censuses & Programs 6,838 $964,315 4,974 $752,711 -1,864 -$211,604 Total Discretionary Budget Authority 8,862 $1,223,339 6,966 $1,024,765 -1,896 -$198,574 Mandatory Appropriations 297 $30,000 274 $30,000 -23 $0 Total Budget Authority 9,159 $1,253,339 7,240 $1,054,765 -1,919 -$198,574 Working Capital Fund1 3,368 $336,135 2,393 $274,420 -975 -$61,715 Total Available 12,527 $1,589,474 9,633 $1,329,186 -2,894 -$260,288 1Reflects estimated level of reimbursable work for Census Bureau services to other government agencies and other customers
CEN-9

THIS PAGE INTENTIONALLY LEFT BLANK
CEN-10

Exhibit 3A
FY 2012 Annual Performance Plan
Section 1 Mission Statement The Census Bureau serves as the leading source of quality data about the nation's people and economy. We honor privacy, protect confidentiality, share our expertise globally, and conduct our work openly. We are guided on this mission by our strong and capable workforce, our readiness to innovate, and our abiding commitment to our customers. Section 2 Corresponding DOC Strategic Goals
Performance Outcomes and Department Goals Rationale
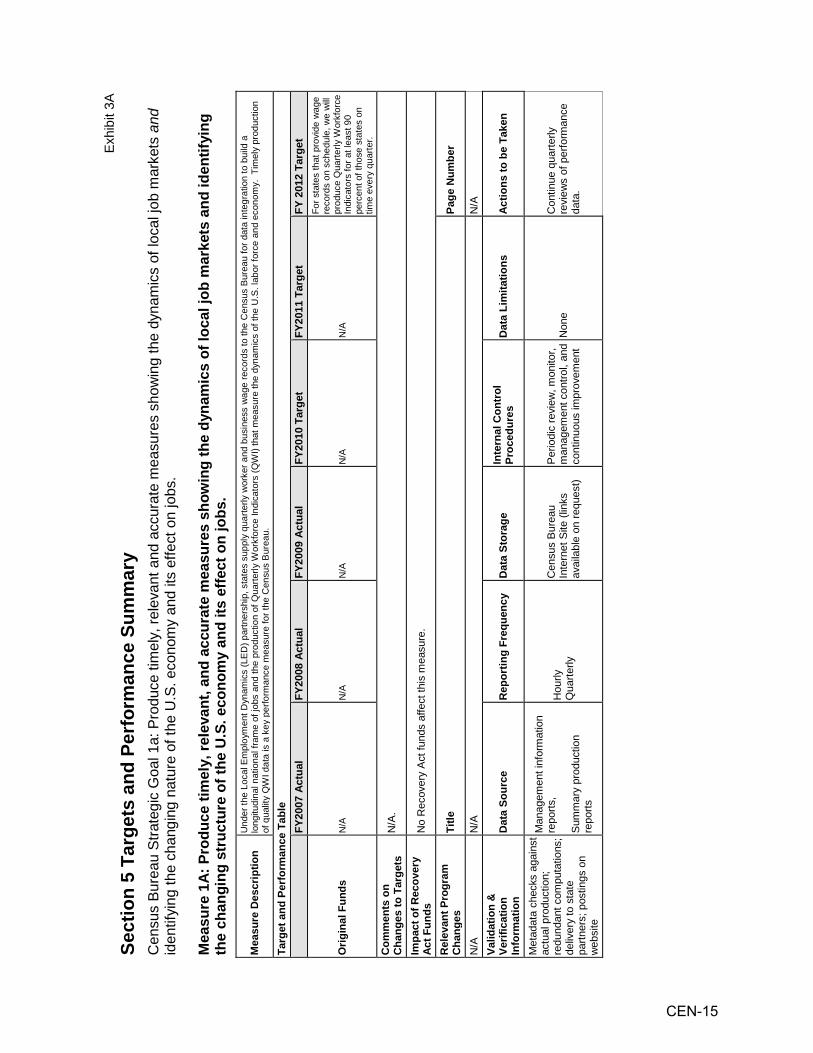
Census Bureau Strategic Theme 1: Foster economic growth by providing up-to-date relevant information. Census Bureau Performance Goal/Outcome 1a.: Produce timely, relevant and accurate measures showing the dynamics of local job markets and identifying the changing nature of the U.S. economy and its effect on jobs. Corresponding DOC Strategic Goal/Outcome: Generating and communicating new, cutting-edge scientific understanding of technical, economic, social and environmental systems. DOC Performance Goal/Outcome 14: Improve understanding of the US economy, society and environment by providing timely, relevant, trusted and accurate data, standards and services enabling entities to make informed decisions. Rationale: Such measures are critical for decision makers and policy makers to determine the health of local economies and track the geographic dimension of the economy. Census Bureau Performance Goal/Outcome 1b.: Provide timely, relevant, accurate and accessible current measures of export activities, and the number and characteristics of exporters, to help identify and exploit export activities for entrepreneurs, businesses, and governments that generate quality jobs, to provide decision makers and policy makers in both the public and private sectors with the information assets they need to make informed decisions, and to illuminate social, economic, and demographic trends. Corresponding DOC Strategic Goal/Outcome: Generating and communicating new, cutting-edge scientific understanding of technical, economic, social and environmental systems. DOC Performance Goal/Outcome 14: Improve understanding of the US economy, society and environment by providing timely, relevant, trusted and accurate data, standards and services enabling entities to make informed decisions.
CEN-11
Exhibit 3A
Rationale: The activities covered by these measures support the Trade Promotion and Commercial Diplomacy goal of the Department of Commerce by providing high quality information on export markets, the number of characteristics of exporters, and by participating in trade promotion, education, and compliance activities. Census Bureau Strategic Theme 2: Advance Scientific Information by Generating a New Understanding of Economic and Social Systems. Census Bureau Performance Goal/Outcome 2a: Provide timely, relevant, accurate and accessible current measures of the population, economy, and governments to help identify and exploit market opportunities for entrepreneurs, businesses, and government that generate quality jobs; to provide decision makers and policy makers in both the public and private sectors with the information assets they need to make informed decisions; and to illuminate social, economic, and demographic trends. Census Bureau Performance Goal/Outcome 2b: Provide timely, relevant, accurate and accessible benchmark measures of the U.S. population, economy, and governments to assess U.S. competitiveness, identify new business opportunities, and foster domestic job growth. Corresponding DOC Strategic Goal/Outcome: Generating and communicating new, cutting-edge scientific understanding of technical, economic, social and environmental systems. DOC Performance Goal/Outcome 14: Improve understanding of the US economy, society and environment by providing timely, relevant, trusted and accurate data, standards and services enabling entities to make informed decisions. Rationale: As the nation’s premier statistical agency, the Census Bureau has the responsibility to provide policymakers, academia, businesses, and the public with accurate, timely, and relevant statistical information. This responsibility spans constitutional mandates, namely the decennial censuses, and legislative mandates, such as the collection of information on the impact of welfare reform. The Census Bureau must also capture the information which forms the basis for estimates of Gross Domestic Product (GDP), the nation’s economic indicators, trade and industry estimates, the allocation of federal program funds, the distribution of congressional seats, and national characteristics, such as race and Hispanic origin, sex, age, and income. The Census Bureau must provide the public with information that is current, while ensuring that the collection of this information does not impose an undue burden on respondents.
CEN-12

Exhibit 3A Section 3 Impact of Recovery Act No Recovery Act funds will be available for obligation in FY 2012.
Section 4 Priorities and Management Challenges The FY 2012 request reflects the following Census Bureau priorities/objectives: • To meet constitutional and legislative mandates by implementing a reengineered 2010 Decennial Census Program designed to take advantage of opportunities for innovations made possible through the expanded use of technology, major changes in the business process for data collection, and the use of focused coverage improvement procedures. • To make fundamental changes to the design, implementation, and management of the decennial census to meet the following goals of the 2020 Census: 1) a complete and accurate census, 2) embraced and valued results, 3) an efficient census, and 4) a well-managed census. • To meet the needs of policymakers, businesses, non-profit organizations, and the public for current measures of the U.S. population, economy, and governments. • To support the economic and political foundations of the U.S. by producing benchmark measures of the economy and population for the administration and equitable funding of Federal, state, and local programs. • To support innovation, promote data use, minimize respondent burden, respect individual privacy, and ensure confidentiality. The Census Bureau faces a number of key challenges in continuing to provide timely, reliable, and confidential data about the economy and population of the United States. The following challenges are viewed as among the most significant because of their importance to the Census Bureau mission: Privacy and Confidentiality Concerns: Public perception of both government and non-government intrusion into personal and business information privacy is increasingly negative. As technology provides greater abilities to collect, process, and disseminate data, it also presents greater challenges to protect data from improper access and use. Any concerns about privacy of information in the Internet age, confidentiality of information provided to the government, and intrusiveness of government programs are challenges to the Census Bureau in collecting personal information in its surveys and censuses. The Economy: Measuring the ever-evolving and rapidly changing economy is becoming increasingly difficult as firms adopt new organizational structures and relationships, embrace new ways of doing business, and streamline their internal and external processes. These changes often alter traditional record keeping practices, posing additional data collection challenges.
CEN-13

Exhibit 3A
Funding Constraints: Demands on the federal budget during the next few years will be substantial. The Census Bureau’s challenge will be to demonstrate the critical importance of accurate information to the government, the economy, and the public, in light of this fiscal environment. Workforce and Workplace Management: Many Census Bureau employees are eligible for early or regular retirement. Recruiting, developing, and retaining the next generation of employees will require planning to ensure that specialized technical and managerial knowledge, as well as the Census Bureau’s corporate culture, values, and institutional knowledge, are transferred.
CEN-14
Ex
hibi
t 3A
Se
ctio
n 5
Targ
ets
and
Perf
orm
ance
Sum
mar
y C
ensu
s Bu
reau
Stra
tegi
c G
oal 1
a: P
rodu
ce ti
mel
y, re
leva
nt a
nd a
ccur
ate
mea
sure
s sh
owin
g th
e dy
nam
ics
of lo
cal j
ob m
arke
ts a
nd
iden
tifyi
ng th
e ch
angi
ng n
atur
e of
the
U.S
. eco
nom
y an
d its
effe
ct o
n jo
bs.
Mea
sure
1A:
Pro
duce
tim
ely,
rele
vant
, and
acc
urat
e m
easu
res
show
ing
the
dyna
mic
s of
loca
l job
mar
kets
and
iden
tifyi
ng
the
chan
ging
str
uctu
re o
f the
U.S
. eco
nom
y an
d its
effe
ct o
n jo
bs.
Mea
sure
Des
crip
tion
Und
er th
e Lo
cal E
mpl
oym
ent D
ynam
ics
(LE
D) p
artn
ersh
ip, s
tate
s su
pply
qua
rterly
wor
ker a
nd b
usin
ess
wag
e re
cord
s to
the
Cen
sus
Bur
eau
for d
ata
inte
grat
ion
to b
uild
a
long
itudi
nal n
atio
nal f
ram
e of
jobs
and
the
prod
uctio
n of
Qua
rterly
Wor
kfor
ce In
dica
tors
(QW
I) th
at m
easu
re th
e dy
nam
ics
of th
e U
.S. l
abor
forc
e an
d ec
onom
y. T
imel
y pr
oduc
tion
of q
ualit
y Q
WI d
ata
is a
key
per
form
ance
mea
sure
for t
he C
ensu
s B
urea
u.
Targ
et a
nd P
erfo
rman
ce T
able
FY20
07 A
ctua
l FY
2008
Act
ual
FY20
09 A
ctua
l FY
2010
Tar
get
FY20
11 T
arge
t FY
201
2 Ta
rget
Orig
inal
Fun
ds
N/A
N
/A
N/A
N
/A
N/A
For s
tate
s th
at p
rovi
de w
age
reco
rds
on s
ched
ule,
we
will
pr
oduc
e Q
uarte
rly W
orkf
orce
In
dica
tors
for a
t lea
st 9
0 pe
rcen
t of t
hose
sta
tes
on
time
ever
y qu
arte
r.
Com
men
ts o
n C
hang
es to
Tar
gets
N
/A.
Impa
ct o
f Rec
over
y Ac
t Fun
ds
No
Rec
over
y A
ct fu
nds
affe
ct th
is m
easu
re.
Rel
evan
t Pro
gram
C
hang
es
Title
Pa
ge N
umbe
r
N/A
N
/A
N/A
Va
lidat
ion
&
Verif
icat
ion
Info
rmat
ion
Dat
a So
urce
R
epor
ting
Freq
uenc
y D
ata
Stor
age
Inte
rnal
Con
trol
Pr
oced
ures
D
ata
Lim
itatio
ns
Actio
ns to
be
Take
n
Met
adat
a ch
ecks
aga
inst
ac
tual
pro
duct
ion;
re
dund
ant c
ompu
tatio
ns;
deliv
ery
to s
tate
pa
rtner
s; p
ostin
gs o
n w
ebsi
te
Man
agem
ent i
nfor
mat
ion
repo
rts,
Sum
mar
y pr
oduc
tion
repo
rts
Hou
rly
Qua
rterly
Cen
sus
Bur
eau
Inte
rnet
Site
(lin
ks
avai
labl
e on
requ
est)
Per
iodi
c re
view
, mon
itor,
man
agem
ent c
ontro
l, an
d co
ntin
uous
impr
ovem
ent
Non
e C
ontin
ue q
uarte
rly
revi
ews
of p
erfo
rman
ce
data
.
CEN-15

Exhi
bit 3
A
Sect
ion
5 Ta
rget
s an
d Pe
rfor
man
ce S
umm
ary
Cen
sus
Bure
au S
trate
gic
Goa
l 1b:
Pro
vide
tim
ely,
rele
vant
, acc
urat
e an
d ac
cess
ible
cur
rent
mea
sure
s of
exp
ort a
ctiv
ities
, and
the
num
ber a
nd c
hara
cter
istic
s of
exp
orte
rs.
Mea
sure
1B
: Rel
ease
mon
thly
exp
ort s
tatis
tics
on s
ched
ule.
M
easu
re D
escr
iptio
n P
erce
nt o
f sch
edul
ed re
leas
e da
tes
for t
he F
T-90
0 In
tern
atio
nal T
rade
in G
oods
and
Ser
vice
s re
leas
ed o
n th
e sc
hedu
led
due
date
.
Targ
et a
nd P
erfo
rman
ce T
able
FY20
07 A
ctua
l FY
2008
Act
ual
FY20
09 A
ctua
l FY
2010
Tar
get
FY20
11 T
arge
t FY
201
2 Ta
rget
O
rigin
al F
unds
N
/A
N/A
N
/A
N/A
N
/A
100%
Com
men
ts o
n C
hang
es to
Tar
gets
N
/A.
Impa
ct o
f Rec
over
y Ac
t Fun
ds
No
Rec
over
y A
ct fu
nds
affe
ct th
is m
easu
re.
Rel
evan
t Pro
gram
C
hang
es
Title
Pa
ge N
umbe
r
N/A
N
/A
N/A
Va
lidat
ion
&
Verif
icat
ion
Info
rmat
ion
Dat
a So
urce
R
epor
ting
Freq
uenc
y D
ata
Stor
age
Inte
rnal
Con
trol
Pr
oced
ures
D
ata
Lim
itatio
ns
Actio
ns to
be
Take
n
- “B
lueb
ook”
Sch
edul
e of
re
leas
e da
tes
Mon
thly
Sch
edul
es m
aint
aine
d on
For
eign
Tra
de
Div
isio
n C
ompu
ters
and
pu
blic
ly a
vaila
ble
on th
e In
tern
et.
The
Cen
sus
Bur
eau
com
pare
s ac
tual
rele
ase
date
s w
ith s
ched
uled
da
ta.
No
varia
tion
from
sc
hedu
le is
per
mitt
ed.
Non
e C
ontin
ue 1
00%
on-
time
perfo
rman
ce.
CEN-16

Exhi
bit 3
A
Sect
ion
5 Ta
rget
s an
d Pe
rfor
man
ce S
umm
ary
Cen
sus
Bure
au S
trate
gic
Goa
l 2a:
Pro
vide
tim
ely,
rele
vant
, acc
urat
e an
d ac
cess
ible
cur
rent
mea
sure
s of
the
popu
latio
n, e
cono
my,
an
d go
vern
men
ts.
Mea
sure
2A
-1. A
chie
ve p
re-d
eter
min
ed c
olle
ctio
n ra
tes
for C
ensu
s B
urea
u su
rvey
s in
ord
er to
pro
vide
sta
tistic
ally
relia
ble
data
to
supp
ort e
ffect
ive
deci
sion
-mak
ing
of p
olic
ymak
ers,
bus
ines
ses,
and
the
publ
ic.
Mea
sure
Des
crip
tion
Mai
ntai
ning
a h
igh
leve
l of r
espo
nse
for b
oth
dem
ogra
phic
and
eco
nom
ic s
urve
ys e
nsur
es th
at in
form
atio
n fro
m C
ensu
s B
urea
u su
rvey
s an
d ce
nsus
es is
alw
ays
relia
ble
and
wid
ely
acce
pted
by
cust
omer
s ov
er th
e lo
ng te
rm. O
ver t
ime,
our
resp
onde
nts’
will
ingn
ess
to p
artic
ipat
e in
sur
veys
is d
eclin
ing
due
to a
num
ber o
f fac
tors
(e.g
. priv
acy
conc
erns
, mis
trust
of g
over
nmen
t, tim
e/ef
fort
to c
ompl
ete
the
surv
ey, e
tc).
The
refo
re, e
ven
to m
aint
ain
cons
iste
nt re
spon
se ra
te m
easu
res
over
tim
e re
quire
s im
prov
emen
ts
to th
e w
ay w
e pe
rform
our
wor
k.
Targ
et a
nd P
erfo
rman
ce T
able
FY20
07 A
ctua
l FY
2008
Act
ual
FY20
09 A
ctua
l FY
2010
Tar
get
FY20
11 T
arge
t FY
2012
Tar
get
Orig
inal
Fun
ds
90%
of k
ey c
ensu
ses
and
su
rvey
s m
et o
r exc
eede
d th
eir p
rede
term
ined
co
llect
ion
rate
s at
pla
nned
le
vels
of r
elia
bilit
y.
90%
of k
ey c
ensu
ses
and
su
rvey
s m
et o
r exc
eede
d th
eir p
rede
term
ined
co
llect
ion
rate
s at
pla
nned
le
vels
of r
elia
bilit
y.
90%
of k
ey c
ensu
ses
and
su
rvey
s m
et o
r exc
eede
d th
eir p
rede
term
ined
co
llect
ion
rate
s at
pla
nned
le
vels
of r
elia
bilit
y.
At l
east
90%
of k
ey c
ensu
ses
and
surv
eys
mee
t or e
xcee
d th
eir p
rede
term
ined
col
lect
ion
rate
s at
pla
nned
leve
ls o
f re
liabi
lity.
At l
east
90%
of k
ey
cens
uses
and
sur
veys
mee
t or
exc
eed
thei
r pr
edet
erm
ined
col
lect
ion
rate
s at
pla
nned
leve
ls o
f re
liabi
lity.
At l
east
90%
of k
ey
cens
uses
and
sur
veys
mee
t or
exc
eed
thei
r pr
edet
erm
ined
col
lect
ion
rate
s at
pla
nned
leve
ls o
f re
liabi
lity.
Com
men
ts o
n C
hang
es to
Ta
rget
s N
/A.
Impa
ct o
f Rec
over
y Ac
t Fu
nds
No
Rec
over
y A
ct fu
nds
affe
ct th
is m
easu
re.
Rel
evan
t Pro
gram
Cha
nges
Titl
e Pa
ge N
umbe
r 20
10 D
ecen
nial
Cen
sus
Am
eric
an C
omm
unity
Sur
vey
initi
ativ
e C
EN
-137
Valid
atio
n &
Ver
ifica
tion
Info
rmat
ion
Dat
a So
urce
R
epor
ting
Freq
uenc
y D
ata
Stor
age
Inte
rnal
Con
trol
Pr
oced
ures
D
ata
Lim
itatio
ns
Actio
ns to
be
Take
n
-
Cen
sus
Bur
eau
surv
eys
are
the
initi
al c
olle
ctio
n so
urce
. In
tern
al c
ontro
l file
s an
d sy
stem
s ar
e th
e so
urce
of
the
resp
onse
rate
dat
a.
Res
pons
e ra
tes
are
tied
to
data
col
lect
ion.
Fre
quen
cy
varie
s by
sur
vey.
All
data
are
sto
red
in
Cen
sus
Bur
eau
data
base
s an
d ar
e pu
blis
hed
in
publ
ic p
ress
rele
ases
.
Qua
lity
assu
ranc
e an
alys
es, A
utom
ated
Dat
a P
roce
ssin
g (A
DP
) rou
tines
, an
d pe
er re
view
s.
Dat
a th
at a
re re
leas
ed
mus
t adh
ere
to T
itle
13
requ
irem
ents
to p
rote
ct
resp
onde
nts’
co
nfid
entia
lity.
Con
tinue
qua
rterly
revi
ews
of
perfo
rman
ce d
ata.
CEN-17

Exhi
bit 3
A
Sect
ion
5 Ta
rget
s an
d Pe
rfor
man
ce S
umm
ary
Cen
sus
Bure
au S
trate
gic
Goa
l 2a:
Pro
vide
tim
ely,
rele
vant
, acc
urat
e an
d ac
cess
ible
cur
rent
mea
sure
s of
the
popu
latio
n, e
cono
my,
an
d go
vern
men
ts.
Mea
sure
2A
-2. R
elea
se d
ata
prod
ucts
for k
ey C
ensu
s B
urea
u pr
ogra
ms
on ti
me
to s
uppo
rt e
ffect
ive
deci
sion
-mak
ing
of p
olic
ymak
ers,
bu
sine
sses
, and
the
publ
ic.
Mea
sure
Des
crip
tion
Ens
urin
g th
at d
ata
prod
ucts
are
rele
ased
on
sche
dule
is e
ssen
tial.
The
Cen
sus
Bur
eau
ackn
owle
dges
an
impo
rtant
dis
tinct
ion
betw
een
rele
ase
of th
e E
cono
mic
Indi
cato
rs
and
the
othe
r sur
veys
’ and
cen
suse
s’ d
ata
prod
ucts
. OM
B S
tatis
tical
Dire
ctiv
e N
umbe
r 3 re
quire
s th
at th
e da
ta fo
r the
prin
cipl
e ec
onom
ic in
dica
tors
be
rele
ased
with
in
pres
crib
ed ti
me
perio
ds. T
he im
pact
of n
ot m
eetin
g re
leas
e da
tes
for t
he e
cono
mic
indi
cato
rs is
muc
h m
ore
serio
us, s
o tw
o se
para
te ta
rget
s ar
e no
ted.
Targ
et a
nd P
erfo
rman
ce T
able
FY20
07 A
ctua
l FY
2008
Act
ual
FY20
09 A
ctua
l FY
2010
Tar
get
FY20
11 T
arge
t FY
2012
Tar
get
Orig
inal
Fun
ds
1)10
0% o
f eco
nom
ic
indi
cato
rs re
leas
ed o
n sc
hedu
le.
2) A
t lea
st 9
0% o
f oth
er
data
pro
duct
s fro
m k
ey
cens
uses
and
sur
veys
w
ere
rele
ased
on
sche
dule
1)10
0% o
f eco
nom
ic
indi
cato
rs re
leas
ed o
n sc
hedu
le.
2) A
t lea
st 9
0% o
f oth
er
data
pro
duct
s fro
m k
ey
cens
uses
and
sur
veys
w
ere
rele
ased
on
sche
dule
1)10
0% o
f eco
nom
ic
indi
cato
rs w
ere
rele
ased
on
sch
edul
e.
2) A
t lea
st 9
0% o
f oth
er
data
pro
duct
s fro
m k
ey
cens
uses
and
sur
veys
w
ere
rele
ased
on
sche
dule
1)10
0% o
f eco
nom
ic
indi
cato
rs re
leas
ed o
n sc
hedu
le.
2) A
t lea
st 9
0% o
f oth
er d
ata
prod
ucts
from
key
cen
suse
s an
d su
rvey
s re
leas
ed o
n sc
hedu
le
1)10
0% o
f eco
nom
ic
indi
cato
rs re
leas
ed o
n sc
hedu
le.
2) A
t lea
st 9
0% o
f oth
er
data
pro
duct
s fro
m k
ey
cens
uses
and
sur
veys
re
leas
ed o
n sc
hedu
le
1)10
0% o
f eco
nom
ic
indi
cato
rs re
leas
ed o
n sc
hedu
le.
2) A
t lea
st 9
0% o
f oth
er d
ata
prod
ucts
from
key
cen
suse
s an
d su
rvey
s re
leas
ed o
n sc
hedu
le
Com
men
ts o
n C
hang
es to
Tar
gets
N
/A.
Impa
ct o
f Rec
over
y A
ct F
unds
N
o R
ecov
ery
Act
fund
s af
fect
this
mea
sure
.
Rel
evan
t Pro
gram
Cha
nges
Pr
ogra
m C
hang
es
Title
of P
rogr
am C
hang
e Pa
ge N
umbe
r 1)
Cur
rent
Dem
ogra
phic
Sta
tistic
s 2)
2010
Dec
enni
al C
ensu
s 1)
Cur
rent
Pop
ulat
ion
Sur
vey
initi
ativ
e 2)
Am
eric
an C
omm
unity
Sur
vey
initi
ativ
e 1)
CE
N-6
5 2)
CE
N-1
37
Valid
atio
n &
Ver
ifica
tion
Info
rmat
ion
Dat
a So
urce
R
epor
ting
Freq
uenc
y D
ata
Stor
age
Inte
rnal
Con
trol
Pr
oced
ures
D
ata
Lim
itatio
ns
Act
ions
to b
e Ta
ken
-
Act
ual d
ata
rele
ases
by
Cen
sus
Bur
eau
prog
ram
s.
The
frequ
ency
of
dat
a re
leas
es v
arie
s.
Rel
ease
dat
es a
re o
ften
publ
ishe
d in
adv
ance
.
Dat
a re
leas
e in
form
atio
n is
sto
red
in
Cen
sus
Bur
eau
syst
ems
and
publ
ic d
ata
rele
ases
.
Per
form
ance
dat
a ar
e ve
rifie
d by
co
mpa
ring
actu
al re
leas
e da
tes
with
sch
edul
ed
rele
ase
date
s.
Met
hodo
logi
cal s
tand
ards
fo
r sur
veys
are
pub
licly
re
porte
d.
Dat
a th
at a
re
rele
ased
mus
t adh
ere
to
Title
13
requ
irem
ents
to
prot
ect r
espo
nden
ts’
conf
iden
tialit
y.
Con
tinue
qua
rterly
re
view
s of
per
form
ance
dat
a.
CEN-18
Exhi
bit 3
A
Sect
ion
5 Ta
rget
s an
d Pe
rfor
man
ce S
umm
ary
Cen
sus
Bure
au S
trate
gic
Goa
l 2a:
Pro
vide
tim
ely,
rele
vant
, acc
urat
e an
d ac
cess
ible
cur
rent
mea
sure
s of
the
popu
latio
n, e
cono
my,
an
d go
vern
men
ts.
Mea
sure
2A
-3. M
eet o
r exc
eed
the
over
all F
eder
al s
core
of c
usto
mer
sat
isfa
ctio
n on
the
e-G
over
nmen
t Am
eric
an C
usto
mer
Sat
isfa
ctio
n In
dex
(AC
SI).
(Bef
ore
FY 2
008,
the
mea
sure
was
wor
ded
“Mee
t or e
xcee
d ov
eral
l Fed
eral
sco
re o
f cus
tom
er s
atis
fact
ion
on th
e A
mer
ican
C
usto
mer
Sat
isfa
ctio
n In
dex”
). (S
ame
as M
easu
re 2
B-2
)
Mea
sure
Des
crip
tion
The
AC
SI i
s a
surv
ey c
ondu
cted
sin
ce 1
994
by th
e U
nive
rsity
of M
ichi
gan
in c
oope
ratio
n w
ith o
ther
gro
ups.
It tr
acks
tren
ds in
cus
tom
er s
atis
fact
ion
and
prov
ides
ben
chm
arks
that
ca
n be
com
pare
d ac
ross
indu
strie
s an
d be
twee
n th
e pu
blic
and
priv
ate
sect
ors.
Fis
cal y
ear 2
008
was
the
benc
hmar
king
yea
r for
the
Cen
sus
Bur
eau'
s pa
rtici
patio
n in
this
e-
Gov
ernm
ent A
CS
I. B
ased
on
resp
onse
s to
the
form
er a
nnua
l AC
SI a
nd th
e C
ensu
s B
urea
u's
Cor
pora
te A
nnua
l Sur
vey
of W
eb S
ite V
isito
rs, t
he C
ensu
s B
urea
u st
rives
to m
eet o
r ex
ceed
the
aver
age
fede
ral g
over
nmen
t cus
tom
er s
atis
fact
ion
leve
ls a
nd w
ill id
entif
y an
d m
ake
itera
tive
adju
stm
ents
to p
roce
sses
or c
usto
m q
uest
ions
ask
ed to
focu
s on
im
prov
ing
over
all q
ualit
y an
d sa
tisfa
ctio
n. F
eder
al s
core
s fo
r FY
2010
and
FY
2011
can
not b
e de
term
ined
unt
il th
e su
rvey
resu
lts a
re re
leas
ed.
Targ
et a
nd P
erfo
rman
ce T
able
FY20
07 A
ctua
l FY
2008
Act
ual
FY20
09 A
ctua
l FY
2010
Tar
get
FY20
11 T
arge
t FY
2012
Tar
get
Orig
inal
Fun
ds
74%
sco
re o
n A
CS
I (m
et ta
rget
)
66%
(did
not
mee
t or
exc
eed
over
all f
eder
al
scor
e of
73
.9%
)
68%
(did
not
mee
t or
exc
eed
over
all f
eder
al
scor
e of
75
.2%
)
Mee
t or e
xcee
d
over
all f
eder
al s
core
M
eet o
r exc
eed
ov
eral
l fed
eral
sco
re
The
Cen
sus
Bur
eau
will
de
velo
p a
new
mea
sure
of
cust
omer
sat
isfa
ctio
n an
d im
plem
ent i
t in
FY 2
012.
At
that
tim
e, th
is m
easu
re w
ill b
e di
scon
tinue
d.
Com
men
ts o
n C
hang
es to
Tar
gets
N/A
.
Impa
ct o
f Rec
over
y A
ct F
unds
N
o R
ecov
ery
Act
fund
s af
fect
this
mea
sure
.
Rel
evan
t Pro
gram
Cha
nges
Ti
tle
Page
Num
ber
Non
e N
/A
N/A
Valid
atio
n &
Ver
ifica
tion
Info
rmat
ion
Dat
a So
urce
R
epor
ting
Freq
uenc
y D
ata
Stor
age
Inte
rnal
Con
trol
Pr
oced
ures
D
ata
Lim
itatio
ns
Act
ions
to b
e Ta
ken
-
Cen
sus
Bur
eau
data
use
rs
at S
tate
Dat
a C
ente
rs,
Bus
ines
s In
form
atio
n D
ata
Cen
ters
, Cen
sus
Info
rmat
ion
Cen
ters
, and
R
egio
nal F
eder
al
Dep
osito
ry L
ibra
ries.
Ann
ually
Prim
ary
stor
age
syst
em
is a
mai
nfra
me
com
pute
r at
the
Ros
s S
choo
l of
Bus
ines
s at
the
Uni
vers
ity o
f Mic
higa
n.
Dat
a ar
e co
llect
ed
elec
troni
cally
and
cro
ss
tabu
late
d. I
nter
view
ers
are
mon
itore
d w
ith
supe
rvis
ors
rand
omly
lis
teni
ng in
on
inte
rvie
ws.
Sam
ple
size
det
erm
ines
the
limits
of s
tate
men
ts th
at c
an
be m
ade
base
d on
the
data
. A
ll C
ensu
s B
urea
u-re
late
d A
CS
I rep
orts
are
car
eful
to
repo
rt co
nfid
ence
inte
rval
s.
Con
tinue
qua
rterly
revi
ews
of
perfo
rman
ce d
ata.
CEN-19
Ex
hibi
t 3A
Se
ctio
n 5
Targ
ets
and
Perf
orm
ance
Sum
mar
y C
ensu
s Bu
reau
Stra
tegi
c G
oal 2
b: P
rovi
de ti
mel
y, re
leva
nt, a
ccur
ate
and
acce
ssib
le b
ench
mar
k m
easu
res
of th
e po
pula
tion,
ec
onom
y, a
nd g
over
nmen
ts.
Mea
sure
2B
-1. C
ompl
ete
key
activ
ities
for c
yclic
al c
ensu
s pr
ogra
ms
on ti
me
to s
uppo
rt e
ffect
ive
deci
sion
-mak
ing
by p
olic
ymak
ers,
bu
sine
sses
, and
the
publ
ic a
nd m
eet c
onst
itutio
nal a
nd le
gisl
ativ
e m
anda
tes
Mea
sure
Des
crip
tion
Due
to th
e cy
clic
al n
atur
e of
thes
e pr
ogra
ms,
it is
impo
rtant
to tr
ack
annu
al k
ey a
ctiv
ities
that
sup
port
the
prog
ram
s. T
he in
tern
al a
ctiv
ities
that
are
trac
ked
are
thos
e co
nsid
ered
to b
e th
e m
ost i
mpo
rtant
in m
eetin
g th
e lo
ng-te
rm g
oals
of t
he c
yclic
al c
ensu
s pr
ogra
ms.
Targ
et a
nd P
erfo
rman
ce T
able
FY20
07 A
ctua
l FY
2008
Act
ual
FY20
09 A
ctua
l FY
2010
Tar
get
FY20
11 T
arge
t FY
2012
Tar
get
Orig
inal
Fun
ds
At l
east
90%
of k
ey
prep
arat
ory
act
iviti
es
wer
e co
mpl
eted
on
sch
edul
e
Som
e pl
anne
d D
ress
R
ehea
rsal
act
iviti
es
wer
e ca
ncel
led.
At l
east
90%
of k
ey
prep
arat
ory
act
iviti
es
wer
e co
mpl
eted
on
sch
edul
e
At l
east
90%
of k
ey
activ
ities
com
plet
ed
on s
ched
ule
At l
east
90%
of k
ey
activ
ities
com
plet
ed
on s
ched
ule
At l
east
90%
of k
ey
activ
ities
com
plet
ed
on s
ched
ule
Com
men
ts o
n C
hang
es to
Tar
gets
N
/A.
Impa
ct o
f Rec
over
y A
ct F
unds
W
hile
Rec
over
y A
ct fu
nds
affe
ct th
is m
easu
re, t
he e
ffect
of t
hose
fund
s is
on
parti
cula
r act
iviti
es w
ithin
the
2010
Cen
sus
in F
Y 20
09 a
nd
FY 2
010.
Thu
s, th
e ef
fect
s ar
e at
a lo
wer
leve
l tha
n w
ould
be
appa
rent
with
GP
RA
mea
sure
s. M
ost o
f the
Rec
over
y A
ct fu
nds
supp
ort e
arly
cen
sus
oper
atio
ns th
at w
ere
alre
ady
plan
ned
and
refle
cted
in th
e in
tern
al m
easu
res
supp
ortin
g th
is G
PR
A m
easu
re.
How
ever
, $25
0 m
illio
n su
ppor
ts e
nhan
cem
ents
to th
e C
ensu
s P
artn
ersh
ip
Pro
gram
, the
Adv
ertis
ing
Con
tract
, and
the
Cov
erag
e M
easu
rem
ent o
pera
tion.
Rel
evan
t Pro
gram
Cha
nges
Pr
ogra
m
Cha
nges
Ti
tle o
f Pro
gram
Cha
nge
Page
Num
ber
1) E
cono
mic
Cen
sus
2)
Cen
sus
of G
over
nmen
ts
3) 2
010
Dec
enni
al C
ensu
s P
rogr
am
4) 2
020
Dec
enni
al C
ensu
s
1) C
yclic
al p
rogr
am c
hang
e fo
r the
third
yea
r of t
he 2
012
Eco
nom
ic C
ensu
s C
ycle
.
2) C
yclic
al p
rogr
am c
hang
e fo
r the
third
yea
r of t
he 2
012
Cen
sus
of G
over
nmen
ts c
ycle
. 3)
Cyc
lical
pro
gram
cha
nge
asso
ciat
ed w
ith th
e 20
10 D
ecen
nial
Cen
sus
Pro
gram
. 4)
Cyc
lical
pro
gram
cha
nge
asso
ciat
ed w
ith th
e 20
20 D
ecen
nial
Cen
sus.
1)C
EN
-113
2)
CE
N-1
21
3)C
EN
-144
4)
CE
N-1
58
Valid
atio
n &
Ver
ifica
tion
Info
rmat
ion
Dat
a So
urce
R
epor
ting
Freq
uenc
y D
ata
Stor
age
Inte
rnal
Con
trol
Pr
oced
ures
D
ata
Lim
itatio
ns
Act
ions
to b
e Ta
ken
-
Act
ivity
sch
edul
es k
ept b
y ea
ch o
f the
cyc
lical
cen
sus
prog
ram
s.
Ong
oing
, bas
ed o
n ac
tivity
sc
hedu
les.
Th
e C
ensu
s B
urea
u pr
ogra
m o
ffice
s m
aint
ain
activ
ity s
ched
ules
and
pe
rform
ance
dat
a.
The
Cen
sus
Bur
eau
com
pare
s ac
tual
co
mpl
etio
n da
tes
with
sc
hedu
led
date
s.
Per
form
ance
dat
a ar
e re
view
ed q
uarte
rly.
Non
e C
ontin
ue q
uarte
rly re
view
s of
pe
rform
ance
dat
a.
CEN-20

Exhi
bit 3
A
Sect
ion
5 Ta
rget
s an
d Pe
rfor
man
ce S
umm
ary
Cen
sus
Bure
au S
trate
gic
Goa
l 2b:
Pro
vide
tim
ely,
rele
vant
, acc
urat
e an
d ac
cess
ible
ben
chm
ark
mea
sure
s of
the
popu
latio
n,
econ
omy,
and
gov
ernm
ents
. M
easu
re 2
B-2
. Mee
t or e
xcee
d th
e ov
eral
l Fed
eral
sco
re o
f cus
tom
er s
atis
fact
ion
on th
e e-
Gov
ernm
ent A
mer
ican
Cus
tom
er S
atis
fact
ion
Inde
x (A
CSI
). (B
efor
e FY
200
8, th
e m
easu
re w
as w
orde
d “M
eet o
r exc
eed
over
all F
eder
al s
core
of c
usto
mer
sat
isfa
ctio
n on
the
Am
eric
an
Cus
tom
er S
atis
fact
ion
Inde
x”).
(Sam
e as
Mea
sure
2A
-3)
Mea
sure
Des
crip
tion
The
AC
SI i
s a
surv
ey c
ondu
cted
sin
ce 1
994
by th
e U
nive
rsity
of M
ichi
gan
in c
oope
ratio
n w
ith o
ther
gro
ups.
It tr
acks
tren
ds in
cus
tom
er s
atis
fact
ion
and
prov
ides
ben
chm
arks
that
ca
n be
com
pare
d ac
ross
indu
strie
s an
d be
twee
n th
e pu
blic
and
priv
ate
sect
ors.
Fis
cal y
ear 2
008
was
the
benc
hmar
king
yea
r for
the
Cen
sus
Bur
eau'
s pa
rtici
patio
n in
this
e-
Gov
ernm
ent A
CS
I. B
ased
on
resp
onse
s to
the
form
er a
nnua
l AC
SI a
nd th
e C
ensu
s B
urea
u's
Cor
pora
te A
nnua
l Sur
vey
of W
eb S
ite V
isito
rs, t
he C
ensu
s B
urea
u st
rives
to m
eet o
r ex
ceed
the
aver
age
fede
ral g
over
nmen
t cus
tom
er s
atis
fact
ion
leve
ls a
nd w
ill id
entif
y an
d m
ake
itera
tive
adju
stm
ents
to p
roce
sses
or c
usto
m q
uest
ions
ask
ed to
focu
s on
im
prov
ing
over
all q
ualit
y an
d sa
tisfa
ctio
n. F
eder
al s
core
s fo
r FY
2010
and
FY
2011
can
not b
e de
term
ined
unt
il th
e su
rvey
resu
lts a
re re
leas
ed.
Targ
et a
nd P
erfo
rman
ce T
able
FY20
07 A
ctua
l FY
2008
Act
ual
FY20
09 A
ctua
l FY
2010
Tar
get
FY20
11 T
arge
t FY
2012
Tar
get
Orig
inal
Fun
ds
74%
sco
re o
n A
CS
I (m
et ta
rget
)
66%
(did
not
mee
t or
exc
eed
over
all f
eder
al
scor
e of
73
.9%
)
68%
(did
not
mee
t or
exc
eed
over
all f
eder
al
scor
e of
75
.2%
)
Mee
t or e
xcee
d
over
all f
eder
al s
core
M
eet o
r exc
eed
ov
eral
l fed
eral
sco
re
The
Cen
sus
Bur
eau
will
de
velo
p a
new
mea
sure
of
cust
omer
sat
isfa
ctio
n an
d im
plem
ent i
t in
FY 2
012.
At
that
tim
e, th
is m
easu
re w
ill b
e di
scon
tinue
d.
Com
men
ts o
n C
hang
es to
Tar
gets
N/A
.
Impa
ct o
f Rec
over
y A
ct F
unds
N
o R
ecov
ery
Act
fund
s af
fect
this
mea
sure
.
Rel
evan
t Pro
gram
Cha
nges
Ti
tle
Page
Num
ber
Non
e N
/A
N/A
Valid
atio
n &
Ver
ifica
tion
Info
rmat
ion
Dat
a So
urce
R
epor
ting
Freq
uenc
y D
ata
Stor
age
Inte
rnal
Con
trol
Pr
oced
ures
D
ata
Lim
itatio
ns
Act
ions
to b
e Ta
ken
-
Cen
sus
Bur
eau
data
use
rs
at S
tate
Dat
a C
ente
rs,
Bus
ines
s In
form
atio
n D
ata
Cen
ters
, Cen
sus
Info
rmat
ion
Cen
ters
, and
R
egio
nal F
eder
al
Dep
osito
ry L
ibra
ries.
Ann
ually
Prim
ary
stor
age
syst
em
is a
mai
nfra
me
com
pute
r at
the
Ros
s S
choo
l of
Bus
ines
s at
the
Uni
vers
ity o
f Mic
higa
n.
Dat
a ar
e co
llect
ed
elec
troni
cally
and
cro
ss
tabu
late
d. I
nter
view
ers
are
mon
itore
d w
ith
supe
rvis
ors
rand
omly
lis
teni
ng in
on
inte
rvie
ws.
Sam
ple
size
det
erm
ines
the
limits
of s
tate
men
ts th
at c
an
be m
ade
base
d on
the
data
. A
ll C
ensu
s B
urea
u-re
late
d A
CS
I rep
orts
are
car
eful
to
repo
rt co
nfid
ence
inte
rval
s.
Con
tinue
qua
rterly
revi
ews
of
perfo
rman
ce d
ata.
CEN-21

Exhi
bit 3
A
Sect
ion
5 Ta
rget
s an
d Pe
rfor
man
ce S
umm
ary
Cen
sus
Bure
au S
trate
gic
Goa
l 2b:
Pro
vide
tim
ely,
rele
vant
, acc
urat
e an
d ac
cess
ible
ben
chm
ark
mea
sure
s of
the
popu
latio
n, e
cono
my,
and
gov
ernm
ents
. M
easu
re 2
B-3
(Thr
ough
FY
2010
). C
orre
ct s
tree
t fea
ture
s in
TIG
ER (g
eogr
aphi
c) d
atab
ase
to m
ore
effe
ctiv
ely
supp
ort C
ensu
s B
urea
u ce
nsus
es a
nd s
urve
ys, a
nd fa
cilit
ate
the
geog
raph
ic p
artn
ersh
ips
betw
een
Fede
ral,
stat
e, lo
cal,
and
trib
al g
over
nmen
ts.
Mea
sure
Des
crip
tion
Cor
rect
ly lo
catin
g ev
ery
stre
et in
the
Mas
ter A
ddre
ss F
ile a
nd g
eogr
aphi
c da
taba
se (M
AF/
TIG
ER
) is
inte
gral
to p
rovi
ding
geo
grap
hic
prod
ucts
and
ser
vice
s th
at m
eet t
he
accu
racy
exp
ecta
tions
of t
he 2
010
Cen
sus
field
dat
a co
llect
ion
staf
f, th
e C
ensu
s B
urea
u’s
data
pro
duct
cus
tom
ers,
and
the
need
s of
the
U.S
. Geo
logi
cal S
urve
y/Th
e N
atio
nal M
ap. M
any
loca
l and
trib
al g
over
nmen
ts th
at p
artic
ipat
ed in
the
Cen
sus
2000
geo
grap
hic
partn
ersh
ip p
rogr
ams
and
man
y po
tent
ial c
usto
mer
s fo
r MA
F/TI
GE
R
geog
raph
ic p
rodu
cts
have
indi
cate
d th
at th
ey w
ould
not
con
side
r fut
ure
geog
raph
ic p
artn
ersh
ips
or u
se w
ithou
t sub
stan
tial i
mpr
ovem
ents
in lo
catio
n ac
cura
cy.
Targ
et a
nd P
erfo
rman
ce T
able
FY20
07 A
ctua
l FY
2008
Act
ual
FY20
09 A
ctua
l FY
2010
Tar
get
FY20
11 T
arge
t FY
2012
Tar
get
Orig
inal
Fun
ds
737
coun
ties
wer
e co
mpl
eted
32
0 co
untie
s w
ere
com
plet
ed
Com
plet
ed u
pdat
es to
el
igib
le c
ount
ies
in th
e
U.S
., P
uerto
Ric
o, a
nd
Isla
nd A
reas
Incr
ease
TIG
ER
upd
ate
subm
issi
ons
el
ectro
nica
lly b
y 10
%
N/A
N
/A
Impa
ct o
f Rec
over
y A
ct F
unds
N
o R
ecov
ery
Act
fund
s af
fect
this
mea
sure
.
Rel
evan
t Pro
gram
Cha
nges
Ti
tle
Page
Num
ber
2010
Dec
enni
al C
ensu
s P
rogr
am
Cyc
lical
pro
gram
cha
nge
asso
ciat
ed w
ith re
engi
neer
ing
the
2010
Dec
enni
al C
ensu
s P
rogr
am.
CE
N-1
44
Valid
atio
n &
Ver
ifica
tion
Info
rmat
ion
Dat
a So
urce
R
epor
ting
Freq
uenc
y D
ata
Stor
age
Inte
rnal
Con
trol
Pr
oced
ures
D
ata
Lim
itatio
ns
Act
ions
to b
e Ta
ken
- M
AF/
TIG
ER
act
ivity
sch
edul
e A
s sc
hedu
led
Cen
sus
Bur
eau
MA
F/TI
GE
R d
atab
ase.
Cen
sus
Bur
eau
com
pare
s ac
tual
com
plet
ion
date
s w
ith s
ched
uled
dat
es.
Non
e C
ontin
ue q
uarte
rly
revi
ews
of p
erfo
rman
ce
data
.
CEN-22

Ex
hibi
t 3A
Se
ctio
n 6
2012
Pro
gram
Cha
nges
(o
blig
atio
ns in
thou
sand
s)
Pr
ogra
m
Cha
nges
Pr
ogra
m N
ame
Acco
mpa
nyin
g AP
P Pa
ge N
o.
GPR
A Pe
rfor
man
ce
Mea
sure
Nam
e an
d N
umbe
r B
ase
FTEs
B
ase
Amou
nt
Incr
ease
/Dec
reas
e FT
Es
Incr
ease
/Dec
reas
e Am
ount
Pa
ge N
o.
C
urre
nt E
cono
mic
S
tatis
tics
N/A
N
/A
1,25
9 $1
85,7
07
-26
-$3,
779
CE
N-4
7
C
urre
nt D
emog
raph
ic
Sta
tistic
s N
/A
N/A
73
5 78
,396
-2
3 12
8 C
EN
-65
S
urve
y D
evel
opm
ent
and
Dat
a S
ervi
ces
N/A
N
/A
31
5,53
5 16
6,
067
CE
N-7
9
E
cono
mic
Cen
sus
TBD
2B
-1
601
113,
503
61
10,7
89
CE
N-1
13
C
ensu
s of
G
over
nmen
ts
TBD
2B
-1
61
8,20
6 17
2,
265
CE
N-1
21
In
terc
ensa
l D
emog
raph
ic
Est
imat
es
N/A
2A
-2
71
10,6
03
0 -5
11
CE
N-1
34
20
10 D
ecen
nial
C
ensu
s P
rogr
am
TBD
2A
-1, 2
B-1
5,
572
716,
638
-2,1
16
-285
,782
C
EN
-137
20
20 D
ecen
nial
C
ensu
s TB
D
2B-1
0
$0
284
67,0
00
CE
N-1
58
D
emog
raph
ic
Sur
veys
Sam
ple
Red
esig
n N
/A
N/A
71
11
,772
-9
-1
,939
C
EN
-175
G
eogr
aphi
c S
uppo
rt N
/A
N/A
36
2 69
,163
-1
-1
,428
C
EN
-182
D
ata
Pro
cess
ing
Sys
tem
s N
/A
N/A
0
35,7
50
0 -3
,318
C
EN
-186
CEN-23
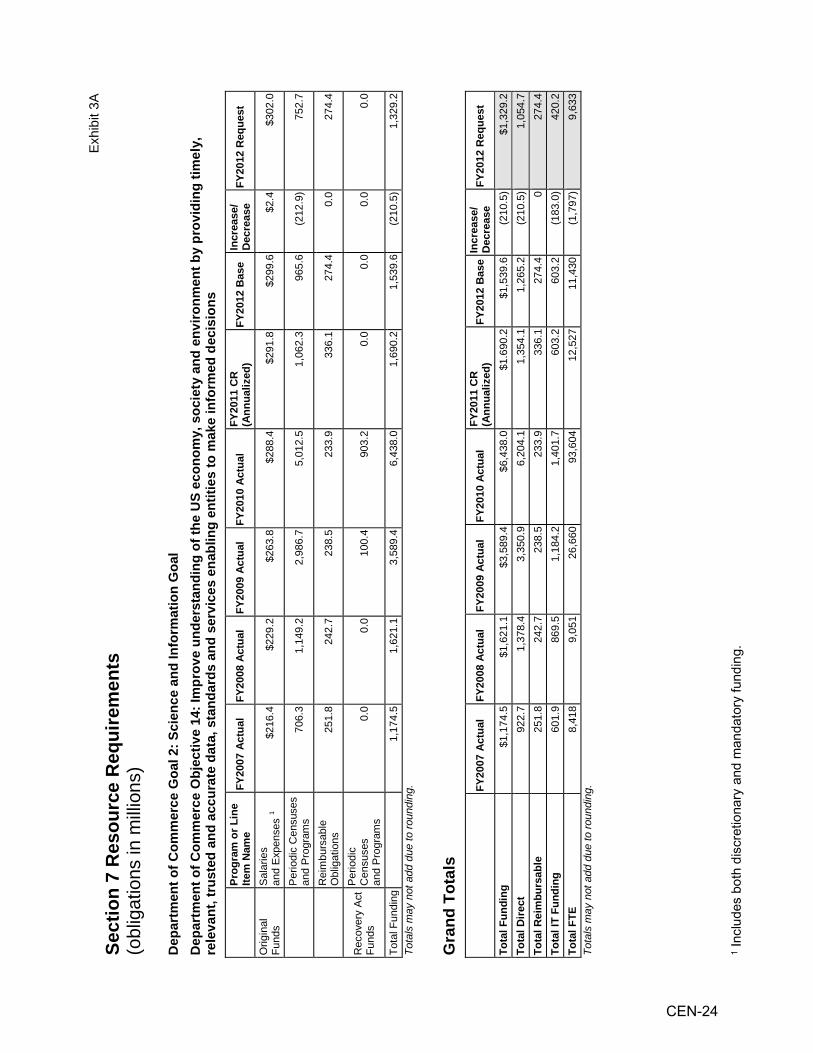
Exhi
bit 3
A
Sect
ion
7 R
esou
rce
Req
uire
men
ts
(obl
igat
ions
in m
illio
ns)
Dep
artm
ent o
f Com
mer
ce G
oal 2
: Sci
ence
and
Info
rmat
ion
Goa
l D
epar
tmen
t of C
omm
erce
Obj
ectiv
e 14
: Im
prov
e un
ders
tand
ing
of th
e U
S ec
onom
y, s
ocie
ty a
nd e
nviro
nmen
t by
prov
idin
g tim
ely,
re
leva
nt, t
rust
ed a
nd a
ccur
ate
data
, sta
ndar
ds a
nd s
ervi
ces
enab
ling
entit
ies
to m
ake
info
rmed
dec
isio
ns
Pr
ogra
m o
r Lin
e Ite
m N
ame
FY20
07 A
ctua
l FY
2008
Act
ual
FY20
09 A
ctua
l FY
2010
Act
ual
FY20
11 C
R
(Ann
ualiz
ed)
FY20
12 B
ase
Incr
ease
/ D
ecre
ase
FY20
12 R
eque
st
Orig
inal
Fu
nds
Sal
arie
s
and
Exp
ense
s 1
$216
.4
$2
29.2
$2
63.8
$2
88.4
$2
91.8
$2
99.6
$2
.4
$302
.0
P
erio
dic
Cen
suse
s
and
Pro
gram
s 70
6.3
1,14
9.2
2,98
6.7
5,01
2.5
1,06
2.3
965.
6 (2
12.9
) 75
2.7
R
eim
burs
able
O
blig
atio
ns
251.
8 24
2.7
238.
5 23
3.9
336.
1 27
4.4
0.0
274.
4
Rec
over
y A
ct
Fund
s
Per
iodi
c
Cen
suse
s
and
Pro
gram
s
0.0
0.0
100.
4 90
3.2
0.0
0.0
0.0
0.0
Tota
l Fun
ding
1,
174.
5 1,
621.
1 3,
589.
4 6,
438.
0 1,
690.
2 1,
539.
6 (2
10.5
) 1,
329.
2 To
tals
may
not
add
due
to ro
undi
ng.
Gra
nd T
otal
s
FY
2007
Act
ual
FY20
08 A
ctua
l FY
2009
Act
ual
FY20
10 A
ctua
l FY
2011
CR
(A
nnua
lized
) FY
2012
Bas
e In
crea
se/
Dec
reas
e FY
2012
Req
uest
Tota
l Fun
ding
$1
,174
.5
$1,6
21.1
$3
,589
.4
$6,4
38.0
$1
.690
.2
$1,5
39.6
(2
10.5
) $1
,329
.2
Tota
l Dire
ct
922.
7 1,
378.
4 3,
350.
9 6,
204.
1 1,
354.
1 1,
265.
2 (2
10.5
) 1,
054.
7 To
tal R
eim
burs
able
25
1.8
242.
7 23
8.5
233.
9 33
6.1
274.
4 0
274.
4 To
tal I
T Fu
ndin
g 60
1.9
869.
5 1,
184.
2 1,
401.
7 60
3.2
603.
2 (1
83.0
) 42
0.2
Tota
l FTE
8,
418
9,05
1 26
,660
93
,604
12
,527
11
,430
(1
,797
) 9,
633
Tota
ls m
ay n
ot a
dd d
ue to
roun
ding
. 1 I
nclu
des
both
dis
cret
iona
ry a
nd m
anda
tory
fund
ing.
CEN-24

Dep
artm
ent o
f Com
mer
ceU
.S. C
ensu
s Bu
reau
Sal
arie
s an
d E
xpen
ses
- Dis
cret
iona
ry B
AS
UM
MA
RY
OF
RE
SO
UR
CE
RE
QU
IRE
ME
NTS
(Dol
lar a
mou
nts
in th
ousa
nds)
Exh
ibit
5
Pag
e
N
o.P
ositi
ons
Bud
get
Aut
horit
yFT
ED
irect
O
blig
atio
ns20
11 A
nnua
lized
CR
Lev
el1,
536
$2
59,0
242,
024
$2
59,0
24FT
E /
posi
tions
real
ignm
ent
148
01
0le
ss:
Obl
igat
ions
from
prio
r yea
rsle
ss:
Uno
blig
ated
bal
ance
, sta
rt of
yea
rC
EN
-28
plus
: 20
12 A
djus
tmen
ts to
bas
e0
10,6
14
0
10,6
14
2012
Bas
e R
eque
st1,
684
26
9,63
8
2,02
5
269,
638
Less
Adm
inis
trativ
e S
avin
gs(5
)
(661
)
(6)
(6
61)
Plu
s (o
r les
s): 2
012
Pro
gram
Cha
nges
35
3,07
7
(27)
3,
077
2012
Est
imat
e1,
714
27
2,05
4
1,99
2
272,
054
Com
paris
on b
y ac
tivity
/sub
activ
ityC
urre
nt S
urve
ys a
nd S
tatis
tics
Per
sonn
elA
mou
ntP
erso
nnel
Am
ount
Per
sonn
elA
mou
ntP
erso
nnel
Am
ount
Per
sonn
elA
mou
nt
CE
N-3
2C
urre
nt e
cono
mic
sta
tistic
sP
os./B
A72
7$1
79,2
171,
181
$179
,217
1,28
5$1
85,7
071,
266
$181
,928
(19)
($3,
779)
FTE
/Obl
.1,
196
179,
013
1,27
017
9,21
71,
259
185,
707
1,23
318
1,92
8(2
6)(3
,779
)
CE
N-3
3C
urre
nt d
emog
raph
ic s
tatis
tics
Pos
./BA
203
75,8
2132
475
,821
370
78,3
9639
278
,524
2212
8FT
E/O
bl.
628
75,6
6272
675
,821
735
78,3
9671
278
,524
(23)
128
CE
N-3
4S
urve
y de
velo
pmen
t and
dat
a se
rvic
esP
os./B
A15
3,98
631
3,98
629
5,53
556
11,6
0227
6,06
7FT
E/O
bl.
243,
915
283,
986
315,
535
4711
,602
166,
067
Incr
ease
/ (D
ecre
ase)
ov
er B
ase
2010
Act
ual
2011
CR
(Ann
ualiz
ed)
2012
Bas
e20
12E
stim
ate
TOTA
LSP
os./B
A94
525
9,02
41,
536
259,
024
1,68
426
9,63
81,
714
272,
054
302,
416
FTE
/Obl
.1,
848
258,
590
2,02
425
9,02
42,
025
269,
638
1,99
227
2,05
4(3
3)2,
416
Adj
ustm
ents
to O
blig
atio
ns:
R
ecov
erie
s0
00
00
U
nobl
igat
ed b
alan
ce, s
tart
of y
ear
00
00
0
Uno
blig
ated
bal
ance
, exp
iring
434
00
00
U
nobl
igat
ed b
alan
ce, e
nd o
f yea
r0
00
00
R
efun
d0
00
00
Fina
ncin
g fro
m tr
ansf
ers:
T
rans
fer f
rom
oth
er a
ccou
nts
00
00
0
Tra
nsfe
r to
othe
r acc
ount
s0
00
00
Sub
tota
l, A
ppro
pria
tion
Pos
.94
525
9,02
41,
536
259,
024
1,68
426
9,63
81,
714
272,
054
302,
416
CEN-25

Dep
artm
ent o
f Com
mer
ceU
.S. C
ensu
s B
urea
uS
alar
ies
and
Exp
ense
s - M
anda
tory
BA
SU
MM
AR
Y O
F R
ES
OU
RC
E R
EQ
UIR
EM
EN
TS(D
olla
r am
ount
s in
thou
sand
s)
Exh
ibit
5
Page
N
o.Po
sitio
nsBu
dget
Au
thor
ityFT
ED
irect
O
blig
atio
ns20
11 E
nact
ed12
1
$30,
000
297
$3
2,76
1FT
E / p
ositi
ons
real
ignm
ent
21
0
(23)
0
less
: O
blig
atio
ns fr
om p
rior y
ears
less
: U
nobl
igat
ed b
alan
ce, s
tart
of y
ear
plus
: 20
12 A
djus
tmen
ts to
bas
e0
00
0
2012
Bas
e R
eque
st14
2
30,0
00
27
4
32,7
61
Plus
(or l
ess)
: 201
2 Pr
ogra
m C
hang
es0
00
0
2012
Est
imat
e14
2
30,0
00
27
4
32,7
61
Com
paris
on b
y ac
tivity
/sub
activ
ity
Pers
onne
lAm
ount
Pers
onne
lAm
ount
Pers
onne
lAm
ount
Pers
onne
lAm
ount
Pers
onne
lAm
ount
CEN
-89
Surv
ey o
f pro
gram
dyn
amic
s Po
s./B
A33
$10,
000
58$1
0,00
057
$10,
000
57$1
0,00
00
$0FT
E/O
bl.
559,
844
6110
,000
5710
,000
5710
,000
00
CEN
-91
Stat
e ch
ildre
n's
heal
th in
sura
nce
prog
ram
Pos.
/BA
5420
,000
6320
,000
8520
,000
8520
,000
00
FTE/
Obl
.22
520
,000
236
22,7
6121
720
,000
217
20,0
000
0
Incr
ease
/ (D
ecre
ase)
ov
er B
ase
2010
Actu
al20
11En
acte
d20
12Ba
se20
12En
acte
d
FTE/
Obl
.22
520
,000
236
22,7
6121
720
,000
217
20,0
000
0
TOTA
LSPo
s./B
A87
30,0
0012
130
,000
142
30,0
0014
230
,000
00
FTE/
Obl
.28
029
,844
297
32,7
6127
430
,000
274
30,0
000
0Ad
just
men
ts to
Obl
igat
ions
:
Rec
over
ies
00
00
0
Uno
blig
ated
bal
ance
, sta
rt of
yea
r(2
,761
)(2
,761
)0
00
U
nobl
igat
ed b
alan
ce, e
xpiri
ng15
60
00
0
Uno
blig
ated
bal
ance
, end
of y
ear
2,76
10
00
0
Ref
und
00
00
0
Fina
ncin
g fro
m tr
ansf
ers:
T
rans
fers
from
oth
er a
ccou
nts
00
00
0
Tra
nsfe
rs to
oth
er a
ccou
nts
00
00
0
Subt
otal
, App
ropr
iatio
nPo
s.87
30,0
0012
130
,000
142
30,0
0014
230
,000
00
CEN-26

Dep
artm
ent o
f Com
mer
ceU
.S. C
ensu
s B
urea
uS
alar
ies
and
Exp
ense
s S
UM
MA
RY
OF
FIN
AN
CIN
G(D
olla
r am
ount
s in
thou
sand
s)
Exh
ibit
7
2010
Act
ual
2011
CR
(Ann
ualiz
ed)
2012
Bas
e20
12E
stim
ate
Incr
ease
/ (D
ecre
ase)
ov
er B
ase
Am
ount
Am
ount
Am
ount
Am
ount
Am
ount
Tota
l Obl
igat
ions
$288
,434
$291
,785
$299
,638
$302
,054
$2,4
16
Fina
ncin
g: O
ffset
ting
colle
ctio
ns fr
om:
F
eder
al F
unds
00
00
0
Non
-Fed
eral
sou
rces
00
00
0
Man
dato
ry fu
nds
(30,
000)
(30,
000)
(30,
000)
(30,
000)
0
Rec
over
ies
00
00
0U
nobl
igat
ed b
alan
ce, s
tart
of y
ear
(2,7
61)
(2,7
61)
00
0U
nobl
igat
edba
lanc
etra
nsfe
rred
00
00
0U
nobl
igat
ed b
alan
ce, t
rans
ferre
d0
00
00
Uno
blig
ated
bal
ance
, exp
iring
590
00
00
Uno
blig
ated
bal
ance
, end
of y
ear
2,76
10
00
0R
efun
d0
00
00
Dis
cret
iona
ry B
udge
t Aut
horit
y25
9,02
425
9,02
426
9,63
827
2,05
42,
416
Fina
ncin
g:
Tra
nsfe
r fro
m o
ther
acc
ount
s0
00
00
T
rans
fer t
o ot
her a
ccou
nts
00
00
0
Tota
l, D
iscr
etio
nary
App
ropr
iatio
n25
9,02
425
9,02
426
9,63
827
2,05
42,
416
CEN-27

Exh
ibit
9
Adj
ustm
ents
:FT
EA
mou
nt
0$5
,499
Oth
er C
hang
es:
0(2
85)
($28
5,39
0)
675,
423
960,
813
(285
,390
)
047
7
$477
,009
14,7
71,3
79
14,2
94,3
70
47
7,00
9
Civ
il S
ervi
ce R
etire
men
t Sys
tem
(CS
RS
)……
……
……
……
……
……
……
……
……
..……
……
…...
……
.……
……
……
……
……
……
……
…
This
will
resu
lt in
a d
ecre
ase
of:
The
estim
ated
per
cent
age
of p
ayro
ll fo
r em
ploy
ees
cove
red
by F
ER
S w
ill in
crea
se fr
om 8
9.9%
in F
Y 20
11 to
92.
9% in
FY
201
2. T
he a
genc
y co
ntrib
utio
n ra
te w
ill re
mai
n 11
.7%
in F
Y 20
12.
This
will
resu
lt in
an
incr
ease
of:
Reg
ular
em
ploy
ees:
The
estim
ated
per
cent
age
of p
ayro
ll fo
r em
ploy
ees
cove
red
by C
SR
S w
ill d
ecre
ase
from
10.
1% in
FY
2011
to 7
.1%
in
FY 2
012.
The
age
ncy
cont
ribut
ion
rate
will
rem
ain
7.0%
in F
Y 20
12.
(Dol
lar a
mou
nts
in th
ousa
nds)
Res
tora
tion
of F
Y 20
11…
……
……
……
……
……
……
……
……
……
……
……
……
……
……
……
……
…..…
……
……
……
……
……
……
…...
Dep
artm
ent o
f Com
mer
ceU
.S. C
ensu
s B
urea
uS
alar
ies
and
Exp
ense
sJU
STI
FIC
ATI
ON
OF
AD
JUS
TME
NTS
TO
BA
SE
2012
$1
35,9
00,0
00 x
7.1
% x
7.0
%…
……
…..…
……
……
……
……
..……
……
……
……
2011
$1
35,9
00,0
00 x
10.
1% x
7.0
%…
……
....…
……
……
……
……
..……
……
……
……
Fede
ral E
mpl
oyee
s' R
etire
men
t Sys
tem
(FE
RS
)……
……
….…
……
……
……
……
……
.…...
……
……
……
.……
……
……
…...
……
.……
……
Reg
ular
em
ploy
ees:
Tota
l, ad
just
men
t-to-
base
……
……
……
….…
..……
……
...…
……
……
……
……
……
……
2012
$1
35,9
00,0
00 x
92.
9% x
11.
7%…
……
….…
.……
..……
……
……
……
…..…
……
…20
11
$135
,900
,000
x 8
9.9%
x 1
1.7%
……
.....…
……
……
……
……
..……
……
……
……
…To
tal,
adju
stm
ent-t
o-ba
se…
...…
……
……
…...
..……
..……
……
……
……
……
……
……
…
CEN-28

Oth
er C
hang
es:
FTE
Am
ount
0$5
05
$505
,140
4,29
2,53
7
3,78
7,39
7
50
5,14
0
023
7
$237
,194
7,69
4,50
0
7,46
8,74
7
22
5,75
3
38
9,93
4
37
8,49
3
11,4
41
237,
194
Thrif
t Sav
ings
Pla
n (T
SP
)……
……
……
……
……
……
……
..……
……
……
…..…
…...
……
……
……
..……
……
……
……
……
……
……
……
…
The
estim
ated
age
ncy
cont
ribut
ion
rate
for t
he T
hrift
Sav
ings
Pla
n w
ill in
crea
se fr
om 3
.1%
in F
Y 20
11 to
3.4
% in
FY
201
2. F
ER
S p
artic
ipat
ion
rate
s w
ill in
crea
se fr
om 8
9.9%
to 9
2.9%
in F
Y 20
12.
This
will
resu
lt in
an
incr
ease
of:
Reg
ular
em
ploy
ees:
2012
$
135,
900,
000
x 92
.9%
x 3
.4%
……
……
.…...
……
……
……
…..…
……
……
……
…20
11
$13
5,90
0,00
0 x
89.9
% x
3.1
%…
……
….…
.……
…..…
……
…..…
……
……
……
…
S
ubto
tal…
……
……
……
……
….…
……
……
...…
..……
……
……
.……
……
……
……
……
Tota
l, ad
just
men
t-to-
base
……
……
…..…
……
…...
.….…
……
..……
……
……
……
……
……
Fede
ral I
nsur
ance
Con
tribu
tions
Act
(FIC
A)…
……
……
……
……
……
……
……
……
……
……
…...
…...
……
……
…...
……
...…
….…
……
……
This
will
resu
lt in
a in
crea
se o
f:
As
the
perc
enta
ge o
f pay
roll
cove
red
by F
ER
S in
crea
ses,
the
cost
of O
AS
DI c
ontri
butio
ns w
ill d
ecre
ase.
The
ove
rall
perc
enta
ge o
f sal
arie
s co
vere
d by
OA
SD
I will
dec
reas
e to
98.
3% in
FY
2012
from
98.
6% in
FY
2011
. Th
e O
AS
DI t
ax
rate
will
rem
ain
6.2%
in F
Y 20
12.
Reg
ular
em
ploy
ees:
2012
$
135,
900,
000
x92.
9% x
98.
3% x
6.2
%…
……
.……
….…
.….…
……
……
……
……
2011
$
135,
900,
000
x 89
.9%
x 9
8.6%
x 6
.2%
……
…..…
……
……
.……
……
……
……
…
Sub
tota
l……
……
……
……
……
……
….…
…..…
……
……
..……
……
……
……
……
……
Oth
er s
alar
ies:
2012
$6
,887
,000
x 9
2.9%
x 9
8.3%
x 6
.2%
….…
.……
……
……
….…
……
……
……
……
2011
$6
,887
,000
x 8
9.9%
x 9
8.6%
x 6
.2%
……
..……
……
……
….…
……
……
……
……
Tota
l, ad
just
men
t-to-
base
……
….…
……
……
…...
……
..……
……
……
……
……
……
……
CEN-29
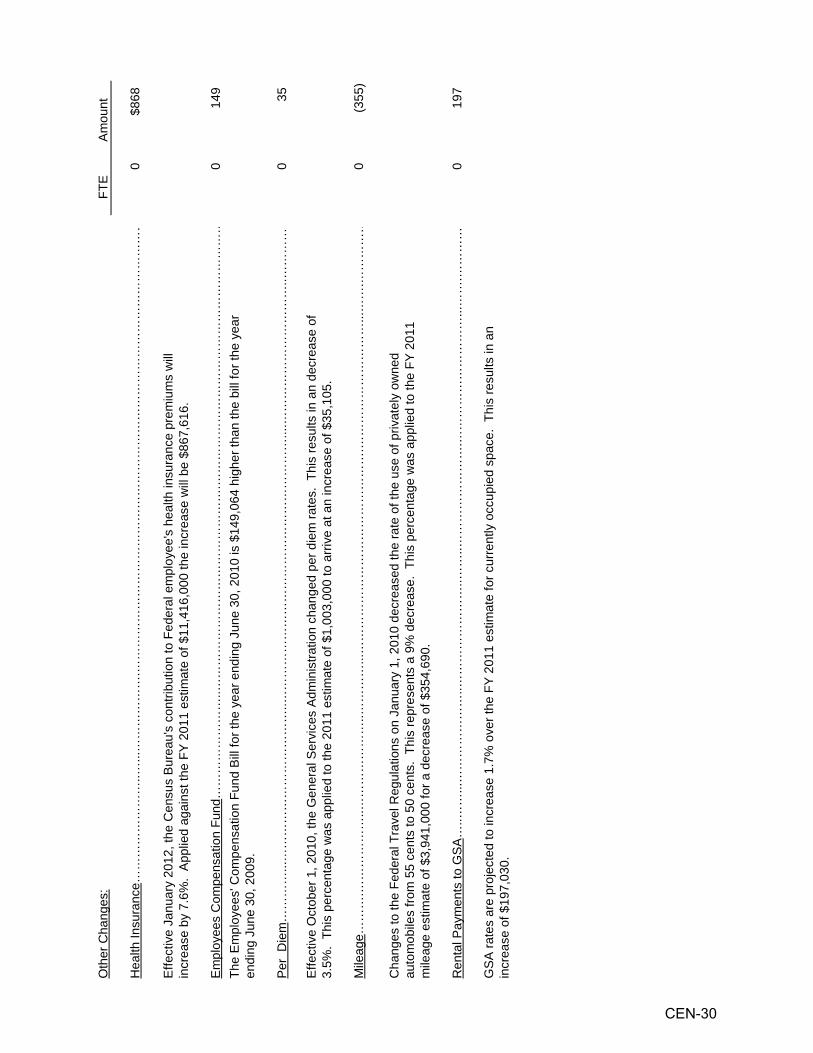
Oth
er C
hang
es:
FTE
Am
ount
0$8
68
014
9
035
0(3
55)
019
7
Per
Die
m…
……
…...
……
……
……
……
……
……
..……
……
……
……
……
……
……
……
……
……
…...
.……
……
……
……
……
…..…
……
…
GS
A ra
tes
are
proj
ecte
d to
incr
ease
1.7
% o
ver t
he F
Y 20
11 e
stim
ate
for c
urre
ntly
occ
upie
d sp
ace.
Thi
s re
sults
in a
n in
crea
se o
f $19
7,03
0.
Effe
ctiv
e O
ctob
er 1
, 201
0, th
e G
ener
al S
ervi
ces
Adm
inis
tratio
n ch
ange
d pe
r die
m ra
tes.
Thi
s re
sults
in a
n de
crea
se o
f 3.
5%.
This
per
cent
age
was
app
lied
to th
e 20
11 e
stim
ate
of $
1,00
3,00
0 to
arri
ve a
t an
incr
ease
of $
35,1
05.
Mile
age…
……
.……
……
……
..……
……
……
…..…
……
…...
……
……
……
……
……
……
……
……
.……
……
……
……
……
...…
….…
……
……
Cha
nges
to th
e Fe
dera
l Tra
vel R
egul
atio
ns o
n Ja
nuar
y 1,
201
0 de
crea
sed
the
rate
of t
he u
se o
f priv
atel
y ow
ned
auto
mob
iles
from
55
cent
s to
50
cent
s. T
his
repr
esen
ts a
9%
dec
reas
e. T
his
perc
enta
ge w
as a
pplie
d to
the
FY 2
011
mile
age
estim
ate
of $
3,94
1,00
0 fo
r a d
ecre
ase
of $
354,
690.
Ren
tal P
aym
ents
to G
SA
…..…
…...
……
……
……
…..…
……
……
……
…..…
…..…
……
……
……
….…
……
……
……
……
…...
……
.……
……
The
Em
ploy
ees'
Com
pens
atio
n Fu
nd B
ill fo
r the
yea
r end
ing
June
30,
201
0 is
$14
9,06
4 hi
gher
than
the
bill
for t
he y
ear
endi
ng J
une
30, 2
009.
Hea
lth In
sura
nce…
……
……
……
…..…
...…
……
……
….…
……
……
……
……
……
……
……
……
……
……
……
……
……
……
……
……
……
…
Effe
ctiv
e Ja
nuar
y 20
12, t
he C
ensu
s B
urea
u's
cont
ribut
ion
to F
eder
al e
mpl
oyee
's h
ealth
insu
ranc
e pr
emiu
ms
will
in
crea
se b
y 7.
6%.
App
lied
agai
nst t
he F
Y 20
11 e
stim
ate
of $
11,4
16,0
00 th
e in
crea
se w
ill b
e $8
67,6
16.
Em
ploy
ees
Com
pens
atio
n Fu
nd…
……
……
……
…..…
……
……
……
……
……
……
……
….…
……
……
……
……
……
……
……
……
……
……
CEN-30

Oth
er C
hang
es:
FTE
Am
ount
0$1
3
0(4
)
031
4
011
8
02,
846
17,0
67
18,9
60
2,
713,
548
33,1
32
62,8
08
05,
115
010
,614
010
,614
Sub
tota
l, ot
her c
hang
es…
……
……
.……
……
……
……
……
……
….…
……
……
……
……
……
……
……
……
……
……
……
……
……
……
……
Sub
tota
l, ad
just
men
ts to
bas
e……
……
……
……
……
……
……
……
……
……
.……
……
……
……
……
……
……
……
……
……
……
……
……
…
Sup
plie
s an
d m
ater
ials
……
……
……
……
...…
….…
...…
…..…
……
….…
……
……
……
……
Tota
l, ad
just
men
ts to
bas
e……
……
……
……
……
……
……
……
……
.……
……
……
……
……
……
……
……
……
……
……
……
……
……
……
Equ
ipm
ent…
…..…
.……
..…..…
……
……
……
……
……
……
……
……
……
……
……
……
…
Oth
er S
ervi
ces…
……
……
……
….…
……
…..…
……
...…
……
……
……
……
..……
……
……
GP
O P
rintin
g……
……
......
..….…
……
……
……
……
….…
……
……
……
……
..……
……
.……
……
……
……
……
...…
….…
……
……
……
……
GP
O h
as p
rovi
ded
an e
stim
ated
rate
incr
ease
of 1
.2%
. Th
is p
erce
ntag
e w
as a
pplie
d to
the
FY 2
011
estim
ate
of
$1,0
55,0
00 to
arri
ve a
t an
incr
ease
of $
12,6
60.
Com
mer
ce B
usin
ess
Sys
tem
….…
……
……
……
……
……
……
……
……
……
……
……
……
...…
……
……
……
……
……
……
……
……
……
…
Com
mun
icat
ions
, util
ities
, and
mis
cella
neou
s ch
arge
s (e
xclu
ding
pos
tage
)……
.……
…
Nat
iona
l Arc
hive
s an
d R
ecor
ds A
dmin
istra
tion…
……
……
……
……
……
……
……
……
……
…..…
..……
……
……
……
...…
….…
……
……
…
Sto
rage
and
mai
nten
ance
cos
ts o
f rec
ords
at t
he N
atio
nal A
rchi
ves
and
Rec
ords
Adm
inis
tratio
n (N
AR
A) w
ere
decr
ease
d by
$4,
000.
Wor
king
Cap
ital F
und…
……
……
……
……
……
...…
……
……
……
……
……
……
……
……
……
......
…..…
……
……
..……
……
……
……
...…
…
An
addi
tiona
l $31
4,00
0 is
requ
ired
to fu
nd a
cos
t inc
reas
e in
the
Dep
artm
ent o
f Com
mer
ce's
Wor
king
Cap
ital F
und.
The
cost
of C
ensu
s B
urea
u pa
rtici
patio
n in
the
Dep
artm
ent-w
ide
Com
mer
ce B
usin
ess
Sys
tem
(CB
S) w
as in
crea
sed
by
$118
,000
.
Gen
eral
Pric
ing
Leve
l Adj
ustm
ent…
……
……
……
……
…...
……
……
……
.……
……
......
….…
……
……
..……
……
……
……
...…
….…
……
…
This
requ
est a
pplie
s O
MB
eco
nom
ic a
ssum
ptio
ns o
f 0.8
% fo
r FY
2012
whe
re th
e pr
ices
that
the
Gov
ernm
ent p
ays
are
esta
blis
hed
thro
ugh
the
mar
ket s
yste
m.
Fact
ors
are
appl
ied
to s
ub-o
bjec
t cla
sses
that
resu
lt in
the
follo
win
g ad
just
men
ts to
bas
e:
Tran
spor
atio
n of
thin
gs…
……
……
...…
.……
……
.……
….…
……
……
.……
……
……
……
CEN-31

Dep
artm
ent o
f Com
mer
ceU
.S. C
ensu
s B
urea
u Sa
larie
s an
d Ex
pens
es -
Dis
cret
iona
ry B
APR
OG
RAM
AN
D P
ERFO
RM
ANC
E: D
IREC
T O
BLIG
ATIO
NS
(Dol
lar a
mou
nts
in th
ousa
nds)
Exhi
bit 1
0
Act
ivity
: C
urre
nt s
urve
ys a
nd s
tatis
tics
Sub
activ
ity: C
urre
nt e
cono
mic
sta
tistic
s
Line
Item
Per
sonn
elA
mou
ntP
erso
nnel
Am
ount
Per
sonn
elA
mou
ntP
erso
nnel
Am
ount
Per
sonn
elA
mou
nt
Bus
ines
s st
atis
tics
Pos
./BA
183
$39,
254
319
$40,
339
314
$40,
454
313
$40,
347
(1)
(107
)FT
E/O
bl.
295
37,6
7331
640
,339
300
40,4
5429
940
,347
(1)
(107
)
Con
stru
ctio
n st
atis
tics
Pos
./BA
5413
,521
8513
,730
105
14,2
3210
514
,196
0(3
6)FT
E/O
bl.
113
13,1
5712
213
,730
120
14,2
3212
014
,196
0(3
6)
Man
ufac
turin
g st
atis
tics
Pos
./BA
119
25,5
0418
027
,727
226
27,7
4819
023
,661
(36)
($4,
087)
FTE
/Obl
.19
024
,271
221
27,7
2720
527
,748
169
23,6
61(3
6)(4
,087
)
Gen
eral
eco
nom
ic s
tatis
tics
Pos
./BA
188
55,2
3530
853
,904
329
58,8
4732
857
,229
(1)
(1,6
18)
FTE
/Obl
.30
659
,098
309
53,9
0432
458
,847
323
57,2
29(1
)(1
,618
)
Fore
ign
trade
sta
tistic
sP
os./B
A13
333
,203
215
31,8
9921
831
,854
217
31,7
74(1
)(8
0)FT
E/O
bl.
211
32,5
1122
331
,899
216
31,8
5421
531
,774
(1)
(80)
Gov
ernm
ent s
tatis
tics
Pos
./BA
5012
,500
7411
,618
9312
,572
113
14,7
2120
2,14
9FT
E/O
bl.
8112
,303
7911
,618
9412
,572
107
14,7
2113
2,14
9
Tota
lP
os./B
A72
717
9,21
71,
181
179,
217
1,28
518
5,70
71,
266
181,
928
(19)
(3,7
79)
FTE/
Obl
119
617
901
31
270
179
217
125
918
570
71
233
181
928
(26)
(377
9)
Incr
ease
/ (D
ecre
ase)
ov
er B
ase
2010
Act
ual
2011
CR
(Ann
ualiz
ed)
2012
Bas
e20
12Es
timat
e
FTE/
Obl
.1,
196
179,
013
1,27
017
9,21
71,
259
185,
707
1,23
318
1,92
8(2
6)(3
,779
)
Adj
ustm
ents
to O
blig
atio
ns:
R
ecov
erie
s
Uno
blig
ated
bal
ance
, sta
rt of
yea
r
Uno
blig
ated
bal
ance
, exp
iring
204
U
nobl
igat
ed b
alan
ce, e
nd o
f yea
r
Ref
und
Fina
ncin
g fro
m tr
ansf
ers:
Tra
nsfe
r fro
m o
ther
acc
ount
s
Tra
nsfe
r to
othe
r acc
ount
s
App
ropr
iatio
nP
os.
727
179,
217
1,18
117
9,21
71,
285
185,
707
1,26
618
1,92
8(1
9)(3
,779
)
CEN-32

Dep
artm
ent o
f Com
mer
ceU
.S. C
ensu
s B
urea
uS
alar
ies
and
Exp
ense
s - D
iscr
etio
nary
BA
PR
OG
RA
M A
ND
PE
RFO
RM
AN
CE
: D
IRE
CT
OB
LIG
ATI
ON
S(D
olla
r am
ount
s in
thou
sand
s)
Exh
ibit
10
Act
ivity
: C
urre
nt s
urve
ys a
nd s
tatis
tics
Sub
activ
ity: C
urre
nt d
emog
raph
ic s
tatis
tics
Line
Item
Per
sonn
elA
mou
ntP
erso
nnel
Am
ount
Per
sonn
elA
mou
ntP
erso
nnel
Am
ount
Per
sonn
elA
mou
nt
Hou
seho
ld s
urve
ysP
os./B
A15
7$6
3,30
124
4$6
3,30
527
4$6
5,45
431
9$6
9,29
245
$3,8
38FT
E/O
bl.
549
63,4
4264
163
,305
645
65,4
5464
569
,292
03,
838
Pop
ulat
ion
and
hous
ing
anal
yses
Pos
./BA
4612
,520
8012
,516
9612
,942
739,
232
(23)
(3,7
10)
FTE
/Obl
.79
12,2
2085
12,5
1690
12,9
4267
9,23
2(2
3)(3
,710
)
Tota
lP
os./B
A20
375
,821
324
75,8
2137
078
,396
392
78,5
2422
128
FTE
/Obl
.62
875
,662
726
75,8
2173
578
,396
712
78,5
24(2
3)12
8A
djus
tmen
ts to
Obl
igat
ions
:
Rec
over
ies
Uno
blig
ated
bal
ance
, sta
rt of
yea
r
Uno
blig
ated
bal
ance
, exp
iring
159
Uno
blig
ated
bala
nce
end
ofye
ar
Incr
ease
/ (D
ecre
ase)
ov
er B
ase
2010
Act
ual
2011
CR
(Ann
ualiz
ed)
2012
Bas
e20
12E
stim
ate
U
nobl
igat
ed b
alan
ce, e
nd o
f yea
r
Ref
und
Fina
ncin
g fro
m tr
ansf
ers:
T
rans
fer f
rom
oth
er a
ccou
nts
T
rans
fer t
o ot
her a
ccou
nts
App
ropr
iatio
nP
os.
203
75,8
2132
475
,821
370
78,3
9639
278
,524
2212
8
CEN-33

Dep
artm
ent o
f Com
mer
ceU
.S. C
ensu
s B
urea
uS
alar
ies
and
Exp
ense
s - D
iscr
etio
nary
BA
PR
OG
RA
M A
ND
PE
RFO
RM
AN
CE
: D
IRE
CT
OB
LIG
ATI
ON
S(D
olla
r am
ount
s in
thou
sand
s)
Exh
ibit
10
Act
ivity
: C
urre
nt s
urve
ys a
nd s
tatis
tics
Sub
activ
ity: S
urve
y de
velo
pmen
t and
dat
a se
rvic
es
Line
Item
Per
sonn
elA
mou
ntP
erso
nnel
Am
ount
Per
sonn
elA
mou
ntP
erso
nnel
Am
ount
Per
sonn
elA
mou
nt
Sur
vey
deve
lopm
ent a
nd d
ata
serv
ices
Pos
./BA
15$3
,986
31$3
,986
29$5
,535
56$1
1,60
227
$6,0
67FT
E/O
bl.
243,
915
283,
986
315,
535
4711
,602
166,
067
Tota
lP
os./B
A15
3,98
631
3,98
629
5,53
556
11,6
0227
6,06
7FT
E/O
bl.
243,
915
283,
986
315,
535
4711
,602
166,
067
Adj
ustm
ents
to O
blig
atio
ns:
R
ecov
erie
s
Uno
blig
ated
bal
ance
, sta
rt of
yea
r
Uno
blig
ated
bal
ance
, exp
iring
71
Uno
blig
ated
bal
ance
, end
of y
ear
Ref
und
Incr
ease
/ (D
ecre
ase)
ov
er B
ase
2010
Act
ual
2011
CR
(Ann
ualiz
ed)
2012
Bas
e20
12E
stim
ate
R
efun
d
Fina
ncin
g fro
m tr
ansf
ers:
T
rans
fer f
rom
oth
er a
ccou
nts
T
rans
fer t
o ot
her a
ccou
nts
App
ropr
iatio
nP
os.
153,
986
313,
986
295,
535
5611
,602
276,
067
CEN-34

APPROPRIATION ACCOUNT: Salaries and Expenses BUDGET ACTIVITY: Current Surveys and Statistics
For FY 2012, the Census Bureau requests an increase of $5.1 million and -14 FTE over the FY 2012 base program for a total of $274.8 million and 2,011 FTE for Current Surveys and Statistics. BASE JUSTIFICATION FOR FY 2012: Current Surveys and Statistics Overview The Current Surveys and Statistics ($274.8 million and 2,011 FTE) budget is organized into three subactivities under the Salaries and Expenses account.
• The Current Economic Statistics subactivity ($184.6 million and 1,252 FTE) includes economic statistics programs that provide public and private sector data users with relevant, accurate, and timely national statistical profiles of every sector of the U.S. economy.
• The Current Demographic Statistics subactivity ($78.5 million and 712 FTE) contains programs that provide social and economic information on a monthly, quarterly, and annual basis to inform effective public and private decision-making.
• The Survey Development and Data Services subactivity ($11.6 million and 47 FTE) consists of two programs: the Statistical Abstract of the United States and General Research.
Significant Adjustments-to-Base (ATBs): The Census Bureau requests a net increase of $10.6 million to fund adjustments to current programs for Current Surveys and Statistics activities. The increase will provide inflationary increases for non-labor activities, including service contracts, utilities, and rent charges from the General Services Administration (GSA). ADMINISTRATIVE COST SAVINGS: The Administration is pursuing an aggressive government-wide effort to curb non-essential administrative spending called the Administrative Efficiency Initiative. In order to be good stewards of taxpayer money the Federal Government should continue to seek ways to improve the efficiency of programs without reducing their effectiveness. As such, the President directed each agency to analyze its administrative costs and identify savings where possible. After reviewing its administrative costs, the Census Bureau has identified $661,000 in administrative savings in the Salaries and Expenses account, with an additional $193,000 in savings identified through the Department’s Working Capital Fund (see the Departmental Management Working Capital Fund section for more details). The Census Bureau has targeted a number of areas to achieve its savings. All of these program change savings are associated with human capital; the Census Bureau expects to reduce through position management and control and reductions to its workers compensation costs. The $854,000 in administrative savings identified above represent real reductions to Census Bureau’s funding level and will help reduce overall spending by the Federal Government.
Department of Commerce U.S. Census Bureau
Salaries and Expenses PROGRAM JUSTIFICATION
CEN-35

SUBACTIVITY: Current Economic Statistics The goal of the current economic statistics program is to provide public and private data users with relevant, accurate, and timely national statistical profiles for every sector of the U.S. economy. Business Statistics The business statistics programs measure the economic activity of the distribution and service trade sectors in the United States. The data provide principal economic performance indicators, including monthly and annual data for the retail and wholesale sectors and quarterly and annual data for the service sector of the national economy. These sectors account for nearly 70 percent of U.S. economic activity. Together, the business statistics programs provide the primary source of up-to-date facts on the structure and functioning of the distributive trades and service sectors of the economy and provide timely updates to data collected in the economic census. The principal economic indicator series are closely followed and widely used by policymakers in the public and private sectors and move financial markets. The data, in conjunction with other economic data collected by the Census Bureau, are vital to effective economic policy decisions by business and government. Current retail trade reports This program provides monthly and annual estimates of retail and accommodation and food services sales, e-commerce sales, selected merchandise lines data, inventories, and purchases. The current retail trade and accommodation and food services estimates cover almost 3.9 million establishments. The Census Bureau publishes advance monthly retail and food services sales estimates for the United States as a whole, based on early reports from a small sub-sample of the larger monthly retail survey. This advance monthly retail publication is designated as one of the principal economic indicators. The television newscasts and the financial pages of newspapers and magazines regularly highlight the sales levels and trends from this report. From the larger monthly retail survey sample, the Census Bureau publishes monthly sales and end-of-month inventory estimates, inventory/sales ratios, and quarterly estimates of e-commerce sales. The annual retail trade program provides key measures of retail and accommodations and food services activity for intercensal years and is the basis for benchmarking monthly estimates of sales and inventories and provides measurements of purchases, e-commerce sales, accounts receivables, inventories held outside the United States, operating expenses, and selected merchandise lines. The economic outlook depends greatly on the strength of retail and accommodation and food services sales and retail inventories. These data are important inputs to the Bureau of Economic Analysis’ (BEA) estimation of Gross Domestic Product (GDP). Also, these timely estimates provide principal indicators to the Federal Reserve Board and Council of Economic Advisers for formulation of monetary and fiscal policies and analysis of economic policies. The Census Bureau is the only source for these data. Current wholesale trade reports This program provides monthly and annual estimates of wholesale sales, inventories, inventory/sales ratios, purchases, and e-commerce sales. The current wholesale trade estimates cover over 430,000 establishments.
CEN-36
The monthly wholesale trade report, a principal economic indicator, covers merchant wholesalers (except manufacturers’ sales branches and offices), which account for 66 percent of all wholesale sales and 80 percent of all wholesale inventories based on the 2008 Annual Wholesale Trade Survey (AWTS). The merchant wholesalers included in this report are wholesalers that sell goods on their own account, such as industrial distributors, jobbers, exporters, and importers. Each month, the Census Bureau publishes totals for sales, end-of-month inventories, and inventory/sales ratios registered by businesses engaged in wholesaling merchandise. The annual wholesale trade program covers the wholesalers included in the monthly wholesale report (described above), as well as manufacturers’ sales offices and branches, electronic markets, agents, and brokers. In addition to sales, inventories, and inventory/sales ratios, the annual program provides measurements of purchases, e-commerce sales, EDI sales, inventories held outside the United States, operating expenses, and commissions received (agents and brokers only). Wholesale sales and inventories are key inputs to BEA’s estimates of GDP data. Also, these data provide important input to the Federal Reserve, the Council of Economic Advisers, and other Federal agencies for their use in determining economic policies and formulating monetary and fiscal policies. The Census Bureau is the only source for these data. Current service trade reports This program provides quarterly and annual information on service industries in the United States. The Quarterly Services Survey (QSS), the first new principal economic indicator to be introduced in over 40 years, produces dollar-volume estimates of revenue and other important measures of service industry activity. This quarterly indicator provides information on all service sectors, comprising 55 percent of GDP and including a variety of industry detail for key information, telecommunications, and technology-sensitive industries of the knowledge economy and other industries sensitive to changes in the business cycle. The Service Annual Survey (SAS) produces estimates of total revenue, purchased services, and estimates of e-commerce sales for all service sectors, comprising many of the fastest growing divisions of the economy. In addition, revenue estimates are produced for selected products and industries. Moreover, estimates of export revenue are produced for many selected industries in business, information, rental and leasing, arts and entertainment, and other services. Services dominate the U.S. economy and the current service trade data produced by the Census Bureau serve as key inputs to the measurement of economic performance. The BEA uses services data in developing the national income and product accounts and in compiling benchmark and annual input-output tables. The Bureau of Labor Statistics uses these Census Bureau source data as input to its productivity and price measurements. The Department of Transportation uses transportation data from these surveys for general planning, policy development, program management, and evaluation. The Centers for Medicare and Medicaid Services use the health data in developing the annual estimates of National Health Expenditures. Academia and private industry use the SAS data for research and as a tool for market analysis. Statistical sample improvements This program provides research, development, and implementation of sample improvements for the current retail, wholesale, and service surveys. This includes selection of the new business sample based on the results from the most current economic census and updating samples on a quarterly and annual basis. New samples are necessary to redistribute respondent burden and minimize sampling error. Sample updates improve coverage of the business universe and ensure accurate representation of those firms selected in the samples. These activities are necessary to maintain and improve the quality of current survey estimates and
CEN-37

provide the basis for implementing more efficient methods of survey processing with the goal of reducing respondent burden and survey costs. Construction Statistics The construction statistics programs provide national performance indicators for the construction sector of the economy. The programs cover activities such as residential building permit authorizations, housing starts, characteristics and prices of new housing, and value of construction put in place. The data are vital to understanding the economic and social aspects of construction activity in the U.S., are pertinent to the national economic and social needs of the U.S. population, and provide a basis for effective policy making at all levels of government and in the private sector. The programs supplement the data collected in the economic census. Since construction activities are particularly sensitive to the level of interest rates, these data are an important indicator of how changes in interest rates are affecting the economy. We have made content and coverage improvements to our construction indicators program, and have improved accessibility to the data. Building permits data This program provides monthly and annual statistics on privately-owned residential construction authorized by building permits. The monthly data include national, regional, and state estimates, as well as totals for selected metropolitan areas and individual places. The annual data cover permit-issuing places that are not in the monthly sample; the annual data in combination with the sample data are used as benchmarks to revise the monthly series. This program covers 20,000 permit-issuing offices. The national series titled “Housing Units Authorized by Building Permits” is a component of the index of leading economic indicators. Building permit data are used for direct input to the ratio estimation of housing starts and new home sales data. This program also provides data used to develop samples for the Census Bureau's Survey of Construction and numerous demographic surveys, including the Current Population Survey. Other data users include the Federal Reserve Board and the Department of Housing and Urban Development (HUD). Financial institutions use these data to estimate mortgage demand. Private firms use the sub-national data for market planning, material demand, and investment analysis. Housing starts data This program provides national and regional statistics on the number of housing units started and the number authorized but not yet started. In conjunction with HUD, this program also collects information on the completion and sale of new housing units, as well as characteristics of these units, such as floor area, number of stories, etc. In addition to providing the source data for the Housing Starts, new home sales, and the Construction Put in Place Survey, all principal economic indicators, this program provides data for the development of price indices of new one-family houses sold and under construction. The data are closely followed by the home-building industry. Housing starts data are used as direct input to the construction put in place single-family estimation and are used to generate the construction put in place multi-family survey sample.
Construction put in place data This program provides estimates of the total dollar value of all construction work done in the nation each month, a principal economic indicator. "Construction" includes new buildings and structures as well as additions and alterations to existing buildings and structures. Residential improvements to owner-occupied housing units are derived from the Consumer Expenditures Survey.
CEN-38

Construction put in place data are provided to the Bureau of Economic Analysis for direct input to the national income and product accounts. These data accounted for about 7 percent of total Gross Domestic Product in 2008. Other data users include the Council of Economic Advisers, the Federal Reserve Board, construction firms, and trade associations. Manufacturing Statistics The manufacturing statistics programs measure the overall performance of the U.S. manufacturing sector and the investment behavior of all U.S. businesses. The data provide key national performance indicators for the sector of the economy that provides 12 percent of the nation’s employment. The manufacturing sector also supplies the export markets, which have become increasingly important to the overall health of our nation’s economy. These programs, which supplement data collected in the economic census, provide the monthly, quarterly, and annual data that are vital to policymakers in both the public and private sectors for analysis of the business cycle and domestic production. They provide key information on major labor, capital, and manufacturing material inputs and outputs, as well as capital investment by U.S. businesses. Base funding also provides the Census contribution towards costs associated with surveys conducted under joint project agreements collecting data on research and development, and pollution abatement costs and expenditures. Surveys on manufacturing capacity utilization and energy use are conducted on a cost reimbursable basis for other Federal agencies.
Current industrial reports This program supplements the product data collected in the economic census with current measures of manufacturing activity in the United States. The surveys collect data from approximately 22,000 reporting units and provide current data on 1,800 of the approximately 7,800 total manufactured products. Production and shipments information are the two common items collected, but the program also collects other measures, such as inventories, orders, and consumption in a number of surveys. These surveys measure manufacturing activity in important commodity areas, such as textiles and apparel, chemicals, primary metals, computer and electronic components, industrial equipment, and consumer goods. The Census Bureau conducts these surveys by mail on a monthly, quarterly, and annual basis using a unified data collection and processing system. The Bureau of Economic Analysis (BEA) uses Current Industrial Reports data to prepare the quarterly estimates of Gross Domestic Product (GDP). The Federal Reserve Board prepares the monthly index of industrial production and the Bureau of Labor Statistics (BLS) develops price indexes based on these data. The International Trade Administration (ITA) and the International Trade Commission use these data to monitor the effects of international trade on domestic production. These data also are widely used by thousands of trade associations and private businesses to assess production trends and identify new market opportunities. Improvements have been made in timeliness of these data. Several years ago we accelerated the release of the annual reports from 12 to 6 months following the end of the reference year. Last year 24 percent of all these reports were issued ahead of schedule. Annual survey of manufactures This program collects information from approximately 53,000 manufacturing establishments and measures manufacturing activity that includes employment, payroll, fringe benefits, cost of materials, capital expenditures, fuels consumed, shipments, and inventories by stage of fabrication. The Census Bureau also publishes information on e-commerce sales and the basic data at the national level for 322 industry groups and for about 1,700 product
CEN-39
classes. The Census Bureau provides selected data at the state level. This program is the only source of comprehensive data on the manufacturing sector of our economy. BEA, BLS, the Federal Reserve Board, ITA and manufacturing and non-manufacturing firms are all users of the Annual Survey of Manufactures data. Over the past five years this program has demonstrated improved efficiencies through the accelerate release of its data products by the average of three months sooner than previously released. Industrial indicators and business investment The Manufacturers' Shipments, Inventories and Orders (M3) Survey provides the indicators of monthly changes for the entire U.S. manufacturing sector. The survey provides monthly data on the dollar volume of shipments, new and unfilled orders, and total inventories for 89 North American Industry Classification System industry categories and 8 market categories, and stage-of-fabrication inventory data for about 21 broad categories. The M3 report is one of the principal economic indicators for the United States, as well as a component of the GDP estimates. The shipments data are important coincident indicators of the business cycle; new orders and unfilled orders are important leading indicators and inventories-to-shipments ratios are a lagging indicator. The BEA, the Federal Reserve Board, the Conference Board, and the Council of Economic Advisers use these data. The financial pages of many leading newspapers and magazines consistently highlight this information. The M3 Survey collects 100 percent of its data via electronic means, thereby reducing data collection costs. This reduction in costs contributed, in part, to our ability to conduct two new benchmark surveys: the Manufacturers’ Unfilled Orders Survey and the Shipments to Federal Agencies Survey. Prior to the introduction of these surveys, there were no benchmark data available for the monthly unfilled orders and defense/non-defense splits. The Annual Capital Expenditures Survey and the Information and Communication Technology Survey collect data, using a probability sample representative of all private nonfarm businesses, on sales, capital expenditures for new and used structures and equipment, and capitalized and expensed spending on information and communication technology equipment and software. Annual program data are supplemented on a 5-year cycle, with added detail on investment by types of structures and equipment. A new sample of approximately 61,000 businesses with and without employees is selected annually for the Annual Capital Expenditures Survey to reduce reporting burden on companies with less than 500 employees (including self-employed). Only those businesses with employees, approximately 46,000, are sent an Information and Communication Technology Survey. These data are vital in measuring the differential effects of technological, price, and regulatory changes on production facilities; for analyzing productivity growth, the ability of U.S. businesses to compete with foreign producers, and plant capacity; and for evaluating overall economic performance. The BEA uses these data to prepare quarterly estimates of GDP and the Conference Board uses the data to prepare the monthly index of leading economic indicators. Other users of this program are the Council of Economic Advisers, the Federal Reserve Board, the Department of the Treasury and the Congressional Budget Office. The private sector uses these data to monitor current production trends, plan future production, and identify new investment requirements.
CEN-40

General Economic Statistics The general economic statistics programs provide information that is essential to understanding the changing economic structure of the United States. In addition, the Business Register and parallel classification activities also provide the infrastructure for the current and periodic economic programs that produce national statistical profiles of all sectors of the economy. Business register The Business Register (BR) identifies the business populations covered by economic censuses and surveys; maintains information about company affiliation and organizational structure; provides consistent industrial, geographic, and size classifications, as needed, to construct efficient, representative samples and enumeration lists; serves as a consolidated source for name, address, and other contact information needed for cost-effective data collection methods; and supports census and survey processing operations. The BR comprises more than 28 million active establishments. It includes 1.6 million establishments belonging to over 160,000 multi-establishment firms, 6.3 million single-establishment firms with paid employees, and over 20 million single-establishment firms without paid employees. A significant portion of the BR information originates from the administrative records of other Federal agencies, such as the Internal Revenue Service, the Social Security Administration and the Bureau of Labor Statistics. Administrative record data offer an efficient, low-cost alternative to direct mailing to millions of small businesses. The Census Bureau supplements these administrative data with results from the economic census, the annual Company Organization Survey (COS), the Annual Survey of Manufactures, and other current surveys. Census Bureau collections provide information on the composition, organizational structure, and operating characteristics of multi-establishment enterprises. Accurate information about these larger companies is important because these firms account for a disproportionate share of the nation’s production and employment. The COS uses electronic collection methods to obtain data from some firms, making it easier for the respondents to provide these data, thus reducing the reporting burden. The BR is the source of statistical frames for internal Census Bureau programs. The annual County Business Patterns (CBP) report is based on tabulations from the BR and provides basic operating statistics for establishments with paid employees in all industries except agricultural production, railroads, the United States Postal Service, private households, and government. Tabulations summarize data by the North American Industry Classification System (NAICS) for the United States, the District of Columbia, Puerto Rico, and counties. The CBP is the only annual source of detailed industry statistics for small geographic areas. These data are used by Federal agencies, including the Bureau of Economic Analysis (BEA). However, the heaviest use is by private businesses and organizations and by local governments, who obtain CBP statistics through the Internet, depository libraries, a network of State Data Centers, and other local channels. Industry and commodity classification This program assures that Census Bureau operations are complete, consistent, and comparable with the Office of Management and Budget (OMB) and other agency standards. This program is also responsible for preparing concordances between the classification systems used in other countries and the United States as official classifications requested by OMB. The NAICS was developed cooperatively with Canada and Mexico and first put in place in 1997. Subsequent revisions in 2002 and 2007 have been incorporated into statistical programs throughout
CEN-41

the Census Bureau. The scheduled revision for 2012 is currently under way. This program coordinates and supports the continued maintenance and revision of the NAICS structure every five years. The Industry and Commodity Classification program is responsible for assigning valid NAICS codes to new business establishments on the business register. The Census Bureau works closely with other agencies that supply administrative records to ensure the completeness and quality of incoming NAICS codes. Further, the Census Bureau conducts a quarterly survey of business births to obtain NAICS codes or verify administrative records assignments. Accurate and timely industrial classifications are essential to structuring efficient samples that provide high-quality estimates for industrial statistics. The assignment of accurate codes in the business register is the foundation of all sample work for economic programs. The Industry and Commodity Classification program is also responsible for a pre-economic census survey of units that do not have industrial classification codes. This effort ensures that the proper economic census survey form is sent to smaller establishments and new businesses that have not responded in the past. The pre-census refile survey is a key step when preparing for an efficient and effective economic census. During the economic census, the Industry and Commodity Classification program processes over 900,000 classification forms and provides coding assistance and guidance to other economic census program areas. The Industry and Commodity Classification program also works on the continued development of a new North American Product Classification System (NAPCS). The program provides staff for development subcommittees, documents results of cooperative North American product development decisions and maintains a repository of United States products. This program coordinated the initial implementation of NAPCS products for the service industries with the Bureau of Economic Analysis and the Bureau of Labor Statistics during the preparation of the economic censuses in 2002 and 2007. Economic studies This program researches important economic issues; evaluates economic, decennial, and demographic data programs; and develops new and improved economic measures. The Center for Economic Studies does not conduct surveys but rather integrates, creates, maintains, and provides micro data from the Census Bureau's data collection programs to approved researchers. The research results have generated substantial new insights into the quality of census and survey data, led to new public use data products, identified gaps in existing programs, and suggested areas where new programs are needed. Specifically, the program has produced research with direct relevance to numerous existing Census Bureau programs (including the Annual Survey of Manufactures, Annual Capital Expenditures Survey, Research & Development Survey, Pollution Abatement Cost Expenditure Survey, and the Survey of Business Owners), identified new economic measures (including high-tech trade, job creation and destruction, and new data on the dynamics of small and young businesses), contributed to developing measurement approaches in evolving areas of the economy (including e-business), and supported the classification of historical economic census data to a NAICS basis. The Census Bureau's Center for Economic Studies is undertaking work to improve the utility of Federal data for studying business behavior. One undertaking is a research program to compare the businesses lists of the Census Bureau and the Bureau of Labor Statistics, to identify areas where closer collaboration might improve the lists of both agencies, thereby increasing the accuracy of business statistics from both agencies. Another project is to extend the Longitudinal Business Database by linking the existing files with additional data on small businesses, which are often the progenitors of larger, publicly traded, companies. The Center for Economic Studies is working to
CEN-42

integrate trade data with other business datasets to better measure the characteristics and dynamics of firms that export and import. The Longitudinal Employer Household Dynamics (LEHD) program was moved to the Center for Economic Studies in 2008. This move recognizes the synergies between the innovative research programs at the Center and in LEHD. In FY 2010, a number of significant enhancements were introduced to the program with the Local Employment Dynamics initiative. These include introducing race and ethnicity, education, and Federal workers to the Quarterly Workforce Indicators and OnTheMap. Quarterly financial report The Quarterly Financial Report (QFR) program collects and reports current information on corporate financial conditions. It is a principal economic indicator, as well as a component of other economic indicators. It includes statistics on sales, profits, assets, liabilities, stockholders' equity, and related accounts and ratios. Using a sample survey of 9,000 companies, the program provides industry and asset size data for small, medium, and large manufacturing corporations, and provides data for corporations with more than $50 million in assets in the wholesale, retail, and mining sectors. The data are used by BEA in constructing the national income accounts, and by the Federal Reserve Board in the flow of funds accounts. The data are also used in the public and private sectors to analyze corporate profits and financial conditions by industry and asset size. Measuring electronic business The extraordinary growth of the Internet has changed the way businesses communicate, seek and access information, purchase and sell goods, and interact. The successful integration of information, communication, and computer technology has provided firms with the opportunity to fundamentally change the ways they operate and conduct business. The Census Bureau has taken a leadership role in measuring and assessing the impact of electronic business on our economy. The Census Bureau e-business measurement program provides quarterly measures of retail e-commerce sales and more detailed annual measures of e-commerce activity for manufacturing, wholesalers, selected service industries, and retail trade. Foreign Trade Statistics The foreign trade statistics programs provide official monthly statistics on imports, exports, and balance of trade for all types of merchandise moving between the United States and its international trading partners. The trade statistics are a principal economic indicator for the United States and are released within 40 to 45 days after the reference month. The Census Bureau is the primary source of this comprehensive monthly data that provide national performance indicators vital to understanding our economy, as well as our economic relationship with the rest of the world. Import statistics This program compiles monthly foreign trade statistics from information filed with U.S. Customs and Border Protection. Import statistics are compiled for shipments valued over $2,000, except for selected commodities valued over $250. Data for shipments valued under $2,000 (and under $250 where applicable) are developed for individual countries through a statistical estimating procedure. The monthly and cumulative statistics summarize merchandise imports using the commodity classifications of the Harmonized Tariff Schedule of the United States, Annotated (HTSUSA) by country of origin and by customs district of entry, although various other commodity classification systems and statistics are readily available. The merchandise imports summary statistics are adjusted to a balance-of-payments basis and combined with imports of services statistics provided by the BEA, and published in a joint press
CEN-43
release. Information is released monthly, covering major commodities and groupings for the Standard International Trade Classification (SITC), NAICS, End-Use Classification, and coverage by geographic areas. The program also produces a series of tabulations and automated media products covering government and private-sector imports of merchandise into the United States, Puerto Rico and the Virgin Islands, as well as selected information on foreign trade zones. In addition, data are released showing movements of imports by vessel and air with information on commodity, country of origin, value, quantity, shipping weight, U.S. port of unloading, and state of destination. All this information can be found on the following websites: www.census.gov/trade and www.usatradeonline.gov. In compliance with the Omnibus Trade and Competitiveness Act of 1988 (Trade Act of 1988), the Census Bureau releases the official import statistics for classifications based on the Harmonized Commodity Description and Coding System. In addition, pursuant to the Trade Act of 1988, the Census Bureau releases seasonally adjusted merchandise trade data on a constant dollar basis. This program also provides statistical reports required by the Committee for Implementation of Textile Agreements for monitoring textile imports from all countries that have bilateral textile agreements with the United States. In addition to the statistical information on textiles, the program also provides statistical information for monitoring imports of steel products and softwood lumber products required by the Import Administration or the International Trade Administration. Trade legislation requires compilation of information on imports for special trade agreements including the Generalized System of Preferences, the Caribbean Basin Initiative, the North American Free Trade Agreement (NAFTA), and approximately 15 other bilateral trade agreements. The BEA, Council of Economic Advisers, Federal Reserve Board and Department of the Treasury use import trade statistics to develop the import components for the Gross Domestic Product (GDP) accounts and to monitor the impact of imports on the general economy. Some of the other users of information from the import statistics program are the U.S. Trade Representative, Department of Commerce, U.S. International Trade Commission, Maritime Administration, Department of Transportation, Army Corps of Engineers, U.S. Customs and Border Protection, and many other public and private sector organizations. These groups use the information to negotiate trade agreements, and implement and monitor international trade agreements, such as NAFTA, and other special bilateral agreements on quotas, textiles, steel, automotive vehicles and parts, etc. In addition, this information is widely used by the business community in market research, trade promotional activities, and analysis of water transportation requirements. Export statistics This program compiles monthly export statistics from electronic export information collected by the Census Bureau and U.S. Customs and Border Protection through the Automated Export System, which provides mainframe, downloadable PC-based software, and Internet filing options for exporters, freight forwarders, and carriers. The export statistics program also includes data on U.S. exports provided by Statistics Canada under a program of import data exchange between U.S. and Canadian agencies. Export statistics are compiled for all shipments individually valued over $2,500 for all countries. However, the Census Bureau estimates data for shipments valued under $2,500 for individual countries. The monthly and cumulative statistics summarize merchandise exports for the commodity classifications using the Schedule B, by country of destination and by customs district of exportation. Schedule B is the official schedule of export commodity classifications that can be used by shippers in reporting export shipments from the United States and in compiling the official statistics on exports of merchandise from the U.S. Schedule B is also based on the Harmonized System.
CEN-44
The merchandise (goods) exports summary statistics are adjusted to a balance-of-payments basis, combined with exports of services statistics provided by the BEA, and published in a joint press release. Similar to the import program, the information is released monthly and shows data covering major commodities and groupings for the SITC, NAICS and End-Use Classification, and coverage by geographic areas. Data items include movement of exports by vessel and air, with information on value, quantity and shipping weight, U.S. port of export, state of origin of export, commodity, and country of destination. In compliance with the Trade Act of 1988, the Census Bureau publishes seasonally adjusted merchandise trade data on a constant dollar basis. The export statistics include non-governmental shipments to foreign countries, including shipments from foreign trade zones. Also included are government shipments, such as Department of Defense Military Assistance Program, Grant-Aid shipments, economic assistance shipments, and shipments of agricultural commodities under Public Law 83-480. The BEA, Council of Economic Advisers, Federal Reserve Board, and Department of the Treasury use export trade statistics to develop the export component of merchandise figures for the balance of payments and GDP accounts. Some other users of information from the export statistics program are the Department of Agriculture, Department of Commerce, the U.S. Trade Representative, Bureau of Labor Statistics, U.S. Customs and Border Protection, and many other public and private sector organizations. These groups use the export information to implement and monitor international trade agreements, such as NAFTA; promote exports through export promotion programs; enforce export control and national security laws; conduct trade negotiations; and conduct market research to determine export market potential and vessel and air movement requirements. Trade monitoring This program covers the Census Bureau responsibilities under the Trade Act of 1974. This includes Section 608 (Uniform Statistical Data on Imports, Exports and Production), Title V (Generalized System of Preferences) and Section 282 (Trade Monitoring System). Section 608 requires data on imports, exports and domestic production on a comparable basis. The NAICS classification system is used for this purpose and a correlation between the international based Harmonized System classification system and the domestic production based NAICS classification system has been developed. The commodity classification systems are revised on a regular basis, updated to reflect changing statistical needs and to improve comparability of trade and domestic production data. It also allows comparability of data between the United States and other countries. This requires continual revisions of the import, export, and output classification systems to promote comparability with the Harmonized System Classification System. Title V of the Act requires data to monitor imports from designated countries and to evaluate the economic effect of the Generalized System of Preferences (GSP). The latter provides duty-free access to the U.S. market by developing countries. The compilation of GSP import data provides the means for analyzing the effectiveness of the Act to promote exports and economic development in beneficiary countries. The data also provide the basis for changes in eligibility whenever GSP imports from a beneficiary country trigger the need for competitive limitations. Section 282 of the Act requires publication of data in order to monitor the relationship between imports, and U.S. employment and production by geographic region. These data assist in the identification of areas affected by imported articles.
CEN-45

Government Statistics The government statistics programs provide current statistical information on revenues, expenditures, debt, and financial assets for more than 90,000 state and local governments. The programs provide data in the areas of public employment and payroll, as well as Federal Government programmatic expenditures on a geographic basis. The data are vital to measuring the government sector of the national economy, understanding the flow of public funds throughout the country, and for administering public programs. Survey of government finance operations This survey provides statistics on the different aspects of state and local government financial activity. There are three parts to the survey: an annual survey on the entire range of governmental revenue, expenditure, indebtedness and assets information; a quarterly survey on state and local government tax revenues; and a quarterly survey on the finances of selected public employee retirement systems. The annual financial statistics program serves as an update of census-year benchmark statistics. The statistics include data on revenue by source, expenditure by function and object, indebtedness and debt transactions, and financial assets. The revenue data include detailed tax data by the major categories of property, sales, income, licenses, and permits; intergovernmental receipts according to source of funds (Federal, state or local governments); government charges for services; and miscellaneous revenue, such as earnings on investments. Expenditure detail includes the major purpose served, such as education, public welfare, health and hospitals, streets and highways, housing and community development, police and fire protection, sewerage and sanitation, and general support. The Bureau of Economic Analysis uses these estimates to develop the state and local sector component of the quarterly and annual revisions to the National Income and Product Accounts (NIPA). State and local governments account for about 12 percent of Gross Domestic Product and are the source for about the same share of personal income in the nation. The Federal Reserve Board uses these estimates in the flow of funds accounts as source information for several key measures of the credit markets. Congress and state officials use the tax and intergovernmental revenue database to prepare analyses of fiscal policy, tax burdens, and comparative studies on governmental finance. Local officials use the detail by types of government to understand the relative activity of counties, municipalities, townships, special districts, and school districts. Survey of government employment Federal, state, and local governments account for about 15 percent of the nation’s civilian labor force. This program provides the annual update of government employment and payroll data by level of government and function. The basic data include a range of information on employees, their pay and hours for the month of March. Survey results provide national estimates of each variable by type of government (Federal, state, county, municipal, township, school district, and special district) and government function (education, police protection, public welfare, etc.), as well as state-by-state estimates of state and local government variables by function. The survey is the only intercensal source of public employment and pay data at the sub-national level. The Bureau of Economic Analysis uses these estimates for deriving price-level changes in the NIPA series. Governors use these data for comparison among states of governmental efficiency. Federal financial statistics This program provides for the production of the annual Consolidated Federal Funds Report (CFFR) products, including the CFFR report, on-line query tool, and Federal Aid to States report. The CFFR products provide statistics on Federal Government expenditures or obligations in each state, territory, county, and municipality. Coverage of the CFFR includes Federal
CEN-46

salaries and wages, procurement, grants, and direct payments, as well as Federal insurance and loan programs. The Congress is especially interested in CFFR data as it illustrates the effects of Federal programs on state and sub-state economies. PROGRAM CHANGES FOR FY 2012:
1. Current Industrial Reports (Base Funding 35 FTE and $4.0 million; Program Change – 35FTE and -$4.0 million): The Census Bureau requests a decrease to terminate the Current Industrial Reports (CIR) Program. The FY 2012 budget request is the result of a review of both ongoing and cyclical programs necessary to achieve Department of Commerce and Census Bureau goals and difficult choices had to be made in balancing program needs and fiscal constraints. This review resulted in the termination of the Current Industrial Reports program in order to fund higher priority programs within the Census Bureau and Department. We continue to measure the manufacturing sector through other current program data collection efforts such as the Annual Survey of Manufactures (ASM), the monthly Manufacturers’ Shipments, Inventories, & Orders (M3), the Quarterly Financial Report (QFR), the Annual Capital Expenditures Survey (ACES), the annual Business R&D and Innovation Survey (BRDIS), and the Quarterly Plant Capacity Utilization survey. We will expand the NAICS industry product detail for some manufacturing industries in the 2012 Economic Census to minimize the loss incurred through the cancellation of the CIR program. 2. Measuring E-Business (Base Funding 3 FTE and $2.2 million; Program Change 0 FTE and -$1.5 million): This reduction reflects efficiencies gained over the last few years in the production of these data as they have become more integrated with the larger data collection efforts within the Economic Statistics programs. The funding reduction will have no detrimental impact on the program. 3. Revitalize Government Statistics (Base Funding 10 FTE and $1.3 million; Program Change 19 FTE and $2.9 million): The Census Bureau requests an increase to revitalize the Government Statistics program by allowing for research, improvements, and new data products in the area of pensions. Pension statistics (19 FTE and +$2,882,000) – A program increase will be used to develop new methodologies for measuring revenues, expenditures, and financial assets of publicly sponsored defined contribution plans, and for measuring costs and liabilities associated with other post employment benefits (OPEBs) for all public employees. Little information exists on the full scale of unfunded liabilities associated with public pensions and OPEBs, nor are there comprehensive official statistics on these data. Developing new collection efforts in this area will provide public policymakers with a new data source in which to assess trillions in estimated liabilities of state and local governments. Proposed Actions: • Begin to develop new methodologies to produce consistent measures of revenues, expenditures,
and financial assets of publicly sponsored defined contribution plans • Explore the development of new methodologies to produce consistent measures of the costs and
liabilities associated with Other Post Employment Benefits (OPEBs) • Hire staff needed to conduct research, develop methodologies and operations, and conduct
feasibility and evaluation studies
CEN-47

Statement of Need and Economic Benefits: The Government Statistics Program is one of the Census Bureau’s longest continual data collection efforts with some of our data dating back to collections as early as 1902. The data produced are critical to understanding the fiscal welfare of state and local governments, critical to the compilation of GDP (12%), critical to the development of the Flow of Funds, and should be critical to answering key questions that the nation is facing. Despite a history of constrained program growth, the Census Bureau has continued to put out the highest quality data on state and local (and at one time, Federal) government activities. Our data are the only comprehensive source on the fiscal welfare of state and local governments. They are the strongest – albeit incomplete – indicator of Federal spending. This was confirmed by the Committee on National Statistics (CNStat) of the National Research Council in their 2007 report, State and Local Government Statistics at a Crossroad. In the report, CNStat charged the Census Bureau to improve, build, and enhance the Government Statistics Program. The report laid out 21 strategic recommendations for accomplishing this task. The requested program increase addresses some of these recommendations and allows us to respond to changing times with new and improved collections. Strong support for programmatic improvements, including more relevant data, exists from Census Bureau Federal counterparts at BEA and the Federal Reserve System. Outside support from public interest groups like the Pension Research Council and the Federal Funds Information for States is also resolute. In March 2010, Governments Division held a data user conference that reaffirmed the need for more relevant data. It is clear from recent policy research and corresponding media coverage that more relevant data in the area of pension statistics are needed. In February 2010, the Pew Center on the States reported in The Trillion Dollar Gap that an estimated $1 trillion gap exists between the pension, health care, and other retirement benefits states have promised their current and retired workers and the funds they have on hand to pay for them. The New York Times followed with a story on how public pension funds are adding risk to raise returns. In March, National Public Radio launched a weeklong special on Deferred Promises: America’s Pension Crisis, which featured compelling accounts about the state of pension systems across the nation. This research and attention are strong indicators that comprehensive, comparable data on public pensions are of vital need. While the Census Bureau currently collects information on defined benefit plans, there is a need for detailed data on defined contribution plans, which have become more prevalent in recent years. This program increase will provide for the first quantitative data on defined contribution plans and OPEBs, which will allow for their inclusion in the calculation of the GDP. These new measures will enhance both the Government Statistics Program as well as the Census of Governments Program. The Census Bureau’s ability to provide these statistics will fill a critical data void, as public policymakers will have a complete data source in which to assess trillions of dollars in liabilities for public pensions. The increase to the Government Statistics Program will allow for research, improvements, and new data products in the area of pension statistics. This has gained increased interest over the past decade as economic and legislative changes have impacted the breadth of data required by the Bureau of Economic Analysis (BEA), Federal Reserve, policy makers, and data users. Furthermore, the Government Statistics Program request directly supports the Census Bureau’s Strategic Objective 4 by meeting the needs of policymakers, businesses and nonprofit organizations, and the public for current measures of the U.S. governments. Interim current government statistics data, which are authorized under Title 13, Section 182, provide vital information on the state of all levels of government, including Federal, state, and local. To meet the Census Bureau objective and to ensure
CEN-48
that quality statistics on governments are provided, funding is needed to revitalize the current Government Statistics Program. The complex and ever-changing state and local government universe is a major economic force, totaling about 12 percent of GDP and nearly 15 percent of the civilian labor force population (including Federal employees). Government statistics data comprise a significant component in the GDP calculation. The benefits gained from the program increase will improve the quality of the data, the GDP, the National Income and Product Accounts produced by BEA, and the Flow of Funds Accounts produced by the Federal Reserve. On an annual basis, an estimated $14.4 trillion is not currently measured in the Government Statistics Program, GDP, and the Flow of Funds Accounts produced by the Federal Reserve. New data products in the area of public pension statistics will allow for the measurement of an estimated $100 billion in publicly sponsored defined contribution plans, and $1 trillion estimated in unfunded liabilities. These products will fill a critical knowledge gap by supplying policymakers with the data needed to make key economic decisions for the future. The FY 2012 increase will revitalize the Census Bureau’s Government Statistics Program by allowing for research, improvements, and new data products in the area of pension statistics. A new data product on pension statistics will provide detailed information on defined contributions and OPEBs, which will allow policy makers to assess the viability of the social safety net, the ability of state and local governments to cover costs, and the dependence of state and local government on Federal funding to cover these or other costs as a result of these obligations. Without these data we are unable to provide a complete picture of government fiscal activities, and policymakers cannot fully quantify the effects of the costs of public pensions systems on present and future economic conditions. Our ability to provide comprehensive data on public pensions and OPEBs will provide policymakers with a complete data source in which to assess trillions of dollars in liabilities. Schedule and Milestones: FY 2012: • Hire necessary staff FY 2013: • Complete methods and instruments for conducting a pilot study on producing consistent
measures of revenues, expenditures, and financial assets of publicly sponsored defined contribution plans
• Complete methods and instruments for conducting a pilot study on producing consistent measures of the costs and liabilities associated with OPEBs
FY 2014: • Complete pilot study on publicly sponsored defined contribution plans • Issue results of producing consistent measures of revenues, expenditures, and financial assets of
publicly sponsored defined contribution plans • Complete pilot study on the costs and liabilities associated with OPEBs • Issue results of producing consistent measures of the costs and liabilities associated with OPEBs
CEN-49

FY 2015: • Publish consistent measures of revenues, expenditures, and financial assets of publicly
sponsored defined contribution plans • Publish consistent measures of the costs and liabilities associated with OPEBs Deliverables: See Schedule and Milestones
4. Terminate Federal Financial Statistics (Base Funding 6 FTE and $0.7 million; Program Change -6 FTE and -$0.7 million): The Census Bureau requests a decrease of $0.7 million and 6 FTE to terminate the Federal Financial Statistics Program. The FY 2012 budget request is the result of a review of both ongoing and cyclical programs necessary to achieve Department of Commerce and Census Bureau goals and difficult choices had to be made in balancing program needs and fiscal constraints. This review resulted in the termination of the Federal Financial Statistics program in order to fund higher priority programs within the Census Bureau and Department. While the program funds the Consolidated Federal Funds Report, an important data collection, our focus is on filling gaps in other areas of the Government statistics program.
CEN-50

Performance Goals and Measurement Data (Current Industrial Reports) Performance Goal: Science and Information Goal
FY 2011
Target
FY 2012
Target
FY 2013
Target
FY 2014
Target
FY 2015
Target
FY 2016
Target With Decrease Release
survey results for the 2010 ASM and CIR pro-grams on schedule
Release survey results for the 2011 ASM program on schedule
Release survey results for the 2012 ASM program on schedule
Release survey results for the 2013 ASM program on schedule
Release survey results for the 2014 ASM program on schedule
Release survey results for the 2015 ASM program on schedule
Without Decrease Release survey results for the 2010 ASM and CIR pro-grams on schedule
Release survey results for the 2011 ASM and CIR pro-grams on schedule
Release survey results for the 2012 ASM and CIR pro-grams on sche-dule. In the eco-nomic census year, ASM Statistics are included in the Manufac-turing Sector’s Industry Series Release.
Release survey results for the 2013 ASM and CIR pro-grams on schedule
Release survey results for the 2014 ASM and CIR pro-grams on schedule
Release survey results for the 2015 ASM and CIR pro-grams on schedule
Description: This measure supports the Census Bureau’s performance measure to “release data products for key Census Bureau programs on time to support effective decision-making of policymakers, businesses, and the public. This program reduction will remove the CIR data from the component measure.
CEN-51

Performance Goals and Measurement Data (Revitalize Government Statistics) Performance Goal: Science and Information Goal
FY 2011
Target
FY 2012
Target
FY 2013
Target
FY 2014
Target
FY 2015
Target
FY 2016
Target With Increase N/A
1) Com-plete pilot study and issue results of produc-ing consis-tent meas-ures of reve-nues, expen-ditures, and financial assets of publicly spon-sored defined contri-bution plans by Sept. 30th
1) Pro-duce and publish measures of reve-nues, expenditures, and financial assets of publicly sponsored defined contribution plans by Sept. 30th
1) Pro-duce and publish measures of reve-nues, expenditures, and financial assets of publicly sponsored defined contribution plans by Sept. 30th
Without Increase N/A
These new data products will not be devel-oped
These new data products will not be devel-oped
These new data products will not be devel-oped
These new data products will not be devel-oped
These new data products will not be devel-oped
Description: This program and the targets support the Census Bureau’s performance measure to “Release data products for key Census Bureau programs on time to support effective decision-making of policy makers, businesses, and the public. “
CEN-52
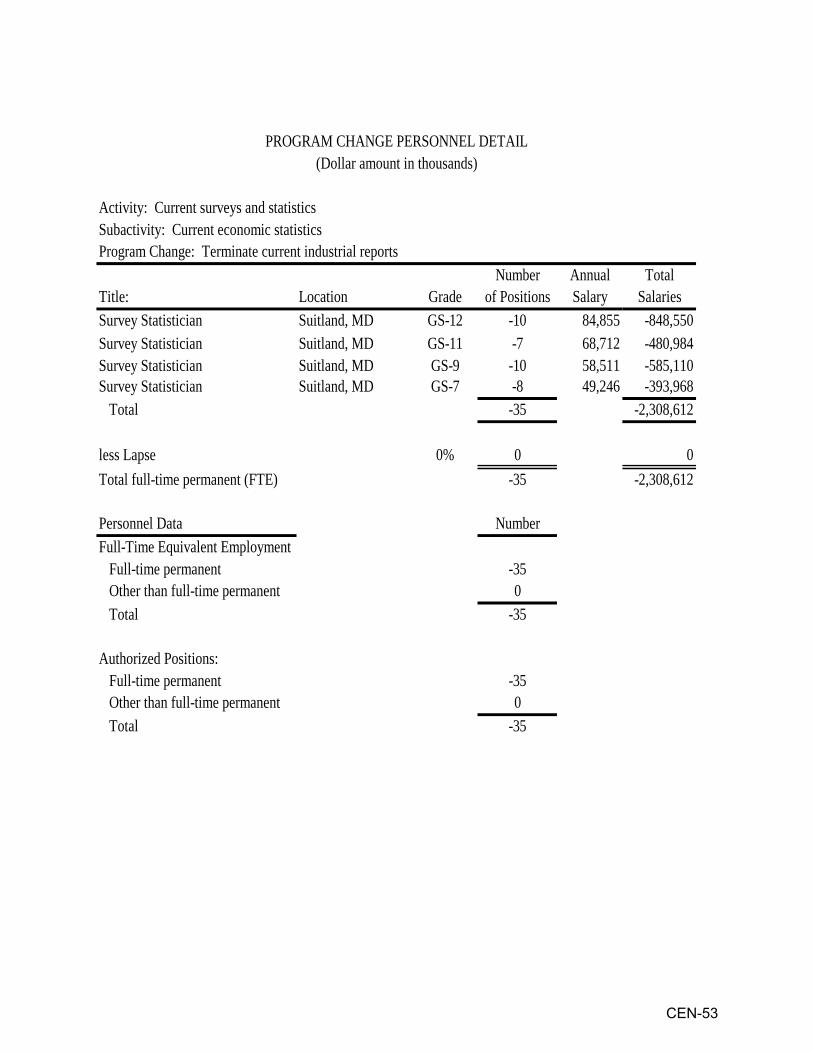
Activity: Current surveys and statisticsSubactivity: Current economic statisticsProgram Change: Terminate current industrial reports
Number Annual TotalTitle: Location Grade of Positions Salary Salaries
Suitland, MD GS-12 -10 84,855 -848,550Suitland, MD GS-11 -7 68,712 -480,984Suitland, MD GS-9 -10 58,511 -585,110Suitland, MD GS-7 -8 49,246 -393,968
-35 -2,308,612
0% 0 0-35 -2,308,612
Number
-350
Total -35
Authorized Positions: Full-time permanent -35
0 Total -35
PROGRAM CHANGE PERSONNEL DETAIL(Dollar amount in thousands)
Survey StatisticianSurvey Statistician
Survey Statistician
Full-time permanent
Total
less LapseTotal full-time permanent (FTE)
Personnel DataFull-Time Equivalent Employment
Survey Statistician
Other than full-time permanent
Other than full-time permanent
CEN-53

Activity: Current surveys and statisticsSubactivity: Current economic statisticsProgram Change: Revitalize government statistics
Number Annual TotalLocation Grade of Positions Salary Salaries
Statistician Suitland, MD GS-15 2 123,758 247,516Mathematical Statistician Suitland, MD GS-14 1 105,211 105,211Statistician Suitland, MD GS-14 1 105,211 105,211IT Specialist Suitland, MD GS-14 2 105,211 210,422Mathematical Statistician Suitland, MD GS-13 3 89,033 267,099Statistician Suitland, MD GS-13 6 89,033 534,198Mathematical Statistician Suitland, MD GS-11 4 67,384 269,536IT Specialist Suitland, MD GS-9 3 54,032 162,096
Suitland, MD GS-9 2 51,630 103,260Suitland, MD GS-5 1 34,075 34,075
25 2,038,624
25% 6 509,65619 1,528,968
Number
190
Total 19
Authorized Positions: Full-time permanent 25
0 Total 25
PROGRAM CHANGE PERSONNEL DETAIL(Dollar amount in thousands)
Other than full-time permanent
Statistical Assistant
Other than full-time permanent
Title:
Statistician
Full-time permanent
Total
less LapseTotal full-time permanent (FTE)
Personnel DataFull-Time Equivalent Employment
CEN-54

Activity: Current surveys and statisticsSubactivity: Current economic statisticsProgram Change: Terminate federal financial statistics
Number Annual TotalLocation Grade of Positions Salary Salaries
Program Analyst Suitland, MD GS-12 -2 84,855 -169,710Mathematical Statistician Suitland, MD GS-11 -1 79,122 -79,122
Suitland, MD GS-9 -3 56,791 -170,373-6 -419,205
0% 0 0-6 -419,205
Number
-60
Total -6
Authorized Positions: Full-time permanent -6
0 Total -6
PROGRAM CHANGE PERSONNEL DETAIL(Dollar amount in thousands)
Other than full-time permanent
Other than full-time permanent
Title:
Statistician
Full-time permanent
Total
less LapseTotal full-time permanent (FTE)
Personnel DataFull-Time Equivalent Employment
CEN-55
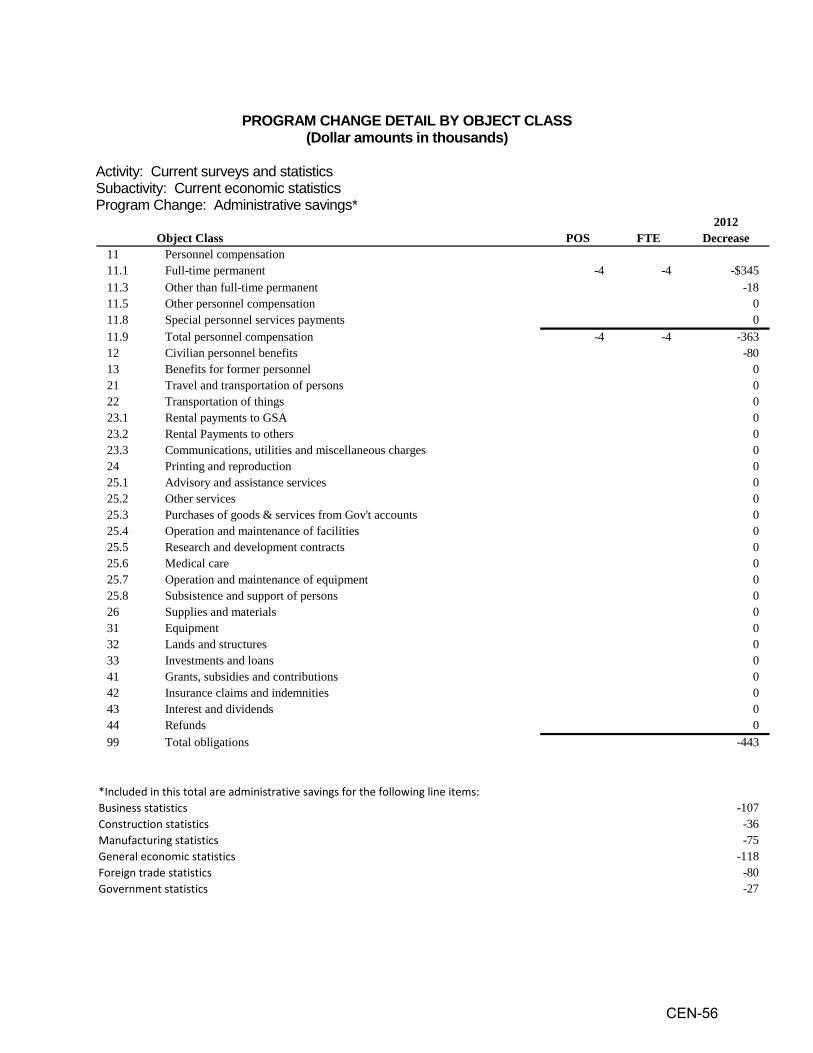
PROGRAM CHANGE DETAIL BY OBJECT CLASS
(Dollar amounts in thousands) Activity: Current surveys and statistics Subactivity: Current economic statistics Program Change: Administrative savings*
2012Object Class POS FTE Decrease
11 Personnel compensation11.1 Full-time permanent -4 -4 -$34511.3 Other than full-time permanent -1811.5 Other personnel compensation 011.8 Special personnel services payments 011.9 Total personnel compensation -4 -4 -36312 Civilian personnel benefits -8013 Benefits for former personnel 021 Travel and transportation of persons 022 Transportation of things 023.1 Rental payments to GSA 023.2 Rental Payments to others 023.3 Communications, utilities and miscellaneous charges 024 Printing and reproduction 025.1 Advisory and assistance services 025.2 Other services 025.3 Purchases of goods & services from Gov't accounts 025.4 Operation and maintenance of facilities 025.5 Research and development contracts 025.6 Medical care 025.7 Operation and maintenance of equipment 025.8 Subsistence and support of persons 026 Supplies and materials 031 Equipment 032 Lands and structures 033 Investments and loans 041 Grants, subsidies and contributions 042 Insurance claims and indemnities 043 Interest and dividends 044 Refunds 099 Total obligations -443
*Included in this total are administrative savings for the following line items:Business statistics -107Construction statistics -36Manufacturing statistics -75General economic statistics -118Foreign trade statistics -80Government statistics -27
CEN-56

PROGRAM CHANGE DETAIL BY OBJECT CLASS (Dollar amounts in thousands)
Activity: Current surveys and statistics Subactivity: Current economic statistics Program Change: Terminate current industrial reports
2012Object Class Decrease
11 Personnel compensation11.1 Full-time permanent -$2,30911.3 Other than full-time permanent -2711.5 Other personnel compensation -3711.8 Special personnel services payments 011.9 Total personnel compensation -2,37312 Civilian personnel benefits -65913 Benefits for former personnel -321 Travel and transportation of persons -1622 Transportation of things -123.1 Rental payments to GSA -18223.2 Rental Payments to others 023.3 Communications, utilities and miscellaneous charges -12824 Printing and reproduction -8325.1 Advisory and assistance services -4725.2 Other services -6125.3 Purchases of goods & services from Gov't accounts -26325.4 Operation and maintenance of facilities -5825.5 Research and development contracts -825.6 Medical care 025.7 Operation and maintenance of equipment -5025.8 Subsistence and support of persons -126 Supplies and materials -2931 Equipment -5032 Lands and structures 033 Investments and loans 041 Grants, subsidies and contributions 042 Insurance claims and indemnities 043 Interest and dividends 044 Refunds 099 Total obligations -4,012
CEN-57

PROGRAM CHANGE DETAIL BY OBJECT CLASS (Dollar amounts in thousands)
Activity: Current surveys and statistics Subactivity: Current economic statistics Program Change: Measuring e-business
2012Object Class Decrease
11 Personnel compensation11.1 Full-time permanent 011.3 Other than full-time permanent 011.5 Other personnel compensation 011.8 Special personnel services payments 011.9 Total personnel compensation 012 Civilian personnel benefits 013 Benefits for former personnel 021 Travel and transportation of persons 022 Transportation of things 023.1 Rental payments to GSA 023.2 Rental Payments to others 023.3 Communications, utilities and miscellaneous charges -$13224 Printing and reproduction -3325.1 Advisory and assistance services -1,24625.2 Other services -3925.3 Purchases of goods & services from Gov't accounts 025.4 Operation and maintenance of facilities 025.5 Research and development contracts 025.6 Medical care 025.7 Operation and maintenance of equipment 025.8 Subsistence and support of persons 026 Supplies and materials -5031 Equipment 032 Lands and structures 033 Investments and loans 041 Grants, subsidies and contributions 042 Insurance claims and indemnities 043 Interest and dividends 044 Refunds 099 Total obligations -1,500
CEN-58

PROGRAM CHANGE DETAIL BY OBJECT CLASS (Dollar amounts in thousands)
Activity: Current surveys and statistics Subactivity: Current economic statistics Program Change: Revitalize government statistics
2012Object Class Increase
11 Personnel compensation11.1 Full-time permanent $1,52911.3 Other than full-time permanent 911.5 Other personnel compensation 4311.8 Special personnel services payments 0 11.9 Total personnel compensation 1,58112 Civilian personnel benefits 42113 Benefits for former personnel 021 Travel and transportation of persons 4622 Transportation of things 123.1 Rental payments to GSA 11023.2 Rental Payments to others 023.3 Communications, utilities and miscellaneous charges 4724 Printing and reproduction 1825.1 Advisory and assistance services 3225.2 Other services 38125.3 Purchases of goods & services from Gov't accounts 9525.4 Operation and maintenance of facilities 3925.5 Research and development contracts 125.6 Medical care 025.7 Operation and maintenance of equipment 3725.8 Subsistence and support of persons 126 Supplies and materials 3231 Equipment 4032 Lands and structures 0 33 Investments and loans 0 41 Grants, subsidies and contributions 0 42 Insurance claims and indemnities 0 43 Interest and dividends 0 44 Refunds 0 99 Total obligations 2,882
CEN-59

PROGRAM CHANGE DETAIL BY OBJECT CLASS (Dollar amounts in thousands)
Activity: Current surveys and statistics Subactivity: Current economic statistics Program Change: Terminate Federal financial statistics
2012Object Class Decrease
11 Personnel compensation11.1 Full-time permanent -$41911.3 Other than full-time permanent -211.5 Other personnel compensation -511.8 Special personnel services payments 0 11.9 Total personnel compensation -42612 Civilian personnel benefits -12113 Benefits for former personnel -121 Travel and transportation of persons -322 Transportation of things 023.1 Rental payments to GSA -3723.2 Rental Payments to others 023.3 Communications, utilities and miscellaneous charges -924 Printing and reproduction -125.1 Advisory and assistance services -825.2 Other services -925.3 Purchases of goods & services from Gov't accounts -4325.4 Operation and maintenance of facilities -1025.5 Research and development contracts 025.6 Medical care 025.7 Operation and maintenance of equipment -925.8 Subsistence and support of persons 026 Supplies and materials -2331 Equipment -632 Lands and structures 0 33 Investments and loans 0 41 Grants, subsidies and contributions 0 42 Insurance claims and indemnities 0 43 Interest and dividends 0 44 Refunds 0 99 Total obligations -706
CEN-60

SUBACTIVITY: Current Demographic Statistics The objective of the Current Demographic Statistics subactivity is to provide elected officials and government managers with the reliable social and economic statistics needed to make effective policy and program decisions. The components of this program have generated a lengthy time series of monthly, quarterly, and annual measures that provide historical perspective to many current issues. The monthly, quarterly, and annual surveys, and the value-added data analyses funded through the Census Bureau’s current demographic statistics program are the primary source of accurate and timely information on which decision makers depend to make informed and cost-effective decisions. Data from these programs are used to create the United States’ official measures of employment, unemployment, poverty, and widely used measures of income and health insurance coverage. Additionally, these surveys and analyses are the source of significant insight for decision-makers on topics, such as immigration, families and children, and the geographic patterns of change in population and characteristics, and for participation of various individuals and households in Federal assistance programs. Household Surveys The household surveys line item includes the full array of operations and services associated with large scale data collection, including:
preparation of the sample and survey materials, collection of the data by field representatives, data processing and estimation, production and quality control of monthly, quarterly, and annual data products, and data dissemination of tabulations and public-use micro-data via the Internet and other
media. These programs are continually assessed by monitoring survey response rates, individual and macro-level reporting of data, coverage of the population, and comparisons of projected costs and actual expenditures. The assessments are obtained on a monthly basis through survey-specific data processing and the Census Bureau’s financial management reports. The surveys and assessments efficiently leverage capabilities of the field infrastructure and workforce used for the decennial census. The household surveys line item includes the three distinct programs described below. Current population survey The Current Population Survey (CPS) is a monthly survey of about 58,000 households that has been conducted by the Census Bureau for the Bureau of Labor Statistics (BLS) for more than 50 years, with the BLS providing about two thirds of the total funding for the program. Although the primary purpose of the CPS is to provide detailed labor force characteristics of the civilian noninstitutional population and the monthly unemployment rate, a leading economic indicator, for the BLS. The Census Bureau’s funding supports the collection and processing, as well as the oversampling of Hispanic households for the Annual Social and Economic Supplement (ASEC) each year. In addition, Census Bureau funding supports the collection and processing of the CPS Fertility supplement, conducted every other June; the CPS School Enrollment supplement, conducted every October; and the Voting and Registration supplement, conducted every other November. Census Bureau funding for these CPS supplements produces annual data on work experience, income, poverty, migration, school enrollment, and biennial data on voting. The CPS
CEN-61

program also receives separate funding from the State Children’s Health Insurance Program (SCHIP) to supplement the sample to obtain annual estimates of health insurance coverage of children. This additional sample increases the basic monthly CPS sample by about 20 percent and the sample for the March ASEC by about 25 percent. The CPS sample provides direct estimates for the nation as a whole and serves as part of a model based for individual states and other geographic areas. In addition to the Census Bureau, the BLS, and the SCHIP funding, other agencies sponsor supplements to the CPS in other months as well, and have covered such topics as Child Support and Alimony, Tobacco Use, Volunteers, and Food Security. Sample cases that are found to be vacant in the CPS are also eligible for the Housing Vacancy Survey, which produces the quarterly housing vacancy rates, another leading economic indicator. The CPS is a longstanding, cooperative, statistical program that benefits many other government agencies and other organizations. In July of 2009 the CPS began to use a Contact History Instrument (CHI) to collect information about timing, type, and result of field contact attempts. This CHI information is used to increase success of contacts during subsequent contacts and can result in improved interviewer efficiency as well as decreased interviewing costs. Funding also supports the continued development of a supplemental poverty measure using the CPS to complement the current official measure. The supplemental poverty measure will include many government transfer programs, which will help to evaluate the impact of anti-poverty programs.
Survey methods development The Census Bureau continually investigates ways of providing more accurate survey data faster and at a lower cost. This program tests and develops alternative survey methodologies and concepts for improving demographic surveys. Improvements apply to the CPS, Survey of Income and Program Participation (SIPP), and other demographic surveys that are done on a reimbursable basis for other Federal agencies. They include surveys that provide statistical measurements of crime, housing, health, consumer income, and consumer expenditures. Enhancements resulting from this research affect Federal programs that allocate funding to state and local governments. The research strategy involves consultations with external and internal customers (for example, BLS, the Office of Management and Budget, and the National Center for Health Statistics), and includes research and analysis of interviewing methods, response bias, quality control procedures, questionnaire design, and documentation. The Census Bureau has evaluated telephone versus in-person interviews, response differences between household members, interviewer conditioning, and use of random digit dialing. The Census Bureau is currently standardizing the production of a CHI. The CHI provides paradata to help field representatives locate respondents and identify the best times to contact respondents. Survey of income and program participation The SIPP is the major source of information on the economic well-being of Americans over time. The SIPP allows policy makers and program managers to look at situations of specific families and households over three to four years providing perspective on demographic and economic changes. The SIPP collects sources and amounts of income, labor force information, program participation and eligibility data, and general demographic characteristics in order to measure the effectiveness of existing Federal, state, and local programs. The data are also used to estimate future costs and coverage for government programs, such as food stamps, and to provide improved statistics on the distribution of income in the country. The SIPP content is built around a “core” of labor force, program participation, and income questions designed to measure the economic situation of households in the United States. The survey was designed also to provide a broader context for analysis by adding questions on a variety of topics not covered in the core section such as
CEN-62
child care, wealth, program eligibility, child support, utilization and cost of health care, disability, school enrollment, taxes, and annual income. In September 2008, the Census Bureau began data collection for the 2008 Panel, with a target of 45,000 households; this panel will be a continuing survey through 2012. Also, during this fiscal year, there will be evaluation of estimates from the fielding of a prototype of the new SIPP automated instrument. The data collection from this prototype occurred during FY 2010. This evaluation of the results of the collection through the prototype instrument will determine the success of this new instrument in collection of SIPP data, the completeness of the content of the instrument, and the effectiveness of field preparation for the use of the new Event History Calendar (EHC) within the instrument. In addition, the reengineered data processing system, designed to process output from the new instrument, will continue to be developed, and SIPP data quality will continue to be evaluated by comparisons to administrative records data. Population and housing analyses The population and housing analyses program uses a variety of approaches to create value-added information for policy makers and program managers, refining the statistical data collected in surveys into insightful and useful information. This program increases the knowledge base with varied sources of information, adds context and perspective to survey data, and maintains the statistical infrastructure through compilation of records and development and maintenance of standards. The population and housing analyses program has four major components. Population characteristics The population characteristics program produces a wide variety of population analyses and reports based on data collected by the Current Population Survey (CPS) and other surveys. The recurring Current Population Reports are used by Federal, state, and local agencies to design, implement, and evaluate programmatic activities, and by a wide variety of organizations in the private sector as the official baseline estimates of various social, demographic, and economic phenomena and trends. These reports present both statistical tables and analytical texts. In addition, the Census Bureau produces special reports on a variety of topics as they become important to Federal interests. The program also provides a wide variety of data and research products relating to the distribution of income, wealth, and poverty in the United States. Recurring reports from the CPS and other data sources are the official source of the United States’ poverty and income statistics. The Population Characteristics program ensures continuous improvement and consistency of critical measures relating to Federal standards and classifications. The Office of Management and Budget uses Census Bureau reports as a key component of the analyses needed to monitor and improve Federal standards and classifications on race and ethnicity, metropolitan areas, occupation, high school dropout rates, and other standard measures. Over time, the work on standards reduces duplication of effort, facilitates the integration of independent outputs of the information from these data systems, and provides a common definition structure for all users of these data, both public and private. Population distribution and projections The program provides information on the geographic distribution of, and projections about, population and households. Policy analysis and application of statistical and government programs frequently depend on accurate, detailed information on the location and characteristics of the population at many levels of geography. In particular, geographic-based population information is vital to the development of survey operations.
CEN-63

The modeling program on projections of population and households at both the national and sub-national levels projects the future age, sex, race, and ethnic distribution of the national and state populations. It requires monitoring changes in administrative and vital statistics, evaluating population trends, and then projecting those trends into the future. These projections help to identify and describe major changes in the direction of the United States’ population size and its age, race/ethnicity, and geographic distribution; information that is essential to enable policy makers, government agencies, and businesses to respond to rapid population changes. Foreign research and analyses Funds provided by this program are used principally to update population estimates and projections for nearly 70 countries and areas, including the countries of the former Soviet Union, western and eastern Europe, China, Vietnam, North Korea, Japan, South Korea, Cambodia, Laos, Mongolia, Taiwan, Macau, and Hong Kong. The number of countries updated annually varies but generally ranges from 10-30. Results are released in the International Database (IDB) and to government agencies and researchers worldwide. The IDB in many ways represents the Census Bureau’s window to the world. These funds are also used to update and enhance IDB usability. Recent efforts have included a focus on development of methods for estimating population at sub-national scales to facilitate more efficient U.S. Government responses to international crises of various kinds. This project also provides for demographic and economic studies of countries in transition, emphasizing the New Independent States (former Soviet Union), China, Vietnam, North Korea, and East European countries. Major topics covered include demographic trends, health, socio- and macro-economic measures, financial and fiscal accounts, and labor force. The Census Bureau uses its expert knowledge of the statistical systems and methods in these countries to assess and adjust data released by these countries as well as fill in gaps in the data. The information and resources are used by policy makers in the international assistance communities, as well as by American businesses, the International Trade Administration, the World Bank, the International Monetary Fund, and Congress to assess socioeconomic conditions of these countries and their potential as markets, as well as to make policy decisions regarding potential development assistance activities. The program supports the maintenance of the Census Bureau Library’s International Collection, the largest and most comprehensive collection of international statistical materials in the U.S. government. Funds are used to acquire statistical publications, including census results, from 70 countries of key interest. These funds are also used to support an international publication exchange with the countries of the world as well as Census Bureau interactions with other countries’ statistical offices. The collection is used by Census Bureau staff, other Federal agencies, and the general public. Housing statistics This program conducts the Housing Vacancy Survey, which produces basic information on the current housing market. The survey collects and provides information on vacancy rates for rental and homeowner units and on home ownership rates. The rental vacancy rate from the survey is a component of the index of leading economic indicators used by the Department of Housing and Urban Development (HUD), BEA, National Association of Home Builders, Federal Reserve Board, Office of Management and Budget (OMB), Department of Treasury, and the Council of Economic Advisers (CEA). The housing statistics program also produces quarterly and annual vacancy rates and home ownership rates for the country as a whole, for four major geographic regions, for metropolitan and non-metropolitan areas, and for central cities and suburbs.
CEN-64
Both public (HUD, BEA, FRB, Treasury, CEA, and OMB) and private organizations use the data to evaluate housing markets and to determine the number and characteristics of available units and the level of home ownership. The White House, HUD, private businesses, nonprofit organizations, and academic researchers use these data to measure progress toward the goal of increasing home ownership among American families. PROGRAM CHANGES FOR FY 2012:
1. Current population survey (Base Funding 110 FTE and $11.6 million; Program Change 36 FTE and $5.0 million): The increase will be used to develop a supplemental statistical poverty measure using the CPS to complement the current official measure. In addition, BLS is putting forth a budget initiative of $2.5 million to develop, maintain, and continue research to improve the annual production of supplemental poverty thresholds to be used by the Census Bureau, to add questions to the Consumer Expenditure (CE) Interview survey (e.g., about school breakfasts/lunches and subsidies for utilities), and to move up the delivery date of the CE poverty thresholds to the Census Bureau to early August to support the September release date of the income and poverty report. Statement of Need: The current official poverty measure is defined by Statistical Policy Directive 14 from the Office of Management and Budget, and states that the basis of these measures is “…the classification of income data collected by the Bureau of the Census in accordance with a definition of poverty developed by the Social Security Administration and revised by a Federal Interagency Committee in 1969.” Poverty is a critical indicator of how widely prosperity is shared in our economy and is a key benchmark for targeting resources toward the disadvantaged. The U.S. poverty measure was developed in the 1960’s and has not been substantially changed since then. As such, it is based on outdated assumptions and fails to accurately measure economic deprivation or take into account the availability of many economic resources. In particular, the official measure does not include many government transfer programs, and hence, cannot evaluate the impact of anti-poverty programs. It has been widely criticized for decades. In 1995, the National Academy of Sciences (NAS) Panel on Poverty and Family Assistance took a comprehensive look at the official U.S. poverty measure and recommended changes in the definition of both the poverty threshold and the family resources that are compared with those thresholds to determine poverty status. While the Census Bureau and other stakeholder agencies have been using the NAS report as the basis for their poverty research, there is much work that remains to be done in order to produce a high-quality timely measure that follows the NAS recommendations. These recommendations use as their basis a definition of income that is much broader than the current official measure, and several of the components of the improved measure are not currently collected by the Census Bureau in the Current Population Survey’s Annual Social and Economic Supplement (CPS ASEC) or the American Community Survey (ACS) and must be modeled. The requested funds will allow the Census Bureau to expand its research and production capacities, and work in coordination with the Bureau of Labor Statistics, to complement the official poverty measures with annual measures of poverty from the CPS ASEC (and eventually the ACS) that follow the NAS recommendations. Specifically, this funding will allow the Census Bureau to do the following:
CEN-65

• Expand its data collection efforts to add the questions needed to produce the improved poverty measure. These include questions on mortgages and property value, childcare expenses, child support expenses, and out-of-pocket medical expenses.
• Evaluate, improve, and expand its modeling and estimation techniques to produce the necessary additional resource components on a timely basis and can assure stakeholders that state-of-the-art techniques are used to produce this critically important measure.
• Create a permanent staff who will produce, evaluate, and update these measures and work with stakeholders to ensure that the measure continues to reflect best practices and takes full advantage of the information available to the Census Bureau.
• Expand the measure to other surveys, particularly the ACS, so states and localities can take advantage of this supplemental poverty measure.
FY 2012 Proposed Actions and Deliverables: • Add, collect, process, and analyze new questions on the CPS ASEC. • Hire staff needed to calculate and release this supplementary measure by September of each
year. • Produce a preliminary supplementary measure, and develop additional text and tables about the
supplementary measure. Schedule of Key Milestones: FY 2012:
• Hire necessary staff • Develop, add, collect, process, analyze new questions in CPS ASEC • Improve the measures of income included in the poverty measure • Produce the preliminary supplementary poverty measure FY 2013 – FY 2016:
• Annually evaluate and improve the questions in the CPS ASEC • Annually improve the measures of income included in the poverty measure • Annually publish first annual supplementary poverty measure in September in an expanded
income and poverty report Benefits: Production of an improved poverty measure that more accurately measures economic deprivation and takes into account the availability of many economic resources. The poverty statistics produced annually by the Census Bureau are among the most important social and economic indicators produced by the Federal Government. For years, these statistics have been criticized as out of date, as the measure was formulated in the 1960’s and has not been fundamentally changed since then. This initiative will finally make it possible for the Census Bureau to collect the information needed to produce an improved poverty measure that will in turn help policymakers evaluate the effectiveness of anti-poverty efforts.
CEN-66

Outcomes: A more accurate measure of poverty will provide policymakers with more accurate information for modeling changes to their programs and improving the evaluation of the effectiveness of programs for the disadvantaged. Poverty is a critical indicator of how widely prosperity is shared in our economy and is a benchmark for targeting resources toward the disadvantaged. 2. Survey of Income and Program Participation (SIPP) (Base Funding 519 FTE and $51.4 million; Program Change -34 and -$1.0 million): The Census Bureau requests a decrease to reflect the completion of the Event History Calendar field tests. The remaining funding will allow the Census Bureau to continue collecting SIPP at the full sample size, and continue the reengineering process. 3. Terminate Population Distributions Program (Base Funding 6 FTE and $1.2 million; Program Change -6 FTE and -$1.2 million): The Census Bureau requests a decrease of $1.2 million to terminate the Population Distribution program. The FY 2012 budget request is the result of a review of both ongoing and cyclical programs necessary to achieve Department of Commerce and Census Bureau goals and difficult choices had to be made in balancing program needs and fiscal constraints. This review resulted in the termination of the Population Distributions Program in order to fund higher priority programs within the Census Bureau and Department.
Public releases of publications and presentations such as the following will cease:
o Census Atlas of the United States o Coastline Population Trends in the United States: 1960 to 2008 o Population Change in Central and Outlying Counties of Metropolitan Statistical Areas:
2000 to 2007 o Population Dynamics of the Great Plains
4. Terminate Demographic Call Center (Base Funding 5 FTE and $0.9 million; Program Change -5 FTE and -$0.9 million): The Census Bureau requests a decrease to terminate the Demographic Call Center. The FY 2012 budget request is the result of a review of both ongoing and cyclical programs necessary to achieve Department of Commerce and Census Bureau goals and difficult choices had to be made in balancing program needs and fiscal constraints. This review resulted in the termination of the Demographic Call Center in order to fund higher priority programs within the Census Bureau and Department. The services provided by the call center will be consolidated with similar functions elsewhere in the Census Bureau.
5. Terminate Foreign Research and Analysis (Base Funding 12 FTE and $1.5 million; Program Change -12 FTE and -$1.5 million): The Census Bureau requests a decrease to terminate the Foreign Research and Analysis Program. The FY 2012 budget request is the result of a review of both ongoing and cyclical programs necessary to achieve Department of Commerce and Census Bureau goals and difficult choices had to be made in balancing program needs and fiscal constraints. This review resulted in the termination of the Foreign Research and Analysis program in order to fund higher priority programs within the Census Bureau and Department. While the information produced by this program is valuable, the international` focus of the program is not central to the Census Bureau’s activities and led the Department and the Census Bureau to the difficult decision to terminate the program. The Census Bureau will try to continue to fund some of these activities through the use of reimbursable agreements with other agencies interested in these data.
CEN-67
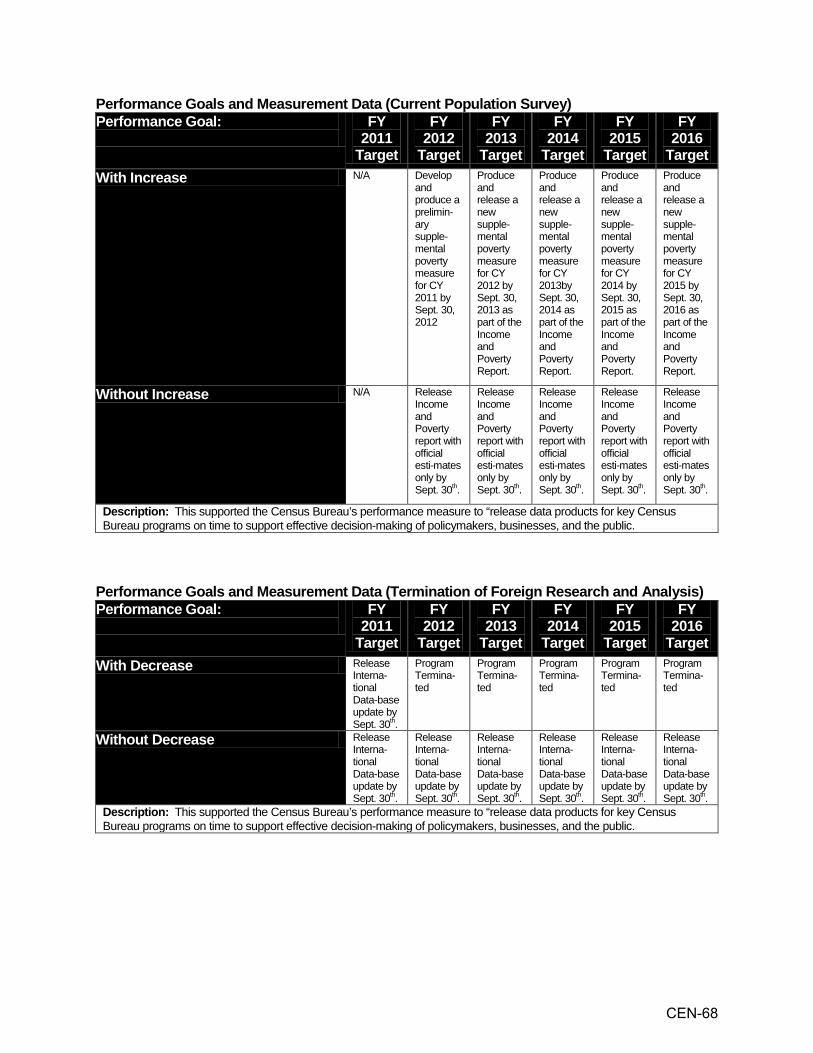
Performance Goals and Measurement Data (Current Population Survey) Performance Goal:
FY 2011
Target
FY 2012
Target
FY 2013
Target
FY 2014
Target
FY 2015
Target
FY 2016
Target With Increase N/A Develop
and produce a prelimin-ary supple-mental poverty measure for CY 2011 by Sept. 30, 2012
Produce and release a new supple-mental poverty measure for CY 2012 by Sept. 30, 2013 as part of the Income and Poverty Report.
Produce and release a new supple-mental poverty measure for CY 2013by Sept. 30, 2014 as part of the Income and Poverty Report.
Produce and release a new supple-mental poverty measure for CY 2014 by Sept. 30, 2015 as part of the Income and Poverty Report.
Produce and release a new supple-mental poverty measure for CY 2015 by Sept. 30, 2016 as part of the Income and Poverty Report.
Without Increase N/A Release Income and Poverty report with official esti-mates only by Sept. 30th.
Release Income and Poverty report with official esti-mates only by Sept. 30th.
Release Income and Poverty report with official esti-mates only by Sept. 30th.
Release Income and Poverty report with official esti-mates only by Sept. 30th.
Release Income and Poverty report with official esti-mates only by Sept. 30th.
Description: This supported the Census Bureau’s performance measure to “release data products for key Census Bureau programs on time to support effective decision-making of policymakers, businesses, and the public.
Performance Goals and Measurement Data (Termination of Foreign Research and Analysis) Performance Goal:
FY 2011
Target
FY 2012
Target
FY 2013
Target
FY 2014
Target
FY 2015
Target
FY 2016
Target With Decrease Release
Interna-tional Data-base update by Sept. 30th.
Program Termina-ted
Program Termina-ted
Program Termina-ted
Program Termina-ted
Program Termina-ted
Without Decrease Release Interna-tional Data-base update by Sept. 30th.
Release Interna-tional Data-base update by Sept. 30th.
Release Interna-tional Data-base update by Sept. 30th.
Release Interna-tional Data-base update by Sept. 30th.
Release Interna-tional Data-base update by Sept. 30th.
Release Interna-tional Data-base update by Sept. 30th.
Description: This supported the Census Bureau’s performance measure to “release data products for key Census Bureau programs on time to support effective decision-making of policymakers, businesses, and the public.
CEN-68
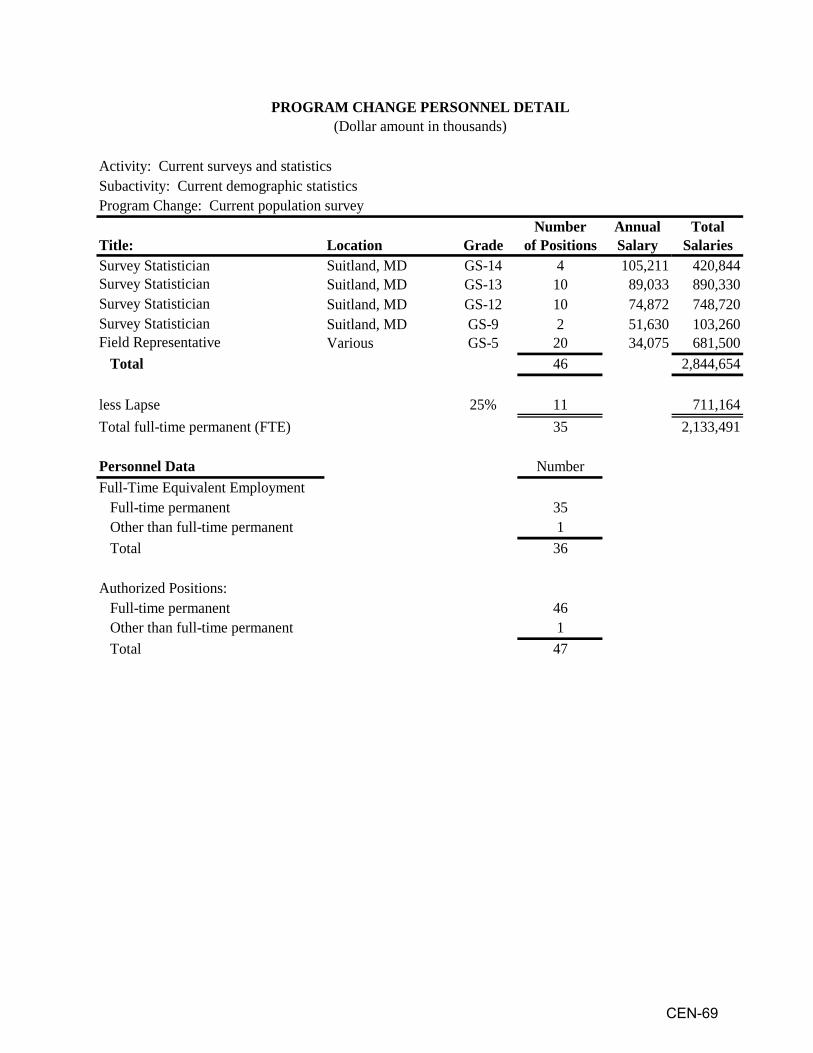
Activity: Current surveys and statisticsSubactivity: Current demographic statisticsProgram Change: Current population survey
Number Annual TotalLocation Grade of Positions Salary SalariesSuitland, MD GS-14 4 105,211 420,844
Survey Statistician Suitland, MD GS-13 10 89,033 890,330Survey Statistician Suitland, MD GS-12 10 74,872 748,720Survey Statistician Suitland, MD GS-9 2 51,630 103,260
Various GS-5 20 34,075 681,50046 2,844,654
25% 11 711,16435 2,133,491
Number
351
Total 36
Authorized Positions: Full-time permanent 46
1 Total 47
Field Representative
Other than full-time permanent
Other than full-time permanent
Full-time permanent
Total
less LapseTotal full-time permanent (FTE)
Personnel DataFull-Time Equivalent Employment
PROGRAM CHANGE PERSONNEL DETAIL(Dollar amount in thousands)
Title:Survey Statistician
CEN-69

Activity: Current surveys and statisticsSubactivity: Current demographic statisticsProgram Change: Terminate demographic call center
Number Annual TotalLocation Grade of Positions Salary SalariesSuitland, MD GS-14 -1 136,771 -136,771
Survey Statistician Suitland, MD GS-13 -1 109,807 -109,807Suitland, MD GS-12 -2 97,333 -194,666Suitland, MD GS-7 -1 52,061 -52,061
-5 -493,305
0% 0 0-5 -493,305
Number
-50
Total -5
Authorized Positions: Full-time permanent -5
0 Total -5
PROGRAM CHANGE PERSONNEL DETAIL(Dollar amount in thousands)
Title:Geographer
Survey Statistician
Full-time permanent
Total
less LapseTotal full-time permanent (FTE)
Personnel DataFull-Time Equivalent Employment
Clerk
Other than full-time permanent
Other than full-time permanent
CEN-70
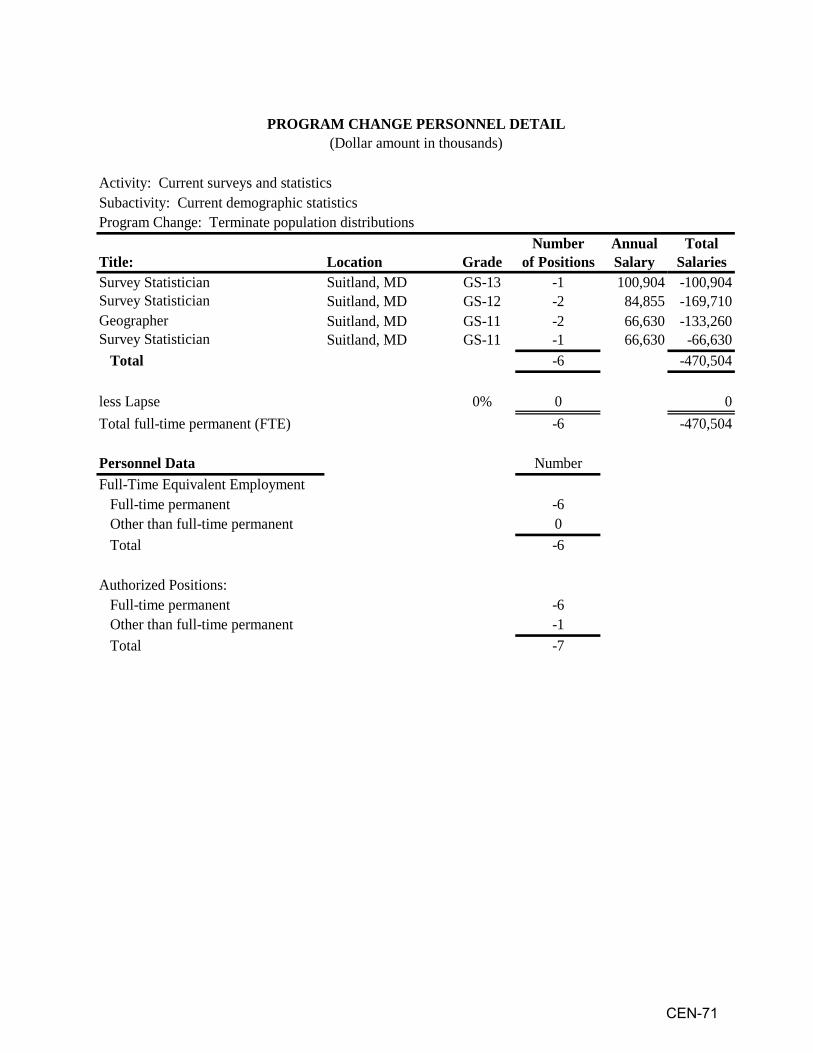
Activity: Current surveys and statisticsSubactivity: Current demographic statisticsProgram Change: Terminate population distributions
Number Annual TotalLocation Grade of Positions Salary SalariesSuitland, MD GS-13 -1 100,904 -100,904
Survey Statistician Suitland, MD GS-12 -2 84,855 -169,710Geographer Suitland, MD GS-11 -2 66,630 -133,260
Suitland, MD GS-11 -1 66,630 -66,630-6 -470,504
0% 0 0-6 -470,504
Number
-60
Total -6
Authorized Positions: Full-time permanent -6
-1 Total -7
PROGRAM CHANGE PERSONNEL DETAIL(Dollar amount in thousands)
Title:Survey Statistician
Full-time permanent
Total
less LapseTotal full-time permanent (FTE)
Personnel DataFull-Time Equivalent Employment
Survey Statistician
Other than full-time permanent
Other than full-time permanent
CEN-71

Activity: Current surveys and statisticsSubactivity: Current demographic statisticsProgram Change: Terminate foreign research and analysis
Number Annual TotalLocation Grade of Positions Salary SalariesSuitland, MD GS-13 -2 100,904 -201,808
Geographer Suitland, MD GS-12 -2 84,855 -169,710Survey Statistician Suitland, MD GS-12 -2 84,855 -169,710Geographer Suitland, MD GS-11 -1 66,630 -66,630Program Analyst Suitland, MD GS-9 -1 58,511 -58,511
Suitland, MD GS-9 -2 58,511 -117,022Suitland, MD GS-6 -2 44,312 -88,624
-12 -872,015
0% 0 0-12 -872,015
Number
-120
Total -12
Authorized Positions: Full-time permanent -12
0 Total -12
PROGRAM CHANGE PERSONNEL DETAIL(Dollar amount in thousands)
Title:Survey Statistician
Survey Statistician
Full-time permanent
Total
less LapseTotal full-time permanent (FTE)
Personnel DataFull-Time Equivalent Employment
Clerk
Other than full-time permanent
Other than full-time permanent
CEN-72
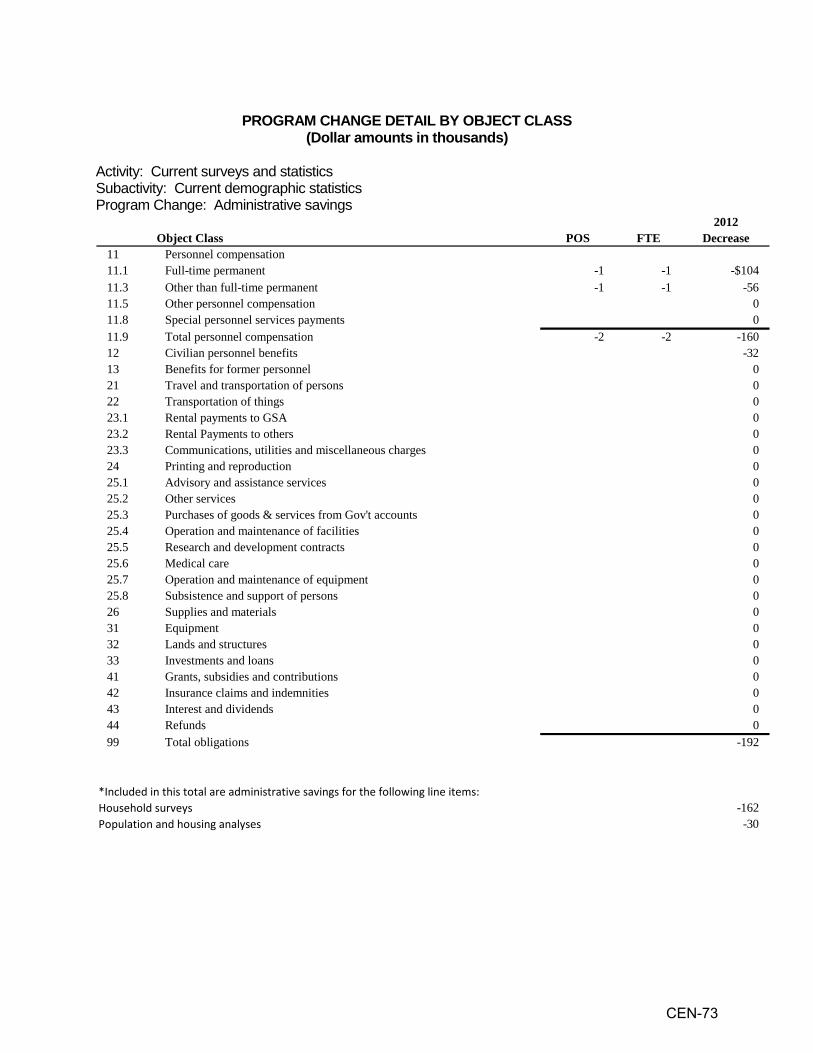
PROGRAM CHANGE DETAIL BY OBJECT CLASS
(Dollar amounts in thousands) Activity: Current surveys and statistics Subactivity: Current demographic statistics Program Change: Administrative savings
2012Object Class POS FTE Decrease
11 Personnel compensation11.1 Full-time permanent -1 -1 -$10411.3 Other than full-time permanent -1 -1 -5611.5 Other personnel compensation 011.8 Special personnel services payments 011.9 Total personnel compensation -2 -2 -16012 Civilian personnel benefits -3213 Benefits for former personnel 021 Travel and transportation of persons 022 Transportation of things 023.1 Rental payments to GSA 023.2 Rental Payments to others 023.3 Communications, utilities and miscellaneous charges 024 Printing and reproduction 025.1 Advisory and assistance services 025.2 Other services 025.3 Purchases of goods & services from Gov't accounts 025.4 Operation and maintenance of facilities 025.5 Research and development contracts 025.6 Medical care 025.7 Operation and maintenance of equipment 025.8 Subsistence and support of persons 026 Supplies and materials 031 Equipment 032 Lands and structures 033 Investments and loans 041 Grants, subsidies and contributions 042 Insurance claims and indemnities 043 Interest and dividends 044 Refunds 099 Total obligations -192
*Included in this total are administrative savings for the following line items:Household surveys -162Population and housing analyses -30
CEN-73
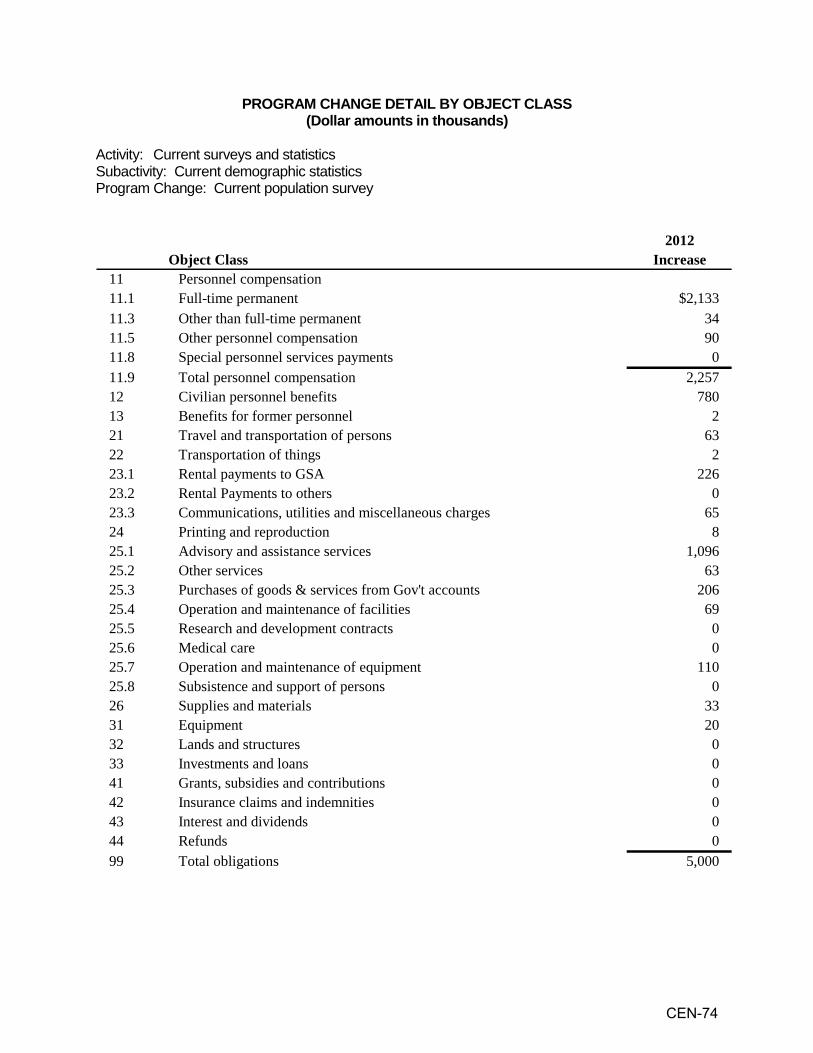
PROGRAM CHANGE DETAIL BY OBJECT CLASS (Dollar amounts in thousands)
Activity: Current surveys and statistics Subactivity: Current demographic statistics Program Change: Current population survey
2012Object Class Increase
11 Personnel compensation11.1 Full-time permanent $2,13311.3 Other than full-time permanent 3411.5 Other personnel compensation 9011.8 Special personnel services payments 011.9 Total personnel compensation 2,25712 Civilian personnel benefits 78013 Benefits for former personnel 221 Travel and transportation of persons 6322 Transportation of things 223.1 Rental payments to GSA 22623.2 Rental Payments to others 023.3 Communications, utilities and miscellaneous charges 6524 Printing and reproduction 825.1 Advisory and assistance services 1,09625.2 Other services 6325.3 Purchases of goods & services from Gov't accounts 20625.4 Operation and maintenance of facilities 6925.5 Research and development contracts 025.6 Medical care 025.7 Operation and maintenance of equipment 11025.8 Subsistence and support of persons 026 Supplies and materials 3331 Equipment 2032 Lands and structures 033 Investments and loans 041 Grants, subsidies and contributions 042 Insurance claims and indemnities 043 Interest and dividends 044 Refunds 099 Total obligations 5,000
CEN-74
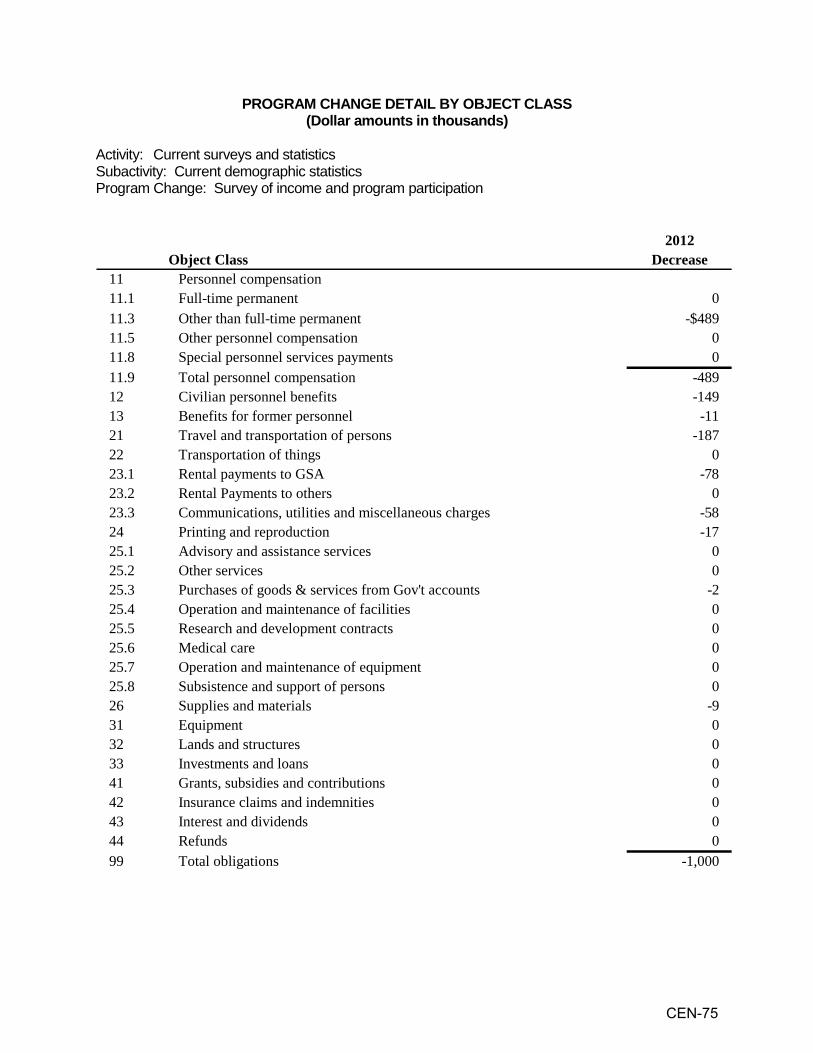
PROGRAM CHANGE DETAIL BY OBJECT CLASS (Dollar amounts in thousands)
Activity: Current surveys and statistics Subactivity: Current demographic statistics Program Change: Survey of income and program participation
2012Object Class Decrease
11 Personnel compensation11.1 Full-time permanent 011.3 Other than full-time permanent -$48911.5 Other personnel compensation 011.8 Special personnel services payments 011.9 Total personnel compensation -48912 Civilian personnel benefits -14913 Benefits for former personnel -1121 Travel and transportation of persons -18722 Transportation of things 023.1 Rental payments to GSA -7823.2 Rental Payments to others 023.3 Communications, utilities and miscellaneous charges -5824 Printing and reproduction -1725.1 Advisory and assistance services 025.2 Other services 025.3 Purchases of goods & services from Gov't accounts -225.4 Operation and maintenance of facilities 025.5 Research and development contracts 025.6 Medical care 025.7 Operation and maintenance of equipment 025.8 Subsistence and support of persons 026 Supplies and materials -931 Equipment 032 Lands and structures 033 Investments and loans 041 Grants, subsidies and contributions 042 Insurance claims and indemnities 043 Interest and dividends 044 Refunds 099 Total obligations -1,000
CEN-75

PROGRAM CHANGE DETAIL BY OBJECT CLASS (Dollar amounts in thousands)
Activity: Current surveys and statistics Subactivity: Current demographic statistics Program Change: Terminate demographic call center
2012Object Class Decrease
11 Personnel compensation11.1 Full-time permanent -$49311.3 Other than full-time permanent -411.5 Other personnel compensation -1411.8 Special personnel services payments 011.9 Total personnel compensation -51112 Civilian personnel benefits -13313 Benefits for former personnel -121 Travel and transportation of persons -522 Transportation of things 023.1 Rental payments to GSA 023.2 Rental Payments to others 023.3 Communications, utilities and miscellaneous charges -1324 Printing and reproduction -125.1 Advisory and assistance services -1625.2 Other services -3225.3 Purchases of goods & services from Gov't accounts -12025.4 Operation and maintenance of facilities -2225.5 Research and development contracts 025.6 Medical care 025.7 Operation and maintenance of equipment -3925.8 Subsistence and support of persons 026 Supplies and materials -531 Equipment -4432 Lands and structures 033 Investments and loans 041 Grants, subsidies and contributions 042 Insurance claims and indemnities 043 Interest and dividends 044 Refunds 099 Total obligations -942
CEN-76

PROGRAM CHANGE DETAIL BY OBJECT CLASS (Dollar amounts in thousands)
Activity: Current surveys and statistics Subactivity: Current demographic statistics Program Change: Population distribution
2012Object Class Decrease
11 Personnel compensation11.1 Full-time permanent -$47011.3 Other than full-time permanent -1011.5 Other personnel compensation -1511.8 Special personnel services payments 011.9 Total personnel compensation -49512 Civilian personnel benefits -14513 Benefits for former personnel -121 Travel and transportation of persons -17222 Transportation of things -123.1 Rental payments to GSA -6023.2 Rental Payments to others 023.3 Communications, utilities and miscellaneous charges -1324 Printing and reproduction -1225.1 Advisory and assistance services -10825.2 Other services -4525.3 Purchases of goods & services from Gov't accounts -3425.4 Operation and maintenance of facilities -4025.5 Research and development contracts -2825.6 Medical care 025.7 Operation and maintenance of equipment -2125.8 Subsistence and support of persons -126 Supplies and materials -1431 Equipment -1732 Lands and structures 033 Investments and loans 041 Grants, subsidies and contributions 042 Insurance claims and indemnities 043 Interest and dividends 044 Refunds 099 Total obligations -1,207
CEN-77
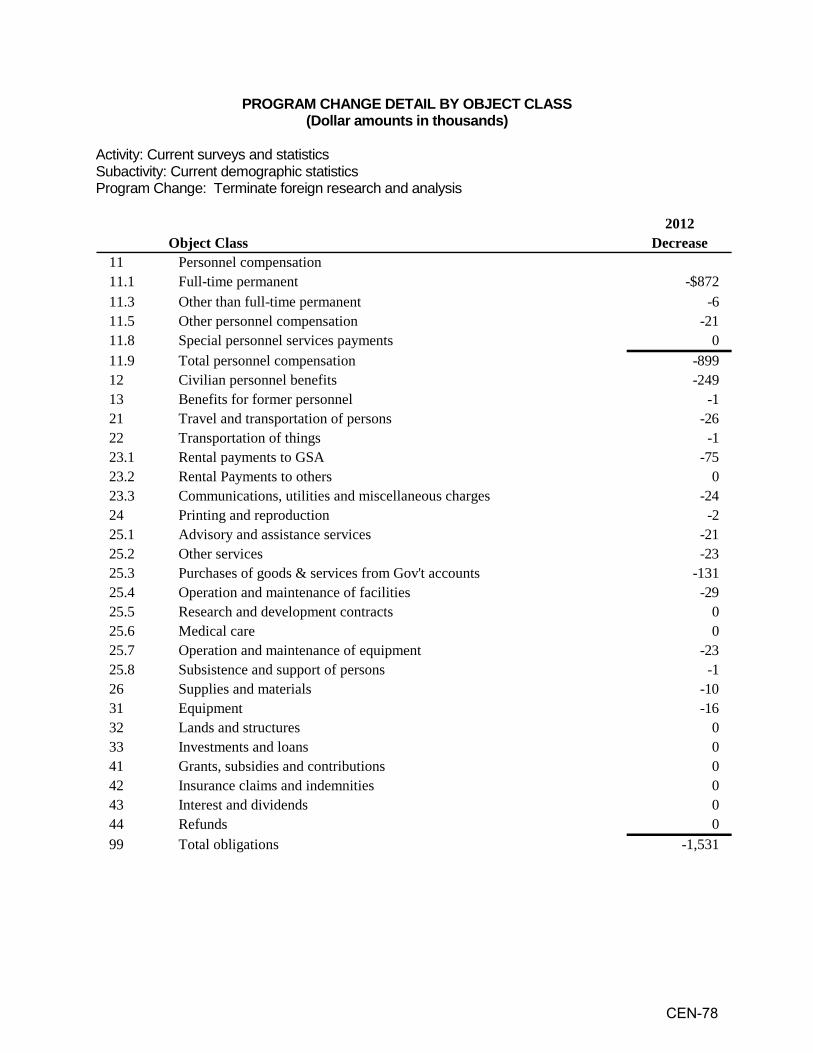
PROGRAM CHANGE DETAIL BY OBJECT CLASS (Dollar amounts in thousands)
Activity: Current surveys and statistics Subactivity: Current demographic statistics Program Change: Terminate foreign research and analysis
2012Object Class Decrease
11 Personnel compensation11.1 Full-time permanent -$87211.3 Other than full-time permanent -611.5 Other personnel compensation -2111.8 Special personnel services payments 011.9 Total personnel compensation -89912 Civilian personnel benefits -24913 Benefits for former personnel -121 Travel and transportation of persons -2622 Transportation of things -123.1 Rental payments to GSA -7523.2 Rental Payments to others 023.3 Communications, utilities and miscellaneous charges -2424 Printing and reproduction -225.1 Advisory and assistance services -2125.2 Other services -2325.3 Purchases of goods & services from Gov't accounts -13125.4 Operation and maintenance of facilities -2925.5 Research and development contracts 025.6 Medical care 025.7 Operation and maintenance of equipment -2325.8 Subsistence and support of persons -126 Supplies and materials -1031 Equipment -1632 Lands and structures 033 Investments and loans 041 Grants, subsidies and contributions 042 Insurance claims and indemnities 043 Interest and dividends 044 Refunds 099 Total obligations -1,531
CEN-78
SUBACTIVITY: Survey Development and Data Services The objectives of the Survey Development and Data Services subactivity are to provide the public with basic statistical reference volumes and guides to sources of statistics; to provide reports which facilitate and encourage the widespread use of the best data for decision making at all levels; and to identify, adapt, develop, and promote new or improved methods and procedures for all Census Bureau surveys. Survey Development and Data Services Survey development and data services consists of two programs: the Statistical Abstract of the United States and General Research. Each year the Census Bureau compiles and issues the Statistical Abstract of the United States. The abstract provides a comprehensive summary of industrial, social, economic, and political data. It serves as a statistical compendium and as a guide to other statistical publications and sources. It includes tables and charts drawn from data of almost 300 government, private, and international agencies. An extension of the Statistical Abstract of the United States program includes planning and development of selected periodic supplements, including the County and City Data Book, State and Metropolitan Area Data Book and USA Counties web database. An electronic web version of Historical Statistics is available. The program also supports the Census Bureau’s Quick Facts and Map Stats at FedStats. The Statistical Abstract of the United States and all its periodic supplements are available in electronic form on the Census Bureau’s website, as well as in print. This program provides policy background and research information for congressional staffs, Federal, state and local government officials, and private businesses and is extensively available in educational and library settings, especially the Federal Depository Library program. Survey development and data services also supports a program of General Research that studies problems related to the Census Bureau’s data collection efforts. These problems continually occur because we are measuring an increasingly complex population and economy. The challenges encompass maintaining adequate response rates, reducing burden of response to census and survey data collection, meeting complex data needs, and improving data quality. We look for solutions using tools from three disciplines: mathematical statistics, social and behavioral sciences, and computation sciences. Research topics include: disclosure limitation, compensating for non-response in longitudinal surveys, small domain estimation, seasonal adjustment, sampling theory and survey design issues, records linkage and analytic uses of administrative lists, metadata, exploratory data analysis and graphics, automated editing and imputation, cognitive methods for questionnaire design, computer usability, interviewer behavior, automated instruments, household rostering, and ethnography. PROGRAM CHANGES FOR FY 2012: 1. Terminate Statistical Abstract (Base Funding 24 FTE and $2.9 million; Program Change -24 FTE and -$2.9 million): The Census Bureau requests a decrease to terminate the Statistical Abstract program. The FY 2012 budget request is the result of a review of both ongoing and cyclical programs necessary to achieve Department of Commerce and Census Bureau goals and difficult choices had to be made in
CEN-79

balancing program needs and fiscal constraints. The availability elsewhere of much of the information in the statistical abstract has led the Department and Census Bureau to the difficult decision to terminate the program.
2. Enhancing the Federal Statistical System’s Ability to Use Administrative Records - (Base Funding 0 FTE and $0 million; Program Change 40 FTE and $9.0 million): The Interagency Committee on Statistical Policy (ICSP), the National Academy of Sciences, and the Census Bureau leadership are in agreement that the future of the Federal statistical system lies in increasing the statistical use of administrative records. Administrative records is the term used to refer to data collected by Federal, state, and local governments for program purposes, as well as data acquired from commercial data brokers. The current system, where the majority of Federal statistics are produced through direct data collections, is becoming too costly and does not reflect changes in our society, such as increased unwillingness to respond. The Census Bureau has had an administrative records program since the 1940s and several economic and demographic data products are currently produced using administrative records. The infrastructure supporting the existing program is, however, inadequate to support expanding the administrative records program, particularly for demographic data products. An expansion of the infrastructure is needed, including: increasing existing staffing levels; acquiring external expertise in matching, linking, and data quality; improving quality assurance programs; improving data management policies and procedures; and purchase of additional records. Building the infrastructure will allow the Census Bureau to take a leadership role among the Federal statistical agencies, including supporting two cross-cutting administrative records pilot projects: a 2010 Census simulation and a health pilot project involving the National Center for Health Statistics (NCHS). These pilot projects are designed to address existing barriers to more complete use of administrative data while at the same time contributing substantive topical knowledge in critical fields. Statement of Need: The Census Bureau is working closely with the ICSP and its sister statistical agencies to further the ability for all Federal statistical agencies to use administrative records. This effort will require us to improve and expand the existing Census Bureau administrative records infrastructure. The administrative records infrastructure refers to the staff, programs, technology, research, and processes that support the use of administrative records, both as a substitute for and a supplement to direct data collection. Building the infrastructure as described in this document will allow the Census Bureau to support various cross-cutting administrative records initiatives, including a 2010 Census simulation and a health pilot project involving the NCHS. 2010 Census Simulation using Administrative Records. The Census Bureau is exploring the feasibility of reducing cost in censuses and surveys by using administrative records as a resource in future censuses and surveys. With additional funds, we will be able to simulate a 2010 Census using administrative records and compare it to the actual 2010 Census. The comparison will allow us to examine and document the coverage and quality of the administrative records census versus the census by traditional methods. Additionally, it will allow us to compare the quality and coverage of major governmental and commercial administrative record data sets so that we can make alternative plans in the event we are not able to obtain key data sets from other Federal agencies. Health Policy Pilot Project. The Census Bureau and the ICSP share a vision that the Federal statistical system would be improved were the Census Bureau able to function as the data linkage hub for other Federal statistical agencies. The Census Bureau would acquire administrative record data sets, link them, and return data to sister statistical agencies. The proposal for FY 2011 is to
CEN-80

enter into a pilot project with NCHS to evaluate the feasibility of this vision. The NCHS project would involve linking health survey data from NCHS with administrative data from the Centers for Medicare and Medicaid Services (CMS), and then returning this data (without any confidential census data) to NCHS. If the pilot is successful, NCHS and CMS will be able to address important health policy questions, such as providing information about whether rising obesity rates would increase Medicare and Medicaid program expenditures; suggesting strategies for management of patients with multiple chronic conditions (e.g., asthma and diabetes); and facilitating analysis of comparative effectiveness of treatments for a wide variety of conditions, including mental health conditions in children. The Census Bureau will gain valuable information to allow it to implement this hub linkage proposal. We will be better able to enter into similar arrangements with other statistical agencies, better able to evaluate the complexity of the customized linkages necessary for each such project, and better able to anticipate implementation and data acquisition issues. Neither of these pilots can occur without expansion of existing infrastructure. One key infrastructure improvement will be to expand the Census Bureau’s administrative records research staff. Only a small number of staff currently works on the administrative records research at the Census Bureau. Skilled staff is needed to support research and development in data linkage, matching, disclosure avoidance methodology, data processing techniques for large files, and data quality measures for both incoming files and production data. This research will provide the knowledge base that will expand our ability to understand appropriate linkages and validated uses. We propose to expand our knowledge base using a combination of outside contractors and new hires. We will also improve the existing policies and procedures supporting the data management infrastructure. While administrative records offer the promise of reduced data collection costs, they carry with them program costs of their own. Records are typically acquired from other Federal or state agencies or purchased from data brokers. These records often contain highly confidential information, and the supplying agency almost invariably places restrictions on their use and requirements for their management. Similarly, commercial data carries with it licensing requirements that require careful supervision and monitoring. Additional funding is necessary to expand and improve existing programs to put in place policies and procedures to safeguard data received from other agencies, and to meet the increased safeguarding requirements involved with an expanded program. This funding will augment the existing program to acquire, manage, and track these records; update the existing Administrative Records Tracking System; efficiently manage the linkage projects for other agencies; and ensure that legal and policy restrictions are observed.
Food Security Project. The Economic Research Service (ERS) will fund research by institutions with access to relevant state-level administrative data to analyze food security issues. ERS proposes several projects using linked administrative data, one of which includes linkage to National Center for Health Statistics (NCHS) survey data. ERS wants analysts to investigate Supplemental Nutrition Assistance Program (SNAP) participation by National Health and Nutrition Examination Survey (NHANES) respondents for a sample of states. In another project, ERS proposes funding research to analyze utilization of Unemployment Insurance and SNAP benefits including transitions between the programs. Proposed Actions and Deliverables for FY 2012:
• Establish a new Senior Technical position to provide leadership for an administrative records research agenda.
• Complete NCHS pilot project, including delivering matched data to NCHS.
CEN-81

• Prepare preliminary results from the 2010 Census Administrative Records Simulation.
• Improve data linkage capabilities and methodologies.
• Expand existing administrative record datasets available at the Census Bureau.
• Strengthen data management policies and procedures for the Census Bureau’s administrative records programs.
• Develop a research agenda for improving the knowledge base for the Federal statistical system
about the capabilities of administrative records.
Performance Goals and Measurement Data (Statistical Abstract) Performance Goal:
FY 2011
Target
FY 2012
Target
FY 2013
Target
FY 2014
Target
FY 2015
Target
FY 2016
Target With Decrease 100% of
publi-cations released on time
Program Termin-ated
Program Termin-ated
Program Termin-ated
Program Termin-ated
Program Termin-ated
Without Decrease 100% of publi-cations released on time
100% of publi-cations released on time
100% of publi-cations released on time
100% of publi-cations released on time
100% of publi-cations released on time
100% of publi-cations released on time
Description: This measured on-time release of statistical compendia.
CEN-82

Performance Goals and Measurement Data (Administrative Records) Performance Goal:
FY 2011
Target
FY 2012
Target
FY 2013
Target
FY 2014
Target
FY 2015
Target
FY 2016
Target With Decrease N/A Establish a
Senior Technical position to support a unified research agenda. Complete NCHS Health Policy Pilot and deliver results. Prepare preliminary results from 2010 Census simulation. Acquire at least one new commercial and one new Federal high value dataset.
Conduct and document lessons learned with NCHS. Complete program plan for expansion of linkage project to other Federal statistical agencies, including policies and proced-ures.
Implement effort to educate other Federal agencies about the availability and potential benefits of the admini-strative records linkage project.
Conduct at least one linkage project for another Federal statistical agency. Begin to develop a program for continu-ous process improve-ment.
Conduct at least two linkage projects for other Federal statistical agencies. Implement program for continu-ous process improve-ment.
Without Decrease N/A Without these funds, we will not be able to support the aggres-sive infrastruc-ture develop-ment required to increase the utility of adminis-trative data for the entire Federal statistical system, and we will harm our ability to use adminis-trative records in the 2020 Census
Without these funds, we will not be able to support the aggres-sive infrastruc-ture develop-ment required to increase the utility of adminis-trative data for the entire Federal statistical system, and we will harm our ability to use adminis-trative records in the 2020 Census
Without these funds, we will not be able to support the aggres-sive infrastruc-ture develop-ment required to increase the utility of adminis-trative data for the entire Federal statistical system, and we will harm our ability to use adminis-trative records in the 2020 Census
Without these funds, we will not be able to support the aggres-sive infrastruc-ture develop-ment required to increase the utility of adminis-trative data for the entire Federal statistical system, and we will harm our ability to use adminis-trative records in the 2020 Census
Without these funds, we will not be able to support the aggres-sive infrastruc-ture develop-ment required to increase the utility of adminis-trative data for the entire Federal statistical system, and we will harm our ability to use adminis-trative records in the 2020 Census
Description: These measures all relate to a pilot project to link records for the NCHS and CMS, a pilot that should allow the Census Bureau to develop the capability to function as a hub for linkage projects for other Federal agencies, thereby increasing the efficiency of the Federal statistical system.
CEN-83

Activity: Current surveys and statisticsSubactivity: Survey development and data servicesProgram Change: Terminate statistical abstract
Number Annual TotalLocation Grade of Positions Salary SalariesSuitland, MD GS-14 -1 115,731 -115,731Suitland, MD GS-13 -2 97,936 -195,872Suitland, MD GS-12 -1 82,359 -82,359Suitland, MD GS-12 -4 82,359 -329,436Suitland, MD GS-12 -2 82,359 -164,718Suitland, MD GS-11 -1 70,794 -70,794Suitland, MD GS-9 -2 56,791 -113,582Suitland, MD GS-8 -1 51,418 -51,418Suitland, MD GS-7 -3 46,431 -139,293Suitland, MD GS-7 -2 46,431 -92,862Suitland, MD GS-5 -5 37,481 -187,405
-24 -1,543,470
0% 0 0-24 -1,543,470
Number
-240
Total -24
Authorized Positions: Full-time permanent -24
0 Total -24
PROGRAM CHANGE PERSONNEL DETAIL(Dollar amount in thousands)
Other than full-time permanent
Full-Time Equivalent Employment
Clerk
Survey StatisticianClerkSurvey Statistician
Survey StatisticianWriterSurvey StatisticianIT SpecialistSurvey Statistician
Other than full-time permanent
Title:Survey Statistician
Clerk
Full-time permanent
Total
less LapseTotal full-time permanent (FTE)
Personnel Data
CEN-84

Activity: Current surveys and statisticsSubactivity: Survey development and data servicesProgram Change: Administrative records
Number Annual TotalLocation Grade of Positions Salary SalariesSuitland, MD ST-1 1 160,000 160,000Suitland, MD GS-15 2 123,758 247,516Suitland, MD GS-15 1 123,758 123,758Suitland, MD GS-14 2 105,211 210,422Suitland, MD GS-14 8 105,211 841,688Suitland, MD GS-14 8 105,211 841,688Suitland, MD GS-13 12 89,033 1,068,396Suitland, MD GS-13 9 89,033 801,297Suitland, MD GS-13 8 89,033 712,264
51 5,007,029
25% 13 1,251,75738 3,755,272
Number
382
Total 40
Authorized Positions: Full-time permanent 51
2 Total 53 Other than full-time permanent
Title:Mathematical Statistician
Full-time permanent
Total
less LapseTotal full-time permanent (FTE)
Personnel Data
PROGRAM CHANGE PERSONNEL DETAIL(Dollar amount in thousands)
Other than full-time permanent
Full-Time Equivalent Employment
Survey Statistician
Mathematical StatisticianIT Specialist
Mathematical StatisticianIT SpecialistSurvey StatisticianIT SpecialistMathematical Statistician
CEN-85

PROGRAM CHANGE DETAIL BY OBJECT CLASS (Dollar amounts in thousands)
Activity: Current surveys and statistics Subactivity: Survey development and data services Program Change: Administrative savings*
2012Object Class POS FTE Decrease
11 Personnel compensation11.1 Full-time permanent 0 0 -$2211.3 Other than full-time permanent 0 0 -111.5 Other personnel compensation 011.8 Special personnel services payments 011.9 Total personnel compensation 0 0 -2312 Civilian personnel benefits -313 Benefits for former personnel 021 Travel and transportation of persons 022 Transportation of things 023.1 Rental payments to GSA 023.2 Rental Payments to others 023.3 Communications, utilities and miscellaneous charges 024 Printing and reproduction 025.1 Advisory and assistance services 025.2 Other services 025.3 Purchases of goods & services from Gov't accounts 025.4 Operation and maintenance of facilities 025.5 Research and development contracts 025.6 Medical care 025.7 Operation and maintenance of equipment 025.8 Subsistence and support of persons 026 Supplies and materials 031 Equipment 032 Lands and structures 033 Investments and loans 041 Grants, subsidies and contributions 042 Insurance claims and indemnities 043 Interest and dividends 044 Refunds 099 Total obligations -26
CEN-86

PROGRAM CHANGE DETAIL BY OBJECT CLASS (Dollar amounts in thousands)
Activity: Current surveys and statistics Subactivity: Survey development and data services Program change: Terminate statistical abstract
2012Object Class Decrease
11 Personnel compensation11.1 Full-time permanent -$1,54311.3 Other than full-time permanent -1011.5 Other personnel compensation -6911.8 Special personnel services payments 011.9 Total personnel compensation -1,62212 Civilian personnel benefits -48013 Benefits for former personnel -221 Travel and transportation of persons -1222 Transportation of things -123.1 Rental payments to GSA -14123.2 Rental Payments to others 023.3 Communications, utilities and miscellaneous charges -3624 Printing and reproduction -6925.1 Advisory and assistance services -3325.2 Other services -17725.3 Purchases of goods & services from Gov't accounts -21325.4 Operation and maintenance of facilities -4325.5 Research and development contracts 025.6 Medical care 025.7 Operation and maintenance of equipment -3725.8 Subsistence and support of persons -126 Supplies and materials -1431 Equipment -2632 Lands and structures 033 Investments and loans 041 Grants, subsidies and contributions 042 Insurance claims and indemnities 043 Interest and dividends 044 Refunds 099 Total obligations -2,907
CEN-87

PROGRAM CHANGE DETAIL BY OBJECT CLASS (Dollar amounts in thousands)
Activity: Current surveys and statistics Subactivity: Survey development and data services Program change: Administrative records
2012Object Class Increase
11 Personnel compensation11.1 Full-time permanent $3,75511.3 Other than full-time permanent 9911.5 Other personnel compensation 8111.8 Special personnel services payments 011.9 Total personnel compensation 3,93512 Civilian personnel benefits 1,08813 Benefits for former personnel 1521 Travel and transportation of persons 2822 Transportation of things 323.1 Rental payments to GSA 023.2 Rental Payments to others 023.3 Communications, utilities and miscellaneous charges 10924 Printing and reproduction 625.1 Advisory and assistance services 10125.2 Other services 1,44925.3 Purchases of goods & services from Gov't accounts 32225.4 Operation and maintenance of facilities 11825.5 Research and development contracts 1,00025.6 Medical care 025.7 Operation and maintenance of equipment 15225.8 Subsistence and support of persons 526 Supplies and materials 3831 Equipment 63132 Lands and structures 033 Investments and loans 041 Grants, subsidies and contributions 042 Insurance claims and indemnities 043 Interest and dividends 044 Refunds 099 Total obligations 9,000
CEN-88

Dep
artm
ent o
f Com
mer
ceU
.S. C
ensu
s B
urea
uSa
larie
s an
d Ex
pens
es -
Man
dato
ry B
APR
OG
RAM
AN
D P
ERFO
RM
ANC
E: D
IREC
T O
BLIG
ATIO
NS
(Dol
lar a
mou
nts
in th
ousa
nds)
Exhi
bit 1
0
Act
ivity
: S
urve
y of
pro
gram
dyn
amic
s
Line
Item
Per
sonn
elA
mou
ntP
erso
nnel
Am
ount
Per
sonn
elA
mou
ntP
erso
nnel
Am
ount
Per
sonn
elA
mou
nt
Sur
vey
of p
rogr
am d
ynam
ics
Pos
./BA
33$1
0,00
058
$10,
000
57$1
0,00
057
$10,
000
0$0
FTE
/Obl
.55
9,84
461
10,0
0057
10,0
0057
10,0
000
0
Tota
lP
os./B
A33
10,0
0058
10,0
0057
10,0
0057
10,0
000
0FT
E/O
bl.
559,
844
6110
,000
5710
,000
5710
,000
00
Adj
ustm
ents
to O
blig
atio
ns:
R
ecov
erie
s
Uno
blig
ated
bal
ance
, sta
rt of
yea
r
Uno
blig
ated
bal
ance
, exp
iring
156
Uno
blig
ated
bala
nce
end
ofye
ar
Incr
ease
/ (D
ecre
ase)
ov
er B
ase
2010
Act
ual
2011
Ena
cted
2012
Bas
e20
12E
nact
ed
U
nobl
igat
ed b
alan
ce, e
nd o
f yea
r
Ref
und
Fina
ncin
g fro
m tr
ansf
ers:
T
rans
fer f
rom
oth
er a
ccou
nts
T
rans
fer t
o ot
her a
ccou
nts
App
ropr
iatio
nP
os.
3310
,000
5810
,000
5710
,000
5710
,000
00
CEN-89

APPROPRIATION ACCOUNT: Salaries and Expenses - Mandatory BUDGET ACTIVITY: Survey of Program Dynamics
The FY 2012 request includes $10.0 million and 57 FTE for Survey of Program Dynamics. BASE JUSTIFICATION FOR FY 2012: Survey of Program Dynamics Overview The Survey of Program Dynamics budget consists of one subactivity with the same name under the Mandatory Salaries and Expenses account. This subactivity contains one line item with the same name ($10.0 million and 57 FTE). Significant Adjustments-to-Base (ATBs): There are no adjustments to base for the Survey of Program Dynamics. SUBACTIVITY: Survey of Program Dynamics LINE ITEM: Survey of Program Dynamics The Survey of Program Dynamics (SPD) program will provide data necessary to determine the impact of welfare provisions of the Personal Responsibility and Work Opportunity Reconciliation Act of 1996 as revised by the 109th Congress. Baseline characteristics come from data already collected by the Survey of Income and Program Participation (SIPP). The goal of SPD is to provide policymakers with relevant, accurate, timely, and cost-effective socio-economic data and information, which can be used by Federal and state public policymakers to evaluate the effects of the Personal Responsibility and Work Opportunity Reconciliation Act of 1996 that established the Temporary Assistance for Needy Families Program, (P.L. 111-291, Extension of P.L. 108-308). The survey of program dynamics supports Department of Commerce general goal/objective 1.3 to “advance key economic and demographic data that support effective decision-making by policymakers, businesses, and the American public.” The SPD program is a source of detailed socioeconomic data from a national sample of households with a focus on the low-income population, which is more likely to receive benefits or assistance from welfare programs. The SPD program has received the same level of annual funding with each extension of the 1996 law. In FY 2012 the Census Bureau plans to use the mandatory funds to conduct, process, and disseminate the 2008 SIPP panel, in support of measuring the impact of the welfare provisions of the Personal Responsibility and Work Opportunity Act mentioned above.
PROGRAM CHANGES FOR FY 2012: No program change is requested for FY 2012.
Department of Commerce U.S. Census Bureau
Salaries and Expenses PROGRAM JUSTIFICATION
CEN-90

Dep
artm
ent o
f Com
mer
ceU
.S. C
ensu
s Bu
reau
Sala
ries
and
Expe
nses
- M
anda
tory
BA
PRO
GR
AM A
ND
PER
FOR
MAN
CE:
DIR
EC
T O
BLI
GA
TIO
NS
(Dol
lar a
mou
nts
in th
ousa
nds)
Exhi
bit 1
0
Act
ivity
: S
tate
chi
ldre
n's
heal
th in
sura
nce
prog
ram
Line
Item
Per
sonn
elA
mou
ntP
erso
nnel
Am
ount
Per
sonn
elA
mou
ntP
erso
nnel
Am
ount
Per
sonn
elA
mou
nt
Sta
te c
hild
ren'
s he
alth
insu
ranc
e pr
ogra
mP
os./B
A54
$20,
000
63$2
0,00
085
$20,
000
85$2
0,00
00
$0FT
E/O
bl.
225
20,0
0023
622
,761
217
20,0
0021
720
,000
00
Tota
lP
os./B
A54
20,0
0063
20,0
0085
20,0
0085
20,0
000
0FT
E/O
bl.
225
20,0
0023
622
,761
217
20,0
0021
720
,000
00
Adj
ustm
ents
to O
blig
atio
ns:
R
ecov
erie
s
Uno
blig
ated
bal
ance
, sta
rt of
yea
r(2
,761
)(2
,761
)
Uno
blig
ated
bal
ance
, exp
iring
U
nobl
igat
ed b
alan
ce, e
nd o
f yea
r2,
761
Ref
und
Incr
ease
/ (D
ecre
ase)
ov
er B
ase
2010
Act
ual
2011
Ena
cted
2012
Bas
e20
12E
nact
ed
R
efun
d
Fina
ncin
g fro
m tr
ansf
ers:
T
rans
fer f
rom
oth
er a
ccou
nts
T
rans
fer t
o ot
her a
ccou
nts
App
ropr
iatio
nP
os.
5420
,000
6320
,000
8520
,000
8520
,000
00
CEN-91

APPROPRIATION ACCOUNT: Salaries and Expenses - Mandatory BUDGET ACTIVITY: State children’s health insurance program
The FY 2012 request includes $20.0 million and 217 FTE for State Children’s Health Insurance Program. BASE JUSTIFICATION FOR FY 2012: State Children’s health insurance program overview The State Children’s Health Insurance Program budget consists of one subactivity with the same name under the Mandatory Salaries and Expenses account. This subactivity contains one line item with the same name ($20.0 million and 217 FTE). Significant Adjustments-to-Base (ATBs): There are no adjustments to base for the State Children’s Health Insurance Program. SUBACTIVITY: State children’s health insurance program LINE ITEM: State children’s health insurance program Under the State Children’s Health Insurance Program (SCHIP), Census Bureau survey data are used to allocate funds to states based on the number of children without health insurance living in low-income families. Allocations are based on statistics from the Annual Social and Economic Supplement to the Current Population Survey (CPS). The Census Bureau will make improvements in the reliability of the state-level data used to estimate changes from one year to the next in the number of low-income children without health insurance coverage. These improvements potentially include making a transition from the CPS to the American Community Survey (ACS) as a basis for SCHIP allocations. Health insurance questions were added to the ACS in 2008. The goal of this mandatory program is to produce statistically reliable annual data for each state on the number of low-income children who do not have health insurance coverage. The SCHIP supports Department of Commerce general goal/objective 1.3 to “advance key economic and demographic data that support effective decision-making by policymakers, businesses, and the American public.” This program was established and funded through mandatory appropriation by the Medicare, Medicaid and State Children’s Health Insurance Program Bill (P.L. 106-113). The program uses adjustments to the CPS to increase the reliability of state-level estimates of the number of uninsured low-income children. The adjustments include, where appropriate, expanding the number of households included in the survey, collecting data in additional months, and exploring alternative methods to enhance state-level estimates by incorporating data from other sources. The SCHIP program was recently reauthorized (P.L.111-3) and provided an additional $10.0 million to the
Department of Commerce U.S. Census Bureau
Salaries and Expenses PROGRAM JUSTIFICATION
CEN-92

Census Bureau to cover rising data collection costs and to improve state estimates of children’s health insurance coverage. The monthly CPS sample was expanded from about 50,000 to 60,000 eligible households. This expansion allowed the Census Bureau to meet the requirement of the SCHIP legislation to improve state estimates of children who live in low-income families and lack health insurance from the Census Bureau’s Annual Social and Economic (ASEC) supplement to the CPS. The expansion also allowed the Census Bureau to conduct an ASEC interview in February and April of each year with about 18,000 households that had completed their 8th month sample interview in August, September, and October. Another 5,000 Hispanic households are selected from the prior November CPS sample in order to increase the accuracy of these estimates. These changes effectively increased the number of sample cases on which the ASEC generates annual estimates to 83,000. PROGRAM CHANGES FOR FY 2012: No program change is requested for FY 2012.
CEN-93

Dep
artm
ent o
f Com
mer
ceU
.S. C
ensu
s Bu
reau
Sala
ries
and
Expe
nses
- D
iscr
etio
nary
BA
SUM
MAR
Y O
F R
EQU
IREM
ENTS
BY
OBJ
ECT
CLA
SS(D
olla
r am
ount
s in
thou
sand
s)
Exhi
bit 1
6
Obj
ect C
lass
2010
Act
ual
2011
CR
(Ann
ualiz
ed)
2012
B
ase
2012
E
stim
ate
Incr
ease
/ (D
ecre
ase)
ov
er B
ase
11P
erso
nnel
com
pens
atio
n11
.1Fu
ll-tim
e pe
rman
ent
$110
,472
$114
,635
$123
,559
$124
,523
$964
11.3
Oth
er th
an fu
ll-tim
e pe
rman
ent
15,8
9618
,937
16,8
2116
,433
(388
)11
.5O
ther
per
sonn
el c
ompe
nsat
ion
6,43
44,
395
4,45
34,
502
4911
.8S
peci
al p
erso
nnel
ser
vice
s pa
ymen
ts0
00
00
11.9
Tota
l per
sonn
el c
ompe
nsat
ion
132,
802
137,
967
144,
833
145,
458
625
12.1
Civ
ilian
pers
onne
l ben
efits
36,8
3938
,652
39,1
6739
,566
399
13B
enef
its fo
r for
mer
per
sonn
el32
145
824
825
68
21Tr
avel
and
tran
spor
tatio
n of
per
sons
5,38
48,
536
8,05
87,
772
(286
)22
Tran
spor
tatio
n of
thin
gs72
61,
416
1,41
31,
415
223
.1R
enta
l pay
men
ts to
GS
A11
,162
11,2
0711
,624
11,3
87(2
37)
23.2
Ren
tal p
aym
ents
to o
ther
s35
11
10
23.3
Com
mun
icat
ion,
util
ities
, mis
c. c
harg
es8,
453
4,74
44,
944
4,76
5(1
79)
24P
rintin
g an
d re
prod
uctio
n53
51,
040
1,12
393
5(1
88)
25.1
Adv
isor
y an
d as
sist
ance
ser
vice
s9,
329
12,4
998,
404
8,16
7(2
37)
25.2
Oth
er s
ervi
ces
7,06
28,
126
7,13
38,
770
1,63
725
.3P
urch
ases
of g
oods
and
svc
s. fr
om g
ov't
acct
s.12
,896
12,0
9517
,570
17,0
62(5
08)
25.4
Ope
ratio
n &
mai
nten
ance
of f
acilit
ies
3,90
33,
197
3,65
73,
544
(113
)25
.5R
esea
rch
& d
evel
opm
ent c
ontra
cts
3,94
02,
406
267
1,34
21,
075
25.6
Med
ical
car
e0
00
00
25.7
Ope
ratio
n &
mai
nten
ance
of e
quip
men
t13
,480
9,21
39,
378
9,43
961
25.8
Sub
sist
ence
& s
uppo
rt of
per
sons
322
195
216
220
426
Sup
plie
s an
d m
ater
ials
4,29
52,
690
4,51
54,
466
(49)
31E
quip
men
t7
106
458
27
087
748
940
231
Equ
ipm
ent
7,10
64,
582
7,08
77,
489
402
32La
nds
and
stru
ctur
es0
00
00
33In
vest
men
ts a
nd lo
ans
00
00
041
Gra
nts,
sub
sidi
es a
nd c
ontri
butio
ns0
00
00
42In
sura
nce
clai
ms
and
inde
mni
ties
00
00
043
Inte
rest
and
div
iden
ds0
00
00
44R
efun
ds0
00
00
99S
ubto
tal,
Dire
ct O
blig
atio
ns25
8,59
025
9,02
426
9,63
827
2,05
42,
416
Prio
r yea
r rec
over
ies
00
00
0U
nobl
igat
ed b
alan
ce, s
tart
of y
ear
00
00
0U
nobl
igat
ed b
alan
ce, e
xpiri
ng43
40
00
0U
nobl
igat
ed b
alan
ce, e
nd o
f yea
r0
00
00
Ref
und
00
00
0U
nobl
igat
ed b
alan
ce, r
esci
ssio
n0
00
00
TOTA
L, B
UD
GE
T A
UTH
OR
ITY
259,
024
259,
024
269,
638
272,
054
2,41
6
CEN-94

Dep
artm
ent o
f Com
mer
ceU
.S. C
ensu
s B
urea
uSa
larie
s an
d Ex
pens
es -
Dis
cret
iona
ry B
ASU
MM
ARY
OF
REQ
UIR
EMEN
TS B
Y O
BJEC
T C
LASS
Exhi
bit 1
6
Per
sonn
el fi
nanc
ed fr
om d
irect
obl
igat
ions
2010
A
ctua
l20
11 C
R(A
nnua
lized
)20
12B
ase
2012
Est
imat
e
Incr
ease
/ (D
ecre
ase)
ov
er B
ase
Full-
Tim
e eq
uiva
lent
em
ploy
men
t:
Ful
l-tim
e pe
rman
ent
926
1,51
71,
567
1,56
6(1
)
Oth
er th
an fu
ll-tim
e pe
rman
ent
922
507
458
426
(32)
T
otal
1,84
82,
024
2,02
51,
992
(33)
Aut
horiz
ed P
ositi
ons:
F
ull-t
ime
perm
anen
t94
51,
536
1,68
41,
714
30O
ther
than
full
time
perm
anen
t1
288
119
91
150
775
(375
)
Oth
er th
an fu
ll-tim
e pe
rman
ent
1,28
81,
199
1,15
077
5(3
75)
Tota
l2,
233
2,73
52,
834
2,48
9(3
45)
CEN-95

Dep
artm
ent o
f Com
mer
ceU
.S. C
ensu
s B
urea
uS
alar
ies
and
Exp
ense
s - M
anda
tory
BA
SU
MM
AR
Y O
F R
EQ
UIR
EM
EN
TS B
Y O
BJE
CT
CLA
SS
(Dol
lar a
mou
nts
in th
ousa
nds)
Exh
ibit
16
Obj
ect C
lass
2010
Act
ual
2011
Ena
cted
2012
Bas
e20
12E
nact
ed
Incr
ease
/ (D
ecre
ase)
ov
er B
ase
11P
erso
nnel
com
pens
atio
n11
.1Fu
ll-tim
e pe
rman
ent
$9,9
30$9
,335
$10,
818
$10,
818
$011
.3O
ther
than
full-
time
perm
anen
t5,
167
6,10
95,
198
5,19
80
11.5
Oth
er p
erso
nnel
com
pens
atio
n78
039
237
237
20
11.8
Spe
cial
per
sonn
el s
ervi
ces
paym
ents
00
00
0
11.9
Tota
l per
sonn
el c
ompe
nsat
ion
15,8
7715
,836
16,3
8816
,388
0
12.1
Civ
ilian
per
sonn
el b
enef
its4,
375
3,91
73,
630
3,63
00
13B
enef
its fo
r for
mer
per
sonn
el34
5121
210
21Tr
avel
and
tran
spor
tatio
n of
per
sons
1,63
71,
698
1,89
31,
893
022
Tran
spor
tatio
n of
thin
gs18
223
314
214
20
23.1
Ren
tal p
aym
ents
to G
SA
1,45
31,
275
1,27
51,
275
023
.2R
enta
l pay
men
ts to
oth
ers
10
00
023
.3C
omm
unic
atio
n, u
tiliti
es, m
isc.
cha
rges
762
429
529
529
024
Prin
ting
and
repr
oduc
tion
171
321
184
184
025
.1A
dvis
ory
and
assi
stan
ce s
ervi
ces
1,20
74,
727
1,60
31,
603
025
.2O
ther
ser
vice
s70
51,
250
777
777
025
.3P
urch
ases
of g
oods
and
svc
s. fr
om g
ov't
acct
s.1,
123
1,31
41,
327
1,32
70
25.4
Ope
ratio
n &
mai
nten
ance
of f
acili
ties
506
376
483
483
025
.5R
esea
rch
& d
evel
opm
ent c
ontra
cts
208
821
10
25.6
Med
ical
car
e0
00
00
25.7
Ope
ratio
n &
mai
nten
ance
of e
quip
men
t83
260
183
683
60
25.8
Sub
sist
ance
& s
uppo
rt of
per
sons
100
9087
870
26S
uppl
ies
and
mat
eria
ls28
917
839
339
30
31E
quip
men
t38
238
343
143
10
qp
32La
nds
and
stru
ctur
es0
00
00
33In
vest
men
ts a
nd lo
ans
00
00
041
Gra
nts,
sub
sidi
es a
nd c
ontri
butio
ns0
00
00
42In
sura
nce
clai
ms
and
inde
mni
ties
00
00
043
Inte
rest
and
div
iden
ds0
00
00
44R
efun
ds0
00
00
99S
ubto
tal,
Dire
ct O
blig
atio
ns29
,844
32,7
6130
,000
30,0
000
Prio
r yea
r rec
over
ies
00
00
0U
nobl
igat
ed b
alan
ce, s
tart
of y
ear
(2,7
61)
(2,7
61)
00
0U
nobl
igat
ed b
alan
ce, e
xpiri
ng15
60
00
0U
nobl
igat
ed b
alan
ce, e
nd o
f yea
r2,
761
00
00
Ref
und
00
00
0U
nobl
igat
ed b
alan
ce, r
esci
ssio
n0
00
00
TOTA
L, B
UD
GE
T A
UTH
OR
ITY
30,0
0030
,000
30,0
0030
,000
0
CEN-96

Dep
artm
ent o
f Com
mer
ceU
.S. C
ensu
s B
urea
uSa
larie
s an
d Ex
pens
es -
Man
dato
ry B
ASU
MM
ARY
OF
REQ
UIR
EMEN
TS B
Y O
BJEC
T C
LASS
(Dol
lar a
mou
nts
in th
ousa
nds)
Exhi
bit 1
6
Per
sonn
el fi
nanc
ed fr
om d
irect
obl
igat
ions
2010
Act
ual
2011
Ena
cted
2012
Bas
e20
12E
nact
ed
Incr
ease
/ (D
ecre
ase)
ov
er B
ase
Full-
Tim
e eq
uiva
lent
em
ploy
men
t:
Ful
l-tim
e pe
rman
ent
8511
913
113
10
O
ther
than
full-
time
perm
anen
t19
517
814
314
30
T
otal
280
297
274
274
0
Aut
horiz
ed P
ositi
ons:
F
ull-t
ime
perm
anen
t87
121
142
142
0O
ther
than
full
time
perm
anen
t18
179
144
144
0
Oth
er th
an fu
ll-tim
e pe
rman
ent
1817
914
414
40
Tota
l10
530
028
628
60
CEN-97

Exhibit 32
Department of Commerce
U.S. Census Bureau Salaries and Expenses
JUSTIFICATION OF PROPOSED LANGUAGE CHANGES 1. After the amount add the words “provided, that from amounts provided herein, funds
may be used for promotion, outreach, and marketing activities.” Similar language currently appears in the Periodic Censuses and Programs appropriation in the FY 2011 President's Budget. We are proposing to add this language to the Salaries and Expenses appropriation. We propose this language because the Census Bureau seeks to, within current funding levels, maintain a limited core promotion, outreach, education and marketing capability, as well as a cadre of outreach and data user training and support specialists in the regional offices drawn from top performing 2010 Census staff. This is essential because the Census Bureau contacts 4 million households per year and will be contacting every business in the United States during the 2012 and 2017 Economic Censuses. Increased cooperation and response rates provide better quality data. Making census and survey data more accessible to a broader audience, including less sophisticated data users like students, business owners, and residents who want to better understand their communities, will improve respondent cooperation and increase the public’s support for high-quality data, as well as help the Census Bureau meet the President’s Executive Order on Transparency and Open Government. The Census Bureau needs to improve public engagement and cooperation with all Census Bureau censuses and surveys. Efforts to promote the decennial census only have a short-term effect on Census Bureau awareness. Absent the ability to support a core promotion capability, the Census Bureau is missing an opportunity to sustain the public cooperation achieved during the 2010 Census and expand support for the other censuses and surveys conducted throughout the decade. However, as part of the 2010 Decennial Census Program, the Census Bureau is conducting a comprehensive assessment of the Integrated Communications Program, to the extent possible, to assess the impact of the program in meeting the goals of improving the mail response rate and the overall accuracy, encouraging cooperation with enumerators, and reducing the differential undercount, to be completed during the 2012 fiscal year. While it is impossible to tease out which of the varied and diverse promotional and partnership efforts helped us match the 2000 mail back participation rate, the GAO and others credit the advertising and promotion effort with helping make the 2010 Census a success and in achieving the substantial budget savings. While we achieved similar results with the first-ever promotional effort for the 2000 Census, research demonstrates the benefit to the Census Bureau was temporary, and we had to spend substantially more in 2010 to simply recover the gains we made in 2000. A small, low key, but more targeted and sustained promotional effort in non-decennial years will not only benefit all other Census Bureau surveys but raise the floor upon which we will start the outreach for the 2020 Census.
CEN-98

Exhibit 33
Department of Commerce U.S. Census Bureau
Salaries and Expenses Appropriation Language and Code Citations:
1. For expenses necessary for collecting, compiling, analyzing, preparing, and publishing
statistics, provided for by law, $274,754,000, provided, that from amounts provided herein, funds may be used for promotion, outreach, and marketing activities.
13 U.S.C. §§4, 6, 8(b), 12, 61-63, 181, 182, 301-307, 401; 15 U.S.C. §§1516, 4901 et seq.; 19 U.S.C. §§1484(e), 2354, 2393; 44 U.S.C. §1343.
13 U.S.C. §4 authorizes the Secretary to "perform the functions and duties imposed upon him by this title," or he may delegate any of them "to such officers and employees of the Department of Commerce as he may designate."
13 U.S.C. §§6, 8(b), 12, 61-63, 182, 301-307 provide for (1) acquisition of information from other organizations, public and private; (2) conducting joint statistical projects with nonprofit organizations or agencies; (3) conducting mechanical and electronic developmental work as needed; (4) collection and publication of statistics on fats and oils; (5) collection and publication of statistics relating to the domestic apparel and textile industries; (6) collection and publication of quarterly financial statistics of business operations; (7) conducting current surveys on statistical subjects covered by periodic censuses; and (8) compilation and publication of information on imports, exports, and mode of transportation.
13 U.S.C. §181 provides that "The Secretary...shall annually produce and publish for each state, county, and local unit of general purpose government which has a population of fifty thousand or more, current data on total population and population characteristics and...shall biennially produce and publish for other local units of general purpose government current data on total population."
13 U.S.C. §401 provides that "The Bureau of the Census shall exchange with the Bureau of Economic Analysis of the Department of Commerce information collected under this title, and under the International Investment and Trade in Services Survey Act, that pertains to any business enterprise that is operating in the United States, if the Secretary of Commerce determines such information is appropriate to augment and improve the quality of data collected under the International Investment and Trade in Services Survey Act."
15 U.S.C. §1516 provides that "The Secretary of Commerce shall have control of the work of gathering and distributing statistical information naturally relating to the subjects confided to his department...He shall also have authority to call upon other departments of the government for statistical data and results obtained by them; and he may collate, arrange, and publish such statistical information so obtained in such manner as to him may seem wise."
CEN-99

15 U.S.C. §4901 et seq. provides that "The Secretary [of Commerce] shall establish the [National Trade] Data Bank. The Secretary shall manage the Data Bank."
19 U.S.C. §1484(e) provides that "The Secretary of the Treasury, the Secretary of Commerce, and the United States International Trade Commission are authorized and directed to establish...an enumeration of articles...comprehending all merchandise imported into the United States and exported from the United States, and shall seek, in conjunction with statistical programs for domestic production and programs for achieving international harmonization of trade statistics, to establish the comparability thereof with such enumeration of articles."
19 U.S.C. §2354 provides that "Whenever the [International Trade] Commission begins an investigation...with respect to an industry, the Commission shall immediately notify the Secretary [of Commerce] of such investigation, and the Secretary shall immediately begin a study of:
(1) the number of firms in the domestic industry producing the like or directly
competitive article which have been or are likely to be certified as eligible for adjustment assistance, and
(2) the extent to which the orderly adjustment of such firms to the import
competition may be facilitated through the use of existing programs."
19 U.S.C. §2393 provides that "The Secretary of Commerce and the Secretary of Labor shall establish and maintain a program to monitor imports of articles into the United States which will reflect changes in the volume of such imports, the relation of such imports to changes in domestic production, changes in employment within domestic industries producing articles like or directly competitive with such imports, and the extent to which such changes in production and employment are concentrated in specific geographic regions of the United States." 44 U.S.C. §1343 provides that “In addition to the usual number of the Statistical Abstract of the United States, twelve thousand copies shall be printed: three thousand for the Senate, six thousand for the House of Representatives, and three thousand for distribution by the Secretary of Commerce.”
CEN-100
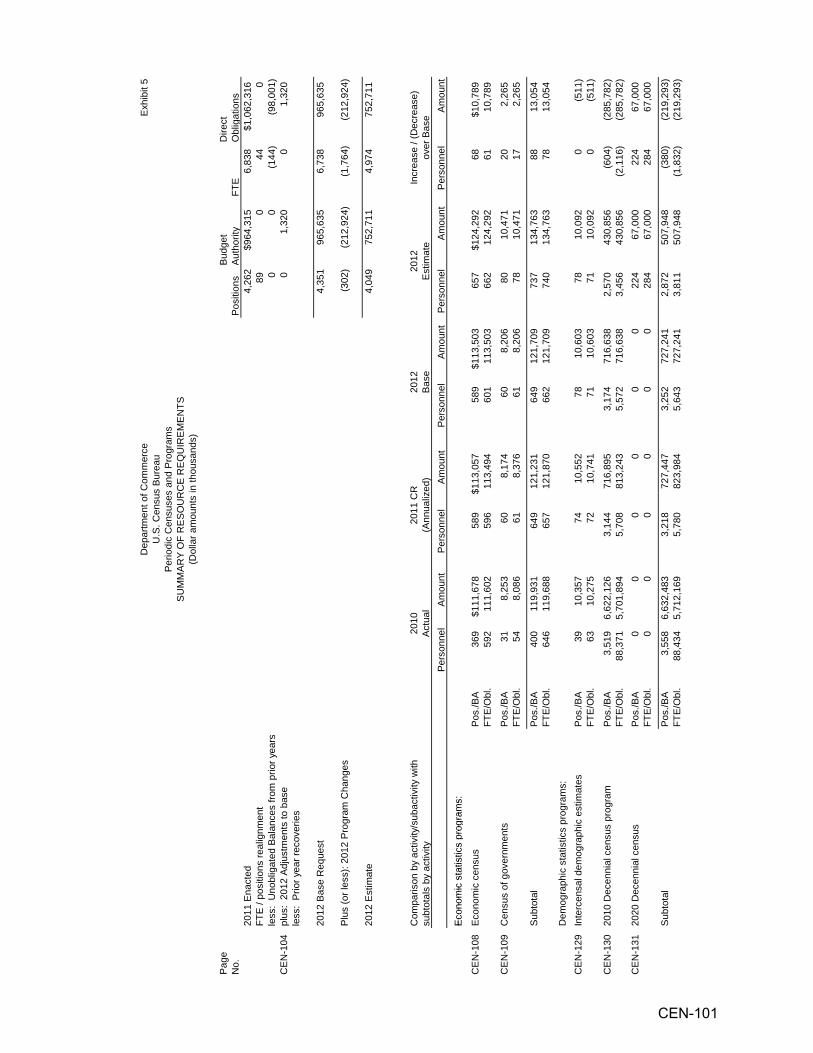
Exh
ibit
5
Pag
e
No.
Pos
ition
sB
udge
t A
utho
rity
FTE
Dire
ct
Obl
igat
ions
2011
Ena
cted
4,26
2$9
64,3
156,
838
$1
,062
,316
FTE
/ po
sitio
ns re
alig
nmen
t89
044
0
less
: U
nobl
igat
ed B
alan
ces
from
prio
r yea
rs0
0(1
44)
(98,
001)
CE
N-1
04pl
us:
2012
Adj
ustm
ents
to b
ase
01,
320
01,
320
less
: P
rior y
ear r
ecov
erie
s
2012
Bas
e R
eque
st4,
351
965,
635
6,73
896
5,63
5
Plu
s (o
r les
s): 2
012
Pro
gram
Cha
nges
(302
)(2
12,9
24)
(1,7
64)
(212
,924
)
2012
Est
imat
e4,
049
752,
711
4,97
475
2,71
1
Com
paris
on b
y ac
tivity
/sub
activ
ity w
ith
subt
otal
s by
act
ivity
Per
sonn
elA
mou
ntP
erso
nnel
Am
ount
Per
sonn
elA
mou
ntP
erso
nnel
Am
ount
Per
sonn
elA
mou
nt
Eco
nom
icst
atis
tics
prog
ram
s:
(Dol
lar a
mou
nts
in th
ousa
nds)
Dep
artm
ent o
f Com
mer
ceU
.S. C
ensu
s B
urea
uP
erio
dic
Cen
suse
s an
d P
rogr
ams
SU
MM
AR
Y O
F R
ES
OU
RC
E R
EQ
UIR
EM
EN
TS
2010
Act
ual
Incr
ease
/ (D
ecre
ase)
over
Bas
e20
11 C
R
(Ann
ualiz
ed)
2012
B
ase
2012
Est
imat
e
Eco
nom
ic s
tatis
tics
prog
ram
s:
CE
N-1
08E
cono
mic
cen
sus
Pos
./BA
369
$111
,678
589
$113
,057
589
$113
,503
657
$124
,292
68$1
0,78
9FT
E/O
bl.
592
111,
602
596
113,
494
601
113,
503
662
124,
292
6110
,789
CE
N-1
09C
ensu
s of
gov
ernm
ents
Pos
./BA
318,
253
608,
174
608,
206
8010
,471
202,
265
FTE
/Obl
.54
8,08
661
8,37
661
8,20
678
10,4
7117
2,26
5
Sub
tota
lP
os./B
A40
011
9,93
164
912
1,23
164
912
1,70
973
713
4,76
388
13,0
54FT
E/O
bl.
646
119,
688
657
121,
870
662
121,
709
740
134,
763
7813
,054
Dem
ogra
phic
sta
tistic
s pr
ogra
ms:
C
EN
-129
Inte
rcen
sal d
emog
raph
ic e
stim
ates
Pos
./BA
3910
,357
7410
,552
7810
,603
7810
,092
0(5
11)
FTE
/Obl
.63
10,2
7572
10,7
4171
10,6
0371
10,0
920
(511
)
CE
N-1
3020
10 D
ecen
nial
cen
sus
prog
ram
Pos
./BA
3,51
96,
622,
126
3,14
471
6,89
53,
174
716,
638
2,57
043
0,85
6(6
04)
(285
,782
)FT
E/O
bl.
88,3
715,
701,
894
5,70
881
3,24
35,
572
716,
638
3,45
643
0,85
6(2
,116
)(2
85,7
82)
CE
N-1
3120
20 D
ecen
nial
cen
sus
Pos
./BA
00
00
00
224
67,0
0022
467
,000
FTE
/Obl
.0
00
00
028
467
,000
284
67,0
00
Sub
tota
lP
os./B
A3,
558
6,63
2,48
33,
218
727,
447
3,25
272
7,24
12,
872
507,
948
(380
)(2
19,2
93)
FTE
/Obl
.88
,434
5,71
2,16
95,
780
823,
984
5,64
372
7,24
13,
811
507,
948
(1,8
32)
(219
,293
)
CEN-101

Com
paris
on b
y ac
tivity
/sub
activ
ity w
ith
subt
otal
s b y
act
ivity
Per
sonn
elA
mou
ntP
erso
nnel
Am
ount
Per
sonn
elA
mou
ntP
erso
nnel
Am
ount
Per
sonn
elA
mou
ntC
EN
-172
Dem
ogra
phic
sur
veys
sam
ple
rede
sign
Pos
./BA
37$1
1,49
374
$1
1,71
379
$11,
772
70$9
,833
(9)
($1,
939)
FTE
/Obl
.58
11,2
9774
12,0
5471
11,7
7262
9,83
3(9
)(1
,939
)C
EN
-179
Geo
grap
hic
supp
ort
Pos
./BA
115
41,6
8132
168
,598
371
69,1
6337
067
,735
(1)
(1,4
28)
FTE
/Obl
.19
041
,512
327
68,8
4936
269
,163
361
67,7
35(1
)(1
,428
)C
EN
-184
Dat
a pr
oces
sing
sys
tem
sP
os./B
A0
31,1
190
35,3
260
35,7
500
32,4
320
(3,3
18)
FTE
/Obl
.0
31,0
610
35,5
590
35,7
500
32,4
320
(3,3
18)
TOTA
LSP
os./B
A4,
110
6,83
6,70
74,
262
964,
315
4,35
196
5,63
54,
049
752,
711
(302
)(2
12,9
24)
FTE
/Obl
.89
,328
5,91
5,72
76,
838
1,06
2,31
66,
738
965,
635
4,97
475
2,71
1(1
,764
)(2
12,9
24)
A
djus
tmen
ts to
Obl
igat
ions
:
Rec
over
ies
(9,0
83)
00
00
U
nobl
igat
ed b
alan
ce, s
tart
of y
ear
(921
,071
)(1
,838
,001
)0
00
F
undi
ng d
efer
red
to F
Y 20
110
00
00
U
nobl
igat
ed b
alan
ce, e
xpiri
ng15
,127
00
00
U
nobl
igat
ed b
alan
ce, e
nd o
f yea
r1,
838,
003
1,74
0,00
00
00
R
efun
d(1
,996
)0
00
0
2010
Act
ual
2011
CR
(A
nnua
lized
)20
12
Bas
eIn
crea
se /
(Dec
reas
e)
ov
er B
ase
2012
Est
imat
e
(,
)
Adj
ustm
ents
to B
udge
t Aut
horit
y:
Uno
blig
ated
Bal
ance
, Res
ciss
ion
129,
000
00
00
Fina
ncin
g fro
m tr
ansf
ers:
T
rans
fer f
rom
oth
er a
ccou
nts
00
00
0
Tra
nsfe
r to
othe
r acc
ount
s0
00
00
Sub
tota
l, A
ppro
pria
tion
Pos
.4,
110
6,96
5,70
74,
262
964,
315
4,35
196
5,63
54,
049
752,
711
(302
)(2
12,9
24)
CEN-102

Dep
artm
ent o
f Com
mer
ceU
.S. C
ensu
s B
urea
u Pe
riodi
c C
ensu
ses
and
Prog
ram
s SU
MM
ARY
OF
FIN
ANC
ING
(Dol
lar a
mou
nts
in th
ousa
nds)
Exhi
bit
7
2010
Actu
al20
11 C
R(A
nnua
lized
)20
12
Base
2012
Es
timat
e
Incr
ease
/ (D
ecre
ase)
over
Bas
eAm
ount
Amou
ntAm
ount
Amou
ntAm
ount
Tota
l Obl
igat
ions
$5,9
15,7
27$1
,062
,316
$965
,635
$752
,711
($21
2,92
4)
Fina
ncin
g: O
ffset
ting
colle
ctio
ns fr
om:
F
eder
al F
unds
0
00
00
Tr
ust F
unds
00
00
0
Non
-fede
ral s
ourc
es0
00
00
Net
of R
ecov
erie
s / T
rans
fer
(9,0
83)
00
00
Uno
blig
ated
bal
ance
, sta
rt of
yea
r(9
21,0
71)
(1,8
38,0
01)
00
0Fu
ndin
g de
ferr
ed to
FY
2011
00
00
0U
nobl
igat
ed b
alan
ce, e
xpiri
ng15
,127
00
00
Uno
bli g
ated
bal
ance
, end
of y
ear
1,83
8,00
31,
740,
000
00
0U
nobl
igat
ed b
alan
ce, e
nd o
f yea
r1,
838,
003
1,74
0,00
00
00
Ref
und
(1,9
96)
00
00
Dis
cret
iona
ry B
udge
t Aut
horit
y6,
836,
707
964,
315
965,
635
752,
711
(212
,924
)
U
nobl
igat
ed B
alan
ce, R
esci
ssio
n12
9,00
00
00
0
Fina
ncin
g:
Tra
nsfe
r fro
m o
ther
acc
ount
s0
00
00
T
rans
fer t
o ot
her a
ccou
nts
00
00
0
Tota
l, D
iscr
etio
nary
App
ropr
iatio
n6,
965,
707
964,
315
965,
635
752,
711
(212
,924
)
CEN-103

Exh
ibit
9
Adj
ustm
ents
:FT
EA
mou
nt
0($
2,29
5)
Oth
er C
hang
es:
0(4
18)
($41
8,16
5)
989,
656
1,40
7,82
1
(4
18,1
65)
069
9
This
will
resu
lt in
an
incr
ease
of:
$698
,932
21,6
43,6
02
20,9
44,6
70
69
8,93
2
This
will
resu
lt in
a d
ecre
ase
of:
Civ
il S
ervi
ce R
etire
men
t Sys
tem
(CS
RS
)……
…...
……
……
……
……
……
……
…...
……
……
……
……
……
……
……
……
……
……
……
……
……
.
The
estim
ated
per
cent
age
of p
ayro
ll fo
r em
ploy
ees
cove
red
by C
SR
S w
ill de
crea
se fr
om 1
0.1%
in F
Y 20
11 to
7.1
% in
FY
2012
. Th
e ag
ency
co
ntrib
utio
n ra
te w
ill re
mai
n 7.
0% in
FY
2012
.
The
estim
ated
per
cent
age
of p
ayro
ll fo
r em
ploy
ees
cove
red
by F
ER
S w
ill in
crea
se fr
om 8
9.9%
in F
Y 20
11 to
92.
9% in
FY
2012
. Th
e ag
ency
co
ntrib
utio
n ra
te w
ill re
mai
n 11
.7%
in F
Y 20
12.
Reg
ular
em
ploy
ees:
2012
$1
99,1
26,0
00 x
92.
9% x
11.
7%…
……
..……
..……
……
……
..……
……
……
……
Dep
artm
ent o
f Com
mer
ce
(Dol
lar a
mou
nts
in th
ousa
nds)
2011
$1
99,1
26,0
00 x
89.
9% x
11.
7%…
……
…..…
…...
……
……
…..…
……
……
……
Tota
l, ad
just
men
t-to-
base
……
……
……
……
……
……
...…
……
……
….…
.……
……
..…
U.S
. Cen
sus
Bur
eau
JUS
TIFI
CA
TIO
N O
F A
DJU
STM
EN
TS T
O B
AS
EP
erio
dic
Cen
suse
s an
d P
rogr
ams
Red
uctio
n of
FY
2011
pay
rais
e……
……
..…..…
….…
……
……
……
……
...…
……
.……
……
……
……
……
……
……
……
……
……
……
……
……
..
Fede
ral E
mpl
oyee
s' R
etire
men
t Sys
tem
(FE
RS
)……
……
..……
……
……
……
……
……
…..…
……
……
……
……
……
...…
……
……
...…
….…
….
Tota
l, ad
just
men
t-to-
base
……
……
……
……
….…
……
..……
……
……
……
….…
……
…20
11
$199
,126
,000
x 1
0.1%
x 7
.0%
……
……
..……
..……
……
……
..……
……
……
…20
12
$199
,126
,000
x 7
.1%
x 7
.0%
……
……
….…
..……
……
……
..……
……
……
……
Reg
ular
em
ploy
ees:
CEN-104

Oth
er C
hang
es:
FTE
Am
ount
0$7
40
This
will
resu
lt in
an
incr
ease
of:
$740
,152
6,28
9,59
4
5,
549,
442
74
0,15
2
035
6
This
will
resu
lt in
a in
crea
se o
f:$3
55,9
31
11,2
74,2
82
10,9
43,5
01
33
0,78
1
857,
209
83
2,05
9
25
,150
35
5,93
1
Oth
er C
hang
es:
01,
215
Fede
ral I
nsur
ance
Con
tribu
tions
Act
(FIC
A)…
……
……
……
.……
……
……
……
…...
……
……
……
……
……
……
……
……
...…
…...
……
.……
…..
2012
$1
99,1
26,0
00 x
92.
9% x
98.
3% x
6.2
%…
……
…...
….…
……
..……
……
……
…R
egul
ar e
mpl
oyee
s:
Reg
ular
em
ploy
ees:
2012
$1
99,1
26,0
00 x
92.
9% x
3.4
%…
……
……
.....…
……
……
…..…
……
……
……
…20
11
$199
,126
,000
x 8
9.9%
x 3
.1%
……
……
…...
..……
……
……
..……
……
……
……
Tota
l, ad
just
men
t-to-
base
……
……
……
……
…...
……
..…...
…...
..……
……
……
……
…
S
ubto
tal…
……
……
……
…..…
……
……
……
..……
……
……
……
…..…
.….…
……
…To
tal,
adju
stm
ent-t
o-ba
se…
……
…..…
……
...…
……
..……
….…
……
…..…
……
……
…
The
est
imat
ed a
genc
y c
ontri
butio
n ra
te fo
r th
e T
hrift
Sav
ings
Pla
n w
ill in
crea
se f
rom
3.1
% i
n FY
201
1 to
3.4
% in
FY
2012
. F
ER
S
parti
cipa
tion
rate
s w
ill in
crea
se fr
om 8
9.9%
to 9
2.9%
in F
Y 20
12.
As
the
perc
enta
ge o
f pay
roll
cove
red
by F
ER
S in
crea
ses,
the
cost
of O
AS
DI c
ontri
butio
ns w
ill de
crea
se.
The
over
all p
erce
ntag
e of
sal
arie
s co
vere
d by
OA
SD
I will
decr
ease
to 9
8.3%
in F
Y 20
12 fr
om 9
8.6%
in F
Y 20
11.
The
OA
SD
I tax
rate
will
rem
ain
6.2%
in F
Y 20
12.
Effe
ctiv
e Ja
nuar
y 20
12, t
he C
ensu
s B
urea
u's
cont
ribut
ion
to F
eder
al e
mpl
oyee
's h
ealth
insu
ranc
e pr
emiu
ms
will
incr
ease
by
7.6%
. A
pplie
d ag
ains
t the
FY
2011
est
imat
e of
$15
,988
,000
the
incr
ease
will
be $
1,21
5,08
8.
Hea
lth In
sura
nce…
……
...…
……
……
……
……
……
.……
…...
……
……
……
……
……
……
……
……
……
……
……
……
……
……
……
……
……
…..
Thrif
t Sav
ings
Pla
n (T
SP
)……
……
……
...…
……
..……
……
……
……
...…
……
……
…..…
……
……
……
……
..……
……
……
……
……
……
……
….
2011
$1
99,1
26,0
00 x
89.
9% x
98.
6% x
6.2
%…
……
….…
……
..……
...…
……
……
…
Sub
tota
l……
……
……
……
……
……
……
……
….…
……
……
..……
……
……
…...
……
Oth
er s
alar
ies:
2011
$1
5,14
0,00
0 x
89.9
% x
98.
6% x
6.2
%…
……
……
…...
……
…..…
……
……
……
2012
$1
5,14
0,00
0 x
92.9
% x
98.
3% x
6.2
%…
……
……
……
.……
…..…
……
……
……
CEN-105

FTE
Am
ount
Em
ploy
ees'
Com
pens
atio
n Fu
nd…
……
……
……
…..…
….…
……
……
……
……
……
….…
……
……
……
……
……
……
...…
……
……
……
……
……
0
$3,7
16
016
6
Oth
er C
hang
es:
0(1
,355
)
027
2
042
0(7
98)
Wor
king
Cap
ital F
und…
……
..……
……
……
……
…..…
......
……
……
……
……
...…
……
……
……
…..…
……
….…
……
……
……
……
…...
..……
….
The
cost
of t
he D
epar
tmen
t of C
omm
erce
's W
orki
ng C
apita
l Fun
d w
ill de
crea
se b
y $7
98,0
00
Mile
age…
……
……
……
……
….…
……
……
.……
...…
……
……
……
……
……
……
……
….…
……
……
……
……
…...
……
.……
……
……
……
……
..
The
Em
ploy
ees'
Com
pens
atio
n Fu
nd B
ill fo
r the
yea
r end
ing
June
30,
201
0 is
$3,
716,
751
high
er th
an th
e bi
ll fo
r the
yea
r end
ing
June
30,
20
09.
The
Cen
sus
Bur
eau
will
reim
burs
e th
e D
epar
tmen
t of L
abor
pur
suan
t to
5 U
.S.C
. § 8
147.
Effe
ctiv
e O
ctob
er 1
, 201
0, th
e G
ener
al S
ervi
ces
Adm
inis
tratio
n ch
ange
d pe
r die
m ra
tes.
Thi
s re
sults
in a
n in
crea
se o
f 3.5
%.
This
per
cent
age
was
app
lied
to th
e 20
11 e
stim
ate
of $
4,73
8,00
0 to
arr
ive
at a
n in
crea
se o
f $16
5,83
0.
Per
Die
m…
……
……
……
……
……
……
……
…...
.……
……
……
..……
……
……
……
……
……
……
……
……
……
…..…
……
……
……
……
……
..….
GS
A ra
tes
are
proj
ecte
d to
incr
ease
1.7
% o
ver t
he F
Y 20
11 e
stim
ate
of $
15,9
96,0
00 fo
r cur
rent
ly o
ccup
ied
spac
e. T
his
resu
lts in
an
incr
ease
of
$27
1,93
2.
GP
O h
as p
rovi
ded
an e
stim
ated
rate
incr
ease
of 1
.2%
. Th
is p
erce
ntag
e w
as a
pplie
d to
the
FY 2
011
estim
ate
of $
3,49
9,00
0 to
arr
ive
at a
n in
crea
se o
f $41
,988
.
GP
O P
rintin
g……
……
..……
……
……
……
…..…
......
……
……
……
……
...…
……
……
……
…..…
……
….…
……
……
……
……
…...
……
.……
……
.
Ren
tal P
aym
ents
to G
SA
……
……
……
.……
……
……
……
…...
..……
…..…
……
……
…..…
……
……
……
….…
……
……
……
……
…...
……
.……
.
Cha
nges
to th
e Fe
dera
l Tra
vel R
egul
atio
ns o
n Ja
nuar
y 1,
201
0 de
crea
sed
the
rate
of t
he u
se o
f priv
atel
y ow
ned
auto
mob
iles
from
55
cent
s to
50
cen
ts.
This
repr
esen
ts a
9%
dec
reas
e. T
his
perc
enta
ge w
as a
pplie
d to
the
FY 2
011
mile
age
estim
ate
of $
15,0
59,0
00 fo
r a d
ecre
ase
of
$1,3
55,3
10.
CEN-106

Oth
er C
hang
es:
FTE
Am
ount
0$1
,723
21,8
16
69
,840
1,43
0,53
2
41,5
20
157,
572
0
6,35
8
0
4,06
3
0
(2,7
43)
0
1,32
0
Equ
ipm
ent…
……
……
……
……
……
……
.……
...…
……
……
……
……
......
……
……
……
Sup
plie
s an
d m
ater
ials
……
……
……
……
.……
……
……
..……
……
......
……
……
...…
…
Com
mun
icat
ions
, util
ities
, and
mis
cella
neou
s ch
arge
s (e
xclu
ding
pos
tage
)……
..…..
Oth
er s
ervi
ces…
……
……
……
.……
….…
……
……
….…
……
……
...…
...…
……
……
…
This
requ
est a
pplie
s O
MB
eco
nom
ic a
ssum
ptio
ns o
f 1.3
% fo
r FY
2012
whe
re th
e pr
ices
that
the
Gov
ernm
ent p
ays
are
esta
blis
hed
thro
ugh
the
mar
ket
syst
em.
Fact
ors
are
appl
ied
to s
ub-o
bjec
t cla
sses
that
resu
lt in
the
follo
win
g ad
just
men
ts to
bas
e:
Gen
eral
Pric
ing
Leve
l Adj
ustm
ent…
……
……
……
……
…...
……
…...
……
……
……
……
.....…
.……
……
…..…
……
……
……
……
……
……
……
…
Tran
spor
atio
n of
thin
gs…
……
……
……
……
…..…
.….…
……
……
……
..……
……
……
Sub
tota
l, ot
her c
hang
es .…
……
……
……
……
……
……
……
……
……
…...
……
……
……
……
……
…..…
……
……
……
……
……
……
……
……
…
Sub
tota
l, ad
just
men
ts to
bas
e …
……
……
……
……
……
……
.……
……
……
.....…
……
……
……
……
……
…...
……
……
……
……
……
……
……
..
Less
: pa
rtial
abs
orpt
ion
of e
mpl
oyee
com
pens
atio
n ad
just
men
t to
base
……
……
……
……
…..…
...…
……
……
.……
……
..……
……
……
……
..
Tota
l, ad
just
men
ts to
bas
e …
……
……
……
……
……
……
……
……
……
……
……
……
……
……
..……
……
……
……
…..…
…..…
…..…
……
……
.
CEN-107

Dep
artm
ent o
f Com
mer
ceU
.S. C
ensu
s B
urea
uP
erio
dic
Cen
suse
s an
d P
rogr
ams
PR
OG
RA
M A
ND
PE
RFO
RM
AN
CE
: D
IRE
CT
OB
LIG
ATI
ON
S(D
olla
r am
ount
s in
thou
sand
s)
Exh
ibit
10
Activ
ity:
Econ
omic
sta
tistic
s pr
ogra
ms
Suba
ctiv
ity: E
cono
mic
cen
sus
Line
Item
Pers
onne
lAm
ount
Pers
onne
lAm
ount
Pers
onne
lAm
ount
Pers
onne
lAm
ount
Pers
onne
lAm
ount
Dire
ctio
nPo
s./B
A17
$8,6
9941
$8,9
8241
$9,0
3356
$8,8
8415
($14
9)FT
E/O
bl.
278,
961
419,
001
419,
033
578,
884
16(1
49)
Con
tent
det
erm
inat
ion
and
desi
gnPo
s./B
A0
022
741
,087
227
41,4
2814
025
,696
(87)
(15,
732)
FTE/
Obl
.0
1622
641
,140
231
41,4
2813
225
,696
(99)
(15,
732)
Mai
l lis
t dev
elop
men
t and
mai
lout
Pos.
/BA
00
00
00
598,
003
598,
003
FTE/
Obl
.0
20
80
061
8,00
361
8,00
3C
olle
ctio
n an
d pr
oces
sing
Pos.
/BA
132
35,7
6327
850
,514
27
850
,724
355
74,3
7377
23,6
49FT
E/O
bl.
212
36,0
9128
550
,871
28
550
,724
364
74,3
7379
23,6
49
Publ
icat
ion
and
diss
emin
atio
nPo
s./B
A22
067
,216
4312
,474
43
12,3
1847
7,33
64
(4,9
82)
FTE/
Obl
.35
366
,532
4412
,474
44
12,3
1848
7,33
64
(4,9
82)
Tota
lPo
s./B
A36
911
1,67
858
911
3,05
7
58
911
3,50
365
712
4,29
268
10,7
89FT
E/O
bl.
592
111,
602
596
113,
494
601
113,
503
662
124,
292
6110
,789
Adju
stm
ents
to O
blig
atio
ns:
R
ecov
erie
s(3
33)
U
nobl
igat
ed b
alan
ce, s
tart
of y
ear
(301
)
(4
37)
Incr
ease
/ (D
ecre
ase)
o
ver B
ase
2010
Ac
tual
2011
CR
(Ann
ualiz
ed)
2012
Base
2012
Estim
ate
g,
y(
)(
)
Fun
ding
def
erre
d to
FY
2011
U
nobl
igat
ed b
alan
ce, e
xpiri
ng27
3
U
nobl
igat
ed b
alan
ce, e
nd o
f yea
r43
7
R
efun
d
Adju
stm
ents
to B
udge
t Aut
horit
y:
Uno
blig
ated
Bal
ance
, Res
ciss
ion
Fina
ncin
g fro
m tr
ansf
ers:
T
rans
fer f
rom
oth
er a
ccou
nts
T
rans
fer t
o ot
her a
ccou
nts
Appr
opria
tion
Pos.
369
111,
678
589
113,
057
589
113,
503
657
124,
292
6810
,789
CEN-108
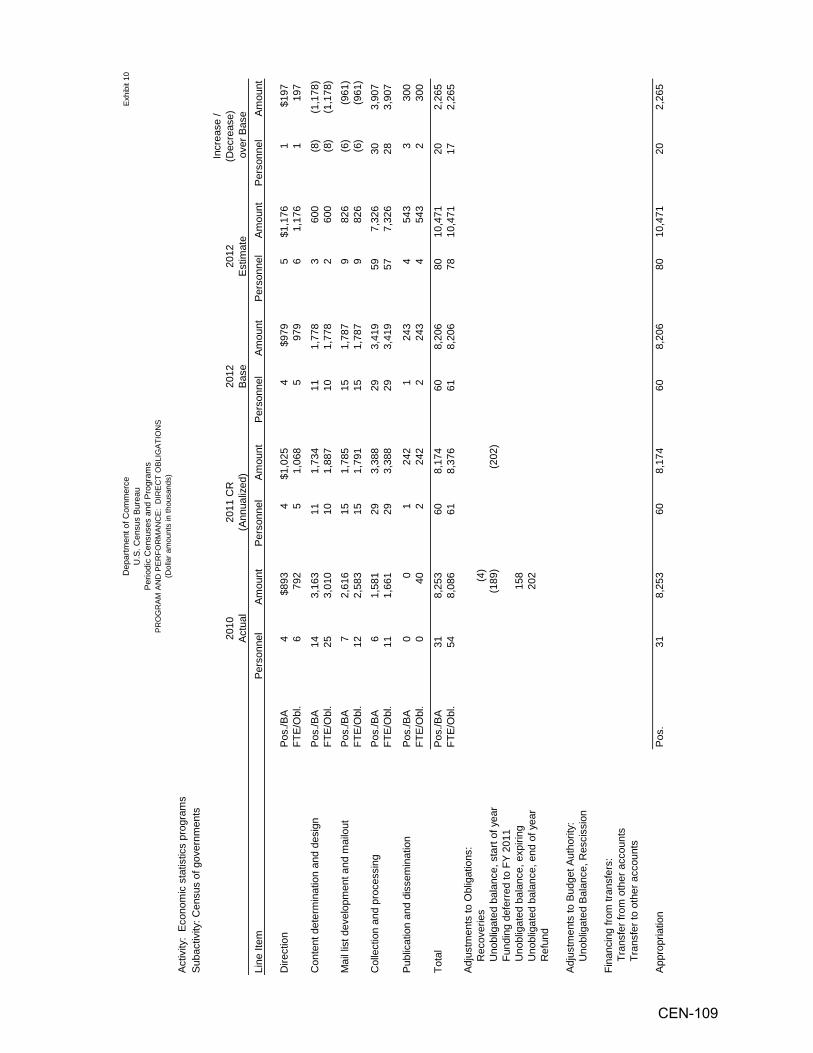
Dep
artm
ent o
f Com
mer
ceU
.S. C
ensu
s B
urea
uP
erio
dic
Cen
suse
s an
d P
rogr
ams
PR
OG
RA
M A
ND
PE
RFO
RM
AN
CE
: D
IRE
CT
OB
LIG
ATI
ON
S(D
olla
r am
ount
s in
thou
sand
s)
Exh
ibit
10
Activ
ity:
Econ
omic
sta
tistic
s pr
ogra
ms
Suba
ctiv
ity: C
ensu
s of
gov
ernm
ents
Line
Item
Pers
onne
lAm
ount
Pers
onne
lAm
ount
Pers
onne
lAm
ount
Pers
onne
lAm
ount
Pers
onne
lAm
ount
Dire
ctio
nPo
s./B
A4
$893
4$1
,025
4$9
795
$1,1
761
$197
FTE/
Obl
.6
792
51,
068
597
96
1,17
61
197
Con
tent
det
erm
inat
ion
and
desi
gnPo
s./B
A14
3,16
311
1,73
411
1,77
83
600
(8)
(1,1
78)
FT
E/O
bl.
253,
010
101,
887
101,
778
260
0(8
)(1
,178
)
Mai
l lis
t dev
elop
men
t and
mai
lout
Pos.
/BA
72,
616
151,
785
15
1,78
79
826
(6
)(9
61)
FTE/
Obl
.12
2,58
315
1,79
1
151,
787
982
6
(6)
(961
)
C
olle
ctio
n an
d pr
oces
sing
Pos.
/BA
61,
581
293,
388
29
3,41
959
7,32
6
30
3,90
7
FTE/
Obl
.11
1,66
129
3,38
8
293,
419
577,
326
283,
907
Publ
icat
ion
and
diss
emin
atio
nPo
s./B
A0
01
242
124
34
543
330
0FT
E/O
bl.
040
224
22
243
454
32
300
Tota
lPo
s./B
A31
8,25
360
8,17
4
60
8,20
680
10,4
71
20
2,26
5
FTE/
Obl
.54
8,08
661
8,37
6
61
8,20
678
10,4
71
17
2,26
5
Adju
stm
ents
to O
blig
atio
ns:
R
ecov
erie
s(4
)
Uno
blig
ated
bal
ance
, sta
rt of
yea
r(1
89)
(202
)
Incr
ease
/ (D
ecre
ase)
o
ver B
ase
2010
Actu
al
2011
CR
(Ann
ualiz
ed)
2012
Base
2012
Estim
ate
gy
()
()
F
undi
ng d
efer
red
to F
Y 20
11
Uno
blig
ated
bal
ance
, exp
iring
158
Uno
blig
ated
bal
ance
, end
of y
ear
202
Ref
und
Adju
stm
ents
to B
udge
t Aut
horit
y:
Uno
blig
ated
Bal
ance
, Res
ciss
ion
Fina
ncin
g fro
m tr
ansf
ers:
Tra
nsfe
r fro
m o
ther
acc
ount
s
Tra
nsfe
r to
othe
r acc
ount
s
Appr
opria
tion
Pos.
318,
253
608,
174
608,
206
8010
,471
202,
265
CEN-109
APPROPRIATION ACCOUNT: Periodic Censuses and Programs BUDGET ACTIVITY: Economic Statistics Programs
For FY 2012, the Census Bureau requests an increase of $13.1 million and 78 FTE over the FY 2012 base program for a total of $134.8 and 740 FTE for Economic Statistics Programs. BASE JUSTIFICATION FOR FY 2012: Economic Statistics Programs Overview The Census Bureau’s mission is to serve as the leading source of quality data about the nation’s people and economy. The Economic Statistics Programs activity furthers this mission by providing key benchmark measures about the U.S. economy and governments. The Economic Statistics Program ($134.8 million and 740 FTE) budget is organized into two subactivities under the Periodic Censuses and Programs account,
• The Economic Census subactivity ($124.3 million and 662 FTE) is organized into five line items representing major program components: Direction, Content Determination and Design, Mail List Development and Mailout, Collection and Processing, and Publication and Dissemination.
• The Census of Governments subactivity ($10.5 million and 78 FTE) is organized into five line items representing major program components: Direction, Content Determination and Design, Mail List Development and Mailout, Collection and Processing, and Publication and Dissemination.
· Significant Adjustments-to-Base (ATBs): The Census Bureau requests a net increase of 0 FTE and a net increase of $0.4 million to fund adjustments to current programs for Economic Statistics Programs activities. The increase will provide inflationary increases for non-labor activities, including service contracts, utilities, and rent charges from the General Services Administration (GSA). ADMINISTRATIVE COST SAVINGS The Administration is pursuing an aggressive government-wide effort to curb non-essential administrative spending called the Accountable Government Initiative. In order to be good stewards of taxpayer money, the Federal Government should continue to seek ways to improve the efficiency of programs without reducing their effectiveness. As such, the President directed each agency to analyze its administrative costs and identify savings where possible. After reviewing its administrative costs, the Census Bureau has identified $2,287,000 in administrative savings. The Census Bureau has targeted a number of areas to achieve its savings. Acquisition plans for FY 2012 account for $1,639,000 in savings. In the area of human capital, the Census Bureau expects to reduce its costs by $353,000 through position management and control and reduced workers compensation costs. Another $295,000 in administrative savings has been identified in logistics plans and in general administrative
Department of Commerce U.S. Census Bureau
Periodic Censuses and Programs PROGRAM JUSTIFICATION
CEN-110

support by limiting discretionary travel and printing. The $2,287,000 in administrative savings identified above represent real reductions to the Census Bureau’s funding level and will help reduce overall spending by the Federal Government. SUBACTIVITY: Economic census Economic Census Overview The objectives of the economic census subactivity are to provide the nation with comprehensive, detailed, and authoritative facts about the structure of the U.S. economy. Every five years, the economic census profiles the U.S. economy from the national to the local level. It provides official measures of output for industries and geographic areas. Economic policy makers in Federal, state, and local governments use economic census data to project trends, guide economic development, and assess the impact of economic policy. The data help build the foundation for Gross Domestic Product (GDP) and other indicators of economic performance. Title 13 U.S.C. §131 requires the censuses of manufactures, mineral industries, construction industries, retail and wholesale trade, service industries, transportation, and other businesses every five years, covering the years ending in “2” and “7.” The 2012 Economic Census will collect data on over 28 million establishments. The Census Bureau will minimize respondent burden by sending questionnaires to fewer than 25 percent of these establishments. Administrative records are used to obtain information for the remaining establishments, which include smaller businesses. For the 2012 Economic Census all respondents will have an opportunity to report electronically. Data will be disseminated through the American FactFinder. The economic census also includes several related programs that provide statistics on the characteristics of businesses, business expenses, and other items of national interest. The economic census includes the census of the island areas (Puerto Rico, Virgin Islands, Guam, American Samoa and Northern Mariana Islands) and surveys of businesses owned by women and minorities. The results of the census will be summarized and presented for various classifications, such as kind-of-business, geographic locations at various levels of aggregation, sales size, employment size, legal form of organization, and degree of specialization. The 2012 Economic Census consists of eight core program components and several related data collections. The core components are separately tailored for each major domestic business sector, provide comprehensive and detailed information on the structure of the U.S. non-farm economy, and are the cornerstone of our nation’s economic statistics programs. The related data collections are more specialized and provide supplementary information on businesses owned by women, minorities, supplementary information on expenditures and expenses for non-goods producing businesses, transportation information on the movement of goods, and periodic census information on the economies of Puerto Rico and island areas. The economic census represents the primary source of facts about the structure and function of the U.S. economy, providing essential information to government and business to help guide sound decisions. It furnishes an important part of the framework for composite measures, such as the GDP, and the Bureau of Economic Analysis’ (BEA) input-output analyses and National Income and Product Accounts that provide important information about market sectors, such as manufacturing. The National Accounts and practically all major government economic statistical series are directly or indirectly dependent on the economic census. Statistics, analyses, and economic research produced by BEA, Bureau of Labor Statistics, Federal Reserve Board, Department of Energy, and the Census Bureau are dependent on the economic census results. The economic census not only provides
CEN-111

BEA with vital source data for the national accounts, it also provides weights and benchmarks for indexes of industrial production, productivity, and prices. Moreover, the census furnishes benchmarks and sampling lists for the Census Bureau’s current economic programs and for many data series at other Federal agencies. Business enterprises, trade associations, banks, investors, economic development agencies, research groups, educational institutions, and unions use data from the census for planning expansion programs, selecting locations for new establishments, forecasting sales trends, determining market potential, forecasting sales and advertising performance, and performing other analyses. For example, the data are used to decide where to locate a plant, where to build a shopping center, or figure out what the market demand is for a product. In forecasting and planning, economic census results are the primary source of information about the changing structure of the U.S. economy. The census identifies industries and geographic areas that are experiencing rapid growth, as well as those that are declining. The information is also used to revise the North American Industry Classification System (NAICS) and to update the Business Register. Direction Direction includes planning and support activities required to conduct the census. Content determination and design Activities include a review of census program components and content, including the Survey of Business Owners and other census-related surveys, with business and government analysts, data providers, and other data users, as well as the design and printing of more than 550 industry specific report forms. Mail list development and mailout Activities include assembling and preparing the census mail list for over 28 million business locations. Specific activities include computer specifications, procurements and processing of administrative records, programming activities, and labeling and assembly of mail packages. Postage costs are included in this line item. Collection and processing This line item includes all collection and clerical operations conducted in Jeffersonville, Indiana at the Census Bureau’s National Processing Center. Activities include check-in of forms, data capture, customer support associated with handling incoming telephone calls and correspondence, re-mailing of forms and telephone follow-ups of delinquent reporters or businesses, computer edits of reported data, and the correction of erroneous and/or inconsistent data. This line item also includes the development, testing, and maintenance of processing systems and computer programs that support data collection and processing, including an electronic reporting infrastructure to support the electronic reporting option offered to over 4 million businesses. Publication and dissemination Activities include all operations related to data tabulations, final table review of tabulated census data, development of census products, review of disclosure avoidance patterns, and the dissemination of census results. More than 1,700 census products will be developed and delivered in electronic media supported by metadata, which describes the data to users, and support tools that let users access information across subject-related topics. Products will profile industries, geographic areas, and special subjects.
CEN-112

PROGRAM CHANGES FOR FY 2012: Economic census (Base Funding 601 FTE and $113.5 million; Program Change 61FTE and $10.8 million): Fiscal Year (FY) 2012 is the third year of the six-year 2012 Economic Census funding cycle. The focus of activity for FY 2012 is the development of the collection instruments and processing systems to be used in the 2012 Economic Census. Specific activities include outreach with over 1,500 of the largest companies about the census, development and creation of electronic tools and the Business Help Site to service respondent needs, conduct of a classification mailing in preparation of the census mail list, creation of the mail frame through the processing of 100+ million administrative records, printing of millions of report forms, and development of the processing systems to be used in the 2012 Economic Census. This program change includes a decrease of 4 FTE and $1.9 million in administrative savings and a cyclical increase of 65 FTE and $12.7 million. Proposed Actions: Direction (Base Funding 41 FTE and $9.0 million; Program Change 16 FTE and -$0.1 million): In FY 2012 the focus will be on implementing the design plan covering census content, collection, and all processing activities. Managers will direct the content determination and design, mail list development and mailout, collection and processing, and publication and dissemination activities outlined below. Further, they will monitor the census schedule, manage risks, and engage in other program and project management activities needed to ensure an effective and on-time census. Content determination and design (Base Funding 231 FTE and $41.4 million; Program Change -99 FTE and -$15.7 million): In FY 2012 we will complete the development of census content, design paper and electronic versions of collection instruments, secure Office of Management and Budget (OMB) clearance, complete the commercial printing of paper report forms, and prepare electronic reporting and other data collection systems that must be production-ready at the beginning of FY 2013. Work on content will include the development of content for a great variety of industry-specific special inquiries. Once content determination is complete, we will prepare paper and electronic layouts for more than 550 report form variations, each targeted at a specific industry or small group of related industries. Further, we will submit content and collection plans to the OMB and secure its clearance under the Paperwork Reduction Act. We also will work through the Government Printing Office to secure the services of commercial printing contractors, which must complete printing, assembly, and delivery of some 11 million report form packages needed for census mailout and followup operations. To promote reporting by large, economically significant multi-establishment businesses, we will send them advance information to help them prepare for census reporting, and we will engage about 2,000 of the largest companies through our Account Managers program. Finally, we will complete development, testing, and deployment of collection systems, including the Business Help Site and Secure Messaging Center, which provide assistance to business respondents, and two electronic reporting applications―the Surveyor system, which is tailored to the reporting needs of larger, multi-establishment businesses, and direct Internet reporting, which is tailored to the needs of single-establishment businesses. All of this makes us ready for collection operations that will begin in October 2012 and continue through October 2013. Mail list development and mailout (Base Funding 0 FTE and $0; Program Change 61 FTE and $8.0 million): In FY 2012 , we will carry out the 2011 Classification (Refile) Survey, and we will construct the economic census mailing list, which is derived from the Census Bureau’s Business Register. The 2011 Classification Survey will provide accurate NAICS codes for approximately
CEN-113
100,000 single-establishment businesses that would otherwise have missing, incomplete, or unreliable industry classifications on the Census Bureau’s Business Register. This activity is needed to ensure effective assignment of industry-specific report forms for the general census collection that will begin early in FY 2013. Other work needed to prepare the census mail list includes an early close-out of the 2011 Company Organization Survey and Annual Survey of Manufactures, which update the Business Register’s coverage of multi-establishment businesses, and the procurement and processing of additional administrative records content, which supports the census and provides observations (in lieu of direct collection) for nearly half of the Nation’s small, single-establishment businesses. Collection and processing (Base Funding 285 FTE and $50.7 million; Program Change 79 FTE and $23.6 million): In FY 2012, we will complete development and testing of census processing systems. This work includes migration of some systems from legacy information technology platforms to the Blade/Linux platforms that are the Census Bureau’s “go-to” architecture. Additionally, it includes the development, testing, and deployment of systems for receiving and checking in both paper and electronic reports; capturing data from paper reports; matching census responses to the Business Register, which serves as the mechanism for controlling complete, unduplicated coverage of the target population; performing a variety of data edits that identify inconsistent or statistically extreme responses; performing analytical review of individual responses; and correcting data as needed. This work prepares us for census data capture and processing operations, which must begin very early in FY 2013. Publication and dissemination (Base Funding 44 FTE and $12.3 million; Program Change 4 FTE and -$5.0 million): In FY 2012, we will plan data products and develop systems needed for preparation of statistical products, analytical review, disclosure avoidance, and delivery of products to the Census Bureau’s dissemination system, the American FactFinder. Product design will focus on the Advance Report, more than 600 Industry Series Reports, and early work on more than 800 Geographic Series Reports. Additionally, we will plan new products that profile the characteristics of U.S. enterprises, including measures of innovation and globalization. We also will develop new, more integrated tools designed to make analytical review of data products more effective, and we will develop an updated system that identifies and suppresses data that would disclose identifiable information about an individual business, as required by Title 13, United States Code, Section 9. These activities will prepare data products for release by means of an updated American FactFinder. Statement of Need and Economic Benefits: The economic census represents the primary source of facts about the structure and function of the U.S. economy, providing essential information to government and business to help guide sound decisions. It furnishes an important part of the framework for composite measures, for example covering an estimated 84 percent of the GDP, and BEA’s input-output analyses and National Income and Product Accounts that provide important information about market sectors, such as manufacturing. The National Accounts and practically all major government economic statistical series are directly or indirectly dependent on the economic census. Statistics, analyses, and economic research produced by BEA, Bureau of Labor Statistics, Federal Reserve Board, Department of Energy, and the Census Bureau are dependent on the economic census results. The economic census not only provides BEA with vital source data for the national accounts, it also provides weights and benchmarks for indexes of industrial production, productivity, and prices. Moreover, the census furnishes benchmarks and sampling lists for the Census Bureau’s current economic programs and for many data series at other Federal agencies.
CEN-114

Schedule and Milestones: Key milestones in FY 2012 include:
• Complete the mailing and processing of classification forms in preparation for the economic census mailing.
• Complete commercial print contracts for over 8 million forms. • Complete electronic reporting instruments. • Deploy Business Help Site. • Complete mail list development completed for initial mailing.
Deliverables: See performance measure targets below. Performance Goals and Measurement Data Performance Goal: Science and Information Goal
FY 2011 Target
FY 2012 Target
FY 2013 Target
FY 2014 Target
FY 2015 Target
FY 2016 Target
With Increase 1)Finalize report form content for 2012 Eco-nomic Census core pro-grams. 2)Com-plete forms design for 60% of the 2012 Eco-nomic Census core pro-gram’s report forms.
1)Com-plete commer-cial printing of the 2012 Economic Census report forms by Sept. 2012. 2)Complete mailing and processing of the classifica-tion forms in preparation for the Economic Census mailing by Sept. 30, 2012.
1)Com-plete the mailout of question-naires for the 2012 Economic Census by December 31, 2012. 2)Achieve 5 percent more electronic responses compared to the 2007 Economic Census.
1)Begin tabulation and macro-data analysis for the 2012 Economic Census by October 31, 2013. 2)Achieve an 86% unit response rate for the 2012 Economic Census. 3)Release the 2012 Economic Census Advance Report in February 2014. 4)Complete Industry Series releases for 70% of the NAICS industries covered by August 2014.
1)Complete Industry Series releases for 100% of the NAICS industries covered by December 2014. 2)Complete Geograph-ic Series releases for 100% of the areas covered by August 2015. 3)Prepare a detailed project plan for all phases of the 2017 Economic Census by June 2015.
1)Finalize report form content for 2017 Economic Census core programs. 2)Complete forms design for 60% of the 2017 Economic Census core program’s report forms.
CEN-115

Without Increase 1)Finalize
report form content for 2012 Eco-nomic Census core pro-grams. 2)Complete forms design for 40% of the 2012 Economic Census core pro-gram’s report forms.
1)Complete commercial printing of the 2012 Economic Census report forms by Sept. 2012. 2)Complete mailing and processing of the classifica-tion forms in prepara-tion for the Economic Census mailing by Sept. 30, 2012.
1)Complete the mailout of question-naires for the 2012 Economic Census by December 31, 2012. 2)Achieve 5 percent more electronic responses compared to the 2007 Economic Census.
1)Begin tabulation and macrodata analysis for the 2012 Economic Census by October 31, 2013. 2)Achieve an 86% unit response rate for the 2012 Economic Census. 3)Release the 2012 Economic Census Advance Report in February 2014. 4)Complete Industry Series releases for 70% of the NAICS industries covered by August 2014.
1)Complete Industry Series releases for 100% of the NAICS industries covered by December 2014. 2)Complete Geographic Series releases for 100% of the areas covered by August 2015. 3)Prepare a detailed project plan for all phases of the 2017 Economic Census by June 2015.
1)Finalize report form content for 2017 Economic Census core programs. 2)Complete forms design for 40% of the 2017 Economic Census core program’s report forms.
Description: This supports the Census Bureau’s performance measure to “complete key activities for cyclical census programs on time to support effective decision-making by policymakers, businesses, and the public and meet constitutional and legislative mandates.”
CEN-116
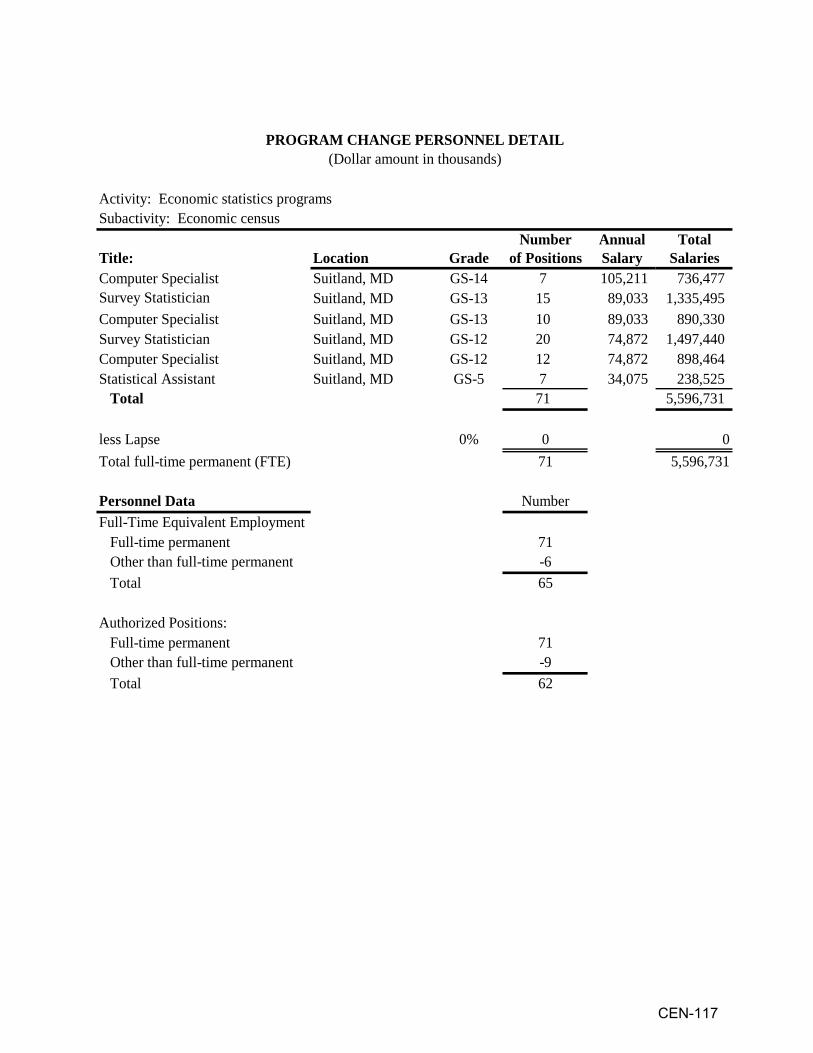
Activity: Economic statistics programsSubactivity: Economic census
Number Annual TotalLocation Grade of Positions Salary SalariesSuitland, MD GS-14 7 105,211 736,477
Survey Statistician Suitland, MD GS-13 15 89,033 1,335,495Suitland, MD GS-13 10 89,033 890,330Suitland, MD GS-12 20 74,872 1,497,440Suitland, MD GS-12 12 74,872 898,464Suitland, MD GS-5 7 34,075 238,525
71 5,596,731
0% 0 071 5,596,731
Number
71-6
Total 65
Authorized Positions: Full-time permanent 71
-9 Total 62
Statistical Assistant
Other than full-time permanent
Other than full-time permanent
Full-time permanent
Total
less LapseTotal full-time permanent (FTE)
Personnel Data
PROGRAM CHANGE PERSONNEL DETAIL(Dollar amount in thousands)
Full-Time Equivalent Employment
Survey Statistician
Title:Computer Specialist
Computer Specialist
Computer Specialist
CEN-117

PROGRAM CHANGE DETAIL BY OBJECT CLASS
(Dollar amounts in thousands) Activity: Economic statistics programs Subactivity: Economic census Program Change: Administrative savings*
2012Object Class POS FTE Decrease
11 Personnel compensation11.1 Full-time permanent -3 -3 -$21311.3 Other than full-time permanent 0 -1 -3811.5 Other personnel compensation 011.8 Special personnel services payments 011.9 Total personnel compensation -3 -4 -25112 Civilian personnel benefits -7513 Benefits for former personnel 021 Travel and transportation of persons -22322 Transportation of things 023.1 Rental payments to GSA 023.2 Rental Payments to others 023.3 Communications, utilities and miscellaneous charges 024 Printing and reproduction -5025.1 Advisory and assistance services -56325.2 Other services -8725.3 Purchases of goods & services from Gov't accounts -7525.4 Operation and maintenance of facilities -9025.5 Research and development contracts 025.6 Medical care 025.7 Operation and maintenance of equipment -46425.8 Subsistence and support of persons 026 Supplies and materials 031 Equipment 032 Lands and structures 033 Investments and loans 041 Grants, subsidies and contributions 042 Insurance claims and indemnities 043 Interest and dividends 044 Refunds 099 Total obligations -1,878
*Included in this total are administrative savings for the following line items:Direction -132Content Determination and Design -292Mail List Development and Mailout -62Collection and Processing -1,200Publication and Dissemination -192
CEN-118

PROGRAM CHANGE DETAIL BY OBJECT CLASS (Dollar amounts in thousands)
Activity: Economic statistics programs Subactivity: Economic census
2012Object Class Increase
11 Personnel compensation11.1 Full-time permanent $5,59711.3 Other than full-time permanent -15611.5 Other personnel compensation 5211.8 Special personnel services payments 011.9 Total personnel compensation 5,49312 Civilian personnel benefits 96613 Benefits for former personnel -8121 Travel and transportation of persons 21022 Transportation of things 223.1 Rental payments to GSA 1,16223.2 Rental Payments to others 123.3 Communications, utilities and miscellaneous charges -2,18124 Printing and reproduction 6,45925.1 Advisory and assistance services 1,20925.2 Other services -41525.3 Purchases of goods & services from Gov't accounts -3,11225.4 Operation and maintenance of facilities -58725.5 Research and development contracts -19625.6 Medical care 025.7 Operation and maintenance of equipment 1,93825.8 Subsistence and support of persons -2626 Supplies and materials 17731 Equipment 1,64832 Lands and structures 033 Investments and loans 041 Grants, subsidies and contributions 042 Insurance claims and indemnities 043 Interest and dividends 044 Refunds 099 Total obligations 12,667
CEN-119
SUBACTIVITY: Census of Governments Census of Governments Overview The objectives of the Census of Governments subactivity identify the scope and nature of the nation’s state and local government sector; provide authoritative benchmark figures in the areas of public finance and public employment; classify local government organization, powers and activities; and measure Federal, state, and local fiscal relationships. The Census of Governments – a part of the Nation’s economic census programs – is the only source of comprehensive and uniformly classified data on the economic activities of state and local governments. Title 13 U.S.C. §161 requires the Census of Governments every five years. The 2012 Census of Governments universe will include approximately 90,000 independent state and local governments and many thousands more subordinate agencies. This complex and ever-changing state and local government universe is a major economic force, totaling about 12 percent of the Gross Domestic Product (GDP) and 14 percent of the U.S. workforce. The Census of Governments represents the primary source of facts about the structure and function of the public sector of the U.S. economy. It provides essential information to the Congress and Federal agencies, such as the Departments of Education, Justice, Housing and Urban Development, and Health and Human Services, for planning and evaluating programs involving intergovernmental relationships. The census contributes an important element for constructing composite national economic measures, such as the GDP quantifying economic output, BEA input-output tables that measure market sectors, and the Federal Reserve Board’s flow of funds that provide time-series data of financial flows in the economy. The Census of Governments’ findings supply vital analytical tools for a wide variety of data users. Among the most prominent data users are state and local government officials, educational organizations, criminal justice organizations, public interest groups, private industry, economic research agencies, and the media. These groups use the information to compare financing, employment levels, employee pay, and operations among specific governments; develop relative measures of revenue extraction, especially taxation, and the cost for delivery of services among geographic areas; research market opportunities for sales to governments; analyze the relative advantages and risks of owning government securities; develop economic research looking at the relationship of government to the rest of society; and describe the nature, scale, and trend of governmental activities in the United States. The Census of Governments is the only source of comprehensive and uniformly classified data on economic activities of state and local governments. The Census of Governments programs are divided into three components: organization, employment, and finance.
• The Government Organization Component establishes the universe of state and local government entities and identifies the disparate nature of intergovernmental relationships within each state-area. It is within this component that the definition, structure, and number of governmental entities are determined.
• The Employment Component provides data on the number of full-time and part-time employees with corresponding full-time and part-time pay by governmental function.
CEN-120
• The Finance Component data describe how much money governments take in and spend, and quantify debt and asset characteristics. These data consist of various deliverables on taxes, assets of public pension systems, and comprehensive statistics on state and local government finances. These data also cover revenues by type, expenditures by character and function, indebtedness by term, and cash and securities holdings.
The 2012 Census of Governments will demonstrate efficiencies in both data collection procedures and editing methods. The 2012 Census of Governments will have expanded use of electronic reporting for collections. Likewise, due to comprehensive research on administrative records and private sector data, the Finance Component will be able to utilize such data sources in lieu of direct collections. Improvements to macro and micro edit methods will also lead to cost and time savings in the data processing phase. These operational efficiencies allow staff to devote necessary time to developing analytic reports and data dissemination interfaces. These needed improvements were recommended in the Committee on National Statistics’ 2007 Report, State and Local Governments at a Crossroads. In the report, the Committee charged the Census Bureau with improving, building, and enhancing its census of governments programs. The report laid out 21 strategic recommendations for improving data on governments, and tasked Governments Division with this historic task. These improvements begin to address the recommendations and show progress towards programmatic change. Direction Direction includes overall planning, design, and support activities. Content determination and design Activities include the review and assessment of the data content for each component survey/program and the coordination of these data needs with data providers and data users. Mail list development and mailout Activities include the development of a master directory file of all state and local governments followed by the commencement of mail-out operations, whether by mailing a survey form or notification letter or by emailing a request for information. Collection and processing This line item includes all data collection and processing operations for each of the census of governments surveys and programs – traditional mail canvass survey operations, expanding Internet data collection options, field and office enumeration and compilation activities, and electronic data collection. Publication and dissemination: This line item includes all operations related to the development of data for public release, tabulation, and publication (electronic and print copy) of census findings and dissemination of information to data users. PROGRAM CHANGES FOR FY 2012: Census of Governments (Base Funding 61 FTE and $8.2 million; Program Change 17 FTE and $2.3 million): Fiscal Year 2012 is the third year in the five-year cycle of the 2012 Census of Governments. The 2012 Census of Governments consists of three components: government organization, public employment, and government finances. Fiscal Year 2012 funding is requested
CEN-121
primarily for data collection and processing in the organization component; data preparation and initiation of data collection and processing in the employment component; and the preparation for and start of data collection and processing in the finance component. Key objectives of the FY 2012 work are the identification of the universe, collection of data about the universe characteristics, and the start of employment and finance data collection. Since 1957, the census of governments has been compiled every five years in conjunction with the economic census. Funding for the census of governments has historically been, and continues to be, cyclical in nature due to the fact that Title 13, Section 161 authorizes a quinquennial census. Therefore, an increase of funds from FY 2011 to FY 2012 is needed as 2012 Census of Governments activities get underway. The census of governments is related to the government statistics programs. The census of governments is conducted every five years (years ending in '2' and '7'), whereas the government statistics programs are conducted in the intervening years, and a sample of state and local governments is used to collect data. Given that the census of governments is a long-standing program, various survey methods and approaches have been employed over time. Based on lessons learned, the 2012 Census of Governments will utilize the best mix of survey methods and administrative record practices to conduct an accurate census. Historically, the census of governments programs have utilized field enumeration for data collection methods. The move to increased use of administrative records and central collection methods among the states has been deemed most cost effective. As such, the Census Bureau has taken strides to improve these methods and techniques, which will be employed in the 2012 Census of Governments. For example, in FY 2010 a study was performed to determine best practices for central collection methods, the results of which will feed into the 2012 Census of Governments. These methods will be used to the greatest extent possible in lieu of direct data collection to reduce the reporting burden of governments as well as to reduce costs. This program change includes a decrease of 0 FTE and $0.4 million in administrative savings and a cyclical increase of 17 FTE and $2.7 million. Proposed Actions: Direction (Base Funding 5 FTE and $1.0 million; Program Change 1 FTE and $0.2 million): Based on the project management plan developed in FY 2010, the Census Bureau will monitor all key census activities in the project plan, associated time schedules, and resources involved in the census. Content determination and design (Base Funding 10 FTE and $1.8 million; Program Change -8 FTE and -$1.2 million): The work in this activity will include final preparation of eight form types in the Employment Component, both mail and Internet, prior to the start of data collection in March 2012. For the Finance Component, the activity will be similar for eight collection instruments used for mail and Internet. In addition, there will be final preparation of collection instruments for about 25 states where joint Census Bureau-state finance surveys are conducted. Mail list development and mailout (Base Funding 15 FTE and $1.8 million; Program Change -6 FTE and -$1.0 million): The primary focus of activity for FY 2012 will be the development of a master directory file in the Organization Component of the census of
CEN-122

governments and the application of that directory in the Employment and Finance Components. This involves developing a master directory file for approximately 90,000 state and local government units and their agencies/institutions. This is necessary to establish the universe for each component of the census of governments and maintain information essential for conducting sample surveys that are to be supported by the census results. The government directory information is the public sector counterpart to the private sector Business Register. FY 2012 work includes ongoing research into state government legislation, searching for appropriate secondary sources that contain information on newly created governments and government types (using established directories, such as state school directories or those maintained by other Federal agencies), and discussions with state experts. The Employment Component will begin mailout operations in March 2012. For the Finance Component, mail list activities in FY 2012 will support an October 2012 mailout. Collection and processing (Base Funding 29 FTE and $3.4 million; Program Change 28 FTE and $3.9 million): The Census Bureau will collect and process data in all three components in FY 2012. Collection will begin in October 2012 for the directory survey in the Organization Component and the processing of those data will continue throughout the year. In the Employment Component, the Census Bureau will complete the review and testing of the software processing systems used for data entry, collection, processing, review, and analysis. Finance Component activities will focus on the review and testing of the software processing systems used for data entry, collection, processing, review, and analysis. For state governments and large local governments, the Census Bureau will begin compiling data records from electronic and published documents received. States involved in central collection arrangements will begin supplying data, and the Census Bureau will begin the compilation, review, and editing phase of this effort. Publication and dissemination (Base Funding 2 FTE and $0.2 million; Program Change 2 FTE and $0.3 million): Activities during FY 2012 will include deciding on options for electronic dissemination and limited printing, developing data products, and coordinating publication activities with the general planning, data collection, and processing of the census of governments. Statement of Need and Economic Benefits: The census of governments provides economic information used to develop the state and local government portion of the GDP, about 12 percent of the total. This census covers approximately 90,000 state and local government units and sub-agencies and collects data on more than 18 million state and local government employees, 14 percent of the U.S. workforce. Detailed information on nearly $2.5 trillion in public retirement system assets, one of the largest pools of funding for market investments, is collected, disseminated, and published. The census of governments will support the economic foundations of the United States by producing benchmark measures of state and local governments. This will be accomplished by providing information on revenues, expenditures, debt, and financial assets for approximately 90,000 state and local governments. The programs also provide data in the areas of public employment and payroll, as well as Federal Government programmatic expenditures on a geographic basis. Specific products include:
• Mail Census of Governments Organization Component directory survey • Mail Census of Governments Employment Component surveys
CEN-123
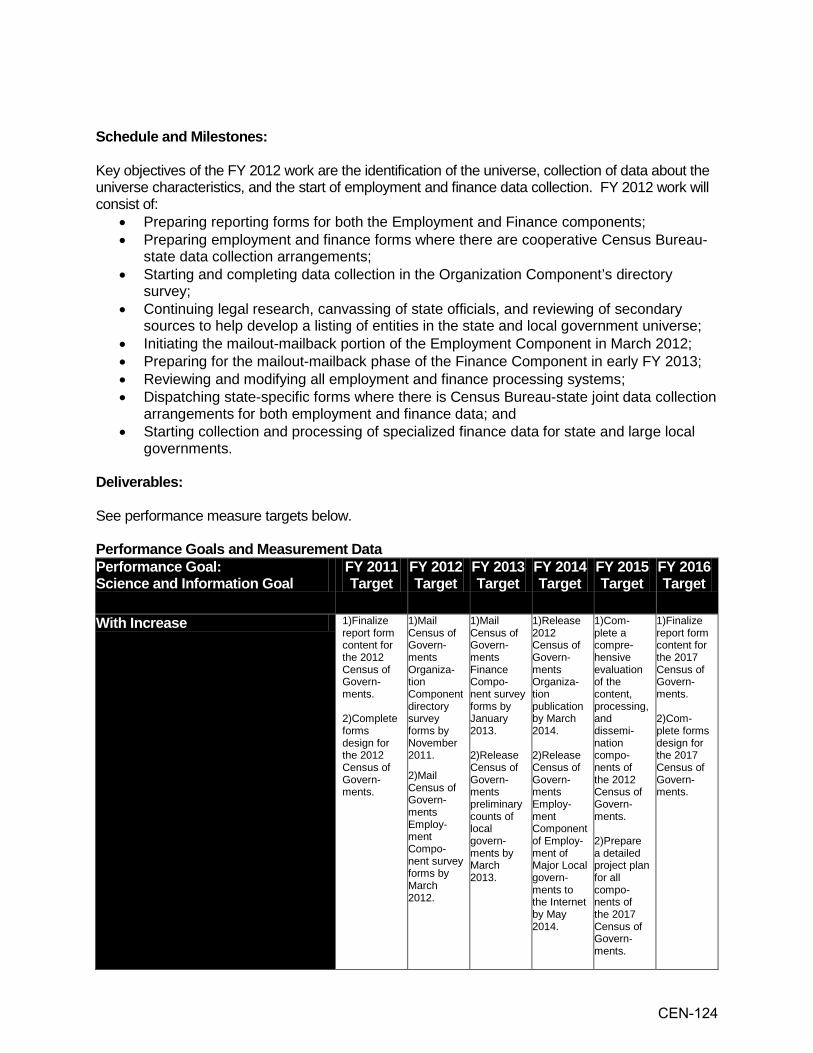
Schedule and Milestones: Key objectives of the FY 2012 work are the identification of the universe, collection of data about the universe characteristics, and the start of employment and finance data collection. FY 2012 work will consist of:
• Preparing reporting forms for both the Employment and Finance components; • Preparing employment and finance forms where there are cooperative Census Bureau-
state data collection arrangements; • Starting and completing data collection in the Organization Component’s directory
survey; • Continuing legal research, canvassing of state officials, and reviewing of secondary
sources to help develop a listing of entities in the state and local government universe; • Initiating the mailout-mailback portion of the Employment Component in March 2012; • Preparing for the mailout-mailback phase of the Finance Component in early FY 2013; • Reviewing and modifying all employment and finance processing systems; • Dispatching state-specific forms where there is Census Bureau-state joint data collection
arrangements for both employment and finance data; and • Starting collection and processing of specialized finance data for state and large local
governments. Deliverables: See performance measure targets below. Performance Goals and Measurement Data Performance Goal: Science and Information Goal
FY 2011 Target
FY 2012 Target
FY 2013 Target
FY 2014 Target
FY 2015 Target
FY 2016 Target
With Increase 1)Finalize report form content for the 2012 Census of Govern-ments. 2)Complete forms design for the 2012 Census of Govern-ments.
1)Mail Census of Govern-ments Organiza-tion Component directory survey forms by November 2011.
2)Mail Census of Govern-ments Employ-ment Compo-nent survey forms by March 2012.
1)Mail Census of Govern-ments Finance Compo-nent survey forms by January 2013. 2)Release Census of Govern-ments preliminary counts of local govern-ments by March 2013.
1)Release 2012 Census of Govern-ments Organiza-tion publication by March 2014. 2)Release Census of Govern-ments Employ-ment Component of Employ-ment of Major Local govern-ments to the Internet by May 2014.
1)Com-plete a compre-hensive evaluation of the content, processing, and dissemi-nation compo-nents of the 2012 Census of Govern-ments. 2)Prepare a detailed project plan for all compo-nents of the 2017 Census of Govern-ments.
1)Finalize report form content for the 2017 Census of Govern-ments. 2)Com-plete forms design for the 2017 Census of Govern-ments.
CEN-124

Without Increase 1)Finalize
report form content for the 2012 Census of Govern-ments. 2)Com-plete forms design for the 2012 Census of Govern-ments.
1)Mailout of Census of Govern-ments Organiza-tion Compo-nent directory survey forms will be delayed. 2)Mailout of Census of Govern-ments Employ-ment Compo-nent survey forms will be delayed.
1)Mailout of Census of Govern-ments Finance Compo-nent survey forms will be delayed. 2)Release of Census of Govern-ments preliminary counts of local govern-ments will be delayed.
1)Release of 2012 Census of Govern-ments Organiza-tion publication will be delayed and likely curtailed. 2)Release of Census of Govern-ments Employ-ment Compo-nent of Employ-ment of Major Local govern-ments to the Internet will be delayed and likely curtailed.
1)Com-pletion of a compre-hensive evaluation of the content, process-ing, and dissemi-nation compo-nents of the 2012 Census of Govern-ments will be delayed and likely curtailed. 2)Prepa-ration of a detailed project plan for all compo-nents of the 2012 Census of Govern-ments will be delayed and likely curtailed.
1)Finali-zation of report form content for the 2017 Census of Govern-ments will be delayed. 2)Com-pletion of forms design for the 2017 Census of Govern-ments will be delayed.
Description: This supports the Census Bureau’s performance measure to “complete key activities for cyclical census programs on time to support effective decision-making by policymakers, businesses, and the public and meet constitutional and legislative mandates.”
CEN-125

Activity: Economic statistics programsSubactivity: Census of governments
Number Annual TotalLocation Grade of Positions Salary SalariesSuitland, MD GS-14 2 105,211 210,422
Mathmatical Statistician Suitland, MD GS-13 1 89,033 89,033Survey Statistician Suitland, MD GS-13 3 89,033 267,099
Suitland, MD GS-13 1 89,033 89,033Suitland, MD GS-12 3 74,872 224,616Suitland, MD GS-11 5 62,467 312,335Suitland, MD GS-9 4 51,630 206,520Suitland, MD GS-5 1 34,075 34,075
20 1,433,133
25% 5 358,28315 1,074,850
Number
152
Total 17
Authorized Positions: Full-time permanent 20
2 Total 22
Personnel DataFull-Time Equivalent Employment
Survey Statistician
Title:Survey Statistician
Survey Statistician
Computer SpecialistComputer Specialist
PROGRAM CHANGE PERSONNEL DETAIL(Dollar amount in thousands)
Office Automation Clerk
Other than full-time permanent
Other than full-time permanent
Full-time permanent
Total
less LapseTotal full-time permanent (FTE)
CEN-126

PROGRAM CHANGE DETAIL BY OBJECT CLASS (Dollar amounts in thousands)
Activity: Economic statistics programs Subactivity: Census of governments Program Change: Administrative savings*
2012Object Class POS FTE Decrease
11 Personnel compensation11.1 Full-time permanent 011.3 Other than full-time permanent -$2111.5 Other personnel compensation 011.8 Special personnel services payments 011.9 Total personnel compensation -2112 Civilian personnel benefits -613 Benefits for former personnel 021 Travel and transportation of persons -2222 Transportation of things 023.1 Rental payments to GSA 023.2 Rental Payments to others 023.3 Communications, utilities and miscellaneous charges 024 Printing and reproduction 025.1 Advisory and assistance services -16525.2 Other services -7525.3 Purchases of goods & services from Gov't accounts -6925.4 Operation and maintenance of facilities -825.5 Research and development contracts -2225.6 Medical care 025.7 Operation and maintenance of equipment -2125.8 Subsistence and support of persons 026 Supplies and materials 031 Equipment 032 Lands and structures 033 Investments and loans 041 Grants, subsidies and contributions 042 Insurance claims and indemnities 043 Interest and dividends 044 Refunds 099 Total obligations -409
*Included in this total are administrative savings for the following line items:Direction -21Content Determination and Design -8Mail List Development and Mailout -24Collection and Processing -349Publication and Dissemination -7
CEN-127

PROGRAM CHANGE DETAIL BY OBJECT CLASS
(Dollar amounts in thousands) Activity: Economic statistics programs Subactivity: Census of governments
2012Object Class Increase
11 Personnel compensation11.1 Full-time permanent $1,07511.3 Other than full-time permanent 10911.5 Other personnel compensation 1611.8 Special personnel services payments 011.9 Total personnel compensation 1,20012 Civilian personnel benefits 27013 Benefits for former personnel -621 Travel and transportation of persons 5722 Transportation of things 023.1 Rental payments to GSA 13223.2 Rental Payments to others 023.3 Communications, utilities and miscellaneous charges -4224 Printing and reproduction -7725.1 Advisory and assistance services 69425.2 Other services 14825.3 Purchases of goods & services from Gov't accounts -4125.4 Operation and maintenance of facilities -6625.5 Research and development contracts 11425.6 Medical care 025.7 Operation and maintenance of equipment -3425.8 Subsistence and support of persons -326 Supplies and materials 12131 Equipment 20732 Lands and structures 033 Investments and loans 041 Grants, subsidies and contributions 042 Insurance claims and indemnities 043 Interest and dividends 044 Refunds 099 Total obligations 2,674
CEN-128

Dep
artm
ent o
f Com
mer
ceU
.S. C
ensu
s Bu
reau
Perio
dic
Cen
suse
s an
d Pr
ogra
ms
PR
OG
RA
M A
ND
PE
RFO
RM
AN
CE
: D
IRE
CT
OB
LIG
ATI
ON
S(D
olla
r am
ount
s in
thou
sand
s)
Exh
ibit
10
Act
ivity
: D
emog
raph
ic s
tatis
tics
prog
ram
sS
ubac
tivity
: Int
erce
nsal
dem
ogra
phic
est
imat
es
Line
Item
Per
sonn
elA
mou
ntP
erso
nnel
Am
ount
Per
sonn
elA
mou
ntP
erso
nnel
Am
ount
Per
sonn
elA
mou
nt
Inte
rcen
sal d
emog
raph
ic e
stim
ates
Pos
./BA
39$1
0,35
774
$1
0,55
278
$10,
603
78$1
0,09
20
($51
1)FT
E/O
bl.
6310
,275
72
10,7
4171
10,6
0371
10,0
920
(511
)
Tota
lP
os./B
A39
10,3
5774
10
,552
7810
,603
7810
,092
0(5
11)
FTE
/Obl
.63
10,2
7572
10
,741
7110
,603
7110
,092
0(5
11)
Adj
ustm
ents
to O
blig
atio
ns:
R
ecov
erie
s(3
8)
U
nobl
igat
ed b
alan
ce, s
tart
of y
ear
(44)
(1
89)
Fun
ding
def
erre
d to
FY
2011
U
nobl
igat
ed b
alan
ce, e
xpiri
ng(2
5)
U
nobl
igat
ed b
alan
ce, e
nd o
f yea
r18
9
R
efun
d
Incr
ease
/ (D
ecre
ase)
ov
er B
ase
2010
A
ctua
l20
11 C
R(A
nnua
lized
)20
12
B
ase
2012
Est
imat
e
Adj
ustm
ents
to B
udge
t Aut
horit
y:
Uno
blig
ated
Bal
ance
, Res
ciss
ion
Fina
ncin
g fro
m tr
ansf
ers:
T
rans
fer f
rom
oth
er a
ccou
nts
T
rans
fer t
o ot
her a
ccou
nts
App
ropr
iatio
nP
os.
3910
,357
7410
,552
7810
,603
7810
,092
0(5
11)
CEN-129

Dep
artm
ent o
f Com
mer
ceU
.S. C
ensu
s B
urea
uP
erio
dic
Cen
suse
s an
d P
rogr
ams
PR
OG
RA
M A
ND
PE
RFO
RM
AN
CE
: D
IRE
CT
OB
LIG
ATI
ON
S(D
olla
r am
ount
s in
thou
sand
s)
Exh
ibit
10
Activ
ity:
Dem
ogra
phic
sta
tistic
s pr
ogra
ms
Suba
ctiv
ity:
2010
Dec
enni
al c
ensu
s pr
ogra
m
Line
Item
Pers
onne
lAm
ount
Pers
onne
lAm
ount
Pers
onne
lAm
ount
Pers
onne
lAm
ount
Pers
onne
lAm
ount
2010
Dec
enni
al c
ensu
s pr
ogra
mPo
s./B
A3,
519
$6,6
22,1
263,
144
$716
,895
3,17
4$7
16,6
382,
570
$430
,856
(604
)($
285,
782)
FTE/
Obl
.88
,371
5,70
1,89
45,
708
813,
243
5,57
271
6,63
83,
456
430,
856
(2,1
16)
(285
,782
)
Tota
lPo
s./B
A3,
519
6,62
2,12
63,
144
716,
895
3,17
471
6,63
82,
052
430,
856
(604
)(2
85,7
82)
FTE/
Obl
.88
,371
5,70
1,89
45,
708
813,
243
5,57
271
6,63
83,
456
430,
856
(2,1
16)
(285
,782
)Ad
just
men
ts to
Obl
igat
ions
:
Rec
over
ies
(8,6
44)
U
nobl
igat
ed b
alan
ce, s
tart
of y
ear
(919
,917
)(1
,836
,348
)
Fun
ding
def
erre
d to
FY
2011
U
nobl
igat
ed b
alan
ce, e
xpiri
ng14
,735
U
nobl
igat
ed b
alan
ce, e
nd o
f yea
r1,
836,
054
1,74
0,00
0
Ref
und
(1,9
96)
Incr
ease
/ (D
ecre
ase)
ov
er B
ase
2010
Actu
al20
11 C
R(A
nnua
lized
)20
12
Base
2012
Es
timat
e
Adju
stm
ents
to B
udge
t Aut
horit
y:
Uno
blig
ated
Bal
ance
, Res
ciss
ion
129,
000
Fina
ncin
g fro
m tr
ansf
ers:
T
rans
fer f
rom
oth
er a
ccou
nts
T
rans
fer t
o ot
her a
ccou
nts
Appr
opria
tion
Pos.
3,51
96,
751,
126
3,14
471
6,89
53,
174
716,
638
2,05
243
0,85
6(6
04)
(285
,782
)
CEN-130

Dep
artm
ent o
f Com
mer
ceU
.S. C
ensu
s B
urea
uP
erio
dic
Cen
suse
s an
d P
rogr
ams
PR
OG
RA
M A
ND
PE
RFO
RM
AN
CE
: D
IRE
CT
OB
LIG
ATI
ON
S(D
olla
r am
ount
s in
thou
sand
s)
Exh
ibit
10
Act
ivity
: D
emog
raph
ic s
tatis
tics
prog
ram
sS
ubac
tivity
: 202
0 D
ecen
nial
cen
sus
Line
Item
Per
sonn
elA
mou
ntP
erso
nnel
Am
ount
Per
sonn
elA
mou
ntP
erso
nnel
Am
ount
Per
sonn
elA
mou
nt
2020
Dec
enni
al C
ensu
sP
os./B
A0
$00
$00
$022
4$6
7,00
022
4$6
7,00
0FT
E/O
bl.
00
00
00
284
67,0
0028
467
,000
Tota
lP
os./B
A0
00
00
022
467
,000
224
67,0
00FT
E/O
bl.
00
00
00
284
67,0
0028
467
,000
Adj
ustm
ents
to O
blig
atio
ns:
R
ecov
erie
s
Uno
blig
ated
bal
ance
, sta
rt of
yea
r
Fun
ding
def
erre
d to
FY
201
1
Uno
blig
ated
bal
ance
, exp
iring
U
nobl
igat
ed b
alan
ce, e
nd o
f yea
r
Ref
und
R
epro
gram
min
g
Adj
ustm
ents
to B
udge
t Aut
horit
y:
Uno
blig
ated
Bal
ance
, Res
ciss
ion
Fina
ncin
g fro
m tr
ansf
ers:
Tran
sfer
from
othe
racc
ount
s
Incr
ease
/ (D
ecre
ase)
over
Bas
e20
10A
ctua
l20
11 C
R(A
nnua
lized
)20
12B
ase
2012
Est
imat
e
T
rans
fer f
rom
oth
er a
ccou
nts
T
rans
fer t
o ot
her a
ccou
nts
App
ropr
iatio
nP
os.
00
00
00
224
67,0
0022
467
,000
CEN-131
APPROPRIATION ACCOUNT: Periodic Censuses and Programs BUDGET ACTIVITY: Demographic statistics programs
For FY 2012, the Census Bureau requests a net decrease of $219.3 million and 1,832 FTE from the FY 2012 base program for a total of $507.9 million and 3,811 FTE for demographic statistics programs. BASE JUSTIFICATION FOR FY 2012: Demographic statistics programs overview The Census Bureau’s mission is to serve as the leading source of quality data about the Nation’s people and economy. The demographic statistics programs activity furthers this mission by providing key benchmark measures about the U.S. population. The demographic statistics programs ($507.9 million and 3,811 FTE) budget is organized into three subactivities under the Periodic Censuses and Programs account.
• The intercensal demographic estimates subactivity ($10.1 million and 71 FTE) consists of one line item by the same name.
• The 2010 decennial census program subactivity ($430.8 million and 3,456 FTE) contains the American Community Survey, the Master Address File/Topologically Integrated Geographic Encoding and Referencing (MAF/TIGER) Enhancement Program (MTEP), and the 2010 Census.
• The 2020 decennial census subactivity ($67.0 million and 284 FTE) currently consists of one line item by the same name.
Significant Adjustments-to-Base (ATBs): The Census Bureau requests a decrease of $0.2 million to fund adjustments to current programs for demographic statistics programs activities. This reflects inflationary adjustments for non-labor activities, including employee compensation benefits, service contracts, utilities, and rent charges from the General Services Administration (GSA). ADMINISTRATIVE COST SAVINGS: The Administration is pursuing an aggressive government-wide effort to curb non-essential administrative spending called the Administrative Efficiency Initiative. In order to be good stewards of taxpayer money the Federal Government should continue to seek ways to improve the efficiency of programs without reducing their effectiveness. As such, the President directed each agency to analyze its administrative costs and identify savings where possible. After reviewing its administrative costs, the Census Bureau has identified $13,333,000 in administrative savings, of
Department of Commerce U.S. Census Bureau
Periodic Censuses and Programs PROGRAM JUSTIFICATION
CEN-132
which $798,000 in savings is identified through the Department’s Working Capital Fund (see the Departmental Management Working Capital Fund section for more details). The Census Bureau has targeted a number of areas to achieve its savings. Acquisition plans for FY 2012 account for $5,088,000 in savings. In the area of human capital, the Census Bureau expects to reduce its costs by $5,216,000 through position management and control and reduced workers compensation costs. Another $896,000 in administrative savings has been identified in logistics plans and in general administrative support by limiting discretionary travel and printing. The Census Bureau has also identified $1,335,000 in savings tied to IT related items, primarily through the closing, ahead of schedule, of a data center established for the 2010 Census. The $13,333,000 in administrative savings identified above represent real reductions to the Census Bureau’s funding level and will help reduce overall spending by the Federal Government. SUBACTIVITY: Intercensal demographic estimates Line Item: Intercensal demographic estimates The intercensal demographic estimates program assists elected officials and government program managers in allocating hundreds of billions of dollars each year by giving them updated estimates of the United States population for the country, states, counties, cities, and townships. Through this legislatively required program, policymakers and program managers are able to better understand their population’s size, as well as its basic characteristics like age, sex, race, and Hispanic origin; and estimates of the number of housing units, in the years between the decennial censuses. Since the United States population grows and changes between decennial censuses – and governments base many of their funding decisions on the size and basic characteristics of the population – effective and efficient government requires these updated estimates. Title 13, Section 181 of the U.S. Code requires the Census Bureau to produce annual data on the population size and certain population characteristics (age, race, ethnicity, and sex) for the Nation, states, counties, and local units of government with a population of 50,000 or more. This law also requires the Census Bureau to produce biennial estimates of total population for all local units of general-purpose government, regardless of their size. Further, the law specifies the use of such estimates by Federal agencies when allocating Federal benefits to states, counties, and local units of government when they are based on population size. Among the Federal programs that use these intercensal estimates to allocate funds are the Department of Health and Human Services’ Medical Assistance Program (Medicaid) and Social Service Block Grants (SSBG)/Entitlement Grants Program; the Department of Housing and Urban Development’s Community Development Block Grant Program (CDBG); and the Department of Labor’s Employment and Training Administration – Workforce Investment Act (WIA) Dislocated Workers Program. Hundreds of billions of dollars in Federal funds are distributed to states and other areas based in some part on intercensal estimates. These estimates of the geographic distribution of the population are also used for decisions about state and local government services, planning utility services, redefining metropolitan areas, and locating retail outlets and manufacturing establishments. Federal time-series that are produced on a per capita basis, such as per capita income, births per capita, and cancer incidence rates per capita, also rely on these estimates for their denominators. The intercensal population estimates are used as the controls for all household surveys conducted by the Census Bureau. These surveys have a major impact on the accuracy of the country’s key measures, such as unemployment, inflation,
CEN-133

income, poverty, and health insurance coverage. Intercensal estimates are essential to controlling variability in the surveys that provide these measures. The Census Bureau is responsible for developing and implementing the technical methods that produce the estimates. Recent experience in the acquisition, processing, and integration of the various administrative and survey data related to international migration have led to improvements in the accuracy and reliability of the national population estimates. To produce the sub-national estimates, population-modeling techniques are applied to a wide variety of administrative data, which must be processed and integrated. The results are sent to representatives of each state for their review and comment. This cooperative and collaborative process is essential in making the population estimates a reliable and useful indicator of how the United States changes between censuses.
PROGRAM CHANGES FOR FY 2012: The only program change in this subactivity is $511,000 in administrative savings.
CEN-134

PROGRAM CHANGE DETAIL BY OBJECT CLASS
(Dollar amounts in thousands) Activity: Demographic statistics programs Subactivity: Intercensal demographic estimates Program Change: Administrative savings
2012Object Class POS FTE Decrease
11 Personnel compensation11.1 Full-time permanent 011.3 Other than full-time permanent -$2311.5 Other personnel compensation 011.8 Special personnel services payments 011.9 Total personnel compensation -2312 Civilian personnel benefits -713 Benefits for former personnel 021 Travel and transportation of persons -1922 Transportation of things 023.1 Rental payments to GSA 023.2 Rental Payments to others 023.3 Communications, utilities and miscellaneous charges 024 Printing and reproduction 025.1 Advisory and assistance services -5125.2 Other services -6825.3 Purchases of goods & services from Gov't accounts -19825.4 Operation and maintenance of facilities -7825.5 Research and development contracts 025.6 Medical care 025.7 Operation and maintenance of equipment -6625.8 Subsistence and support of persons -126 Supplies and materials 031 Equipment 032 Lands and structures 033 Investments and loans 041 Grants, subsidies and contributions 042 Insurance claims and indemnities 043 Interest and dividends 044 Refunds 099 Total obligations -511
CEN-135

SUBACTIVITY: 2010 Decennial census program The decennial census has been conducted since the birth of the Nation. It provides the official population counts for determining the allocation to states of seats in the U.S. House of Representatives and for determining how the districts are defined for those seats. The Census Bureau provides to each state the data necessary to determine congressional, state, and local legislative boundaries. The provision of these data is mandated in the U.S. Constitution and Title 13 of the U.S. Code. This program supports Department of Commerce general goal/objective 1.3 to “advance key economic and demographic data that support effective decision-making by policymakers, businesses, and the American public.” The decennial census provides comprehensive and useful demographic information about all people living in the United States, Puerto Rico, and the associated Island Areas. The program also provides data for small geographic areas and population groups that Federal agencies need to implement legally mandated programs. Over $400 billion in Federal funding is allocated annually using information from the decennial census, such as from the 2010 Census, the American Community Survey, and the Population Estimates Program. Line Item: American community survey Given the rapid demographic changes experienced in recent years and the strong expectation that such changes will continue and accelerate, the once-a-decade data collection approach of a decennial census is no longer sufficient for producing much of the data required by the Federal Government, states, municipalities, and tribal governments. To meet the needs and expectations of the Nation, the Census Bureau developed the American Community Survey (ACS). The ACS, sent monthly to a small percentage of the population, collects detailed information on the characteristics of population and housing on an ongoing basis. These data previously were collected only in census years in conjunction with the decennial census. After years of development and testing, the Census Bureau implemented the ACS nationwide in 2005. The ACS will allow Federal agencies, state governments, tribal officials, and local customers to make decisions based on current information, rather than on data collected nine or more years ago. The Census Bureau will continue to refine the process and ensure that it is in place to produce tract-level data (in general, areas with populations between 1,500 - 8,000) similar to the Census 2000 long-form (detailed characteristics) data, in conjunction with the 2010 Census short-form (basic characteristics) data. The Census Bureau releases the estimates from the ACS program each year, based on the previous year’s data collection. Collecting long-form data during the decade through the ACS has had a profound effect on the census design plan. The collection of long-form data had added substantial burden and complexity to past decennial censuses. Implementing the ACS means that the Decennial Census can focus on its constitutional mandate to accurately count the population to apportion the House of Representatives. The ACS—supported by a complete and accurate address system—has simplified the census design, resulting in improvements in both coverage and data quality, while providing current data on detailed population, social, economic, and housing characteristics. Line Item: MAF/TIGER enhancement program With the completion in 2008 of the MAF/TIGER Accuracy Improvement Project, an updated and enhanced TIGER database with positionally accurate information now will allow the Census Bureau to maintain a more complete and accurate inventory and location of addresses and features. In
CEN-136

addition, it will greatly expand the Census Bureau’s ability to improve the accuracy and completeness of the statistical and geographic information provided to data users. An updated TIGER database also will enhance data users’ ability to use and further process ACS and 2010 Census data using their own geographic information systems. In FY 2012, we will continue our Community Address Update System program of updating addresses in areas where existing Master Address File processes are insufficient. Line Item: 2010 Census A sustained, multi-year integrated program for planning, testing, and developing the constitutionally mandated enumeration in 2010 has been the third key component of the reengineering effort. This effort encompassed mailout/mailback tests in 2003 and 2005, major field tests under census-like conditions in 2004 and 2006, a test of a bilingual questionnaire in 2007, and an (abbreviated) dress rehearsal in 2008. Improvements developed this decade include: $ Mailing a second replacement questionnaire to households that do not respond to the
initial mailout. Research by the program has shown a second mailing to have significant capability for increasing mail response rates, thus lowering field follow-up workloads and costs;
$ Increasing data quality for all population groups through improved questionnaire wording and instructions, especially when collecting data about race and Hispanic origin;
$ Increasing within-household coverage for all groups and areas through improved questionnaire wording and instructions regarding residence rules;
$ Implementing methodological improvements the Census Bureau has developed to collect data for persons who live in group quarters; and
$ Developing GPS-equipped handheld computers for collecting Address Canvassing data, including GPS locations for every housing unit and updated map features.
To do these things successfully, procedures needed to be fully tested under census-like conditions and refined well in advance of Census Day, April 1, 2010. This required a sustained, multiyear effort of integrated planning, development, testing, revising, and retesting of all the many procedures needed to complete a successful census. Without those efforts (completed between 2002 and 2008), the Nation would have been left with a 2010 Census that improves data timeliness and relevance (as a result of implementing the ACS) and geographic accuracy (as a result of the completed MTEP efforts), but with no improvement in coverage accuracy. PROGRAM CHANGES FOR FY 2012: 1. 2010 Decennial census program – american community survey (Base Funding 2,544 FTE and $247.5 million; Program Change 122 FTE and $5.2 million): The Census Bureau continues to collect data from households and group quarters in all counties throughout the U.S. (including the fifty states, District of Columbia, and all municipios in Puerto Rico). The American Community Survey (ACS) continues to be the only Census Bureau population-based survey that collects information in many of these counties. Full implementation of the ACS eliminated the need for a long form as part of the 2010 Census and provides necessary data every year instead of once a decade as in the past.
CEN-137

The FY 2011 President’s Budget requested funds to continue the full implementation of the ACS, including the start of a process to increase the annual sample from 2.9 million to 3.5 million housing units to improve the reliability of the ACS estimates at the tract level. Additionally, the FY 2011 request supports 100 percent nonresponse follow-up for all sampled addresses in Remote Alaska and small American Indian, Alaska Native, and Hawaiian Homeland areas to improve the reliability of estimates for these areas and population groups. An investment that improves the reliability of ACS data at the tract level leads to a more equitable allocation of Federal funds across all communities and population subgroups and improves the ability of users to detect change from year to year. The FY 2011 request also supported a series of annual data quality improvements. Fiscal Year 2012 funds will continue the implementation of the ACS at a fully expanded sample size of 3.5 million housing units, including data quality improvement activities. This program change includes a decrease of 8 FTE and $3.7 million for administrative savings and an increase of 130 FTE and $8.8 million to reflect the sample expansion. Proposed actions Initial mail collection This activity covers printing, mailing (initial and second), and data capture for a multiple mail approach to approximately 3.4 million mailable addresses across every county in the U.S. To maximize response to mail collection, the mailing operation includes a pre-notice letter, the questionnaire, a reminder postcard, and a second questionnaire, if required. It is estimated that a second mailing will be required for approximately 75 percent of the addresses. Approximately 50 percent of addresses will respond by mail. Those questionnaires will be checked-in and the data captured. In addition, this activity includes telephone follow-up for responding addresses whose questionnaires are not complete. About one-third (over 560,000 questionnaires annually) of the responding addresses will require our Telephone Failed Edit Follow-Up (FEFU) operation to improve quality of responses. A Telephone Questionnaire Assistance (TQA) program will be maintained. Both operations are staffed by trained telephone interviewers, many of whom are bilingual. Languages spoken by these interviewers include English, Spanish, Russian, German, Italian, Chinese, Korean, French, and Vietnamese. In addition, interviewers who speak a number of other languages, such as Amharic, Arabic, Farsi, Hindi, Japanese, Navajo, Portuguese, Romanian, Swahili, Tagalog, Thai, Tigrinya, and Tohono O’odham, are on staff to provide assistance. Responses to questions on place of birth, race, work, industry, occupation, field of degree, and migration will be coded. The data capture system will be maintained for the survey. All activities are completed from the Census Bureau’s National Processing Center using well-trained, permanent staff. Costs include personnel, printing, postage, maintaining a data capture system, and continuing the use of the automated data collection instruments for the TQA and FEFU operations.
• The ACS control system tracks and monitors every case through the mail interviews, the Computer-Assisted Telephone Interviews (CATI), and the Computer-Assisted Personal Visit Interviews (CAPI) (the latter two are described below). The control system is very sophisticated and includes the capability to remove late mail receipts assigned to CATI or CAPI within 24 hours of receipt of the late mail return to avoid unnecessary interview time by telephone center or field staff and to minimize respondent burden.
• The Census Bureau monitors the components of the mail operation to ensure quality. Standard reviews are incorporated into the mailing assembly to identify and correct errors.
• The Census Bureau monitors the completed questionnaire check-in and data capture to
ensure quality. In addition, the Census Bureau works to find less expensive, faster, and highly accurate strategies to capture the data on the questionnaires returned in the mail.
CEN-138

• The Census Bureau quickly reviews all mail returns for completeness and improves data quality by telephoning households missing needed information to explain the importance of the data and help the respondents complete the missing items.
Telephone nonresponse follow-up The Census Bureau’s three permanent telephone centers conduct a telephone nonresponse follow-up operation for approximately 1.4 million non-responding households for which telephone numbers can be identified. Costs of this operation include those associated with the personnel who conduct and supervise the operation, telephone charges, monitoring for quality purposes and maintenance, and maintenance of the telephone system and the automated data collection instrument. • The Census Bureau maintains the high quality of data collection through continual improvement
and quality control. ACS procedures require systematic monitoring of all telephone interviewers to ensure adherence to interviewing standards and policies. Interviewers are provided with feedback to ensure continuous improvement; they are retrained and assisted when problems are observed. A series of monthly instructional memoranda are provided to keep staff well trained. Refresher training is provided to all staff to ensure that quality remains high.
• Research continues to improve the acquisition of telephone numbers, which in turn, improves the productivity of call center operations. CATI is a less expensive mode of data collection than personal visit interviewing, and the Census Bureau continually works to keep the number of cases for this operation as high as possible in order to reduce the need for personal visits.
• Similar to language assistance provided by the TQA operation described above, the Census
Bureau maintains a staff of CATI interviewers who are bilingual in many languages to accommodate households that speak a language other than English.
Personal visit nonresponse follow-up About 3,900 Field Representatives (FRs), spread across every county and tribal government area in the U. S., attempt to personally contact households at approximately 698,000 addresses annually that have failed to respond to the ACS by either mail or telephone. Costs include salaries for field and regional office staff, mileage and other travel expenses, and quality control. The FRs report to the Census Bureau's twelve permanent Regional Offices (ROs) and are supervised by experienced, permanent supervisory FRs. • The Census Bureau continues to work to maintain the high quality of data collection through
continual performance monitoring and improvement to ensure response rates remain high each month and across all ROs. This activity includes maintaining a quality reinterview program and conducting research to improve the procedures for CAPI operations. Refresher training is provided to cover survey procedures and concepts, as well as conducting observations of interviewers to reinforce appropriate interviewing behaviors, improve performance, and correct problems as necessary. These activities are essential to maintaining and improving ACS data quality and reflect best practices.
• The Census Bureau continues to conduct personal nonresponse follow-up visits to all addresses
in the sample for Remote Alaska and small American Indian, Alaska Native, and Hawaiian Homelands areas. This will improve the reliability of tract-level estimates for these areas and population groups.
Puerto rico This activity covers all activities for data collection for a sample of approximately 37,000 addresses per year, including printing and mailing to 30,000 mailable addresses across the 78 county-equivalent areas in Puerto Rico. Approximately 12,000 nonresponse follow-up interviews are
CEN-139
conducted by telephone and approximately 15,000 personal visit nonresponse follow-up interviews are conducted by FRs. All interviewing and responses through the TQA System are provided in Spanish. The survey is called the Puerto Rico Community Survey to avoid confusion and improve response. • The Puerto Rico Community Survey is the first Census Bureau demographic survey to be
completed on a regular basis in Puerto Rico. This presents many challenges, such as maintaining an experienced interviewer workforce. However, this survey will continue to provide invaluable data on Puerto Rico every year between the decennial censuses.
• The Census Bureau maintains questionnaires and automated interview tools specific to the Puerto Rico Community Survey. Although the questionnaire for Puerto Rico is consistent with the questionnaire for the U. S., there are important differences, such as modifying response categories (e.g., “Born in Puerto Rico or the United States”). This requires modification of the paper questionnaire, the CATI instrument, the CAPI instrument, and all associated instructions and training materials (in addition to translation into Spanish). Through the mail interviewing, CATI, and CAPI processes, the Census Bureau must track the Puerto Rico Community Survey cases separately to ensure the proper materials are used. This is similar in complexity to having a separate survey.
• Complete check-in and data capture operations are conducted for completed mail returns.
Telephone Failed Edit Follow-up on mail questionnaires is conducted to improve quality of responses. The interviews are conducted in Spanish from our Tucson, Arizona Telephone Center. Research is conducted to improve procedures.
• The Census Bureau continues to work to maintain the high quality of data collection through
continual performance monitoring and improvement to ensure response rates remain high each month. This activity includes maintaining a quality reinterview program and conducting research to improve the procedures for CAPI operations. Refresher training is provided to cover survey procedures and concepts, as well as conducting observations of interviewers to reinforce appropriate interviewing behaviors, improve performance, and correct problems as necessary. These activities are essential to maintaining and improving ACS data quality and reflect best practices.
Group quarters data collection This activity covers the ongoing collection of data from approximately 195,000 sample persons from a representative sample of Group Quarters (GQs) spread across the U.S. and Puerto Rico over the entire year. Costs are for field staff, regional office staff, travel, mileage, and quality control. The FRs report to the Census Bureau’s ROs and are supervised by experienced, permanent supervisory FRs. The GQ component of the ACS consists of two parts: the facility questionnaire and the resident questionnaire. Both are collected through personal visit interview. The Group Quarters Facility Questionnaire (GQFQ) is an automated instrument used to gather information, such as group quarters type, the number of residents, and name/location of each resident. The GQFQ also is designed to randomly select 10-15 residents who will complete a GQ questionnaire. Interviews conducted with the selected sample of residents are collected using a blend of automated and paper instruments, depending on security and other requirements of the facility. • The Census Bureau must continually update a universe file of all GQs throughout the U.S. and
Puerto Rico by developing new systems for file transfers and updating functions. In 2011, a new
CEN-140
GQ universe file will be used that incorporates the 2010 Census updates. The ACS will continually work to improve the universe file throughout the decade.
• The ACS also must maintain the quality and integrity of the data collected in GQs. Senior FRs and the RO staff oversee the operations, correct any mistakes, ensure timeliness, and maintain the quality of the operation, thus ensuring that procedures are followed correctly and the data are of high quality.
• Activities include ongoing efforts to improve operations and response rates by conducting working group meetings with national leaders from organizations and agencies that represent the types of group quarters that are sampled. Research continues to incorporate a geocoding module into the automated interview instrument and revise the editing and imputation system.
• Interviewer procedures and training materials are updated and staff are trained through a series
of monthly home study exercises and instructional memoranda. Refresher training is provided to cover survey procedures and concepts, as well as conducting observations of interviewers to reinforce appropriate interviewing behaviors, improve performance, and correct problems as necessary. These activities are essential to maintaining and improving ACS data quality and reflect best practices.
IT infrastructure This activity funds maintenance, repair, and ongoing replacement charges for laptops used in the field. Funds also cover data storage and maintenance of computer equipment needed for the data processing activities. Data processing, weighting and review This activity covers all data processing and review of output to make certain the data are correct. It includes all the computer programming required for data editing, statistical weighting, and calculation of variances. It also includes review of these operations to ensure that the editing and weighting are done correctly. • The Census Bureau will conduct sample selection for approximately 3.5 million addresses spread
across every county in the U.S. and Puerto Rico. Data cleaning on cases from three data collection modes -- mail, CATI and CAPI -- will be completed, as well as data editing/imputation and statistical weighting for all cases. Editing and processing, as well as the statistical weighting for correctness, will be reviewed and updated. The Census Bureau will continue improving the methodology for sample selection, particularly by concentrating on improved coverage for small population groups. Data edit, imputation, and statistical weighting systems will be maintained separately for U.S. housing unit data, for Group Quarters data, and for data for Puerto Rico.
• The goal of the ACS is to begin releasing data by the end of each fiscal year. Estimates based on one year of data are produced and reviewed for all geographic areas with populations of 65,000 or more; combined data from three calendar years are used to produce and review annual multiyear estimates for all geographic areas with a population of 20,000 or more, and combined data from five calendar years are used to produce and review annual multiyear estimates for geographic areas of all sizes.
• The Census Bureau continues to refine the methodology for selecting the sample, weighting the data estimates, and calculating the variances for ACS estimates. Each estimate in published ACS products is disseminated with a measure of reliability.
CEN-141

• The Census Bureau continues to research better ways to include small population groups in the sample.
• The Census Bureau continues to develop new and innovative methodologies for editing the data
and providing responses for missing data that draw upon as much information as possible.
• The Census Bureau continues to conduct research and evaluation activities and conduct an enhanced review of all one-, three-, and five-year ACS estimates.
Data dissemination This activity includes developing all specifications and completing all computer processing to create data tabulations and data products for one-, three-, and five-year estimates. The data products cover all of the detailed characteristics collected in the ACS, such as income, poverty, educational attainment, migration, journey to work, and so forth. The products include tables, rankings, profiles and public use microdata sample files. The data are disseminated electronically through the American FactFinder and the Census Bureau’s Website. • This activity provides for the further development of automated systems and tools to review the
ACS estimates. The ACS produces too much data for our statisticians to review and approve using traditional methods. The Census Bureau works to continually develop and improve statistical computer tools and methods to identify anomalies in the estimates, thereby helping to focus and improve the review and ultimate quality of the estimates. Work and refinement of the automated review tools will continue in FY 2012.
• The ACS also provides support for the ongoing activities of the Data Access and Dissemination System (including American FactFinder), the Census Bureau’s system for disseminating a full array of data products via the Internet.
Partnership and outreach This activity provides funding for support of the Census Bureau advisory committees that provide advice to improve all aspects of the ACS and for production of various informational and educational materials. Operational assistance, technical consultations, training, responses to a wide variety of data user needs and requests, and support for contracts to develop improved communication and training methods are also conducted in this activity. Project management This activity includes management of all ACS operations, ensuring that key elements are produced on time and overseeing all operations (including collection, production, dissemination of the data products, and evaluation) to maintain the high integrity and high quality of the ACS program. Project management staff develops schedules for all operations, ensures compliance with the scheduled dates, and intervenes and modifies operations when problems are identified. Methods panel This category provides funding for research, testing, and evaluations aimed at improving overall ACS data quality, achieving survey efficiencies, and developing and improving ACS questionnaire content and related data collection materials. The 2012 Methods Panel will include testing methods for increasing survey and operational efficiencies. Alternative methods or procedures will be developed and evaluated that could potentially reduce the overall survey cost, lessen respondent burden, and improve response rates, such as designing and testing enhancements to the ACS mailing materials. Activities and projects related to developing and improving ACS questionnaire design and content will also be conducted. The 2012 ACS Methods Panel will complete the analysis of an ACS Content Test, finalize results from an ACS Internet Test, and launch a content reinterview to provide measures of data reliability for the ACS. The 2012 Methods Panel will also continue important research to enhance the ability of non-English-speaking
CEN-142
households to understand ACS content and informational materials and to improve the response rates among non-English-speaking and culturally-isolated households. Funds for the 2012 Methods Panel also cover continuation of the FY 2011 research, as well as planning for the FY 2013 projects. This program supports the Department of Commerce’s Science and Information goal. It supports the Census Bureau’s Strategic Plan Goal 2.b. to: Provide timely, relevant, accurate, and accessible benchmark measures of the U.S. population, economy, and governments to assess U.S. competitiveness, identify new business opportunities, and foster domestic job growth. Statement of Need and Economic Benefits
The ACS collects detailed information on the characteristics of population and housing on an ongoing basis. These data previously were collected only in census years in conjunction with the decennial census. After years of development and testing, the Census Bureau implemented the ACS nationwide in 2005 to ensure widespread use of the annual data tabulations the ACS produces throughout the decade. This process allows Federal agencies, state governments, tribal officials, and local customers to make decisions based on current information, not the situation years ago, and will allow the Census Bureau to refine the process and ensure that it is in place to produce detailed characteristics estimates for census tracts (in general, areas with populations between 1,500 – 8,000) similar to the Census 2000 long-form, as a complement to the 2010 Census basic characteristics data. The ACS – supported by a complete and accurate address system – simplified the 2010 Census design, resulting in improvements in both coverage and data quality. Schedule and Milestones Key milestones in FY 2012 include the continuation of ACS and release of products for geographic areas of all sizes including census tracts and block groups. The Census Bureau continues to collect data from households and group quarters in all counties throughout the U.S. (including the fifty states, District of Columbia, and all municipios in Puerto Rico). The ACS continues to be the only Census Bureau population-based survey that collects information in many of these counties. Full implementation of the ACS eliminated the need for a long form as part of the 2010 Census and provides necessary data every year instead of once a decade as in the past.
Fiscal Year 2011 funds were requested to continue the full implementation of the ACS, including the start of a process to increase the annual sample from 2.9 million to 3.5 million housing units to improve the reliability of the ACS estimates at the tract level. Additionally, 100 percent follow-up for all sampled addresses in Remote Alaska and small American Indian, Alaska Native, and Hawaiian Homeland areas was conducted to improve the reliability of estimates for these areas and population groups. An investment that improves the reliability of ACS data at the tract level leading to a more equitable allocation of Federal funds across all communities and population subgroups and improves the ability of users to detect change from year to year. Fiscal Year 2011 funds also supported a series of annual data quality improvements. Fiscal Year 2012 funds will continue the implementation of the ACS at a fully expanded sample size of 3.5 million housing units, including data quality improvement activities. Deliverables See performance measure targets below.
CEN-143

2. 2010 Decennial census program – MAF/TIGER enhancement program (Base Funding 107 FTE and $13.9 million; Program Change -11 FTE and -$0.6 million): Included is the remaining element of the MAF/TIGER Enhancement Program, conducted in support of the 2010 Census. This element, the Community Address Updating System (CAUS), provides updates to addresses in areas where existing Geographic Support System (GSS) processes are insufficient. Funding will support infrastructure, research of targeting methodology for updates along with field work to maintain the MAF/TIGER database for non-urban communities in the U.S. These are areas where updates from the U.S. Postal Service Delivery Sequence File (DSF) do not provide sufficient coverage and require the use of trained field representatives to add, update, or delete non-city style addresses in the MAF/TIGER database. The decrease can be attributed to reduced training costs for the field representatives on the CAUS operation. Existing staff will be more experienced and primarily require refresher training rather than the complete initial training on the program. Schedule and Milestones Key milestones in FY 2012 include the ongoing maintenance of MAF/TIGER for 2010 Census. With the successful closeout of four major program objectives of the MAF/TIGER Enhancement Program (MTEP) (road centerline realignment and modernization of the MTEP databases), fostering partnerships with state, local, and tribal governments and conducting periodic MAF/TIGER evaluation studies, the Census Bureau is positioned to continue work in Fiscal Year 2012 evaluating operations conducted in support of the 2010 decennial census. The CAUS objective will continue data collection in FY 2012. The CAUS program will focus on the continuous maintenance of the MAF, particularly in non-urban communities in the U.S., to support the ACS and other surveys beyond the 2010 Census. This program change includes a decrease of 2 FTE and $0.5 million for administrative savings and a cyclical program decrease of 9 FTE and $0.1 million. Deliverables See performance measure targets below. 3. 2010 Decennial census program – 2010 census (Base Funding 2,921 FTE and $455.2 million; Program Change -2,227 FTE and -$290.4 million): The request for FY 2012 will be used to continue conducting the 2010 Decennial Census Program. Those efforts are built on experience and lessons learned from prior censuses, eight years of research and testing for the 2010 Census, a decade of research for the ACS, and more than two decades of experience in building, maintaining, and improving our geographic reference files. The focus of activities will include data dissemination, evaluation, and resolution of count questions from local, state, and tribal governments.
CEN-144

In FY 2012, the 2010 Census will continue to release data products from the 2010 Census; release results from its coverage measurement program, and continue other evaluation and assessment activities.
In FY 2012, activities will focus on:
• Continuing the evaluations, assessments, and experiments related to 2010 Census operations;
• Conducting the Count Question Resolution Program;
• Developing and disseminating the 2010 Census data products;
• Working to archive response data and questionnaire images;
• Conducting ongoing maintenance and support of the Data Access and Dissemination System (DADS), including continued incremental implementation of the DADS II system; and
• Conducting closeout activities of 2010 Census contracts.
This program change includes a decrease of 34 FTE and $5.7 million for administrative savings and a cyclical program decrease of 2,193 FTE and $284.7 million. Proposed Actions Program development and management Funding in this category supports overall coordination of the implementation of the 2010 Census and continued integration with the American Community Survey and the MAF/TIGER Enhancement Program. Specifically, funding covers the significant task of monitoring and coordinating the efforts of multiple Census Bureau divisions and offices in updating and managing a detailed integrated census schedule; maintenance of operational and system planning documents and requirements; managing changes to the baseline; issues resolution and management; and program-level risk management. It also supports overall management functions, such as budget formulation, presentation, and execution; interactions with oversight activities by the U.S. Government Accountability Office, the Office of the Inspector General, the Office of Management and Budget, and others; and work with and support of the Census Bureau advisory committees. These funds also provide for coordination and management of system implementation and maintenance for decennial census headquarters systems and headquarters administrative support for the program, such as acquisition, human resources, security, and finance. Content, questionnaires, and products In FY 2012, funding in this category continues to focus on the tabulation and dissemination of 2010 Census products. The Census Bureau will compile and organize the raw census data into formats from which data products can be generated. Specifically, we will: • Prepare and disseminate additional geographic products, such as county block maps,
census tract maps, county subdivision outline maps, and many summary and profile products.
• Tabulate and release the data for small population groups with the release of the Census 2010 Summary File 2 (commonly referred to as SF-2). These tables on population and housing characteristics are iterated or repeated for race and Hispanic groups. The Data Access and Dissemination System II will also prepare other proposed 2010 Census data products, such as the Public Use Microdata Sample—a first-time decennial shortform (only) product.
CEN-145

This category also provides support for the ongoing activities of the DADS system. In addition to the tabulation and dissemination of 2010 Census data by the DADS II system, the ACS, the economic censuses and surveys, and population estimates are disseminated by DADS II. The Census Bureau will retire the legacy American FactFinder system in FY 2011. Some activities related to decommissioning the system and completing the cut-over and conversion of legacy data sets will be completed in early FY 2012. Funding in this category also will support developmental efforts towards integrating 2010 Census data with other Federal statistical data, including the ACS. Such a data network framework created and maintained by the Census Bureau, would better serve citizens, businesses, policy makers, and other decision makers by dynamically integrating the most current information available from numerous sources. Field data collection and support
Funding in this category supports preparations, implementation, monitoring, and day-to-day management of the field components of the operations for the 2010 Census itself. Specifically, in FY 2012, these efforts encompass the following:
• The Census Bureau will close out the Regional Census Centers (RCCs). This funding supports removal and disposition of furniture, non-IT equipment and supplies, and operational costs, such as space, security, and utilities until the offices are no longer operational.
• IT equipment in the RCCs will be removed, sanitized, and shipped back to one central location for further disposition.
• The Census Bureau will continue to provide overall contract management for the Field Data
Collection Automation (FDCA) program contract to ensure contractor compliance with quality assurance and security requirements; provide technical support for all aspects of the FDCA contract; and continue to implement business management, metrics, and performance evaluations.
Automated data collection, systems, and data capture Funding in this category supports multiyear efforts to maintain a business and logical architecture for the 2010 Census, conducting data processing, and completing development and implementation of data capture and related processing systems for the 2010 Census. In FY 2012, we will: • Continue archiving 2010 Census questionnaire images for the National Archives and
Records Administration and for the Census Image Retrieval Application (CIRA);
• Continue to provide overall contract management for the Decennial Response Integration System (DRIS) program contract to ensure contractor compliance with quality assurance and security requirements; provide technical support for all aspects of the DRIS contract; and continue to implement business management, metrics, and performance evaluations;
• Maintain production of the Cost and Progress System for the 2010 Census; and
• Maintain the detailed 2010 Census schedules. Census design, methodology and evaluation Funding in this category supports the Census Program of Evaluations and Experiments (CPEX), operational assessments, and the Census Coverage Measurement Program. Specifically, in FY 2012, these efforts encompass the following:
CEN-146

• Support for the coordination and preparation of data analysis for evaluations, experiments, and assessments, all of which will explain what occurs in the 2010 Census and will lay the foundation for research during the next decade on how to plan and improve the 2020 Decennial Census Program.
• Use of the Master Trace Repository for Research Project, which enables access to data from multiple sources to provide information about cases in various phases of data collection and processing. This allows quantitative insight into the relationship of key census processes. This effort is considered critical by the Census Bureau and outside oversight, such as the National Academy of Science, for understanding the 2010 Census and the 2020 Census efforts.
• This category also provides for headquarters support, monitoring, and oversight of the
Census Coverage Measurement (CCM), as well as review of the CCM data. CCM will produce and deliver coverage estimates.
Census test and dress rehearsal implementation No funds are requested for these operations in FY 2012. Statement of Need and Economic Benefits The multiyear integrated program for planning, testing and development of the constitutionally mandated enumeration has encompassed mailout/mailback tests in 2003 and 2005, major field tests under census-like conditions in 2004 and 2006, the 2007 National Census Test to study the use of bilingual forms, and a dress rehearsal in 2008. The data collection effort for the 2010 Census is taking advantage of and building on capabilities made possible by the existence of the ACS and MTEP in order to improve accuracy for the 2010 Census, while keeping operational risk as low as possible.
The targets we set earlier this decade for the reengineered 2010 Decennial Census program goals were ambitious: • Improve the relevance and timeliness of census long-form data compared to Census 2000 by
implementing the ACS to produce long-form-type data each year. The ACS was a completely new and revolutionary survey designed to remove the long form from the once-a-decade decennial and produce the same detailed characteristics data on an annual basis. Since the implementation of the program in 2005, we have been releasing these data on an annual basis for places with a population of 65,000 or more. Beginning in 2008 and every year thereafter, three consecutive years of data are combined to make annual multiyear estimates for all places with a population of 20,000 or more.
• In 2010, ACS will combine data from 2005 to 2009 to produce information on the population for all areas at the census tract level, thus providing similar content and reliability of small-area data as compared to the Census 2000 long form. The Census Bureau will continue to issue these detailed, small-area social and economic data in FY 2011 and every year thereafter.
• Reduce operational risk compared to Census 2000 by completing a multiyear program of
research, development, and testing, ending with a dress rehearsal of 2010 Census methods and systems in FY 2008 and by completing the MAF/TIGER Accuracy Improvement Program (MTAIP) for all 3,232 counties by FY 2008. The Census Bureau completed its
CEN-147

planned program of research, development, and testing, and the MTAIP was completed on schedule in 2008.
• Improve the accuracy of census coverage compared to Census 2000 by reducing the measured number of geographic coding errors by at least 50 percent, reducing the measured number of duplicates by at least 50 percent, and reducing the measured overall net coverage error at the national level to less than 0.5 percent. The Census Bureau will not have coverage estimates to assess success in meeting this goal until the census program—including the coverage measurement program—is completed. The final CCM field operations are being conducted in FY 2011 in order to measure the accuracy and determine whether this goal was met. The estimates of net coverage error (i.e., population for specified domains, net undercount or overcount) and components of census coverage for housing units and persons in housing units (e.g., erroneous enumerations, omissions) for stateside are scheduled to be released in July 2012 and for Puerto Rico are scheduled to be released in September 2012. The evaluation of CCM results will continue into FY 2013.
• Contain costs by conducting all three components of the reengineered census for an amount that is less than the cost of repeating the methodology used in the 2000 Census, in large part through the use of handheld computers. However, in order to address growing concerns with risk of operational readiness, the Census Bureau chose to eliminate the use of handheld computers to collect nonresponse follow-up data. In making this change, which significantly increased the cost of the 2010 Census program, the Census Bureau acknowledged the inability to meet this goal but believes it was the right decision to ensure a successful and accurate census.
The reengineered 2010 Census produced the Nation’s population count, meeting its constitutional mandate of producing the counts once each decade for apportioning the seats in the U.S. House of Representatives among the states. In addition, data collected from the 2010 decennial census program, including the ACS, will improve the Nation’s ability to: • Determine the boundaries of congressional, state, and local legislative districts; • Allocate Federal funds for state, local, and tribal governments – (estimated to be over $400 billion
annually); • Monitor and evaluate Federal legislation; • Develop plans for roads, schools, hospitals, and community and job training centers; • Conduct business research; and • Support Federal, state, tribal, and local government responses to emergency situations.
CEN-148

Schedule and Milestones Key milestones in FY 2012 include the delivery of data products and continuation of assessments and evaluations. The table below lists the major milestones of the 2010 Census.
2010 Decennial Census Program Milestones Preparatory Activities for 2010 Census Oct 2008 Begin Opening Local Census Offices (150 Early LCOs) Apr 2009 Begin Address Canvassing (Completed July 2009) Sep 2009 Begin Group Quarters Validation Oct 2009 Begin Opening Remaining 344 LCOs Mar 2010 Begin Delivery of 2010 Census Questionnaires to Households Data Collection, Processing, and Tabulation Apr 1, 2010 Census Day Apr 2010 Begin Nonresponse Follow-up Dec 2010 Deliver Apportionment Counts to President Mar 2011 Complete Delivery of Redistricting Data to the States Aug 2013 Complete Release of All Data Products Sep 2013 Complete Research, Evaluation, and Experiments Program
Deliverables See performance measure targets below.
CEN-149
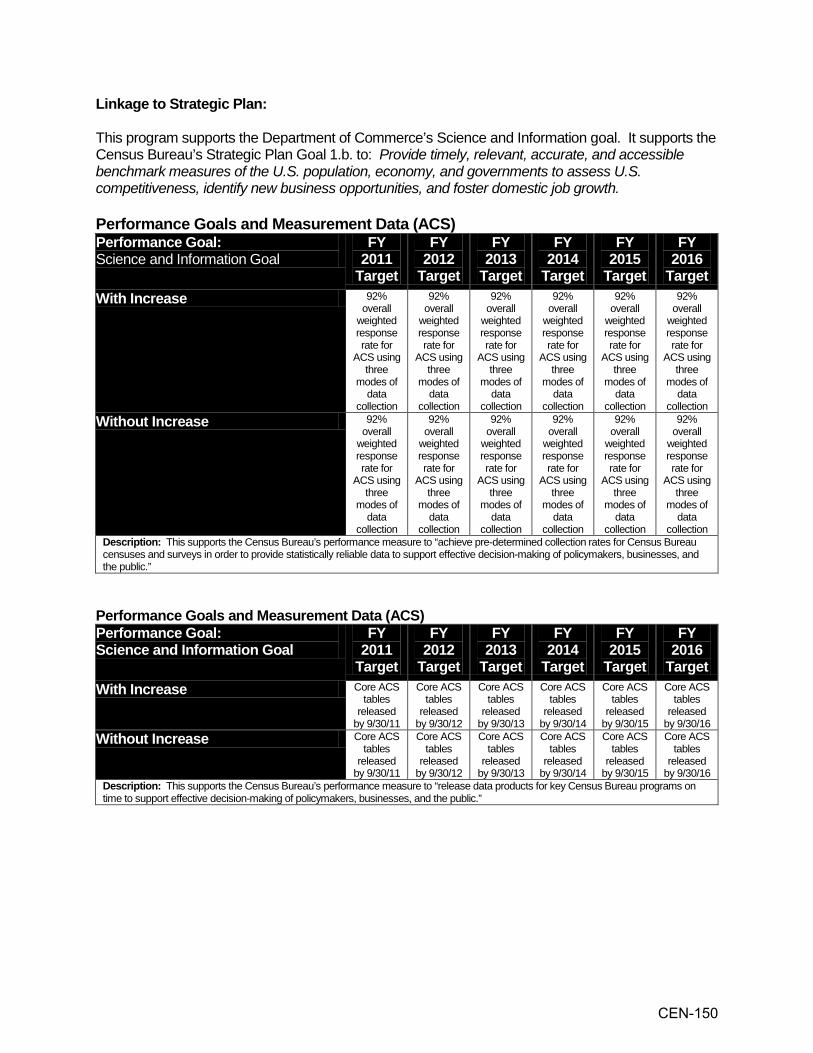
Linkage to Strategic Plan: This program supports the Department of Commerce’s Science and Information goal. It supports the Census Bureau’s Strategic Plan Goal 1.b. to: Provide timely, relevant, accurate, and accessible benchmark measures of the U.S. population, economy, and governments to assess U.S. competitiveness, identify new business opportunities, and foster domestic job growth. Performance Goals and Measurement Data (ACS) Performance Goal: Science and Information Goal
FY 2011
Target
FY 2012
Target
FY 2013
Target
FY 2014
Target
FY 2015
Target
FY 2016
Target With Increase 92%
overall weighted response rate for
ACS using three
modes of data
collection
92% overall
weighted response rate for
ACS using three
modes of data
collection
92% overall
weighted response rate for
ACS using three
modes of data
collection
92% overall
weighted response rate for
ACS using three
modes of data
collection
92% overall
weighted response rate for
ACS using three
modes of data
collection
92% overall
weighted response rate for
ACS using three
modes of data
collection Without Increase 92%
overall weighted response rate for
ACS using three
modes of data
collection
92% overall
weighted response rate for
ACS using three
modes of data
collection
92% overall
weighted response rate for
ACS using three
modes of data
collection
92% overall
weighted response rate for
ACS using three
modes of data
collection
92% overall
weighted response rate for
ACS using three
modes of data
collection
92% overall
weighted response rate for
ACS using three
modes of data
collection Description: This supports the Census Bureau’s performance measure to “achieve pre-determined collection rates for Census Bureau censuses and surveys in order to provide statistically reliable data to support effective decision-making of policymakers, businesses, and the public.”
Performance Goals and Measurement Data (ACS) Performance Goal: Science and Information Goal
FY 2011
Target
FY 2012
Target
FY 2013
Target
FY 2014
Target
FY 2015
Target
FY 2016
Target With Increase Core ACS
tables released
by 9/30/11
Core ACS tables
released by 9/30/12
Core ACS tables
released by 9/30/13
Core ACS tables
released by 9/30/14
Core ACS tables
released by 9/30/15
Core ACS tables
released by 9/30/16
Without Increase Core ACS tables
released by 9/30/11
Core ACS tables
released by 9/30/12
Core ACS tables
released by 9/30/13
Core ACS tables
released by 9/30/14
Core ACS tables
released by 9/30/15
Core ACS tables
released by 9/30/16
Description: This supports the Census Bureau’s performance measure to “release data products for key Census Bureau programs on time to support effective decision-making of policymakers, businesses, and the public.”
CEN-150

Performance Goals and Measurement Data (MTEP) Performance Goal: Science and Information Goal
FY 2011
Target
FY 2012
Target
FY 2013
Target
FY 2014
Target
FY 2015
Target
FY 2016
Target With Decrease Assign
16,000 eligible blocks for field work.
Assign 16,000 eligible blocks for field work.
In FY 2013, CAUS will transfer to the Geo-graphic Support program.
N/A N/A N/A
Without Decrease Assign 16,000 eligible blocks for field work.
Assign 16,000 eligible blocks for field work.
N/A N/A N/A N/A
Description: This supports the Census Bureau’s performance measure to “release data products for key Census Bureau programs on time to support effective decision-making of policymakers, businesses, and the public.”
Performance Goals and Measurement Data (2010 Census) Performance Goal: Science and Information Goal
FY 2011 Target
FY 2012 Target
FY 2013 Target
With Decrease 1) Deliver state-level population counts for apportionment to the President 2) Close remaining LCOs and paper data capture centers. 3) Process, tabulate and disseminate census data below the state-level for use in redistricting efforts. 4) Complete coverage measurement operations.
1) Release 100% of data products scheduled for FY 2012. 2) Release 100% of all evaluation, assessment, and experiment reports scheduled for FY 2012. 3) Release estimates of coverage measurement.
1) Complete release of all data products. 2) Release 100% of all evaluation reports scheduled for FY 2013. 3) Create data and questionnaire images for archiving. 4) Close out DRIS contract.
Without Decrease 1) Deliver state-level population counts for apportionment to the President. 2) Close remaining LCOs and paper data capture centers 3) Process, tabulate and disseminate census data below the state-level for use in redistricting efforts. 4) Complete coverage measurement operations.
1) Release 100% of data products scheduled for FY 2012. 2) Release 100% of all evaluation, assessment, and experiment reports scheduled for FY 2012. 3) Release estimates of coverage measurement.
1) Complete release of all data products. 2) Release 100% of all evaluation reports scheduled for FY 2013. 3) Create data and questionnaire images for archiving. 4) Close out DRIS contract.
Description: This supports the Census Bureau’s performance measure to “complete key activities for cyclical census programs on time to support effective decision-making by policymakers, businesses and the public and meet constitutional and legislative mandates.” Note: This program ends in FY 2013.
CEN-151
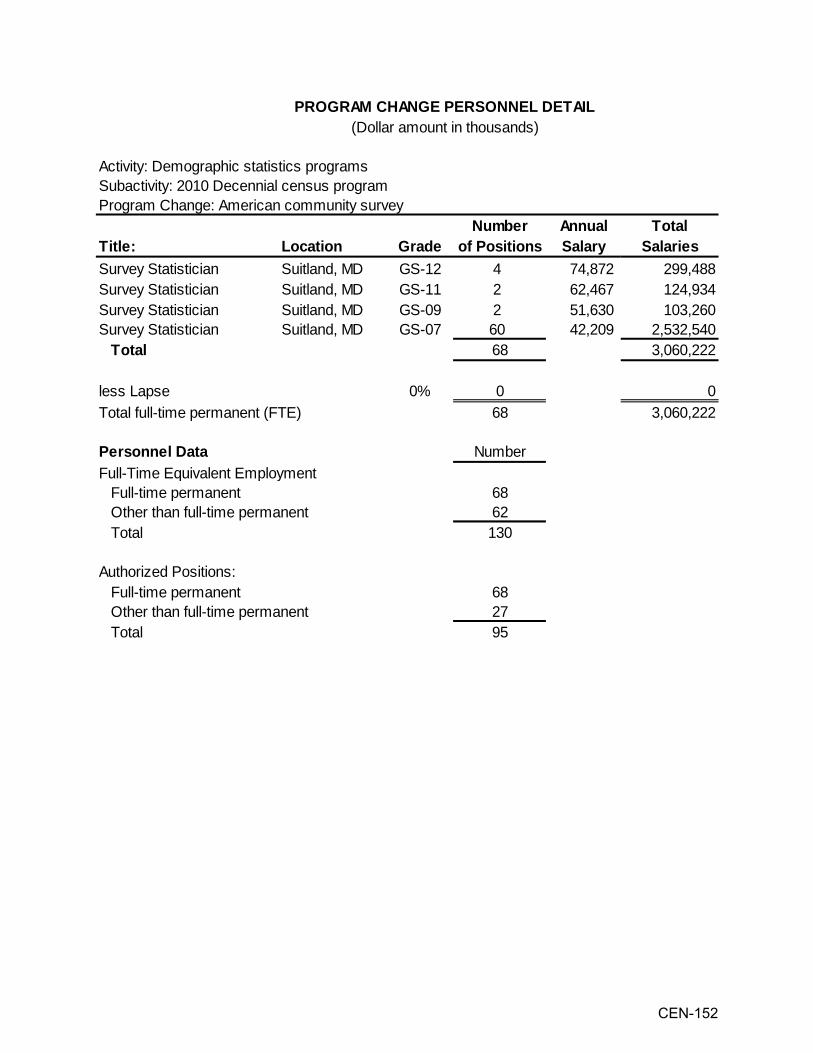
PROGRAM CHANGE PERSONNEL DETAIL(Dollar amount in thousands)
Activity: Demographic statistics programsSubactivity: 2010 Decennial census programProgram Change: American community survey
Number Annual TotalLocation Grade of Positions Salary Salaries
Survey Statistician Suitland, MD GS-12 4 74,872 299,488Survey Statistician Suitland, MD GS-11 2 62,467 124,934Survey Statistician Suitland, MD GS-09 2 51,630 103,260Survey Statistician Suitland, MD GS-07 60 42,209 2,532,540
68 3,060,222
0% 0 068 3,060,222
Personnel Data Number
6862
Total 130
Authorized Positions: Full-time permanent 68
27 Total 95
Title:
Full-time permanent
Total
less LapseTotal full-time permanent (FTE)
Full-Time Equivalent Employment
Other than full-time permanent
Other than full-time permanent
CEN-152

PROGRAM CHANGE PERSONNEL DETAIL(Dollar amount in thousands)
Activity: Demographic statistics programsSubactivity: 2010 Decennial census programProgram Change: 2010 Census and MAF/TIGER enhancement program
Number Annual TotalLocation Grade of Positions Salary Salaries
Program Manager Suitland, MD GS-15 -3 140,259 -420,777Program Analyst Suitland, MD GS-14 -21 119,238 -2,503,998Geographer Suitland, MD GS-14 -1 119,238 -119,238Mathematical Statistician Suitland, MD GS-14 -1 119,238 -119,238Statistician Suitland, MD GS-14 -5 119,238 -596,190IT Specialist Suitland, MD GS-14 -8 119,238 -953,904Geographer Suitland, MD GS-13 -2 100,904 -201,808Program Manager Suitland, MD GS-13 -16 100,904 -1,614,464Mathematical Statistician Suitland, MD GS-13 -11 100,904 -1,109,944Statistician Suitland, MD GS-13 -9 100,904 -908,136IT Specialist Suitland, MD GS-13 -2 100,904 -201,808Program Analyst Suitland, MD GS-13 -30 100,904 -3,027,120Geographer Suitland, MD GS-12 -11 84,855 -933,405Program Analyst Suitland, MD GS-12 -43 84,855 -3,648,765Program Manager Suitland, MD GS-12 -10 84,855 -848,550Mathematical Statistician Suitland, MD GS-12 -1 84,855 -84,855Statistician Suitland, MD GS-12 -14 84,855 -1,187,970IT Specialist Suitland, MD GS-12 -7 84,855 -593,985Program Analyst Suitland, MD GS-11 -38 70,794 -2,690,172Mathematical Statistician Suitland, MD GS-11 -12 70,794 -849,528Statistician Suitland, MD GS-11 -14 70,794 -991,116IT Specialist Suitland, MD GS-09 -1 66,635 -66,635Program Analyst Suitland, MD GS-09 -1 58,511 -58,511Statistician Suitland, MD GS-09 -19 58,511 -1,111,709Statistical Assistant Suitland, MD GS-09 -1 58,511 -58,511Geographer Suitland, MD GS-09 -6 53,350 -320,100Statistical Assistant Jeffersonville, IN GS-08 -1 50,117 -50,117Program Analyst Suitland, MD GS-07 -2 47,838 -95,676Clerk Suitland, MD GS-06 -1 43,046 -43,046Statistical Assistant Jeffersonville, IN GS-06 -270 44,213 -11,937,510Statistical Clerk Jeffersonville, IN GS-05 -72 34,445 -2,480,040
-633 -39,826,826
0% 0 0-633 -39,826,826Total full-time permanent (FTE)
Title:
Total
less Lapse
CEN-153
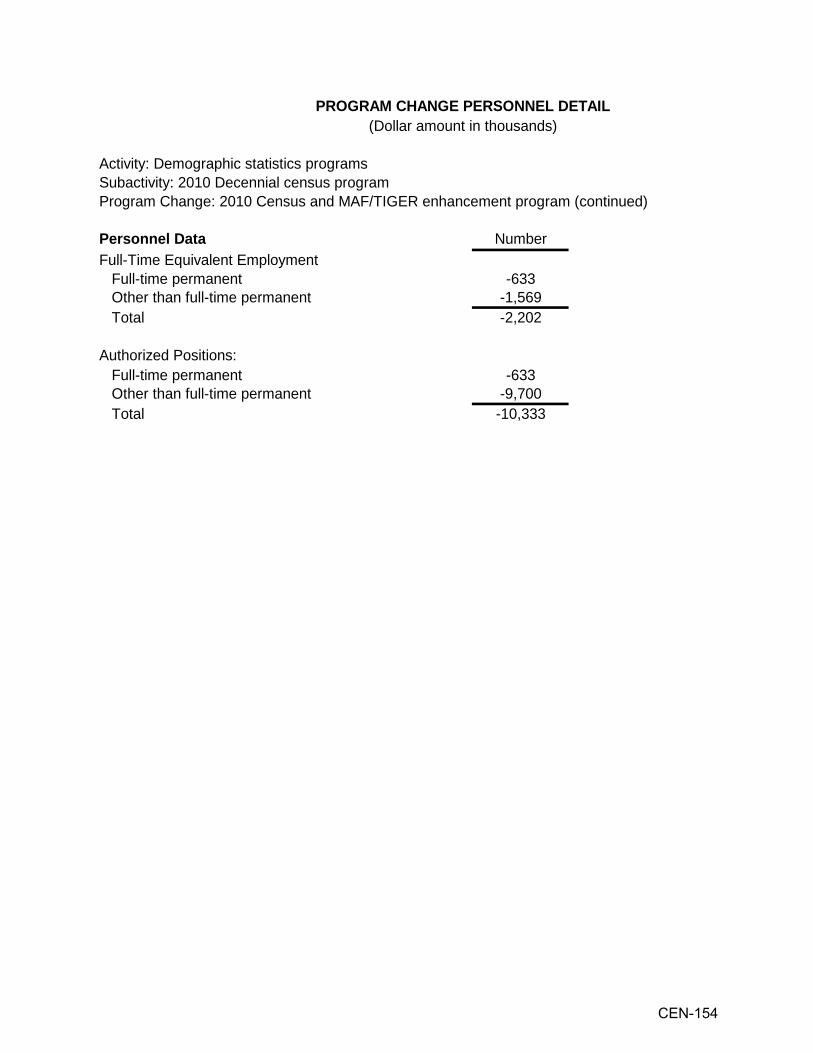
PROGRAM CHANGE PERSONNEL DETAIL(Dollar amount in thousands)
Activity: Demographic statistics programsSubactivity: 2010 Decennial census programProgram Change: 2010 Census and MAF/TIGER enhancement program (continued)
Personnel Data Number
-633-1,569
Total -2,202
Authorized Positions: Full-time permanent -633
-9,700 Total -10,333
Full-Time Equivalent Employment Full-time permanent Other than full-time permanent
Other than full-time permanent
CEN-154
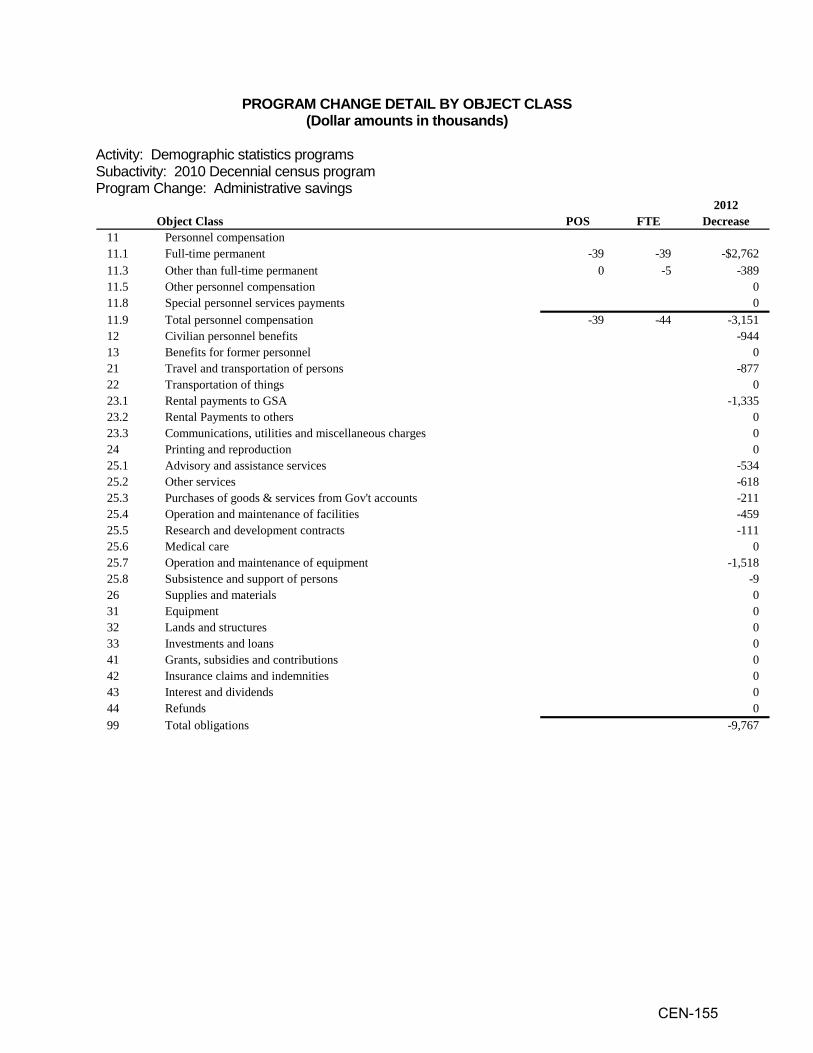
PROGRAM CHANGE DETAIL BY OBJECT CLASS (Dollar amounts in thousands)
Activity: Demographic statistics programs Subactivity: 2010 Decennial census program Program Change: Administrative savings
2012Object Class POS FTE Decrease
11 Personnel compensation11.1 Full-time permanent -39 -39 -$2,76211.3 Other than full-time permanent 0 -5 -38911.5 Other personnel compensation 011.8 Special personnel services payments 011.9 Total personnel compensation -39 -44 -3,15112 Civilian personnel benefits -94413 Benefits for former personnel 021 Travel and transportation of persons -87722 Transportation of things 023.1 Rental payments to GSA -1,33523.2 Rental Payments to others 023.3 Communications, utilities and miscellaneous charges 024 Printing and reproduction 025.1 Advisory and assistance services -53425.2 Other services -61825.3 Purchases of goods & services from Gov't accounts -21125.4 Operation and maintenance of facilities -45925.5 Research and development contracts -11125.6 Medical care 025.7 Operation and maintenance of equipment -1,51825.8 Subsistence and support of persons -926 Supplies and materials 031 Equipment 032 Lands and structures 033 Investments and loans 041 Grants, subsidies and contributions 042 Insurance claims and indemnities 043 Interest and dividends 044 Refunds 099 Total obligations -9,767
CEN-155

PROGRAM CHANGE DETAIL BY OBJECT CLASS (Dollar amounts in thousands)
Activity: Demographic statistics programs Subactivity: 2010 Decennial census
2012Object Class Decrease
11 Personnel compensation11.1 Full-time permanent -$36,76711.3 Other than full-time permanent -82,99911.5 Other personnel compensation -1,86511.8 Special personnel services payments 0 11.9 Total personnel compensation -121,63112 Civilian personnel benefits -30,85913 Benefits for former personnel -60021 Travel and transportation of persons -16,16222 Transportation of things -1,55723.1 Rental payments to GSA -10,46023.2 Rental Payments to others -1523.3 Communications, utilities and miscellaneous charges -56824 Printing and reproduction -15625.1 Advisory and assistance services -62,72325.2 Other services 6,74125.3 Purchases of goods & services from Gov't accounts -18,36525.4 Operation and maintenance of facilities -3,42625.5 Research and development contracts 2,00125.6 Medical care 025.7 Operation and maintenance of equipment -15,19025.8 Subsistence and support of persons -12926 Supplies and materials -17231 Equipment -2,74432 Lands and structures 0 33 Investments and loans 0 41 Grants, subsidies and contributions 0 42 Insurance claims and indemnities 0 43 Interest and dividends 0 44 Refunds 0 99 Total obligations -276,015
CEN-156

SUBACTIVITY: 2020 Decennial census Line Item: 2020 Decennial census Fiscal Year 2012 is the first year of funding for the three-year research and testing phase of the 2020 Census.
The request for FY 2012 will be used to initiate the research and testing phase for the 2020 Decennial Census Program. The Census Bureau must make fundamental changes to program, business, operational, and technical processes if it is to meet its vision and strategic goals, respectively:
Vision: An efficient and quality census supported by Bureau-wide systems, methods, and infrastructure
Goals:
• A complete and accurate census • Embraced and valued results • An efficient census • A well-managed census
Without substantial and bold innovation, costs may become prohibitive. The focus of FY 2012 activities will be to establish the research and testing infrastructure required to effectively test (1) new enumeration methods, (2) new processes to support field operations, (3) more cost-effective IT systems, and (4) address and spatial frame-related methods needed for the 2020 Census to supplement research being carried out in the geographic support program. Additionally, focus will be on program management and systems engineering activities to ensure effective management and technical/operational cohesion of FY 2012 research and testing projects. Consequently, the research and testing agenda (supported by strong program and risk management and systems engineering) addresses the major cost and quality drivers in the census, critical to achieving the strategic vision and goals.
The Census Bureau must make fundamental changes to the design, implementation, and management of the decennial census if it is to meet its goals for the 2020 Census. External stakeholders and experts have provided numerous reports and recommendations over the past decade asking for stronger program management and systems engineering approaches, as well as urging us to consider more automation and considering new listing and enumeration methods. Further, we have volumes of internal research and evaluations over the decades, which also support rethinking the decennial census. The objective of the initiative is to provide sufficient information to select a preliminary census design(s) by the end of FY 2014. Consequently, we have frontloaded and integrated critical research and testing into the FY 2012-2014 period rather than stretching it out over the FY 2012-2018 period. This decision was taken in reaction to lessons learned from previous, more decentralized, decennial research and testing approaches, which resulted in the key design decisions not being made until late in the decade. Without substantive changes to methods and developmental approaches, in addition to cost increases, the census may not meet the required quality goals. The Census Bureau analyzed costs over the 2010 Census life cycle to determine where the greatest costs were incurred. Most of the costs over the 15-year life cycle (including ACS and the MAF/TIGER Enhancement Program) were
CEN-157

incurred in FY 2009 and FY 2010. For the decennial census itself, a major cost in FY 2009 was the field costs associated with address canvassing (address list updating and map improvements). The main costs contributing to the peak in FY 2010 were field infrastructure and the costs of hiring field- office staff and enumerators. These costs resulted, in part, from labor-intensive field operations for nonresponse follow-up and paper-based data collection. Also significant was the maintenance of an IT infrastructure to support all operations, reflecting the majority of costs in major contracts and a portion of headquarters staff and support. Given the 50-year history of large cost increases coupled with an increasingly complex demographic and technological environment, a new approach is warranted if costs are to be contained. The 2020 Census planning approach is to (1) research new methods likely to affect costs early enough to inform timely design decisions, (2) incorporate strong risk and program management and comprehensive and centralized systems engineering, and (3) design a solution that is robust, resilient, and flexible enough to respond to as-yet-unknown further social and technological changes, to the greatest extent possible. Specifically, we will integrate testing into the production environment of the American Community Survey, conduct many small, inexpensive tests to narrow options, and take advantage of cross-program uses of systems being developed. Beginning early in the 2020 Census planning process, key groups were consulted and their priorities have been reflected in our strategic plans and strategies. Below is a list of the key stakeholders and their respective roles in planning the 2020 Census.
Key 2020 Census Stakeholder Groups Key 2020 Census Stakeholder Groups Area of Interest
The American People A Representative and Accurate Census Department of Commerce Oversight and Administration Office of Management and Budget Oversight and Reporting Government Accountability Office Auditing and Reporting Congress Oversight and Funding
Decennial Census Advisory Committee Advisory Scientific Advisory Committee Advisory
Race and Ethnic Advisory Committees Advisory
Key National, State, and Local Partners Advisory
National Academy of Sciences Consulting
PROGRAM CHANGES FOR FY 2012: 2020 Decennial Census (Base Funding 0 FTE and $0.0 million; Program Change 284 FTE and $67.0 million): Fiscal Year 2012 is the first year of funding for the three-year research and testing phase of the 2020 Census. The program change includes a decrease of 12 FTE and $2.3 million for administrative savings and a cyclical program increase of 296 FTE and $69.3 million.
CEN-158

Proposed Actions FY 2012 Key Program Activities The FY 2012 key program activities lay the foundation for managing and testing new decennial census systems and methods. Consequently, the 2020 Census program management, systems engineering, and research and testing efforts in FY 2012 center on:
• Finalizing critical plans for ensuring integrated and effective management of the 2020 Census program, such as risk management;
• Completing systems engineering activities for laying the foundation to develop standards and methods, as well as beginning architectural development, placing the IT infrastructure for the 2020 Census within the Census Bureau’s architecture;
• Developing qualitative and field test plans for operationalizing and assessing the research agenda;
• Developing study plans and conducting qualitative tests for evaluating response options, including electronic modes;
• Developing administrative records research plans and supporting alternative systems to focus on decennial needs;
• Benchmarking the integrated IT infrastructure and field automation logic and high-level requirements for early prototyping; and
• Developing study plans and concept models for measuring the error in the Master Address File in support of the geographic support program.
FY 2012 - 2014 Project-Related Activities The FY 2012-2014 project-related activities describe the workflow across the Research and Testing phase. During FY 2012, the Census Bureau must prepare the groundwork for vigorously researching multiple designs, which include operational options for measuring and improving several components, such as the census address frame; enumerating the population; developing and implementing the field infrastructure; and implementing other critical census functions. The bulk of the proof of concept research will occur in the FY 2012-2014 timeframe. Much of FY 2012 will be spent developing the plans and identifying candidate methods for testing a number of operational options. During FY 2012, we will be obtaining expert advice and input, as well as refining plans as more information is obtained. In order to ensure that we have sufficient expertise, we will leverage existing contracts, such as the Census Bureau’s existing Research and Development contract, through which we can reach a number of strong technical and research-oriented expertise to support research and testing projects during this first planning phase. Further, the 2020 Census program will be included in an overall Bureau-wide acquisition strategy for IT goods and services. Specific areas of research are listed below:
Census Frame Research and Testing Priorities (augmenting the geographic support program)
• Developing a prototype Master Address File (MAF) error model for determining error structures and levels for use in ensuring the ongoing quality of the MAF over the decade;
CEN-159

• Examining several approaches to independently measuring MAF quality over the decade; and
• Determining alternative approaches to conducting the statutorily mandated Local Update of Census Addresses program, given the potential to use only targeted address canvassing at the end of the decade.
Enumeration Research and Testing Priorities
• Substantially increasing electronic self-response options; • Tailoring response modes by demographics and geography; and • Testing the use of administrative records to support and augment response.
Infrastructure Research and Testing Priorities
• Pursuing Bureau-wide systems solutions for workload management, listing, and enumeration automation;
• Developing integrated Information Technology solutions; • Reengineering the entire process timeline from notification, through capture, processing, and
response database development; and • Enhancing administrative records databases.
Plans and Deliverables by Investment Area To organize the research and testing phase work, we identified eight investment areas. The required work will be linked through a defined 2020 Census Work Breakdown Structure so that for any given fiscal year, it is clear what work is being done at what cost and where acquisitions are in their life cycles. Below is a description of the work and major deliverables in FY 2012 by investment area. Program management Funding in this category supports overall management of the planning of the 2020 Census. Specifically, funding covers the significant task of developing strategic and program management processes and documents, implementing processes, and maintaining documents. Program process areas include risk, change, issues, performance, schedule, sourcing, governance, communications, human capital management, and budget management, which include budget formulation, presentation, and execution. It also supports development and oversight of the program’s Research and Testing Plan and numerous program execution products, including acquisitions. Further, this funding supports interactions with oversight activities by the Government Accountability Office, the Office of the Inspector General, the Office of Management and Budget, and others; and working with and support of the Census Bureau advisory committees. Key deliverables include:
• Budget Management Plan • FY 2012 Operating Plans • Risk Management Plan • Human Capital Management Plan • Quality Management Plan • Stakeholder Management Plan • Communications Plan
CEN-160
Systems engineering and integration Funding in this category supports the implementation of a consistent systems engineering process for each development effort. It includes the implementation of a systems engineering process to integrate the separate developments into an enabling operational infrastructure. Key activities include leveraging the Census Bureau’s enterprise architecture to assure that component systems designs are consistent with mandated standards and that they are designed to inter-operate as required; establishing a requirements development and management process to assure that operational requirements (and constraints) are fully understood and translated into technical requirements; developing and evolving operational and systems concepts of operation; conducting analyses of alternatives to identify preferred options, taking into account expected costs and benefits; leveraging a modular open system design to allow for necessary evolution of requirements and expected technology refresh opportunities; establishing a technical integration process to assure that separately developed components can and do operate cooperatively, consistent with the concept of operations; and establishing a systems engineering and integration function in support of the decennial census planning office. Key deliverables include:
• Systems Engineering Master Plan • Enterprise Architecture Alignment Plan • High-Level Business Requirements Document • System of Systems Life cycle Methodology/Strategy • Certification and Accreditation Plan
Census frame The funding for this investment area will be used to support projects that supplement the geographic support program. It includes developing a comprehensive error model for the Master Address File (MAF) to be used to measure quality needed for the decennial census; an Independent MAF Quality Assessment, which is intended to ensure that quality measures are being met; and a Local Update of Census Addresses (LUCA) Improvement project for increasing the utility and efficiency of LUCA, especially in a potential targeted address canvassing environment. All these projects are crucial for ensuring that the 2020 Census begins with a high quality MAF, which is the single biggest predictor of a quality census. The 2020 Census frame projects, together with the FY 2011 Geographic Support Initiative, will ensure that the decennial census’ need that MAF quality is well understood, adequately measured, and deficiencies quickly addressed will be met. Key deliverables include:
• Early MAF Error Model Prototype • Preliminary Report on Candidate Methods for Independent Ongoing MAF Quality
Assessment • Preliminary Report on Candidate Methods for LUCA Processes
Enumeration Funding in this investment area will support expanding, automating, tailoring, and increasing the efficiencies of response. It includes projects that attempt to reduce paper, make it easier to be counted, and tailor response modes to geographic or demographic groups. Should more and automated self-response options be available (such as Internet response), they could engender higher self-response, resulting in decreased cost and increased quality (self-response is typically of better quality than enumerator-completed response). This investment area also includes examining whether administrative records can be used for nonresponse applications. Should this prove feasible, there would be less required fieldwork and less data capture, resulting in a smaller field infrastructure and, ultimately, lower cost. This effort builds on the infrastructure that is being developed as part of the administrative records initiative in the FY 2011 President’s Budget but has a decennial census-specific focus. Results of work in FY 2011 supported by that initiative will inform work in this investment area.
CEN-161

In this investment area, projects cluster into three areas: (1) automated field infrastructure, in which we investigate how to design and implement efficient field automation; (2) optimizing self-response, which includes investigating new electronic modes, new contact modes (e.g., post office boxes, email addresses); and (3) investigating alternative approaches to nonresponse follow-up, including alternative contacts (e.g., cell phone, email), as well as using administrative records to supplement nonresponse data. Key deliverables include:
• High-level Requirements and Design Document for the Automated Field Infrastructure • Preliminary Report on Candidate Methods for nonresponse follow-up (Non-Administrative
Records) • Preliminary Report on Candidate Modes for Self-Response • High-Level Requirements and Design Document for Web-Based Workload Management
Response processing Work in this investment area for FY 2012 is limited to early explorations to improve coding, editing, and imputation of missing count and response items. It is intended to see what the options are for better integration of these three related processes and to see if new methods exist. Further, we will research roles for editing race and Hispanic Origin responses with problems and the feasibility of coding responses during data capture. The key deliverable is:
• Early Coding, Editing, and Imputation Prototype Evaluative programs Funding in this investment area for FY 2012 is limited to a low level of effort in order to begin identifying candidate sources and methods for use for expanding demographic analysis. (For example, the 2010 Census Demographic Analysis program will not produce estimates of under- or over-coverage for the Hispanic population.) Also, very limited efforts on census coverage measurement may include reviewing the results from the 2010 Census Program of Evaluations and Experiments and to begin in-house research on improving an alternative Census Coverage Measurement study. The key deliverable is:
• Preliminary Report on Candidate Methods for Demographic Analysis Infrastructure Work in this investment area for FY 2012 is intended to explore improving, consolidating, streamlining, and integrating of IT and field infrastructure. Projects supporting this investment area develop common cross-program and cost-effective IT technical solutions, such as centralizing and integrating the hardware, software, and telecommunications that support decennial and other programs; development of databases to support self- and nonresponse, including using administrative records; increasing the ease and consistency of user interfaces by moving to a web-based workload management system; examining alternatives to the current field infrastructure, as well as streamlining and optimizing logistics management processes; and making major inroads on dealing with duplicate information by putting significant effort into exploring multiple matching methods. Should Bureau-wide, streamlined, and integrated approaches be adopted, there will be fewer and more compatible systems, hence decreasing costs, increasing quality, and having transferable systems and methods. Further, should the field infrastructure and logistics model be streamlined, significant cost and time savings will occur. The key deliverables include:
• Preliminary Report on Candidate Methods for Improving Quality Control of Field Work • Prototype of Alternative Administrative Records Database • Preliminary Report on Hardware/Software Candidate Solutions for IT Infrastructure • Preliminary Report on Privacy and Confidentiality Issues • Preliminary Report on Candidate Methods for Improving Matching Processes • Preliminary Report on Candidate Contact Methods
CEN-162

• Preliminary Report on Administrative Records Options for Nonresponse follow-up This program supports the Department of Commerce’s Science and Information goal. It supports the Census Bureau’s Strategic Plan Goal 1.b. to: Provide timely, relevant, accurate, and accessible benchmark measures of the U.S. population, economy, and governments to assess U.S. competitiveness, identify new business opportunities, and foster domestic job growth. Statement of Need and Economic Benefits The multiyear integrated program for planning, testing, and developing the constitutionally mandated decennial census begins with developing and solidifying the research and testing infrastructure in FY 2012. As stated earlier, the vision is “An efficient and quality census supported by corporate systems, methods, and infrastructure.” The expected results of the approaches for the 2020 Census are described below. These are not exhaustive but are meant to highlight areas where approaches for the 2020 Census specifically strive to overcome some of the problems encountered in the 2010 Census. Further, we describe the potential program return on investment.
• Establishing early program integration and common vision setting, and aligning major program control points.
o 2020 Approach: Development of the Strategic Plan early in the life cycle to guide subsequent plans and work. A full life cycle, integrated schedule, including a Work Breakdown Structure (WBS), will link budgets, work, acquisitions, and testing.
o 2010 Approach: Program management plans were not an early priority, resulting in the need to finalize these plans late in the cycle in response to crisis. Schedule information was not always linked to the budget, resulting in the lack of an integrated view of the full life cycle with schedules and budgets out of alignment.
• Estimated costs better aligned with actual costs.
o 2020 Approach: Use of a budget that incorporates successive approximation
techniques for reduced uncertainty, and allowing for alternative cost estimates in 2013 and greater precision the closer we get to 2020.
o 2010 Approach: In 2000, the Census Bureau had to develop a full life cycle budget before work on the actual design for 2010 had even begun. This resulted in a misalignment between budget and schedule, causing us to repeat some issues that occurred during Census 2000.
• Reduced contract risk and solutions to better meet actual program needs.
o 2020 Approach: Adoption of an overall 2020 Census acquisition strategy for external
contractor support, and to solidify the sourcing strategy criteria for build or buy.
o 2010 Approach: Use of multiple acquisition strategies, resulting in late or incomplete acquisitions and misalignment of budgeted costs to contractor proposals, causing early re-scoping.
CEN-163

• Fewer and less severe risk events.
o 2020 Approach: Initiation of risk management at the beginning of the planning cycle to mitigate risk early in the decennial census research and testing cycle.
o 2010 Approach: No formal mechanism to manage risk until the production phase of the program, allowing risks to escalate to issues in the research and development phase of the program.
• Better metrics for determining how the program is progressing across numerous projects.
o 2020 Approach: Utilization of Performance Logic Models to define a Performance Management Plan for all projects in the program in order to illustrate how a project's performance measures are related to its specific problems, goals, and objectives.
o 2010 Approach: Performance Logic Models were not utilized, resulting in approaches being designed on the fly in order to communicate how each project in the program was progressing. Earned Value Management was used mainly for major contracts.
• Increased efficiency, reduced costs, higher quality, and reduced data collection timeline and/or lower differential undercount.
o Self-Response Options
2020 Approach: Investigation of a wide array of electronic self-response options; also researching and testing of response modes to tailor by demographics and geography.
2010 Approach: Initially investigated the use of an Internet option but dropped plans based on IT security concerns and cost-benefit analysis. Implemented targeted replacement mailings and a bilingual form.
o Nonresponse Options
2020 Approach: Research and testing automated data collection instruments, use of alternative modes of data collection, testing the use of administrative records in various nonresponse applications, and the use of more efficient strategies for traditional nonresponse follow-up, including reduced number of contacts and alternative contact modes (e.g., email).
2010 Approach: Initially planned the use of handheld computers for Non-response Follow-up but dropped those plans due to major contract management issues. As a contingency, used a traditional paper-based, labor-intensive, and expensive non-response approach (involving up to six contacts).
o Headquarters and Field Automation
2020 Approach: Research and testing an integrated workload management system and automation of field operations, including a prototype for a Bureau-
CEN-164
wide listing and enumeration device and a standard operational control system that can be used for other surveys (not just the shortform census).
2010 Approach: As contingencies to the Field Data Collection Automation contract, the 2010 Census ended up using separate operational control systems, two listing devices, and no automated enumeration devices, resulting in additional expense, higher risk due to the decision to go back to paper coming late in the program, and potentially higher error rates.
o IT Infrastructure
2020 Approach: Research and testing the feasibility of a common IT infrastructure (i.e., hardware, software, telecommunications, operating system) for decennial and demographic programs.
2010 Approach: One-of-a-kind systems were developed solely for the 2010 Census that become somewhat obsolete at the end of the census.
o Administrative Records
2020 Approach: Conduct research to aggressively pursue testing the use of
administrative records in nonresponse applications. This may include developing an alternative database that is not constrained by tax record data or pursue legislative changes that allow more efficient use of tax record data.
2010 Approach: Use of the administrative records database (including tax record data) in highly-restricted and limited applications.
Potential Return on Investment As stated earlier, without substantial innovation and improvements, the cost of undertaking the 2020 Census likely will be prohibitive. It is anticipated that the first workable life cycle estimate for the cost of the 2020 Census can accompany the submission of Phase II of the program, Operational Development and Systems Testing (FY 2015 –FY 2018). However, as we progress in the Research and Testing phase, move into the Operational Development and Systems Testing phase, and integrate results and information obtained from external experts, we will be able to further refine the life cycle cost estimate. The idea is to narrow the range of estimates as the 2020 Census gets closer. If the design for the 2020 Census were viewed on a continuum of change, the purpose of the research and testing agenda would be to determine how far along the continuum the 2020 Census Bureau could proceed without introducing unacceptable risk. By early FY 2013, as research and testing results are incorporated into plans, the Census Bureau will have narrowed the number of possible design alternatives to just a few, and thereby identify a range for full life cycle estimates. As mentioned earlier, the focus of the 2020 Census Research and Testing Agenda is to research methods aggressively to increase response rates, reduce paper through automation, and thus reduce field labor and infrastructure. An example scenario illustrating the potential return on investment would be if we were able to increase self-response by one percentage point through alternative contact modes that are tailored for each demographic group and linked to physical addresses, then we could save millions of dollars (for the 2010 Census, a one percentage point increase in the mail response rate is estimated to save $85 million).
CEN-165

Linkages with Other Initiatives/Programs
The 2020 Census program will take advantage of related work across the Census Bureau. Therefore, we have identified specific relationships and interactions, not only between and among program projects, but also with other initiatives/programs, particularly with the expansion of the geographic support program in FY 2011. Below is a summary of the interdependencies.
• Supplement research included in the geographic support program. To ensure no duplication of effort, clear project-by-project delineation will be decided to guide which activities belong in the geographic support program and which ones are required for 2020 Census independent research. Specifically, 2020 Census frame-related projects are focused on developing independent, customer-focused methods for understanding error in the MAF, measuring MAF quality over the decade, and in improving LUCA. Without these projects, there is a high risk that we may not be able to discern the true quality of the MAF, potentially leading to the need for a full address canvassing. Results will flow in both directions between the GSS and 2020 Census research projects.
• Supplement infrastructure activities in the FY 2012 Administrative Records Initiative. To
ensure no duplication of effort, clear project-by-project delineation will be decided to guide which activities belong in the Administrative Records Initiative and which ones are required for 2020 Census independent research. Specifically, we are funding decennial-focused projects, including an alternative database to that of the current administrative records infrastructure database, which is dependent on highly restricted tax data, and research on using administrative records for decennial census nonresponse applications.
• Identify high-priority evaluations and experiments within the 2010 Census Program of
Evaluations and Experiments (CPEX). To ensure timely insertion of CPEX results into 2020 Census projects, we will closely coordinate with appropriate CPEX Program managers to leverage preliminary results.
• Integrate appropriate testing into the American Community Survey Methods Panel
infrastructure.
• Look for opportunities for Bureau-wide architecture and IT solutions, looking to the Chief Information Officer as the systems overseer for IT solutions.
• Integrate key components of the field infrastructure into all planning.
2020 Census Program: Outcomes of a Successfully Redesigned Decennial Census The new design for the 2020 Census will produce the Nation’s population counts needed to meet its constitutional mandate of producing the counts once each decade for apportioning the seats in the U.S. House of Representatives among the states. The Census Bureau’s objective for the Research and Testing Phase (2012 – 2014) is to develop a preliminary design based on solid research aimed at achieving the goal of conducting the 2020 Census at a lower cost than the 2010 Census (per housing unit on an inflation-adjusted basis) while maintaining high quality results.
CEN-166

In addition, data collected from the 2020 Decennial Census and the ACS will improve the Nation’s ability to: • Determine the boundaries of congressional, state, and local legislative districts; • Allocate Federal funds for state, local, and tribal governments (estimated to be over $400 billion
annually); • Monitor and evaluate Federal legislation; • Develop plans for roads, schools, hospitals, and community and job training centers; • Conduct business research; and • Support Federal, state, tribal, and local government responses to emergency situations. Performance Goals and Measurement Data (2020 Census) Performance Goal: Science and Information Goal.
FY 2012 Target
FY 2013 Target
FY 2014 Target
With Increase 1) Candidate approaches are identified for measuring (e.g., MAF Error Model) and improving MAF quality (e.g., LUCA). 2) Candidate approaches are identified for automating (e.g., Automating Field Infrastructure), tailoring, (e.g., Optimizing Self-Response), and increasing the efficiencies of response (e.g., Reducing and Improving Household follow-up Operations). 3) Infrastructure approaches are identified for integrating (e.g., Integrated IT infrastructure), expanding (e.g., Alternative Administrative Records Database), and optimizing (Web-based HQ Workload Management) field and IT infrastructure.
1) Candidate MAF quality measurement and improvement approaches are tested, validated, and refined. 2) Candidate approaches for automating, tailoring, and increasing the efficiencies of response are tested, validated, and refined. 3) Candidate approaches for integrating, expanding, and optimizing field and IT infrastructure are tested, validated, and refined.
1) Approaches are selected for measuring and improving MAF quality. 2) Approaches are selected for automating, tailoring, and increasing the efficiencies of response. 3) Approaches are selected for integrating, expanding, and optimizing field and IT infrastructure.
Without Increase Without the requested increase, we will not be able to institute a 2020 Census early planning effort in FY 2012.
Description: This supports the Census Bureau’s performance measure to “complete key activities for cyclical census programs on time to support effective decision-making by policymakers, businesses and the public and meet constitutional and legislative mandates.” Note: This program begins in FY 2012, and the first major phase runs through FY 2014.
CEN-167

PROGRAM CHANGE PERSONNEL DETAIL(Dollar amount in thousands)
Activity: Demographic statistics programsSubactivity: 2020 Decennial census
Number Annual TotalLocation Grade of Positions Salary Salaries
Program Manager Suitland, MD GS-15 3 140,259 420,777Program Analyst Suitland, MD GS-14 21 119,238 2,503,998Geographer Suitland, MD GS-14 1 119,238 119,238Mathematical Statistician Suitland, MD GS-14 1 119,238 119,238Statistician Suitland, MD GS-14 5 119,238 596,190IT Specialist Suitland, MD GS-14 8 119,238 953,904Geographer Suitland, MD GS-13 2 100,904 201,808Program Manager Suitland, MD GS-13 16 100,904 1,614,464Mathematical Statistician Suitland, MD GS-13 11 100,904 1,109,944Statistician Suitland, MD GS-13 9 100,904 908,136IT Specialist Suitland, MD GS-13 2 100,904 201,808Program Analyst Suitland, MD GS-13 30 100,904 3,027,120Geographer Suitland, MD GS-12 11 84,855 933,405Program Analyst Suitland, MD GS-12 43 84,855 3,648,765Program Manager Suitland, MD GS-12 10 84,855 848,550Mathematical Statistician Suitland, MD GS-12 1 84,855 84,855Statistician Suitland, MD GS-12 14 84,855 1,187,970IT Specialist Suitland, MD GS-12 7 84,855 593,985Program Analyst Suitland, MD GS-11 32 70,794 2,265,408Mathematical Statistician Suitland, MD GS-11 1 70,794 70,794Statistician Suitland, MD GS-11 1 70,794 70,794Program Analyst Suitland, MD GS-09 1 58,511 58,511Statistician Suitland, MD GS-09 2 58,511 117,022Program Analyst Suitland, MD GS-07 2 47,838 95,676Clerk Suitland, MD GS-06 1 43,046 43,046
235 21,795,406
0% 0 0235 21,795,406
Total
Title:
less LapseTotal full-time permanent (FTE)
CEN-168
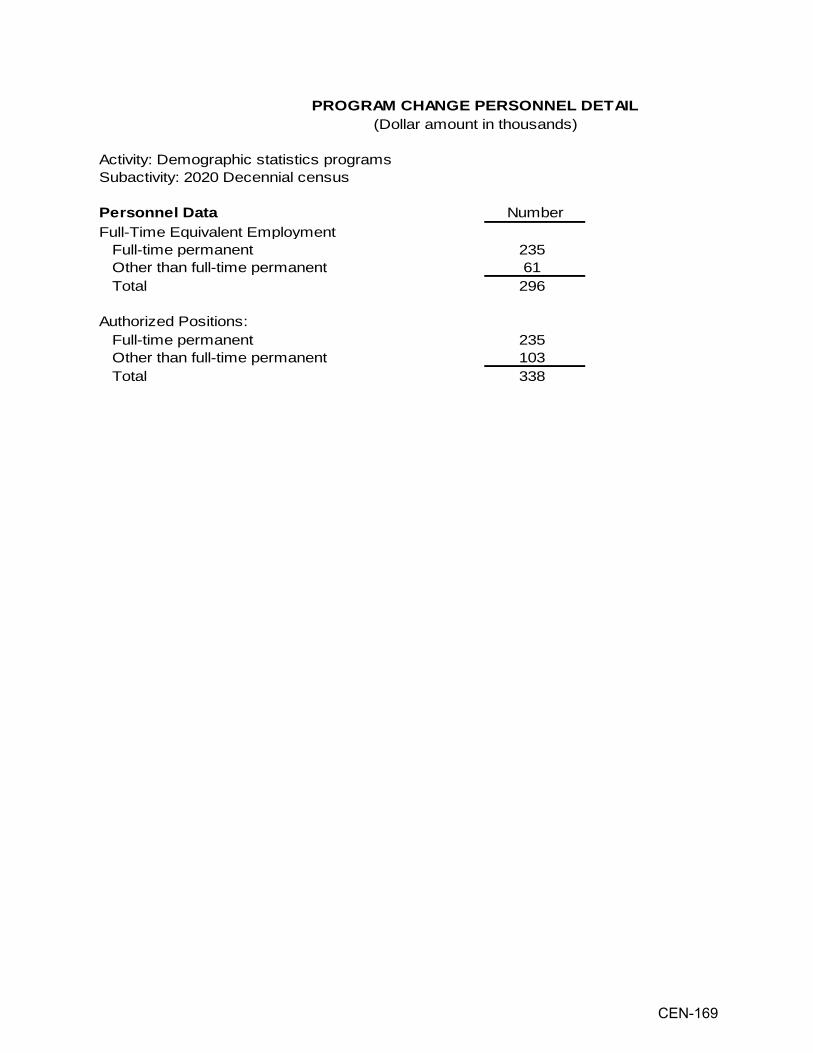
PROGRAM CHANGE PERSONNEL DETAIL(Dollar amount in thousands)
Activity: Demographic statistics programsSubactivity: 2020 Decennial census
Personnel Data Number
23561
Total 296
Authorized Positions: Full-time permanent 235
103 Total 338
Full-time permanent Other than full-time permanent
Other than full-time permanent
Full-Time Equivalent Employment
CEN-169

PROGRAM CHANGE DETAIL BY OBJECT CLASS (Dollar amounts in thousands)
Activity: Demographic statistics programs Subactivity: 2020 Decennial census Program Change: Administrative savings
2012Object Class POS FTE Decrease
11 Personnel compensation11.1 Full-time permanent -11 -11 -$78011.3 Other than full-time permanent 0 -1 -6111.5 Other personnel compensation 011.8 Special personnel services payments 011.9 Total personnel compensation -11 -12 -84112 Civilian personnel benefits -25013 Benefits for former personnel 021 Travel and transportation of persons 022 Transportation of things 023.1 Rental payments to GSA 023.2 Rental Payments to others 023.3 Communications, utilities and miscellaneous charges 024 Printing and reproduction 025.1 Advisory and assistance services -2025.2 Other services -1,02725.3 Purchases of goods & services from Gov't accounts 025.4 Operation and maintenance of facilities -5425.5 Research and development contracts -2425.6 Medical care 025.7 Operation and maintenance of equipment -4125.8 Subsistence and support of persons 026 Supplies and materials 031 Equipment 032 Lands and structures 033 Investments and loans 041 Grants, subsidies and contributions 042 Insurance claims and indemnities 043 Interest and dividends 044 Refunds 099 Total obligations -2,257
CEN-170

PROGRAM CHANGE DETAIL BY OBJECT CLASS (Dollar amounts in thousands)
Activity: Demographic statistics programs Subactivity: 2020 Decennial census
2012Object Class Increase
11 Personnel compensation11.1 Full-time permanent $21,79511.3 Other than full-time permanent 5,06811.5 Other personnel compensation 1,04511.8 Special personnel services payments 0 11.9 Total personnel compensation 27,90812 Civilian personnel benefits 7,23513 Benefits for former personnel 3921 Travel and transportation of persons 48322 Transportation of things 2023.1 Rental payments to GSA 3,31123.2 Rental Payments to others 023.3 Communications, utilities and miscellaneous charges 1,50624 Printing and reproduction 6125.1 Advisory and assistance services 34525.2 Other services 16,60225.3 Purchases of goods & services from Gov't accounts 3,04825.4 Operation and maintenance of facilities 87125.5 Research and development contracts 39225.6 Medical care 025.7 Operation and maintenance of equipment 66825.8 Subsistence and support of persons 1826 Supplies and materials 27331 Equipment 6,47732 Lands and structures 0 33 Investments and loans 0 41 Grants, subsidies and contributions 0 42 Insurance claims and indemnities 0 43 Interest and dividends 0 44 Refunds 0 99 Total obligations 69,257
CEN-171
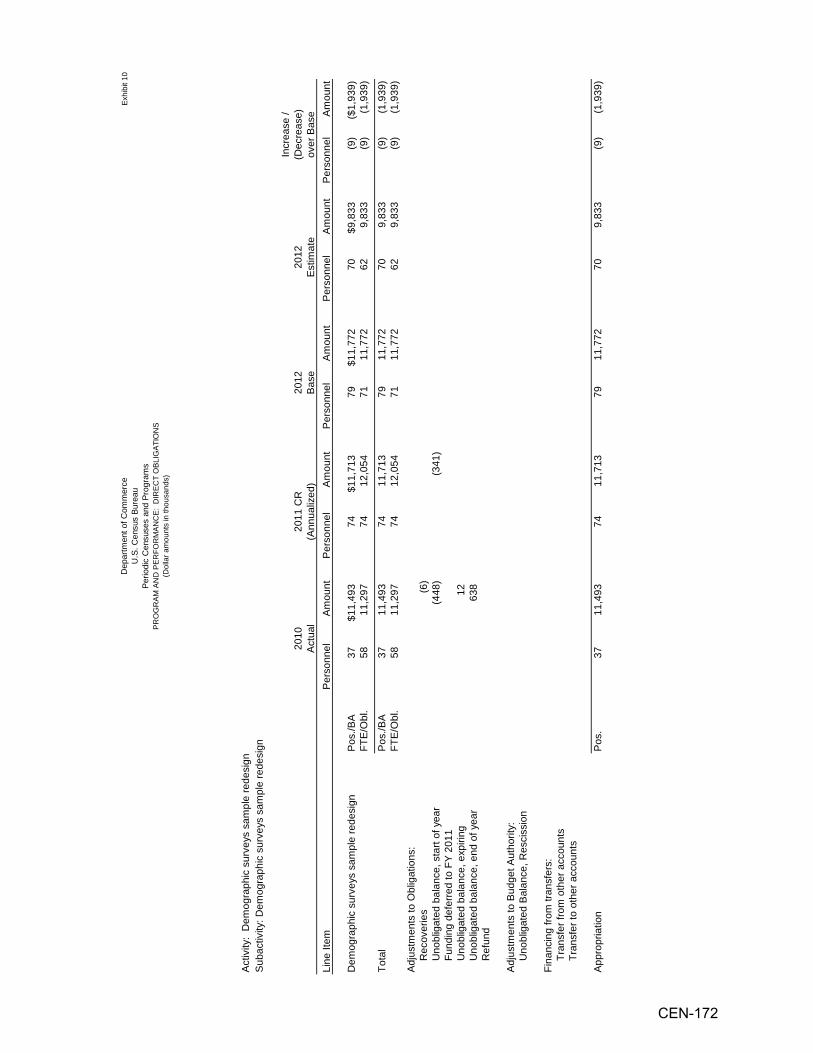
Dep
artm
ent o
f Com
mer
ceU
.S. C
ensu
s Bu
reau
Perio
dic
Cen
suse
s an
d Pr
ogra
ms
PR
OG
RA
M A
ND
PE
RFO
RM
AN
CE
: D
IRE
CT
OB
LIG
ATI
ON
S
(Dol
lar a
mou
nts
in th
ousa
nds)
Exh
ibit
10
Act
ivity
: D
emog
raph
ic s
urve
ys s
ampl
e re
desi
gnS
ubac
tivity
: Dem
ogra
phic
sur
veys
sam
ple
rede
sign
Line
Item
Per
sonn
elA
mou
ntP
erso
nnel
Am
ount
Per
sonn
elA
mou
ntP
erso
nnel
Am
ount
Per
sonn
elA
mou
nt
Dem
ogra
phic
sur
veys
sam
ple
rede
sign
Pos
./BA
37$1
1,49
374
$11,
713
79$1
1,77
270
$9,8
33(9
)($
1,93
9)FT
E/O
bl.
5811
,297
7412
,054
7111
,772
629,
833
(9)
(1,9
39)
Tota
lP
os./B
A37
11,4
9374
11,7
1379
11,7
7270
9,83
3(9
)(1
,939
)FT
E/O
bl.
5811
,297
7412
,054
7111
,772
629,
833
(9)
(1,9
39)
Adj
ustm
ents
to O
blig
atio
ns:
R
ecov
erie
s(6
)
Uno
blig
ated
bal
ance
, sta
rt of
yea
r(4
48)
(341
)
Fun
ding
def
erre
d to
FY
2011
U
nobl
igat
ed b
alan
ce, e
xpiri
ng12
Uno
blig
ated
bal
ance
, end
of y
ear
638
R
efun
d
Incr
ease
/ (D
ecre
ase)
over
Bas
e20
10A
ctua
l20
11 C
R(A
nnua
lized
)20
12
B
ase
2012
Est
imat
e
Adj
ustm
ents
to B
udge
t Aut
horit
y:
Uno
blig
ated
Bal
ance
, Res
ciss
ion
Fina
ncin
g fro
m tr
ansf
ers:
T
rans
fer f
rom
oth
er a
ccou
nts
T
rans
fer t
o ot
her a
ccou
nts
App
ropr
iatio
nP
os.
3711
,493
7411
,713
7911
,772
709,
833
(9)
(1,9
39)
CEN-172

APPROPRIATION ACCOUNT: Periodic Censuses and Programs BUDGET ACTIVITY: Demographic surveys sample redesign
For FY 2012, the Census Bureau requests a decrease of $1.9 million and 9 FTE from the FY 2012 base program for a total of $9.8 million and 62 FTE for demographic surveys sample redesign BASE JUSTIFICATION FOR FY 2012: Demographic Surveys Sample Redesign Overview The demographic surveys sample redesign budget is organized into 1 subactivity with the same name under the Periodic Censuses and Programs account. This subactivity contains one line item with the same name ($9.8 million and 62 FTE).
Significant Adjustments-to-Base (ATBs): The Census Bureau requests a net increase of 0 FTE and $59,000 to fund adjustments to current programs for demographic surveys sample redesign activities. The increase will provide inflationary increases for non-labor activities, including service contracts, utilities, and rent charges from the General Services Administration (GSA). ADMINISTRATIVE COST SAVINGS: The Administration is pursuing an aggressive government-wide effort to curb non-essential administrative spending called the Administrative Efficiency Initiative. In order to be good stewards of taxpayer money the Federal Government should continue to seek ways to improve the efficiency of programs without reducing their effectiveness. As such, the President directed each agency to analyze its administrative costs and identify savings where possible. After reviewing its administrative costs, the Census Bureau has identified $439,000 in administrative savings. The Census Bureau has targeted a number of areas to achieve its savings. Acquisition plans for FY 2012 account for $397,000 in savings. In the area of human capital, the Census Bureau expects to reduce its costs by $35,000 through position management and control and reduced workers compensation costs. Another $7,000 in administrative savings has been identified in logistics plans and in general administrative support by limiting discretionary travel and printing. The $439,000 in administrative savings identified above represent real reductions to the Census Bureau’s funding level and will help reduce overall spending by the Federal Government.
Department of Commerce U.S. Census Bureau
Periodic Censuses and Programs PROGRAM JUSTIFICATION
CEN-173

SUBACTIVITY: Demographic surveys sample redesign LINE ITEM: Demographic Surveys Sample Redesign Demographic Surveys Sample Redesign Overview The objectives of the demographic surveys sample redesign subactivity/line item are to, with the existence of a continually updated Master Address File (MAF) and the continued availability of American Community Survey (ACS) data, take advantage of an opportunity to reduce future survey costs by improving our approach to designing and selecting samples for the major national household surveys. Our plan is to implement future redesign samples based on the availability of MAF and ACS information. After the next coordinated sample redesign, we will allow sponsoring agencies the option to redesign survey samples at any time during the decade, not just once every ten years after the Decennial Census. The major goal of the Demographic Surveys Sample Redesign is to minimize total survey costs for the desired level of reliability. The primary objectives of the program are to:
• deliver quality samples that meet the sponsors’ data needs; • coordinate the sample selection and implementation to reduce costs and reduce respondent
burden; • fully exploit the use of a continuously updated MAF and the ACS to produce cost-effective
survey samples; • develop a flexible, easily maintainable infrastructure that provides the capability to redesign
surveys more frequently than once after each Decennial Census and to produce new or supplemental survey samples with quick turn-around;
• reduce survey costs, with a focus on costs associated with data collection, ongoing production, and overheads; and
• implement continuous process improvements. The demographic surveys sample redesign program is essential to maintain the relevance, accuracy, and quality of major federal surveys of families and households by providing improved sampling methodologies, sample designs, and automated data processing systems. Only by selecting new, updated samples for the major household surveys – based on the most recent information about the population – will the Congress and the public be able to maintain confidence in critical socioeconomic indicators such as the monthly unemployment rate, the monthly consumer price index and annual measures of health insurance coverage and fair market rent, which are vital to the effective management of the United States’ economy and government programs. The program takes updated information on the location and characteristics of the American population and uses that up-to-date snapshot to select representative samples of the population. These new, representative samples then become the basis for major household surveys conducted by Federal agencies until the next sample redesign. In the past, redesigns occurred every ten years because the decennial census was the only source of sufficiently comprehensive data to update the samples. This meant that improvements in survey methodology or technology could not be implemented on a timely basis. Future sample redesigns will not be locked into a once-a-decade cycle because of the continued availability of updated MAF and ACS data. We will have the flexibility to produce up-to-date, efficient samples for the Federal household surveys when needed.
CEN-174

The major recurring household surveys requiring sample redesign include the:
• Current Population Survey, jointly sponsored by the Bureau of Labor Statistics (BLS) and the
U.S. Census Bureau; • Survey of Income and Program Participation, sponsored by the U.S. Census Bureau; • Consumer Expenditure Surveys, sponsored by the BLS; • American Housing Surveys, sponsored by the Department of Housing and Urban
Development; • National Crime Victimization Survey, sponsored by the Bureau of Justice Statistics; • National Health Interview Survey, sponsored by the National Center for Health Statistics; and • State Children’s Health Insurance Program survey, jointly sponsored by the BLS and the U.S.
Census Bureau. Because the statistical methods and survey technologies underlying these surveys are generally consistent, the sample redesign program improves their efficiency and reduces costs. Research and development methods and costs are shared among the surveys. Each survey does not need to redesign on its own, but rather leverages the knowledge, skills and abilities of staff working on the other surveys. The overall level of effort is reduced by the coordination made possible by the sample redesign program. For example, one sampling system will handle all of the surveys above, instead of seven different sampling systems. The Census Bureau’s funding request for the demographic surveys sample redesign historically constitutes about 75 percent of the total funding needed for the program over the decade and represents activities that are common to all surveys. The Census Bureau’s partner agencies, which sponsor the surveys, request the remaining funds to cover activities specific to their surveys. The benefit of this funding arrangement is that it preserves the economies of scale realized by designing the surveys’ samples and the systems to select and maintain them in an effort that is centrally managed and funded through the Census Bureau. PROGRAM CHANGE FOR FY 2012: Demographic surveys sample redesign (Base Funding 71 FTE and $11.8 million; Program Change -9 FTE and -$1.9 million): The FY 2012 budget request is the result of a review of both ongoing and cyclical programs necessary to achieve Department of Commerce and Census Bureau goals and difficult choices had to be made in balancing program needs and fiscal constraints. This review resulted in a reduction of $1,500,000 in order to fund higher priority programs within the Census Bureau and Department.
This program change includes $439,000 in administrative savings. Performance Goals and Measurement Data This decrease will not directly impact program performance measures.
CEN-175
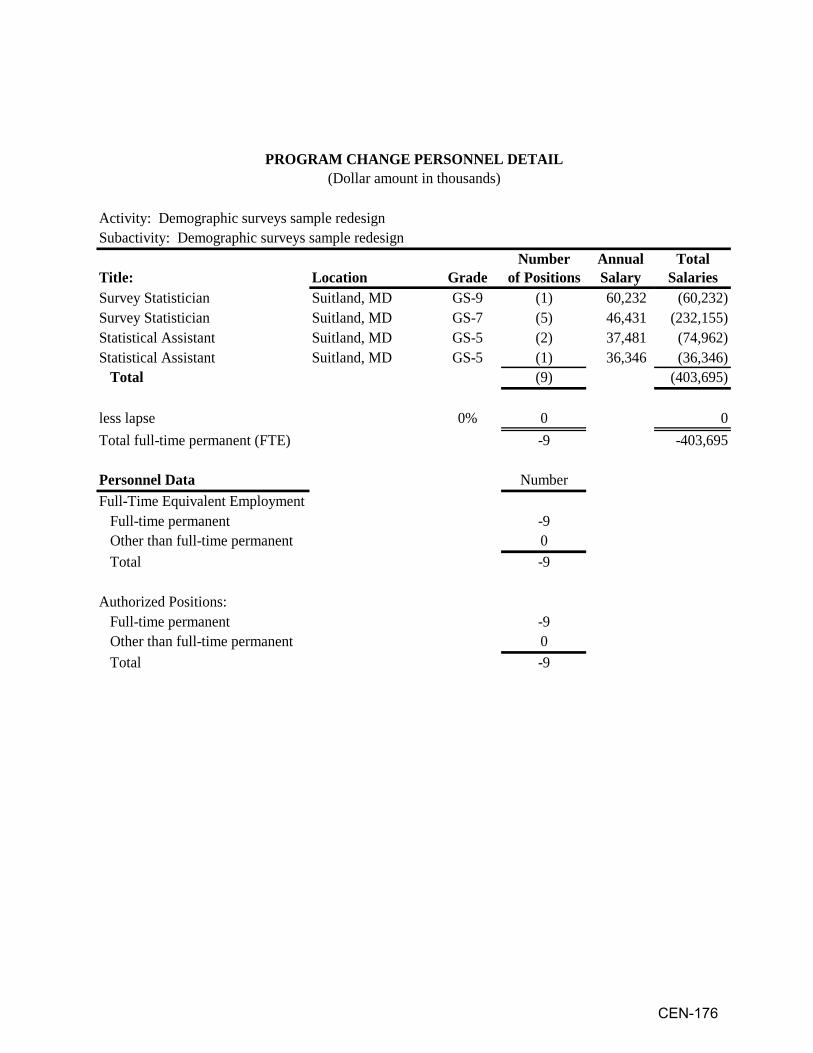
Activity: Demographic surveys sample redesignSubactivity: Demographic surveys sample redesign
Number Annual TotalLocation Grade of Positions Salary SalariesSuitland, MD GS-9 (1) 60,232 (60,232)Suitland, MD GS-7 (5) 46,431 (232,155)Suitland, MD GS-5 (2) 37,481 (74,962)Suitland, MD GS-5 (1) 36,346 (36,346)
(9) (403,695)
0% 0 0-9 -403,695
Number
-90
Total -9
Authorized Positions: Full-time permanent -9
0 Total -9
PROGRAM CHANGE PERSONNEL DETAIL(Dollar amount in thousands)
Full-Time Equivalent Employment
Survey Statistician
Title:Survey Statistician
Statistical AssistantStatistical Assistant
Other than full-time permanent
Other than full-time permanent
Full-time permanent
Total
less lapseTotal full-time permanent (FTE)
Personnel Data
CEN-176

PROGRAM CHANGE DETAIL BY OBJECT CLASS (Dollar amounts in thousands)
Activity: Demographic surveys sample redesign Subactivity: Demographic surveys sample redesign Program Change: Administrative savings
2012Object Class POS FTE Decrease
11 Personnel compensation11.1 Full-time permanent 011.3 Other than full-time permanent -$2711.5 Other personnel compensation 011.8 Special personnel services payments 011.9 Total personnel compensation -2712 Civilian personnel benefits -813 Benefits for former personnel 021 Travel and transportation of persons -722 Transportation of things 023.1 Rental payments to GSA 023.2 Rental Payments to others 023.3 Communications, utilities and miscellaneous charges 024 Printing and reproduction 025.1 Advisory and assistance services -9925.2 Other services -6025.3 Purchases of goods & services from Gov't accounts -9725.4 Operation and maintenance of facilities -6325.5 Research and development contracts 025.6 Medical care 025.7 Operation and maintenance of equipment -7725.8 Subsistence and support of persons -126 Supplies and materials 031 Equipment 032 Lands and structures 033 Investments and loans 041 Grants, subsidies and contributions 042 Insurance claims and indemnities 043 Interest and dividends 044 Refunds 099 Total obligations -439
CEN-177

PROGRAM CHANGE DETAIL BY OBJECT CLASS (Dollar amounts in thousands)
Activity: Demographic surveys sample redesign Subactivity: Demographic surveys sample redesign
2012Object Class Decrease
11 Personnel compensation11.1 Full-time permanent -$40411.3 Other than full-time permanent 011.5 Other personnel compensation -1011.8 Special personnel services payments 011.9 Total personnel compensation -41412 Civilian personnel benefits -9413 Benefits for former personnel 021 Travel and transportation of persons -222 Transportation of things 023.1 Rental payments to GSA 023.2 Rental Payments to others 023.3 Communications, utilities and miscellaneous charges -324 Printing and reproduction 025.1 Advisory and assistance services -70225.2 Other services -22225.3 Purchases of goods & services from Gov't accounts -4925.4 Operation and maintenance of facilities -525.5 Research and development contracts 025.6 Medical care 025.7 Operation and maintenance of equipment -625.8 Subsistence and support of persons 026 Supplies and materials -131 Equipment -232 Lands and structures 033 Investments and loans 041 Grants, subsidies and contributions 042 Insurance claims and indemnities 043 Interest and dividends 044 Refunds 099 Total obligations -1,500
CEN-178

Dep
artm
ent o
f Com
mer
ceU
.S. C
ensu
s Bu
reau
Perio
dic
Cen
suse
s an
d Pr
ogra
ms
PRO
GR
AM A
ND
PER
FOR
MAN
CE:
DIR
EC
T O
BLI
GA
TIO
NS
(Dol
lar a
mou
nts
in th
ousa
nds)
Exhi
bit 1
0
Act
ivity
: G
eogr
aphi
c su
ppor
tS
ubac
tivity
: G
eogr
aphi
c su
ppor
t
Line
Item
Per
sonn
elA
mou
ntP
erso
nnel
Am
ount
Per
sonn
elA
mou
ntP
erso
nnel
Am
ount
Per
sonn
elA
mou
nt
Geo
grap
hic
supp
ort
Pos
./BA
115
$41,
681
321
$68,
598
371
$69,
163
370
$67,
735
(1)
($1,
428)
FTE
/Obl
.19
041
,512
327
68,8
4936
269
,163
361
67,7
35(1
)(1
,428
)
Tota
lP
os./B
A11
541
,681
321
68,5
98
37
169
,163
370
67,7
35(1
)(1
,428
)FT
E/O
bl.
190
41,5
1232
7
68
,849
362
69,1
6336
167
,735
(1)
(1,4
28)
Adj
ustm
ents
to O
blig
atio
ns:
R
ecov
erie
s(5
5)
Uno
blig
ated
bal
ance
, sta
rt of
yea
r(3
8)
(2
51)
F
undi
ng d
efer
red
to F
Y 2
011
0
Uno
blig
ated
bal
ance
, exp
iring
11
U
nobl
igat
ed b
alan
ce, e
nd o
f yea
r25
1
Ref
und
0
Incr
ease
/ (D
ecre
ase)
over
Bas
e20
10A
ctua
l20
11 C
R(A
nnua
lized
)20
12B
ase
2012
Est
imat
e
Adj
ustm
ents
to B
udge
t Aut
horit
y:
Uno
blig
ated
Bal
ance
, Res
ciss
ion
0
Fina
ncin
g fro
m tr
ansf
ers:
T
rans
fer f
rom
oth
er a
ccou
nts
0
T
rans
fer t
o ot
her a
ccou
nts
0
App
ropr
iatio
nP
os.
115
41,6
8132
168
,598
371
69,1
6337
067
,735
(1)
(1,4
28)
CEN-179

APPROPRIATION ACCOUNT: Periodic Censuses and Programs BUDGET ACTIVITY: Geographic support
For FY 2012, the Census Bureau requests a decrease of $1.4 million and 1 FTE from the FY 2012 base program for a total of $67.7 million and 361 FTE for geographic support. BASE JUSTIFICATION FOR FY 2012: Geographic Support Overview The geographic support budget is organized into 1 subactivity with the same name under the Periodic Censuses and Programs account. This subactivity contains one line item with the same name ($67.7 million and 361 FTE).
Significant Adjustments-to-Base (ATBs): The Census Bureau requests a net increase of 0 FTE and $0.6 million to fund adjustments to current programs for Geographic Support activities. The increase will provide inflationary increases for non-labor activities, including service contracts, utilities, and rent charges from the General Services Administration (GSA). ADMINISTRATIVE COST SAVINGS: The Administration is pursuing an aggressive government-wide effort to curb non-essential administrative spending called the Administrative Efficiency Initiative. In order to be good stewards of taxpayer money the Federal Government should continue to seek ways to improve the efficiency of programs without reducing their effectiveness. As such, the President directed each agency to analyze its administrative costs and identify savings where possible. After reviewing its administrative costs, the Census Bureau has identified $1,428,000 in administrative savings. The Census Bureau has targeted a number of areas to achieve its savings. Acquisition plans for FY 2012 account for $1,244,000 in savings. In the area of human capital, the Census Bureau expects to reduce its costs by $132,000 through position management and control and reduced workers compensation costs. Another $52,000 in administrative savings has been identified in logistics plans and in general administrative support by limiting discretionary travel and printing. The $1,428,000 in administrative savings identified above represent real reductions to the Census Bureau’s funding level and will help reduce overall spending by the Federal Government.
Department of Commerce U.S. Census Bureau
Periodic Censuses and Programs PROGRAM JUSTIFICATION
CEN-180

SUBACTIVITY: Geographic support LINE ITEM: Geographic support The objective of the geographic support subactivity/line item is to provide maps, address lists, address and geographic reference files, and associated processing systems needed to meet the geographic requirements of all Census Bureau programs. To support this objective, the Census Bureau has developed an integrated, computer-based Geographic Support System (GSS). One of the major components of this system is the Master Address File/Topologically Integrated Geographic Encoding and Referencing (MAF/TIGER) database. The MAF/TIGER improves the quality and efficiency of collecting and processing geographic data with a precise digital approach that takes advantage of state-of-the-art commercial off-the-shelf products and geographic information system (GIS) software products. The MAF/TIGER is updated regularly and requires large volumes of information from many external sources, including state, local, and tribal governments and the U.S. Postal Service, to maintain a current and complete inventory of streets, roads, address ranges, accurate geographic boundaries, other map information, and city-style residential housing units. The GSS allows simultaneous multi-user access to a specific county, as well as efficient and productive file transfers to users. Technical capabilities and geographic products are essential to meeting the core needs of the economic census, the current demographic statistics program, the intercensal demographic estimates program, the American Community Survey, and tabulations for the 2010 Decennial Census. The program establishes and distributes the geographic component for the multi-agency Geospatial One-Stop project and supports the Geographic Line of Business, which is chaired by the Federal Geographic Data Committee. The GSS supports activities that maintain the master list of housing units, known as the Master Address File (MAF). Continuous updating of the MAF in conjunction with the U.S. Postal Service and local/tribal partners, as required by Executive Order 12906 and P.L. 103-430, is the most cost-effective and quality-assured method for providing a spatially accurate housing unit address list for use by Census Bureau surveys and the 2010 Decennial Census. MAF/TIGER database update operations include updates of features, feature names, zip codes, and address ranges in the TIGER database. The updated TIGER database then supports the assignment of a correct census block code to residential addresses through automated means (a process known as “geocoding”). Further updates occur when new addresses provided by the U.S. Postal Service cannot be geocoded automatically. Where automated processes cannot assign the correct geocodes to an address, clerical processes are used and structured to maximize the number of residential addresses spatially located. This operation currently is the most efficient and cost-effective method of updating the TIGER database and providing geocoded residential addresses required for processing and tabulating census and household survey data. The GSS also supports geographic cooperation efforts with state, local, and tribal governments. These cooperative efforts help the Census Bureau deal with concerns expressed by officials at all
CEN-181
levels of government about inaccurate MAF and TIGER information. They also increase the confidence of Census Bureau customers in the data provided from censuses and household surveys. The GSS funds the maintenance of the American National Standards Institute (ANSI) geographic area codes for states, counties, metropolitan and micropolitan areas, and other geographic areas. The GSS also funds cooperative geographic code maintenance efforts with the United States Geological Survey, which is the ANSI maintenance authority for place and minor civil division geographic codes. The GSS funds the annual Boundary and Annexation Survey (BAS). The BAS collects data, including correct names, legal descriptions and legal boundaries to determine the inventory of legally defined entities, such as counties, larger minor civil divisions, incorporated places, American Indian reservations, and off-reservation trust lands. In all, there are approximately 10,000 governmental units, which have populations greater than 5,000 that are annually surveyed by the BAS. The BAS is the only current source of a nationally consistent inventory of governments, their legal status, and their boundaries. In accordance with OMB Circular A-16, the data the BAS collects is available through the Geospatial One-Stop Website. Finally, the GSS supports quality assurance operations for geographic support products. To assure high quality census and household survey results, the Census Bureau employs statistically sound techniques to evaluate the quality of the processes used to build, update, and enhance the MAF and the TIGER database. This includes continuous development of and adherence to geographic standards and criteria for statistical areas to support data dissemination. In addition, the Census Bureau must perform quality assurance processes before releasing geographic products for use by the public and the various censuses and household surveys to ensure that these products meet completeness and accuracy expectations. In FY 2011, the Census Bureau began an effort to incorporate new technologies and additional update methods. This included an initiative to support improved address coverage, continual update of road and other spatial data, and enhanced quality measures of Census Bureau geographic programs. These efforts are expected to provide an up-to-date address list, increase the efficiency of field staff working on ongoing surveys, and determine the feasibility for the Census Bureau to pursue a targeted address canvassing operation (as opposed to a 100 percent operation) for the 2020 Census. By focusing on activities that improve the MAF while maintaining and enhancing the spatial infrastructure that makes census and survey work possible, this initiative represents the next phase of geographic support after the MTEP. PROGRAM CHANGES FOR FY 2012: The only program change in this subactivity is $1,428,000 in administrative savings.
CEN-182
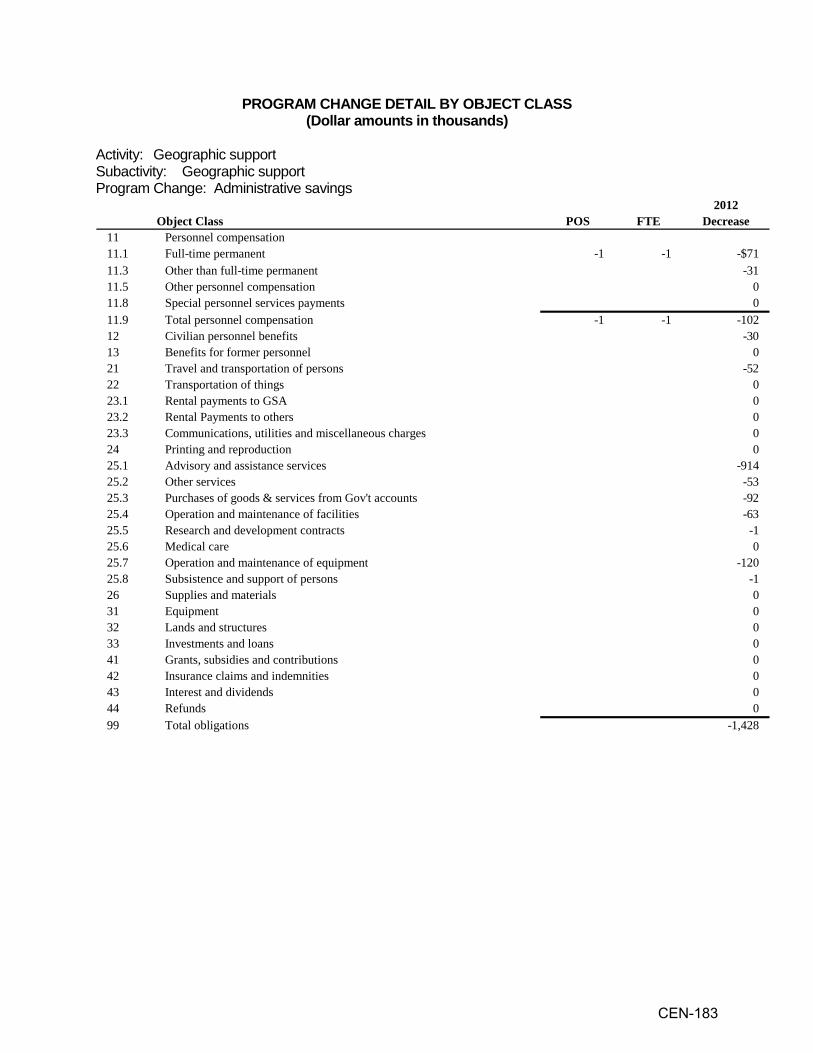
PROGRAM CHANGE DETAIL BY OBJECT CLASS (Dollar amounts in thousands)
Activity: Geographic support Subactivity: Geographic support Program Change: Administrative savings
2012Object Class POS FTE Decrease
11 Personnel compensation11.1 Full-time permanent -1 -1 -$7111.3 Other than full-time permanent -3111.5 Other personnel compensation 011.8 Special personnel services payments 011.9 Total personnel compensation -1 -1 -10212 Civilian personnel benefits -3013 Benefits for former personnel 021 Travel and transportation of persons -5222 Transportation of things 023.1 Rental payments to GSA 023.2 Rental Payments to others 023.3 Communications, utilities and miscellaneous charges 024 Printing and reproduction 025.1 Advisory and assistance services -91425.2 Other services -5325.3 Purchases of goods & services from Gov't accounts -9225.4 Operation and maintenance of facilities -6325.5 Research and development contracts -125.6 Medical care 025.7 Operation and maintenance of equipment -12025.8 Subsistence and support of persons -126 Supplies and materials 031 Equipment 032 Lands and structures 033 Investments and loans 041 Grants, subsidies and contributions 042 Insurance claims and indemnities 043 Interest and dividends 044 Refunds 099 Total obligations -1,428
CEN-183
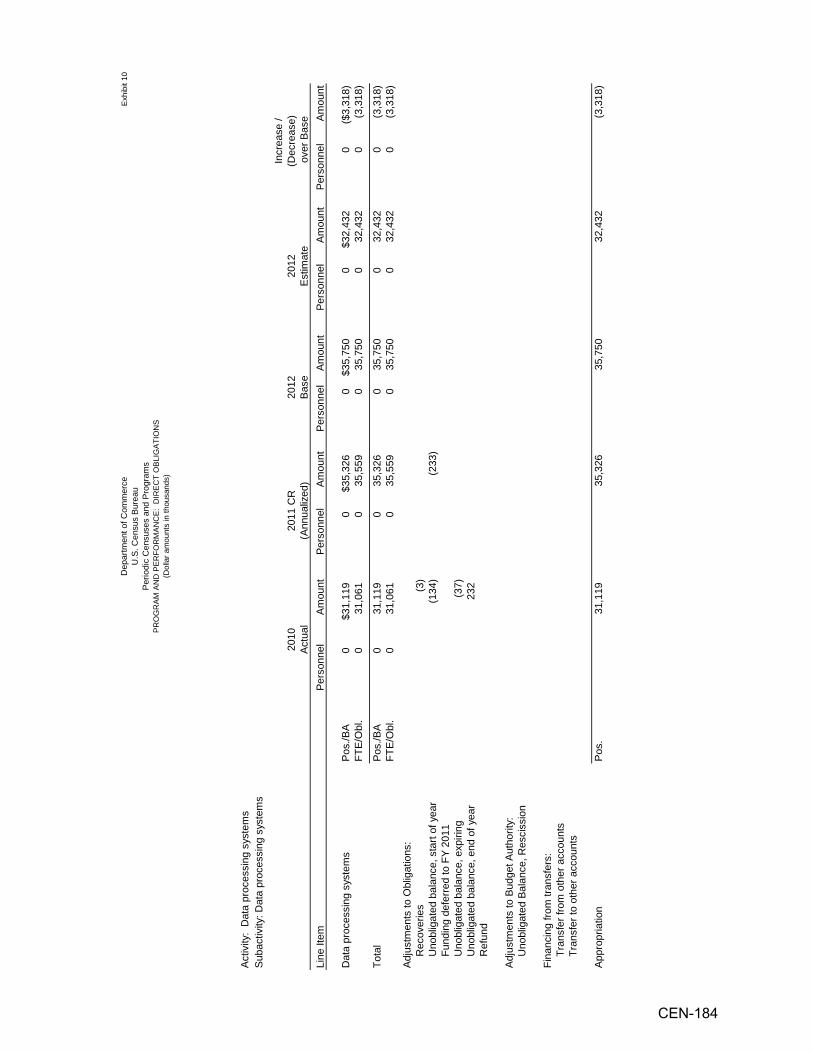
Dep
artm
ent o
f Com
mer
ceU
.S. C
ensu
s B
urea
uP
erio
dic
Cen
suse
s an
d P
rogr
ams
PR
OG
RA
M A
ND
PE
RFO
RM
AN
CE
: D
IRE
CT
OB
LIG
ATI
ON
S(D
olla
r am
ount
s in
thou
sand
s)
Exh
ibit
10
Activ
ity:
Dat
a pr
oces
sing
sys
tem
sSu
bact
ivity
: Dat
a pr
oces
sing
sys
tem
s
Line
Item
Pers
onne
lAm
ount
Pers
onne
lAm
ount
Pers
onne
lAm
ount
Pers
onne
lAm
ount
Pers
onne
lAm
ount
Dat
a pr
oces
sing
sys
tem
sPo
s./B
A0
$31,
119
0$3
5,32
60
$35,
750
0$3
2,43
20
($3,
318)
FTE/
Obl
.0
31,0
610
35,5
59
0
35,7
500
32,4
320
(3,3
18)
Tota
lPo
s./B
A0
31,1
190
35,3
26
0
35,7
500
32,4
320
(3,3
18)
FTE/
Obl
.0
31,0
610
35,5
59
0
35,7
500
32,4
320
(3,3
18)
Adju
stm
ents
to O
blig
atio
ns:
R
ecov
erie
s(3
)
Uno
blig
ated
bal
ance
, sta
rt of
yea
r(1
34)
(233
)
F
undi
ng d
efer
red
to F
Y 20
11
Uno
blig
ated
bal
ance
, exp
iring
(37)
Uno
blig
ated
bal
ance
, end
of y
ear
232
Ref
und
Incr
ease
/ (D
ecre
ase)
ove
r Bas
e20
10Ac
tual
2011
CR
(Ann
ualiz
ed)
2012
Ba
se20
12
Es
timat
e
Adju
stm
ents
to B
udge
t Aut
horit
y:
Uno
blig
ated
Bal
ance
, Res
ciss
ion
Fi
nanc
ing
from
tran
sfer
s:
Tra
nsfe
r fro
m o
ther
acc
ount
s
Tra
nsfe
r to
othe
r acc
ount
s
Appr
opria
tion
Pos.
31,1
1935
,326
35,7
5032
,432
(3,3
18)
CEN-184

APPROPRIATION ACCOUNT: Periodic Censuses and Programs BUDGET ACTIVITY: Data processing systems
For FY 2012, the Census Bureau requests a decrease of $3.3 million and 0 FTE from the FY 2012 base program for a total of $35.8 million and 0 FTE for data processing systems. BASE JUSTIFICATION FOR FY 2012: Data Processing Systems Overview The data processing systems budget is organized into one subactivity with the same name under the Periodic Censuses and Programs account. That subactivity consists of one line item with the same name ($35.8 million and 0 FTE).
Significant Adjustments-to-Base (ATBs): The Census Bureau requests a net increase of 0 FTE and $0.4 million to fund adjustments to current programs for data processing systems activities. The increase will provide inflationary increases for non-labor activities, including service contracts, utilities, and rent charges from the General Services Administration (GSA). ADMINISTRATIVE COST SAVINGS: The Administration is pursuing an aggressive government-wide effort to curb non-essential administrative spending called the Administrative Efficiency Initiative. In order to be good stewards of taxpayer money the Federal Government should continue to seek ways to improve the efficiency of programs without reducing their effectiveness. As such, the President directed each agency to analyze its administrative costs and identify savings where possible. After reviewing its administrative costs, the Census Bureau has identified $1,659,000 in administrative savings. The Census Bureau has targeted a number of areas to achieve its savings. Acquisition plans for FY 2012 account for the entire $1,659,000 in savings. The $1,659,000 in administrative savings identified above represent real reductions to the Census Bureau’s funding level and will help reduce overall spending by the Federal Government.
Department of Commerce U.S. Census Bureau
Periodic Censuses and Programs PROGRAM JUSTIFICATION
CEN-185

SUBACTIVITY: Data processing systems LINE ITEM: Data processing systems The objective of the data processing systems subactivity/line item is to provide day-to-day information technology support for all program areas of the Census Bureau. The data processing systems program manages hardware and software supporting the Census Bureau’s enterprise needs. Economies of scale are achieved through centralized information technology contracts and services in accordance with the Department of Commerce guidelines and a comprehensive information technology plan. The Census Bureau-wide information technology responsibilities include all voice and data telecommunications services, management of the general-purpose computing facility, management of the wide area network, support for local area networks, network security and continuity of operations support, and management of several bureau-wide software licenses. These enterprise software licenses ensure a standard open-systems development environment supporting distributed processing platforms. This program will continue to provide automated systems and technology support for the decennial census and other Census Bureau programs. PROGRAM CHANGES FOR FY 2012: Data Processing Systems (Base Funding 0 FTE and $35.8 million; Program Change 0 FTE and -$3.3 million): The FY 2012 budget request is the result of a review of both ongoing and cyclical programs necessary to achieve Department of Commerce and Census Bureau goals and difficult choices had to be made in balancing program needs and fiscal constraints. This review resulted in several funding reductions described elsewhere in this budget submission. The reductions to these programs means that the level of support required by the data processing systems will also decrease by $1.7 million.
This program change includes administrative savings of $1,659,000. Performance Goals and Measurement Data This decrease will not directly impact program performance measures.
CEN-186

PROGRAM CHANGE DETAIL BY OBJECT CLASS (Dollar amounts in thousands)
Activity: Data processing systems Subactivity: Data processing systems Program Change: Administrative savings
2012Object Class POS FTE Decrease
11 Personnel compensation11.1 Full-time permanent 011.3 Other than full-time permanent 011.5 Other personnel compensation 011.8 Special personnel services payments 011.9 Total personnel compensation 012 Civilian personnel benefits 013 Benefits for former personnel 021 Travel and transportation of persons 022 Transportation of things 023.1 Rental payments to GSA 023.2 Rental Payments to others 023.3 Communications, utilities and miscellaneous charges 024 Printing and reproduction 025.1 Advisory and assistance services -$43625.2 Other services -325.3 Purchases of goods & services from Gov't accounts -11625.4 Operation and maintenance of facilities 025.5 Research and development contracts 025.6 Medical care 025.7 Operation and maintenance of equipment -1,10425.8 Subsistence and support of persons 026 Supplies and materials 031 Equipment 032 Lands and structures 033 Investments and loans 041 Grants, subsidies and contributions 042 Insurance claims and indemnities 043 Interest and dividends 044 Refunds 099 Total obligations -1,659
CEN-187

PROGRAM CHANGE DETAIL BY OBJECT CLASS (Dollar amounts in thousands)
Activity: Data processing systems Subactivity: Data processing systems
2012Object Class Decrease
11 Personnel compensation11.1 Full-time permanent 011.3 Other than full-time permanent 011.5 Other personnel compensation 011.8 Special personnel services payments 011.9 Total personnel compensation 012 Civilian personnel benefits 013 Benefits for former personnel 021 Travel and transportation of persons 022 Transportation of things 023.1 Rental payments to GSA 023.2 Rental Payments to others 023.3 Communications, utilities and miscellaneous charges -$3624 Printing and reproduction 025.1 Advisory and assistance services -41225.2 Other services -325.3 Purchases of goods & services from Gov't accounts -10625.4 Operation and maintenance of facilities 025.5 Research and development contracts 025.6 Medical care 025.7 Operation and maintenance of equipment -1,04225.8 Subsistence and support of persons 026 Supplies and materials -231 Equipment -5832 Lands and structures 033 Investments and loans 041 Grants, subsidies and contributions 042 Insurance claims and indemnities 043 Interest and dividends 044 Refunds 099 Total obligations -1,659
CEN-188

Dep
artm
ent o
f Com
mer
ceU
.S. C
ensu
s Bu
reau
Perio
dic
Cen
suse
s an
d Pr
ogra
ms
Sum
mar
y of
Req
uire
men
ts b
y O
bjec
t Cla
ss(D
olla
r am
ount
s in
thou
sand
s)
Exhi
bit 1
6
Obj
ect C
lass
2010
A
ctua
l20
11 C
R(A
nnua
lized
)20
12
Bas
e20
12 E
stim
ate
Incr
ease
/ (D
ecre
ase)
ov
er B
ase
11P
erso
nnel
com
pens
atio
n11
.1Fu
ll-tim
e pe
rman
ent
$403
,654
$265
,814
$285
,433
$272
,903
($12
,530
)11
.3O
ther
than
full-
time
perm
anen
t2,
523,
875
147,
527
136,
389
57,8
21(7
8,56
8)11
.5O
ther
per
sonn
el c
ompe
nsat
ion
189,
157
10,4
6912
,755
11,9
93(7
62)
11.8
Spe
cial
per
sonn
el s
ervi
ces
paym
ents
00
00
0
11.9
Tota
l per
sonn
el c
ompe
nsat
ion
3,11
6,68
642
3,81
043
4,57
734
2,71
7(9
1,86
0)
12.1
Civ
ilian
pers
onne
l ben
efits
353,
484
109,
773
116,
339
92,5
37(2
3,80
2)13
Ben
efits
for f
orm
er p
erso
nnel
743
1,33
91,
109
461
(648
)21
Trav
el a
nd tr
ansp
orta
tion
of p
erso
ns44
8,62
129
,982
40,4
5923
,845
(16,
614)
22Tr
ansp
orta
tion
of th
ings
26,8
599,
417
2,42
989
4(1
,535
)23
.1R
enta
l pay
men
ts to
GS
A92
,567
61,3
4243
,601
36,4
11(7
,190
)23
.2R
enta
l pay
men
ts to
oth
ers
511
1817
3(1
4)23
.3C
omm
unic
atio
n, u
tiliti
es, m
isc.
cha
rges
93,2
9719
,374
25,6
2624
,302
(1,3
24)
24P
rintin
g an
d re
prod
uctio
n15
,801
2,96
96,
002
12,2
396,
237
25.1
Adv
isor
y an
d as
sist
ance
ser
vice
s28
4,80
216
0,82
910
3,65
339
,282
(64,
371)
25.2
Oth
er s
ervi
ces
207,
276
85,0
0917
,795
38,6
5520
,860
25.3
Pur
chas
es o
f goo
ds a
nd s
vcs.
Fro
m g
ov't
acct
s.34
7,43
642
,124
47,4
6227
,979
(19,
483)
25.4
Ope
ratio
n &
mai
nten
ance
of f
acilit
ies
28,2
4614
,370
14,0
4010
,012
(4,0
28)
25.5
Res
earc
h &
dev
elop
men
t con
tract
s4,
035
3,97
63,
607
5,76
02,
153
25.6
Med
ical
Car
e0
00
00
25.7
Ope
ratio
n &
mai
nten
ance
of e
quip
men
t74
1,32
172
,605
78,5
4861
,471
(17,
077)
25.8
Sub
sist
ence
& s
uppo
rt of
per
sons
16,3
5149
635
820
6(1
52)
26S
uppl
ies
and
mat
eria
ls73
,282
4,87
47,
958
8,35
439
631
Equ
ipm
ent
64,3
7820
,009
22,0
5527
,583
5,52
832
Land
s an
d st
ruct
ures
00
00
032
Land
s an
d st
ruct
ures
00
00
033
Inve
stm
ents
and
loan
s0
00
00
41G
rant
s, s
ubsi
dies
and
con
tribu
tions
00
00
042
Insu
ranc
e cl
aim
s an
d in
dem
nitie
s18
00
00
43In
tere
st a
nd d
ivid
ends
130
00
044
Ref
unds
00
00
092
Con
tinge
ncy
fund
00
00
0
99S
ubto
tal,
Dire
ct O
blig
atio
ns5,
915,
727
1,06
2,31
696
5,63
575
2,71
1(2
12,9
24)
Prio
r yea
r rec
over
ies
(9,0
83)
00
00
Uno
blig
ated
bal
ance
, sta
rt of
yea
r(9
21,0
71)
(98,
001)
00
0U
nobl
igat
ed b
alan
ce, e
xpiri
ng15
,127
00
00
Uno
blig
ated
bal
ance
, end
of y
ear
1,83
8,00
30
00
0R
efun
d(1
,996
)0
00
0U
nobl
igat
ed b
alan
ce, r
esci
ssio
n12
9,00
00
00
0
TOTA
L, B
UD
GE
T A
UTH
OR
ITY
6,96
5,70
796
4,31
596
5,63
575
2,71
1(2
12,9
24)
CEN-189

Dep
artm
ent o
f Com
mer
ceU
.S. C
ensu
s B
urea
u Pe
riodi
c C
ensu
ses
and
Prog
ram
sS
umm
ary
of R
equi
rem
ents
by
Obj
ect C
lass
(Dol
lar a
mou
nts
in th
ousa
nds)
Exhi
bit 1
6
Per
sonn
el fi
nanc
ed fr
om d
irect
obl
igat
ions
2010
A
ctua
l20
11 C
R(A
nnua
lized
)20
12
Bas
e20
12
Est
imat
e
Incr
ease
/ (D
ecre
ase)
ov
er B
ase
Full-
Tim
e eq
uiva
lent
em
ploy
men
t:
Ful
l-tim
e pe
rman
ent
4,02
93,
491
3,65
83,
351
(307
)
Oth
er th
an fu
ll-tim
e pe
rman
ent
85,2
993,
347
3,08
01,
623
(1,4
57)
T
otal
89,3
286,
838
6,73
84,
974
(1,7
64)
Aut
horiz
ed P
ositi
ons:
F
ull-t
ime
perm
anen
t4,
110
4,26
24,
351
4,04
9(3
02)
Oth
erth
anfu
lltim
epe
rman
ent
1759
614
152
1174
72
170
(957
7)
Oth
er th
an fu
ll-tim
e pe
rman
ent
17,5
9614
,152
11,7
472,
170
(9,5
77)
Tota
l21
,706
18,4
1416
,098
6,21
9(9
,879
)
CEN-190

Exhibit 33
Department of Commerce U.S. Census Bureau
Periodic Censuses and Programs Appropriation Language and Code Citations:
1. For necessary expenses to collect and publish statistics for periodic censuses and
programs provided for by law, $752,711,000, to remain available until September 30, 2013, provided that from amounts provided herein, funds may be used for promotion, outreach, and marketing activities.
13 U.S.C. §§4, 6, 12, 61-63, 81, 91, 181, 182, 301-307, 401; 15 U.S.C. §§1516, 4901 et seq.; 19 U.S.C. §§1484(e), 2354, 2393.
13 U.S.C. §4 authorizes the Secretary to "perform the functions and duties imposed upon him by this title," or he may delegate any of them "to such officers and employees of the Department of Commerce as he may designate."
13 U.S.C. §§6, 12, 61-63, 81, 91, 182, 301-307 provide for (1) acquisition of information from other organizations, public and private; (2) conducting joint statistical projects with nonprofit organizations or agencies; (3) conducting mechanical and electronic developmental work as needed; (4) collection and publication of statistics on fats and oils; (5) collection and publication of statistics relating to the domestic apparel and textile industries; (6) collection and publication of quarterly financial statistics of business operations; (7) conducting current surveys on statistical subjects covered by periodic censuses; and (8) compilation and publication of information on imports, exports, and mode of transportation.
13 U.S.C. §181 provides that "The Secretary...shall annually produce and publish for each state, county, and local unit of general purpose government which has a population of fifty thousand or more, current data on total population and population characteristics and...shall biennially produce and publish for other local units of general purpose government current data on total population."
13 U.S.C. §401 provides that "The Bureau of the Census shall exchange with the Bureau of Economic Analysis of the Department of Commerce information collected under this title, and under the International Investment and Trade in Services Survey Act, that pertains to any business enterprise that is operating in the United States, if the Secretary of Commerce determines such information is appropriate to augment and improve the quality of data collected under the International Investment and Trade in Services Survey Act."
15 U.S.C. §1516 provides that "The Secretary of Commerce shall have control of the work of gathering and distributing statistical information naturally relating to the subjects
CEN-191

confided to his department...He shall also have authority to call upon other departments of the government for statistical data and results obtained by them; and he may collate, arrange, and publish such statistical information so obtained in such manner as to him may seem wise."
15 U.S.C. §4901 et seq. provides that "The Secretary [of Commerce] shall establish the [National Trade] Data Bank. The Secretary shall manage the Data Bank."
19 U.S.C. §1484(e) provides that "The Secretary of the Treasury, the Secretary of Commerce, and the United States International Trade Commission are authorized and directed to establish...an enumeration of articles...comprehending all merchandise imported into the United States and exported from the United States, and shall seek, in conjunction with statistical programs for domestic production and programs for achieving international harmonization of trade statistics, to establish the comparability thereof with such enumeration of articles."
19 U.S.C. §2354 provides that "Whenever the [International Trade] Commission begins an investigation...with respect to an industry, the Commission shall immediately notify the Secretary [of Commerce] of such investigation, and the Secretary shall immediately begin a study of:
(1) the number of firms in the domestic industry producing the like or directly
competitive article which have been or are likely to be certified as eligible for adjustment assistance, and
(2) the extent to which the orderly adjustment of such firms to the import
competition may be facilitated through the use of existing programs."
19 U.S.C. §2393 provides that "The Secretary of Commerce and the Secretary of Labor shall establish and maintain a program to monitor imports of articles into the United States which will reflect changes in the volume of such imports, the relation of such imports to changes in domestic production, changes in employment within domestic industries producing articles like or directly competitive with such imports, and the extent to which such changes in production and employment are concentrated in specific geographic regions of the United States."
CEN-192

Dep
artm
ent o
f Com
mer
ceU
.S. C
ensu
s B
urea
uW
orki
ng C
apita
l Fun
dS
UM
MA
RY
OF
RE
SO
UR
CE
RE
QU
IRE
ME
NTS
(Dol
lar a
mou
nts
in th
ousa
nds)
Exh
ibit
5
FTE
Dire
ct
Obl
igat
ions
2011
Est
imat
e3,
368
$850
,038
FTE
/ pos
ition
s re
alig
nmen
tle
ss:
Obl
igat
ed fr
om p
rior y
ears
less
: U
nobl
igat
ed b
alan
ce, s
tart
of y
ear
plus
: 20
12 A
djus
tmen
ts to
bas
e(9
75)
715
le
ss:
Prio
r yea
r rec
over
ies
2012
Bas
e R
eque
st2,
393
850,
753
Plus
(or l
ess)
: 201
2 Pr
ogra
m C
hang
es0
0
2012
Est
imat
e2,
393
850,
753
Com
paris
on b
y ac
tivity
/sub
activ
ityPe
rson
nel
Amou
ntPe
rson
nel
Amou
ntPe
rson
nel
Amou
ntPe
rson
nel
Amou
ntPe
rson
nel
Amou
nt
Cur
rent
sur
veys
and
sta
tistic
s
Cur
rent
eco
nom
ic s
tatis
tics
FTE/
Obl
.36
9$1
33,9
4735
6$1
33,5
8530
1$1
43,2
8230
1$1
43,2
820
$0
Cur
rent
dem
ogra
phic
sta
tistic
sFT
E/O
bl.
1,73
727
3,75
82,
814
369,
260
2,00
832
8,19
72,
008
328,
197
00
D
ecen
nial
cen
sus
FTE/
Obl
.0
307,
042
032
0,98
70
362,
608
036
2,60
80
0
Oth
erFT
E/O
bl.
4210
,748
198
26,2
0684
16,6
6684
16,6
660
0
TOTA
LSFT
E/O
bl2
148
725
495
336
885
003
82
393
850
753
239
385
075
30
0
Incr
ease
/ (D
ecre
ase)
over
Bas
e20
10
Actu
al20
11 C
R(A
nnua
lized
)20
12
Base
2012
Est
imat
e
TOTA
LSFT
E/O
bl.
2,14
872
5,49
53,
368
850,
038
2,39
385
0,75
32,
393
850,
753
00
Adju
stm
ents
to O
blig
atio
ns:
R
ecov
erie
s0
(12,
555)
0(5
,500
)0
(5,5
00)
0(5
,500
)0
0
Uno
blig
ated
bal
ance
, sta
rt of
yea
r0
(230
,120
)0
(429
,093
)0
(337
,354
)0
(337
,354
)0
0
Uno
blig
ated
bal
ance
, tra
nsfe
rred
U
nobl
igat
ed b
alan
ce, e
xpiri
ng
Uno
blig
ated
bal
ance
, end
of y
ear
042
9,09
30
337,
354
026
9,90
00
269,
900
00
Fina
ncin
g fro
m tr
ansf
ers:
T
rans
fer f
rom
oth
er a
ccou
nts
00
00
00
00
00
T
rans
fer t
o ot
her a
ccou
nts
00
00
00
00
00
Tota
l FT
E/O
bl.
2,14
891
1,91
33,
368
752,
799
2,39
377
7,79
92,
393
777,
799
00
CEN-193

THIS
PAG
E IN
TEN
TIO
NA
LLY
LEFT
BLA
NK
CEN-194

Dep
artm
ent o
f Com
mer
ceU
.S. C
ensu
s B
urea
uW
orki
ng C
apita
l Fun
d S
UM
MA
RY
OF
FIN
AN
CIN
G(D
olla
r am
ount
s in
thou
sand
s)
Exh
ibit
7
2010
Act
ual
2011
Est
imat
e20
12B
ase
2012
Est
imat
e
Incr
ease
/(D
ecre
ase)
over
Bas
eA
mou
ntA
mou
ntA
mou
ntA
mou
ntA
mou
nt
Tota
l Obl
igat
ion
$725
,495
$850
,038
$850
,753
$850
,753
$0
Fina
ncin
g:0
00
00
Offs
ettin
g co
llect
ions
from
:
Fed
eral
Fun
ds(2
30,0
11)
(276
,446
)(2
36,4
90)
(236
,490
)0
N
on-F
eder
al s
ourc
es(3
,906
)(7
,454
)(4
,410
)(4
,410
)0
O
ther
(677
,996
)(4
68,8
99)
(536
,899
)(5
36,8
99)
0
Rec
over
ies
(12,
555)
(5,5
00)
($5,
500)
($5,
500)
Uno
blig
ated
bal
ance
, sta
rt of
yea
r(2
30,1
20)
(429
,093
)(3
37,3
54)
(337
,354
)0
Uno
blig
ated
bal
ance
tran
sfer
red
00
00
0U
nobl
igat
ed b
alan
ce, e
xpiri
ng0
00
00
Uno
blig
ated
bal
ance
, end
of y
ear
429,
093
337,
354
269,
900
269,
900
0
Dis
cret
iona
ry B
udge
t Aut
horit
y0
00
00
Fina
ncin
g:
Tra
nsfe
r fro
m o
ther
acc
ount
s0
00
00
T
rans
fer t
o ot
her a
ccou
nts
00
00
0
Tota
l, D
iscr
etio
nary
App
ropr
iatio
n0
00
00
CEN-195
APPROPRIATION ACCOUNT: Working Capital Fund BUDGET ACTIVITY: Working capital fund
The FY 2012 request includes $850.8 million and 2,388 FTE for the Working Capital Fund. BASE JUSTIFICATION FOR FY 2012: Working Capital Fund Overview The Working Capital Fund was created by the Omnibus Consolidated Appropriations Act, 1997 (P.L. 104-208). The Working Capital Fund supports Department of Commerce general goal/objective 1.3 to “advance key economic and demographic data that support effective decision-making by policymakers, businesses and the American public.” It also supports the Census Bureau’s internal objective to meet the needs of policymakers, businesses, nonprofit organizations, and the public for current measures of the U.S. population, economy, and governments. Significant Adjustments-to-Base (ATBs): There are no adjustments to base for the Working Capital Fund. SUBACTIVITY: Working capital fund The Working Capital Fund supports a customer driven approach to services by providing a mechanism to identify and keep customers informed of the true costs of specific services and the basis for the charges. The Census Bureau is able to identify and control fluctuations in prices and establish a consistent and supportable pricing policy for both internal and external customers. The Working Capital Fund has enabled the Census Bureau to establish a clearly identifiable audit trail in the accounting records, resulting in more accurate and reliable financial statements and variance reports. A detailed project identification system records and identifies actual costs of work performed for each activity with the appropriate source of funding. The Working Capital Fund is a revolving fund, with appropriated and reimbursable funding compensating the Working Capital Fund for services provided. The programs and projects of the Census Bureau, whether funded by appropriated funds or other funds, pay their own share of the centralized services received through the Working Capital Fund; there is full recovery of the cost of providing the service, paid by those who actually use or benefit from the service. PROGRAM CHANGES FOR FY 2012: No program change is requested for FY 2012.
Department of Commerce U.S. Census Bureau Working Capital Fund
PROGRAM JUSTIFICATION
CEN-196
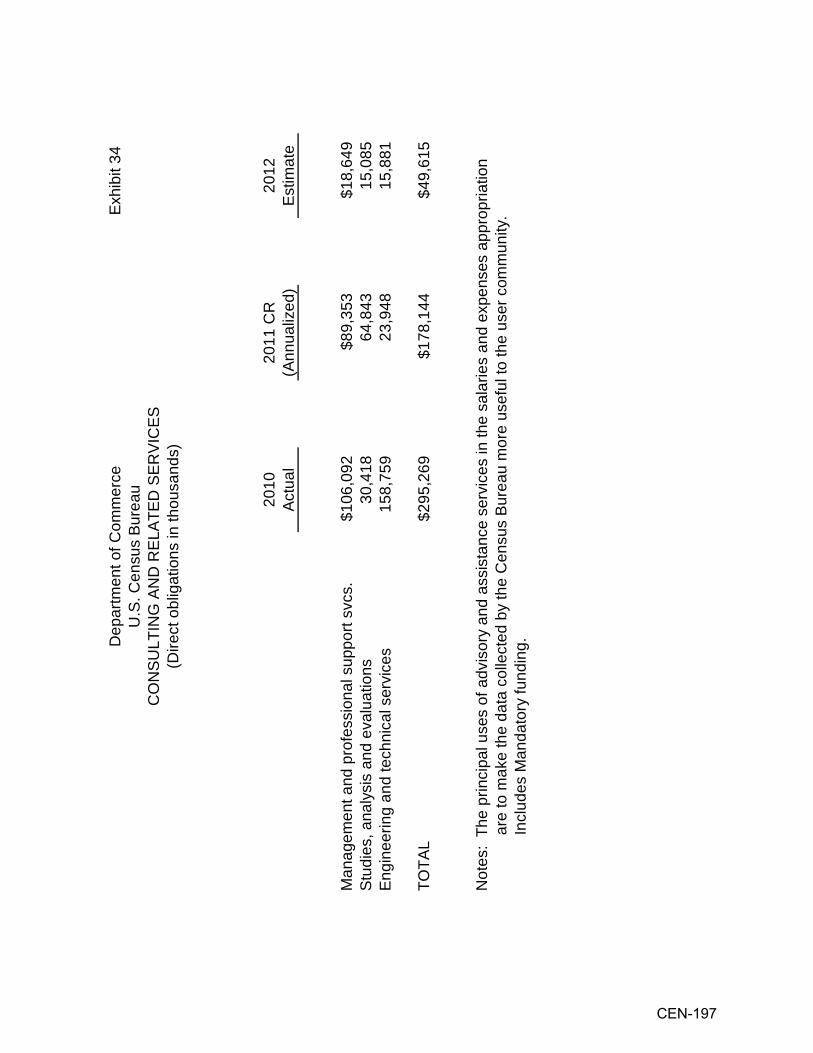
Dep
artm
ent o
f Com
mer
ceEx
hibi
t 34
U.S
. Cen
sus
Bure
auC
ON
SULT
ING
AN
D R
ELAT
ED S
ERVI
CES
(Dire
ct o
blig
atio
ns in
thou
sand
s)
2010
Ac
tual
2011
CR
(Ann
ualiz
ed)
2012
Es
timat
e
Man
agem
ent a
nd p
rofe
ssio
nal s
uppo
rt sv
cs.
$106
,092
$89,
353
$18,
649
Stud
ies,
ana
lysi
s an
d ev
alua
tions
30,4
1864
,843
15,0
85En
gine
erin
g an
d te
chni
cal s
ervi
ces
158,
759
23,9
4815
,881
TOTA
L$2
95,2
69$1
78,1
44$4
9,61
5
Not
es:
The
prin
cipa
l use
s of
adv
isor
y an
d as
sist
ance
ser
vice
s in
the
sala
ries
and
expe
nses
app
ropr
iatio
n
a
re to
mak
e th
e da
ta c
olle
cted
by
the
Cen
sus
Bure
au m
ore
usef
ul to
the
user
com
mun
ity.
Incl
udes
Man
dato
ry fu
ndin
g.
CEN-197

Exh
ibit
35D
epar
tmen
t of C
omm
erce
U. S
. Cen
sus
Bur
eau
PE
RIO
DIC
ALS
, PA
MP
HLE
TS, A
ND
AU
DIO
VIS
UA
L P
RO
DU
CTS
(Obl
igat
ions
in th
ousa
nds)
FY 2
010
Act
ual
2011
CR
(Ann
ualiz
ed)
FY 2
012
Est
imat
e
Per
iodi
cals
$114
$90
$72
Pam
phle
ts10
,434
3,68
52,
947
Aud
iovi
sual
s58
,010
2,40
51,
640
TOTA
L68
,558
6,18
04,
659
Pam
phle
ts:
In a
n ef
fort
to p
rom
ote
the
two
maj
or c
ensu
ses
note
d ab
ove
and
the
Am
eric
an C
omm
unity
Sur
vey,
th
e C
ensu
s B
urea
u pr
oduc
es a
var
iety
of p
rom
otio
nal m
ater
ials
des
igne
d to
gen
erat
e in
tere
st in
hig
her
resp
onse
rate
s to
thes
e ef
forts
. All
the
vario
us fo
rms,
boo
klet
s an
d tra
inin
g m
ater
ials
nee
d to
con
duct
the
de
cenn
ial c
ensu
s ar
e ne
eded
in h
uge
quan
titie
s. T
he a
genc
y al
so p
rodu
ces
exte
rnal
ly-fo
cuse
d m
ater
ials
rela
ted
to
rein
forc
ing
its m
issi
on a
nd g
oals
of p
rovi
ding
val
uabl
e, a
ccur
ate,
qua
lity
data
; rec
ruitm
ent o
f new
sta
ff; p
olic
ies
(s
uch
as re
spon
ding
to F
OIA
requ
ests
or a
dvic
e on
how
repo
rters
can
wor
k m
ore
effe
ctiv
ely
with
the
Cen
sus
Bur
eau)
and
oth
er is
sues
and
topi
cs o
f int
eres
t. Th
e C
ensu
s B
urea
u al
so p
rints
and
pub
lish
for t
he p
ublic
, C
ompl
ete
Cou
nt C
omm
ittee
Gui
des
for T
ribal
Lea
ders
, loc
al le
ader
s, a
nd n
atio
nal l
eade
rs.
Aud
iovi
sual
s: T
his
cate
gory
incl
udes
bot
h in
-hou
se a
nd c
ontra
cted
cos
ts fo
r prin
ting
artw
ork
and
phot
ogra
phic
slid
es a
nd tr
ansp
aren
cies
for p
rese
ntat
ions
. Thi
s ca
tego
ry a
lso
incl
udes
the
prod
ucto
n of
pro
mot
iona
l and
m
edia
-use
vid
eo, a
dai
ly ra
dio
prog
ram
, pos
ters
and
gra
phic
s, p
hoto
grap
hy, a
nd o
ther
mul
timed
ia p
rodu
cts
onlin
e an
d on
dis
c. It
als
o in
clud
es a
dver
tisin
g an
d ot
her p
rom
otio
nal a
ctiv
ities
for t
he 2
010
Cen
sus.
Per
iodi
cals
: In
add
ition
to th
e de
cenn
ial C
ensu
s of
Pop
ulat
ion
and
Hou
sing
(con
duct
ed e
very
10
year
s in
yea
rs
endi
ng in
zer
o), a
nd th
e E
cono
mic
Cen
sus
(con
duct
ed e
very
5 y
ears
in y
ears
end
ing
in 2
and
7),
and
the
Am
eric
an
Com
mun
ity S
urve
y (a
nnua
l), th
e U
S C
ensu
s B
urea
u, o
n av
erag
e, c
ondu
cts
150
surv
eys
annu
ally
that
may
ul
timat
ely
resu
lt in
1,0
00 re
ports
. The
se re
ports
are
dis
tribu
ted
in p
rint a
nd a
vaila
ble
onlin
e to
dat
a us
ers
of a
ll ty
pes,
rang
ing
from
oth
er g
over
nmen
t age
ncie
s to
bus
ines
ses,
soc
ial s
ervi
ce p
rovi
ders
, res
earc
hers
, lib
rarie
s, a
nd
othe
rs. M
any
of th
ese
repo
rts a
re re
curri
ng a
nd p
arts
of a
ser
ies
of re
ports
issu
ed o
n a
regu
lar b
asis
.
CEN-198
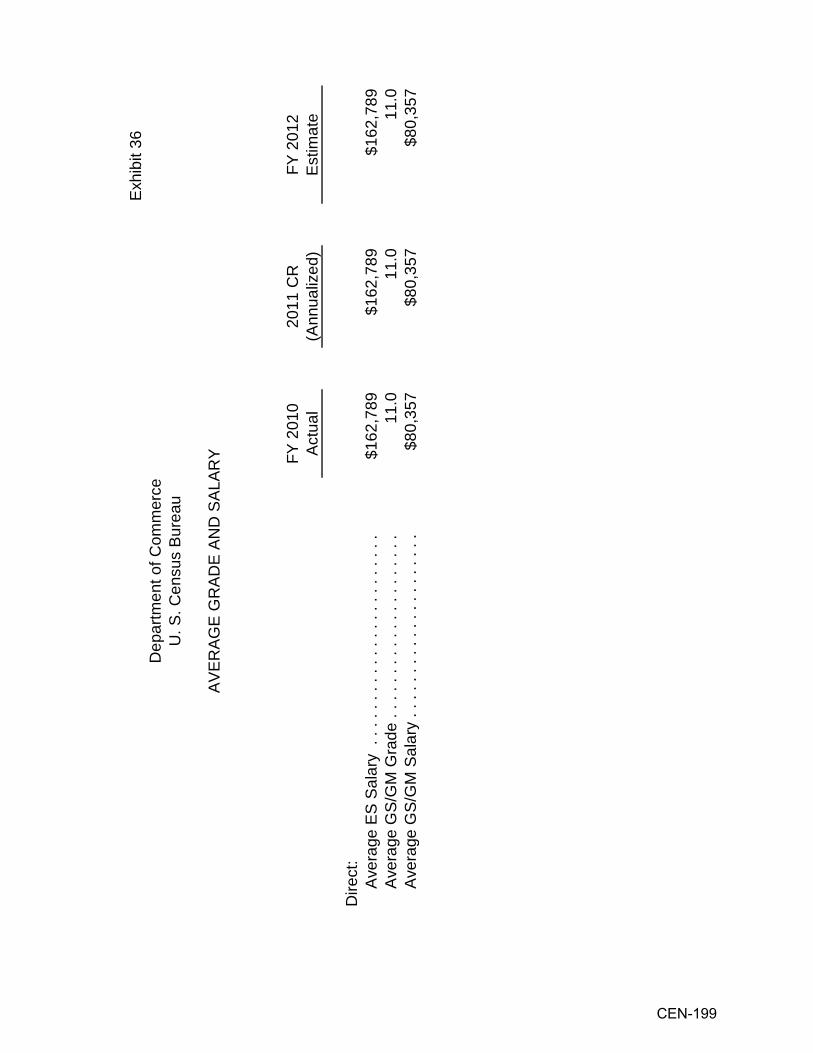
Exh
ibit
36D
epar
tmen
t of C
omm
erce
U. S
. Cen
sus
Bur
eau
AV
ER
AG
E G
RA
DE
AN
D S
ALA
RY FY
201
0A
ctua
l20
11 C
R(A
nnua
lized
)FY
201
2 E
stim
ate
Dire
ct:
A
vera
ge E
S S
alar
y .
. . .
. . .
. . .
. . .
. . .
. . .
. . .
. .
$162
,789
$162
,789
$162
,789
A
vera
ge G
S/G
M G
rade
. . .
. . .
. . .
. . .
. . .
. . .
. . .
11
.011
.011
.0
Ave
rage
GS
/GM
Sal
ary
. . .
. . .
. . .
. . .
. . .
. . .
. . .
$80,
357
$80,
357
$80,
357
CEN-199
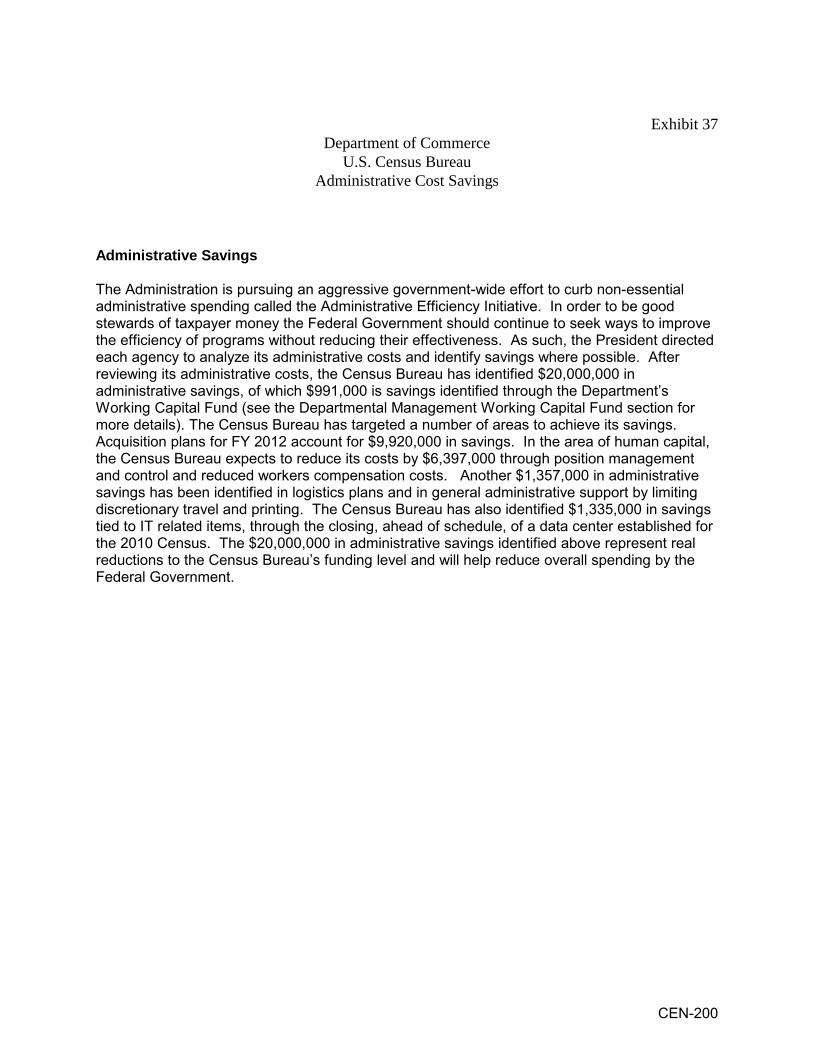
Exhibit 37
Department of Commerce U.S. Census Bureau
Administrative Cost Savings Administrative Savings The Administration is pursuing an aggressive government-wide effort to curb non-essential administrative spending called the Administrative Efficiency Initiative. In order to be good stewards of taxpayer money the Federal Government should continue to seek ways to improve the efficiency of programs without reducing their effectiveness. As such, the President directed each agency to analyze its administrative costs and identify savings where possible. After reviewing its administrative costs, the Census Bureau has identified $20,000,000 in administrative savings, of which $991,000 is savings identified through the Department’s Working Capital Fund (see the Departmental Management Working Capital Fund section for more details). The Census Bureau has targeted a number of areas to achieve its savings. Acquisition plans for FY 2012 account for $9,920,000 in savings. In the area of human capital, the Census Bureau expects to reduce its costs by $6,397,000 through position management and control and reduced workers compensation costs. Another $1,357,000 in administrative savings has been identified in logistics plans and in general administrative support by limiting discretionary travel and printing. The Census Bureau has also identified $1,335,000 in savings tied to IT related items, through the closing, ahead of schedule, of a data center established for the 2010 Census. The $20,000,000 in administrative savings identified above represent real reductions to the Census Bureau’s funding level and will help reduce overall spending by the Federal Government.
CEN-200
Related Documents