USER NOTE CONSOLIDATED FEDERAL FUNDS REPORT for Fiscal Year 1999 (Revised August 2000, January 2004) We have reviewed the data published in the original printed and electronic editions of the Consolidated Federal Funds Report for Fiscal Year 1999 (issued April 2000) and have made some revisions. We also discovered a few typographical errors, which we have corrected. The revised data and typographical corrections have been integrated into the complete set of tables presented here. A further significant post-publication change is NOT included here. This change, which can be seen only in the electronic data (Online Query System and downloads) is explained below in item 8. 1. Data records for procurement contracts made in foreign countries were deleted from the ‘‘U.S. Undistributed’’ line of Table 5. Pages 8 through 11 have been revised. 2. Table 6 Salary and Wage data for the Department of State have been revised to reflect the reorganization of the U.S. Information Agency (USIA) into the State Department. Data on salaries and wages for USIA were moved from the ‘‘Other nondefense’’ column into the column showing data for the State Department. The data for other agencies, the subtotal for all nondefense agencies and the grand total of both Defense and nondefense agencies did not change. The changes are limited to the two specified columns on revised pages 17 and 18. 3. A typographical error of the North Dakota data on Table 7 was corrected. The error did not effect the data for the other states and territories and the U.S. Total data. Page 19has been revised to correct only the North Dakota data. 4. Duplicate data on mortgage insurance loan guarantees for homes and for condominiums were removed from the respective columns of Table 8, page 20. 5. Data on some Small Business Administration loan guarantees inadvertently included in the ‘‘Other’’ column of the original Table 8 were moved and properly attributed as Small Business loan guarantees. 6. A missing column of ‘‘other’’ data that was originally summed in the ‘‘Total’’ column of Table 9, but which never appeared separately in the printed table, was added to the table. Revised Table 9is presented on page 21. 7. The above data changes resulted in changes in summary data (Table 1, page 1), in per capita calculations (Table 10, page 22), per cent calculations (Table 11, page 23), the special tabulation of Defense Department data (Table 12, page 24) and in the Historic Summary (Table 13, pages 25, 27 and 29 only).

Welcome message from author
This document is posted to help you gain knowledge. Please leave a comment to let me know what you think about it! Share it to your friends and learn new things together.
Transcript
USER NOTE CONSOLIDATED FEDERAL FUNDS REPORT
for Fiscal Year 1999
(Revised August 2000, January 2004)
We have reviewed the data published in the original printed and electronic editions of the Consolidated Federal Funds Report for Fiscal Year 1999 (issued April 2000) and have made some revisions. We also discovered a few typographical errors, which we have corrected. The revised data and typographical corrections have been integrated into the complete set of tables presented here. A further significant post-publication change is NOT included here. This change, which can be seen only in the electronic data (Online Query System and downloads) is explained below in item 8. 1. Data records for procurement contracts made in foreign countries were deleted from the ‘‘U.S. Undistributed’’ line of Table 5. Pages 8 through 11 have been revised. 2. Table 6 Salary and Wage data for the Department of State have been revised to reflect the reorganization of the U.S. Information Agency (USIA) into the State Department. Data on salaries and wages for USIA were moved from the ‘‘Other nondefense’’ column into the column showing data for the State Department. The data for other agencies, the subtotal for all nondefense agencies and the grand total of both Defense and nondefense agencies did not change. The changes are limited to the two specified columns on revised pages 17 and 18. 3. A typographical error of the North Dakota data on Table 7 was corrected. The error did not effect the data for the other states and territories and the U.S. Total data. Page 19has been revised to correct only the North Dakota data. 4. Duplicate data on mortgage insurance loan guarantees for homes and for condominiums were removed from the respective columns of Table 8, page 20. 5. Data on some Small Business Administration loan guarantees inadvertently included in the ‘‘Other’’ column of the original Table 8 were moved and properly attributed as Small Business loan guarantees. 6. A missing column of ‘‘other’’ data that was originally summed in the ‘‘Total’’ column of Table 9, but which never appeared separately in the printed table, was added to the table. Revised Table 9is presented on page 21. 7. The above data changes resulted in changes in summary data (Table 1, page 1), in per capita calculations (Table 10, page 22), per cent calculations (Table 11, page 23), the special tabulation of Defense Department data (Table 12, page 24) and in the Historic Summary (Table 13, pages 25, 27 and 29 only).
8. Department of Housing and Urban Development's program, "Lower Income Housing Assistance Program -- Section 8 Moderate Rehabilitation" (CFDA program 14.856) has been reclassified from CFFR's "Other Direct Payments" (DO) assistance type to the "Grants" (GG) assistance type. This change affects Tables 1, 3, 4, 10 ,11, 13, and 15, and involves a significant shift of $21.3 billion (nationally) from "Other Direct Payments" to "Grants." The change is NOT represented in this PDF version of the publication, but is available via the Online Query System and downloads at http://www.census.gov/govs/www/cffr.html. CFFR Object Code Category
DR Direct Payments for Individuals (Retirement and Disability only) DO Direct Payments for Individuals (Other than Retirement and Disability) DX Direct Payments Other than for Individuals GG Grants (Block, Grants, Formula Grants, Project Grants and Cooperative Agreements)PC Procurement Contracts SW Salaries and Wages DL Direct Loans GL Guaranteed/Insured Loans II Insurance
You Make Informed DecisionsHelping
U S C E N S U S B U R E A U
Consolidated Federal FundsReport for Fiscal YearState and County Areas
U.S. Department of CommerceEconomics and Statistics AdministrationU.S. CENSUS BUREAU
Issued April 2000
CFFR/99
1999
Gerard T. Keffer, Chief of theFederal Programs Branch, directed thepreparation of this report, under the gen-eral supervision of Mitchell L. Trager,Assistant Division Chief for Evaluation andInformation Systems. Daniel Pflumdirected the collection and review of Fed-eral Assistance Award Data System data,assisted by Cathy Davis, Diane Glaspie,Sue Jones, and Alice Wimbish. MichaelMashburn coordinated the assembly andprocessing of the Federal agency data filesused for this report. Daniel Pflum andCarl Lundgren served as principal dataanalysts and liaisons with the Federalreporting agencies.
Michael Freeman and Jennifer Phanprovided computer processing support forthe Federal Assistance Award Data System,and Linda Huang performed computerprocessing to generate the report datatables, under the supervision of KathleenChamberlain, Chief of the InformationSystems Branch.
Benjamin D. Cromer, Barbara Abbott,Shirley Clark, Patricia A. Heiston, andLaurene V. Qualls of the Administrativeand Customer Services Division, Walter C.Odom, Chief, provided publications andprinting management, graphics design andcomposition, and editorial review for printand electronic media. General directionand production management were pro-vided by Michael G. Garland, AssistantChief, and Gary J. Lauffer, Chief, Publica-tions Services Branch.
Grateful acknowledgment is made of thecooperation of the Federal Governmentdepartments and agencies for providinginformation needed for this report.
For information regarding data in thisreport, contact Federal Programs Branch,Governments Division, U.S. Census Bureau,Washington, DC 20233. Telephone:301-457-1565. E-mail: [email protected].
ACKNOWLEDGMENTS
Consolidated Federal Funds Reportfor Fiscal Year
U.S. Department of CommerceWilliam M. Daley,
Secretary
Robert L. Mallett,Deputy Secretary
Economics and Statistics AdministrationRobert J. Shapiro,Under Secretary for
Economic Affairs
U.S. CENSUS BUREAUKenneth Prewitt,
Director
Issued April 2000
1999
CFFR/99
State and County Areas
Paula J. Schneider,Principal Associate Directorfor Programs
Frederick T. Knickerbocker,Associate Directorfor Economic Programs
Thomas L. Mesenbourg,Assistant Directorfor Economic Programs
Gordon W. Green,Chief, Governments Division
SUGGESTED CITATION
U.S. Census Bureau. ConsolidatedFederal Funds Report for
Fiscal Year 1999. U.S. GovernmentPrinting Office, Washington, DC 2000.
ECONOMICS
AND STATISTICS
ADMINISTRATION
Economicsand StatisticsAdministration
Robert J. Shapiro,Under Secretaryfor Economic Affairs
U.S. CENSUS BUREAU
Kenneth Prewitt,Director
William G. Barron,Deputy Director
Introduction . . . . . . . . . . . . . . . . . . . . . . . . . . . . . . . . . . . . . . . v
Figures
1. Federal Government Expenditure, Per-Capita Ranges by State: Fiscal Year 1999 . xviii2. Federal Government Expenditure, Amounts and Percentages by Major Object
Category: Fiscal Year 1999. . . . . . . . . . . . . . . . . . . . . . . . . . . . xix3. Federal Government Expenditure, Amounts and Percentages by Major Agency:
Fiscal Year 1999 . . . . . . . . . . . . . . . . . . . . . . . . . . . . . . . . . xix4. Federal Government Expenditure, Annual Amounts by Major Object Category:
Fiscal Years 1983-99 . . . . . . . . . . . . . . . . . . . . . . . . . . . . . . . xx5. Federal Government Expenditure, Per-Capita Amounts by State, by Major Object
Category: Fiscal Year 1999. . . . . . . . . . . . . . . . . . . . . . . . . . . . xxi6. Federal Government Expenditure, Annual Amounts by Major Agency: Fiscal
Years 1983-99 . . . . . . . . . . . . . . . . . . . . . . . . . . . . . . . . . . xxii7. Federal Government Expenditure, Per-Capita Amounts by State, by Major
Agency: Fiscal Year 1999 . . . . . . . . . . . . . . . . . . . . . . . . . . . . xxiii
Tables
1. Summary of Federal Government Expenditure, by State and Outlying Area:Fiscal Year 1999 . . . . . . . . . . . . . . . . . . . . . . . . . . . . . . . . . 1
2. Federal Government Expenditure for Direct Payments for Individuals forRetirement and Disability, for Selected Programs, by State and Outlying Area:Fiscal Year 1999 . . . . . . . . . . . . . . . . . . . . . . . . . . . . . . . . . 2
3. Federal Government Expenditure for Direct Payments Other Than for Retirementand Disability, for Selected Programs, by State and Outlying Area: Fiscal Year1999 . . . . . . . . . . . . . . . . . . . . . . . . . . . . . . . . . . . . . . . 3
4. Federal Government Expenditure for Grants, by Agency, by State and OutlyingArea: Fiscal Year 1999 . . . . . . . . . . . . . . . . . . . . . . . . . . . . . . 4
5. Federal Government Expenditure for Procurement Contracts, by Agency, byState and Outlying Area: Fiscal Year 1999 . . . . . . . . . . . . . . . . . . . . 8
6. Federal Government Expenditure for Salaries and Wages, by Agency, by Stateand Outlying Area: Fiscal Year 1999 . . . . . . . . . . . . . . . . . . . . . . . 12
7. Federal Government Direct Loan Programs—Volume of Assistance Provided, byState and Outlying Area: Fiscal Year 1999 . . . . . . . . . . . . . . . . . . . . 19
8. Federal Government Guaranteed Loan Programs—Volume of Coverage Provided,by State and Outlying Area: Fiscal Year 1999 . . . . . . . . . . . . . . . . . . 20
9. Federal Government Insurance Programs—Volume of Coverage Provided, byState and Outlying Area: Fiscal Year 1999 . . . . . . . . . . . . . . . . . . . . 21
10. Per-Capita Amounts of Federal Government Expenditure, by Major ObjectCategory, by State and Outlying Area: Fiscal Year 1999 . . . . . . . . . . . . . 22
11. Percent Distribution of Federal Government Expenditure, by Major ObjectCategory, by State and Outlying Area: Fiscal Year 1999 . . . . . . . . . . . . . 23
12 Federal Government Expenditure for Defense Department and All OtherAgencies, by State and Outlying Area: Fiscal Year 1999 . . . . . . . . . . . . . 24
13. Historical Summary of Federal Government Expenditure, by State and OutlyingArea: Fiscal Years 1990 to 1999 . . . . . . . . . . . . . . . . . . . . . . . . . 25
14. State Rankings for Per-Capita Amounts of Federal Government Expenditure:Fiscal Year 1999 . . . . . . . . . . . . . . . . . . . . . . . . . . . . . . . . . 31
15. Federal Government Expenditure, by State and County Area: Fiscal Year 1999 . . 32
Appendixes
A. County-Type Areas Without County Government . . . . . . . . . . . . . . . . . A-1B. Geographic Areas With More Than Four Congressional Districts . . . . . . . . . B-1C. County Locations of State Capital Cities . . . . . . . . . . . . . . . . . . . . . . C-1D. Consolidated Federal Funds Report Data Sources . . . . . . . . . . . . . . . . . D-1E. State Coordinating Agencies, State Data Center Program, U.S. Census Bureau . . E-1F. Use of County Area Allocations for Selected Federal Pass-Through Assistance
Programs by State . . . . . . . . . . . . . . . . . . . . . . . . . . . . . . . . F-1
CONTENTS
iii
Introduction
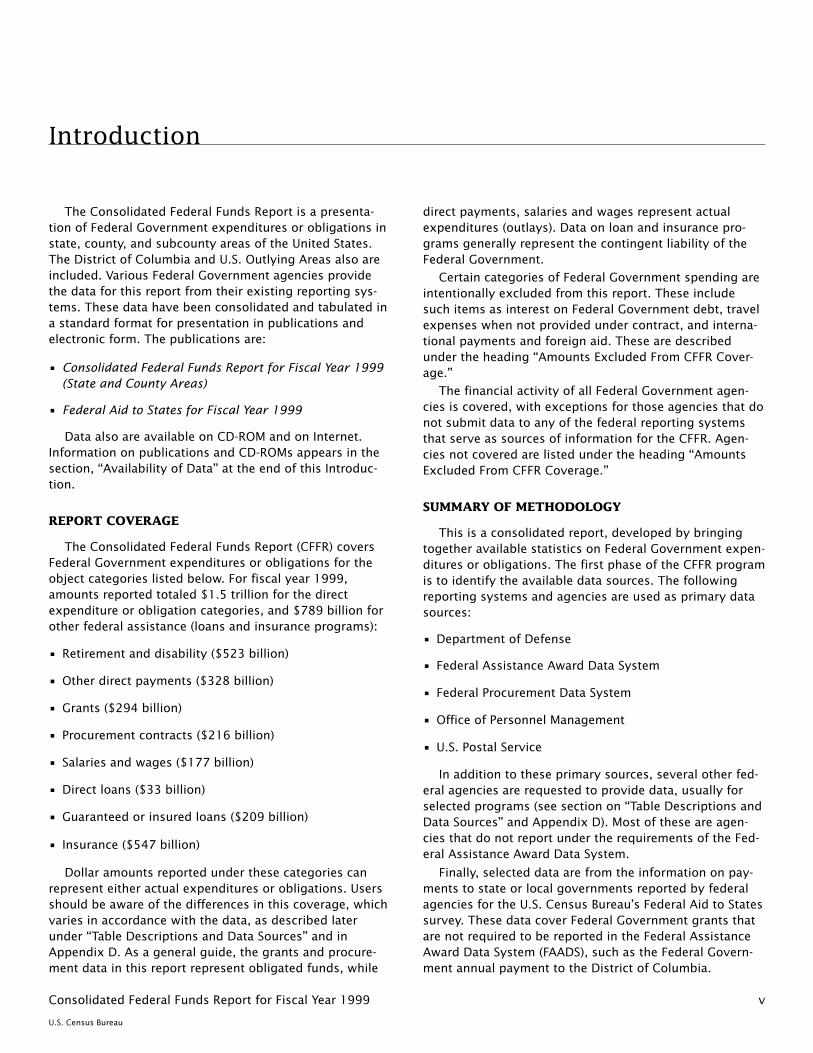
The Consolidated Federal Funds Report is a presenta-tion of Federal Government expenditures or obligations instate, county, and subcounty areas of the United States.The District of Columbia and U.S. Outlying Areas also areincluded. Various Federal Government agencies providethe data for this report from their existing reporting sys-tems. These data have been consolidated and tabulated ina standard format for presentation in publications andelectronic form. The publications are:
• Consolidated Federal Funds Report for Fiscal Year 1999(State and County Areas)
• Federal Aid to States for Fiscal Year 1999
Data also are available on CD-ROM and on Internet.Information on publications and CD-ROMs appears in thesection, ‘‘Availability of Data’’ at the end of this Introduc-tion.
REPORT COVERAGE
The Consolidated Federal Funds Report (CFFR) coversFederal Government expenditures or obligations for theobject categories listed below. For fiscal year 1999,amounts reported totaled $1.5 trillion for the directexpenditure or obligation categories, and $789 billion forother federal assistance (loans and insurance programs):
• Retirement and disability ($523 billion)
• Other direct payments ($328 billion)
• Grants ($294 billion)
• Procurement contracts ($216 billion)
• Salaries and wages ($177 billion)
• Direct loans ($33 billion)
• Guaranteed or insured loans ($209 billion)
• Insurance ($547 billion)
Dollar amounts reported under these categories canrepresent either actual expenditures or obligations. Usersshould be aware of the differences in this coverage, whichvaries in accordance with the data, as described laterunder ‘‘Table Descriptions and Data Sources’’ and inAppendix D. As a general guide, the grants and procure-ment data in this report represent obligated funds, while
direct payments, salaries and wages represent actualexpenditures (outlays). Data on loan and insurance pro-grams generally represent the contingent liability of theFederal Government.
Certain categories of Federal Government spending areintentionally excluded from this report. These includesuch items as interest on Federal Government debt, travelexpenses when not provided under contract, and interna-tional payments and foreign aid. These are describedunder the heading ‘‘Amounts Excluded From CFFR Cover-age.’’
The financial activity of all Federal Government agen-cies is covered, with exceptions for those agencies that donot submit data to any of the federal reporting systemsthat serve as sources of information for the CFFR. Agen-cies not covered are listed under the heading ‘‘AmountsExcluded From CFFR Coverage.’’
SUMMARY OF METHODOLOGY
This is a consolidated report, developed by bringingtogether available statistics on Federal Government expen-ditures or obligations. The first phase of the CFFR programis to identify the available data sources. The followingreporting systems and agencies are used as primary datasources:
• Department of Defense
• Federal Assistance Award Data System
• Federal Procurement Data System
• Office of Personnel Management
• U.S. Postal Service
In addition to these primary sources, several other fed-eral agencies are requested to provide data, usually forselected programs (see section on ‘‘Table Descriptions andData Sources’’ and Appendix D). Most of these are agen-cies that do not report under the requirements of the Fed-eral Assistance Award Data System.
Finally, selected data are from the information on pay-ments to state or local governments reported by federalagencies for the U.S. Census Bureau’s Federal Aid to Statessurvey. These data cover Federal Government grants thatare not required to be reported in the Federal AssistanceAward Data System (FAADS), such as the Federal Govern-ment annual payment to the District of Columbia.
vConsolidated Federal Funds Report for Fiscal Year 1999
U.S. Census Bureau
All data submitted for the CFFR are assigned a programidentification code, an agency identification code, and anobject code. The program identification code format ispatterned after the Catalog of Federal Domestic Assistance(CFDA) program number. For all data that a CFDA code isavailable, the CFDA number is used for the program iden-tification code. For all other data submissions, a uniquecode (or pseudo code) is assigned. For data that comesthrough the FAADS, the same program identifiers are usedin both FAADS and CFFR. Although not presented in thisCFFR publication, the program identification code is con-tained in the CFFR data file available on Internet andCD-ROM.The agency identification code assigned to each data
record is the four-character Federal Information ProcessingStandards (FIPS) code issued by the National Institute ofStandards and Technology. The two leftmost charactersform a component data element, called the TreasuryAgency Symbol (TAS), which is identical to the two-digitnumerical code used in the budgetary process to identifymajor federal agencies.The object code assigned to each data record submitted
for the CFFR consists of two alphabetic characters to des-ignate the broad object category of federal expenditure towhich each data record belongs. These are the categories(retirement and disability, other direct payments, grants,procurement, salaries and wages, direct loans, guaranteedloans, and insurance) listed previously under ‘‘Report Cov-erage,’’ and described in more detail below under ‘‘TableDescriptions and Data Sources.’’Both the program identification code and the object
code are used throughout the CFFR processing. Forexample, during the data edit and review stages, dollaramounts are tallied by program or object categoryfor comparison with other sources of information onfederal outlays. In addition, the object code becomes theprimary basis for the table presentation in the CFFR publi-cations (all grants data are grouped together, and soforth).The processing of all data submitted by federal agen-
cies for the CFFR involves the five steps detailed below.Exceptions are detailed later under ‘‘Table Descriptionsand Data Sources’’ and in Appendix D.
1. Verification of edit totals requires comparing dollaramounts and record counts actually submitted withtotals provided on transmittal documentation fromeach federal agency. Since most submissions are viaInternet or diskette, this process involves ensuringthat the electronic files are in the prescribed format.Any discrepancies are brought to the attention ofthe submitting agency and corrections made asneeded.
2. Verification of geographic coding applied to thosesubmissions received electronically. Since data fromthe different sources often are submitted on the basis
of different geographic coding, a frequent additionalstep in CFFR processing is to convert all data recordsto standard geographic designations. The details ofgeographic coding for the CFFR are described later inthe section ‘‘Geographic Presentation and Coding.’’
3. For purposes of review, data from each agency aresorted by program identification code and geographicunit. This enables review tables to be produced show-ing data by state, county, or subcounty area for eachfederal program or object category. At this stage, anational total of federal program amounts in the CFFRis compared to totals for the same programs thatappear in other data sources, such as the CFDA andthe federal budget. Data also are reviewed by programor object category for unusual changes at thenational, state, county, and subcounty levels. In thismanner, patterns of Federal Government spending forany category, such as Department of Defense salariesand wages, are reviewed. This phase of processing isthus concerned with review and verification of dollaramounts by program, object category, and geography.Corrections are made as needed, based upon consul-tation with the federal agency submitting the originaldata.
4. Data records are combined so that only one recordexists for each unique combination of geographiccode, program identification code, agency code, andobject code. Even though multiple grant awards mayhave been made under a single program to any givengeographic area, they are all combined into a singlerecord for the fiscal year. If ten Community Develop-ment Block Grants are awarded to New York City dur-ing fiscal year 1999, they are combined into a singlerecord for Community Development Block Grantsfunding within New York City. Combining like datarecords in this manner is the final step in processingfor each CFFR submission or data file.
5. All data files are then merged together to form a con-solidated CFFR file. This enables the compilation oftotal federal expenditure or obligation by object cat-egory and geographic area. These data are reviewedand final corrections made to the CFFR data file.
This final data file contains records in geographic detailonly. County, state, or United States total records are notpart of the CFFR data file. Nor are summary totals byobject category actually contained in the data file. All ofthese summary records are tallied during preparation ofthe tables in the CFFR. In this way, totals published in theCFFR represent summations of the more detailed data con-tained in the CFFR data file.
Table preparation also entails processing the CFFR datafile in conjunction with the CFFR geographic reference file.The data file contains all information associated with thefederal program or object category of spending being
vi Consolidated Federal Funds Report for Fiscal Year 1999
U.S. Census Bureau
reported. The geographic reference file contains all perti-nent information concerning the government unit forwhich data are published. This information includes thestate, county, and municipal/township name, the 1999population, the congressional districts, and all associatedgeographic coding.
RELATIONSHIP TO FEDERAL ASSISTANCE AWARDDATA SYSTEM (FAADS)
The Federal Assistance Award Data System (FAADS) is aquarterly report of financial assistance awards made byeach federal agency. Coverage includes most (but not all)grants, direct payments to individuals and others, insur-ance, and loans. Data submitted by federal agencies forthe FAADS serve as the source for most of the statistics inthis publication. The FAADS does not provide informationon either salaries and wages or procurement contracts. AllCFFR data not obtained through the FAADS are otherwiseobtained from federal agencies.The Office of Management and Budget selected the
Census Bureau as executive agent, responsible for operat-ing the FAADS. Data on financial assistance awards aresubmitted quarterly by Federal Government agencies. TheCensus Bureau collects these data and combines them toform a single quarterly database on Federal Governmentfinancial assistance awards. Each quarterly database is dis-tributed to the Congress and to state governments. Inaddition to grant awards, the FAADS program covers directpayments to individuals (such as retirement benefits),direct payments for specified use (such as food stampawards), cooperative agreements, guaranteed loans, directloans, and insurance programs of the Federal Government.All financial assistance awards in the FAADS are identifiedby a Catalog of Federal Domestic Assistance (CFDA) pro-gram number (or a pseudo code, if a CFDA number isunavailable).For grants, the FAADS data represent the federal obliga-
tion incurred at the time the grant is awarded. Theamounts reported do not represent actual expenditures,since obligations in one time period may not result in out-lays during the same time period. Moreover, initialamounts obligated may be adjusted at a later date, eitherthrough enhancements or deobligations. These deobliga-tions may appear in the CFFR data as negative amounts.Users should be aware of what these amounts representand use care in interpreting such data.For fiscal year 1999, CFFR derived data from the FAADS
by summing the four quarterly reports that covered finan-cial assistance awarded between October 1, 1998, andSeptember 30, 1999. All program awards in FAADS arereported by state, county, and usually, city of recipient.Submitting agencies use either FIPS codes for states, coun-ties, and places, or General Services Administration loca-tion codes.
RELATIONSHIP TO FEDERAL AID TO STATES (FAS)
The publication, Federal Aid to States for Fiscal Year1999 (FAS), presents state-by-state distributions of FederalGovernment expenditures for grants to state and localgovernments only. In the CFFR, federal grants generallyrepresent obligations (not expenditures or outlays), andinclude grants to nongovernmental recipients, in additionto payments to state and local governments. Grants arepresented in Table 4 of this report.
The Federal Aid to States report generally covers actualfederal grant outlays to state and local governments, byagency and program. Data reported in the FAS are submit-ted to the Census Bureau in accordance with OMB CircularA-11 and the Census Bureau’s annual Federal Aid to Statesreporting guidelines. Such data were previously collectedand published annually by the Division of GovernmentAccounts and Reports, Fiscal Service, Bureau of Govern-ment Financial Operations, Department of the Treasury.Prior to 1983, these data were published in the annualDepartment of the Treasury report Federal Aid to States.
During the years 1981-97, Table 2 of the CensusBureau’s publication, Federal Expenditures by State, pro-vided statistics equivalent to those found in the TreasuryDepartment’s FAS series (ending in 1982) and in the Cen-sus Bureau’s FAS series (beginning in 1998). In addition,the other tables of the FES series (discontinued after 1997)published statistics on salaries and wages, direct pay-ments for individuals, procurement, and other programs.These other statistics are now being published as part ofthe Consolidated Federal Funds Report series.
The data on grants to state and local governments inFAS are reconciled with amounts in the federal budget.The definitions applied in the Budget for grants to govern-ments serves as the basis for reporting in the FAS publica-tion. Users should consult the introductory text in the FASpublication for a detailed explanation of the grants datathat appear in that report.
There are several differences between the FAS reportand the CFFR report:
1. The FAS report generally covers federal grant outlaysor expenditures, whereas grants data in the CFFR gen-erally cover obligations, which may or may not resultin actual expenditures. Obligations that do not resultin expenditures may become deobligated. Deobliga-tions are shown as negative amounts in the data.
2. The FAS report covers only grants to state and localgovernments, whereas the grants data in the CFFRinclude all grants, regardless of whether the recipientis a government entity. The CFFR provides data onseveral other categories of federal funds, while theFAS provides information only on grants.
viiConsolidated Federal Funds Report for Fiscal Year 1999
U.S. Census Bureau
3. The level of geographic detail for which data areshown is different. The FAS report distributes dataonly on a state-by-state basis, while the CFFR reportcontains state and county area information. (The CFFRdatabase also contains data at the subcounty, placelevel.)
4. Data on Department of Housing and Urban Develop-ment housing assistance (Section 8) payments also isdifferent. In FAS, these payments are classified asgrants where the landlord is a public agency. In theCFFR, all Section 8 payments are classified as directpayments. This is because data used for the CFFRrequire subcounty geographic detail, whereas datadistinguishing between public and nonpublic land-lords are available only at the state level of detail.
5. The data on Federal Emergency Management Agencypayments under the Disaster Assistance Program alsovaries. In the CFFR, these payments are classified asgrants, while in the FAS report, individual assistancepayments under this program are excluded from thegrants data. The grants versus direct payments dataare not available at the substate level.
TABLE DESCRIPTIONS AND DATA SOURCES
Appendix D lists the data sources used for the CFFR,arranged by major category of Federal Government expen-diture or obligation. The Table descriptions that followinclude explanations of the coverage, conceptual basis forreporting (expenditures versus obligations), geographicbasis for reporting, and other information important forinterpreting the data in the CFFR. The use of the term FIPSgeographic codes in the following text refers to the Fed-eral Information Processing Standards codes maintainedby the National Institute of Standards and Technology,Department of Commerce.
Table 1: Total Expenditure
All amounts in Table 1 are aggregates from dataincluded in Tables 2-6. Data are rounded to millions of dol-lars. Total expenditure does not include data on contin-gent liabilities (loans and insurance), which are separatelylisted in Tables 7-9.
Table 2: Retirement and Disability
In the CFFR, data covering Federal Government directpayments are separated into two object categories: directpayments for retirement and disability benefits (Table 2),and all other direct payments (Table 3). Retirement anddisability programs include federal employee retirementand disability benefits, Social Security payments of alltypes, selected Veterans Administration programs, andselected other federal programs (see Appendix D).Both the FAADS and the Catalog of Federal Domestic
Assistance (CFDA) categorize direct payments in a differ-ent manner than the CFFR. Both the FAADS and the CFDA
subdivide direct payments into the two subcategories,‘‘Direct Payments for a Specified Use’’ and ‘‘Direct Pay-ments with Unrestricted Use.’’ Neither subdivision is rec-ognized in the CFFR. The CFFR instead subdivides directpayments into three object types: Object code DR for‘‘Retirement and Disability Payments to Individuals,’’ objectcode DO for ‘‘Other Direct Payments for Individuals,’’ andobject code DX for ‘‘Direct Payments Other than for Indi-viduals.’’ Only object code DR is presented in Table 2.Object codes DO and DX are presented in Table 3.The CFDA defines ‘‘Direct Payments for a Specified Use’’
as ‘‘Financial assistance provided directly to individuals,private firms, and other private institutions to encourageor subsidize a particular activity by conditioning thereceipt of assistance on a particular performance by therecipient. This does not include solicited contracts for theprocurement of goods and services for the Federal Gov-ernment.’’ The FAADS similarly defines ‘‘Direct Paymentsfor a Specified Use’’ as ‘‘a subsidy or other nonreimburs-able direct financial aid.’’The CFDA defines ‘‘Direct Payments With Unrestricted
Use’’ as ‘‘Financial assistance provided directly to benefi-ciaries who satisfy eligibility requirements with no restric-tions imposed on the recipient as to how the money isspent. Included are payments under retirement, pension,and compensation programs.’’ The FAADS defines ‘‘DirectPayments With Unrestricted Use’’ with such examples as‘‘retirement, pension, veterans benefits, etc.’’Except as indicated below, data in Table 2, Retirement
and Disability, are compiled from amounts reported by theFederal Agencies for the Federal Assistance Award DataSystem (FAADS). Reported amounts represent obligationsof federal funds during the fiscal year. Direct payments forindividuals are shown by state and county area only, inaccordance with the reporting requirements of the FAADS.The following retirement and disability direct paymentprograms are not available from the FAADS and areobtained from other data sources.
1. Military retirement benefits data are supplied by theDepartment of Defense, along with that agency’s dataon military payroll. Amounts represent actual expendi-tures during the fiscal year. Coverage includes recur-rent benefit payments, as well as permanent and tem-porary disability payments. Data are provided by stateand county area of recipient.
2. Included in the amounts shown for civilian retirementbenefits are benefits for retired uniformed U.S. CoastGuard personnel, for which data were obtained fromthat agency. Coverage includes taxable benefitsfinanced by employer or general fund contributions.Retired civilian employees of the Coast Guard areexcluded from these data, but included in data fromthe Office of Personnel Management.
3. Federal civilian employee retirement and disabilitypayments are from the Compensation Group, Office of
viii Consolidated Federal Funds Report for Fiscal Year 1999
U.S. Census Bureau
Personnel Management (OPM). Amounts includeexpenditures for all periodic annuity, survivor annuity,lump sum death claims, and withdrawals. Administra-tive expenses and funds transferred to other retire-ment systems are excluded.Retirement benefits for federal civilian employees
also include data for former Postal Service employees.Note that the amounts reported by OPM include
payments from employee contributions. No data cov-ering the payments associated only with employercontributions, earnings on investments, or other non-employee financed amounts could be obtained.The OPM data represent an estimated geographic
distribution of actual fiscal year 1999 disbursements.The methodology used by OPM is based on propor-tionate calendar year-to-date annuity disbursementsthrough September 30, 1999. The calendar year-to-date data are accumulated by ZIP code, and propor-tionate shares are then applied against the actual totalof fiscal year 1999 disbursements. ZIP codes reflectrecipient location except for payments made via elec-tronic funds transfer, which reflect correspondence ZIPcode.Like other data submitted on the basis of ZIP codes,
these data are converted to state and county areasusing standard methodology.
4. Pension plan termination insurance payments reflectbenefits paid by the Pension Benefit Guaranty Corpo-ration (PBGC) under the Pension Plan TerminationInsurance Program (CFDA program 86.001). Datainclude only those payments made directly by thePBGC. Amounts paid by interim custodians such asbanks or other financial institutions are not reported.The data submitted by the PBGC are geographicallydistributed by postal ZIP code and converted tocounty level data for the CFFR.
5. Payments to retirees and other beneficiaries from thePublic Health Service, Commissioned Corps, arereported by that federal agency. Amounts are reportedby mailing address (ZIP code) of the beneficiary andconverted to county level data by the Census Bureau.
6. Data for benefit payments to retirees from theNational Oceanic and Atmospheric Administration(NOAA) Commissioned Corps are from the U.S. CoastGuard, Pay and Personnel Center, and are availableonly at the state level.
7. The State Department Foreign Service Officers retire-ment system provided data on fiscal year 1999 benefitpayments. These are reported geographically by ZIPcode and converted to county level data by the Cen-sus Bureau.
8. The Tennessee Valley Authority reported benefit pay-ments to retirees by state and county area.
Data on Social Security and Supplemental SecurityIncome (SSI) payments come from reports submittedby the Social Security Administration for the FAADS.All amounts reflect obligations during the fiscal year,with the state-by-state distribution estimated. Allamounts are reported by recipient location. Excludedfrom the amounts reported are payments to recipientsin foreign countries. The amounts shown under theSSI program exclude any state government sharesadministered by the Federal Government.
Table 3: Other Direct Payments
Programs classified as other direct payments in Table 3include two CFFR object categories. The first object cat-egory (code ‘‘DO’’) is direct payments for individuals, otherthan for retirement and disability. The second object cat-egory (code ‘‘DX’’) is direct payments, other than for indi-viduals. The first object category contains far more expen-diture than the second object category. For convenience ofpresentation, these two object categories are combined inthe CFFR publication, but are available separately in theCFFR database. (See text under the ‘‘Table 2’’ headingabove for further information about the subdivisions ofthe ‘‘Direct Payments’’ category.)Amounts shown in Table 3, Other Direct Payments,
come from the FAADS, except for those programs listedbelow or in Appendix D. These amounts generally repre-sent obligations incurred during the fiscal year. The fourquarterly FAADS databases are consolidated to obtain fis-cal year totals. Direct payments for individuals arereported by state and county area only.In Tables 3 and 15 (and data file available on Internet
and CD-ROM) all Department of Housing and Urban Devel-opment housing assistance is classified in the direct pay-ments to individuals category. The total obligations areallocated by state and county. Amounts reported for theHousing Assistance Payments (the Section 8 program)under this object category reflect the entire amount ofobligations for the year. That is, all Section 8 (andvoucher) payments are classified as direct payments forindividuals, regardless of whether they are paid to publicor private landlords. By contrast, the Federal Aid to Statespublication classifies these payments as grants, if thelandlord is a public agency.Excess earned income tax credits represent Federal
Government payments during calendar year 1999 for taxyear 1998. Information is from the Department of theTreasury, Internal Revenue Service, Statistics of IncomeDivision. Amounts reflect only the excess earned incometax credits actually refunded. Aggregate figures by stateare reported. No substate detail is available.Crop Insurance data on the amount of indemnity pay-
ments (claims) and premium subsidies are provided by theAgriculture Department. Coverage includes the claimspaid directly by the Federal Government to farmers, andpremium subsidies to private insurers. Federal indemnity
ixConsolidated Federal Funds Report for Fiscal Year 1999
U.S. Census Bureau
payments to private insurance carriers are not reported.Amounts reflect the resident county of the claimant fordirect payment, or location of county of the private carrierfor premium subsidies. Data reflect actual expendituresduring fiscal year 1999.The Federal Emergency Management Agency provides
county level data for payments under the National FloodInsurance program. Amounts represent claims and adjus-tor expenses.Legal Services Corporation expenditures data are from
that agency. The Legal Services Corporation payments rep-resent annualized grants and contracts, by state, made bythis agency from the subsidy it receives from the FederalGovernment.U.S. Postal Service expenditures for current operations,
other than procurement and salaries and wages, are pro-vided by the Postal Service as part of that agency’s totalsubmission for CFFR. Data are provided by state andcounty area, with the distribution based on the methodol-ogy described later for Postal Service salaries and wages.Data for the Federal Government (employer) share of
premiums on federal employee life and health insuranceare from the Office of Personnel Management, Compensa-tion Group. All expenditures for life and health insurancepremiums are assigned to the ‘‘state undistributed’’ levelof geography. For both the life and health insurance pro-grams, the amounts reported represent only the employer(Federal Government) share of the premiums.The Education Department reports fiscal year 1999 pay-
ments under the Federal Family Education Loan program.Amounts under the other direct payments for individualscategory include interest subsidies. Amounts under thedirect payments, other than for individuals, categoryinclude default payments, advances, and administrativecost allowances for guarantee agencies.Food Stamp program data are supplied by the Depart-
ment of Agriculture for the FAADS. Amounts reflect theactual value of benefits awarded, by state, during the fis-cal year. Figures may differ slightly from amounts repre-senting the value of benefits redeemed or processedthrough the Federal Reserve System.Federal Employee Workers Compensation payments are
from reports submitted by the Department of Labor,Employment Standards Administration, Office of Workers’Compensation Programs, for the FAADS. Amounts for fis-cal year 1999 reflect actual payments, with the state-and-county distribution based on the ZIP code of the recipi-ent’s place of residence.Statistics on federal expenditures for unemployment
compensation are compiled from information obtainedfrom the Department of Labor. Amounts reported includeall benefit payments made from the Unemployment Com-pensation Trust Fund, regardless of the source of fundingfor the payments. Thus, amounts reported include regularand extended benefits to unemployed workers, and ben-efits to ex-civilian and ex-military federal employees. Prior
to 1989, only benefit payments financed by the FederalGovernment were included in this publication.
The Office of Justice Programs provides data for pay-ments under the Public Safety Officers’ Benefit Program(CFDA 16.571) of the Department of Justice.
Medicare data are reported by the Department of Healthand Human Services for the FAADS. All amounts reflectobligations during the fiscal year, with the state-by-statedistribution estimated. All amounts are reported by recipi-ent location. Excluded from the amounts reported are pay-ments to recipients in foreign countries.
Table 4: Grants
The grants category in the CFFR combines two grantscategories listed in the CFDA and four grants categoriesfound in the FAADS. The CFDA distinguishes two catego-ries of grant: Formula Grants and Project Grants. TheFAADS subdivides Formula Grants into two further catego-ries: Block Grant and Formula Grant. The FAADS also sub-divides Project Grants into two further categories: ProjectGrant and Cooperative Agreement.
The CFDA defines ‘‘Formula Grants’’ as ‘‘Allocations ofmoney to States or their subdivisions in accordance with adistribution formula prescribed by law or administrativeregulation, for activities of a continuing nature not con-fined to a specific program.’’ The CFDA defines ‘‘ProjectGrants’’ as ‘‘The funding, for fixed or known periods, ofspecific projects or the delivery of specific services orproducts without liability for damages for failure to per-form. Project grants include fellowships, scholarships,research grants, training grants, traineeships, experimen-tal and demonstration grants, evaluation grants, planninggrants, technical assistance grants, survey grants, con-struction grants, and unsolicited contractual agreements.’’No further definitions are provided in the FAADS or FAS.
The principal source of the grants data in the CFFR isthe information submitted quarterly for the Federal Assis-tance Award Data System (FAADS). For grants, the FAADSdata represent the federal obligation incurred at the timethe grant is awarded. The grants data from FAADS that arecarried forward to the CFFR total about 98 percent of allgrants reported. (See section above, ‘‘Relationship to Fed-eral Assistance Award Data System (FAADS)’’ for furtherinformation about FAADS.)
The remaining grants data for the CFFR are from datasubmitted to the Census Bureau pursuant to the annualFederal Aid to States (FAS) survey, and OMB Circular A-11.These submissions are required annually of all FederalGovernment agencies that make payments to state or localgovernments. Selected grant programs data are obtainedfrom the Federal Aid to States (FAS) data base to ensurecomprehensive coverage in the CFFR. FAS Data are avail-able only at the state area level of reporting. (See sectionabove, ‘‘Relationship to Federal Aid to States (FAS)’’ for fur-ther information about FAS.)
x Consolidated Federal Funds Report for Fiscal Year 1999
U.S. Census Bureau
Table 5: Procurement
Statistics in Table 5, covering Federal Government pro-curement contracts, are provided by the U.S. Postal Service(USPS) for Postal Service procurement and by the FederalProcurement Data Center (FPDC) within the General Ser-vices Administration for procurement actions of all otherfederal agencies, including the Defense Department.Amounts provided by the USPS represent actual outlays
for contractual commitments, while amounts provided bythe FPDC represent the value of obligations for contractactions, and do not reflect actual Federal Governmentexpenditures. In general, only current year contractactions are reported for data provided by the FPDC; how-ever, multiple-year obligations may be reflected for con-tract actions of less than 3 years duration.The FPDC collects procurement statistics on a quarterly
basis from most Federal Government departments andagencies, and provides these data according to the placeof performance rather than the location of the prime con-tractor. Excluded from the procurement totals reported arethe amounts for the judicial and legislative branches ofgovernment and most intergovernmental transfers offunds. Also excluded from the totals are amounts for pro-curement in foreign countries.Most contract actions provided by the FPDC with values
under $25,000 are not distributed by state and outlyingarea. Also, certain Department of Defense contracts areclassified with respect to location of performance. Suchamounts are reported as ‘‘U.S. undistributed.’’Procurement data awarded by the USPS include all out-
lays made under formal contractual agreements. The FPDCdata include contractual actions for construction, pur-chases of equipment, and other purchases of tangibleitems by the Federal Government. Also included with theFPDC data are contractual actions for services often notgenerally associated with procurement, such as the pur-chase of utilities, building leases, and other servicesentered into via contractual agreement.Procurement data provided by the FPDC are distributed
according to place of performance, as designated by FIPSstate/county/place geographic coding. These geographiccodes are matched against the government unit codescomprising the geographic basis for the CFFR, andassigned to any units where a match is found. Unmatcheddata records are distributed to ‘‘balance of county’’ repre-sented by the state/county portion of the FIPS geographiccode. (For those FPDC data records submitted only with astate/place code, a county code is first assigned via a geo-graphic conversion file.)
Table 6: Salaries and Wages
Amounts reported for Federal Government salaries andwages are from four sources: the Department of Defense,the Office of Personnel Management, the Postal Service,
and the U.S. Coast Guard (within Department of Transpor-tation). All amounts represent outlays during the FederalGovernment’s fiscal year.The Defense Department provides information on mili-
tary payrolls, with separate amounts for active militaryand inactive military (Reserve and National Guard). Thesedata are from the Directorate for Information, Operationsand Reports of the Washington Headquarters Services,Department of Defense. (Note that salaries and wagesdata covering civilian employees of the Defense Depart-ment are from the Office of Personnel Management, asdescribed below.) The submission from the DefenseDepartment is an electronic file containing data recordsthat are distributed using FIPS geographic codes for statesand counties.Amounts reported represent estimates of fiscal year
outlays by state and county, and include gross compensa-tion. This covers salaries and wages, housing allowances,and in general all other personnel compensation, exceptretired military pay, which is reported in Table 2 under theseparate category, retirement and disability direct pay-ments for individuals. Other features of the Department ofDefense salaries and wages include:
1. Amounts for military personnel stationed overseas areexcluded from totals.
2. Salaries and wages for inactive personnel refer to mili-tary Reserve and National Guard payroll.
3. Amounts reported reflect the place of employment(duty station) rather than home residence.
Salaries and wages data for U.S. Postal Service employ-ees are provided by the U.S. Postal Service. Amounts rep-resent actual outlays during the fiscal year, but with thenational total distributed among the states and countieson an estimated basis. Estimates are derived by calculat-ing the ‘‘per employee’’ payroll cost and applying this costto each postal facility based upon the number of employ-ees. The Postal Service data are geographically distributedbased upon place of employment (postal facility), ratherthan place of residence. Data records are submitted in anelectronic file and contain FIPS state and county areacodes.Statistics on salaries and wages for uniformed employ-
ees of the U.S. Coast Guard are reported by the U.S. CoastGuard, within the Department of Transportation. Data arereported by ZIP code, for the place of employment.Amounts are then aggregated by county area.Salaries and wages for all other federal employees are
from the Office of Personnel Management. Coverageincludes all other federal civilian employees (excluding theCentral Intelligence Agency, Defense Intelligence Agency,and the National Security Agency) employed in the UnitedStates and the outlying areas. Data are reported separatelyfor each major federal agency. The data include:
xiConsolidated Federal Funds Report for Fiscal Year 1999
U.S. Census Bureau
• Basic annual salaries
• Premium pay (overtime, night differential, cost ofliving allowances, station allowances, holiday pay,and any retroactive pay)
• Lump sum payments (for annual leave)
OPM national totals represent actual expenditures oroutlays during the fiscal year. The geographic distributionof these amounts by state (or outlying area) and countyare estimated, based upon place of employment. The fol-lowing assumptions apply for the OPM estimation proce-dures:
1. The basis for the geographic distribution is place ofemployment, using data on salary and employmentdistributions from the Office of Personnel Manage-ment’s (OPM) Central Personnel Data File (CPDF) as ofMarch 31, 1999. Data are geographically prorated tototal fiscal year payroll and payment data from the SF113-A, ‘‘Monthly Report of Federal Civilian Employ-ment.’’
2. Estimated payroll data are produced at the state,county, and outlying area levels only.
3. Payroll data are allocated to states, counties, and out-lying areas based partly on estimates. The estimatesassume that premium pay and lump sum payments aswell as part-time and intermittent pay are proportionalto the salaries of full-time federal civilian employees(both defense and nondefense) in the states, countiesand outlying areas.
4. Judicial pay is estimated using the above assumptionwith the exception of the Supreme Court whose SF113-A pay is added to the District of Columbia’s non-defense payroll.
The methodology used to estimate the geographic dis-tribution of salaries and wages data involves the followingsteps:
1. Actual expenditures for salaries and wages areobtained from the SF 113-A. Salary and wage data onthe SF 113-A are total expenditures (including basic,premium, and lump sum payments) for all federalcivilian employees. These data are not reported bystate and county on the SF 113-A.
2. From OPM’s CPDF and agency survey data, aggregatebasic salaries for full-time employees only are com-puted for each county, each outlying area, total U.S.,and total outlying areas. Based on these aggregatebasic salaries, percentages are computed for bothDepartment of Defense and all other agencies. Thesepercentages determine each county’s and outlyingarea’s proportion of the total (U.S. and outlying areas)full-time salaries.
3. The percentages referenced above are applied to SF113-A agency payroll data for the U.S. and outlyingareas to estimate actual expenditures in counties andoutlying areas. State and outlying area totals areobtained by aggregating estimated actual expendi-tures in counties and outlying areas, respectively.
4. Federal pay expenditures in Washington, DC, are com-puted by the above methodology. However, a supple-ment is then added to this estimate for agencies notreporting to the Central Personnel Data File. Thesupplement consists of SF 113-A agency payroll datafor the following agencies: U.S. Congress, Congres-sional Budget Office, White House Office, Office of theVice President, Federal Reserve Board, Architect of theCapitol, U.S. Botanic Gardens, Library of Congress,Copyright Royalty Tribunal, U.S. Tax Court, Office ofTechnology Assessment, and the Supreme Court. Sinceemployment in these agencies is primarily, and inmost cases totally, in the District, payroll data areadded to the District’s estimate.
Tables 7-9. Direct Loans, Guaranteed Loans, andInsurance
The CFDA defines ‘‘Direct Loans’’ as ‘‘Financial assis-tance provided through the lending of federal monies for aspecific period of time, with a reasonable expectation ofrepayment. Such loans may or may not require the pay-ment of interest.’’ The CFDA defines ‘‘Guaranteed/InsuredLoans’’ as ‘‘Programs in which the Federal Governmentmakes an arrangement to indemnify a lender against all orpart of all of any defaults by those responsible for therepayment of loans.’’ The CFDA defines ‘‘Insurance’’ as‘‘Financial assistance provided to assure reimbursementfor losses sustained under specified conditions. Coveragemay be provided directly by the Federal Government orthrough private carriers and may or may not involve thepayment of premiums.’’ The FAADS and CFFR use the samecategories, and provide no separate definitions.All data on loans and insurance programs of the Federal
Government, with the exception of data on flood insur-ance and student loan programs, come from the FederalAssistance Award Data System (FAADS). Guaranteed loans,direct loans, and insurance are reported in the FAADS bystate and county area, or by state, county, and place. Dataon the Federal Direct Student Loan (CFDA number 84.268)and Federal Family Education Loan programs (CFDA num-ber 84.032) are not reported for the Federal AssistanceAward Data System, and are obtained separately from theDepartment of Education. National Flood Insurance data(CFDA number 83.100), reflecting insurance in force onSeptember 30, 1999, are from the Federal EmergencyManagement Agency.Loan and insurance program amounts in Tables 7-9
reflect the volume of loan or insurance activities. Theseamounts represent either direct loans made to certain cat-egories of borrowers, or the Federal Government contin-gent liability for loans guaranteed and direct insuranceagainst loss.
xii Consolidated Federal Funds Report for Fiscal Year 1999
U.S. Census Bureau
Loans and insurance data do not represent actualexpenditures associated with the loan or insurance pro-grams. Any actual outlays under these programs, such asinsurance claims paid by the Federal Government, appearin the direct payments categories in the CFFR. FederalGovernment contingent liability can vary by program, andcaution should be used in comparing one federal loan orinsurance program to another, or in interpreting the datapresented to reflect actual federal outlays over time. Thefollowing also should be noted:
1. Amounts guaranteed or insured do not necessarilyrepresent future outlays.
2. All amounts reflect the dollar value of loans or insur-ance coverage provided during the fiscal year, and notthe cumulative totals of such activity over the life ofthe program.
3. Direct loans are not reported on a net basis, as in thefederal budget, but rather are shown in terms of totalamounts loaned.
4. Programs otherwise similar can vary in the share ofthe total liability that the Federal Government guaran-tees or insures. Certain veterans guaranteed loan pro-grams are guaranteed only up to a stated maximumdollar value, for example. In these cases, the FederalGovernment contingent liability is less than the totalvalue of the loan or insured policy agreement.
Tables 10-11: Miscellaneous Calculations
Per capita federal expenditure amounts in Table 10 arecomputed using 1999 population estimates.
Percentage distributions of federal expenditures inTable 11 are computed based on U.S. totals in the samecategory.
Table 12: Defense Department and All OtherAgencies
The Defense Department and other agency expenditureamounts in Table 12 are computed from data in Tables 2through 6. Figures for all Department of Defense agenciesare tallied to arrive at a total for Department of Defenseexpenditures. This total is then netted from the grandtotal of Federal Government expenditures, and theresidual categorized as nondefense expenditures. Thisprocedure is followed for each state and outlying area.The defense/nondefense totals are then used to computeper capita and percent distribution amounts, using theprocedure described above for Tables 10 and 11.
Data in the column on Energy Department defenserelated activities are from the Department of Energy, Officeof the Assistant Secretary for Defense programs. Thesedata represent defense related atomic energy activities,
and are presented on an exhibit basis only. Since the dataare for the Department of Energy, they are included in thecolumns for ‘‘All other federal agencies,’’ rather thanDepartment of Defense.
Table 13: Historical Summary
Consolidated Federal Funds Report has been publishedannually since fiscal year 1983. The data in Table 13 rep-resent summary totals, by state and object category, ofcovered federal expenditures from fiscal years 1990 to1999. Amounts shown include revisions to originally pub-lished figures, where applicable. These revisions are madewhere errors existed in the original data, or where federalprograms have been reclassified to another object cat-egory of expenditure.
Table 14: State Rankings
Per-capita rankings in Table 14 are derived from per-capita figures shown in Table 10. The District of Columbiaand the outlying areas are excluded from the rankings.
Table 15: County Areas
The summary federal expenditure data in Table 15 areby state and county area. State areas include the 50states, the District of Columbia, and the Outlying Areas ofAmerican Samoa, Federated States of Micronesia, Guam,Republic of the Marshall Islands, Commonwealth of theNorthern Mariana Islands, Republic of Palau, Common-wealth of Puerto Rico, and the U.S. Virgin Islands. Countyareas include both counties and county equivalent areas.Examples of county equivalent areas include county areaswith no county government and municipal governmentsthat are independent of any organized county. Coverageincludes all object (or use) categories of Federal Govern-ment expenditure.The basis for the geographic distribution in the CFFR
varies according to the object category and the datasource. These sources are detailed above in the tabledescriptions and in Appendix D. The following generalguidelines apply:
• Grants-location of initial recipient
• Salaries and wages-place of employment
• Procurement-place of performance
• All other object categories-recipient location
For grants, users should note that some dollar amountsappear at the state capital county areas. This reflects thecoding of grants to the state governments, even whensuch grants represent payments that are subsequentlypassed through to local jurisdictions, or represent pro-grams that are spread out over all areas of the state interms of financial impact. Appendix C lists the statecapital cities and their respective county areas. Most large
xiiiConsolidated Federal Funds Report for Fiscal Year 1999
U.S. Census Bureau
volume grant programs involve a direct federal-to-statetransfer of aid, which the state governments subsequentlyredistribute. Data for several of these grant programs aretreated differently in the CFFR as described in the sectionbelow, ‘‘Estimates for Substate Grant Distribution.’’ As indi-cated in that section, CFFR data for several grant pro-grams are distributed by county of final recipient, ratherthan initial recipient, as reported in the FAADS.Included in the geographic listings are the terms ‘‘U.S.
undistributed’’ and ‘‘state undistributed.’’ These are usedfor data that were reported without specific geographicdesignations for the state or county. Examples of suchdata include procurement actions of less than $25,000,which are reported as one data record and assigned to‘‘U.S. undistributed.’’The congressional districts shown in the CFFR reflect
the districts of the 106th Congress. For those states thathave only one at-large representative, the congressionaldistrict is shown as ‘‘00.’’As indicated previously and explained in detail under
‘‘Table Descriptions and Data Sources,’’ dollar amountsreported can reflect expenditures or obligations. In somecases, dollar amounts shown will be negative. Suchamounts reflect deobligations of financial assistance thathad been previously awarded, and generally appear in thegrant object category.
GEOGRAPHIC PRESENTATION AND CODING
Background
The Consolidated Federal Funds Report program callsfor reporting by state (and outlying area), county (orcounty equivalent), municipality, and congressional dis-trict. At the subcounty level, the term municipality indi-cates any subcounty unit of general local government. Forthis reason, the geographic basis for presentation in theConsolidated Federal Funds Report is the government clas-sification system developed by the Census Bureau in itsCensus of Governments program.This report presents data by state and county area. The
District of Columbia and the Outlying Areas of AmericanSamoa, Federated States of Micronesia, Guam, Republic ofthe Marshall Islands, Commonwealth of the Northern Mari-ana Islands, Republic of Palau, Commonwealth of PuertoRico, and the U.S. Virgin Islands are included. In additionto county areas, municipal governments that are indepen-dent of any organized county are included here as countyequivalent areas. Appendix A contains a listing of thesemunicipalities.
Government Units
According to the 1997 Census of Governments, therewere 87,504 government units in the United States(excluding outlying areas and Indian tribes). In addition tothe Federal Government and 50 state governments, therewere 87,453 local governments, distributed as follows:
County . . . . . . . . . . . . . . . . . . . . . . . . . . . . . . . . . 3,043Municipal. . . . . . . . . . . . . . . . . . . . . . . . . . . . . . . 19,372Township. . . . . . . . . . . . . . . . . . . . . . . . . . . . . . . 16,629School district. . . . . . . . . . . . . . . . . . . . . . . . . . 13,726Special district . . . . . . . . . . . . . . . . . . . . . . . . . 34,683
Exact definitions of government units are available inVolume 1, Number 1 of the 1997 Census of Governments,Government Organization. That publication describes thestructure and organization of state and local governmentsthroughout the Nation. The general local governmentsthat define the universe for this publication are those inexistence (active and incorporated) as of June 1997. Thiscount includes all known governments in the 50 statesand the District of Columbia, but excludes outlying areasand Indian tribes. All such governments are covered in theGovernments Integrated Directory, the Census Bureau’s fileof all active government units in the nation.The Consolidated Federal Funds Report contains data
by state, county, and subcounty area, making use of gov-ernment units to represent geographic areas. For statesand outlying areas, government jurisdictions have fixed,stable boundaries that correspond to well-defined geo-graphic areas. For county and subcounty governmentunits, however, there can be significant differencesbetween the concept of government unit and a specifiedgeographic area.Where county governments exist, they correspond to
generally accepted county geographic boundaries. How-ever, many areas of the United States lack county govern-ment. Organized county governments are not found inConnecticut and Rhode Island, as well as in some outlyingareas, and the District of Columbia. Numerous cities, suchas Baltimore, MD (which is not located within a countygovernment area), and San Francisco, CA (which is a con-solidated city/county government), also exist independentof any county government.County-equivalent areas are included in the Consoli-
dated Federal Funds Report as if they were legitimatecounties to ensure consistency in the geographic presenta-tion of the data. A complete listing of these areas can befound in Appendix A.It is important to note that the CFFR covers Federal
Government payments to all types of recipients—bothgovernment and other—located in the geographic areasover which these governments have jurisdiction. Forexample, the federal payments to the New York City areacould represent monies allocated to the city government,a private company located in the city, or a private citizenresiding in the city. No attempt is made in the CFFR to pro-vide information on the recipients (individually or by type)of federal money. For most programs, information onrecipients and recipient types (and other details) can befound in the FAADS.All funds received within a given municipality are
assigned to only one county, even when the municipality
xiv Consolidated Federal Funds Report for Fiscal Year 1999
U.S. Census Bureau
exists in more than one county. In most cases, the effectof this assignment on the statistical presentation of thedata is negligible. However, users should be aware of thistreatment, particularly if using data for one of these multi-county jurisdictions. The municipalities of over 50,000population, which exist in more than one county area, andtheir respective counties, are shown in Appendix D.The government structure of New York City deserves
special mention. Classified for census purposes as amunicipality, the city is actually comprised of five countyequivalent (borough) areas (Bronx, Kings, New York,Queens, and Richmond). None of these are presentedseparately in this report. New York City is presented as asingle county-equivalent area.
Congressional District Reporting
The congressional district or districts for each countyarea are displayed in Table 15 and the CFFR databases. Forthose places that have multiple districts, all such districtsare displayed. The congressional districts shown in thispublication represent the boundaries of the 106th Con-gress, in session as of January 1999.In those places with more than one congressional dis-
trict, dollar amounts are not reported separately for eachdistrict. The federal financial data in the reporting systems(data sources) used for the CFFR do not contain suchdetail, with the exception of selected data records of theFederal Assistance Award Data System.Several other aspects of the congressional district cod-
ing should be noted:
• For states with an at-large representative, the code ‘‘00’’is reported.
• For Outlying Areas with a nonvoting representative toCongress, the congressional district is reported as ‘‘98.’’
• Outlying Areas with no representatives have ‘‘99’’ for acongressional district code.
• To derive totals of all funds to any particular congres-sional district, amounts for all government units in thatdistrict would have to be aggregated.
• For counties and places that exist in more than one dis-trict, all congressional districts are reported.
The geographic reference file used in the CFFR is avail-able along with the CFFR data file, on CD-ROM. (To orderor obtain, see section below on Availability of Data.)
ESTIMATES FOR SUBSTATE GRANT DISTRIBUTIONS
Many federal grant programs involve a direct paymentto state governments, which are then responsible for pro-gram administration. Examples include: grants that are‘‘passed through’’ to local governments (such as blockgrant programs); grants, such as for highway construc-tion, in which the financial impact of federal funds is
spread out over all areas of the state; and grants or assis-tance programs such as Aid to Families with DependentChildren, which the state can administer but for which theultimate beneficiaries are found throughout the states.The CFFR contains data on the substate allocation of
funds for several major federal grant programs. To theextent possible, these data are allocated by county orcounty-equivalent area. Substate allocation figures forthese programs are available for some, but not all, of thestates and outlying areas. Appendix F contains detail, byprogram and state.The Department of Health and Human Services reports
the estimated county allocation on five grant programs ona quarterly basis to the Federal Assistance Award DataSystem (FAADS). These programs, their Catalog of FederalDomestic Assistance (CFDA) program numbers, and theirfiscal year 1999 funding are:
• Temporary Assistance for Needy Families(TANF)(93.558): $16.7 billion
• Aid to Families With Dependent Children (AFDC)(93.560): $130 million
• Child Support Enforcement (93.563): $2.5 billion
• State Survey and Certification of Health Care Providersand Suppliers (93.777): $326 million
• Medical Assistance (Medicaid) (93.778): $110.9 billion
For the Highway Planning and Construction program(CFDA number 20.205), the Transportation Departmentreports the actual place of performance (county area)where the funded project is located. If the project is inmore than one county area, each county is reported, alongwith its share of the funding. Funding for this grant pro-gram totaled $24.0 billion in fiscal year 1999.The substate allocations for funds for ten major pro-
grams are derived by the Census Bureau from a survey ofstate government agencies:
• Food Stamps (10.551): $15.9 billion
• National School Lunch Program (10.555): $6.2 billion
• Special Supplemental Nutrition Program for Women,Infants and Children (WIC) (10.557): $4.2 billion
• Nutrition Assistance for Puerto Rico (10.566): $1.2 bil-lion
• Job Training Partnership Act (17.250): $3.3 billion
• Special Education-Grants to States (84.027): $4.3 billion
• Rehabilitation Services—Vocational Rehabilitation Grantsto States (84.126): $2.2 billion
• Low-Income Home Energy Assistance (93.568): $1.3 bil-lion
• Social Services Block Grant (93.667): $1.9 billion
xvConsolidated Federal Funds Report for Fiscal Year 1999
U.S. Census Bureau
• Block Grants for Prevention and Treatment of SubstanceAbuse (93.959): $1.6 billion
The derived county allocations for the above ten pro-grams are based upon a Survey of State Government Pass-Through Expenditures, conducted by the Census Bureauduring fiscal year 1996. For each program, the administer-ing state agencies are asked to provide information on thecounty allocation of program funds within their state.Responses, where received, are used as the basis for pro-rating total program funding by state among the countyareas within each state. Total program funding for eachstate is reported by the administering federal agency tothe Federal Assistance Award Data System (FAADS).
Appendix F also includes one program for which countyarea allocations were derived using information suppliedby federal agencies directly to the CFFR:
• Title I Grants to Local Educational Agencies (84.010):$8.3 billion
Data for program 84.010 were derived from informa-tion supplied by the Education Department on the stateallocation for the 1998-99 school year and on the countyallocation for the 1997-98 school year.
AMOUNTS EXCLUDED FROM CFFR COVERAGE
Federal Government expenditures covered in the CFFRtotal $1.5 trillion for fiscal year 1999. This amount doesnot represent all Federal Government expenditures.Amounts excluded from the CFFR can be grouped into twogeneral categories-conceptual exclusions andagency/program omissions.
Federal expenditures excluded conceptually are thosethat could not be geographically distributed, all interna-tional transactions and foreign payments, and federal out-lay categories not covered by any of the reporting systemsthat served as data sources for the CFFR. The largest itemwas net interest on Federal Government debt, which wasestimated to be $230 billion in fiscal year 1999. The fiscalyear 1999 total outlays for the international affairs func-tion in the federal budget was estimated at $15 billion.
Expenditures for the Central Intelligence Agency, theDefense Intelligence Agency, and the National SecurityAgency are excluded from coverage.
The CFFR data are compiled by object categories of fed-eral expenditures. The reporting systems and federalagencies that serve as data sources exclude federal travelexpenditures, to the extent that they are not covered bycontractual agreements. No estimate of the magnitude ofthese expenditures is available.
For some agencies, data for selected object categoriescould not be obtained. These include the procurementactions of the judicial and legislative sectors of the FederalGovernment. Expenditures other than salaries and wages
are not available for the Federal Deposit Insurance Corpo-ration, National Credit Union Administration, and FederalSaving and Loans Insurance Corporation.
The federal budget outlays estimated for fiscal year1999 totaled $1.8 trillion. However, comparison of thefederal budget amount with data reported in the CFFR canbe misleading, since the federal budget amounts differfrom CFFR in accounting concepts and the treatment ofintragovernmental transfers. For example, outlays formany programs in the federal budget are reported on anet basis, whereas the CFFR reports gross outlays or obli-gations to nonfederal recipients.
AVAILABILITY OF DATA
Copies of the publication, Consolidated Federal FundsReport for Fiscal year 1999 (State and County Areas), areavailable from Customer Services, U.S. Census Bureau,Washington, DC 20233-0800; 301-457-4100. The publica-tion, Federal Aid to States for Fiscal Year 1999, also maybe purchased from Customer Services.
As indicated earlier, the CFFR data files are available onInternet and CD-ROM. The data available electronically aremore detailed than the summarized data presented in thepublished reports. Each record in the CFFR data file con-tains the following fields:
• Government unit (GU) code (state, type, county, unit)
• Program identification code (CFDA code or pseudo code)
• Object code
• Federal funding sign
• Federal funding amount
• Pass-through flag
• Federal Information Processing Standard (FIPS) locationcode (state, county, place)
• FIPS federal agency code
All appropriate documentation and data file descrip-tions are provided with each CFFR Internet or CD-ROM file.These accompanying files include program identificationand agency identification files.
Also available on the CD-ROM is an accompanying CFFRgeographic reference file. This file contains the names andCensus Bureau government unit (GU) codes for all state,county, municipal, and township units in the Nation. Inaddition, the file contains associated FIPS geographic loca-tion codes, the population, and the congressional districtsserving each government unit.
Users interested in obtaining CD-ROMs of the Consoli-dated Federal Funds Report data files should contact Cus-tomer Services, U.S. Census Bureau, Washington, DC
xvi Consolidated Federal Funds Report for Fiscal Year 1999
U.S. Census Bureau
20233-0800. Telephone 301-457-4100. Users also mayobtain a copy of this report and related data files via theCensus Bureau’s Internet site at http://www.census.gov/govs/www/cffr.html.The Consolidated Federal Funds Report also is being
made available to the public through the Census Bureau’sState Data Center Program. Through this program, theCensus Bureau provides participating state organizations(government agencies and university centers) with publi-cations, CD-ROM files, and general information assistance.The state organizations, in turn, provide data access ser-vices such as publication reference centers, inquiry han-dling and general assistance in data use. They also estab-lish affiliates in key locations around the states by placingbasic sets of census publications in local libraries, city andregional planning agencies and so forth.
Users may contact the State Data Centers (or affiliates)to determine if the Consolidated Federal Funds Reportpublication or the related CD-ROM data files are available,or to request further information about the data. A list ofthe State Data Center lead agencies may be found inAppendix E.
MEANING OF SYMBOLS
The symbols in the tables have the following meanings:
- Represents zero or rounds to zero.
(NA) Not available.
r Revised from amount published in prior year.
(X) Not applicable.
( ) Numbers in parentheses represent negative amounts.
xviiConsolidated Federal Funds Report for Fiscal Year 1999
U.S. Census Bureau
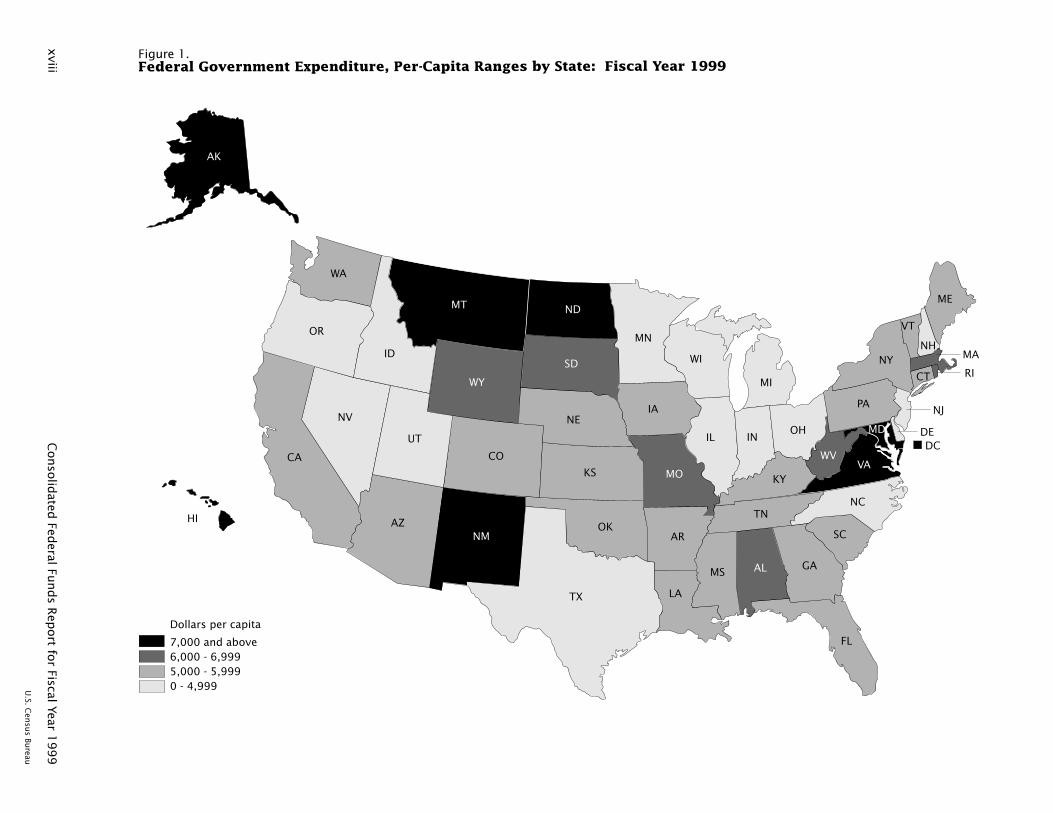
xviii
Figure 1.Federal Government Expenditure, Per-Capita Ranges by State: Fiscal Year 1999
ME
VT
NHNY
PA
CTMI
OHIN
WVVA
NC
SC
GA
FL
KY
TN
ALMS
WI
IL
LA
AR
MO
IA
MN
ND
SD
NE
KS
OK
TX
MT
WY
CO
NM
ID
UT
AZ
WA
OR
NV
CA
AK
MA
RI
NJ
DC
MD
7,000 and above6,000 - 6,9995,000 - 5,9990 - 4,999
DE
HI
Conso
lidated
Federal Fu
nds R
eport fo
r Fiscal Year 19
99
�
U.S. C
ensu
s Bureau
Dollars per capita
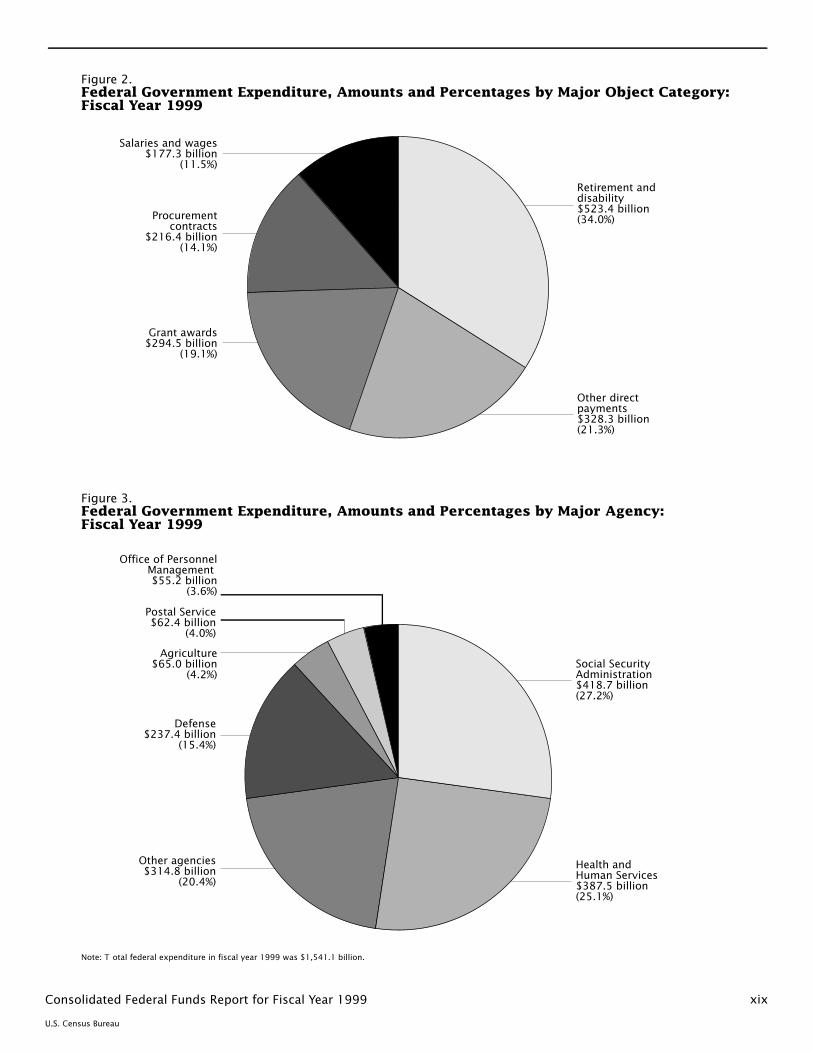
Figure 3.Federal Government Expenditure, Amounts and Percentages by Major Agency: Fiscal Year 1999
Other agencies$314.8 billion
(20.4%)
Social Security Administration$418.7 billion(27.2%)
Postal Service$62.4 billion
(4.0%)
Defense$237.4 billion
(15.4%)
Health andHuman Services$387.5 billion(25.1%)
xix
Figure 2.Federal Government Expenditure, Amounts and Percentages by Major Object Category: Fiscal Year 1999
Retirement and disability$523.4 billion(34.0%)
Other direct payments$328.3 billion(21.3%)
Salaries and wages$177.3 billion
(11.5%)
Procurement contracts
$216.4 billion(14.1%)
Grant awards$294.5 billion
(19.1%)
Agriculture$65.0 billion
(4.2%)
Office of Personnel Management $55.2 billion
(3.6%)
Consolidated Federal Funds Report for Fiscal Year 1999�
U.S. Census Bureau
Note:T otal federal expenditure in fiscal year 1999 was $1,541.1 billion.
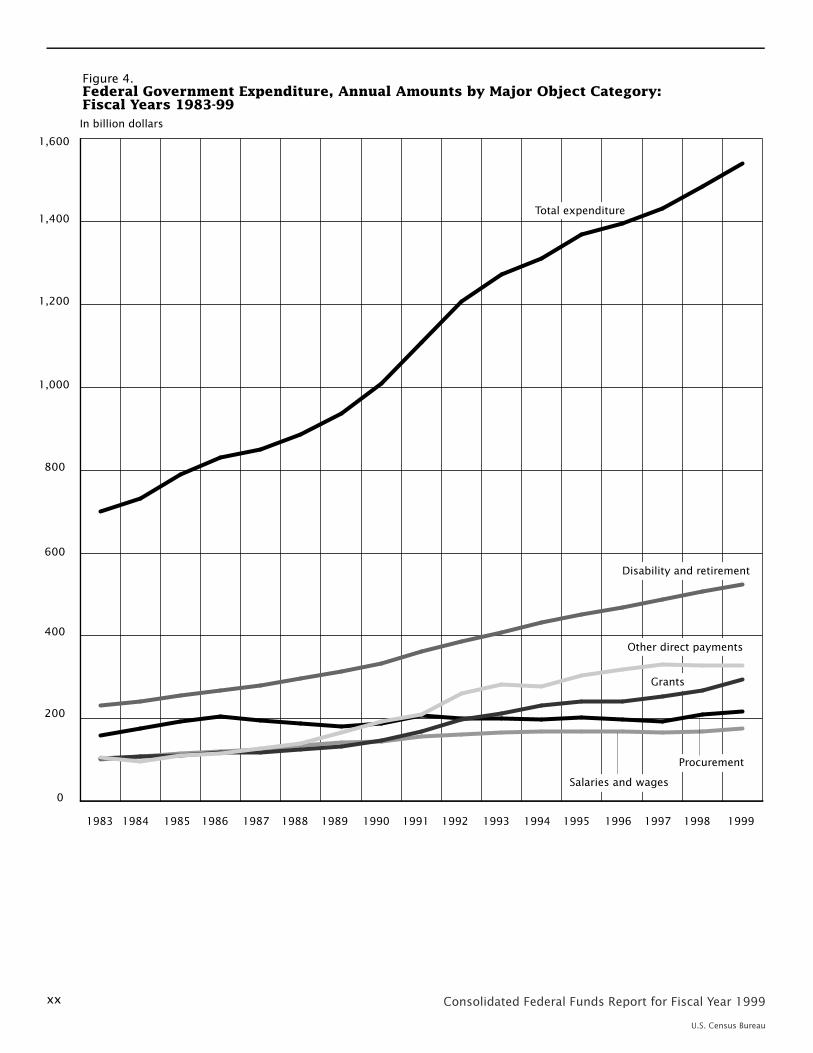
Figure 4.Federal Government Expenditure, Annual Amounts by Major Object Category: Fiscal Years 1983-99
Disability and retirement
Procurement
199719961995199419931992199119901989198819871986198519841983
Total expenditure
Other direct payments
Salaries and wages
xx
Grants
1998 1999
1,600
1,400
1,200
1,000
800
600
400
200
0
In billion dollars
Consolidated Federal Funds Report for Fiscal Year 1999�
U.S. Census Bureau
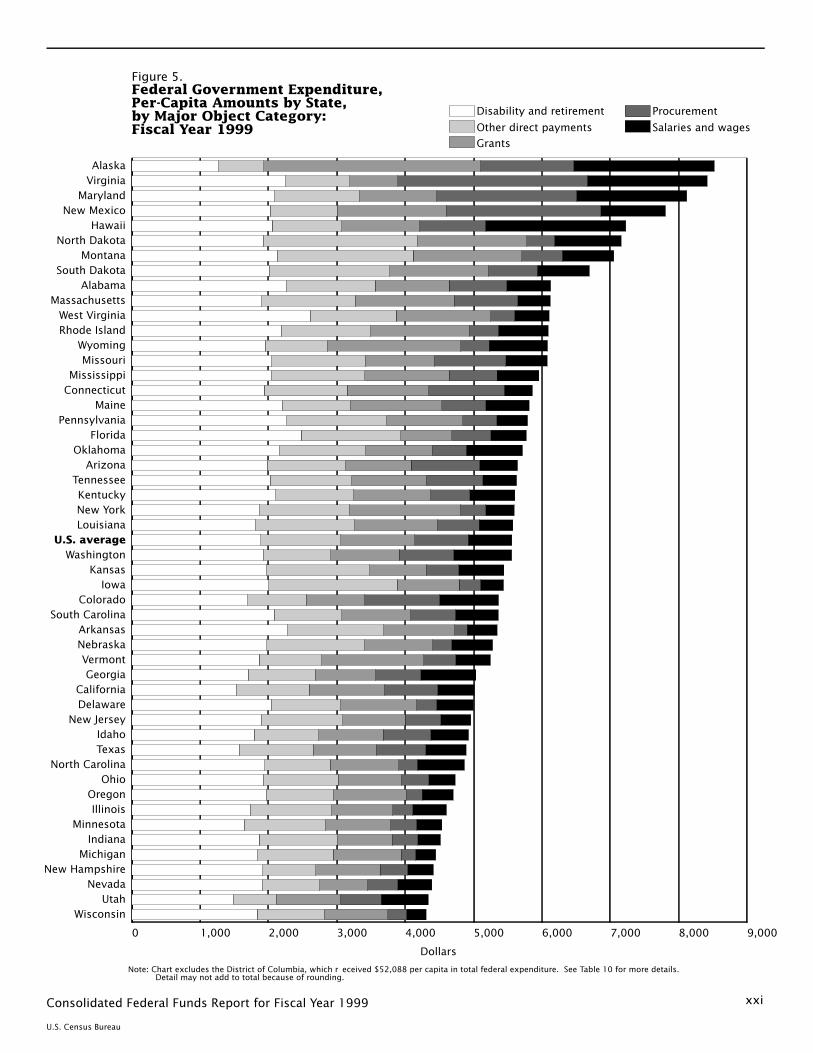
xxi
0 1,000 2,000 3,000 4,000 5,000 6,000 7,000 8,000 9,000
WisconsinUtah
NevadaNew Hampshire
MichiganIndiana
MinnesotaIllinois
OregonOhio
North CarolinaTexasIdaho
New JerseyDelawareCalifornia
GeorgiaVermont
NebraskaArkansas
South CarolinaColorado
IowaKansas
WashingtonU.S. average
LouisianaNew YorkKentucky
TennesseeArizona
OklahomaFlorida
PennsylvaniaMaine
ConnecticutMississippi
MissouriWyoming
Rhode IslandWest Virginia
MassachusettsAlabama
South DakotaMontana
North DakotaHawaii
New MexicoMaryland
VirginiaAlaska
Figure 5.Federal Government Expenditure, �Per-Capita Amounts by State, �by Major Object Category: �Fiscal Year 1999
Disability and retirement
Other direct payments
Grants
Procurement
Salaries and wages
Note:Chart excludes the District of Columbia, which r eceived $52,088 per capita in total federal expenditure. See Table 10 for more details. � Detail may not add to total because of rounding.
Dollars
Consolidated Federal Funds Report for Fiscal Year 1999�
U.S. Census Bureau
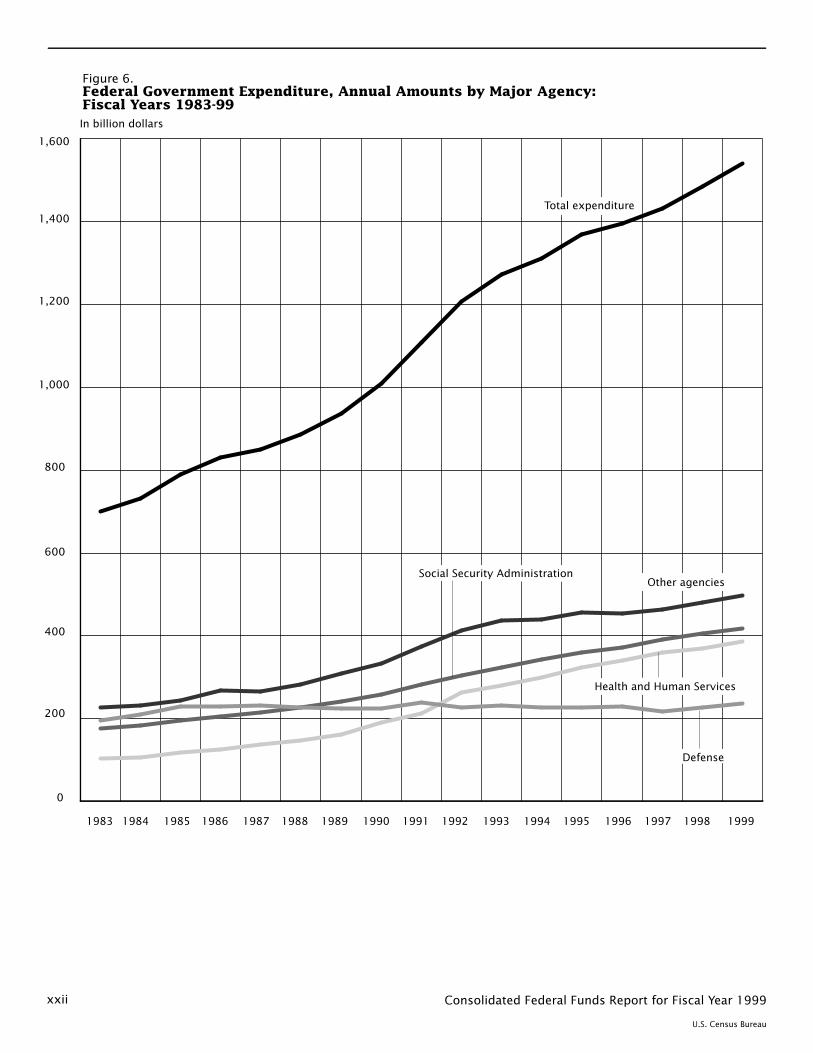
Figure 6.Federal Government Expenditure, Annual Amounts by Major Agency: Fiscal Years 1983-99
Social Security Administration
Defense
199719961995199419931992199119901989198819871986198519841983
Total expenditure
Other agencies
xxii
1998 1999
1,600
1,400
1,200
1,000
800
600
400
200
0
Health and Human Services
In billion dollars
Consolidated Federal Funds Report for Fiscal Year 1999�
U.S. Census Bureau
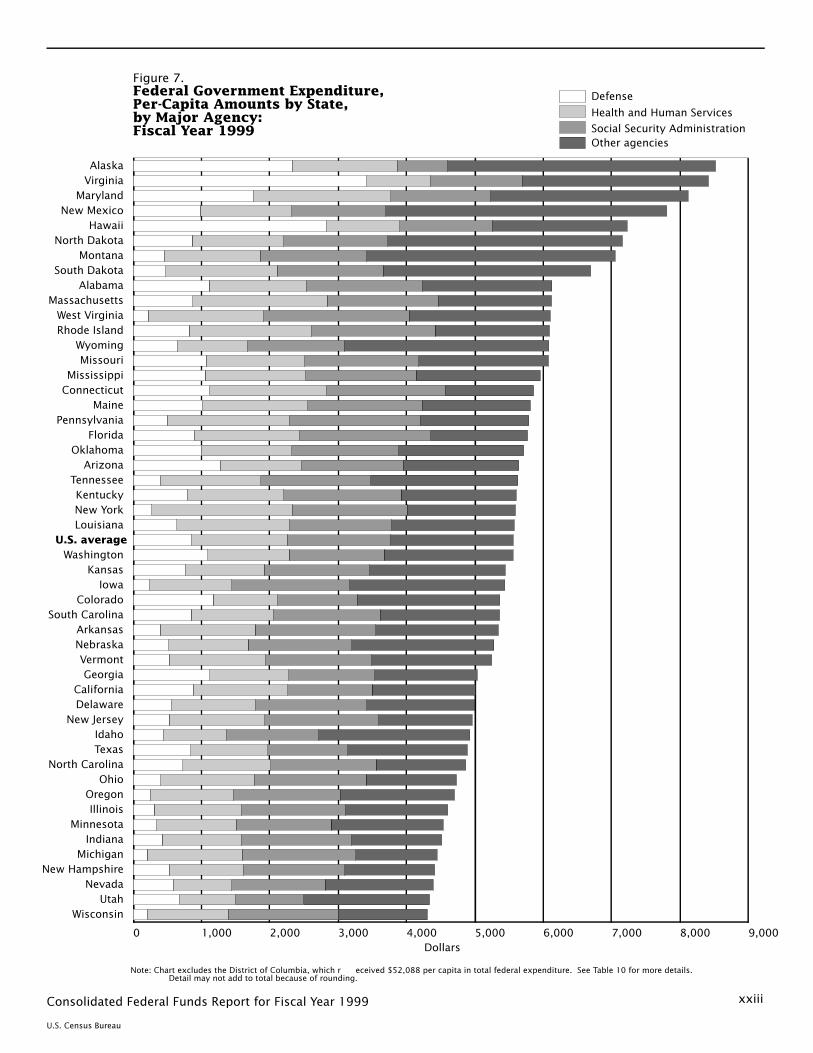
xxiii
0 1,000 2,000 3,000 4,000 5,000 6,000 7,000 8,000 9,000
Wisconsin Utah
Nevada New Hampshire
Michigan Indiana
Minnesota Illinois
Oregon Ohio
North Carolina Texas Idaho
New Jersey Delaware California
Georgia Vermont
Nebraska Arkansas
South Carolina Colorado
Iowa Kansas
Washington U.S. average
Louisiana New York Kentucky
Tennessee Arizona
Oklahoma Florida
Pennsylvania Maine
Connecticut Mississippi
Missouri Wyoming
Rhode Island West Virginia
Massachusetts Alabama
South Dakota Montana
North Dakota Hawaii
New Mexico Maryland
Virginia Alaska
Figure 7.Federal Government Expenditure, �Per-Capita Amounts by State, �by Major Agency: �Fiscal Year 1999
Defense
Health and Human Services
Social Security AdministrationOther agencies
Note:Chart excludes the District of Columbia, which r eceived $52,088 per capita in total federal expenditure. See Table 10 for more details. � Detail may not add to total because of rounding.
Dollars
Consolidated Federal Funds Report for Fiscal Year 1999�
U.S. Census Bureau
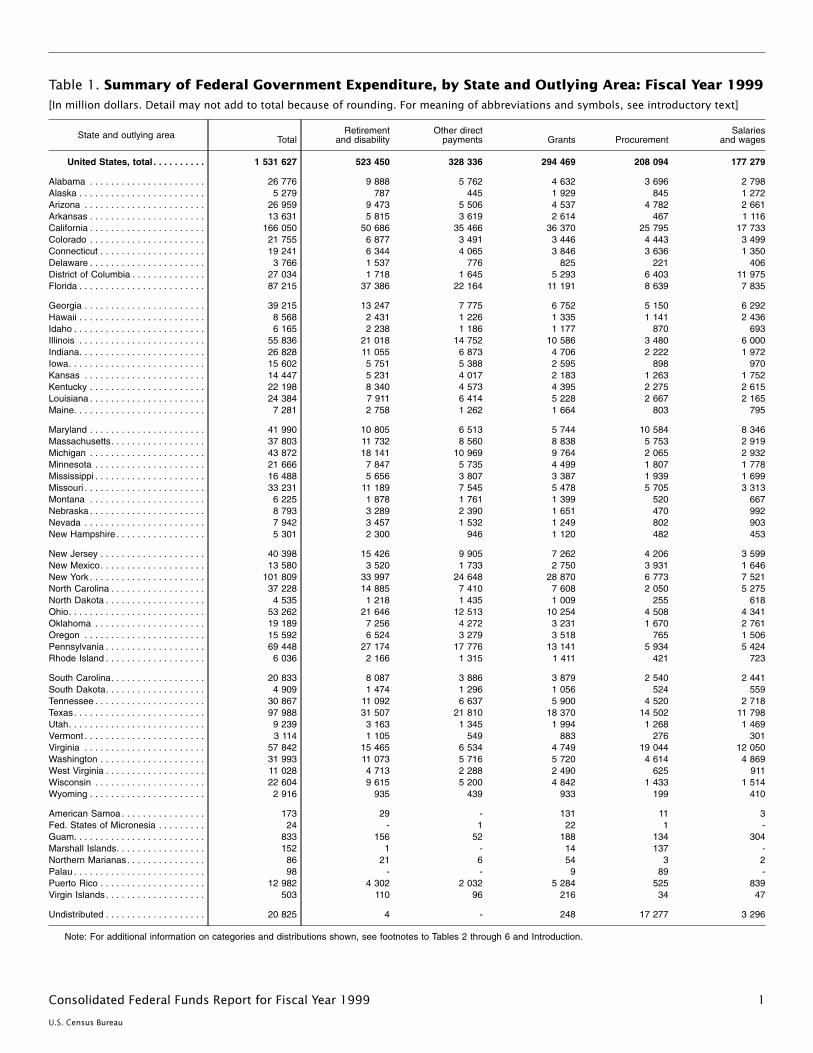
Table 1. Summary of Federal Government Expenditure, by State and Outlying Area: Fiscal Year 1999[In million dollars. Detail may not add to total because of rounding. For meaning of abbreviations and symbols, see introductory text]
State and outlying area TotalRetirement
and disabilityOther direct
payments Grants ProcurementSalaries
and wages
United States, total . . . . . . . . . . 1 531 627 523 450 328 336 294 469 208 094 177 279
Alabama . . . . . . . . . . . . . . . . . . . . . . 26 776 9 888 5 762 4 632 3 696 2 798Alaska . . . . . . . . . . . . . . . . . . . . . . . . 5 279 787 445 1 929 845 1 272Arizona . . . . . . . . . . . . . . . . . . . . . . . 26 959 9 473 5 506 4 537 4 782 2 661Arkansas . . . . . . . . . . . . . . . . . . . . . . 13 631 5 815 3 619 2 614 467 1 116California . . . . . . . . . . . . . . . . . . . . . . 166 050 50 686 35 466 36 370 25 795 17 733Colorado . . . . . . . . . . . . . . . . . . . . . . 21 755 6 877 3 491 3 446 4 443 3 499Connecticut . . . . . . . . . . . . . . . . . . . . 19 241 6 344 4 065 3 846 3 636 1 350Delaware . . . . . . . . . . . . . . . . . . . . . . 3 766 1 537 776 825 221 406District of Columbia . . . . . . . . . . . . . . 27 034 1 718 1 645 5 293 6 403 11 975Florida . . . . . . . . . . . . . . . . . . . . . . . . 87 215 37 386 22 164 11 191 8 639 7 835
Georgia . . . . . . . . . . . . . . . . . . . . . . . 39 215 13 247 7 775 6 752 5 150 6 292Hawaii . . . . . . . . . . . . . . . . . . . . . . . . 8 568 2 431 1 226 1 335 1 141 2 436Idaho . . . . . . . . . . . . . . . . . . . . . . . . . 6 165 2 238 1 186 1 177 870 693Illinois . . . . . . . . . . . . . . . . . . . . . . . . 55 836 21 018 14 752 10 586 3 480 6 000Indiana. . . . . . . . . . . . . . . . . . . . . . . . 26 828 11 055 6 873 4 706 2 222 1 972Iowa. . . . . . . . . . . . . . . . . . . . . . . . . . 15 602 5 751 5 388 2 595 898 970Kansas . . . . . . . . . . . . . . . . . . . . . . . 14 447 5 231 4 017 2 183 1 263 1 752Kentucky . . . . . . . . . . . . . . . . . . . . . . 22 198 8 340 4 573 4 395 2 275 2 615Louisiana . . . . . . . . . . . . . . . . . . . . . . 24 384 7 911 6 414 5 228 2 667 2 165Maine. . . . . . . . . . . . . . . . . . . . . . . . . 7 281 2 758 1 262 1 664 803 795
Maryland . . . . . . . . . . . . . . . . . . . . . . 41 990 10 805 6 513 5 744 10 584 8 346Massachusetts. . . . . . . . . . . . . . . . . . 37 803 11 732 8 560 8 838 5 753 2 919Michigan . . . . . . . . . . . . . . . . . . . . . . 43 872 18 141 10 969 9 764 2 065 2 932Minnesota . . . . . . . . . . . . . . . . . . . . . 21 666 7 847 5 735 4 499 1 807 1 778Mississippi . . . . . . . . . . . . . . . . . . . . . 16 488 5 656 3 807 3 387 1 939 1 699Missouri . . . . . . . . . . . . . . . . . . . . . . . 33 231 11 189 7 545 5 478 5 705 3 313Montana . . . . . . . . . . . . . . . . . . . . . . 6 225 1 878 1 761 1 399 520 667Nebraska . . . . . . . . . . . . . . . . . . . . . . 8 793 3 289 2 390 1 651 470 992Nevada . . . . . . . . . . . . . . . . . . . . . . . 7 942 3 457 1 532 1 249 802 903New Hampshire . . . . . . . . . . . . . . . . . 5 301 2 300 946 1 120 482 453
New Jersey . . . . . . . . . . . . . . . . . . . . 40 398 15 426 9 905 7 262 4 206 3 599New Mexico. . . . . . . . . . . . . . . . . . . . 13 580 3 520 1 733 2 750 3 931 1 646New York . . . . . . . . . . . . . . . . . . . . . . 101 809 33 997 24 648 28 870 6 773 7 521North Carolina . . . . . . . . . . . . . . . . . . 37 228 14 885 7 410 7 608 2 050 5 275North Dakota . . . . . . . . . . . . . . . . . . . 4 535 1 218 1 435 1 009 255 618Ohio. . . . . . . . . . . . . . . . . . . . . . . . . . 53 262 21 646 12 513 10 254 4 508 4 341Oklahoma . . . . . . . . . . . . . . . . . . . . . 19 189 7 256 4 272 3 231 1 670 2 761Oregon . . . . . . . . . . . . . . . . . . . . . . . 15 592 6 524 3 279 3 518 765 1 506Pennsylvania . . . . . . . . . . . . . . . . . . . 69 448 27 174 17 776 13 141 5 934 5 424Rhode Island . . . . . . . . . . . . . . . . . . . 6 036 2 166 1 315 1 411 421 723
South Carolina. . . . . . . . . . . . . . . . . . 20 833 8 087 3 886 3 879 2 540 2 441South Dakota. . . . . . . . . . . . . . . . . . . 4 909 1 474 1 296 1 056 524 559Tennessee . . . . . . . . . . . . . . . . . . . . . 30 867 11 092 6 637 5 900 4 520 2 718Texas. . . . . . . . . . . . . . . . . . . . . . . . . 97 988 31 507 21 810 18 370 14 502 11 798Utah. . . . . . . . . . . . . . . . . . . . . . . . . . 9 239 3 163 1 345 1 994 1 268 1 469Vermont . . . . . . . . . . . . . . . . . . . . . . . 3 114 1 105 549 883 276 301Virginia . . . . . . . . . . . . . . . . . . . . . . . 57 842 15 465 6 534 4 749 19 044 12 050Washington . . . . . . . . . . . . . . . . . . . . 31 993 11 073 5 716 5 720 4 614 4 869West Virginia . . . . . . . . . . . . . . . . . . . 11 028 4 713 2 288 2 490 625 911Wisconsin . . . . . . . . . . . . . . . . . . . . . 22 604 9 615 5 200 4 842 1 433 1 514Wyoming . . . . . . . . . . . . . . . . . . . . . . 2 916 935 439 933 199 410
American Samoa . . . . . . . . . . . . . . . . 173 29 - 131 11 3Fed. States of Micronesia . . . . . . . . . 24 - 1 22 1 -Guam. . . . . . . . . . . . . . . . . . . . . . . . . 833 156 52 188 134 304Marshall Islands. . . . . . . . . . . . . . . . . 152 1 - 14 137 -Northern Marianas. . . . . . . . . . . . . . . 86 21 6 54 3 2Palau . . . . . . . . . . . . . . . . . . . . . . . . . 98 - - 9 89 -Puerto Rico . . . . . . . . . . . . . . . . . . . . 12 982 4 302 2 032 5 284 525 839Virgin Islands. . . . . . . . . . . . . . . . . . . 503 110 96 216 34 47
Undistributed . . . . . . . . . . . . . . . . . . . 20 825 4 - 248 17 277 3 296
Note: For additional information on categories and distributions shown, see footnotes to Tables 2 through 6 and Introduction.
1Consolidated Federal Funds Report for Fiscal Year 1999
U.S. Census Bureau
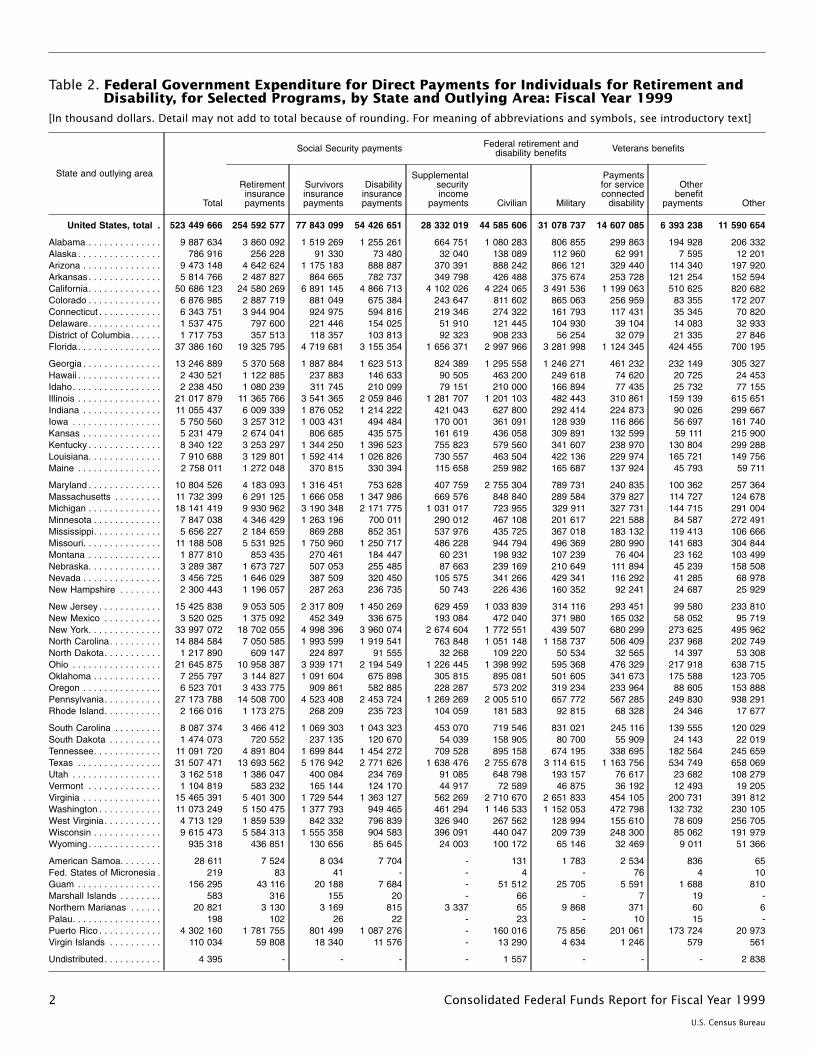
Table 2. Federal Government Expenditure for Direct Payments for Individuals for Retirement andDisability, for Selected Programs, by State and Outlying Area: Fiscal Year 1999
[In thousand dollars. Detail may not add to total because of rounding. For meaning of abbreviations and symbols, see introductory text]
State and outlying area
Total
Social Security payments Federal retirement anddisability benefits Veterans benefits
Other
Retirementinsurancepayments
Survivorsinsurancepayments
Disabilityinsurancepayments
Supplementalsecurityincome
payments Civilian Military
Paymentsfor serviceconnected
disability
Otherbenefit
payments
United States, total . 523 449 666 254 592 577 77 843 099 54 426 651 28 332 019 44 585 606 31 078 737 14 607 085 6 393 238 11 590 654
Alabama . . . . . . . . . . . . . . 9 887 634 3 860 092 1 519 269 1 255 261 664 751 1 080 283 806 855 299 863 194 928 206 332Alaska . . . . . . . . . . . . . . . . 786 916 256 228 91 330 73 480 32 040 138 089 112 960 62 991 7 595 12 201Arizona . . . . . . . . . . . . . . . 9 473 148 4 642 624 1 175 183 888 887 370 391 888 242 866 121 329 440 114 340 197 920Arkansas . . . . . . . . . . . . . . 5 814 766 2 487 827 864 665 782 737 349 798 426 488 375 674 253 728 121 254 152 594California. . . . . . . . . . . . . . 50 686 123 24 580 269 6 891 145 4 866 713 4 102 026 4 224 065 3 491 536 1 199 063 510 625 820 682Colorado . . . . . . . . . . . . . . 6 876 985 2 887 719 881 049 675 384 243 647 811 602 865 063 256 959 83 355 172 207Connecticut . . . . . . . . . . . . 6 343 751 3 944 904 924 975 594 816 219 346 274 322 161 793 117 431 35 345 70 820Delaware. . . . . . . . . . . . . . 1 537 475 797 600 221 446 154 025 51 910 121 445 104 930 39 104 14 083 32 933District of Columbia. . . . . . 1 717 753 357 513 118 357 103 813 92 323 908 233 56 254 32 079 21 335 27 846Florida. . . . . . . . . . . . . . . . 37 386 160 19 325 795 4 719 681 3 155 354 1 656 371 2 997 966 3 281 998 1 124 345 424 455 700 195
Georgia . . . . . . . . . . . . . . . 13 246 889 5 370 568 1 887 884 1 623 513 824 389 1 295 558 1 246 271 461 232 232 149 305 327Hawaii . . . . . . . . . . . . . . . . 2 430 521 1 122 885 237 883 146 633 90 505 463 200 249 618 74 620 20 725 24 453Idaho. . . . . . . . . . . . . . . . . 2 238 450 1 080 239 311 745 210 099 79 151 210 000 166 894 77 435 25 732 77 155Illinois . . . . . . . . . . . . . . . . 21 017 879 11 365 766 3 541 365 2 059 846 1 281 707 1 201 103 482 443 310 861 159 139 615 651Indiana . . . . . . . . . . . . . . . 11 055 437 6 009 339 1 876 052 1 214 222 421 043 627 800 292 414 224 873 90 026 299 667Iowa . . . . . . . . . . . . . . . . . 5 750 560 3 257 312 1 003 431 494 484 170 001 361 091 128 939 116 866 56 697 161 740Kansas . . . . . . . . . . . . . . . 5 231 479 2 674 041 806 685 435 575 161 619 436 058 309 891 132 599 59 111 215 900Kentucky . . . . . . . . . . . . . . 8 340 122 3 253 297 1 344 250 1 396 523 755 823 579 560 341 607 238 970 130 804 299 288Louisiana. . . . . . . . . . . . . . 7 910 688 3 129 801 1 592 414 1 026 826 730 557 463 504 422 136 229 974 165 721 149 756Maine . . . . . . . . . . . . . . . . 2 758 011 1 272 048 370 815 330 394 115 658 259 982 165 687 137 924 45 793 59 711
Maryland . . . . . . . . . . . . . . 10 804 526 4 183 093 1 316 451 753 628 407 759 2 755 304 789 731 240 835 100 362 257 364Massachusetts . . . . . . . . . 11 732 399 6 291 125 1 666 058 1 347 986 669 576 848 840 289 584 379 827 114 727 124 678Michigan . . . . . . . . . . . . . . 18 141 419 9 930 962 3 190 348 2 171 775 1 031 017 723 955 329 911 327 731 144 715 291 004Minnesota . . . . . . . . . . . . . 7 847 038 4 346 429 1 263 196 700 011 290 012 467 108 201 617 221 588 84 587 272 491Mississippi. . . . . . . . . . . . . 5 656 227 2 184 659 869 288 852 351 537 976 435 725 367 018 183 132 119 413 106 666Missouri. . . . . . . . . . . . . . . 11 188 508 5 531 925 1 750 960 1 250 717 486 228 944 794 496 369 280 990 141 683 304 844Montana . . . . . . . . . . . . . . 1 877 810 853 435 270 461 184 447 60 231 198 932 107 239 76 404 23 162 103 499Nebraska. . . . . . . . . . . . . . 3 289 387 1 673 727 507 053 255 485 87 663 239 169 210 649 111 894 45 239 158 508Nevada . . . . . . . . . . . . . . . 3 456 725 1 646 029 387 509 320 450 105 575 341 266 429 341 116 292 41 285 68 978New Hampshire . . . . . . . . 2 300 443 1 196 057 287 263 236 735 50 743 226 436 160 352 92 241 24 687 25 929
New Jersey . . . . . . . . . . . . 15 425 838 9 053 505 2 317 809 1 450 269 629 459 1 033 839 314 116 293 451 99 580 233 810New Mexico . . . . . . . . . . . 3 520 025 1 375 092 452 349 336 675 193 084 472 040 371 980 165 032 58 052 95 719New York. . . . . . . . . . . . . . 33 997 072 18 702 055 4 998 396 3 960 074 2 674 604 1 772 551 439 507 680 299 273 625 495 962North Carolina. . . . . . . . . . 14 884 584 7 050 585 1 993 599 1 919 541 763 848 1 051 148 1 158 737 506 409 237 968 202 749North Dakota. . . . . . . . . . . 1 217 890 609 147 224 897 91 555 32 268 109 220 50 534 32 565 14 397 53 308Ohio . . . . . . . . . . . . . . . . . 21 645 875 10 958 387 3 939 171 2 194 549 1 226 445 1 398 992 595 368 476 329 217 918 638 715Oklahoma . . . . . . . . . . . . . 7 255 797 3 144 827 1 091 604 675 898 305 815 895 081 501 605 341 673 175 588 123 705Oregon . . . . . . . . . . . . . . . 6 523 701 3 433 775 909 861 582 885 228 287 573 202 319 234 233 964 88 605 153 888Pennsylvania. . . . . . . . . . . 27 173 788 14 508 700 4 523 408 2 453 724 1 269 269 2 005 510 657 772 567 285 249 830 938 291Rhode Island. . . . . . . . . . . 2 166 016 1 173 275 268 209 235 723 104 059 181 583 92 815 68 328 24 346 17 677
South Carolina . . . . . . . . . 8 087 374 3 466 412 1 069 303 1 043 323 453 070 719 546 831 021 245 116 139 555 120 029South Dakota . . . . . . . . . . 1 474 073 720 552 237 135 120 670 54 039 158 905 80 700 55 909 24 143 22 019Tennessee. . . . . . . . . . . . . 11 091 720 4 891 804 1 699 844 1 454 272 709 528 895 158 674 195 338 695 182 564 245 659Texas . . . . . . . . . . . . . . . . 31 507 471 13 693 562 5 176 942 2 771 626 1 638 476 2 755 678 3 114 615 1 163 756 534 749 658 069Utah . . . . . . . . . . . . . . . . . 3 162 518 1 386 047 400 084 234 769 91 085 648 798 193 157 76 617 23 682 108 279Vermont . . . . . . . . . . . . . . 1 104 819 583 232 165 144 124 170 44 917 72 589 46 875 36 192 12 493 19 205Virginia . . . . . . . . . . . . . . . 15 465 391 5 401 300 1 729 544 1 363 127 562 269 2 710 670 2 651 833 454 105 200 731 391 812Washington . . . . . . . . . . . . 11 073 249 5 150 475 1 377 793 949 465 461 294 1 146 533 1 152 053 472 798 132 732 230 105West Virginia. . . . . . . . . . . 4 713 129 1 859 539 842 332 796 839 326 940 267 562 128 994 155 610 78 609 256 705Wisconsin . . . . . . . . . . . . . 9 615 473 5 584 313 1 555 358 904 583 396 091 440 047 209 739 248 300 85 062 191 979Wyoming . . . . . . . . . . . . . . 935 318 436 851 130 656 85 645 24 003 100 172 65 146 32 469 9 011 51 366
American Samoa. . . . . . . . 28 611 7 524 8 034 7 704 - 131 1 783 2 534 836 65Fed. States of Micronesia . 219 83 41 - - 4 - 76 4 10Guam . . . . . . . . . . . . . . . . 156 295 43 116 20 188 7 684 - 51 512 25 705 5 591 1 688 810Marshall Islands . . . . . . . . 583 316 155 20 - 66 - 7 19 -Northern Marianas . . . . . . 20 821 3 130 3 169 815 3 337 65 9 868 371 60 6Palau. . . . . . . . . . . . . . . . . 198 102 26 22 - 23 - 10 15 -Puerto Rico . . . . . . . . . . . . 4 302 160 1 781 755 801 499 1 087 276 - 160 016 75 856 201 061 173 724 20 973Virgin Islands . . . . . . . . . . 110 034 59 808 18 340 11 576 - 13 290 4 634 1 246 579 561
Undistributed . . . . . . . . . . . 4 395 - - - - 1 557 - - - 2 838
2 Consolidated Federal Funds Report for Fiscal Year 1999
U.S. Census Bureau
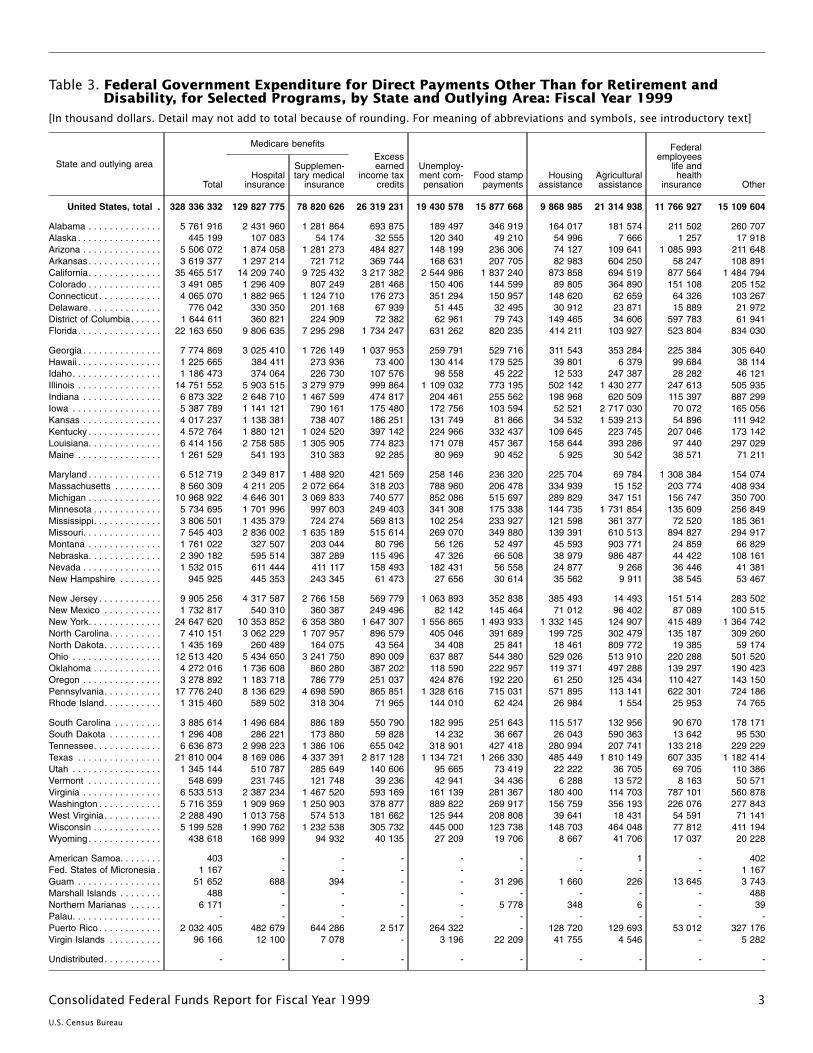
Table 3. Federal Government Expenditure for Direct Payments Other Than for Retirement andDisability, for Selected Programs, by State and Outlying Area: Fiscal Year 1999
[In thousand dollars. Detail may not add to total because of rounding. For meaning of abbreviations and symbols, see introductory text]
State and outlying area
Total
Medicare benefitsExcessearned
income taxcredits
Unemploy-ment com-pensation
Food stamppayments
Housingassistance
Agriculturalassistance
Federalemployees
life andhealth
insurance OtherHospital
insurance
Supplemen-tary medical
insurance
United States, total . 328 336 332 129 827 775 78 820 626 26 319 231 19 430 578 15 877 668 9 868 985 21 314 938 11 766 927 15 109 604
Alabama . . . . . . . . . . . . . . 5 761 916 2 431 960 1 281 864 693 875 189 497 346 919 164 017 181 574 211 502 260 707Alaska . . . . . . . . . . . . . . . . 445 199 107 083 54 174 32 555 120 340 49 210 54 996 7 666 1 257 17 918Arizona . . . . . . . . . . . . . . . 5 506 072 1 874 058 1 281 273 484 827 148 199 236 306 74 127 109 641 1 085 993 211 648Arkansas . . . . . . . . . . . . . . 3 619 377 1 297 214 721 712 369 744 168 631 207 705 82 983 604 250 58 247 108 891California. . . . . . . . . . . . . . 35 465 517 14 209 740 9 725 432 3 217 382 2 544 986 1 837 240 873 858 694 519 877 564 1 484 794Colorado . . . . . . . . . . . . . . 3 491 085 1 296 409 807 249 281 468 150 406 144 599 89 805 364 890 151 108 205 152Connecticut . . . . . . . . . . . . 4 065 070 1 882 965 1 124 710 176 273 351 294 150 957 148 620 62 659 64 326 103 267Delaware. . . . . . . . . . . . . . 776 042 330 350 201 168 67 939 51 445 32 495 30 912 23 871 15 889 21 972District of Columbia. . . . . . 1 644 611 360 821 224 909 72 382 62 961 79 743 149 465 34 606 597 783 61 941Florida. . . . . . . . . . . . . . . . 22 163 650 9 806 635 7 295 298 1 734 247 631 262 820 235 414 211 103 927 523 804 834 030
Georgia . . . . . . . . . . . . . . . 7 774 869 3 025 410 1 726 149 1 037 953 259 791 529 716 311 543 353 284 225 384 305 640Hawaii . . . . . . . . . . . . . . . . 1 225 665 384 411 273 936 73 400 130 414 179 525 39 801 6 379 99 684 38 114Idaho. . . . . . . . . . . . . . . . . 1 186 473 374 064 226 730 107 576 98 558 45 222 12 533 247 387 28 282 46 121Illinois . . . . . . . . . . . . . . . . 14 751 552 5 903 515 3 279 979 999 864 1 109 032 773 195 502 142 1 430 277 247 613 505 935Indiana . . . . . . . . . . . . . . . 6 873 322 2 648 710 1 467 599 474 817 204 461 255 562 198 968 620 509 115 397 887 299Iowa . . . . . . . . . . . . . . . . . 5 387 789 1 141 121 790 161 175 480 172 756 103 594 52 521 2 717 030 70 072 165 056Kansas . . . . . . . . . . . . . . . 4 017 237 1 138 381 738 407 186 251 131 749 81 866 34 532 1 539 213 54 896 111 942Kentucky . . . . . . . . . . . . . . 4 572 764 1 880 121 1 024 520 397 142 224 966 332 437 109 645 223 745 207 046 173 142Louisiana. . . . . . . . . . . . . . 6 414 156 2 758 585 1 305 905 774 823 171 078 457 367 158 644 393 286 97 440 297 029Maine . . . . . . . . . . . . . . . . 1 261 529 541 193 310 383 92 285 80 969 90 452 5 925 30 542 38 571 71 211
Maryland . . . . . . . . . . . . . . 6 512 719 2 349 817 1 488 920 421 569 258 146 236 320 225 704 69 784 1 308 384 154 074Massachusetts . . . . . . . . . 8 560 309 4 211 205 2 072 664 318 203 788 960 206 478 334 939 15 152 203 774 408 934Michigan . . . . . . . . . . . . . . 10 968 922 4 646 301 3 069 833 740 577 852 086 515 697 289 829 347 151 156 747 350 700Minnesota . . . . . . . . . . . . . 5 734 695 1 701 996 997 603 249 403 341 308 175 338 144 735 1 731 854 135 609 256 849Mississippi. . . . . . . . . . . . . 3 806 501 1 435 379 724 274 569 813 102 254 233 927 121 598 361 377 72 520 185 361Missouri. . . . . . . . . . . . . . . 7 545 403 2 836 002 1 635 189 515 614 269 070 349 880 139 391 610 513 894 827 294 917Montana . . . . . . . . . . . . . . 1 761 022 327 507 203 044 80 796 56 126 52 497 45 593 903 771 24 859 66 829Nebraska. . . . . . . . . . . . . . 2 390 182 595 514 387 289 115 496 47 326 66 508 38 979 986 487 44 422 108 161Nevada . . . . . . . . . . . . . . . 1 532 015 611 444 411 117 158 493 182 431 56 558 24 877 9 268 36 446 41 381New Hampshire . . . . . . . . 945 925 445 353 243 345 61 473 27 656 30 614 35 562 9 911 38 545 53 467
New Jersey . . . . . . . . . . . . 9 905 256 4 317 587 2 766 158 569 779 1 063 893 352 838 385 493 14 493 151 514 283 502New Mexico . . . . . . . . . . . 1 732 817 540 310 360 387 249 496 82 142 145 464 71 012 96 402 87 089 100 515New York. . . . . . . . . . . . . . 24 647 620 10 353 852 6 358 380 1 647 307 1 556 865 1 493 933 1 332 145 124 907 415 489 1 364 742North Carolina. . . . . . . . . . 7 410 151 3 062 229 1 707 957 896 579 405 046 391 689 199 725 302 479 135 187 309 260North Dakota. . . . . . . . . . . 1 435 169 260 489 164 075 43 564 34 408 25 841 18 461 809 772 19 385 59 174Ohio . . . . . . . . . . . . . . . . . 12 513 420 5 434 650 3 241 750 890 009 637 887 544 380 529 026 513 910 220 288 501 520Oklahoma . . . . . . . . . . . . . 4 272 016 1 736 608 860 280 387 202 118 590 222 957 119 371 497 288 139 297 190 423Oregon . . . . . . . . . . . . . . . 3 278 892 1 183 718 786 779 251 037 424 876 192 220 61 250 125 434 110 427 143 150Pennsylvania. . . . . . . . . . . 17 776 240 8 136 629 4 698 590 865 851 1 328 616 715 031 571 895 113 141 622 301 724 186Rhode Island. . . . . . . . . . . 1 315 460 589 502 318 304 71 965 144 010 62 424 26 984 1 554 25 953 74 765
South Carolina . . . . . . . . . 3 885 614 1 496 684 886 189 550 790 182 995 251 643 115 517 132 956 90 670 178 171South Dakota . . . . . . . . . . 1 296 408 286 221 173 880 59 828 14 232 36 667 26 043 590 363 13 642 95 530Tennessee. . . . . . . . . . . . . 6 636 873 2 998 223 1 386 106 655 042 318 901 427 418 280 994 207 741 133 218 229 229Texas . . . . . . . . . . . . . . . . 21 810 004 8 169 086 4 337 391 2 817 128 1 134 721 1 266 330 485 449 1 810 149 607 335 1 182 414Utah . . . . . . . . . . . . . . . . . 1 345 144 510 787 285 649 140 606 95 665 73 419 22 222 36 705 69 705 110 386Vermont . . . . . . . . . . . . . . 548 699 231 745 121 748 39 236 42 941 34 436 6 288 13 572 8 163 50 571Virginia . . . . . . . . . . . . . . . 6 533 513 2 387 234 1 467 520 593 169 161 139 281 367 180 400 114 703 787 101 560 878Washington . . . . . . . . . . . . 5 716 359 1 909 969 1 250 903 378 877 889 822 269 917 156 759 356 193 226 076 277 843West Virginia. . . . . . . . . . . 2 288 490 1 013 758 574 513 181 662 125 944 208 808 39 641 18 431 54 591 71 141Wisconsin . . . . . . . . . . . . . 5 199 528 1 990 762 1 232 538 305 732 445 000 123 738 148 703 464 048 77 812 411 194Wyoming . . . . . . . . . . . . . . 438 618 168 999 94 932 40 135 27 209 19 706 8 667 41 706 17 037 20 228
American Samoa. . . . . . . . 403 - - - - - - 1 - 402Fed. States of Micronesia . 1 167 - - - - - - - - 1 167Guam . . . . . . . . . . . . . . . . 51 652 688 394 - - 31 296 1 660 226 13 645 3 743Marshall Islands . . . . . . . . 488 - - - - - - - - 488Northern Marianas . . . . . . 6 171 - - - - 5 778 348 6 - 39Palau. . . . . . . . . . . . . . . . . - - - - - - - - - -Puerto Rico . . . . . . . . . . . . 2 032 405 482 679 644 286 2 517 264 322 - 128 720 129 693 53 012 327 176Virgin Islands . . . . . . . . . . 96 166 12 100 7 078 - 3 196 22 209 41 755 4 546 - 5 282
Undistributed . . . . . . . . . . . - - - - - - - - - -
3Consolidated Federal Funds Report for Fiscal Year 1999
U.S. Census Bureau
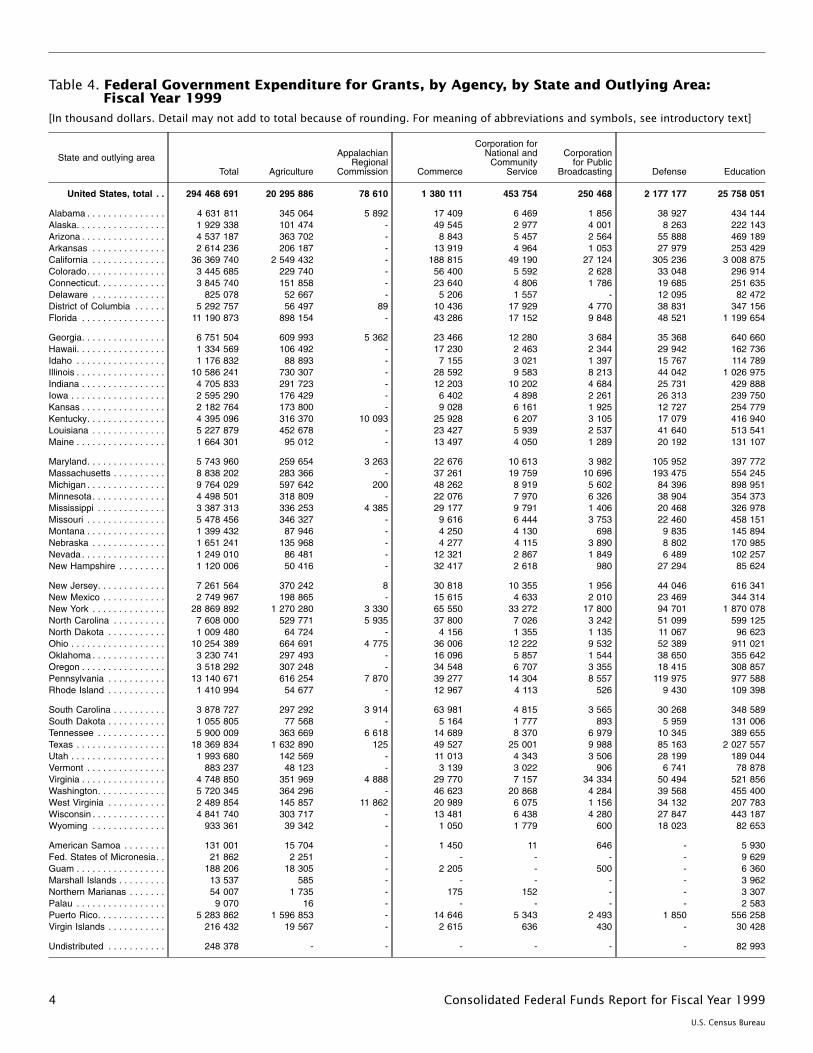
Table 4. Federal Government Expenditure for Grants, by Agency, by State and Outlying Area:Fiscal Year 1999
[In thousand dollars. Detail may not add to total because of rounding. For meaning of abbreviations and symbols, see introductory text]
State and outlying area
Total Agriculture
AppalachianRegional
Commission Commerce
Corporation forNational and
CommunityService
Corporationfor Public
Broadcasting Defense Education
United States, total . . 294 468 691 20 295 886 78 610 1 380 111 453 754 250 468 2 177 177 25 758 051
Alabama . . . . . . . . . . . . . . . 4 631 811 345 064 5 892 17 409 6 469 1 856 38 927 434 144Alaska. . . . . . . . . . . . . . . . . 1 929 338 101 474 - 49 545 2 977 4 001 8 263 222 143Arizona . . . . . . . . . . . . . . . . 4 537 187 363 702 - 8 843 5 457 2 564 55 888 469 189Arkansas . . . . . . . . . . . . . . 2 614 236 206 187 - 13 919 4 964 1 053 27 979 253 429California . . . . . . . . . . . . . . 36 369 740 2 549 432 - 188 815 49 190 27 124 305 236 3 008 875Colorado. . . . . . . . . . . . . . . 3 445 685 229 740 - 56 400 5 592 2 628 33 048 296 914Connecticut. . . . . . . . . . . . . 3 845 740 151 858 - 23 640 4 806 1 786 19 685 251 635Delaware . . . . . . . . . . . . . . 825 078 52 667 - 5 206 1 557 - 12 095 82 472District of Columbia . . . . . . 5 292 757 56 497 89 10 436 17 929 4 770 38 831 347 156Florida . . . . . . . . . . . . . . . . 11 190 873 898 154 - 43 286 17 152 9 848 48 521 1 199 654
Georgia. . . . . . . . . . . . . . . . 6 751 504 609 993 5 362 23 466 12 280 3 684 35 368 640 660Hawaii. . . . . . . . . . . . . . . . . 1 334 569 106 492 - 17 230 2 463 2 344 29 942 162 736Idaho . . . . . . . . . . . . . . . . . 1 176 832 88 893 - 7 155 3 021 1 397 15 767 114 789Illinois . . . . . . . . . . . . . . . . . 10 586 241 730 307 - 28 592 9 583 8 213 44 042 1 026 975Indiana . . . . . . . . . . . . . . . . 4 705 833 291 723 - 12 203 10 202 4 684 25 731 429 888Iowa . . . . . . . . . . . . . . . . . . 2 595 290 176 429 - 6 402 4 898 2 261 26 313 239 750Kansas . . . . . . . . . . . . . . . . 2 182 764 173 800 - 9 028 6 161 1 925 12 727 254 779Kentucky. . . . . . . . . . . . . . . 4 395 096 316 370 10 093 25 928 6 207 3 105 17 079 416 940Louisiana . . . . . . . . . . . . . . 5 227 879 452 678 - 23 427 5 939 2 537 41 640 513 541Maine . . . . . . . . . . . . . . . . . 1 664 301 95 012 - 13 497 4 050 1 289 20 192 131 107
Maryland. . . . . . . . . . . . . . . 5 743 960 259 654 3 263 22 676 10 613 3 982 105 952 397 772Massachusetts . . . . . . . . . . 8 838 202 283 366 - 37 261 19 759 10 696 193 475 554 245Michigan . . . . . . . . . . . . . . . 9 764 029 597 642 200 48 262 8 919 5 602 84 396 898 951Minnesota. . . . . . . . . . . . . . 4 498 501 318 809 - 22 076 7 970 6 326 38 904 354 373Mississippi . . . . . . . . . . . . . 3 387 313 336 253 4 385 29 177 9 791 1 406 20 468 326 978Missouri . . . . . . . . . . . . . . . 5 478 456 346 327 - 9 616 6 444 3 753 22 460 458 151Montana . . . . . . . . . . . . . . . 1 399 432 87 946 - 4 250 4 130 698 9 835 145 894Nebraska . . . . . . . . . . . . . . 1 651 241 135 968 - 4 277 4 115 3 890 8 802 170 985Nevada . . . . . . . . . . . . . . . . 1 249 010 86 481 - 12 321 2 867 1 849 6 489 102 257New Hampshire . . . . . . . . . 1 120 006 50 416 - 32 417 2 618 980 27 294 85 624
New Jersey. . . . . . . . . . . . . 7 261 564 370 242 8 30 818 10 355 1 956 44 046 616 341New Mexico . . . . . . . . . . . . 2 749 967 198 865 - 15 615 4 633 2 010 23 469 344 314New York . . . . . . . . . . . . . . 28 869 892 1 270 280 3 330 65 550 33 272 17 800 94 701 1 870 078North Carolina . . . . . . . . . . 7 608 000 529 771 5 935 37 800 7 026 3 242 51 099 599 125North Dakota . . . . . . . . . . . 1 009 480 64 724 - 4 156 1 355 1 135 11 067 96 623Ohio . . . . . . . . . . . . . . . . . . 10 254 389 664 691 4 775 36 006 12 222 9 532 52 389 911 021Oklahoma . . . . . . . . . . . . . . 3 230 741 297 493 - 16 096 5 857 1 544 38 650 355 642Oregon . . . . . . . . . . . . . . . . 3 518 292 307 248 - 34 548 6 707 3 355 18 415 308 857Pennsylvania . . . . . . . . . . . 13 140 671 616 254 7 870 39 277 14 304 8 557 119 975 977 588Rhode Island . . . . . . . . . . . 1 410 994 54 677 - 12 967 4 113 526 9 430 109 398
South Carolina . . . . . . . . . . 3 878 727 297 292 3 914 63 981 4 815 3 565 30 268 348 589South Dakota . . . . . . . . . . . 1 055 805 77 568 - 5 164 1 777 893 5 959 131 006Tennessee . . . . . . . . . . . . . 5 900 009 363 669 6 618 14 689 8 370 6 979 10 345 389 655Texas . . . . . . . . . . . . . . . . . 18 369 834 1 632 890 125 49 527 25 001 9 988 85 163 2 027 557Utah . . . . . . . . . . . . . . . . . . 1 993 680 142 569 - 11 013 4 343 3 506 28 199 189 044Vermont . . . . . . . . . . . . . . . 883 237 48 123 - 3 139 3 022 906 6 741 78 878Virginia . . . . . . . . . . . . . . . . 4 748 850 351 969 4 888 29 770 7 157 34 334 50 494 521 856Washington. . . . . . . . . . . . . 5 720 345 364 296 - 46 623 20 868 4 284 39 568 455 400West Virginia . . . . . . . . . . . 2 489 854 145 857 11 862 20 989 6 075 1 156 34 132 207 783Wisconsin . . . . . . . . . . . . . . 4 841 740 303 717 - 13 481 6 438 4 280 27 847 443 187Wyoming . . . . . . . . . . . . . . 933 361 39 342 - 1 050 1 779 600 18 023 82 653
American Samoa . . . . . . . . 131 001 15 704 - 1 450 11 646 - 5 930Fed. States of Micronesia. . 21 862 2 251 - - - - - 9 629Guam . . . . . . . . . . . . . . . . . 188 206 18 305 - 2 205 - 500 - 6 360Marshall Islands . . . . . . . . . 13 537 585 - - - - - 3 962Northern Marianas . . . . . . . 54 007 1 735 - 175 152 - - 3 307Palau . . . . . . . . . . . . . . . . . 9 070 16 - - - - - 2 583Puerto Rico. . . . . . . . . . . . . 5 283 862 1 596 853 - 14 646 5 343 2 493 1 850 556 258Virgin Islands . . . . . . . . . . . 216 432 19 567 - 2 615 636 430 - 30 428
Undistributed . . . . . . . . . . . 248 378 - - - - - - 82 993
4 Consolidated Federal Funds Report for Fiscal Year 1999
U.S. Census Bureau
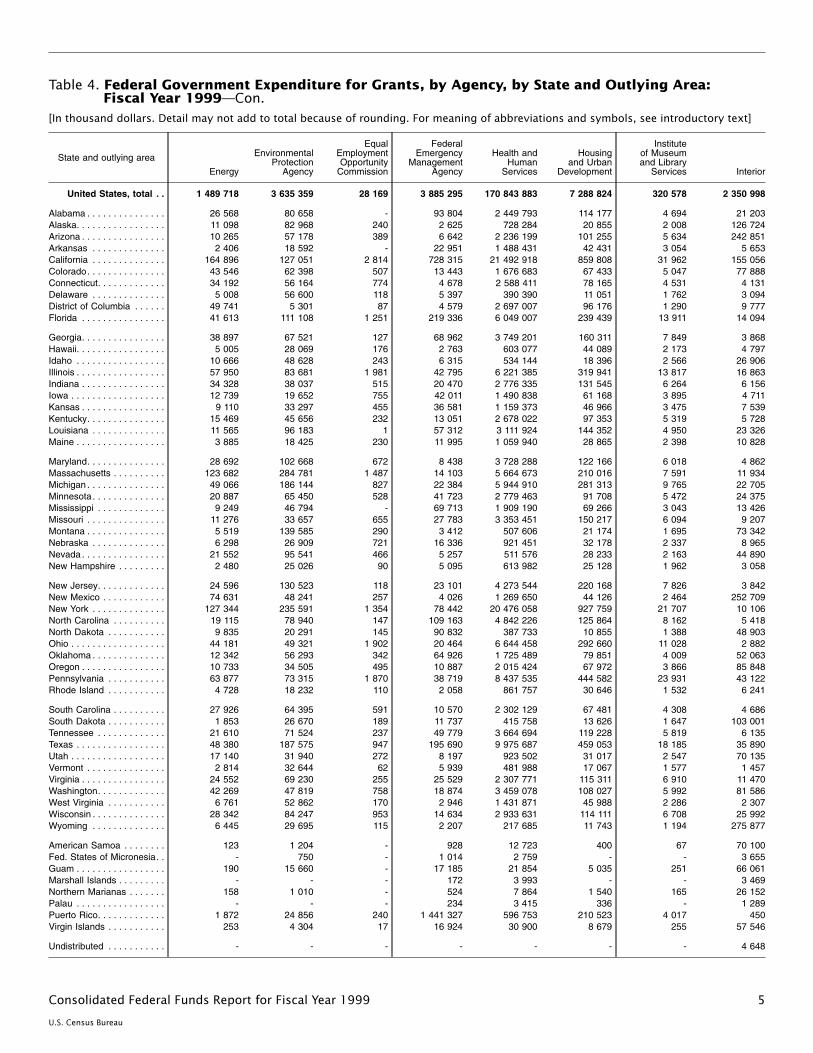
Table 4. Federal Government Expenditure for Grants, by Agency, by State and Outlying Area:Fiscal Year 1999—Con.
[In thousand dollars. Detail may not add to total because of rounding. For meaning of abbreviations and symbols, see introductory text]
State and outlying area
Energy
EnvironmentalProtection
Agency
EqualEmploymentOpportunity
Commission
FederalEmergency
ManagementAgency
Health andHuman
Services
Housingand Urban
Development
Instituteof Museumand Library
Services Interior
United States, total . . 1 489 718 3 635 359 28 169 3 885 295 170 843 883 7 288 824 320 578 2 350 998
Alabama . . . . . . . . . . . . . . . 26 568 80 658 - 93 804 2 449 793 114 177 4 694 21 203Alaska. . . . . . . . . . . . . . . . . 11 098 82 968 240 2 625 728 284 20 855 2 008 126 724Arizona . . . . . . . . . . . . . . . . 10 265 57 178 389 6 642 2 236 199 101 255 5 634 242 851Arkansas . . . . . . . . . . . . . . 2 406 18 592 - 22 951 1 488 431 42 431 3 054 5 653California . . . . . . . . . . . . . . 164 896 127 051 2 814 728 315 21 492 918 859 808 31 962 155 056Colorado. . . . . . . . . . . . . . . 43 546 62 398 507 13 443 1 676 683 67 433 5 047 77 888Connecticut. . . . . . . . . . . . . 34 192 56 164 774 4 678 2 588 411 78 165 4 531 4 131Delaware . . . . . . . . . . . . . . 5 008 56 600 118 5 397 390 390 11 051 1 762 3 094District of Columbia . . . . . . 49 741 5 301 87 4 579 2 697 007 96 176 1 290 9 777Florida . . . . . . . . . . . . . . . . 41 613 111 108 1 251 219 336 6 049 007 239 439 13 911 14 094
Georgia. . . . . . . . . . . . . . . . 38 897 67 521 127 68 962 3 749 201 160 311 7 849 3 868Hawaii. . . . . . . . . . . . . . . . . 5 005 28 069 176 2 763 603 077 44 089 2 173 4 797Idaho . . . . . . . . . . . . . . . . . 10 666 48 628 243 6 315 534 144 18 396 2 566 26 906Illinois . . . . . . . . . . . . . . . . . 57 950 83 681 1 981 42 795 6 221 385 319 941 13 817 16 863Indiana . . . . . . . . . . . . . . . . 34 328 38 037 515 20 470 2 776 335 131 545 6 264 6 156Iowa . . . . . . . . . . . . . . . . . . 12 739 19 652 755 42 011 1 490 838 61 168 3 895 4 711Kansas . . . . . . . . . . . . . . . . 9 110 33 297 455 36 581 1 159 373 46 966 3 475 7 539Kentucky. . . . . . . . . . . . . . . 15 469 45 656 232 13 051 2 678 022 97 353 5 319 5 728Louisiana . . . . . . . . . . . . . . 11 565 96 183 1 57 312 3 111 924 144 352 4 950 23 326Maine . . . . . . . . . . . . . . . . . 3 885 18 425 230 11 995 1 059 940 28 865 2 398 10 828
Maryland. . . . . . . . . . . . . . . 28 692 102 668 672 8 438 3 728 288 122 166 6 018 4 862Massachusetts . . . . . . . . . . 123 682 284 781 1 487 14 103 5 664 673 210 016 7 591 11 934Michigan . . . . . . . . . . . . . . . 49 066 186 144 827 22 384 5 944 910 281 313 9 765 22 705Minnesota. . . . . . . . . . . . . . 20 887 65 450 528 41 723 2 779 463 91 708 5 472 24 375Mississippi . . . . . . . . . . . . . 9 249 46 794 - 69 713 1 909 190 69 266 3 043 13 426Missouri . . . . . . . . . . . . . . . 11 276 33 657 655 27 783 3 353 451 150 217 6 094 9 207Montana . . . . . . . . . . . . . . . 5 519 139 585 290 3 412 507 606 21 174 1 695 73 342Nebraska . . . . . . . . . . . . . . 6 298 26 909 721 16 336 921 451 32 178 2 337 8 965Nevada . . . . . . . . . . . . . . . . 21 552 95 541 466 5 257 511 576 28 233 2 163 44 890New Hampshire . . . . . . . . . 2 480 25 026 90 5 095 613 982 25 128 1 962 3 058
New Jersey. . . . . . . . . . . . . 24 596 130 523 118 23 101 4 273 544 220 168 7 826 3 842New Mexico . . . . . . . . . . . . 74 631 48 241 257 4 026 1 269 650 44 126 2 464 252 709New York . . . . . . . . . . . . . . 127 344 235 591 1 354 78 442 20 476 058 927 759 21 707 10 106North Carolina . . . . . . . . . . 19 115 78 940 147 109 163 4 842 226 125 864 8 162 5 418North Dakota . . . . . . . . . . . 9 835 20 291 145 90 832 387 733 10 855 1 388 48 903Ohio . . . . . . . . . . . . . . . . . . 44 181 49 321 1 902 20 464 6 644 458 292 660 11 028 2 882Oklahoma . . . . . . . . . . . . . . 12 342 56 293 342 64 926 1 725 489 79 851 4 009 52 063Oregon . . . . . . . . . . . . . . . . 10 733 34 505 495 10 887 2 015 424 67 972 3 866 85 848Pennsylvania . . . . . . . . . . . 63 877 73 315 1 870 38 719 8 437 535 444 582 23 931 43 122Rhode Island . . . . . . . . . . . 4 728 18 232 110 2 058 861 757 30 646 1 532 6 241
South Carolina . . . . . . . . . . 27 926 64 395 591 10 570 2 302 129 67 481 4 308 4 686South Dakota . . . . . . . . . . . 1 853 26 670 189 11 737 415 758 13 626 1 647 103 001Tennessee . . . . . . . . . . . . . 21 610 71 524 237 49 779 3 664 694 119 228 5 819 6 135Texas . . . . . . . . . . . . . . . . . 48 380 187 575 947 195 690 9 975 687 459 053 18 185 35 890Utah . . . . . . . . . . . . . . . . . . 17 140 31 940 272 8 197 923 502 31 017 2 547 70 135Vermont . . . . . . . . . . . . . . . 2 814 32 644 62 5 939 481 988 17 067 1 577 1 457Virginia . . . . . . . . . . . . . . . . 24 552 69 230 255 25 529 2 307 771 115 311 6 910 11 470Washington. . . . . . . . . . . . . 42 269 47 819 758 18 874 3 459 078 108 027 5 992 81 586West Virginia . . . . . . . . . . . 6 761 52 862 170 2 946 1 431 871 45 988 2 286 2 307Wisconsin . . . . . . . . . . . . . . 28 342 84 247 953 14 634 2 933 631 114 111 6 708 25 992Wyoming . . . . . . . . . . . . . . 6 445 29 695 115 2 207 217 685 11 743 1 194 275 877
American Samoa . . . . . . . . 123 1 204 - 928 12 723 400 67 70 100Fed. States of Micronesia. . - 750 - 1 014 2 759 - - 3 655Guam . . . . . . . . . . . . . . . . . 190 15 660 - 17 185 21 854 5 035 251 66 061Marshall Islands . . . . . . . . . - - - 172 3 993 - - 3 469Northern Marianas . . . . . . . 158 1 010 - 524 7 864 1 540 165 26 152Palau . . . . . . . . . . . . . . . . . - - - 234 3 415 336 - 1 289Puerto Rico. . . . . . . . . . . . . 1 872 24 856 240 1 441 327 596 753 210 523 4 017 450Virgin Islands . . . . . . . . . . . 253 4 304 17 16 924 30 900 8 679 255 57 546
Undistributed . . . . . . . . . . . - - - - - - - 4 648
5Consolidated Federal Funds Report for Fiscal Year 1999
U.S. Census Bureau
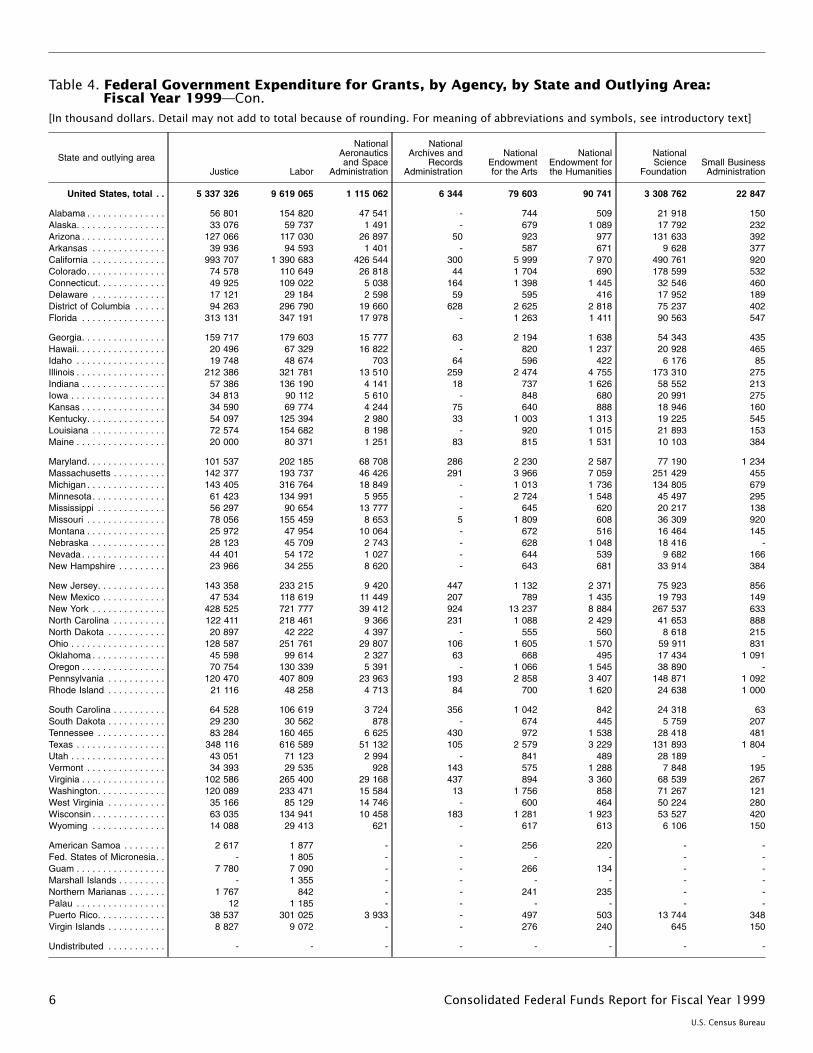
Table 4. Federal Government Expenditure for Grants, by Agency, by State and Outlying Area:Fiscal Year 1999—Con.
[In thousand dollars. Detail may not add to total because of rounding. For meaning of abbreviations and symbols, see introductory text]
State and outlying area
Justice Labor
NationalAeronauticsand Space
Administration
NationalArchives and
RecordsAdministration
NationalEndowmentfor the Arts
NationalEndowment forthe Humanities
NationalScience
FoundationSmall BusinessAdministration
United States, total . . 5 337 326 9 619 065 1 115 062 6 344 79 603 90 741 3 308 762 22 847
Alabama . . . . . . . . . . . . . . . 56 801 154 820 47 541 - 744 509 21 918 150Alaska. . . . . . . . . . . . . . . . . 33 076 59 737 1 491 - 679 1 089 17 792 232Arizona . . . . . . . . . . . . . . . . 127 066 117 030 26 897 50 923 977 131 633 392Arkansas . . . . . . . . . . . . . . 39 936 94 593 1 401 - 587 671 9 628 377California . . . . . . . . . . . . . . 993 707 1 390 683 426 544 300 5 999 7 970 490 761 920Colorado. . . . . . . . . . . . . . . 74 578 110 649 26 818 44 1 704 690 178 599 532Connecticut. . . . . . . . . . . . . 49 925 109 022 5 038 164 1 398 1 445 32 546 460Delaware . . . . . . . . . . . . . . 17 121 29 184 2 598 59 595 416 17 952 189District of Columbia . . . . . . 94 263 296 790 19 660 628 2 625 2 818 75 237 402Florida . . . . . . . . . . . . . . . . 313 131 347 191 17 978 - 1 263 1 411 90 563 547
Georgia. . . . . . . . . . . . . . . . 159 717 179 603 15 777 63 2 194 1 638 54 343 435Hawaii. . . . . . . . . . . . . . . . . 20 496 67 329 16 822 - 820 1 237 20 928 465Idaho . . . . . . . . . . . . . . . . . 19 748 48 674 703 64 596 422 6 176 85Illinois . . . . . . . . . . . . . . . . . 212 386 321 781 13 510 259 2 474 4 755 173 310 275Indiana . . . . . . . . . . . . . . . . 57 386 136 190 4 141 18 737 1 626 58 552 213Iowa . . . . . . . . . . . . . . . . . . 34 813 90 112 5 610 - 848 680 20 991 275Kansas . . . . . . . . . . . . . . . . 34 590 69 774 4 244 75 640 888 18 946 160Kentucky. . . . . . . . . . . . . . . 54 097 125 394 2 980 33 1 003 1 313 19 225 545Louisiana . . . . . . . . . . . . . . 72 574 154 682 8 198 - 920 1 015 21 893 153Maine . . . . . . . . . . . . . . . . . 20 000 80 371 1 251 83 815 1 531 10 103 384
Maryland. . . . . . . . . . . . . . . 101 537 202 185 68 708 286 2 230 2 587 77 190 1 234Massachusetts . . . . . . . . . . 142 377 193 737 46 426 291 3 966 7 059 251 429 455Michigan . . . . . . . . . . . . . . . 143 405 316 764 18 849 - 1 013 1 736 134 805 679Minnesota. . . . . . . . . . . . . . 61 423 134 991 5 955 - 2 724 1 548 45 497 295Mississippi . . . . . . . . . . . . . 56 297 90 654 13 777 - 645 620 20 217 138Missouri . . . . . . . . . . . . . . . 78 056 155 459 8 653 5 1 809 608 36 309 920Montana . . . . . . . . . . . . . . . 25 972 47 954 10 064 - 672 516 16 464 145Nebraska . . . . . . . . . . . . . . 28 123 45 709 2 743 - 628 1 048 18 416 -Nevada . . . . . . . . . . . . . . . . 44 401 54 172 1 027 - 644 539 9 682 166New Hampshire . . . . . . . . . 23 966 34 255 8 620 - 643 681 33 914 384
New Jersey. . . . . . . . . . . . . 143 358 233 215 9 420 447 1 132 2 371 75 923 856New Mexico . . . . . . . . . . . . 47 534 118 619 11 449 207 789 1 435 19 793 149New York . . . . . . . . . . . . . . 428 525 721 777 39 412 924 13 237 8 884 267 537 633North Carolina . . . . . . . . . . 122 411 218 461 9 366 231 1 088 2 429 41 653 888North Dakota . . . . . . . . . . . 20 897 42 222 4 397 - 555 560 8 618 215Ohio . . . . . . . . . . . . . . . . . . 128 587 251 761 29 807 106 1 605 1 570 59 911 831Oklahoma . . . . . . . . . . . . . . 45 598 99 614 2 327 63 668 495 17 434 1 091Oregon . . . . . . . . . . . . . . . . 70 754 130 339 5 391 - 1 066 1 545 38 890 -Pennsylvania . . . . . . . . . . . 120 470 407 809 23 963 193 2 858 3 407 148 871 1 092Rhode Island . . . . . . . . . . . 21 116 48 258 4 713 84 700 1 620 24 638 1 000
South Carolina . . . . . . . . . . 64 528 106 619 3 724 356 1 042 842 24 318 63South Dakota . . . . . . . . . . . 29 230 30 562 878 - 674 445 5 759 207Tennessee . . . . . . . . . . . . . 83 284 160 465 6 625 430 972 1 538 28 418 481Texas . . . . . . . . . . . . . . . . . 348 116 616 589 51 132 105 2 579 3 229 131 893 1 804Utah . . . . . . . . . . . . . . . . . . 43 051 71 123 2 994 - 841 489 28 189 -Vermont . . . . . . . . . . . . . . . 34 393 29 535 928 143 575 1 288 7 848 195Virginia . . . . . . . . . . . . . . . . 102 586 265 400 29 168 437 894 3 360 68 539 267Washington. . . . . . . . . . . . . 120 089 233 471 15 584 13 1 756 858 71 267 121West Virginia . . . . . . . . . . . 35 166 85 129 14 746 - 600 464 50 224 280Wisconsin . . . . . . . . . . . . . . 63 035 134 941 10 458 183 1 281 1 923 53 527 420Wyoming . . . . . . . . . . . . . . 14 088 29 413 621 - 617 613 6 106 150
American Samoa . . . . . . . . 2 617 1 877 - - 256 220 - -Fed. States of Micronesia. . - 1 805 - - - - - -Guam . . . . . . . . . . . . . . . . . 7 780 7 090 - - 266 134 - -Marshall Islands . . . . . . . . . - 1 355 - - - - - -Northern Marianas . . . . . . . 1 767 842 - - 241 235 - -Palau . . . . . . . . . . . . . . . . . 12 1 185 - - - - - -Puerto Rico. . . . . . . . . . . . . 38 537 301 025 3 933 - 497 503 13 744 348Virgin Islands . . . . . . . . . . . 8 827 9 072 - - 276 240 645 150
Undistributed . . . . . . . . . . . - - - - - - - -
6 Consolidated Federal Funds Report for Fiscal Year 1999
U.S. Census Bureau
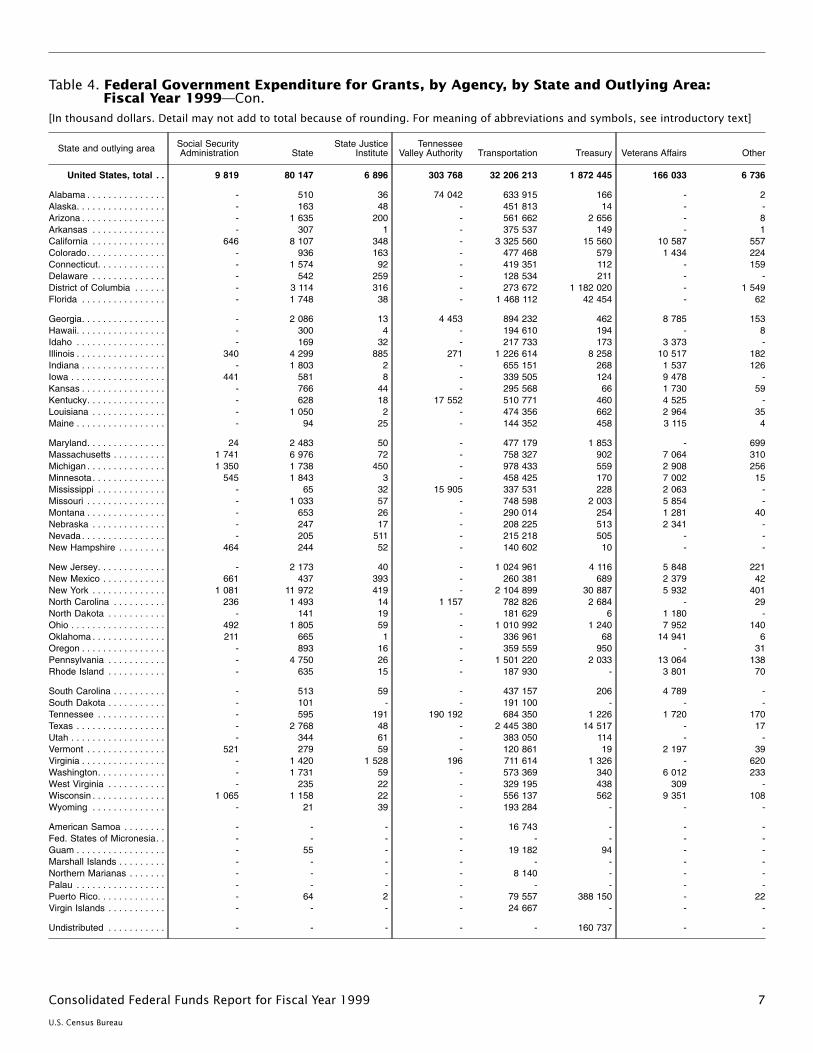
Table 4. Federal Government Expenditure for Grants, by Agency, by State and Outlying Area:Fiscal Year 1999—Con.
[In thousand dollars. Detail may not add to total because of rounding. For meaning of abbreviations and symbols, see introductory text]
State and outlying area Social SecurityAdministration State
State JusticeInstitute
TennesseeValley Authority Transportation Treasury Veterans Affairs Other
United States, total . . 9 819 80 147 6 896 303 768 32 206 213 1 872 445 166 033 6 736
Alabama . . . . . . . . . . . . . . . - 510 36 74 042 633 915 166 - 2Alaska. . . . . . . . . . . . . . . . . - 163 48 - 451 813 14 - -Arizona . . . . . . . . . . . . . . . . - 1 635 200 - 561 662 2 656 - 8Arkansas . . . . . . . . . . . . . . - 307 1 - 375 537 149 - 1California . . . . . . . . . . . . . . 646 8 107 348 - 3 325 560 15 560 10 587 557Colorado. . . . . . . . . . . . . . . - 936 163 - 477 468 579 1 434 224Connecticut. . . . . . . . . . . . . - 1 574 92 - 419 351 112 - 159Delaware . . . . . . . . . . . . . . - 542 259 - 128 534 211 - -District of Columbia . . . . . . - 3 114 316 - 273 672 1 182 020 - 1 549Florida . . . . . . . . . . . . . . . . - 1 748 38 - 1 468 112 42 454 - 62
Georgia. . . . . . . . . . . . . . . . - 2 086 13 4 453 894 232 462 8 785 153Hawaii. . . . . . . . . . . . . . . . . - 300 4 - 194 610 194 - 8Idaho . . . . . . . . . . . . . . . . . - 169 32 - 217 733 173 3 373 -Illinois . . . . . . . . . . . . . . . . . 340 4 299 885 271 1 226 614 8 258 10 517 182Indiana . . . . . . . . . . . . . . . . - 1 803 2 - 655 151 268 1 537 126Iowa . . . . . . . . . . . . . . . . . . 441 581 8 - 339 505 124 9 478 -Kansas . . . . . . . . . . . . . . . . - 766 44 - 295 568 66 1 730 59Kentucky. . . . . . . . . . . . . . . - 628 18 17 552 510 771 460 4 525 -Louisiana . . . . . . . . . . . . . . - 1 050 2 - 474 356 662 2 964 35Maine . . . . . . . . . . . . . . . . . - 94 25 - 144 352 458 3 115 4
Maryland. . . . . . . . . . . . . . . 24 2 483 50 - 477 179 1 853 - 699Massachusetts . . . . . . . . . . 1 741 6 976 72 - 758 327 902 7 064 310Michigan . . . . . . . . . . . . . . . 1 350 1 738 450 - 978 433 559 2 908 256Minnesota. . . . . . . . . . . . . . 545 1 843 3 - 458 425 170 7 002 15Mississippi . . . . . . . . . . . . . - 65 32 15 905 337 531 228 2 063 -Missouri . . . . . . . . . . . . . . . - 1 033 57 - 748 598 2 003 5 854 -Montana . . . . . . . . . . . . . . . - 653 26 - 290 014 254 1 281 40Nebraska . . . . . . . . . . . . . . - 247 17 - 208 225 513 2 341 -Nevada . . . . . . . . . . . . . . . . - 205 511 - 215 218 505 - -New Hampshire . . . . . . . . . 464 244 52 - 140 602 10 - -
New Jersey. . . . . . . . . . . . . - 2 173 40 - 1 024 961 4 116 5 848 221New Mexico . . . . . . . . . . . . 661 437 393 - 260 381 689 2 379 42New York . . . . . . . . . . . . . . 1 081 11 972 419 - 2 104 899 30 887 5 932 401North Carolina . . . . . . . . . . 236 1 493 14 1 157 782 826 2 684 - 29North Dakota . . . . . . . . . . . - 141 19 - 181 629 6 1 180 -Ohio . . . . . . . . . . . . . . . . . . 492 1 805 59 - 1 010 992 1 240 7 952 140Oklahoma . . . . . . . . . . . . . . 211 665 1 - 336 961 68 14 941 6Oregon . . . . . . . . . . . . . . . . - 893 16 - 359 559 950 - 31Pennsylvania . . . . . . . . . . . - 4 750 26 - 1 501 220 2 033 13 064 138Rhode Island . . . . . . . . . . . - 635 15 - 187 930 - 3 801 70
South Carolina . . . . . . . . . . - 513 59 - 437 157 206 4 789 -South Dakota . . . . . . . . . . . - 101 - - 191 100 - - -Tennessee . . . . . . . . . . . . . - 595 191 190 192 684 350 1 226 1 720 170Texas . . . . . . . . . . . . . . . . . - 2 768 48 - 2 445 380 14 517 - 17Utah . . . . . . . . . . . . . . . . . . - 344 61 - 383 050 114 - -Vermont . . . . . . . . . . . . . . . 521 279 59 - 120 861 19 2 197 39Virginia . . . . . . . . . . . . . . . . - 1 420 1 528 196 711 614 1 326 - 620Washington. . . . . . . . . . . . . - 1 731 59 - 573 369 340 6 012 233West Virginia . . . . . . . . . . . - 235 22 - 329 195 438 309 -Wisconsin . . . . . . . . . . . . . . 1 065 1 158 22 - 556 137 562 9 351 108Wyoming . . . . . . . . . . . . . . - 21 39 - 193 284 - - -
American Samoa . . . . . . . . - - - - 16 743 - - -Fed. States of Micronesia. . - - - - - - - -Guam . . . . . . . . . . . . . . . . . - 55 - - 19 182 94 - -Marshall Islands . . . . . . . . . - - - - - - - -Northern Marianas . . . . . . . - - - - 8 140 - - -Palau . . . . . . . . . . . . . . . . . - - - - - - - -Puerto Rico. . . . . . . . . . . . . - 64 2 - 79 557 388 150 - 22Virgin Islands . . . . . . . . . . . - - - - 24 667 - - -
Undistributed . . . . . . . . . . . - - - - - 160 737 - -
7Consolidated Federal Funds Report for Fiscal Year 1999
U.S. Census Bureau
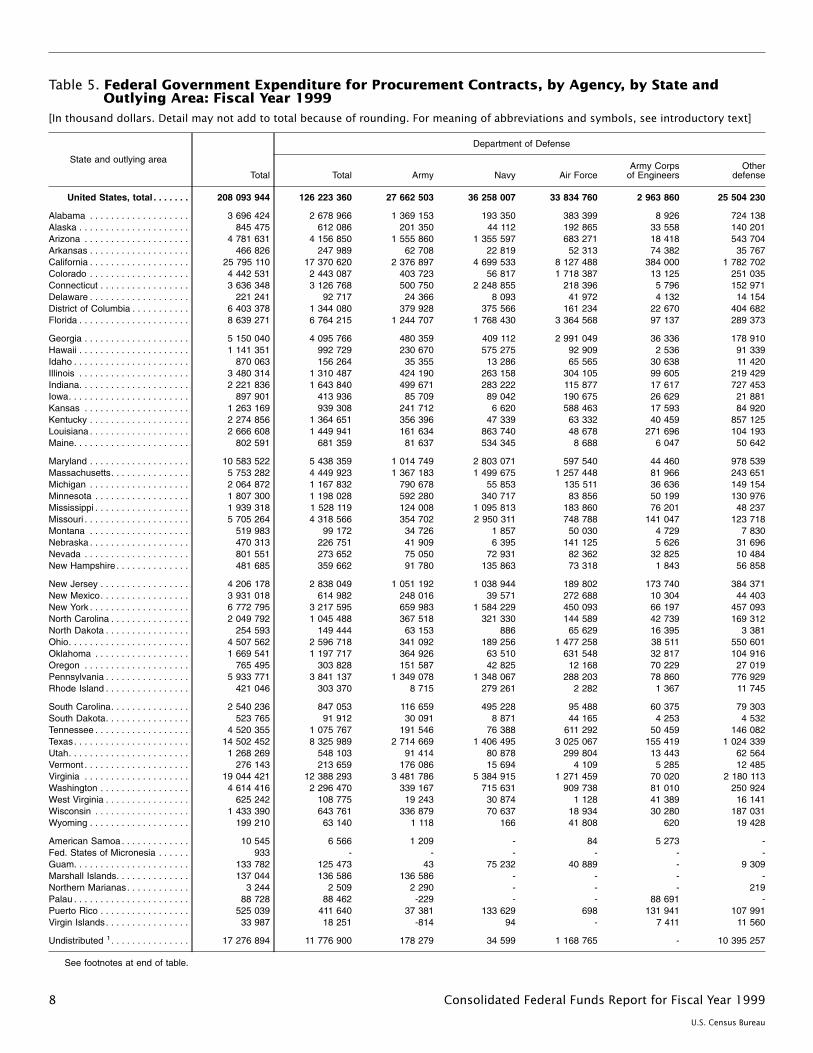
Table 5. Federal Government Expenditure for Procurement Contracts, by Agency, by State andOutlying Area: Fiscal Year 1999
[In thousand dollars. Detail may not add to total because of rounding. For meaning of abbreviations and symbols, see introductory text]
State and outlying area
Total
Department of Defense
Total Army Navy Air ForceArmy Corps
of EngineersOther
defense
United States, total . . . . . . . 208 093 944 126 223 360 27 662 503 36 258 007 33 834 760 2 963 860 25 504 230
Alabama . . . . . . . . . . . . . . . . . . . 3 696 424 2 678 966 1 369 153 193 350 383 399 8 926 724 138Alaska . . . . . . . . . . . . . . . . . . . . . 845 475 612 086 201 350 44 112 192 865 33 558 140 201Arizona . . . . . . . . . . . . . . . . . . . . 4 781 631 4 156 850 1 555 860 1 355 597 683 271 18 418 543 704Arkansas . . . . . . . . . . . . . . . . . . . 466 826 247 989 62 708 22 819 52 313 74 382 35 767California . . . . . . . . . . . . . . . . . . . 25 795 110 17 370 620 2 376 897 4 699 533 8 127 488 384 000 1 782 702Colorado . . . . . . . . . . . . . . . . . . . 4 442 531 2 443 087 403 723 56 817 1 718 387 13 125 251 035Connecticut . . . . . . . . . . . . . . . . . 3 636 348 3 126 768 500 750 2 248 855 218 396 5 796 152 971Delaware . . . . . . . . . . . . . . . . . . . 221 241 92 717 24 366 8 093 41 972 4 132 14 154District of Columbia . . . . . . . . . . . 6 403 378 1 344 080 379 928 375 566 161 234 22 670 404 682Florida . . . . . . . . . . . . . . . . . . . . . 8 639 271 6 764 215 1 244 707 1 768 430 3 364 568 97 137 289 373
Georgia . . . . . . . . . . . . . . . . . . . . 5 150 040 4 095 766 480 359 409 112 2 991 049 36 336 178 910Hawaii . . . . . . . . . . . . . . . . . . . . . 1 141 351 992 729 230 670 575 275 92 909 2 536 91 339Idaho . . . . . . . . . . . . . . . . . . . . . . 870 063 156 264 35 355 13 286 65 565 30 638 11 420Illinois . . . . . . . . . . . . . . . . . . . . . 3 480 314 1 310 487 424 190 263 158 304 105 99 605 219 429Indiana. . . . . . . . . . . . . . . . . . . . . 2 221 836 1 643 840 499 671 283 222 115 877 17 617 727 453Iowa. . . . . . . . . . . . . . . . . . . . . . . 897 901 413 936 85 709 89 042 190 675 26 629 21 881Kansas . . . . . . . . . . . . . . . . . . . . 1 263 169 939 308 241 712 6 620 588 463 17 593 84 920Kentucky . . . . . . . . . . . . . . . . . . . 2 274 856 1 364 651 356 396 47 339 63 332 40 459 857 125Louisiana . . . . . . . . . . . . . . . . . . . 2 666 608 1 449 941 161 634 863 740 48 678 271 696 104 193Maine. . . . . . . . . . . . . . . . . . . . . . 802 591 681 359 81 637 534 345 8 688 6 047 50 642
Maryland . . . . . . . . . . . . . . . . . . . 10 583 522 5 438 359 1 014 749 2 803 071 597 540 44 460 978 539Massachusetts. . . . . . . . . . . . . . . 5 753 282 4 449 923 1 367 183 1 499 675 1 257 448 81 966 243 651Michigan . . . . . . . . . . . . . . . . . . . 2 064 872 1 167 832 790 678 55 853 135 511 36 636 149 154Minnesota . . . . . . . . . . . . . . . . . . 1 807 300 1 198 028 592 280 340 717 83 856 50 199 130 976Mississippi . . . . . . . . . . . . . . . . . . 1 939 318 1 528 119 124 008 1 095 813 183 860 76 201 48 237Missouri . . . . . . . . . . . . . . . . . . . . 5 705 264 4 318 566 354 702 2 950 311 748 788 141 047 123 718Montana . . . . . . . . . . . . . . . . . . . 519 983 99 172 34 726 1 857 50 030 4 729 7 830Nebraska . . . . . . . . . . . . . . . . . . . 470 313 226 751 41 909 6 395 141 125 5 626 31 696Nevada . . . . . . . . . . . . . . . . . . . . 801 551 273 652 75 050 72 931 82 362 32 825 10 484New Hampshire . . . . . . . . . . . . . . 481 685 359 662 91 780 135 863 73 318 1 843 56 858
New Jersey . . . . . . . . . . . . . . . . . 4 206 178 2 838 049 1 051 192 1 038 944 189 802 173 740 384 371New Mexico. . . . . . . . . . . . . . . . . 3 931 018 614 982 248 016 39 571 272 688 10 304 44 403New York . . . . . . . . . . . . . . . . . . . 6 772 795 3 217 595 659 983 1 584 229 450 093 66 197 457 093North Carolina . . . . . . . . . . . . . . . 2 049 792 1 045 488 367 518 321 330 144 589 42 739 169 312North Dakota . . . . . . . . . . . . . . . . 254 593 149 444 63 153 886 65 629 16 395 3 381Ohio. . . . . . . . . . . . . . . . . . . . . . . 4 507 562 2 596 718 341 092 189 256 1 477 258 38 511 550 601Oklahoma . . . . . . . . . . . . . . . . . . 1 669 541 1 197 717 364 926 63 510 631 548 32 817 104 916Oregon . . . . . . . . . . . . . . . . . . . . 765 495 303 828 151 587 42 825 12 168 70 229 27 019Pennsylvania . . . . . . . . . . . . . . . . 5 933 771 3 841 137 1 349 078 1 348 067 288 203 78 860 776 929Rhode Island . . . . . . . . . . . . . . . . 421 046 303 370 8 715 279 261 2 282 1 367 11 745
South Carolina. . . . . . . . . . . . . . . 2 540 236 847 053 116 659 495 228 95 488 60 375 79 303South Dakota. . . . . . . . . . . . . . . . 523 765 91 912 30 091 8 871 44 165 4 253 4 532Tennessee . . . . . . . . . . . . . . . . . . 4 520 355 1 075 767 191 546 76 388 611 292 50 459 146 082Texas. . . . . . . . . . . . . . . . . . . . . . 14 502 452 8 325 989 2 714 669 1 406 495 3 025 067 155 419 1 024 339Utah. . . . . . . . . . . . . . . . . . . . . . . 1 268 269 548 103 91 414 80 878 299 804 13 443 62 564Vermont . . . . . . . . . . . . . . . . . . . . 276 143 213 659 176 086 15 694 4 109 5 285 12 485Virginia . . . . . . . . . . . . . . . . . . . . 19 044 421 12 388 293 3 481 786 5 384 915 1 271 459 70 020 2 180 113Washington . . . . . . . . . . . . . . . . . 4 614 416 2 296 470 339 167 715 631 909 738 81 010 250 924West Virginia . . . . . . . . . . . . . . . . 625 242 108 775 19 243 30 874 1 128 41 389 16 141Wisconsin . . . . . . . . . . . . . . . . . . 1 433 390 643 761 336 879 70 637 18 934 30 280 187 031Wyoming . . . . . . . . . . . . . . . . . . . 199 210 63 140 1 118 166 41 808 620 19 428
American Samoa . . . . . . . . . . . . . 10 545 6 566 1 209 - 84 5 273 -Fed. States of Micronesia . . . . . . 933 - - - - - -Guam. . . . . . . . . . . . . . . . . . . . . . 133 782 125 473 43 75 232 40 889 - 9 309Marshall Islands. . . . . . . . . . . . . . 137 044 136 586 136 586 - - - -Northern Marianas. . . . . . . . . . . . 3 244 2 509 2 290 - - - 219Palau . . . . . . . . . . . . . . . . . . . . . . 88 728 88 462 -229 - - 88 691 -Puerto Rico . . . . . . . . . . . . . . . . . 525 039 411 640 37 381 133 629 698 131 941 107 991Virgin Islands. . . . . . . . . . . . . . . . 33 987 18 251 -814 94 - 7 411 11 560
Undistributed 1. . . . . . . . . . . . . . . 17 276 894 11 776 900 178 279 34 599 1 168 765 - 10 395 257
See footnotes at end of table.
8 Consolidated Federal Funds Report for Fiscal Year 1999
U.S. Census Bureau
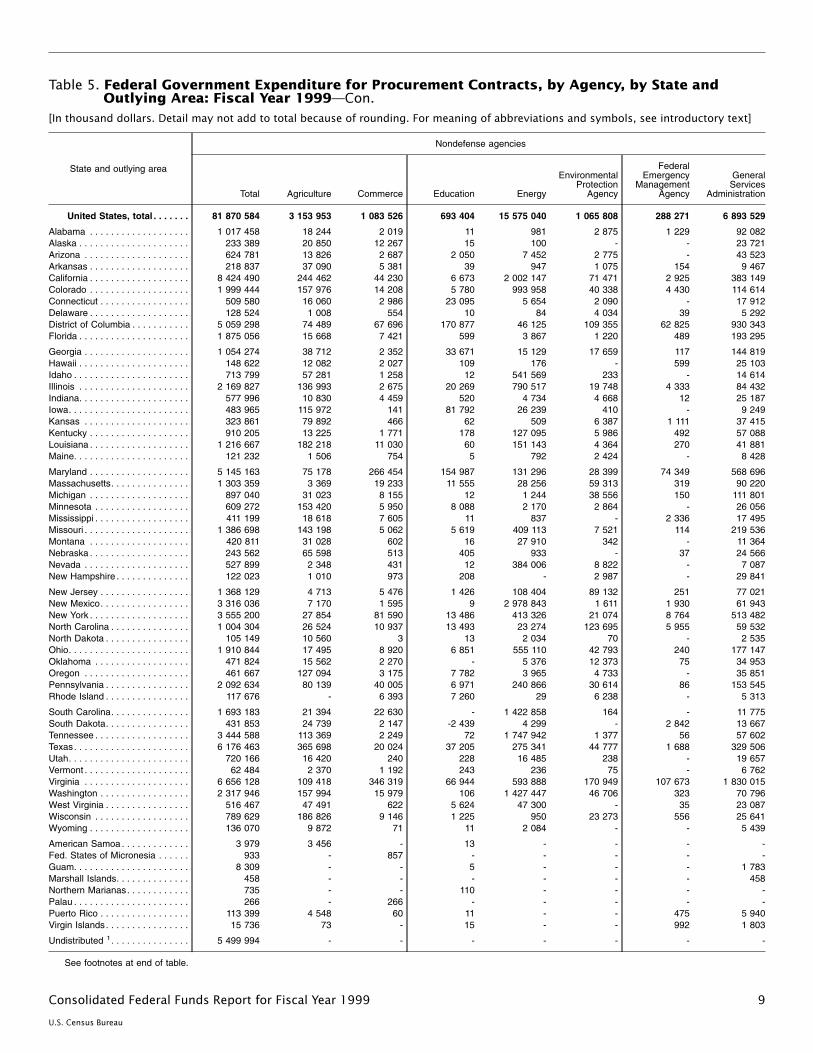
Table 5. Federal Government Expenditure for Procurement Contracts, by Agency, by State andOutlying Area: Fiscal Year 1999—Con.
[In thousand dollars. Detail may not add to total because of rounding. For meaning of abbreviations and symbols, see introductory text]
State and outlying area
Nondefense agencies
Total Agriculture Commerce Education Energy
EnvironmentalProtection
Agency
FederalEmergency
ManagementAgency
GeneralServices
Administration
United States, total . . . . . . . 81 870 584 3 153 953 1 083 526 693 404 15 575 040 1 065 808 288 271 6 893 529
Alabama . . . . . . . . . . . . . . . . . . . 1 017 458 18 244 2 019 11 981 2 875 1 229 92 082Alaska . . . . . . . . . . . . . . . . . . . . . 233 389 20 850 12 267 15 100 - - 23 721Arizona . . . . . . . . . . . . . . . . . . . . 624 781 13 826 2 687 2 050 7 452 2 775 - 43 523Arkansas . . . . . . . . . . . . . . . . . . . 218 837 37 090 5 381 39 947 1 075 154 9 467California . . . . . . . . . . . . . . . . . . . 8 424 490 244 462 44 230 6 673 2 002 147 71 471 2 925 383 149Colorado . . . . . . . . . . . . . . . . . . . 1 999 444 157 976 14 208 5 780 993 958 40 338 4 430 114 614Connecticut . . . . . . . . . . . . . . . . . 509 580 16 060 2 986 23 095 5 654 2 090 - 17 912Delaware . . . . . . . . . . . . . . . . . . . 128 524 1 008 554 10 84 4 034 39 5 292District of Columbia . . . . . . . . . . . 5 059 298 74 489 67 696 170 877 46 125 109 355 62 825 930 343Florida . . . . . . . . . . . . . . . . . . . . . 1 875 056 15 668 7 421 599 3 867 1 220 489 193 295
Georgia . . . . . . . . . . . . . . . . . . . . 1 054 274 38 712 2 352 33 671 15 129 17 659 117 144 819Hawaii . . . . . . . . . . . . . . . . . . . . . 148 622 12 082 2 027 109 176 - 599 25 103Idaho . . . . . . . . . . . . . . . . . . . . . . 713 799 57 281 1 258 12 541 569 233 - 14 614Illinois . . . . . . . . . . . . . . . . . . . . . 2 169 827 136 993 2 675 20 269 790 517 19 748 4 333 84 432Indiana. . . . . . . . . . . . . . . . . . . . . 577 996 10 830 4 459 520 4 734 4 668 12 25 187Iowa. . . . . . . . . . . . . . . . . . . . . . . 483 965 115 972 141 81 792 26 239 410 - 9 249Kansas . . . . . . . . . . . . . . . . . . . . 323 861 79 892 466 62 509 6 387 1 111 37 415Kentucky . . . . . . . . . . . . . . . . . . . 910 205 13 225 1 771 178 127 095 5 986 492 57 088Louisiana . . . . . . . . . . . . . . . . . . . 1 216 667 182 218 11 030 60 151 143 4 364 270 41 881Maine. . . . . . . . . . . . . . . . . . . . . . 121 232 1 506 754 5 792 2 424 - 8 428
Maryland . . . . . . . . . . . . . . . . . . . 5 145 163 75 178 266 454 154 987 131 296 28 399 74 349 568 696Massachusetts. . . . . . . . . . . . . . . 1 303 359 3 369 19 233 11 555 28 256 59 313 319 90 220Michigan . . . . . . . . . . . . . . . . . . . 897 040 31 023 8 155 12 1 244 38 556 150 111 801Minnesota . . . . . . . . . . . . . . . . . . 609 272 153 420 5 950 8 088 2 170 2 864 - 26 056Mississippi . . . . . . . . . . . . . . . . . . 411 199 18 618 7 605 11 837 - 2 336 17 495Missouri . . . . . . . . . . . . . . . . . . . . 1 386 698 143 198 5 062 5 619 409 113 7 521 114 219 536Montana . . . . . . . . . . . . . . . . . . . 420 811 31 028 602 16 27 910 342 - 11 364Nebraska . . . . . . . . . . . . . . . . . . . 243 562 65 598 513 405 933 - 37 24 566Nevada . . . . . . . . . . . . . . . . . . . . 527 899 2 348 431 12 384 006 8 822 - 7 087New Hampshire . . . . . . . . . . . . . . 122 023 1 010 973 208 - 2 987 - 29 841
New Jersey . . . . . . . . . . . . . . . . . 1 368 129 4 713 5 476 1 426 108 404 89 132 251 77 021New Mexico. . . . . . . . . . . . . . . . . 3 316 036 7 170 1 595 9 2 978 843 1 611 1 930 61 943New York . . . . . . . . . . . . . . . . . . . 3 555 200 27 854 81 590 13 486 413 326 21 074 8 764 513 482North Carolina . . . . . . . . . . . . . . . 1 004 304 26 524 10 937 13 493 23 274 123 695 5 955 59 532North Dakota . . . . . . . . . . . . . . . . 105 149 10 560 3 13 2 034 70 - 2 535Ohio. . . . . . . . . . . . . . . . . . . . . . . 1 910 844 17 495 8 920 6 851 555 110 42 793 240 177 147Oklahoma . . . . . . . . . . . . . . . . . . 471 824 15 562 2 270 - 5 376 12 373 75 34 953Oregon . . . . . . . . . . . . . . . . . . . . 461 667 127 094 3 175 7 782 3 965 4 733 - 35 851Pennsylvania . . . . . . . . . . . . . . . . 2 092 634 80 139 40 005 6 971 240 866 30 614 86 153 545Rhode Island . . . . . . . . . . . . . . . . 117 676 - 6 393 7 260 29 6 238 - 5 313
South Carolina. . . . . . . . . . . . . . . 1 693 183 21 394 22 630 - 1 422 858 164 - 11 775South Dakota. . . . . . . . . . . . . . . . 431 853 24 739 2 147 -2 439 4 299 - 2 842 13 667Tennessee . . . . . . . . . . . . . . . . . . 3 444 588 113 369 2 249 72 1 747 942 1 377 56 57 602Texas. . . . . . . . . . . . . . . . . . . . . . 6 176 463 365 698 20 024 37 205 275 341 44 777 1 688 329 506Utah. . . . . . . . . . . . . . . . . . . . . . . 720 166 16 420 240 228 16 485 238 - 19 657Vermont . . . . . . . . . . . . . . . . . . . . 62 484 2 370 1 192 243 236 75 - 6 762Virginia . . . . . . . . . . . . . . . . . . . . 6 656 128 109 418 346 319 66 944 593 888 170 949 107 673 1 830 015Washington . . . . . . . . . . . . . . . . . 2 317 946 157 994 15 979 106 1 427 447 46 706 323 70 796West Virginia . . . . . . . . . . . . . . . . 516 467 47 491 622 5 624 47 300 - 35 23 087Wisconsin . . . . . . . . . . . . . . . . . . 789 629 186 826 9 146 1 225 950 23 273 556 25 641Wyoming . . . . . . . . . . . . . . . . . . . 136 070 9 872 71 11 2 084 - - 5 439
American Samoa . . . . . . . . . . . . . 3 979 3 456 - 13 - - - -Fed. States of Micronesia . . . . . . 933 - 857 - - - - -Guam. . . . . . . . . . . . . . . . . . . . . . 8 309 - - 5 - - - 1 783Marshall Islands. . . . . . . . . . . . . . 458 - - - - - - 458Northern Marianas. . . . . . . . . . . . 735 - - 110 - - - -Palau . . . . . . . . . . . . . . . . . . . . . . 266 - 266 - - - - -Puerto Rico . . . . . . . . . . . . . . . . . 113 399 4 548 60 11 - - 475 5 940Virgin Islands. . . . . . . . . . . . . . . . 15 736 73 - 15 - - 992 1 803
Undistributed 1. . . . . . . . . . . . . . . 5 499 994 - - - - - - -
See footnotes at end of table.
9Consolidated Federal Funds Report for Fiscal Year 1999
U.S. Census Bureau
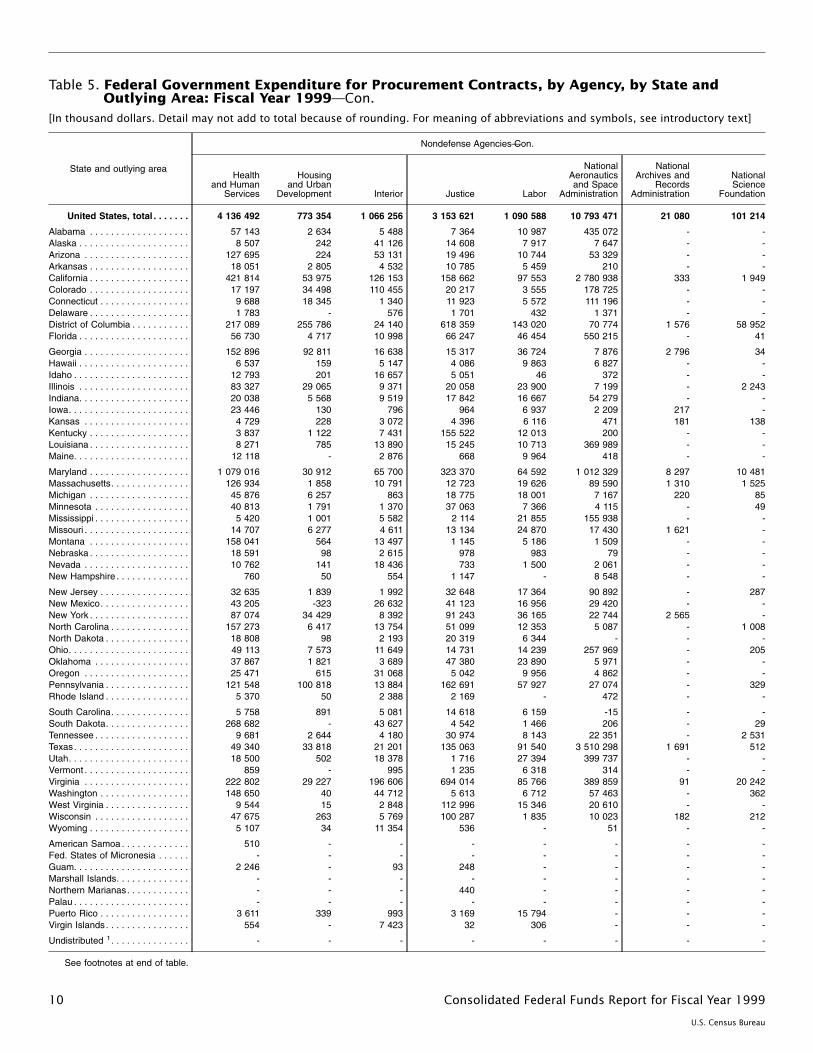
Table 5. Federal Government Expenditure for Procurement Contracts, by Agency, by State andOutlying Area: Fiscal Year 1999—Con.
[In thousand dollars. Detail may not add to total because of rounding. For meaning of abbreviations and symbols, see introductory text]
State and outlying area
Nondefense Agencies—Con.
Healthand Human
Services
Housingand Urban
Development Interior Justice Labor
NationalAeronauticsand Space
Administration
NationalArchives and
RecordsAdministration
NationalScience
Foundation
United States, total . . . . . . . 4 136 492 773 354 1 066 256 3 153 621 1 090 588 10 793 471 21 080 101 214
Alabama . . . . . . . . . . . . . . . . . . . 57 143 2 634 5 488 7 364 10 987 435 072 - -Alaska . . . . . . . . . . . . . . . . . . . . . 8 507 242 41 126 14 608 7 917 7 647 - -Arizona . . . . . . . . . . . . . . . . . . . . 127 695 224 53 131 19 496 10 744 53 329 - -Arkansas . . . . . . . . . . . . . . . . . . . 18 051 2 805 4 532 10 785 5 459 210 - -California . . . . . . . . . . . . . . . . . . . 421 814 53 975 126 153 158 662 97 553 2 780 938 333 1 949Colorado . . . . . . . . . . . . . . . . . . . 17 197 34 498 110 455 20 217 3 555 178 725 - -Connecticut . . . . . . . . . . . . . . . . . 9 688 18 345 1 340 11 923 5 572 111 196 - -Delaware . . . . . . . . . . . . . . . . . . . 1 783 - 576 1 701 432 1 371 - -District of Columbia . . . . . . . . . . . 217 089 255 786 24 140 618 359 143 020 70 774 1 576 58 952Florida . . . . . . . . . . . . . . . . . . . . . 56 730 4 717 10 998 66 247 46 454 550 215 - 41
Georgia . . . . . . . . . . . . . . . . . . . . 152 896 92 811 16 638 15 317 36 724 7 876 2 796 34Hawaii . . . . . . . . . . . . . . . . . . . . . 6 537 159 5 147 4 086 9 863 6 827 - -Idaho . . . . . . . . . . . . . . . . . . . . . . 12 793 201 16 657 5 051 46 372 - -Illinois . . . . . . . . . . . . . . . . . . . . . 83 327 29 065 9 371 20 058 23 900 7 199 - 2 243Indiana. . . . . . . . . . . . . . . . . . . . . 20 038 5 568 9 519 17 842 16 667 54 279 - -Iowa. . . . . . . . . . . . . . . . . . . . . . . 23 446 130 796 964 6 937 2 209 217 -Kansas . . . . . . . . . . . . . . . . . . . . 4 729 228 3 072 4 396 6 116 471 181 138Kentucky . . . . . . . . . . . . . . . . . . . 3 837 1 122 7 431 155 522 12 013 200 - -Louisiana . . . . . . . . . . . . . . . . . . . 8 271 785 13 890 15 245 10 713 369 989 - -Maine. . . . . . . . . . . . . . . . . . . . . . 12 118 - 2 876 668 9 964 418 - -
Maryland . . . . . . . . . . . . . . . . . . . 1 079 016 30 912 65 700 323 370 64 592 1 012 329 8 297 10 481Massachusetts. . . . . . . . . . . . . . . 126 934 1 858 10 791 12 723 19 626 89 590 1 310 1 525Michigan . . . . . . . . . . . . . . . . . . . 45 876 6 257 863 18 775 18 001 7 167 220 85Minnesota . . . . . . . . . . . . . . . . . . 40 813 1 791 1 370 37 063 7 366 4 115 - 49Mississippi . . . . . . . . . . . . . . . . . . 5 420 1 001 5 582 2 114 21 855 155 938 - -Missouri . . . . . . . . . . . . . . . . . . . . 14 707 6 277 4 611 13 134 24 870 17 430 1 621 -Montana . . . . . . . . . . . . . . . . . . . 158 041 564 13 497 1 145 5 186 1 509 - -Nebraska . . . . . . . . . . . . . . . . . . . 18 591 98 2 615 978 983 79 - -Nevada . . . . . . . . . . . . . . . . . . . . 10 762 141 18 436 733 1 500 2 061 - -New Hampshire . . . . . . . . . . . . . . 760 50 554 1 147 - 8 548 - -
New Jersey . . . . . . . . . . . . . . . . . 32 635 1 839 1 992 32 648 17 364 90 892 - 287New Mexico. . . . . . . . . . . . . . . . . 43 205 -323 26 632 41 123 16 956 29 420 - -New York . . . . . . . . . . . . . . . . . . . 87 074 34 429 8 392 91 243 36 165 22 744 2 565 -North Carolina . . . . . . . . . . . . . . . 157 273 6 417 13 754 51 099 12 353 5 087 - 1 008North Dakota . . . . . . . . . . . . . . . . 18 808 98 2 193 20 319 6 344 - - -Ohio. . . . . . . . . . . . . . . . . . . . . . . 49 113 7 573 11 649 14 731 14 239 257 969 - 205Oklahoma . . . . . . . . . . . . . . . . . . 37 867 1 821 3 689 47 380 23 890 5 971 - -Oregon . . . . . . . . . . . . . . . . . . . . 25 471 615 31 068 5 042 9 956 4 862 - -Pennsylvania . . . . . . . . . . . . . . . . 121 548 100 818 13 884 162 691 57 927 27 074 - 329Rhode Island . . . . . . . . . . . . . . . . 5 370 50 2 388 2 169 - 472 - -
South Carolina. . . . . . . . . . . . . . . 5 758 891 5 081 14 618 6 159 -15 - -South Dakota. . . . . . . . . . . . . . . . 268 682 - 43 627 4 542 1 466 206 - 29Tennessee . . . . . . . . . . . . . . . . . . 9 681 2 644 4 180 30 974 8 143 22 351 - 2 531Texas. . . . . . . . . . . . . . . . . . . . . . 49 340 33 818 21 201 135 063 91 540 3 510 298 1 691 512Utah. . . . . . . . . . . . . . . . . . . . . . . 18 500 502 18 378 1 716 27 394 399 737 - -Vermont . . . . . . . . . . . . . . . . . . . . 859 - 995 1 235 6 318 314 - -Virginia . . . . . . . . . . . . . . . . . . . . 222 802 29 227 196 606 694 014 85 766 389 859 91 20 242Washington . . . . . . . . . . . . . . . . . 148 650 40 44 712 5 613 6 712 57 463 - 362West Virginia . . . . . . . . . . . . . . . . 9 544 15 2 848 112 996 15 346 20 610 - -Wisconsin . . . . . . . . . . . . . . . . . . 47 675 263 5 769 100 287 1 835 10 023 182 212Wyoming . . . . . . . . . . . . . . . . . . . 5 107 34 11 354 536 - 51 - -
American Samoa . . . . . . . . . . . . . 510 - - - - - - -Fed. States of Micronesia . . . . . . - - - - - - - -Guam. . . . . . . . . . . . . . . . . . . . . . 2 246 - 93 248 - - - -Marshall Islands. . . . . . . . . . . . . . - - - - - - - -Northern Marianas. . . . . . . . . . . . - - - 440 - - - -Palau . . . . . . . . . . . . . . . . . . . . . . - - - - - - - -Puerto Rico . . . . . . . . . . . . . . . . . 3 611 339 993 3 169 15 794 - - -Virgin Islands. . . . . . . . . . . . . . . . 554 - 7 423 32 306 - - -
Undistributed 1. . . . . . . . . . . . . . . - - - - - - - -
See footnotes at end of table.
10 Consolidated Federal Funds Report for Fiscal Year 1999
U.S. Census Bureau
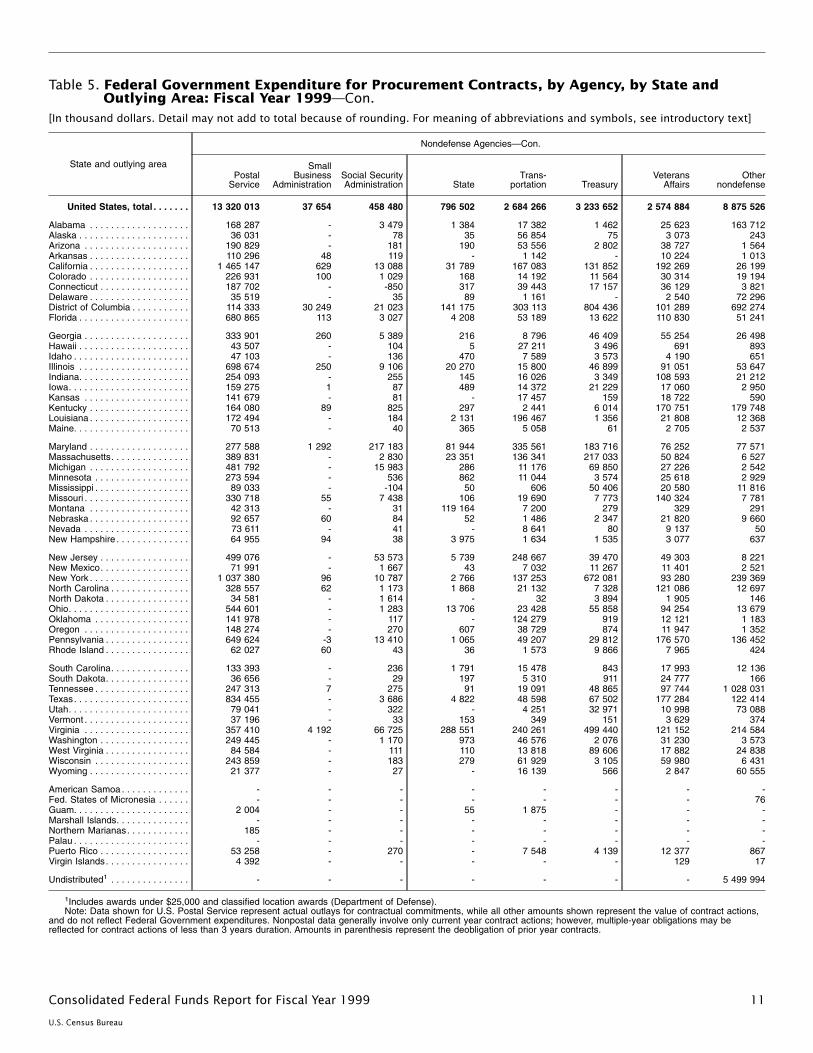
Table 5. Federal Government Expenditure for Procurement Contracts, by Agency, by State andOutlying Area: Fiscal Year 1999—Con.
[In thousand dollars. Detail may not add to total because of rounding. For meaning of abbreviations and symbols, see introductory text]
State and outlying area
Nondefense Agencies— Con.
PostalService
SmallBusiness
AdministrationSocial SecurityAdministration State
Trans-portation Treasury
VeteransAffairs
Othernondefense
United States, total . . . . . . . 13 320 013 37 654 458 480 796 502 2 684 266 3 233 652 2 574 884 8 875 526
Alabama . . . . . . . . . . . . . . . . . . . 168 287 - 3 479 1 384 17 382 1 462 25 623 163 712Alaska . . . . . . . . . . . . . . . . . . . . . 36 031 - 78 35 56 854 75 3 073 243Arizona . . . . . . . . . . . . . . . . . . . . 190 829 - 181 190 53 556 2 802 38 727 1 564Arkansas . . . . . . . . . . . . . . . . . . . 110 296 48 119 - 1 142 - 10 224 1 013California . . . . . . . . . . . . . . . . . . . 1 465 147 629 13 088 31 789 167 083 131 852 192 269 26 199Colorado . . . . . . . . . . . . . . . . . . . 226 931 100 1 029 168 14 192 11 564 30 314 19 194Connecticut . . . . . . . . . . . . . . . . . 187 702 - -850 317 39 443 17 157 36 129 3 821Delaware . . . . . . . . . . . . . . . . . . . 35 519 - 35 89 1 161 - 2 540 72 296District of Columbia . . . . . . . . . . . 114 333 30 249 21 023 141 175 303 113 804 436 101 289 692 274Florida . . . . . . . . . . . . . . . . . . . . . 680 865 113 3 027 4 208 53 189 13 622 110 830 51 241
Georgia . . . . . . . . . . . . . . . . . . . . 333 901 260 5 389 216 8 796 46 409 55 254 26 498Hawaii . . . . . . . . . . . . . . . . . . . . . 43 507 - 104 5 27 211 3 496 691 893Idaho . . . . . . . . . . . . . . . . . . . . . . 47 103 - 136 470 7 589 3 573 4 190 651Illinois . . . . . . . . . . . . . . . . . . . . . 698 674 250 9 106 20 270 15 800 46 899 91 051 53 647Indiana. . . . . . . . . . . . . . . . . . . . . 254 093 - 255 145 16 026 3 349 108 593 21 212Iowa. . . . . . . . . . . . . . . . . . . . . . . 159 275 1 87 489 14 372 21 229 17 060 2 950Kansas . . . . . . . . . . . . . . . . . . . . 141 679 - 81 - 17 457 159 18 722 590Kentucky . . . . . . . . . . . . . . . . . . . 164 080 89 825 297 2 441 6 014 170 751 179 748Louisiana . . . . . . . . . . . . . . . . . . . 172 494 - 184 2 131 196 467 1 356 21 808 12 368Maine. . . . . . . . . . . . . . . . . . . . . . 70 513 - 40 365 5 058 61 2 705 2 537
Maryland . . . . . . . . . . . . . . . . . . . 277 588 1 292 217 183 81 944 335 561 183 716 76 252 77 571Massachusetts. . . . . . . . . . . . . . . 389 831 - 2 830 23 351 136 341 217 033 50 824 6 527Michigan . . . . . . . . . . . . . . . . . . . 481 792 - 15 983 286 11 176 69 850 27 226 2 542Minnesota . . . . . . . . . . . . . . . . . . 273 594 - 536 862 11 044 3 574 25 618 2 929Mississippi . . . . . . . . . . . . . . . . . . 89 033 - -104 50 606 50 406 20 580 11 816Missouri . . . . . . . . . . . . . . . . . . . . 330 718 55 7 438 106 19 690 7 773 140 324 7 781Montana . . . . . . . . . . . . . . . . . . . 42 313 - 31 119 164 7 200 279 329 291Nebraska . . . . . . . . . . . . . . . . . . . 92 657 60 84 52 1 486 2 347 21 820 9 660Nevada . . . . . . . . . . . . . . . . . . . . 73 611 - 41 - 8 641 80 9 137 50New Hampshire . . . . . . . . . . . . . . 64 955 94 38 3 975 1 634 1 535 3 077 637
New Jersey . . . . . . . . . . . . . . . . . 499 076 - 53 573 5 739 248 667 39 470 49 303 8 221New Mexico. . . . . . . . . . . . . . . . . 71 991 - 1 667 43 7 032 11 267 11 401 2 521New York . . . . . . . . . . . . . . . . . . . 1 037 380 96 10 787 2 766 137 253 672 081 93 280 239 369North Carolina . . . . . . . . . . . . . . . 328 557 62 1 173 1 868 21 132 7 328 121 086 12 697North Dakota . . . . . . . . . . . . . . . . 34 581 - 1 614 - 32 3 894 1 905 146Ohio. . . . . . . . . . . . . . . . . . . . . . . 544 601 - 1 283 13 706 23 428 55 858 94 254 13 679Oklahoma . . . . . . . . . . . . . . . . . . 141 978 - 117 - 124 279 919 12 121 1 183Oregon . . . . . . . . . . . . . . . . . . . . 148 274 - 270 607 38 729 874 11 947 1 352Pennsylvania . . . . . . . . . . . . . . . . 649 624 -3 13 410 1 065 49 207 29 812 176 570 136 452Rhode Island . . . . . . . . . . . . . . . . 62 027 60 43 36 1 573 9 866 7 965 424
South Carolina. . . . . . . . . . . . . . . 133 393 - 236 1 791 15 478 843 17 993 12 136South Dakota. . . . . . . . . . . . . . . . 36 656 - 29 197 5 310 911 24 777 166Tennessee . . . . . . . . . . . . . . . . . . 247 313 7 275 91 19 091 48 865 97 744 1 028 031Texas. . . . . . . . . . . . . . . . . . . . . . 834 455 - 3 686 4 822 48 598 67 502 177 284 122 414Utah. . . . . . . . . . . . . . . . . . . . . . . 79 041 - 322 - 4 251 32 971 10 998 73 088Vermont . . . . . . . . . . . . . . . . . . . . 37 196 - 33 153 349 151 3 629 374Virginia . . . . . . . . . . . . . . . . . . . . 357 410 4 192 66 725 288 551 240 261 499 440 121 152 214 584Washington . . . . . . . . . . . . . . . . . 249 445 - 1 170 973 46 576 2 076 31 230 3 573West Virginia . . . . . . . . . . . . . . . . 84 584 - 111 110 13 818 89 606 17 882 24 838Wisconsin . . . . . . . . . . . . . . . . . . 243 859 - 183 279 61 929 3 105 59 980 6 431Wyoming . . . . . . . . . . . . . . . . . . . 21 377 - 27 - 16 139 566 2 847 60 555
American Samoa . . . . . . . . . . . . . - - - - - - - -Fed. States of Micronesia . . . . . . - - - - - - - 76Guam. . . . . . . . . . . . . . . . . . . . . . 2 004 - - 55 1 875 - - -Marshall Islands. . . . . . . . . . . . . . - - - - - - - -Northern Marianas. . . . . . . . . . . . 185 - - - - - - -Palau . . . . . . . . . . . . . . . . . . . . . . - - - - - - - -Puerto Rico . . . . . . . . . . . . . . . . . 53 258 - 270 - 7 548 4 139 12 377 867Virgin Islands. . . . . . . . . . . . . . . . 4 392 - - - - - 129 17
Undistributed1 . . . . . . . . . . . . . . . - - - - - - - 5 499 994
1Includes awards under $25,000 and classified location awards (Department of Defense).Note: Data shown for U.S. Postal Service represent actual outlays for contractual commitments, while all other amounts shown represent the value of contract actions,
and do not reflect Federal Government expenditures. Nonpostal data generally involve only current year contract actions; however, multiple-year obligations may bereflected for contract actions of less than 3 years duration. Amounts in parenthesis represent the deobligation of prior year contracts.
11Consolidated Federal Funds Report for Fiscal Year 1999
U.S. Census Bureau
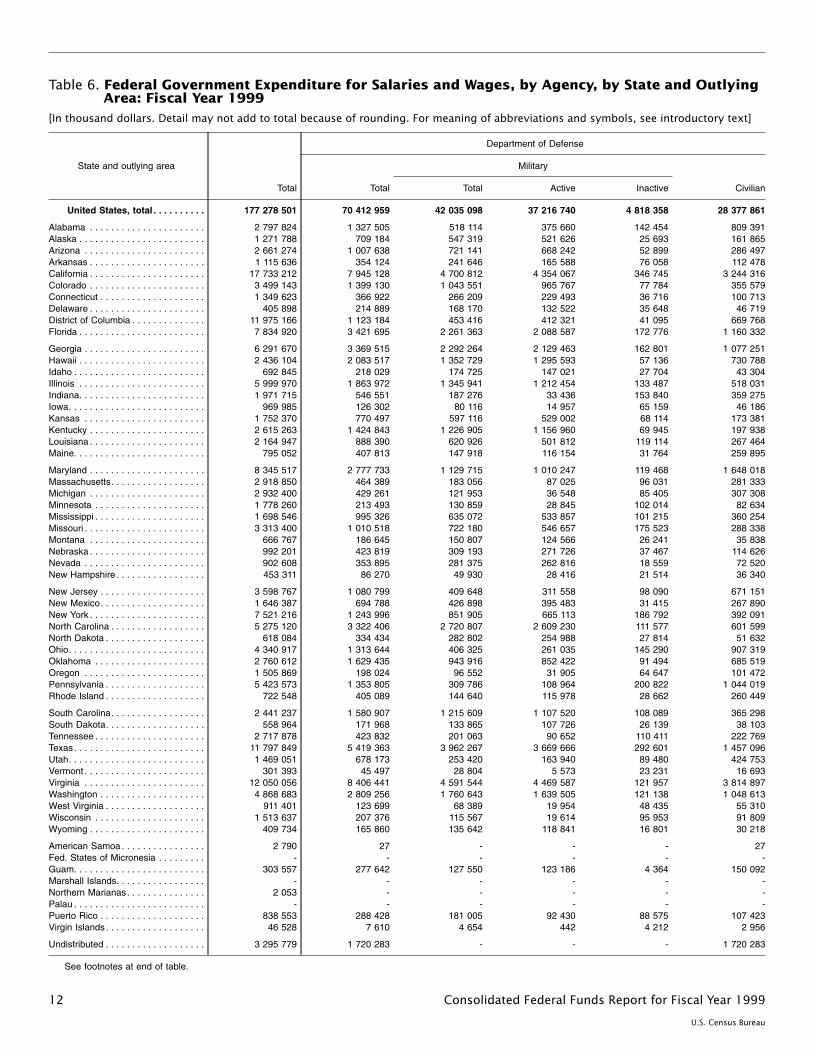
Table 6. Federal Government Expenditure for Salaries and Wages, by Agency, by State and OutlyingArea: Fiscal Year 1999
[In thousand dollars. Detail may not add to total because of rounding. For meaning of abbreviations and symbols, see introductory text]
State and outlying area
Total
Department of Defense
Total
Military
CivilianTotal Active Inactive
United States, total . . . . . . . . . . 177 278 501 70 412 959 42 035 098 37 216 740 4 818 358 28 377 861
Alabama . . . . . . . . . . . . . . . . . . . . . . 2 797 824 1 327 505 518 114 375 660 142 454 809 391Alaska . . . . . . . . . . . . . . . . . . . . . . . . 1 271 788 709 184 547 319 521 626 25 693 161 865Arizona . . . . . . . . . . . . . . . . . . . . . . . 2 661 274 1 007 638 721 141 668 242 52 899 286 497Arkansas . . . . . . . . . . . . . . . . . . . . . . 1 115 636 354 124 241 646 165 588 76 058 112 478California . . . . . . . . . . . . . . . . . . . . . . 17 733 212 7 945 128 4 700 812 4 354 067 346 745 3 244 316Colorado . . . . . . . . . . . . . . . . . . . . . . 3 499 143 1 399 130 1 043 551 965 767 77 784 355 579Connecticut . . . . . . . . . . . . . . . . . . . . 1 349 623 366 922 266 209 229 493 36 716 100 713Delaware . . . . . . . . . . . . . . . . . . . . . . 405 898 214 889 168 170 132 522 35 648 46 719District of Columbia . . . . . . . . . . . . . . 11 975 166 1 123 184 453 416 412 321 41 095 669 768Florida . . . . . . . . . . . . . . . . . . . . . . . . 7 834 920 3 421 695 2 261 363 2 088 587 172 776 1 160 332
Georgia . . . . . . . . . . . . . . . . . . . . . . . 6 291 670 3 369 515 2 292 264 2 129 463 162 801 1 077 251Hawaii . . . . . . . . . . . . . . . . . . . . . . . . 2 436 104 2 083 517 1 352 729 1 295 593 57 136 730 788Idaho . . . . . . . . . . . . . . . . . . . . . . . . . 692 845 218 029 174 725 147 021 27 704 43 304Illinois . . . . . . . . . . . . . . . . . . . . . . . . 5 999 970 1 863 972 1 345 941 1 212 454 133 487 518 031Indiana. . . . . . . . . . . . . . . . . . . . . . . . 1 971 715 546 551 187 276 33 436 153 840 359 275Iowa. . . . . . . . . . . . . . . . . . . . . . . . . . 969 985 126 302 80 116 14 957 65 159 46 186Kansas . . . . . . . . . . . . . . . . . . . . . . . 1 752 370 770 497 597 116 529 002 68 114 173 381Kentucky . . . . . . . . . . . . . . . . . . . . . . 2 615 263 1 424 843 1 226 905 1 156 960 69 945 197 938Louisiana . . . . . . . . . . . . . . . . . . . . . . 2 164 947 888 390 620 926 501 812 119 114 267 464Maine. . . . . . . . . . . . . . . . . . . . . . . . . 795 052 407 813 147 918 116 154 31 764 259 895
Maryland . . . . . . . . . . . . . . . . . . . . . . 8 345 517 2 777 733 1 129 715 1 010 247 119 468 1 648 018Massachusetts. . . . . . . . . . . . . . . . . . 2 918 850 464 389 183 056 87 025 96 031 281 333Michigan . . . . . . . . . . . . . . . . . . . . . . 2 932 400 429 261 121 953 36 548 85 405 307 308Minnesota . . . . . . . . . . . . . . . . . . . . . 1 778 260 213 493 130 859 28 845 102 014 82 634Mississippi . . . . . . . . . . . . . . . . . . . . . 1 698 546 995 326 635 072 533 857 101 215 360 254Missouri . . . . . . . . . . . . . . . . . . . . . . . 3 313 400 1 010 518 722 180 546 657 175 523 288 338Montana . . . . . . . . . . . . . . . . . . . . . . 666 767 186 645 150 807 124 566 26 241 35 838Nebraska . . . . . . . . . . . . . . . . . . . . . . 992 201 423 819 309 193 271 726 37 467 114 626Nevada . . . . . . . . . . . . . . . . . . . . . . . 902 608 353 895 281 375 262 816 18 559 72 520New Hampshire . . . . . . . . . . . . . . . . . 453 311 86 270 49 930 28 416 21 514 36 340
New Jersey . . . . . . . . . . . . . . . . . . . . 3 598 767 1 080 799 409 648 311 558 98 090 671 151New Mexico. . . . . . . . . . . . . . . . . . . . 1 646 387 694 788 426 898 395 483 31 415 267 890New York . . . . . . . . . . . . . . . . . . . . . . 7 521 216 1 243 996 851 905 665 113 186 792 392 091North Carolina . . . . . . . . . . . . . . . . . . 5 275 120 3 322 406 2 720 807 2 609 230 111 577 601 599North Dakota . . . . . . . . . . . . . . . . . . . 618 084 334 434 282 802 254 988 27 814 51 632Ohio. . . . . . . . . . . . . . . . . . . . . . . . . . 4 340 917 1 313 644 406 325 261 035 145 290 907 319Oklahoma . . . . . . . . . . . . . . . . . . . . . 2 760 612 1 629 435 943 916 852 422 91 494 685 519Oregon . . . . . . . . . . . . . . . . . . . . . . . 1 505 869 198 024 96 552 31 905 64 647 101 472Pennsylvania . . . . . . . . . . . . . . . . . . . 5 423 573 1 353 805 309 786 108 964 200 822 1 044 019Rhode Island . . . . . . . . . . . . . . . . . . . 722 548 405 089 144 640 115 978 28 662 260 449
South Carolina. . . . . . . . . . . . . . . . . . 2 441 237 1 580 907 1 215 609 1 107 520 108 089 365 298South Dakota. . . . . . . . . . . . . . . . . . . 558 964 171 968 133 865 107 726 26 139 38 103Tennessee . . . . . . . . . . . . . . . . . . . . . 2 717 878 423 832 201 063 90 652 110 411 222 769Texas. . . . . . . . . . . . . . . . . . . . . . . . . 11 797 849 5 419 363 3 962 267 3 669 666 292 601 1 457 096Utah. . . . . . . . . . . . . . . . . . . . . . . . . . 1 469 051 678 173 253 420 163 940 89 480 424 753Vermont . . . . . . . . . . . . . . . . . . . . . . . 301 393 45 497 28 804 5 573 23 231 16 693Virginia . . . . . . . . . . . . . . . . . . . . . . . 12 050 056 8 406 441 4 591 544 4 469 587 121 957 3 814 897Washington . . . . . . . . . . . . . . . . . . . . 4 868 683 2 809 256 1 760 643 1 639 505 121 138 1 048 613West Virginia . . . . . . . . . . . . . . . . . . . 911 401 123 699 68 389 19 954 48 435 55 310Wisconsin . . . . . . . . . . . . . . . . . . . . . 1 513 637 207 376 115 567 19 614 95 953 91 809Wyoming . . . . . . . . . . . . . . . . . . . . . . 409 734 165 860 135 642 118 841 16 801 30 218
American Samoa . . . . . . . . . . . . . . . . 2 790 27 - - - 27Fed. States of Micronesia . . . . . . . . . - - - - - -Guam. . . . . . . . . . . . . . . . . . . . . . . . . 303 557 277 642 127 550 123 186 4 364 150 092Marshall Islands. . . . . . . . . . . . . . . . . - - - - - -Northern Marianas. . . . . . . . . . . . . . . 2 053 - - - - -Palau . . . . . . . . . . . . . . . . . . . . . . . . . - - - - - -Puerto Rico . . . . . . . . . . . . . . . . . . . . 838 553 288 428 181 005 92 430 88 575 107 423Virgin Islands. . . . . . . . . . . . . . . . . . . 46 528 7 610 4 654 442 4 212 2 956
Undistributed . . . . . . . . . . . . . . . . . . . 3 295 779 1 720 283 - - - 1 720 283
See footnotes at end of table.
12 Consolidated Federal Funds Report for Fiscal Year 1999
U.S. Census Bureau
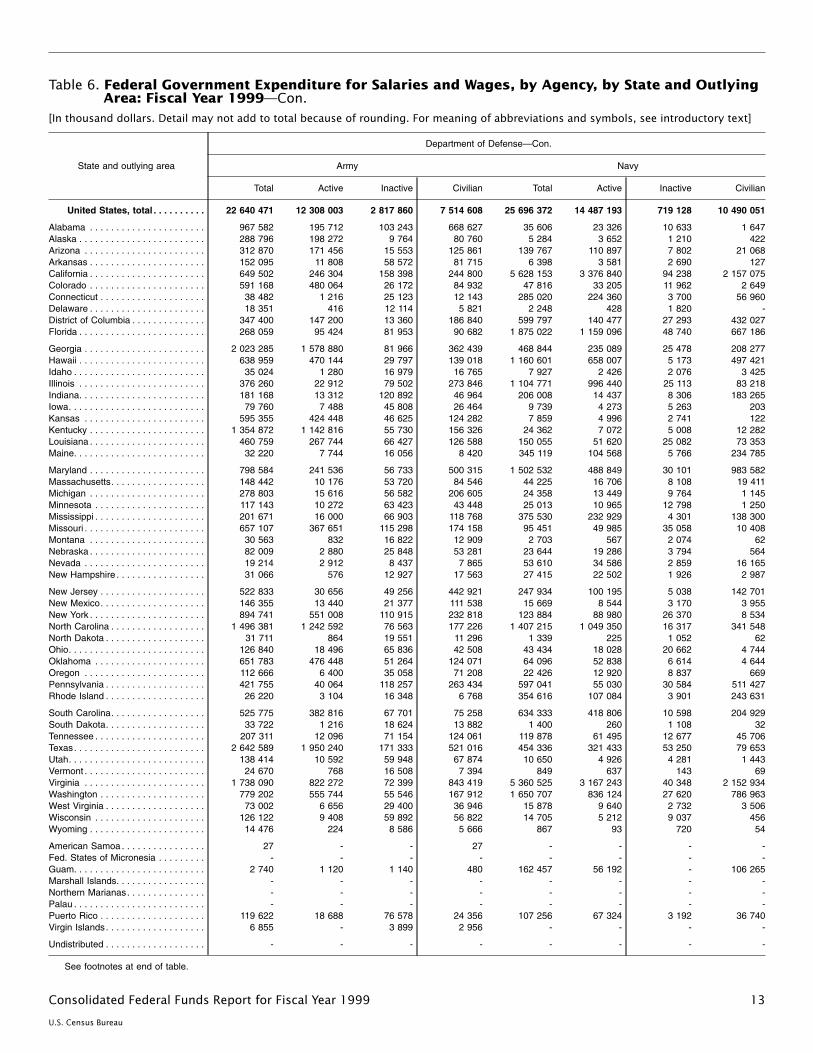
Table 6. Federal Government Expenditure for Salaries and Wages, by Agency, by State and OutlyingArea: Fiscal Year 1999—Con.
[In thousand dollars. Detail may not add to total because of rounding. For meaning of abbreviations and symbols, see introductory text]
State and outlying area
Department of Defense— Con.
Army Navy
Total Active Inactive Civilian Total Active Inactive Civilian
United States, total . . . . . . . . . . 22 640 471 12 308 003 2 817 860 7 514 608 25 696 372 14 487 193 719 128 10 490 051
Alabama . . . . . . . . . . . . . . . . . . . . . . 967 582 195 712 103 243 668 627 35 606 23 326 10 633 1 647Alaska . . . . . . . . . . . . . . . . . . . . . . . . 288 796 198 272 9 764 80 760 5 284 3 652 1 210 422Arizona . . . . . . . . . . . . . . . . . . . . . . . 312 870 171 456 15 553 125 861 139 767 110 897 7 802 21 068Arkansas . . . . . . . . . . . . . . . . . . . . . . 152 095 11 808 58 572 81 715 6 398 3 581 2 690 127California . . . . . . . . . . . . . . . . . . . . . . 649 502 246 304 158 398 244 800 5 628 153 3 376 840 94 238 2 157 075Colorado . . . . . . . . . . . . . . . . . . . . . . 591 168 480 064 26 172 84 932 47 816 33 205 11 962 2 649Connecticut . . . . . . . . . . . . . . . . . . . . 38 482 1 216 25 123 12 143 285 020 224 360 3 700 56 960Delaware . . . . . . . . . . . . . . . . . . . . . . 18 351 416 12 114 5 821 2 248 428 1 820 -District of Columbia . . . . . . . . . . . . . . 347 400 147 200 13 360 186 840 599 797 140 477 27 293 432 027Florida . . . . . . . . . . . . . . . . . . . . . . . . 268 059 95 424 81 953 90 682 1 875 022 1 159 096 48 740 667 186
Georgia . . . . . . . . . . . . . . . . . . . . . . . 2 023 285 1 578 880 81 966 362 439 468 844 235 089 25 478 208 277Hawaii . . . . . . . . . . . . . . . . . . . . . . . . 638 959 470 144 29 797 139 018 1 160 601 658 007 5 173 497 421Idaho . . . . . . . . . . . . . . . . . . . . . . . . . 35 024 1 280 16 979 16 765 7 927 2 426 2 076 3 425Illinois . . . . . . . . . . . . . . . . . . . . . . . . 376 260 22 912 79 502 273 846 1 104 771 996 440 25 113 83 218Indiana. . . . . . . . . . . . . . . . . . . . . . . . 181 168 13 312 120 892 46 964 206 008 14 437 8 306 183 265Iowa. . . . . . . . . . . . . . . . . . . . . . . . . . 79 760 7 488 45 808 26 464 9 739 4 273 5 263 203Kansas . . . . . . . . . . . . . . . . . . . . . . . 595 355 424 448 46 625 124 282 7 859 4 996 2 741 122Kentucky . . . . . . . . . . . . . . . . . . . . . . 1 354 872 1 142 816 55 730 156 326 24 362 7 072 5 008 12 282Louisiana . . . . . . . . . . . . . . . . . . . . . . 460 759 267 744 66 427 126 588 150 055 51 620 25 082 73 353Maine. . . . . . . . . . . . . . . . . . . . . . . . . 32 220 7 744 16 056 8 420 345 119 104 568 5 766 234 785
Maryland . . . . . . . . . . . . . . . . . . . . . . 798 584 241 536 56 733 500 315 1 502 532 488 849 30 101 983 582Massachusetts. . . . . . . . . . . . . . . . . . 148 442 10 176 53 720 84 546 44 225 16 706 8 108 19 411Michigan . . . . . . . . . . . . . . . . . . . . . . 278 803 15 616 56 582 206 605 24 358 13 449 9 764 1 145Minnesota . . . . . . . . . . . . . . . . . . . . . 117 143 10 272 63 423 43 448 25 013 10 965 12 798 1 250Mississippi . . . . . . . . . . . . . . . . . . . . . 201 671 16 000 66 903 118 768 375 530 232 929 4 301 138 300Missouri . . . . . . . . . . . . . . . . . . . . . . . 657 107 367 651 115 298 174 158 95 451 49 985 35 058 10 408Montana . . . . . . . . . . . . . . . . . . . . . . 30 563 832 16 822 12 909 2 703 567 2 074 62Nebraska . . . . . . . . . . . . . . . . . . . . . . 82 009 2 880 25 848 53 281 23 644 19 286 3 794 564Nevada . . . . . . . . . . . . . . . . . . . . . . . 19 214 2 912 8 437 7 865 53 610 34 586 2 859 16 165New Hampshire . . . . . . . . . . . . . . . . . 31 066 576 12 927 17 563 27 415 22 502 1 926 2 987
New Jersey . . . . . . . . . . . . . . . . . . . . 522 833 30 656 49 256 442 921 247 934 100 195 5 038 142 701New Mexico. . . . . . . . . . . . . . . . . . . . 146 355 13 440 21 377 111 538 15 669 8 544 3 170 3 955New York . . . . . . . . . . . . . . . . . . . . . . 894 741 551 008 110 915 232 818 123 884 88 980 26 370 8 534North Carolina . . . . . . . . . . . . . . . . . . 1 496 381 1 242 592 76 563 177 226 1 407 215 1 049 350 16 317 341 548North Dakota . . . . . . . . . . . . . . . . . . . 31 711 864 19 551 11 296 1 339 225 1 052 62Ohio. . . . . . . . . . . . . . . . . . . . . . . . . . 126 840 18 496 65 836 42 508 43 434 18 028 20 662 4 744Oklahoma . . . . . . . . . . . . . . . . . . . . . 651 783 476 448 51 264 124 071 64 096 52 838 6 614 4 644Oregon . . . . . . . . . . . . . . . . . . . . . . . 112 666 6 400 35 058 71 208 22 426 12 920 8 837 669Pennsylvania . . . . . . . . . . . . . . . . . . . 421 755 40 064 118 257 263 434 597 041 55 030 30 584 511 427Rhode Island . . . . . . . . . . . . . . . . . . . 26 220 3 104 16 348 6 768 354 616 107 084 3 901 243 631
South Carolina. . . . . . . . . . . . . . . . . . 525 775 382 816 67 701 75 258 634 333 418 806 10 598 204 929South Dakota. . . . . . . . . . . . . . . . . . . 33 722 1 216 18 624 13 882 1 400 260 1 108 32Tennessee . . . . . . . . . . . . . . . . . . . . . 207 311 12 096 71 154 124 061 119 878 61 495 12 677 45 706Texas. . . . . . . . . . . . . . . . . . . . . . . . . 2 642 589 1 950 240 171 333 521 016 454 336 321 433 53 250 79 653Utah. . . . . . . . . . . . . . . . . . . . . . . . . . 138 414 10 592 59 948 67 874 10 650 4 926 4 281 1 443Vermont . . . . . . . . . . . . . . . . . . . . . . . 24 670 768 16 508 7 394 849 637 143 69Virginia . . . . . . . . . . . . . . . . . . . . . . . 1 738 090 822 272 72 399 843 419 5 360 525 3 167 243 40 348 2 152 934Washington . . . . . . . . . . . . . . . . . . . . 779 202 555 744 55 546 167 912 1 650 707 836 124 27 620 786 963West Virginia . . . . . . . . . . . . . . . . . . . 73 002 6 656 29 400 36 946 15 878 9 640 2 732 3 506Wisconsin . . . . . . . . . . . . . . . . . . . . . 126 122 9 408 59 892 56 822 14 705 5 212 9 037 456Wyoming . . . . . . . . . . . . . . . . . . . . . . 14 476 224 8 586 5 666 867 93 720 54
American Samoa . . . . . . . . . . . . . . . . 27 - - 27 - - - -Fed. States of Micronesia . . . . . . . . . - - - - - - - -Guam. . . . . . . . . . . . . . . . . . . . . . . . . 2 740 1 120 1 140 480 162 457 56 192 - 106 265Marshall Islands. . . . . . . . . . . . . . . . . - - - - - - - -Northern Marianas. . . . . . . . . . . . . . . - - - - - - - -Palau . . . . . . . . . . . . . . . . . . . . . . . . . - - - - - - - -Puerto Rico . . . . . . . . . . . . . . . . . . . . 119 622 18 688 76 578 24 356 107 256 67 324 3 192 36 740Virgin Islands. . . . . . . . . . . . . . . . . . . 6 855 - 3 899 2 956 - - - -
Undistributed . . . . . . . . . . . . . . . . . . . - - - - - - - -
See footnotes at end of table.
13Consolidated Federal Funds Report for Fiscal Year 1999
U.S. Census Bureau
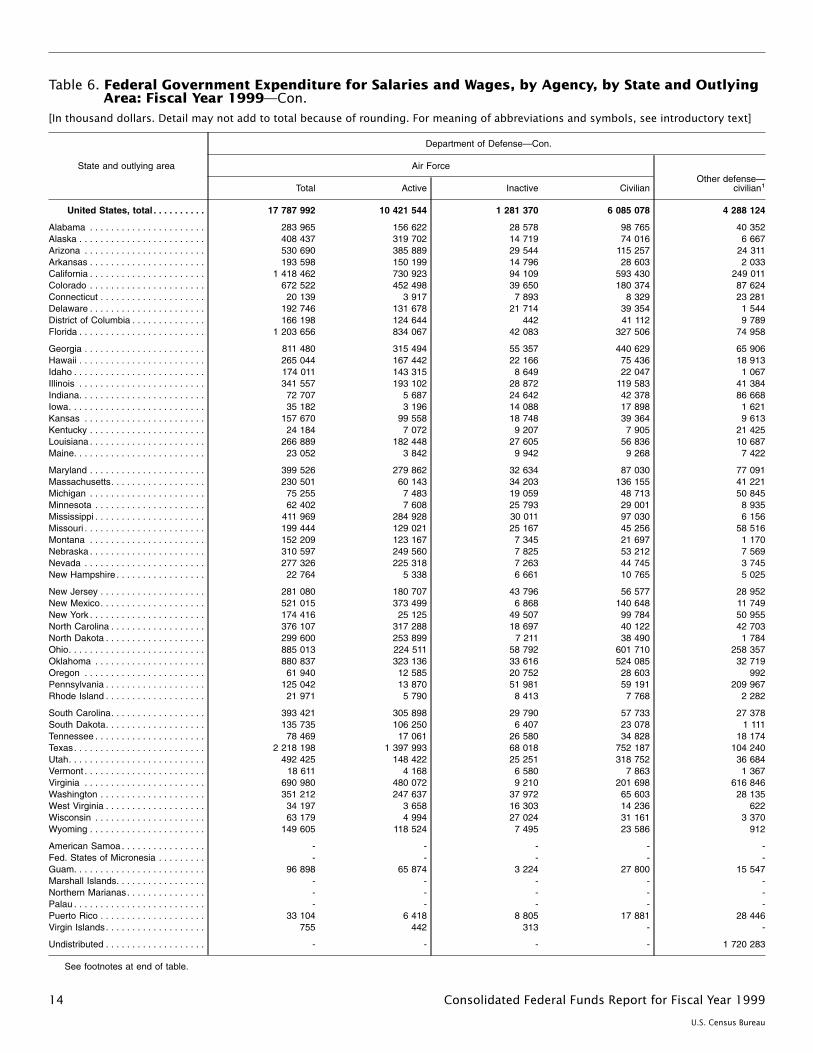
Table 6. Federal Government Expenditure for Salaries and Wages, by Agency, by State and OutlyingArea: Fiscal Year 1999—Con.
[In thousand dollars. Detail may not add to total because of rounding. For meaning of abbreviations and symbols, see introductory text]
State and outlying area
Department of Defense— Con.
Air ForceOther defense—
civilian1Total Active Inactive Civilian
United States, total . . . . . . . . . . 17 787 992 10 421 544 1 281 370 6 085 078 4 288 124
Alabama . . . . . . . . . . . . . . . . . . . . . . 283 965 156 622 28 578 98 765 40 352Alaska . . . . . . . . . . . . . . . . . . . . . . . . 408 437 319 702 14 719 74 016 6 667Arizona . . . . . . . . . . . . . . . . . . . . . . . 530 690 385 889 29 544 115 257 24 311Arkansas . . . . . . . . . . . . . . . . . . . . . . 193 598 150 199 14 796 28 603 2 033California . . . . . . . . . . . . . . . . . . . . . . 1 418 462 730 923 94 109 593 430 249 011Colorado . . . . . . . . . . . . . . . . . . . . . . 672 522 452 498 39 650 180 374 87 624Connecticut . . . . . . . . . . . . . . . . . . . . 20 139 3 917 7 893 8 329 23 281Delaware . . . . . . . . . . . . . . . . . . . . . . 192 746 131 678 21 714 39 354 1 544District of Columbia . . . . . . . . . . . . . . 166 198 124 644 442 41 112 9 789Florida . . . . . . . . . . . . . . . . . . . . . . . . 1 203 656 834 067 42 083 327 506 74 958
Georgia . . . . . . . . . . . . . . . . . . . . . . . 811 480 315 494 55 357 440 629 65 906Hawaii . . . . . . . . . . . . . . . . . . . . . . . . 265 044 167 442 22 166 75 436 18 913Idaho . . . . . . . . . . . . . . . . . . . . . . . . . 174 011 143 315 8 649 22 047 1 067Illinois . . . . . . . . . . . . . . . . . . . . . . . . 341 557 193 102 28 872 119 583 41 384Indiana. . . . . . . . . . . . . . . . . . . . . . . . 72 707 5 687 24 642 42 378 86 668Iowa. . . . . . . . . . . . . . . . . . . . . . . . . . 35 182 3 196 14 088 17 898 1 621Kansas . . . . . . . . . . . . . . . . . . . . . . . 157 670 99 558 18 748 39 364 9 613Kentucky . . . . . . . . . . . . . . . . . . . . . . 24 184 7 072 9 207 7 905 21 425Louisiana . . . . . . . . . . . . . . . . . . . . . . 266 889 182 448 27 605 56 836 10 687Maine. . . . . . . . . . . . . . . . . . . . . . . . . 23 052 3 842 9 942 9 268 7 422
Maryland . . . . . . . . . . . . . . . . . . . . . . 399 526 279 862 32 634 87 030 77 091Massachusetts. . . . . . . . . . . . . . . . . . 230 501 60 143 34 203 136 155 41 221Michigan . . . . . . . . . . . . . . . . . . . . . . 75 255 7 483 19 059 48 713 50 845Minnesota . . . . . . . . . . . . . . . . . . . . . 62 402 7 608 25 793 29 001 8 935Mississippi . . . . . . . . . . . . . . . . . . . . . 411 969 284 928 30 011 97 030 6 156Missouri . . . . . . . . . . . . . . . . . . . . . . . 199 444 129 021 25 167 45 256 58 516Montana . . . . . . . . . . . . . . . . . . . . . . 152 209 123 167 7 345 21 697 1 170Nebraska . . . . . . . . . . . . . . . . . . . . . . 310 597 249 560 7 825 53 212 7 569Nevada . . . . . . . . . . . . . . . . . . . . . . . 277 326 225 318 7 263 44 745 3 745New Hampshire . . . . . . . . . . . . . . . . . 22 764 5 338 6 661 10 765 5 025
New Jersey . . . . . . . . . . . . . . . . . . . . 281 080 180 707 43 796 56 577 28 952New Mexico. . . . . . . . . . . . . . . . . . . . 521 015 373 499 6 868 140 648 11 749New York . . . . . . . . . . . . . . . . . . . . . . 174 416 25 125 49 507 99 784 50 955North Carolina . . . . . . . . . . . . . . . . . . 376 107 317 288 18 697 40 122 42 703North Dakota . . . . . . . . . . . . . . . . . . . 299 600 253 899 7 211 38 490 1 784Ohio. . . . . . . . . . . . . . . . . . . . . . . . . . 885 013 224 511 58 792 601 710 258 357Oklahoma . . . . . . . . . . . . . . . . . . . . . 880 837 323 136 33 616 524 085 32 719Oregon . . . . . . . . . . . . . . . . . . . . . . . 61 940 12 585 20 752 28 603 992Pennsylvania . . . . . . . . . . . . . . . . . . . 125 042 13 870 51 981 59 191 209 967Rhode Island . . . . . . . . . . . . . . . . . . . 21 971 5 790 8 413 7 768 2 282
South Carolina. . . . . . . . . . . . . . . . . . 393 421 305 898 29 790 57 733 27 378South Dakota. . . . . . . . . . . . . . . . . . . 135 735 106 250 6 407 23 078 1 111Tennessee . . . . . . . . . . . . . . . . . . . . . 78 469 17 061 26 580 34 828 18 174Texas. . . . . . . . . . . . . . . . . . . . . . . . . 2 218 198 1 397 993 68 018 752 187 104 240Utah. . . . . . . . . . . . . . . . . . . . . . . . . . 492 425 148 422 25 251 318 752 36 684Vermont . . . . . . . . . . . . . . . . . . . . . . . 18 611 4 168 6 580 7 863 1 367Virginia . . . . . . . . . . . . . . . . . . . . . . . 690 980 480 072 9 210 201 698 616 846Washington . . . . . . . . . . . . . . . . . . . . 351 212 247 637 37 972 65 603 28 135West Virginia . . . . . . . . . . . . . . . . . . . 34 197 3 658 16 303 14 236 622Wisconsin . . . . . . . . . . . . . . . . . . . . . 63 179 4 994 27 024 31 161 3 370Wyoming . . . . . . . . . . . . . . . . . . . . . . 149 605 118 524 7 495 23 586 912
American Samoa . . . . . . . . . . . . . . . . - - - - -Fed. States of Micronesia . . . . . . . . . - - - - -Guam. . . . . . . . . . . . . . . . . . . . . . . . . 96 898 65 874 3 224 27 800 15 547Marshall Islands. . . . . . . . . . . . . . . . . - - - - -Northern Marianas. . . . . . . . . . . . . . . - - - - -Palau . . . . . . . . . . . . . . . . . . . . . . . . . - - - - -Puerto Rico . . . . . . . . . . . . . . . . . . . . 33 104 6 418 8 805 17 881 28 446Virgin Islands. . . . . . . . . . . . . . . . . . . 755 442 313 - -
Undistributed . . . . . . . . . . . . . . . . . . . - - - - 1 720 283
See footnotes at end of table.
14 Consolidated Federal Funds Report for Fiscal Year 1999
U.S. Census Bureau
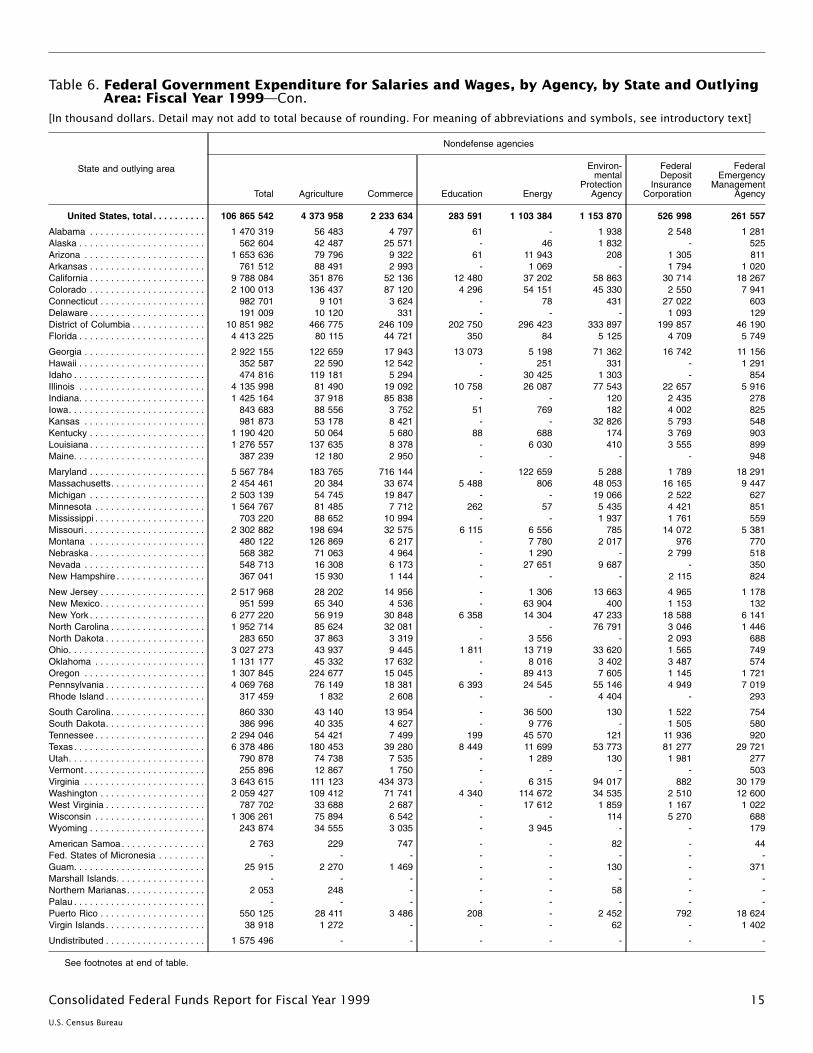
Table 6. Federal Government Expenditure for Salaries and Wages, by Agency, by State and OutlyingArea: Fiscal Year 1999—Con.
[In thousand dollars. Detail may not add to total because of rounding. For meaning of abbreviations and symbols, see introductory text]
State and outlying area
Nondefense agencies
Total Agriculture Commerce Education Energy
Environ-mental
ProtectionAgency
FederalDeposit
InsuranceCorporation
FederalEmergency
ManagementAgency
United States, total . . . . . . . . . . 106 865 542 4 373 958 2 233 634 283 591 1 103 384 1 153 870 526 998 261 557
Alabama . . . . . . . . . . . . . . . . . . . . . . 1 470 319 56 483 4 797 61 - 1 938 2 548 1 281Alaska . . . . . . . . . . . . . . . . . . . . . . . . 562 604 42 487 25 571 - 46 1 832 - 525Arizona . . . . . . . . . . . . . . . . . . . . . . . 1 653 636 79 796 9 322 61 11 943 208 1 305 811Arkansas . . . . . . . . . . . . . . . . . . . . . . 761 512 88 491 2 993 - 1 069 - 1 794 1 020California . . . . . . . . . . . . . . . . . . . . . . 9 788 084 351 876 52 136 12 480 37 202 58 863 30 714 18 267Colorado . . . . . . . . . . . . . . . . . . . . . . 2 100 013 136 437 87 120 4 296 54 151 45 330 2 550 7 941Connecticut . . . . . . . . . . . . . . . . . . . . 982 701 9 101 3 624 - 78 431 27 022 603Delaware . . . . . . . . . . . . . . . . . . . . . . 191 009 10 120 331 - - - 1 093 129District of Columbia . . . . . . . . . . . . . . 10 851 982 466 775 246 109 202 750 296 423 333 897 199 857 46 190Florida . . . . . . . . . . . . . . . . . . . . . . . . 4 413 225 80 115 44 721 350 84 5 125 4 709 5 749
Georgia . . . . . . . . . . . . . . . . . . . . . . . 2 922 155 122 659 17 943 13 073 5 198 71 362 16 742 11 156Hawaii . . . . . . . . . . . . . . . . . . . . . . . . 352 587 22 590 12 542 - 251 331 - 1 291Idaho . . . . . . . . . . . . . . . . . . . . . . . . . 474 816 119 181 5 294 - 30 425 1 303 - 854Illinois . . . . . . . . . . . . . . . . . . . . . . . . 4 135 998 81 490 19 092 10 758 26 087 77 543 22 657 5 916Indiana. . . . . . . . . . . . . . . . . . . . . . . . 1 425 164 37 918 85 838 - - 120 2 435 278Iowa. . . . . . . . . . . . . . . . . . . . . . . . . . 843 683 88 556 3 752 51 769 182 4 002 825Kansas . . . . . . . . . . . . . . . . . . . . . . . 981 873 53 178 8 421 - - 32 826 5 793 548Kentucky . . . . . . . . . . . . . . . . . . . . . . 1 190 420 50 064 5 680 88 688 174 3 769 903Louisiana . . . . . . . . . . . . . . . . . . . . . . 1 276 557 137 635 8 378 - 6 030 410 3 555 899Maine. . . . . . . . . . . . . . . . . . . . . . . . . 387 239 12 180 2 950 - - - - 948
Maryland . . . . . . . . . . . . . . . . . . . . . . 5 567 784 183 765 716 144 - 122 659 5 288 1 789 18 291Massachusetts. . . . . . . . . . . . . . . . . . 2 454 461 20 384 33 674 5 488 806 48 053 16 165 9 447Michigan . . . . . . . . . . . . . . . . . . . . . . 2 503 139 54 745 19 847 - - 19 066 2 522 627Minnesota . . . . . . . . . . . . . . . . . . . . . 1 564 767 81 485 7 712 262 57 5 435 4 421 851Mississippi . . . . . . . . . . . . . . . . . . . . . 703 220 88 652 10 994 - - 1 937 1 761 559Missouri . . . . . . . . . . . . . . . . . . . . . . . 2 302 882 198 694 32 575 6 115 6 556 785 14 072 5 381Montana . . . . . . . . . . . . . . . . . . . . . . 480 122 126 869 6 217 - 7 780 2 017 976 770Nebraska . . . . . . . . . . . . . . . . . . . . . . 568 382 71 063 4 964 - 1 290 - 2 799 518Nevada . . . . . . . . . . . . . . . . . . . . . . . 548 713 16 308 6 173 - 27 651 9 687 - 350New Hampshire . . . . . . . . . . . . . . . . . 367 041 15 930 1 144 - - - 2 115 824
New Jersey . . . . . . . . . . . . . . . . . . . . 2 517 968 28 202 14 956 - 1 306 13 663 4 965 1 178New Mexico. . . . . . . . . . . . . . . . . . . . 951 599 65 340 4 536 - 63 904 400 1 153 132New York . . . . . . . . . . . . . . . . . . . . . . 6 277 220 56 919 30 848 6 358 14 304 47 233 18 588 6 141North Carolina . . . . . . . . . . . . . . . . . . 1 952 714 85 624 32 081 - - 76 791 3 046 1 446North Dakota . . . . . . . . . . . . . . . . . . . 283 650 37 863 3 319 - 3 556 - 2 093 688Ohio. . . . . . . . . . . . . . . . . . . . . . . . . . 3 027 273 43 937 9 445 1 811 13 719 33 620 1 565 749Oklahoma . . . . . . . . . . . . . . . . . . . . . 1 131 177 45 332 17 632 - 8 016 3 402 3 487 574Oregon . . . . . . . . . . . . . . . . . . . . . . . 1 307 845 224 677 15 045 - 89 413 7 605 1 145 1 721Pennsylvania . . . . . . . . . . . . . . . . . . . 4 069 768 76 149 18 381 6 393 24 545 55 146 4 949 7 019Rhode Island . . . . . . . . . . . . . . . . . . . 317 459 1 832 2 608 - - 4 404 - 293
South Carolina. . . . . . . . . . . . . . . . . . 860 330 43 140 13 954 - 36 500 130 1 522 754South Dakota. . . . . . . . . . . . . . . . . . . 386 996 40 335 4 627 - 9 776 - 1 505 580Tennessee . . . . . . . . . . . . . . . . . . . . . 2 294 046 54 421 7 499 199 45 570 121 11 936 920Texas. . . . . . . . . . . . . . . . . . . . . . . . . 6 378 486 180 453 39 280 8 449 11 699 53 773 81 277 29 721Utah. . . . . . . . . . . . . . . . . . . . . . . . . . 790 878 74 738 7 535 - 1 289 130 1 981 277Vermont . . . . . . . . . . . . . . . . . . . . . . . 255 896 12 867 1 750 - - - - 503Virginia . . . . . . . . . . . . . . . . . . . . . . . 3 643 615 111 123 434 373 - 6 315 94 017 882 30 179Washington . . . . . . . . . . . . . . . . . . . . 2 059 427 109 412 71 741 4 340 114 672 34 535 2 510 12 600West Virginia . . . . . . . . . . . . . . . . . . . 787 702 33 688 2 687 - 17 612 1 859 1 167 1 022Wisconsin . . . . . . . . . . . . . . . . . . . . . 1 306 261 75 894 6 542 - - 114 5 270 688Wyoming . . . . . . . . . . . . . . . . . . . . . . 243 874 34 555 3 035 - 3 945 - - 179
American Samoa . . . . . . . . . . . . . . . . 2 763 229 747 - - 82 - 44Fed. States of Micronesia . . . . . . . . . - - - - - - - -Guam. . . . . . . . . . . . . . . . . . . . . . . . . 25 915 2 270 1 469 - - 130 - 371Marshall Islands. . . . . . . . . . . . . . . . . - - - - - - - -Northern Marianas. . . . . . . . . . . . . . . 2 053 248 - - - 58 - -Palau . . . . . . . . . . . . . . . . . . . . . . . . . - - - - - - - -Puerto Rico . . . . . . . . . . . . . . . . . . . . 550 125 28 411 3 486 208 - 2 452 792 18 624Virgin Islands. . . . . . . . . . . . . . . . . . . 38 918 1 272 - - - 62 - 1 402
Undistributed . . . . . . . . . . . . . . . . . . . 1 575 496 - - - - - - -
See footnotes at end of table.
15Consolidated Federal Funds Report for Fiscal Year 1999
U.S. Census Bureau
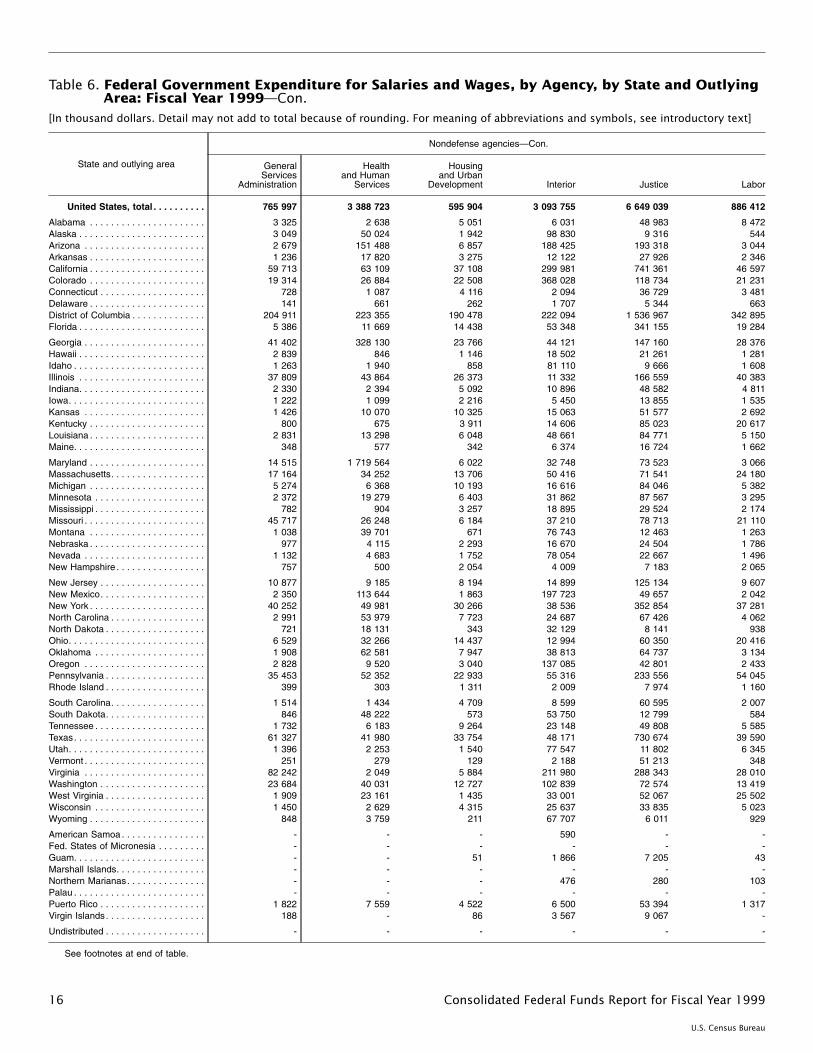
Table 6. Federal Government Expenditure for Salaries and Wages, by Agency, by State and OutlyingArea: Fiscal Year 1999—Con.
[In thousand dollars. Detail may not add to total because of rounding. For meaning of abbreviations and symbols, see introductory text]
State and outlying area
Nondefense agencies— Con.
GeneralServices
Administration
Healthand Human
Services
Housingand Urban
Development Interior Justice Labor
United States, total . . . . . . . . . . 765 997 3 388 723 595 904 3 093 755 6 649 039 886 412
Alabama . . . . . . . . . . . . . . . . . . . . . . 3 325 2 638 5 051 6 031 48 983 8 472Alaska . . . . . . . . . . . . . . . . . . . . . . . . 3 049 50 024 1 942 98 830 9 316 544Arizona . . . . . . . . . . . . . . . . . . . . . . . 2 679 151 488 6 857 188 425 193 318 3 044Arkansas . . . . . . . . . . . . . . . . . . . . . . 1 236 17 820 3 275 12 122 27 926 2 346California . . . . . . . . . . . . . . . . . . . . . . 59 713 63 109 37 108 299 981 741 361 46 597Colorado . . . . . . . . . . . . . . . . . . . . . . 19 314 26 884 22 508 368 028 118 734 21 231Connecticut . . . . . . . . . . . . . . . . . . . . 728 1 087 4 116 2 094 36 729 3 481Delaware . . . . . . . . . . . . . . . . . . . . . . 141 661 262 1 707 5 344 663District of Columbia . . . . . . . . . . . . . . 204 911 223 355 190 478 222 094 1 536 967 342 895Florida . . . . . . . . . . . . . . . . . . . . . . . . 5 386 11 669 14 438 53 348 341 155 19 284
Georgia . . . . . . . . . . . . . . . . . . . . . . . 41 402 328 130 23 766 44 121 147 160 28 376Hawaii . . . . . . . . . . . . . . . . . . . . . . . . 2 839 846 1 146 18 502 21 261 1 281Idaho . . . . . . . . . . . . . . . . . . . . . . . . . 1 263 1 940 858 81 110 9 666 1 608Illinois . . . . . . . . . . . . . . . . . . . . . . . . 37 809 43 864 26 373 11 332 166 559 40 383Indiana. . . . . . . . . . . . . . . . . . . . . . . . 2 330 2 394 5 092 10 896 48 582 4 811Iowa. . . . . . . . . . . . . . . . . . . . . . . . . . 1 222 1 099 2 216 5 450 13 855 1 535Kansas . . . . . . . . . . . . . . . . . . . . . . . 1 426 10 070 10 325 15 063 51 577 2 692Kentucky . . . . . . . . . . . . . . . . . . . . . . 800 675 3 911 14 606 85 023 20 617Louisiana . . . . . . . . . . . . . . . . . . . . . . 2 831 13 298 6 048 48 661 84 771 5 150Maine. . . . . . . . . . . . . . . . . . . . . . . . . 348 577 342 6 374 16 724 1 662
Maryland . . . . . . . . . . . . . . . . . . . . . . 14 515 1 719 564 6 022 32 748 73 523 3 066Massachusetts. . . . . . . . . . . . . . . . . . 17 164 34 252 13 706 50 416 71 541 24 180Michigan . . . . . . . . . . . . . . . . . . . . . . 5 274 6 368 10 193 16 616 84 046 5 382Minnesota . . . . . . . . . . . . . . . . . . . . . 2 372 19 279 6 403 31 862 87 567 3 295Mississippi . . . . . . . . . . . . . . . . . . . . . 782 904 3 257 18 895 29 524 2 174Missouri . . . . . . . . . . . . . . . . . . . . . . . 45 717 26 248 6 184 37 210 78 713 21 110Montana . . . . . . . . . . . . . . . . . . . . . . 1 038 39 701 671 76 743 12 463 1 263Nebraska . . . . . . . . . . . . . . . . . . . . . . 977 4 115 2 293 16 670 24 504 1 786Nevada . . . . . . . . . . . . . . . . . . . . . . . 1 132 4 683 1 752 78 054 22 667 1 496New Hampshire . . . . . . . . . . . . . . . . . 757 500 2 054 4 009 7 183 2 065
New Jersey . . . . . . . . . . . . . . . . . . . . 10 877 9 185 8 194 14 899 125 134 9 607New Mexico. . . . . . . . . . . . . . . . . . . . 2 350 113 644 1 863 197 723 49 657 2 042New York . . . . . . . . . . . . . . . . . . . . . . 40 252 49 981 30 266 38 536 352 854 37 281North Carolina . . . . . . . . . . . . . . . . . . 2 991 53 979 7 723 24 687 67 426 4 062North Dakota . . . . . . . . . . . . . . . . . . . 721 18 131 343 32 129 8 141 938Ohio. . . . . . . . . . . . . . . . . . . . . . . . . . 6 529 32 266 14 437 12 994 60 350 20 416Oklahoma . . . . . . . . . . . . . . . . . . . . . 1 908 62 581 7 947 38 813 64 737 3 134Oregon . . . . . . . . . . . . . . . . . . . . . . . 2 828 9 520 3 040 137 085 42 801 2 433Pennsylvania . . . . . . . . . . . . . . . . . . . 35 453 52 352 22 933 55 316 233 556 54 045Rhode Island . . . . . . . . . . . . . . . . . . . 399 303 1 311 2 009 7 974 1 160
South Carolina. . . . . . . . . . . . . . . . . . 1 514 1 434 4 709 8 599 60 595 2 007South Dakota. . . . . . . . . . . . . . . . . . . 846 48 222 573 53 750 12 799 584Tennessee . . . . . . . . . . . . . . . . . . . . . 1 732 6 183 9 264 23 148 49 808 5 585Texas. . . . . . . . . . . . . . . . . . . . . . . . . 61 327 41 980 33 754 48 171 730 674 39 590Utah. . . . . . . . . . . . . . . . . . . . . . . . . . 1 396 2 253 1 540 77 547 11 802 6 345Vermont . . . . . . . . . . . . . . . . . . . . . . . 251 279 129 2 188 51 213 348Virginia . . . . . . . . . . . . . . . . . . . . . . . 82 242 2 049 5 884 211 980 288 343 28 010Washington . . . . . . . . . . . . . . . . . . . . 23 684 40 031 12 727 102 839 72 574 13 419West Virginia . . . . . . . . . . . . . . . . . . . 1 909 23 161 1 435 33 001 52 067 25 502Wisconsin . . . . . . . . . . . . . . . . . . . . . 1 450 2 629 4 315 25 637 33 835 5 023Wyoming . . . . . . . . . . . . . . . . . . . . . . 848 3 759 211 67 707 6 011 929
American Samoa . . . . . . . . . . . . . . . . - - - 590 - -Fed. States of Micronesia . . . . . . . . . - - - - - -Guam. . . . . . . . . . . . . . . . . . . . . . . . . - - 51 1 866 7 205 43Marshall Islands. . . . . . . . . . . . . . . . . - - - - - -Northern Marianas. . . . . . . . . . . . . . . - - - 476 280 103Palau . . . . . . . . . . . . . . . . . . . . . . . . . - - - - - -Puerto Rico . . . . . . . . . . . . . . . . . . . . 1 822 7 559 4 522 6 500 53 394 1 317Virgin Islands. . . . . . . . . . . . . . . . . . . 188 - 86 3 567 9 067 -
Undistributed . . . . . . . . . . . . . . . . . . . - - - - - -
See footnotes at end of table.
16 Consolidated Federal Funds Report for Fiscal Year 1999
U.S. Census Bureau
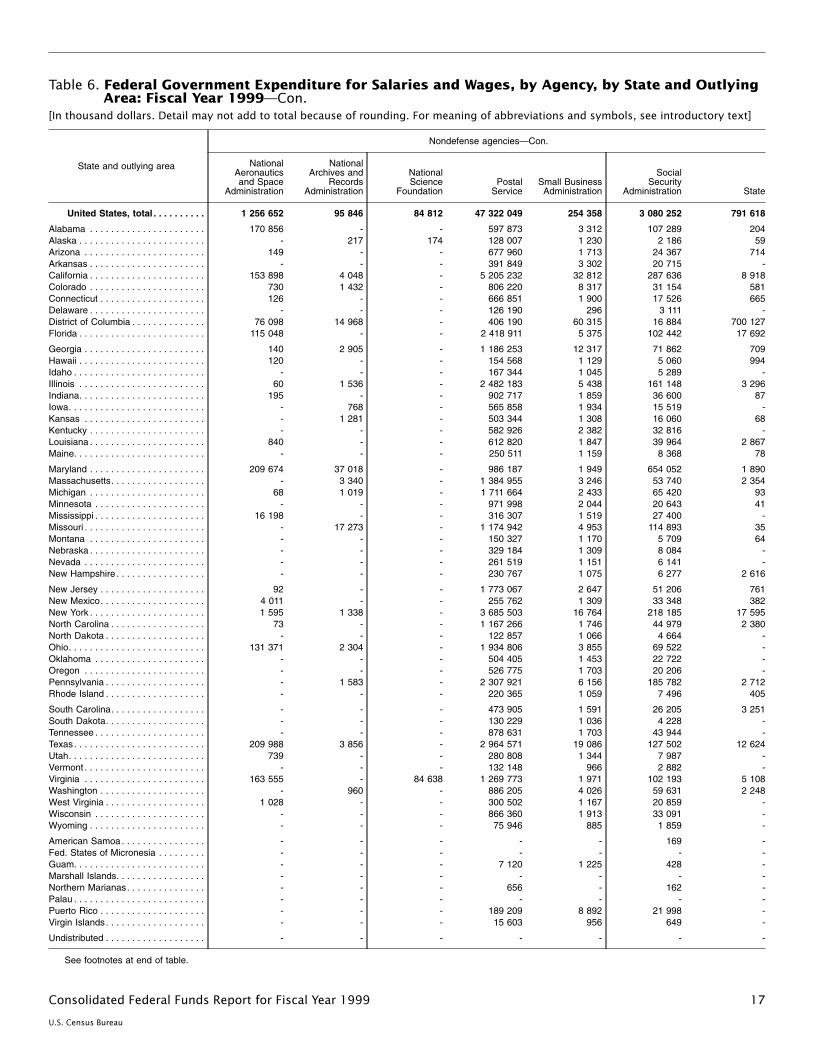
Table 6. Federal Government Expenditure for Salaries and Wages, by Agency, by State and OutlyingArea: Fiscal Year 1999—Con.
[In thousand dollars. Detail may not add to total because of rounding. For meaning of abbreviations and symbols, see introductory text]
State and outlying area
Nondefense agencies— Con.
NationalAeronauticsand Space
Administration
NationalArchives and
RecordsAdministration
NationalScience
FoundationPostal
ServiceSmall BusinessAdministration
SocialSecurity
Administration State
United States, total . . . . . . . . . . 1 256 652 95 846 84 812 47 322 049 254 358 3 080 252 791 618
Alabama . . . . . . . . . . . . . . . . . . . . . . 170 856 - - 597 873 3 312 107 289 204Alaska . . . . . . . . . . . . . . . . . . . . . . . . - 217 174 128 007 1 230 2 186 59Arizona . . . . . . . . . . . . . . . . . . . . . . . 149 - - 677 960 1 713 24 367 714Arkansas . . . . . . . . . . . . . . . . . . . . . . - - - 391 849 3 302 20 715 -California . . . . . . . . . . . . . . . . . . . . . . 153 898 4 048 - 5 205 232 32 812 287 636 8 918Colorado . . . . . . . . . . . . . . . . . . . . . . 730 1 432 - 806 220 8 317 31 154 581Connecticut . . . . . . . . . . . . . . . . . . . . 126 - - 666 851 1 900 17 526 665Delaware . . . . . . . . . . . . . . . . . . . . . . - - - 126 190 296 3 111 -District of Columbia . . . . . . . . . . . . . . 76 098 14 968 - 406 190 60 315 16 884 700 127Florida . . . . . . . . . . . . . . . . . . . . . . . . 115 048 - - 2 418 911 5 375 102 442 17 692
Georgia . . . . . . . . . . . . . . . . . . . . . . . 140 2 905 - 1 186 253 12 317 71 862 709Hawaii . . . . . . . . . . . . . . . . . . . . . . . . 120 - - 154 568 1 129 5 060 994Idaho . . . . . . . . . . . . . . . . . . . . . . . . . - - - 167 344 1 045 5 289 -Illinois . . . . . . . . . . . . . . . . . . . . . . . . 60 1 536 - 2 482 183 5 438 161 148 3 296Indiana. . . . . . . . . . . . . . . . . . . . . . . . 195 - - 902 717 1 859 36 600 87Iowa. . . . . . . . . . . . . . . . . . . . . . . . . . - 768 - 565 858 1 934 15 519 -Kansas . . . . . . . . . . . . . . . . . . . . . . . - 1 281 - 503 344 1 308 16 060 68Kentucky . . . . . . . . . . . . . . . . . . . . . . - - - 582 926 2 382 32 816 -Louisiana . . . . . . . . . . . . . . . . . . . . . . 840 - - 612 820 1 847 39 964 2 867Maine. . . . . . . . . . . . . . . . . . . . . . . . . - - - 250 511 1 159 8 368 78
Maryland . . . . . . . . . . . . . . . . . . . . . . 209 674 37 018 - 986 187 1 949 654 052 1 890Massachusetts. . . . . . . . . . . . . . . . . . - 3 340 - 1 384 955 3 246 53 740 2 354Michigan . . . . . . . . . . . . . . . . . . . . . . 68 1 019 - 1 711 664 2 433 65 420 93Minnesota . . . . . . . . . . . . . . . . . . . . . - - - 971 998 2 044 20 643 41Mississippi . . . . . . . . . . . . . . . . . . . . . 16 198 - - 316 307 1 519 27 400 -Missouri . . . . . . . . . . . . . . . . . . . . . . . - 17 273 - 1 174 942 4 953 114 893 35Montana . . . . . . . . . . . . . . . . . . . . . . - - - 150 327 1 170 5 709 64Nebraska . . . . . . . . . . . . . . . . . . . . . . - - - 329 184 1 309 8 084 -Nevada . . . . . . . . . . . . . . . . . . . . . . . - - - 261 519 1 151 6 141 -New Hampshire . . . . . . . . . . . . . . . . . - - - 230 767 1 075 6 277 2 616
New Jersey . . . . . . . . . . . . . . . . . . . . 92 - - 1 773 067 2 647 51 206 761New Mexico. . . . . . . . . . . . . . . . . . . . 4 011 - - 255 762 1 309 33 348 382New York . . . . . . . . . . . . . . . . . . . . . . 1 595 1 338 - 3 685 503 16 764 218 185 17 595North Carolina . . . . . . . . . . . . . . . . . . 73 - - 1 167 266 1 746 44 979 2 380North Dakota . . . . . . . . . . . . . . . . . . . - - - 122 857 1 066 4 664 -Ohio. . . . . . . . . . . . . . . . . . . . . . . . . . 131 371 2 304 - 1 934 806 3 855 69 522 -Oklahoma . . . . . . . . . . . . . . . . . . . . . - - - 504 405 1 453 22 722 -Oregon . . . . . . . . . . . . . . . . . . . . . . . - - - 526 775 1 703 20 206 -Pennsylvania . . . . . . . . . . . . . . . . . . . - 1 583 - 2 307 921 6 156 185 782 2 712Rhode Island . . . . . . . . . . . . . . . . . . . - - - 220 365 1 059 7 496 405
South Carolina. . . . . . . . . . . . . . . . . . - - - 473 905 1 591 26 205 3 251South Dakota. . . . . . . . . . . . . . . . . . . - - - 130 229 1 036 4 228 -Tennessee . . . . . . . . . . . . . . . . . . . . . - - - 878 631 1 703 43 944 -Texas. . . . . . . . . . . . . . . . . . . . . . . . . 209 988 3 856 - 2 964 571 19 086 127 502 12 624Utah. . . . . . . . . . . . . . . . . . . . . . . . . . 739 - - 280 808 1 344 7 987 -Vermont . . . . . . . . . . . . . . . . . . . . . . . - - - 132 148 966 2 882 -Virginia . . . . . . . . . . . . . . . . . . . . . . . 163 555 - 84 638 1 269 773 1 971 102 193 5 108Washington . . . . . . . . . . . . . . . . . . . . - 960 - 886 205 4 026 59 631 2 248West Virginia . . . . . . . . . . . . . . . . . . . 1 028 - - 300 502 1 167 20 859 -Wisconsin . . . . . . . . . . . . . . . . . . . . . - - - 866 360 1 913 33 091 -Wyoming . . . . . . . . . . . . . . . . . . . . . . - - - 75 946 885 1 859 -
American Samoa . . . . . . . . . . . . . . . . - - - - - 169 -Fed. States of Micronesia . . . . . . . . . - - - - - - -Guam. . . . . . . . . . . . . . . . . . . . . . . . . - - - 7 120 1 225 428 -Marshall Islands. . . . . . . . . . . . . . . . . - - - - - - -Northern Marianas. . . . . . . . . . . . . . . - - - 656 - 162 -Palau . . . . . . . . . . . . . . . . . . . . . . . . . - - - - - - -Puerto Rico . . . . . . . . . . . . . . . . . . . . - - - 189 209 8 892 21 998 -Virgin Islands. . . . . . . . . . . . . . . . . . . - - - 15 603 956 649 -
Undistributed . . . . . . . . . . . . . . . . . . . - - - - - - -
See footnotes at end of table.
17Consolidated Federal Funds Report for Fiscal Year 1999
U.S. Census Bureau
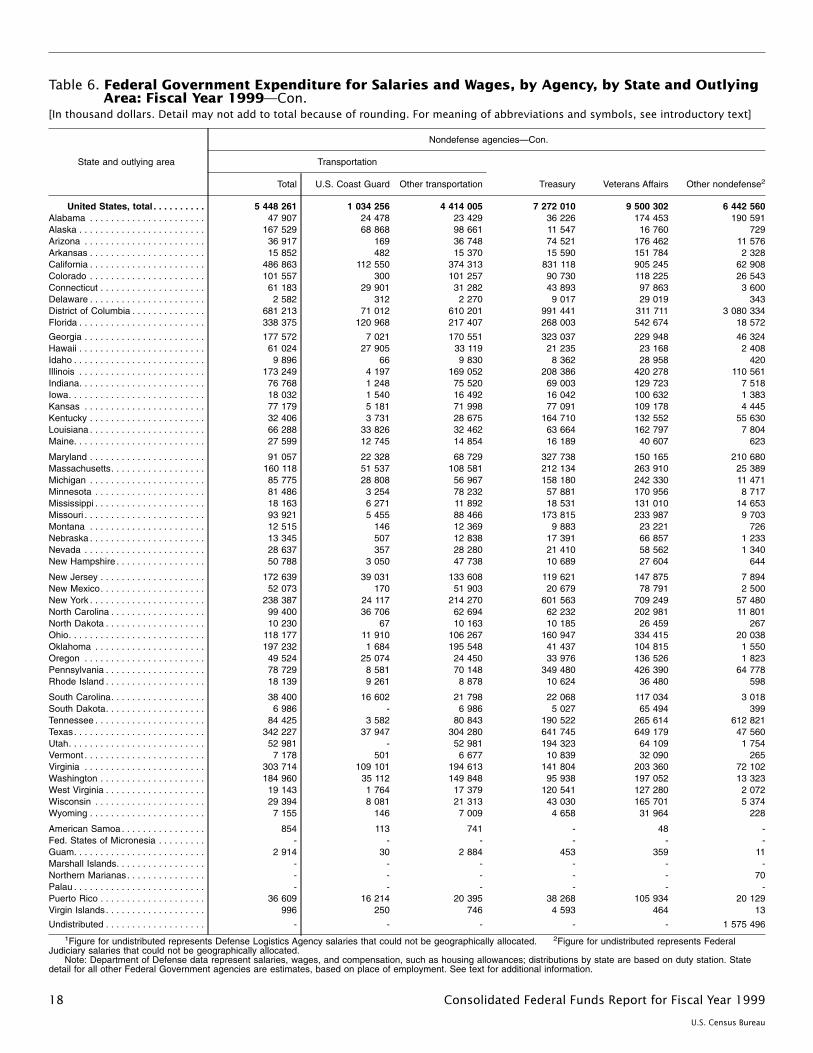
Table 6. Federal Government Expenditure for Salaries and Wages, by Agency, by State and OutlyingArea: Fiscal Year 1999—Con.
[In thousand dollars. Detail may not add to total because of rounding. For meaning of abbreviations and symbols, see introductory text]
State and outlying area
Nondefense agencies— Con.
Transportation
Treasury Veterans Affairs Other nondefense2Total U.S. Coast Guard Other transportation
United States, total . . . . . . . . . . 5 448 261 1 034 256 4 414 005 7 272 010 9 500 302 6 442 560Alabama . . . . . . . . . . . . . . . . . . . . . . 47 907 24 478 23 429 36 226 174 453 190 591Alaska . . . . . . . . . . . . . . . . . . . . . . . . 167 529 68 868 98 661 11 547 16 760 729Arizona . . . . . . . . . . . . . . . . . . . . . . . 36 917 169 36 748 74 521 176 462 11 576Arkansas . . . . . . . . . . . . . . . . . . . . . . 15 852 482 15 370 15 590 151 784 2 328California . . . . . . . . . . . . . . . . . . . . . . 486 863 112 550 374 313 831 118 905 245 62 908Colorado . . . . . . . . . . . . . . . . . . . . . . 101 557 300 101 257 90 730 118 225 26 543Connecticut . . . . . . . . . . . . . . . . . . . . 61 183 29 901 31 282 43 893 97 863 3 600Delaware . . . . . . . . . . . . . . . . . . . . . . 2 582 312 2 270 9 017 29 019 343District of Columbia . . . . . . . . . . . . . . 681 213 71 012 610 201 991 441 311 711 3 080 334Florida . . . . . . . . . . . . . . . . . . . . . . . . 338 375 120 968 217 407 268 003 542 674 18 572
Georgia . . . . . . . . . . . . . . . . . . . . . . . 177 572 7 021 170 551 323 037 229 948 46 324Hawaii . . . . . . . . . . . . . . . . . . . . . . . . 61 024 27 905 33 119 21 235 23 168 2 408Idaho . . . . . . . . . . . . . . . . . . . . . . . . . 9 896 66 9 830 8 362 28 958 420Illinois . . . . . . . . . . . . . . . . . . . . . . . . 173 249 4 197 169 052 208 386 420 278 110 561Indiana. . . . . . . . . . . . . . . . . . . . . . . . 76 768 1 248 75 520 69 003 129 723 7 518Iowa. . . . . . . . . . . . . . . . . . . . . . . . . . 18 032 1 540 16 492 16 042 100 632 1 383Kansas . . . . . . . . . . . . . . . . . . . . . . . 77 179 5 181 71 998 77 091 109 178 4 445Kentucky . . . . . . . . . . . . . . . . . . . . . . 32 406 3 731 28 675 164 710 132 552 55 630Louisiana . . . . . . . . . . . . . . . . . . . . . . 66 288 33 826 32 462 63 664 162 797 7 804Maine. . . . . . . . . . . . . . . . . . . . . . . . . 27 599 12 745 14 854 16 189 40 607 623
Maryland . . . . . . . . . . . . . . . . . . . . . . 91 057 22 328 68 729 327 738 150 165 210 680Massachusetts. . . . . . . . . . . . . . . . . . 160 118 51 537 108 581 212 134 263 910 25 389Michigan . . . . . . . . . . . . . . . . . . . . . . 85 775 28 808 56 967 158 180 242 330 11 471Minnesota . . . . . . . . . . . . . . . . . . . . . 81 486 3 254 78 232 57 881 170 956 8 717Mississippi . . . . . . . . . . . . . . . . . . . . . 18 163 6 271 11 892 18 531 131 010 14 653Missouri . . . . . . . . . . . . . . . . . . . . . . . 93 921 5 455 88 466 173 815 233 987 9 703Montana . . . . . . . . . . . . . . . . . . . . . . 12 515 146 12 369 9 883 23 221 726Nebraska . . . . . . . . . . . . . . . . . . . . . . 13 345 507 12 838 17 391 66 857 1 233Nevada . . . . . . . . . . . . . . . . . . . . . . . 28 637 357 28 280 21 410 58 562 1 340New Hampshire . . . . . . . . . . . . . . . . . 50 788 3 050 47 738 10 689 27 604 644
New Jersey . . . . . . . . . . . . . . . . . . . . 172 639 39 031 133 608 119 621 147 875 7 894New Mexico. . . . . . . . . . . . . . . . . . . . 52 073 170 51 903 20 679 78 791 2 500New York . . . . . . . . . . . . . . . . . . . . . . 238 387 24 117 214 270 601 563 709 249 57 480North Carolina . . . . . . . . . . . . . . . . . . 99 400 36 706 62 694 62 232 202 981 11 801North Dakota . . . . . . . . . . . . . . . . . . . 10 230 67 10 163 10 185 26 459 267Ohio. . . . . . . . . . . . . . . . . . . . . . . . . . 118 177 11 910 106 267 160 947 334 415 20 038Oklahoma . . . . . . . . . . . . . . . . . . . . . 197 232 1 684 195 548 41 437 104 815 1 550Oregon . . . . . . . . . . . . . . . . . . . . . . . 49 524 25 074 24 450 33 976 136 526 1 823Pennsylvania . . . . . . . . . . . . . . . . . . . 78 729 8 581 70 148 349 480 426 390 64 778Rhode Island . . . . . . . . . . . . . . . . . . . 18 139 9 261 8 878 10 624 36 480 598
South Carolina. . . . . . . . . . . . . . . . . . 38 400 16 602 21 798 22 068 117 034 3 018South Dakota. . . . . . . . . . . . . . . . . . . 6 986 - 6 986 5 027 65 494 399Tennessee . . . . . . . . . . . . . . . . . . . . . 84 425 3 582 80 843 190 522 265 614 612 821Texas. . . . . . . . . . . . . . . . . . . . . . . . . 342 227 37 947 304 280 641 745 649 179 47 560Utah. . . . . . . . . . . . . . . . . . . . . . . . . . 52 981 - 52 981 194 323 64 109 1 754Vermont . . . . . . . . . . . . . . . . . . . . . . . 7 178 501 6 677 10 839 32 090 265Virginia . . . . . . . . . . . . . . . . . . . . . . . 303 714 109 101 194 613 141 804 203 360 72 102Washington . . . . . . . . . . . . . . . . . . . . 184 960 35 112 149 848 95 938 197 052 13 323West Virginia . . . . . . . . . . . . . . . . . . . 19 143 1 764 17 379 120 541 127 280 2 072Wisconsin . . . . . . . . . . . . . . . . . . . . . 29 394 8 081 21 313 43 030 165 701 5 374Wyoming . . . . . . . . . . . . . . . . . . . . . . 7 155 146 7 009 4 658 31 964 228
American Samoa . . . . . . . . . . . . . . . . 854 113 741 - 48 -Fed. States of Micronesia . . . . . . . . . - - - - - -Guam. . . . . . . . . . . . . . . . . . . . . . . . . 2 914 30 2 884 453 359 11Marshall Islands. . . . . . . . . . . . . . . . . - - - - - -Northern Marianas. . . . . . . . . . . . . . . - - - - - 70Palau . . . . . . . . . . . . . . . . . . . . . . . . . - - - - - -Puerto Rico . . . . . . . . . . . . . . . . . . . . 36 609 16 214 20 395 38 268 105 934 20 129Virgin Islands. . . . . . . . . . . . . . . . . . . 996 250 746 4 593 464 13
Undistributed . . . . . . . . . . . . . . . . . . . - - - - - 1 575 4961Figure for undistributed represents Defense Logistics Agency salaries that could not be geographically allocated. 2Figure for undistributed represents Federal
Judiciary salaries that could not be geographically allocated.Note: Department of Defense data represent salaries, wages, and compensation, such as housing allowances; distributions by state are based on duty station. State
detail for all other Federal Government agencies are estimates, based on place of employment. See text for additional information.
18 Consolidated Federal Funds Report for Fiscal Year 1999
U.S. Census Bureau
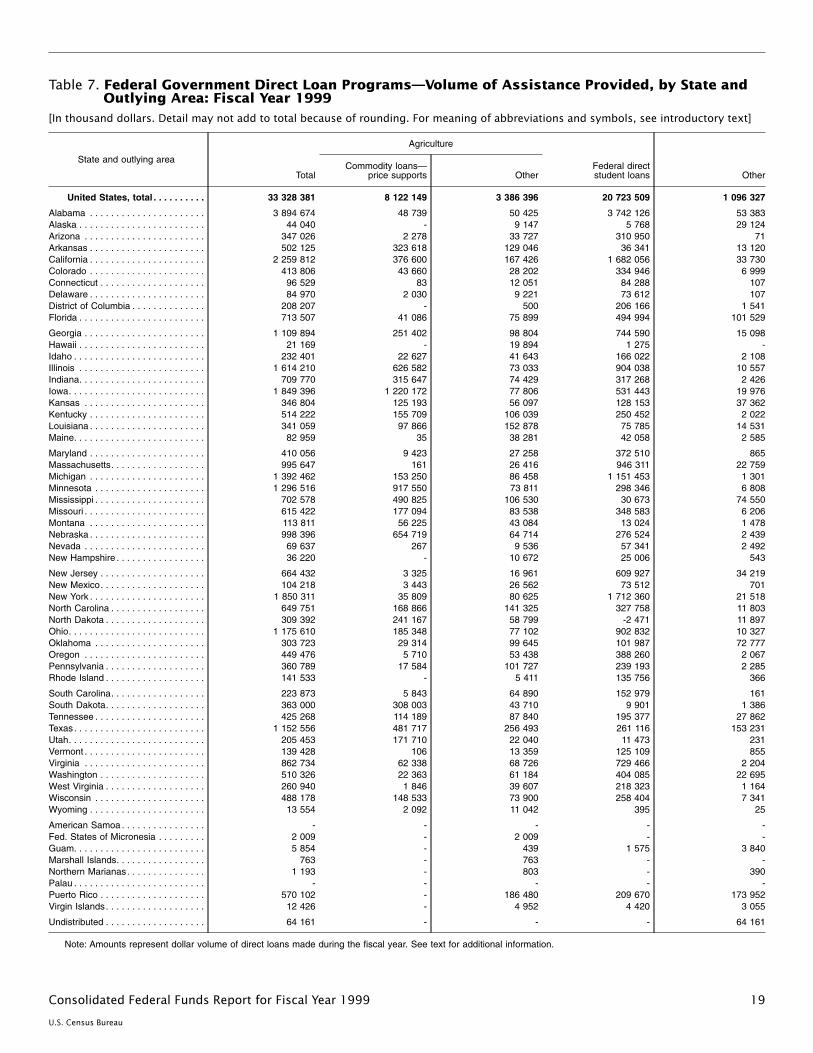
Table 7. Federal Government Direct Loan Programs—Volume of Assistance Provided, by State andOutlying Area: Fiscal Year 1999
[In thousand dollars. Detail may not add to total because of rounding. For meaning of abbreviations and symbols, see introductory text]
State and outlying area
Total
Agriculture
Federal directstudent loans Other
Commodity loans—price supports Other
United States, total . . . . . . . . . . 33 328 381 8 122 149 3 386 396 20 723 509 1 096 327
Alabama . . . . . . . . . . . . . . . . . . . . . . 3 894 674 48 739 50 425 3 742 126 53 383Alaska . . . . . . . . . . . . . . . . . . . . . . . . 44 040 - 9 147 5 768 29 124Arizona . . . . . . . . . . . . . . . . . . . . . . . 347 026 2 278 33 727 310 950 71Arkansas . . . . . . . . . . . . . . . . . . . . . . 502 125 323 618 129 046 36 341 13 120California . . . . . . . . . . . . . . . . . . . . . . 2 259 812 376 600 167 426 1 682 056 33 730Colorado . . . . . . . . . . . . . . . . . . . . . . 413 806 43 660 28 202 334 946 6 999Connecticut . . . . . . . . . . . . . . . . . . . . 96 529 83 12 051 84 288 107Delaware . . . . . . . . . . . . . . . . . . . . . . 84 970 2 030 9 221 73 612 107District of Columbia . . . . . . . . . . . . . . 208 207 - 500 206 166 1 541Florida . . . . . . . . . . . . . . . . . . . . . . . . 713 507 41 086 75 899 494 994 101 529
Georgia . . . . . . . . . . . . . . . . . . . . . . . 1 109 894 251 402 98 804 744 590 15 098Hawaii . . . . . . . . . . . . . . . . . . . . . . . . 21 169 - 19 894 1 275 -Idaho . . . . . . . . . . . . . . . . . . . . . . . . . 232 401 22 627 41 643 166 022 2 108Illinois . . . . . . . . . . . . . . . . . . . . . . . . 1 614 210 626 582 73 033 904 038 10 557Indiana. . . . . . . . . . . . . . . . . . . . . . . . 709 770 315 647 74 429 317 268 2 426Iowa. . . . . . . . . . . . . . . . . . . . . . . . . . 1 849 396 1 220 172 77 806 531 443 19 976Kansas . . . . . . . . . . . . . . . . . . . . . . . 346 804 125 193 56 097 128 153 37 362Kentucky . . . . . . . . . . . . . . . . . . . . . . 514 222 155 709 106 039 250 452 2 022Louisiana . . . . . . . . . . . . . . . . . . . . . . 341 059 97 866 152 878 75 785 14 531Maine. . . . . . . . . . . . . . . . . . . . . . . . . 82 959 35 38 281 42 058 2 585
Maryland . . . . . . . . . . . . . . . . . . . . . . 410 056 9 423 27 258 372 510 865Massachusetts. . . . . . . . . . . . . . . . . . 995 647 161 26 416 946 311 22 759Michigan . . . . . . . . . . . . . . . . . . . . . . 1 392 462 153 250 86 458 1 151 453 1 301Minnesota . . . . . . . . . . . . . . . . . . . . . 1 296 516 917 550 73 811 298 346 6 808Mississippi . . . . . . . . . . . . . . . . . . . . . 702 578 490 825 106 530 30 673 74 550Missouri . . . . . . . . . . . . . . . . . . . . . . . 615 422 177 094 83 538 348 583 6 206Montana . . . . . . . . . . . . . . . . . . . . . . 113 811 56 225 43 084 13 024 1 478Nebraska . . . . . . . . . . . . . . . . . . . . . . 998 396 654 719 64 714 276 524 2 439Nevada . . . . . . . . . . . . . . . . . . . . . . . 69 637 267 9 536 57 341 2 492New Hampshire . . . . . . . . . . . . . . . . . 36 220 - 10 672 25 006 543
New Jersey . . . . . . . . . . . . . . . . . . . . 664 432 3 325 16 961 609 927 34 219New Mexico. . . . . . . . . . . . . . . . . . . . 104 218 3 443 26 562 73 512 701New York . . . . . . . . . . . . . . . . . . . . . . 1 850 311 35 809 80 625 1 712 360 21 518North Carolina . . . . . . . . . . . . . . . . . . 649 751 168 866 141 325 327 758 11 803North Dakota . . . . . . . . . . . . . . . . . . . 309 392 241 167 58 799 -2 471 11 897Ohio. . . . . . . . . . . . . . . . . . . . . . . . . . 1 175 610 185 348 77 102 902 832 10 327Oklahoma . . . . . . . . . . . . . . . . . . . . . 303 723 29 314 99 645 101 987 72 777Oregon . . . . . . . . . . . . . . . . . . . . . . . 449 476 5 710 53 438 388 260 2 067Pennsylvania . . . . . . . . . . . . . . . . . . . 360 789 17 584 101 727 239 193 2 285Rhode Island . . . . . . . . . . . . . . . . . . . 141 533 - 5 411 135 756 366
South Carolina. . . . . . . . . . . . . . . . . . 223 873 5 843 64 890 152 979 161South Dakota. . . . . . . . . . . . . . . . . . . 363 000 308 003 43 710 9 901 1 386Tennessee . . . . . . . . . . . . . . . . . . . . . 425 268 114 189 87 840 195 377 27 862Texas. . . . . . . . . . . . . . . . . . . . . . . . . 1 152 556 481 717 256 493 261 116 153 231Utah. . . . . . . . . . . . . . . . . . . . . . . . . . 205 453 171 710 22 040 11 473 231Vermont . . . . . . . . . . . . . . . . . . . . . . . 139 428 106 13 359 125 109 855Virginia . . . . . . . . . . . . . . . . . . . . . . . 862 734 62 338 68 726 729 466 2 204Washington . . . . . . . . . . . . . . . . . . . . 510 326 22 363 61 184 404 085 22 695West Virginia . . . . . . . . . . . . . . . . . . . 260 940 1 846 39 607 218 323 1 164Wisconsin . . . . . . . . . . . . . . . . . . . . . 488 178 148 533 73 900 258 404 7 341Wyoming . . . . . . . . . . . . . . . . . . . . . . 13 554 2 092 11 042 395 25
American Samoa . . . . . . . . . . . . . . . . - - - - -Fed. States of Micronesia . . . . . . . . . 2 009 - 2 009 - -Guam. . . . . . . . . . . . . . . . . . . . . . . . . 5 854 - 439 1 575 3 840Marshall Islands. . . . . . . . . . . . . . . . . 763 - 763 - -Northern Marianas. . . . . . . . . . . . . . . 1 193 - 803 - 390Palau . . . . . . . . . . . . . . . . . . . . . . . . . - - - - -Puerto Rico . . . . . . . . . . . . . . . . . . . . 570 102 - 186 480 209 670 173 952Virgin Islands. . . . . . . . . . . . . . . . . . . 12 426 - 4 952 4 420 3 055
Undistributed . . . . . . . . . . . . . . . . . . . 64 161 - - - 64 161
Note: Amounts represent dollar volume of direct loans made during the fiscal year. See text for additional information.
19Consolidated Federal Funds Report for Fiscal Year 1999
U.S. Census Bureau
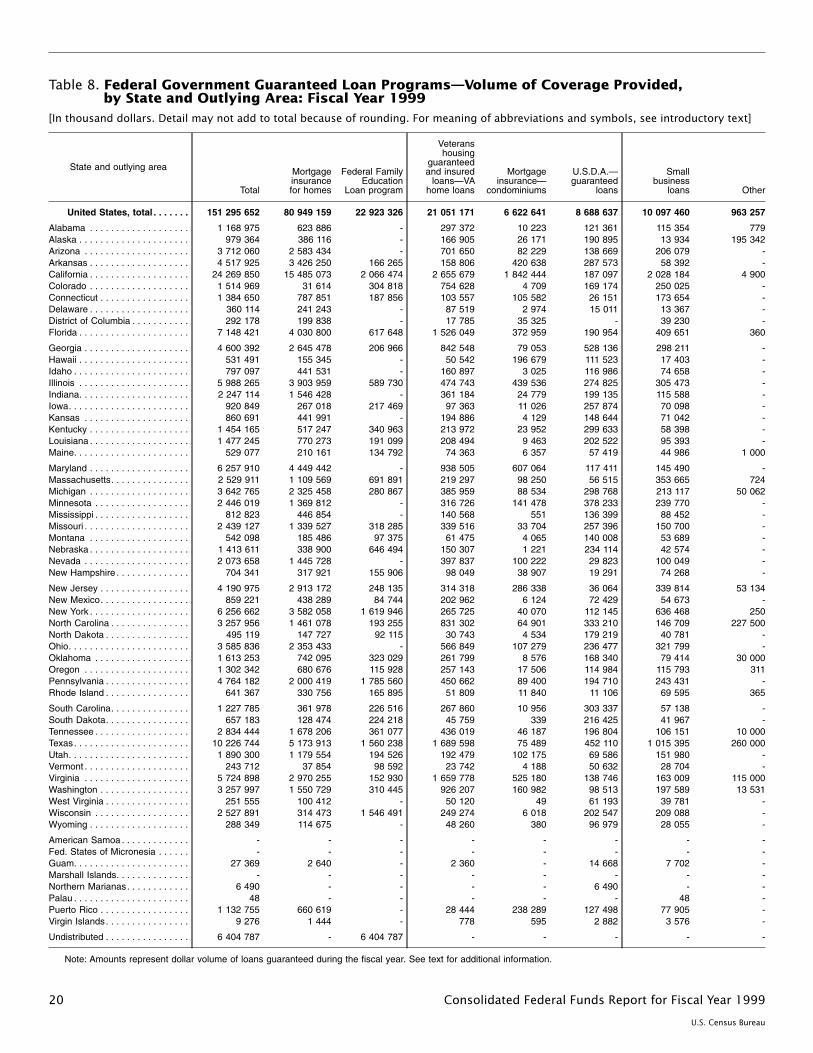
Table 8. Federal Government Guaranteed Loan Programs—Volume of Coverage Provided,by State and Outlying Area: Fiscal Year 1999
[In thousand dollars. Detail may not add to total because of rounding. For meaning of abbreviations and symbols, see introductory text]
State and outlying area
Total
Mortgageinsurancefor homes
Federal FamilyEducation
Loan program
Veteranshousing
guaranteedand insured
loans— VAhome loans
Mortgageinsurance—
condominiums
U.S.D.A.—guaranteed
loans
Smallbusiness
loans Other
United States, total . . . . . . . 151 295 652 80 949 159 22 923 326 21 051 171 6 622 641 8 688 637 10 097 460 963 257
Alabama . . . . . . . . . . . . . . . . . . . 1 168 975 623 886 - 297 372 10 223 121 361 115 354 779Alaska . . . . . . . . . . . . . . . . . . . . . 979 364 386 116 - 166 905 26 171 190 895 13 934 195 342Arizona . . . . . . . . . . . . . . . . . . . . 3 712 060 2 583 434 - 701 650 82 229 138 669 206 079 -Arkansas . . . . . . . . . . . . . . . . . . . 4 517 925 3 426 250 166 265 158 806 420 638 287 573 58 392 -California . . . . . . . . . . . . . . . . . . . 24 269 850 15 485 073 2 066 474 2 655 679 1 842 444 187 097 2 028 184 4 900Colorado . . . . . . . . . . . . . . . . . . . 1 514 969 31 614 304 818 754 628 4 709 169 174 250 025 -Connecticut . . . . . . . . . . . . . . . . . 1 384 650 787 851 187 856 103 557 105 582 26 151 173 654 -Delaware . . . . . . . . . . . . . . . . . . . 360 114 241 243 - 87 519 2 974 15 011 13 367 -District of Columbia . . . . . . . . . . . 292 178 199 838 - 17 785 35 325 - 39 230 -Florida . . . . . . . . . . . . . . . . . . . . . 7 148 421 4 030 800 617 648 1 526 049 372 959 190 954 409 651 360
Georgia . . . . . . . . . . . . . . . . . . . . 4 600 392 2 645 478 206 966 842 548 79 053 528 136 298 211 -Hawaii . . . . . . . . . . . . . . . . . . . . . 531 491 155 345 - 50 542 196 679 111 523 17 403 -Idaho . . . . . . . . . . . . . . . . . . . . . . 797 097 441 531 - 160 897 3 025 116 986 74 658 -Illinois . . . . . . . . . . . . . . . . . . . . . 5 988 265 3 903 959 589 730 474 743 439 536 274 825 305 473 -Indiana. . . . . . . . . . . . . . . . . . . . . 2 247 114 1 546 428 - 361 184 24 779 199 135 115 588 -Iowa. . . . . . . . . . . . . . . . . . . . . . . 920 849 267 018 217 469 97 363 11 026 257 874 70 098 -Kansas . . . . . . . . . . . . . . . . . . . . 860 691 441 991 - 194 886 4 129 148 644 71 042 -Kentucky . . . . . . . . . . . . . . . . . . . 1 454 165 517 247 340 963 213 972 23 952 299 633 58 398 -Louisiana . . . . . . . . . . . . . . . . . . . 1 477 245 770 273 191 099 208 494 9 463 202 522 95 393 -Maine. . . . . . . . . . . . . . . . . . . . . . 529 077 210 161 134 792 74 363 6 357 57 419 44 986 1 000
Maryland . . . . . . . . . . . . . . . . . . . 6 257 910 4 449 442 - 938 505 607 064 117 411 145 490 -Massachusetts. . . . . . . . . . . . . . . 2 529 911 1 109 569 691 891 219 297 98 250 56 515 353 665 724Michigan . . . . . . . . . . . . . . . . . . . 3 642 765 2 325 458 280 867 385 959 88 534 298 768 213 117 50 062Minnesota . . . . . . . . . . . . . . . . . . 2 446 019 1 369 812 - 316 726 141 478 378 233 239 770 -Mississippi . . . . . . . . . . . . . . . . . . 812 823 446 854 - 140 568 551 136 399 88 452 -Missouri . . . . . . . . . . . . . . . . . . . . 2 439 127 1 339 527 318 285 339 516 33 704 257 396 150 700 -Montana . . . . . . . . . . . . . . . . . . . 542 098 185 486 97 375 61 475 4 065 140 008 53 689 -Nebraska . . . . . . . . . . . . . . . . . . . 1 413 611 338 900 646 494 150 307 1 221 234 114 42 574 -Nevada . . . . . . . . . . . . . . . . . . . . 2 073 658 1 445 728 - 397 837 100 222 29 823 100 049 -New Hampshire . . . . . . . . . . . . . . 704 341 317 921 155 906 98 049 38 907 19 291 74 268 -
New Jersey . . . . . . . . . . . . . . . . . 4 190 975 2 913 172 248 135 314 318 286 338 36 064 339 814 53 134New Mexico. . . . . . . . . . . . . . . . . 859 221 438 289 84 744 202 962 6 124 72 429 54 673 -New York . . . . . . . . . . . . . . . . . . . 6 256 662 3 582 058 1 619 946 265 725 40 070 112 145 636 468 250North Carolina . . . . . . . . . . . . . . . 3 257 956 1 461 078 193 255 831 302 64 901 333 210 146 709 227 500North Dakota . . . . . . . . . . . . . . . . 495 119 147 727 92 115 30 743 4 534 179 219 40 781 -Ohio. . . . . . . . . . . . . . . . . . . . . . . 3 585 836 2 353 433 - 566 849 107 279 236 477 321 799 -Oklahoma . . . . . . . . . . . . . . . . . . 1 613 253 742 095 323 029 261 799 8 576 168 340 79 414 30 000Oregon . . . . . . . . . . . . . . . . . . . . 1 302 342 680 676 115 928 257 143 17 506 114 984 115 793 311Pennsylvania . . . . . . . . . . . . . . . . 4 764 182 2 000 419 1 785 560 450 662 89 400 194 710 243 431 -Rhode Island . . . . . . . . . . . . . . . . 641 367 330 756 165 895 51 809 11 840 11 106 69 595 365
South Carolina. . . . . . . . . . . . . . . 1 227 785 361 978 226 516 267 860 10 956 303 337 57 138 -South Dakota. . . . . . . . . . . . . . . . 657 183 128 474 224 218 45 759 339 216 425 41 967 -Tennessee . . . . . . . . . . . . . . . . . . 2 834 444 1 678 206 361 077 436 019 46 187 196 804 106 151 10 000Texas. . . . . . . . . . . . . . . . . . . . . . 10 226 744 5 173 913 1 560 238 1 689 598 75 489 452 110 1 015 395 260 000Utah. . . . . . . . . . . . . . . . . . . . . . . 1 890 300 1 179 554 194 526 192 479 102 175 69 586 151 980 -Vermont . . . . . . . . . . . . . . . . . . . . 243 712 37 854 98 592 23 742 4 188 50 632 28 704 -Virginia . . . . . . . . . . . . . . . . . . . . 5 724 898 2 970 255 152 930 1 659 778 525 180 138 746 163 009 115 000Washington . . . . . . . . . . . . . . . . . 3 257 997 1 550 729 310 445 926 207 160 982 98 513 197 589 13 531West Virginia . . . . . . . . . . . . . . . . 251 555 100 412 - 50 120 49 61 193 39 781 -Wisconsin . . . . . . . . . . . . . . . . . . 2 527 891 314 473 1 546 491 249 274 6 018 202 547 209 088 -Wyoming . . . . . . . . . . . . . . . . . . . 288 349 114 675 - 48 260 380 96 979 28 055 -
American Samoa . . . . . . . . . . . . . - - - - - - - -Fed. States of Micronesia . . . . . . - - - - - - - -Guam. . . . . . . . . . . . . . . . . . . . . . 27 369 2 640 - 2 360 - 14 668 7 702 -Marshall Islands. . . . . . . . . . . . . . - - - - - - - -Northern Marianas. . . . . . . . . . . . 6 490 - - - - 6 490 - -Palau . . . . . . . . . . . . . . . . . . . . . . 48 - - - - - 48 -Puerto Rico . . . . . . . . . . . . . . . . . 1 132 755 660 619 - 28 444 238 289 127 498 77 905 -Virgin Islands. . . . . . . . . . . . . . . . 9 276 1 444 - 778 595 2 882 3 576 -
Undistributed . . . . . . . . . . . . . . . . 6 404 787 - 6 404 787 - - - - -
Note: Amounts represent dollar volume of loans guaranteed during the fiscal year. See text for additional information.
20 Consolidated Federal Funds Report for Fiscal Year 1999
U.S. Census Bureau
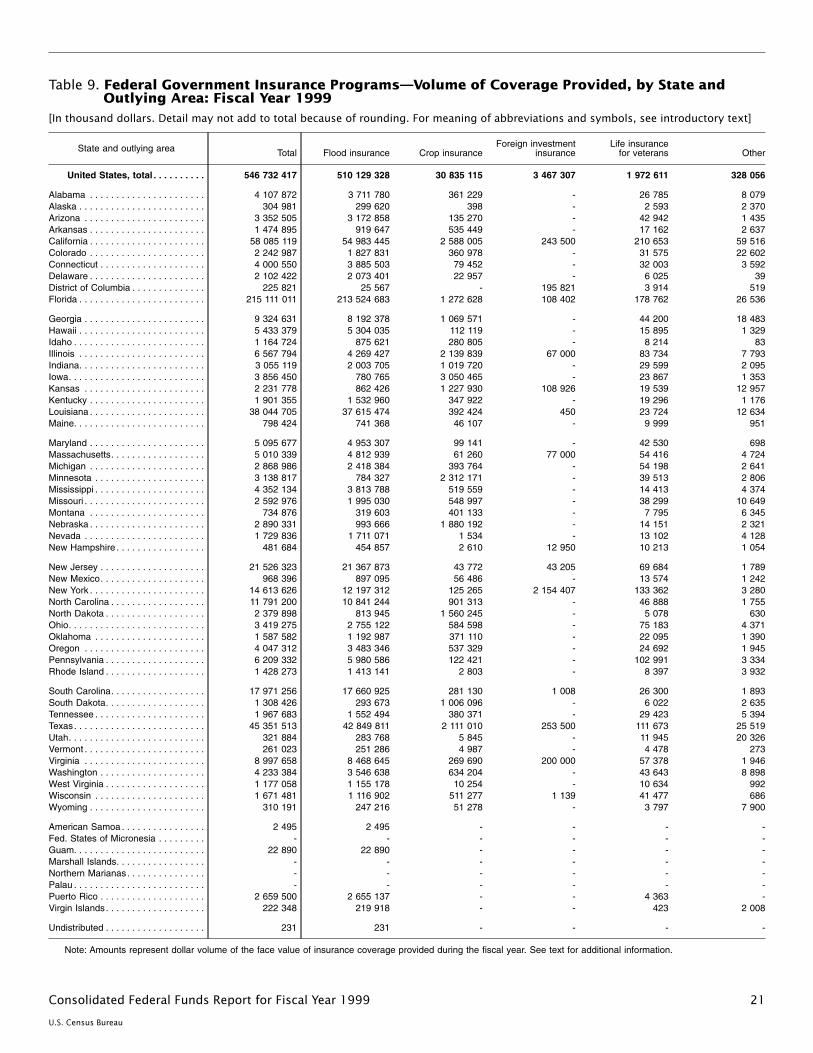
Table 9. Federal Government Insurance Programs—Volume of Coverage Provided, by State andOutlying Area: Fiscal Year 1999
[In thousand dollars. Detail may not add to total because of rounding. For meaning of abbreviations and symbols, see introductory text]
State and outlying area Total Flood insurance Crop insuranceForeign investment
insuranceLife insurance
for veterans Other
United States, total . . . . . . . . . . 546 732 417 510 129 328 30 835 115 3 467 307 1 972 611 328 056
Alabama . . . . . . . . . . . . . . . . . . . . . . 4 107 872 3 711 780 361 229 - 26 785 8 079Alaska . . . . . . . . . . . . . . . . . . . . . . . . 304 981 299 620 398 - 2 593 2 370Arizona . . . . . . . . . . . . . . . . . . . . . . . 3 352 505 3 172 858 135 270 - 42 942 1 435Arkansas . . . . . . . . . . . . . . . . . . . . . . 1 474 895 919 647 535 449 - 17 162 2 637California . . . . . . . . . . . . . . . . . . . . . . 58 085 119 54 983 445 2 588 005 243 500 210 653 59 516Colorado . . . . . . . . . . . . . . . . . . . . . . 2 242 987 1 827 831 360 978 - 31 575 22 602Connecticut . . . . . . . . . . . . . . . . . . . . 4 000 550 3 885 503 79 452 - 32 003 3 592Delaware . . . . . . . . . . . . . . . . . . . . . . 2 102 422 2 073 401 22 957 - 6 025 39District of Columbia . . . . . . . . . . . . . . 225 821 25 567 - 195 821 3 914 519Florida . . . . . . . . . . . . . . . . . . . . . . . . 215 111 011 213 524 683 1 272 628 108 402 178 762 26 536
Georgia . . . . . . . . . . . . . . . . . . . . . . . 9 324 631 8 192 378 1 069 571 - 44 200 18 483Hawaii . . . . . . . . . . . . . . . . . . . . . . . . 5 433 379 5 304 035 112 119 - 15 895 1 329Idaho . . . . . . . . . . . . . . . . . . . . . . . . . 1 164 724 875 621 280 805 - 8 214 83Illinois . . . . . . . . . . . . . . . . . . . . . . . . 6 567 794 4 269 427 2 139 839 67 000 83 734 7 793Indiana. . . . . . . . . . . . . . . . . . . . . . . . 3 055 119 2 003 705 1 019 720 - 29 599 2 095Iowa. . . . . . . . . . . . . . . . . . . . . . . . . . 3 856 450 780 765 3 050 465 - 23 867 1 353Kansas . . . . . . . . . . . . . . . . . . . . . . . 2 231 778 862 426 1 227 930 108 926 19 539 12 957Kentucky . . . . . . . . . . . . . . . . . . . . . . 1 901 355 1 532 960 347 922 - 19 296 1 176Louisiana . . . . . . . . . . . . . . . . . . . . . . 38 044 705 37 615 474 392 424 450 23 724 12 634Maine. . . . . . . . . . . . . . . . . . . . . . . . . 798 424 741 368 46 107 - 9 999 951
Maryland . . . . . . . . . . . . . . . . . . . . . . 5 095 677 4 953 307 99 141 - 42 530 698Massachusetts. . . . . . . . . . . . . . . . . . 5 010 339 4 812 939 61 260 77 000 54 416 4 724Michigan . . . . . . . . . . . . . . . . . . . . . . 2 868 986 2 418 384 393 764 - 54 198 2 641Minnesota . . . . . . . . . . . . . . . . . . . . . 3 138 817 784 327 2 312 171 - 39 513 2 806Mississippi . . . . . . . . . . . . . . . . . . . . . 4 352 134 3 813 788 519 559 - 14 413 4 374Missouri . . . . . . . . . . . . . . . . . . . . . . . 2 592 976 1 995 030 548 997 - 38 299 10 649Montana . . . . . . . . . . . . . . . . . . . . . . 734 876 319 603 401 133 - 7 795 6 345Nebraska . . . . . . . . . . . . . . . . . . . . . . 2 890 331 993 666 1 880 192 - 14 151 2 321Nevada . . . . . . . . . . . . . . . . . . . . . . . 1 729 836 1 711 071 1 534 - 13 102 4 128New Hampshire . . . . . . . . . . . . . . . . . 481 684 454 857 2 610 12 950 10 213 1 054
New Jersey . . . . . . . . . . . . . . . . . . . . 21 526 323 21 367 873 43 772 43 205 69 684 1 789New Mexico. . . . . . . . . . . . . . . . . . . . 968 396 897 095 56 486 - 13 574 1 242New York . . . . . . . . . . . . . . . . . . . . . . 14 613 626 12 197 312 125 265 2 154 407 133 362 3 280North Carolina . . . . . . . . . . . . . . . . . . 11 791 200 10 841 244 901 313 - 46 888 1 755North Dakota . . . . . . . . . . . . . . . . . . . 2 379 898 813 945 1 560 245 - 5 078 630Ohio. . . . . . . . . . . . . . . . . . . . . . . . . . 3 419 275 2 755 122 584 598 - 75 183 4 371Oklahoma . . . . . . . . . . . . . . . . . . . . . 1 587 582 1 192 987 371 110 - 22 095 1 390Oregon . . . . . . . . . . . . . . . . . . . . . . . 4 047 312 3 483 346 537 329 - 24 692 1 945Pennsylvania . . . . . . . . . . . . . . . . . . . 6 209 332 5 980 586 122 421 - 102 991 3 334Rhode Island . . . . . . . . . . . . . . . . . . . 1 428 273 1 413 141 2 803 - 8 397 3 932
South Carolina. . . . . . . . . . . . . . . . . . 17 971 256 17 660 925 281 130 1 008 26 300 1 893South Dakota. . . . . . . . . . . . . . . . . . . 1 308 426 293 673 1 006 096 - 6 022 2 635Tennessee . . . . . . . . . . . . . . . . . . . . . 1 967 683 1 552 494 380 371 - 29 423 5 394Texas. . . . . . . . . . . . . . . . . . . . . . . . . 45 351 513 42 849 811 2 111 010 253 500 111 673 25 519Utah. . . . . . . . . . . . . . . . . . . . . . . . . . 321 884 283 768 5 845 - 11 945 20 326Vermont . . . . . . . . . . . . . . . . . . . . . . . 261 023 251 286 4 987 - 4 478 273Virginia . . . . . . . . . . . . . . . . . . . . . . . 8 997 658 8 468 645 269 690 200 000 57 378 1 946Washington . . . . . . . . . . . . . . . . . . . . 4 233 384 3 546 638 634 204 - 43 643 8 898West Virginia . . . . . . . . . . . . . . . . . . . 1 177 058 1 155 178 10 254 - 10 634 992Wisconsin . . . . . . . . . . . . . . . . . . . . . 1 671 481 1 116 902 511 277 1 139 41 477 686Wyoming . . . . . . . . . . . . . . . . . . . . . . 310 191 247 216 51 278 - 3 797 7 900
American Samoa . . . . . . . . . . . . . . . . 2 495 2 495 - - - -Fed. States of Micronesia . . . . . . . . . - - - - - -Guam. . . . . . . . . . . . . . . . . . . . . . . . . 22 890 22 890 - - - -Marshall Islands. . . . . . . . . . . . . . . . . - - - - - -Northern Marianas. . . . . . . . . . . . . . . - - - - - -Palau . . . . . . . . . . . . . . . . . . . . . . . . . - - - - - -Puerto Rico . . . . . . . . . . . . . . . . . . . . 2 659 500 2 655 137 - - 4 363 -Virgin Islands. . . . . . . . . . . . . . . . . . . 222 348 219 918 - - 423 2 008
Undistributed . . . . . . . . . . . . . . . . . . . 231 231 - - - -
Note: Amounts represent dollar volume of the face value of insurance coverage provided during the fiscal year. See text for additional information.
21Consolidated Federal Funds Report for Fiscal Year 1999
U.S. Census Bureau
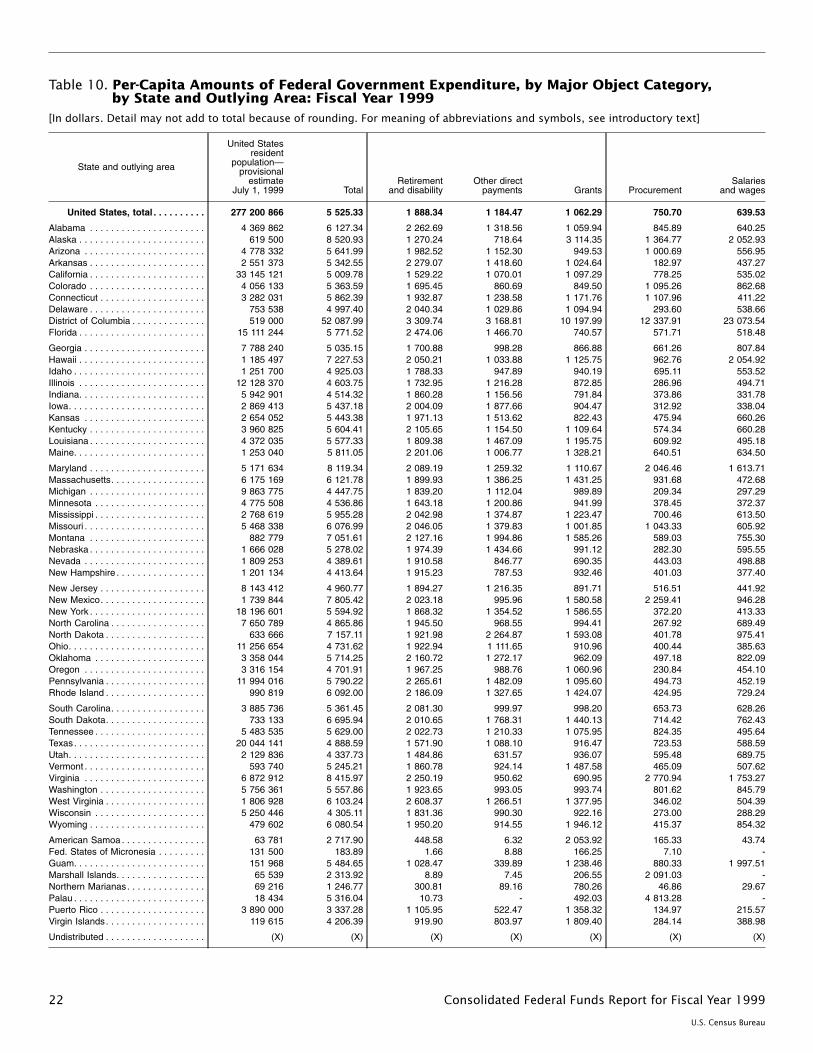
Table 10. Per-Capita Amounts of Federal Government Expenditure, by Major Object Category,by State and Outlying Area: Fiscal Year 1999
[In dollars. Detail may not add to total because of rounding. For meaning of abbreviations and symbols, see introductory text]
State and outlying area
United Statesresident
population—provisional
estimateJuly 1, 1999 Total
Retirementand disability
Other directpayments Grants Procurement
Salariesand wages
United States, total . . . . . . . . . . 277 200 866 5 525.33 1 888.34 1 184.47 1 062.29 750.70 639.53
Alabama . . . . . . . . . . . . . . . . . . . . . . 4 369 862 6 127.34 2 262.69 1 318.56 1 059.94 845.89 640.25Alaska . . . . . . . . . . . . . . . . . . . . . . . . 619 500 8 520.93 1 270.24 718.64 3 114.35 1 364.77 2 052.93Arizona . . . . . . . . . . . . . . . . . . . . . . . 4 778 332 5 641.99 1 982.52 1 152.30 949.53 1 000.69 556.95Arkansas . . . . . . . . . . . . . . . . . . . . . . 2 551 373 5 342.55 2 279.07 1 418.60 1 024.64 182.97 437.27California . . . . . . . . . . . . . . . . . . . . . . 33 145 121 5 009.78 1 529.22 1 070.01 1 097.29 778.25 535.02Colorado . . . . . . . . . . . . . . . . . . . . . . 4 056 133 5 363.59 1 695.45 860.69 849.50 1 095.26 862.68Connecticut . . . . . . . . . . . . . . . . . . . . 3 282 031 5 862.39 1 932.87 1 238.58 1 171.76 1 107.96 411.22Delaware . . . . . . . . . . . . . . . . . . . . . . 753 538 4 997.40 2 040.34 1 029.86 1 094.94 293.60 538.66District of Columbia . . . . . . . . . . . . . . 519 000 52 087.99 3 309.74 3 168.81 10 197.99 12 337.91 23 073.54Florida . . . . . . . . . . . . . . . . . . . . . . . . 15 111 244 5 771.52 2 474.06 1 466.70 740.57 571.71 518.48
Georgia . . . . . . . . . . . . . . . . . . . . . . . 7 788 240 5 035.15 1 700.88 998.28 866.88 661.26 807.84Hawaii . . . . . . . . . . . . . . . . . . . . . . . . 1 185 497 7 227.53 2 050.21 1 033.88 1 125.75 962.76 2 054.92Idaho . . . . . . . . . . . . . . . . . . . . . . . . . 1 251 700 4 925.03 1 788.33 947.89 940.19 695.11 553.52Illinois . . . . . . . . . . . . . . . . . . . . . . . . 12 128 370 4 603.75 1 732.95 1 216.28 872.85 286.96 494.71Indiana. . . . . . . . . . . . . . . . . . . . . . . . 5 942 901 4 514.32 1 860.28 1 156.56 791.84 373.86 331.78Iowa. . . . . . . . . . . . . . . . . . . . . . . . . . 2 869 413 5 437.18 2 004.09 1 877.66 904.47 312.92 338.04Kansas . . . . . . . . . . . . . . . . . . . . . . . 2 654 052 5 443.38 1 971.13 1 513.62 822.43 475.94 660.26Kentucky . . . . . . . . . . . . . . . . . . . . . . 3 960 825 5 604.41 2 105.65 1 154.50 1 109.64 574.34 660.28Louisiana . . . . . . . . . . . . . . . . . . . . . . 4 372 035 5 577.33 1 809.38 1 467.09 1 195.75 609.92 495.18Maine. . . . . . . . . . . . . . . . . . . . . . . . . 1 253 040 5 811.05 2 201.06 1 006.77 1 328.21 640.51 634.50
Maryland . . . . . . . . . . . . . . . . . . . . . . 5 171 634 8 119.34 2 089.19 1 259.32 1 110.67 2 046.46 1 613.71Massachusetts. . . . . . . . . . . . . . . . . . 6 175 169 6 121.78 1 899.93 1 386.25 1 431.25 931.68 472.68Michigan . . . . . . . . . . . . . . . . . . . . . . 9 863 775 4 447.75 1 839.20 1 112.04 989.89 209.34 297.29Minnesota . . . . . . . . . . . . . . . . . . . . . 4 775 508 4 536.86 1 643.18 1 200.86 941.99 378.45 372.37Mississippi . . . . . . . . . . . . . . . . . . . . . 2 768 619 5 955.28 2 042.98 1 374.87 1 223.47 700.46 613.50Missouri . . . . . . . . . . . . . . . . . . . . . . . 5 468 338 6 076.99 2 046.05 1 379.83 1 001.85 1 043.33 605.92Montana . . . . . . . . . . . . . . . . . . . . . . 882 779 7 051.61 2 127.16 1 994.86 1 585.26 589.03 755.30Nebraska . . . . . . . . . . . . . . . . . . . . . . 1 666 028 5 278.02 1 974.39 1 434.66 991.12 282.30 595.55Nevada . . . . . . . . . . . . . . . . . . . . . . . 1 809 253 4 389.61 1 910.58 846.77 690.35 443.03 498.88New Hampshire . . . . . . . . . . . . . . . . . 1 201 134 4 413.64 1 915.23 787.53 932.46 401.03 377.40
New Jersey . . . . . . . . . . . . . . . . . . . . 8 143 412 4 960.77 1 894.27 1 216.35 891.71 516.51 441.92New Mexico. . . . . . . . . . . . . . . . . . . . 1 739 844 7 805.42 2 023.18 995.96 1 580.58 2 259.41 946.28New York . . . . . . . . . . . . . . . . . . . . . . 18 196 601 5 594.92 1 868.32 1 354.52 1 586.55 372.20 413.33North Carolina . . . . . . . . . . . . . . . . . . 7 650 789 4 865.86 1 945.50 968.55 994.41 267.92 689.49North Dakota . . . . . . . . . . . . . . . . . . . 633 666 7 157.11 1 921.98 2 264.87 1 593.08 401.78 975.41Ohio. . . . . . . . . . . . . . . . . . . . . . . . . . 11 256 654 4 731.62 1 922.94 1 111.65 910.96 400.44 385.63Oklahoma . . . . . . . . . . . . . . . . . . . . . 3 358 044 5 714.25 2 160.72 1 272.17 962.09 497.18 822.09Oregon . . . . . . . . . . . . . . . . . . . . . . . 3 316 154 4 701.91 1 967.25 988.76 1 060.96 230.84 454.10Pennsylvania . . . . . . . . . . . . . . . . . . . 11 994 016 5 790.22 2 265.61 1 482.09 1 095.60 494.73 452.19Rhode Island . . . . . . . . . . . . . . . . . . . 990 819 6 092.00 2 186.09 1 327.65 1 424.07 424.95 729.24
South Carolina. . . . . . . . . . . . . . . . . . 3 885 736 5 361.45 2 081.30 999.97 998.20 653.73 628.26South Dakota. . . . . . . . . . . . . . . . . . . 733 133 6 695.94 2 010.65 1 768.31 1 440.13 714.42 762.43Tennessee . . . . . . . . . . . . . . . . . . . . . 5 483 535 5 629.00 2 022.73 1 210.33 1 075.95 824.35 495.64Texas. . . . . . . . . . . . . . . . . . . . . . . . . 20 044 141 4 888.59 1 571.90 1 088.10 916.47 723.53 588.59Utah. . . . . . . . . . . . . . . . . . . . . . . . . . 2 129 836 4 337.73 1 484.86 631.57 936.07 595.48 689.75Vermont . . . . . . . . . . . . . . . . . . . . . . . 593 740 5 245.21 1 860.78 924.14 1 487.58 465.09 507.62Virginia . . . . . . . . . . . . . . . . . . . . . . . 6 872 912 8 415.97 2 250.19 950.62 690.95 2 770.94 1 753.27Washington . . . . . . . . . . . . . . . . . . . . 5 756 361 5 557.86 1 923.65 993.05 993.74 801.62 845.79West Virginia . . . . . . . . . . . . . . . . . . . 1 806 928 6 103.24 2 608.37 1 266.51 1 377.95 346.02 504.39Wisconsin . . . . . . . . . . . . . . . . . . . . . 5 250 446 4 305.11 1 831.36 990.30 922.16 273.00 288.29Wyoming . . . . . . . . . . . . . . . . . . . . . . 479 602 6 080.54 1 950.20 914.55 1 946.12 415.37 854.32
American Samoa . . . . . . . . . . . . . . . . 63 781 2 717.90 448.58 6.32 2 053.92 165.33 43.74Fed. States of Micronesia . . . . . . . . . 131 500 183.89 1.66 8.88 166.25 7.10 -Guam. . . . . . . . . . . . . . . . . . . . . . . . . 151 968 5 484.65 1 028.47 339.89 1 238.46 880.33 1 997.51Marshall Islands. . . . . . . . . . . . . . . . . 65 539 2 313.92 8.89 7.45 206.55 2 091.03 -Northern Marianas. . . . . . . . . . . . . . . 69 216 1 246.77 300.81 89.16 780.26 46.86 29.67Palau . . . . . . . . . . . . . . . . . . . . . . . . . 18 434 5 316.04 10.73 - 492.03 4 813.28 -Puerto Rico . . . . . . . . . . . . . . . . . . . . 3 890 000 3 337.28 1 105.95 522.47 1 358.32 134.97 215.57Virgin Islands. . . . . . . . . . . . . . . . . . . 119 615 4 206.39 919.90 803.97 1 809.40 284.14 388.98
Undistributed . . . . . . . . . . . . . . . . . . . (X) (X) (X) (X) (X) (X) (X)
22 Consolidated Federal Funds Report for Fiscal Year 1999
U.S. Census Bureau
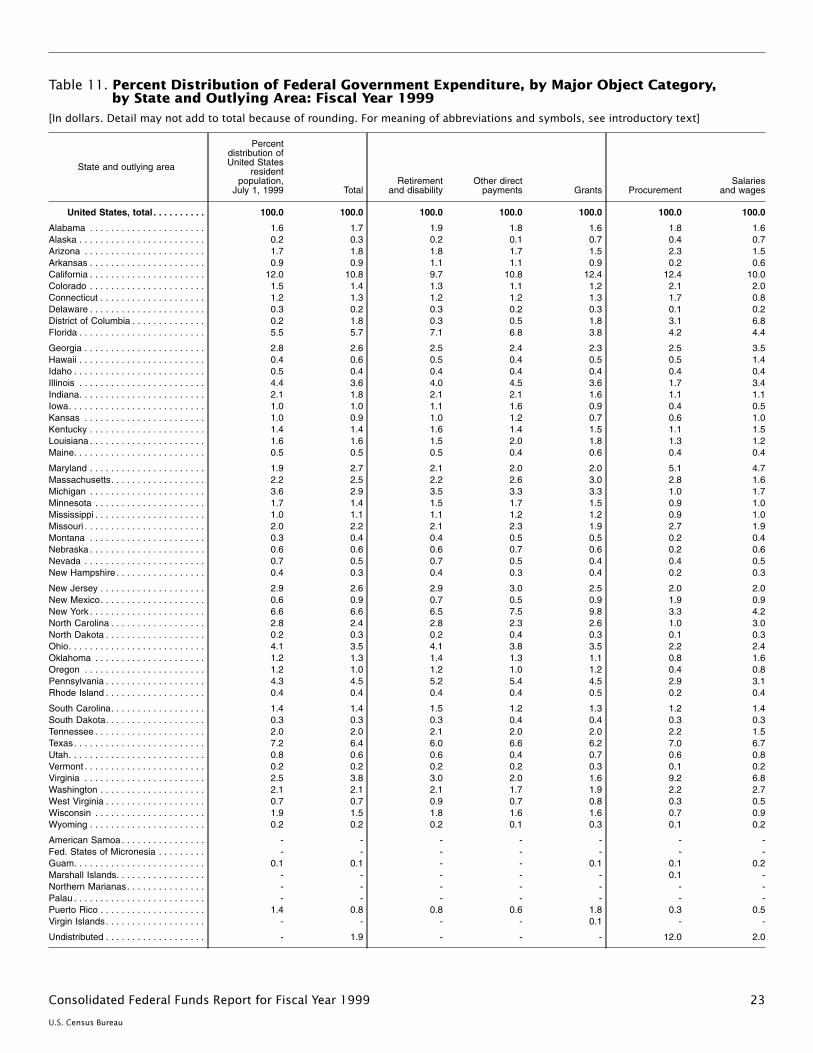
Table 11. Percent Distribution of Federal Government Expenditure, by Major Object Category,by State and Outlying Area: Fiscal Year 1999
[In dollars. Detail may not add to total because of rounding. For meaning of abbreviations and symbols, see introductory text]
State and outlying area
Percentdistribution ofUnited States
residentpopulation,
July 1, 1999 TotalRetirement
and disabilityOther direct
payments Grants ProcurementSalaries
and wages
United States, total . . . . . . . . . . 100.0 100.0 100.0 100.0 100.0 100.0 100.0
Alabama . . . . . . . . . . . . . . . . . . . . . . 1.6 1.7 1.9 1.8 1.6 1.8 1.6Alaska . . . . . . . . . . . . . . . . . . . . . . . . 0.2 0.3 0.2 0.1 0.7 0.4 0.7Arizona . . . . . . . . . . . . . . . . . . . . . . . 1.7 1.8 1.8 1.7 1.5 2.3 1.5Arkansas . . . . . . . . . . . . . . . . . . . . . . 0.9 0.9 1.1 1.1 0.9 0.2 0.6California . . . . . . . . . . . . . . . . . . . . . . 12.0 10.8 9.7 10.8 12.4 12.4 10.0Colorado . . . . . . . . . . . . . . . . . . . . . . 1.5 1.4 1.3 1.1 1.2 2.1 2.0Connecticut . . . . . . . . . . . . . . . . . . . . 1.2 1.3 1.2 1.2 1.3 1.7 0.8Delaware . . . . . . . . . . . . . . . . . . . . . . 0.3 0.2 0.3 0.2 0.3 0.1 0.2District of Columbia . . . . . . . . . . . . . . 0.2 1.8 0.3 0.5 1.8 3.1 6.8Florida . . . . . . . . . . . . . . . . . . . . . . . . 5.5 5.7 7.1 6.8 3.8 4.2 4.4
Georgia . . . . . . . . . . . . . . . . . . . . . . . 2.8 2.6 2.5 2.4 2.3 2.5 3.5Hawaii . . . . . . . . . . . . . . . . . . . . . . . . 0.4 0.6 0.5 0.4 0.5 0.5 1.4Idaho . . . . . . . . . . . . . . . . . . . . . . . . . 0.5 0.4 0.4 0.4 0.4 0.4 0.4Illinois . . . . . . . . . . . . . . . . . . . . . . . . 4.4 3.6 4.0 4.5 3.6 1.7 3.4Indiana. . . . . . . . . . . . . . . . . . . . . . . . 2.1 1.8 2.1 2.1 1.6 1.1 1.1Iowa. . . . . . . . . . . . . . . . . . . . . . . . . . 1.0 1.0 1.1 1.6 0.9 0.4 0.5Kansas . . . . . . . . . . . . . . . . . . . . . . . 1.0 0.9 1.0 1.2 0.7 0.6 1.0Kentucky . . . . . . . . . . . . . . . . . . . . . . 1.4 1.4 1.6 1.4 1.5 1.1 1.5Louisiana . . . . . . . . . . . . . . . . . . . . . . 1.6 1.6 1.5 2.0 1.8 1.3 1.2Maine. . . . . . . . . . . . . . . . . . . . . . . . . 0.5 0.5 0.5 0.4 0.6 0.4 0.4
Maryland . . . . . . . . . . . . . . . . . . . . . . 1.9 2.7 2.1 2.0 2.0 5.1 4.7Massachusetts. . . . . . . . . . . . . . . . . . 2.2 2.5 2.2 2.6 3.0 2.8 1.6Michigan . . . . . . . . . . . . . . . . . . . . . . 3.6 2.9 3.5 3.3 3.3 1.0 1.7Minnesota . . . . . . . . . . . . . . . . . . . . . 1.7 1.4 1.5 1.7 1.5 0.9 1.0Mississippi . . . . . . . . . . . . . . . . . . . . . 1.0 1.1 1.1 1.2 1.2 0.9 1.0Missouri . . . . . . . . . . . . . . . . . . . . . . . 2.0 2.2 2.1 2.3 1.9 2.7 1.9Montana . . . . . . . . . . . . . . . . . . . . . . 0.3 0.4 0.4 0.5 0.5 0.2 0.4Nebraska . . . . . . . . . . . . . . . . . . . . . . 0.6 0.6 0.6 0.7 0.6 0.2 0.6Nevada . . . . . . . . . . . . . . . . . . . . . . . 0.7 0.5 0.7 0.5 0.4 0.4 0.5New Hampshire . . . . . . . . . . . . . . . . . 0.4 0.3 0.4 0.3 0.4 0.2 0.3
New Jersey . . . . . . . . . . . . . . . . . . . . 2.9 2.6 2.9 3.0 2.5 2.0 2.0New Mexico. . . . . . . . . . . . . . . . . . . . 0.6 0.9 0.7 0.5 0.9 1.9 0.9New York . . . . . . . . . . . . . . . . . . . . . . 6.6 6.6 6.5 7.5 9.8 3.3 4.2North Carolina . . . . . . . . . . . . . . . . . . 2.8 2.4 2.8 2.3 2.6 1.0 3.0North Dakota . . . . . . . . . . . . . . . . . . . 0.2 0.3 0.2 0.4 0.3 0.1 0.3Ohio. . . . . . . . . . . . . . . . . . . . . . . . . . 4.1 3.5 4.1 3.8 3.5 2.2 2.4Oklahoma . . . . . . . . . . . . . . . . . . . . . 1.2 1.3 1.4 1.3 1.1 0.8 1.6Oregon . . . . . . . . . . . . . . . . . . . . . . . 1.2 1.0 1.2 1.0 1.2 0.4 0.8Pennsylvania . . . . . . . . . . . . . . . . . . . 4.3 4.5 5.2 5.4 4.5 2.9 3.1Rhode Island . . . . . . . . . . . . . . . . . . . 0.4 0.4 0.4 0.4 0.5 0.2 0.4
South Carolina. . . . . . . . . . . . . . . . . . 1.4 1.4 1.5 1.2 1.3 1.2 1.4South Dakota. . . . . . . . . . . . . . . . . . . 0.3 0.3 0.3 0.4 0.4 0.3 0.3Tennessee . . . . . . . . . . . . . . . . . . . . . 2.0 2.0 2.1 2.0 2.0 2.2 1.5Texas. . . . . . . . . . . . . . . . . . . . . . . . . 7.2 6.4 6.0 6.6 6.2 7.0 6.7Utah. . . . . . . . . . . . . . . . . . . . . . . . . . 0.8 0.6 0.6 0.4 0.7 0.6 0.8Vermont . . . . . . . . . . . . . . . . . . . . . . . 0.2 0.2 0.2 0.2 0.3 0.1 0.2Virginia . . . . . . . . . . . . . . . . . . . . . . . 2.5 3.8 3.0 2.0 1.6 9.2 6.8Washington . . . . . . . . . . . . . . . . . . . . 2.1 2.1 2.1 1.7 1.9 2.2 2.7West Virginia . . . . . . . . . . . . . . . . . . . 0.7 0.7 0.9 0.7 0.8 0.3 0.5Wisconsin . . . . . . . . . . . . . . . . . . . . . 1.9 1.5 1.8 1.6 1.6 0.7 0.9Wyoming . . . . . . . . . . . . . . . . . . . . . . 0.2 0.2 0.2 0.1 0.3 0.1 0.2
American Samoa . . . . . . . . . . . . . . . . - - - - - - -Fed. States of Micronesia . . . . . . . . . - - - - - - -Guam. . . . . . . . . . . . . . . . . . . . . . . . . 0.1 0.1 - - 0.1 0.1 0.2Marshall Islands. . . . . . . . . . . . . . . . . - - - - - 0.1 -Northern Marianas. . . . . . . . . . . . . . . - - - - - - -Palau . . . . . . . . . . . . . . . . . . . . . . . . . - - - - - - -Puerto Rico . . . . . . . . . . . . . . . . . . . . 1.4 0.8 0.8 0.6 1.8 0.3 0.5Virgin Islands. . . . . . . . . . . . . . . . . . . - - - - 0.1 - -
Undistributed . . . . . . . . . . . . . . . . . . . - 1.9 - - - 12.0 2.0
23Consolidated Federal Funds Report for Fiscal Year 1999
U.S. Census Bureau
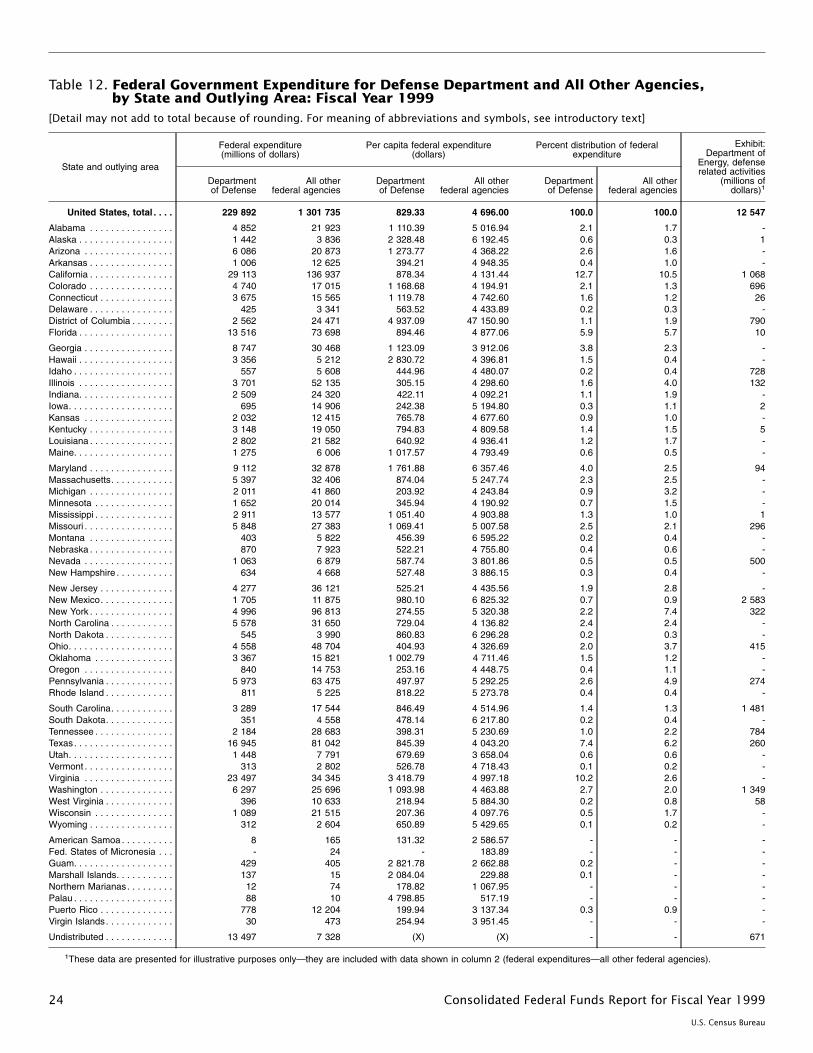
Table 12. Federal Government Expenditure for Defense Department and All Other Agencies,by State and Outlying Area: Fiscal Year 1999
[Detail may not add to total because of rounding. For meaning of abbreviations and symbols, see introductory text]
State and outlying area
Federal expenditure(millions of dollars)
Per capita federal expenditure(dollars)
Percent distribution of federalexpenditure
Exhibit:Department of
Energy, defenserelated activities
(millions ofdollars)1
Departmentof Defense
All otherfederal agencies
Departmentof Defense
All otherfederal agencies
Departmentof Defense
All otherfederal agencies
United States, total . . . . 229 892 1 301 735 829.33 4 696.00 100.0 100.0 12 547
Alabama . . . . . . . . . . . . . . . . 4 852 21 923 1 110.39 5 016.94 2.1 1.7 -Alaska . . . . . . . . . . . . . . . . . . 1 442 3 836 2 328.48 6 192.45 0.6 0.3 1Arizona . . . . . . . . . . . . . . . . . 6 086 20 873 1 273.77 4 368.22 2.6 1.6 -Arkansas . . . . . . . . . . . . . . . . 1 006 12 625 394.21 4 948.35 0.4 1.0 -California . . . . . . . . . . . . . . . . 29 113 136 937 878.34 4 131.44 12.7 10.5 1 068Colorado . . . . . . . . . . . . . . . . 4 740 17 015 1 168.68 4 194.91 2.1 1.3 696Connecticut . . . . . . . . . . . . . . 3 675 15 565 1 119.78 4 742.60 1.6 1.2 26Delaware . . . . . . . . . . . . . . . . 425 3 341 563.52 4 433.89 0.2 0.3 -District of Columbia . . . . . . . . 2 562 24 471 4 937.09 47 150.90 1.1 1.9 790Florida . . . . . . . . . . . . . . . . . . 13 516 73 698 894.46 4 877.06 5.9 5.7 10
Georgia . . . . . . . . . . . . . . . . . 8 747 30 468 1 123.09 3 912.06 3.8 2.3 -Hawaii . . . . . . . . . . . . . . . . . . 3 356 5 212 2 830.72 4 396.81 1.5 0.4 -Idaho . . . . . . . . . . . . . . . . . . . 557 5 608 444.96 4 480.07 0.2 0.4 728Illinois . . . . . . . . . . . . . . . . . . 3 701 52 135 305.15 4 298.60 1.6 4.0 132Indiana. . . . . . . . . . . . . . . . . . 2 509 24 320 422.11 4 092.21 1.1 1.9 -Iowa. . . . . . . . . . . . . . . . . . . . 695 14 906 242.38 5 194.80 0.3 1.1 2Kansas . . . . . . . . . . . . . . . . . 2 032 12 415 765.78 4 677.60 0.9 1.0 -Kentucky . . . . . . . . . . . . . . . . 3 148 19 050 794.83 4 809.58 1.4 1.5 5Louisiana . . . . . . . . . . . . . . . . 2 802 21 582 640.92 4 936.41 1.2 1.7 -Maine. . . . . . . . . . . . . . . . . . . 1 275 6 006 1 017.57 4 793.49 0.6 0.5 -
Maryland . . . . . . . . . . . . . . . . 9 112 32 878 1 761.88 6 357.46 4.0 2.5 94Massachusetts. . . . . . . . . . . . 5 397 32 406 874.04 5 247.74 2.3 2.5 -Michigan . . . . . . . . . . . . . . . . 2 011 41 860 203.92 4 243.84 0.9 3.2 -Minnesota . . . . . . . . . . . . . . . 1 652 20 014 345.94 4 190.92 0.7 1.5 -Mississippi . . . . . . . . . . . . . . . 2 911 13 577 1 051.40 4 903.88 1.3 1.0 1Missouri . . . . . . . . . . . . . . . . . 5 848 27 383 1 069.41 5 007.58 2.5 2.1 296Montana . . . . . . . . . . . . . . . . 403 5 822 456.39 6 595.22 0.2 0.4 -Nebraska . . . . . . . . . . . . . . . . 870 7 923 522.21 4 755.80 0.4 0.6 -Nevada . . . . . . . . . . . . . . . . . 1 063 6 879 587.74 3 801.86 0.5 0.5 500New Hampshire . . . . . . . . . . . 634 4 668 527.48 3 886.15 0.3 0.4 -
New Jersey . . . . . . . . . . . . . . 4 277 36 121 525.21 4 435.56 1.9 2.8 -New Mexico. . . . . . . . . . . . . . 1 705 11 875 980.10 6 825.32 0.7 0.9 2 583New York . . . . . . . . . . . . . . . . 4 996 96 813 274.55 5 320.38 2.2 7.4 322North Carolina . . . . . . . . . . . . 5 578 31 650 729.04 4 136.82 2.4 2.4 -North Dakota . . . . . . . . . . . . . 545 3 990 860.83 6 296.28 0.2 0.3 -Ohio. . . . . . . . . . . . . . . . . . . . 4 558 48 704 404.93 4 326.69 2.0 3.7 415Oklahoma . . . . . . . . . . . . . . . 3 367 15 821 1 002.79 4 711.46 1.5 1.2 -Oregon . . . . . . . . . . . . . . . . . 840 14 753 253.16 4 448.75 0.4 1.1 -Pennsylvania . . . . . . . . . . . . . 5 973 63 475 497.97 5 292.25 2.6 4.9 274Rhode Island . . . . . . . . . . . . . 811 5 225 818.22 5 273.78 0.4 0.4 -
South Carolina. . . . . . . . . . . . 3 289 17 544 846.49 4 514.96 1.4 1.3 1 481South Dakota. . . . . . . . . . . . . 351 4 558 478.14 6 217.80 0.2 0.4 -Tennessee . . . . . . . . . . . . . . . 2 184 28 683 398.31 5 230.69 1.0 2.2 784Texas. . . . . . . . . . . . . . . . . . . 16 945 81 042 845.39 4 043.20 7.4 6.2 260Utah. . . . . . . . . . . . . . . . . . . . 1 448 7 791 679.69 3 658.04 0.6 0.6 -Vermont . . . . . . . . . . . . . . . . . 313 2 802 526.78 4 718.43 0.1 0.2 -Virginia . . . . . . . . . . . . . . . . . 23 497 34 345 3 418.79 4 997.18 10.2 2.6 -Washington . . . . . . . . . . . . . . 6 297 25 696 1 093.98 4 463.88 2.7 2.0 1 349West Virginia . . . . . . . . . . . . . 396 10 633 218.94 5 884.30 0.2 0.8 58Wisconsin . . . . . . . . . . . . . . . 1 089 21 515 207.36 4 097.76 0.5 1.7 -Wyoming . . . . . . . . . . . . . . . . 312 2 604 650.89 5 429.65 0.1 0.2 -
American Samoa . . . . . . . . . . 8 165 131.32 2 586.57 - - -Fed. States of Micronesia . . . - 24 - 183.89 - - -Guam. . . . . . . . . . . . . . . . . . . 429 405 2 821.78 2 662.88 0.2 - -Marshall Islands. . . . . . . . . . . 137 15 2 084.04 229.88 0.1 - -Northern Marianas. . . . . . . . . 12 74 178.82 1 067.95 - - -Palau . . . . . . . . . . . . . . . . . . . 88 10 4 798.85 517.19 - - -Puerto Rico . . . . . . . . . . . . . . 778 12 204 199.94 3 137.34 0.3 0.9 -Virgin Islands. . . . . . . . . . . . . 30 473 254.94 3 951.45 - - -
Undistributed . . . . . . . . . . . . . 13 497 7 328 (X) (X) - - 671
1These data are presented for illustrative purposes only— they are included with data shown in column 2 (federal expenditures— all other federal agencies).
24 Consolidated Federal Funds Report for Fiscal Year 1999
U.S. Census Bureau
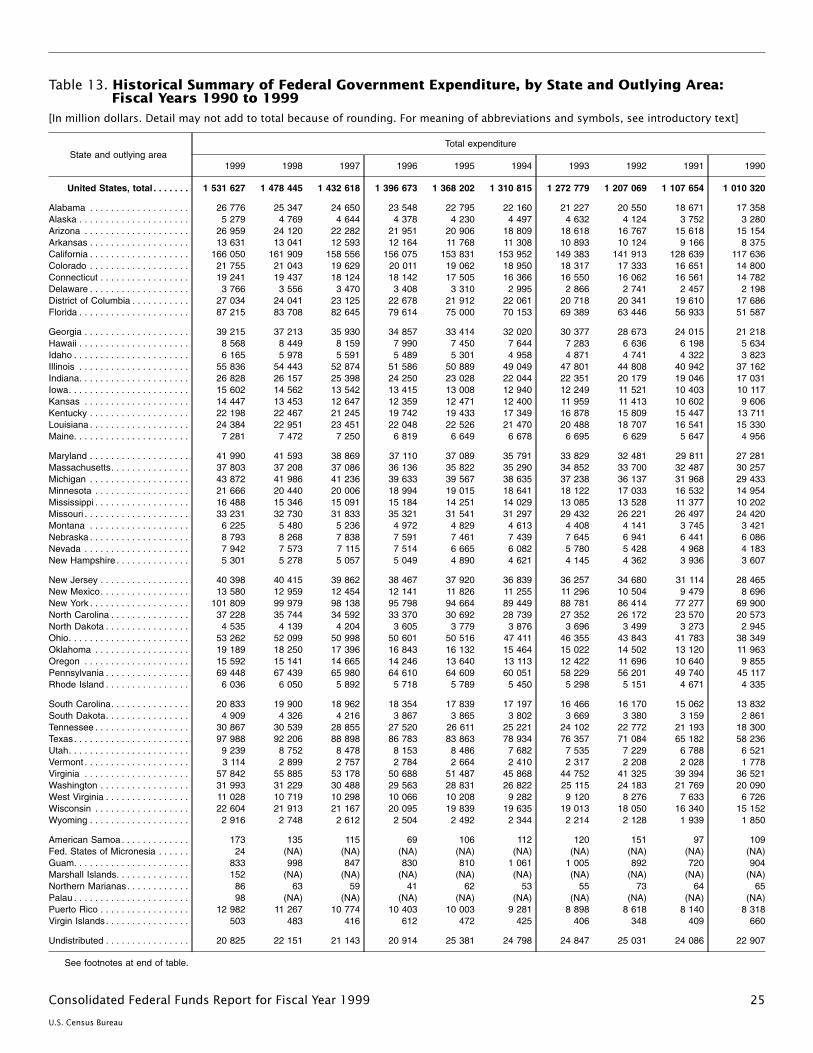
Table 13. Historical Summary of Federal Government Expenditure, by State and Outlying Area:Fiscal Years 1990 to 1999
[In million dollars. Detail may not add to total because of rounding. For meaning of abbreviations and symbols, see introductory text]
State and outlying areaTotal expenditure
1999 1998 1997 1996 1995 1994 1993 1992 1991 1990
United States, total . . . . . . . 1 531 627 1 478 445 1 432 618 1 396 673 1 368 202 1 310 815 1 272 779 1 207 069 1 107 654 1 010 320
Alabama . . . . . . . . . . . . . . . . . . . 26 776 25 347 24 650 23 548 22 795 22 160 21 227 20 550 18 671 17 358Alaska . . . . . . . . . . . . . . . . . . . . . 5 279 4 769 4 644 4 378 4 230 4 497 4 632 4 124 3 752 3 280Arizona . . . . . . . . . . . . . . . . . . . . 26 959 24 120 22 282 21 951 20 906 18 809 18 618 16 767 15 618 15 154Arkansas . . . . . . . . . . . . . . . . . . . 13 631 13 041 12 593 12 164 11 768 11 308 10 893 10 124 9 166 8 375California . . . . . . . . . . . . . . . . . . . 166 050 161 909 158 556 156 075 153 831 153 952 149 383 141 913 128 639 117 636Colorado . . . . . . . . . . . . . . . . . . . 21 755 21 043 19 629 20 011 19 062 18 950 18 317 17 333 16 651 14 800Connecticut . . . . . . . . . . . . . . . . . 19 241 19 437 18 124 18 142 17 505 16 366 16 550 16 062 16 561 14 782Delaware . . . . . . . . . . . . . . . . . . . 3 766 3 556 3 470 3 408 3 310 2 995 2 866 2 741 2 457 2 198District of Columbia . . . . . . . . . . . 27 034 24 041 23 125 22 678 21 912 22 061 20 718 20 341 19 610 17 686Florida . . . . . . . . . . . . . . . . . . . . . 87 215 83 708 82 645 79 614 75 000 70 153 69 389 63 446 56 933 51 587
Georgia . . . . . . . . . . . . . . . . . . . . 39 215 37 213 35 930 34 857 33 414 32 020 30 377 28 673 24 015 21 218Hawaii . . . . . . . . . . . . . . . . . . . . . 8 568 8 449 8 159 7 990 7 450 7 644 7 283 6 636 6 198 5 634Idaho . . . . . . . . . . . . . . . . . . . . . . 6 165 5 978 5 591 5 489 5 301 4 958 4 871 4 741 4 322 3 823Illinois . . . . . . . . . . . . . . . . . . . . . 55 836 54 443 52 874 51 586 50 889 49 049 47 801 44 808 40 942 37 162Indiana. . . . . . . . . . . . . . . . . . . . . 26 828 26 157 25 398 24 250 23 028 22 044 22 351 20 179 19 046 17 031Iowa. . . . . . . . . . . . . . . . . . . . . . . 15 602 14 562 13 542 13 415 13 008 12 940 12 249 11 521 10 403 10 117Kansas . . . . . . . . . . . . . . . . . . . . 14 447 13 453 12 647 12 359 12 471 12 400 11 959 11 413 10 602 9 606Kentucky . . . . . . . . . . . . . . . . . . . 22 198 22 467 21 245 19 742 19 433 17 349 16 878 15 809 15 447 13 711Louisiana . . . . . . . . . . . . . . . . . . . 24 384 22 951 23 451 22 048 22 526 21 470 20 488 18 707 16 541 15 330Maine. . . . . . . . . . . . . . . . . . . . . . 7 281 7 472 7 250 6 819 6 649 6 678 6 695 6 629 5 647 4 956
Maryland . . . . . . . . . . . . . . . . . . . 41 990 41 593 38 869 37 110 37 089 35 791 33 829 32 481 29 811 27 281Massachusetts. . . . . . . . . . . . . . . 37 803 37 208 37 086 36 136 35 822 35 290 34 852 33 700 32 487 30 257Michigan . . . . . . . . . . . . . . . . . . . 43 872 41 986 41 236 39 633 39 567 38 635 37 238 36 137 31 968 29 433Minnesota . . . . . . . . . . . . . . . . . . 21 666 20 440 20 006 18 994 19 015 18 641 18 122 17 033 16 532 14 954Mississippi . . . . . . . . . . . . . . . . . . 16 488 15 346 15 091 15 184 14 251 14 029 13 085 13 528 11 377 10 202Missouri . . . . . . . . . . . . . . . . . . . . 33 231 32 730 31 833 35 321 31 541 31 297 29 432 26 221 26 497 24 420Montana . . . . . . . . . . . . . . . . . . . 6 225 5 480 5 236 4 972 4 829 4 613 4 408 4 141 3 745 3 421Nebraska . . . . . . . . . . . . . . . . . . . 8 793 8 268 7 838 7 591 7 461 7 439 7 645 6 941 6 441 6 086Nevada . . . . . . . . . . . . . . . . . . . . 7 942 7 573 7 115 7 514 6 665 6 082 5 780 5 428 4 968 4 183New Hampshire . . . . . . . . . . . . . . 5 301 5 278 5 057 5 049 4 890 4 621 4 145 4 362 3 936 3 607
New Jersey . . . . . . . . . . . . . . . . . 40 398 40 415 39 862 38 467 37 920 36 839 36 257 34 680 31 114 28 465New Mexico. . . . . . . . . . . . . . . . . 13 580 12 959 12 454 12 141 11 826 11 255 11 296 10 504 9 479 8 696New York . . . . . . . . . . . . . . . . . . . 101 809 99 979 98 138 95 798 94 664 89 449 88 781 86 414 77 277 69 900North Carolina . . . . . . . . . . . . . . . 37 228 35 744 34 592 33 370 30 692 28 739 27 352 26 172 23 570 20 573North Dakota . . . . . . . . . . . . . . . . 4 535 4 139 4 204 3 605 3 779 3 876 3 696 3 499 3 273 2 945Ohio. . . . . . . . . . . . . . . . . . . . . . . 53 262 52 099 50 998 50 601 50 516 47 411 46 355 43 843 41 783 38 349Oklahoma . . . . . . . . . . . . . . . . . . 19 189 18 250 17 396 16 843 16 132 15 464 15 022 14 502 13 120 11 963Oregon . . . . . . . . . . . . . . . . . . . . 15 592 15 141 14 665 14 246 13 640 13 113 12 422 11 696 10 640 9 855Pennsylvania . . . . . . . . . . . . . . . . 69 448 67 439 65 980 64 610 64 609 60 051 58 229 56 201 49 740 45 117Rhode Island . . . . . . . . . . . . . . . . 6 036 6 050 5 892 5 718 5 789 5 450 5 298 5 151 4 671 4 335
South Carolina. . . . . . . . . . . . . . . 20 833 19 900 18 962 18 354 17 839 17 197 16 466 16 170 15 062 13 832South Dakota. . . . . . . . . . . . . . . . 4 909 4 326 4 216 3 867 3 865 3 802 3 669 3 380 3 159 2 861Tennessee . . . . . . . . . . . . . . . . . . 30 867 30 539 28 855 27 520 26 611 25 221 24 102 22 772 21 193 18 300Texas. . . . . . . . . . . . . . . . . . . . . . 97 988 92 206 88 898 86 783 83 863 78 934 76 357 71 084 65 182 58 236Utah. . . . . . . . . . . . . . . . . . . . . . . 9 239 8 752 8 478 8 153 8 486 7 682 7 535 7 229 6 788 6 521Vermont . . . . . . . . . . . . . . . . . . . . 3 114 2 899 2 757 2 784 2 664 2 410 2 317 2 208 2 028 1 778Virginia . . . . . . . . . . . . . . . . . . . . 57 842 55 885 53 178 50 688 51 487 45 868 44 752 41 325 39 394 36 521Washington . . . . . . . . . . . . . . . . . 31 993 31 229 30 488 29 563 28 831 26 822 25 115 24 183 21 769 20 090West Virginia . . . . . . . . . . . . . . . . 11 028 10 719 10 298 10 066 10 208 9 282 9 120 8 276 7 633 6 726Wisconsin . . . . . . . . . . . . . . . . . . 22 604 21 913 21 167 20 095 19 839 19 635 19 013 18 050 16 340 15 152Wyoming . . . . . . . . . . . . . . . . . . . 2 916 2 748 2 612 2 504 2 492 2 344 2 214 2 128 1 939 1 850
American Samoa . . . . . . . . . . . . . 173 135 115 69 106 112 120 151 97 109Fed. States of Micronesia . . . . . . 24 (NA) (NA) (NA) (NA) (NA) (NA) (NA) (NA) (NA)Guam. . . . . . . . . . . . . . . . . . . . . . 833 998 847 830 810 1 061 1 005 892 720 904Marshall Islands. . . . . . . . . . . . . . 152 (NA) (NA) (NA) (NA) (NA) (NA) (NA) (NA) (NA)Northern Marianas. . . . . . . . . . . . 86 63 59 41 62 53 55 73 64 65Palau . . . . . . . . . . . . . . . . . . . . . . 98 (NA) (NA) (NA) (NA) (NA) (NA) (NA) (NA) (NA)Puerto Rico . . . . . . . . . . . . . . . . . 12 982 11 267 10 774 10 403 10 003 9 281 8 898 8 618 8 140 8 318Virgin Islands. . . . . . . . . . . . . . . . 503 483 416 612 472 425 406 348 409 660
Undistributed . . . . . . . . . . . . . . . . 20 825 22 151 21 143 20 914 25 381 24 798 24 847 25 031 24 086 22 907
See footnotes at end of table.
25Consolidated Federal Funds Report for Fiscal Year 1999
U.S. Census Bureau
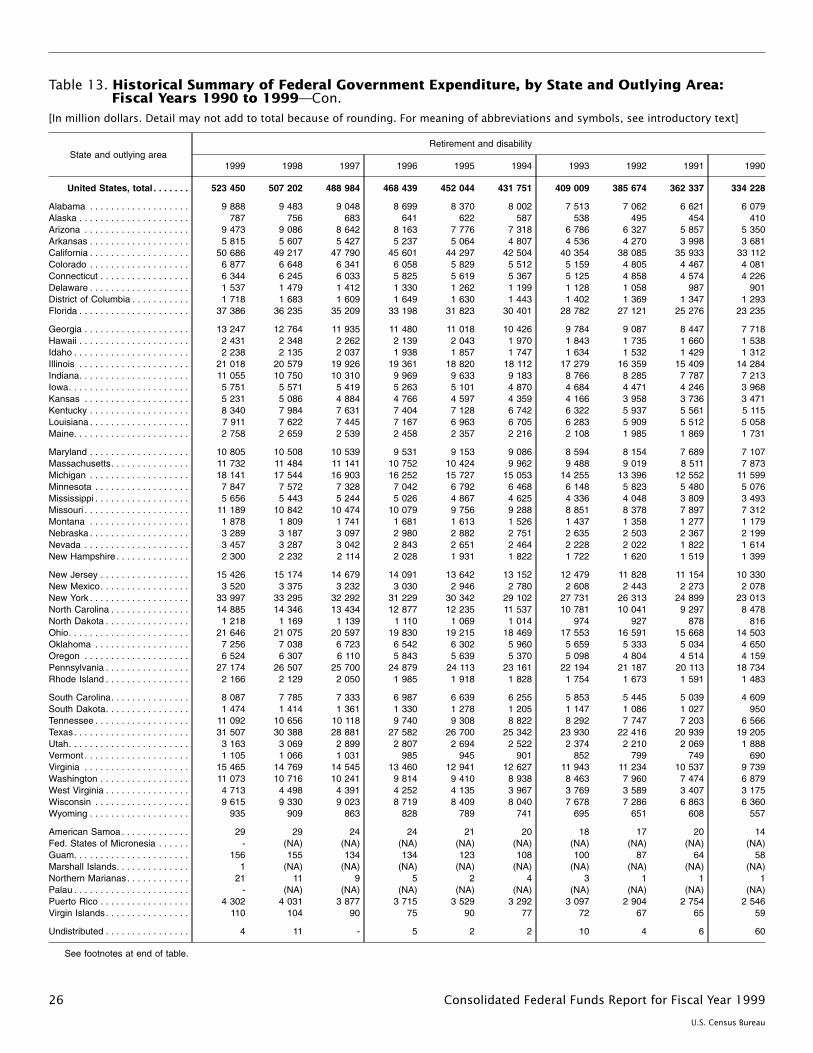
Table 13. Historical Summary of Federal Government Expenditure, by State and Outlying Area:Fiscal Years 1990 to 1999—Con.
[In million dollars. Detail may not add to total because of rounding. For meaning of abbreviations and symbols, see introductory text]
State and outlying areaRetirement and disability
1999 1998 1997 1996 1995 1994 1993 1992 1991 1990
United States, total . . . . . . . 523 450 507 202 488 984 468 439 452 044 431 751 409 009 385 674 362 337 334 228
Alabama . . . . . . . . . . . . . . . . . . . 9 888 9 483 9 048 8 699 8 370 8 002 7 513 7 062 6 621 6 079Alaska . . . . . . . . . . . . . . . . . . . . . 787 756 683 641 622 587 538 495 454 410Arizona . . . . . . . . . . . . . . . . . . . . 9 473 9 086 8 642 8 163 7 776 7 318 6 786 6 327 5 857 5 350Arkansas . . . . . . . . . . . . . . . . . . . 5 815 5 607 5 427 5 237 5 064 4 807 4 536 4 270 3 998 3 681California . . . . . . . . . . . . . . . . . . . 50 686 49 217 47 790 45 601 44 297 42 504 40 354 38 085 35 933 33 112Colorado . . . . . . . . . . . . . . . . . . . 6 877 6 648 6 341 6 058 5 829 5 512 5 159 4 805 4 467 4 081Connecticut . . . . . . . . . . . . . . . . . 6 344 6 245 6 033 5 825 5 619 5 367 5 125 4 858 4 574 4 226Delaware . . . . . . . . . . . . . . . . . . . 1 537 1 479 1 412 1 330 1 262 1 199 1 128 1 058 987 901District of Columbia . . . . . . . . . . . 1 718 1 683 1 609 1 649 1 630 1 443 1 402 1 369 1 347 1 293Florida . . . . . . . . . . . . . . . . . . . . . 37 386 36 235 35 209 33 198 31 823 30 401 28 782 27 121 25 276 23 235
Georgia . . . . . . . . . . . . . . . . . . . . 13 247 12 764 11 935 11 480 11 018 10 426 9 784 9 087 8 447 7 718Hawaii . . . . . . . . . . . . . . . . . . . . . 2 431 2 348 2 262 2 139 2 043 1 970 1 843 1 735 1 660 1 538Idaho . . . . . . . . . . . . . . . . . . . . . . 2 238 2 135 2 037 1 938 1 857 1 747 1 634 1 532 1 429 1 312Illinois . . . . . . . . . . . . . . . . . . . . . 21 018 20 579 19 926 19 361 18 820 18 112 17 279 16 359 15 409 14 284Indiana. . . . . . . . . . . . . . . . . . . . . 11 055 10 750 10 310 9 969 9 633 9 183 8 766 8 285 7 787 7 213Iowa. . . . . . . . . . . . . . . . . . . . . . . 5 751 5 571 5 419 5 263 5 101 4 870 4 684 4 471 4 246 3 968Kansas . . . . . . . . . . . . . . . . . . . . 5 231 5 086 4 884 4 766 4 597 4 359 4 166 3 958 3 736 3 471Kentucky . . . . . . . . . . . . . . . . . . . 8 340 7 984 7 631 7 404 7 128 6 742 6 322 5 937 5 561 5 115Louisiana . . . . . . . . . . . . . . . . . . . 7 911 7 622 7 445 7 167 6 963 6 705 6 283 5 909 5 512 5 058Maine. . . . . . . . . . . . . . . . . . . . . . 2 758 2 659 2 539 2 458 2 357 2 216 2 108 1 985 1 869 1 731
Maryland . . . . . . . . . . . . . . . . . . . 10 805 10 508 10 539 9 531 9 153 9 086 8 594 8 154 7 689 7 107Massachusetts. . . . . . . . . . . . . . . 11 732 11 484 11 141 10 752 10 424 9 962 9 488 9 019 8 511 7 873Michigan . . . . . . . . . . . . . . . . . . . 18 141 17 544 16 903 16 252 15 727 15 053 14 255 13 396 12 552 11 599Minnesota . . . . . . . . . . . . . . . . . . 7 847 7 572 7 328 7 042 6 792 6 468 6 148 5 823 5 480 5 076Mississippi . . . . . . . . . . . . . . . . . . 5 656 5 443 5 244 5 026 4 867 4 625 4 336 4 048 3 809 3 493Missouri . . . . . . . . . . . . . . . . . . . . 11 189 10 842 10 474 10 079 9 756 9 288 8 851 8 378 7 897 7 312Montana . . . . . . . . . . . . . . . . . . . 1 878 1 809 1 741 1 681 1 613 1 526 1 437 1 358 1 277 1 179Nebraska . . . . . . . . . . . . . . . . . . . 3 289 3 187 3 097 2 980 2 882 2 751 2 635 2 503 2 367 2 199Nevada . . . . . . . . . . . . . . . . . . . . 3 457 3 287 3 042 2 843 2 651 2 464 2 228 2 022 1 822 1 614New Hampshire . . . . . . . . . . . . . . 2 300 2 232 2 114 2 028 1 931 1 822 1 722 1 620 1 519 1 399
New Jersey . . . . . . . . . . . . . . . . . 15 426 15 174 14 679 14 091 13 642 13 152 12 479 11 828 11 154 10 330New Mexico. . . . . . . . . . . . . . . . . 3 520 3 375 3 232 3 030 2 946 2 780 2 608 2 443 2 273 2 078New York . . . . . . . . . . . . . . . . . . . 33 997 33 295 32 292 31 229 30 342 29 102 27 731 26 313 24 899 23 013North Carolina . . . . . . . . . . . . . . . 14 885 14 346 13 434 12 877 12 235 11 537 10 781 10 041 9 297 8 478North Dakota . . . . . . . . . . . . . . . . 1 218 1 169 1 139 1 110 1 069 1 014 974 927 878 816Ohio. . . . . . . . . . . . . . . . . . . . . . . 21 646 21 075 20 597 19 830 19 215 18 469 17 553 16 591 15 668 14 503Oklahoma . . . . . . . . . . . . . . . . . . 7 256 7 038 6 723 6 542 6 302 5 960 5 659 5 333 5 034 4 650Oregon . . . . . . . . . . . . . . . . . . . . 6 524 6 307 6 110 5 843 5 639 5 370 5 098 4 804 4 514 4 159Pennsylvania . . . . . . . . . . . . . . . . 27 174 26 507 25 700 24 879 24 113 23 161 22 194 21 187 20 113 18 734Rhode Island . . . . . . . . . . . . . . . . 2 166 2 129 2 050 1 985 1 918 1 828 1 754 1 673 1 591 1 483
South Carolina. . . . . . . . . . . . . . . 8 087 7 785 7 333 6 987 6 639 6 255 5 853 5 445 5 039 4 609South Dakota. . . . . . . . . . . . . . . . 1 474 1 414 1 361 1 330 1 278 1 205 1 147 1 086 1 027 950Tennessee . . . . . . . . . . . . . . . . . . 11 092 10 656 10 118 9 740 9 308 8 822 8 292 7 747 7 203 6 566Texas. . . . . . . . . . . . . . . . . . . . . . 31 507 30 388 28 881 27 582 26 700 25 342 23 930 22 416 20 939 19 205Utah. . . . . . . . . . . . . . . . . . . . . . . 3 163 3 069 2 899 2 807 2 694 2 522 2 374 2 210 2 069 1 888Vermont . . . . . . . . . . . . . . . . . . . . 1 105 1 066 1 031 985 945 901 852 799 749 690Virginia . . . . . . . . . . . . . . . . . . . . 15 465 14 769 14 545 13 460 12 941 12 627 11 943 11 234 10 537 9 739Washington . . . . . . . . . . . . . . . . . 11 073 10 716 10 241 9 814 9 410 8 938 8 463 7 960 7 474 6 879West Virginia . . . . . . . . . . . . . . . . 4 713 4 498 4 391 4 252 4 135 3 967 3 769 3 589 3 407 3 175Wisconsin . . . . . . . . . . . . . . . . . . 9 615 9 330 9 023 8 719 8 409 8 040 7 678 7 286 6 863 6 360Wyoming . . . . . . . . . . . . . . . . . . . 935 909 863 828 789 741 695 651 608 557
American Samoa . . . . . . . . . . . . . 29 29 24 24 21 20 18 17 20 14Fed. States of Micronesia . . . . . . - (NA) (NA) (NA) (NA) (NA) (NA) (NA) (NA) (NA)Guam. . . . . . . . . . . . . . . . . . . . . . 156 155 134 134 123 108 100 87 64 58Marshall Islands. . . . . . . . . . . . . . 1 (NA) (NA) (NA) (NA) (NA) (NA) (NA) (NA) (NA)Northern Marianas. . . . . . . . . . . . 21 11 9 5 2 4 3 1 1 1Palau . . . . . . . . . . . . . . . . . . . . . . - (NA) (NA) (NA) (NA) (NA) (NA) (NA) (NA) (NA)Puerto Rico . . . . . . . . . . . . . . . . . 4 302 4 031 3 877 3 715 3 529 3 292 3 097 2 904 2 754 2 546Virgin Islands. . . . . . . . . . . . . . . . 110 104 90 75 90 77 72 67 65 59
Undistributed . . . . . . . . . . . . . . . . 4 11 - 5 2 2 10 4 6 60
See footnotes at end of table.
26 Consolidated Federal Funds Report for Fiscal Year 1999
U.S. Census Bureau
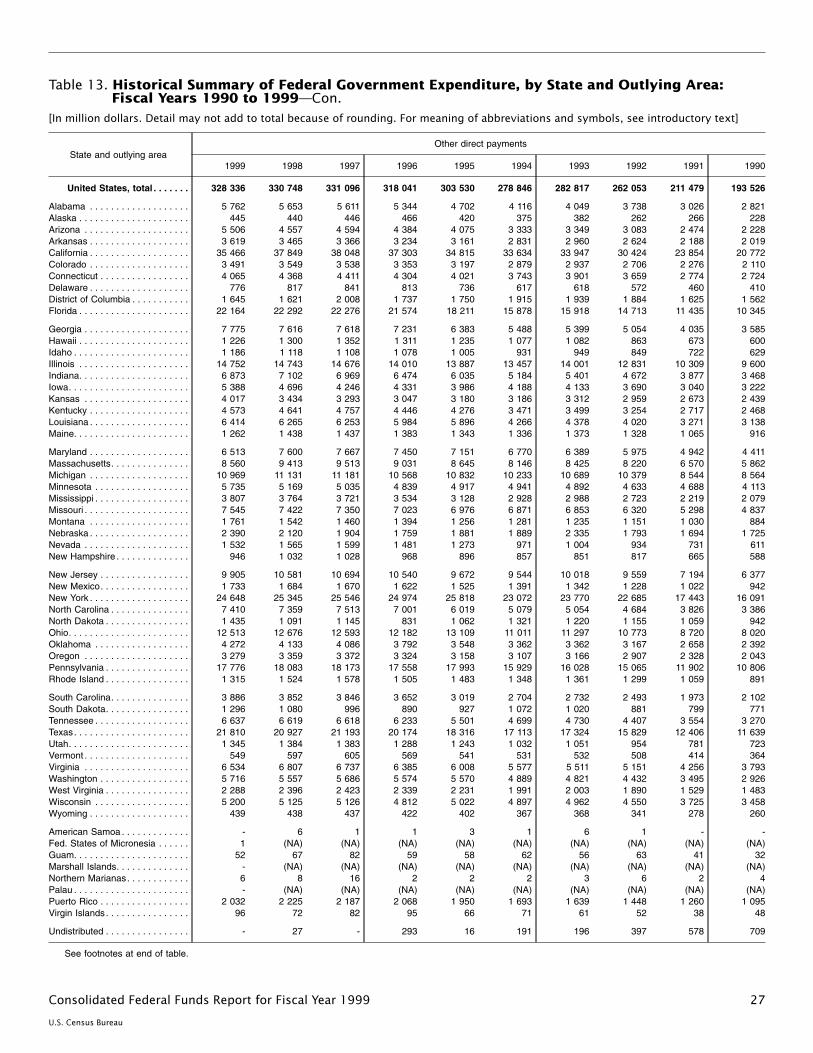
Table 13. Historical Summary of Federal Government Expenditure, by State and Outlying Area:Fiscal Years 1990 to 1999—Con.
[In million dollars. Detail may not add to total because of rounding. For meaning of abbreviations and symbols, see introductory text]
State and outlying areaOther direct payments
1999 1998 1997 1996 1995 1994 1993 1992 1991 1990
United States, total . . . . . . . 328 336 330 748 331 096 318 041 303 530 278 846 282 817 262 053 211 479 193 526
Alabama . . . . . . . . . . . . . . . . . . . 5 762 5 653 5 611 5 344 4 702 4 116 4 049 3 738 3 026 2 821Alaska . . . . . . . . . . . . . . . . . . . . . 445 440 446 466 420 375 382 262 266 228Arizona . . . . . . . . . . . . . . . . . . . . 5 506 4 557 4 594 4 384 4 075 3 333 3 349 3 083 2 474 2 228Arkansas . . . . . . . . . . . . . . . . . . . 3 619 3 465 3 366 3 234 3 161 2 831 2 960 2 624 2 188 2 019California . . . . . . . . . . . . . . . . . . . 35 466 37 849 38 048 37 303 34 815 33 634 33 947 30 424 23 854 20 772Colorado . . . . . . . . . . . . . . . . . . . 3 491 3 549 3 538 3 353 3 197 2 879 2 937 2 706 2 276 2 110Connecticut . . . . . . . . . . . . . . . . . 4 065 4 368 4 411 4 304 4 021 3 743 3 901 3 659 2 774 2 724Delaware . . . . . . . . . . . . . . . . . . . 776 817 841 813 736 617 618 572 460 410District of Columbia . . . . . . . . . . . 1 645 1 621 2 008 1 737 1 750 1 915 1 939 1 884 1 625 1 562Florida . . . . . . . . . . . . . . . . . . . . . 22 164 22 292 22 276 21 574 18 211 15 878 15 918 14 713 11 435 10 345
Georgia . . . . . . . . . . . . . . . . . . . . 7 775 7 616 7 618 7 231 6 383 5 488 5 399 5 054 4 035 3 585Hawaii . . . . . . . . . . . . . . . . . . . . . 1 226 1 300 1 352 1 311 1 235 1 077 1 082 863 673 600Idaho . . . . . . . . . . . . . . . . . . . . . . 1 186 1 118 1 108 1 078 1 005 931 949 849 722 629Illinois . . . . . . . . . . . . . . . . . . . . . 14 752 14 743 14 676 14 010 13 887 13 457 14 001 12 831 10 309 9 600Indiana. . . . . . . . . . . . . . . . . . . . . 6 873 7 102 6 969 6 474 6 035 5 184 5 401 4 672 3 877 3 468Iowa. . . . . . . . . . . . . . . . . . . . . . . 5 388 4 696 4 246 4 331 3 986 4 188 4 133 3 690 3 040 3 222Kansas . . . . . . . . . . . . . . . . . . . . 4 017 3 434 3 293 3 047 3 180 3 186 3 312 2 959 2 673 2 439Kentucky . . . . . . . . . . . . . . . . . . . 4 573 4 641 4 757 4 446 4 276 3 471 3 499 3 254 2 717 2 468Louisiana . . . . . . . . . . . . . . . . . . . 6 414 6 265 6 253 5 984 5 896 4 266 4 378 4 020 3 271 3 138Maine. . . . . . . . . . . . . . . . . . . . . . 1 262 1 438 1 437 1 383 1 343 1 336 1 373 1 328 1 065 916
Maryland . . . . . . . . . . . . . . . . . . . 6 513 7 600 7 667 7 450 7 151 6 770 6 389 5 975 4 942 4 411Massachusetts. . . . . . . . . . . . . . . 8 560 9 413 9 513 9 031 8 645 8 146 8 425 8 220 6 570 5 862Michigan . . . . . . . . . . . . . . . . . . . 10 969 11 131 11 181 10 568 10 832 10 233 10 689 10 379 8 544 8 564Minnesota . . . . . . . . . . . . . . . . . . 5 735 5 169 5 035 4 839 4 917 4 941 4 892 4 633 4 688 4 113Mississippi . . . . . . . . . . . . . . . . . . 3 807 3 764 3 721 3 534 3 128 2 928 2 988 2 723 2 219 2 079Missouri . . . . . . . . . . . . . . . . . . . . 7 545 7 422 7 350 7 023 6 976 6 871 6 853 6 320 5 298 4 837Montana . . . . . . . . . . . . . . . . . . . 1 761 1 542 1 460 1 394 1 256 1 281 1 235 1 151 1 030 884Nebraska . . . . . . . . . . . . . . . . . . . 2 390 2 120 1 904 1 759 1 881 1 889 2 335 1 793 1 694 1 725Nevada . . . . . . . . . . . . . . . . . . . . 1 532 1 565 1 599 1 481 1 273 971 1 004 934 731 611New Hampshire . . . . . . . . . . . . . . 946 1 032 1 028 968 896 857 851 817 665 588
New Jersey . . . . . . . . . . . . . . . . . 9 905 10 581 10 694 10 540 9 672 9 544 10 018 9 559 7 194 6 377New Mexico. . . . . . . . . . . . . . . . . 1 733 1 684 1 670 1 622 1 525 1 391 1 342 1 228 1 022 942New York . . . . . . . . . . . . . . . . . . . 24 648 25 345 25 546 24 974 25 818 23 072 23 770 22 685 17 443 16 091North Carolina . . . . . . . . . . . . . . . 7 410 7 359 7 513 7 001 6 019 5 079 5 054 4 684 3 826 3 386North Dakota . . . . . . . . . . . . . . . . 1 435 1 091 1 145 831 1 062 1 321 1 220 1 155 1 059 942Ohio. . . . . . . . . . . . . . . . . . . . . . . 12 513 12 676 12 593 12 182 13 109 11 011 11 297 10 773 8 720 8 020Oklahoma . . . . . . . . . . . . . . . . . . 4 272 4 133 4 086 3 792 3 548 3 362 3 362 3 167 2 658 2 392Oregon . . . . . . . . . . . . . . . . . . . . 3 279 3 359 3 372 3 324 3 158 3 107 3 166 2 907 2 328 2 043Pennsylvania . . . . . . . . . . . . . . . . 17 776 18 083 18 173 17 558 17 993 15 929 16 028 15 065 11 902 10 806Rhode Island . . . . . . . . . . . . . . . . 1 315 1 524 1 578 1 505 1 483 1 348 1 361 1 299 1 059 891
South Carolina. . . . . . . . . . . . . . . 3 886 3 852 3 846 3 652 3 019 2 704 2 732 2 493 1 973 2 102South Dakota. . . . . . . . . . . . . . . . 1 296 1 080 996 890 927 1 072 1 020 881 799 771Tennessee . . . . . . . . . . . . . . . . . . 6 637 6 619 6 618 6 233 5 501 4 699 4 730 4 407 3 554 3 270Texas. . . . . . . . . . . . . . . . . . . . . . 21 810 20 927 21 193 20 174 18 316 17 113 17 324 15 829 12 406 11 639Utah. . . . . . . . . . . . . . . . . . . . . . . 1 345 1 384 1 383 1 288 1 243 1 032 1 051 954 781 723Vermont . . . . . . . . . . . . . . . . . . . . 549 597 605 569 541 531 532 508 414 364Virginia . . . . . . . . . . . . . . . . . . . . 6 534 6 807 6 737 6 385 6 008 5 577 5 511 5 151 4 256 3 793Washington . . . . . . . . . . . . . . . . . 5 716 5 557 5 686 5 574 5 570 4 889 4 821 4 432 3 495 2 926West Virginia . . . . . . . . . . . . . . . . 2 288 2 396 2 423 2 339 2 231 1 991 2 003 1 890 1 529 1 483Wisconsin . . . . . . . . . . . . . . . . . . 5 200 5 125 5 126 4 812 5 022 4 897 4 962 4 550 3 725 3 458Wyoming . . . . . . . . . . . . . . . . . . . 439 438 437 422 402 367 368 341 278 260
American Samoa . . . . . . . . . . . . . - 6 1 1 3 1 6 1 - -Fed. States of Micronesia . . . . . . 1 (NA) (NA) (NA) (NA) (NA) (NA) (NA) (NA) (NA)Guam. . . . . . . . . . . . . . . . . . . . . . 52 67 82 59 58 62 56 63 41 32Marshall Islands. . . . . . . . . . . . . . - (NA) (NA) (NA) (NA) (NA) (NA) (NA) (NA) (NA)Northern Marianas. . . . . . . . . . . . 6 8 16 2 2 2 3 6 2 4Palau . . . . . . . . . . . . . . . . . . . . . . - (NA) (NA) (NA) (NA) (NA) (NA) (NA) (NA) (NA)Puerto Rico . . . . . . . . . . . . . . . . . 2 032 2 225 2 187 2 068 1 950 1 693 1 639 1 448 1 260 1 095Virgin Islands. . . . . . . . . . . . . . . . 96 72 82 95 66 71 61 52 38 48
Undistributed . . . . . . . . . . . . . . . . - 27 - 293 16 191 196 397 578 709
See footnotes at end of table.
27Consolidated Federal Funds Report for Fiscal Year 1999
U.S. Census Bureau
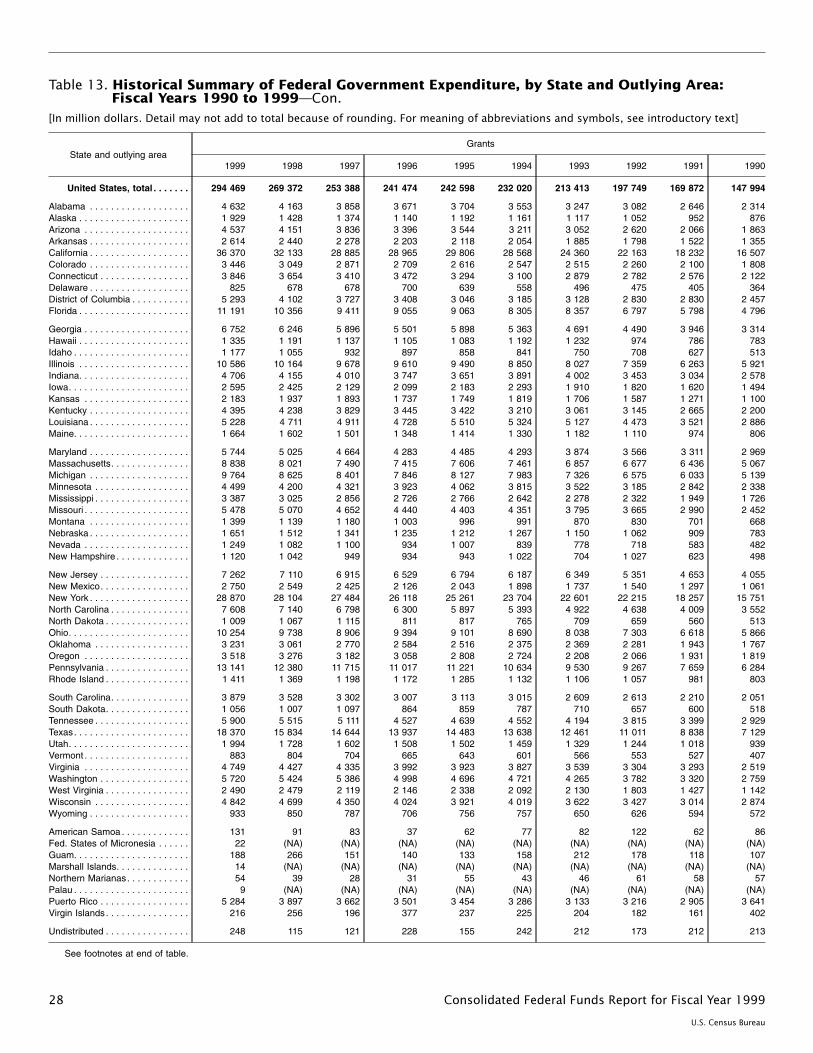
Table 13. Historical Summary of Federal Government Expenditure, by State and Outlying Area:Fiscal Years 1990 to 1999—Con.
[In million dollars. Detail may not add to total because of rounding. For meaning of abbreviations and symbols, see introductory text]
State and outlying areaGrants
1999 1998 1997 1996 1995 1994 1993 1992 1991 1990
United States, total . . . . . . . 294 469 269 372 253 388 241 474 242 598 232 020 213 413 197 749 169 872 147 994
Alabama . . . . . . . . . . . . . . . . . . . 4 632 4 163 3 858 3 671 3 704 3 553 3 247 3 082 2 646 2 314Alaska . . . . . . . . . . . . . . . . . . . . . 1 929 1 428 1 374 1 140 1 192 1 161 1 117 1 052 952 876Arizona . . . . . . . . . . . . . . . . . . . . 4 537 4 151 3 836 3 396 3 544 3 211 3 052 2 620 2 066 1 863Arkansas . . . . . . . . . . . . . . . . . . . 2 614 2 440 2 278 2 203 2 118 2 054 1 885 1 798 1 522 1 355California . . . . . . . . . . . . . . . . . . . 36 370 32 133 28 885 28 965 29 806 28 568 24 360 22 163 18 232 16 507Colorado . . . . . . . . . . . . . . . . . . . 3 446 3 049 2 871 2 709 2 616 2 547 2 515 2 260 2 100 1 808Connecticut . . . . . . . . . . . . . . . . . 3 846 3 654 3 410 3 472 3 294 3 100 2 879 2 782 2 576 2 122Delaware . . . . . . . . . . . . . . . . . . . 825 678 678 700 639 558 496 475 405 364District of Columbia . . . . . . . . . . . 5 293 4 102 3 727 3 408 3 046 3 185 3 128 2 830 2 830 2 457Florida . . . . . . . . . . . . . . . . . . . . . 11 191 10 356 9 411 9 055 9 063 8 305 8 357 6 797 5 798 4 796
Georgia . . . . . . . . . . . . . . . . . . . . 6 752 6 246 5 896 5 501 5 898 5 363 4 691 4 490 3 946 3 314Hawaii . . . . . . . . . . . . . . . . . . . . . 1 335 1 191 1 137 1 105 1 083 1 192 1 232 974 786 783Idaho . . . . . . . . . . . . . . . . . . . . . . 1 177 1 055 932 897 858 841 750 708 627 513Illinois . . . . . . . . . . . . . . . . . . . . . 10 586 10 164 9 678 9 610 9 490 8 850 8 027 7 359 6 263 5 921Indiana. . . . . . . . . . . . . . . . . . . . . 4 706 4 155 4 010 3 747 3 651 3 891 4 002 3 453 3 034 2 578Iowa. . . . . . . . . . . . . . . . . . . . . . . 2 595 2 425 2 129 2 099 2 183 2 293 1 910 1 820 1 620 1 494Kansas . . . . . . . . . . . . . . . . . . . . 2 183 1 937 1 893 1 737 1 749 1 819 1 706 1 587 1 271 1 100Kentucky . . . . . . . . . . . . . . . . . . . 4 395 4 238 3 829 3 445 3 422 3 210 3 061 3 145 2 665 2 200Louisiana . . . . . . . . . . . . . . . . . . . 5 228 4 711 4 911 4 728 5 510 5 324 5 127 4 473 3 521 2 886Maine. . . . . . . . . . . . . . . . . . . . . . 1 664 1 602 1 501 1 348 1 414 1 330 1 182 1 110 974 806
Maryland . . . . . . . . . . . . . . . . . . . 5 744 5 025 4 664 4 283 4 485 4 293 3 874 3 566 3 311 2 969Massachusetts. . . . . . . . . . . . . . . 8 838 8 021 7 490 7 415 7 606 7 461 6 857 6 677 6 436 5 067Michigan . . . . . . . . . . . . . . . . . . . 9 764 8 625 8 401 7 846 8 127 7 983 7 326 6 575 6 033 5 139Minnesota . . . . . . . . . . . . . . . . . . 4 499 4 200 4 321 3 923 4 062 3 815 3 522 3 185 2 842 2 338Mississippi . . . . . . . . . . . . . . . . . . 3 387 3 025 2 856 2 726 2 766 2 642 2 278 2 322 1 949 1 726Missouri . . . . . . . . . . . . . . . . . . . . 5 478 5 070 4 652 4 440 4 403 4 351 3 795 3 665 2 990 2 452Montana . . . . . . . . . . . . . . . . . . . 1 399 1 139 1 180 1 003 996 991 870 830 701 668Nebraska . . . . . . . . . . . . . . . . . . . 1 651 1 512 1 341 1 235 1 212 1 267 1 150 1 062 909 783Nevada . . . . . . . . . . . . . . . . . . . . 1 249 1 082 1 100 934 1 007 839 778 718 583 482New Hampshire . . . . . . . . . . . . . . 1 120 1 042 949 934 943 1 022 704 1 027 623 498
New Jersey . . . . . . . . . . . . . . . . . 7 262 7 110 6 915 6 529 6 794 6 187 6 349 5 351 4 653 4 055New Mexico. . . . . . . . . . . . . . . . . 2 750 2 549 2 425 2 126 2 043 1 898 1 737 1 540 1 297 1 061New York . . . . . . . . . . . . . . . . . . . 28 870 28 104 27 484 26 118 25 261 23 704 22 601 22 215 18 257 15 751North Carolina . . . . . . . . . . . . . . . 7 608 7 140 6 798 6 300 5 897 5 393 4 922 4 638 4 009 3 552North Dakota . . . . . . . . . . . . . . . . 1 009 1 067 1 115 811 817 765 709 659 560 513Ohio. . . . . . . . . . . . . . . . . . . . . . . 10 254 9 738 8 906 9 394 9 101 8 690 8 038 7 303 6 618 5 866Oklahoma . . . . . . . . . . . . . . . . . . 3 231 3 061 2 770 2 584 2 516 2 375 2 369 2 281 1 943 1 767Oregon . . . . . . . . . . . . . . . . . . . . 3 518 3 276 3 182 3 058 2 808 2 724 2 208 2 066 1 931 1 819Pennsylvania . . . . . . . . . . . . . . . . 13 141 12 380 11 715 11 017 11 221 10 634 9 530 9 267 7 659 6 284Rhode Island . . . . . . . . . . . . . . . . 1 411 1 369 1 198 1 172 1 285 1 132 1 106 1 057 981 803
South Carolina. . . . . . . . . . . . . . . 3 879 3 528 3 302 3 007 3 113 3 015 2 609 2 613 2 210 2 051South Dakota. . . . . . . . . . . . . . . . 1 056 1 007 1 097 864 859 787 710 657 600 518Tennessee . . . . . . . . . . . . . . . . . . 5 900 5 515 5 111 4 527 4 639 4 552 4 194 3 815 3 399 2 929Texas. . . . . . . . . . . . . . . . . . . . . . 18 370 15 834 14 644 13 937 14 483 13 638 12 461 11 011 8 838 7 129Utah. . . . . . . . . . . . . . . . . . . . . . . 1 994 1 728 1 602 1 508 1 502 1 459 1 329 1 244 1 018 939Vermont . . . . . . . . . . . . . . . . . . . . 883 804 704 665 643 601 566 553 527 407Virginia . . . . . . . . . . . . . . . . . . . . 4 749 4 427 4 335 3 992 3 923 3 827 3 539 3 304 3 293 2 519Washington . . . . . . . . . . . . . . . . . 5 720 5 424 5 386 4 998 4 696 4 721 4 265 3 782 3 320 2 759West Virginia . . . . . . . . . . . . . . . . 2 490 2 479 2 119 2 146 2 338 2 092 2 130 1 803 1 427 1 142Wisconsin . . . . . . . . . . . . . . . . . . 4 842 4 699 4 350 4 024 3 921 4 019 3 622 3 427 3 014 2 874Wyoming . . . . . . . . . . . . . . . . . . . 933 850 787 706 756 757 650 626 594 572
American Samoa . . . . . . . . . . . . . 131 91 83 37 62 77 82 122 62 86Fed. States of Micronesia . . . . . . 22 (NA) (NA) (NA) (NA) (NA) (NA) (NA) (NA) (NA)Guam. . . . . . . . . . . . . . . . . . . . . . 188 266 151 140 133 158 212 178 118 107Marshall Islands. . . . . . . . . . . . . . 14 (NA) (NA) (NA) (NA) (NA) (NA) (NA) (NA) (NA)Northern Marianas. . . . . . . . . . . . 54 39 28 31 55 43 46 61 58 57Palau . . . . . . . . . . . . . . . . . . . . . . 9 (NA) (NA) (NA) (NA) (NA) (NA) (NA) (NA) (NA)Puerto Rico . . . . . . . . . . . . . . . . . 5 284 3 897 3 662 3 501 3 454 3 286 3 133 3 216 2 905 3 641Virgin Islands. . . . . . . . . . . . . . . . 216 256 196 377 237 225 204 182 161 402
Undistributed . . . . . . . . . . . . . . . . 248 115 121 228 155 242 212 173 212 213
See footnotes at end of table.
28 Consolidated Federal Funds Report for Fiscal Year 1999
U.S. Census Bureau
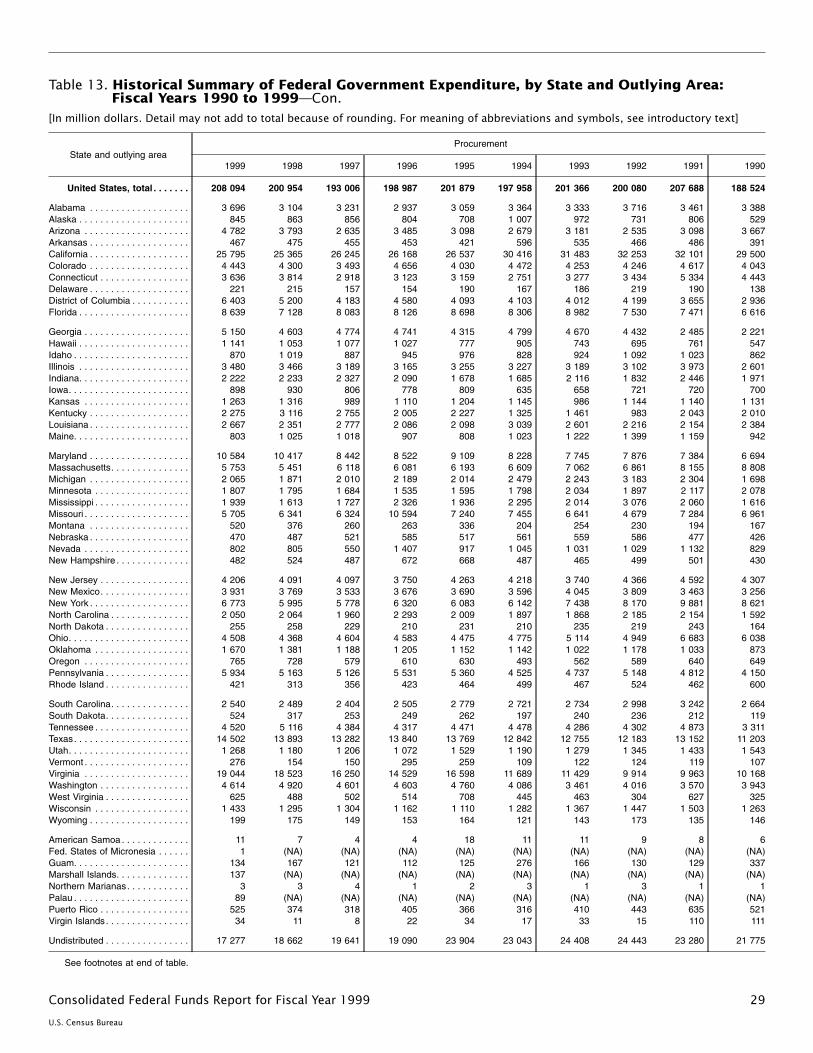
Table 13. Historical Summary of Federal Government Expenditure, by State and Outlying Area:Fiscal Years 1990 to 1999—Con.
[In million dollars. Detail may not add to total because of rounding. For meaning of abbreviations and symbols, see introductory text]
State and outlying areaProcurement
1999 1998 1997 1996 1995 1994 1993 1992 1991 1990
United States, total . . . . . . . 208 094 200 954 193 006 198 987 201 879 197 958 201 366 200 080 207 688 188 524
Alabama . . . . . . . . . . . . . . . . . . . 3 696 3 104 3 231 2 937 3 059 3 364 3 333 3 716 3 461 3 388Alaska . . . . . . . . . . . . . . . . . . . . . 845 863 856 804 708 1 007 972 731 806 529Arizona . . . . . . . . . . . . . . . . . . . . 4 782 3 793 2 635 3 485 3 098 2 679 3 181 2 535 3 098 3 667Arkansas . . . . . . . . . . . . . . . . . . . 467 475 455 453 421 596 535 466 486 391California . . . . . . . . . . . . . . . . . . . 25 795 25 365 26 245 26 168 26 537 30 416 31 483 32 253 32 101 29 500Colorado . . . . . . . . . . . . . . . . . . . 4 443 4 300 3 493 4 656 4 030 4 472 4 253 4 246 4 617 4 043Connecticut . . . . . . . . . . . . . . . . . 3 636 3 814 2 918 3 123 3 159 2 751 3 277 3 434 5 334 4 443Delaware . . . . . . . . . . . . . . . . . . . 221 215 157 154 190 167 186 219 190 138District of Columbia . . . . . . . . . . . 6 403 5 200 4 183 4 580 4 093 4 103 4 012 4 199 3 655 2 936Florida . . . . . . . . . . . . . . . . . . . . . 8 639 7 128 8 083 8 126 8 698 8 306 8 982 7 530 7 471 6 616
Georgia . . . . . . . . . . . . . . . . . . . . 5 150 4 603 4 774 4 741 4 315 4 799 4 670 4 432 2 485 2 221Hawaii . . . . . . . . . . . . . . . . . . . . . 1 141 1 053 1 077 1 027 777 905 743 695 761 547Idaho . . . . . . . . . . . . . . . . . . . . . . 870 1 019 887 945 976 828 924 1 092 1 023 862Illinois . . . . . . . . . . . . . . . . . . . . . 3 480 3 466 3 189 3 165 3 255 3 227 3 189 3 102 3 973 2 601Indiana. . . . . . . . . . . . . . . . . . . . . 2 222 2 233 2 327 2 090 1 678 1 685 2 116 1 832 2 446 1 971Iowa. . . . . . . . . . . . . . . . . . . . . . . 898 930 806 778 809 635 658 721 720 700Kansas . . . . . . . . . . . . . . . . . . . . 1 263 1 316 989 1 110 1 204 1 145 986 1 144 1 140 1 131Kentucky . . . . . . . . . . . . . . . . . . . 2 275 3 116 2 755 2 005 2 227 1 325 1 461 983 2 043 2 010Louisiana . . . . . . . . . . . . . . . . . . . 2 667 2 351 2 777 2 086 2 098 3 039 2 601 2 216 2 154 2 384Maine. . . . . . . . . . . . . . . . . . . . . . 803 1 025 1 018 907 808 1 023 1 222 1 399 1 159 942
Maryland . . . . . . . . . . . . . . . . . . . 10 584 10 417 8 442 8 522 9 109 8 228 7 745 7 876 7 384 6 694Massachusetts. . . . . . . . . . . . . . . 5 753 5 451 6 118 6 081 6 193 6 609 7 062 6 861 8 155 8 808Michigan . . . . . . . . . . . . . . . . . . . 2 065 1 871 2 010 2 189 2 014 2 479 2 243 3 183 2 304 1 698Minnesota . . . . . . . . . . . . . . . . . . 1 807 1 795 1 684 1 535 1 595 1 798 2 034 1 897 2 117 2 078Mississippi . . . . . . . . . . . . . . . . . . 1 939 1 613 1 727 2 326 1 936 2 295 2 014 3 076 2 060 1 616Missouri . . . . . . . . . . . . . . . . . . . . 5 705 6 341 6 324 10 594 7 240 7 455 6 641 4 679 7 284 6 961Montana . . . . . . . . . . . . . . . . . . . 520 376 260 263 336 204 254 230 194 167Nebraska . . . . . . . . . . . . . . . . . . . 470 487 521 585 517 561 559 586 477 426Nevada . . . . . . . . . . . . . . . . . . . . 802 805 550 1 407 917 1 045 1 031 1 029 1 132 829New Hampshire . . . . . . . . . . . . . . 482 524 487 672 668 487 465 499 501 430
New Jersey . . . . . . . . . . . . . . . . . 4 206 4 091 4 097 3 750 4 263 4 218 3 740 4 366 4 592 4 307New Mexico. . . . . . . . . . . . . . . . . 3 931 3 769 3 533 3 676 3 690 3 596 4 045 3 809 3 463 3 256New York . . . . . . . . . . . . . . . . . . . 6 773 5 995 5 778 6 320 6 083 6 142 7 438 8 170 9 881 8 621North Carolina . . . . . . . . . . . . . . . 2 050 2 064 1 960 2 293 2 009 1 897 1 868 2 185 2 154 1 592North Dakota . . . . . . . . . . . . . . . . 255 258 229 210 231 210 235 219 243 164Ohio. . . . . . . . . . . . . . . . . . . . . . . 4 508 4 368 4 604 4 583 4 475 4 775 5 114 4 949 6 683 6 038Oklahoma . . . . . . . . . . . . . . . . . . 1 670 1 381 1 188 1 205 1 152 1 142 1 022 1 178 1 033 873Oregon . . . . . . . . . . . . . . . . . . . . 765 728 579 610 630 493 562 589 640 649Pennsylvania . . . . . . . . . . . . . . . . 5 934 5 163 5 126 5 531 5 360 4 525 4 737 5 148 4 812 4 150Rhode Island . . . . . . . . . . . . . . . . 421 313 356 423 464 499 467 524 462 600
South Carolina. . . . . . . . . . . . . . . 2 540 2 489 2 404 2 505 2 779 2 721 2 734 2 998 3 242 2 664South Dakota. . . . . . . . . . . . . . . . 524 317 253 249 262 197 240 236 212 119Tennessee . . . . . . . . . . . . . . . . . . 4 520 5 116 4 384 4 317 4 471 4 478 4 286 4 302 4 873 3 311Texas. . . . . . . . . . . . . . . . . . . . . . 14 502 13 893 13 282 13 840 13 769 12 842 12 755 12 183 13 152 11 203Utah. . . . . . . . . . . . . . . . . . . . . . . 1 268 1 180 1 206 1 072 1 529 1 190 1 279 1 345 1 433 1 543Vermont . . . . . . . . . . . . . . . . . . . . 276 154 150 295 259 109 122 124 119 107Virginia . . . . . . . . . . . . . . . . . . . . 19 044 18 523 16 250 14 529 16 598 11 689 11 429 9 914 9 963 10 168Washington . . . . . . . . . . . . . . . . . 4 614 4 920 4 601 4 603 4 760 4 086 3 461 4 016 3 570 3 943West Virginia . . . . . . . . . . . . . . . . 625 488 502 514 708 445 463 304 627 325Wisconsin . . . . . . . . . . . . . . . . . . 1 433 1 295 1 304 1 162 1 110 1 282 1 367 1 447 1 503 1 263Wyoming . . . . . . . . . . . . . . . . . . . 199 175 149 153 164 121 143 173 135 146
American Samoa . . . . . . . . . . . . . 11 7 4 4 18 11 11 9 8 6Fed. States of Micronesia . . . . . . 1 (NA) (NA) (NA) (NA) (NA) (NA) (NA) (NA) (NA)Guam. . . . . . . . . . . . . . . . . . . . . . 134 167 121 112 125 276 166 130 129 337Marshall Islands. . . . . . . . . . . . . . 137 (NA) (NA) (NA) (NA) (NA) (NA) (NA) (NA) (NA)Northern Marianas. . . . . . . . . . . . 3 3 4 1 2 3 1 3 1 1Palau . . . . . . . . . . . . . . . . . . . . . . 89 (NA) (NA) (NA) (NA) (NA) (NA) (NA) (NA) (NA)Puerto Rico . . . . . . . . . . . . . . . . . 525 374 318 405 366 316 410 443 635 521Virgin Islands. . . . . . . . . . . . . . . . 34 11 8 22 34 17 33 15 110 111
Undistributed . . . . . . . . . . . . . . . . 17 277 18 662 19 641 19 090 23 904 23 043 24 408 24 443 23 280 21 775
See footnotes at end of table.
29Consolidated Federal Funds Report for Fiscal Year 1999
U.S. Census Bureau
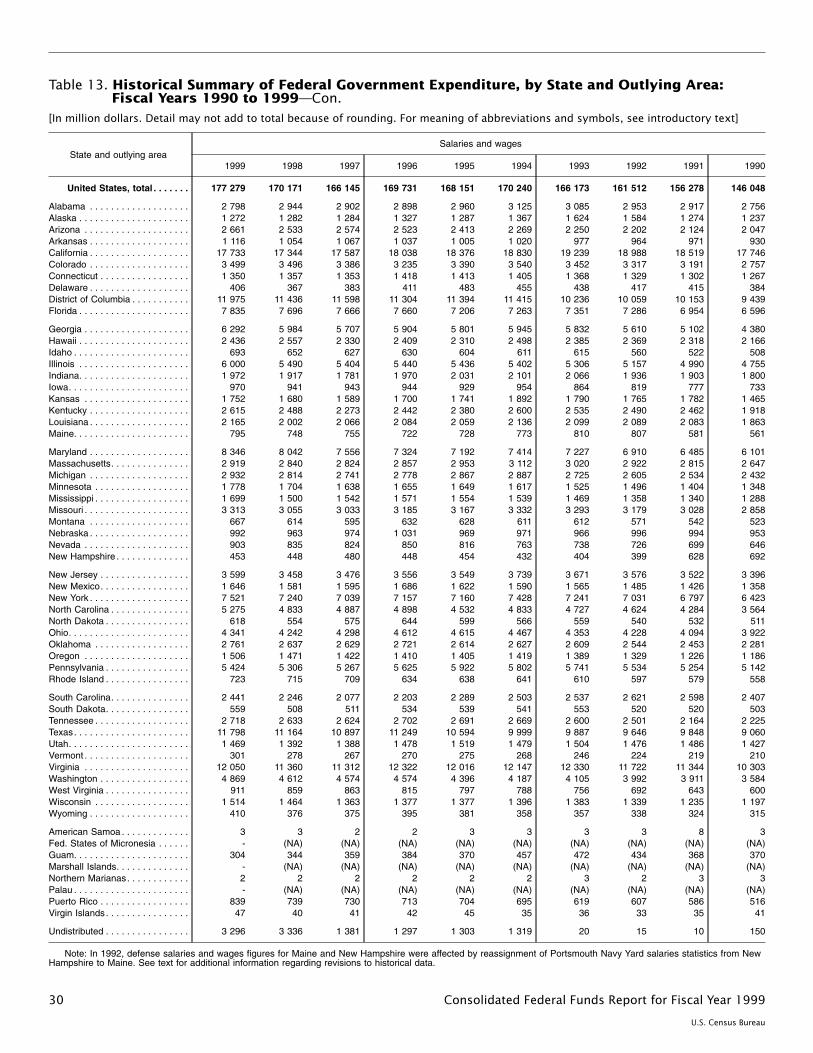
Table 13. Historical Summary of Federal Government Expenditure, by State and Outlying Area:Fiscal Years 1990 to 1999—Con.
[In million dollars. Detail may not add to total because of rounding. For meaning of abbreviations and symbols, see introductory text]
State and outlying areaSalaries and wages
1999 1998 1997 1996 1995 1994 1993 1992 1991 1990
United States, total . . . . . . . 177 279 170 171 166 145 169 731 168 151 170 240 166 173 161 512 156 278 146 048
Alabama . . . . . . . . . . . . . . . . . . . 2 798 2 944 2 902 2 898 2 960 3 125 3 085 2 953 2 917 2 756Alaska . . . . . . . . . . . . . . . . . . . . . 1 272 1 282 1 284 1 327 1 287 1 367 1 624 1 584 1 274 1 237Arizona . . . . . . . . . . . . . . . . . . . . 2 661 2 533 2 574 2 523 2 413 2 269 2 250 2 202 2 124 2 047Arkansas . . . . . . . . . . . . . . . . . . . 1 116 1 054 1 067 1 037 1 005 1 020 977 964 971 930California . . . . . . . . . . . . . . . . . . . 17 733 17 344 17 587 18 038 18 376 18 830 19 239 18 988 18 519 17 746Colorado . . . . . . . . . . . . . . . . . . . 3 499 3 496 3 386 3 235 3 390 3 540 3 452 3 317 3 191 2 757Connecticut . . . . . . . . . . . . . . . . . 1 350 1 357 1 353 1 418 1 413 1 405 1 368 1 329 1 302 1 267Delaware . . . . . . . . . . . . . . . . . . . 406 367 383 411 483 455 438 417 415 384District of Columbia . . . . . . . . . . . 11 975 11 436 11 598 11 304 11 394 11 415 10 236 10 059 10 153 9 439Florida . . . . . . . . . . . . . . . . . . . . . 7 835 7 696 7 666 7 660 7 206 7 263 7 351 7 286 6 954 6 596
Georgia . . . . . . . . . . . . . . . . . . . . 6 292 5 984 5 707 5 904 5 801 5 945 5 832 5 610 5 102 4 380Hawaii . . . . . . . . . . . . . . . . . . . . . 2 436 2 557 2 330 2 409 2 310 2 498 2 385 2 369 2 318 2 166Idaho . . . . . . . . . . . . . . . . . . . . . . 693 652 627 630 604 611 615 560 522 508Illinois . . . . . . . . . . . . . . . . . . . . . 6 000 5 490 5 404 5 440 5 436 5 402 5 306 5 157 4 990 4 755Indiana. . . . . . . . . . . . . . . . . . . . . 1 972 1 917 1 781 1 970 2 031 2 101 2 066 1 936 1 903 1 800Iowa. . . . . . . . . . . . . . . . . . . . . . . 970 941 943 944 929 954 864 819 777 733Kansas . . . . . . . . . . . . . . . . . . . . 1 752 1 680 1 589 1 700 1 741 1 892 1 790 1 765 1 782 1 465Kentucky . . . . . . . . . . . . . . . . . . . 2 615 2 488 2 273 2 442 2 380 2 600 2 535 2 490 2 462 1 918Louisiana . . . . . . . . . . . . . . . . . . . 2 165 2 002 2 066 2 084 2 059 2 136 2 099 2 089 2 083 1 863Maine. . . . . . . . . . . . . . . . . . . . . . 795 748 755 722 728 773 810 807 581 561
Maryland . . . . . . . . . . . . . . . . . . . 8 346 8 042 7 556 7 324 7 192 7 414 7 227 6 910 6 485 6 101Massachusetts. . . . . . . . . . . . . . . 2 919 2 840 2 824 2 857 2 953 3 112 3 020 2 922 2 815 2 647Michigan . . . . . . . . . . . . . . . . . . . 2 932 2 814 2 741 2 778 2 867 2 887 2 725 2 605 2 534 2 432Minnesota . . . . . . . . . . . . . . . . . . 1 778 1 704 1 638 1 655 1 649 1 617 1 525 1 496 1 404 1 348Mississippi . . . . . . . . . . . . . . . . . . 1 699 1 500 1 542 1 571 1 554 1 539 1 469 1 358 1 340 1 288Missouri . . . . . . . . . . . . . . . . . . . . 3 313 3 055 3 033 3 185 3 167 3 332 3 293 3 179 3 028 2 858Montana . . . . . . . . . . . . . . . . . . . 667 614 595 632 628 611 612 571 542 523Nebraska . . . . . . . . . . . . . . . . . . . 992 963 974 1 031 969 971 966 996 994 953Nevada . . . . . . . . . . . . . . . . . . . . 903 835 824 850 816 763 738 726 699 646New Hampshire . . . . . . . . . . . . . . 453 448 480 448 454 432 404 399 628 692
New Jersey . . . . . . . . . . . . . . . . . 3 599 3 458 3 476 3 556 3 549 3 739 3 671 3 576 3 522 3 396New Mexico. . . . . . . . . . . . . . . . . 1 646 1 581 1 595 1 686 1 622 1 590 1 565 1 485 1 426 1 358New York . . . . . . . . . . . . . . . . . . . 7 521 7 240 7 039 7 157 7 160 7 428 7 241 7 031 6 797 6 423North Carolina . . . . . . . . . . . . . . . 5 275 4 833 4 887 4 898 4 532 4 833 4 727 4 624 4 284 3 564North Dakota . . . . . . . . . . . . . . . . 618 554 575 644 599 566 559 540 532 511Ohio. . . . . . . . . . . . . . . . . . . . . . . 4 341 4 242 4 298 4 612 4 615 4 467 4 353 4 228 4 094 3 922Oklahoma . . . . . . . . . . . . . . . . . . 2 761 2 637 2 629 2 721 2 614 2 627 2 609 2 544 2 453 2 281Oregon . . . . . . . . . . . . . . . . . . . . 1 506 1 471 1 422 1 410 1 405 1 419 1 389 1 329 1 226 1 186Pennsylvania . . . . . . . . . . . . . . . . 5 424 5 306 5 267 5 625 5 922 5 802 5 741 5 534 5 254 5 142Rhode Island . . . . . . . . . . . . . . . . 723 715 709 634 638 641 610 597 579 558
South Carolina. . . . . . . . . . . . . . . 2 441 2 246 2 077 2 203 2 289 2 503 2 537 2 621 2 598 2 407South Dakota. . . . . . . . . . . . . . . . 559 508 511 534 539 541 553 520 520 503Tennessee . . . . . . . . . . . . . . . . . . 2 718 2 633 2 624 2 702 2 691 2 669 2 600 2 501 2 164 2 225Texas. . . . . . . . . . . . . . . . . . . . . . 11 798 11 164 10 897 11 249 10 594 9 999 9 887 9 646 9 848 9 060Utah. . . . . . . . . . . . . . . . . . . . . . . 1 469 1 392 1 388 1 478 1 519 1 479 1 504 1 476 1 486 1 427Vermont . . . . . . . . . . . . . . . . . . . . 301 278 267 270 275 268 246 224 219 210Virginia . . . . . . . . . . . . . . . . . . . . 12 050 11 360 11 312 12 322 12 016 12 147 12 330 11 722 11 344 10 303Washington . . . . . . . . . . . . . . . . . 4 869 4 612 4 574 4 574 4 396 4 187 4 105 3 992 3 911 3 584West Virginia . . . . . . . . . . . . . . . . 911 859 863 815 797 788 756 692 643 600Wisconsin . . . . . . . . . . . . . . . . . . 1 514 1 464 1 363 1 377 1 377 1 396 1 383 1 339 1 235 1 197Wyoming . . . . . . . . . . . . . . . . . . . 410 376 375 395 381 358 357 338 324 315
American Samoa . . . . . . . . . . . . . 3 3 2 2 3 3 3 3 8 3Fed. States of Micronesia . . . . . . - (NA) (NA) (NA) (NA) (NA) (NA) (NA) (NA) (NA)Guam. . . . . . . . . . . . . . . . . . . . . . 304 344 359 384 370 457 472 434 368 370Marshall Islands. . . . . . . . . . . . . . - (NA) (NA) (NA) (NA) (NA) (NA) (NA) (NA) (NA)Northern Marianas. . . . . . . . . . . . 2 2 2 2 2 2 3 2 3 3Palau . . . . . . . . . . . . . . . . . . . . . . - (NA) (NA) (NA) (NA) (NA) (NA) (NA) (NA) (NA)Puerto Rico . . . . . . . . . . . . . . . . . 839 739 730 713 704 695 619 607 586 516Virgin Islands. . . . . . . . . . . . . . . . 47 40 41 42 45 35 36 33 35 41
Undistributed . . . . . . . . . . . . . . . . 3 296 3 336 1 381 1 297 1 303 1 319 20 15 10 150
Note: In 1992, defense salaries and wages figures for Maine and New Hampshire were affected by reassignment of Portsmouth Navy Yard salaries statistics from NewHampshire to Maine. See text for additional information regarding revisions to historical data.
30 Consolidated Federal Funds Report for Fiscal Year 1999
U.S. Census Bureau
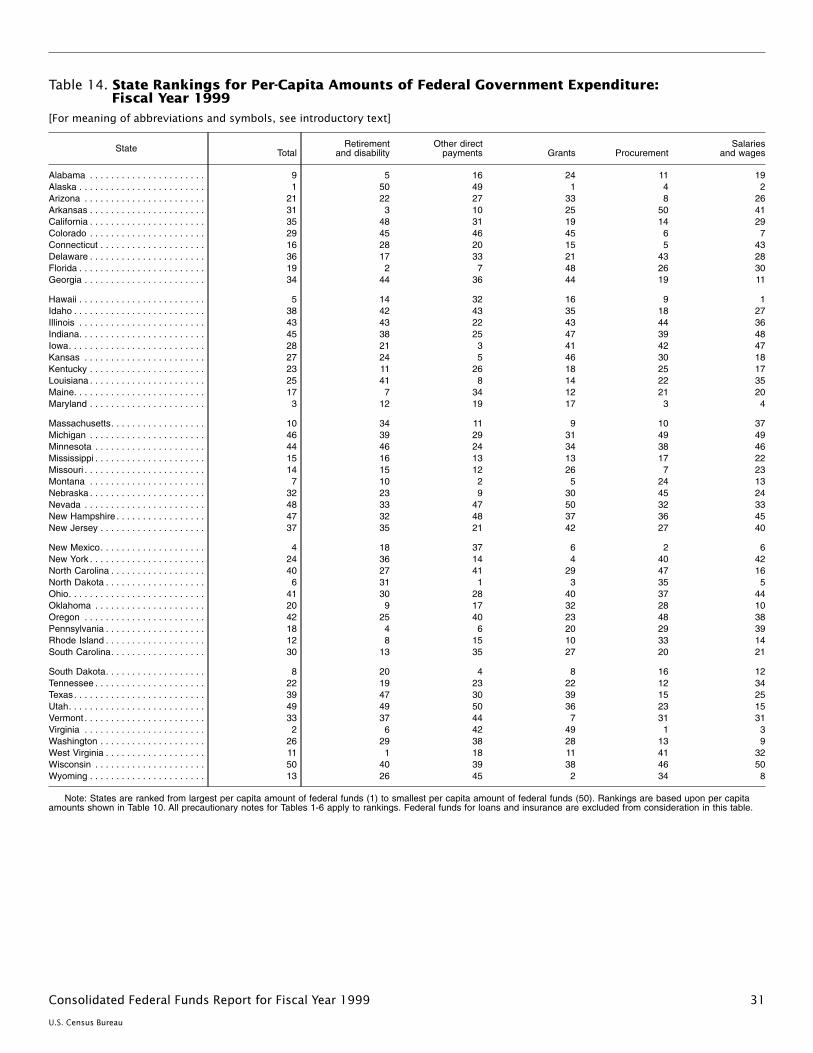
Table 14. State Rankings for Per-Capita Amounts of Federal Government Expenditure:Fiscal Year 1999
[For meaning of abbreviations and symbols, see introductory text]
State TotalRetirement
and disabilityOther direct
payments Grants ProcurementSalaries
and wages
Alabama . . . . . . . . . . . . . . . . . . . . . . 9 5 16 24 11 19Alaska . . . . . . . . . . . . . . . . . . . . . . . . 1 50 49 1 4 2Arizona . . . . . . . . . . . . . . . . . . . . . . . 21 22 27 33 8 26Arkansas . . . . . . . . . . . . . . . . . . . . . . 31 3 10 25 50 41California . . . . . . . . . . . . . . . . . . . . . . 35 48 31 19 14 29Colorado . . . . . . . . . . . . . . . . . . . . . . 29 45 46 45 6 7Connecticut . . . . . . . . . . . . . . . . . . . . 16 28 20 15 5 43Delaware . . . . . . . . . . . . . . . . . . . . . . 36 17 33 21 43 28Florida . . . . . . . . . . . . . . . . . . . . . . . . 19 2 7 48 26 30Georgia . . . . . . . . . . . . . . . . . . . . . . . 34 44 36 44 19 11
Hawaii . . . . . . . . . . . . . . . . . . . . . . . . 5 14 32 16 9 1Idaho . . . . . . . . . . . . . . . . . . . . . . . . . 38 42 43 35 18 27Illinois . . . . . . . . . . . . . . . . . . . . . . . . 43 43 22 43 44 36Indiana. . . . . . . . . . . . . . . . . . . . . . . . 45 38 25 47 39 48Iowa. . . . . . . . . . . . . . . . . . . . . . . . . . 28 21 3 41 42 47Kansas . . . . . . . . . . . . . . . . . . . . . . . 27 24 5 46 30 18Kentucky . . . . . . . . . . . . . . . . . . . . . . 23 11 26 18 25 17Louisiana . . . . . . . . . . . . . . . . . . . . . . 25 41 8 14 22 35Maine. . . . . . . . . . . . . . . . . . . . . . . . . 17 7 34 12 21 20Maryland . . . . . . . . . . . . . . . . . . . . . . 3 12 19 17 3 4
Massachusetts. . . . . . . . . . . . . . . . . . 10 34 11 9 10 37Michigan . . . . . . . . . . . . . . . . . . . . . . 46 39 29 31 49 49Minnesota . . . . . . . . . . . . . . . . . . . . . 44 46 24 34 38 46Mississippi . . . . . . . . . . . . . . . . . . . . . 15 16 13 13 17 22Missouri . . . . . . . . . . . . . . . . . . . . . . . 14 15 12 26 7 23Montana . . . . . . . . . . . . . . . . . . . . . . 7 10 2 5 24 13Nebraska . . . . . . . . . . . . . . . . . . . . . . 32 23 9 30 45 24Nevada . . . . . . . . . . . . . . . . . . . . . . . 48 33 47 50 32 33New Hampshire . . . . . . . . . . . . . . . . . 47 32 48 37 36 45New Jersey . . . . . . . . . . . . . . . . . . . . 37 35 21 42 27 40
New Mexico. . . . . . . . . . . . . . . . . . . . 4 18 37 6 2 6New York . . . . . . . . . . . . . . . . . . . . . . 24 36 14 4 40 42North Carolina . . . . . . . . . . . . . . . . . . 40 27 41 29 47 16North Dakota . . . . . . . . . . . . . . . . . . . 6 31 1 3 35 5Ohio. . . . . . . . . . . . . . . . . . . . . . . . . . 41 30 28 40 37 44Oklahoma . . . . . . . . . . . . . . . . . . . . . 20 9 17 32 28 10Oregon . . . . . . . . . . . . . . . . . . . . . . . 42 25 40 23 48 38Pennsylvania . . . . . . . . . . . . . . . . . . . 18 4 6 20 29 39Rhode Island . . . . . . . . . . . . . . . . . . . 12 8 15 10 33 14South Carolina. . . . . . . . . . . . . . . . . . 30 13 35 27 20 21
South Dakota. . . . . . . . . . . . . . . . . . . 8 20 4 8 16 12Tennessee . . . . . . . . . . . . . . . . . . . . . 22 19 23 22 12 34Texas. . . . . . . . . . . . . . . . . . . . . . . . . 39 47 30 39 15 25Utah. . . . . . . . . . . . . . . . . . . . . . . . . . 49 49 50 36 23 15Vermont . . . . . . . . . . . . . . . . . . . . . . . 33 37 44 7 31 31Virginia . . . . . . . . . . . . . . . . . . . . . . . 2 6 42 49 1 3Washington . . . . . . . . . . . . . . . . . . . . 26 29 38 28 13 9West Virginia . . . . . . . . . . . . . . . . . . . 11 1 18 11 41 32Wisconsin . . . . . . . . . . . . . . . . . . . . . 50 40 39 38 46 50Wyoming . . . . . . . . . . . . . . . . . . . . . . 13 26 45 2 34 8
Note: States are ranked from largest per capita amount of federal funds (1) to smallest per capita amount of federal funds (50). Rankings are based upon per capitaamounts shown in Table 10. All precautionary notes for Tables 1-6 apply to rankings. Federal funds for loans and insurance are excluded from consideration in this table.
31Consolidated Federal Funds Report for Fiscal Year 1999
U.S. Census Bureau
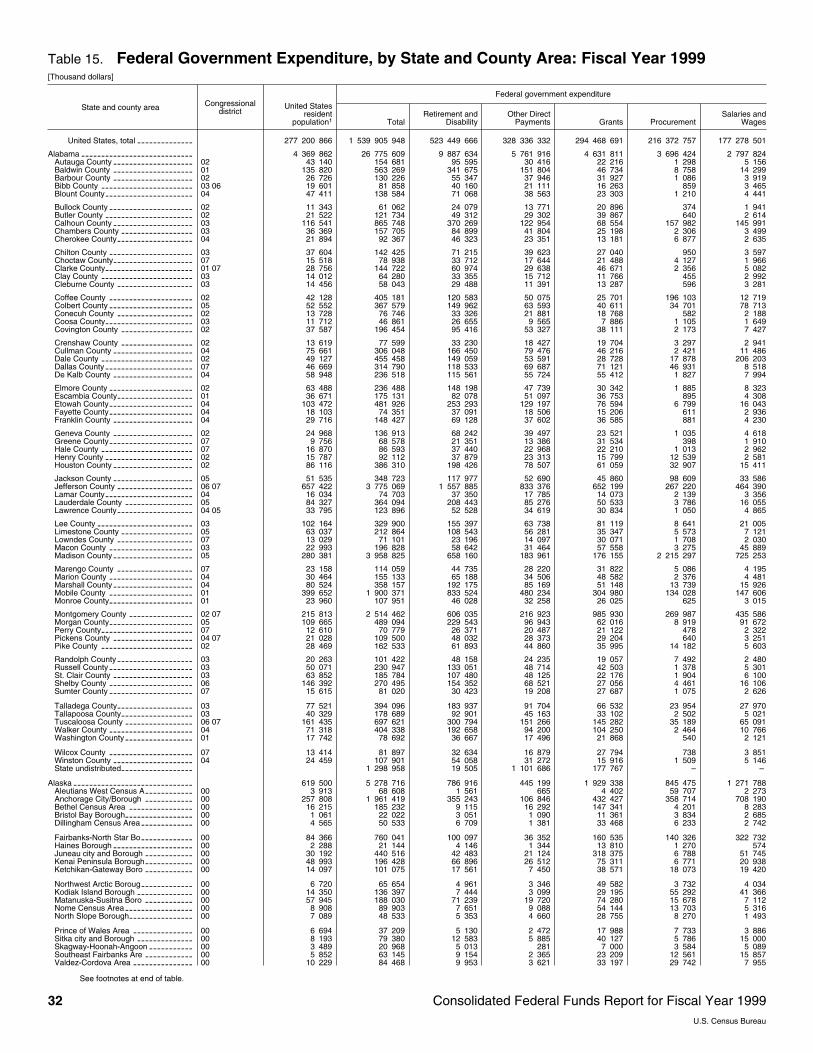
Table 15. Federal Government Expenditure, by State and County Area: Fiscal Year 1999[Thousand dollars]
State and county area Congressionaldistrict
Federal government expenditure
United Statesresident
population1 TotalRetirement and
DisabilityOther Direct
Payments Grants ProcurementSalaries and
Wages
United States, total -------------- 277 200 866 1 539 905 948 523 449 666 328 336 332 294 468 691 216 372 757 177 278 501
Alabama ---------------------------- 4 369 862 26 775 609 9 887 634 5 761 916 4 631 811 3 696 424 2 797 824Autauga County 02-------------------- 43 140 154 681 95 595 30 416 22 216 1 298 5 156Baldwin County 01-------------------- 135 820 563 269 341 675 151 804 46 734 8 758 14 299Barbour County 02-------------------- 26 726 130 226 55 347 37 946 31 927 1 086 3 919Bibb County 03 06----------------------- 19 601 81 858 40 160 21 111 16 263 859 3 465Blount County 04---------------------- 47 411 138 584 71 068 38 563 23 303 1 210 4 441
Bullock County 02--------------------- 11 343 61 062 24 079 13 771 20 896 374 1 941Butler County 02---------------------- 21 522 121 734 49 312 29 302 39 867 640 2 614Calhoun County 03-------------------- 116 541 865 748 370 269 122 954 68 554 157 982 145 991Chambers County 03------------------ 36 369 157 705 84 899 41 804 25 198 2 306 3 499Cherokee County 04------------------- 21 894 92 367 46 323 23 351 13 181 6 877 2 635
Chilton County 03--------------------- 37 604 142 425 71 215 39 623 27 040 950 3 597Choctaw County 07-------------------- 15 518 78 938 33 712 17 644 21 488 4 127 1 966Clarke County 01 07---------------------- 28 756 144 722 60 974 29 638 46 671 2 356 5 082Clay County 03----------------------- 14 012 64 280 33 355 15 712 11 766 455 2 992Cleburne County 03------------------- 14 456 58 043 29 488 11 391 13 287 596 3 281
Coffee County 02--------------------- 42 128 405 181 120 583 50 075 25 701 196 103 12 719Colbert County 05--------------------- 52 552 367 579 149 962 63 593 40 611 34 701 78 713Conecuh County 02------------------- 13 728 76 746 33 326 21 881 18 768 582 2 188Coosa County 03---------------------- 11 712 46 861 26 655 9 565 7 886 1 105 1 649Covington County 02------------------ 37 587 196 454 95 416 53 327 38 111 2 173 7 427
Crenshaw County 02------------------ 13 619 77 599 33 230 18 427 19 704 3 297 2 941Cullman County 04-------------------- 75 661 306 048 166 450 79 476 46 216 2 421 11 486Dale County 02----------------------- 49 127 455 458 149 059 53 591 28 728 17 878 206 203Dallas County 07---------------------- 46 669 314 790 118 533 69 687 71 121 46 931 8 518De Kalb County 04-------------------- 58 948 236 518 115 561 55 724 55 412 1 827 7 994
Elmore County 02--------------------- 63 488 236 488 148 198 47 739 30 342 1 885 8 323Escambia County 01------------------- 36 671 175 131 82 078 51 097 36 753 895 4 308Etowah County 04--------------------- 103 472 481 926 253 293 129 197 76 594 6 799 16 043Fayette County 04--------------------- 18 103 74 351 37 091 18 506 15 206 611 2 936Franklin County 04-------------------- 29 716 148 427 69 128 37 602 36 585 881 4 230
Geneva County 02-------------------- 24 968 136 913 68 242 39 497 23 521 1 035 4 618Greene County 07--------------------- 9 756 68 578 21 351 13 386 31 534 398 1 910Hale County 07----------------------- 16 870 86 593 37 440 22 968 22 210 1 013 2 962Henry County 02---------------------- 15 787 92 112 37 879 23 313 15 799 12 539 2 581Houston County 02-------------------- 86 116 386 310 198 426 78 507 61 059 32 907 15 411
Jackson County 05-------------------- 51 535 348 723 117 977 52 690 45 860 98 609 33 586Jefferson County 06 07------------------- 657 422 3 775 069 1 557 885 833 376 652 199 267 220 464 390Lamar County 04---------------------- 16 034 74 703 37 350 17 785 14 073 2 139 3 356Lauderdale County 05----------------- 84 327 364 094 208 443 85 276 50 533 3 786 16 055Lawrence County 04 05------------------- 33 795 123 896 52 528 34 619 30 834 1 050 4 865
Lee County 03------------------------ 102 164 329 900 155 397 63 738 81 119 8 641 21 005Limestone County 05------------------ 63 037 212 864 108 543 56 281 35 347 5 573 7 121Lowndes County 07------------------- 13 029 71 101 23 196 14 097 30 071 1 708 2 030Macon County 03--------------------- 22 993 196 828 58 642 31 464 57 558 3 275 45 889Madison County 05-------------------- 280 381 3 958 825 658 160 183 961 176 155 2 215 297 725 253
Marengo County 07------------------- 23 158 114 059 44 735 28 220 31 822 5 086 4 195Marion County 04--------------------- 30 464 155 133 65 188 34 506 48 582 2 376 4 481Marshall County 04-------------------- 80 524 358 157 192 175 85 169 51 148 13 739 15 926Mobile County 01--------------------- 399 652 1 900 371 833 524 480 234 304 980 134 028 147 606Monroe County 01--------------------- 23 960 107 951 46 028 32 258 26 025 625 3 015
Montgomery County 02 07---------------- 215 813 2 514 462 606 035 216 923 985 930 269 987 435 586Morgan County 05--------------------- 109 665 489 094 229 543 96 943 62 016 8 919 91 672Perry County 07----------------------- 12 610 70 779 26 371 20 487 21 122 478 2 322Pickens County 04 07-------------------- 21 028 109 500 48 032 28 373 29 204 640 3 251Pike County 02----------------------- 28 469 162 533 61 893 44 860 35 995 14 182 5 603
Randolph County 03------------------- 20 263 101 422 48 158 24 235 19 057 7 492 2 480Russell County 03--------------------- 50 071 230 947 133 051 48 714 42 503 1 378 5 301St. Clair County 03-------------------- 63 852 185 784 107 480 48 125 22 176 1 904 6 100Shelby County 06--------------------- 146 392 270 495 154 352 68 521 27 056 4 461 16 106Sumter County 07--------------------- 15 615 81 020 30 423 19 208 27 687 1 075 2 626
Talladega County 03------------------- 77 521 394 096 183 937 91 704 66 532 23 954 27 970Tallapoosa County 03------------------ 40 329 178 689 92 901 45 163 33 102 2 502 5 021Tuscaloosa County 06 07----------------- 161 435 697 621 300 794 151 266 145 282 35 189 65 091Walker County 04--------------------- 71 318 404 338 192 658 94 200 104 250 2 464 10 766Washington County 01----------------- 17 742 78 692 36 667 17 496 21 868 540 2 121
Wilcox County 07--------------------- 13 414 81 897 32 634 16 879 27 794 738 3 851Winston County 04-------------------- 24 459 107 901 54 058 31 272 15 916 1 509 5 146State undistributed------------------ 1 298 958 19 505 1 101 686 177 767 – –
Alaska ------------------------------ 619 500 5 278 716 786 916 445 199 1 929 338 845 475 1 271 788Aleutians West Census A 00------------ 3 913 68 608 1 561 665 4 402 59 707 2 273Anchorage City/Borough 00------------ 257 808 1 961 419 355 243 106 846 432 427 358 714 708 190Bethel Census Area 00---------------- 16 215 185 232 9 115 16 292 147 341 4 201 8 283Bristol Bay Borough 00----------------- 1 061 22 022 3 051 1 090 11 361 3 834 2 685Dillingham Census Area 00------------- 4 565 50 533 6 709 1 381 33 468 6 233 2 742
Fairbanks~North Star Bo 00------------- 84 366 760 041 100 097 36 352 160 535 140 326 322 732Haines Borough 00-------------------- 2 288 21 144 4 146 1 344 13 810 1 270 574Juneau city and Borough 00------------ 30 192 440 516 42 483 21 124 318 375 6 788 51 745Kenai Peninsula Borough 00------------ 48 993 196 428 66 896 26 512 75 311 6 771 20 938Ketchikan~Gateway Boro 00------------ 14 097 101 075 17 561 7 450 38 571 18 073 19 420
Northwest Arctic Boroug 00------------- 6 720 65 654 4 961 3 346 49 582 3 732 4 034Kodiak Island Borough 00-------------- 14 350 136 397 7 444 3 099 29 195 55 292 41 366Matanuska~Susitna Boro 00------------ 57 945 188 030 71 239 19 720 74 280 15 678 7 112Nome Census Area 00----------------- 8 908 89 903 7 651 9 088 54 144 13 703 5 316North Slope Borough 00---------------- 7 089 48 533 5 353 4 660 28 755 8 270 1 493
Prince of Wales Area 00--------------- 6 694 37 209 5 130 2 472 17 988 7 733 3 886Sitka city and Borough 00-------------- 8 193 79 380 12 583 5 885 40 127 5 786 15 000Skagway~Hoonah~Angoon 00----------- 3 489 20 968 5 013 281 7 000 3 584 5 089Southeast Fairbanks Are 00------------ 5 852 63 145 9 154 2 365 23 209 12 561 15 857Valdez~Cordova Area 00--------------- 10 229 84 468 9 953 3 621 33 197 29 742 7 955
See footnotes at end of table.
32 Consolidated Federal Funds Report for Fiscal Year 1999U.S. Census Bureau
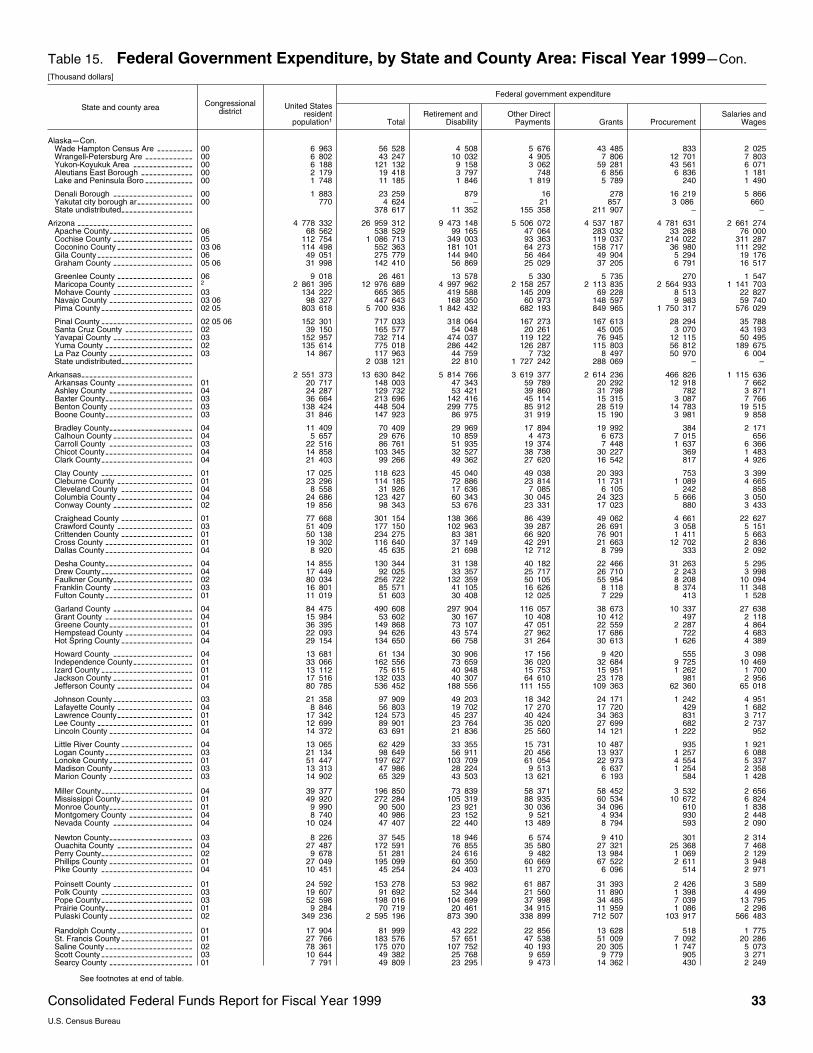
Table 15. Federal Government Expenditure, by State and County Area: Fiscal Year 1999mCon.[Thousand dollars]
State and county area Congressionaldistrict
Federal government expenditure
United Statesresident
population1 TotalRetirement and
DisabilityOther Direct
Payments Grants ProcurementSalaries and
Wages
AlaskamCon.Wade Hampton Census Are 00--------- 6 963 56 528 4 508 5 676 43 485 833 2 025Wrangell~Petersburg Are 00------------ 6 802 43 247 10 032 4 905 7 806 12 701 7 803Yukon~Koyukuk Area 00--------------- 6 188 121 132 9 158 3 062 59 281 43 561 6 071Aleutians East Borough 00------------- 2 179 19 418 3 797 748 6 856 6 836 1 181Lake and Peninsula Boro 00------------ 1 748 11 185 1 846 1 819 5 789 240 1 490
Denali Borough 00-------------------- 1 883 23 259 879 16 278 16 219 5 866Yakutat city borough ar 00-------------- 770 4 624 – 21 857 3 086 660State undistributed------------------ 378 617 11 352 155 358 211 907 – –
Arizona ----------------------------- 4 778 332 26 959 312 9 473 148 5 506 072 4 537 187 4 781 631 2 661 274Apache County 06--------------------- 68 562 538 529 99 165 47 064 283 032 33 268 76 000Cochise County 05-------------------- 112 754 1 086 713 349 003 93 363 119 037 214 022 311 287Coconino County 03 06------------------- 114 498 552 363 181 101 64 273 158 717 36 980 111 292Gila County 06------------------------ 49 051 275 779 144 940 56 464 49 904 5 294 19 176Graham County 05 06-------------------- 31 998 142 410 56 869 25 029 37 205 6 791 16 517
Greenlee County 06------------------- 9 018 26 461 13 578 5 330 5 735 270 1 547Maricopa County 2
------------------- 2 861 395 12 976 689 4 997 962 2 158 257 2 113 835 2 564 933 1 141 703Mohave County 03-------------------- 134 222 665 365 419 588 145 209 69 228 8 513 22 827Navajo County 03 06--------------------- 98 327 447 643 168 350 60 973 148 597 9 983 59 740Pima County 02 05----------------------- 803 618 5 700 936 1 842 432 682 193 849 965 1 750 317 576 029
Pinal County 02 05 06----------------------- 152 301 717 033 318 064 167 273 167 613 28 294 35 788Santa Cruz County 02----------------- 39 150 165 577 54 048 20 261 45 005 3 070 43 193Yavapai County 03-------------------- 152 957 732 714 474 037 119 122 76 945 12 115 50 495Yuma County 02---------------------- 135 614 775 018 286 442 126 287 115 803 56 812 189 675La Paz County 03--------------------- 14 867 117 963 44 759 7 732 8 497 50 970 6 004State undistributed------------------ 2 038 121 22 810 1 727 242 288 069 – –
Arkansas---------------------------- 2 551 373 13 630 842 5 814 766 3 619 377 2 614 236 466 826 1 115 636Arkansas County 01------------------- 20 717 148 003 47 343 59 789 20 292 12 918 7 662Ashley County 04--------------------- 24 287 129 732 53 421 39 860 31 798 782 3 871Baxter County 03---------------------- 36 664 213 696 142 416 45 114 15 315 3 087 7 766Benton County 03--------------------- 138 424 448 504 299 775 85 912 28 519 14 783 19 515Boone County 03---------------------- 31 846 147 923 86 975 31 919 15 190 3 981 9 858
Bradley County 04--------------------- 11 409 70 409 29 969 17 894 19 992 384 2 171Calhoun County 04-------------------- 5 657 29 676 10 859 4 473 6 673 7 015 656Carroll County 03--------------------- 22 516 86 761 51 935 19 374 7 448 1 637 6 366Chicot County 04---------------------- 14 858 103 345 32 527 38 738 30 227 369 1 483Clark County 04----------------------- 21 403 99 266 49 362 27 620 16 542 817 4 926
Clay County 01----------------------- 17 025 118 623 45 040 49 038 20 393 753 3 399Cleburne County 01------------------- 23 296 114 185 72 886 23 814 11 731 1 089 4 665Cleveland County 04------------------ 8 558 31 926 17 636 7 085 6 105 242 858Columbia County 04------------------- 24 686 123 427 60 343 30 045 24 323 5 666 3 050Conway County 02-------------------- 19 856 98 343 53 676 23 331 17 023 880 3 433
Craighead County 01------------------ 77 668 301 154 138 366 86 439 49 062 4 661 22 627Crawford County 03------------------- 51 409 177 150 102 963 39 287 26 691 3 058 5 151Crittenden County 01------------------ 50 138 234 275 83 381 66 920 76 901 1 411 5 663Cross County 01---------------------- 19 302 116 640 37 149 42 291 21 663 12 702 2 836Dallas County 04---------------------- 8 920 45 635 21 698 12 712 8 799 333 2 092
Desha County 04---------------------- 14 855 130 344 31 138 40 182 22 466 31 263 5 295Drew County 04----------------------- 17 449 92 025 33 357 25 717 26 710 2 243 3 998Faulkner County 02-------------------- 80 034 256 722 132 359 50 105 55 954 8 208 10 094Franklin County 03-------------------- 16 801 85 571 41 105 16 626 8 118 8 374 11 348Fulton County 01---------------------- 11 019 51 603 30 408 12 025 7 229 413 1 528
Garland County 04-------------------- 84 475 490 608 297 904 116 057 38 673 10 337 27 638Grant County 04---------------------- 15 984 53 602 30 167 10 408 10 412 497 2 118Greene County 01--------------------- 36 395 149 868 73 107 47 051 22 559 2 287 4 864Hempstead County 04----------------- 22 093 94 626 43 574 27 962 17 686 722 4 683Hot Spring County 04------------------ 29 154 134 650 66 758 31 264 30 613 1 626 4 389
Howard County 04-------------------- 13 681 61 134 30 906 17 156 9 420 555 3 098Independence County 01--------------- 33 066 162 556 73 659 36 020 32 684 9 725 10 469Izard County 01----------------------- 13 112 75 615 40 948 15 753 15 951 1 262 1 700Jackson County 01-------------------- 17 516 132 033 40 307 64 610 23 178 981 2 956Jefferson County 04------------------- 80 785 536 452 188 556 111 155 109 363 62 360 65 018
Johnson County 03-------------------- 21 358 97 909 49 203 18 342 24 171 1 242 4 951Lafayette County 04------------------- 8 846 56 803 19 702 17 270 17 720 429 1 682Lawrence County 01------------------- 17 342 124 573 45 237 40 424 34 363 831 3 717Lee County 01------------------------ 12 699 89 901 23 764 35 020 27 699 682 2 737Lincoln County 04--------------------- 14 372 63 691 21 836 25 560 14 121 1 222 952
Little River County 04------------------ 13 065 62 429 33 355 15 731 10 487 935 1 921Logan County 03---------------------- 21 134 98 649 56 911 20 456 13 937 1 257 6 088Lonoke County 01--------------------- 51 447 197 627 103 709 61 054 22 973 4 554 5 337Madison County 03-------------------- 13 313 47 986 28 224 9 513 6 637 1 254 2 358Marion County 03--------------------- 14 902 65 329 43 503 13 621 6 193 584 1 428
Miller County 04----------------------- 39 377 196 850 73 839 58 371 58 452 3 532 2 656Mississippi County 01------------------ 49 920 272 284 105 319 88 935 60 534 10 672 6 824Monroe County 01--------------------- 9 990 90 500 23 921 30 036 34 096 610 1 838Montgomery County 04---------------- 8 740 40 986 23 152 9 521 4 934 930 2 448Nevada County 04-------------------- 10 024 47 407 22 440 13 489 8 794 593 2 090
Newton County 03--------------------- 8 226 37 545 18 946 6 574 9 410 301 2 314Ouachita County 04------------------- 27 487 172 591 76 855 35 580 27 321 25 368 7 468Perry County 02----------------------- 9 678 51 281 24 616 9 482 13 984 1 069 2 129Phillips County 01--------------------- 27 049 195 099 60 350 60 669 67 522 2 611 3 948Pike County 04----------------------- 10 451 45 254 24 403 11 270 6 096 514 2 971
Poinsett County 01-------------------- 24 592 153 278 53 982 61 887 31 393 2 426 3 589Polk County 03----------------------- 19 607 91 692 52 344 21 560 11 890 1 398 4 499Pope County 03----------------------- 52 598 198 016 104 699 37 998 34 485 7 039 13 795Prairie County 01---------------------- 9 284 70 719 20 461 34 915 11 959 1 086 2 298Pulaski County 02--------------------- 349 236 2 595 196 873 390 338 899 712 507 103 917 566 483
Randolph County 01------------------- 17 904 81 999 43 222 22 856 13 628 518 1 775St. Francis County 01------------------ 27 766 183 576 57 651 47 538 51 009 7 092 20 286Saline County 02---------------------- 78 361 175 070 107 752 40 193 20 305 1 747 5 073Scott County 03----------------------- 10 644 49 382 25 768 9 659 9 779 905 3 271Searcy County 01--------------------- 7 791 49 809 23 295 9 473 14 362 430 2 249
See footnotes at end of table.
Consolidated Federal Funds Report for Fiscal Year 1999 33U.S. Census Bureau
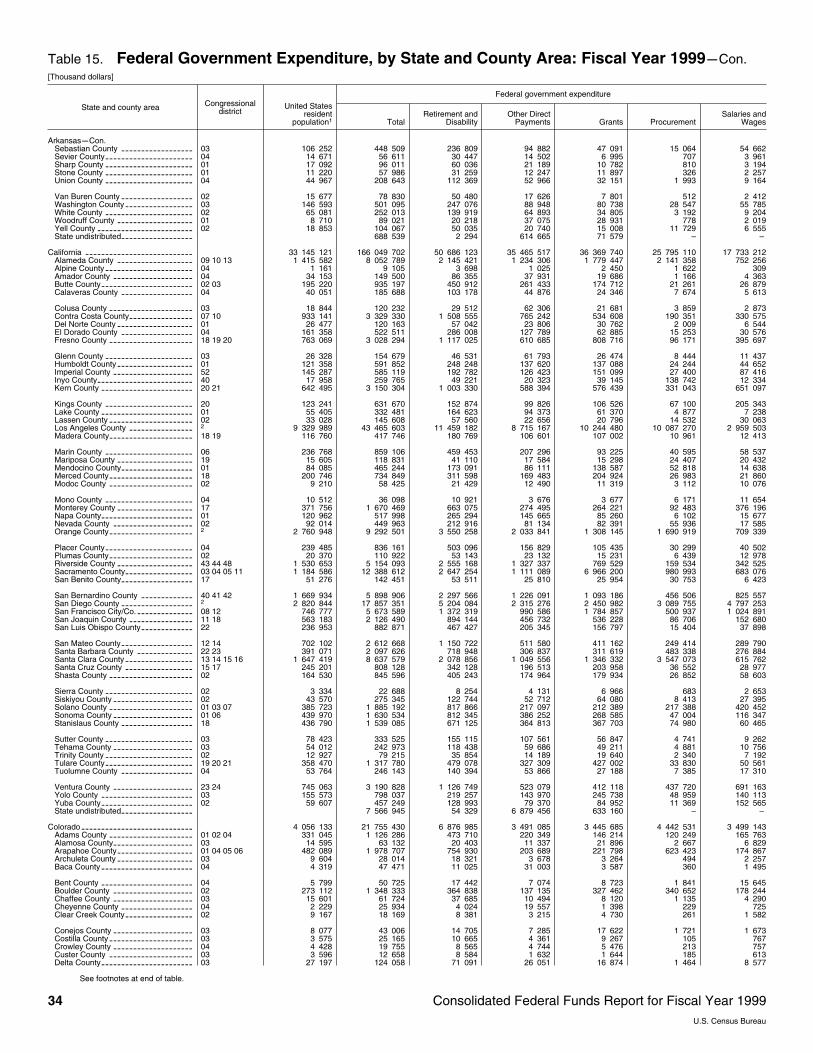
Table 15. Federal Government Expenditure, by State and County Area: Fiscal Year 1999mCon.[Thousand dollars]
State and county area Congressionaldistrict
Federal government expenditure
United Statesresident
population1 TotalRetirement and
DisabilityOther Direct
Payments Grants ProcurementSalaries and
Wages
ArkansasmCon.Sebastian County 03------------------ 106 252 448 509 236 809 94 882 47 091 15 064 54 662Sevier County 04---------------------- 14 671 56 611 30 447 14 502 6 995 707 3 961Sharp County 01---------------------- 17 092 96 011 60 036 21 189 10 782 810 3 194Stone County 01---------------------- 11 220 57 986 31 259 12 247 11 897 326 2 257Union County 04---------------------- 44 967 208 643 112 369 52 966 32 151 1 993 9 164
Van Buren County 02------------------ 15 677 78 830 50 480 17 626 7 801 512 2 412Washington County 03----------------- 146 593 501 095 247 076 88 948 80 738 28 547 55 785White County 02---------------------- 65 081 252 013 139 919 64 893 34 805 3 192 9 204Woodruff County 01------------------- 8 710 89 021 20 218 37 075 28 931 778 2 019Yell County 02------------------------ 18 853 104 067 50 035 20 740 15 008 11 729 6 555State undistributed------------------ 688 539 2 294 614 665 71 579 – –
California --------------------------- 33 145 121 166 049 702 50 686 123 35 465 517 36 369 740 25 795 110 17 733 212Alameda County 09 10 13------------------- 1 415 582 8 052 789 2 145 421 1 234 306 1 779 447 2 141 358 752 256Alpine County 04---------------------- 1 161 9 105 3 698 1 025 2 450 1 622 309Amador County 04-------------------- 34 153 149 500 86 355 37 931 19 686 1 166 4 363Butte County 02 03----------------------- 195 220 935 197 450 912 261 433 174 712 21 261 26 879Calaveras County 04------------------ 40 051 185 688 103 178 44 876 24 346 7 674 5 613
Colusa County 03--------------------- 18 844 120 232 29 512 62 306 21 681 3 859 2 873Contra Costa County 07 10---------------- 933 141 3 329 330 1 508 555 765 242 534 608 190 351 330 575Del Norte County 01------------------- 26 477 120 163 57 042 23 806 30 762 2 009 6 544El Dorado County 04------------------ 161 358 522 511 286 008 127 789 62 885 15 253 30 576Fresno County 18 19 20--------------------- 763 069 3 028 294 1 117 025 610 685 808 716 96 171 395 697
Glenn County 03---------------------- 26 328 154 679 46 531 61 793 26 474 8 444 11 437Humboldt County 01------------------- 121 358 591 852 248 248 137 620 137 088 24 244 44 652Imperial County 52-------------------- 145 287 585 119 192 782 126 423 151 099 27 400 87 416Inyo County 40------------------------ 17 958 259 765 49 221 20 323 39 145 138 742 12 334Kern County 20 21----------------------- 642 495 3 150 304 1 003 330 588 394 576 439 331 043 651 097
Kings County 20---------------------- 123 241 631 670 152 874 99 826 106 526 67 100 205 343Lake County 01----------------------- 55 405 332 481 164 623 94 373 61 370 4 877 7 238Lassen County 02--------------------- 33 028 145 608 57 560 22 656 20 796 14 532 30 063Los Angeles County 2
---------------- 9 329 989 43 465 603 11 459 182 8 715 167 10 244 480 10 087 270 2 959 503Madera County 18 19--------------------- 116 760 417 746 180 769 106 601 107 002 10 961 12 413
Marin County 06---------------------- 236 768 859 106 459 453 207 296 93 225 40 595 58 537Mariposa County 19------------------- 15 605 118 831 41 110 17 584 15 298 24 407 20 432Mendocino County 01------------------ 84 085 465 244 173 091 86 111 138 587 52 818 14 638Merced County 18--------------------- 200 746 734 849 311 598 169 483 204 924 26 983 21 860Modoc County 02--------------------- 9 210 58 425 21 429 12 490 11 319 3 112 10 076
Mono County 04---------------------- 10 512 36 098 10 921 3 676 3 677 6 171 11 654Monterey County 17------------------- 371 756 1 670 469 663 075 274 495 264 221 92 483 376 196Napa County 01----------------------- 120 962 517 998 265 294 145 665 85 260 6 102 15 677Nevada County 02-------------------- 92 014 449 963 212 916 81 134 82 391 55 936 17 585Orange County 2
--------------------- 2 760 948 9 292 501 3 550 258 2 033 841 1 308 145 1 690 919 709 339
Placer County 04---------------------- 239 485 836 161 503 096 156 829 105 435 30 299 40 502Plumas County 02--------------------- 20 370 110 922 53 143 23 132 15 231 6 439 12 978Riverside County 43 44 48------------------- 1 530 653 5 154 093 2 555 168 1 327 337 769 529 159 534 342 525Sacramento County 03 04 05 11----------------- 1 184 586 12 388 612 2 647 254 1 111 089 6 966 200 980 993 683 076San Benito County 17------------------ 51 276 142 451 53 511 25 810 25 954 30 753 6 423
San Bernardino County 40 41 42------------- 1 669 934 5 898 906 2 297 566 1 226 091 1 093 186 456 506 825 557San Diego County 2
------------------ 2 820 844 17 857 351 5 204 084 2 315 276 2 450 982 3 089 755 4 797 253San Francisco City/Co. 08 12-------------- 746 777 5 673 589 1 372 319 990 586 1 784 857 500 937 1 024 891San Joaquin County 11 18---------------- 563 183 2 126 490 894 144 456 732 536 228 86 706 152 680San Luis Obispo County 22------------- 236 953 882 871 467 427 205 345 156 797 15 404 37 898
San Mateo County 12 14------------------ 702 102 2 612 668 1 150 722 511 580 411 162 249 414 289 790Santa Barbara County 22 23-------------- 391 071 2 097 626 718 948 306 837 311 619 483 338 276 884Santa Clara County 13 14 15 16----------------- 1 647 419 8 637 579 2 078 856 1 049 556 1 346 332 3 547 073 615 762Santa Cruz County 15 17----------------- 245 201 808 128 342 128 196 513 203 958 36 552 28 977Shasta County 02--------------------- 164 530 845 596 405 243 174 964 179 934 26 852 58 603
Sierra County 02---------------------- 3 334 22 688 8 254 4 131 6 966 683 2 653Siskiyou County 02-------------------- 43 570 275 345 122 744 52 712 64 080 8 413 27 395Solano County 01 03 07--------------------- 385 723 1 885 192 817 866 217 097 212 389 217 388 420 452Sonoma County 01 06-------------------- 439 970 1 630 534 812 345 386 252 268 585 47 004 116 347Stanislaus County 18------------------ 436 790 1 539 085 671 125 364 813 367 703 74 980 60 465
Sutter County 03---------------------- 78 423 333 525 155 115 107 561 56 847 4 741 9 262Tehama County 03-------------------- 54 012 242 973 118 438 59 686 49 211 4 881 10 756Trinity County 02---------------------- 12 927 79 215 35 854 14 189 19 640 2 340 7 192Tulare County 19 20 21---------------------- 358 470 1 317 780 479 078 327 309 427 002 33 830 50 561Tuolumne County 04------------------ 53 764 246 143 140 394 53 866 27 188 7 385 17 310
Ventura County 23 24-------------------- 745 063 3 190 828 1 126 749 523 079 412 118 437 720 691 163Yolo County 03----------------------- 155 573 798 037 219 257 143 970 245 738 48 959 140 113Yuba County 02----------------------- 59 607 457 249 128 993 79 370 84 952 11 369 152 565State undistributed------------------ 7 566 945 54 329 6 879 456 633 160 – –
Colorado---------------------------- 4 056 133 21 755 430 6 876 985 3 491 085 3 445 685 4 442 531 3 499 143Adams County 01 02 04--------------------- 331 045 1 126 286 473 710 220 349 146 214 120 249 165 763Alamosa County 03-------------------- 14 595 63 132 20 403 11 337 21 896 2 667 6 829Arapahoe County 01 04 05 06------------------- 482 089 1 978 707 754 930 203 689 221 798 623 423 174 867Archuleta County 03------------------- 9 604 28 014 18 321 3 678 3 264 494 2 257Baca County 04----------------------- 4 319 47 471 11 025 31 003 3 587 360 1 495
Bent County 04----------------------- 5 799 50 725 17 442 7 074 8 723 1 841 15 645Boulder County 02-------------------- 273 112 1 348 333 364 838 137 135 327 462 340 652 178 244Chaffee County 03-------------------- 15 601 61 724 37 685 10 494 8 120 1 135 4 290Cheyenne County 04------------------ 2 229 25 934 4 024 19 557 1 398 229 725Clear Creek County 02----------------- 9 167 18 169 8 381 3 215 4 730 261 1 582
Conejos County 03-------------------- 8 077 43 006 14 705 7 285 17 622 1 721 1 673Costilla County 03--------------------- 3 575 25 165 10 665 4 361 9 267 105 767Crowley County 04-------------------- 4 428 19 755 8 565 4 744 5 476 213 757Custer County 03--------------------- 3 596 12 658 8 584 1 632 1 644 185 613Delta County 03----------------------- 27 197 124 058 71 091 26 051 16 874 1 464 8 577
See footnotes at end of table.
34 Consolidated Federal Funds Report for Fiscal Year 1999U.S. Census Bureau
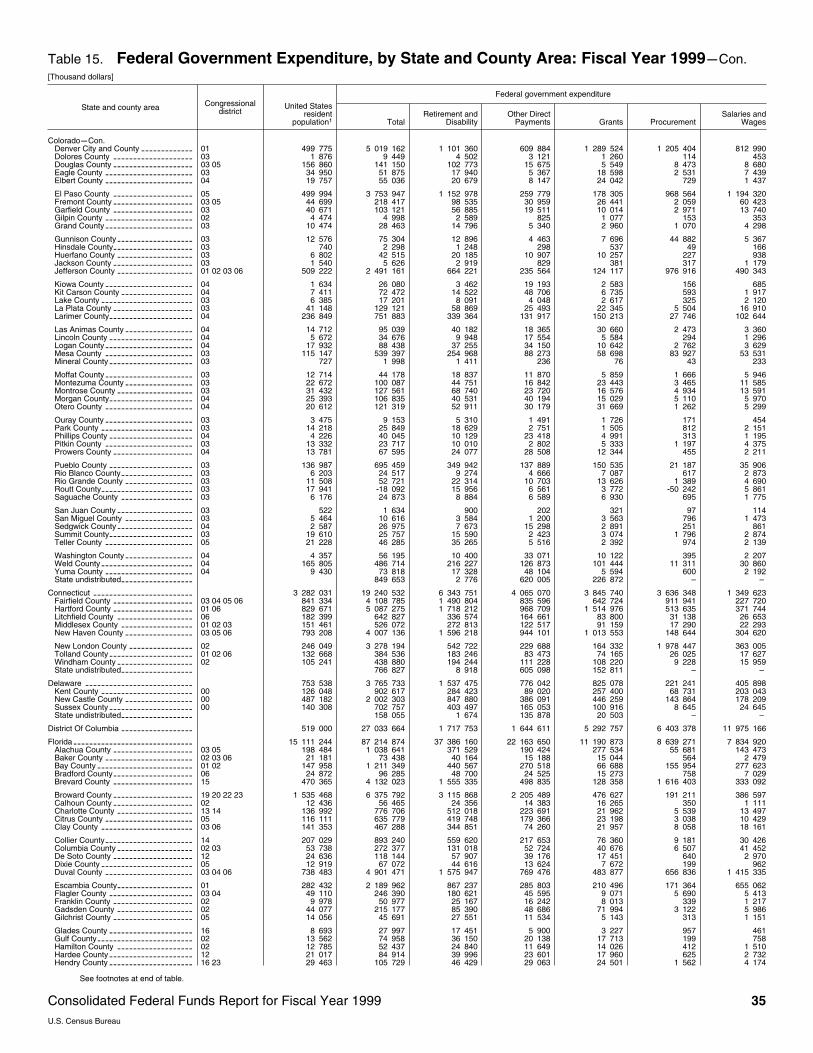
Table 15. Federal Government Expenditure, by State and County Area: Fiscal Year 1999mCon.[Thousand dollars]
State and county area Congressionaldistrict
Federal government expenditure
United Statesresident
population1 TotalRetirement and
DisabilityOther Direct
Payments Grants ProcurementSalaries and
Wages
ColoradomCon.Denver City and County 01------------- 499 775 5 019 162 1 101 360 609 884 1 289 524 1 205 404 812 990Dolores County 03-------------------- 1 876 9 449 4 502 3 121 1 260 114 453Douglas County 03 05-------------------- 156 860 141 150 102 773 15 675 5 549 8 473 8 680Eagle County 03---------------------- 34 950 51 875 17 940 5 367 18 598 2 531 7 439Elbert County 04---------------------- 19 757 55 036 20 679 8 147 24 042 729 1 437
El Paso County 05-------------------- 499 994 3 753 947 1 152 978 259 779 178 305 968 564 1 194 320Fremont County 03 05-------------------- 44 699 218 417 98 535 30 959 26 441 2 059 60 423Garfield County 03-------------------- 40 671 103 121 56 885 19 511 10 014 2 971 13 740Gilpin County 02---------------------- 4 474 4 998 2 589 825 1 077 153 353Grand County 03---------------------- 10 474 28 463 14 796 5 340 2 960 1 070 4 298
Gunnison County 03------------------- 12 576 75 304 12 896 4 463 7 696 44 882 5 367Hinsdale County 03-------------------- 740 2 298 1 248 298 537 49 166Huerfano County 03------------------- 6 802 42 515 20 185 10 907 10 257 227 938Jackson County 03-------------------- 1 540 5 626 2 919 829 381 317 1 179Jefferson County 01 02 03 06------------------- 509 222 2 491 161 664 221 235 564 124 117 976 916 490 343
Kiowa County 04---------------------- 1 634 26 080 3 462 19 193 2 583 156 685Kit Carson County 04------------------ 7 411 72 472 14 522 48 706 6 735 593 1 917Lake County 03----------------------- 6 385 17 201 8 091 4 048 2 617 325 2 120La Plata County 03-------------------- 41 148 129 121 58 869 25 493 22 345 5 504 16 910Larimer County 04--------------------- 236 849 751 883 339 364 131 917 150 213 27 746 102 644
Las Animas County 04----------------- 14 712 95 039 40 182 18 365 30 660 2 473 3 360Lincoln County 04--------------------- 5 672 34 676 9 948 17 554 5 584 294 1 296Logan County 04---------------------- 17 932 88 438 37 255 34 150 10 642 2 762 3 629Mesa County 03---------------------- 115 147 539 397 254 968 88 273 58 698 83 927 53 531Mineral County 03--------------------- 727 1 998 1 411 236 76 43 233
Moffat County 03---------------------- 12 714 44 178 18 837 11 870 5 859 1 666 5 946Montezuma County 03----------------- 22 672 100 087 44 751 16 842 23 443 3 465 11 585Montrose County 03------------------- 31 432 127 561 68 740 23 720 16 576 4 934 13 591Morgan County 04--------------------- 25 393 106 835 40 531 40 194 15 029 5 110 5 970Otero County 04---------------------- 20 612 121 319 52 911 30 179 31 669 1 262 5 299
Ouray County 03---------------------- 3 475 9 153 5 310 1 491 1 726 171 454Park County 03----------------------- 14 218 25 849 18 629 2 751 1 505 812 2 151Phillips County 04--------------------- 4 226 40 045 10 129 23 418 4 991 313 1 195Pitkin County 03---------------------- 13 332 23 717 10 010 2 802 5 333 1 197 4 375Prowers County 04-------------------- 13 781 67 595 24 077 28 508 12 344 455 2 211
Pueblo County 03--------------------- 136 987 695 459 349 942 137 889 150 535 21 187 35 906Rio Blanco County 03------------------ 6 203 24 517 9 274 4 666 7 087 617 2 873Rio Grande County 03----------------- 11 508 52 721 22 314 10 703 13 626 1 389 4 690Routt County 03----------------------- 17 941 ~18 092 15 956 6 561 3 772 ~50 242 5 861Saguache County 03------------------ 6 176 24 873 8 884 6 589 6 930 695 1 775
San Juan County 03------------------- 522 1 634 900 202 321 97 114San Miguel County 03----------------- 5 464 10 616 3 584 1 200 3 563 796 1 473Sedgwick County 04------------------- 2 587 26 975 7 673 15 298 2 891 251 861Summit County 03--------------------- 19 610 25 757 15 590 2 423 3 074 1 796 2 874Teller County 05---------------------- 21 228 46 285 35 265 5 516 2 392 974 2 139
Washington County 04----------------- 4 357 56 195 10 400 33 071 10 122 395 2 207Weld County 04----------------------- 165 805 486 714 216 227 126 873 101 444 11 311 30 860Yuma County 04---------------------- 9 430 73 818 17 328 48 104 5 594 600 2 192State undistributed------------------ 849 653 2 776 620 005 226 872 – –
Connecticut ------------------------- 3 282 031 19 240 532 6 343 751 4 065 070 3 845 740 3 636 348 1 349 623Fairfield County 03 04 05 06-------------------- 841 334 4 108 785 1 490 804 835 596 642 724 911 941 227 720Hartford County 01 06-------------------- 829 671 5 087 275 1 718 212 968 709 1 514 976 513 635 371 744Litchfield County 06------------------- 182 399 642 827 336 574 164 661 83 800 31 138 26 653Middlesex County 01 02 03------------------ 151 461 526 072 272 813 122 517 91 159 17 290 22 293New Haven County 03 05 06----------------- 793 208 4 007 136 1 596 218 944 101 1 013 553 148 644 304 620
New London County 02---------------- 246 049 3 278 194 542 722 229 688 164 332 1 978 447 363 005Tolland County 01 02 06--------------------- 132 668 384 536 183 246 83 473 74 165 26 025 17 627Windham County 02------------------- 105 241 438 880 194 244 111 228 108 220 9 228 15 959State undistributed------------------ 766 827 8 918 605 098 152 811 – –
Delaware --------------------------- 753 538 3 765 733 1 537 475 776 042 825 078 221 241 405 898Kent County 00----------------------- 126 048 902 617 284 423 89 020 257 400 68 731 203 043New Castle County 00----------------- 487 182 2 002 303 847 880 386 091 446 259 143 864 178 209Sussex County 00--------------------- 140 308 702 757 403 497 165 053 100 916 8 645 24 645State undistributed------------------ 158 055 1 674 135 878 20 503 – –
District Of Columbia ------------------ 519 000 27 033 664 1 717 753 1 644 611 5 292 757 6 403 378 11 975 166
Florida------------------------------ 15 111 244 87 214 874 37 386 160 22 163 650 11 190 873 8 639 271 7 834 920Alachua County 03 05-------------------- 198 484 1 038 641 371 529 190 424 277 534 55 681 143 473Baker County 02 03 06---------------------- 21 181 73 438 40 164 15 188 15 044 564 2 479Bay County 01 02------------------------ 147 958 1 211 349 440 567 270 518 66 688 155 954 277 623Bradford County 06-------------------- 24 872 96 285 48 700 24 525 15 273 758 7 029Brevard County 15-------------------- 470 365 4 132 023 1 555 335 498 835 128 358 1 616 403 333 092
Broward County 19 20 22 23-------------------- 1 535 468 6 375 792 3 115 868 2 205 489 476 627 191 211 386 597Calhoun County 02-------------------- 12 436 56 465 24 356 14 383 16 265 350 1 111Charlotte County 13 14------------------- 136 992 776 706 512 018 223 691 21 962 5 539 13 497Citrus County 05---------------------- 116 111 635 779 419 748 179 366 23 198 3 038 10 429Clay County 03 06----------------------- 141 353 467 288 344 851 74 260 21 957 8 058 18 161
Collier County 14---------------------- 207 029 893 240 559 620 217 653 76 360 9 181 30 426Columbia County 02 03------------------- 53 738 272 377 131 018 52 724 40 676 6 507 41 452De Soto County 12-------------------- 24 636 118 144 57 907 39 176 17 451 640 2 970Dixie County 05----------------------- 12 919 67 072 44 616 13 624 7 672 199 962Duval County 03 04 06---------------------- 738 483 4 901 471 1 575 947 769 476 483 877 656 836 1 415 335
Escambia County 01------------------- 282 432 2 189 962 867 237 285 803 210 496 171 364 655 062Flagler County 03 04--------------------- 49 110 246 390 180 621 45 595 9 071 5 690 5 413Franklin County 02-------------------- 9 978 50 977 25 167 16 242 8 013 339 1 217Gadsden County 02------------------- 44 077 215 177 85 390 48 686 71 994 3 122 5 986Gilchrist County 05-------------------- 14 056 45 691 27 551 11 534 5 143 313 1 151
Glades County 16--------------------- 8 693 27 997 17 451 5 900 3 227 957 461Gulf County 02------------------------ 13 562 74 958 36 150 20 138 17 713 199 758Hamilton County 02------------------- 12 785 52 437 24 840 11 649 14 026 412 1 510Hardee County 12--------------------- 21 017 84 914 39 996 23 601 17 960 625 2 732Hendry County 16 23--------------------- 29 463 105 729 46 429 29 063 24 501 1 562 4 174
See footnotes at end of table.
Consolidated Federal Funds Report for Fiscal Year 1999 35U.S. Census Bureau
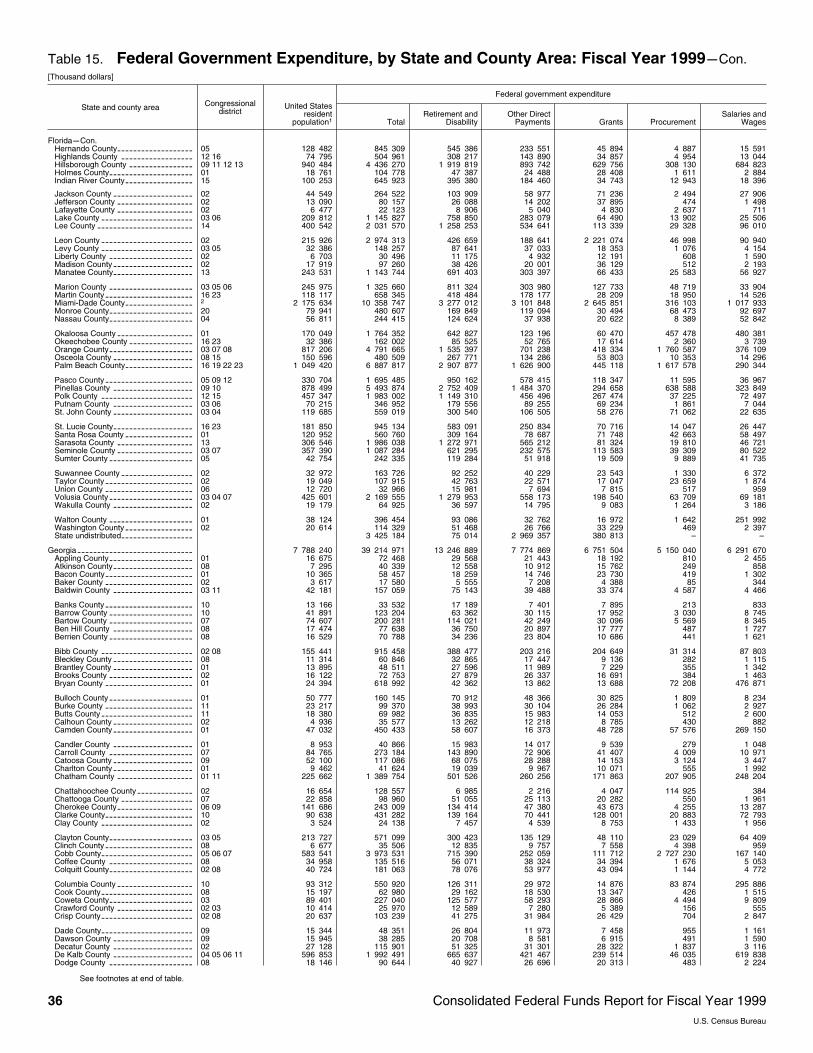
Table 15. Federal Government Expenditure, by State and County Area: Fiscal Year 1999mCon.[Thousand dollars]
State and county area Congressionaldistrict
Federal government expenditure
United Statesresident
population1 TotalRetirement and
DisabilityOther Direct
Payments Grants ProcurementSalaries and
Wages
FloridamCon.Hernando County 05------------------- 128 482 845 309 545 386 233 551 45 894 4 887 15 591Highlands County 12 16------------------ 74 795 504 961 308 217 143 890 34 857 4 954 13 044Hillsborough County 09 11 12 13---------------- 940 484 4 436 270 1 919 819 893 742 629 756 308 130 684 823Holmes County 01--------------------- 18 761 104 778 47 387 24 488 28 408 1 611 2 884Indian River County 15----------------- 100 253 645 923 395 380 184 460 34 743 12 943 18 396
Jackson County 02-------------------- 44 549 264 522 103 909 58 977 71 236 2 494 27 906Jefferson County 02------------------- 13 090 80 157 26 088 14 202 37 895 474 1 498Lafayette County 02------------------- 6 477 22 123 8 906 5 040 4 830 2 637 711Lake County 03 06----------------------- 209 812 1 145 827 758 850 283 079 64 490 13 902 25 506Lee County 14------------------------ 400 542 2 031 570 1 258 253 534 641 113 339 29 328 96 010
Leon County 02----------------------- 215 926 2 974 313 426 659 188 641 2 221 074 46 998 90 940Levy County 03 05----------------------- 32 386 148 257 87 641 37 033 18 353 1 076 4 154Liberty County 02--------------------- 6 703 30 496 11 175 4 932 12 191 608 1 590Madison County 02-------------------- 17 919 97 260 38 426 20 001 36 129 512 2 193Manatee County 13-------------------- 243 531 1 143 744 691 403 303 397 66 433 25 583 56 927
Marion County 03 05 06--------------------- 245 975 1 325 660 811 324 303 980 127 733 48 719 33 904Martin County 16 23---------------------- 118 117 658 345 418 484 178 177 28 209 18 950 14 526Miami~Dade County 2
----------------- 2 175 634 10 358 747 3 277 012 3 101 848 2 645 851 316 103 1 017 933Monroe County 20--------------------- 79 941 480 607 169 849 119 094 30 494 68 473 92 697Nassau County 04--------------------- 56 811 244 415 124 624 37 938 20 622 8 389 52 842
Okaloosa County 01------------------- 170 049 1 764 352 642 827 123 196 60 470 457 478 480 381Okeechobee County 16 23---------------- 32 386 162 002 85 525 52 765 17 614 2 360 3 739Orange County 03 07 08--------------------- 817 206 4 791 665 1 535 397 701 238 418 334 1 760 587 376 109Osceola County 08 15-------------------- 150 596 480 509 267 771 134 286 53 803 10 353 14 296Palm Beach County 16 19 22 23----------------- 1 049 420 6 887 817 2 907 877 1 626 900 445 118 1 617 578 290 344
Pasco County 05 09 12---------------------- 330 704 1 695 485 950 162 578 415 118 347 11 595 36 967Pinellas County 09 10-------------------- 878 499 5 493 874 2 752 409 1 484 370 294 658 638 588 323 849Polk County 12 15----------------------- 457 347 1 983 002 1 149 310 456 496 267 474 37 225 72 497Putnam County 03 06-------------------- 70 215 346 952 179 556 89 255 69 234 1 861 7 044St. John County 03 04-------------------- 119 685 559 019 300 540 106 505 58 276 71 062 22 635
St. Lucie County 16 23-------------------- 181 850 945 134 583 091 250 834 70 716 14 047 26 447Santa Rosa County 01----------------- 120 952 560 760 309 164 78 687 71 748 42 663 58 497Sarasota County 13------------------- 306 546 1 986 038 1 272 971 565 212 81 324 19 810 46 721Seminole County 03 07------------------- 357 390 1 087 284 621 295 232 575 113 583 39 309 80 522Sumter County 05--------------------- 42 754 242 335 119 284 51 918 19 509 9 889 41 735
Suwannee County 02------------------ 32 972 163 726 92 252 40 229 23 543 1 330 6 372Taylor County 02---------------------- 19 049 107 915 42 763 22 571 17 047 23 659 1 874Union County 06---------------------- 12 720 32 966 15 981 7 694 7 815 517 959Volusia County 03 04 07--------------------- 425 601 2 169 555 1 279 953 558 173 198 540 63 709 69 181Wakulla County 02-------------------- 19 179 64 925 36 597 14 795 9 083 1 264 3 186
Walton County 01--------------------- 38 124 396 454 93 086 32 762 16 972 1 642 251 992Washington County 02----------------- 20 614 114 329 51 468 26 766 33 229 469 2 397State undistributed------------------ 3 425 184 75 014 2 969 357 380 813 – –
Georgia----------------------------- 7 788 240 39 214 971 13 246 889 7 774 869 6 751 504 5 150 040 6 291 670Appling County 01--------------------- 16 675 72 468 29 568 21 443 18 192 810 2 455Atkinson County 08-------------------- 7 295 40 339 12 558 10 912 15 762 249 858Bacon County 01---------------------- 10 365 58 457 18 259 14 746 23 730 419 1 302Baker County 02---------------------- 3 617 17 580 5 555 7 208 4 388 85 344Baldwin County 03 11-------------------- 42 181 157 059 75 143 39 488 33 374 4 587 4 466
Banks County 10---------------------- 13 166 33 532 17 189 7 401 7 895 213 833Barrow County 10--------------------- 41 891 123 204 63 362 30 115 17 952 3 030 8 745Bartow County 07--------------------- 74 607 200 281 114 021 42 249 30 096 5 569 8 345Ben Hill County 08-------------------- 17 474 77 638 36 750 20 897 17 777 487 1 727Berrien County 08--------------------- 16 529 70 788 34 236 23 804 10 686 441 1 621
Bibb County 02 08----------------------- 155 441 915 458 388 477 203 216 204 649 31 314 87 803Bleckley County 08-------------------- 11 314 60 846 32 865 17 447 9 136 282 1 115Brantley County 01-------------------- 13 895 48 511 27 596 11 989 7 229 355 1 342Brooks County 02--------------------- 16 122 72 753 27 879 26 337 16 691 384 1 463Bryan County 01---------------------- 24 394 618 992 42 362 13 862 13 688 72 208 476 871
Bulloch County 01--------------------- 50 777 160 145 70 912 48 366 30 825 1 809 8 234Burke County 11---------------------- 23 217 99 370 38 993 30 104 26 284 1 062 2 927Butts County 11----------------------- 18 380 69 982 36 835 15 983 14 053 512 2 600Calhoun County 02-------------------- 4 936 35 577 13 262 12 218 8 785 430 882Camden County 01-------------------- 47 032 450 433 58 607 16 373 48 728 57 576 269 150
Candler County 01-------------------- 8 953 40 866 15 983 14 017 9 539 279 1 048Carroll County 07--------------------- 84 765 273 184 143 890 72 906 41 407 4 009 10 971Catoosa County 09-------------------- 52 100 117 086 68 075 28 288 14 153 3 124 3 447Charlton County 01-------------------- 9 462 41 624 19 039 9 967 10 071 555 1 992Chatham County 01 11------------------- 225 662 1 389 754 501 526 260 256 171 863 207 905 248 204
Chattahoochee County 02-------------- 16 654 128 557 6 985 2 216 4 047 114 925 384Chattooga County 07------------------ 22 858 98 960 51 055 25 113 20 282 550 1 961Cherokee County 06 09------------------- 141 686 243 009 134 414 47 380 43 673 4 255 13 287Clarke County 10---------------------- 90 638 431 282 139 164 70 441 128 001 20 883 72 793Clay County 02----------------------- 3 524 24 138 7 457 4 539 8 753 1 433 1 956
Clayton County 03 05--------------------- 213 727 571 099 300 423 135 129 48 110 23 029 64 409Clinch County 08---------------------- 6 677 35 506 12 835 9 757 7 558 4 398 959Cobb County 05 06 07----------------------- 583 541 3 973 531 715 390 252 059 111 712 2 727 230 167 140Coffee County 08--------------------- 34 958 135 516 56 071 38 324 34 394 1 676 5 053Colquitt County 02 08--------------------- 40 724 181 063 78 076 53 977 43 094 1 144 4 772
Columbia County 10------------------- 93 312 550 920 126 311 29 972 14 876 83 874 295 886Cook County 08----------------------- 15 197 62 980 29 162 18 530 13 347 426 1 515Coweta County 03--------------------- 89 401 227 040 125 577 58 293 28 866 4 494 9 809Crawford County 02 03------------------- 10 414 25 970 12 589 7 280 5 389 156 555Crisp County 02 08----------------------- 20 637 103 239 41 275 31 984 26 429 704 2 847
Dade County 09----------------------- 15 344 48 351 26 804 11 973 7 458 955 1 161Dawson County 09-------------------- 15 945 38 285 20 708 8 581 6 915 491 1 590Decatur County 02-------------------- 27 128 115 901 51 325 31 301 28 322 1 837 3 116De Kalb County 04 05 06 11-------------------- 596 853 1 992 491 665 637 421 467 239 514 46 035 619 838Dodge County 08--------------------- 18 146 90 644 40 927 26 696 20 313 483 2 224
See footnotes at end of table.
36 Consolidated Federal Funds Report for Fiscal Year 1999U.S. Census Bureau

Table 15. Federal Government Expenditure, by State and County Area: Fiscal Year 1999mCon.[Thousand dollars]
State and county area Congressionaldistrict
Federal government expenditure
United Statesresident
population1 TotalRetirement and
DisabilityOther Direct
Payments Grants ProcurementSalaries and
Wages
GeorgiamCon.Dooly County 02 08---------------------- 10 433 67 619 21 988 25 764 17 530 401 1 936Dougherty County 02 08------------------ 94 080 661 900 218 741 104 814 100 014 92 023 146 308Douglas County 07-------------------- 91 175 201 579 120 578 49 660 19 116 2 710 9 516Early County 02----------------------- 12 127 63 803 23 946 19 798 16 314 1 809 1 936Echols County 08--------------------- 2 534 6 256 2 422 1 728 1 978 28 101
Effingham County 01 11------------------ 38 370 90 697 50 509 17 809 18 324 796 3 258Elbert County 10---------------------- 19 363 97 571 46 942 22 998 18 158 2 287 7 185Emanuel County 01------------------- 21 042 116 498 46 680 28 924 34 933 1 054 4 907Evans County 01---------------------- 10 089 45 594 20 918 10 805 11 219 341 2 312Fannin County 09--------------------- 18 945 93 708 52 852 23 110 14 762 512 2 472
Fayette County 03--------------------- 92 378 202 999 146 924 32 500 7 537 4 365 11 674Floyd County 07---------------------- 85 512 332 162 180 023 84 255 51 674 4 926 11 284Forsyth County 09--------------------- 96 686 126 055 75 082 27 503 13 882 1 997 7 591Franklin County 10-------------------- 19 311 85 781 45 595 21 975 14 877 717 2 616Fulton County 04 05 06---------------------- 744 827 6 801 758 1 524 294 804 069 2 339 593 919 987 1 213 815
Gilmer County 09--------------------- 19 766 80 856 46 394 19 115 11 473 640 3 234Glascock County 11------------------- 2 544 13 073 6 042 3 681 2 638 156 555Glynn County 01---------------------- 67 945 412 159 163 032 74 667 44 628 47 466 82 365Gordon County 09--------------------- 41 966 132 473 70 048 31 843 22 787 2 167 5 628Grady County 02---------------------- 21 600 86 647 42 263 23 973 18 216 469 1 726
Greene County 11--------------------- 14 094 61 722 30 821 14 346 13 600 500 2 454Gwinnett County 04 06 10------------------- 545 632 926 567 397 018 139 559 72 879 149 473 167 638Habersham County 09----------------- 32 530 117 555 67 377 27 968 15 469 1 157 5 585Hall County 09------------------------ 123 290 372 805 195 853 83 836 53 113 18 081 21 922Hancock County 11-------------------- 9 046 52 748 22 393 13 305 16 079 213 757
Haralson County 07------------------- 25 070 99 542 48 358 22 482 25 178 769 2 756Harris County 03---------------------- 22 634 72 965 44 151 11 237 14 455 604 2 518Hart County 10------------------------ 22 124 90 855 40 927 19 151 20 403 6 095 4 278Heard County 07---------------------- 10 490 30 321 15 011 7 745 6 524 247 794Henry County 03 11---------------------- 113 443 311 461 169 267 48 371 24 682 5 103 64 038
Houston County 02 08-------------------- 107 644 1 214 160 296 879 66 876 38 982 208 023 603 401Irwin County 08----------------------- 9 181 41 944 15 748 14 987 9 269 270 1 669Jackson County 10-------------------- 39 057 131 263 66 603 28 757 23 380 7 080 5 444Jasper County 11--------------------- 10 589 35 673 18 616 7 520 8 129 284 1 123Jeff Davis County 08------------------- 12 714 49 719 24 177 14 345 9 514 370 1 313
Jefferson County 11------------------- 17 858 95 733 38 703 26 851 27 439 526 2 213Jenkins County 11--------------------- 8 401 44 631 16 605 14 598 12 128 318 983Johnson County 08-------------------- 8 293 42 668 18 263 12 798 10 460 285 861Jones County 03 08---------------------- 23 307 61 507 33 305 12 516 13 654 505 1 527Lamar County 03---------------------- 15 010 61 450 35 258 14 179 9 204 471 2 338
Lanier County 08---------------------- 6 959 27 880 11 734 8 806 6 403 236 701Laurens County 08-------------------- 43 927 230 916 96 710 47 542 43 899 6 707 36 057Lee County 02 08------------------------ 23 341 46 847 25 410 12 878 6 666 398 1 496Liberty County 01--------------------- 59 694 231 005 89 473 21 455 52 992 2 170 64 915Lincoln County 10--------------------- 8 339 38 897 18 552 9 219 6 079 4 115 931
Long County 01----------------------- 8 709 29 635 10 879 4 418 13 691 142 505Lowndes County 02 08------------------- 85 413 532 848 167 316 75 828 56 931 75 501 157 272Lumpkin County 09-------------------- 19 772 58 461 27 265 10 759 9 791 639 10 007McDuffie County 10------------------- 21 814 89 360 44 512 20 582 20 026 498 3 742McIntosh County 01------------------- 10 114 59 645 22 121 11 129 24 851 315 1 229
Macon County 02--------------------- 13 126 68 922 24 516 22 250 20 235 311 1 609Madison County 10-------------------- 25 208 83 001 46 015 18 975 14 147 885 2 979Marion County 02--------------------- 6 779 27 695 9 877 5 702 10 721 128 1 267Meriwether County 02 03----------------- 23 043 89 746 43 695 20 335 22 651 789 2 276Miller County 02----------------------- 6 318 33 148 12 768 12 581 6 670 185 943
Mitchell County 02--------------------- 21 219 101 767 39 470 31 785 26 627 727 3 157Monroe County 03--------------------- 20 032 57 920 31 401 14 128 9 166 766 2 458Montgomery County 01---------------- 7 854 33 992 15 191 8 883 8 545 284 1 090Morgan County 10--------------------- 15 437 52 796 27 369 13 760 9 319 497 1 850Murray County 09--------------------- 33 922 77 681 43 517 18 287 10 243 1 338 4 295
Muscogee County 02 03------------------ 182 058 1 586 713 502 065 158 666 136 572 10 583 778 826Newton County 10--------------------- 60 583 178 726 93 569 43 639 31 217 3 198 7 104Oconee County 10-------------------- 24 526 57 753 35 052 12 104 5 227 1 066 4 304Oglethorpe County 10----------------- 11 564 31 764 13 907 7 518 7 769 1 661 909Paulding County 07-------------------- 79 587 120 099 67 083 23 241 23 304 1 468 5 003
Peach County 02 03---------------------- 24 996 138 406 73 734 27 790 28 773 3 182 4 927Pickens County 09-------------------- 21 024 90 647 42 560 15 043 27 389 3 065 2 589Pierce County 01---------------------- 15 804 64 635 34 244 17 215 10 329 851 1 996Pike County 03----------------------- 13 104 47 342 23 254 9 618 8 435 469 5 565Polk County 07----------------------- 36 627 169 514 85 665 38 981 30 010 10 905 3 952
Pulaski County 08--------------------- 8 359 50 786 23 377 16 417 9 707 242 1 043Putnam County 11-------------------- 18 199 67 420 38 884 15 204 9 981 634 2 718Quitman County 02-------------------- 2 449 17 427 7 490 3 402 5 834 196 505Rabun County 09--------------------- 13 687 64 906 34 524 16 476 10 712 644 2 549Randolph County 02------------------- 8 012 45 662 17 301 11 674 15 504 286 896
Richmond County 10 11------------------ 190 310 1 142 213 544 402 181 946 185 223 32 765 197 878Rockdale County 04------------------- 68 968 147 120 90 715 34 520 13 416 1 886 6 583Schley County 02--------------------- 3 949 14 537 5 683 3 971 4 388 99 395Screven County 11-------------------- 14 463 70 144 29 776 19 879 18 057 512 1 920Seminole County 02------------------- 9 803 47 958 22 367 14 360 9 954 270 1 006
Spalding County 03-------------------- 57 825 228 464 119 995 56 475 42 197 2 990 6 809Stephens County 09------------------- 25 332 111 428 61 488 29 574 15 450 1 002 3 914Stewart County 02--------------------- 5 374 34 080 11 861 8 585 12 664 213 757Sumter County 02--------------------- 31 362 142 020 57 519 41 492 35 143 1 463 6 403Talbot County 02---------------------- 6 969 32 810 17 508 5 644 8 559 290 808
Taliaferro County 11------------------- 1 924 19 370 4 913 3 284 10 656 114 404Tattnall County 01--------------------- 19 171 89 450 44 292 21 472 21 076 554 2 056Taylor County 02---------------------- 8 287 46 435 20 965 10 282 13 829 298 1 060Telfair County 08---------------------- 11 406 71 216 32 177 19 571 17 409 507 1 551Terrell County 02---------------------- 11 205 61 314 20 664 16 928 15 711 4 783 3 229
See footnotes at end of table.
Consolidated Federal Funds Report for Fiscal Year 1999 37U.S. Census Bureau
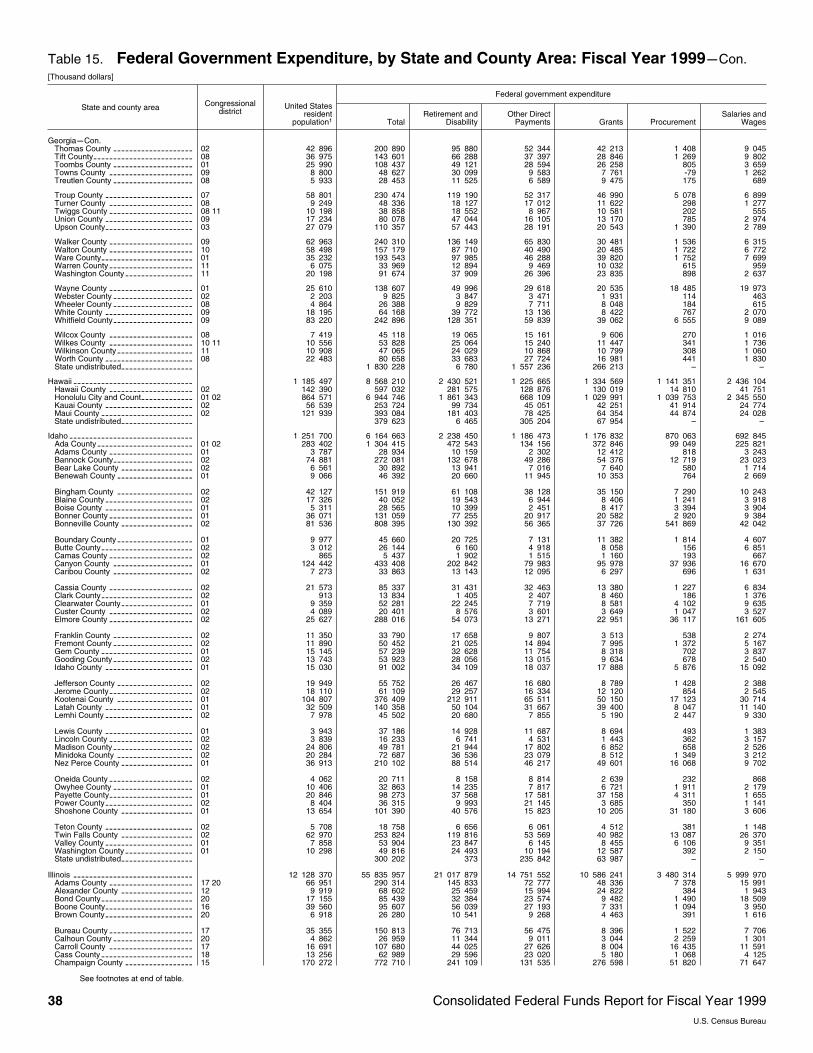
Table 15. Federal Government Expenditure, by State and County Area: Fiscal Year 1999mCon.[Thousand dollars]
State and county area Congressionaldistrict
Federal government expenditure
United Statesresident
population1 TotalRetirement and
DisabilityOther Direct
Payments Grants ProcurementSalaries and
Wages
GeorgiamCon.Thomas County 02-------------------- 42 896 200 890 95 880 52 344 42 213 1 408 9 045Tift County 08------------------------- 36 975 143 601 66 288 37 397 28 846 1 269 9 802Toombs County 01-------------------- 25 990 108 437 49 121 28 594 26 258 805 3 659Towns County 09--------------------- 8 800 48 627 30 099 9 583 7 761 ~79 1 262Treutlen County 08-------------------- 5 933 28 453 11 525 6 589 9 475 175 689
Troup County 07---------------------- 58 801 230 474 119 190 52 317 46 990 5 078 6 899Turner County 08--------------------- 9 249 48 336 18 127 17 012 11 622 298 1 277Twiggs County 08 11--------------------- 10 198 38 858 18 552 8 967 10 581 202 555Union County 09---------------------- 17 234 80 078 47 044 16 105 13 170 785 2 974Upson County 03---------------------- 27 079 110 357 57 443 28 191 20 543 1 390 2 789
Walker County 09--------------------- 62 963 240 310 136 149 65 830 30 481 1 536 6 315Walton County 10--------------------- 58 498 157 179 87 710 40 490 20 485 1 722 6 772Ware County 01----------------------- 35 232 193 543 97 985 46 288 39 820 1 752 7 699Warren County 11--------------------- 6 075 33 969 12 894 9 469 10 032 615 959Washington County 11----------------- 20 198 91 674 37 909 26 396 23 835 898 2 637
Wayne County 01--------------------- 25 610 138 607 49 996 29 618 20 535 18 485 19 973Webster County 02-------------------- 2 203 9 825 3 847 3 471 1 931 114 463Wheeler County 08-------------------- 4 864 26 388 9 829 7 711 8 048 184 615White County 09---------------------- 18 195 64 168 39 772 13 136 8 422 767 2 070Whitfield County 09-------------------- 83 220 242 896 128 351 59 839 39 062 6 555 9 089
Wilcox County 08--------------------- 7 419 45 118 19 065 15 161 9 606 270 1 016Wilkes County 10 11--------------------- 10 556 53 828 25 064 15 240 11 447 341 1 736Wilkinson County 11------------------- 10 908 47 065 24 029 10 868 10 799 308 1 060Worth County 08---------------------- 22 483 80 658 33 683 27 724 16 981 441 1 830State undistributed------------------ 1 830 228 6 780 1 557 236 266 213 – –
Hawaii ------------------------------ 1 185 497 8 568 210 2 430 521 1 225 665 1 334 569 1 141 351 2 436 104Hawaii County 02--------------------- 142 390 597 032 281 575 128 876 130 019 14 810 41 751Honolulu City and Count 01 02------------- 864 571 6 944 746 1 861 343 668 109 1 029 991 1 039 753 2 345 550Kauai County 02---------------------- 56 539 253 724 99 734 45 051 42 251 41 914 24 774Maui County 02----------------------- 121 939 393 084 181 403 78 425 64 354 44 874 24 028State undistributed------------------ 379 623 6 465 305 204 67 954 – –
Idaho ------------------------------- 1 251 700 6 164 663 2 238 450 1 186 473 1 176 832 870 063 692 845Ada County 01 02------------------------ 283 402 1 304 415 472 543 134 156 372 846 99 049 225 821Adams County 01--------------------- 3 787 28 934 10 159 2 302 12 412 818 3 243Bannock County 02-------------------- 74 881 272 081 132 678 49 286 54 376 12 719 23 023Bear Lake County 02------------------ 6 561 30 892 13 941 7 016 7 640 580 1 714Benewah County 01------------------- 9 066 46 392 20 660 11 945 10 353 764 2 669
Bingham County 02------------------- 42 127 151 919 61 108 38 128 35 150 7 290 10 243Blaine County 02---------------------- 17 326 40 052 19 543 6 944 8 406 1 241 3 918Boise County 01---------------------- 5 311 28 565 10 399 2 451 8 417 3 394 3 904Bonner County 01--------------------- 36 071 131 059 77 255 20 917 20 582 2 920 9 384Bonneville County 02------------------ 81 536 808 395 130 392 56 365 37 726 541 869 42 042
Boundary County 01------------------- 9 977 45 660 20 725 7 131 11 382 1 814 4 607Butte County 02----------------------- 3 012 26 144 6 160 4 918 8 058 156 6 851Camas County 02--------------------- 865 5 437 1 902 1 515 1 160 193 667Canyon County 01-------------------- 124 442 433 408 202 842 79 983 95 978 37 936 16 670Caribou County 02-------------------- 7 273 33 863 13 143 12 095 6 297 696 1 631
Cassia County 02--------------------- 21 573 85 337 31 431 32 463 13 380 1 227 6 834Clark County 02----------------------- 913 13 834 1 405 2 407 8 460 186 1 376Clearwater County 01------------------ 9 359 52 281 22 245 7 719 8 581 4 102 9 635Custer County 02--------------------- 4 089 20 401 8 576 3 601 3 649 1 047 3 527Elmore County 02--------------------- 25 627 288 016 54 073 13 271 22 951 36 117 161 605
Franklin County 02-------------------- 11 350 33 790 17 658 9 807 3 513 538 2 274Fremont County 02-------------------- 11 890 50 452 21 025 14 894 7 995 1 372 5 167Gem County 01----------------------- 15 145 57 239 32 628 11 754 8 318 702 3 837Gooding County 02-------------------- 13 743 53 923 28 056 13 015 9 634 678 2 540Idaho County 01---------------------- 15 030 91 002 34 109 18 037 17 888 5 876 15 092
Jefferson County 02------------------- 19 949 55 752 26 467 16 680 8 789 1 428 2 388Jerome County 02--------------------- 18 110 61 109 29 257 16 334 12 120 854 2 545Kootenai County 01------------------- 104 807 376 409 212 911 65 511 50 150 17 123 30 714Latah County 01---------------------- 32 509 140 358 50 104 31 667 39 400 8 047 11 140Lemhi County 02---------------------- 7 978 45 502 20 680 7 855 5 190 2 447 9 330
Lewis County 01---------------------- 3 943 37 186 14 928 11 687 8 694 493 1 383Lincoln County 02--------------------- 3 839 16 233 6 741 4 531 1 443 362 3 157Madison County 02-------------------- 24 806 49 781 21 944 17 802 6 852 658 2 526Minidoka County 02------------------- 20 284 72 687 36 536 23 079 8 512 1 349 3 212Nez Perce County 01------------------ 36 913 210 102 88 514 46 217 49 601 16 068 9 702
Oneida County 02--------------------- 4 062 20 711 8 158 8 814 2 639 232 868Owyhee County 01-------------------- 10 406 32 863 14 235 7 817 6 721 1 911 2 179Payette County 01--------------------- 20 846 98 273 37 568 17 581 37 158 4 311 1 655Power County 02---------------------- 8 404 36 315 9 993 21 145 3 685 350 1 141Shoshone County 01------------------ 13 654 101 390 40 576 15 823 10 205 31 180 3 606
Teton County 02---------------------- 5 708 18 758 6 656 6 061 4 512 381 1 148Twin Falls County 02------------------ 62 970 253 824 119 816 53 569 40 982 13 087 26 370Valley County 01---------------------- 7 858 53 904 23 847 6 145 8 455 6 106 9 351Washington County 01----------------- 10 298 49 816 24 493 10 194 12 587 392 2 150State undistributed------------------ 300 202 373 235 842 63 987 – –
Illinois ------------------------------ 12 128 370 55 835 957 21 017 879 14 751 552 10 586 241 3 480 314 5 999 970Adams County 17 20--------------------- 66 951 290 314 145 833 72 777 48 336 7 378 15 991Alexander County 12------------------ 9 919 68 602 25 459 15 994 24 822 384 1 943Bond County 20----------------------- 17 155 85 439 32 384 23 574 9 482 1 490 18 509Boone County 16---------------------- 39 560 95 607 56 039 27 193 7 331 1 094 3 950Brown County 20---------------------- 6 918 26 280 10 541 9 268 4 463 391 1 616
Bureau County 17--------------------- 35 355 150 813 76 713 56 475 8 396 1 522 7 706Calhoun County 20-------------------- 4 862 26 959 11 344 9 011 3 044 2 259 1 301Carroll County 17--------------------- 16 691 107 680 44 025 27 626 8 004 16 435 11 591Cass County 18----------------------- 13 256 62 989 29 596 23 020 5 180 1 068 4 125Champaign County 15----------------- 170 272 772 710 241 109 131 535 276 598 51 820 71 647
See footnotes at end of table.
38 Consolidated Federal Funds Report for Fiscal Year 1999U.S. Census Bureau
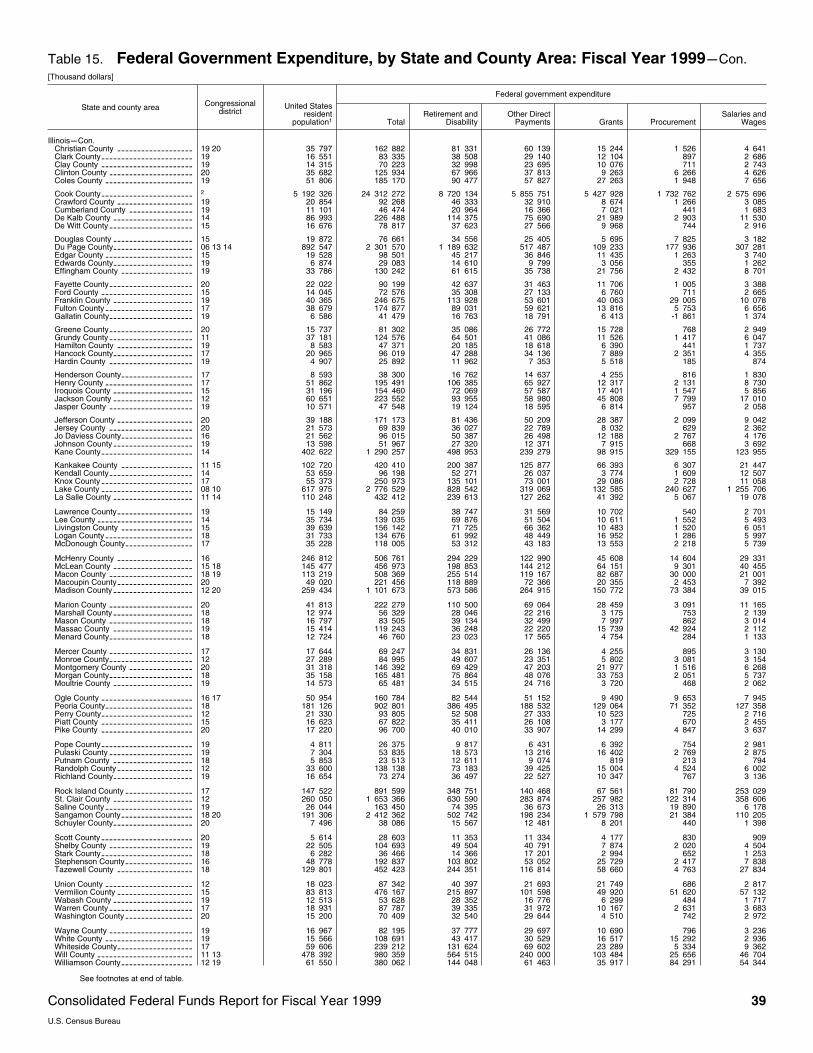
Table 15. Federal Government Expenditure, by State and County Area: Fiscal Year 1999mCon.[Thousand dollars]
State and county area Congressionaldistrict
Federal government expenditure
United Statesresident
population1 TotalRetirement and
DisabilityOther Direct
Payments Grants ProcurementSalaries and
Wages
IllinoismCon.Christian County 19 20------------------- 35 797 162 882 81 331 60 139 15 244 1 526 4 641Clark County 19----------------------- 16 551 83 335 38 508 29 140 12 104 897 2 686Clay County 19----------------------- 14 315 70 223 32 998 23 695 10 076 711 2 743Clinton County 20--------------------- 35 682 125 934 67 966 37 813 9 263 6 266 4 626Coles County 19---------------------- 51 806 185 170 90 477 57 827 27 263 1 948 7 656
Cook County 2----------------------- 5 192 326 24 312 272 8 720 134 5 855 751 5 427 928 1 732 762 2 575 696
Crawford County 19------------------- 20 854 92 268 46 333 32 910 8 674 1 266 3 085Cumberland County 19---------------- 11 101 46 474 20 964 16 366 7 021 441 1 683De Kalb County 14-------------------- 86 993 226 488 114 375 75 690 21 989 2 903 11 530De Witt County 15--------------------- 16 676 78 817 37 623 27 566 9 968 744 2 916
Douglas County 15-------------------- 19 872 76 661 34 556 25 405 5 695 7 825 3 182Du Page County 06 13 14-------------------- 892 547 2 301 570 1 189 632 517 487 109 233 177 936 307 281Edgar County 15---------------------- 19 528 98 501 45 217 36 846 11 435 1 263 3 740Edwards County 19-------------------- 6 874 29 083 14 610 9 799 3 056 355 1 262Effingham County 19------------------ 33 786 130 242 61 615 35 738 21 756 2 432 8 701
Fayette County 20--------------------- 22 022 90 199 42 637 31 463 11 706 1 005 3 388Ford County 15----------------------- 14 045 72 576 35 308 27 133 6 760 711 2 665Franklin County 19-------------------- 40 365 246 675 113 928 53 601 40 063 29 005 10 078Fulton County 17---------------------- 38 679 174 877 89 031 59 621 13 816 5 753 6 656Gallatin County 19--------------------- 6 586 41 479 16 763 18 791 6 413 ~1 861 1 374
Greene County 20--------------------- 15 737 81 302 35 086 26 772 15 728 768 2 949Grundy County 11--------------------- 37 181 124 576 64 501 41 086 11 526 1 417 6 047Hamilton County 19------------------- 8 583 47 371 20 185 18 618 6 390 441 1 737Hancock County 17-------------------- 20 965 96 019 47 288 34 136 7 889 2 351 4 355Hardin County 19--------------------- 4 907 25 892 11 962 7 353 5 518 185 874
Henderson County 17------------------ 8 593 38 300 16 762 14 637 4 255 816 1 830Henry County 17---------------------- 51 862 195 491 106 385 65 927 12 317 2 131 8 730Iroquois County 15-------------------- 31 196 154 460 72 069 57 587 17 401 1 547 5 856Jackson County 12-------------------- 60 651 223 552 93 955 58 980 45 808 7 799 17 010Jasper County 19--------------------- 10 571 47 548 19 124 18 595 6 814 957 2 058
Jefferson County 20------------------- 39 188 171 173 81 436 50 209 28 387 2 099 9 042Jersey County 20--------------------- 21 573 69 839 36 027 22 789 8 032 629 2 362Jo Daviess County 16------------------ 21 562 96 015 50 387 26 498 12 188 2 767 4 176Johnson County 19-------------------- 13 598 51 967 27 320 12 371 7 915 668 3 692Kane County 14----------------------- 402 622 1 290 257 498 953 239 279 98 915 329 155 123 955
Kankakee County 11 15------------------ 102 720 420 410 200 387 125 877 66 393 6 307 21 447Kendall County 14--------------------- 53 659 96 198 52 271 26 037 3 774 1 609 12 507Knox County 17----------------------- 55 373 250 973 135 101 73 001 29 086 2 728 11 058Lake County 08 10----------------------- 617 975 2 776 529 828 542 319 069 132 585 240 627 1 255 706La Salle County 11 14-------------------- 110 248 432 412 239 613 127 262 41 392 5 067 19 078
Lawrence County 19------------------- 15 149 84 259 38 747 31 569 10 702 540 2 701Lee County 14------------------------ 35 734 139 035 69 876 51 504 10 611 1 552 5 493Livingston County 15------------------ 39 639 156 142 71 725 66 362 10 483 1 520 6 051Logan County 18---------------------- 31 733 134 676 61 992 48 449 16 952 1 286 5 997McDonough County 17----------------- 35 228 118 005 53 312 43 183 13 553 2 218 5 739
McHenry County 16------------------- 246 812 506 761 294 229 122 990 45 608 14 604 29 331McLean County 15 18-------------------- 145 477 456 973 198 853 144 212 64 151 9 301 40 455Macon County 18 19--------------------- 113 219 508 369 255 514 119 167 82 687 30 000 21 001Macoupin County 20------------------- 49 020 221 456 118 889 72 366 20 355 2 453 7 392Madison County 12 20-------------------- 259 434 1 101 673 573 586 264 915 150 772 73 384 39 015
Marion County 20--------------------- 41 813 222 279 110 500 69 064 28 459 3 091 11 165Marshall County 18-------------------- 12 974 56 329 28 046 22 216 3 175 753 2 139Mason County 18--------------------- 16 797 83 505 39 134 32 499 7 997 862 3 014Massac County 19-------------------- 15 414 119 243 36 248 22 220 15 739 42 924 2 112Menard County 18--------------------- 12 724 46 760 23 023 17 565 4 754 284 1 133
Mercer County 17--------------------- 17 644 69 247 34 831 26 136 4 255 895 3 130Monroe County 12--------------------- 27 289 84 995 49 607 23 351 5 802 3 081 3 154Montgomery County 20---------------- 31 318 146 392 69 429 47 203 21 977 1 516 6 268Morgan County 18--------------------- 35 158 165 481 75 864 48 076 33 753 2 051 5 737Moultrie County 19-------------------- 14 573 65 481 34 515 24 716 3 720 468 2 062
Ogle County 16 17----------------------- 50 954 160 784 82 544 51 152 9 490 9 653 7 945Peoria County 18---------------------- 181 126 902 801 386 495 188 532 129 064 71 352 127 358Perry County 12----------------------- 21 330 93 805 52 508 27 333 10 523 725 2 716Piatt County 15----------------------- 16 623 67 822 35 411 26 108 3 177 670 2 455Pike County 20----------------------- 17 220 96 700 40 010 33 907 14 299 4 847 3 637
Pope County 19----------------------- 4 811 26 375 9 817 6 431 6 392 754 2 981Pulaski County 19--------------------- 7 304 53 835 18 573 13 216 16 402 2 769 2 875Putnam County 18-------------------- 5 853 23 513 12 611 9 074 819 213 794Randolph County 12------------------- 33 600 138 138 73 183 39 425 15 004 4 524 6 002Richland County 19-------------------- 16 654 73 274 36 497 22 527 10 347 767 3 136
Rock Island County 17----------------- 147 522 891 599 348 751 140 468 67 561 81 790 253 029St. Clair County 12-------------------- 260 050 1 653 366 630 590 283 874 257 982 122 314 358 606Saline County 19---------------------- 26 044 163 450 74 395 36 673 26 313 19 890 6 178Sangamon County 18 20------------------ 191 306 2 412 362 502 742 198 234 1 579 798 21 384 110 205Schuyler County 20-------------------- 7 496 38 086 15 567 12 481 8 201 440 1 398
Scott County 20----------------------- 5 614 28 603 11 353 11 334 4 177 830 909Shelby County 19--------------------- 22 505 104 693 49 504 40 791 7 874 2 020 4 504Stark County 18----------------------- 6 282 36 466 14 366 17 201 2 994 652 1 253Stephenson County 16----------------- 48 778 192 837 103 802 53 052 25 729 2 417 7 838Tazewell County 18------------------- 129 801 452 423 244 351 116 814 58 660 4 763 27 834
Union County 12---------------------- 18 023 87 342 40 397 21 693 21 749 686 2 817Vermilion County 15------------------- 83 813 476 167 215 897 101 598 49 920 51 620 57 132Wabash County 19-------------------- 12 513 53 628 28 352 16 776 6 299 484 1 717Warren County 17--------------------- 18 931 87 787 39 335 31 972 10 167 2 631 3 683Washington County 20----------------- 15 200 70 409 32 540 29 644 4 510 742 2 972
Wayne County 19--------------------- 16 967 82 195 37 777 29 697 10 690 796 3 236White County 19---------------------- 15 566 108 691 43 417 30 529 16 517 15 292 2 936Whiteside County 17------------------- 59 606 239 212 131 624 69 602 23 289 5 334 9 362Will County 11 13------------------------ 478 392 980 359 564 515 240 000 103 484 25 656 46 704Williamson County 12 19------------------ 61 550 380 062 144 048 61 463 35 917 84 291 54 344
See footnotes at end of table.
Consolidated Federal Funds Report for Fiscal Year 1999 39U.S. Census Bureau
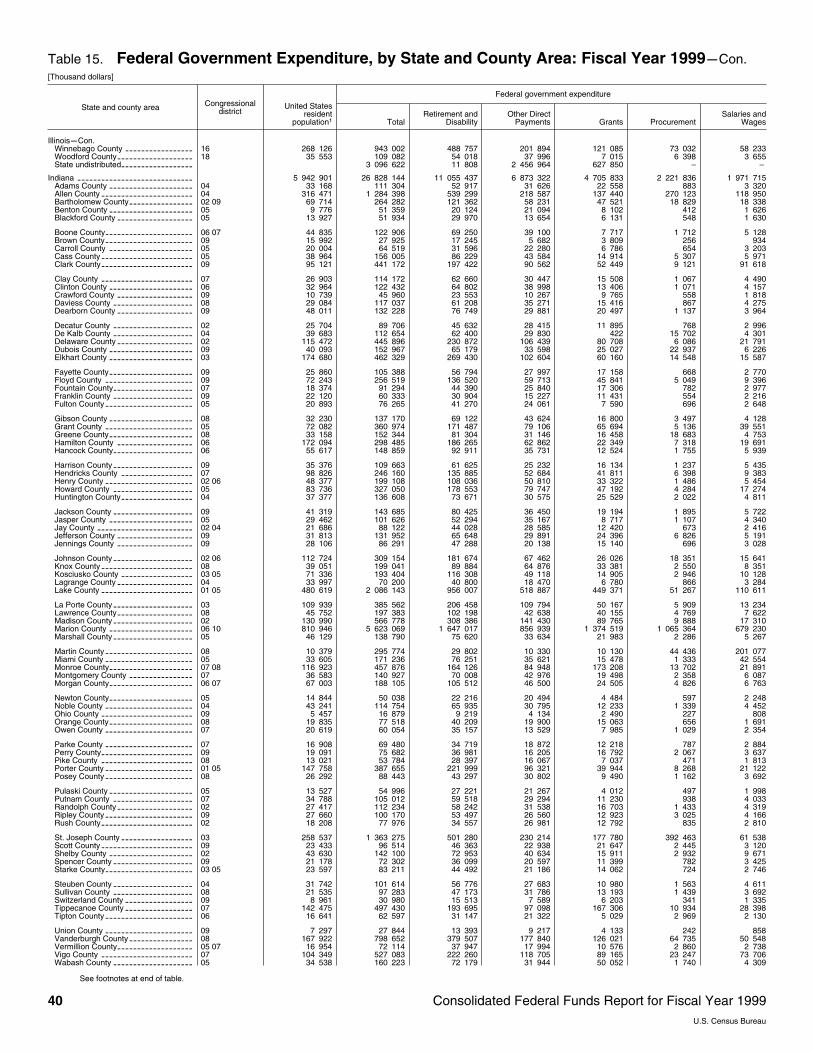
Table 15. Federal Government Expenditure, by State and County Area: Fiscal Year 1999mCon.[Thousand dollars]
State and county area Congressionaldistrict
Federal government expenditure
United Statesresident
population1 TotalRetirement and
DisabilityOther Direct
Payments Grants ProcurementSalaries and
Wages
IllinoismCon.Winnebago County 16----------------- 268 126 943 002 488 757 201 894 121 085 73 032 58 233Woodford County 18------------------- 35 553 109 082 54 018 37 996 7 015 6 398 3 655State undistributed------------------ 3 096 622 11 808 2 456 964 627 850 – –
Indiana ----------------------------- 5 942 901 26 828 144 11 055 437 6 873 322 4 705 833 2 221 836 1 971 715Adams County 04--------------------- 33 168 111 304 52 917 31 626 22 558 883 3 320Allen County 04----------------------- 316 471 1 284 398 539 299 218 587 137 440 270 123 118 950Bartholomew County 02 09---------------- 69 714 264 282 121 362 58 231 47 521 18 829 18 338Benton County 05--------------------- 9 776 51 359 20 124 21 094 8 102 412 1 626Blackford County 05------------------- 13 927 51 934 29 970 13 654 6 131 548 1 630
Boone County 06 07---------------------- 44 835 122 906 69 250 39 100 7 717 1 712 5 128Brown County 09---------------------- 15 992 27 925 17 245 5 682 3 809 256 934Carroll County 05--------------------- 20 004 64 519 31 596 22 280 6 786 654 3 203Cass County 05----------------------- 38 964 156 005 86 229 43 584 14 914 5 307 5 971Clark County 09----------------------- 95 121 441 172 197 422 90 562 52 449 9 121 91 618
Clay County 07----------------------- 26 903 114 172 62 660 30 447 15 508 1 067 4 490Clinton County 06--------------------- 32 964 122 432 64 802 38 998 13 406 1 071 4 157Crawford County 09------------------- 10 739 45 960 23 553 10 267 9 765 558 1 818Daviess County 08-------------------- 29 084 117 037 61 208 35 271 15 416 867 4 275Dearborn County 09------------------- 48 011 132 228 76 749 29 881 20 497 1 137 3 964
Decatur County 02-------------------- 25 704 89 706 45 632 28 415 11 895 768 2 996De Kalb County 04-------------------- 39 683 112 654 62 400 29 830 422 15 702 4 301Delaware County 02------------------- 115 472 445 896 230 872 106 439 80 708 6 086 21 791Dubois County 09--------------------- 40 093 152 967 65 179 33 598 25 027 22 937 6 226Elkhart County 03--------------------- 174 680 462 329 269 430 102 604 60 160 14 548 15 587
Fayette County 09--------------------- 25 860 105 388 56 794 27 997 17 158 668 2 770Floyd County 09---------------------- 72 243 256 519 136 520 59 713 45 841 5 049 9 396Fountain County 07-------------------- 18 374 91 294 44 390 25 840 17 306 782 2 977Franklin County 09-------------------- 22 120 60 333 30 904 15 227 11 431 554 2 216Fulton County 05---------------------- 20 893 76 265 41 270 24 061 7 590 696 2 648
Gibson County 08--------------------- 32 230 137 170 69 122 43 624 16 800 3 497 4 128Grant County 05---------------------- 72 082 360 974 171 487 79 106 65 694 5 136 39 551Greene County 08--------------------- 33 158 152 344 81 304 31 146 16 458 18 683 4 753Hamilton County 06------------------- 172 094 298 485 186 265 62 862 22 349 7 318 19 691Hancock County 06-------------------- 55 617 148 859 92 911 35 731 12 524 1 755 5 939
Harrison County 09-------------------- 35 376 109 663 61 625 25 232 16 134 1 237 5 435Hendricks County 07------------------ 98 826 246 160 135 885 52 684 41 811 6 398 9 383Henry County 02 06---------------------- 48 377 199 108 108 036 50 810 33 322 1 486 5 454Howard County 05-------------------- 83 736 327 050 178 553 79 747 47 192 4 284 17 274Huntington County 04------------------ 37 377 136 608 73 671 30 575 25 529 2 022 4 811
Jackson County 09-------------------- 41 319 143 685 80 425 36 450 19 194 1 895 5 722Jasper County 05--------------------- 29 462 101 626 52 294 35 167 8 717 1 107 4 340Jay County 02 04------------------------ 21 686 88 122 44 028 28 585 12 420 673 2 416Jefferson County 09------------------- 31 813 131 952 65 648 29 891 24 396 6 826 5 191Jennings County 09------------------- 28 106 86 291 47 288 20 138 15 140 696 3 028
Johnson County 02 06-------------------- 112 724 309 154 181 674 67 462 26 026 18 351 15 641Knox County 08----------------------- 39 051 199 041 89 884 64 876 33 381 2 550 8 351Kosciusko County 03 05------------------ 71 336 193 404 116 308 49 118 14 905 2 946 10 128Lagrange County 04------------------- 33 997 70 200 40 800 18 470 6 780 866 3 284Lake County 01 05----------------------- 480 619 2 086 143 956 007 518 887 449 371 51 267 110 611
La Porte County 03-------------------- 109 939 385 562 206 458 109 794 50 167 5 909 13 234Lawrence County 08------------------- 45 752 197 383 102 198 42 638 40 155 4 769 7 622Madison County 02-------------------- 130 990 566 778 308 386 141 430 89 765 9 888 17 310Marion County 06 10--------------------- 810 946 5 623 069 1 647 017 856 939 1 374 519 1 065 364 679 230Marshall County 05-------------------- 46 129 138 790 75 620 33 634 21 983 2 286 5 267
Martin County 08---------------------- 10 379 295 774 29 802 10 330 10 130 44 436 201 077Miami County 05---------------------- 33 605 171 236 76 251 35 621 15 478 1 333 42 554Monroe County 07 08--------------------- 116 923 457 876 164 126 84 948 173 208 13 702 21 891Montgomery County 07---------------- 36 583 140 927 70 008 42 976 19 498 2 358 6 087Morgan County 06 07--------------------- 67 003 188 105 105 512 46 500 24 505 4 826 6 763
Newton County 05--------------------- 14 844 50 038 22 216 20 494 4 484 597 2 248Noble County 04---------------------- 43 241 114 754 65 935 30 795 12 233 1 339 4 452Ohio County 09----------------------- 5 457 16 879 9 219 4 134 2 490 227 808Orange County 08--------------------- 19 835 77 518 40 209 19 900 15 063 656 1 691Owen County 07---------------------- 20 619 60 054 35 157 13 529 7 985 1 029 2 354
Parke County 07---------------------- 16 908 69 480 34 719 18 872 12 218 787 2 884Perry County 09----------------------- 19 091 75 682 36 981 16 205 16 792 2 067 3 637Pike County 08----------------------- 13 021 53 784 28 397 16 067 7 037 471 1 813Porter County 01 05---------------------- 147 758 387 655 221 999 96 321 39 944 8 268 21 122Posey County 08---------------------- 26 292 88 443 43 297 30 802 9 490 1 162 3 692
Pulaski County 05--------------------- 13 527 54 996 27 221 21 267 4 012 497 1 998Putnam County 07-------------------- 34 788 105 012 59 518 29 294 11 230 938 4 033Randolph County 02------------------- 27 417 112 234 58 242 31 538 16 703 1 433 4 319Ripley County 09---------------------- 27 660 100 170 53 497 26 560 12 923 3 025 4 166Rush County 02----------------------- 18 208 77 976 34 557 26 981 12 792 835 2 810
St. Joseph County 03------------------ 258 537 1 363 275 501 280 230 214 177 780 392 463 61 538Scott County 09----------------------- 23 433 96 514 46 363 22 938 21 647 2 445 3 120Shelby County 02--------------------- 43 630 142 100 72 953 40 634 15 911 2 932 9 671Spencer County 09-------------------- 21 178 72 302 36 099 20 597 11 399 782 3 425Starke County 03 05---------------------- 23 597 83 211 44 492 21 186 14 062 724 2 746
Steuben County 04-------------------- 31 742 101 614 56 776 27 683 10 980 1 563 4 611Sullivan County 08-------------------- 21 535 97 283 47 173 31 786 13 193 1 439 3 692Switzerland County 09----------------- 8 961 30 980 15 513 7 589 6 203 341 1 335Tippecanoe County 07----------------- 142 475 497 430 193 695 97 098 167 306 10 934 28 398Tipton County 06---------------------- 16 641 62 597 31 147 21 322 5 029 2 969 2 130
Union County 09---------------------- 7 297 27 844 13 393 9 217 4 133 242 858Vanderburgh County 08---------------- 167 922 798 652 379 507 177 840 126 021 64 735 50 548Vermillion County 05 07------------------- 16 954 72 114 37 947 17 994 10 576 2 860 2 738Vigo County 07----------------------- 104 349 527 083 222 260 118 705 89 165 23 247 73 706Wabash County 05-------------------- 34 538 160 223 72 179 31 944 50 052 1 740 4 309
See footnotes at end of table.
40 Consolidated Federal Funds Report for Fiscal Year 1999U.S. Census Bureau

Table 15. Federal Government Expenditure, by State and County Area: Fiscal Year 1999mCon.[Thousand dollars]
State and county area Congressionaldistrict
Federal government expenditure
United Statesresident
population1 TotalRetirement and
DisabilityOther Direct
Payments Grants ProcurementSalaries and
Wages
IndianamCon.Warren County 05--------------------- 8 349 32 781 12 656 15 502 3 257 270 1 096Warrick County 08--------------------- 52 557 133 365 78 617 31 209 15 924 1 492 6 123Washington County 09----------------- 28 233 90 409 47 192 23 280 15 149 1 498 3 291Wayne County 02--------------------- 71 134 334 755 160 592 76 038 83 608 5 370 9 147Wells County 04---------------------- 26 810 81 660 43 704 26 010 7 886 782 3 279
White County 05---------------------- 25 522 114 418 56 399 34 759 18 539 999 3 723Whitley County 04--------------------- 30 811 94 805 56 128 25 137 5 357 4 478 3 704State undistributed------------------ 1 715 526 1 842 1 453 524 260 160 – –
Iowa-------------------------------- 2 869 413 15 601 525 5 750 560 5 387 789 2 595 290 897 901 969 985Adair County 04----------------------- 8 066 42 827 16 825 16 396 7 921 313 1 373Adams County 03--------------------- 4 405 25 739 10 448 11 315 2 284 313 1 380Allamakee County 02------------------ 14 068 59 151 28 932 18 444 7 428 1 348 2 999Appanoose County 03----------------- 13 446 75 538 35 379 17 570 17 966 753 3 870Audubon County 04------------------- 6 802 42 834 16 100 16 978 7 852 355 1 549
Benton County 02--------------------- 25 798 104 443 45 348 39 441 9 024 7 157 3 473Black Hawk County 02----------------- 119 959 511 848 249 786 122 600 96 493 10 851 32 118Boone County 05---------------------- 26 300 105 980 54 446 32 676 10 255 1 084 7 519Bremer County 02--------------------- 23 440 95 766 46 860 31 212 13 742 1 123 2 829Buchanan County 02------------------ 21 160 85 961 39 664 32 615 9 615 824 3 243
Buena Vista County 05----------------- 19 404 94 317 41 879 34 945 8 238 3 484 5 770Butler County 02---------------------- 15 499 77 026 35 101 30 232 8 693 611 2 388Calhoun County 05-------------------- 11 319 64 660 29 067 27 882 4 928 583 2 200Carroll County 05--------------------- 21 518 96 688 46 239 31 628 12 352 1 366 5 103Cass County 04----------------------- 14 512 75 204 36 272 27 426 7 054 739 3 712
Cedar County 01---------------------- 18 056 71 970 32 203 29 015 5 451 684 4 617Cerro Gordo County 02---------------- 45 669 220 572 107 288 54 837 44 306 4 851 9 290Cherokee County 05------------------- 13 060 66 649 31 547 25 501 6 285 669 2 647Chickasaw County 02------------------ 13 423 118 780 27 023 22 849 5 537 60 867 2 504Clarke County 03---------------------- 8 273 37 144 16 549 13 567 5 074 432 1 522
Clay County 05----------------------- 17 245 89 862 36 426 38 929 9 565 826 4 116Clayton County 02--------------------- 18 582 87 352 39 245 31 524 11 112 1 053 4 417Clinton County 01--------------------- 49 612 203 307 109 306 63 531 21 530 1 788 7 152Crawford County 05------------------- 16 427 86 163 33 550 29 166 11 592 7 188 4 667Dallas County 04---------------------- 38 210 127 705 62 336 34 304 24 470 1 397 5 198
Davis County 03---------------------- 8 517 40 141 16 796 12 659 8 649 384 1 653Decatur County 03-------------------- 8 319 43 815 18 012 13 408 10 055 469 1 871Delaware County 02------------------- 18 482 69 935 29 559 28 297 8 454 786 2 838Des Moines County 03----------------- 41 955 202 307 96 138 44 939 25 272 26 244 9 713Dickinson County 05------------------- 16 285 77 629 40 721 21 359 12 556 625 2 368
Dubuque County 02------------------- 88 112 322 160 171 098 80 174 48 238 5 566 17 084Emmet County 05--------------------- 10 638 61 749 26 340 22 088 7 166 3 731 2 424Fayette County 02--------------------- 21 566 103 466 47 331 38 722 11 500 1 170 4 743Floyd County 02---------------------- 16 256 120 022 41 653 29 232 44 770 1 549 2 817Franklin County 05-------------------- 10 781 59 567 22 983 24 839 9 165 512 2 069
Fremont County 04-------------------- 7 706 48 471 19 378 20 205 6 308 957 1 623Greene County 05--------------------- 10 020 58 554 25 912 23 148 6 588 576 2 330Grundy County 02--------------------- 12 284 60 584 26 915 24 490 6 865 483 1 831Guthrie County 04--------------------- 11 591 57 664 27 323 21 042 5 896 762 2 641Hamilton County 05------------------- 15 905 76 471 35 273 30 316 7 492 696 2 693
Hancock County 05-------------------- 12 037 56 935 25 555 25 266 3 160 569 2 387Hardin County 05--------------------- 18 159 103 776 48 240 33 805 9 504 8 013 4 214Harrison County 04-------------------- 15 216 79 730 35 299 28 173 11 367 842 4 049Henry County 03---------------------- 20 139 90 788 38 993 25 154 22 271 867 3 503Howard County 02-------------------- 9 574 48 333 20 342 19 446 6 042 851 1 653
Humboldt County 05------------------- 10 224 55 567 25 515 21 995 4 762 583 2 711Ida County 05------------------------- 7 930 41 669 18 206 17 926 3 415 398 1 724Iowa County 02----------------------- 15 667 65 380 30 591 24 797 5 953 786 3 253Jackson County 02-------------------- 20 157 95 352 42 573 29 321 19 129 768 3 562Jasper County 03--------------------- 36 659 140 680 73 748 44 358 15 191 1 988 5 394
Jefferson County 03------------------- 16 762 60 452 26 371 20 285 8 416 815 4 566Johnson County 01-------------------- 103 813 532 849 118 477 59 429 177 401 113 771 63 771Jones County 01---------------------- 20 075 75 550 36 249 27 256 8 233 1 071 2 740Keokuk County 03--------------------- 11 340 69 222 28 237 27 788 9 456 768 2 974Kossuth County 05-------------------- 17 630 95 487 39 911 41 849 8 353 1 224 4 149
Lee County 03------------------------ 38 309 157 220 81 810 42 980 24 054 1 844 6 532Linn County 01------------------------ 184 891 962 902 330 055 127 032 104 081 346 674 55 060Louisa County 01--------------------- 11 945 51 312 21 831 16 558 5 799 4 667 2 456Lucas County 03---------------------- 9 131 47 613 22 988 13 926 8 155 466 2 078Lyon County 05----------------------- 12 030 51 325 23 180 21 556 4 303 549 1 738
Madison County 04-------------------- 14 105 52 230 25 729 17 699 6 110 540 2 152Mahaska County 03------------------- 21 954 95 710 43 827 30 842 16 277 979 3 785Marion County 03--------------------- 31 529 155 403 74 006 30 923 16 342 3 373 30 758Marshall County 03-------------------- 38 782 190 514 90 019 42 812 29 514 21 540 6 630Mills County 04----------------------- 14 705 67 071 29 774 20 774 13 046 684 2 793
Mitchell County 02--------------------- 11 106 55 726 26 953 22 233 4 025 526 1 989Monona County 05-------------------- 10 089 66 134 26 515 27 352 9 234 569 2 465Monroe County 03--------------------- 8 017 43 140 20 253 13 857 7 157 327 1 545Montgomery County 04---------------- 11 707 60 641 28 524 22 008 6 541 611 2 956Muscatine County 01------------------ 41 195 147 305 75 898 34 387 20 811 10 061 6 148
O’Brien County 05--------------------- 14 621 78 859 36 072 29 071 9 605 753 3 356Osceola County 05-------------------- 6 914 35 540 14 907 16 354 2 535 341 1 403Page County 03----------------------- 17 139 82 493 41 452 24 807 11 731 895 3 607Palo Alto County 05------------------- 9 917 63 864 25 432 24 524 11 284 512 2 113Plymouth County 05------------------- 24 819 97 801 45 083 35 788 10 450 1 612 4 868
Pocahontas County 05----------------- 8 774 55 989 22 820 26 109 4 336 509 2 214Polk County 04----------------------- 364 672 3 064 338 655 399 1 274 803 734 657 98 609 300 870Pottawattamie County 04--------------- 86 425 791 211 182 814 530 198 63 771 2 550 11 879Poweshiek County 03------------------ 18 693 78 704 39 508 29 475 6 302 725 2 695Ringgold County 03------------------- 5 361 32 003 12 899 12 929 4 228 384 1 563
See footnotes at end of table.
Consolidated Federal Funds Report for Fiscal Year 1999 41U.S. Census Bureau
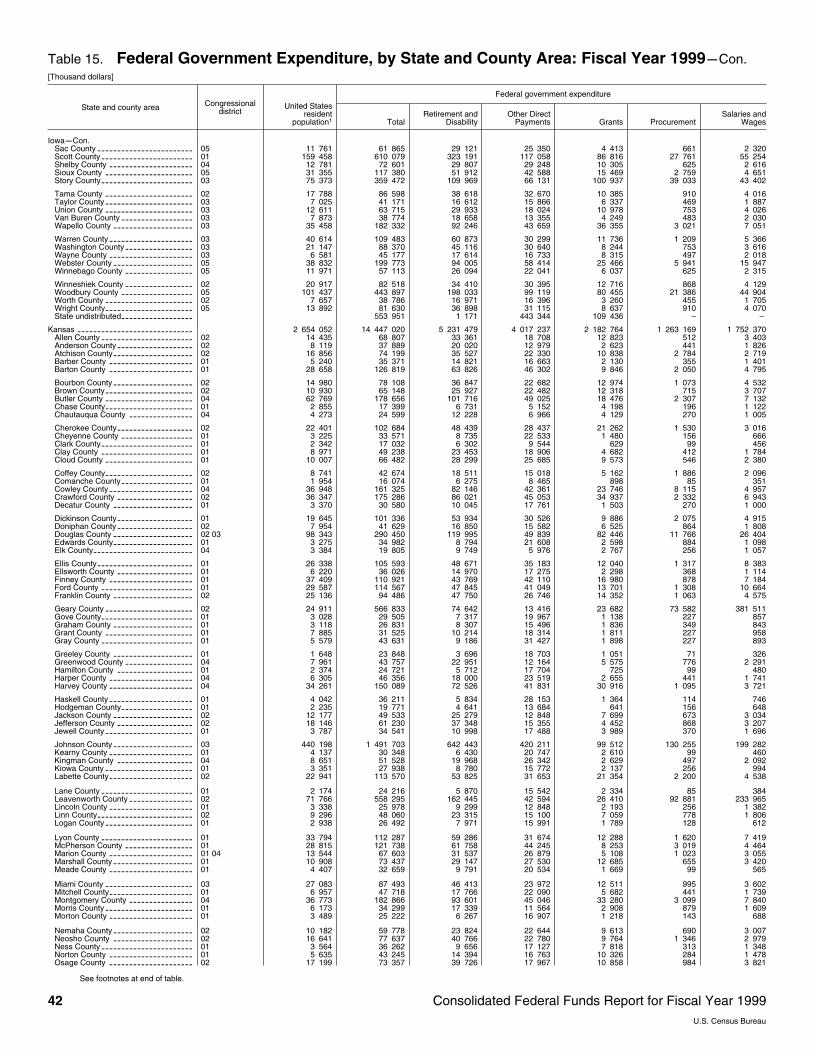
Table 15. Federal Government Expenditure, by State and County Area: Fiscal Year 1999mCon.[Thousand dollars]
State and county area Congressionaldistrict
Federal government expenditure
United Statesresident
population1 TotalRetirement and
DisabilityOther Direct
Payments Grants ProcurementSalaries and
Wages
IowamCon.Sac County 05------------------------ 11 761 61 865 29 121 25 350 4 413 661 2 320Scott County 01----------------------- 159 458 610 079 323 191 117 058 86 816 27 761 55 254Shelby County 04--------------------- 12 781 72 601 29 807 29 248 10 305 625 2 616Sioux County 05---------------------- 31 355 117 380 51 912 42 588 15 469 2 759 4 651Story County 03----------------------- 75 373 359 472 109 969 66 131 100 937 39 033 43 402
Tama County 02---------------------- 17 788 86 598 38 618 32 670 10 385 910 4 016Taylor County 03---------------------- 7 025 41 171 16 612 15 866 6 337 469 1 887Union County 03---------------------- 12 611 63 715 29 933 18 024 10 978 753 4 026Van Buren County 03------------------ 7 873 38 774 18 658 13 355 4 249 483 2 030Wapello County 03-------------------- 35 458 182 332 92 246 43 659 36 355 3 021 7 051
Warren County 03--------------------- 40 614 109 483 60 873 30 299 11 736 1 209 5 366Washington County 03----------------- 21 147 88 370 45 116 30 640 8 244 753 3 616Wayne County 03--------------------- 6 581 45 177 17 614 16 733 8 315 497 2 018Webster County 05-------------------- 38 832 199 773 94 005 58 414 25 466 5 941 15 947Winnebago County 05----------------- 11 971 57 113 26 094 22 041 6 037 625 2 315
Winneshiek County 02----------------- 20 917 82 518 34 410 30 395 12 716 868 4 129Woodbury County 05------------------ 101 437 443 897 198 033 99 119 80 455 21 386 44 904Worth County 02---------------------- 7 657 38 786 16 971 16 396 3 260 455 1 705Wright County 05---------------------- 13 892 81 630 36 898 31 115 8 637 910 4 070State undistributed------------------ 553 951 1 171 443 344 109 436 – –
Kansas ----------------------------- 2 654 052 14 447 020 5 231 479 4 017 237 2 182 764 1 263 169 1 752 370Allen County 02----------------------- 14 435 68 807 33 361 18 708 12 823 512 3 403Anderson County 02------------------- 8 119 37 889 20 020 12 979 2 623 441 1 826Atchison County 02-------------------- 16 856 74 199 35 527 22 330 10 838 2 784 2 719Barber County 01--------------------- 5 240 35 371 14 821 16 663 2 130 355 1 401Barton County 01--------------------- 28 658 126 819 63 826 46 302 9 846 2 050 4 795
Bourbon County 02-------------------- 14 980 78 108 36 847 22 682 12 974 1 073 4 532Brown County 02---------------------- 10 930 65 148 25 927 22 482 12 318 715 3 707Butler County 04---------------------- 62 769 178 656 101 716 49 025 18 476 2 307 7 132Chase County 01---------------------- 2 855 17 399 6 731 5 152 4 198 196 1 122Chautauqua County 04---------------- 4 273 24 599 12 228 6 966 4 129 270 1 005
Cherokee County 02------------------- 22 401 102 684 48 439 28 437 21 262 1 530 3 016Cheyenne County 01------------------ 3 225 33 571 8 735 22 533 1 480 156 666Clark County 01----------------------- 2 342 17 032 6 302 9 544 629 99 456Clay County 01----------------------- 8 971 49 238 23 453 18 906 4 682 412 1 784Cloud County 01---------------------- 10 007 66 482 28 299 25 685 9 573 546 2 380
Coffey County 02---------------------- 8 741 42 674 18 511 15 018 5 162 1 886 2 096Comanche County 01------------------ 1 954 16 074 6 275 8 465 898 85 351Cowley County 04--------------------- 36 948 161 325 82 146 42 361 23 746 8 115 4 957Crawford County 02------------------- 36 347 175 286 86 021 45 053 34 937 2 332 6 943Decatur County 01-------------------- 3 370 30 580 10 045 17 761 1 503 270 1 000
Dickinson County 01------------------- 19 645 101 336 53 934 30 526 9 886 2 075 4 915Doniphan County 02------------------- 7 954 41 629 16 850 15 582 6 525 864 1 808Douglas County 02 03-------------------- 98 343 290 450 119 995 49 839 82 446 11 766 26 404Edwards County 01-------------------- 3 275 34 982 8 794 21 608 2 598 884 1 098Elk County 04------------------------- 3 384 19 805 9 749 5 976 2 767 256 1 057
Ellis County 01------------------------ 26 338 105 593 48 671 35 183 12 040 1 317 8 383Ellsworth County 01------------------- 6 220 36 026 14 970 17 275 2 298 368 1 114Finney County 01--------------------- 37 409 110 921 43 769 42 110 16 980 878 7 184Ford County 01----------------------- 29 587 114 567 47 845 41 049 13 701 1 308 10 664Franklin County 02-------------------- 25 136 94 486 47 750 26 746 14 352 1 063 4 575
Geary County 02---------------------- 24 911 566 833 74 642 13 416 23 682 73 582 381 511Gove County 01----------------------- 3 028 29 505 7 317 19 967 1 138 227 857Graham County 01-------------------- 3 118 26 831 8 307 15 496 1 836 349 843Grant County 01---------------------- 7 885 31 525 10 214 18 314 1 811 227 958Gray County 01----------------------- 5 579 43 631 9 186 31 427 1 898 227 893
Greeley County 01-------------------- 1 648 23 848 3 696 18 703 1 051 71 326Greenwood County 04----------------- 7 961 43 757 22 951 12 164 5 575 776 2 291Hamilton County 01------------------- 2 374 24 721 5 712 17 704 725 99 480Harper County 04--------------------- 6 305 46 356 18 000 23 519 2 655 441 1 741Harvey County 04--------------------- 34 261 150 089 72 526 41 831 30 916 1 095 3 721
Haskell County 01--------------------- 4 042 36 211 5 834 28 153 1 364 114 746Hodgeman County 01------------------ 2 235 19 771 4 641 13 684 641 156 648Jackson County 02-------------------- 12 177 49 533 25 279 12 848 7 699 673 3 034Jefferson County 02------------------- 18 146 61 230 37 348 15 355 4 452 868 3 207Jewell County 01---------------------- 3 787 34 541 10 998 17 488 3 989 370 1 696
Johnson County 03-------------------- 440 198 1 491 703 642 443 420 211 99 512 130 255 199 282Kearny County 01--------------------- 4 137 30 348 6 430 20 747 2 610 99 460Kingman County 04------------------- 8 651 51 528 19 968 26 342 2 629 497 2 092Kiowa County 01---------------------- 3 351 27 938 8 780 15 772 2 137 256 994Labette County 02--------------------- 22 941 113 570 53 825 31 653 21 354 2 200 4 538
Lane County 01----------------------- 2 174 24 216 5 870 15 542 2 334 85 384Leavenworth County 02---------------- 71 766 558 295 162 445 42 594 26 410 92 881 233 965Lincoln County 01--------------------- 3 338 25 978 9 299 12 848 2 193 256 1 382Linn County 02------------------------ 9 296 48 060 23 315 15 100 7 059 778 1 806Logan County 01---------------------- 2 938 26 492 7 971 15 991 1 789 128 612
Lyon County 01----------------------- 33 794 112 287 59 286 31 674 12 288 1 620 7 419McPherson County 01----------------- 28 815 121 738 61 758 44 245 8 253 3 019 4 464Marion County 01 04--------------------- 13 544 67 603 31 537 26 879 5 108 1 023 3 055Marshall County 01-------------------- 10 908 73 437 29 147 27 530 12 685 655 3 420Meade County 01--------------------- 4 407 32 659 9 791 20 534 1 669 99 565
Miami County 03---------------------- 27 083 87 493 46 413 23 972 12 511 995 3 602Mitchell County 01--------------------- 6 957 47 718 17 766 22 090 5 682 441 1 739Montgomery County 04---------------- 36 773 182 866 93 601 45 046 33 280 3 099 7 840Morris County 01---------------------- 6 173 34 299 17 339 11 564 2 908 879 1 609Morton County 01--------------------- 3 489 25 222 6 267 16 907 1 218 143 688
Nemaha County 02-------------------- 10 182 59 778 23 824 22 644 9 613 690 3 007Neosho County 02-------------------- 16 641 77 637 40 766 22 780 9 764 1 346 2 979Ness County 01----------------------- 3 564 36 262 9 656 17 127 7 818 313 1 348Norton County 01--------------------- 5 635 43 245 14 394 16 763 10 326 284 1 478Osage County 02--------------------- 17 199 73 357 39 726 17 967 10 858 984 3 821
See footnotes at end of table.
42 Consolidated Federal Funds Report for Fiscal Year 1999U.S. Census Bureau
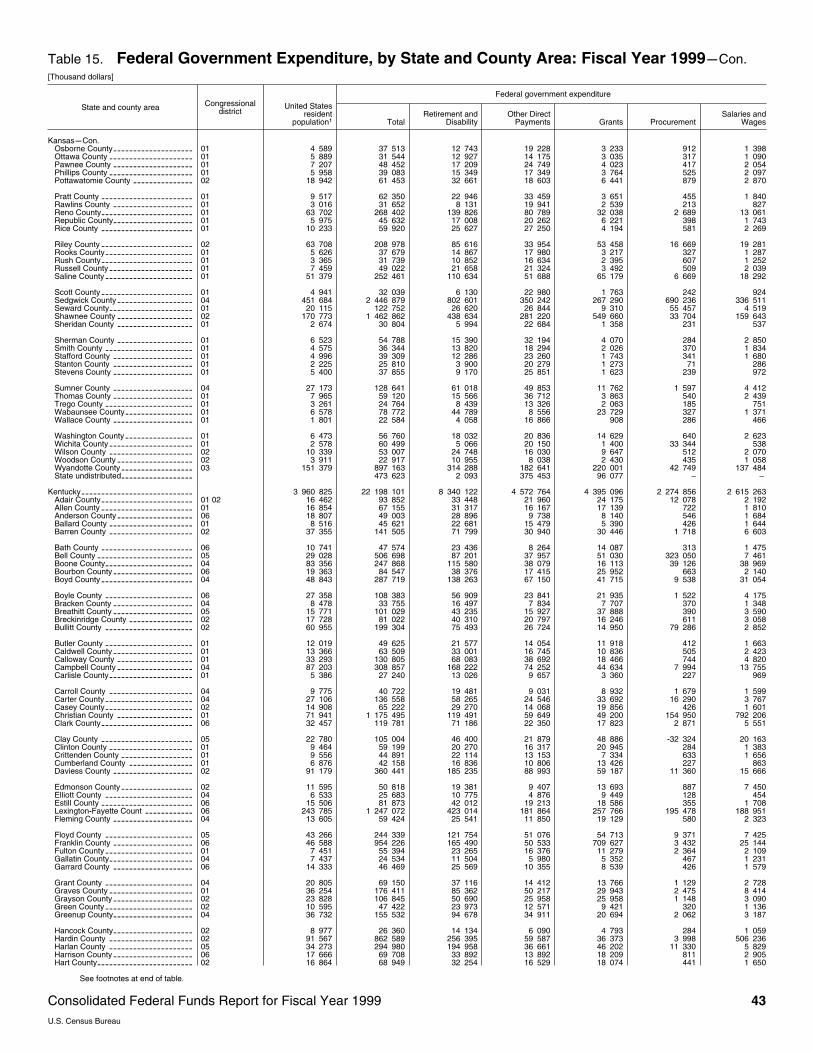
Table 15. Federal Government Expenditure, by State and County Area: Fiscal Year 1999mCon.[Thousand dollars]
State and county area Congressionaldistrict
Federal government expenditure
United Statesresident
population1 TotalRetirement and
DisabilityOther Direct
Payments Grants ProcurementSalaries and
Wages
KansasmCon.Osborne County 01-------------------- 4 589 37 513 12 743 19 228 3 233 912 1 398Ottawa County 01--------------------- 5 889 31 544 12 927 14 175 3 035 317 1 090Pawnee County 01-------------------- 7 207 48 452 17 209 24 749 4 023 417 2 054Phillips County 01--------------------- 5 958 39 083 15 349 17 349 3 764 525 2 097Pottawatomie County 02--------------- 18 942 61 453 32 661 18 603 6 441 879 2 870
Pratt County 01----------------------- 9 517 62 350 22 946 33 459 3 651 455 1 840Rawlins County 01-------------------- 3 016 31 652 8 131 19 941 2 539 213 827Reno County 01----------------------- 63 702 268 402 139 826 80 789 32 038 2 689 13 061Republic County 01-------------------- 5 975 45 632 17 008 20 262 6 221 398 1 743Rice County 01----------------------- 10 233 59 920 25 627 27 250 4 194 581 2 269
Riley County 02----------------------- 63 708 208 978 85 616 33 954 53 458 16 669 19 281Rooks County 01---------------------- 5 626 37 679 14 867 17 980 3 217 327 1 287Rush County 01----------------------- 3 365 31 739 10 852 16 634 2 395 607 1 252Russell County 01--------------------- 7 459 49 022 21 658 21 324 3 492 509 2 039Saline County 01---------------------- 51 379 252 461 110 634 51 688 65 179 6 669 18 292
Scott County 01----------------------- 4 941 32 039 6 130 22 980 1 763 242 924Sedgwick County 04------------------- 451 684 2 446 879 802 601 350 242 267 290 690 236 336 511Seward County 01--------------------- 20 115 122 752 26 620 26 844 9 310 55 457 4 519Shawnee County 02------------------- 170 773 1 462 862 438 634 281 220 549 660 33 704 159 643Sheridan County 01------------------- 2 674 30 804 5 994 22 684 1 358 231 537
Sherman County 01------------------- 6 523 54 788 15 390 32 194 4 070 284 2 850Smith County 01---------------------- 4 575 36 344 13 820 18 294 2 026 370 1 834Stafford County 01-------------------- 4 996 39 309 12 286 23 260 1 743 341 1 680Stanton County 01-------------------- 2 225 25 810 3 900 20 279 1 273 71 286Stevens County 01-------------------- 5 400 37 855 9 170 25 851 1 623 239 972
Sumner County 04-------------------- 27 173 128 641 61 018 49 853 11 762 1 597 4 412Thomas County 01-------------------- 7 965 59 120 15 566 36 712 3 863 540 2 439Trego County 01---------------------- 3 261 24 764 8 439 13 326 2 063 185 751Wabaunsee County 01----------------- 6 578 78 772 44 789 8 556 23 729 327 1 371Wallace County 01-------------------- 1 801 22 584 4 058 16 866 908 286 466
Washington County 01----------------- 6 473 56 760 18 032 20 836 14 629 640 2 623Wichita County 01--------------------- 2 578 60 499 5 066 20 150 1 400 33 344 538Wilson County 02--------------------- 10 339 53 007 24 748 16 030 9 647 512 2 070Woodson County 02------------------- 3 911 22 917 10 955 8 038 2 430 435 1 058Wyandotte County 03------------------ 151 379 897 163 314 288 182 641 220 001 42 749 137 484State undistributed------------------ 473 623 2 093 375 453 96 077 – –
Kentucky---------------------------- 3 960 825 22 198 101 8 340 122 4 572 764 4 395 096 2 274 856 2 615 263Adair County 01 02----------------------- 16 462 93 852 33 448 21 960 24 175 12 078 2 192Allen County 01----------------------- 16 854 67 155 31 317 16 167 17 139 722 1 810Anderson County 06------------------- 18 807 49 003 28 896 9 738 8 140 546 1 684Ballard County 01--------------------- 8 516 45 621 22 681 15 479 5 390 426 1 644Barren County 02--------------------- 37 355 141 505 71 799 30 940 30 446 1 718 6 603
Bath County 06----------------------- 10 741 47 574 23 436 8 264 14 087 313 1 475Bell County 05------------------------ 29 028 506 698 87 201 37 957 51 030 323 050 7 461Boone County 04---------------------- 83 356 247 868 115 580 38 079 16 113 39 126 38 969Bourbon County 06-------------------- 19 363 84 547 38 376 17 415 25 952 663 2 140Boyd County 04----------------------- 48 843 287 719 138 263 67 150 41 715 9 538 31 054
Boyle County 06---------------------- 27 358 108 383 56 909 23 841 21 935 1 522 4 175Bracken County 04-------------------- 8 478 33 755 16 497 7 834 7 707 370 1 348Breathitt County 05-------------------- 15 771 101 029 43 235 15 927 37 888 390 3 590Breckinridge County 02---------------- 17 728 81 022 40 310 20 797 16 246 611 3 058Bullitt County 02---------------------- 60 955 199 304 75 493 26 724 14 950 79 286 2 852
Butler County 01---------------------- 12 019 49 625 21 577 14 054 11 918 412 1 663Caldwell County 01-------------------- 13 366 63 509 33 001 16 745 10 836 505 2 423Calloway County 01------------------- 33 293 130 805 68 083 38 692 18 466 744 4 820Campbell County 04------------------- 87 203 308 857 168 222 74 252 44 634 7 994 13 755Carlisle County 01--------------------- 5 386 27 240 13 026 9 657 3 360 227 969
Carroll County 04--------------------- 9 775 40 722 19 481 9 031 8 932 1 679 1 599Carter County 04---------------------- 27 106 136 558 58 265 24 546 33 692 16 290 3 767Casey County 02---------------------- 14 908 65 222 29 270 14 068 19 856 426 1 601Christian County 01------------------- 71 941 1 175 495 119 491 59 649 49 200 154 950 792 206Clark County 06----------------------- 32 457 119 781 71 186 22 350 17 823 2 871 5 551
Clay County 05----------------------- 22 780 105 004 46 400 21 879 48 886 ~32 324 20 163Clinton County 01--------------------- 9 464 59 199 20 270 16 317 20 945 284 1 383Crittenden County 01------------------ 9 556 44 891 22 114 13 153 7 334 633 1 656Cumberland County 01---------------- 6 876 42 158 16 836 10 806 13 426 227 863Daviess County 02-------------------- 91 179 360 441 185 235 88 993 59 187 11 360 15 666
Edmonson County 02------------------ 11 595 50 818 19 381 9 407 13 693 887 7 450Elliott County 04---------------------- 6 533 25 683 10 775 4 876 9 449 128 454Estill County 06----------------------- 15 506 81 873 42 012 19 213 18 586 355 1 708Lexington~Fayette Count 06------------ 243 785 1 247 072 423 014 181 864 257 766 195 478 188 951Fleming County 04-------------------- 13 605 59 424 25 541 11 850 19 129 580 2 323
Floyd County 05---------------------- 43 266 244 339 121 754 51 076 54 713 9 371 7 425Franklin County 06-------------------- 46 588 954 226 165 490 50 533 709 627 3 432 25 144Fulton County 01---------------------- 7 451 55 394 23 265 16 376 11 279 2 364 2 109Gallatin County 04--------------------- 7 437 24 534 11 504 5 980 5 352 467 1 231Garrard County 06-------------------- 14 333 46 469 25 569 10 355 8 539 426 1 579
Grant County 04---------------------- 20 805 69 150 37 116 14 412 13 766 1 129 2 728Graves County 01--------------------- 36 254 176 411 85 362 50 217 29 943 2 475 8 414Grayson County 02-------------------- 23 828 106 845 50 690 25 958 25 958 1 148 3 090Green County 02---------------------- 10 595 47 422 23 973 12 571 9 421 320 1 136Greenup County 04-------------------- 36 732 155 532 94 678 34 911 20 694 2 062 3 187
Hancock County 02-------------------- 8 977 26 360 14 134 6 090 4 793 284 1 059Hardin County 02--------------------- 91 567 862 589 256 395 59 587 36 373 3 998 506 236Harlan County 05--------------------- 34 273 294 980 194 958 36 661 46 202 11 330 5 829Harrison County 06-------------------- 17 666 69 708 33 892 13 892 18 209 811 2 905Hart County 02------------------------ 16 864 68 949 32 254 16 529 18 074 441 1 650
See footnotes at end of table.
Consolidated Federal Funds Report for Fiscal Year 1999 43U.S. Census Bureau

Table 15. Federal Government Expenditure, by State and County Area: Fiscal Year 1999mCon.[Thousand dollars]
State and county area Congressionaldistrict
Federal government expenditure
United Statesresident
population1 TotalRetirement and
DisabilityOther Direct
Payments Grants ProcurementSalaries and
Wages
KentuckymCon.Henderson County 01------------------ 44 410 170 912 87 473 51 379 21 041 5 005 6 014Henry County 04---------------------- 15 023 53 276 25 210 14 363 10 405 625 2 672Hickman County 01-------------------- 5 146 27 817 9 444 11 463 5 792 185 933Hopkins County 01-------------------- 46 155 246 288 116 514 44 313 27 754 38 079 19 629Jackson County 05-------------------- 13 040 67 053 27 868 13 319 24 022 362 1 482
Jefferson County 02 03------------------- 672 900 3 831 243 1 414 410 713 289 527 125 809 917 366 503Jessamine County 06------------------ 37 300 109 067 56 005 19 558 22 194 7 598 3 712Johnson County 05-------------------- 23 999 126 592 61 642 24 620 36 324 753 3 254Kenton County 04--------------------- 147 221 608 932 263 904 111 934 86 016 13 870 133 207Knott County 05----------------------- 17 931 87 797 39 852 16 558 28 224 690 2 472
Knox County 05----------------------- 31 976 153 723 61 361 28 683 55 236 726 7 717Larue County 02---------------------- 13 150 54 631 29 060 14 137 8 929 466 2 039Laurel County 05---------------------- 52 015 214 891 99 616 33 793 52 522 12 980 15 980Lawrence County 04 05------------------- 15 800 78 688 37 280 14 940 22 432 1 842 2 193Lee County 05------------------------ 7 994 46 186 20 056 9 108 15 764 256 1 002
Leslie County 05---------------------- 13 558 78 654 35 784 14 669 25 369 929 1 903Letcher County 05--------------------- 26 069 149 397 72 843 28 708 42 885 1 110 3 852Lewis County 04---------------------- 13 471 59 696 27 114 12 114 19 167 270 1 031Lincoln County 02 06--------------------- 22 540 97 082 45 409 20 726 27 494 654 2 799Livingston County 01------------------ 9 481 59 428 23 726 12 871 5 704 13 766 3 361
Logan County 01---------------------- 26 276 117 672 51 212 38 715 22 879 1 562 3 304Lyon County 01----------------------- 8 060 33 127 19 490 8 047 3 850 242 1 497McCracken County 01----------------- 64 407 641 891 155 498 73 360 39 862 334 313 38 857McCreary County 05------------------- 16 754 235 386 41 839 18 808 25 507 145 299 3 933McLean County 01-------------------- 9 897 52 261 21 695 15 194 13 335 384 1 652
Madison County 06-------------------- 67 690 255 301 115 465 53 807 50 682 8 763 26 583Magoffin County 05-------------------- 14 036 70 514 28 838 13 908 26 125 408 1 235Marion County 02--------------------- 17 120 74 116 33 793 16 155 20 430 675 3 063Marshall County 01-------------------- 30 250 121 147 73 697 29 737 11 837 1 316 4 561Martin County 05---------------------- 11 901 67 194 35 326 11 052 18 681 1 156 979
Mason County 04--------------------- 16 825 84 097 31 980 17 183 31 178 554 3 202Meade County 02--------------------- 29 195 69 397 43 531 14 262 8 937 526 2 141Menifee County 05-------------------- 5 865 40 753 14 226 4 987 12 355 661 8 524Mercer County 06--------------------- 20 809 72 841 42 066 15 051 12 578 632 2 513Metcalfe County 02-------------------- 9 596 42 136 18 267 9 799 12 274 355 1 441
Monroe County 01--------------------- 11 157 69 780 26 110 17 512 23 488 441 2 229Montgomery County 06---------------- 21 636 94 539 43 971 18 350 28 195 597 3 425Morgan County 05--------------------- 13 660 62 340 25 764 11 783 22 658 567 1 568Muhlenberg County 01----------------- 31 968 226 740 83 203 33 018 21 595 59 499 29 425Nelson County 02--------------------- 36 971 108 460 56 990 25 972 18 347 2 132 5 019
Nicholas County 04 06-------------------- 7 126 30 457 14 905 7 117 6 950 213 1 271Ohio County 01----------------------- 22 128 92 898 50 707 22 706 14 513 1 047 3 925Oldham County 04-------------------- 45 821 67 341 36 293 16 458 9 647 1 112 3 832Owen County 04---------------------- 10 418 29 543 14 661 8 177 5 288 298 1 118Owsley County 05--------------------- 5 375 38 414 14 832 6 878 15 539 256 909
Pendleton County 04------------------ 13 959 46 493 22 525 9 736 12 296 432 1 504Perry County 05----------------------- 30 805 182 038 94 036 32 288 41 490 6 318 7 907Pike County 05----------------------- 71 526 422 657 200 322 66 114 130 642 11 365 14 214Powell County 06--------------------- 13 264 43 062 19 827 6 954 14 312 329 1 639Pulaski County 05--------------------- 57 110 259 973 138 762 44 088 64 410 2 874 9 839
Robertson County 04------------------ 2 265 8 877 3 979 2 581 2 020 57 240Rockcastle County 05------------------ 15 974 96 214 30 578 14 101 49 563 417 1 555Rowan County 04--------------------- 22 168 82 200 35 682 18 849 22 743 755 4 172Russell County 01--------------------- 16 182 86 288 39 703 16 419 26 596 993 2 576Scott County 06----------------------- 32 249 87 773 43 568 19 291 21 087 796 3 031
Shelby County 04--------------------- 30 552 91 277 46 217 19 381 15 658 5 763 4 258Simpson County 01-------------------- 16 587 61 564 27 651 20 369 11 423 455 1 667Spencer County 02-------------------- 10 441 27 630 14 592 6 666 4 308 738 1 325Taylor County 02---------------------- 22 942 99 294 51 617 25 515 16 163 1 544 4 455Todd County 01----------------------- 11 289 53 110 21 765 17 815 11 374 504 1 653
Trigg County 01----------------------- 12 593 64 998 34 760 15 142 7 779 1 203 6 112Trimble County 04--------------------- 7 926 24 534 13 511 6 366 3 614 227 816Union County 01---------------------- 16 499 ~89 632 32 908 22 582 8 773 ~156 451 2 556Warren County 02--------------------- 87 683 349 362 154 092 84 239 62 739 10 073 38 220Washington County 02----------------- 11 047 41 492 19 254 10 329 9 697 384 1 828
Wayne County 05--------------------- 19 190 93 921 37 524 19 960 34 071 384 1 982Webster County 01-------------------- 13 460 87 102 31 910 17 528 8 039 27 610 2 015Whitley County 05--------------------- 36 130 232 076 112 163 47 138 56 126 9 284 7 365Wolfe County 05---------------------- 7 507 44 483 17 636 7 680 17 104 554 1 510Woodford County 06------------------- 22 773 59 038 36 729 11 841 7 326 1 035 2 107State undistributed------------------ 1 030 257 2 225 866 394 161 639 – –
Louisiana --------------------------- 4 372 035 24 384 277 7 910 688 6 414 156 5 227 879 2 666 608 2 164 947Acadia Parish 07---------------------- 57 947 271 484 102 811 80 918 67 082 14 569 6 104Allen Parish 07------------------------ 24 218 144 911 42 339 34 025 26 607 3 347 38 594Ascension Parish 03 04------------------- 74 049 205 662 90 760 59 472 43 190 5 367 6 873Assumption Parish 03------------------ 23 242 90 704 36 961 26 494 24 297 464 2 487Avoyelles Parish 06------------------- 40 710 216 942 77 563 62 626 65 484 5 826 5 443
Beauregard Parish 07------------------ 32 265 132 568 69 757 30 644 24 869 1 026 6 271Bienville Parish 05--------------------- 15 739 88 775 35 874 24 120 24 957 1 284 2 541Bossier Parish 05--------------------- 93 374 681 797 257 049 76 406 58 357 45 012 244 972Caddo Parish 04 05---------------------- 241 502 1 166 045 476 500 286 134 244 222 45 415 113 773Calcasieu Parish 07------------------- 180 607 700 590 326 404 186 210 125 407 29 708 32 862
Caldwell Parish 05-------------------- 10 469 58 274 21 233 22 563 12 733 298 1 446Cameron Parish 07-------------------- 8 969 33 821 12 132 11 036 6 654 2 496 1 503Catahoula Parish 06------------------- 10 905 84 548 22 169 32 166 20 121 7 680 2 412Claiborne Parish 05------------------- 16 826 79 477 32 875 20 489 22 891 846 2 376Concordia Parish 06------------------- 20 572 123 625 41 376 39 447 33 452 5 936 3 413
See footnotes at end of table.
44 Consolidated Federal Funds Report for Fiscal Year 1999U.S. Census Bureau
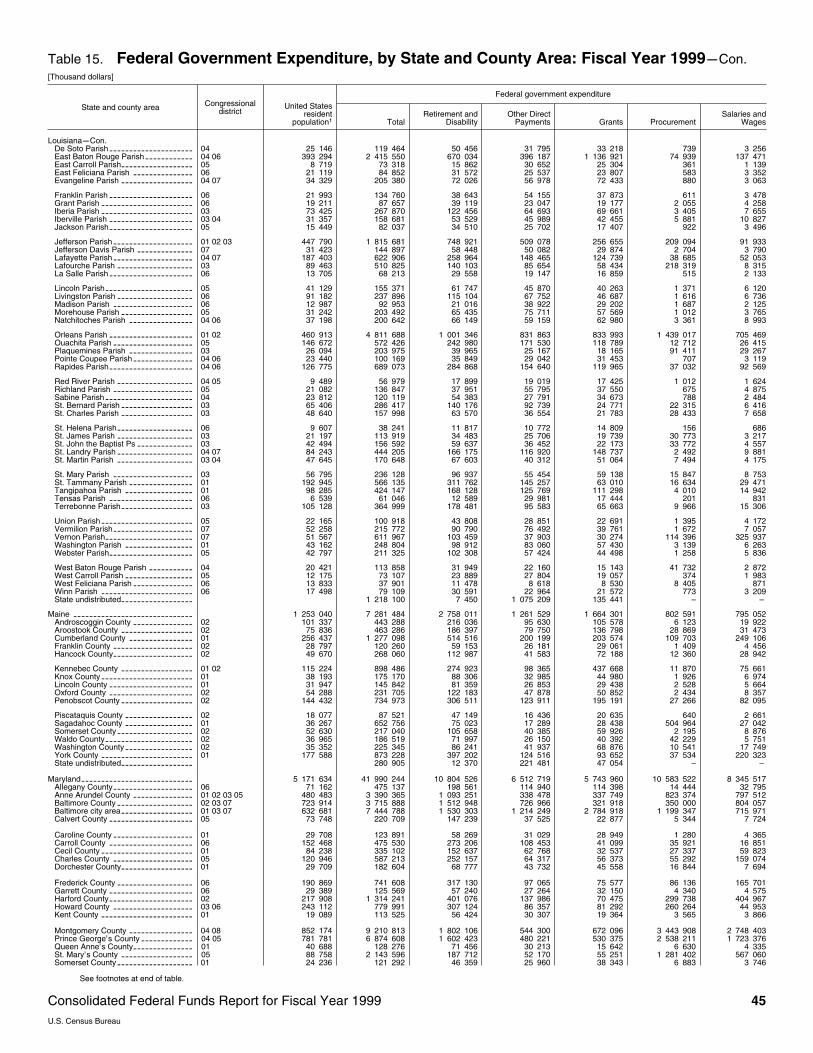
Table 15. Federal Government Expenditure, by State and County Area: Fiscal Year 1999mCon.[Thousand dollars]
State and county area Congressionaldistrict
Federal government expenditure
United Statesresident
population1 TotalRetirement and
DisabilityOther Direct
Payments Grants ProcurementSalaries and
Wages
LouisianamCon.De Soto Parish 04--------------------- 25 146 119 464 50 456 31 795 33 218 739 3 256East Baton Rouge Parish 04 06------------ 393 294 2 415 550 670 034 396 187 1 136 921 74 939 137 471East Carroll Parish 05------------------ 8 719 73 318 15 862 30 652 25 304 361 1 139East Feliciana Parish 06--------------- 21 119 84 852 31 572 25 537 23 807 583 3 352Evangeline Parish 04 07------------------ 34 329 205 380 72 026 56 978 72 433 880 3 063
Franklin Parish 06--------------------- 21 993 134 760 38 643 54 155 37 873 611 3 478Grant Parish 06----------------------- 19 211 87 657 39 119 23 047 19 177 2 055 4 258Iberia Parish 03----------------------- 73 425 267 870 122 456 64 693 69 661 3 405 7 655Iberville Parish 03 04--------------------- 31 357 158 681 53 529 45 989 42 455 5 881 10 827Jackson Parish 05--------------------- 15 449 82 037 34 510 25 702 17 407 922 3 496
Jefferson Parish 01 02 03-------------------- 447 790 1 815 681 748 921 509 078 256 655 209 094 91 933Jefferson Davis Parish 07-------------- 31 423 144 897 58 448 50 082 29 874 2 704 3 790Lafayette Parish 04 07-------------------- 187 403 622 906 258 964 148 465 124 739 38 685 52 053Lafourche Parish 03------------------- 89 463 510 825 140 103 85 654 58 434 218 319 8 315La Salle Parish 06--------------------- 13 705 68 213 29 558 19 147 16 859 515 2 133
Lincoln Parish 05---------------------- 41 129 155 371 61 747 45 870 40 263 1 371 6 120Livingston Parish 06------------------- 91 182 237 896 115 104 67 752 46 687 1 616 6 736Madison Parish 06-------------------- 12 987 92 953 21 016 38 922 29 202 1 687 2 125Morehouse Parish 05------------------ 31 242 203 492 65 435 75 711 57 569 1 012 3 765Natchitoches Parish 04 06---------------- 37 198 200 642 66 149 59 159 62 980 3 361 8 993
Orleans Parish 01 02--------------------- 460 913 4 811 688 1 001 346 831 863 833 993 1 439 017 705 469Ouachita Parish 05-------------------- 146 672 572 426 242 980 171 530 118 789 12 712 26 415Plaquemines Parish 03---------------- 26 094 203 975 39 965 25 167 18 165 91 411 29 267Pointe Coupee Parish 04 06--------------- 23 440 100 169 35 849 29 042 31 453 707 3 119Rapides Parish 04 06--------------------- 126 775 689 073 284 868 154 640 119 965 37 032 92 569
Red River Parish 04 05------------------- 9 489 56 979 17 899 19 019 17 425 1 012 1 624Richland Parish 05-------------------- 21 082 136 847 37 951 55 795 37 550 675 4 875Sabine Parish 04---------------------- 23 812 120 119 54 383 27 791 34 673 788 2 484St. Bernard Parish 03------------------ 65 406 286 417 140 176 92 739 24 771 22 315 6 416St. Charles Parish 03------------------ 48 640 157 998 63 570 36 554 21 783 28 433 7 658
St. Helena Parish 06------------------- 9 607 38 241 11 817 10 772 14 809 156 686St. James Parish 03------------------- 21 197 113 919 34 483 25 706 19 739 30 773 3 217St. John the Baptist Ps 03-------------- 42 494 156 592 59 637 36 452 22 173 33 772 4 557St. Landry Parish 04 07------------------- 84 243 444 205 166 175 116 920 148 737 2 492 9 881St. Martin Parish 03 04------------------- 47 645 170 648 67 603 40 312 51 064 7 494 4 175
St. Mary Parish 03-------------------- 56 795 236 128 96 937 55 454 59 138 15 847 8 753St. Tammany Parish 01---------------- 192 945 566 135 311 762 145 257 63 010 16 634 29 471Tangipahoa Parish 01----------------- 98 285 424 147 168 128 125 769 111 298 4 010 14 942Tensas Parish 06--------------------- 6 539 61 046 12 589 29 981 17 444 201 831Terrebonne Parish 03------------------ 105 128 364 999 178 481 95 583 65 663 9 966 15 306
Union Parish 05----------------------- 22 165 100 918 43 808 28 851 22 691 1 395 4 172Vermilion Parish 07-------------------- 52 258 215 772 90 790 76 492 39 761 1 672 7 057Vernon Parish 07---------------------- 51 567 611 967 103 459 37 903 30 274 114 396 325 937Washington Parish 01----------------- 43 162 248 804 98 912 83 060 57 430 3 139 6 263Webster Parish 05--------------------- 42 797 211 325 102 308 57 424 44 498 1 258 5 836
West Baton Rouge Parish 04----------- 20 421 113 858 31 949 22 160 15 143 41 732 2 872West Carroll Parish 05----------------- 12 175 73 107 23 889 27 804 19 057 374 1 983West Feliciana Parish 06--------------- 13 833 37 901 11 478 8 618 8 530 8 405 871Winn Parish 06----------------------- 17 498 79 109 30 591 22 964 21 572 773 3 209State undistributed------------------ 1 218 100 7 450 1 075 209 135 441 – –
Maine ------------------------------ 1 253 040 7 281 484 2 758 011 1 261 529 1 664 301 802 591 795 052Androscoggin County 02--------------- 101 337 443 288 216 036 95 630 105 578 6 123 19 922Aroostook County 02------------------ 75 836 463 286 186 397 79 750 136 798 28 869 31 473Cumberland County 01---------------- 256 437 1 277 098 514 516 200 199 203 574 109 703 249 106Franklin County 02-------------------- 28 797 120 260 59 153 26 181 29 061 1 409 4 456Hancock County 02-------------------- 49 670 268 060 112 987 41 583 72 188 12 360 28 942
Kennebec County 01 02------------------ 115 224 898 486 274 923 98 365 437 668 11 870 75 661Knox County 01----------------------- 38 193 175 170 88 306 32 985 44 980 1 926 6 974Lincoln County 01--------------------- 31 947 145 842 81 359 26 853 29 438 2 528 5 664Oxford County 02--------------------- 54 288 231 705 122 183 47 878 50 852 2 434 8 357Penobscot County 02------------------ 144 432 734 973 306 511 123 911 195 191 27 266 82 095
Piscataquis County 02----------------- 18 077 87 521 47 149 16 436 20 635 640 2 661Sagadahoc County 01----------------- 36 267 652 756 75 023 17 289 28 438 504 964 27 042Somerset County 02------------------- 52 630 217 040 105 658 40 385 59 926 2 195 8 876Waldo County 02---------------------- 36 965 186 519 71 997 26 150 40 392 42 229 5 751Washington County 02----------------- 35 352 225 345 86 241 41 937 68 876 10 541 17 749York County 01----------------------- 177 588 873 228 397 202 124 516 93 652 37 534 220 323State undistributed------------------ 280 905 12 370 221 481 47 054 – –
Maryland---------------------------- 5 171 634 41 990 244 10 804 526 6 512 719 5 743 960 10 583 522 8 345 517Allegany County 06-------------------- 71 162 475 137 198 561 114 940 114 398 14 444 32 795Anne Arundel County 01 02 03 05--------------- 480 483 3 390 365 1 093 251 338 478 337 749 823 374 797 512Baltimore County 02 03 07------------------- 723 914 3 715 888 1 512 948 726 966 321 918 350 000 804 057Baltimore city area 01 03 07------------------ 632 681 7 444 788 1 530 303 1 214 249 2 784 918 1 199 347 715 971Calvert County 05--------------------- 73 748 220 709 147 239 37 525 22 877 5 344 7 724
Caroline County 01-------------------- 29 708 123 891 58 269 31 029 28 949 1 280 4 365Carroll County 06--------------------- 152 468 475 530 273 206 108 453 41 099 35 921 16 851Cecil County 01----------------------- 84 238 335 102 152 637 62 768 32 537 27 337 59 823Charles County 05-------------------- 120 946 587 213 252 157 64 317 56 373 55 292 159 074Dorchester County 01------------------ 29 709 182 604 68 777 43 732 45 558 16 844 7 694
Frederick County 06------------------- 190 869 741 608 317 130 97 065 75 577 86 136 165 701Garrett County 06--------------------- 29 389 125 569 57 240 27 264 32 150 4 340 4 575Harford County 02--------------------- 217 908 1 314 241 401 076 137 986 70 475 299 738 404 967Howard County 03 06-------------------- 243 112 779 991 307 124 86 357 81 292 260 264 44 953Kent County 01----------------------- 19 089 113 525 56 424 30 307 19 364 3 565 3 866
Montgomery County 04 08---------------- 852 174 9 210 813 1 802 106 544 300 672 096 3 443 908 2 748 403Prince George’s County 04 05------------- 781 781 6 874 608 1 602 423 480 221 530 375 2 538 211 1 723 376Queen Anne’s County 01--------------- 40 688 128 276 71 456 30 213 15 642 6 630 4 335St. Mary’s County 05------------------ 88 758 2 143 596 187 712 52 170 55 251 1 281 402 567 060Somerset County 01------------------- 24 236 121 292 46 359 25 960 38 343 6 883 3 746
See footnotes at end of table.
Consolidated Federal Funds Report for Fiscal Year 1999 45U.S. Census Bureau
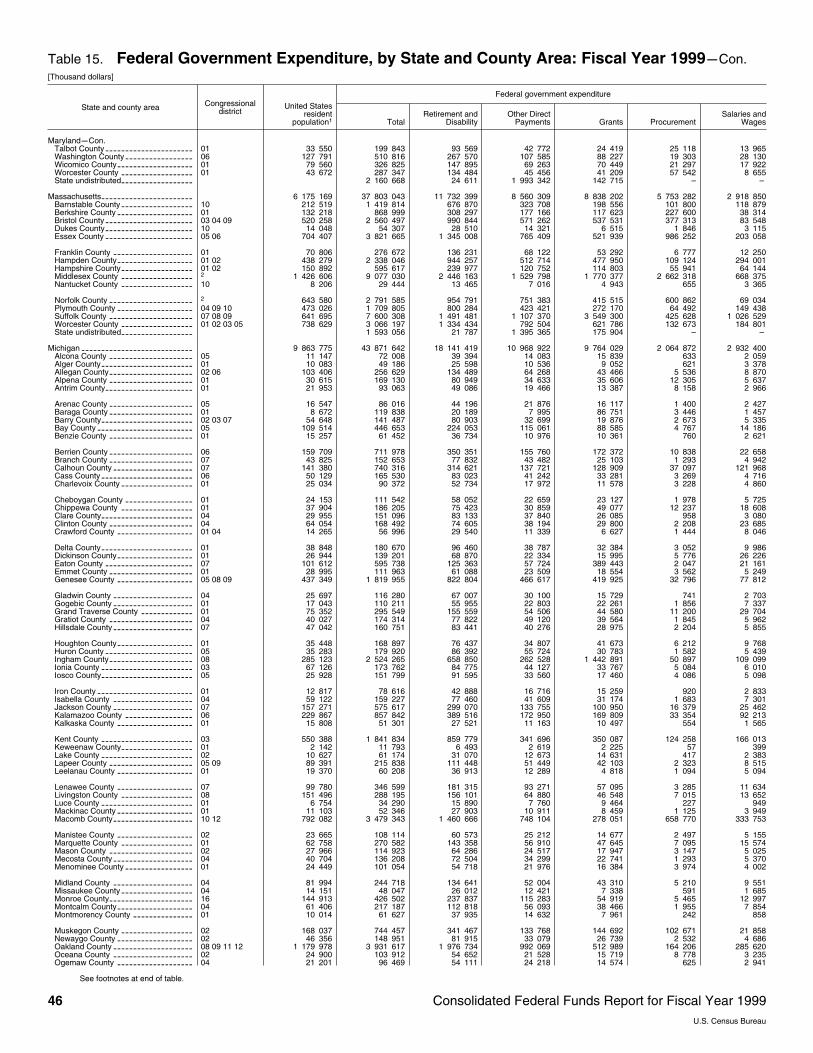
Table 15. Federal Government Expenditure, by State and County Area: Fiscal Year 1999mCon.[Thousand dollars]
State and county area Congressionaldistrict
Federal government expenditure
United Statesresident
population1 TotalRetirement and
DisabilityOther Direct
Payments Grants ProcurementSalaries and
Wages
MarylandmCon.Talbot County 01---------------------- 33 550 199 843 93 569 42 772 24 419 25 118 13 965Washington County 06----------------- 127 791 510 816 267 570 107 585 88 227 19 303 28 130Wicomico County 01------------------- 79 560 326 825 147 895 69 263 70 449 21 297 17 922Worcester County 01------------------ 43 672 287 347 134 484 45 456 41 209 57 542 8 655State undistributed------------------ 2 160 668 24 611 1 993 342 142 715 – –
Massachusetts----------------------- 6 175 169 37 803 043 11 732 399 8 560 309 8 838 202 5 753 282 2 918 850Barnstable County 10------------------ 212 519 1 419 814 676 870 323 708 198 556 101 800 118 879Berkshire County 01------------------- 132 218 868 999 308 297 177 166 117 623 227 600 38 314Bristol County 03 04 09---------------------- 520 258 2 560 497 990 844 571 262 537 531 377 313 83 548Dukes County 10---------------------- 14 048 54 307 28 510 14 321 6 515 1 846 3 115Essex County 05 06---------------------- 704 407 3 821 665 1 345 008 765 409 521 939 986 252 203 058
Franklin County 01-------------------- 70 806 276 672 136 231 68 122 53 292 6 777 12 250Hampden County 01 02------------------- 438 279 2 338 046 944 257 512 714 477 950 109 124 294 001Hampshire County 01 02------------------ 150 892 595 617 239 977 120 752 114 803 55 941 64 144Middlesex County 2
------------------ 1 426 606 9 077 030 2 446 163 1 529 798 1 770 377 2 662 318 668 375Nantucket County 10------------------ 8 206 29 444 13 465 7 016 4 943 655 3 365
Norfolk County 2--------------------- 643 580 2 791 585 954 791 751 383 415 515 600 862 69 034
Plymouth County 04 09 10------------------- 473 026 1 709 805 800 284 423 421 272 170 64 492 149 438Suffolk County 07 08 09--------------------- 641 695 7 600 308 1 491 481 1 107 370 3 549 300 425 628 1 026 529Worcester County 01 02 03 05------------------ 738 629 3 066 197 1 334 434 792 504 621 786 132 673 184 801State undistributed------------------ 1 593 056 21 787 1 395 365 175 904 – –
Michigan ---------------------------- 9 863 775 43 871 642 18 141 419 10 968 922 9 764 029 2 064 872 2 932 400Alcona County 05--------------------- 11 147 72 008 39 394 14 083 15 839 633 2 059Alger County 01----------------------- 10 083 49 186 25 598 10 536 9 052 621 3 378Allegan County 02 06--------------------- 103 406 256 629 134 489 64 268 43 466 5 536 8 870Alpena County 01--------------------- 30 615 169 130 80 949 34 633 35 606 12 305 5 637Antrim County 01---------------------- 21 953 93 063 49 086 19 466 13 387 8 158 2 966
Arenac County 05--------------------- 16 547 86 016 44 196 21 876 16 117 1 400 2 427Baraga County 01--------------------- 8 672 119 838 20 189 7 995 86 751 3 446 1 457Barry County 02 03 07----------------------- 54 648 141 487 80 903 32 699 19 876 2 673 5 335Bay County 05------------------------ 109 514 446 653 224 053 115 061 88 585 4 767 14 186Benzie County 01--------------------- 15 257 61 452 36 734 10 976 10 361 760 2 621
Berrien County 06--------------------- 159 709 711 978 350 351 155 760 172 372 10 838 22 658Branch County 07--------------------- 43 825 152 653 77 832 43 482 25 103 1 293 4 942Calhoun County 07-------------------- 141 380 740 316 314 621 137 721 128 909 37 097 121 968Cass County 06----------------------- 50 129 165 530 83 023 41 242 33 281 3 269 4 716Charlevoix County 01------------------ 25 034 90 372 52 734 17 972 11 578 3 228 4 860
Cheboygan County 01----------------- 24 153 111 542 58 052 22 659 23 127 1 978 5 725Chippewa County 01------------------ 37 904 186 205 75 423 30 859 49 077 12 237 18 608Clare County 04----------------------- 29 955 151 096 83 133 37 840 26 085 958 3 080Clinton County 04--------------------- 64 054 168 492 74 605 38 194 29 800 2 208 23 685Crawford County 01 04------------------- 14 265 56 996 29 540 11 339 6 627 1 444 8 046
Delta County 01----------------------- 38 848 180 670 96 460 38 787 32 384 3 052 9 986Dickinson County 01------------------- 26 944 139 201 68 870 22 334 15 995 5 776 26 226Eaton County 07---------------------- 101 612 595 738 125 363 57 724 389 443 2 047 21 161Emmet County 01--------------------- 28 995 111 963 61 088 23 509 18 554 3 562 5 249Genesee County 05 08 09------------------- 437 349 1 819 955 822 804 466 617 419 925 32 796 77 812
Gladwin County 04-------------------- 25 697 116 280 67 007 30 100 15 729 741 2 703Gogebic County 01-------------------- 17 043 110 211 55 955 22 803 22 261 1 856 7 337Grand Traverse County 01------------- 75 352 295 549 155 559 54 506 44 580 11 200 29 704Gratiot County 04--------------------- 40 027 174 314 77 822 49 120 39 564 1 845 5 962Hillsdale County 07-------------------- 47 042 160 751 83 441 40 276 28 975 2 204 5 855
Houghton County 01------------------- 35 448 168 897 76 437 34 807 41 673 6 212 9 768Huron County 05---------------------- 35 283 179 920 86 392 55 724 30 783 1 582 5 439Ingham County 08--------------------- 285 123 2 524 265 658 850 262 528 1 442 891 50 897 109 099Ionia County 03----------------------- 67 126 173 762 84 775 44 127 33 767 5 084 6 010Iosco County 05----------------------- 25 928 151 799 91 595 33 560 17 460 4 086 5 098
Iron County 01------------------------ 12 817 78 616 42 888 16 716 15 259 920 2 833Isabella County 04-------------------- 59 122 159 227 77 460 41 609 31 174 1 683 7 301Jackson County 07-------------------- 157 271 575 617 299 070 133 755 100 950 16 379 25 462Kalamazoo County 06----------------- 229 867 857 842 389 516 172 950 169 809 33 354 92 213Kalkaska County 01------------------- 15 808 51 301 27 521 11 163 10 497 554 1 565
Kent County 03----------------------- 550 388 1 841 834 859 779 341 696 350 087 124 258 166 013Keweenaw County 01------------------ 2 142 11 793 6 493 2 619 2 225 57 399Lake County 02----------------------- 10 627 61 174 31 070 12 673 14 631 417 2 383Lapeer County 05 09--------------------- 89 391 215 838 111 448 51 449 42 103 2 323 8 515Leelanau County 01------------------- 19 370 60 208 36 913 12 289 4 818 1 094 5 094
Lenawee County 07------------------- 99 780 346 599 181 315 93 271 57 095 3 285 11 634Livingston County 08------------------ 151 496 288 195 156 101 64 880 46 548 7 015 13 652Luce County 01----------------------- 6 754 34 290 15 890 7 760 9 464 227 949Mackinac County 01------------------- 11 103 52 346 27 903 10 911 8 459 1 125 3 949Macomb County 10 12-------------------- 792 082 3 479 343 1 460 666 748 104 278 051 658 770 333 753
Manistee County 02------------------- 23 665 108 114 60 573 25 212 14 677 2 497 5 155Marquette County 01------------------ 62 758 270 582 143 358 56 910 47 645 7 095 15 574Mason County 02--------------------- 27 966 114 923 64 286 24 517 17 947 3 147 5 025Mecosta County 04-------------------- 40 704 136 208 72 504 34 299 22 741 1 293 5 370Menominee County 01----------------- 24 449 101 054 54 718 21 976 16 384 3 974 4 002
Midland County 04-------------------- 81 994 244 718 134 641 52 004 43 310 5 210 9 551Missaukee County 04------------------ 14 151 48 047 26 012 12 421 7 338 591 1 685Monroe County 16--------------------- 144 913 426 502 237 837 115 283 54 919 5 465 12 997Montcalm County 04------------------- 61 406 217 187 112 818 56 093 38 466 1 955 7 854Montmorency County 01--------------- 10 014 61 627 37 935 14 632 7 961 242 858
Muskegon County 02------------------ 168 037 744 457 341 467 133 768 144 692 102 671 21 858Newaygo County 02------------------- 46 356 148 951 81 915 33 079 26 739 2 532 4 686Oakland County 08 09 11 12-------------------- 1 179 978 3 931 617 1 976 734 992 069 512 989 164 206 285 620Oceana County 02-------------------- 24 900 103 912 54 652 21 528 15 719 8 778 3 235Ogemaw County 04------------------- 21 201 96 469 54 111 24 218 14 574 625 2 941
See footnotes at end of table.
46 Consolidated Federal Funds Report for Fiscal Year 1999U.S. Census Bureau
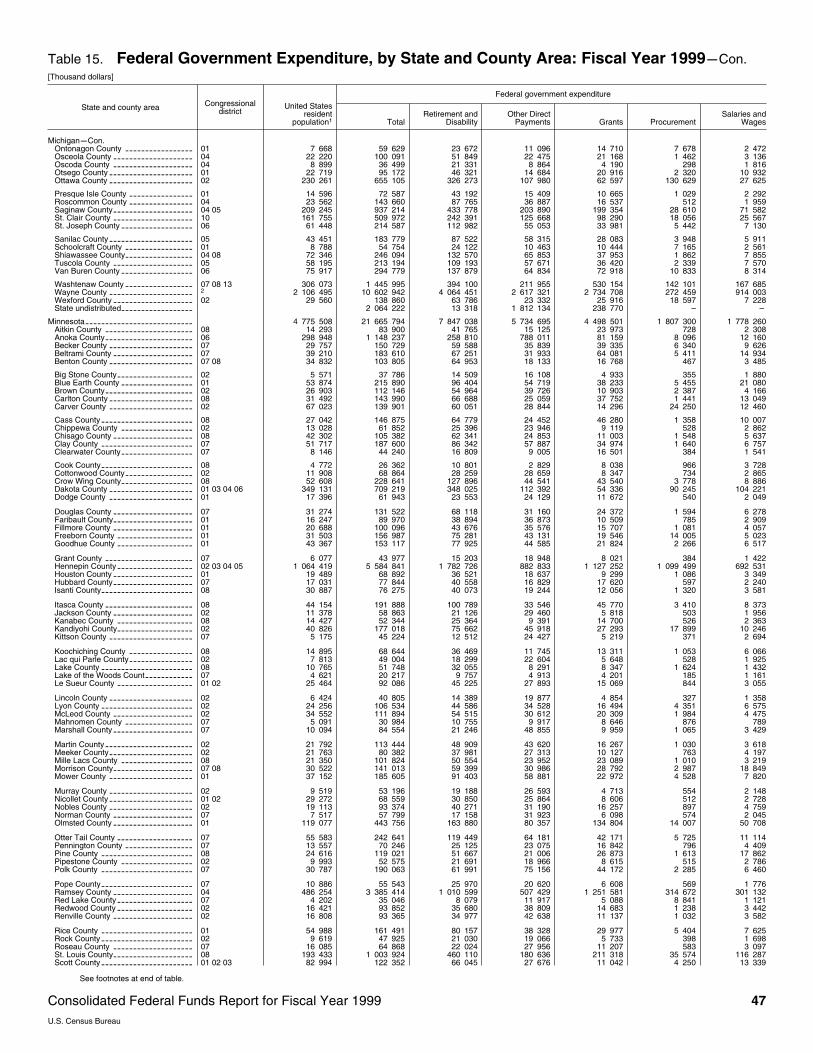
Table 15. Federal Government Expenditure, by State and County Area: Fiscal Year 1999mCon.[Thousand dollars]
State and county area Congressionaldistrict
Federal government expenditure
United Statesresident
population1 TotalRetirement and
DisabilityOther Direct
Payments Grants ProcurementSalaries and
Wages
MichiganmCon.Ontonagon County 01----------------- 7 668 59 629 23 672 11 096 14 710 7 678 2 472Osceola County 04-------------------- 22 220 100 091 51 849 22 475 21 168 1 462 3 136Oscoda County 04-------------------- 8 899 36 499 21 331 8 864 4 190 298 1 816Otsego County 01--------------------- 22 719 95 172 46 321 14 684 20 916 2 320 10 932Ottawa County 02--------------------- 230 261 655 105 326 273 107 980 62 597 130 629 27 625
Presque Isle County 01---------------- 14 596 72 587 43 192 15 409 10 665 1 029 2 292Roscommon County 04---------------- 23 562 143 660 87 765 36 887 16 537 512 1 959Saginaw County 04 05-------------------- 209 245 937 214 433 778 203 890 199 354 28 610 71 582St. Clair County 10-------------------- 161 755 509 972 242 391 125 668 98 290 18 056 25 567St. Joseph County 06------------------ 61 448 214 587 112 982 55 053 33 981 5 442 7 130
Sanilac County 05--------------------- 43 451 183 779 87 522 58 315 28 083 3 948 5 911Schoolcraft County 01----------------- 8 788 54 754 24 122 10 463 10 444 7 165 2 561Shiawassee County 04 08----------------- 72 346 246 094 132 570 65 853 37 953 1 862 7 855Tuscola County 05-------------------- 58 195 213 194 109 193 57 671 36 420 2 339 7 570Van Buren County 06------------------ 75 917 294 779 137 879 64 834 72 918 10 833 8 314
Washtenaw County 07 08 13----------------- 306 073 1 445 995 394 100 211 955 530 154 142 101 167 685Wayne County 2
--------------------- 2 106 495 10 602 942 4 064 451 2 617 321 2 734 708 272 459 914 003Wexford County 02-------------------- 29 560 138 860 63 786 23 332 25 916 18 597 7 228State undistributed------------------ 2 064 222 13 318 1 812 134 238 770 – –
Minnesota--------------------------- 4 775 508 21 665 794 7 847 038 5 734 695 4 498 501 1 807 300 1 778 260Aitkin County 08---------------------- 14 293 83 900 41 765 15 125 23 973 728 2 308Anoka County 06---------------------- 298 948 1 148 237 258 810 788 011 81 159 8 096 12 160Becker County 07--------------------- 29 757 150 729 59 588 35 839 39 335 6 340 9 626Beltrami County 07-------------------- 39 210 183 610 67 251 31 933 64 081 5 411 14 934Benton County 07 08--------------------- 34 832 103 805 64 953 18 133 16 768 467 3 485
Big Stone County 02------------------- 5 571 37 786 14 509 16 108 4 933 355 1 880Blue Earth County 01------------------ 53 874 215 890 96 404 54 719 38 233 5 455 21 080Brown County 02---------------------- 26 903 112 146 54 964 39 726 10 903 2 387 4 166Carlton County 08--------------------- 31 492 143 990 66 688 25 059 37 752 1 441 13 049Carver County 02--------------------- 67 023 139 901 60 051 28 844 14 296 24 250 12 460
Cass County 08----------------------- 27 042 146 875 64 779 24 452 46 280 1 358 10 007Chippewa County 02------------------ 13 028 61 852 25 396 23 946 9 119 528 2 862Chisago County 08-------------------- 42 302 105 382 62 341 24 853 11 003 1 548 5 637Clay County 07----------------------- 51 717 187 600 86 342 57 887 34 974 1 640 6 757Clearwater County 07------------------ 8 146 44 240 16 809 9 005 16 501 384 1 541
Cook County 08----------------------- 4 772 26 362 10 801 2 829 8 038 966 3 728Cottonwood County 02----------------- 11 908 68 864 28 259 28 659 8 347 734 2 865Crow Wing County 08------------------ 52 608 228 641 127 896 44 541 43 540 3 778 8 886Dakota County 01 03 04 06--------------------- 349 131 709 219 348 025 112 392 54 336 90 245 104 221Dodge County 01--------------------- 17 396 61 943 23 553 24 129 11 672 540 2 049
Douglas County 07-------------------- 31 274 131 522 68 118 31 160 24 372 1 594 6 278Faribault County 01-------------------- 16 247 89 970 38 894 36 873 10 509 785 2 909Fillmore County 01-------------------- 20 688 100 096 43 676 35 576 15 707 1 081 4 057Freeborn County 01------------------- 31 503 156 987 75 281 43 131 19 546 14 005 5 023Goodhue County 01------------------- 43 367 153 117 77 925 44 585 21 824 2 266 6 517
Grant County 07---------------------- 6 077 43 977 15 203 18 948 8 021 384 1 422Hennepin County 02 03 04 05------------------- 1 064 419 5 584 841 1 782 726 882 833 1 127 252 1 099 499 692 531Houston County 01-------------------- 19 489 68 892 36 521 18 637 9 299 1 086 3 349Hubbard County 07-------------------- 17 031 77 844 40 558 16 829 17 620 597 2 240Isanti County 08----------------------- 30 887 76 275 40 073 19 244 12 056 1 320 3 581
Itasca County 08---------------------- 44 154 191 888 100 789 33 546 45 770 3 410 8 373Jackson County 02-------------------- 11 378 58 863 21 126 29 460 5 818 503 1 956Kanabec County 08------------------- 14 427 52 344 25 364 9 391 14 700 526 2 363Kandiyohi County 02------------------- 40 826 177 018 75 662 45 918 27 293 17 899 10 246Kittson County 07--------------------- 5 175 45 224 12 512 24 427 5 219 371 2 694
Koochiching County 08---------------- 14 895 68 644 36 469 11 745 13 311 1 053 6 066Lac qui Parle County 02---------------- 7 813 49 004 18 299 22 604 5 648 528 1 925Lake County 08----------------------- 10 765 51 748 32 055 8 291 8 347 1 624 1 432Lake of the Woods Count 07------------ 4 621 20 217 9 757 4 913 4 201 185 1 161Le Sueur County 01 02------------------- 25 464 92 086 45 225 27 893 15 069 844 3 055
Lincoln County 02--------------------- 6 424 40 805 14 389 19 877 4 854 327 1 358Lyon County 02----------------------- 24 256 106 534 44 586 34 528 16 494 4 351 6 575McLeod County 02-------------------- 34 552 111 894 54 515 30 612 20 309 1 984 4 475Mahnomen County 07----------------- 5 091 30 984 10 755 9 917 8 646 876 789Marshall County 07-------------------- 10 094 84 554 21 246 48 855 9 959 1 065 3 429
Martin County 02---------------------- 21 792 113 444 48 909 43 620 16 267 1 030 3 618Meeker County 02--------------------- 21 763 80 382 37 981 27 313 10 127 763 4 197Mille Lacs County 08------------------ 21 350 101 824 50 554 23 952 23 089 1 010 3 219Morrison County 07 08-------------------- 30 522 141 013 59 399 30 986 28 792 2 987 18 849Mower County 01--------------------- 37 152 185 605 91 403 58 881 22 972 4 528 7 820
Murray County 02--------------------- 9 519 53 196 19 188 26 593 4 713 554 2 148Nicollet County 01 02--------------------- 29 272 68 559 30 850 25 864 8 606 512 2 728Nobles County 02--------------------- 19 113 93 374 40 271 31 190 16 257 897 4 759Norman County 07-------------------- 7 517 57 799 17 158 31 923 6 098 574 2 045Olmsted County 01-------------------- 119 077 443 756 163 880 80 357 134 804 14 007 50 708
Otter Tail County 07------------------- 55 583 242 641 119 449 64 181 42 171 5 725 11 114Pennington County 07----------------- 13 557 70 246 25 125 23 075 16 842 796 4 409Pine County 08----------------------- 24 616 119 021 51 667 21 006 26 873 1 613 17 862Pipestone County 02------------------ 9 993 52 575 21 691 18 966 8 615 515 2 786Polk County 07----------------------- 30 787 190 063 61 991 75 156 44 172 2 285 6 460
Pope County 07----------------------- 10 886 55 543 25 970 20 620 6 608 569 1 776Ramsey County 04-------------------- 486 254 3 385 414 1 010 599 507 429 1 251 581 314 672 301 132Red Lake County 07------------------- 4 202 35 046 8 079 11 917 5 088 8 841 1 121Redwood County 02------------------- 16 421 93 852 35 680 38 809 14 683 1 238 3 442Renville County 02-------------------- 16 808 93 365 34 977 42 638 11 137 1 032 3 582
Rice County 01----------------------- 54 988 161 491 80 157 38 328 29 977 5 404 7 625Rock County 02----------------------- 9 619 47 925 21 030 19 066 5 733 398 1 698Roseau County 07-------------------- 16 085 64 868 22 024 27 956 11 207 583 3 097St. Louis County 08-------------------- 193 433 1 003 924 460 110 180 636 211 318 35 574 116 287Scott County 01 02 03----------------------- 82 994 122 352 66 045 27 676 11 042 4 250 13 339
See footnotes at end of table.
Consolidated Federal Funds Report for Fiscal Year 1999 47U.S. Census Bureau

Table 15. Federal Government Expenditure, by State and County Area: Fiscal Year 1999mCon.[Thousand dollars]
State and county area Congressionaldistrict
Federal government expenditure
United Statesresident
population1 TotalRetirement and
DisabilityOther Direct
Payments Grants ProcurementSalaries and
Wages
MinnesotamCon.Sherburne County 07 08------------------ 63 356 108 044 58 850 20 030 17 485 1 857 9 822Sibley County 02---------------------- 14 774 61 893 24 645 26 735 7 617 559 2 337Stearns County 02 07-------------------- 130 081 441 945 184 491 91 876 74 584 24 879 66 115Steele County 01---------------------- 32 061 107 452 52 057 32 896 11 780 6 599 4 120Stevens County 07-------------------- 9 973 61 117 17 819 26 972 11 651 660 4 015
Swift County 02----------------------- 11 344 63 350 23 317 26 574 8 350 2 245 2 863Todd County 07----------------------- 24 240 102 406 44 041 24 827 28 536 912 4 090Traverse County 07------------------- 4 168 33 344 10 708 18 139 3 093 301 1 102Wabasha County 01------------------- 21 140 92 756 40 432 25 282 9 794 13 984 3 264Wadena County 07-------------------- 13 238 66 663 31 605 15 052 16 670 672 2 663
Waseca County 01-------------------- 18 560 86 277 31 163 26 267 8 475 5 490 14 881Washington County 06----------------- 202 606 260 877 151 842 53 523 32 354 7 594 15 563Watonwan County 02------------------ 11 548 59 409 25 079 22 407 3 428 5 949 2 545Wilkin County 07---------------------- 7 287 40 268 13 838 19 796 4 792 429 1 414Winona County 01--------------------- 47 785 156 793 79 750 41 740 22 444 5 539 7 320
Wright County 02 03---------------------- 87 864 187 148 103 340 46 721 24 045 2 728 10 313Yellow Medicine County 02------------- 11 310 71 856 25 094 31 137 11 401 1 728 2 497State undistributed------------------ 960 615 3 874 770 598 186 143 – –
Mississippi -------------------------- 2 768 619 16 487 905 5 656 227 3 806 501 3 387 313 1 939 318 1 698 546Adams County 04--------------------- 33 657 174 971 80 967 40 050 38 434 9 380 6 140Alcorn County 01---------------------- 33 080 148 671 77 465 37 253 27 222 2 040 4 691Amite County 04---------------------- 13 906 58 293 27 882 14 467 12 562 811 2 571Attala County 02 03---------------------- 18 338 99 979 46 787 25 296 23 705 1 168 3 023Benton County 01--------------------- 8 091 38 546 16 491 9 752 10 679 528 1 095
Bolivar County 02--------------------- 39 826 239 284 77 394 73 612 82 162 1 201 4 915Calhoun County 01-------------------- 14 891 74 526 33 201 22 282 15 224 1 102 2 716Carroll County 02--------------------- 9 967 43 672 17 300 11 966 12 258 1 024 1 124Chickasaw County 01------------------ 18 121 88 540 42 114 23 396 19 332 748 2 949Choctaw County 01-------------------- 9 366 36 538 16 227 8 112 9 554 619 2 026
Claiborne County 02------------------- 11 596 48 684 21 176 12 351 13 170 877 1 110Clarke County 03---------------------- 18 445 72 190 38 118 16 304 15 358 485 1 925Clay County 03----------------------- 21 657 94 666 40 816 22 085 20 589 6 552 4 623Coahoma County 02------------------- 31 094 188 553 62 084 66 214 54 311 1 178 4 767Copiah County 04--------------------- 28 892 150 707 65 091 33 495 27 992 20 083 4 046
Covington County 04------------------ 17 889 84 925 41 102 17 933 22 404 488 2 998Desoto County 01--------------------- 102 131 246 571 149 467 55 983 30 463 3 296 7 363Forrest County 05--------------------- 74 927 376 689 162 882 84 235 67 877 18 732 42 963Franklin County 04-------------------- 8 160 48 589 18 618 8 614 18 621 618 2 117George County 05--------------------- 20 185 73 653 41 638 20 416 8 681 552 2 366
Greene County 05--------------------- 12 630 37 427 17 948 10 295 7 955 371 858Grenada County 01 02-------------------- 22 450 113 640 49 135 32 950 18 631 2 527 10 396Hancock County 05-------------------- 41 518 473 834 91 880 38 231 17 183 206 376 120 164Harrison County 05-------------------- 178 567 1 578 134 483 771 195 329 89 706 235 579 573 749Hinds County 02 04---------------------- 245 737 1 913 853 514 825 250 331 865 656 57 230 225 811
Holmes County 02--------------------- 21 562 151 153 46 081 46 812 47 133 8 060 3 068Humphreys County 02----------------- 11 214 76 436 20 863 29 285 22 316 2 499 1 474Issaquena County 02------------------ 1 635 14 224 2 120 7 651 2 944 1 206 303Itawamba County 01------------------- 21 085 72 871 34 238 19 776 15 093 1 235 2 530Jackson County 05-------------------- 133 120 1 439 499 276 061 126 841 68 870 865 917 101 810
Jasper County 03--------------------- 18 110 77 820 38 499 16 594 19 196 501 3 030Jefferson County 02------------------- 8 385 58 791 18 080 15 614 23 492 345 1 260Jefferson Davis County 04-------------- 13 770 61 166 25 858 14 426 19 258 295 1 328Jones County 03 04---------------------- 63 054 275 793 146 042 68 768 46 945 2 522 11 515Kemper County 03-------------------- 10 487 48 715 20 373 11 573 14 586 355 1 827
Lafayette County 01------------------- 34 914 126 770 47 318 21 533 35 280 7 482 15 157Lamar County 05---------------------- 38 127 89 295 48 691 23 122 14 311 597 2 574Lauderdale County 03----------------- 75 978 435 071 183 539 80 576 60 084 15 932 94 940Lawrence County 04------------------- 13 066 69 192 37 215 16 766 11 176 569 3 466Leake County 02 03---------------------- 19 602 98 936 44 834 26 971 22 558 647 3 925
Lee County 01------------------------ 75 211 281 497 144 128 60 703 41 539 6 492 28 635Leflore County 02--------------------- 36 816 212 300 70 253 73 521 53 645 5 230 9 650Lincoln County 04--------------------- 32 105 124 602 64 835 27 937 25 358 1 022 5 450Lowndes County 03------------------- 60 527 345 685 120 724 46 040 43 666 61 415 73 840Madison County 02 03-------------------- 74 562 428 274 109 252 71 749 55 763 181 972 9 538
Marion County 04--------------------- 26 538 131 045 59 686 31 014 29 403 7 604 3 337Marshall County 01-------------------- 32 323 152 827 62 251 32 399 52 082 1 604 4 491Monroe County 01--------------------- 38 230 171 159 74 668 42 008 46 941 2 031 5 511Montgomery County 01 02---------------- 12 394 76 932 29 138 18 157 24 996 698 3 943Neshoba County 03------------------- 27 639 120 840 49 252 26 612 39 212 603 5 162
Newton County 03--------------------- 21 741 113 494 55 395 32 287 20 500 711 4 602Noxubee County 03------------------- 12 497 65 945 24 525 15 873 21 838 1 822 1 886Oktibbeha County 01 03------------------ 39 765 203 039 63 996 31 866 81 756 9 251 16 169Panola County 01 02--------------------- 33 913 151 999 66 884 39 244 37 222 2 930 5 719Pearl River County 05----------------- 47 969 200 822 102 222 51 433 19 361 22 522 5 283
Perry County 05----------------------- 12 039 42 257 20 911 10 658 8 920 353 1 415Pike County 04----------------------- 37 910 184 359 88 359 49 015 37 485 2 057 7 444Pontotoc County 01------------------- 25 685 85 135 43 196 22 402 15 626 877 3 034Prentiss County 01-------------------- 24 497 101 196 52 647 26 117 19 199 497 2 734Quitman County 02-------------------- 9 780 67 733 21 885 23 948 20 182 341 1 377
Rankin County 03--------------------- 112 348 291 367 165 636 58 733 34 910 3 051 29 037Scott County 03----------------------- 24 911 124 132 53 381 29 540 32 440 795 7 978Sharkey County 02-------------------- 6 543 42 831 12 093 18 858 9 859 476 1 546Simpson County 04-------------------- 25 375 112 930 51 629 25 503 32 243 679 2 875Smith County 03---------------------- 15 431 62 334 31 054 12 149 15 906 479 2 746
Stone County 05---------------------- 13 488 70 179 35 288 18 523 11 742 887 3 739Sunflower County 02------------------ 33 257 152 735 48 150 57 994 41 757 803 4 031Tallahatchie County 01 02----------------- 14 587 95 107 27 905 32 704 26 823 5 071 2 604Tate County 01----------------------- 24 417 91 946 42 517 24 936 19 638 1 148 3 707Tippah County 01--------------------- 21 069 97 187 47 641 25 116 19 785 1 371 3 273
See footnotes at end of table.
48 Consolidated Federal Funds Report for Fiscal Year 1999U.S. Census Bureau
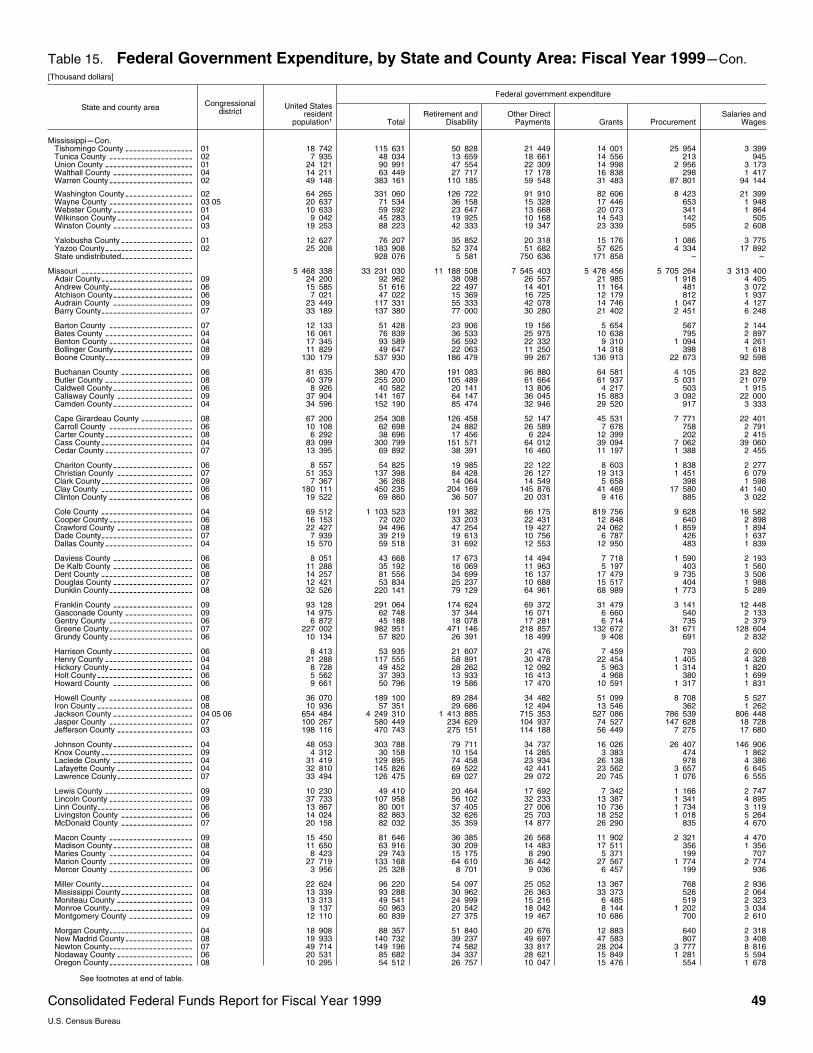
Table 15. Federal Government Expenditure, by State and County Area: Fiscal Year 1999mCon.[Thousand dollars]
State and county area Congressionaldistrict
Federal government expenditure
United Statesresident
population1 TotalRetirement and
DisabilityOther Direct
Payments Grants ProcurementSalaries and
Wages
MississippimCon.Tishomingo County 01----------------- 18 742 115 631 50 828 21 449 14 001 25 954 3 399Tunica County 02--------------------- 7 935 48 034 13 659 18 661 14 556 213 945Union County 01---------------------- 24 121 90 991 47 554 22 309 14 998 2 956 3 173Walthall County 04-------------------- 14 211 63 449 27 717 17 178 16 838 298 1 417Warren County 02--------------------- 49 148 383 161 110 185 59 548 31 483 87 801 94 144
Washington County 02----------------- 64 265 331 060 126 722 91 910 82 606 8 423 21 399Wayne County 03 05--------------------- 20 637 71 534 36 158 15 328 17 446 653 1 948Webster County 01-------------------- 10 633 59 592 23 647 13 668 20 073 341 1 864Wilkinson County 04------------------- 9 042 45 283 19 925 10 168 14 543 142 505Winston County 03-------------------- 19 253 88 223 42 333 19 347 23 339 595 2 608
Yalobusha County 01------------------ 12 627 76 207 35 852 20 318 15 176 1 086 3 775Yazoo County 02---------------------- 25 208 183 908 52 374 51 682 57 625 4 334 17 892State undistributed------------------ 928 076 5 581 750 636 171 858 – –
Missouri ---------------------------- 5 468 338 33 231 030 11 188 508 7 545 403 5 478 456 5 705 264 3 313 400Adair County 09----------------------- 24 200 92 962 38 098 26 557 21 985 1 918 4 405Andrew County 06--------------------- 15 585 51 616 22 497 14 401 11 164 481 3 072Atchison County 06-------------------- 7 021 47 022 15 369 16 725 12 179 812 1 937Audrain County 09-------------------- 23 449 117 331 55 333 42 078 14 746 1 047 4 127Barry County 07----------------------- 33 189 137 380 77 000 30 280 21 402 2 451 6 248
Barton County 07--------------------- 12 133 51 428 23 906 19 156 5 654 567 2 144Bates County 04---------------------- 16 061 76 839 36 533 25 975 10 638 795 2 897Benton County 04--------------------- 17 345 93 589 56 592 22 332 9 310 1 094 4 261Bollinger County 08-------------------- 11 829 49 647 22 063 11 250 14 318 398 1 618Boone County 09---------------------- 130 179 537 930 186 479 99 267 136 913 22 673 92 598
Buchanan County 06------------------ 81 635 380 470 191 083 96 880 64 581 4 105 23 822Butler County 08---------------------- 40 379 255 200 105 489 61 664 61 937 5 031 21 079Caldwell County 06-------------------- 8 926 40 582 20 141 13 806 4 217 503 1 915Callaway County 09------------------- 37 904 141 167 64 147 36 045 15 883 3 092 22 000Camden County 04-------------------- 34 596 152 190 85 474 32 946 29 520 917 3 333
Cape Girardeau County 08------------- 67 200 254 308 126 458 52 147 45 531 7 771 22 401Carroll County 06--------------------- 10 108 62 698 24 882 26 589 7 678 758 2 791Carter County 08---------------------- 6 292 38 696 17 456 6 224 12 399 202 2 415Cass County 04----------------------- 83 099 300 799 151 571 64 012 39 094 7 062 39 060Cedar County 07---------------------- 13 395 69 892 38 391 16 460 11 197 1 388 2 455
Chariton County 06-------------------- 8 557 54 825 19 985 22 122 8 603 1 838 2 277Christian County 07------------------- 51 353 137 398 84 428 26 127 19 313 1 451 6 079Clark County 09----------------------- 7 367 36 268 14 064 14 549 5 658 398 1 598Clay County 06----------------------- 180 111 450 235 204 169 145 876 41 469 17 580 41 140Clinton County 06--------------------- 19 522 69 860 36 507 20 031 9 416 885 3 022
Cole County 04----------------------- 69 512 1 103 523 191 382 66 175 819 756 9 628 16 582Cooper County 06--------------------- 16 153 72 020 33 203 22 431 12 848 640 2 898Crawford County 08------------------- 22 427 94 496 47 254 19 427 24 062 1 859 1 894Dade County 07----------------------- 7 939 39 219 19 613 10 756 6 787 426 1 637Dallas County 04---------------------- 15 570 59 518 31 692 12 553 12 950 483 1 839
Daviess County 06-------------------- 8 051 43 668 17 673 14 494 7 718 1 590 2 193De Kalb County 06-------------------- 11 288 35 192 16 069 11 963 5 197 403 1 560Dent County 08----------------------- 14 257 81 556 34 699 16 137 17 479 9 735 3 506Douglas County 07-------------------- 12 421 53 834 25 237 10 688 15 517 404 1 988Dunklin County 08--------------------- 32 526 220 141 79 129 64 961 68 989 1 773 5 289
Franklin County 09-------------------- 93 128 291 064 174 624 69 372 31 479 3 141 12 448Gasconade County 09----------------- 14 975 62 748 37 344 16 071 6 660 540 2 133Gentry County 06--------------------- 6 872 45 188 18 078 17 281 6 714 735 2 379Greene County 07--------------------- 227 002 982 951 471 146 218 857 132 672 31 671 128 604Grundy County 06--------------------- 10 134 57 820 26 391 18 499 9 408 691 2 832
Harrison County 06-------------------- 8 413 53 935 21 607 21 476 7 459 793 2 600Henry County 04---------------------- 21 288 117 555 58 891 30 478 22 454 1 405 4 328Hickory County 04--------------------- 8 728 49 452 28 262 12 092 5 963 1 314 1 820Holt County 06------------------------ 5 562 37 393 13 933 16 413 4 968 380 1 699Howard County 06-------------------- 9 661 50 796 19 586 17 470 10 591 1 317 1 831
Howell County 08--------------------- 36 070 189 100 89 284 34 482 51 099 8 708 5 527Iron County 08------------------------ 10 936 57 351 29 686 12 494 13 546 362 1 262Jackson County 04 05 06-------------------- 654 484 4 249 310 1 413 885 715 353 527 086 786 539 806 448Jasper County 07--------------------- 100 267 580 449 234 629 104 937 74 527 147 628 18 728Jefferson County 03------------------- 198 116 470 743 275 151 114 188 56 449 7 275 17 680
Johnson County 04-------------------- 48 053 303 788 79 711 34 737 16 026 26 407 146 906Knox County 09----------------------- 4 312 30 158 10 154 14 285 3 383 474 1 862Laclede County 04-------------------- 31 419 129 895 74 458 23 934 26 138 978 4 386Lafayette County 04------------------- 32 810 145 826 69 522 42 441 23 562 3 657 6 645Lawrence County 07------------------- 33 494 126 475 69 027 29 072 20 745 1 076 6 555
Lewis County 09---------------------- 10 230 49 410 20 464 17 692 7 342 1 166 2 747Lincoln County 09--------------------- 37 733 107 958 56 102 32 233 13 387 1 341 4 895Linn County 06------------------------ 13 867 80 001 37 405 27 006 10 736 1 734 3 119Livingston County 06------------------ 14 024 82 863 32 626 25 703 18 252 1 018 5 264McDonald County 07------------------ 20 158 82 032 35 359 14 877 26 290 835 4 670
Macon County 09--------------------- 15 450 81 646 36 385 26 568 11 902 2 321 4 470Madison County 08-------------------- 11 650 63 916 30 209 14 483 17 511 356 1 356Maries County 04--------------------- 8 423 29 743 15 175 8 290 5 371 199 707Marion County 09--------------------- 27 719 133 168 64 610 36 442 27 567 1 774 2 774Mercer County 06--------------------- 3 956 25 328 8 701 9 036 6 457 199 936
Miller County 04----------------------- 22 624 96 220 54 097 25 052 13 367 768 2 936Mississippi County 08------------------ 13 339 93 288 30 962 26 363 33 373 526 2 064Moniteau County 04------------------- 13 313 49 541 24 999 15 216 6 485 519 2 323Monroe County 09--------------------- 9 137 50 963 20 542 18 042 8 144 1 202 3 034Montgomery County 09---------------- 12 110 60 839 27 375 19 467 10 686 700 2 610
Morgan County 04--------------------- 18 908 88 357 51 840 20 676 12 883 640 2 318New Madrid County 08----------------- 19 933 140 732 39 237 49 697 47 583 807 3 408Newton County 07--------------------- 49 714 149 196 74 582 33 817 28 204 3 777 8 816Nodaway County 06------------------- 20 531 85 682 34 337 28 621 15 849 1 281 5 594Oregon County 08--------------------- 10 295 54 512 26 757 10 047 15 476 554 1 678
See footnotes at end of table.
Consolidated Federal Funds Report for Fiscal Year 1999 49U.S. Census Bureau
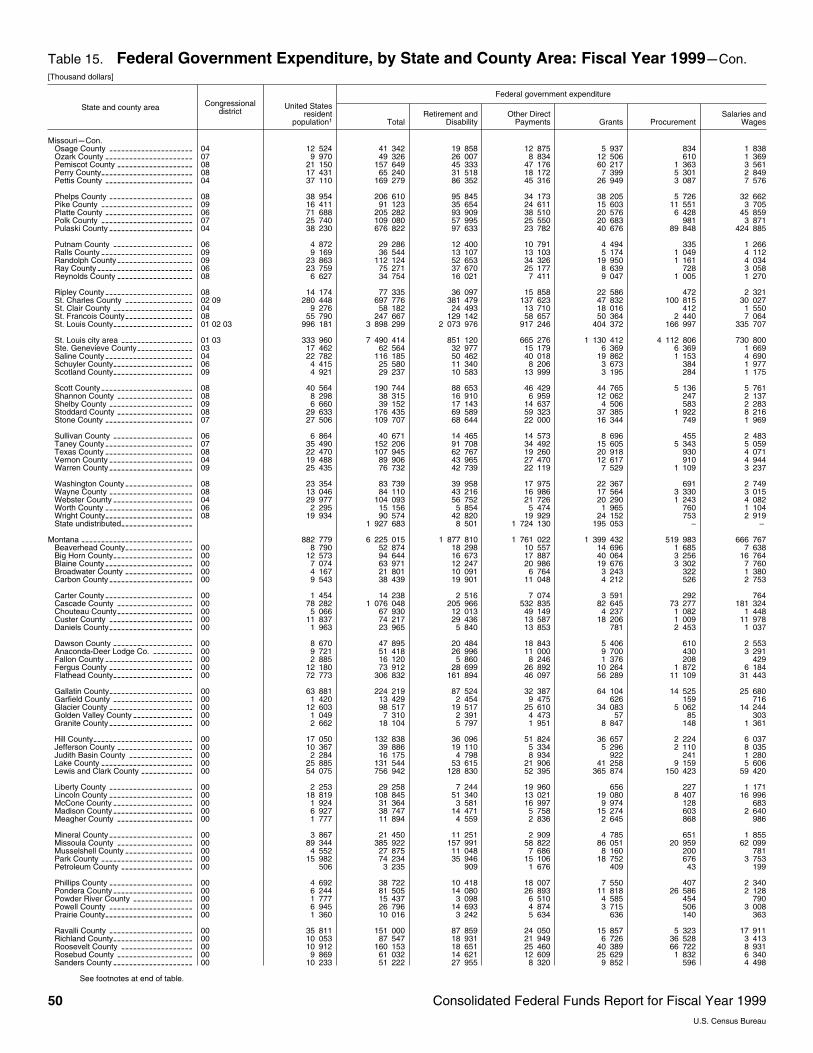
Table 15. Federal Government Expenditure, by State and County Area: Fiscal Year 1999mCon.[Thousand dollars]
State and county area Congressionaldistrict
Federal government expenditure
United Statesresident
population1 TotalRetirement and
DisabilityOther Direct
Payments Grants ProcurementSalaries and
Wages
MissourimCon.Osage County 04--------------------- 12 524 41 342 19 858 12 875 5 937 834 1 838Ozark County 07---------------------- 9 970 49 326 26 007 8 834 12 506 610 1 369Pemiscot County 08------------------- 21 150 157 649 45 333 47 176 60 217 1 363 3 561Perry County 08----------------------- 17 431 65 240 31 518 18 172 7 399 5 301 2 849Pettis County 04---------------------- 37 110 169 279 86 352 45 316 26 949 3 087 7 576
Phelps County 08--------------------- 38 954 206 610 95 845 34 173 38 205 5 726 32 662Pike County 09----------------------- 16 411 91 123 35 654 24 611 15 603 11 551 3 705Platte County 06---------------------- 71 688 205 282 93 909 38 510 20 576 6 428 45 859Polk County 07----------------------- 25 740 109 080 57 995 25 550 20 683 981 3 871Pulaski County 04--------------------- 38 230 676 822 97 633 23 782 40 676 89 848 424 885
Putnam County 06-------------------- 4 872 29 286 12 400 10 791 4 494 335 1 266Ralls County 09----------------------- 9 169 36 544 13 107 13 103 5 174 1 049 4 112Randolph County 09------------------- 23 863 112 124 52 653 34 326 19 950 1 161 4 034Ray County 06------------------------ 23 759 75 271 37 670 25 177 8 639 728 3 058Reynolds County 08------------------- 6 627 34 754 16 021 7 411 9 047 1 005 1 270
Ripley County 08---------------------- 14 174 77 335 36 097 15 858 22 586 472 2 321St. Charles County 02 09----------------- 280 448 697 776 381 479 137 623 47 832 100 815 30 027St. Clair County 04-------------------- 9 276 58 182 24 493 13 710 18 016 412 1 550St. Francois County 08----------------- 55 790 247 667 129 142 58 657 50 364 2 440 7 064St. Louis County 01 02 03-------------------- 996 181 3 898 299 2 073 976 917 246 404 372 166 997 335 707
St. Louis city area 01 03------------------ 333 960 7 490 414 851 120 665 276 1 130 412 4 112 806 730 800Ste. Genevieve County 03-------------- 17 462 62 564 32 977 15 179 6 369 6 369 1 669Saline County 04---------------------- 22 782 116 185 50 462 40 018 19 862 1 153 4 690Schuyler County 06-------------------- 4 415 25 580 11 340 8 206 3 673 384 1 977Scotland County 09-------------------- 4 921 29 237 10 583 13 999 3 195 284 1 175
Scott County 08----------------------- 40 564 190 744 88 653 46 429 44 765 5 136 5 761Shannon County 08------------------- 8 298 38 315 16 910 6 959 12 062 247 2 137Shelby County 09--------------------- 6 660 39 152 17 143 14 637 4 506 583 2 283Stoddard County 08------------------- 29 633 176 435 69 589 59 323 37 385 1 922 8 216Stone County 07---------------------- 27 506 109 707 68 644 22 000 16 344 749 1 969
Sullivan County 06-------------------- 6 864 40 671 14 465 14 573 8 696 455 2 483Taney County 07---------------------- 35 490 152 206 91 708 34 492 15 605 5 343 5 059Texas County 08---------------------- 22 470 107 945 62 767 19 260 20 918 930 4 071Vernon County 04--------------------- 19 488 89 906 43 965 27 470 12 617 910 4 944Warren County 09--------------------- 25 435 76 732 42 739 22 119 7 529 1 109 3 237
Washington County 08----------------- 23 354 83 739 39 958 17 975 22 367 691 2 749Wayne County 08--------------------- 13 046 84 110 43 216 16 986 17 564 3 330 3 015Webster County 04-------------------- 29 977 104 093 56 752 21 726 20 290 1 243 4 082Worth County 06---------------------- 2 295 15 156 5 854 5 474 1 965 760 1 104Wright County 08---------------------- 19 934 90 574 42 820 19 929 24 152 753 2 919State undistributed------------------ 1 927 683 8 501 1 724 130 195 053 – –
Montana ---------------------------- 882 779 6 225 015 1 877 810 1 761 022 1 399 432 519 983 666 767Beaverhead County 00----------------- 8 790 52 874 18 298 10 557 14 696 1 685 7 638Big Horn County 00-------------------- 12 573 94 644 16 673 17 887 40 064 3 256 16 764Blaine County 00---------------------- 7 074 63 971 12 247 20 986 19 676 3 302 7 760Broadwater County 00----------------- 4 167 21 801 10 091 6 764 3 243 322 1 380Carbon County 00--------------------- 9 543 38 439 19 901 11 048 4 212 526 2 753
Carter County 00---------------------- 1 454 14 238 2 516 7 074 3 591 292 764Cascade County 00------------------- 78 282 1 076 048 205 966 532 835 82 645 73 277 181 324Chouteau County 00------------------- 5 066 67 930 12 013 49 149 4 237 1 082 1 448Custer County 00--------------------- 11 837 74 217 29 436 13 587 18 206 1 009 11 978Daniels County 00--------------------- 1 963 23 965 5 840 13 853 781 2 453 1 037
Dawson County 00-------------------- 8 670 47 895 20 484 18 843 5 406 610 2 553Anaconda~Deer Lodge Co. 00---------- 9 721 51 418 26 996 11 000 9 700 430 3 291Fallon County 00---------------------- 2 885 16 120 5 860 8 246 1 376 208 429Fergus County 00--------------------- 12 180 73 912 28 699 26 892 10 264 1 872 6 184Flathead County 00-------------------- 72 773 306 832 161 894 46 097 56 289 11 109 31 443
Gallatin County 00--------------------- 63 881 224 219 87 524 32 387 64 104 14 525 25 680Garfield County 00-------------------- 1 420 13 429 2 454 9 475 626 159 716Glacier County 00--------------------- 12 603 98 517 19 517 25 610 34 083 5 062 14 244Golden Valley County 00--------------- 1 049 7 310 2 391 4 473 57 85 303Granite County 00--------------------- 2 662 18 104 5 797 1 951 8 847 148 1 361
Hill County 00------------------------- 17 050 132 838 36 096 51 824 36 657 2 224 6 037Jefferson County 00------------------- 10 367 39 886 19 110 5 334 5 296 2 110 8 035Judith Basin County 00---------------- 2 284 16 175 4 798 8 934 922 241 1 280Lake County 00----------------------- 25 885 131 544 53 615 21 906 41 258 9 159 5 606Lewis and Clark County 00------------- 54 075 756 942 128 830 52 395 365 874 150 423 59 420
Liberty County 00--------------------- 2 253 29 258 7 244 19 960 656 227 1 171Lincoln County 00--------------------- 18 819 108 845 51 340 13 021 19 080 8 407 16 996McCone County 00-------------------- 1 924 31 364 3 581 16 997 9 974 128 683Madison County 00-------------------- 6 927 38 747 14 471 5 758 15 274 603 2 640Meagher County 00------------------- 1 777 11 894 4 559 2 836 2 645 868 986
Mineral County 00--------------------- 3 867 21 450 11 251 2 909 4 785 651 1 855Missoula County 00------------------- 89 344 385 922 157 991 58 822 86 051 20 959 62 099Musselshell County 00----------------- 4 552 27 875 11 048 7 686 8 160 200 781Park County 00----------------------- 15 982 74 234 35 946 15 106 18 752 676 3 753Petroleum County 00------------------ 506 3 235 909 1 676 409 43 199
Phillips County 00--------------------- 4 692 38 722 10 418 18 007 7 550 407 2 340Pondera County 00-------------------- 6 244 81 505 14 080 26 893 11 818 26 586 2 128Powder River County 00--------------- 1 777 15 437 3 098 6 510 4 585 454 790Powell County 00--------------------- 6 945 26 796 14 693 4 874 3 715 506 3 008Prairie County 00---------------------- 1 360 10 016 3 242 5 634 636 140 363
Ravalli County 00--------------------- 35 811 151 000 87 859 24 050 15 857 5 323 17 911Richland County 00-------------------- 10 053 87 547 18 931 21 949 6 726 36 528 3 413Roosevelt County 00------------------ 10 912 160 153 18 651 25 460 40 389 66 722 8 931Rosebud County 00------------------- 9 869 61 032 14 621 12 609 25 629 1 832 6 340Sanders County 00-------------------- 10 233 51 222 27 955 8 320 9 852 596 4 498
See footnotes at end of table.
50 Consolidated Federal Funds Report for Fiscal Year 1999U.S. Census Bureau
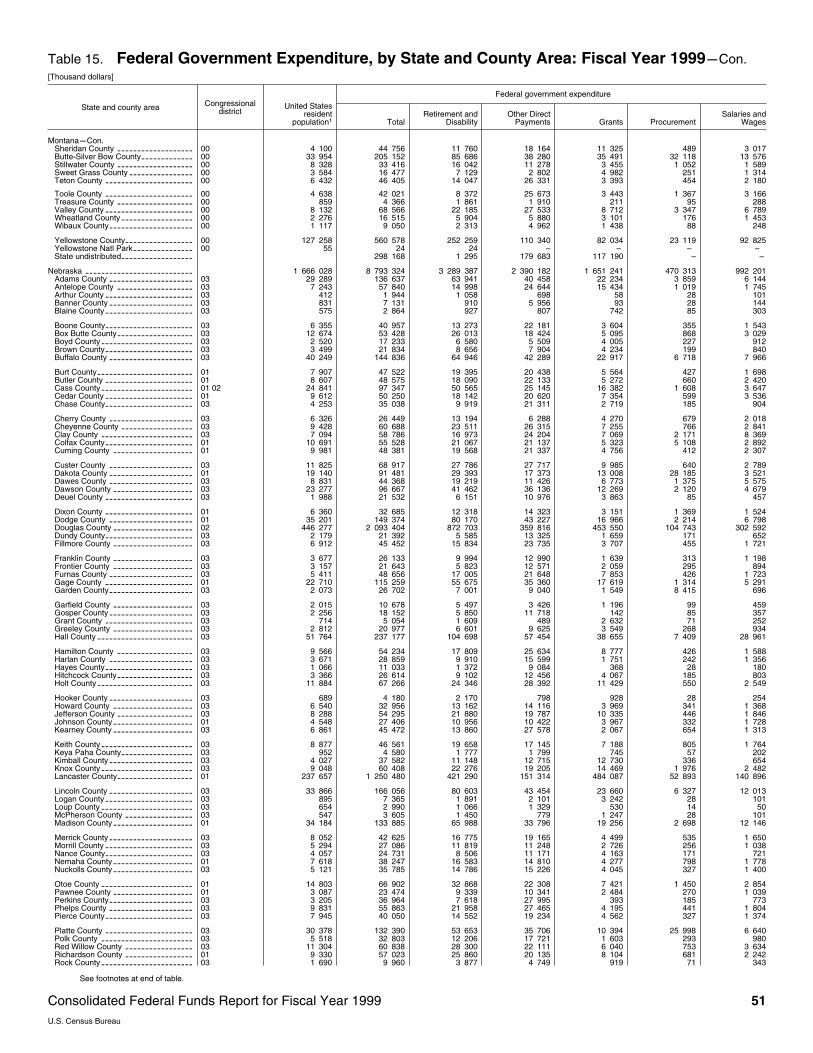
Table 15. Federal Government Expenditure, by State and County Area: Fiscal Year 1999mCon.[Thousand dollars]
State and county area Congressionaldistrict
Federal government expenditure
United Statesresident
population1 TotalRetirement and
DisabilityOther Direct
Payments Grants ProcurementSalaries and
Wages
MontanamCon.Sheridan County 00------------------- 4 100 44 756 11 760 18 164 11 325 489 3 017Butte~Silver Bow County 00------------- 33 954 205 152 85 686 38 280 35 491 32 118 13 576Stillwater County 00------------------- 8 328 33 416 16 042 11 278 3 455 1 052 1 589Sweet Grass County 00---------------- 3 584 16 477 7 129 2 802 4 982 251 1 314Teton County 00---------------------- 6 432 46 405 14 047 26 331 3 393 454 2 180
Toole County 00---------------------- 4 638 42 021 8 372 25 673 3 443 1 367 3 166Treasure County 00------------------- 859 4 366 1 861 1 910 211 95 288Valley County 00---------------------- 8 132 68 566 22 185 27 533 8 712 3 347 6 789Wheatland County 00------------------ 2 276 16 515 5 904 5 880 3 101 176 1 453Wibaux County 00--------------------- 1 117 9 050 2 313 4 962 1 438 88 248
Yellowstone County 00----------------- 127 258 560 578 252 259 110 340 82 034 23 119 92 825Yellowstone Natl Park 00--------------- 55 24 24 – – – –State undistributed------------------ 298 168 1 295 179 683 117 190 – –
Nebraska --------------------------- 1 666 028 8 793 324 3 289 387 2 390 182 1 651 241 470 313 992 201Adams County 03--------------------- 29 289 136 637 63 941 40 458 22 234 3 859 6 144Antelope County 03------------------- 7 243 57 840 14 998 24 644 15 434 1 019 1 745Arthur County 03---------------------- 412 1 944 1 058 698 58 28 101Banner County 03--------------------- 831 7 131 910 5 956 93 28 144Blaine County 03---------------------- 575 2 864 927 807 742 85 303
Boone County 03---------------------- 6 355 40 957 13 273 22 181 3 604 355 1 543Box Butte County 03------------------- 12 674 53 428 26 013 18 424 5 095 868 3 029Boyd County 03----------------------- 2 520 17 233 6 580 5 509 4 005 227 912Brown County 03---------------------- 3 499 21 834 8 656 7 904 4 234 199 840Buffalo County 03--------------------- 40 249 144 836 64 946 42 289 22 917 6 718 7 966
Burt County 01------------------------ 7 907 47 522 19 395 20 438 5 564 427 1 698Butler County 01---------------------- 8 607 48 575 18 090 22 133 5 272 660 2 420Cass County 01 02----------------------- 24 841 97 347 50 565 25 145 16 382 1 608 3 647Cedar County 01---------------------- 9 612 50 250 18 142 20 620 7 354 599 3 536Chase County 03---------------------- 4 253 35 038 9 919 21 311 2 719 185 904
Cherry County 03--------------------- 6 326 26 449 13 194 6 288 4 270 679 2 018Cheyenne County 03------------------ 9 428 60 688 23 511 26 315 7 255 766 2 841Clay County 03----------------------- 7 094 58 786 16 973 24 204 7 069 2 171 8 369Colfax County 01---------------------- 10 691 55 528 21 067 21 137 5 323 5 108 2 892Cuming County 01-------------------- 9 981 48 381 19 568 21 337 4 756 412 2 307
Custer County 03--------------------- 11 825 68 917 27 786 27 717 9 985 640 2 789Dakota County 01--------------------- 19 140 91 481 29 393 17 373 13 008 28 185 3 521Dawes County 03--------------------- 8 831 44 368 19 219 11 426 6 773 1 375 5 575Dawson County 03-------------------- 23 277 96 667 41 462 36 136 12 269 2 120 4 679Deuel County 03---------------------- 1 988 21 532 6 151 10 976 3 863 85 457
Dixon County 01---------------------- 6 360 32 685 12 318 14 323 3 151 1 369 1 524Dodge County 01--------------------- 35 201 149 374 80 170 43 227 16 966 2 214 6 798Douglas County 02-------------------- 446 277 2 093 404 872 703 359 816 453 550 104 743 302 592Dundy County 03---------------------- 2 179 21 392 5 585 13 325 1 659 171 652Fillmore County 03-------------------- 6 912 45 452 15 834 23 735 3 707 455 1 721
Franklin County 03-------------------- 3 677 26 133 9 994 12 990 1 639 313 1 198Frontier County 03-------------------- 3 157 21 643 5 823 12 571 2 059 295 894Furnas County 03--------------------- 5 411 48 656 17 005 21 648 7 853 426 1 723Gage County 01---------------------- 22 710 115 259 55 675 35 360 17 619 1 314 5 291Garden County 03--------------------- 2 073 26 702 7 001 9 040 1 549 8 415 696
Garfield County 03-------------------- 2 015 10 678 5 497 3 426 1 196 99 459Gosper County 03--------------------- 2 256 18 152 5 850 11 718 142 85 357Grant County 03---------------------- 714 5 054 1 609 489 2 632 71 252Greeley County 03-------------------- 2 812 20 977 6 601 9 625 3 549 268 934Hall County 03------------------------ 51 764 237 177 104 698 57 454 38 655 7 409 28 961
Hamilton County 03------------------- 9 566 54 234 17 809 25 634 8 777 426 1 588Harlan County 03--------------------- 3 671 28 859 9 910 15 599 1 751 242 1 356Hayes County 03---------------------- 1 066 11 033 1 372 9 084 368 28 180Hitchcock County 03------------------- 3 366 26 614 9 102 12 456 4 067 185 803Holt County 03------------------------ 11 884 67 266 24 346 28 392 11 429 550 2 549
Hooker County 03--------------------- 689 4 180 2 170 798 928 28 254Howard County 03-------------------- 6 540 32 956 13 162 14 116 3 969 341 1 368Jefferson County 03------------------- 8 288 54 295 21 880 19 787 10 335 446 1 846Johnson County 01-------------------- 4 548 27 406 10 956 10 422 3 967 332 1 728Kearney County 03-------------------- 6 861 45 472 13 860 27 578 2 067 654 1 313
Keith County 03----------------------- 8 877 46 561 19 658 17 145 7 188 805 1 764Keya Paha County 03------------------ 952 4 580 1 777 1 799 745 57 202Kimball County 03--------------------- 4 027 37 582 11 148 12 715 12 730 336 654Knox County 03----------------------- 9 048 60 408 22 276 19 205 14 469 1 976 2 482Lancaster County 01------------------- 237 657 1 250 480 421 290 151 314 484 087 52 893 140 896
Lincoln County 03--------------------- 33 866 166 056 80 603 43 454 23 660 6 327 12 013Logan County 03---------------------- 895 7 365 1 891 2 101 3 242 28 101Loup County 03----------------------- 654 2 990 1 066 1 329 530 14 50McPherson County 03----------------- 547 3 605 1 450 779 1 247 28 101Madison County 01-------------------- 34 184 133 885 65 988 33 796 19 256 2 698 12 146
Merrick County 03--------------------- 8 052 42 625 16 775 19 165 4 499 535 1 650Morrill County 03---------------------- 5 294 27 086 11 819 11 248 2 726 256 1 038Nance County 03---------------------- 4 057 24 731 8 506 11 171 4 163 171 721Nemaha County 01-------------------- 7 618 38 247 16 583 14 810 4 277 798 1 778Nuckolls County 03-------------------- 5 121 35 785 14 786 15 226 4 045 327 1 400
Otoe County 01----------------------- 14 803 66 902 32 868 22 308 7 421 1 450 2 854Pawnee County 01-------------------- 3 087 23 474 9 339 10 341 2 484 270 1 039Perkins County 03--------------------- 3 205 36 964 7 618 27 995 393 185 773Phelps County 03--------------------- 9 831 55 863 21 958 27 465 4 195 441 1 804Pierce County 03---------------------- 7 945 40 050 14 552 19 234 4 562 327 1 374
Platte County 03---------------------- 30 378 132 390 53 653 35 706 10 394 25 998 6 640Polk County 03----------------------- 5 518 32 803 12 206 17 721 1 603 293 980Red Willow County 03----------------- 11 304 60 838 28 300 22 111 6 040 753 3 634Richardson County 01----------------- 9 330 57 023 25 860 20 135 8 104 681 2 242Rock County 03----------------------- 1 690 9 960 3 877 4 749 919 71 343
See footnotes at end of table.
Consolidated Federal Funds Report for Fiscal Year 1999 51U.S. Census Bureau
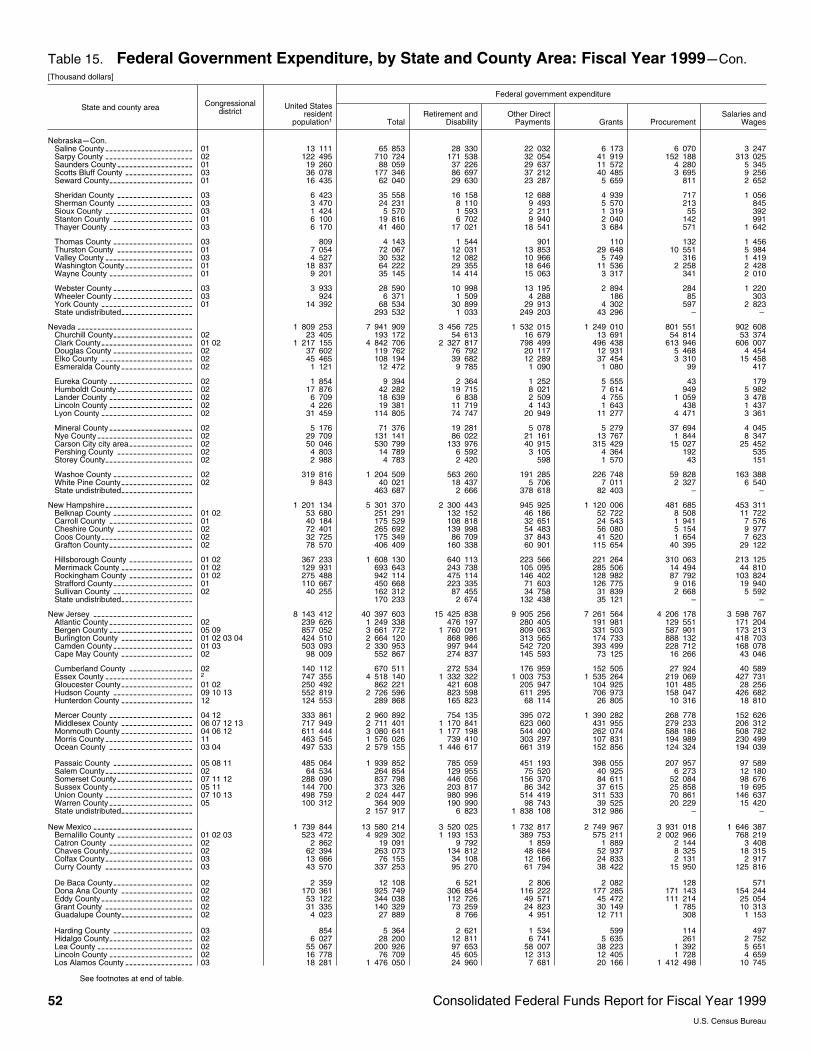
Table 15. Federal Government Expenditure, by State and County Area: Fiscal Year 1999mCon.[Thousand dollars]
State and county area Congressionaldistrict
Federal government expenditure
United Statesresident
population1 TotalRetirement and
DisabilityOther Direct
Payments Grants ProcurementSalaries and
Wages
NebraskamCon.Saline County 01---------------------- 13 111 65 853 28 330 22 032 6 173 6 070 3 247Sarpy County 02---------------------- 122 495 710 724 171 538 32 054 41 919 152 188 313 025Saunders County 01------------------- 19 260 88 059 37 226 29 637 11 572 4 280 5 345Scotts Bluff County 03----------------- 36 078 177 346 86 697 37 212 40 485 3 695 9 256Seward County 01--------------------- 16 435 62 040 29 630 23 287 5 659 811 2 652
Sheridan County 03------------------- 6 423 35 558 16 158 12 688 4 939 717 1 056Sherman County 03------------------- 3 470 24 231 8 110 9 493 5 570 213 845Sioux County 03---------------------- 1 424 5 570 1 593 2 211 1 319 55 392Stanton County 01-------------------- 6 100 19 816 6 702 9 940 2 040 142 991Thayer County 03--------------------- 6 170 41 460 17 021 18 541 3 684 571 1 642
Thomas County 03-------------------- 809 4 143 1 544 901 110 132 1 456Thurston County 01------------------- 7 054 72 067 12 031 13 853 29 648 10 551 5 984Valley County 03---------------------- 4 527 30 532 12 082 10 966 5 749 316 1 419Washington County 01----------------- 18 837 64 222 29 355 18 646 11 536 2 258 2 428Wayne County 01--------------------- 9 201 35 145 14 414 15 063 3 317 341 2 010
Webster County 03-------------------- 3 933 28 590 10 998 13 195 2 894 284 1 220Wheeler County 03-------------------- 924 6 371 1 509 4 288 186 85 303York County 01----------------------- 14 392 68 534 30 899 29 913 4 302 597 2 823State undistributed------------------ 293 532 1 033 249 203 43 296 – –
Nevada ----------------------------- 1 809 253 7 941 909 3 456 725 1 532 015 1 249 010 801 551 902 608Churchill County 02-------------------- 23 405 193 172 54 613 16 679 13 691 54 814 53 374Clark County 01 02----------------------- 1 217 155 4 842 706 2 327 817 798 499 496 438 613 946 606 007Douglas County 02-------------------- 37 602 119 762 76 792 20 117 12 931 5 468 4 454Elko County 02----------------------- 45 465 108 194 39 682 12 289 37 454 3 310 15 458Esmeralda County 02------------------ 1 121 12 472 9 785 1 090 1 080 99 417
Eureka County 02--------------------- 1 854 9 394 2 364 1 252 5 555 43 179Humboldt County 02------------------- 17 876 42 282 19 715 8 021 7 614 949 5 982Lander County 02--------------------- 6 709 18 639 6 838 2 509 4 755 1 059 3 478Lincoln County 02--------------------- 4 226 19 381 11 719 4 143 1 643 438 1 437Lyon County 02----------------------- 31 459 114 805 74 747 20 949 11 277 4 471 3 361
Mineral County 02--------------------- 5 176 71 376 19 281 5 078 5 279 37 694 4 045Nye County 02------------------------ 29 709 131 141 86 022 21 161 13 767 1 844 8 347Carson City city area 02---------------- 50 046 530 799 133 976 40 915 315 429 15 027 25 452Pershing County 02------------------- 4 803 14 789 6 592 3 105 4 364 192 535Storey County 02---------------------- 2 988 4 783 2 420 598 1 570 43 151
Washoe County 02-------------------- 319 816 1 204 509 563 260 191 285 226 748 59 828 163 388White Pine County 02------------------ 9 843 40 021 18 437 5 706 7 011 2 327 6 540State undistributed------------------ 463 687 2 666 378 618 82 403 – –
New Hampshire---------------------- 1 201 134 5 301 370 2 300 443 945 925 1 120 006 481 685 453 311Belknap County 01 02-------------------- 53 680 251 291 132 152 46 186 52 722 8 508 11 722Carroll County 01--------------------- 40 184 175 529 108 818 32 651 24 543 1 941 7 576Cheshire County 02------------------- 72 401 265 692 139 998 54 483 56 080 5 154 9 977Coos County 02----------------------- 32 725 175 349 86 709 37 843 41 520 1 654 7 623Grafton County 02--------------------- 78 570 406 409 160 338 60 901 115 654 40 395 29 122
Hillsborough County 01 02---------------- 367 233 1 608 130 640 113 223 566 221 264 310 063 213 125Merrimack County 01 02------------------ 129 931 693 643 243 738 105 095 285 506 14 494 44 810Rockingham County 01 02---------------- 275 488 942 114 475 114 146 402 128 982 87 792 103 824Strafford County 01-------------------- 110 667 450 668 223 335 71 603 126 775 9 016 19 940Sullivan County 02-------------------- 40 255 162 312 87 455 34 758 31 839 2 668 5 592State undistributed------------------ 170 233 2 674 132 438 35 121 – –
New Jersey ------------------------- 8 143 412 40 397 603 15 425 838 9 905 256 7 261 564 4 206 178 3 598 767Atlantic County 02--------------------- 239 626 1 249 338 476 197 280 405 191 981 129 551 171 204Bergen County 05 09--------------------- 857 052 3 661 772 1 760 091 809 063 331 503 587 901 173 213Burlington County 01 02 03 04------------------ 424 510 2 664 120 868 986 313 565 174 733 888 132 418 703Camden County 01 03-------------------- 503 093 2 330 953 997 944 542 720 393 499 228 712 168 078Cape May County 02------------------ 98 009 552 867 274 837 145 593 73 125 16 266 43 046
Cumberland County 02---------------- 140 112 670 511 272 534 176 959 152 505 27 924 40 589Essex County 2
---------------------- 747 355 4 518 140 1 332 322 1 003 753 1 535 264 219 069 427 731Gloucester County 01 02------------------ 250 492 862 221 421 608 205 947 104 925 101 485 28 256Hudson County 09 10 13-------------------- 552 819 2 726 596 823 598 611 295 706 973 158 047 426 682Hunterdon County 12------------------ 124 553 289 868 165 823 68 114 26 805 10 316 18 810
Mercer County 04 12--------------------- 333 861 2 960 892 754 135 395 072 1 390 282 268 778 152 626Middlesex County 06 07 12 13------------------ 717 949 2 711 401 1 170 841 623 060 431 955 279 233 206 312Monmouth County 04 06 12------------------ 611 444 3 080 641 1 177 198 544 400 262 074 588 186 508 782Morris County 11---------------------- 463 545 1 576 026 739 410 303 297 107 831 194 989 230 499Ocean County 03 04--------------------- 497 533 2 579 155 1 446 617 661 319 152 856 124 324 194 039
Passaic County 05 08 11-------------------- 485 064 1 939 852 785 059 451 193 398 055 207 957 97 589Salem County 02---------------------- 64 534 264 854 129 955 75 520 40 925 6 273 12 180Somerset County 07 11 12------------------- 288 090 837 798 446 056 156 370 84 611 52 084 98 676Sussex County 05 11--------------------- 144 700 373 326 203 817 86 342 37 615 25 858 19 695Union County 07 10 13---------------------- 498 759 2 024 447 980 996 514 419 311 533 70 861 146 637Warren County 05--------------------- 100 312 364 909 190 990 98 743 39 525 20 229 15 420State undistributed------------------ 2 157 917 6 823 1 838 108 312 986 – –
New Mexico ------------------------- 1 739 844 13 580 214 3 520 025 1 732 817 2 749 967 3 931 018 1 646 387Bernalillo County 01 02 03------------------- 523 472 4 929 302 1 193 153 389 753 575 211 2 002 966 768 219Catron County 02--------------------- 2 862 19 091 9 792 1 859 1 889 2 144 3 408Chaves County 02--------------------- 62 394 263 073 134 812 48 684 52 937 8 325 18 315Colfax County 03---------------------- 13 666 76 155 34 108 12 166 24 833 2 131 2 917Curry County 03---------------------- 43 570 337 253 95 270 61 794 38 422 15 950 125 816
De Baca County 02-------------------- 2 359 12 108 6 521 2 806 2 082 128 571Dona Ana County 02------------------ 170 361 925 749 306 854 116 222 177 285 171 143 154 244Eddy County 02----------------------- 53 122 344 038 112 726 49 571 45 472 111 214 25 054Grant County 02---------------------- 31 335 140 329 73 259 24 823 30 149 1 785 10 313Guadalupe County 02------------------ 4 023 27 889 8 766 4 951 12 711 308 1 153
Harding County 03-------------------- 854 5 364 2 621 1 534 599 114 497Hidalgo County 02--------------------- 6 027 28 200 12 811 6 741 5 635 261 2 752Lea County 02------------------------ 55 067 200 926 97 653 58 007 38 223 1 392 5 651Lincoln County 02--------------------- 16 778 76 709 45 605 12 313 12 405 1 728 4 659Los Alamos County 03----------------- 18 281 1 476 050 24 960 7 681 20 166 1 412 498 10 745
See footnotes at end of table.
52 Consolidated Federal Funds Report for Fiscal Year 1999U.S. Census Bureau

Table 15. Federal Government Expenditure, by State and County Area: Fiscal Year 1999mCon.[Thousand dollars]
State and county area Congressionaldistrict
Federal government expenditure
United Statesresident
population1 TotalRetirement and
DisabilityOther Direct
Payments Grants ProcurementSalaries and
Wages
New MexicomCon.Luna County 02----------------------- 24 360 112 070 57 127 22 191 22 111 1 508 9 132McKinley County 03------------------- 66 923 405 466 99 336 36 990 159 293 17 777 92 069Mora County 03----------------------- 4 945 30 716 11 091 3 363 14 191 314 1 756Otero County 02---------------------- 54 185 492 696 153 720 32 305 40 607 75 481 190 583Quay County 03----------------------- 9 872 62 739 26 192 22 067 10 364 1 008 3 108
Rio Arriba County 03------------------ 38 180 201 602 68 232 26 199 84 330 9 460 13 380Roosevelt County 03------------------ 17 416 91 456 32 474 37 227 17 992 995 2 768Sandoval County 01 03------------------- 90 253 261 239 141 008 41 585 58 089 7 968 12 590San Juan County 03------------------- 109 899 417 442 160 851 68 777 104 095 11 243 72 477San Miguel County 03----------------- 28 488 171 051 52 120 26 133 84 248 1 285 7 265
Santa Fe County 01 03------------------- 124 228 894 295 228 668 71 687 497 552 38 551 57 836Sierra County 02---------------------- 11 008 97 620 48 336 16 802 24 494 3 161 4 828Socorro County 02-------------------- 16 500 86 713 28 684 11 248 30 170 8 326 8 284Taos County 03----------------------- 27 116 131 502 52 419 17 528 46 782 3 519 11 255Torrance County 01------------------- 16 408 62 470 26 315 8 384 11 790 13 595 2 387
Union County 03---------------------- 3 903 36 765 9 835 8 002 16 406 355 2 166Valencia County 01 02-------------------- 65 095 230 426 126 010 43 017 54 219 1 359 5 821Cibola County 02 03---------------------- 26 894 94 395 36 902 5 299 34 803 3 026 14 366State undistributed------------------ 837 315 1 795 435 107 400 412 – –
New York --------------------------- 18 196 601 101 808 595 33 997 072 24 647 620 28 869 892 6 772 795 7 521 216Albany County 21--------------------- 292 006 4 981 310 838 786 391 182 3 335 140 100 765 315 437Allegany County 31-------------------- 50 553 201 648 97 773 42 726 47 246 6 818 7 085Broome County 23 25 26-------------------- 195 246 953 578 459 298 187 039 173 859 89 749 43 634Cattaraugus County 31---------------- 84 477 394 386 176 718 72 701 92 654 36 964 15 350Cayuga County 25 27 31-------------------- 81 703 317 949 154 771 71 072 74 164 7 510 10 431
Chautauqua County 31---------------- 137 431 631 576 307 058 124 948 145 298 31 174 23 097Chemung County 31------------------- 91 738 424 784 209 551 86 776 95 099 7 820 25 538Chenango County 23------------------ 50 704 202 044 106 679 36 875 47 948 4 022 6 521Clinton County 24--------------------- 79 722 321 511 152 484 59 083 73 019 10 198 26 727Columbia County 22------------------- 63 002 272 624 133 541 55 922 64 376 9 097 9 687
Cortland County 25-------------------- 48 006 172 734 86 002 32 096 41 474 6 640 6 522Delaware County 23 26------------------- 46 362 308 020 108 088 60 664 113 720 15 608 9 939Dutchess County 19 22 26------------------- 268 237 993 458 502 236 206 077 202 957 19 778 62 409Erie County 27 29 30------------------------ 925 957 4 836 679 2 137 134 959 564 1 058 750 244 584 436 645Essex County 22 24---------------------- 37 507 194 775 91 536 34 175 41 604 5 671 21 789
Franklin County 24-------------------- 48 511 216 517 92 671 42 835 63 871 8 319 8 821Fulton County 24---------------------- 52 851 205 661 110 353 43 537 43 113 3 079 5 579Genesee County 27------------------- 60 469 247 746 123 066 53 215 36 083 11 849 23 533Greene County 22--------------------- 48 348 189 653 105 595 39 746 34 706 3 112 6 495Hamilton County 24------------------- 5 190 29 095 15 216 5 307 7 077 327 1 168
Herkimer County 23 24------------------- 63 354 264 356 138 738 60 641 51 299 5 917 7 760Jefferson County 24------------------- 109 920 874 378 205 423 76 244 112 621 57 955 422 136Lewis County 24---------------------- 27 289 99 824 49 209 17 628 26 330 3 142 3 515Livingston County 27------------------ 65 851 202 235 108 145 48 064 32 936 4 439 8 651Madison County 23-------------------- 71 127 225 125 126 641 44 952 41 865 2 824 8 843
Monroe County 27 28 29--------------------- 712 419 3 233 043 1 354 487 750 689 797 411 152 135 178 321Montgomery County 21 23---------------- 50 369 246 202 131 314 62 744 38 531 7 041 6 571Nassau County 03 04 05--------------------- 1 305 057 6 254 514 2 817 838 1 574 056 658 705 818 171 385 744New York city area 2
----------------- 7 428 162 44 212 616 12 062 495 10 577 917 15 816 100 2 536 996 3 219 108Niagara County 29-------------------- 216 164 1 014 981 495 052 217 211 187 837 37 460 77 420
Oneida County 23--------------------- 229 714 1 307 326 598 000 241 226 259 605 87 950 120 545Onondaga County 25------------------ 456 215 2 261 177 925 410 391 122 409 585 307 691 227 369Ontario County 27--------------------- 99 791 401 422 199 984 79 636 64 217 11 603 45 983Orange County 19 20 26--------------------- 334 199 1 545 115 557 086 251 377 211 015 143 555 382 082Orleans County 29-------------------- 45 022 156 562 76 188 35 202 33 356 6 946 4 870
Oswego County 24-------------------- 123 875 420 765 223 136 81 405 93 073 8 266 14 885Otsego County 23--------------------- 60 619 253 891 126 526 51 487 60 327 6 097 9 454Putnam County 19-------------------- 94 844 235 710 134 389 59 212 26 760 3 891 11 458Rensselaer County 21 22----------------- 151 445 810 724 310 944 135 478 322 875 10 883 30 545Rockland County 20------------------- 284 022 1 026 681 480 024 252 561 235 649 20 653 37 794
St. Lawrence County 24---------------- 112 853 484 237 224 262 89 815 136 626 7 586 25 947Saratoga County 21 22------------------- 199 733 600 603 340 701 107 771 74 819 8 787 68 524Schenectady County 21---------------- 143 871 1 019 210 361 941 144 547 133 976 329 504 49 242Schoharie County 22 23------------------ 32 050 123 009 62 925 24 806 29 192 1 316 4 770Schuyler County 31-------------------- 19 229 74 481 37 567 12 697 20 115 1 056 3 047
Seneca County 27 31--------------------- 31 925 129 644 73 441 25 969 20 452 1 429 8 354Steuben County 31-------------------- 97 699 454 379 226 194 83 693 87 796 16 751 39 946Suffolk County 01 02 05--------------------- 1 383 847 6 150 519 2 524 991 1 198 263 950 261 830 013 646 991Sullivan County 20 26-------------------- 69 331 369 547 156 777 83 373 107 455 9 413 12 529Tioga County 25 26---------------------- 52 216 463 448 90 273 29 419 24 308 311 349 8 098
Tompkins County 26 31------------------- 97 656 444 897 132 183 58 461 220 827 14 383 19 044Ulster County 26---------------------- 167 293 654 517 334 433 134 441 142 637 15 048 27 958Warren County 22--------------------- 61 441 253 145 133 873 51 677 45 855 5 952 15 789Washington County 22----------------- 60 141 214 666 118 080 43 782 40 713 4 044 8 046Wayne County 27--------------------- 95 521 339 058 177 145 72 324 68 491 9 510 11 588
Westchester County 17 18 19 20---------------- 905 572 4 059 912 1 733 365 1 007 000 688 951 339 303 291 293Wyoming County 27------------------- 44 189 141 110 74 113 31 692 19 919 9 657 5 729Yates County 31---------------------- 24 556 96 405 55 956 20 645 13 952 995 4 858State undistributed------------------ 4 593 413 9 269 3 812 852 771 292 – –
North Carolina ----------------------- 7 650 789 37 227 647 14 884 584 7 410 151 7 608 000 2 049 792 5 275 120Alamance County 06 12------------------ 121 100 438 737 252 420 102 667 63 443 6 794 13 413Alexander County 10------------------ 31 984 86 726 49 790 20 746 12 360 1 125 2 704Alleghany County 05------------------- 9 850 52 712 26 924 10 446 11 783 1 404 2 154Anson County 08---------------------- 24 238 126 261 49 926 27 678 28 029 17 735 2 894Ashe County 05----------------------- 24 284 109 242 52 814 22 047 29 476 816 4 090
Avery County 10---------------------- 15 844 75 256 38 119 17 538 16 747 534 2 317Beaufort County 01 03-------------------- 45 150 217 479 107 819 56 383 44 116 2 896 6 265Bertie County 01---------------------- 20 392 120 721 48 346 27 081 38 758 2 386 4 150Bladen County 01 07--------------------- 30 919 157 810 67 336 33 901 43 110 7 786 5 676Brunswick County 07------------------ 71 214 318 009 189 432 58 438 39 279 16 557 14 304
See footnotes at end of table.
Consolidated Federal Funds Report for Fiscal Year 1999 53U.S. Census Bureau
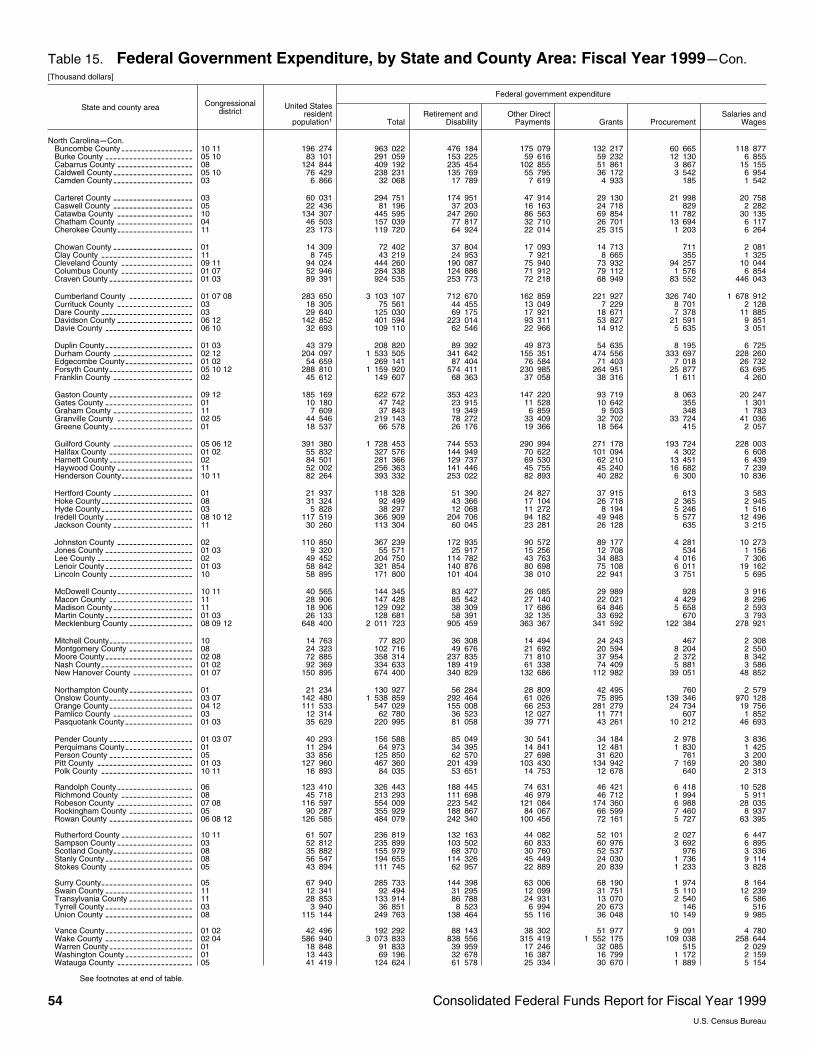
Table 15. Federal Government Expenditure, by State and County Area: Fiscal Year 1999mCon.[Thousand dollars]
State and county area Congressionaldistrict
Federal government expenditure
United Statesresident
population1 TotalRetirement and
DisabilityOther Direct
Payments Grants ProcurementSalaries and
Wages
North CarolinamCon.Buncombe County 10 11------------------ 196 274 963 022 476 184 175 079 132 217 60 665 118 877Burke County 05 10---------------------- 83 101 291 059 153 225 59 616 59 232 12 130 6 855Cabarrus County 08------------------- 124 844 409 192 235 454 102 855 51 861 3 867 15 155Caldwell County 05 10-------------------- 76 429 238 231 135 769 55 795 36 172 3 542 6 954Camden County 03-------------------- 6 866 32 068 17 789 7 619 4 933 185 1 542
Carteret County 03-------------------- 60 031 294 751 174 951 47 914 29 130 21 998 20 758Caswell County 05-------------------- 22 436 81 196 37 203 16 163 24 718 829 2 282Catawba County 10------------------- 134 307 445 595 247 260 86 563 69 854 11 782 30 135Chatham County 04------------------- 46 503 157 039 77 817 32 710 26 701 13 694 6 117Cherokee County 11------------------- 23 173 119 720 64 924 22 014 25 315 1 203 6 264
Chowan County 01-------------------- 14 309 72 402 37 804 17 093 14 713 711 2 081Clay County 11----------------------- 8 745 43 219 24 953 7 921 8 665 355 1 325Cleveland County 09 11------------------ 94 024 444 260 190 087 75 940 73 932 94 257 10 044Columbus County 01 07------------------ 52 946 284 338 124 886 71 912 79 112 1 576 6 854Craven County 01 03--------------------- 89 391 924 535 253 773 72 218 68 949 83 552 446 043
Cumberland County 01 07 08---------------- 283 650 3 103 107 712 670 162 859 221 927 326 740 1 678 912Currituck County 03------------------- 18 305 75 561 44 455 13 049 7 229 8 701 2 128Dare County 03----------------------- 29 640 125 030 69 175 17 921 18 671 7 378 11 885Davidson County 06 12------------------- 142 852 401 594 223 014 93 311 53 827 21 591 9 851Davie County 06 10---------------------- 32 693 109 110 62 546 22 966 14 912 5 635 3 051
Duplin County 01 03---------------------- 43 379 208 820 89 392 49 873 54 635 8 195 6 725Durham County 02 12-------------------- 204 097 1 533 505 341 642 155 351 474 556 333 697 228 260Edgecombe County 01 02----------------- 54 659 269 141 87 404 76 584 71 403 7 018 26 732Forsyth County 05 10 12--------------------- 288 810 1 159 920 574 411 230 985 264 951 25 877 63 695Franklin County 02-------------------- 45 612 149 607 68 363 37 058 38 316 1 611 4 260
Gaston County 09 12--------------------- 185 169 622 672 353 423 147 220 93 719 8 063 20 247Gates County 01---------------------- 10 180 47 742 23 915 11 528 10 642 355 1 301Graham County 11-------------------- 7 609 37 843 19 349 6 859 9 503 348 1 783Granville County 02 05------------------- 44 546 219 143 78 272 33 409 32 702 33 724 41 036Greene County 01--------------------- 18 537 66 578 26 176 19 366 18 564 415 2 057
Guilford County 05 06 12-------------------- 391 380 1 728 453 744 553 290 994 271 178 193 724 228 003Halifax County 01 02--------------------- 55 832 327 576 144 949 70 622 101 094 4 302 6 608Harnett County 02--------------------- 84 501 281 366 129 737 69 530 62 210 13 451 6 439Haywood County 11------------------- 52 002 256 363 141 446 45 755 45 240 16 682 7 239Henderson County 10 11------------------ 82 264 393 332 253 022 82 893 40 282 6 300 10 836
Hertford County 01-------------------- 21 937 118 328 51 390 24 827 37 915 613 3 583Hoke County 08----------------------- 31 324 92 499 43 366 17 104 26 718 2 365 2 945Hyde County 03----------------------- 5 828 38 297 12 068 11 272 8 194 5 246 1 516Iredell County 08 10 12---------------------- 117 519 366 909 204 706 94 182 49 948 5 577 12 496Jackson County 11-------------------- 30 260 113 304 60 045 23 281 26 128 635 3 215
Johnston County 02------------------- 110 850 367 239 172 935 90 572 89 177 4 281 10 273Jones County 01 03---------------------- 9 320 55 571 25 917 15 256 12 708 534 1 156Lee County 02------------------------ 49 452 204 750 114 782 43 763 34 883 4 016 7 306Lenoir County 01 03---------------------- 58 842 321 854 140 876 80 698 75 108 6 011 19 162Lincoln County 10--------------------- 58 895 171 800 101 404 38 010 22 941 3 751 5 695
McDowell County 10 11------------------- 40 565 144 345 83 427 26 085 29 989 928 3 916Macon County 11--------------------- 28 906 147 428 85 542 27 140 22 021 4 429 8 296Madison County 11-------------------- 18 906 129 092 38 309 17 686 64 846 5 658 2 593Martin County 01 03---------------------- 26 133 128 681 58 391 32 135 33 692 670 3 793Mecklenburg County 08 09 12---------------- 648 400 2 011 723 905 459 363 367 341 592 122 384 278 921
Mitchell County 10--------------------- 14 763 77 820 36 308 14 494 24 243 467 2 308Montgomery County 08---------------- 24 323 102 716 49 676 21 692 20 594 8 204 2 550Moore County 02 08---------------------- 72 885 358 314 237 835 71 810 37 954 2 372 8 342Nash County 01 02----------------------- 92 369 334 633 189 419 61 338 74 409 5 881 3 586New Hanover County 01 07--------------- 150 895 674 400 340 829 132 686 112 982 39 051 48 852
Northampton County 01---------------- 21 234 130 927 56 284 28 809 42 495 760 2 579Onslow County 03 07--------------------- 142 480 1 538 859 292 464 61 026 75 895 139 346 970 128Orange County 04 12--------------------- 111 533 547 029 155 008 66 253 281 279 24 734 19 756Pamlico County 03-------------------- 12 314 62 780 36 523 12 027 11 771 607 1 852Pasquotank County 01 03----------------- 35 629 220 995 81 058 39 771 43 261 10 212 46 693
Pender County 01 03 07--------------------- 40 293 156 588 85 049 30 541 34 184 2 978 3 836Perquimans County 01----------------- 11 294 64 973 34 395 14 841 12 481 1 830 1 425Person County 05--------------------- 33 856 125 850 62 570 27 698 31 620 761 3 200Pitt County 01 03------------------------ 127 960 467 360 201 439 103 430 134 942 7 169 20 380Polk County 10 11----------------------- 16 893 84 035 53 651 14 753 12 678 640 2 313
Randolph County 06------------------- 123 410 326 443 188 445 74 631 46 421 6 418 10 528Richmond County 08------------------ 45 718 213 293 111 698 46 979 46 712 1 994 5 911Robeson County 07 08------------------- 116 597 554 009 223 542 121 084 174 360 6 988 28 035Rockingham County 05---------------- 90 287 355 929 188 867 84 067 66 599 7 460 8 937Rowan County 06 08 12--------------------- 126 585 484 079 242 340 100 456 72 161 5 727 63 395
Rutherford County 10 11------------------ 61 507 236 819 132 163 44 082 52 101 2 027 6 447Sampson County 03------------------- 52 812 235 899 103 502 60 833 60 976 3 692 6 895Scotland County 08-------------------- 35 882 155 979 68 370 30 760 52 537 976 3 336Stanly County 08---------------------- 56 547 194 655 114 326 45 449 24 030 1 736 9 114Stokes County 05--------------------- 43 894 111 745 62 957 22 889 20 839 1 233 3 828
Surry County 05----------------------- 67 940 285 733 144 398 63 006 68 190 1 974 8 164Swain County 11---------------------- 12 341 92 494 31 295 12 099 31 751 5 110 12 239Transylvania County 11---------------- 28 853 133 914 86 788 24 931 13 070 2 540 6 586Tyrrell County 03---------------------- 3 940 36 851 8 523 6 994 20 673 146 516Union County 08---------------------- 115 144 249 763 138 464 55 116 36 048 10 149 9 985
Vance County 01 02---------------------- 42 496 192 292 88 143 38 302 51 977 9 091 4 780Wake County 02 04---------------------- 586 940 3 073 833 838 556 315 419 1 552 175 109 038 258 644Warren County 01--------------------- 18 848 91 833 39 959 17 246 32 085 515 2 029Washington County 01----------------- 13 443 69 196 32 678 16 387 16 799 1 172 2 159Watauga County 05------------------- 41 419 124 624 61 578 25 334 30 670 1 889 5 154
See footnotes at end of table.
54 Consolidated Federal Funds Report for Fiscal Year 1999U.S. Census Bureau

Table 15. Federal Government Expenditure, by State and County Area: Fiscal Year 1999mCon.[Thousand dollars]
State and county area Congressionaldistrict
Federal government expenditure
United Statesresident
population1 TotalRetirement and
DisabilityOther Direct
Payments Grants ProcurementSalaries and
Wages
North CarolinamCon.Wayne County 01 03--------------------- 111 711 718 958 257 044 103 913 111 667 54 426 191 909Wilkes County 05 10--------------------- 63 640 228 688 115 730 46 349 55 312 2 211 9 087Wilson County 01 02--------------------- 68 801 304 912 139 289 70 077 79 856 7 145 8 545Yadkin County 10--------------------- 35 245 126 722 64 141 25 914 31 917 1 141 3 609Yancey County 11--------------------- 16 860 78 462 40 268 13 978 21 197 696 2 323State undistributed------------------ 1 571 379 27 475 1 470 842 73 063 – –
North Dakota ------------------------ 633 666 4 535 216 1 217 890 1 435 169 1 009 480 254 593 618 084Adams County 00--------------------- 2 644 19 664 6 385 10 029 2 253 171 826Barnes County 00--------------------- 11 864 85 836 27 990 37 589 12 253 3 223 4 781Benson County 00--------------------- 6 781 79 428 12 898 23 695 32 891 4 991 4 953Billings County 00--------------------- 1 066 5 109 954 2 138 789 131 1 096Bottineau County 00------------------- 7 241 58 074 17 557 31 959 4 987 559 3 012
Bowman County 00-------------------- 3 269 26 006 7 727 10 907 6 395 185 792Burke County 00---------------------- 2 189 26 593 6 825 13 158 4 034 259 2 316Burleigh County 00-------------------- 67 371 573 230 127 056 69 058 319 592 7 162 50 362Cass County 00----------------------- 118 405 495 633 179 861 100 381 90 719 24 689 99 982Cavalier County 00-------------------- 4 821 63 809 11 860 46 968 3 025 313 1 643
Dickey County 00--------------------- 5 662 46 298 12 359 22 631 9 248 472 1 587Divide County 00---------------------- 2 294 23 446 6 527 13 215 2 413 201 1 089Dunn County 00----------------------- 3 457 22 450 5 567 8 977 4 373 2 504 1 029Eddy County 00----------------------- 2 795 21 250 7 207 10 346 2 271 423 1 004Emmons County 00------------------- 4 302 31 010 10 199 15 390 4 075 242 1 104
Foster County 00---------------------- 3 787 47 515 9 061 14 506 18 194 4 304 1 451Golden Valley County 00--------------- 1 782 14 918 4 737 7 860 1 765 99 456Grand Forks County 00---------------- 64 674 424 257 88 389 73 511 59 529 66 480 136 349Grant County 00---------------------- 2 854 24 620 6 293 13 154 3 936 185 1 052Griggs County 00--------------------- 2 778 26 510 7 012 16 529 1 689 227 1 053
Hettinger County 00------------------- 2 839 32 725 7 784 19 451 4 249 156 1 085Kidder County 00---------------------- 2 798 23 185 6 116 12 124 3 651 227 1 066La Moure County 00------------------- 4 700 45 569 11 653 23 677 7 654 738 1 847Logan County 00---------------------- 2 268 19 531 5 027 11 607 2 094 156 647McHenry County 00------------------- 5 962 50 741 16 270 22 915 8 282 586 2 688
McIntosh County 00------------------- 3 397 28 820 10 138 14 547 2 758 227 1 150McKenzie County 00------------------- 5 541 32 006 9 342 12 073 5 504 2 889 2 198McLean County 00-------------------- 9 603 77 456 24 109 31 326 11 540 5 748 4 733Mercer County 00--------------------- 9 210 32 751 14 487 11 223 3 952 1 185 1 904Morton County 00--------------------- 24 568 104 321 47 255 29 582 19 360 2 950 5 174
Mountrail County 00------------------- 6 516 58 536 15 078 18 910 19 662 459 4 426Nelson County 00--------------------- 3 656 43 354 11 961 24 749 4 933 355 1 356Oliver County 00---------------------- 2 158 12 016 2 566 4 538 4 696 28 188Pembina County 00------------------- 8 351 73 412 19 617 36 893 8 139 2 040 6 723Pierce County 00---------------------- 4 594 34 136 10 589 16 819 5 088 305 1 335
Ramsey County 00-------------------- 11 944 109 639 29 286 38 420 19 617 12 675 9 641Ransom County 00-------------------- 5 731 41 676 13 376 21 908 4 017 604 1 771Renville County 00-------------------- 2 799 23 552 7 023 13 817 1 555 213 943Richland County 00-------------------- 17 924 89 480 31 117 42 996 10 678 981 3 708Rolette County 00--------------------- 14 229 147 697 21 686 21 944 48 440 32 936 22 690
Sargent County 00-------------------- 4 288 34 044 8 575 19 206 3 967 455 1 842Sheridan County 00------------------- 1 665 20 216 4 296 11 008 4 156 278 479Sioux County 00---------------------- 4 156 40 326 4 728 8 736 17 401 2 547 6 913Slope County 00---------------------- 887 6 960 950 5 343 537 28 101Stark County 00----------------------- 22 490 99 271 42 078 30 112 19 627 777 6 675
Steele County 00---------------------- 2 182 26 035 5 304 17 540 2 011 342 837Stutsman County 00------------------- 21 090 139 948 48 171 50 123 29 816 2 500 9 338Towner County 00--------------------- 2 955 33 675 7 108 20 984 4 400 171 1 012Traill County 00----------------------- 8 555 60 381 19 018 30 762 7 471 1 042 2 088Walsh County 00---------------------- 13 356 92 040 28 792 42 527 16 612 899 3 211
Ward County 00----------------------- 58 360 469 391 118 698 64 710 39 121 58 812 188 049Wells County 00---------------------- 5 094 46 443 14 680 23 824 6 045 398 1 495Williams County 00-------------------- 19 764 99 120 44 181 31 416 14 634 4 063 4 826State undistributed------------------ 171 108 367 107 359 63 382 – –
Ohio-------------------------------- 11 256 654 53 262 164 21 645 875 12 513 420 10 254 389 4 507 562 4 340 917Adams County 02--------------------- 28 698 152 256 60 162 27 441 59 729 1 090 3 834Allen County 04----------------------- 106 898 561 670 342 160 96 497 74 411 24 085 24 517Ashland County 16-------------------- 51 973 147 656 86 809 33 991 18 319 2 795 5 742Ashtabula County 19------------------ 103 344 425 685 216 932 106 618 58 098 30 223 13 814Athens County 06--------------------- 61 599 260 883 89 527 55 198 89 846 6 839 19 472
Auglaize County 04 08-------------------- 47 167 148 035 76 362 48 548 13 775 4 373 4 977Belmont County 18-------------------- 71 259 353 301 186 314 84 625 67 978 4 235 10 149Brown County 02---------------------- 41 576 137 286 64 909 37 826 28 700 1 440 4 411Butler County 08---------------------- 333 486 972 449 514 562 208 645 167 760 50 006 31 477Carroll County 18--------------------- 29 286 78 047 40 711 16 905 17 111 782 2 537
Champaign County 07----------------- 38 572 132 860 67 592 34 339 18 544 8 148 4 237Clark County 07----------------------- 144 962 669 912 348 423 151 101 119 542 12 235 38 611Clermont County 02------------------- 178 749 377 915 207 023 80 649 68 007 5 729 16 507Clinton County 06--------------------- 40 701 153 559 75 222 43 704 24 800 1 773 8 061Columbiana County 17 18----------------- 111 300 465 174 242 259 110 220 79 972 7 183 25 540
Coshocton County 18------------------ 36 204 134 238 69 333 29 816 26 380 3 418 5 292Crawford County 04------------------- 47 010 186 355 99 376 56 241 25 128 1 469 4 141Cuyahoga County 10 11 13 19------------------ 1 371 717 7 901 966 3 012 818 1 855 287 1 565 036 617 586 851 240Darke County 08---------------------- 54 063 188 314 96 740 52 589 30 135 2 738 6 113Defiance County 05------------------- 39 651 137 711 69 240 39 032 19 906 4 544 4 988
Delaware County 12------------------- 103 679 266 548 104 349 89 986 48 194 12 229 11 791Erie County 05------------------------ 77 893 328 244 166 324 77 684 61 397 11 114 11 725Fairfield County 07-------------------- 126 723 338 943 185 932 81 541 49 136 9 333 13 001Fayette County 07--------------------- 28 399 108 610 51 127 32 865 20 995 1 038 2 584Franklin County 12 15-------------------- 1 027 821 6 051 077 1 746 292 781 658 2 457 365 475 114 590 648
See footnotes at end of table.
Consolidated Federal Funds Report for Fiscal Year 1999 55U.S. Census Bureau
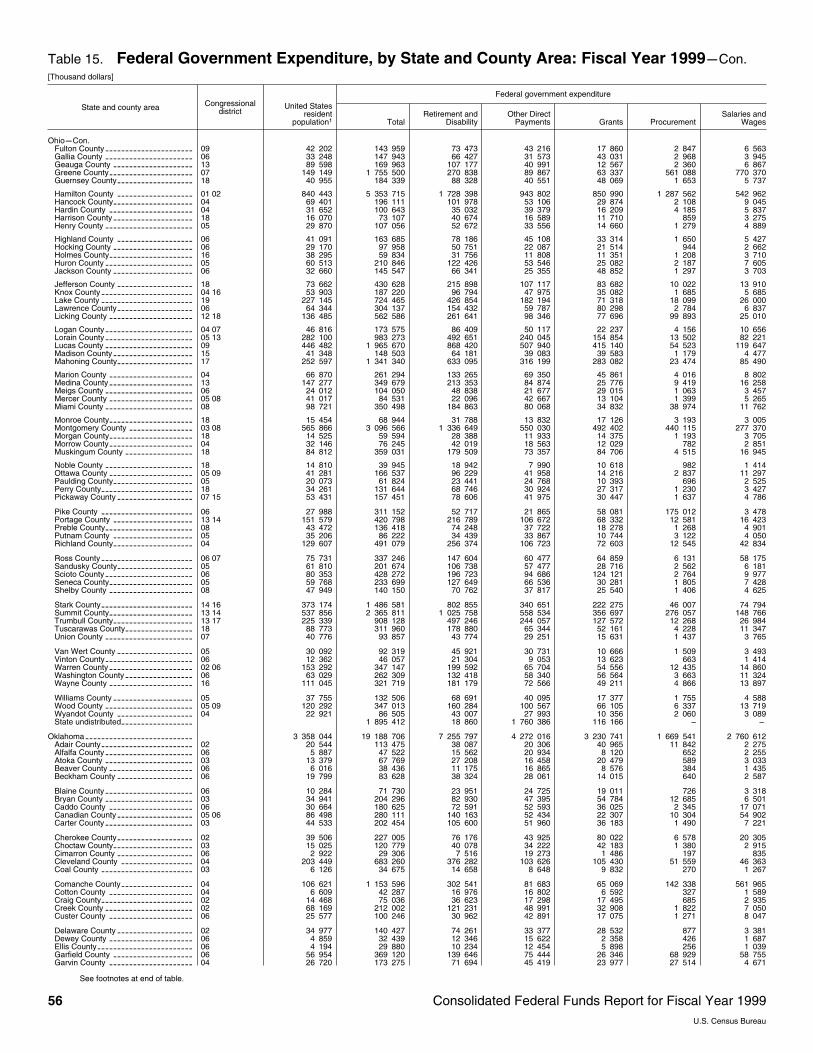
Table 15. Federal Government Expenditure, by State and County Area: Fiscal Year 1999mCon.[Thousand dollars]
State and county area Congressionaldistrict
Federal government expenditure
United Statesresident
population1 TotalRetirement and
DisabilityOther Direct
Payments Grants ProcurementSalaries and
Wages
OhiomCon.Fulton County 09---------------------- 42 202 143 959 73 473 43 216 17 860 2 847 6 563Gallia County 06---------------------- 33 248 147 943 66 427 31 573 43 031 2 968 3 945Geauga County 13-------------------- 89 598 169 963 107 177 40 991 12 567 2 360 6 867Greene County 07--------------------- 149 149 1 755 500 270 838 89 867 63 337 561 088 770 370Guernsey County 18------------------- 40 955 184 339 88 328 40 551 48 069 1 653 5 737
Hamilton County 01 02------------------- 840 443 5 353 715 1 728 398 943 802 850 990 1 287 562 542 962Hancock County 04-------------------- 69 401 196 111 101 978 53 106 29 874 2 108 9 045Hardin County 04--------------------- 31 652 100 643 35 032 39 379 16 209 4 185 5 837Harrison County 18-------------------- 16 070 73 107 40 674 16 589 11 710 859 3 275Henry County 05---------------------- 29 870 107 056 52 672 33 556 14 660 1 279 4 889
Highland County 06------------------- 41 091 163 685 78 186 45 108 33 314 1 650 5 427Hocking County 06-------------------- 29 170 97 958 50 751 22 087 21 514 944 2 662Holmes County 16--------------------- 38 295 59 834 31 756 11 808 11 351 1 208 3 710Huron County 05---------------------- 60 513 210 846 122 426 53 546 25 082 2 187 7 605Jackson County 06-------------------- 32 660 145 547 66 341 25 355 48 852 1 297 3 703
Jefferson County 18------------------- 73 662 430 628 215 898 107 117 83 682 10 022 13 910Knox County 04 16----------------------- 53 903 187 220 96 794 47 975 35 082 1 685 5 685Lake County 19----------------------- 227 145 724 465 426 854 182 194 71 318 18 099 26 000Lawrence County 06------------------- 64 344 304 137 154 432 59 787 80 298 2 784 6 837Licking County 12 18--------------------- 136 485 562 586 261 641 98 346 77 696 99 893 25 010
Logan County 04 07---------------------- 46 816 173 575 86 409 50 117 22 237 4 156 10 656Lorain County 05 13---------------------- 282 100 983 273 492 651 240 045 154 854 13 502 82 221Lucas County 09---------------------- 446 482 1 965 670 868 420 507 940 415 140 54 523 119 647Madison County 15-------------------- 41 348 148 503 64 181 39 083 39 583 1 179 4 477Mahoning County 17------------------- 252 597 1 341 340 633 095 316 199 283 082 23 474 85 490
Marion County 04--------------------- 66 870 261 294 133 265 69 350 45 861 4 016 8 802Medina County 13--------------------- 147 277 349 679 213 353 84 874 25 776 9 419 16 258Meigs County 06---------------------- 24 012 104 050 48 838 21 677 29 015 1 063 3 457Mercer County 05 08--------------------- 41 017 84 531 22 096 42 667 13 104 1 399 5 265Miami County 08---------------------- 98 721 350 498 184 863 80 068 34 832 38 974 11 762
Monroe County 18--------------------- 15 454 68 944 31 788 13 832 17 126 3 193 3 005Montgomery County 03 08---------------- 565 866 3 096 566 1 336 649 550 030 492 402 440 115 277 370Morgan County 18--------------------- 14 525 59 594 28 388 11 933 14 375 1 193 3 705Morrow County 04--------------------- 32 146 76 245 42 019 18 563 12 029 782 2 851Muskingum County 18----------------- 84 812 359 031 179 509 73 357 84 706 4 515 16 945
Noble County 18---------------------- 14 810 39 945 18 942 7 990 10 618 982 1 414Ottawa County 05 09--------------------- 41 281 166 537 96 229 41 958 14 216 2 837 11 297Paulding County 05-------------------- 20 073 61 824 23 441 24 768 10 393 696 2 525Perry County 18----------------------- 34 261 131 644 68 746 30 924 27 317 1 230 3 427Pickaway County 07 15------------------- 53 431 157 451 78 606 41 975 30 447 1 637 4 786
Pike County 06----------------------- 27 988 311 152 52 717 21 865 58 081 175 012 3 478Portage County 13 14-------------------- 151 579 420 798 216 789 106 672 68 332 12 581 16 423Preble County 08---------------------- 43 472 136 418 74 248 37 722 18 278 1 268 4 901Putnam County 05-------------------- 35 206 86 222 34 439 33 867 10 744 3 122 4 050Richland County 04-------------------- 129 607 491 079 256 374 106 723 72 603 12 545 42 834
Ross County 06 07----------------------- 75 731 337 246 147 604 60 477 64 859 6 131 58 175Sandusky County 05------------------- 61 810 201 674 106 738 57 477 28 716 2 562 6 181Scioto County 06---------------------- 80 353 428 272 196 723 94 686 124 121 2 764 9 977Seneca County 05--------------------- 59 768 233 699 127 649 66 536 30 281 1 805 7 428Shelby County 08--------------------- 47 949 140 150 70 762 37 817 25 540 1 406 4 625
Stark County 14 16----------------------- 373 174 1 486 581 802 855 340 651 222 275 46 007 74 794Summit County 13 14--------------------- 537 856 2 365 811 1 025 758 558 534 356 697 276 057 148 766Trumbull County 13 17-------------------- 225 339 908 128 497 246 244 057 127 572 12 268 26 984Tuscarawas County 18----------------- 88 773 311 960 178 880 65 344 52 161 4 228 11 347Union County 07---------------------- 40 776 93 857 43 774 29 251 15 631 1 437 3 765
Van Wert County 05------------------- 30 092 92 319 45 921 30 731 10 666 1 509 3 493Vinton County 06---------------------- 12 362 46 057 21 304 9 053 13 623 663 1 414Warren County 02 06--------------------- 153 292 347 147 199 592 65 704 54 556 12 435 14 860Washington County 06----------------- 63 029 262 309 132 418 58 340 56 564 3 663 11 324Wayne County 16--------------------- 111 045 321 719 181 179 72 566 49 211 4 866 13 897
Williams County 05-------------------- 37 755 132 506 68 691 40 095 17 377 1 755 4 588Wood County 05 09---------------------- 120 292 347 013 160 284 100 567 66 105 6 337 13 719Wyandot County 04------------------- 22 921 86 505 43 007 27 993 10 356 2 060 3 089State undistributed------------------ 1 895 412 18 860 1 760 386 116 166 – –
Oklahoma--------------------------- 3 358 044 19 188 706 7 255 797 4 272 016 3 230 741 1 669 541 2 760 612Adair County 02----------------------- 20 544 113 475 38 087 20 306 40 965 11 842 2 275Alfalfa County 06---------------------- 5 887 47 522 15 562 20 934 8 120 652 2 255Atoka County 03---------------------- 13 379 67 769 27 208 16 458 20 479 589 3 033Beaver County 06--------------------- 6 016 38 436 11 175 16 865 8 576 384 1 435Beckham County 06------------------- 19 799 83 628 38 324 28 061 14 015 640 2 587
Blaine County 06---------------------- 10 284 71 730 23 951 24 725 19 011 726 3 318Bryan County 03---------------------- 34 941 204 296 82 930 47 395 54 784 12 685 6 501Caddo County 06--------------------- 30 664 180 625 72 591 52 593 36 025 2 345 17 071Canadian County 05 06------------------- 86 498 280 111 140 163 52 434 22 307 10 304 54 902Carter County 03---------------------- 44 533 202 454 105 600 51 960 36 183 1 490 7 221
Cherokee County 02------------------- 39 506 227 005 76 176 43 925 80 022 6 578 20 305Choctaw County 03-------------------- 15 025 120 779 40 078 34 222 42 183 1 380 2 915Cimarron County 06------------------- 2 922 29 306 7 516 19 273 1 486 197 835Cleveland County 04------------------ 203 449 683 260 376 282 103 626 105 430 51 559 46 363Coal County 03----------------------- 6 126 34 675 14 658 8 648 9 832 270 1 267
Comanche County 04------------------ 106 621 1 153 596 302 541 81 683 65 069 142 338 561 965Cotton County 04--------------------- 6 609 42 287 16 976 16 802 6 592 327 1 589Craig County 02----------------------- 14 468 75 036 36 623 17 298 17 495 685 2 935Creek County 02---------------------- 68 169 212 002 121 231 48 991 32 908 1 822 7 050Custer County 06--------------------- 25 577 100 246 30 962 42 891 17 075 1 271 8 047
Delaware County 02------------------- 34 977 140 427 74 261 33 377 28 532 877 3 381Dewey County 06--------------------- 4 859 32 439 12 346 15 622 2 358 426 1 687Ellis County 06------------------------ 4 194 29 880 10 234 12 454 5 898 256 1 039Garfield County 06-------------------- 56 954 369 120 139 646 75 444 26 346 68 929 58 755Garvin County 04--------------------- 26 720 173 275 71 694 45 419 23 977 27 514 4 671
See footnotes at end of table.
56 Consolidated Federal Funds Report for Fiscal Year 1999U.S. Census Bureau
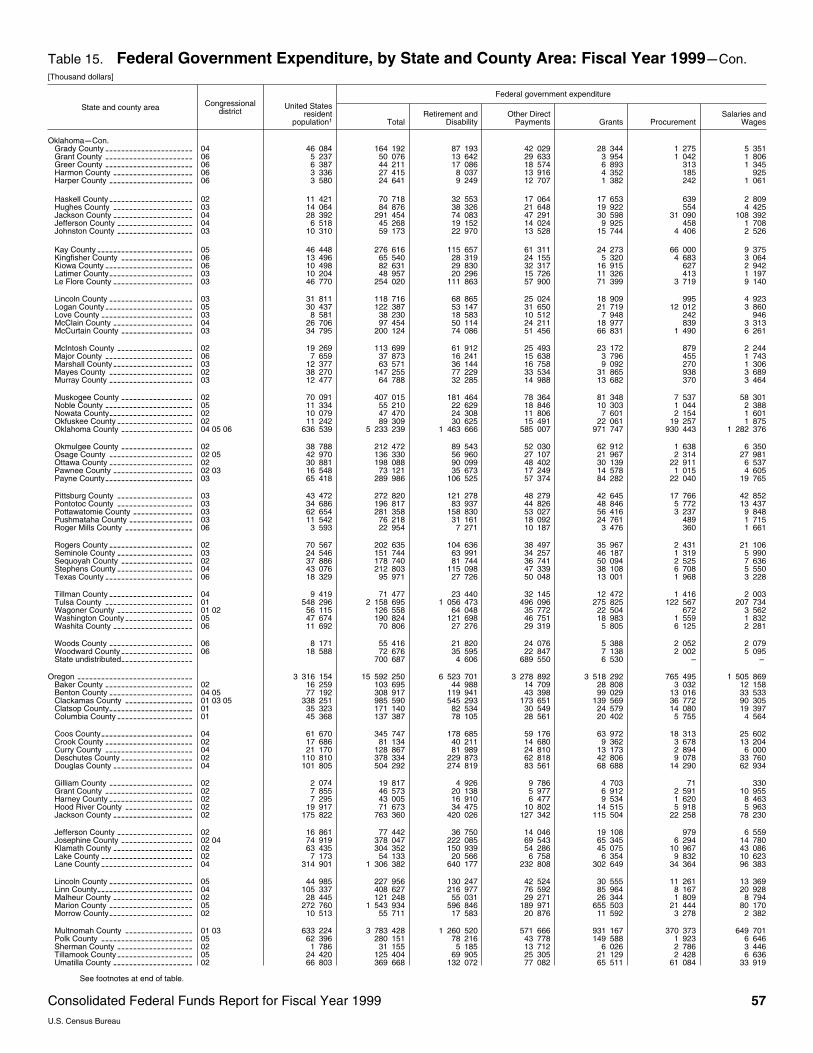
Table 15. Federal Government Expenditure, by State and County Area: Fiscal Year 1999mCon.[Thousand dollars]
State and county area Congressionaldistrict
Federal government expenditure
United Statesresident
population1 TotalRetirement and
DisabilityOther Direct
Payments Grants ProcurementSalaries and
Wages
OklahomamCon.Grady County 04---------------------- 46 084 164 192 87 193 42 029 28 344 1 275 5 351Grant County 06---------------------- 5 237 50 076 13 642 29 633 3 954 1 042 1 806Greer County 06---------------------- 6 387 44 211 17 086 18 574 6 893 313 1 345Harmon County 06-------------------- 3 336 27 415 8 037 13 916 4 352 185 925Harper County 06--------------------- 3 580 24 641 9 249 12 707 1 382 242 1 061
Haskell County 02--------------------- 11 421 70 718 32 553 17 064 17 653 639 2 809Hughes County 03-------------------- 14 064 84 876 38 326 21 648 19 922 554 4 425Jackson County 04-------------------- 28 392 291 454 74 083 47 291 30 598 31 090 108 392Jefferson County 04------------------- 6 518 45 268 19 152 14 024 9 925 458 1 708Johnston County 03------------------- 10 310 59 173 22 970 13 528 15 744 4 406 2 526
Kay County 05------------------------ 46 448 276 616 115 657 61 311 24 273 66 000 9 375Kingfisher County 06------------------ 13 496 65 540 28 319 24 155 5 320 4 683 3 064Kiowa County 06---------------------- 10 498 82 631 29 830 32 317 16 915 627 2 942Latimer County 03--------------------- 10 204 48 957 20 296 15 726 11 326 413 1 197Le Flore County 03-------------------- 46 770 254 020 111 863 57 900 71 399 3 719 9 140
Lincoln County 03--------------------- 31 811 118 716 68 865 25 024 18 909 995 4 923Logan County 05---------------------- 30 437 122 387 53 147 31 650 21 719 12 012 3 860Love County 03----------------------- 8 581 38 230 18 583 10 512 7 948 242 946McClain County 04-------------------- 26 706 97 454 50 114 24 211 18 977 839 3 313McCurtain County 03------------------ 34 795 200 124 74 086 51 456 66 831 1 490 6 261
McIntosh County 02------------------- 19 269 113 699 61 912 25 493 23 172 879 2 244Major County 06---------------------- 7 659 37 873 16 241 15 638 3 796 455 1 743Marshall County 03-------------------- 12 377 63 571 36 144 16 758 9 092 270 1 306Mayes County 02--------------------- 38 270 147 255 77 229 33 534 31 865 938 3 689Murray County 03--------------------- 12 477 64 788 32 285 14 988 13 682 370 3 464
Muskogee County 02------------------ 70 091 407 015 181 464 78 364 81 348 7 537 58 301Noble County 05---------------------- 11 334 55 210 22 629 18 846 10 303 1 044 2 388Nowata County 02--------------------- 10 079 47 470 24 308 11 806 7 601 2 154 1 601Okfuskee County 02------------------- 11 242 89 309 30 625 15 491 22 061 19 257 1 875Oklahoma County 04 05 06------------------ 636 539 5 233 239 1 463 666 585 007 971 747 930 443 1 282 376
Okmulgee County 02------------------ 38 788 212 472 89 543 52 030 62 912 1 638 6 350Osage County 02 05--------------------- 42 970 136 330 56 960 27 107 21 967 2 314 27 981Ottawa County 02--------------------- 30 881 198 088 90 099 48 402 30 139 22 911 6 537Pawnee County 02 03-------------------- 16 548 73 121 35 673 17 249 14 578 1 015 4 605Payne County 03---------------------- 65 418 289 986 106 525 57 374 84 282 22 040 19 765
Pittsburg County 03------------------- 43 472 272 820 121 278 48 279 42 645 17 766 42 852Pontotoc County 03------------------- 34 686 196 817 83 937 44 826 48 846 5 772 13 437Pottawatomie County 03--------------- 62 654 281 358 158 830 53 027 56 416 3 237 9 848Pushmataha County 03---------------- 11 542 76 218 31 161 18 092 24 761 489 1 715Roger Mills County 06----------------- 3 593 22 954 7 271 10 187 3 476 360 1 661
Rogers County 02--------------------- 70 567 202 635 104 636 38 497 35 967 2 431 21 106Seminole County 03------------------- 24 546 151 744 63 991 34 257 46 187 1 319 5 990Sequoyah County 02------------------ 37 886 178 740 81 744 36 741 50 094 2 525 7 636Stephens County 04------------------- 43 076 212 803 115 098 47 339 38 108 6 708 5 550Texas County 06---------------------- 18 329 95 971 27 726 50 048 13 001 1 968 3 228
Tillman County 04--------------------- 9 419 71 477 23 440 32 145 12 472 1 416 2 003Tulsa County 01---------------------- 548 296 2 158 695 1 056 473 496 096 275 825 122 567 207 734Wagoner County 01 02------------------- 56 115 126 558 64 048 35 772 22 504 672 3 562Washington County 05----------------- 47 674 190 824 121 698 46 751 18 983 1 559 1 832Washita County 06-------------------- 11 692 70 806 27 276 29 319 5 805 6 125 2 281
Woods County 06--------------------- 8 171 55 416 21 820 24 076 5 388 2 052 2 079Woodward County 06------------------ 18 588 72 676 35 595 22 847 7 138 2 002 5 095State undistributed------------------ 700 687 4 606 689 550 6 530 – –
Oregon ----------------------------- 3 316 154 15 592 250 6 523 701 3 278 892 3 518 292 765 495 1 505 869Baker County 02---------------------- 16 259 103 695 44 988 14 709 28 808 3 032 12 158Benton County 04 05--------------------- 77 192 308 917 119 941 43 398 99 029 13 016 33 533Clackamas County 01 03 05----------------- 338 251 985 590 545 293 173 651 139 569 36 772 90 305Clatsop County 01--------------------- 35 323 171 140 82 534 30 549 24 579 14 080 19 397Columbia County 01------------------- 45 368 137 387 78 105 28 561 20 402 5 755 4 564
Coos County 04----------------------- 61 670 345 747 178 685 59 176 63 972 18 313 25 602Crook County 02---------------------- 17 686 81 134 40 211 14 680 9 362 3 678 13 204Curry County 04---------------------- 21 170 128 867 81 989 24 810 13 173 2 894 6 000Deschutes County 02------------------ 110 810 378 334 229 873 62 818 42 806 9 078 33 760Douglas County 04-------------------- 101 805 504 292 274 819 83 561 68 688 14 290 62 934
Gilliam County 02--------------------- 2 074 19 817 4 926 9 786 4 703 71 330Grant County 02---------------------- 7 855 46 573 20 138 5 977 6 912 2 591 10 955Harney County 02--------------------- 7 295 43 005 16 910 6 477 9 534 1 620 8 463Hood River County 02----------------- 19 917 71 673 34 475 10 802 14 515 5 918 5 963Jackson County 02-------------------- 175 822 763 360 420 026 127 342 115 504 22 258 78 230
Jefferson County 02------------------- 16 861 77 442 36 750 14 046 19 108 979 6 559Josephine County 02 04------------------ 74 919 378 047 222 085 69 543 65 345 6 294 14 780Klamath County 02-------------------- 63 435 304 352 150 939 54 286 45 075 10 967 43 086Lake County 02----------------------- 7 173 54 133 20 566 6 758 6 354 9 832 10 623Lane County 04----------------------- 314 901 1 306 382 640 177 232 808 302 649 34 364 96 383
Lincoln County 05--------------------- 44 985 227 956 130 247 42 524 30 555 11 261 13 369Linn County 04------------------------ 105 337 408 627 216 977 76 592 85 964 8 167 20 928Malheur County 02-------------------- 28 445 121 248 55 031 29 271 26 344 1 809 8 794Marion County 05--------------------- 272 760 1 543 934 596 846 189 971 655 503 21 444 80 170Morrow County 02--------------------- 10 513 55 711 17 583 20 876 11 592 3 278 2 382
Multnomah County 01 03----------------- 633 224 3 783 428 1 260 520 571 666 931 167 370 373 649 701Polk County 05----------------------- 62 396 280 151 78 216 43 778 149 588 1 923 6 646Sherman County 02------------------- 1 786 31 155 5 185 13 712 6 026 2 786 3 446Tillamook County 05------------------- 24 420 125 404 69 905 25 305 21 129 2 428 6 636Umatilla County 02-------------------- 66 803 369 668 132 072 77 082 65 511 61 084 33 919
See footnotes at end of table.
Consolidated Federal Funds Report for Fiscal Year 1999 57U.S. Census Bureau

Table 15. Federal Government Expenditure, by State and County Area: Fiscal Year 1999mCon.[Thousand dollars]
State and county area Congressionaldistrict
Federal government expenditure
United Statesresident
population1 TotalRetirement and
DisabilityOther Direct
Payments Grants ProcurementSalaries and
Wages
OregonmCon.Union County 02---------------------- 24 807 112 426 54 859 27 600 19 052 1 708 9 206Wallowa County 02-------------------- 7 258 48 977 18 757 9 903 13 746 2 174 4 397Wasco County 02--------------------- 23 346 134 123 56 430 24 488 26 652 11 923 14 630Washington County 01----------------- 409 305 833 799 430 001 186 913 132 483 41 251 43 152Wheeler County 02-------------------- 1 559 7 239 4 666 1 939 210 57 367Yamhill County 01--------------------- 83 424 273 486 137 256 60 219 36 689 8 029 31 293State undistributed------------------ 1 025 029 15 720 803 316 205 994 – –
Pennsylvania ------------------------ 11 994 016 69 448 043 27 173 788 17 776 240 13 140 671 5 933 771 5 423 573Adams County 19--------------------- 87 697 306 828 169 666 58 095 45 659 12 095 21 313Allegheny County 04 14 18 20------------------- 1 256 806 9 270 321 3 153 700 2 128 328 1 538 374 1 651 248 798 670Armstrong County 05 12------------------ 73 001 386 511 196 697 99 284 74 079 3 996 12 455Beaver County 04--------------------- 182 687 834 471 445 377 241 228 112 742 14 414 20 709Bedford County 09-------------------- 49 699 215 296 109 549 49 965 39 366 9 143 7 273
Berks County 06---------------------- 358 211 1 343 046 718 782 319 980 180 077 60 190 64 017Blair County 09----------------------- 129 937 673 844 328 093 149 457 137 303 13 638 45 353Bradford County 10-------------------- 62 146 286 794 134 099 52 366 66 111 22 701 11 518Bucks County 08---------------------- 594 047 1 942 958 1 048 694 489 323 178 098 149 147 77 695Butler County 04 21---------------------- 172 522 772 283 344 917 177 613 97 528 92 482 59 742
Cambria County 12-------------------- 153 766 992 009 424 156 225 783 142 120 125 201 74 749Cameron County 05------------------- 5 571 36 962 15 557 9 022 11 090 284 1 010Carbon County 11--------------------- 58 759 268 268 152 225 73 895 31 983 3 400 6 765Centre County 05 09--------------------- 132 190 678 422 189 912 102 275 283 935 73 414 28 886Chester County 07 16-------------------- 430 001 1 499 986 669 913 299 678 163 235 204 483 162 677
Clarion County 05 12--------------------- 41 651 187 813 87 909 55 946 35 292 2 611 6 055Clearfield County 05 09------------------- 80 732 365 757 186 828 94 245 63 668 5 749 15 268Clinton County 05--------------------- 36 774 171 010 81 494 42 499 23 988 14 869 8 161Columbia County 11------------------- 63 674 257 634 136 179 65 537 34 264 12 744 8 909Crawford County 05 21------------------- 89 109 382 585 198 252 96 410 68 732 6 381 12 810
Cumberland County 17 19---------------- 210 663 1 187 124 534 636 160 207 75 607 59 848 356 826Dauphin County 17-------------------- 245 576 3 331 412 709 950 276 624 2 031 612 140 864 172 362Delaware County 01 02 07 16------------------- 541 502 2 495 707 1 210 804 686 136 287 378 181 995 129 394Elk County 05------------------------- 34 344 140 943 78 670 37 182 17 939 1 577 5 576Erie County 21------------------------ 276 993 1 194 276 564 193 274 535 234 070 41 455 80 023
Fayette County 12 20--------------------- 143 775 913 373 417 547 252 151 209 537 8 475 25 664Forest County 05---------------------- 4 938 32 413 16 683 8 210 4 308 1 057 2 155Franklin County 09-------------------- 128 812 614 832 321 643 95 718 64 545 53 730 79 197Fulton County 09---------------------- 14 616 57 926 30 608 11 786 11 757 2 182 1 592Greene County 20--------------------- 42 072 199 964 97 714 57 317 51 450 ~14 649 8 132
Huntingdon County 09----------------- 44 753 190 500 94 390 42 956 43 736 2 896 6 522Indiana County 12--------------------- 87 831 415 658 190 711 110 626 92 532 6 299 15 490Jefferson County 05------------------- 46 086 217 846 114 296 56 477 37 594 1 747 7 732Juniata County 09--------------------- 22 204 75 826 41 608 18 863 10 822 855 3 677Lackawanna County 10---------------- 206 520 1 235 633 568 423 310 018 161 816 136 364 59 011
Lancaster County 16 17------------------- 460 035 1 510 893 838 092 310 442 183 161 88 829 90 370Lawrence County 04------------------- 94 508 523 954 262 459 145 109 72 522 18 482 25 382Lebanon County 17-------------------- 117 856 539 856 273 719 99 164 54 709 16 203 96 061Lehigh County 15--------------------- 299 855 1 207 741 536 984 308 823 179 915 109 218 72 801Luzerne County 11-------------------- 312 000 1 830 367 888 819 463 836 251 196 73 810 152 706
Lycoming County 05 10------------------- 116 709 525 917 258 720 118 639 90 160 22 179 36 218McKean County 05-------------------- 45 987 230 048 108 366 50 602 39 209 4 530 27 341Mercer County 21--------------------- 121 458 586 676 313 816 162 669 88 713 4 350 17 127Mifflin County 09---------------------- 46 793 206 649 98 959 50 720 48 246 2 234 6 491Monroe County 10 11--------------------- 128 541 546 173 253 384 105 185 35 027 56 539 96 039
Montgomery County 2---------------- 724 087 3 241 400 1 579 254 728 046 269 654 424 234 240 211
Montour County 11-------------------- 17 571 79 144 39 499 20 415 16 430 708 2 092Northampton County 15---------------- 259 736 1 159 885 591 497 307 338 158 032 28 114 74 905Northumberland County 06 11------------- 93 163 439 569 241 181 115 231 66 098 4 525 12 534Perry County 09 17----------------------- 44 280 159 556 84 257 34 785 32 995 2 541 4 977
Philadelphia County 01 02 03---------------- 1 417 601 12 566 479 3 389 213 2 751 077 3 519 122 1 230 961 1 676 106Pike County 10----------------------- 41 357 119 046 76 549 26 178 5 244 1 289 9 785Potter County 05---------------------- 17 115 78 955 39 604 16 057 19 527 928 2 839Schuylkill County 06------------------- 148 788 751 874 411 695 197 972 86 320 14 997 40 891Snyder County 09--------------------- 37 875 119 458 69 550 28 749 15 571 1 131 4 457
Somerset County 12------------------- 80 028 374 058 186 794 100 070 67 248 8 091 11 855Sullivan County 10-------------------- 6 038 31 597 17 651 6 675 5 039 718 1 515Susquehanna County 10--------------- 42 190 159 584 89 719 36 152 24 597 2 036 7 079Tioga County 05---------------------- 41 657 213 758 91 578 38 145 73 138 2 094 8 803Union County 05---------------------- 40 546 229 674 71 043 27 574 34 487 11 322 85 248
Venango County 05------------------- 57 562 273 605 140 556 67 870 54 973 2 523 7 683Warren County 05--------------------- 43 505 180 225 98 419 43 559 23 076 5 762 9 409Washington County 20----------------- 204 888 1 062 971 528 141 299 770 188 947 13 296 32 817Wayne County 10--------------------- 46 080 336 594 136 109 50 097 24 590 118 451 7 347Westmoreland County 04 12 20-------------- 370 658 1 747 407 891 841 521 797 250 544 23 212 60 012
Wyoming County 10------------------- 29 298 100 700 56 289 25 042 14 380 1 066 3 922York County 19----------------------- 376 586 1 742 326 703 447 246 472 154 731 536 512 101 162State undistributed------------------ 3 395 673 22 707 3 042 243 330 722 – –
Rhode Island ------------------------ 990 819 6 036 064 2 166 016 1 315 460 1 410 994 421 046 722 548Bristol County 01---------------------- 49 102 194 362 108 362 47 152 27 829 2 766 8 253Kent County 02----------------------- 162 120 715 572 375 226 177 870 108 392 12 088 41 996Newport County 01-------------------- 83 024 1 013 017 214 442 74 133 56 322 295 594 372 527Providence County 01 02----------------- 574 108 3 308 607 1 231 172 658 084 1 075 597 90 727 253 027Washington County 02----------------- 122 465 482 615 231 014 98 218 86 768 19 871 46 745State undistributed------------------ 321 891 5 802 260 003 56 087 – –
South Carolina----------------------- 3 885 736 20 833 188 8 087 374 3 885 614 3 878 727 2 540 236 2 441 237Abbeville County 03------------------- 24 681 92 718 49 154 15 589 24 812 545 2 619Aiken County 02 03---------------------- 135 401 1 969 834 285 995 108 949 93 499 1 427 484 53 908Allendale County 02------------------- 11 325 60 510 20 292 15 761 22 742 377 1 338Anderson County 03------------------- 162 793 570 432 328 359 123 042 90 770 6 102 22 159Bamberg County 06------------------- 16 289 93 115 31 845 21 812 31 470 5 725 2 263
See footnotes at end of table.
58 Consolidated Federal Funds Report for Fiscal Year 1999U.S. Census Bureau
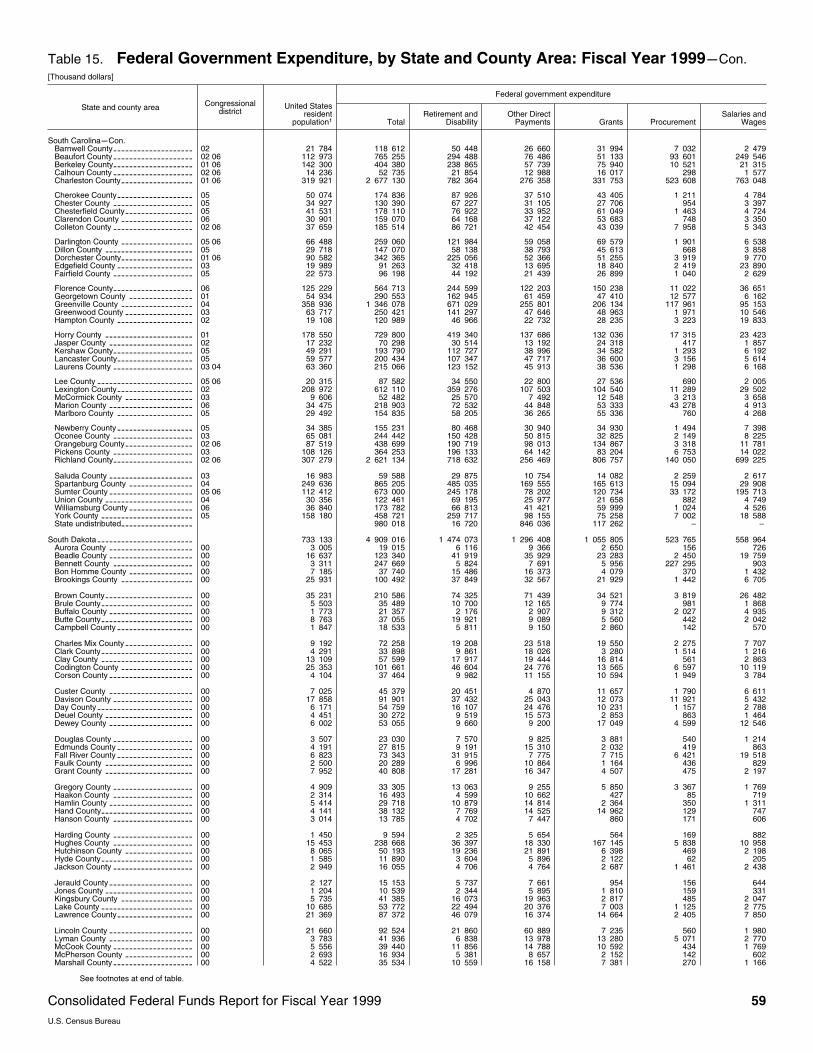
Table 15. Federal Government Expenditure, by State and County Area: Fiscal Year 1999mCon.[Thousand dollars]
State and county area Congressionaldistrict
Federal government expenditure
United Statesresident
population1 TotalRetirement and
DisabilityOther Direct
Payments Grants ProcurementSalaries and
Wages
South CarolinamCon.Barnwell County 02-------------------- 21 784 118 612 50 448 26 660 31 994 7 032 2 479Beaufort County 02 06-------------------- 112 973 765 255 294 488 76 486 51 133 93 601 249 546Berkeley County 01 06-------------------- 142 300 404 380 238 865 57 739 75 940 10 521 21 315Calhoun County 02 06-------------------- 14 236 52 735 21 854 12 988 16 017 298 1 577Charleston County 01 06------------------ 319 921 2 677 130 782 364 276 358 331 753 523 608 763 048
Cherokee County 05------------------- 50 074 174 836 87 926 37 510 43 405 1 211 4 784Chester County 05-------------------- 34 927 130 390 67 227 31 105 27 706 954 3 397Chesterfield County 05----------------- 41 531 178 110 76 922 33 952 61 049 1 463 4 724Clarendon County 06------------------ 30 901 159 070 64 168 37 122 53 683 748 3 350Colleton County 02 06-------------------- 37 659 185 514 86 721 42 454 43 039 7 958 5 343
Darlington County 05 06------------------ 66 488 259 060 121 984 59 058 69 579 1 901 6 538Dillon County 05---------------------- 29 718 147 070 58 138 38 793 45 613 668 3 858Dorchester County 01 06------------------ 90 582 342 365 225 056 52 366 51 255 3 919 9 770Edgefield County 03------------------- 19 989 91 263 32 418 13 695 18 840 2 419 23 890Fairfield County 05-------------------- 22 573 96 198 44 192 21 439 26 899 1 040 2 629
Florence County 06-------------------- 125 229 564 713 244 599 122 203 150 238 11 022 36 651Georgetown County 01---------------- 54 934 290 553 162 945 61 459 47 410 12 577 6 162Greenville County 04------------------ 358 936 1 346 078 671 029 255 801 206 134 117 961 95 153Greenwood County 03----------------- 63 717 250 421 141 297 47 646 48 963 1 971 10 546Hampton County 02------------------- 19 108 120 989 46 966 22 732 28 235 3 223 19 833
Horry County 01---------------------- 178 550 729 800 419 340 137 686 132 036 17 315 23 423Jasper County 02--------------------- 17 232 70 298 30 514 13 192 24 318 417 1 857Kershaw County 05-------------------- 49 291 193 790 112 727 38 996 34 582 1 293 6 192Lancaster County 05------------------- 59 577 200 434 107 347 47 717 36 600 3 156 5 614Laurens County 03 04-------------------- 63 360 215 066 123 152 45 913 38 536 1 298 6 168
Lee County 05 06------------------------ 20 315 87 582 34 550 22 800 27 536 690 2 005Lexington County 02------------------- 208 972 612 110 359 276 107 503 104 540 11 289 29 502McCormick County 03----------------- 9 606 52 482 25 570 7 492 12 548 3 213 3 658Marion County 06--------------------- 34 475 218 903 72 532 44 848 53 333 43 278 4 913Marlboro County 05------------------- 29 492 154 835 58 205 36 265 55 336 760 4 268
Newberry County 05------------------- 34 385 155 231 80 468 30 940 34 930 1 494 7 398Oconee County 03-------------------- 65 081 244 442 150 428 50 815 32 825 2 149 8 225Orangeburg County 02 06----------------- 87 519 438 699 190 719 98 013 134 867 3 318 11 781Pickens County 03-------------------- 108 126 364 253 196 133 64 142 83 204 6 753 14 022Richland County 02 06-------------------- 307 279 2 621 134 718 632 256 469 806 757 140 050 699 225
Saluda County 03--------------------- 16 983 59 588 29 875 10 754 14 082 2 259 2 617Spartanburg County 04---------------- 249 636 865 205 485 035 169 555 165 613 15 094 29 908Sumter County 05 06--------------------- 112 412 673 000 245 178 78 202 120 734 33 172 195 713Union County 04---------------------- 30 356 122 461 69 195 25 977 21 658 882 4 749Williamsburg County 06---------------- 36 840 173 782 66 813 41 421 59 999 1 024 4 526York County 05----------------------- 158 180 458 721 259 717 98 155 75 258 7 002 18 588State undistributed------------------ 980 018 16 720 846 036 117 262 – –
South Dakota------------------------ 733 133 4 909 016 1 474 073 1 296 408 1 055 805 523 765 558 964Aurora County 00--------------------- 3 005 19 015 6 116 9 366 2 650 156 726Beadle County 00--------------------- 16 637 123 340 41 919 35 929 23 283 2 450 19 759Bennett County 00-------------------- 3 311 247 669 5 824 7 691 5 956 227 295 903Bon Homme County 00---------------- 7 185 37 740 15 486 16 373 4 079 370 1 432Brookings County 00------------------ 25 931 100 492 37 849 32 567 21 929 1 442 6 705
Brown County 00---------------------- 35 231 210 586 74 325 71 439 34 521 3 819 26 482Brule County 00----------------------- 5 503 35 489 10 700 12 165 9 774 981 1 868Buffalo County 00--------------------- 1 773 21 357 2 176 2 907 9 312 2 027 4 935Butte County 00----------------------- 8 763 37 055 19 921 9 089 5 560 442 2 042Campbell County 00------------------- 1 847 18 533 5 811 9 150 2 860 142 570
Charles Mix County 00----------------- 9 192 72 258 19 208 23 518 19 550 2 275 7 707Clark County 00----------------------- 4 291 33 898 9 861 18 026 3 280 1 514 1 216Clay County 00----------------------- 13 109 57 599 17 917 19 444 16 814 561 2 863Codington County 00------------------ 25 353 101 661 46 604 24 776 13 565 6 597 10 119Corson County 00--------------------- 4 104 37 464 9 982 11 155 10 594 1 949 3 784
Custer County 00--------------------- 7 025 45 379 20 451 4 870 11 657 1 790 6 611Davison County 00-------------------- 17 858 91 901 37 432 25 043 12 073 11 921 5 432Day County 00------------------------ 6 171 54 759 16 107 24 476 10 231 1 157 2 788Deuel County 00---------------------- 4 451 30 272 9 519 15 573 2 853 863 1 464Dewey County 00--------------------- 6 002 53 055 9 660 9 200 17 049 4 599 12 546
Douglas County 00-------------------- 3 507 23 030 7 570 9 825 3 881 540 1 214Edmunds County 00------------------- 4 191 27 815 9 191 15 310 2 032 419 863Fall River County 00------------------- 6 823 73 343 31 915 7 775 7 715 6 421 19 518Faulk County 00---------------------- 2 500 20 289 6 996 10 864 1 164 436 829Grant County 00---------------------- 7 952 40 808 17 281 16 347 4 507 475 2 197
Gregory County 00-------------------- 4 909 33 305 13 063 9 255 5 850 3 367 1 769Haakon County 00-------------------- 2 314 16 493 4 599 10 662 427 85 719Hamlin County 00--------------------- 5 414 29 718 10 879 14 814 2 364 350 1 311Hand County 00----------------------- 4 141 38 132 7 769 14 525 14 962 129 747Hanson County 00-------------------- 3 014 13 785 4 702 7 447 860 171 606
Harding County 00-------------------- 1 450 9 594 2 325 5 654 564 169 882Hughes County 00-------------------- 15 453 238 668 36 397 18 330 167 145 5 838 10 958Hutchinson County 00----------------- 8 065 50 193 19 236 21 891 6 398 469 2 198Hyde County 00----------------------- 1 585 11 890 3 604 5 896 2 122 62 205Jackson County 00-------------------- 2 949 16 055 4 706 4 764 2 687 1 461 2 438
Jerauld County 00--------------------- 2 127 15 153 5 737 7 661 954 156 644Jones County 00---------------------- 1 204 10 539 2 344 5 895 1 810 159 331Kingsbury County 00------------------ 5 735 41 385 16 073 19 963 2 817 485 2 047Lake County 00----------------------- 10 685 53 772 22 494 20 376 7 003 1 125 2 775Lawrence County 00------------------- 21 369 87 372 46 079 16 374 14 664 2 405 7 850
Lincoln County 00--------------------- 21 660 92 524 21 860 60 889 7 235 560 1 980Lyman County 00--------------------- 3 783 41 936 6 838 13 978 13 280 5 071 2 770McCook County 00-------------------- 5 556 39 440 11 856 14 788 10 592 434 1 769McPherson County 00----------------- 2 693 16 934 5 381 8 657 2 152 142 602Marshall County 00-------------------- 4 522 35 534 10 559 16 158 7 381 270 1 166
See footnotes at end of table.
Consolidated Federal Funds Report for Fiscal Year 1999 59U.S. Census Bureau

Table 15. Federal Government Expenditure, by State and County Area: Fiscal Year 1999mCon.[Thousand dollars]
State and county area Congressionaldistrict
Federal government expenditure
United Statesresident
population1 TotalRetirement and
DisabilityOther Direct
Payments Grants ProcurementSalaries and
Wages
South DakotamCon.Meade County 00--------------------- 21 405 137 428 46 571 19 905 13 514 30 925 26 513Mellette County 00-------------------- 2 043 12 862 2 907 3 961 5 490 85 419Miner County 00---------------------- 2 684 20 223 6 592 10 040 2 598 185 808Minnehaha County 00----------------- 142 821 611 393 251 870 101 752 87 610 63 240 106 920Moody County 00--------------------- 6 432 42 446 11 919 15 306 7 165 2 581 5 475
Pennington County 00----------------- 88 117 559 118 204 697 71 105 80 256 34 899 168 160Perkins County 00--------------------- 3 466 26 322 9 007 12 433 3 375 258 1 249Potter County 00---------------------- 2 838 26 687 7 500 14 360 3 509 221 1 098Roberts County 00-------------------- 9 804 71 134 19 780 24 121 18 936 2 478 5 820Sanborn County 00-------------------- 2 680 24 438 6 038 9 975 7 410 213 801
Shannon County 00------------------- 12 468 142 611 16 508 12 214 86 319 6 448 21 121Spink County 00---------------------- 7 433 62 458 18 090 32 135 9 074 570 2 590Stanley County 00--------------------- 2 895 15 384 4 675 9 012 1 402 43 251Sully County 00----------------------- 1 485 21 189 2 697 14 051 4 116 57 268Todd County 00----------------------- 9 496 72 877 10 808 8 057 42 116 580 11 317
Tripp County 00----------------------- 6 622 35 547 14 099 14 705 4 432 389 1 921Turner County 00--------------------- 8 660 45 643 18 629 18 439 6 122 559 1 893Union County 00---------------------- 12 472 130 212 23 110 22 222 10 617 72 141 2 121Walworth County 00------------------- 5 614 29 780 11 431 11 384 4 843 453 1 670Yankton County 00-------------------- 21 190 89 583 38 247 25 706 12 150 3 475 10 006Ziebach County 00-------------------- 2 165 12 092 2 095 6 061 3 326 416 193State undistributed------------------ 212 363 484 98 612 113 267 – –
Tennessee -------------------------- 5 483 535 30 866 836 11 091 720 6 636 873 5 900 009 4 520 355 2 717 878Anderson County 03------------------- 71 004 2 209 749 196 326 73 073 63 118 1 804 933 72 299Bedford County 04-------------------- 34 905 121 237 66 223 28 617 20 953 1 012 4 431Benton County 08--------------------- 16 497 82 381 45 384 20 646 13 063 704 2 584Bledsoe County 03-------------------- 10 945 42 529 17 320 11 986 11 999 364 860Blount County 02---------------------- 102 785 673 067 222 605 88 867 61 732 285 244 14 619
Bradley County 02 03--------------------- 84 126 280 296 147 963 73 205 42 381 3 849 12 897Campbell County 04------------------- 38 466 223 755 106 150 52 946 43 863 16 049 4 747Cannon County 06-------------------- 12 248 51 513 24 801 16 748 8 242 409 1 313Carroll County 08--------------------- 29 450 155 006 72 693 40 805 32 201 4 719 4 588Carter County 01---------------------- 53 299 214 314 109 365 46 438 50 302 2 977 5 232
Cheatham County 07------------------ 36 128 80 953 45 088 19 734 10 194 1 799 4 138Chester County 07-------------------- 14 859 57 637 23 980 14 655 16 982 327 1 693Claiborne County 04------------------- 29 747 166 661 71 262 34 268 56 817 985 3 328Clay County 06----------------------- 7 268 38 939 12 534 9 723 14 095 723 1 864Cocke County 01---------------------- 32 291 155 740 71 569 34 257 45 242 986 3 686
Coffee County 04--------------------- 46 355 538 875 114 185 51 349 30 234 318 923 24 184Crockett County 08-------------------- 14 077 74 114 29 380 24 653 16 180 1 381 2 521Cumberland County 04---------------- 45 326 214 270 130 260 46 313 26 255 6 798 4 645Davidson County 05 06------------------- 530 050 3 562 813 1 033 531 584 714 1 339 555 165 320 439 693Decatur County 07-------------------- 10 788 61 731 24 784 19 862 14 485 483 2 117
De Kalb County 06-------------------- 16 174 82 150 34 104 22 171 21 996 1 746 2 133Dickson County 07-------------------- 43 017 145 653 80 437 37 218 21 312 1 274 5 412Dyer County 08----------------------- 36 725 173 455 76 600 48 931 38 892 2 775 6 256Fayette County 07--------------------- 31 441 117 649 40 735 30 963 42 247 730 2 975Fentress County 04-------------------- 16 357 91 894 38 291 26 241 24 177 941 2 244
Franklin County 04-------------------- 37 826 166 240 84 302 43 806 23 243 6 955 7 935Gibson County 08--------------------- 48 030 268 750 114 347 81 311 60 906 2 857 9 330Giles County 04----------------------- 29 036 123 389 59 059 31 741 27 083 1 286 4 220Grainger County 04-------------------- 20 219 105 841 40 739 20 130 41 348 622 3 001Greene County 01--------------------- 60 900 303 255 134 935 56 915 52 679 49 043 9 682
Grundy County 03--------------------- 14 046 67 537 33 433 18 137 14 141 378 1 448Hamblen County 04------------------- 54 201 225 236 111 720 55 293 46 863 1 977 9 383Hamilton County 03------------------- 294 720 2 155 834 718 895 341 278 263 812 426 783 405 065Hancock County 01-------------------- 6 767 41 060 13 159 9 546 17 594 205 555Hardeman County 07------------------ 24 451 153 097 54 217 33 068 41 218 21 364 3 230
Hardin County 04--------------------- 25 247 141 841 54 252 31 101 50 064 1 082 5 342Hawkins County 01-------------------- 50 109 304 673 103 295 42 460 45 577 99 706 13 635Haywood County 08------------------- 19 416 107 627 33 786 33 833 36 437 523 3 048Henderson County 07------------------ 24 767 129 803 51 895 30 961 36 913 7 094 2 941Henry County 08---------------------- 30 091 171 585 81 233 40 591 38 393 3 642 7 725
Hickman County 07-------------------- 21 283 73 279 39 169 17 202 13 033 654 3 222Houston County 08-------------------- 7 888 39 755 21 506 8 617 8 007 336 1 288Humphreys County 08----------------- 17 192 177 297 39 738 18 274 22 627 74 852 21 805Jackson County 06-------------------- 9 643 47 146 18 096 13 345 13 986 401 1 318Jefferson County 01------------------- 45 104 183 763 100 455 40 388 35 443 1 561 5 916
Johnson County 01-------------------- 16 736 82 237 39 716 19 811 20 025 625 2 059Knox County 01 02 04----------------------- 376 039 1 821 870 783 520 353 445 321 926 147 887 215 091Lake County 08----------------------- 8 131 47 482 14 772 14 868 13 046 3 601 1 194Lauderdale County 08----------------- 24 234 131 301 49 945 40 301 36 308 1 473 3 275Lawrence County 04------------------- 39 626 170 680 87 651 42 873 31 675 2 348 6 133
Lewis County 07---------------------- 11 127 44 207 20 135 12 991 9 429 242 1 410Lincoln County 04--------------------- 29 773 131 017 68 939 27 658 29 222 983 4 215Loudon County 02--------------------- 39 892 176 350 101 880 40 035 24 234 1 667 8 533McMinn County 02-------------------- 46 395 198 927 101 370 47 903 38 920 4 778 5 955McNairy County 07-------------------- 24 312 162 640 59 018 33 220 64 909 995 4 498
Macon County 06--------------------- 18 542 71 807 30 138 21 436 17 744 459 2 031Madison County 08-------------------- 86 752 378 912 167 754 95 744 80 457 5 992 28 965Marion County 03--------------------- 26 907 123 429 59 232 34 152 25 104 981 3 959Marshall County 06-------------------- 26 423 91 989 45 057 25 743 15 831 2 017 3 342Maury County 07---------------------- 70 440 252 913 125 952 61 596 48 017 6 253 11 095
Meigs County 03---------------------- 10 134 43 417 23 265 8 958 9 260 284 1 650Monroe County 02--------------------- 35 576 153 956 76 990 31 457 39 679 1 423 4 407Montgomery County 07---------------- 129 411 496 207 279 176 75 034 59 673 10 118 72 205Moore County 04---------------------- 5 140 15 016 7 186 4 401 2 969 106 353Morgan County 03--------------------- 18 689 73 156 33 311 16 902 18 486 455 4 001
See footnotes at end of table.
60 Consolidated Federal Funds Report for Fiscal Year 1999U.S. Census Bureau
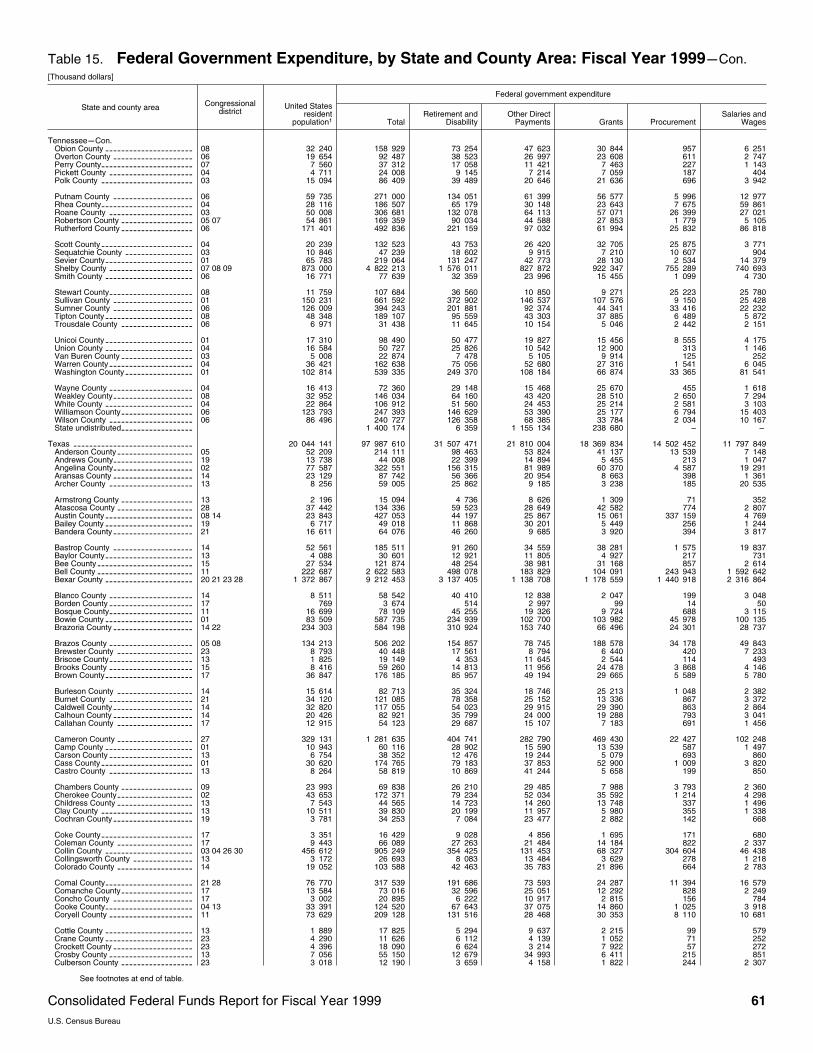
Table 15. Federal Government Expenditure, by State and County Area: Fiscal Year 1999mCon.[Thousand dollars]
State and county area Congressionaldistrict
Federal government expenditure
United Statesresident
population1 TotalRetirement and
DisabilityOther Direct
Payments Grants ProcurementSalaries and
Wages
TennesseemCon.Obion County 08---------------------- 32 240 158 929 73 254 47 623 30 844 957 6 251Overton County 06-------------------- 19 654 92 487 38 523 26 997 23 608 611 2 747Perry County 07----------------------- 7 560 37 312 17 058 11 421 7 463 227 1 143Pickett County 04--------------------- 4 711 24 008 9 145 7 214 7 059 187 404Polk County 03----------------------- 15 094 86 409 39 489 20 646 21 636 696 3 942
Putnam County 06-------------------- 59 735 271 000 134 051 61 399 56 577 5 996 12 977Rhea County 04----------------------- 28 116 186 507 65 179 30 148 23 643 7 675 59 861Roane County 03--------------------- 50 008 306 681 132 078 64 113 57 071 26 399 27 021Robertson County 05 07------------------ 54 861 169 359 90 034 44 588 27 853 1 779 5 105Rutherford County 06------------------ 171 401 492 836 221 159 97 032 61 994 25 832 86 818
Scott County 04----------------------- 20 239 132 523 43 753 26 420 32 705 25 875 3 771Sequatchie County 03----------------- 10 846 47 239 18 602 9 915 7 210 10 607 904Sevier County 01---------------------- 65 783 219 064 131 247 42 773 28 130 2 534 14 379Shelby County 07 08 09--------------------- 873 000 4 822 213 1 576 011 827 872 922 347 755 289 740 693Smith County 06---------------------- 16 771 77 639 32 359 23 996 15 455 1 099 4 730
Stewart County 08--------------------- 11 759 107 684 36 560 10 850 9 271 25 223 25 780Sullivan County 01-------------------- 150 231 661 592 372 902 146 537 107 576 9 150 25 428Sumner County 06-------------------- 126 009 394 243 201 881 92 374 44 341 33 416 22 232Tipton County 08---------------------- 48 348 189 107 95 559 43 303 37 885 6 489 5 872Trousdale County 06------------------ 6 971 31 438 11 645 10 154 5 046 2 442 2 151
Unicoi County 01---------------------- 17 310 98 490 50 477 19 827 15 456 8 555 4 175Union County 04---------------------- 16 584 50 727 25 826 10 542 12 900 313 1 146Van Buren County 03------------------ 5 008 22 874 7 478 5 105 9 914 125 252Warren County 04--------------------- 36 421 162 638 75 056 52 680 27 316 1 541 6 045Washington County 01----------------- 102 814 539 335 249 370 108 184 66 874 33 365 81 541
Wayne County 04--------------------- 16 413 72 360 29 148 15 468 25 670 455 1 618Weakley County 08-------------------- 32 952 146 034 64 160 43 420 28 510 2 650 7 294White County 04---------------------- 22 864 106 912 51 560 24 453 25 214 2 581 3 103Williamson County 06------------------ 123 793 247 393 146 629 53 390 25 177 6 794 15 403Wilson County 06--------------------- 86 496 240 727 126 358 68 385 33 784 2 034 10 167State undistributed------------------ 1 400 174 6 359 1 155 134 238 680 – –
Texas ------------------------------ 20 044 141 97 987 610 31 507 471 21 810 004 18 369 834 14 502 452 11 797 849Anderson County 05------------------- 52 209 214 111 98 463 53 824 41 137 13 539 7 148Andrews County 19-------------------- 13 738 44 008 22 399 14 894 5 455 213 1 047Angelina County 02-------------------- 77 587 322 551 156 315 81 989 60 370 4 587 19 291Aransas County 14-------------------- 23 129 87 742 56 366 20 954 8 663 398 1 361Archer County 13--------------------- 8 256 59 005 25 862 9 185 3 238 185 20 535
Armstrong County 13------------------ 2 196 15 094 4 736 8 626 1 309 71 352Atascosa County 28------------------- 37 442 134 336 59 523 28 649 42 582 774 2 807Austin County 08 14---------------------- 23 843 427 053 44 197 25 867 15 061 337 159 4 769Bailey County 19---------------------- 6 717 49 018 11 868 30 201 5 449 256 1 244Bandera County 21-------------------- 16 611 64 076 46 260 9 685 3 920 394 3 817
Bastrop County 14-------------------- 52 561 185 511 91 260 34 559 38 281 1 575 19 837Baylor County 13---------------------- 4 088 30 601 12 921 11 805 4 927 217 731Bee County 15------------------------ 27 534 121 874 48 254 38 981 31 168 857 2 614Bell County 11------------------------ 222 687 2 622 583 498 078 183 829 104 091 243 943 1 592 642Bexar County 20 21 23 28---------------------- 1 372 867 9 212 453 3 137 405 1 138 708 1 178 559 1 440 918 2 316 864
Blanco County 14--------------------- 8 511 58 542 40 410 12 838 2 047 199 3 048Borden County 17--------------------- 769 3 674 514 2 997 99 14 50Bosque County 11--------------------- 16 699 78 109 45 255 19 326 9 724 688 3 115Bowie County 01---------------------- 83 509 587 735 234 939 102 700 103 982 45 978 100 135Brazoria County 14 22-------------------- 234 303 584 198 310 924 153 740 66 496 24 301 28 737
Brazos County 05 08--------------------- 134 213 506 202 154 857 78 745 188 578 34 178 49 843Brewster County 23------------------- 8 793 40 448 17 561 8 794 6 440 420 7 233Briscoe County 13--------------------- 1 825 19 149 4 353 11 645 2 544 114 493Brooks County 15--------------------- 8 416 59 260 14 813 11 956 24 478 3 868 4 146Brown County 17---------------------- 36 847 176 185 85 957 49 194 29 665 5 589 5 780
Burleson County 14------------------- 15 614 82 713 35 324 18 746 25 213 1 048 2 382Burnet County 21--------------------- 34 120 121 085 78 358 25 152 13 336 867 3 372Caldwell County 14-------------------- 32 820 117 055 54 023 29 915 29 390 863 2 864Calhoun County 14-------------------- 20 426 82 921 35 799 24 000 19 288 793 3 041Callahan County 17------------------- 12 915 54 123 29 687 15 107 7 183 691 1 456
Cameron County 27------------------- 329 131 1 281 635 404 741 282 790 469 430 22 427 102 248Camp County 01---------------------- 10 943 60 116 28 902 15 590 13 539 587 1 497Carson County 13--------------------- 6 754 38 352 12 476 19 244 5 079 693 860Cass County 01----------------------- 30 620 174 765 79 183 37 853 52 900 1 009 3 820Castro County 13--------------------- 8 264 58 819 10 869 41 244 5 658 199 850
Chambers County 09------------------ 23 993 69 838 26 210 29 485 7 988 3 793 2 360Cherokee County 02------------------- 43 653 172 371 79 234 52 034 35 592 1 214 4 298Childress County 13------------------- 7 543 44 565 14 723 14 260 13 748 337 1 496Clay County 13----------------------- 10 511 39 830 20 199 11 957 5 980 355 1 338Cochran County 19-------------------- 3 781 34 253 7 084 23 477 2 882 142 668
Coke County 17----------------------- 3 351 16 429 9 028 4 856 1 695 171 680Coleman County 17------------------- 9 443 66 089 27 263 21 484 14 184 822 2 337Collin County 03 04 26 30---------------------- 456 612 905 249 354 425 131 453 68 327 304 604 46 438Collingsworth County 13--------------- 3 172 26 693 8 083 13 484 3 629 278 1 218Colorado County 14------------------- 19 052 103 588 42 463 35 783 21 896 664 2 783
Comal County 21 28---------------------- 76 770 317 539 191 686 73 593 24 287 11 394 16 579Comanche County 17------------------ 13 584 73 016 32 596 25 051 12 292 828 2 249Concho County 17-------------------- 3 002 20 895 6 222 10 917 2 815 156 784Cooke County 04 13---------------------- 33 391 124 520 67 643 37 075 14 860 1 025 3 918Coryell County 11--------------------- 73 629 209 128 131 516 28 468 30 353 8 110 10 681
Cottle County 13---------------------- 1 889 17 825 5 294 9 637 2 215 99 579Crane County 23---------------------- 4 290 11 626 6 112 4 139 1 052 71 252Crockett County 23-------------------- 4 396 18 090 6 624 3 214 7 922 57 272Crosby County 13--------------------- 7 056 55 150 12 679 34 993 6 411 215 851Culberson County 23------------------ 3 018 12 190 3 659 4 158 1 822 244 2 307
See footnotes at end of table.
Consolidated Federal Funds Report for Fiscal Year 1999 61U.S. Census Bureau

Table 15. Federal Government Expenditure, by State and County Area: Fiscal Year 1999mCon.[Thousand dollars]
State and county area Congressionaldistrict
Federal government expenditure
United Statesresident
population1 TotalRetirement and
DisabilityOther Direct
Payments Grants ProcurementSalaries and
Wages
TexasmCon.Dallam County 19--------------------- 6 627 57 629 14 785 29 759 11 328 706 1 050Dallas County 2
---------------------- 2 062 100 8 971 802 2 719 909 1 434 137 1 222 948 2 178 235 1 416 573Dawson County 17-------------------- 14 442 101 554 25 755 57 114 15 603 455 2 627Deaf Smith County 19----------------- 18 800 90 153 26 174 47 882 12 972 1 118 2 007Delta County 01----------------------- 4 973 33 481 12 301 10 015 8 663 1 500 1 003
Denton County 04 13 26--------------------- 404 074 671 142 313 236 147 186 56 612 98 203 55 904De Witt County 15--------------------- 19 275 103 396 38 023 27 144 34 817 597 2 815Dickens County 13-------------------- 2 176 21 796 6 291 12 021 2 802 128 552Dimmit County 23--------------------- 10 349 70 421 14 966 11 563 38 151 210 5 530Donley County 13--------------------- 3 827 22 752 10 057 9 431 2 483 130 650
Duval County 28---------------------- 13 647 81 407 22 475 24 424 31 425 213 2 869Eastland County 17-------------------- 17 489 105 103 50 964 30 789 19 387 853 3 110Ector County 19 23----------------------- 123 748 379 233 189 694 106 172 68 769 3 365 11 233Edwards County 23-------------------- 3 668 13 121 3 634 6 323 2 188 93 884Ellis County 06 24------------------------ 107 580 318 748 154 479 89 278 61 586 3 220 10 185
El Paso County 16 23-------------------- 701 908 3 073 775 1 098 549 496 191 595 627 248 880 634 527Erath County 17----------------------- 31 469 113 721 60 115 33 621 15 076 940 3 969Falls County 11----------------------- 17 263 112 955 40 072 29 371 31 651 919 10 942Fannin County 04--------------------- 28 677 169 556 69 951 45 522 32 611 1 459 20 013Fayette County 14--------------------- 21 390 109 763 53 212 29 348 21 519 1 980 3 706
Fisher County 17---------------------- 4 190 38 691 10 587 22 579 4 196 242 1 087Floyd County 13---------------------- 8 112 66 357 14 314 42 340 7 866 401 1 437Foard County 13---------------------- 1 631 18 911 4 578 8 768 5 215 57 294Fort Bend County 22 25------------------- 353 697 527 240 241 609 130 286 112 713 13 512 29 121Franklin County 01-------------------- 9 945 34 667 17 750 10 589 5 329 242 757
Freestone County 05------------------ 17 647 69 567 35 870 16 136 15 008 697 1 857Frio County 28------------------------ 15 918 62 514 19 810 15 965 25 104 617 1 018Gaines County 19--------------------- 14 767 81 729 16 863 56 907 6 590 242 1 128Galveston County 09------------------ 248 469 1 044 332 416 947 249 445 188 907 133 567 55 465Garza County 13---------------------- 4 515 25 017 8 600 12 060 3 528 171 658
Gillespie County 21-------------------- 20 396 95 015 62 000 21 505 6 213 1 471 3 826Glasscock County 21------------------ 1 443 16 038 1 098 12 610 2 201 28 101Goliad County 15---------------------- 7 125 30 072 13 303 8 956 6 748 199 866Gonzales County 14------------------- 17 561 97 616 39 823 23 695 25 690 638 7 770Gray County 13----------------------- 23 299 108 286 52 814 39 946 10 248 1 975 3 303
Grayson County 04-------------------- 103 728 469 804 242 124 115 824 86 923 9 317 15 617Gregg County 01 04---------------------- 113 155 460 296 248 008 115 440 75 421 4 042 17 384Grimes County 02--------------------- 24 033 83 133 37 880 20 324 21 935 730 2 264Guadalupe County 21 28------------------ 82 808 358 571 187 328 111 792 45 777 2 529 11 145Hale County 13----------------------- 36 491 184 405 60 281 85 162 31 236 2 140 5 585
Hall County 13------------------------ 3 594 35 708 9 021 18 395 7 009 227 1 056Hamilton County 11------------------- 7 609 42 848 20 782 14 420 5 568 558 1 520Hansford County 19------------------- 5 399 37 233 10 224 24 162 1 952 156 738Hardeman County 13------------------ 4 389 32 447 12 478 14 185 4 709 213 862Hardin County 02--------------------- 49 684 164 268 88 580 45 925 24 589 1 023 4 151
Harris County 2---------------------- 3 250 404 13 997 892 3 681 853 2 238 756 2 270 195 4 435 722 1 371 366
Harrison County 01-------------------- 59 797 234 136 106 238 54 623 63 989 2 262 7 024Hartley County 19--------------------- 5 274 19 424 1 917 16 777 372 57 301Haskell County 17--------------------- 5 970 54 922 16 819 27 182 9 030 341 1 549Hays County 14----------------------- 92 755 280 031 121 647 49 063 55 373 45 542 8 406
Hemphill County 13-------------------- 3 471 11 721 5 291 4 955 885 99 490Henderson County 05------------------ 70 673 236 835 126 772 62 881 40 500 1 552 5 131Hidalgo County 15--------------------- 534 907 1 810 526 554 621 446 748 579 502 102 522 127 132Hill County 11------------------------- 31 060 185 699 75 648 47 177 54 959 3 068 4 847Hockley County 19-------------------- 23 374 117 393 35 554 50 777 28 009 644 2 409
Hood County 17----------------------- 38 750 158 438 112 760 32 314 7 378 1 334 4 652Hopkins County 01-------------------- 30 614 140 698 62 251 38 769 33 770 1 162 4 745Houston County 02-------------------- 22 223 122 611 53 714 32 964 30 712 1 573 3 648Howard County 17-------------------- 31 687 231 278 75 923 60 986 25 097 33 279 35 993Hudspeth County 23------------------- 3 238 13 967 3 899 3 595 2 138 469 3 865
Hunt County 01 04----------------------- 71 717 598 698 144 104 76 629 71 206 290 213 16 547Hutchinson County 13----------------- 23 711 93 370 51 511 29 478 8 157 650 3 574Irion County 21----------------------- 1 693 6 364 3 343 1 874 824 71 252Jack County 17----------------------- 7 481 27 512 14 759 8 414 2 911 298 1 129Jackson County 14-------------------- 13 648 75 476 26 010 37 432 10 170 355 1 509
Jasper County 02--------------------- 33 494 161 064 72 542 44 996 38 109 1 513 3 903Jeff Davis County 23------------------- 2 415 13 268 4 659 1 977 5 586 71 975Jefferson County 09------------------- 241 332 1 350 923 488 290 339 831 189 638 192 432 140 733Jim Hogg County 28------------------- 4 972 30 818 8 174 8 225 11 256 562 2 601Jim Wells County 15 28------------------- 40 212 194 610 66 918 56 586 63 978 976 6 151
Johnson County 06 12-------------------- 122 594 350 335 211 869 89 056 34 792 3 203 11 415Jones County 17---------------------- 18 846 91 727 34 895 40 676 12 967 583 2 606Karnes County 15--------------------- 15 112 74 791 26 988 19 588 25 915 505 1 794Kaufman County 04 05------------------- 68 065 287 360 160 014 83 002 32 335 2 488 9 520Kendall County 21--------------------- 21 865 104 124 73 051 16 159 4 829 7 401 2 684
Kenedy County 27--------------------- 436 1 418 484 303 213 43 375Kent County 17----------------------- 854 10 079 2 296 3 919 3 431 57 376Kerr County 21------------------------ 43 234 246 581 159 034 47 139 13 972 2 227 24 209Kimble County 21--------------------- 4 238 18 197 10 146 4 845 2 530 13 662King County 13----------------------- 318 2 539 382 1 721 189 43 203
Kinney County 23--------------------- 3 465 22 693 11 542 4 323 2 963 185 3 680Kleberg County 15 27-------------------- 29 680 253 000 50 535 37 620 32 934 87 051 44 860Knox County 13----------------------- 4 104 36 930 10 470 17 265 7 162 540 1 492Lamar County 01---------------------- 46 050 243 271 104 200 59 126 69 257 2 466 8 222Lamb County 13---------------------- 14 765 94 867 28 998 50 372 13 235 441 1 822
Lampasas County 11------------------ 17 700 86 486 55 958 19 777 8 103 540 2 108La Salle County 28-------------------- 5 992 34 454 9 169 8 083 14 885 215 2 103Lavaca County 14--------------------- 18 912 112 776 52 745 30 408 25 986 762 2 875Lee County 14------------------------ 14 871 45 789 24 321 11 317 8 275 475 1 402Leon County 05----------------------- 14 870 94 646 44 006 22 682 24 544 771 2 643
See footnotes at end of table.
62 Consolidated Federal Funds Report for Fiscal Year 1999U.S. Census Bureau
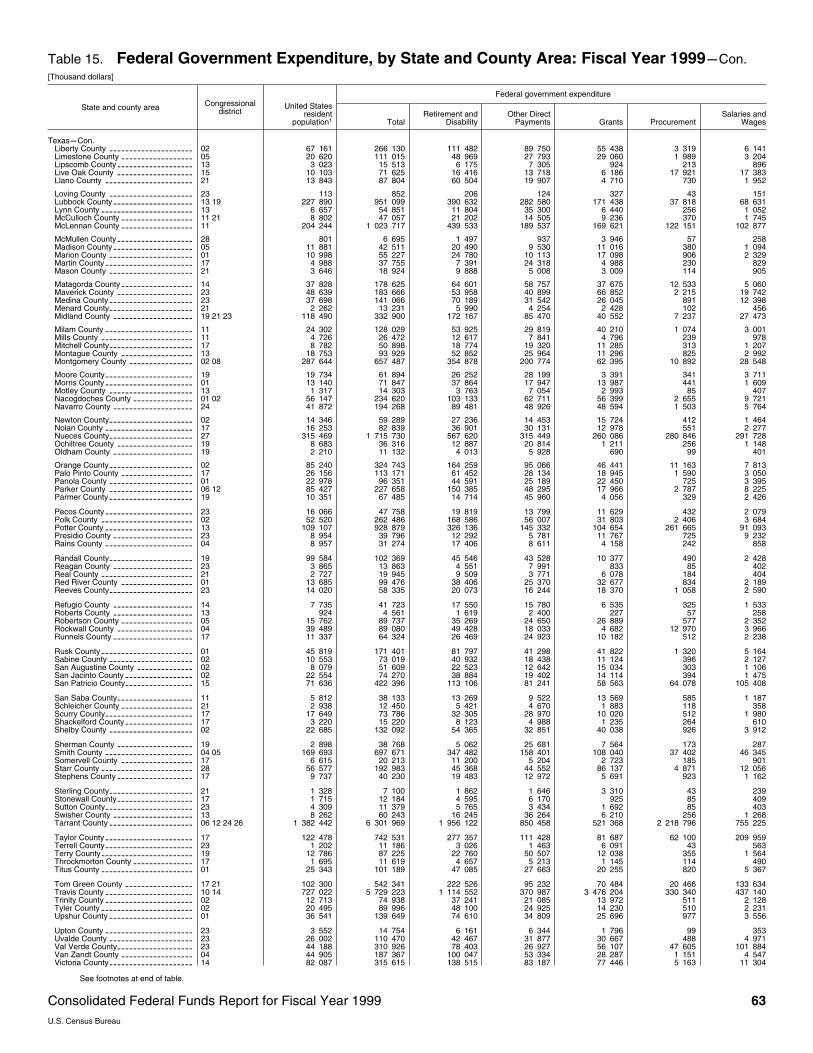
Table 15. Federal Government Expenditure, by State and County Area: Fiscal Year 1999mCon.[Thousand dollars]
State and county area Congressionaldistrict
Federal government expenditure
United Statesresident
population1 TotalRetirement and
DisabilityOther Direct
Payments Grants ProcurementSalaries and
Wages
TexasmCon.Liberty County 02--------------------- 67 161 266 130 111 482 89 750 55 438 3 319 6 141Limestone County 05------------------ 20 620 111 015 48 969 27 793 29 060 1 989 3 204Lipscomb County 13------------------- 3 023 15 513 6 175 7 305 924 213 896Live Oak County 15------------------- 10 103 71 625 16 416 13 718 6 186 17 921 17 383Llano County 21---------------------- 13 843 87 804 60 504 19 907 4 710 730 1 952
Loving County 23--------------------- 113 852 206 124 327 43 151Lubbock County 13 19-------------------- 227 890 951 099 390 632 282 580 171 438 37 818 68 631Lynn County 13----------------------- 6 657 54 851 11 804 35 300 6 440 256 1 052McCulloch County 11 21------------------ 8 802 47 057 21 202 14 505 9 236 370 1 745McLennan County 11------------------ 204 244 1 023 717 439 533 189 537 169 621 122 151 102 877
McMullen County 28------------------- 801 6 695 1 497 937 3 946 57 258Madison County 05-------------------- 11 881 42 511 20 490 9 530 11 016 380 1 094Marion County 01--------------------- 10 998 55 227 24 780 10 113 17 098 906 2 329Martin County 17---------------------- 4 988 37 755 7 391 24 318 4 988 230 829Mason County 21--------------------- 3 646 18 924 9 888 5 008 3 009 114 905
Matagorda County 14------------------ 37 828 178 625 64 601 58 757 37 675 12 533 5 060Maverick County 23------------------- 48 639 183 666 53 958 40 899 66 852 2 215 19 742Medina County 23--------------------- 37 698 141 066 70 189 31 542 26 045 891 12 398Menard County 21--------------------- 2 262 13 231 5 990 4 254 2 428 102 456Midland County 19 21 23-------------------- 118 490 332 900 172 167 85 470 40 552 7 237 27 473
Milam County 11---------------------- 24 302 128 029 53 925 29 819 40 210 1 074 3 001Mills County 11----------------------- 4 726 26 472 12 617 7 841 4 796 239 978Mitchell County 17--------------------- 8 782 50 898 18 774 19 320 11 285 313 1 207Montague County 13------------------ 18 753 93 929 52 852 25 964 11 296 825 2 992Montgomery County 02 08---------------- 287 644 657 487 354 878 200 774 62 395 10 892 28 548
Moore County 19---------------------- 19 734 61 894 26 252 28 199 3 391 341 3 711Morris County 01---------------------- 13 140 71 847 37 864 17 947 13 987 441 1 609Motley County 13--------------------- 1 317 14 303 3 763 7 054 2 993 85 407Nacogdoches County 01 02--------------- 56 147 234 620 103 133 62 711 56 399 2 655 9 721Navarro County 24-------------------- 41 872 194 268 89 481 48 926 48 594 1 503 5 764
Newton County 02--------------------- 14 346 59 289 27 236 14 453 15 724 412 1 464Nolan County 17---------------------- 16 253 82 839 36 901 30 131 12 978 551 2 277Nueces County 27--------------------- 315 469 1 715 730 567 620 315 449 260 086 280 846 291 728Ochiltree County 19------------------- 8 683 36 316 12 887 20 814 1 211 256 1 148Oldham County 19-------------------- 2 210 11 132 4 013 5 928 690 99 401
Orange County 02--------------------- 85 240 324 743 164 259 95 066 46 441 11 163 7 813Palo Pinto County 17------------------ 26 156 113 171 61 452 28 134 18 945 1 590 3 050Panola County 01--------------------- 22 978 96 351 44 591 25 189 22 450 725 3 395Parker County 06 12--------------------- 85 427 227 658 150 385 48 295 17 966 2 787 8 225Parmer County 19--------------------- 10 351 67 485 14 714 45 960 4 056 329 2 426
Pecos County 23---------------------- 16 066 47 758 19 819 13 799 11 629 432 2 079Polk County 02----------------------- 52 520 262 486 168 586 56 007 31 803 2 406 3 684Potter County 13---------------------- 109 107 928 879 326 136 145 332 104 654 261 665 91 093Presidio County 23-------------------- 8 954 39 796 12 292 5 781 11 767 725 9 232Rains County 04---------------------- 8 957 31 274 17 406 8 611 4 158 242 858
Randall County 19--------------------- 99 584 102 369 45 546 43 528 10 377 490 2 428Reagan County 23-------------------- 3 865 13 863 4 551 7 991 833 85 402Real County 21----------------------- 2 727 19 945 9 509 3 771 6 078 184 404Red River County 01------------------ 13 685 99 476 38 406 25 370 32 677 834 2 189Reeves County 23--------------------- 14 020 58 335 20 073 16 244 18 370 1 058 2 590
Refugio County 14-------------------- 7 735 41 723 17 550 15 780 6 535 325 1 533Roberts County 13-------------------- 924 4 561 1 619 2 400 227 57 258Robertson County 05------------------ 15 762 89 737 35 269 24 650 26 889 577 2 352Rockwall County 04------------------- 39 489 89 080 49 428 18 033 4 682 12 970 3 966Runnels County 17-------------------- 11 337 64 324 26 469 24 923 10 182 512 2 238
Rusk County 01----------------------- 45 819 171 401 81 797 41 298 41 822 1 320 5 164Sabine County 02--------------------- 10 553 73 019 40 932 18 438 11 124 396 2 127San Augustine County 02-------------- 8 079 51 609 22 523 12 642 15 034 303 1 106San Jacinto County 02----------------- 22 554 74 270 38 884 19 402 14 114 394 1 475San Patricio County 15----------------- 71 636 422 396 113 106 81 241 58 563 64 078 105 408
San Saba County 11------------------- 5 812 38 133 13 269 9 522 13 569 585 1 187Schleicher County 21------------------ 2 938 12 450 5 421 4 670 1 883 118 358Scurry County 17---------------------- 17 649 73 786 32 305 28 970 10 020 512 1 980Shackelford County 17----------------- 3 220 15 220 8 123 4 988 1 235 264 610Shelby County 02--------------------- 22 685 132 092 54 365 32 851 40 038 926 3 912
Sherman County 19------------------- 2 898 38 768 5 062 25 681 7 564 173 287Smith County 04 05---------------------- 169 693 697 671 347 482 158 401 108 040 37 402 46 345Somervell County 17------------------ 6 615 20 213 11 200 5 204 2 723 185 901Starr County 28----------------------- 56 577 192 983 45 368 44 552 86 137 4 871 12 056Stephens County 17------------------- 9 737 40 230 19 483 12 972 5 691 923 1 162
Sterling County 21--------------------- 1 328 7 100 1 862 1 646 3 310 43 239Stonewall County 17------------------- 1 715 12 184 4 595 6 170 925 85 409Sutton County 23---------------------- 4 309 11 379 5 765 3 434 1 692 85 403Swisher County 13-------------------- 8 262 60 243 16 245 36 264 6 210 256 1 268Tarrant County 06 12 24 26--------------------- 1 382 442 6 301 969 1 956 122 850 458 521 368 2 218 796 755 225
Taylor County 17---------------------- 122 478 742 531 277 357 111 428 81 687 62 100 209 959Terrell County 23---------------------- 1 202 11 186 3 026 1 463 6 091 43 563Terry County 19----------------------- 12 786 87 225 22 760 50 507 12 038 355 1 564Throckmorton County 17--------------- 1 695 11 619 4 657 5 213 1 145 114 490Titus County 01----------------------- 25 343 101 189 47 085 27 663 20 255 820 5 367
Tom Green County 17 21----------------- 102 300 542 341 222 526 95 232 70 484 20 466 133 634Travis County 10 14---------------------- 727 022 5 729 223 1 114 552 370 987 3 476 204 330 340 437 140Trinity County 02---------------------- 12 713 74 938 37 241 21 085 13 972 511 2 128Tyler County 02----------------------- 20 495 89 996 48 100 24 925 14 230 510 2 231Upshur County 01--------------------- 36 541 139 649 74 610 34 809 25 696 977 3 556
Upton County 23---------------------- 3 552 14 754 6 161 6 344 1 796 99 353Uvalde County 23--------------------- 26 002 110 470 42 467 31 877 30 667 488 4 971Val Verde County 23------------------- 44 188 310 926 78 403 26 927 56 107 47 605 101 884Van Zandt County 04------------------ 44 905 187 367 100 047 53 334 28 287 1 151 4 547Victoria County 14--------------------- 82 087 315 615 138 515 83 187 77 446 5 163 11 304
See footnotes at end of table.
Consolidated Federal Funds Report for Fiscal Year 1999 63U.S. Census Bureau
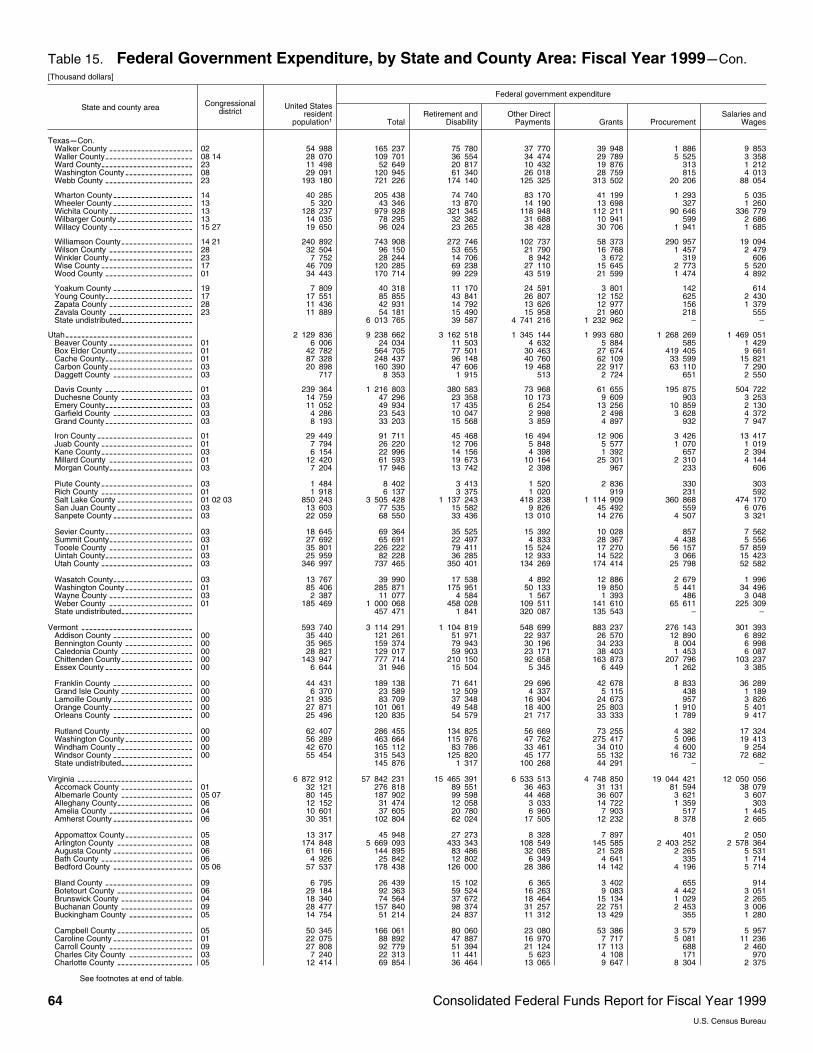
Table 15. Federal Government Expenditure, by State and County Area: Fiscal Year 1999mCon.[Thousand dollars]
State and county area Congressionaldistrict
Federal government expenditure
United Statesresident
population1 TotalRetirement and
DisabilityOther Direct
Payments Grants ProcurementSalaries and
Wages
TexasmCon.Walker County 02--------------------- 54 988 165 237 75 780 37 770 39 948 1 886 9 853Waller County 08 14---------------------- 28 070 109 701 36 554 34 474 29 789 5 525 3 358Ward County 23----------------------- 11 498 52 649 20 817 10 432 19 876 313 1 212Washington County 08----------------- 29 091 120 945 61 340 26 018 28 759 815 4 013Webb County 23---------------------- 193 180 721 226 174 140 125 325 313 502 20 206 88 054
Wharton County 14-------------------- 40 285 205 438 74 740 83 170 41 199 1 293 5 035Wheeler County 13-------------------- 5 320 43 346 13 870 14 190 13 698 327 1 260Wichita County 13--------------------- 128 237 979 928 321 345 118 948 112 211 90 646 336 779Wilbarger County 13------------------- 14 035 78 295 32 382 31 688 10 941 599 2 686Willacy County 15 27--------------------- 19 650 96 024 23 265 38 428 30 706 1 941 1 685
Williamson County 14 21------------------ 240 892 743 908 272 746 102 737 58 373 290 957 19 094Wilson County 28--------------------- 32 504 96 150 53 655 21 790 16 768 1 457 2 479Winkler County 23--------------------- 7 752 28 244 14 706 8 942 3 672 319 606Wise County 17----------------------- 46 709 120 285 69 238 27 110 15 645 2 773 5 520Wood County 01---------------------- 34 443 170 714 99 229 43 519 21 599 1 474 4 892
Yoakum County 19-------------------- 7 809 40 318 11 170 24 591 3 801 142 614Young County 17---------------------- 17 551 85 855 43 841 26 807 12 152 625 2 430Zapata County 28--------------------- 11 436 42 931 14 792 13 626 12 977 156 1 379Zavala County 23--------------------- 11 889 54 181 15 490 15 958 21 960 218 555State undistributed------------------ 6 013 765 39 587 4 741 216 1 232 962 – –
Utah-------------------------------- 2 129 836 9 238 662 3 162 518 1 345 144 1 993 680 1 268 269 1 469 051Beaver County 01--------------------- 6 006 24 034 11 503 4 632 5 884 585 1 429Box Elder County 01------------------- 42 782 564 705 77 501 30 463 27 674 419 405 9 661Cache County 01---------------------- 87 328 248 437 96 148 40 760 62 109 33 599 15 821Carbon County 03--------------------- 20 898 160 390 47 606 19 468 22 917 63 110 7 290Daggett County 03-------------------- 717 8 353 1 915 513 2 724 651 2 550
Davis County 01---------------------- 239 364 1 216 803 380 583 73 968 61 655 195 875 504 722Duchesne County 03------------------ 14 759 47 296 23 358 10 173 9 609 903 3 253Emery County 03---------------------- 11 052 49 934 17 435 6 254 13 256 10 859 2 130Garfield County 03-------------------- 4 286 23 543 10 047 2 998 2 498 3 628 4 372Grand County 03---------------------- 8 193 33 203 15 568 3 859 4 897 932 7 947
Iron County 01------------------------ 29 449 91 711 45 468 16 494 12 906 3 426 13 417Juab County 01----------------------- 7 794 26 220 12 706 5 848 5 577 1 070 1 019Kane County 03----------------------- 6 154 22 996 14 156 4 398 1 392 657 2 394Millard County 01--------------------- 12 420 61 593 19 673 10 164 25 301 2 310 4 144Morgan County 03--------------------- 7 204 17 946 13 742 2 398 967 233 606
Piute County 03----------------------- 1 484 8 402 3 413 1 520 2 836 330 303Rich County 01----------------------- 1 918 6 137 3 375 1 020 919 231 592Salt Lake County 01 02 03------------------- 850 243 3 505 428 1 137 243 418 238 1 114 909 360 868 474 170San Juan County 03------------------- 13 603 77 535 15 582 9 826 45 492 559 6 076Sanpete County 03-------------------- 22 059 68 550 33 436 13 010 14 276 4 507 3 321
Sevier County 03---------------------- 18 645 69 364 35 525 15 392 10 028 857 7 562Summit County 03--------------------- 27 692 65 691 22 497 4 833 28 367 4 438 5 556Tooele County 01--------------------- 35 801 226 222 79 411 15 524 17 270 56 157 57 859Uintah County 03---------------------- 25 959 82 228 36 285 12 933 14 522 3 066 15 423Utah County 03----------------------- 346 997 737 465 350 401 134 269 174 414 25 798 52 582
Wasatch County 03-------------------- 13 767 39 990 17 538 4 892 12 886 2 679 1 996Washington County 01----------------- 85 406 285 871 175 951 50 133 19 850 5 441 34 496Wayne County 03--------------------- 2 387 11 077 4 584 1 567 1 393 486 3 048Weber County 01--------------------- 185 469 1 000 068 458 028 109 511 141 610 65 611 225 309State undistributed------------------ 457 471 1 841 320 087 135 543 – –
Vermont ---------------------------- 593 740 3 114 291 1 104 819 548 699 883 237 276 143 301 393Addison County 00-------------------- 35 440 121 261 51 971 22 937 26 570 12 890 6 892Bennington County 00----------------- 35 965 159 374 79 943 30 196 34 233 8 004 6 998Caledonia County 00------------------ 28 821 129 017 59 903 23 171 38 403 1 453 6 087Chittenden County 00------------------ 143 947 777 714 210 150 92 658 163 873 207 796 103 237Essex County 00---------------------- 6 644 31 946 15 504 5 345 6 449 1 262 3 385
Franklin County 00-------------------- 44 431 189 138 71 641 29 696 42 678 8 833 36 289Grand Isle County 00------------------ 6 370 23 589 12 509 4 337 5 115 438 1 189Lamoille County 00-------------------- 21 935 83 709 37 348 16 904 24 673 957 3 826Orange County 00--------------------- 27 871 101 061 49 548 18 400 25 803 1 910 5 401Orleans County 00-------------------- 25 496 120 835 54 579 21 717 33 333 1 789 9 417
Rutland County 00-------------------- 62 407 286 455 134 825 56 669 73 255 4 382 17 324Washington County 00----------------- 56 289 463 664 115 976 47 762 275 417 5 096 19 413Windham County 00------------------- 42 670 165 112 83 786 33 461 34 010 4 600 9 254Windsor County 00-------------------- 55 454 315 543 125 820 45 177 55 132 16 732 72 682State undistributed------------------ 145 876 1 317 100 268 44 291 – –
Virginia ----------------------------- 6 872 912 57 842 231 15 465 391 6 533 513 4 748 850 19 044 421 12 050 056Accomack County 01------------------ 32 121 276 818 89 551 36 463 31 131 81 594 38 079Albemarle County 05 07------------------ 80 145 187 902 99 598 44 468 36 607 3 621 3 607Alleghany County 06------------------- 12 152 31 474 12 058 3 033 14 722 1 359 303Amelia County 04--------------------- 10 601 37 605 20 780 6 960 7 903 517 1 445Amherst County 06-------------------- 30 351 102 804 62 024 17 505 12 232 8 378 2 665
Appomattox County 05----------------- 13 317 45 948 27 273 8 328 7 897 401 2 050Arlington County 08------------------- 174 848 5 669 093 433 343 108 549 145 585 2 403 252 2 578 364Augusta County 06-------------------- 61 166 144 895 83 486 32 085 21 528 2 265 5 531Bath County 06----------------------- 4 926 25 842 12 802 6 349 4 641 335 1 714Bedford County 05 06-------------------- 57 537 178 438 126 000 28 386 14 142 4 196 5 714
Bland County 09---------------------- 6 795 26 439 15 102 6 365 3 402 655 914Botetourt County 06------------------- 29 184 92 363 59 524 16 263 9 083 4 442 3 051Brunswick County 04------------------ 18 340 74 564 37 672 18 464 15 134 1 029 2 265Buchanan County 09------------------ 28 477 157 840 98 374 31 257 22 751 2 453 3 006Buckingham County 05---------------- 14 754 51 214 24 837 11 312 13 429 355 1 280
Campbell County 05------------------- 50 345 166 061 80 060 23 080 53 386 3 579 5 957Caroline County 01-------------------- 22 075 88 892 47 887 16 970 7 717 5 081 11 236Carroll County 09--------------------- 27 808 92 779 51 394 21 124 17 113 688 2 460Charles City County 03---------------- 7 240 22 313 11 441 5 623 4 108 171 970Charlotte County 05------------------- 12 414 69 854 36 464 13 065 9 647 8 304 2 375
See footnotes at end of table.
64 Consolidated Federal Funds Report for Fiscal Year 1999U.S. Census Bureau
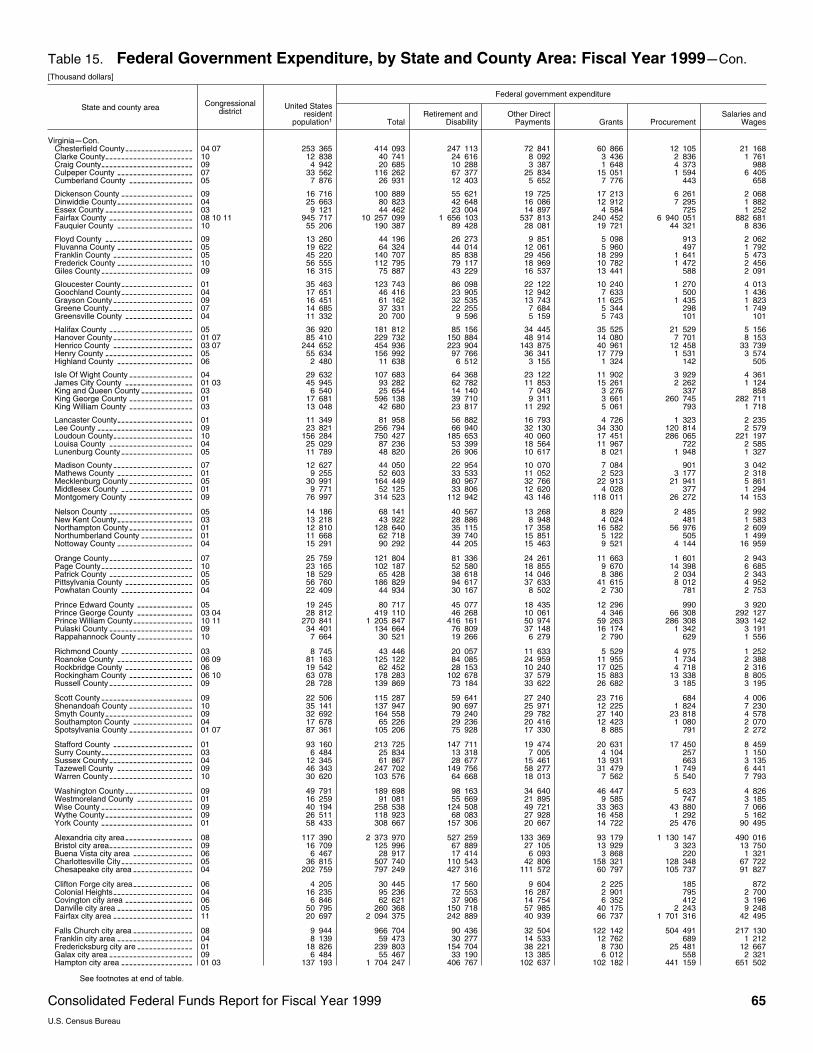
Table 15. Federal Government Expenditure, by State and County Area: Fiscal Year 1999mCon.[Thousand dollars]
State and county area Congressionaldistrict
Federal government expenditure
United Statesresident
population1 TotalRetirement and
DisabilityOther Direct
Payments Grants ProcurementSalaries and
Wages
VirginiamCon.Chesterfield County 04 07----------------- 253 365 414 093 247 113 72 841 60 866 12 105 21 168Clarke County 10---------------------- 12 838 40 741 24 616 8 092 3 436 2 836 1 761Craig County 09----------------------- 4 942 20 685 10 288 3 387 1 648 4 373 988Culpeper County 07------------------- 33 562 116 262 67 377 25 834 15 051 1 594 6 405Cumberland County 05---------------- 7 876 26 931 12 403 5 652 7 776 443 658
Dickenson County 09------------------ 16 716 100 889 55 621 19 725 17 213 6 261 2 068Dinwiddie County 04------------------- 25 663 80 823 42 648 16 086 12 912 7 295 1 882Essex County 03---------------------- 9 121 44 462 23 004 14 897 4 584 725 1 252Fairfax County 08 10 11--------------------- 945 717 10 257 099 1 656 103 537 813 240 452 6 940 051 882 681Fauquier County 10------------------- 55 206 190 387 89 428 28 081 19 721 44 321 8 836
Floyd County 09---------------------- 13 260 44 196 26 273 9 851 5 098 913 2 062Fluvanna County 05------------------- 19 622 64 324 44 014 12 061 5 960 497 1 792Franklin County 05-------------------- 45 220 140 707 85 838 29 456 18 299 1 641 5 473Frederick County 10------------------- 56 555 112 795 79 117 18 969 10 782 1 472 2 456Giles County 09----------------------- 16 315 75 887 43 229 16 537 13 441 588 2 091
Gloucester County 01------------------ 35 463 123 743 86 098 22 122 10 240 1 270 4 013Goochland County 04------------------ 17 651 46 416 23 905 12 942 7 633 500 1 436Grayson County 09-------------------- 16 451 61 162 32 535 13 743 11 625 1 435 1 823Greene County 07--------------------- 14 685 37 331 22 255 7 684 5 344 298 1 749Greensville County 04----------------- 11 332 20 700 9 596 5 159 5 743 101 101
Halifax County 05--------------------- 36 920 181 812 85 156 34 445 35 525 21 529 5 156Hanover County 01 07-------------------- 85 410 229 732 150 884 48 914 14 080 7 701 8 153Henrico County 03 07-------------------- 244 652 454 936 223 904 143 875 40 961 12 458 33 739Henry County 05---------------------- 55 634 156 992 97 766 36 341 17 779 1 531 3 574Highland County 06------------------- 2 480 11 638 6 512 3 155 1 324 142 505
Isle Of Wight County 04---------------- 29 632 107 683 64 368 23 122 11 902 3 929 4 361James City County 01 03----------------- 45 945 93 282 62 782 11 853 15 261 2 262 1 124King and Queen County 03------------- 6 540 25 654 14 140 7 043 3 276 337 858King George County 01---------------- 17 681 596 138 39 710 9 311 3 661 260 745 282 711King William County 03---------------- 13 048 42 680 23 817 11 292 5 061 793 1 718
Lancaster County 01------------------- 11 349 81 958 56 882 16 793 4 726 1 323 2 235Lee County 09------------------------ 23 821 256 794 66 940 32 130 34 330 120 814 2 579Loudoun County 10-------------------- 156 284 750 427 185 653 40 060 17 451 286 065 221 197Louisa County 04--------------------- 25 029 87 236 53 399 18 564 11 967 722 2 585Lunenburg County 05------------------ 11 789 48 820 26 906 10 617 8 021 1 948 1 327
Madison County 07-------------------- 12 627 44 050 22 954 10 070 7 084 901 3 042Mathews County 01------------------- 9 255 52 603 33 533 11 052 2 523 3 177 2 318Mecklenburg County 05---------------- 30 991 164 449 80 967 32 766 22 913 21 941 5 861Middlesex County 01------------------ 9 771 52 125 33 806 12 620 4 028 377 1 294Montgomery County 09---------------- 76 997 314 523 112 942 43 146 118 011 26 272 14 153
Nelson County 05--------------------- 14 186 68 141 40 567 13 268 8 829 2 485 2 992New Kent County 03------------------- 13 218 43 922 28 886 8 948 4 024 481 1 583Northampton County 01---------------- 12 810 128 640 35 115 17 358 16 582 56 976 2 609Northumberland County 01------------- 11 668 62 718 39 740 15 851 5 122 505 1 499Nottoway County 04------------------- 15 291 90 292 44 205 15 463 9 521 4 144 16 959
Orange County 07--------------------- 25 759 121 804 81 336 24 261 11 663 1 601 2 943Page County 10----------------------- 23 165 102 187 52 580 18 855 9 670 14 398 6 685Patrick County 05--------------------- 18 529 65 428 38 618 14 046 8 386 2 034 2 343Pittsylvania County 05----------------- 56 760 186 829 94 617 37 633 41 615 8 012 4 952Powhatan County 04------------------ 22 409 44 934 30 167 8 502 2 730 781 2 753
Prince Edward County 05-------------- 19 245 80 717 45 077 18 435 12 296 990 3 920Prince George County 03 04-------------- 28 812 419 110 46 268 10 061 4 346 66 308 292 127Prince William County 10 11--------------- 270 841 1 205 847 416 161 50 974 59 263 286 308 393 142Pulaski County 09--------------------- 34 401 134 664 76 809 37 148 16 174 1 342 3 191Rappahannock County 10-------------- 7 664 30 521 19 266 6 279 2 790 629 1 556
Richmond County 03------------------ 8 745 43 446 20 057 11 633 5 529 4 975 1 252Roanoke County 06 09------------------- 81 163 125 122 84 085 24 959 11 955 1 734 2 388Rockbridge County 06----------------- 19 542 62 452 28 153 10 240 17 025 4 718 2 316Rockingham County 06 10---------------- 63 078 178 283 102 678 37 579 15 883 13 338 8 805Russell County 09--------------------- 28 728 139 869 73 184 33 622 26 682 3 185 3 195
Scott County 09----------------------- 22 506 115 287 59 641 27 240 23 716 684 4 006Shenandoah County 10---------------- 35 141 137 947 90 697 25 971 12 225 1 824 7 230Smyth County 09---------------------- 32 692 164 558 79 240 29 782 27 140 23 818 4 578Southampton County 04--------------- 17 678 65 226 29 236 20 416 12 423 1 080 2 070Spotsylvania County 01 07---------------- 87 361 105 206 75 928 17 330 8 885 791 2 272
Stafford County 01-------------------- 93 160 213 725 147 711 19 474 20 631 17 450 8 459Surry County 03----------------------- 6 484 25 834 13 318 7 005 4 104 257 1 150Sussex County 04--------------------- 12 345 61 867 28 677 15 461 13 931 663 3 135Tazewell County 09------------------- 46 343 247 702 149 756 58 277 31 479 1 749 6 441Warren County 10--------------------- 30 620 103 576 64 668 18 013 7 562 5 540 7 793
Washington County 09----------------- 49 791 189 698 98 163 34 640 46 447 5 623 4 826Westmoreland County 01-------------- 16 259 91 081 55 669 21 895 9 585 747 3 185Wise County 09----------------------- 40 194 258 538 124 508 49 721 33 363 43 880 7 066Wythe County 09---------------------- 26 511 118 923 68 083 27 928 16 458 1 292 5 162York County 01----------------------- 58 433 308 667 157 306 20 667 14 722 25 476 90 495
Alexandria city area 08----------------- 117 390 2 373 970 527 259 133 369 93 179 1 130 147 490 016Bristol city area 09--------------------- 16 709 125 996 67 889 27 105 13 929 3 323 13 750Buena Vista city area 06--------------- 6 467 28 917 17 414 6 093 3 868 220 1 321Charlottesville City 05------------------ 36 815 507 740 110 543 42 806 158 321 128 348 67 722Chesapeake city area 04--------------- 202 759 797 249 427 316 111 572 60 797 105 737 91 827
Clifton Forge city area 06--------------- 4 205 30 445 17 560 9 604 2 225 185 872Colonial Heights 04-------------------- 16 235 95 236 72 553 16 287 2 901 795 2 700Covington city area 06----------------- 6 846 62 621 37 906 14 754 6 352 412 3 196Danville city area 05------------------- 50 795 260 368 150 718 57 985 40 175 2 243 9 248Fairfax city area 11-------------------- 20 697 2 094 375 242 889 40 939 66 737 1 701 316 42 495
Falls Church city area 08--------------- 9 944 966 704 90 436 32 504 122 142 504 491 217 130Franklin city area 04------------------- 8 139 59 473 30 277 14 533 12 762 689 1 212Fredericksburg city are 01-------------- 18 826 239 803 154 704 38 221 8 730 25 481 12 667Galax city area 09--------------------- 6 484 55 467 33 190 13 385 6 012 558 2 321Hampton city area 01 03------------------ 137 193 1 704 247 406 767 102 637 102 182 441 159 651 502
See footnotes at end of table.
Consolidated Federal Funds Report for Fiscal Year 1999 65U.S. Census Bureau
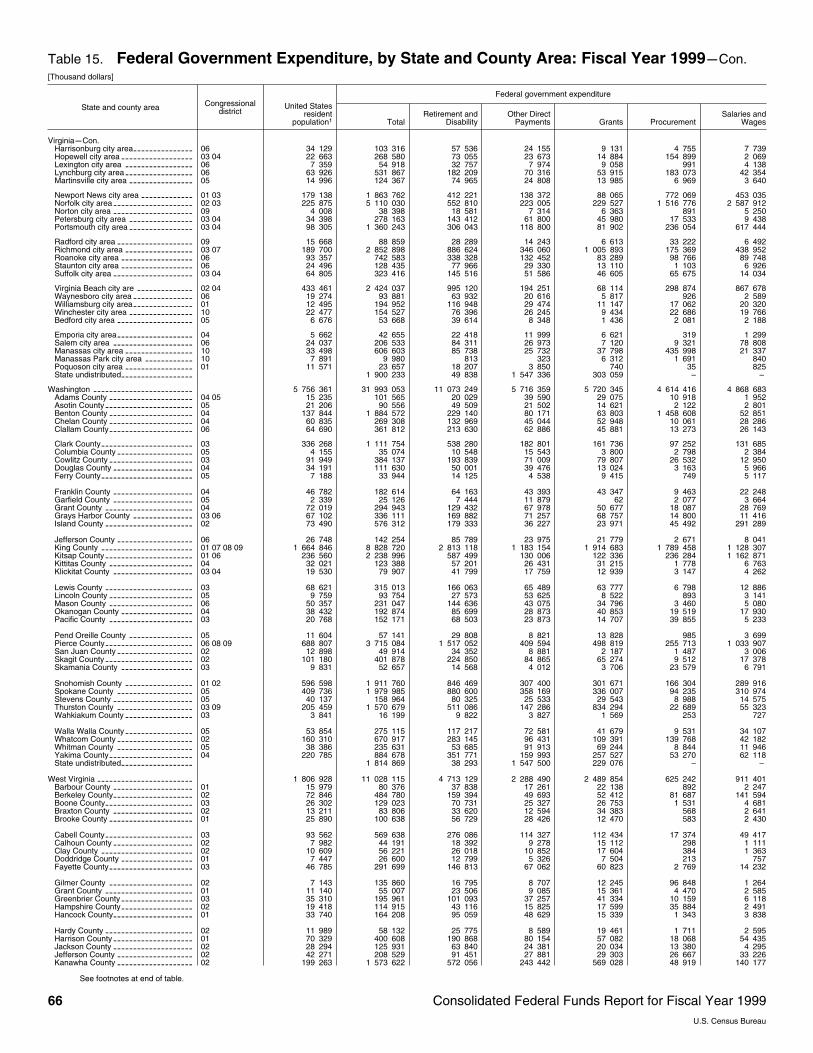
Table 15. Federal Government Expenditure, by State and County Area: Fiscal Year 1999mCon.[Thousand dollars]
State and county area Congressionaldistrict
Federal government expenditure
United Statesresident
population1 TotalRetirement and
DisabilityOther Direct
Payments Grants ProcurementSalaries and
Wages
VirginiamCon.Harrisonburg city area 06--------------- 34 129 103 316 57 536 24 155 9 131 4 755 7 739Hopewell city area 03 04------------------ 22 663 268 580 73 055 23 673 14 884 154 899 2 069Lexington city area 06----------------- 7 359 54 918 32 757 7 974 9 058 991 4 138Lynchburg city area 06----------------- 63 926 531 867 182 209 70 316 53 915 183 073 42 354Martinsville city area 05---------------- 14 996 124 367 74 965 24 808 13 985 6 969 3 640
Newport News city area 01 03------------- 179 138 1 863 762 412 221 138 372 88 065 772 069 453 035Norfolk city area 02 03-------------------- 225 875 5 110 030 552 810 223 005 229 527 1 516 776 2 587 912Norton city area 09-------------------- 4 008 38 398 18 581 7 314 6 363 891 5 250Petersburg city area 03 04---------------- 34 398 278 163 143 412 61 800 45 980 17 533 9 438Portsmouth city area 03 04---------------- 98 305 1 360 243 306 043 118 800 81 902 236 054 617 444
Radford city area 09------------------- 15 668 88 859 28 289 14 243 6 613 33 222 6 492Richmond city area 03 07----------------- 189 700 2 852 898 886 624 346 060 1 005 893 175 369 438 952Roanoke city area 06------------------ 93 357 742 583 338 328 132 452 83 289 98 766 89 748Staunton city area 06------------------ 24 496 128 435 77 966 29 330 13 110 1 103 6 926Suffolk city area 03 04-------------------- 64 805 323 416 145 516 51 586 46 605 65 675 14 034
Virginia Beach city are 02 04-------------- 433 461 2 424 037 995 120 194 251 68 114 298 874 867 678Waynesboro city area 06--------------- 19 274 93 881 63 932 20 616 5 817 926 2 589Williamsburg city area 01--------------- 12 495 194 952 116 948 29 474 11 147 17 062 20 320Winchester city area 10---------------- 22 477 154 527 76 396 26 245 9 434 22 686 19 766Bedford city area 05------------------- 6 676 53 668 39 614 8 348 1 436 2 081 2 188
Emporia city area 04------------------- 5 662 42 655 22 418 11 999 6 621 319 1 299Salem city area 06-------------------- 24 037 206 533 84 311 26 973 7 120 9 321 78 808Manassas city area 10----------------- 33 498 606 603 85 738 25 732 37 798 435 998 21 337Manassas Park city area 10------------ 7 891 9 980 813 323 6 312 1 691 840Poquoson city area 01----------------- 11 571 23 657 18 207 3 850 740 35 825State undistributed------------------ 1 900 233 49 838 1 547 336 303 059 – –
Washington ------------------------- 5 756 361 31 993 053 11 073 249 5 716 359 5 720 345 4 614 416 4 868 683Adams County 04 05--------------------- 15 235 101 565 20 029 39 590 29 075 10 918 1 952Asotin County 05---------------------- 21 206 90 556 49 509 21 502 14 621 2 122 2 801Benton County 04--------------------- 137 844 1 884 572 229 140 80 171 63 803 1 458 608 52 851Chelan County 04--------------------- 60 835 269 308 132 969 45 044 52 948 10 061 28 286Clallam County 06--------------------- 64 690 361 812 213 630 62 886 45 881 13 273 26 143
Clark County 03----------------------- 336 268 1 111 754 538 280 182 801 161 736 97 252 131 685Columbia County 05------------------- 4 155 35 074 10 548 15 543 3 800 2 798 2 384Cowlitz County 03--------------------- 91 949 384 137 193 839 71 009 79 807 26 532 12 950Douglas County 04-------------------- 34 191 111 630 50 001 39 476 13 024 3 163 5 966Ferry County 05----------------------- 7 188 33 944 14 125 4 538 9 415 749 5 117
Franklin County 04-------------------- 46 782 182 614 64 163 43 393 43 347 9 463 22 248Garfield County 05-------------------- 2 339 25 126 7 444 11 879 62 2 077 3 664Grant County 04---------------------- 72 019 294 943 129 432 67 978 50 677 18 087 28 769Grays Harbor County 03 06--------------- 67 102 336 111 169 882 71 257 68 757 14 800 11 416Island County 02---------------------- 73 490 576 312 179 333 36 227 23 971 45 492 291 289
Jefferson County 06------------------- 26 748 142 254 85 789 23 975 21 779 2 671 8 041King County 01 07 08 09----------------------- 1 664 846 8 828 720 2 813 118 1 183 154 1 914 683 1 789 458 1 128 307Kitsap County 01 06---------------------- 236 560 2 238 996 587 499 130 006 122 336 236 284 1 162 871Kittitas County 04--------------------- 32 021 123 388 57 201 26 431 31 215 1 778 6 763Klickitat County 03 04-------------------- 19 530 79 907 41 799 17 759 12 939 3 147 4 262
Lewis County 03---------------------- 68 621 315 013 166 063 65 489 63 777 6 798 12 886Lincoln County 05--------------------- 9 759 93 754 27 573 53 625 8 522 893 3 141Mason County 06--------------------- 50 357 231 047 144 636 43 075 34 796 3 460 5 080Okanogan County 04------------------ 38 432 192 874 85 699 28 873 40 853 19 519 17 930Pacific County 03--------------------- 20 768 152 171 68 503 23 873 14 707 39 855 5 233
Pend Oreille County 05---------------- 11 604 57 141 29 808 8 821 13 828 985 3 699Pierce County 06 08 09---------------------- 688 807 3 715 084 1 517 052 409 594 498 819 255 713 1 033 907San Juan County 02------------------- 12 898 49 914 34 352 8 881 2 187 1 487 3 006Skagit County 02---------------------- 101 180 401 878 224 850 84 865 65 274 9 512 17 378Skamania County 03------------------ 9 831 52 657 14 568 4 012 3 706 23 579 6 791
Snohomish County 01 02----------------- 596 598 1 911 760 846 469 307 400 301 671 166 304 289 916Spokane County 05------------------- 409 736 1 979 985 880 600 358 169 336 007 94 235 310 974Stevens County 05-------------------- 40 137 158 964 80 325 25 533 29 543 8 988 14 575Thurston County 03 09------------------- 205 459 1 570 679 511 086 147 286 834 294 22 689 55 323Wahkiakum County 03----------------- 3 841 16 199 9 822 3 827 1 569 253 727
Walla Walla County 05----------------- 53 854 275 115 117 217 72 581 41 679 9 531 34 107Whatcom County 02------------------- 160 310 670 917 283 145 96 431 109 391 139 768 42 182Whitman County 05------------------- 38 386 235 631 53 685 91 913 69 244 8 844 11 946Yakima County 04--------------------- 220 785 884 678 351 771 159 993 257 527 53 270 62 118State undistributed------------------ 1 814 869 38 293 1 547 500 229 076 – –
West Virginia ------------------------ 1 806 928 11 028 115 4 713 129 2 288 490 2 489 854 625 242 911 401Barbour County 01-------------------- 15 979 80 376 37 838 17 261 22 138 892 2 247Berkeley County 02-------------------- 72 846 484 780 159 394 49 693 52 412 81 687 141 594Boone County 03---------------------- 26 302 129 023 70 731 25 327 26 753 1 531 4 681Braxton County 02-------------------- 13 211 83 806 33 620 12 594 34 383 568 2 641Brooke County 01--------------------- 25 890 100 638 56 729 28 426 12 470 583 2 430
Cabell County 03---------------------- 93 562 569 638 276 086 114 327 112 434 17 374 49 417Calhoun County 02-------------------- 7 982 44 191 18 392 9 278 15 112 298 1 111Clay County 02----------------------- 10 609 56 221 26 018 10 852 17 604 384 1 363Doddridge County 01------------------ 7 447 26 600 12 799 5 326 7 504 213 757Fayette County 03--------------------- 46 785 291 699 146 813 67 062 60 823 2 769 14 232
Gilmer County 02--------------------- 7 143 135 860 16 795 8 707 12 245 96 848 1 264Grant County 01---------------------- 11 140 55 007 23 506 9 085 15 361 4 470 2 585Greenbrier County 03------------------ 35 310 195 961 101 093 37 257 41 334 10 159 6 118Hampshire County 02------------------ 19 418 114 915 43 116 15 825 17 599 35 884 2 491Hancock County 01-------------------- 33 740 164 208 95 059 48 629 15 339 1 343 3 838
Hardy County 02---------------------- 11 989 58 132 25 775 8 589 19 461 1 711 2 595Harrison County 01-------------------- 70 329 400 608 190 868 80 154 57 082 18 068 54 435Jackson County 02-------------------- 28 294 125 931 63 840 24 381 20 034 13 380 4 295Jefferson County 02------------------- 42 271 208 529 91 451 27 881 29 303 26 667 33 226Kanawha County 02------------------- 199 263 1 573 622 572 056 243 442 569 028 48 919 140 177
See footnotes at end of table.
66 Consolidated Federal Funds Report for Fiscal Year 1999U.S. Census Bureau
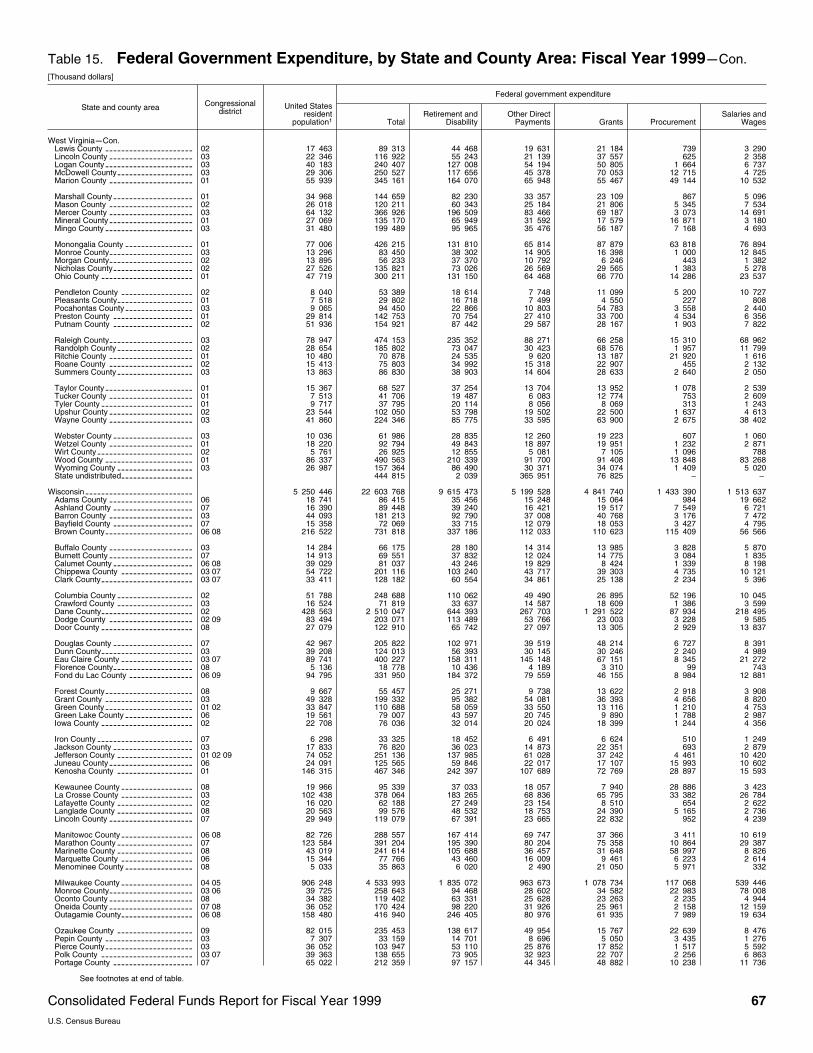
Table 15. Federal Government Expenditure, by State and County Area: Fiscal Year 1999mCon.[Thousand dollars]
State and county area Congressionaldistrict
Federal government expenditure
United Statesresident
population1 TotalRetirement and
DisabilityOther Direct
Payments Grants ProcurementSalaries and
Wages
West VirginiamCon.Lewis County 02---------------------- 17 463 89 313 44 468 19 631 21 184 739 3 290Lincoln County 03--------------------- 22 346 116 922 55 243 21 139 37 557 625 2 358Logan County 03---------------------- 40 183 240 407 127 008 54 194 50 805 1 664 6 737McDowell County 03------------------- 29 306 250 527 117 656 45 378 70 053 12 715 4 725Marion County 01--------------------- 55 939 345 161 164 070 65 948 55 467 49 144 10 532
Marshall County 01-------------------- 34 968 144 659 82 230 33 357 23 109 867 5 096Mason County 02--------------------- 26 018 120 211 60 343 25 184 21 806 5 345 7 534Mercer County 03--------------------- 64 132 366 926 196 509 83 466 69 187 3 073 14 691Mineral County 01--------------------- 27 069 135 170 65 949 31 592 17 579 16 871 3 180Mingo County 03---------------------- 31 480 199 489 95 965 35 476 56 187 7 168 4 693
Monongalia County 01----------------- 77 006 426 215 131 810 65 814 87 879 63 818 76 894Monroe County 03--------------------- 13 296 83 450 38 302 14 905 16 398 1 000 12 845Morgan County 02--------------------- 13 895 56 233 37 370 10 792 6 246 443 1 382Nicholas County 02-------------------- 27 526 135 821 73 026 26 569 29 565 1 383 5 278Ohio County 01----------------------- 47 719 300 211 131 150 64 468 66 770 14 286 23 537
Pendleton County 02------------------ 8 040 53 389 18 614 7 748 11 099 5 200 10 727Pleasants County 01------------------- 7 518 29 802 16 718 7 499 4 550 227 808Pocahontas County 03----------------- 9 065 94 450 22 866 10 803 54 783 3 558 2 440Preston County 01-------------------- 29 814 142 753 70 754 27 410 33 700 4 534 6 356Putnam County 02-------------------- 51 936 154 921 87 442 29 587 28 167 1 903 7 822
Raleigh County 03--------------------- 78 947 474 153 235 352 88 271 66 258 15 310 68 962Randolph County 02------------------- 28 654 185 802 73 047 30 423 68 576 1 957 11 799Ritchie County 01--------------------- 10 480 70 878 24 535 9 620 13 187 21 920 1 616Roane County 02--------------------- 15 413 75 803 34 992 15 318 22 907 455 2 132Summers County 03------------------- 13 863 86 830 38 903 14 604 28 633 2 640 2 050
Taylor County 01---------------------- 15 367 68 527 37 254 13 704 13 952 1 078 2 539Tucker County 01--------------------- 7 513 41 706 19 487 6 083 12 774 753 2 609Tyler County 01----------------------- 9 717 37 795 20 114 8 056 8 069 313 1 243Upshur County 02--------------------- 23 544 102 050 53 798 19 502 22 500 1 637 4 613Wayne County 03--------------------- 41 860 224 346 85 775 33 595 63 900 2 675 38 402
Webster County 03-------------------- 10 036 61 986 28 835 12 260 19 223 607 1 060Wetzel County 01--------------------- 18 220 92 794 49 843 18 897 19 951 1 232 2 871Wirt County 02------------------------ 5 761 26 925 12 855 5 081 7 105 1 096 788Wood County 01---------------------- 86 337 490 563 210 339 91 700 91 408 13 848 83 268Wyoming County 03------------------- 26 987 157 364 86 490 30 371 34 074 1 409 5 020State undistributed------------------ 444 815 2 039 365 951 76 825 – –
Wisconsin--------------------------- 5 250 446 22 603 768 9 615 473 5 199 528 4 841 740 1 433 390 1 513 637Adams County 06--------------------- 18 741 86 415 35 456 15 248 15 064 984 19 662Ashland County 07-------------------- 16 390 89 448 39 240 16 421 19 517 7 549 6 721Barron County 03--------------------- 44 093 181 213 92 790 37 008 40 768 3 176 7 472Bayfield County 07-------------------- 15 358 72 069 33 715 12 079 18 053 3 427 4 795Brown County 06 08---------------------- 216 522 731 818 337 186 112 033 110 623 115 409 56 566
Buffalo County 03--------------------- 14 284 66 175 28 180 14 314 13 985 3 828 5 870Burnett County 07--------------------- 14 913 69 551 37 832 12 024 14 775 3 084 1 835Calumet County 06 08-------------------- 39 029 81 037 43 246 19 829 8 424 1 339 8 198Chippewa County 03 07------------------ 54 722 201 116 103 240 43 717 39 303 4 735 10 121Clark County 03 07----------------------- 33 411 128 182 60 554 34 861 25 138 2 234 5 396
Columbia County 02------------------- 51 788 248 688 110 062 49 490 26 895 52 196 10 045Crawford County 03------------------- 16 524 71 819 33 637 14 587 18 609 1 386 3 599Dane County 02----------------------- 428 563 2 510 047 644 393 267 703 1 291 522 87 934 218 495Dodge County 02 09--------------------- 83 494 203 071 113 489 53 766 23 003 3 228 9 585Door County 08----------------------- 27 079 122 910 65 742 27 097 13 305 2 929 13 837
Douglas County 07-------------------- 42 967 205 822 102 971 39 519 48 214 6 727 8 391Dunn County 03----------------------- 39 208 124 013 56 393 30 145 30 246 2 240 4 989Eau Claire County 03 07------------------ 89 741 400 227 158 311 145 148 67 151 8 345 21 272Florence County 08-------------------- 5 136 18 778 10 436 4 189 3 310 99 743Fond du Lac County 06 09---------------- 94 795 331 950 184 372 79 559 46 155 8 984 12 881
Forest County 08---------------------- 9 667 55 457 25 271 9 738 13 622 2 918 3 908Grant County 03---------------------- 49 328 199 332 95 382 54 081 36 393 4 656 8 820Green County 01 02---------------------- 33 847 110 688 58 059 33 550 13 116 1 210 4 753Green Lake County 06----------------- 19 561 79 007 43 597 20 745 9 890 1 788 2 987Iowa County 02----------------------- 22 708 76 036 32 014 20 024 18 399 1 244 4 356
Iron County 07------------------------ 6 298 33 325 18 452 6 491 6 624 510 1 249Jackson County 03-------------------- 17 833 76 820 36 023 14 873 22 351 693 2 879Jefferson County 01 02 09------------------- 74 052 251 136 137 985 61 028 37 242 4 461 10 420Juneau County 06--------------------- 24 091 125 565 59 846 22 017 17 107 15 993 10 602Kenosha County 01------------------- 146 315 467 346 242 397 107 689 72 769 28 897 15 593
Kewaunee County 08------------------ 19 966 95 339 37 033 18 057 7 940 28 886 3 423La Crosse County 03------------------ 102 438 378 064 183 265 68 836 65 795 33 382 26 784Lafayette County 02------------------- 16 020 62 188 27 249 23 154 8 510 654 2 622Langlade County 08------------------- 20 563 99 576 48 532 18 753 24 390 5 165 2 736Lincoln County 07--------------------- 29 949 119 079 67 391 23 665 22 832 952 4 239
Manitowoc County 06 08------------------ 82 726 288 557 167 414 69 747 37 366 3 411 10 619Marathon County 07------------------- 123 584 391 204 195 390 80 204 75 358 10 864 29 387Marinette County 08------------------- 43 019 241 614 105 688 36 457 31 648 58 997 8 826Marquette County 06------------------ 15 344 77 766 43 460 16 009 9 461 6 223 2 614Menominee County 08----------------- 5 033 35 863 6 020 2 490 21 050 5 971 332
Milwaukee County 04 05------------------ 906 248 4 533 993 1 835 072 963 673 1 078 734 117 068 539 446Monroe County 03 06--------------------- 39 725 258 643 94 468 28 602 34 582 22 983 78 008Oconto County 08--------------------- 34 382 119 402 63 331 25 628 23 263 2 235 4 944Oneida County 07 08--------------------- 36 052 170 424 98 220 31 926 25 961 2 158 12 159Outagamie County 06 08------------------ 158 480 416 940 246 405 80 976 61 935 7 989 19 634
Ozaukee County 09------------------- 82 015 235 453 138 617 49 954 15 767 22 639 8 476Pepin County 03---------------------- 7 307 33 159 14 701 8 696 5 050 3 435 1 276Pierce County 03---------------------- 36 052 103 947 53 110 25 876 17 852 1 517 5 592Polk County 03 07----------------------- 39 363 138 655 73 905 32 923 22 707 2 256 6 863Portage County 07-------------------- 65 022 212 359 97 157 44 345 48 882 10 238 11 736
See footnotes at end of table.
Consolidated Federal Funds Report for Fiscal Year 1999 67U.S. Census Bureau
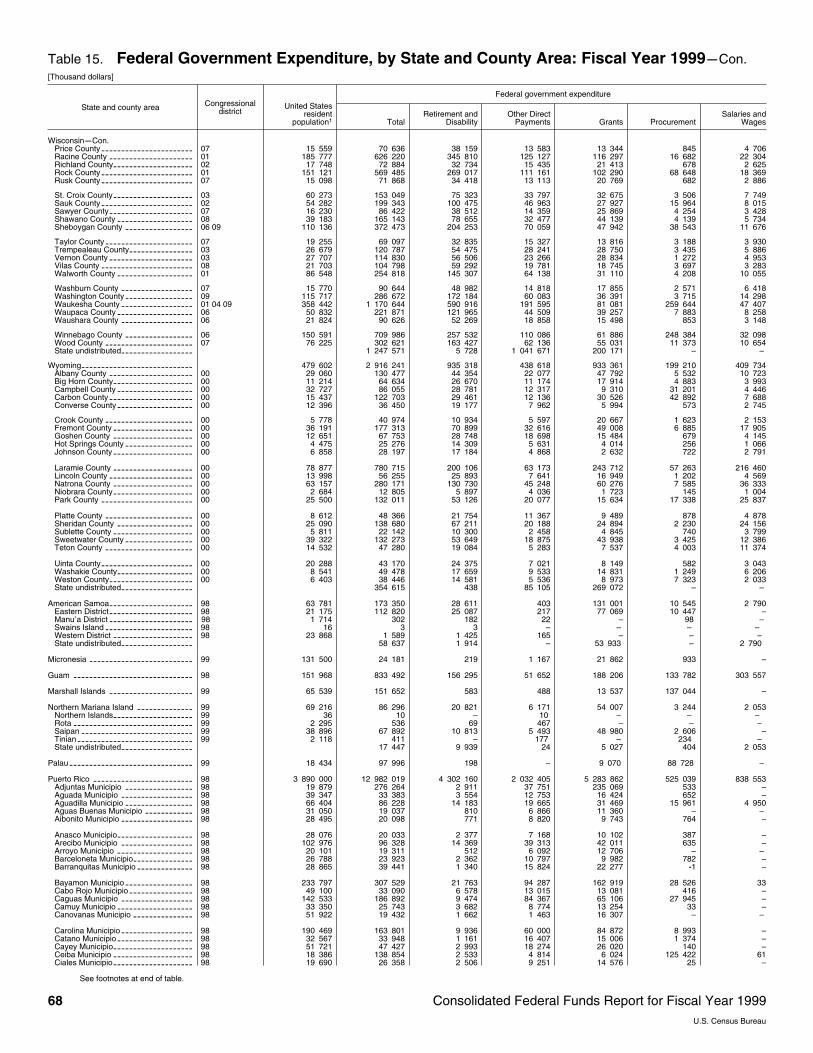
Table 15. Federal Government Expenditure, by State and County Area: Fiscal Year 1999mCon.[Thousand dollars]
State and county area Congressionaldistrict
Federal government expenditure
United Statesresident
population1 TotalRetirement and
DisabilityOther Direct
Payments Grants ProcurementSalaries and
Wages
WisconsinmCon.Price County 07----------------------- 15 559 70 636 38 159 13 583 13 344 845 4 706Racine County 01--------------------- 185 777 626 220 345 810 125 127 116 297 16 682 22 304Richland County 02-------------------- 17 748 72 884 32 734 15 435 21 413 678 2 625Rock County 01----------------------- 151 121 569 485 269 017 111 161 102 290 68 648 18 369Rusk County 07----------------------- 15 098 71 868 34 418 13 113 20 769 682 2 886
St. Croix County 03-------------------- 60 273 153 049 75 323 33 797 32 675 3 506 7 749Sauk County 02----------------------- 54 282 199 343 100 475 46 963 27 927 15 964 8 015Sawyer County 07--------------------- 16 230 86 422 38 512 14 359 25 869 4 254 3 428Shawano County 08------------------- 39 183 165 143 78 655 32 477 44 139 4 139 5 734Sheboygan County 06 09----------------- 110 136 372 473 204 253 70 059 47 942 38 543 11 676
Taylor County 07---------------------- 19 255 69 097 32 835 15 327 13 816 3 188 3 930Trempealeau County 03---------------- 26 679 120 787 54 475 28 241 28 750 3 435 5 886Vernon County 03--------------------- 27 707 114 830 56 506 23 266 28 834 1 272 4 953Vilas County 08----------------------- 21 703 104 798 59 292 19 781 18 745 3 697 3 283Walworth County 01------------------- 86 548 254 818 145 307 64 138 31 110 4 208 10 055
Washburn County 07------------------ 15 770 90 644 48 982 14 818 17 855 2 571 6 418Washington County 09----------------- 115 717 286 672 172 184 60 083 36 391 3 715 14 298Waukesha County 01 04 09------------------ 358 442 1 170 644 590 916 191 595 81 081 259 644 47 407Waupaca County 06------------------- 50 832 221 871 121 965 44 509 39 257 7 883 8 258Waushara County 06------------------ 21 824 90 626 52 269 18 858 15 498 853 3 148
Winnebago County 06----------------- 150 591 709 986 257 532 110 086 61 886 248 384 32 098Wood County 07---------------------- 76 225 302 621 163 427 62 136 55 031 11 373 10 654State undistributed------------------ 1 247 571 5 728 1 041 671 200 171 – –
Wyoming---------------------------- 479 602 2 916 241 935 318 438 618 933 361 199 210 409 734Albany County 00--------------------- 29 060 130 477 44 354 22 077 47 792 5 532 10 723Big Horn County 00-------------------- 11 214 64 634 26 670 11 174 17 914 4 883 3 993Campbell County 00------------------- 32 727 86 055 28 781 12 317 9 310 31 201 4 446Carbon County 00--------------------- 15 437 122 703 29 461 12 136 30 526 42 892 7 688Converse County 00------------------- 12 396 36 450 19 177 7 962 5 994 573 2 745
Crook County 00---------------------- 5 778 40 974 10 934 5 597 20 667 1 623 2 153Fremont County 00-------------------- 36 191 177 313 70 899 32 616 49 008 6 885 17 905Goshen County 00-------------------- 12 651 67 753 28 748 18 698 15 484 679 4 145Hot Springs County 00----------------- 4 475 25 276 14 309 5 631 4 014 256 1 066Johnson County 00-------------------- 6 858 28 197 17 184 4 868 2 632 722 2 791
Laramie County 00-------------------- 78 877 780 715 200 106 63 173 243 712 57 263 216 460Lincoln County 00--------------------- 13 998 56 255 25 893 7 641 16 949 1 202 4 569Natrona County 00-------------------- 63 157 280 171 130 730 45 248 60 276 7 585 36 333Niobrara County 00-------------------- 2 684 12 805 5 897 4 036 1 723 145 1 004Park County 00----------------------- 25 500 132 011 53 126 20 077 15 634 17 338 25 837
Platte County 00---------------------- 8 612 48 366 21 754 11 367 9 489 878 4 878Sheridan County 00------------------- 25 090 138 680 67 211 20 188 24 894 2 230 24 156Sublette County 00-------------------- 5 811 22 142 10 300 2 458 4 845 740 3 799Sweetwater County 00----------------- 39 322 132 273 53 649 18 875 43 938 3 425 12 386Teton County 00---------------------- 14 532 47 280 19 084 5 283 7 537 4 003 11 374
Uinta County 00----------------------- 20 288 43 170 24 375 7 021 8 149 582 3 043Washakie County 00------------------- 8 541 49 478 17 659 9 533 14 831 1 249 6 206Weston County 00--------------------- 6 403 38 446 14 581 5 536 8 973 7 323 2 033State undistributed------------------ 354 615 438 85 105 269 072 – –
American Samoa 98--------------------- 63 781 173 350 28 611 403 131 001 10 545 2 790Eastern District 98--------------------- 21 175 112 820 25 087 217 77 069 10 447 –Manu’a District 98--------------------- 1 714 302 182 22 – 98 –Swains Island 98---------------------- 16 3 3 – – – –Western District 98-------------------- 23 868 1 589 1 425 165 – – –State undistributed------------------ 58 637 1 914 – 53 933 – 2 790
Micronesia 99-------------------------- 131 500 24 181 219 1 167 21 862 933 –
Guam 98------------------------------ 151 968 833 492 156 295 51 652 188 206 133 782 303 557
Marshall Islands 99--------------------- 65 539 151 652 583 488 13 537 137 044 –
Northern Mariana Island 99-------------- 69 216 86 296 20 821 6 171 54 007 3 244 2 053Northern Islands 99-------------------- 36 10 – 10 – – –Rota 99------------------------------ 2 295 536 69 467 – – –Saipan 99---------------------------- 38 896 67 892 10 813 5 493 48 980 2 606 –Tinian 99----------------------------- 2 118 411 – 177 – 234 –State undistributed------------------ 17 447 9 939 24 5 027 404 2 053
Palau 99------------------------------- 18 434 97 996 198 – 9 070 88 728 –
Puerto Rico 98------------------------- 3 890 000 12 982 019 4 302 160 2 032 405 5 283 862 525 039 838 553Adjuntas Municipio 98----------------- 19 879 276 264 2 911 37 751 235 069 533 –Aguada Municipio 98------------------ 39 347 33 383 3 554 12 753 16 424 652 –Aguadilla Municipio 98----------------- 66 404 86 228 14 183 19 665 31 469 15 961 4 950Aguas Buenas Municipio 98------------ 31 050 19 037 810 6 866 11 360 – –Aibonito Municipio 98------------------ 28 495 20 098 771 8 820 9 743 764 –
Anasco Municipio 98------------------- 28 076 20 033 2 377 7 168 10 102 387 –Arecibo Municipio 98------------------ 102 976 96 328 14 369 39 313 42 011 635 –Arroyo Municipio 98------------------- 20 101 19 311 512 6 092 12 706 – –Barceloneta Municipio 98--------------- 26 788 23 923 2 362 10 797 9 982 782 –Barranquitas Municipio 98-------------- 28 865 39 441 1 340 15 824 22 277 ~1 –
Bayamon Municipio 98----------------- 233 797 307 529 21 763 94 287 162 919 28 526 33Cabo Rojo Municipio 98---------------- 49 100 33 090 6 578 13 015 13 081 416 –Caguas Municipio 98------------------ 142 533 186 892 9 474 84 367 65 106 27 945 –Camuy Municipio 98------------------- 33 350 25 743 3 682 8 774 13 254 33 –Canovanas Municipio 98--------------- 51 922 19 432 1 662 1 463 16 307 – –
Carolina Municipio 98------------------ 190 469 163 801 9 936 60 000 84 872 8 993 –Catano Municipio 98------------------- 32 567 33 948 1 161 16 407 15 006 1 374 –Cayey Municipio 98-------------------- 51 721 47 427 2 993 18 274 26 020 140 –Ceiba Municipio 98-------------------- 18 386 138 854 2 533 4 814 6 024 125 422 61Ciales Municipio 98-------------------- 19 690 26 358 2 506 9 251 14 576 25 –
See footnotes at end of table.
68 Consolidated Federal Funds Report for Fiscal Year 1999U.S. Census Bureau
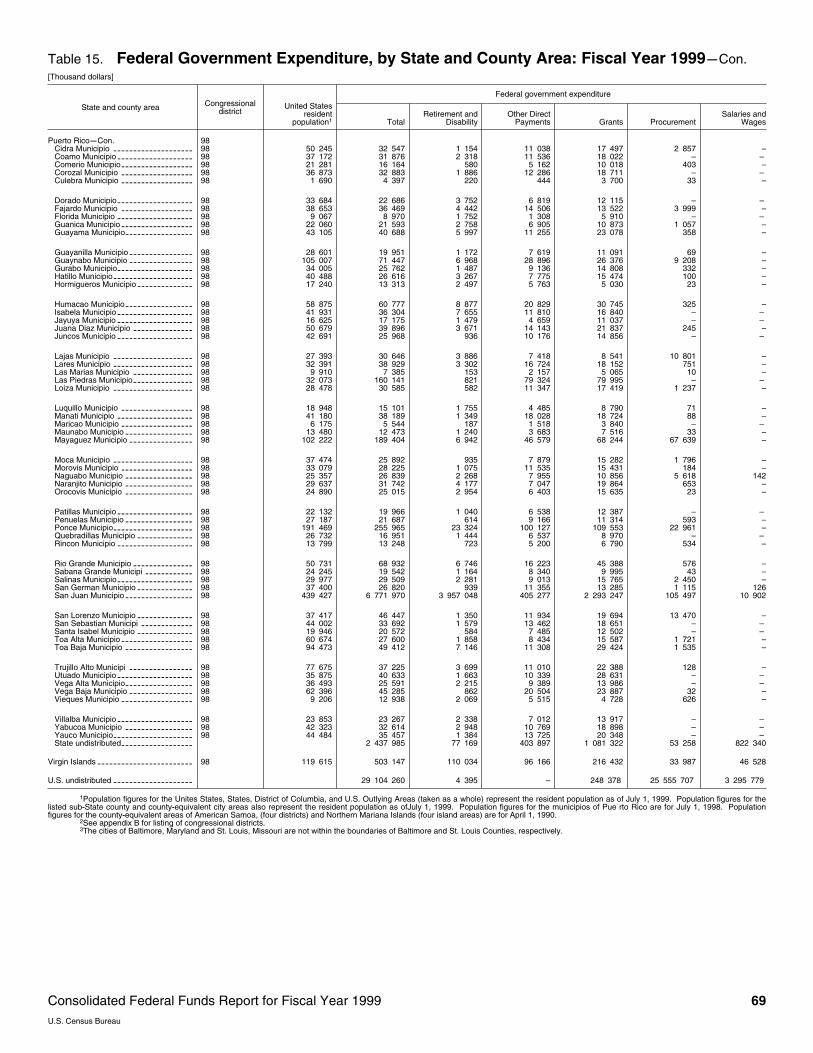
Table 15. Federal Government Expenditure, by State and County Area: Fiscal Year 1999mCon.[Thousand dollars]
State and county area Congressionaldistrict
Federal government expenditure
United Statesresident
population1 TotalRetirement and
DisabilityOther Direct
Payments Grants ProcurementSalaries and
Wages
Puerto RicomCon. 98Cidra Municipio 98-------------------- 50 245 32 547 1 154 11 038 17 497 2 857 –Coamo Municipio 98------------------- 37 172 31 876 2 318 11 536 18 022 – –Comerio Municipio 98------------------ 21 281 16 164 580 5 162 10 018 403 –Corozal Municipio 98------------------ 36 873 32 883 1 886 12 286 18 711 – –Culebra Municipio 98------------------ 1 690 4 397 220 444 3 700 33 –
Dorado Municipio 98------------------- 33 684 22 686 3 752 6 819 12 115 – –Fajardo Municipio 98------------------ 38 653 36 469 4 442 14 506 13 522 3 999 –Florida Municipio 98------------------- 9 067 8 970 1 752 1 308 5 910 – –Guanica Municipio 98------------------ 22 060 21 593 2 758 6 905 10 873 1 057 –Guayama Municipio 98----------------- 43 105 40 688 5 997 11 255 23 078 358 –
Guayanilla Municipio 98---------------- 28 601 19 951 1 172 7 619 11 091 69 –Guaynabo Municipio 98---------------- 105 007 71 447 6 968 28 896 26 376 9 208 –Gurabo Municipio 98------------------- 34 005 25 762 1 487 9 136 14 808 332 –Hatillo Municipio 98-------------------- 40 488 26 616 3 267 7 775 15 474 100 –Hormigueros Municipio 98-------------- 17 240 13 313 2 497 5 763 5 030 23 –
Humacao Municipio 98----------------- 58 875 60 777 8 877 20 829 30 745 325 –Isabela Municipio 98------------------- 41 931 36 304 7 655 11 810 16 840 – –Jayuya Municipio 98------------------- 16 625 17 175 1 479 4 659 11 037 – –Juana Diaz Municipio 98--------------- 50 679 39 896 3 671 14 143 21 837 245 –Juncos Municipio 98------------------- 42 691 25 968 936 10 176 14 856 – –
Lajas Municipio 98-------------------- 27 393 30 646 3 886 7 418 8 541 10 801 –Lares Municipio 98-------------------- 32 391 38 929 3 302 16 724 18 152 751 –Las Marias Municipio 98--------------- 9 910 7 385 153 2 157 5 065 10 –Las Piedras Municipio 98--------------- 32 073 160 141 821 79 324 79 995 – –Loiza Municipio 98-------------------- 28 478 30 585 582 11 347 17 419 1 237 –
Luquillo Municipio 98------------------ 18 948 15 101 1 755 4 485 8 790 71 –Manati Municipio 98------------------- 41 180 38 189 1 349 18 028 18 724 88 –Maricao Municipio 98------------------ 6 175 5 544 187 1 518 3 840 – –Maunabo Municipio 98----------------- 13 480 12 473 1 240 3 683 7 516 33 –Mayaguez Municipio 98---------------- 102 222 189 404 6 942 46 579 68 244 67 639 –
Moca Municipio 98-------------------- 37 474 25 892 935 7 879 15 282 1 796 –Morovis Municipio 98------------------ 33 079 28 225 1 075 11 535 15 431 184 –Naguabo Municipio 98----------------- 25 357 26 839 2 268 7 955 10 856 5 618 142Naranjito Municipio 98----------------- 29 637 31 742 4 177 7 047 19 864 653 –Orocovis Municipio 98----------------- 24 890 25 015 2 954 6 403 15 635 23 –
Patillas Municipio 98------------------- 22 132 19 966 1 040 6 538 12 387 – –Penuelas Municipio 98----------------- 27 187 21 687 614 9 166 11 314 593 –Ponce Municipio 98-------------------- 191 469 255 965 23 324 100 127 109 553 22 961 –Quebradillas Municipio 98-------------- 26 732 16 951 1 444 6 537 8 970 – –Rincon Municipio 98------------------- 13 799 13 248 723 5 200 6 790 534 –
Rio Grande Municipio 98--------------- 50 731 68 932 6 746 16 223 45 388 576 –Sabana Grande Municipi 98------------ 24 245 19 542 1 164 8 340 9 995 43 –Salinas Municipio 98------------------- 29 977 29 509 2 281 9 013 15 765 2 450 –San German Municipio 98-------------- 37 400 26 820 939 11 355 13 285 1 115 126San Juan Municipio 98----------------- 439 427 6 771 970 3 957 048 405 277 2 293 247 105 497 10 902
San Lorenzo Municipio 98-------------- 37 417 46 447 1 350 11 934 19 694 13 470 –San Sebastian Municipi 98------------- 44 002 33 692 1 579 13 462 18 651 – –Santa Isabel Municipio 98-------------- 19 946 20 572 584 7 485 12 502 – –Toa Alta Municipio 98------------------ 60 674 27 600 1 858 8 434 15 587 1 721 –Toa Baja Municipio 98----------------- 94 473 49 412 7 146 11 308 29 424 1 535 –
Trujillo Alto Municipi 98---------------- 77 675 37 225 3 699 11 010 22 388 128 –Utuado Municipio 98------------------- 35 875 40 633 1 663 10 339 28 631 – –Vega Alta Municipio 98----------------- 36 493 25 591 2 215 9 389 13 986 – –Vega Baja Municipio 98---------------- 62 396 45 285 862 20 504 23 887 32 –Vieques Municipio 98------------------ 9 206 12 938 2 069 5 515 4 728 626 –
Villalba Municipio 98------------------- 23 853 23 267 2 338 7 012 13 917 – –Yabucoa Municipio 98----------------- 42 323 32 614 2 948 10 769 18 898 – –Yauco Municipio 98-------------------- 44 484 35 457 1 384 13 725 20 348 – –State undistributed------------------ 2 437 985 77 169 403 897 1 081 322 53 258 822 340
Virgin Islands 98------------------------ 119 615 503 147 110 034 96 166 216 432 33 987 46 528
U.S. undistributed -------------------- 29 104 260 4 395 – 248 378 25 555 707 3 295 779
1Population figures for the Unites States, States, District of Columbia, and U.S. Outlying Areas (taken as a whole) represent the resident population as of July 1, 1999. Population figures for thelisted sub~State county and county~equivalent city areas also represent the resident population as ofJuly 1, 1999. Population figures for the municipios of Pue rto Rico are for July 1, 1998. Populationfigures for the county~equivalent areas of American Samoa, (four districts) and Northern Mariana Islands (four island areas) are for April 1, 1990.
2See appendix B for listing of congressional districts.3The cities of Baltimore, Maryland and St. Louis, Missouri are not within the boundaries of Baltimore and St. Louis Counties, respectively.
Consolidated Federal Funds Report for Fiscal Year 1999 69U.S. Census Bureau
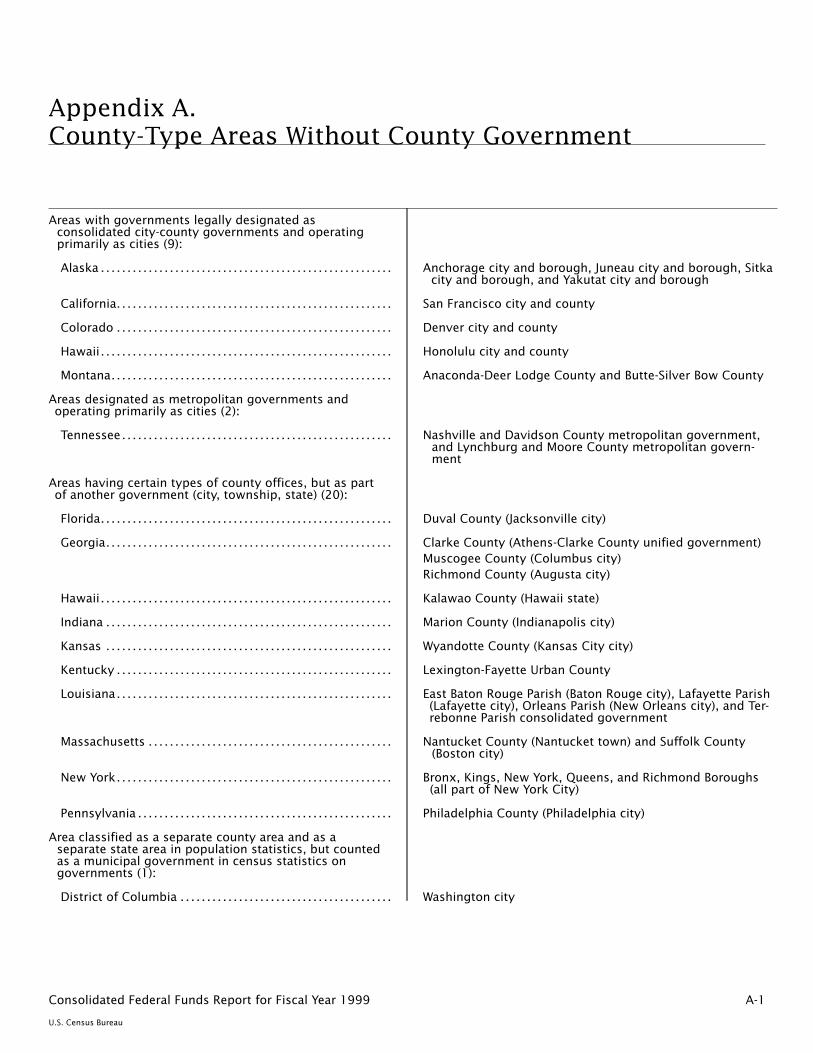
Appendix A.County-Type Areas Without County Government
Areas with governments legally designated asconsolidated city-county governments and operatingprimarily as cities (9):
Alaska . . . . . . . . . . . . . . . . . . . . . . . . . . . . . . . . . . . . . . . . . . . . . . . . . . . . . . . Anchorage city and borough, Juneau city and borough, Sitkacity and borough, and Yakutat city and borough
California. . . . . . . . . . . . . . . . . . . . . . . . . . . . . . . . . . . . . . . . . . . . . . . . . . . . San Francisco city and county
Colorado . . . . . . . . . . . . . . . . . . . . . . . . . . . . . . . . . . . . . . . . . . . . . . . . . . . . Denver city and county
Hawaii. . . . . . . . . . . . . . . . . . . . . . . . . . . . . . . . . . . . . . . . . . . . . . . . . . . . . . . Honolulu city and county
Montana. . . . . . . . . . . . . . . . . . . . . . . . . . . . . . . . . . . . . . . . . . . . . . . . . . . . . Anaconda-Deer Lodge County and Butte-Silver Bow County
Areas designated as metropolitan governments andoperating primarily as cities (2):
Tennessee. . . . . . . . . . . . . . . . . . . . . . . . . . . . . . . . . . . . . . . . . . . . . . . . . . . Nashville and Davidson County metropolitan government,and Lynchburg and Moore County metropolitan govern-ment
Areas having certain types of county offices, but as partof another government (city, township, state) (20):
Florida. . . . . . . . . . . . . . . . . . . . . . . . . . . . . . . . . . . . . . . . . . . . . . . . . . . . . . . Duval County (Jacksonville city)
Georgia. . . . . . . . . . . . . . . . . . . . . . . . . . . . . . . . . . . . . . . . . . . . . . . . . . . . . . Clarke County (Athens-Clarke County unified government)Muscogee County (Columbus city)Richmond County (Augusta city)
Hawaii. . . . . . . . . . . . . . . . . . . . . . . . . . . . . . . . . . . . . . . . . . . . . . . . . . . . . . . Kalawao County (Hawaii state)
Indiana . . . . . . . . . . . . . . . . . . . . . . . . . . . . . . . . . . . . . . . . . . . . . . . . . . . . . . Marion County (Indianapolis city)
Kansas . . . . . . . . . . . . . . . . . . . . . . . . . . . . . . . . . . . . . . . . . . . . . . . . . . . . . . Wyandotte County (Kansas City city)
Kentucky . . . . . . . . . . . . . . . . . . . . . . . . . . . . . . . . . . . . . . . . . . . . . . . . . . . . Lexington-Fayette Urban County
Louisiana. . . . . . . . . . . . . . . . . . . . . . . . . . . . . . . . . . . . . . . . . . . . . . . . . . . . East Baton Rouge Parish (Baton Rouge city), Lafayette Parish(Lafayette city), Orleans Parish (New Orleans city), and Ter-rebonne Parish consolidated government
Massachusetts . . . . . . . . . . . . . . . . . . . . . . . . . . . . . . . . . . . . . . . . . . . . . . Nantucket County (Nantucket town) and Suffolk County(Boston city)
New York. . . . . . . . . . . . . . . . . . . . . . . . . . . . . . . . . . . . . . . . . . . . . . . . . . . . Bronx, Kings, New York, Queens, and Richmond Boroughs(all part of New York City)
Pennsylvania . . . . . . . . . . . . . . . . . . . . . . . . . . . . . . . . . . . . . . . . . . . . . . . . Philadelphia County (Philadelphia city)
Area classified as a separate county area and as aseparate state area in population statistics, but countedas a municipal government in census statistics ongovernments (1):
District of Columbia . . . . . . . . . . . . . . . . . . . . . . . . . . . . . . . . . . . . . . . . Washington city
A-1Consolidated Federal Funds Report for Fiscal Year 1999
U.S. Census Bureau
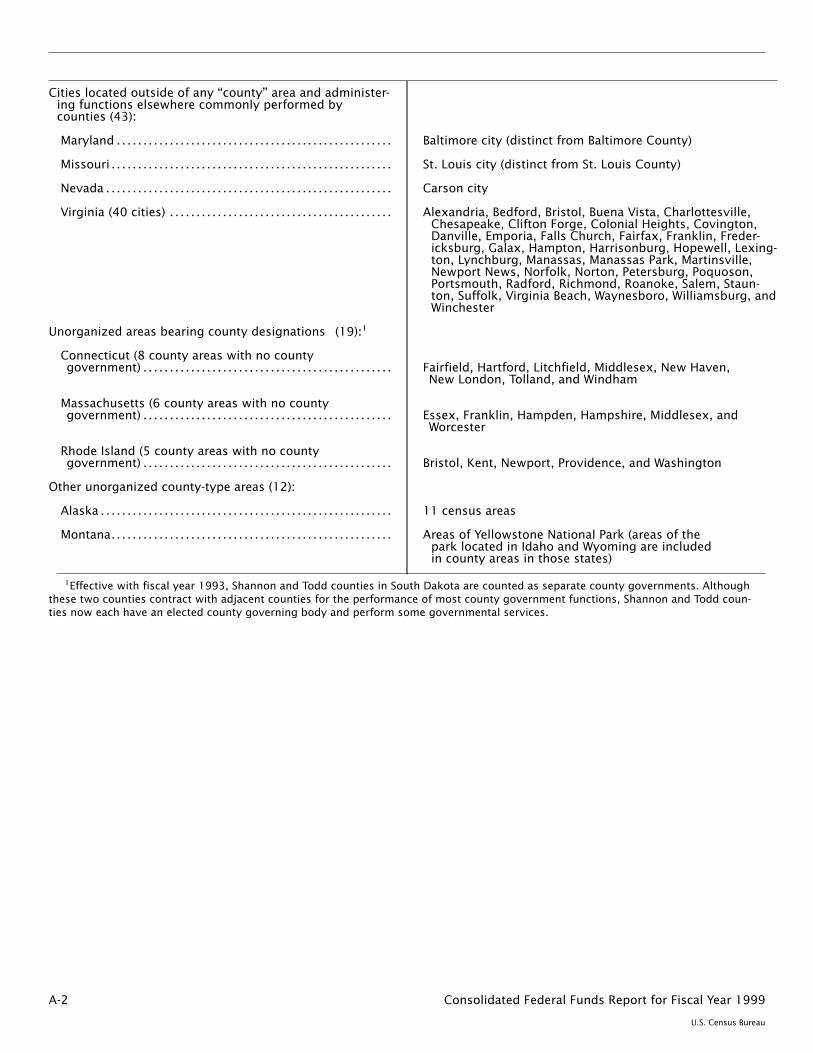
Cities located outside of any ‘‘county’’ area and administer-ing functions elsewhere commonly performed bycounties (43):
Maryland . . . . . . . . . . . . . . . . . . . . . . . . . . . . . . . . . . . . . . . . . . . . . . . . . . . . Baltimore city (distinct from Baltimore County)
Missouri . . . . . . . . . . . . . . . . . . . . . . . . . . . . . . . . . . . . . . . . . . . . . . . . . . . . . St. Louis city (distinct from St. Louis County)
Nevada . . . . . . . . . . . . . . . . . . . . . . . . . . . . . . . . . . . . . . . . . . . . . . . . . . . . . . Carson city
Virginia (40 cities) . . . . . . . . . . . . . . . . . . . . . . . . . . . . . . . . . . . . . . . . . . Alexandria, Bedford, Bristol, Buena Vista, Charlottesville,Chesapeake, Clifton Forge, Colonial Heights, Covington,Danville, Emporia, Falls Church, Fairfax, Franklin, Freder-icksburg, Galax, Hampton, Harrisonburg, Hopewell, Lexing-ton, Lynchburg, Manassas, Manassas Park, Martinsville,Newport News, Norfolk, Norton, Petersburg, Poquoson,Portsmouth, Radford, Richmond, Roanoke, Salem, Staun-ton, Suffolk, Virginia Beach, Waynesboro, Williamsburg, andWinchester
Unorganized areas bearing county designations (19):1
Connecticut (8 county areas with no countygovernment) . . . . . . . . . . . . . . . . . . . . . . . . . . . . . . . . . . . . . . . . . . . . . . . Fairfield, Hartford, Litchfield, Middlesex, New Haven,
New London, Tolland, and Windham
Massachusetts (6 county areas with no countygovernment) . . . . . . . . . . . . . . . . . . . . . . . . . . . . . . . . . . . . . . . . . . . . . . . Essex, Franklin, Hampden, Hampshire, Middlesex, and
Worcester
Rhode Island (5 county areas with no countygovernment) . . . . . . . . . . . . . . . . . . . . . . . . . . . . . . . . . . . . . . . . . . . . . . . Bristol, Kent, Newport, Providence, and Washington
Other unorganized county-type areas (12):
Alaska . . . . . . . . . . . . . . . . . . . . . . . . . . . . . . . . . . . . . . . . . . . . . . . . . . . . . . . 11 census areas
Montana. . . . . . . . . . . . . . . . . . . . . . . . . . . . . . . . . . . . . . . . . . . . . . . . . . . . . Areas of Yellowstone National Park (areas of thepark located in Idaho and Wyoming are includedin county areas in those states)
1Effective with fiscal year 1993, Shannon and Todd counties in South Dakota are counted as separate county governments. Althoughthese two counties contract with adjacent counties for the performance of most county government functions, Shannon and Todd coun-ties now each have an elected county governing body and perform some governmental services.
A-2 Consolidated Federal Funds Report for Fiscal Year 1999
U.S. Census Bureau
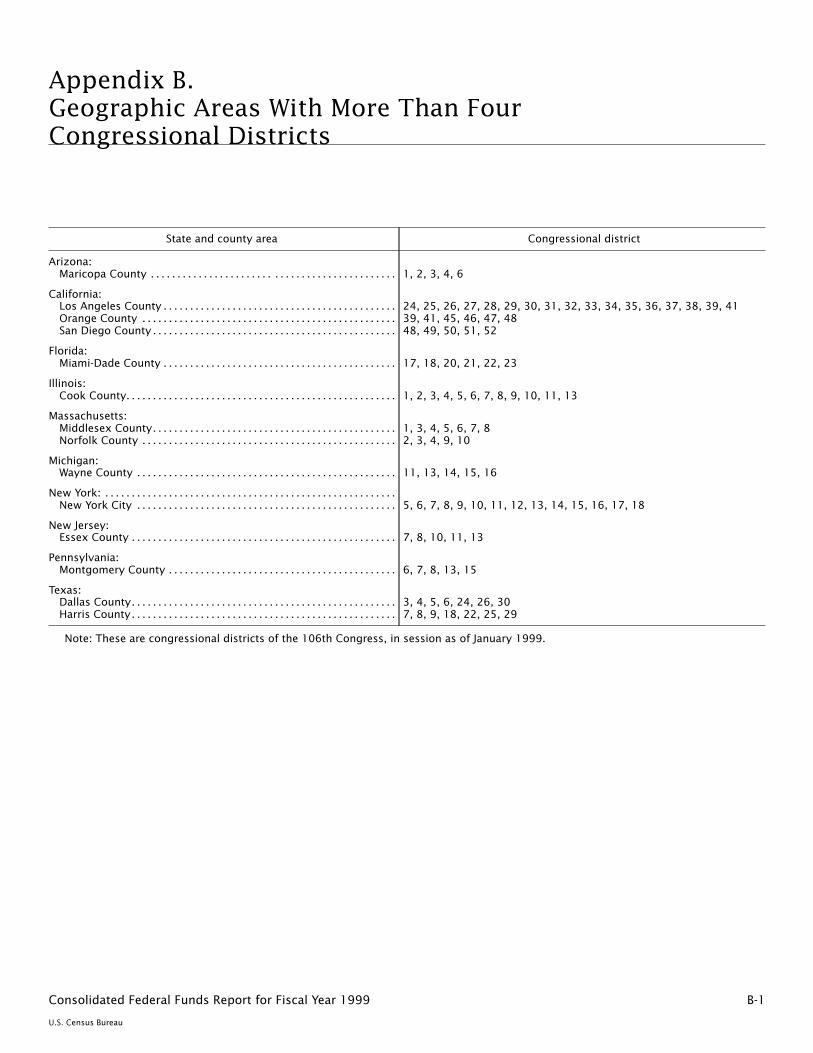
Appendix B.Geographic Areas With More Than FourCongressional Districts
State and county area Congressional district
Arizona:Maricopa County . . . . . . . . . . . . . . . . . . . . . . . . . . . . . . . . . . . . . . . . . . . . . . 1, 2, 3, 4, 6
California:Los Angeles County . . . . . . . . . . . . . . . . . . . . . . . . . . . . . . . . . . . . . . . . . . . . 24, 25, 26, 27, 28, 29, 30, 31, 32, 33, 34, 35, 36, 37, 38, 39, 41Orange County . . . . . . . . . . . . . . . . . . . . . . . . . . . . . . . . . . . . . . . . . . . . . . . . 39, 41, 45, 46, 47, 48San Diego County . . . . . . . . . . . . . . . . . . . . . . . . . . . . . . . . . . . . . . . . . . . . . . 48, 49, 50, 51, 52
Florida:Miami-Dade County . . . . . . . . . . . . . . . . . . . . . . . . . . . . . . . . . . . . . . . . . . . . 17, 18, 20, 21, 22, 23
Illinois:Cook County. . . . . . . . . . . . . . . . . . . . . . . . . . . . . . . . . . . . . . . . . . . . . . . . . . . 1, 2, 3, 4, 5, 6, 7, 8, 9, 10, 11, 13
Massachusetts:Middlesex County. . . . . . . . . . . . . . . . . . . . . . . . . . . . . . . . . . . . . . . . . . . . . . 1, 3, 4, 5, 6, 7, 8Norfolk County . . . . . . . . . . . . . . . . . . . . . . . . . . . . . . . . . . . . . . . . . . . . . . . . 2, 3, 4, 9, 10
Michigan:Wayne County . . . . . . . . . . . . . . . . . . . . . . . . . . . . . . . . . . . . . . . . . . . . . . . . . 11, 13, 14, 15, 16
New York: . . . . . . . . . . . . . . . . . . . . . . . . . . . . . . . . . . . . . . . . . . . . . . . . . . . . . . .New York City . . . . . . . . . . . . . . . . . . . . . . . . . . . . . . . . . . . . . . . . . . . . . . . . . 5, 6, 7, 8, 9, 10, 11, 12, 13, 14, 15, 16, 17, 18
New Jersey:Essex County . . . . . . . . . . . . . . . . . . . . . . . . . . . . . . . . . . . . . . . . . . . . . . . . . . 7, 8, 10, 11, 13
Pennsylvania:Montgomery County . . . . . . . . . . . . . . . . . . . . . . . . . . . . . . . . . . . . . . . . . . . 6, 7, 8, 13, 15
Texas:Dallas County. . . . . . . . . . . . . . . . . . . . . . . . . . . . . . . . . . . . . . . . . . . . . . . . . . 3, 4, 5, 6, 24, 26, 30Harris County. . . . . . . . . . . . . . . . . . . . . . . . . . . . . . . . . . . . . . . . . . . . . . . . . . 7, 8, 9, 18, 22, 25, 29
Note: These are congressional districts of the 106th Congress, in session as of January 1999.
B-1Consolidated Federal Funds Report for Fiscal Year 1999
U.S. Census Bureau
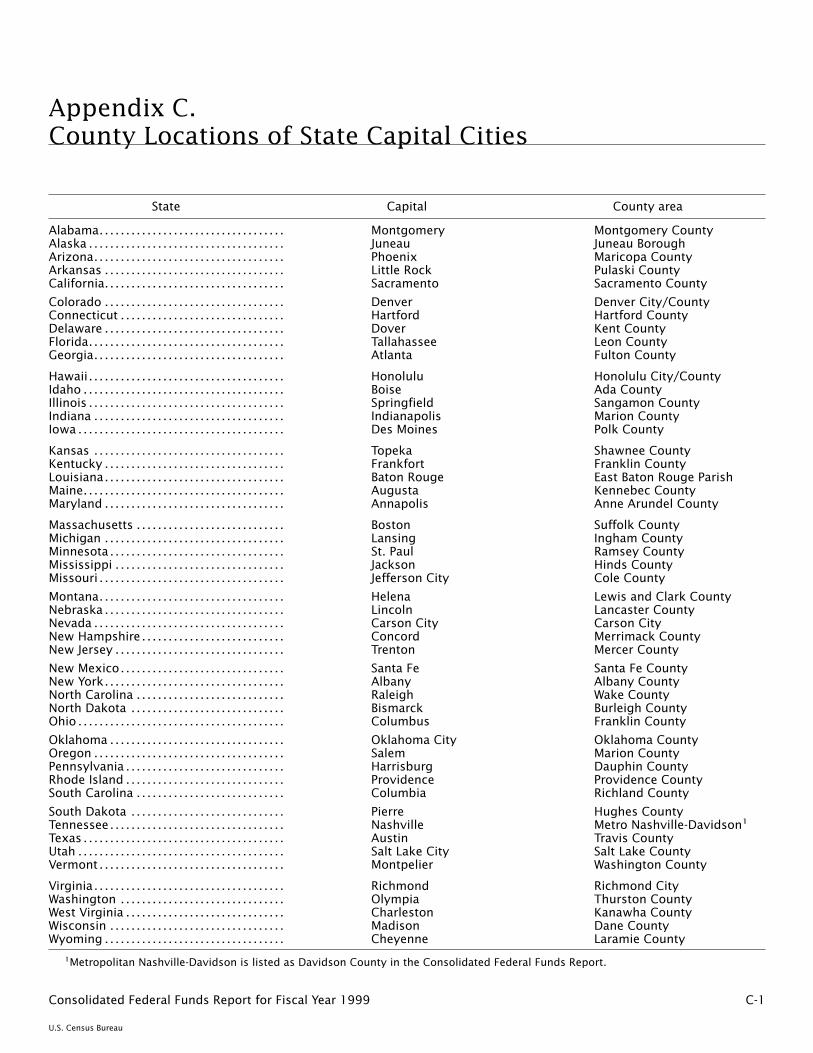
Appendix C.County Locations of State Capital Cities
State Capital County area
Alabama. . . . . . . . . . . . . . . . . . . . . . . . . . . . . . . . . . . Montgomery Montgomery CountyAlaska . . . . . . . . . . . . . . . . . . . . . . . . . . . . . . . . . . . . . Juneau Juneau BoroughArizona. . . . . . . . . . . . . . . . . . . . . . . . . . . . . . . . . . . . Phoenix Maricopa CountyArkansas . . . . . . . . . . . . . . . . . . . . . . . . . . . . . . . . . . Little Rock Pulaski CountyCalifornia. . . . . . . . . . . . . . . . . . . . . . . . . . . . . . . . . . Sacramento Sacramento County
Colorado . . . . . . . . . . . . . . . . . . . . . . . . . . . . . . . . . . Denver Denver City/CountyConnecticut . . . . . . . . . . . . . . . . . . . . . . . . . . . . . . . Hartford Hartford CountyDelaware . . . . . . . . . . . . . . . . . . . . . . . . . . . . . . . . . . Dover Kent CountyFlorida. . . . . . . . . . . . . . . . . . . . . . . . . . . . . . . . . . . . . Tallahassee Leon CountyGeorgia. . . . . . . . . . . . . . . . . . . . . . . . . . . . . . . . . . . . Atlanta Fulton County
Hawaii. . . . . . . . . . . . . . . . . . . . . . . . . . . . . . . . . . . . . Honolulu Honolulu City/CountyIdaho . . . . . . . . . . . . . . . . . . . . . . . . . . . . . . . . . . . . . . Boise Ada CountyIllinois . . . . . . . . . . . . . . . . . . . . . . . . . . . . . . . . . . . . . Springfield Sangamon CountyIndiana . . . . . . . . . . . . . . . . . . . . . . . . . . . . . . . . . . . . Indianapolis Marion CountyIowa . . . . . . . . . . . . . . . . . . . . . . . . . . . . . . . . . . . . . . . Des Moines Polk County
Kansas . . . . . . . . . . . . . . . . . . . . . . . . . . . . . . . . . . . . Topeka Shawnee CountyKentucky . . . . . . . . . . . . . . . . . . . . . . . . . . . . . . . . . . Frankfort Franklin CountyLouisiana. . . . . . . . . . . . . . . . . . . . . . . . . . . . . . . . . . Baton Rouge East Baton Rouge ParishMaine. . . . . . . . . . . . . . . . . . . . . . . . . . . . . . . . . . . . . . Augusta Kennebec CountyMaryland . . . . . . . . . . . . . . . . . . . . . . . . . . . . . . . . . . Annapolis Anne Arundel County
Massachusetts . . . . . . . . . . . . . . . . . . . . . . . . . . . . Boston Suffolk CountyMichigan . . . . . . . . . . . . . . . . . . . . . . . . . . . . . . . . . . Lansing Ingham CountyMinnesota . . . . . . . . . . . . . . . . . . . . . . . . . . . . . . . . . St. Paul Ramsey CountyMississippi . . . . . . . . . . . . . . . . . . . . . . . . . . . . . . . . Jackson Hinds CountyMissouri . . . . . . . . . . . . . . . . . . . . . . . . . . . . . . . . . . . Jefferson City Cole County
Montana. . . . . . . . . . . . . . . . . . . . . . . . . . . . . . . . . . . Helena Lewis and Clark CountyNebraska . . . . . . . . . . . . . . . . . . . . . . . . . . . . . . . . . . Lincoln Lancaster CountyNevada . . . . . . . . . . . . . . . . . . . . . . . . . . . . . . . . . . . . Carson City Carson CityNew Hampshire . . . . . . . . . . . . . . . . . . . . . . . . . . . Concord Merrimack CountyNew Jersey . . . . . . . . . . . . . . . . . . . . . . . . . . . . . . . . Trenton Mercer County
New Mexico. . . . . . . . . . . . . . . . . . . . . . . . . . . . . . . Santa Fe Santa Fe CountyNew York. . . . . . . . . . . . . . . . . . . . . . . . . . . . . . . . . . Albany Albany CountyNorth Carolina . . . . . . . . . . . . . . . . . . . . . . . . . . . . Raleigh Wake CountyNorth Dakota . . . . . . . . . . . . . . . . . . . . . . . . . . . . . Bismarck Burleigh CountyOhio . . . . . . . . . . . . . . . . . . . . . . . . . . . . . . . . . . . . . . . Columbus Franklin County
Oklahoma . . . . . . . . . . . . . . . . . . . . . . . . . . . . . . . . . Oklahoma City Oklahoma CountyOregon . . . . . . . . . . . . . . . . . . . . . . . . . . . . . . . . . . . . Salem Marion CountyPennsylvania . . . . . . . . . . . . . . . . . . . . . . . . . . . . . . Harrisburg Dauphin CountyRhode Island . . . . . . . . . . . . . . . . . . . . . . . . . . . . . . Providence Providence CountySouth Carolina . . . . . . . . . . . . . . . . . . . . . . . . . . . . Columbia Richland County
South Dakota . . . . . . . . . . . . . . . . . . . . . . . . . . . . . Pierre Hughes CountyTennessee. . . . . . . . . . . . . . . . . . . . . . . . . . . . . . . . . Nashville Metro Nashville-Davidson1
Texas . . . . . . . . . . . . . . . . . . . . . . . . . . . . . . . . . . . . . . Austin Travis CountyUtah . . . . . . . . . . . . . . . . . . . . . . . . . . . . . . . . . . . . . . . Salt Lake City Salt Lake CountyVermont . . . . . . . . . . . . . . . . . . . . . . . . . . . . . . . . . . . Montpelier Washington County
Virginia. . . . . . . . . . . . . . . . . . . . . . . . . . . . . . . . . . . . Richmond Richmond CityWashington . . . . . . . . . . . . . . . . . . . . . . . . . . . . . . . Olympia Thurston CountyWest Virginia . . . . . . . . . . . . . . . . . . . . . . . . . . . . . . Charleston Kanawha CountyWisconsin . . . . . . . . . . . . . . . . . . . . . . . . . . . . . . . . . Madison Dane CountyWyoming . . . . . . . . . . . . . . . . . . . . . . . . . . . . . . . . . . Cheyenne Laramie County
1Metropolitan Nashville-Davidson is listed as Davidson County in the Consolidated Federal Funds Report.
C-1Consolidated Federal Funds Report for Fiscal Year 1999
U.S. Census Bureau
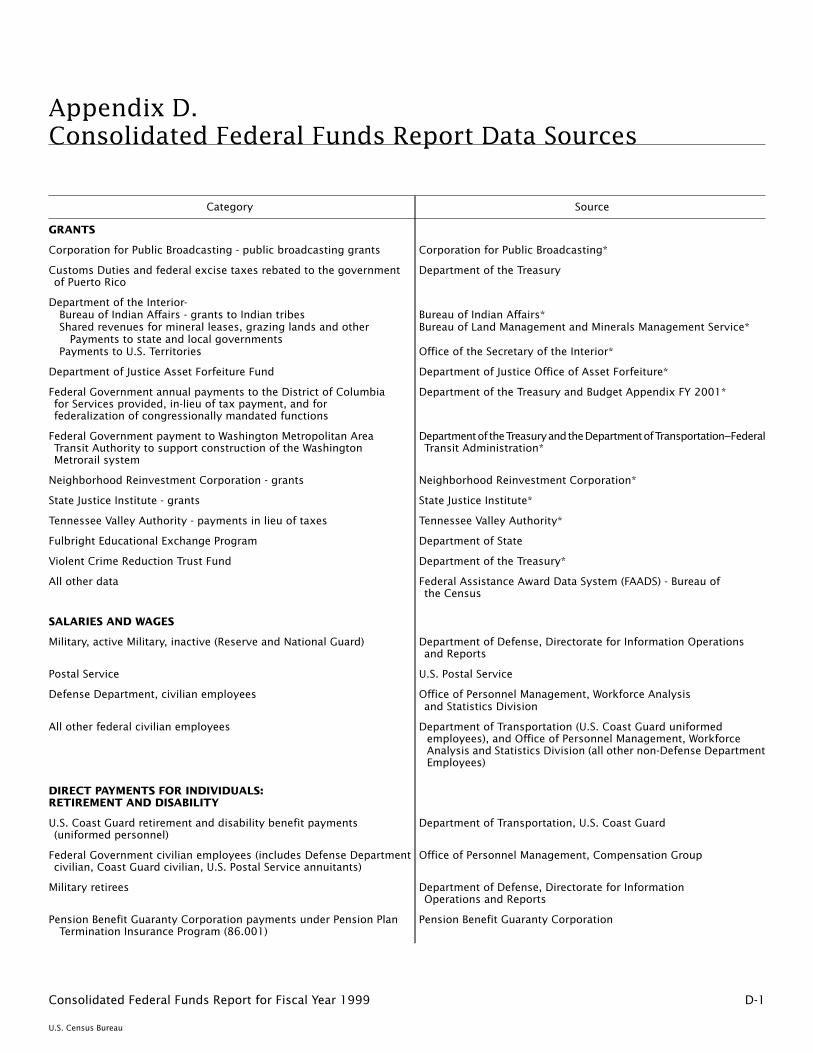
Appendix D.Consolidated Federal Funds Report Data Sources
Category Source
GRANTS
Corporation for Public Broadcasting - public broadcasting grants Corporation for Public Broadcasting*
Customs Duties and federal excise taxes rebated to the governmentof Puerto Rico
Department of the Treasury
Department of the Interior-Bureau of Indian Affairs - grants to Indian tribes Bureau of Indian Affairs*Shared revenues for mineral leases, grazing lands and other Bureau of Land Management and Minerals Management Service*Payments to state and local governments
Payments to U.S. Territories Office of the Secretary of the Interior*
Department of Justice Asset Forfeiture Fund Department of Justice Office of Asset Forfeiture*
Federal Government annual payments to the District of Columbiafor Services provided, in-lieu of tax payment, and forfederalization of congressionally mandated functions
Department of the Treasury and Budget Appendix FY 2001*
Federal Government payment to Washington Metropolitan AreaTransit Authority to support construction of the WashingtonMetrorail system
Departmentof theTreasuryandtheDepartmentofTransportation−FederalTransit Administration*
Neighborhood Reinvestment Corporation - grants Neighborhood Reinvestment Corporation*
State Justice Institute - grants State Justice Institute*
Tennessee Valley Authority - payments in lieu of taxes Tennessee Valley Authority*
Fulbright Educational Exchange Program Department of State
Violent Crime Reduction Trust Fund Department of the Treasury*
All other data Federal Assistance Award Data System (FAADS) - Bureau ofthe Census
SALARIES AND WAGES
Military, active Military, inactive (Reserve and National Guard) Department of Defense, Directorate for Information Operationsand Reports
Postal Service U.S. Postal Service
Defense Department, civilian employees Office of Personnel Management, Workforce Analysisand Statistics Division
All other federal civilian employees Department of Transportation (U.S. Coast Guard uniformedemployees), and Office of Personnel Management, WorkforceAnalysis and Statistics Division (all other non-Defense DepartmentEmployees)
DIRECT PAYMENTS FOR INDIVIDUALS:RETIREMENT AND DISABILITY
U.S. Coast Guard retirement and disability benefit payments(uniformed personnel)
Department of Transportation, U.S. Coast Guard
Federal Government civilian employees (includes Defense Departmentcivilian, Coast Guard civilian, U.S. Postal Service annuitants)
Office of Personnel Management, Compensation Group
Military retirees Department of Defense, Directorate for InformationOperations and Reports
Pension Benefit Guaranty Corporation payments under Pension PlanTermination Insurance Program (86.001)
Pension Benefit Guaranty Corporation
D-1Consolidated Federal Funds Report for Fiscal Year 1999
U.S. Census Bureau
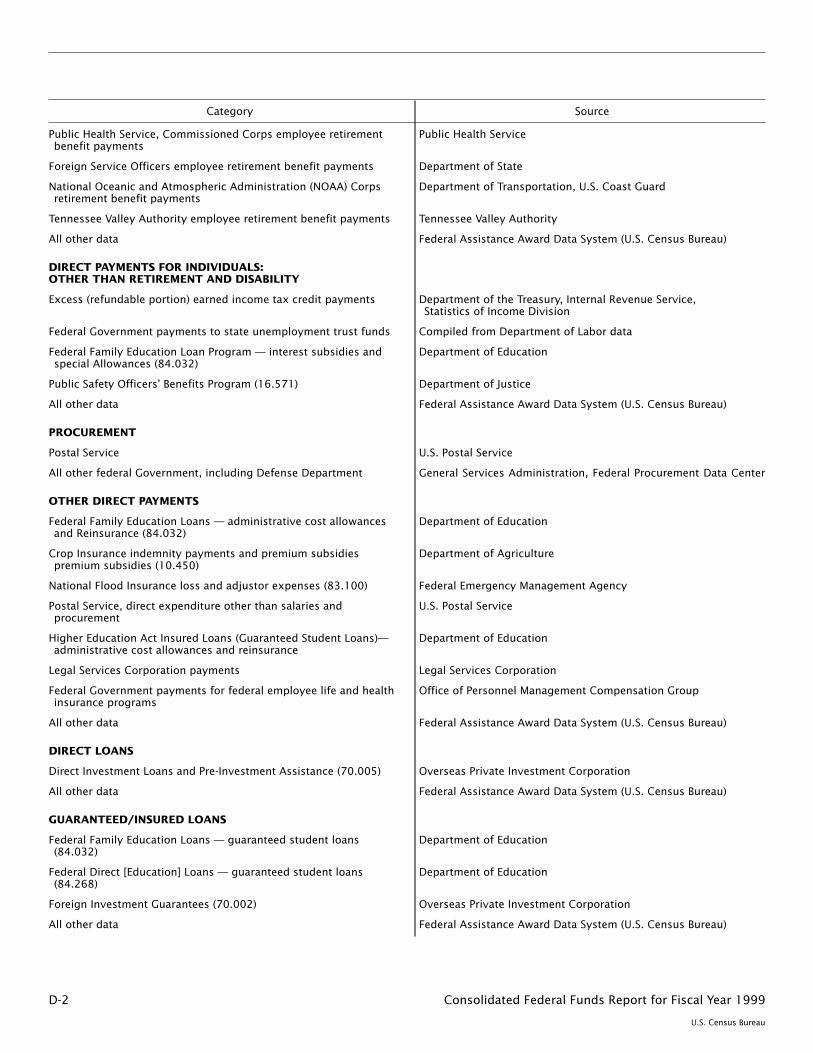
Category Source
Public Health Service, Commissioned Corps employee retirementbenefit payments
Public Health Service
Foreign Service Officers employee retirement benefit payments Department of State
National Oceanic and Atmospheric Administration (NOAA) Corpsretirement benefit payments
Department of Transportation, U.S. Coast Guard
Tennessee Valley Authority employee retirement benefit payments Tennessee Valley Authority
All other data Federal Assistance Award Data System (U.S. Census Bureau)
DIRECT PAYMENTS FOR INDIVIDUALS:OTHER THAN RETIREMENT AND DISABILITY
Excess (refundable portion) earned income tax credit payments Department of the Treasury, Internal Revenue Service,Statistics of Income Division
Federal Government payments to state unemployment trust funds Compiled from Department of Labor data
Federal Family Education Loan Program — interest subsidies andspecial Allowances (84.032)
Department of Education
Public Safety Officers’ Benefits Program (16.571) Department of Justice
All other data Federal Assistance Award Data System (U.S. Census Bureau)
PROCUREMENT
Postal Service U.S. Postal Service
All other federal Government, including Defense Department General Services Administration, Federal Procurement Data Center
OTHER DIRECT PAYMENTS
Federal Family Education Loans — administrative cost allowancesand Reinsurance (84.032)
Department of Education
Crop Insurance indemnity payments and premium subsidiespremium subsidies (10.450)
Department of Agriculture
National Flood Insurance loss and adjustor expenses (83.100) Federal Emergency Management Agency
Postal Service, direct expenditure other than salaries andprocurement
U.S. Postal Service
Higher Education Act Insured Loans (Guaranteed Student Loans)—administrative cost allowances and reinsurance
Department of Education
Legal Services Corporation payments Legal Services Corporation
Federal Government payments for federal employee life and healthinsurance programs
Office of Personnel Management Compensation Group
All other data Federal Assistance Award Data System (U.S. Census Bureau)
DIRECT LOANS
Direct Investment Loans and Pre-Investment Assistance (70.005) Overseas Private Investment Corporation
All other data Federal Assistance Award Data System (U.S. Census Bureau)
GUARANTEED/INSURED LOANS
Federal Family Education Loans — guaranteed student loans(84.032)
Department of Education
Federal Direct [Education] Loans — guaranteed student loans(84.268)
Department of Education
Foreign Investment Guarantees (70.002) Overseas Private Investment Corporation
All other data Federal Assistance Award Data System (U.S. Census Bureau)
D-2 Consolidated Federal Funds Report for Fiscal Year 1999
U.S. Census Bureau
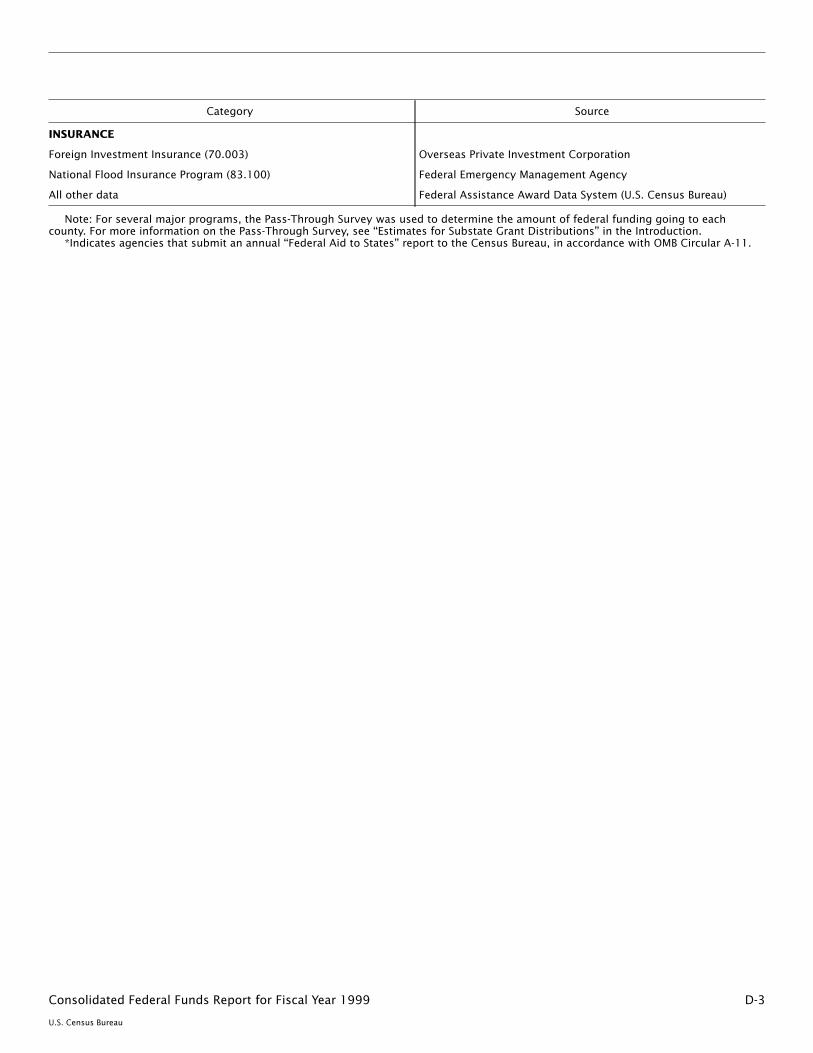
Category Source
INSURANCE
Foreign Investment Insurance (70.003) Overseas Private Investment Corporation
National Flood Insurance Program (83.100) Federal Emergency Management Agency
All other data Federal Assistance Award Data System (U.S. Census Bureau)
Note: For several major programs, the Pass-Through Survey was used to determine the amount of federal funding going to eachcounty. For more information on the Pass-Through Survey, see ‘‘Estimates for Substate Grant Distributions’’ in the Introduction.
*Indicates agencies that submit an annual ‘‘Federal Aid to States’’ report to the Census Bureau, in accordance with OMB Circular A-11.
D-3Consolidated Federal Funds Report for Fiscal Year 1999
U.S. Census Bureau
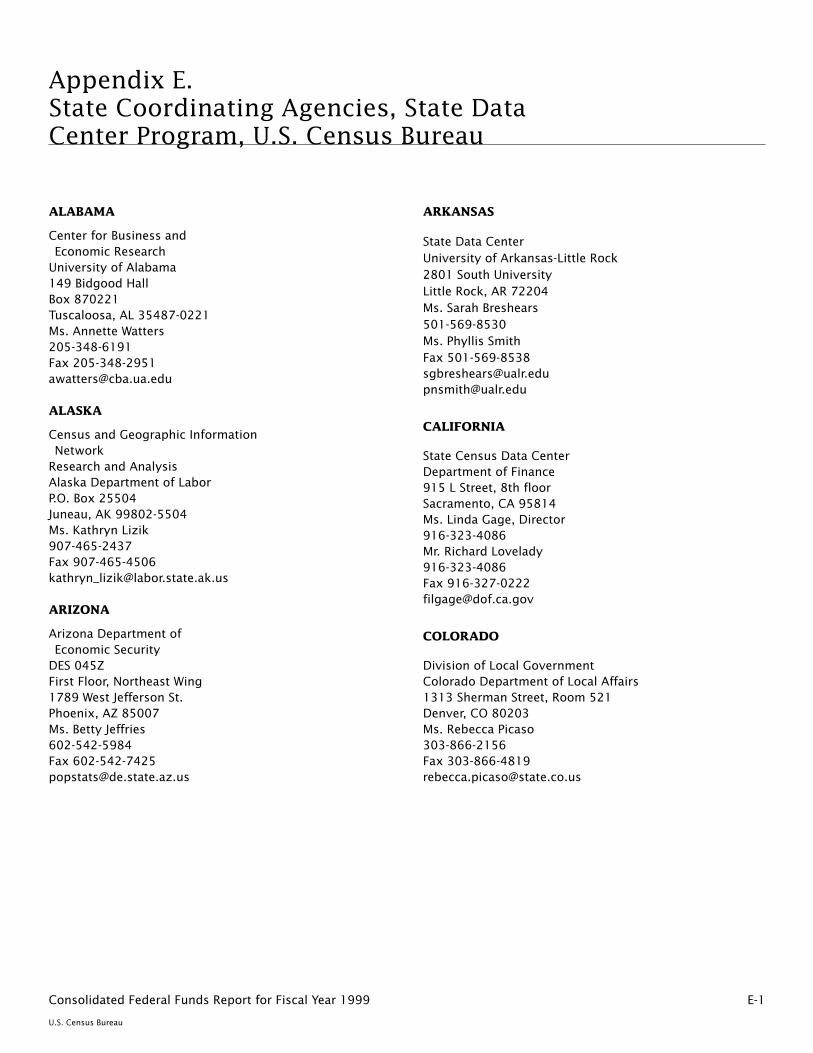
Appendix E.State Coordinating Agencies, State DataCenter Program, U.S. Census Bureau
ALABAMA
Center for Business andEconomic ResearchUniversity of Alabama149 Bidgood HallBox 870221Tuscaloosa, AL 35487-0221Ms. Annette Watters205-348-6191Fax [email protected]
ALASKA
Census and Geographic InformationNetworkResearch and AnalysisAlaska Department of LaborP.O. Box 25504Juneau, AK 99802-5504Ms. Kathryn Lizik907-465-2437Fax [email protected]
ARIZONA
Arizona Department ofEconomic SecurityDES 045ZFirst Floor, Northeast Wing1789 West Jefferson St.Phoenix, AZ 85007Ms. Betty Jeffries602-542-5984Fax [email protected]
ARKANSAS
State Data CenterUniversity of Arkansas-Little Rock2801 South UniversityLittle Rock, AR 72204Ms. Sarah Breshears501-569-8530Ms. Phyllis SmithFax [email protected]@ualr.edu
CALIFORNIA
State Census Data CenterDepartment of Finance915 L Street, 8th floorSacramento, CA 95814Ms. Linda Gage, Director916-323-4086Mr. Richard Lovelady916-323-4086Fax [email protected]
COLORADO
Division of Local GovernmentColorado Department of Local Affairs1313 Sherman Street, Room 521Denver, CO 80203Ms. Rebecca Picaso303-866-2156Fax [email protected]
E-1Consolidated Federal Funds Report for Fiscal Year 1999
U.S. Census Bureau
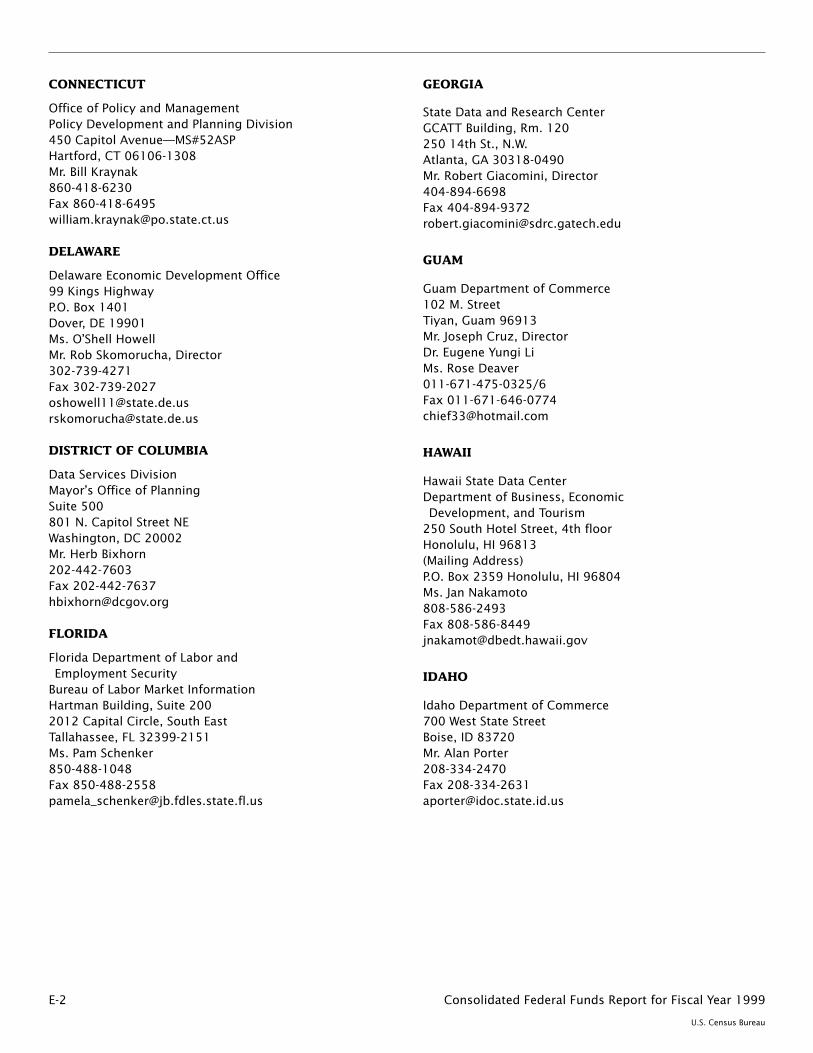
CONNECTICUT
Office of Policy and ManagementPolicy Development and Planning Division450 Capitol Avenue—MS#52ASPHartford, CT 06106-1308Mr. Bill Kraynak860-418-6230Fax [email protected]
DELAWARE
Delaware Economic Development Office99 Kings HighwayP.O. Box 1401Dover, DE 19901Ms. O’Shell HowellMr. Rob Skomorucha, Director302-739-4271Fax [email protected]@state.de.us
DISTRICT OF COLUMBIA
Data Services DivisionMayor’s Office of PlanningSuite 500801 N. Capitol Street NEWashington, DC 20002Mr. Herb Bixhorn202-442-7603Fax [email protected]
FLORIDA
Florida Department of Labor andEmployment SecurityBureau of Labor Market InformationHartman Building, Suite 2002012 Capital Circle, South EastTallahassee, FL 32399-2151Ms. Pam Schenker850-488-1048Fax [email protected]
GEORGIA
State Data and Research CenterGCATT Building, Rm. 120250 14th St., N.W.Atlanta, GA 30318-0490Mr. Robert Giacomini, Director404-894-6698Fax [email protected]
GUAM
Guam Department of Commerce102 M. StreetTiyan, Guam 96913Mr. Joseph Cruz, DirectorDr. Eugene Yungi LiMs. Rose Deaver011-671-475-0325/6Fax [email protected]
HAWAII
Hawaii State Data CenterDepartment of Business, EconomicDevelopment, and Tourism250 South Hotel Street, 4th floorHonolulu, HI 96813(Mailing Address)P.O. Box 2359 Honolulu, HI 96804Ms. Jan Nakamoto808-586-2493Fax [email protected]
IDAHO
Idaho Department of Commerce700 West State StreetBoise, ID 83720Mr. Alan Porter208-334-2470Fax [email protected]
E-2 Consolidated Federal Funds Report for Fiscal Year 1999
U.S. Census Bureau
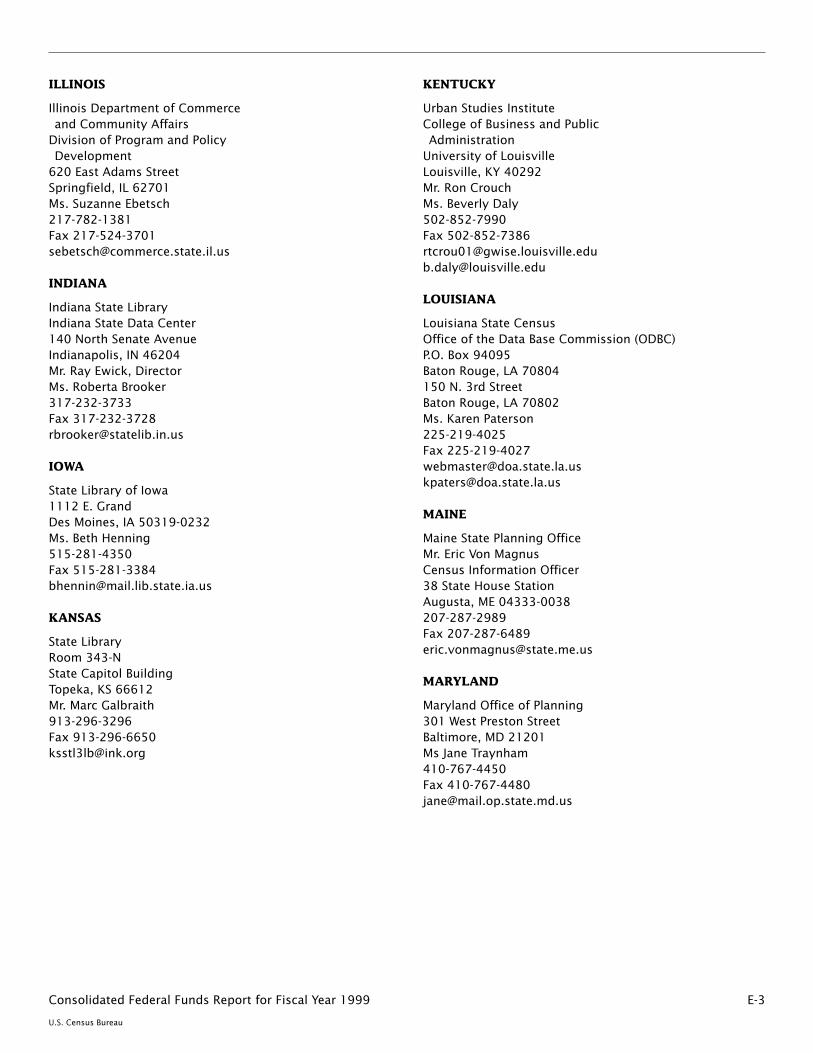
ILLINOIS
Illinois Department of Commerceand Community AffairsDivision of Program and PolicyDevelopment620 East Adams StreetSpringfield, IL 62701Ms. Suzanne Ebetsch217-782-1381Fax [email protected]
INDIANA
Indiana State LibraryIndiana State Data Center140 North Senate AvenueIndianapolis, IN 46204Mr. Ray Ewick, DirectorMs. Roberta Brooker317-232-3733Fax [email protected]
IOWA
State Library of Iowa1112 E. GrandDes Moines, IA 50319-0232Ms. Beth Henning515-281-4350Fax [email protected]
KANSAS
State LibraryRoom 343-NState Capitol BuildingTopeka, KS 66612Mr. Marc Galbraith913-296-3296Fax [email protected]
KENTUCKY
Urban Studies InstituteCollege of Business and PublicAdministrationUniversity of LouisvilleLouisville, KY 40292Mr. Ron CrouchMs. Beverly Daly502-852-7990Fax [email protected]@louisville.edu
LOUISIANA
Louisiana State CensusOffice of the Data Base Commission (ODBC)P.O. Box 94095Baton Rouge, LA 70804150 N. 3rd StreetBaton Rouge, LA 70802Ms. Karen Paterson225-219-4025Fax [email protected]@doa.state.la.us
MAINE
Maine State Planning OfficeMr. Eric Von MagnusCensus Information Officer38 State House StationAugusta, ME 04333-0038207-287-2989Fax [email protected]
MARYLAND
Maryland Office of Planning301 West Preston StreetBaltimore, MD 21201Ms Jane Traynham410-767-4450Fax [email protected]
E-3Consolidated Federal Funds Report for Fiscal Year 1999
U.S. Census Bureau
MASSACHUSETTS
Massachusetts Institute for Social andEconomic Research128 Thompson HallUniversity of MassachusettsAmherst, MA 01003Dr. Stephen Coelen, Director413-545-3460Fax [email protected]
MICHIGAN
Michigan Information CenterDepartment of Management and BudgetDemographic Research and StatisticsP.O. Box 30026Lansing, MI 48909Mr. Eric SwansonMs. Carolyn Lauer517-373-7910Fax [email protected]@state.mi.us
MINNESOTA
State Demographer’s OfficeMinnesota Planning300 Centennial Office Building658 Cedar StreetSt. Paul, MN 55155Mr. David Birkholz612-296-2557Ms. Barbara Ronningen651-297-4886Fax [email protected]@mnplan.state.mn.us
MISSISSIPPI
Center for Population StudiesThe University of MississippiBondurant Bldg., Room 3WUniversity, MS 38677-9702Dr. Max Williams, Director601-232-7288Fax [email protected]@olemiss.edu
MISSOURI
Missouri State Census Data Center600 W. Main StreetPO Box 387Jefferson City, MO 65102Ms. Debra Pitts573-526-7648Fax [email protected]
MONTANA
Census and Economic InformationCenterMontana Department of CommerceP.O. Box 2005051424 9th AvenueHelena, MT 59601Mr. Allan B. Cox406-444-4393Fax [email protected]
NEBRASKA
Center for Public Affairs ResearchNebraska State Data CenterPeter Kiewit Conference Center, # 232University of Nebraska at OmahaOmaha, NE 68182-0001Mr. Jerome Deichert402-554-2134Fax [email protected]
NEVADA
Nevada State Data Center100 N. Stewart StreetCarson City, NV 89710Ms. Joan KerschnerMs. Linda Lee Nary775-684-3326Fax 775-684-33301-800-922-2880 (in Nevada only)[email protected]
NEW HAMPSHIRE
New Hampshire Office of State Planning2 1/2 Beacon StreetConcord, NH 03301-4497Mr. Tom Duffy603-271-2155Fax [email protected]
E-4 Consolidated Federal Funds Report for Fiscal Year 1999
U.S. Census Bureau
NEW JERSEY
New Jersey State Data CenterDivision of Labor Market andDemographic ResearchNew Jersey Department of LaborCN 388Trenton, NJ 08625-0388Mr. David Joye609-984-2595Fax [email protected]
NEW MEXICO
New Mexico Economic DevelopmentDepartment1100 St. Francis DriveP.O. Box 20003Santa Fe, NM 87504-5003Ms. Elizabeth Davis505-827-0264Fax [email protected]
NEW YORK
New York State Data CenterEmpire State Development30 S. Pearl StreetAlbany, NY 12245Mr. Robert Scardamalia518-292-5300Fax [email protected]
NORTH CAROLINA
North Carolina Office of State Planning20321 Mail Service CenterRaleigh, NC 27699-0321Contact State Library of North CarolinaInformation Desk919-733-3270Fax 919-733-5679http://www.ospl.state.nc.us/sdn/
NORTH DAKOTA
North Dakota State Data CenterNorth Dakota State UniversityIACC 424P.O. Box 5636Fargo, ND 58105Dr. Richard Rathge701-231-8621Fax [email protected]://www.sdc.ag.ndsu.nodak.edu
NORTHERN MARIANA ISLANDS
Department of CommerceCentral Statistics DivisionCaller Box 10007, Donnie Hill Apts.Saipan, Mariana Islands 96950Mr. Isidro Ogarto, Acting DirectorFax [email protected]
OHIO
Office of Strategic ResearchOhio Department of DevelopmentP.O. Box 100177 High Street, 27th FloorColumbus, OH 43215Mr. Barry Bennett614-466-2115Fax [email protected]
OKLAHOMA
Oklahoma State Data CenterOklahoma Department of Commerce900 N. Stiles AvenueOklahoma City, OK 73104(Mailing address)P.O. Box 26980Oklahoma City, OK 73126-0980Mr. Jeff Wallace405-815-5184Fax [email protected]
E-5Consolidated Federal Funds Report for Fiscal Year 1999
U.S. Census Bureau
OREGON
Center for Population Research andCensus School of Urban and Public AffairsPortland State UniversityP.O. Box 751Portland, OR 97207-0751Mr. George Hough800-547-8887, ext. 5159503-725-5159Fax [email protected]://www.upa.pdx.edu/cprc/
PENNSYLVANIA
Pennsylvania State Data CenterInstitute of State and Regional AffairsPenn State Harrisburg777 West Harrisburg PikeMiddletown, PA 17057-4898Ms. Diane Shoop, Director717-948-6336Fax [email protected]
PUERTO RICO
Junta de PlanificacionOficina del CensoP.O. Box 41119Centro Gubernamental MinillasSan Juan, PR 00940-1119Sra. Lillian Torres Aguirre787-728-4430/787-723-6200 ext.2502Fax [email protected]
RHODE ISLAND
Rhode Island Department of AdministrationStatewide Planning ProgramOne Capitol HillProvidence, RI 02908-5873Mr. Mark Brown401-222-6183Fax [email protected]
SOUTH CAROLINA
Office of Research and Statistical ServicesSouth Carolina Budget and Control BoardRembert Dennis Bldg. Room 425Columbia, SC 29201Mr. Bobby BowersMr. Mike MacFarlaneMs. Diane Tester803-734-3780Fax [email protected]
SOUTH DAKOTA
Business Research BureauSchool of BusinessUniversity of South Dakota414 East Clark StreetVermillion, SD 57069Ms. Nancy Nelson, DirectorMs. Nancy Craig, Information Officer605-677-5287Fax [email protected]@usd.edu
TENNESSEE
Tennessee Department of Economicand Community Development320 Sixth Avenue6th Floor, Rachel Jackson BuildingNashville, TN 37243-0405Mr. Don [email protected]
TEXAS
Department of Rural SociologyTexas A & M University SystemSpecial Services BuildingCollege Station, TX 77843-2125Dr. Steve MurdockMs. Beverly Pecotte409-845-5115 or 5332Fax [email protected]@txsdcsun.tamu.edu
E-6 Consolidated Federal Funds Report for Fiscal Year 1999
U.S. Census Bureau
UTAH
Office of Planning and BudgetState Capitol, Room 116Salt Lake City, UT 84114Ms. Lisa Hillman801-537-9013Mr. David Abel801-538-1036Fax [email protected]@email.state.ut.us
VERMONT
Center for Rural StudiesUniversity of Vermont20 Morrill HallBurlington, VT 05405Ms. Sharon Whitaker802-656-3201Fax [email protected]
VIRGINIA
Virginia Employment Commission703 East Main StreetRichmond, VA 23219Mr. Don Lillywhite804-786-8026Fax [email protected]
VIRGIN ISLANDS
University of the Virgin IslandsEastern Caribbean CenterNo. 2 John Brewer’s BayCharlotte AmalieSt. Thomas, VI 00802Dr. Frank Mills340-693-1027Fax [email protected]
WASHINGTON
Forecasting DivisionOffice of Financial Management450 Insurance Bldg., Box 43113Olympia, WA 98504-3113Ms. Yi Zhao360-902-0599Fax [email protected]
WEST VIRGINIA
West Virginia Development OfficeResearch and Strategic Planning DivisionCapitol ComplexBuilding 6, Room 553Charleston, WV 25305Ms. Delphine Coffey304-558-4010Fax [email protected]
WISCONSIN
Department of AdministrationDemographic Services Center101 E. Wilson St., 6th FloorP.O. Box 7868Madison, WI 53707-7868Mr. Donald Harrier, chief608-267-2705Mr. Robert Naylor608-267-6931Fax [email protected]
WYOMING
Department of Admin. and InformationEconomic Analysis DivisionEmerson Building 327ECheyenne, WY 82002-0060Mr. Buck McVeighDr. Wenlin Liu307-777-7504Fax [email protected]
Note: If you plan to publish any information from this address list, you should be aware that changes are made regularly.
Please contact the Customer Liaison Office of the U.S. Census Bureau at 301-457-1305 for the latest listing.
To purchase CFFR data on tape or CD-ROM, contact:U.S. Census BureauCustomer Services
Washington, DC 20233301-457-4100
Fax for orders only: 888-249-7295Fax for general information: 301-457-4714
Visit the Census Bureau’s home page athttp://www.census.gov.
E-7Consolidated Federal Funds Report for Fiscal Year 1999
U.S. Census Bureau
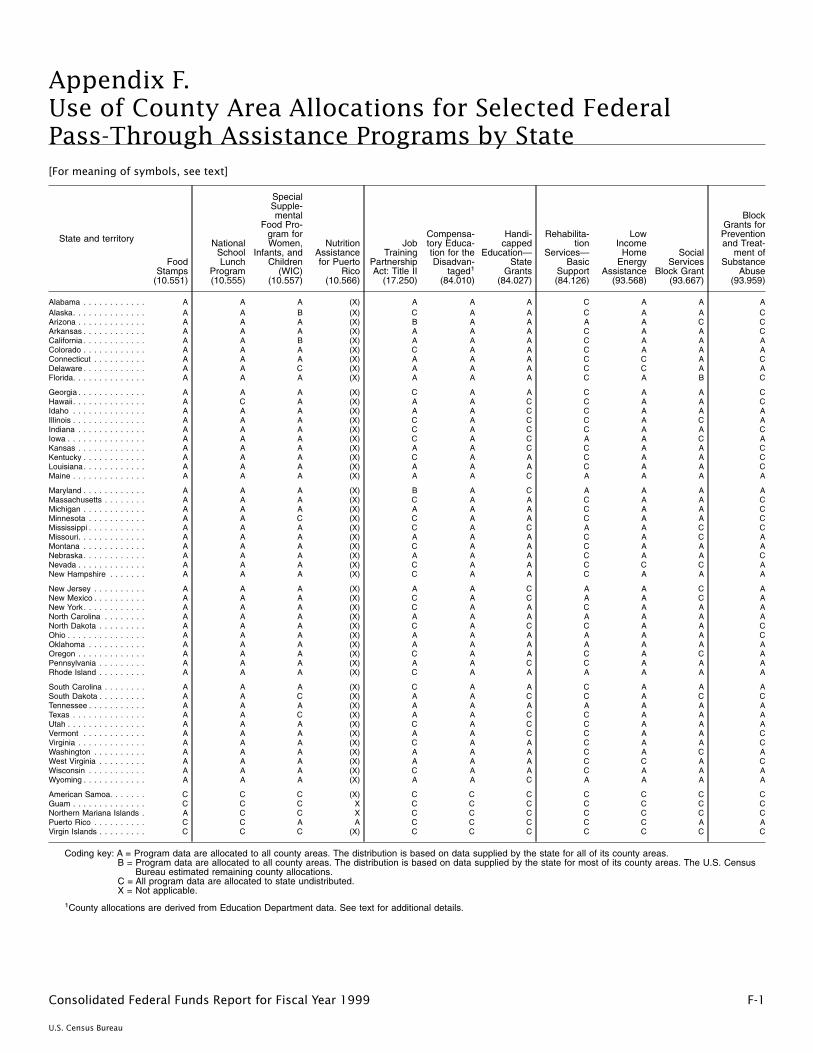
Appendix F.Use of County Area Allocations for Selected FederalPass-Through Assistance Programs by State[For meaning of symbols, see text]
State and territory
FoodStamps
(10.551)
NationalSchoolLunch
Program(10.555)
SpecialSupple-mental
Food Pro-gram forWomen,
Infants, andChildren
(WIC)(10.557)
NutritionAssistancefor Puerto
Rico(10.566)
JobTraining
PartnershipAct: Title II
(17.250)
Compensa-tory Educa-tion for theDisadvan-
taged1
(84.010)
Handi-capped
Education—State
Grants(84.027)
Rehabilita-tion
Services—Basic
Support(84.126)
LowIncome
HomeEnergy
Assistance(93.568)
SocialServices
Block Grant(93.667)
BlockGrants forPreventionand Treat-
ment ofSubstance
Abuse(93.959)
Alabama . . . . . . . . . . . . A A A (X) A A A C A A AAlaska. . . . . . . . . . . . . . A A B (X) C A A C A A CArizona . . . . . . . . . . . . . A A A (X) B A A A A C CArkansas . . . . . . . . . . . . A A A (X) A A A C A A CCalifornia . . . . . . . . . . . . A A B (X) A A A C A A AColorado . . . . . . . . . . . . A A A (X) C A A C A A AConnecticut . . . . . . . . . . A A A (X) A A A C C A CDelaware . . . . . . . . . . . . A A C (X) A A A C C A AFlorida. . . . . . . . . . . . . . A A A (X) A A A C A B C
Georgia . . . . . . . . . . . . . A A A (X) C A A C A A CHawaii. . . . . . . . . . . . . . A C A (X) A A C C A A CIdaho . . . . . . . . . . . . . . A A A (X) A A C C A A AIllinois . . . . . . . . . . . . . . A A A (X) C A C C A C AIndiana . . . . . . . . . . . . . A A A (X) C A C C A A CIowa . . . . . . . . . . . . . . . A A A (X) C A C A A C AKansas . . . . . . . . . . . . . A A A (X) A A C C A A CKentucky . . . . . . . . . . . . A A A (X) C A A C A A CLouisiana. . . . . . . . . . . . A A A (X) A A A C A A CMaine . . . . . . . . . . . . . . A A A (X) A A C A A A A
Maryland . . . . . . . . . . . . A A A (X) B A C A A A AMassachusetts . . . . . . . . A A A (X) C A A C A A CMichigan . . . . . . . . . . . . A A A (X) A A A C A A CMinnesota . . . . . . . . . . . A A C (X) C A A C A A CMississippi . . . . . . . . . . . A A A (X) C A C A A C CMissouri. . . . . . . . . . . . . A A A (X) A A A C A C AMontana . . . . . . . . . . . . A A A (X) C A A C A A ANebraska. . . . . . . . . . . . A A A (X) A A A C A A CNevada . . . . . . . . . . . . . A A A (X) C A A C C C ANew Hampshire . . . . . . . A A A (X) C A A C A A A
New Jersey . . . . . . . . . . A A A (X) A A C A A C ANew Mexico . . . . . . . . . . A A A (X) C A C A A C ANew York. . . . . . . . . . . . A A A (X) C A A C A A ANorth Carolina . . . . . . . . A A A (X) A A A A A A ANorth Dakota . . . . . . . . . A A A (X) C A C C A A COhio . . . . . . . . . . . . . . . A A A (X) A A A A A A COklahoma . . . . . . . . . . . A A A (X) A A A A A A AOregon . . . . . . . . . . . . . A A A (X) C A A C A C APennsylvania . . . . . . . . . A A A (X) A A C C A A ARhode Island . . . . . . . . . A A A (X) C A A A A A A
South Carolina . . . . . . . . A A A (X) C A A C A A ASouth Dakota . . . . . . . . . A A C (X) A A C C A C CTennessee . . . . . . . . . . . A A A (X) A A A A A A ATexas . . . . . . . . . . . . . . A A C (X) A A C C A A AUtah . . . . . . . . . . . . . . . A A A (X) C A C C A A AVermont . . . . . . . . . . . . A A A (X) A A C C A A CVirginia . . . . . . . . . . . . . A A A (X) C A A C A A CWashington . . . . . . . . . . A A A (X) A A A C A C AWest Virginia . . . . . . . . . A A A (X) A A A C C A CWisconsin . . . . . . . . . . . A A A (X) C A A C A A AWyoming . . . . . . . . . . . . A A A (X) A A C A A A A
American Samoa. . . . . . . C C C (X) C C C C C C CGuam . . . . . . . . . . . . . . C C C X C C C C C C CNorthern Mariana Islands . A C C X C C C C C C CPuerto Rico . . . . . . . . . . C C A A C C C C C A AVirgin Islands . . . . . . . . . C C C (X) C C C C C C C
Coding key: A = Program data are allocated to all county areas. The distribution is based on data supplied by the state for all of its county areas.B = Program data are allocated to all county areas. The distribution is based on data supplied by the state for most of its county areas. The U.S. Census
Bureau estimated remaining county allocations.C = All program data are allocated to state undistributed.X = Not applicable.
1County allocations are derived from Education Department data. See text for additional details.
F-1Consolidated Federal Funds Report for Fiscal Year 1999
U.S. Census Bureau
Related Documents


![[Final] ENG Consolidated EM for CMS Funds (b32727651v1 24 ...](https://static.cupdf.com/doc/110x72/62765ac4874b0304af0786e3/final-eng-consolidated-em-for-cms-funds-b32727651v1-24-.jpg)