Urban Sprawl and UHI in Dallas and Minneapolis Matthew Welshans, MGIS Student, Penn State University April 11, 2014 – Association of American Geographers Annual Meeting

Welcome message from author
This document is posted to help you gain knowledge. Please leave a comment to let me know what you think about it! Share it to your friends and learn new things together.
Transcript

Urban Sprawl and UHI in Dallas and MinneapolisMatthew Welshans, MGIS Student, Penn State University
April 11, 2014 – Association of American Geographers Annual Meeting

Project Summary
• Define Urban Heat Island (UHI) and Urban Sprawl
• Explore Data Used in Project• Methodology for Project• Results• Conclusions and Next Steps

Urban Heat Island Definition
Image Source: US EPA (2012)

Why is Urban Heat Island a Concern?
Carrie Sloan (Flickr)
Kai Hendry (Flickr) Dr. Edwin Ewing/CDC

Urban Sprawl – NE of Dallas

The Problem
• Urban Heat Island is affected by the growth of metropolitan areas– Size of heat island– Increase in temperature difference between
rural/urban areas• What is the correlation between increased
urban sprawl and the change in urban heat island?

Study AreasDallas-Ft. Worth-Arlington, TX MSA• 12 counties in northeast Texas• 2010 Population: 6,426,214• 9,286 square miles (~690/sq mi)
Minneapolis-St. Paul, MN/WI MSA• 11 counties in southeast Minnesota and
2 in western Wisconsin• 2010 Population: 3,759,978• 6,364 square miles (~590/sq mi)

Data Sets
– Land Use/Land Cover Data (2001, 2006, 2011 Draft)• National Land Cover Database (Landsat 7)• Split into 15 land cover categories• Percent Impervious Surface (%IS) calculated per
each pixel– Temperature Data
• Derived from ASTER Imagery from the MODIS Satellite
• Three swaths per study area were chosen based within 2 years of the LULC Data.

Why ASTER For Temperature Data? LANDSAT 7 ETM+ ASTER
Satellite Landsat 7 (1999) Terra EOS Satellite (1999)
Resolution Visible/NIR (4 bands): 30mTIR (1 band): 60m
Visible/NIR (3 Bands): 15mTIR (5 bands): 90m
From ASTER User Handbook Version 2 (2002)

Deriving Temperatures from ASTER
• Temperature calculated using Gillepsie et al (1998)’s Temperature Emissivity Separation (TES) Method for each image.– Atmospheric Scattering effects filtered out– Max and min pixel emissivity calculated– Surface temperature ± 1.5°C calculated using
Planck’s Law
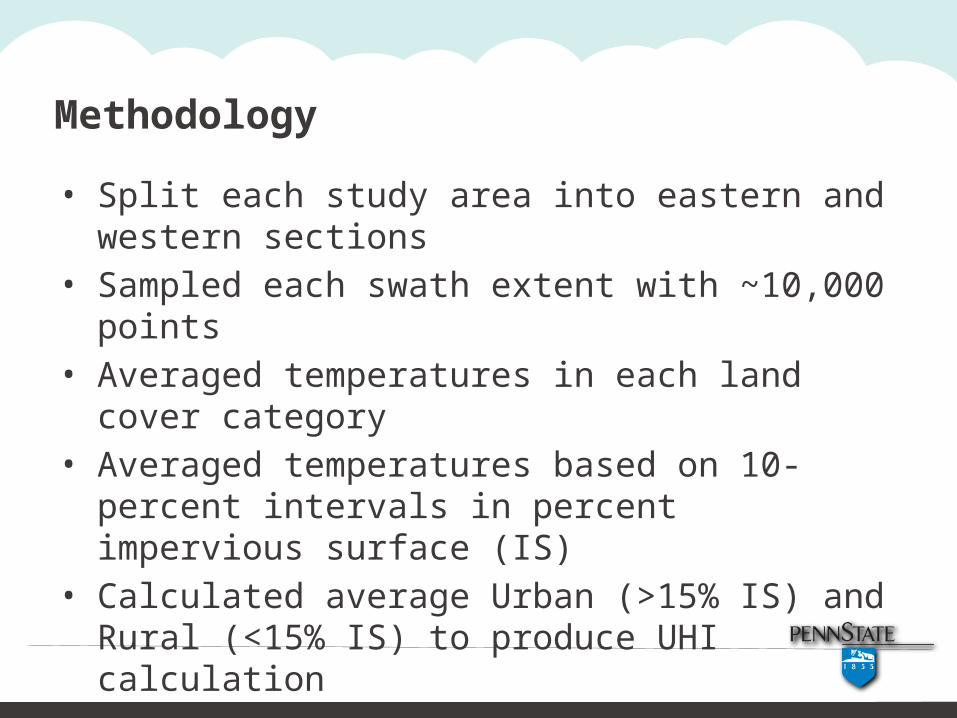
Methodology
• Split each study area into eastern and western sections
• Sampled each swath extent with ~10,000 points
• Averaged temperatures in each land cover category
• Averaged temperatures based on 10-percent intervals in percent impervious surface (IS)
• Calculated average Urban (>15% IS) and Rural (<15% IS) to produce UHI calculation

Results – Minneapolis (West)
UHI
2001 2.28C -0.41C
2.68C
2004 3.23C -0.56C
3.79C
2011 3.17C -0.78C
3.95C
0-10
10-2
0
20-3
0
30-4
0
40-5
0
50-6
0
60-7
0
70-8
0
80-9
0
90-1
00
-2
-1
0
1
2
3
4
5
6
7
8/6/20018/30/20049/10/2011
Percent Impervious Surface
Dep
art
ure
fro
m A
vera
ge
(°C
)

Minneapolis (West)

Results – Dallas
UHI
2001 1.59C -0.30C
1.89C
2005 1.71C -0.63C
2.34C
2013 1.22C -0.57C
1.78C
0-10
10-2
0
20-3
0
30-4
0
40-5
0
50-6
0
60-7
0
70-8
0
80-9
0
90-1
00
-2
-1
0
1
2
3
4
5
6
7
5/18/20013/10/20053/16/2013
Percent Impervious Surface
Dep
art
ure
fro
m A
vera
ge
(°C
)

Dallas

Collin County, TX
Pop 2000
Pop 2010
491,675 782,351

Why The Difference?
• Daytime Surface Albedo (reflectivity) – Higher in cleared areas versus water,
wetlands, and forest– Proportional to surface temperature– Differs depending on time of year

Why The Difference?
Water 5.78%Urban
27.64%
Barren 0.10%
Forest 16.04%Shrub 1.39%Grass 2.96%
Ag36.66%
Wet-land-
s9.44%
Minneapolis (West) - 2006
Water5.30%
Urban21.66%
Barren0.06%
Forest15.28%
Shrub1.63%
Grass2.78%
Ag44%
Wetlands8.79%
Minneapolis (West) - 2001
Water6.68%
Urban30.74%
Barren0.14%
Forest14.99%
Shrub1.32%
Grass2.55%
Ag,36%
Wetlands7.74%
Minneapolis (West) - 2011
Water3.73%
Urban22.71% Bar-
ren0.11%
For-est
11.63%
Shrub0.49%
Grass29.04%
Ag30.38%
Wetlands1.91%
Dallas - 2001Water4.25%
Urban35.22%
Bar-ren0.33%
Forest10.91%
Shrub0.06%
Grass25.17%
Ag21.96%
Wetlands2.10%
Dallas - 2006Water5.14%
Urban41.56%
Barren0.38%
Forest10.21%
Shrub
0.03%
Grass23.00%
Ag18.26
%
Wetlands1.43%
Dallas - 2011

Conclusions
• Generally good link between temperature and percent impervious surface
• Land cover type plays key role in daytime surface temperature patterns– Lower temperatures around water, forests– Highest temperatures in urban, agriculture,
grassland

Next Steps
• Compare 2011 and upcoming 2016 land cover data to newer ASTER imagery
• See if trends continue to hold up• Compare to nighttime imagery if possible to
see how UHI patterns differ. • Reverse Migration and Green Initiatives

Acknowledgements
• Dr. Jay Parrish – Advisor• Beth King and Dr. Doug Miller – Penn State MGIS Program• Jon Dewitz, Joyce Fry, Dr. Jim Vogelmann – USGS EROS
Center
Related Documents