Urban snow indicates pollution originating from road traffic Kirsi Kuoppam € aki * , Heikki Set € al € a, Anna-Lea Rantalainen, D. Johan Kotze University of Helsinki, Department of Environmental Sciences, Niemenkatu 73, FIN-15140 Lahti, Finland article info Article history: Received 27 May 2014 Received in revised form 13 August 2014 Accepted 16 August 2014 Available online Keywords: Urban Traffic Snow Nitrogen Phosphorus Metals PAH abstract Traffic is a major source of pollutants in cities. In this well-replicated study we analysed a broad array of contaminants in snowpacks along roads of different traffic intensities. The majority of pollutants showed a similar pattern with respect to traffic intensity: pH and conductivity as well as concentrations of PAHs, total suspended solids, phosphorus and most heavy metals were higher next to high intensity roads compared to low intensity roads. These pollutant levels also decreased considerably up to 5 m distance from the roads. Furthermore, apart from nitrogen, these variables increased in concentration from control sites in urban forest patches to road bank sites next to roads of low, intermediate and high traffic intensities. The deposition pattern of various traffic-derived pollutants e whether gaseous or particle- bound e was the same. Such information can be useful for the purposes of managing pollutants in ur- ban areas. © 2014 Published by Elsevier Ltd. 1. Introduction Nutrients, metals and organic pollutants accumulate in cities (Kaye et al., 2006), primarily as a result of road traffic(Viklander, 1998; Bu cko et al., 2011; Berndtsson, 2014). In fact, pollution from traffic surpasses many other anthropogenic sources, such as power plants, industry and residential activities (Bu cko et al., 2011). Various nutrients, metals and polycyclic aromatic hydrocarbons (PAH) have been reported to contaminate air, soil and both surface and ground waters close to roads in rural and urbanised areas (Van Bohemen and Janssen van de Laak, 2003; Helmreich et al., 2010). Furthermore, the degree of pollution varies with traffic intensity and traffic-derived pollutants spread to areas adjacent to traffic routes so that there is often a clear dilution of contaminants from the edge of the road to further away (Viskari et al., 1997; Bu cko et al., 2011). Under northern climatic conditions, snow has been shown to be an ideal medium to study pollutant loadings for several reasons: (i) snow samples are easy to collect and analyse, (ii) deposition time is definable from meteorological data, (iii) the concentrations of various impurities in the air are highest in winter, and (iv) the large surface area and slow fall velocity of snowflakes allow efficient accumulation of organic and inorganic pollutants from the atmosphere (Hautala et al., 1995; Sharma and McBean, 2001; Glenn and Sansalone, 2002; Engelhard et al., 2007). In Sweden, Westerlund and Viklander (2006) found much higher loads of particles and associated metals during the snowmelt period compared to the rain period. Consequently, in regions where snow forms part of the precipitation, research on urban snow could be an important environmental research topic (Viklander, 1996, 1999), yet appears to be relatively scarcely studied (Sillanp€ a€ a and Koivusalo, 2013). Furthermore, to our knowledge, no single study has investigated the full array of traffic-derived nutrients and pol- lutants (such as heavy metals and PAHs) in snow, using a well- replicated design of various traffic intensities and distances from roads. This study addresses these shortcomings in an attempt to provide a more general picture on the distribution of nutrients and other pollutants in urban roadside snow. As snow efficiently stores contaminants from the atmosphere to snowpacks alongside roads, considerable amounts of traffic- derived pollutants can pose risks not only to the local environ- ment but also to surface- and ground water reservoirs via storm- water sewer systems during spring snowmelt (Novotny et al., 2008; Sillanp€ a€ a and Koivusalo, 2013). This transfer is particularly evident in highly urbanised areas with predominantly impervious surfaces connected to underground sewer pipelines that provide for fast and efficient drainage. Thus, contaminants enriched in road bank snow can pose an important, hitherto still poorly known risk to the quality of both surface and ground waters (Viklander, 1998; Valtanen et al., 2014). * Corresponding author. E-mail address: kirsi.kuoppamaki@helsinki.fi (K. Kuoppam€ aki). Contents lists available at ScienceDirect Environmental Pollution journal homepage: www.elsevier.com/locate/envpol http://dx.doi.org/10.1016/j.envpol.2014.08.019 0269-7491/© 2014 Published by Elsevier Ltd. Environmental Pollution 195 (2014) 56e63

Welcome message from author
This document is posted to help you gain knowledge. Please leave a comment to let me know what you think about it! Share it to your friends and learn new things together.
Transcript
lable at ScienceDirect
Environmental Pollution 195 (2014) 56e63
Contents lists avai
Environmental Pollution
journal homepage: www.elsevier .com/locate/envpol
Urban snow indicates pollution originating from road traffic
Kirsi Kuoppam€aki*, Heikki Set€al€a, Anna-Lea Rantalainen, D. Johan KotzeUniversity of Helsinki, Department of Environmental Sciences, Niemenkatu 73, FIN-15140 Lahti, Finland
a r t i c l e i n f o
Article history:Received 27 May 2014Received in revised form13 August 2014Accepted 16 August 2014Available online
Keywords:UrbanTrafficSnowNitrogenPhosphorusMetalsPAH
* Corresponding author.E-mail address: [email protected] (K. K
http://dx.doi.org/10.1016/j.envpol.2014.08.0190269-7491/© 2014 Published by Elsevier Ltd.
a b s t r a c t
Traffic is a major source of pollutants in cities. In this well-replicated study we analysed a broad array ofcontaminants in snowpacks along roads of different traffic intensities. The majority of pollutants showeda similar pattern with respect to traffic intensity: pH and conductivity as well as concentrations of PAHs,total suspended solids, phosphorus and most heavy metals were higher next to high intensity roadscompared to low intensity roads. These pollutant levels also decreased considerably up to 5 m distancefrom the roads. Furthermore, apart from nitrogen, these variables increased in concentration fromcontrol sites in urban forest patches to road bank sites next to roads of low, intermediate and high trafficintensities. The deposition pattern of various traffic-derived pollutants e whether gaseous or particle-bound e was the same. Such information can be useful for the purposes of managing pollutants in ur-ban areas.
© 2014 Published by Elsevier Ltd.
1. Introduction
Nutrients, metals and organic pollutants accumulate in cities(Kaye et al., 2006), primarily as a result of road traffic (Viklander,1998; Bu�cko et al., 2011; Berndtsson, 2014). In fact, pollution fromtraffic surpasses many other anthropogenic sources, such as powerplants, industry and residential activities (Bu�cko et al., 2011).Various nutrients, metals and polycyclic aromatic hydrocarbons(PAH) have been reported to contaminate air, soil and both surfaceand ground waters close to roads in rural and urbanised areas (VanBohemen and Janssen van de Laak, 2003; Helmreich et al., 2010).Furthermore, the degree of pollution varies with traffic intensityand traffic-derived pollutants spread to areas adjacent to trafficroutes so that there is often a clear dilution of contaminants fromthe edge of the road to further away (Viskari et al., 1997; Bu�ckoet al., 2011).
Under northern climatic conditions, snow has been shown to bean ideal medium to study pollutant loadings for several reasons: (i)snow samples are easy to collect and analyse, (ii) deposition time isdefinable from meteorological data, (iii) the concentrations ofvarious impurities in the air are highest in winter, and (iv) the largesurface area and slow fall velocity of snowflakes allow efficientaccumulation of organic and inorganic pollutants from the
uoppam€aki).
atmosphere (Hautala et al., 1995; Sharma andMcBean, 2001; Glennand Sansalone, 2002; Engelhard et al., 2007). In Sweden,Westerlund and Viklander (2006) found much higher loads ofparticles and associated metals during the snowmelt periodcompared to the rain period. Consequently, in regions where snowforms part of the precipitation, research on urban snow could be animportant environmental research topic (Viklander, 1996, 1999),yet appears to be relatively scarcely studied (Sillanp€a€a andKoivusalo, 2013). Furthermore, to our knowledge, no single studyhas investigated the full array of traffic-derived nutrients and pol-lutants (such as heavy metals and PAHs) in snow, using a well-replicated design of various traffic intensities and distances fromroads. This study addresses these shortcomings in an attempt toprovide a more general picture on the distribution of nutrients andother pollutants in urban roadside snow.
As snow efficiently stores contaminants from the atmosphere tosnowpacks alongside roads, considerable amounts of traffic-derived pollutants can pose risks not only to the local environ-ment but also to surface- and ground water reservoirs via storm-water sewer systems during spring snowmelt (Novotny et al., 2008;Sillanp€a€a and Koivusalo, 2013). This transfer is particularly evidentin highly urbanised areas with predominantly impervious surfacesconnected to underground sewer pipelines that provide for fast andefficient drainage. Thus, contaminants enriched in road bank snowcan pose an important, hitherto still poorly known risk to thequality of both surface and ground waters (Viklander, 1998;Valtanen et al., 2014).
K. Kuoppam€aki et al. / Environmental Pollution 195 (2014) 56e63 57
By sampling snowpack alongside roads in the vicinity of a citycentre, our focus was to distinguish local, traffic derived contami-nation from that originating from other potential sources. We alsoaimed at exploring whether the concentrations of various con-taminants e emitted either in gaseous or dissolved form or boundto particles e follow the same accumulation pattern in snowregarding traffic load and how rapidly they change with distancefrom the roadside and with traffic intensity. To shed light on thesequestions we performed two studies during late winter in the cityof Lahti, southern Finland, in 2011 and 2013. For the first study,during which snow samples were taken from the edge and at 5 maway from replicated sites next to roads of high and low trafficintensity, we hypothesized that snow from high traffic intensityroads would contain higher concentrations of heavy metals andPAHs as well as higher conductivity, pH and total suspended solids(TSS) than snow from low traffic intensity roads. These concen-trations were also expected to decrease further away from theroads. We refined the second study and collected snow fromreplicated sites of low, intermediate and high traffic intensity roadsas well as from nearby urban forest patches, which served ascontrols. Assuming that pollutants (heavy metals, PAHs and nutri-ents) and other variables (conductivity, pH and TSS) measured inthis study are traffic-derived, we hypothesized that (i) snow inurban forests and next to low-intensity roads would have lowerconcentrations of these pollutants than snow next to higher-intensity traffic, and (ii) concentrations of particle-bound air con-taminants should be disproportionately higher in snow at the hightraffic intensity sites and right next to roads as compared to those atsites with low or no traffic and further away from these roads.
2. Material and methods
2.1. Sampling
We conducted two studies in the city of Lahti (60�590N, 25�390E), southernFinland. Lahti is a moderately-sized city with a population of 103 364, and a pop-ulation density of 666 residents km�2 (Lahti statistics, 2013). Temperature variesbetween �35 �C and þ35 �C within a year, and winter lasts for 135e145 days withsnow cover from the end of November until mid-April. The average depth of snow atthe end of March (the sampling time of this study) is 10e20 cm (FinnishMeteorological Institute, 2013). The first study, performed in MarcheApril 2011,investigated differences in contaminant loads with distance from the road edgewithin the city. Eight sites were selected, four near high traffic intensity roads(20,000e35,000 vehicles day�1) and four near low traffic intensity roads (<500vehicles day�1). On the 29th of March 2011, at each of these eight sites, we collectedsnow directly beside the road, i.e. from the snow bank (0 m samples), and fromintact snowat 5m distance from the road (5m samples) using a 50-cm long� 10 cmdiameter PVC tube. The collected snow (top 50 cm of the snow bank; ca. 4 L) wasplaced in Minigrip plastic bags and transferred to the laboratory and stored in afreezer to be analysed within 2 weeks of sampling. The second study was performedin MarcheApril 2013. Here, snow was also collected from the top of the snow bank,using the same PVC tube as described above, on the 26th and 27th of March 2013from areas with three traffic intensity categories, which were high (20,000e35,000vehicles day�1), intermediate (5000e17 000 vehicles day�1) and low (<500 vehiclesday�1), as well as from remnant forest patches (control sites), which represent cleansnow within the city environment. We assumed that the general background urbanpollution, produced by various sources including traffic, would be represented inthese control samples. Traffic intensity categories were based on the survey ontraffic intensity in Lahti (Saastamoinen et al., 2010). Each of the four treatments wasreplicated four times (16 sites in total). Based on our findings in 2011, samples wereonly collected from snow next to the road, since samples 5 m from the roads wererelatively unpolluted. In both years, all sampling sites were situated right at or closeto the city core, in an area of ca. 6 km2.
2.2. Analysis of pH, conductivity and total suspended solids (TSS)
Melted, non-filtered snow was measured for pH by using a Mettler Delta 340pH meter and for conductivity by using a WTW Cond 330i meter. The amount oftotal suspended solids (TSS) in snow was determined according to the SFS-EN 872(2005) standard for the determination of suspended solids of water by filtering aknown volume of melted snow (100e1000 ml) through pre-weighed WhatmanGF/C filters (1.2 mm pore size; Whatman International, Maidstone, UK), which wereafterwards dried at 105 �C for 2 h and weighed again to obtain the concentrationsof TSS as mg l�1.
2.3. Nutrient analysis
Concentrations of total phosphorus (TP) and total nitrogen (TN) were analysedin 2013 from non-filtered samples using the Lachat instruments QuickChem 8000methods 10-155-01-1-Q and 10-107-04-1-I, respectively, with oxidation SFS 3026.
2.4. Heavy metal analysis
In 2011 each sample was melted and sand and other heavier particles were let tosediment before the supernatant was filtered through a 0.45 mm syringe filter(Whatman). Five ml of the filtered sample was transferred into a test tube.Concentrated HNO3 (50 ml) and 50 ml of 1 mg l�1 indium solution was added as aninternal standard and the sample was mixed well with vortex. In 2013 a 20 mlsample of melted, non-filtered snow was digested with 5 ml of concentrated nitricacid and 25 ml of ultrapure water in a Mars 6 microwave device (method US EPA3015a). One ml of the sample was then diluted with 4 ml of water and 50 ml of in-dium (1mg l�1) was added to the diluted sample. In both years metal concentrationswere determined using a PerkineElmer Elan 6000 ICP-MS according to SFS-EN ISO17294-2 (2005).
2.5. Polycyclic aromatic hydrocarbons (PAH) analysis
For analysing PAHs, 500 ml of melted snow water was first filtered through a0.45 mm filter. All filters and the filtrate of three snow samples were analysed forPAHs. The filters were placed in an Erlenmeyer flask and 100 mg of Cu powder wasadded in order to remove sulphur. Five deuterated PAHs (400 ng, PAH Mix 31deuterated, Dr. Ehrenstorfer GmbH, Augsburg, Germany) were added as internalstandards. The samplewas extractedwith 20ml of a hexane-acetonemixture (1:1, v/v), by sonicating for 30 min and shaking overnight (200 rpm). After shaking, theextract was concentrated with a rotary evaporator to 5ml volume and quantitativelytransferred to Kimax-tubes. Three filtrates were fortified with the internal standardand liquideliquid extracted twice with 10 ml of hexane in a separation funnel. Afterthese steps both filters and filtrates were treated according to the same procedure. Anitrogen stream was used to reduce the sample to approximately 0.5 ml. A smallamount of anhydrous Na2SO4 was added to the Kimax tube to remove the remainingwater. The sample faced clean-up on a 1 g Silica gel (activated overnight at 160 �C)column, which was prepared in a Pasteur-pipette. The silica gel column was firstconditioned with 3 ml of hexane after which the sample was added. The PAHcompounds were eluted from the column with 10 ml of dichloromethane. Thesample was concentrated under a nitrogen stream until its volume was approxi-mately 0.5 ml. Deuterated anthracene (100 ng) was added as a recovery standardand the sample was transferred to a vial. Final analysis was performed by ShimadzuGCMS-QP2010 Ultra gas chromatograph-mass spectrometer.
2.6. Statistical methods
The 2011 data were primarily analysed using ANOVA with two factors (trafficintensity and distance from the road) and their interaction, while the 2013 datawereprimarily analysed using one-way ANOVA (traffic intensity with four levels: low,intermediate, high, control). Data were transformed to normality where possible.Response variables that could not be transformed to normality were tested using thenon-parametric KruskaleWallis test (see Ranta et al., 2002). The statistical package R(R Core Team, 2013) was used to analyse the data.
3. Results
Mean values of all measured variables in 2011, except for threemetals, were highest in snowpack next to high intensity roads, andalmost all were lowest at 5 m from low intensity roads (Table 1 e
this table also presents all statistical results). Conductivity, pH andconcentrations of total suspended solids (TSS) were significantlyhigher in snow next to than at 5 m away from roads and, with theexception of conductivity, were also affected by traffic intensity(Fig. 1). The interaction of traffic intensity and distance from theroads was statistically significant only for TSS and, as such, theinteraction termwas dropped from all other tests for simplicity. Theimpact of traffic intensity on dissolved heavy metals varied, butconcentrations were generally higher next to roads compared to5 m away, significantly so for aluminium, cobalt and chromium.Concentrations of aluminium were also higher at high vs. low in-tensity roads. Unexpectedly, zinc and lead were higher at samples5 m from low intensity roads, with zinc significantly higher at lowintensity roads.
High traffic intensity road snow was characterized by signifi-cantly higher PAH concentrations (except for acenaphthylene,indeno[1,2,3-cd]pyrene and benzo[ghi]perylene), and snow next to

Table 1Mean (standard error) values of each of the variables measured from snow collected in the city of Lahti in 2011 and 2013. Statistical results are also presented (see main text fordetails). High mean values and significant results are highlighted in bold. TSS ¼ Total suspended solids. Metal units ¼ mg l�1, PAH units ¼ ng l�1.
2011
Variable Low intensity High intensity F or H statistic (p-Value)
0 m 5 m 0 m 5 m Intensity Distance
Conductivity (mS cm�1) 140 (51) 15 (2.9) 250 (108.1) 49 (14) 4.38 (0.06) 26.15 (<0.001)pH 6.9 (0.1) 5.7 (0.3) 8.7 (0.4) 7.2 (0.5) 22.35 (<0.001) 14.139 (0.002)TSS (mg l�1)a 57 (13.1) 15 (1.7) 1900 (1100) 20 (9.5)3 17.10 (0.002) 36.19 (<0.001)Metals (dissolved):Aluminium (Al)b 8.9 (1.8) 4.6 (1.1)3 270 (66.1) 9.9 (1.5) 6.40 (<0.05) 6.18 (<0.05)Cobalt (Co)b 0.19 (0.04) 0.06 (0.02)3 0.83 (0.58) 0.12 (0.02) 2.24 (ns) 6.43 (<0.05)Chromium (Cr) 0.22 (0.03) 0.18 (0.04)3 0.31 (0.04) 0.18 (0.03) 1.41 (0.258) 5.24 (0.041)Copper (Cu) 7.0 (2.7) 5.7 (4.1)3 15 (3.5) 5.3 (1.8) 1.41 (0.258) 3.43 (0.089)Manganese (Mn) 6.7 (2.6) 4.0 (1.9)3 4.1 (0.9) 4.2 (1.9) 1.77 (0.206) 1.34 (0.269)Nickel (Ni) 0.43 (0.06) 0.43 (0.20)3 0.92 (0.20) 0.34 (0.08) 1.45 (0.252) 3.89 (0.072)Zinc (Zn) 6.7 (2.1) 12 (9.6)3 3.4 (2.4) 4.0 (2.8) 6.33 (0.027) 0.42 (0.531)Lead (Pb) 0.06 (0.06) 0.14 (0.08)2 0.08 (0.04) 0.08 (0.05)3 0.09 (0.769) 1.14 (0.311)PAHs (dissolved):Naphthalene 22 (2.4) 25 (4.0) 69 (27)3 26 (9.4)2 5.00 (0.049) 1.15 (0.308)Acenaphthylene 4.5 (2.1) 2.3 (0.9) 27 (23.3)3 3.9 (3.9)2 0.53 (0.482) 0.75 (0.405)Fluorene 5.8 (0.9) 1.5 (1.5) 110 (72)3 14 (14)2 10.37 (0.009) 8.66 (0.015)Phenanthreneb 53 (11) 27 (3.2) 1100 (700)3 129 (100)2 4.20 (<0.05) 5.01 (<0.05)Anthraceneb 5.5 (1.2) 2.3 (0.7) 87 (55.8)3 9.8 (8.2)2 4.20 (<0.05) 4.39 (<0.05)Fluoranthene 210 (100) 72 (35) 880 (480)3 130 (100)2 5.25 (0.045) 7.39 (0.022)Pyrene 140 (56) 50 (21) 1200 (620)3 180 (140)2 11.58 (0.007) 8.75 (0.014)Benzo[a]anthracene 37 (15) 16 (6.2) 130 (75)3 25 (12)2 5.14 (0.047) 6.22 (0.032)Chrysene 66(21.1) 25 (7.3) 290 (139.2)3 50 (24)2 9.54 (0.011) 9.99 (0.010)Benzo[bþk]fluoranthene 49 (13) 19 (4.3) 200 (110)3 39 (22)2 8.89 (0.014) 10.22 (0.010)Indeno[1,2,3-cd]pyrene 21 (4.8) 15 (1.8) 47 (25)3 27 (14)2 0.77 (0.400) 0.23 (0.643)Benzo[ghi]peryleneb 21 (6.0) 14 (2.2) 340 (190)3 38 (27)2 3.62 (ns) 2.82 (ns)
2013
Variable Control Low intensity Intermediate intensity High intensity F/c2 p-Value
Conductivity (mS cm�1) 15 (1.5) 20 (6.1) 39(7.5) 170 (57) 15.67 <0.001pH 6.0 (0.5) 5.7 (0.6) 6.6 (0.2) 7.0 (0.1) 1.702 0.219TSS (mg l�1) 840 (180) 5670 (25.3) 3400 (1100) 4900 (960) 10.92 0.012Tot. phosphorus (mg l�1) 0.04 (0.02) 0.14 (0.07) 0.23 (0.08) 0.38 (0.04) 8.48 0.003Tot. nitrogen (mg l�1) 1.06 (0.08) 2.0 (0.79) 1.0 (0.23) 1.8 (0.47) 1.01 0.423Metals (both dissolved and particle-bound):Aluminium (Al) 210 (0)1 860 (463.7)3 2000(1100)2
Cadmium (Cd) 0.13 (0.01)3
Cobalt (Co) 0.14 (0)1 0.56 (0.28)3 2.0 (0.56) 3.26 0.124Chromium (Cr)b 0.20(0.01)3 0.26 (0.06) 1.3 (0.65)3 4.3 (1.11) 10.16 0.017Copper (Cu) 0.56 (0)1 1.3 (0.42)3 3.3 (1.4)3 12 (3.1) 8.13 0.011Manganese (Mn)b 0.85 (0.14) 1.1 (0.51) 9.6 (5.3)3 45 (15) 11.25 0.010Nickel (Ni) 1.4 (0)1 2.4 (0.60)Zinc (Zn) 37 (6.38)3
Lead (Pb) 1.0 (0)1 1.4 (0.23)PAHs (both dissolved and particle-bound):Naphthalene 97 (38.6) 71 (20.7) 250 (160)3 290 (145) 0.46 0.716Fluoreneb 18 (15.5) 3.0 (3.0) 60 (36)3 150 (47) 8.21 0.042Phenanthreneb 220 (120) 160 (59) 950 (510)3 1900 (700) 7.05 0.070Anthracene 12 (3.6) 13 (5.7) 18 (11.4)3 108 (61.5) 0.64 0.604Fluoranthene 160 (107) 140 (57) 660 (360)3 1700 (630) 3.21 0.066Pyrene 99 (53) 130 (58) 840 (470)3 2100 (790) 7.28 0.006Benzo[a]anthracene 20 (12) 64 (13) 530 (320)3 450 (110) 8.33 0.004Chrysene 34 (21) 100 (18) 230 (110)3 610 (290) 4.83 0.022Benzo[bþk]fluoranthene 120 (79.1) 190 (36.2) 480 (240)3 780 (450) 1.51 0.266Indeno[1,2,3-cd]pyreneb 56 (13) 64 (14) 150 (71)3 410 (160) 7.742 0.052Benzo[ghi]peryleneb 52 (16) 75 (30) 500 (260)3 1220 (520) 10.44 0.015
1 ¼ one value, 2 ¼ mean of two values, 3 ¼ mean of three values, All other entries are means and standard errors of four values.a Non-parametric analysis. 2011: two-way non-parametric KruskaleWallis test, H-statistic (see Ranta et al., 2002). 2013: KruskaleWallis c2 statistic. All other analyses were
either two way ANOVAs (2011), or one-way ANOVAs (2013). For these tests, some of the variables were transformed to normality using natural logarithms (2011: Con-ductivity, TSS, Ni, Zn, naphthalene, acenaphthylene, fluorene, fluoranthene, pyrene, benzo[a]anthracene, chrysene, benzo[bþk]fluoranthene, benzo[a]pyrene, 2013: Con-ductivity, P, N, Cu, Ni, Pb, naphthalene, anthracene, fluoranthene, pyrene, benzo[a]anthracene, benzo[bþk]fluoranthene), or square-root transformations (2011: indeno[1,2,3-cd]pyrene, 2013: Co, chrysene, benzo[bþk]fluoranthene).
b Significant road intensity � distance interaction: F ¼ 12.127, p ¼ 0.005.
K. Kuoppam€aki et al. / Environmental Pollution 195 (2014) 56e6358
roads had significantly higher concentrations of dissolved PAHs,irrespective of molecular weights, compared to snow at 5 m fromthe roads (except for naphthalene, acenaphthylene, indeno[1,2,3-cd]pyrene and benzo[ghi]perylene) (Fig. 2). Total concentrations
of dissolved PAHs were 7 and 2 times higher next to roads than at5 m from the roads in high and low traffic road sites, respectively.
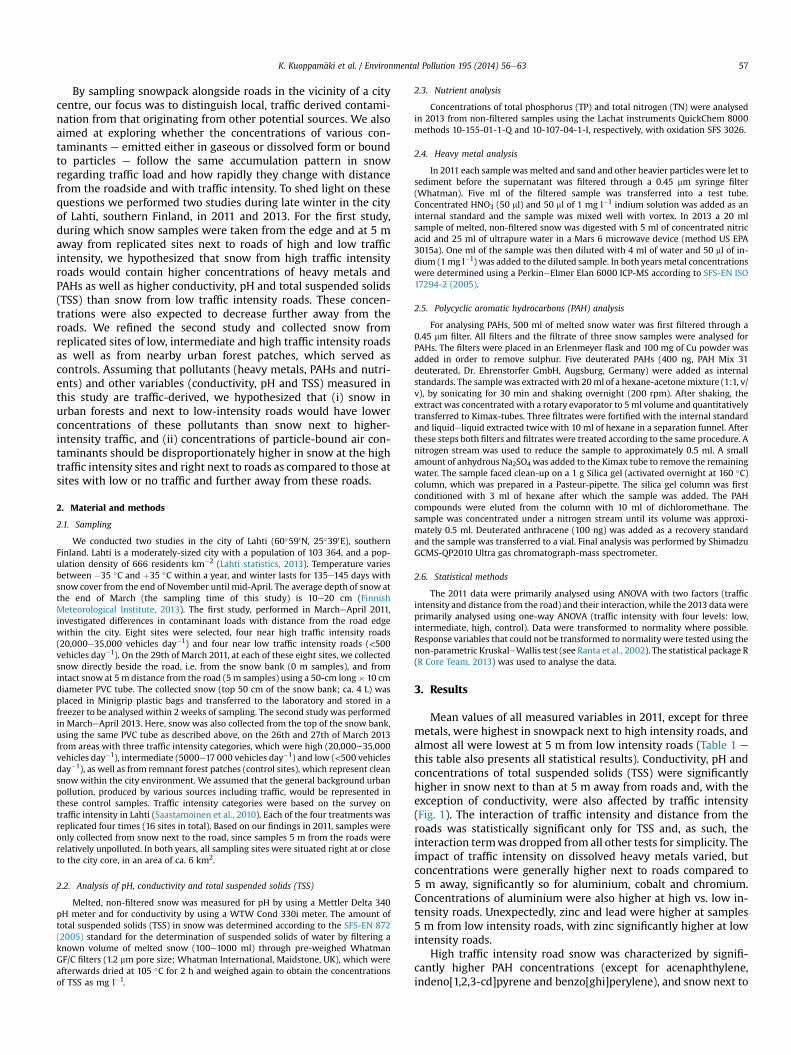
In 2013 conductivity, pH (not significantly so), TSS and totalphosphorous (TP) in snow increased consistently with increasing

0
100
200
300
400
μS c
m-1
Conductivity
0 m 5 m5
6
7
8
9
pH
Distance from the road
pH
0 m 5 m0
500
1000
1500
2000
mg
l-1
TSS
0 m 5 m
2925
high traffic
low traffic
Fig. 1. Mean (±1SE) conductivity, pH and concentration of total suspended solids (TSS) in snow 0 m and 5 m away from high and low traffic intensity roads in 2011.
K. Kuoppam€aki et al. / Environmental Pollution 195 (2014) 56e63 59
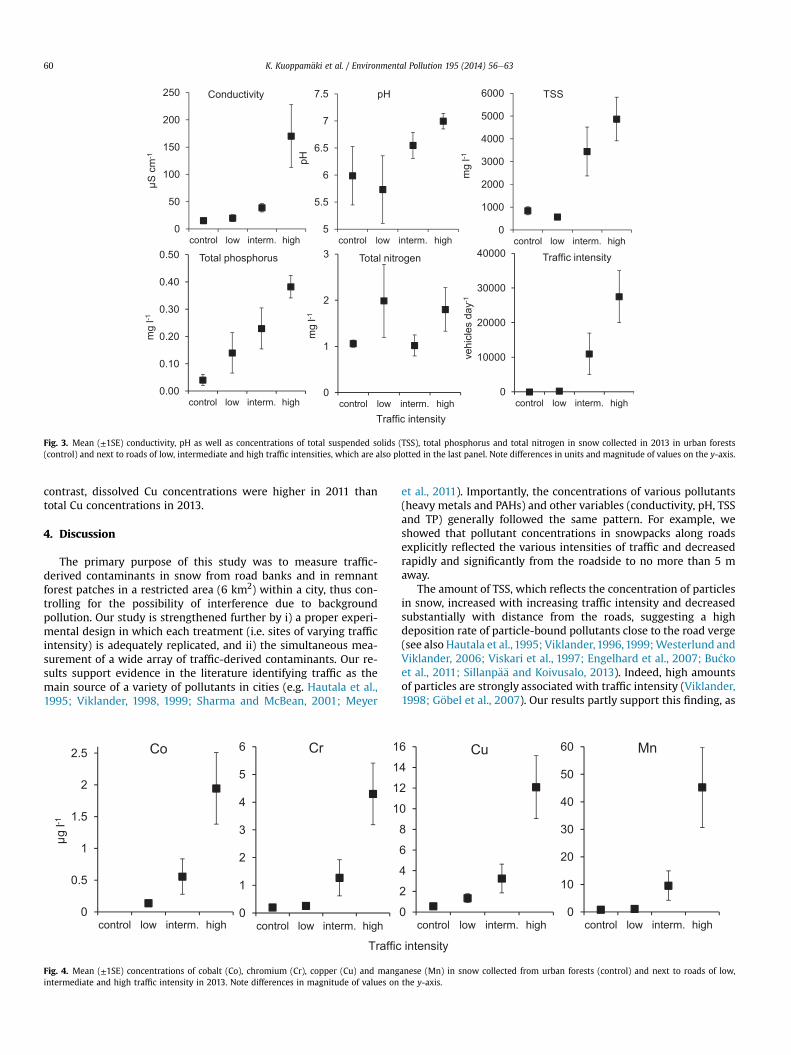
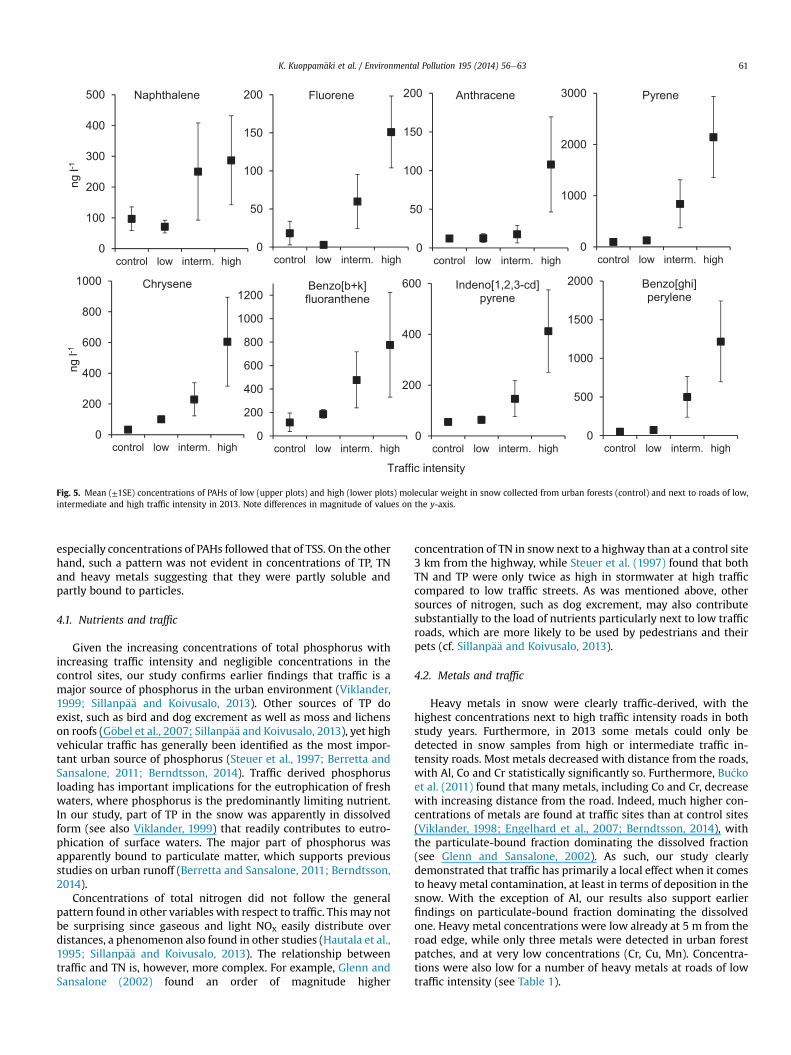
traffic intensity, while total nitrogen (TN) did not show a significantpattern (Fig. 3). Concentrations of many of the metals in non-filtered snowmelt were below detection limit in 2013. However,chromium, copper and manganese significantly increased in con-centration with increasing traffic intensity (Fig. 4) and reflected thepattern found in conductivity rather than that found in TSS (Fig. 3).High concentrations of PAHs, including both particle-bound anddissolved, were measured in snow collected next to roads of bothhigh and intermediate traffic intensity compared to those in snownext to low traffic roads and in forest control sites (Fig. 5). Snowcollected in urban forest patches contained ten times less total PAH
0
20
40
60
80
100
ng l-
1
Naphthalene
0 m 5 m0
50
100
150
200 Fluorene
0 m 5 m0
50
100
150
Distance from
0
100
200
300
400 Benzo[b+k]fluoranthene
0 m 5 m0
20
40
60
80
0
100
200
300
400
500
ng l-
1
Chrysene
0 m 5 m
Fig. 2. Mean (±1SE) concentrations of PAHs of low (upper plots) and high (lower plots) moldifferences in magnitude of values on the y-axis.
than that collected next to high traffic roads. The pattern of PAHconcentrations with respect to traffic intensity largely followed thatof TSS concentrations (Fig. 3).
The concentrations of metals and PAHs next to roads with highand low traffic were mostly higher in 2013, when the results wereobtained from unfiltered samples, than in 2011, when only thedissolved fraction was analysed (Table 1). PAH concentrations were2e9 times higher, while the corresponding differences in metalconcentrations were much more variable. For instance, total Alconcentrations were 24 and 7 times higher than dissolved Al con-centrations next to low and high traffic roads, respectively. In
Anthracene
0 m 5 m0
500
1000
1500
2000 Pyrene
0 m 5 m
high traffic
low traffic
the road
Indeno[1,2,3-cd]pyrene
0 m 5 m0
100
200
300
400
500
600 Benzo[ghi]perylene
0 m 5 m
ecular weight in snow 0 m and 5 m away from high and low traffic roads in 2011. Note
0
50
100
150
200
250
control low interm. high
μS c
m-1
Conductivity
5
5.5
6
6.5
7
7.5
control low interm. high
pH
pH
0
1000
2000
3000
4000
5000
6000
control low interm. high
mg
l-1
TSS
0.00
0.10
0.20
0.30
0.40
0.50
control low interm. high
mg
l-1
Total phosphorus
0
1
2
3
control low interm. high
mg
l-1
Total nitrogen
0
10000
20000
30000
40000
control low interm. high
vehi
cles
day
-1
Traffic intensity
Traffic intensity
Fig. 3. Mean (±1SE) conductivity, pH as well as concentrations of total suspended solids (TSS), total phosphorus and total nitrogen in snow collected in 2013 in urban forests(control) and next to roads of low, intermediate and high traffic intensities, which are also plotted in the last panel. Note differences in units and magnitude of values on the y-axis.
K. Kuoppam€aki et al. / Environmental Pollution 195 (2014) 56e6360
contrast, dissolved Cu concentrations were higher in 2011 thantotal Cu concentrations in 2013.
4. Discussion
The primary purpose of this study was to measure traffic-derived contaminants in snow from road banks and in remnantforest patches in a restricted area (6 km2) within a city, thus con-trolling for the possibility of interference due to backgroundpollution. Our study is strengthened further by i) a proper experi-mental design in which each treatment (i.e. sites of varying trafficintensity) is adequately replicated, and ii) the simultaneous mea-surement of a wide array of traffic-derived contaminants. Our re-sults support evidence in the literature identifying traffic as themain source of a variety of pollutants in cities (e.g. Hautala et al.,1995; Viklander, 1998, 1999; Sharma and McBean, 2001; Meyer
0
0.5
1
1.5
2
2.5
control low interm. high
μg l-
1
Co
0
1
2
3
4
5
6
control low interm. high
μg/l
Cr
1
1
1
1
μg/l
Traffic
Fig. 4. Mean (±1SE) concentrations of cobalt (Co), chromium (Cr), copper (Cu) and mangintermediate and high traffic intensity in 2013. Note differences in magnitude of values on
et al., 2011). Importantly, the concentrations of various pollutants(heavy metals and PAHs) and other variables (conductivity, pH, TSSand TP) generally followed the same pattern. For example, weshowed that pollutant concentrations in snowpacks along roadsexplicitly reflected the various intensities of traffic and decreasedrapidly and significantly from the roadside to no more than 5 maway.
The amount of TSS, which reflects the concentration of particlesin snow, increased with increasing traffic intensity and decreasedsubstantially with distance from the roads, suggesting a highdeposition rate of particle-bound pollutants close to the road verge(see also Hautala et al., 1995; Viklander,1996,1999;Westerlund andViklander, 2006; Viskari et al., 1997; Engelhard et al., 2007; Bu�ckoet al., 2011; Sillanp€a€a and Koivusalo, 2013). Indeed, high amountsof particles are strongly associated with traffic intensity (Viklander,1998; G€obel et al., 2007). Our results partly support this finding, as
0
2
4
6
8
0
2
4
6
control low interm. high
Cu
0
10
20
30
40
50
60
control low interm. high
μg/l
Mn
intensity
anese (Mn) in snow collected from urban forests (control) and next to roads of low,the y-axis.
0
100
200
300
400
500
control low interm. high
ng l-
1
Naphthalene
0
50
100
150
200
control low interm. high
Fluorene
0
50
100
150
200
control low interm. high
ng/l
Anthracene
0
1000
2000
3000
control low interm. high
ng/l
Pyrene
Traffic intensity
0
500
1000
1500
2000
control low interm. high
Benzo[ghi]perylene
0
200
400
600
800
1000
control low interm. high
ng l-
1
Chrysene
0
200
400
600
800
1000
1200
control low interm. high
ng/l
Benzo[b+k]fluoranthene
0
200
400
600
control low interm. high
ng/l
Indeno[1,2,3-cd]pyrene
Fig. 5. Mean (±1SE) concentrations of PAHs of low (upper plots) and high (lower plots) molecular weight in snow collected from urban forests (control) and next to roads of low,intermediate and high traffic intensity in 2013. Note differences in magnitude of values on the y-axis.
K. Kuoppam€aki et al. / Environmental Pollution 195 (2014) 56e63 61
especially concentrations of PAHs followed that of TSS. On the otherhand, such a pattern was not evident in concentrations of TP, TNand heavy metals suggesting that they were partly soluble andpartly bound to particles.
4.1. Nutrients and traffic
Given the increasing concentrations of total phosphorus withincreasing traffic intensity and negligible concentrations in thecontrol sites, our study confirms earlier findings that traffic is amajor source of phosphorus in the urban environment (Viklander,1999; Sillanp€a€a and Koivusalo, 2013). Other sources of TP doexist, such as bird and dog excrement as well as moss and lichenson roofs (G€obel et al., 2007; Sillanp€a€a and Koivusalo, 2013), yet highvehicular traffic has generally been identified as the most impor-tant urban source of phosphorus (Steuer et al., 1997; Berretta andSansalone, 2011; Berndtsson, 2014). Traffic derived phosphorusloading has important implications for the eutrophication of freshwaters, where phosphorus is the predominantly limiting nutrient.In our study, part of TP in the snow was apparently in dissolvedform (see also Viklander, 1999) that readily contributes to eutro-phication of surface waters. The major part of phosphorus wasapparently bound to particulate matter, which supports previousstudies on urban runoff (Berretta and Sansalone, 2011; Berndtsson,2014).
Concentrations of total nitrogen did not follow the generalpattern found in other variables with respect to traffic. This may notbe surprising since gaseous and light NOx easily distribute overdistances, a phenomenon also found in other studies (Hautala et al.,1995; Sillanp€a€a and Koivusalo, 2013). The relationship betweentraffic and TN is, however, more complex. For example, Glenn andSansalone (2002) found an order of magnitude higher
concentration of TN in snow next to a highway than at a control site3 km from the highway, while Steuer et al. (1997) found that bothTN and TP were only twice as high in stormwater at high trafficcompared to low traffic streets. As was mentioned above, othersources of nitrogen, such as dog excrement, may also contributesubstantially to the load of nutrients particularly next to low trafficroads, which are more likely to be used by pedestrians and theirpets (cf. Sillanp€a€a and Koivusalo, 2013).
4.2. Metals and traffic
Heavy metals in snow were clearly traffic-derived, with thehighest concentrations next to high traffic intensity roads in bothstudy years. Furthermore, in 2013 some metals could only bedetected in snow samples from high or intermediate traffic in-tensity roads. Most metals decreased with distance from the roads,with Al, Co and Cr statistically significantly so. Furthermore, Bu�ckoet al. (2011) found that many metals, including Co and Cr, decreasewith increasing distance from the road. Indeed, much higher con-centrations of metals are found at traffic sites than at control sites(Viklander, 1998; Engelhard et al., 2007; Berndtsson, 2014), withthe particulate-bound fraction dominating the dissolved fraction(see Glenn and Sansalone, 2002). As such, our study clearlydemonstrated that traffic has primarily a local effect when it comesto heavy metal contamination, at least in terms of deposition in thesnow. With the exception of Al, our results also support earlierfindings on particulate-bound fraction dominating the dissolvedone. Heavy metal concentrations were low already at 5 m from theroad edge, while only three metals were detected in urban forestpatches, and at very low concentrations (Cr, Cu, Mn). Concentra-tions were also low for a number of heavy metals at roads of lowtraffic intensity (see Table 1).

K. Kuoppam€aki et al. / Environmental Pollution 195 (2014) 56e6362
Patterns of heavy metals in our snow samples, especially Co, Cr,Cu and Mn, followed those of conductivity, being as much as 3.4 e
4.7 times higher at sites with high than intermediate traffic in-tensities. It seems that most heavy metals do not accumulate tohigh concentrations in the snow at traffic intensities of below17,000 vehicles day�1 but rather above 20,000 vehicles day�1.However, the concentrations of metals in our study are consider-ably lower than those in many of the previous corresponding sur-veys on urban snow, in which e.g. Cu concentrations in snow orrunoff next to heavy traffic roads were ca. 100e500 mg l�1
(Viklander, 1998; Westerlund and Viklander, 2006; Engelhard et al.,2007; Bu�cko et al., 2011), while we measured 12e15 mg l�1. Thecorresponding values for Zn are 430e1400 mg l�1 compared to our37 mg l�1.
The mobility, adsorption and retention of heavy metals arehighly influenced by pH (Glenn and Sansalone, 2002), withmetals becoming more soluble in more acidic media. Our resultsindicate that snow pH is lower at 5 m from roads compared tonext to roads, and at control and low traffic intensity sites. Atthose sites we also measured lower concentrations of dissolvedheavy metals compared to those in snow with higher pH next toroads, which may cause a potential environmental risk of heavymetals. Although concentrations of metals were low in our study,they generally seem to be a matter of concern during coldweather conditions, when elevated concentrations have beenobserved possibly due of the application of gravel that increaseswear and tear of roads and tyres (Helmreich et al., 2010;Berndtsson, 2014).
4.3. PAHs and traffic
The distribution of PAHs, irrespective of their molecular weight,had significantly higher concentrations next to roads compared to5 m away and next to roads of higher traffic intensity. Low mo-lecular weight PAH concentrations were also studied in three fil-trates (i.e. in liquid phase) andwere found to be negligible (data notshown) when compared to those analysed from filters. When bothlow and high molecular weight PAH concentrations were high, TSSconcentrations were also high. This suggests that even the lowmolecular weight PAHs were primarily bound to solids, at least inour snow samples taken next to roads of high traffic intensity. Thisassumption is also supported by the remarkably similar distribu-tion of both PAHs and TSS in our study. Given that up to 90% of PAHscan be associated with solids in snowmelt (Sharma and McBean,2001) and that the extent of hydrophobic organic chemical sorp-tion to particles depends on the concentration of the suspendedsolids (Meyer et al., 2011), our result is not surprising. Hautala et al.(1995), however, found that PAHs of low molecular weight (naph-thalene, acenaphthylene, acenaphthene, fluorene, phenanthrene,anthracene, fluoranthene and pyrene) showed higher concentra-tions at 30 m compared to 10 m from the road while those of highmolecular weight (benzo[a]pyrene, indeno[l,2,3-cd]pyrene,dibenzo[a,h]anthracene and benzo[ghi]perylene) tended to depo-sit near the road edge. Similarly, Viskari et al. (1997), who studiedPAHs of low molecular weight (by excluding particles larger than2 mm) found no differences between background levels and road-side sites or between upwind and downwind sides of a road with15 000 vehicles day�1. Sharma and McBean (2001) reported that allheavier compounds of PAHs, mostly of industrial origin, were solelyassociated with solids, whereas the lighter constituents wereslightly partitioned between the solid and liquid phase. Thediscrepancy in results between our study and that of some otherstudies may be due to differences in methodology. Hautala et al.(1995) analysed PAHs from non-filtered liquid samples while weanalysed PAHs collected on a filter. As was mentioned above, we
also measured PAHs from filtered water and clearly found lowerconcentrations than in particles, which is why we used materialcaptured by the filters to depict the relationships between PAHs insnow and traffic intensity.
Irrespective of the method used, our study indisputably showsthat traffic intensity is the main determinant of PAH concentra-tions in snow along roads. Our results showed a very good matchbetween traffic intensity and the amount of PAHs in the snow. Forexample, since traffic intensity, on average, was twice as high atHigh traffic sites than at Intermediate traffic sites (see Fig. 3), theexpectation is that mean concentrations of PAHs would be twiceas high at High than at Intermediate traffic intensity sites. Indeed,depending on the PAH, the ratio varies between 0.7 and 4.5, witha mean of 1.9 (compare means in Table 1). Similarly, concentra-tions of PAHs in snow should be ca. 40 times higher along roadsat High than at Low traffic intensity sites. However, the ratiovaries between 4 (benzo[b]fluoranthene) and 50 (fluorene), witha mean of 13. So, there were higher concentrations of PAHs at lowtraffic intensity sites than would be expected based on its lowtraffic load alone, implying that some PAHs present in snowderived from sources other than local traffic, such as wintertimeheating activity or via atmospheric transport from outside thestudy area.
The use of petroleum products and the general wear and tear ofautomobiles produce a myriad of heavy metals (see Glenn andSansalone, 2002 and references therein), PAHs and other organiccompounds (Meyer et al., 2011), which negatively affect humanhealth and the natural environment, including terrestrial andaquatic systems (Van Bohemen and Janssen van de Laak, 2003).Our study showed that snow acts like a ‘sponge’ and efficientlytraps these traffic-derived contaminants, concentrating it rightnext to roads, although metal concentrations were quite lowcompared to those measured in previous studies on snow andstormwater. It appears that the distribution pattern of most pol-lutants analysed in this study (phosphorus, heavy metals andPAHs) was remarkably similar e being of high concentrationsimmediately next to roads and at roads of high traffic intensity.The fate of these pollutants is twofold. First, during snowmeltthese pollutants get washed into roadside inlets to stormwatersewers and further to adjacent water bodies, where solublenutrient pollutants in particular are readily available for biologicaluptake. Part of the particle-bound pollutants can get trapped tothe sewage system and partly end up in the sediment of waterbodies (Honkonen and Rantalainen, 2013). Also sedimenting,particle-bound material can become available for decompositionand biological uptake in the water column via resuspension, acharacteristic feature of shallow areas in lakes. Second, at least incity centres, snow is typically collected and transported away tosnow deposits. Here pollutants bound to particles can get trappedin the soil below the deposit during snowmelt, while dissolvedsubstances can be transported in melt water (Viklander, 1996) toadjacent water bodies. Since pollution loads are typically higherduring winter than during warmer seasons (Helmreich et al., 2010;Valtanen et al., 2014), it could be managed by transferring much ofthe traffic-derived pollutants out of the city to ecologicallyinsensitive sites from where the transport of pollutants to surfacewaters could be controlled.
Seasonal snowmelt, mode of precipitation and the aggregatestate of water will certainly be impacted by a changing climate. InNorthern Europe, a decrease of long termmean snowpack has beenprojected towards the end of the century, although snow-richwinters are still expected to occur in the future (IPCC, 2014).Thus, it is important to understand snowmelt related deposition ofpollutants to manage urbanwaters in cold climates (cf. Meyer et al.,2011) and during a changing climate.

K. Kuoppam€aki et al. / Environmental Pollution 195 (2014) 56e63 63
5. Conclusions
This study supports the general view of traffic being the mainsource of a variety of pollutants in cities and showed that snow actslike a ‘sponge’ and efficiently traps traffic-derived contaminants,concentrating them right next to roads. From there these pollutantsget washed during snowmelt into roadside inlets to stormwatersewers and further to adjacent water bodies. The concentrations ofmetals, PAHs, conductivity, pH and TP generally followed the samepatternwith respect to traffic intensity and the distance from roads.TSS, i.e. the concentration of particles in snow, increased withincreasing traffic intensity and decreased substantially with dis-tance from the roads, suggesting a high deposition rate of particle-bound pollutants close to the road verge. Concentrations of PAHs inparticular followed that of TSS, but such a pattern was not evidentin concentrations of TP, TN and heavy metals, suggesting that theywere partly soluble and partly bound to particles. The increasingconcentrations of total phosphorus with increasing traffic intensityand negligible concentrations in the control sites support earlierfindings identifying vehicular traffic as the most important urbansource of phosphorus. Concentrations of total nitrogen did notfollow the general pattern found in other variables with respect totraffic, which is not surprising since gaseous and light NOx easilydistribute over distances. Heavymetals in snowwere clearly traffic-derived, with the highest concentrations next to high traffic in-tensity roads in both study years. Wintertime pollution could bemanaged by transferring much of the traffic-derived pollutants outof the city to ecologically insensitive sites fromwhere the transportof pollutants to surface waters could be controlled.
Acknowledgements
We thank the 2011 and 2013 classes of the Field Course in UrbanEnvironmental Ecology, University of Helsinki, for their enthusiasmin collecting the snow and participating in the laboratory work.Jukka Pellinen, Santeri Savolainen and Marianne Lehtonen arethanked for their assistance in the laboratory. The EU projectUrbanEnviro (European Social Fund) is acknowledged for fundingthe activities of the field course and the analyses of the samples.
References
Berndtsson, J.C., 2014. Storm water quality of first flush urban runoff in relation todifferent traffic characteristics. Urban Water J. 11, 284e296.
Berretta, C., Sansalone, J., 2011. Hydrologic transport and partitioning of phosphorusfractions. J. Hydrol. 403, 25e36.
Bu�cko, M.S., Magiera, T., Johanson, B., Petrovský, E., Pesonen, L.J., 2011. Identificationof magnetic particulates in road dust accumulated on roadside snow usingmagnetic, geochemical and micro-morphological analyses. Environ. Pollut. 159,1266e1276.
Engelhard, C., De Toffol, S., Lek, I., Rauch, W., Dallinger, R., 2007. Environmentalimpacts of urban snow management e The alpine case study of Innsbruck. Sci.Total Environ. 382, 286e294.
Finnish Meteorological Institute, 2013. Snow Statistics at. http://ilmatieteenlaitos.fi/lumitilastot (in Finnish). Last accessed 12.5.2014.
Glenn, D.W., Sansalone, J.J., 2002. Accretion and partitioning of heavy metalsassociated with snow exposed to urban traffic and winter storm. J. Environ. Eng.128, 167e185.
G€obel, P., Dierkes, C., Coldewey, W.G., 2007. Storm water runoff concentrationmatrix for urban areas. J. Contam. Hydrol. 91, 26e42.
Hautala, E.-L., Rekil€a, R., Tarhanen, J., Ruuskanen, J., 1995. Deposition of motorvehicle emissions and winter maintenance along roadside assessed by snowanalyses. Environ. Pollut. 87, 45e49.
Helmreich, B., Hilliges, R., Schriewer, A., Horn, H., 2010. Runoff pollutants of a highlytrafficked urban road e Correlation analysis and seasonal influences. Chemo-sphere 80, 991e997.
Honkonen, O., Rantalainen, A.-L., 2013. Impact of urbanization on the concentra-tions and distribution of organic contaminants in boreal lake sediments. En-viron. Monit. Assess. 185, 1437e1449.
IPCC, 2014. Climate Change 2014: Impacts, Adaptation and Vulnerability (Chapter23). Europe.
Kaye, J.P., Groffman, P.M., Grimm, N.B., Baker, L.A., Pouyat, R.V., 2006. A distincturban biogeochemistry? Trends Ecol. Evol. 21, 192e199.
Lahti Statistics, 2013. www4.lahti.fi/verkkotilastointi (in Finnish). Last accessed12.5.14.
Meyer, T., Lei, Y.D., Wania, F., 2011. Transport of polycyclic aromatic hydrocarbonsand pesticides during snowmelt within an urban watershed. Water Res. 45,1147e1156.
Novotny, E.V., Murphy, D., Stefan, H.G., 2008. Increase of urban lake salinity by roaddeicing salt. Sci. Total Environ. 406, 131e144.
R Core Team, 2013. R: a Language and Environment for Statistical Computing. RFoundation for Statistical Computing, Vienna, Austria. http://www.R-project.org/.
Ranta, E., Rita, H., Kouki, J., 2002. Biometria: Tilastotiedett€a ekologeille, eighth ed.Yliopistopaino, p. 569 (in Finnish).
Saastamoinen, K., Onnikki, R., Kerola, R., Onnikki, A., Kiiskil€a, K., 2010. Traffic Surveyin Lahti District at. www.paijat-hame.fi/liikennetutkimus/Lahti_Liikennelaskenta_3osaraportti.pdf (in Finnish). Last accessed 12.5.14.
SFS-EN 872, 2005. Water Quality. Determination of Suspended Solids. Method byFiltration through Glass Fibre Filters.
SFS-EN ISO 17294-2, 2005. Water Quality. Application of Inductively CoupledPlasma Mass Spectrometry (ICP-MS). Part 2: Determination of 62 Elements.
Sharma, M., McBean, E.A., 2001. PAH deposition to snow surface. Environ. Sci. Pollut.Res. 8, 11e18.
Sillanp€a€a, N., Koivusalo, H., 2013. Catchment-scale evaluation of pollution potentialof urban snow at two residential catchments in southern Finland. Water Sci.Technol. 68, 2164e2170.
Steuer, J., Selbig, W., Hornewer, N., Prey, J., 1997. Sources of Contamination in anUrban Basin in Marquette, Michigan and an Analysis of Concentrations, Loads,and Data Quality. Water Resources Investigations Report 97e4242. U.S.Geological Survey and U.S. Environmental Protection Agency, Middleton,Wisconsin.
Valtanen, M., Sillanp€a€a, N., Set€al€a, H., 2014. Effects of land use intensity on storm-water runoff and its temporal occurrence in cold climates. Hydrol. Process. 28,2639e2650.
Van Bohemen, H.D., Janssen van de Laak, W.H., 2003. The influence of road infra-structure and traffic on soil, water, and air quality. Environ. Manag. 31, 50e68.
Viklander, M., 1996. Urban snow deposits e pathways of pollutants. Sci. Total En-viron. 189/190, 379e384.
Viklander, M., 1998. Snow quality in the city of Luleå, Sweden e time-variation oflead, zinc, copper and phosphorus. Sci. Total Environ. 216, 103e112.
Viklander, M., 1999. Substances in urban snow. A comparison of the contaminationof snow in different parts of the city of Luleå, Sweden. Water Air Soil Pollut. 114,377e394.
Viskari, E.-L., Rekil€a, R., Roy, S., Lehto, O., Ruuskanen, J., K€arenlampi, L., 1997.Airborne pollutants along a roadside: assessment using snow analyses andmoss bags. Environ. Pollut. 97, 153e160.
Westerlund, C., Viklander, M., 2006. Particles and associated metals in road runoffduring snowmelt and rainfall. Sci. Total Environ. 362, 143e156.
Related Documents