Update on SPoRT Short-term Forecasting Activities (Lapenta visit, 24 March 2010) WRF Microphysical Adjustments Land Information System High-res SST Forecast Impacts Lightning Warning / Nowcasting WRF Lightning Forecasts Contributions to WRF EMS AIRS Assimilation Scatterometer Assimilation transitioning unique NASA data and research technologies to operations

Update on SPoRT Short-term Forecasting Activities
Feb 08, 2016
WRF Microphysical Adjustments Land Information System High-res SST Forecast Impacts Lightning Warning / Nowcasting WRF Lightning Forecasts Contributions to WRF EMS AIRS Assimilation Scatterometer Assimilation. Update on SPoRT Short-term Forecasting Activities. - PowerPoint PPT Presentation
Welcome message from author
This document is posted to help you gain knowledge. Please leave a comment to let me know what you think about it! Share it to your friends and learn new things together.
Transcript
Update on SPoRT Short-term Forecasting Activities
(Lapenta visit, 24 March 2010)
WRF Microphysical AdjustmentsLand Information SystemHigh-res SST Forecast ImpactsLightning Warning / NowcastingWRF Lightning ForecastsContributions to WRF EMSAIRS AssimilationScatterometer Assimilation
transitioning unique NASA data and research technologies to operations

Land Surface Modeling with LIS
• Precip Verification Study over SE U.S.– LIS land surface initialization vs.
interpolated NAM– Application of non-standard
verification methods• Real-time LIS/Noah at SPoRT
– Output to initialize WRF EMS runs– Diagnostics for NWS BHM CI study
• Incorporate MODIS veg compositesinto LIS (underway)
transitioning unique NASA data and research technologies to operations
transitioning unique NASA data and research technologies to operations
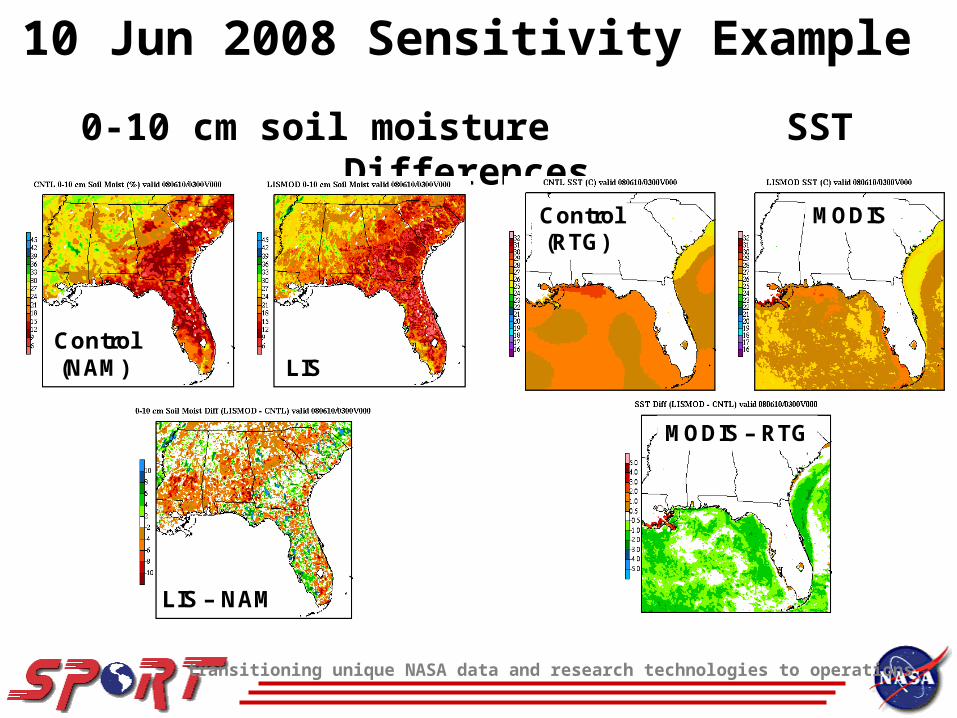
10 Jun 2008 Sensitivity Example
0-10 cm soil moisture SST Differences
Control(NAM) LIS
LIS – NAM
Control(RTG)
MODIS
MODIS – RTG

transitioning unique NASA data and research technologies to operations
10 Jun 2008: 1224 hour forecasts
Sensible Heat Flux 1-hour Precipitation
CNTL LISMOD
DIFF Stage IV
transitioning unique NASA data and research technologies to operations
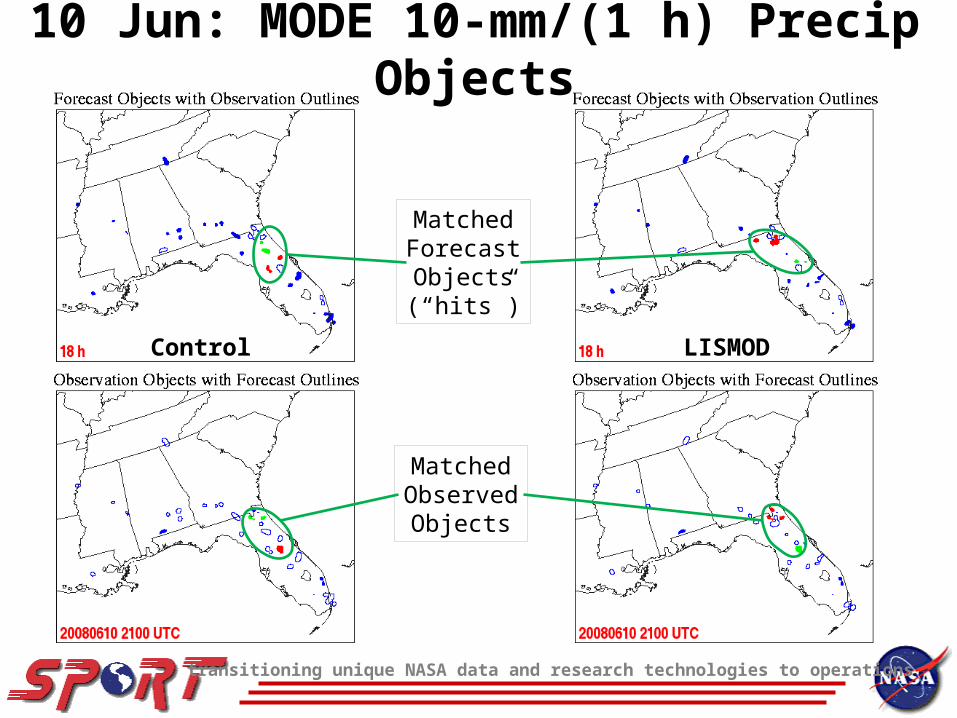
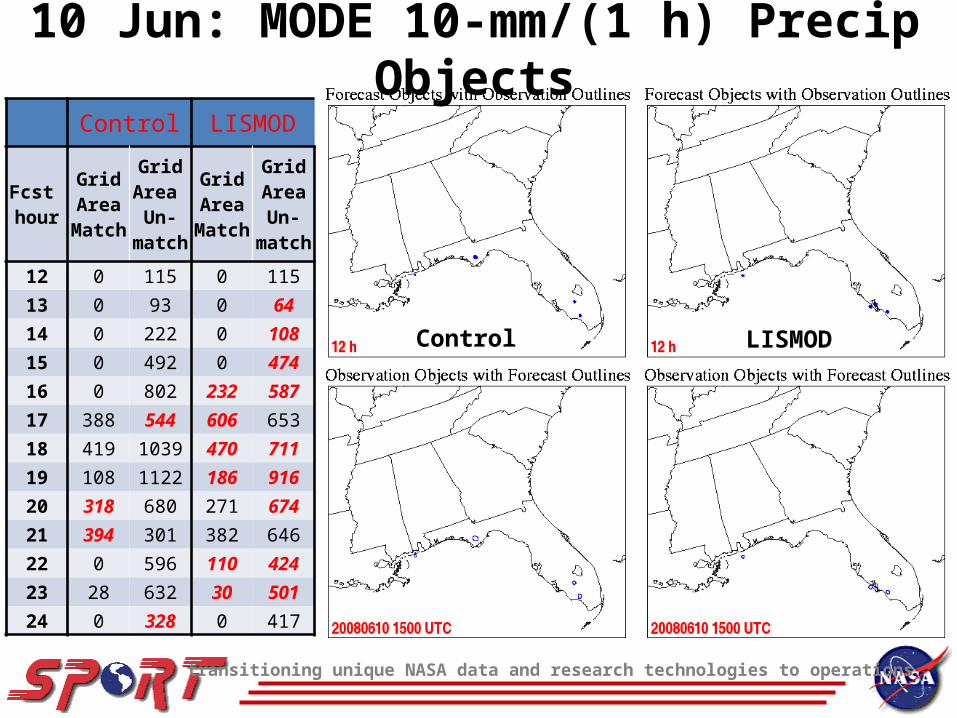
10 Jun: MODE 10-mm/(1 h) Precip Objects
Control LISMOD
MatchedForecastObjects(“hits”)
MatchedObservedObjects
transitioning unique NASA data and research technologies to operations
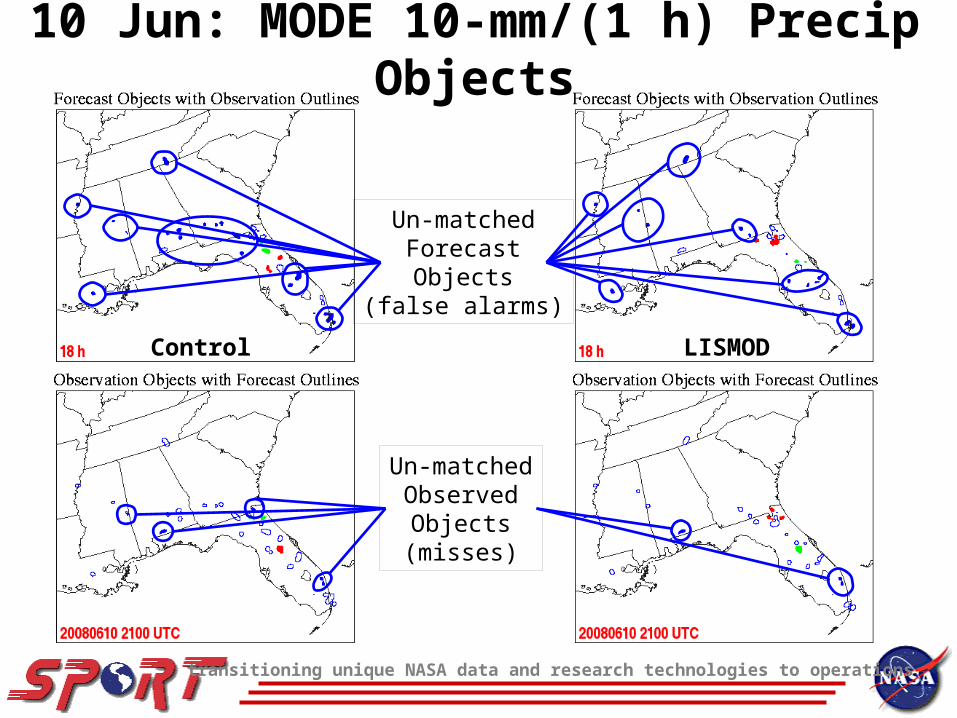
10 Jun: MODE 10-mm/(1 h) Precip Objects
Control LISMOD
Un-matchedForecastObjects
(false alarms)
Un-matchedObservedObjects(misses)
transitioning unique NASA data and research technologies to operations
10 Jun: MODE 10-mm/(1 h) Precip ObjectsControl LISMOD
Fcst hour
Grid Area
Match
Grid Area Un-
match
Grid Area
Match
Grid Area Un-
match
12 0 115 0 11513 0 93 0 6414 0 222 0 10815 0 492 0 47416 0 802 232 58717 388 544 606 65318 419 1039 470 71119 108 1122 186 91620 318 680 271 67421 394 301 382 64622 0 596 110 42423 28 632 30 50124 0 328 0 417
Control LISMOD

transitioning unique NASA data and research technologies to operations
MET/MODE 1-h Precip Object Verification:(Un-)Matched Differences by Model Run, 1224 h Forecasts
-4 0 0 0
-3 0 0 0
-2 0 0 0
-1 0 0 0
0
1 0 0 0
2 0 0 0
3 0 0 0
4 0 0 0
5 0 0 0
Area
(grid
squa
res)
M o d e l In iti a lizati o n D ate
M O D E 1 0 -m m /1 -h o u r D iff in A r e a (U n -)M a tch e d b y fo r e ca s t r u n (L ISM O D - C o n tr o l)
M atc h e d D iffU m atc h e d D iff Quantity # Forecasts
Improved# Forecasts Degraded
5-mm matched 39 41
5-mm unmatched 56 25
10-mm matched 37 39
10-mm unmatched 48 33
25-mm matched 13 8
25-mm unmatched 46 32
Quantity(mean # grid points
per model run)Control LISMOD Difference
(LISMOD – Control)%
Change
5-mm Matched 11,911 12,045 134 1.1%
5-mm Unmatched 17,750 17,175 -575 -3.2%
10-mm Matched 2,456 2,562 106 4.3%
10-mm Unmatched 6,798 6,538 -260 -3.8%
25-mm Matched 60 60 0 0%
25-mm Unmatched 549 505 -44 -8.0%

transitioning unique NASA data and research technologies to operations
Real-time LIS/Noah at SPoRT
• 3-km LIS over southeast U.S.– Spin-up run; restarts 4x per day– Hourly output posted to ftp site
• LIS output for diagnostics– Readily displayable in AWIPS II– NWS BHM: Convective initiation– Other short-term forecasting issues
(low temps, fire weather, etc.)• Future plans
– Expand 3-km to near CONUS– 1-km high-res nest for BHM CI study

Contributions to the WRF EMS v3.1
• SPoRT datasets for initializing the WRFEnvironmental Modeling System (EMS)– High-res, 1-km enhanced SSTs (MODIS+AMSR-E)– Great Lakes sea ice mask– LIS 3-km land surface initialization fields
• Experimental output fields (Dembek – ARW core)– Max output interval base reflectivity– Max output interval 10-m wind speed– Max output interval updraft helicity– Max output interval updraft/
downdraft speed– McCaul’s Forecast lightning threats*
(implemented only into NSSL/WRF)
transitioning unique NASA data and research technologies to operations
Super TuesdayTornado outbreak
NOAA/GLERL Ice Mask

transitioning unique NASA data and research technologies to operations
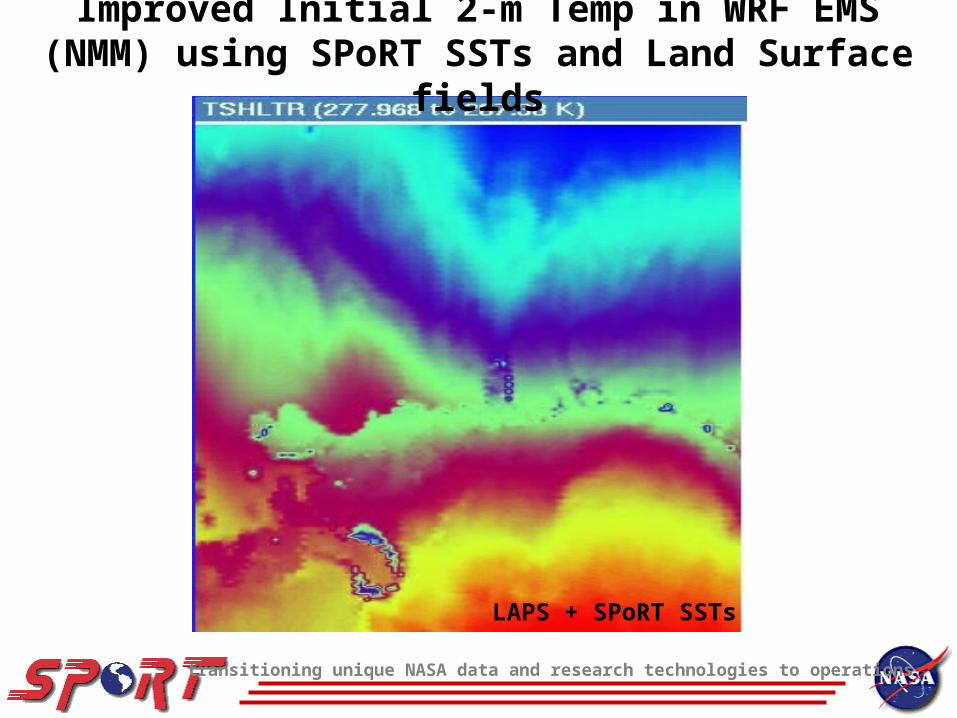
Improved Initial 2-m Temp in WRF EMS (NMM) using SPoRT SSTs and Land Surface fields
LAPS/NAM
transitioning unique NASA data and research technologies to operations
Improved Initial 2-m Temp in WRF EMS (NMM) using SPoRT SSTs and Land Surface fields
LAPS + SPoRT SSTs

transitioning unique NASA data and research technologies to operations
Improved Initial 2-m Temp in WRF EMS (NMM) using SPoRT SSTs and Land Surface fields
LAPS + SPoRT SSTs + LIS Tskin
transitioning unique NASA data and research technologies to operations
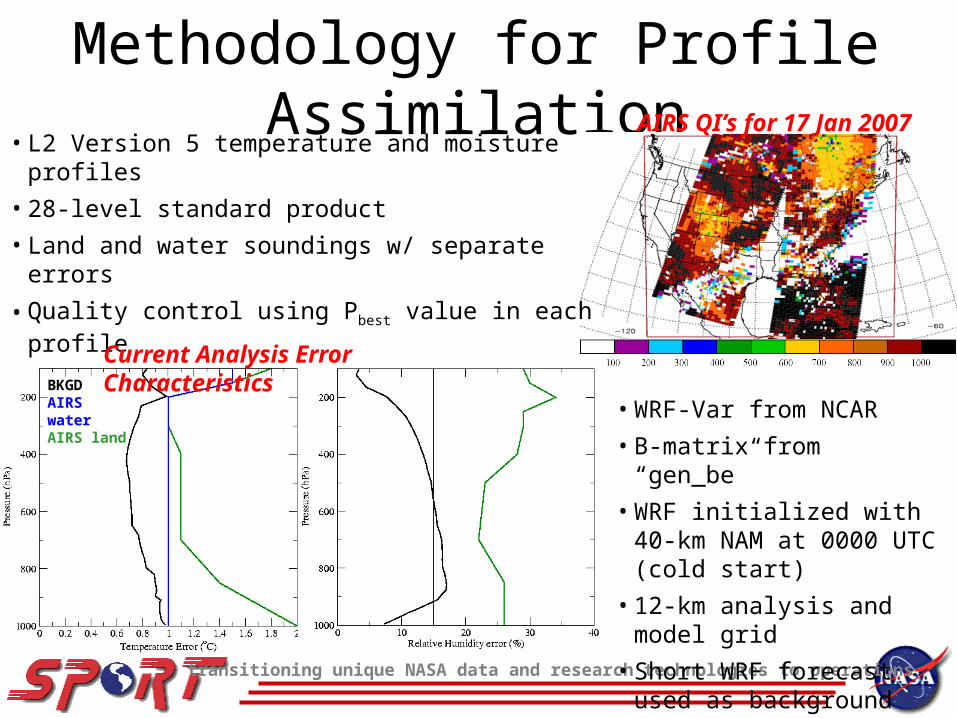
Methodology for Profile AssimilationAIRS QI’s for 17 Jan 2007
• L2 Version 5 temperature and moisture profiles• 28-level standard product• Land and water soundings w/ separate errors• Quality control using Pbest value in each profile
• Sensitivity study assimilating only AIRS profiles
• WRF-Var from NCAR• B-matrix from “gen_be” • WRF initialized with 40-km
NAM at 0000 UTC (cold start)• 12-km analysis and model grid• Short WRF forecast used as
background for analysis
BKGDAIRS waterAIRS land
Current Analysis Error Characteristics
transitioning unique NASA data and research technologies to operations
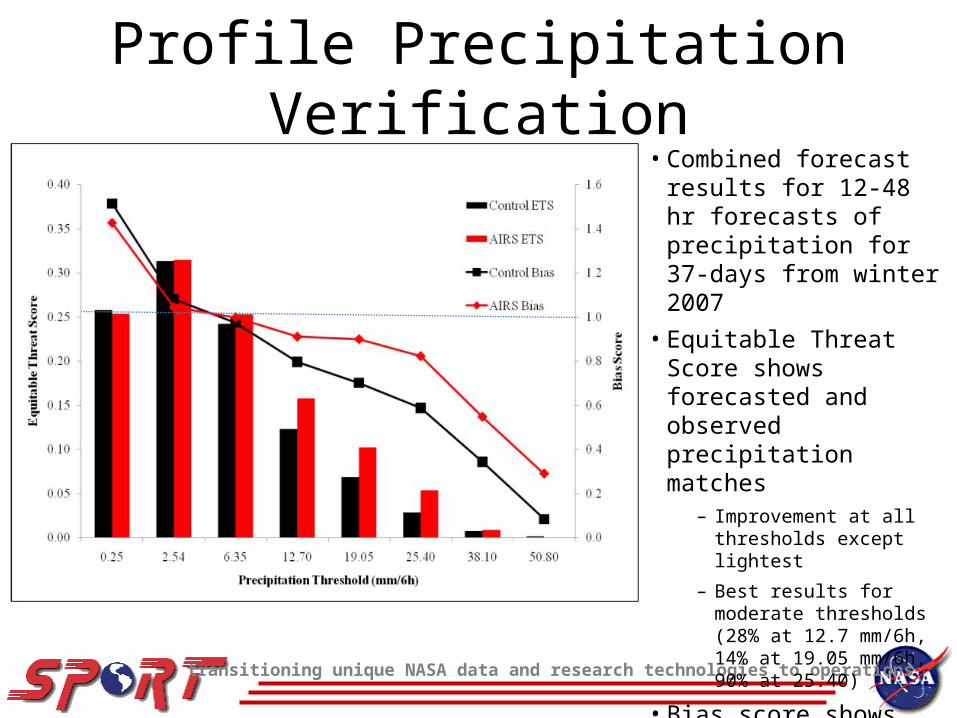
Profile Precipitation Verification• Combined forecast results
for 12-48 hr forecasts of precipitation for 37-days from winter 2007
• Equitable Threat Score shows forecasted and observed precipitation matches
– Improvement at all thresholds except lightest
– Best results for moderate thresholds (28% at 12.7 mm/6h, 14% at 19.05 mm/6h, 90% at 25.40)
• Bias score shows F/O– Improved (closer to 1) for all
thresholds
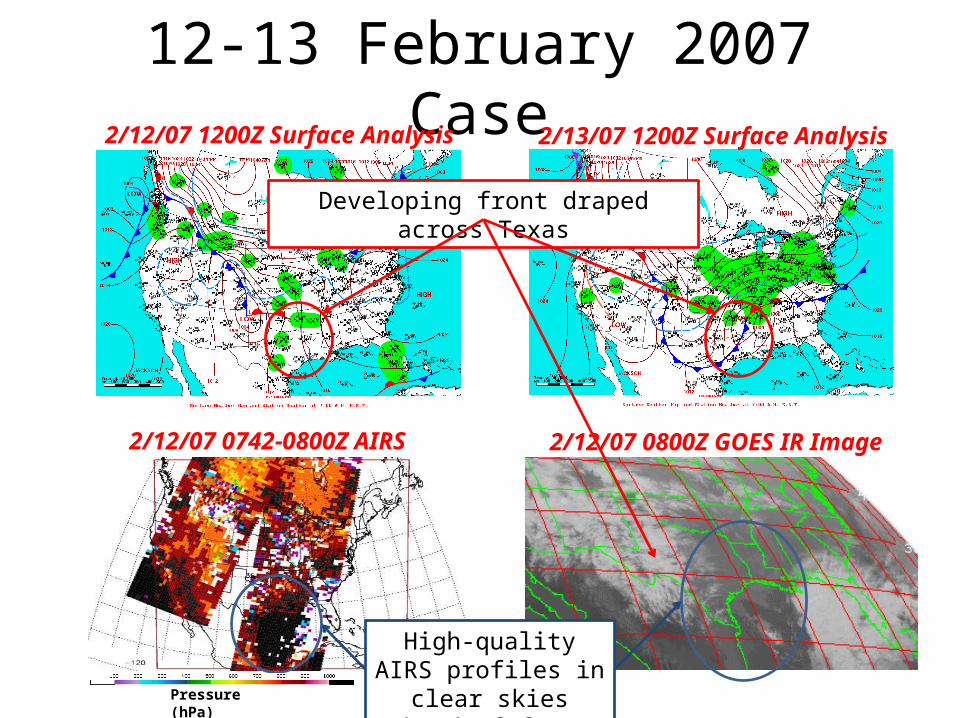
12-13 February 2007 Case2/12/07 1200Z Surface Analysis 2/13/07 1200Z Surface Analysis
Developing front draped across Texas
2/12/07 0742-0800Z AIRS 2/12/07 0800Z GOES IR Image
High-quality AIRS profiles in clear skies
ahead of frontPressure (hPa)
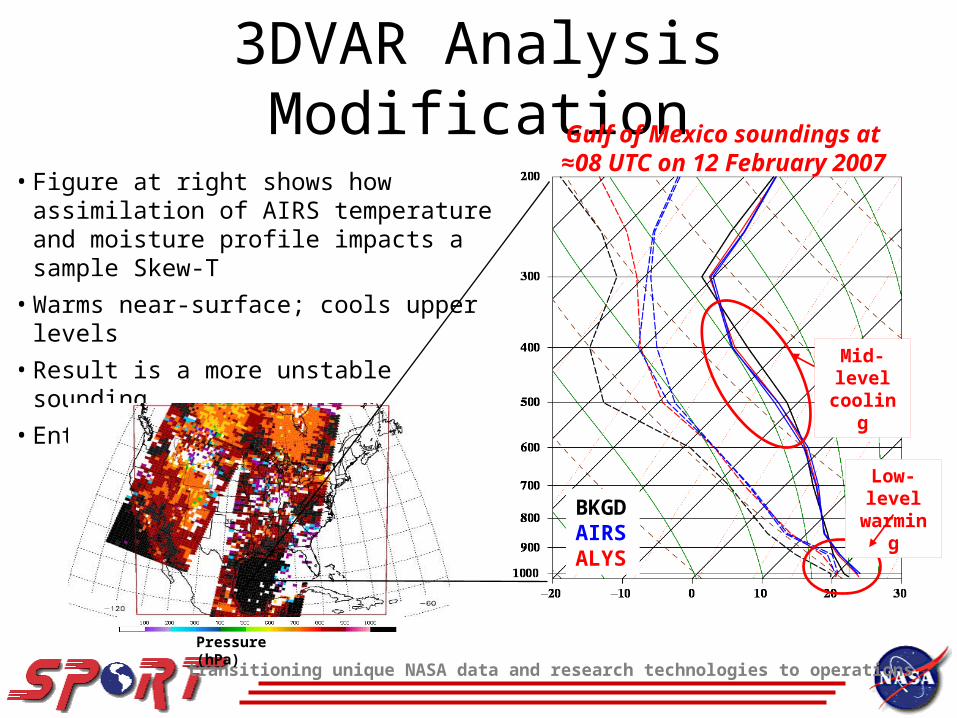
3DVAR Analysis Modification• Figure at right shows how assimilation of AIRS
temperature and moisture profile impacts a sample Skew-T
• Warms near-surface; cools upper levels• Result is a more unstable sounding• Entire column is moistened
transitioning unique NASA data and research technologies to operations
Gulf of Mexico soundings at ≈08 UTC on 12 February 2007
Mid-level cooling
Low-level warmingBKGD
AIRSALYS
Pressure (hPa)

transitioning unique NASA data and research technologies to operations
Improved Precipitation Forecasts
50.80
38.10
25.40
19.05
12.70
6.35
2.54
0.25
Control Control + AIRS Analysis “Truth”
6-hr
pre
cip.
1000
hP
a T d
CA
PE
24-h forecast valid 00Z 2/13/07 • Convective precipitation in Eastern Texas
– Control (upper left) produces some rain but does not capture significant precipitation
– AIRS (upper middle) reproduces convective precipitation line
• Better representation of lower level moisture
• CAPE values above 1800 J/kg in NAM analysis (lower right)
– AIRS (lower middle) nicely represents CAPE
– Control run (lower left) gives no hint of higher CAPE values
Related Documents


![Forecasting short-term wholesale prices on the Irish ... Forecasting of Electricity Markets... · [6] outline a neural network approach for forecasting short-term electricity prices](https://static.cupdf.com/doc/110x72/5f7be24de5c21a73c838523f/forecasting-short-term-wholesale-prices-on-the-irish-forecasting-of-electricity.jpg)