3 4 0 u

Welcome message from author
This document is posted to help you gain knowledge. Please leave a comment to let me know what you think about it! Share it to your friends and learn new things together.
Transcript

3 4 0 u

PELLETIZATION OF FINE COALS
DOE Grant No. DE-FG-22-89PC89766
Final Report
EXECUTIVE SUMMARY
Coal is one of the most abundant energy resources in the United States with nearly 800
million tons of it being mined annually. Process and environmental demands for low-ash,
low-sulfur coals and economic constraints for high productivity are leading the coal industry to
use such modem mining methods as longwall mining and such newer coal processing techniques
as froth flotation, oil agglomeration, chemical cleaning and synthetic fuel production. All these
processes are faced with one common problem area -- fine coals. Dealing effectively with these
fine coals during handling, storage, transportation, and/or processing continues to be a challenge
facing the industry.
Agglomeration by the unit operation of pelletization consists of tumbling moist fines in drums
or discs. Past experimental work and limited commercial practice have shown that pelletization
can alleviate the problems associated with fine coals. However, it was recognized that there
exists a serious need for delineating the fundamental principles of fine coal pelletization.
Accordingly, a research program has been carried involving four specific topics: (i) experimental
investigation of coal pelletization kinetics, (ii) understanding the surface principles of coal
pelletization, (iii) modeling of coal pelletization processes, and (iv) simulation of fine coal
pelletization circuits. This report summarizes the major findings and provides relevant details
of the research effort.
TABLE OF CONTENTS
1.0
2.0
3.0
4.0
5 .O
6.0
7.0
8.0
LIST OF FIGURES
INTRODUCTION 1.1 1.2 1.3
Fine Coals - Problems and Solutions Project Objectives and Specific Research Topics Organization of the Final Report
BACKGROUND 2.1 2.2 Pelletization of Coal Fines 2.3 Conclusions
General Aspects of the Pelletization Process
MATERIALS AND METHODS 3.1 Coal Samples 3.2 3.3 Additives for Coal Pelletization 3.4 Batch Pelletization Experimental Procedure
Preparation and Characterization of Fine Coal Samples
EXPERIMEWAL RESULTS AND DISCUSSION 4.1 Coal Pellet Size Distributions 4.2 Reproducibility of Pelletization Kinetics 4.3 Influence of Feed Moisture 4.4 Influence of Addition of Dodecane 4.5 Effect of Addition of Dextrin 4.6 Influence of Coal Weathering 4.7 Control of Coal Pellet Growth Process
MATHEMATICAL MODELING OF COAL PELLETIZATION PROCESS 5.1 5.2 5.3 Breakage and Layering Process
Mathematical Modeling of Pelletization Processes A Mathematical Model for Nuclei-Growth Region of Pelletization
CoalAgglom: A DYNAMIC SIMCTLATOR FOR COAL PELLETIZATION 6.1 A Generalized Balling Drum Circuit 6.2 Mathematical Model for Simulation 6.3 An Overview of CoalAgglom 6.4 A Casestudy 6.5 Summary and Conclusions
CONCLUSIONS AND RECOMMENDATIONS
REFEENCES
Page No. ii
1-1 1-2 1-3 1-4
2-1 2-1 2-7
2-11
3-1 3-1 3-1 3-5 3-6
4-1 4-1 4-4
4-10 4-13 4-20 4-32 4-36
5-1 5-1 5-3 5-8
6-1 6-2 6-4 6-6
6-13 6-18
7-1
8-1
1

LIST OF FIGURES Page No.
Figure 2.1 A schematic showing the driving force for pelletization due to reduction in total air-water interfacial area.
Figure2.2 Three main mechanisms of pellet formation and growth: nucleation, coalescence, and layering.
Figure 3.1 Photograph of the batch balling drum assembly.
Figure 4.1 Photograph of the Upper Freeport PA -- (a) fine coal sample, (b) moist feed to the balling drum and (c) agglomerates produced after 800 drum revolutions.
Figure 4.2 Photographs of Upper Freeport PA -- (a) moist feed to the balling drum and agglomerates generated after (b) 10, (c) 200 and (d) 400 drum revolutions.
Figure 4.3 Photographs of spherical and raspberry pellets and a schematic of their formation.
Figure 4.4 Size distribution of coal pellets at different stages of growth during a batch pelletization experiment with Upper Freeprt PA fine coal sample.
Figure 4.5 Reproducibility of coal pelletization experiments (Illinois #6 Sample).
Figure 4.6 Reproducibility of coal pelletization experiments (Upper Freeport PA sample).
Figure 4.7 Effect of feed moisture content on the batch pelletization kinetics of the Upper Freeprt PA sample.
Figure 4.8 Effect of feed moisture content on the batch pelletization kinetics of the Illinois No. 6 sample.
Figure 4.9 Moisture reproducibility problems with Illinois No. 6
Figure 4.10 Effect of feed moisture content on the batch pelletization kinetics of the Bethlehem Anthracite sample.
Figure 4.11 Influence of dodecane addition on the batch pelletization kinetics of the Upper Freeport PA sample.
ii
2-2
2-4
3-7
4-2
4-3
4-5
4-6
4-7
4-9
4-1 1
4-12
4-14
4-15
4-16

. Figure 4.12
Figure 4.13
Figure 4.14
Figure 4.15
Figure 4.16
Figure 4.17
Figure 4.18
Figure 4.19
Figure 4.20
Figure 4.21
Figure 4.22
Figure 4.23
Figure 4.24
Figure 5.1
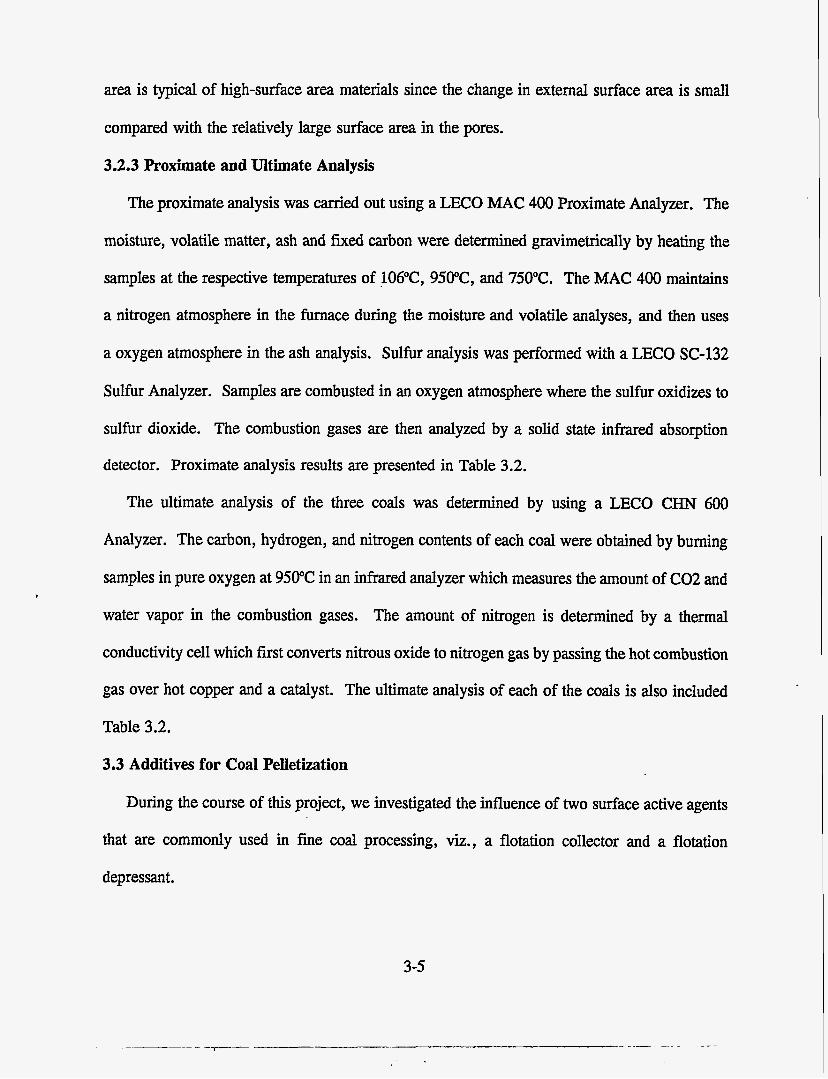
Influence of dodecane addition on the batch pelletization kinetics of the Pittsburgh N0.8 sample.
Influence of dodecane addition on the batch pelletization kinetics of the Illinois N0.6 sample.
Influence of dodecane addition on the batch pelletization kinetics of the Bethlehem Anthracite sample.
Effect of dextrin addition on the batch pelletization kinetics of the Upper Freeport PA sample.
Effect of dextrin addition on the batch pelletization kinetics of the Pittsburgh N0.8 sample.
Effect of dextrin addition on the batch pelletization kinetics of the Illinois N0.6 sample.
Effect of dextrin addition on the batch pelletization kinetics of the Bethlehem Anthracite sample.
Cumulative weight fraction of lyophobic particles as a function of their wetting surface tension for Upper Freeport PA coal fine sample.
Cumulative weight fraction of lyophobic particles as a function of their wetting surface tension for Pittsburgh No. 8 coal fine sample.
Cumulative weight fraction of lyophobic particles as a function of their wetting surface tension for Illinois N0.6 coal fine sample.
Cumulative weight fraction of lyophobic particles as a function of their wetting surface tension for Bethlehem anthracite coal fine sample.
Influence of weathering oxidation of on the pelletization behavior of Upper Freeport PA coal fine sample.
Size distribution of agglomerates produced from as-received and oxidized samples of Upper Freeport PA coal fines.
Typical pelletization curve.
4-17
4-18
4-19
4-2 1
4-22
4-23
4-24
4-26
4-27
4-28
4-29
4-33
4-34
5-2

Figure 5.2 Effect of feed moisture content on the batch pelletization kinetics of the Upper Freeport PA sample (same as Figure 4.6). The solid lines in the figure show the exponential type of growth predicted by random coalescence model of 4. 5.2.
Figure 5.3 Influence of dodecane addition on the batch pelletization kinetics of the Pittsburgh N0.8 sample (same as Figure 4.12).
Figure 5.4 Effect of feed moisture content on the batch pelletization kinetics of the Bethlehem Anthracite sample (same as Figure 4.10).
Figure 5.5 Size distribution of Upper Freeport PA (as received) pellets. The solid lines are the predictions of the pellet size distribution by the random coalescence model (Eq. 5.3).
Figure 5.6 Size distributions of pellets produced with weathered Upper Freeport PA coal sample. The size distributions are also in agreement with the random coalesecence model (Eq. 5.3).
Figure 5.7 Normalized size distributions from the data reported in Figure 5.5 on Upper Freeport PA (as received) sample.
Figure 5.8 Normalized size distributions from the data reported in Figure 5.6 on Upper Freeport PA (weathered) sample.
Figure5.9 Normalized size distributions of the pellets produced with Bethlehem anthracite sample. The figure shows poor agreement with the random coalescence model.
Figure 5.10 Schematic of breakage and layering mechanism.
Figure 5.11 Linear growth rate of agglomerates produced with Bethlehem anthracite as predicted by Eq. 5.16.
Figure 5.12 Variance versus weight mean diameter of agglomerates produced at 32 % and 34 % moisture for Bethelehem anthracite.
Figure 5.13 Pellet size distributions for 32% moisture run with Behtlehem anthracite.
Figure 6.1 Schematic of a conventional closed-circuit pelletizing operation.
Figure 6.2 Flowsheet of a generalized balling drum circuit that is designed for flexibility of operation.
5-5
5-6
5-7
5-9
5-10
5-11
5-12
5-13
5-14
5-18
5-19
5-20
6-3
6-5
iv

Figure 6.3 The main menu bar and the submenu lists from CoaUggZom.
Figure 6.4 Fill-in-the-form type data entry dialog box for Circuit Settings,
Figure 6.5 The data entry screen for Material Specifications. The figure also shows the error message box resulting from range checking on the feed specific gravity.
Figure 6.6 The CoaZAggZom simulation panel showing the subwindows for operating conditions, simulation controls, and a table and two plots of simulation results. Plotted results correspond to the response of the balling circuit to a step change in feed moisture.
Figure 6.7 Listing of operating conditions that were used for the balling circuit case study.
Figure 6.8 Response of the balling circuit - (i) to a step change in feed rate from 30 tph to 50 tph at cycle #60 and (ii) to a manual control action involving amount of undersize fed back as recycle to the circuit so as to bring the circuit to stability.
Figure 6.9 Response of the balling circuit - (i) to a step increase in feed rate to 70 tph at cycle #120 and (ii) to the introduction of pre-formed seeds from a seeding drum at cycle #130 to bring the circuit to stability.
6-8
6-9
6-1 1
6-12
6-14
6-16
6-17
V
1.0 INTRODUCTION
Coal is one of the most abundant resources in the United States with nearly 318 billion tons
(including lignite) that can be mined with proven technologies [25]. These reserves will last for
several hundred years at the present coal production rate of about 800 million tons per year [25].
Limited availability, increased prices, and dependence on foreign supplies of oil and natural gas
have revived interest in coal as a viable source for meeting the national energy requirements.
In keeping up with the higher demands for coal and in attempting to keep the raw coal
production costs low, the coal industry is using such modem mining methods as longwall
mining. The new mining technologies invariably result in non-selective mining and contribute
to higher sulfur and ash contents in the raw coals. Subsequent utilization of coal, as an
alternative fuel to oil and natural gas, is expected through direct combustion for power
generation and through conversion by gasification or liquefaction. If coal is to become our
major source of energy, however, it is necessary that the sulfur and ash content of the
run-of-mine coals be reduced to meet the stringent EPA regulations. For example, the high-
sulfur and high-ash content of the coals fired in utility boilers give rise to the respective
environmental problems of acid rains and fly-ash and bottom-ash disposal. Accordingly, such
advanced coal cleaning techniques as froth flotation and oil agglomeration are being applied to
reduce the sulfur and ash contents of raw coals.
Both the newer mining and coal cleaning technologies contribute to the generation of large
quantities of coal fines. For example, according to one estimate, the production of -28 mesh
fines has increased from 14% to 31 % (by wt.) due to mechanized mining [25]. An even larger
1-1

portion of fines is generated at the coal cleaning plants where finer grinding of coal is required
to liberate and remove ash and sulfur from combustible matter.
1.1 Fine Coals - Problems and Solutions
There are several problems in dealing with fine coals and the more important are listed in
the following.
The use of conventional and newer techniques to clean the finely crushed and ground coals leads to inefficiency and loss of significant amounts of fines into the refuse streams of coal preparation plants. It is estimated that there is a billion tons of coal potentially recoverable from the refuse ponds in the U. S. [42].
Dewatering of fine coals is quite inefficient giving rise to higher moisture contents of the filter cake and often necessitating the additional costly step of thermal drying. Thermal drying of coal fines leads to such problems as spontaneous combustion and particulate pollution. To avoid these, proper control of the dryer and expensive dust abatement equipment become necessary.
During transportation of fine coals from preparation plants to power plants, significant amounts of coal fines are lost as dust. According to one study, losses as high as 3% can occur [46]. Besides the obvious loss of combustible matter, the lost material constitutes serious environment pollution.
Finally, during storage and handling there are the perennial problems, for both the coal industry and the consumer, of spontaneous combustion, dust pollution and freezing (during the winter season).
Agglomeration, a method of forming larger bodies from fine particles [31, 56, 621, is
capable of alleviating most of the problems encountered with fine coals. The method is
successfully used in mineral, metallurgical, fertilizer, and various other process industries.
There are several techniques available for agglomeration of fine particles and these can be
conveniently classified into three categories.
agglomeration of liquid-suspended solids which include flocculation, selective flkculation and oil-agglomeration;
agglomeration by pressure compaction methods including briquetting and extrusion; and
1-2

agglomeration in rotating-beds or fluidized-beds which include pelletization, balling, granulation.
In the coal industry, one of the above methods of agglomeration could be readily selected
depending on the specific problem that is being addressed.
Flocculation is found to be effective in improving the solid-liquid separation (thickening and
filtration) and oil agglomeration is close to commercial application for the recovery and
dewatering of fine coals.
Briquetting is the oldest agglomeration technique employed in the coal industry and is
continued to be used. However, it is considered most suitable for dry coals and small tonnages.
Extrusion is an established process in the ceramic and food industries and works efficiently on
feed materials that are plastic in nature; for coal, this requirement is normally met by addition
of plasticizers or heat treatment. A recent investigation has shown that a roller-die type
extrusion can be most economical in an agglomeration/reslurrying scheme as a means of
distributing and firing clean coal [lo].
Agglomeration of coal fines in fluidized-beds is expected neither to be feasible nor
economical. On the other hand, pelletization is a well established technology and involves
tumbling of moist fines in rotating drums or discs. The pelletization process is more commonly
known as balling in the iron ore industry and granulation in the agro-chemical industry. This
process was commercially applied to coal fines and has the potential of being fully integrated
in coal preparation plant flowsheets.
1.2 Project Objective and Specific Research Topics
Published literature on pelletization of coal fines is somewhat limited. Though the first paper
concerning the pelletization of coal fines appeared in 1955, since then no more than fifty papers
1-3

have been published. Most of these papers are applied in nature and only a few of them
addresses the principles of coal pelletization (see Section 2).
The primary objective of this undertaking was able to generate fundamental information that
would be of practical significance to the coal industry. Specifically, the research was directed
to four main topics:
1. Experimental investigation of coal pelletization kinetics, 2. Understanding the surface principles of coal pelletization, 3. Modeling of coal pelletization processes, and 4. Simulation of fine coal pelletization circuits.
1.3 Organization of the Final Report
This final report summarizes the major fmdings and provides relevant details of this research
effort. It is organized into 8 sections. The fust section provides a general introduction to the
report. The second section provides a literature survey on coal pelletization and the details about
the materials and experimental methods are included in the third section. The next two sections
(Sections 4 and 5) present respectively an account of the experimental results and an analysis of
the results leading to the development of suitable mathematical models for coal pelletization.
Then, Section 6 introduces Coa/Agg/om, an interactive simulator for studying the dynamic
behavior of fine coal pelletizing circuits. Finally the report is concluded with Sections 7 and 8
in which Summary and Conclusions and List of References are included.
1-4

2.0 BACKGROUND
In the following we present a general overview of the pelletization process and then highlight
specific aspects of coal pelletization.
2.1 General Aspects of the Pelletization Process
Pelletization is the process of forming nearly spherical pellets by tumbling moist particulate
fines (with or without addition of binders and other necessary additives) in such devices as
drums, discs, or cones. Mineral, ceramic, chemical, food, fertilizer, nuclear, pharmaceutical,
waste processing and a host of other industries make use of pelletization to alleviate problems
associated with fine particles. However, from a tonnage stand point, pelletization is most
commonly used for agglomeration of iron ore concentrates. Detailed reviews of various
practical and theoretical aspects of the pelletization of fine particles have been published [21,32,
561.
As shown in Figure 2.1, the driving potential for the pelletization of fine particles is the
lowering of the total surface free energy of the system through a reduction of the effective
air-water interfacial area [56]. The forces which bring about this change are of two kinds: (a)
physical and (b) applied [55]. The physical forces responsible for the formation and the strength
of pellets arise from a number of sources - (i) interfacial effects giving rise to capillary and
surface tension forces, (ii) van der Waal’s interaction, magnetic and electrostatic interactions,
(iv) interlocking effects among the particles, and (v) immovable bridging bonds 0. The applied
forces which arise due to the tumbling motion of drums or discs serve the purpose of bringing
individual liquid-wetted particles into proximity with each other so that the physical forces
become operative and pelletization is initiated. Calculations by Rumpf [50] indicate that, for the
2-1

Figure 2.1. A schematic showing the driving force for pelletization due to reduction in total air-water interfacial area.
2-2

case of solid particles which are completely wetted by a bridging liquid, capillary and surface
tension forces are the most predominant. The magnitude of capillary forces depends upon the
type of bond between the particles. These bonds, depending upon the relative proportion and
distribution of the air and water phases in the pellet are referred to as (i) pendular, (ii) funicular,
and (iii) capillary bonds.
The changes in the state of the agglomerating system can in principle be accounted in terms
of the above described forces, but it is simpler to make use of the concept of size change
mechanisms. Such a view point is advantageous because of the inadequate understanding of the
occurrence of these various forces at a molecular or microscopic level. A total of seven
mechanisms of agglomerate formation and size change was suggested earlier [55]. These include
(i) nucleation, (ii) dissociation, (iii) coalescence, (vi) breakage, (v) layering, (vi) attrition, and
(vii) abrasion transfer. For the purpose of our discussion it is enough to consider three of the
seven mechanisms - nucleation, coalescence, and layering (see Figure 2.2).
Nucleation refers to the formation of particles from the continuous phase due to interactions
within the environment in itself. Clearly, nucleation causes appearance of new particles along
with a discrete change in the size of the newly born agglomerates. As soon as the initial
formation of nuclei occur, coalescence begins to set in. It causes discrete size changes and leads
to decrease in the number of agglomerates but not their mass. The third mechanism of layering
corresponds to continuous size change of the particles and is affected by interaction of
particulates with the environment (continuous phase). Accordingly, layering brings changes in
the mass of the agglomerates but not their number. Clearly, layering can occur only when both
the agglomerates and new feed are present.
2-3

MOIST FEED, p, PELLETS (well-formed species), Pi . e: .. e e * *
.**.... . . e *
NUCLEATION
ip , + 1
COAL ESC E NCE
Pi + Pj 4 Pi+j
Figure 2.2. coalescence, and layering.
Three main mechanisms of pellet formation and growth: nucleation,
2-4

These mechanisms take place simultaneously during any agglomeration process unless the
design and operating conditions are otherwise chosen. Actually, the simultaneous Occurrence
of these mechanisms is known to result in undesirable agglomerate size distributions and cycling
of the performance of an agglomerating unit. Also it is recognized that different growth
mechanisms can prevail depending upon the type of feed being pelletized. According to Kapur
and Fuerstenau [3 11 , the growth of pellets in the initial stages of batch pelletization proceeds fast
by nucleation and then mainly by the coalescence mechanism. In later stages of pelletization
there is evidence that a limited amount of breakage of pellets occurs. In industrial pelletizing
operations where a continuous supply of moist feed is charged to the pelletizing device, the
growth mechanism of layering (or snowballing) of added moist feed onto the pellets becomes
important.
In the past, the following types of laboratory experimental techniques have been used to
study the pelletization behavior of particulate materials:
1.
2.
3.
The first technique consists of slowly adding moist feed together with spray water onto a small batch of seed pellets inside a rotating airplane tire to produce large pellets. A detailed account of this technique, which is popular in iron ore processing laboratories for studying the strength and induration characteristics of pellets, is given elsewhere 1661.
The second technique is a batch experimental method that consists of tumbling a charge of moist feed in a laboratory drum without further addition of water and/or moist feed [54, 571. This technique is most suitable for studying pellet growth mechanisms, pellet growth kinetics, influence of process variables, and role of additives.
The third technique known as the locked-cycle pelletization technique is a semi-continuous experimental procedure that i s used to simulate the closed-circuit drum operation in a laboratory 1531.
Using the batch experimental technique, it has been established by Kapur and Fuerstenau [31]
that the batch pelletization kinetics of comminuted feed materials is typically described by an
S-shaped curve. This S-shaped curve shows three distinct regions of growth (depending upon
2-5

the operating conditions) termed as - (i) the nuclei growth, (ii) a transition growth, and (iii) the
pellet or ball growth regions. The extent of these growth regions and hence the kinetics of pellet
growth depends strongly on (i) the moisture content of the feed, (ii) the size distribution and
fineness of the feed, (iii) the feed preparation method, and (iv) the addition of binders. The size
distribution of the resulting pellets in a batch experiment has a self-preserving nature which
implies that irrespective of the operating conditions and the feed material, the size distribution,
when normalized with respect to the average size of the distribution, is represented by a single
curve. This characteristic size distribution is called the similarity size distribution. Sastry [52],
using a population balance approach developed mathematical models and computer simulation
of the pellet growth in balling drums and discs.
Strength characteristics of wet and dry pellets has been a subject of a few theoretical and
several experimental investigations. A detailed review of the literature on the strength of wet
pellets has been prepared by Kapur [32]. It is now fairly well established that the strength of
moist pellets is mainly due to capillary forces. However, in the presence of particles of colloidal
dimensions, the capillary theory alone is not adequate to account for the wet strength. Also, the
capillary forces, which are important in moist pellets disappear once the pellets have dried and
then the forces contributing towards the dry strength of a pellet arise from (i) hardening of
bonding agents, (ii) precipitation of dissolved salts, (iii) friction and interlocking between
particles , and (iv) electro-static, magnetic or van der Waal’s interactions. In order to improve
the strength characteristics of the pellets, binders have been commonly used in the iron ore and
other industries. Bentonite, which is the most common additive for iron ore pellets, has been
extensively studied as a binder. A large number of other additives have been investigated as
possible substitutes for bentonite [61], with demonstrable commercial success.
2-6

2.2 Pelletization of Coal Fines
The first review paper on coal pelletization was published as early as 1962 [4] and since then
about fifty papers have appeared in the literature. More recent literature reviews can be found
in [7, 36, 38, 44, 57, 59, and 621. Following is a brief overview of selected papers from the
literature covering the laboratory investigations and industrial practice of coal pelletization.
2.2.1 Laboratory Studies
The first report on coal pelletization was published by Carveth and Lang [7] in 1951. This
study examined the results of blending coal fines with hot asphalt and steam while maintaining
the mix at 100" C. This process generated pellets ranging from 35 to 50 mm diameter.
However, the process itself was not considered commercially viable due to high heating costs
and high asphalt requirements.
Handfield-Jones 1231 investigated the pelletization of froth floated coals. That study observed
that the strength of coal pellets could be increased by adding bentonite or fine shale as binders.
The study linked the growth behavior of coal pellets with the distribution of water within the
pellet. Also, it was found that the strength of the pellet was affected by the colloidal content
of the binders.
Sastry and coworkers 136, 591 carried out an extensive study on the pelletizability of coal
fines from 12 bituminous coals, 2 subbituminous coals, 1 anthracite and 1 lignite. This study
focused on the effect of feed size, feed moisture, and binder addition on process kinetics. They
concluded that coal fines could be pelletized with a starch binder and that the economics of the
coal pelletizing process is primarily determined by the cost of binders and the cost of thermal
drying of the pellets.
2-7

Pelletization of coal fines is found to be possible only within a narrow range of moisture
additions; outside the range, the coal fines are either too dry or too wet to agglomerate properly
[36]. Ash content of coal is the most significant property determining the moisture requirements
for pelletization. For example, coals with 5% ash require 43% (by weight) moisture, whereas
those with 20% ash require only 30% water addition. The moisture requirement for
pelletization, W (expressed as weight percent of dry coal), and the percent ash in the coal fines,
A, have an empirical relationship:
W = 43.96 exp(-0.017 A).
This moisture-to-ash relationship holds for bituminous and anthracite coals and not for lignite.
Lignite requires much higher moisture for pelletization than estimated from the above
relationship. This is explained in terms of the internal pore structure of lignite. Further, the
sulfur content of coal is found not to influence the pellet growth behavior. The surface area of
coal fines is an important variable influencing the kinetics of pellet growth, in that, for anthracite
and bituminous coals, the rate of growth decreases with increasing fineness of feed, whereas for
lignites a reverse trend is observed.
Among other binders, bentonite, asphalt emulsion, and starch are the three binders most
commonly investigated and used during coal pelletization [36, 68, 691. Of the three binders,
corn starch is found to be most effective in improving the wet and dry pellet compressive
strengths and abrasion and impact resistances but not resistance to water penetration. Corn
starch binder is effective for the pelletization of anthracite, bituminous as well as lignite type
coal fines. An addition of 0.5% (by wt.) appeared to yield pellets with adequate quality.
Bentonite, which is popular in the iron ore industry, is not found to perform as well during coal
pelletization [36].
2-8

Asphalt emulsion is found effective in providing excellent protection against water
penetration. This ability of asphalt emulsion has been attributed to its hydrophobic surface
nature. A combination of corn starch (imparting strength) and asphalt emulsion (imparting
resistance to water penetration) was found to yield the best quality coal pellets.
Rubio and De Leon [49] compared the pelletizing and briquetting results of Brazilian coal
fines. They detailed results from varying moisture content, binder type and concentration, and
curing conditions. Their conclusion was that pelletizing was more economically favorable than
briquetting due to the extra drying costs in the briquetting process.
Most recent studies by Wen, et.al. [68] have shown that a humic acid binder, consisting of
a water soluble colloidal system of humic acids dispersed in ammonium hydroxide solution,
produces strong and durable bituminous coal pellets [31, 321.
Onyemaobi [47J used a set of froth-floated British coals to show that hydrophobicity exerts
more of an effect on moisture requirements for pelletizing than ash content.
A study by Conkle, et. a l [lo] was directed to investigate the pelletizing and reslurrying as
a means of distributing and firing clean coal. Laboratory agglomeration studies were carried
out with disk pelletizer, extrusion and roller-die equipment. It was found that all the three
methods yield satisfactory coal agglomerates for reslurrying , but roller-die method is expected
to be most economical.
While there are very few studies on the role of surface properties on coal pelletization, there
is an abundance of publications in the context of coal cleaning. For example, a recent
publication by Aplan [ 11 includes a review of the influence of hydrophobicity on coal preparation
operations such as flotation, fdtration, flocculation, dispersion, storage and handling.
2-9

2.2.2 Industrial Practice of Coal Pelletization
Coal pelletization was commercially implemented for the first time by the Rochester and
Pittsburgh Coal Company [7, 91. Feed for this operation originated from coal fines recovered
from waste slurries by froth flotation. The fines (100% minus 28 mesh, 50% minus 325 mesh)
were pelletized in a balling drum after 26% moisture and 0.5 to 1.0% lignin was added. The
product pellets (6-20 mm) were dried at 105°C. The operation was considered successful and
produced pellets at a rate of 15 tph. The pelletizing process continued for several years until
the mine supplying the fines closed.
The Eastern Coal Company [ 141 also used a froth flotation process to recover coal fines from
a waste stream as feed to a disc pelletizer. This process used 1.5 weight percent lignin liquor
as binder. While the pelletizing step was reported as successful, serious problems O C C U K ~ ~
during their thermal drying, in that the pellets caught fire when their moisture fell below 1 %.
The plant was later shut down because of this problem.
Hinkle 1241 reported on producing agglomerates from coal fines recovered from a power
plant dust recovery system. Several methods of generating acceptable agglomerates were
studied. The first test method involved combining medium sized lumps of coal with dust.
However, this method produced excessive fines when the final agglomerate product was being
returned to the coal delivery system. The final method that was developed to produce usable
pellets with minimal dust generation involved an Ampel mixer. This report is one of the few
successful implementations of industrial scale coal pelletization.
Conceptual design studies indicate that a typical coal pelletizing plant would consist of a
pelletizing drum or disc circuit with a roller screen and a roller dryer. Capital cost of a 100
TPH pelletizing plant (including dryer) appears to be in the neighborhood of $15 million. The
2-10
operating costs are estimated to be $12 per ton of coal pelletized out of which binder and drying
costs represent 60% [57l.
Jones and Meecham [29, 301 present some of the latest efforts to utilize coal pelletization in
a full-scale application. They describe efforts at British Coal to solve problems of coal fines
handleability. British Coal installed and tested a pilot plant, but did not progress to full
production.
2.3 Conclusions
We may conclude from the above literature survey that research activity in coal pelletization
is quite limited and most of it is of applied type. There exists a clear need to understand the
process engineering aspects of the coal pelletization process including studies on the influence
of operating variables, role of surface chemical properties of coal and quantitative modeling and
process simulation.
2-1 1

3.0 MATERIALS AND METHODS
3.1 Coal Samples
The pelletization experiments were carried out on three bituminous and one anthracite coal
samples. These samples were provided courtesy of a concurrent U.S. Department of Energy
contract studying "Coal Surface Control for Advanced Fine Coal Flotation" (DOE Project No.
DE-AC-88PC88878) [18]. We have chosen these coals for two specific reasons - (i) they are
extensively characterized for physical, chemical, petrographic and surface properties and
flotation behavior and (ii) they are readily available in Berkeley. The list of coals and mine
locations from which they were sampled is included in Table 3.1.
Details of the coal sample collection were given by Fuerstenau et.al [18]. Here we include
only the highlights of the sampling program. Extensive care was used in the collection and
handling of the run-of-the-mine samples. Fresh coal samples were collected from new mine
faces after the removal of clay and rocks. Topsize material was then reduced to minus 4 inches
in the field, homogenized and loaded in 55-gallon drums. Approximately 400 pounds of coal
were loaded per drum. Each drum was then repeatedly filled with argon gas and sealed
("inerted") to minimize oxidation.
3.2 Preparation and Characterization of Fine Coal Samples
Coal fines were produced under controlled conditions by stage crushing and grinding run-of-
mine samples. The procedure consisted of first stage of crushing a 10 kg sample of the 4 inch
as-received coal down to a nominal 3/4 inch topsize in a laboratory jaw crusher. The second
stage consisted of reducing the 3/4 inch feed to a nominal -114 inch topsize in a laboratory roll
crusher. This 1/4 inch product was then split into 500 gram samples and stored in air-tight bags
3- 1

Table 3.1. List of coal samples and their sources.
Seam Bethlehem Anthracite
Pittsburgh No. 8 Upper Freeport PA
' Illinois No. 6
Mine ODerator Mine Location Bethlehem Mines Co. Tamaqua, PA Peabody Coal Co. Marissa, IL R & F Coal Co. Warnock, OH N. Cambria Fuel Co. Blacklick, PA
3-2

under "inert" conditions. Each 500 g Sample of stage crushed coal was first dried in a forced
air heater at 50°C for about 12 hours and was dry ground for 30 minutes in a 8 inch diameter
by 10 inch long stainless steel laboratory mill (loaded with 16, 14, and 12 stainless steel rods
of 3/4, 5/8 , and 1/2 inch respectively). All the pelletizing experiments were conducted within
hours of producing the fine coals by dry grinding. This procedure was developed to minimize
the possible oxidation of the fines.
All the fine coal samples were characterized for their size distribution, specific surface area,
proximate and ultimate analysis. Following sections present the details of the test procedures.
3.2.1 Particle Size Distribution
The standard wet and dry sieving technique was used for determining the particle size
distribution of fine coal samples. It consisted of wet sieving 100 g of coal Sample on a 400
mesh screen and drying the +400 mesh fraction and subjecting it to dry sieving on a nest of
sieves. Table 3.2 presents size distribution of the dry ground coal feeds used for the batch
pelletization experiments.
3.2.2 BET Area
Specific surface area of the fine coal samples was determined by gas adsorption using a
Micromeritics BET Surface Area and Pore Size Analyzer Model 2100. The adsorbate gas used
was a research grade carbon dioxide (purity 99.998%). The surface area was calculated using
the Dubinin-Polyanyi equation and adsorption data. The results which are included in Table 3.2
show that Bethlehem anthracite has the highest surface area, while the three bituminous coals,
Illinois No. 6, Pittsburgh No. 8, and Upper Freeport PA having similar surface areas of roughly
160 to 180 m2/gm. Fuerstenau et al. [18] found that changing the grind conditions of these coals
did not significantly alter the surface area of the coals. The apparent lack of change in surface
3-3

Table 3.2 Physical and chemical characteristics of coal samples used in this project.
Bethlehem Illinois Anthracite No. 6
Pittsburgh No. 8
Size Distribution, cumulative weight percent passing Mesh (opening in pn)
28 (600) 100 100 48 (300) 95 100 65 (212) 96 94 100 (150) 77 82 150 (106) 57 65 200 (75) 36 48 325 (45) 23 32 400 (38) 10 12
100 100 99 99 97 83 57 30
Surface Area, mz/g 380 165 150
Proximate Analysis, weight percent - dry basis (*) Fix. Carbon 92.9 46.3 43.5 Ash 3.5 16.4 11.5 Volatiles 3.7 36.2 35.6 Total Sulfur <0.1 5.73 4.89 As Received Moisture 2.4 9.5 2.3
Ultimate Analysis, weight percent - dry basis (*) Moisture 2.4 9.5 2.3 Carbon 89.9 63.8 71 Hydrogen 2.3 5.7 5.1 Nitrogen 1.16 1.24 1.45 Oxygen 1.18 6.1 6.4 c / o Ratio 76.2 10.5 11.1
Upper Freeport PA
100 99 97 89 72 54 36 8
150
61.8 13 26.2 2.38
1 .o
1.0 75.6 4.7 1.45 3.85 19.6
(*) Source: Fuerstenau, et.d.[18]
3-4
area is typical of high-surface area materials since the change in external surface area is small
compared with the relatively large surface area in the pores.
3.2.3 Proximate and Ultimate Analysis
The proximate analysis was carried out using a LECO MAC 400 Proximate Analyzer. The
moisture, volatile matter, ash and fixed carbon were determined gravimetrically by heating the
samples at the respective temperatures of 106"C, 950"C, and 750°C. The MAC 400 maintains
a nitrogen atmosphere in the furnace during the moisture and volatile analyses, and then uses
a oxygen atmosphere in the ash analysis. Sulfur analysis was performed with a LECO SC-132
Sulfur Analyzer. Samples are combusted in an oxygen atmosphere where the sulfur oxidizes to
sulfur dioxide. The combustion gases are then analyzed by a solid state infrared absorption
detector. Proximate analysis results are presented in Table 3.2.
The ultimate analysis of the three coals was determined by using a LECO CHN 600
Analyzer. The carbon, hydrogen, and nitrogen contents of each coal were obtained by burning
samples in pure oxygen at 950°C in an infrared analyzer which measures the amount of C02 and
water vapor in the combustion gases. The amount of nitrogen is determined by a thermal
conductivity cell which fust converts nitrous oxide to nitrogen gas by passing the hot combustion
gas over hot copper and a catalyst. The ultimate analysis of each of the coals is also included
Table 3.2.
3.3 Additives for Coal Pelletization
During the course of this project, we investigated the influence of two surface active agents
that are commonly used in fine coal processing, viz., a flotation collector and a flotation
depressant.
3-5

3.3.1 Dodecane - a Flotation Collector
In coal flotation, a combination of collector and fiothers is generally used. Coal flotation
collectors are usually nonpolar oils obtained from petroleum distillation or coke-oven plants and
therefore have low solubility in water. Typical nonpolar collectors are kerosene, fuel oil, crude
petroleum and coal tar distillates. By far, kerosene is the most widely used collector in coal
flotation. It is a mixture of saturated paraffinic hydrocarbons whose exact composition depends
on the source of the crude and the distillation process and operation. To ensure a consistent
quality of collector, dodecane was chosen as a standard collector, since its molecular weight is
close to kerosene. Reagent grade n-dodecane obtained from Eastman Kodak Company was used
in this study. *
3.3.2 Dextrin - A Flotation Depressant
Dextrin has been extensively studied as a depressant in various flotation schemes with iron
ore by Iwasaki and Lai [271 and with coal Miller et al. [43]. Dextrin is the product of the
hydrolysis of starch by certain enzymes. The hydrolysis reaction produces a modified starch that
is hydrophilic with a high molecular weight. Dextrin is a short chain molecule that is not likely
to act as a binder. The flotation studies indicate that dextrin adsorbs with hydrophobic bonding
and that adsorption density increases with an increasing number of hydroxyl groups. The dextrin
used for this study is reagent-grade dextrin obtained fiom VWR Scientific Company.
3.4 Batch Pelletization Experimental Procedure
All the batch pelletization experiments were carried out in a 150-mm length by 225-mm
diameter pelletizing drum (Figure 3.1) by making use of the procedure that was extensively to
investigate the pelletization behavior of different kinds of fine powders [31, 36, 57, 603.
3-6

Figure 3.1. Photograph of the batch balling drum assembly.
3-7

The first step of a batch pelletization experiment is the preparation of moist feed. It consists
of -- (i) placing 250 g of dry fine coal feed in a resealable plastic bag and adding the desired
quantities of dextrin/water or dodecane/water emulsion and (ii) sealing the bag and kneading the
contents thoroughly by hand. After the contents are thoroughly mixed, the moist coal fines are
rubbed through a 6-mesh screen to prepare a fluffy feed that is lump free.
The moist fine coal feed is then loaded into the batch pelletizing drum which is enclosed in
a humidified chamber (Figure 3.1) and maintained at 95% relative humidity to minimize the
moisture loss from the drum contents. The drum is rotated at a speed of 40 revolutions per
minute and batch pelletization is carried out for the desired number of revolutions. At the end
of the run, the pelletizing drum is emptied and the drum charge is analyzed for the moisture
content and size distribution of the pellets. Each run is repeated 2 to 4 times under identical
conditions to establish reproducibility. During each run, small samples of moist feed and final
pellet product are taken and their moisture content determined.
Each kinetic experiment then consisted of determining the pellet size distributions as a function
of time (drum revolutions) under given operating conditions.
The pellet size distributions were was determined by placing the green pellets on a set of
sieves of 114 inch to No. 20 Tyler mesh and gently sieving the pellet charge. In the past, the
pellet size distributions were determined by photographing and image analysis [32, 57l but we
have found that the sieve analysis method gave results much faster. From the sieve analysis we
obtain the mass of pellets (mi) retained on the i-th sieve and (with a sieve opening of 4) and
passing the (i-11th sieve. Then for each pellet sample, we calculate mass fractions (wi),
3-8

cumulative mass fractions (y), average pellet diameter (E,,,) and standard deviation (u;) by
using the following expressions.
mi wi = - Cmi
f
y=CWk LE1
(3-1)
(3-2)
- Ew = C d j w i (3-3)
a; = E(& - 0 , ) 2 W i (3-4)
where
Zi = J(didj-1) (3-5)
the geometric mean diameter of the agglomerates in the i-th sieve fraction.
3-9

4.0 EXPERlMENTAL RESULTS AND DISCUSSION
In this section we present results from various pelletization experiments that were performed
during the course of the project along with a qualitative discussion of the results. The next
section deals with the quantitative analysis of the coal pellet growth processes.
4.1 Coal Pellet Size Distributions
As mentioned in the last section, each batch pelletization experiment consists of placing a
moist fine coal sample in the batch balling drum and tumbling the drum for a predetermined time
period. Figure 4.1 shows a picture of -- (a) dry fine coal sample, (b) moist feed just before it
is placed in the drum and (c) the spherical pellets that are formed after 800 drum revolutions.
It is instructive to observe that while dry coal fines are extremely dusty, the moist feed to
the drum shows a definite degree of prenucleation (with agglomerates in the size range of 0.5
to 2 mm) and has as such less of a dusting problem. Nevertheless the drum feed tends to be
fairly fluffy. Tumbling the moist fines for 800 revolutions give rise to near spherical pellets in
the size range of 5 mm to 15 mm.
Figure 4.2 shows the progression of pelletization where the moist feed and samples of coal
agglomerates at 100, 200, and 400 revolution are shown. What is quite fascinating is that the
fluffy feed transforms into well-formed nuclei within 50 or so drum revolutions. During this
initial few revolutions the moisture distributes around the particles and the pendulq forces pull
the individual particles closer giving rise to stable nuclei. These nuclei for the most part tend
to grow by coalescence while forming into a larger cohesive spherical shaped pellets with little
identity of the individual nuclei.
4-1

<b j
Figure 4.1. Photograph of the Upper Freeport PA - (a) fine coal sample, (b) moist feed to the balling drum and (c) agglomerates produced after 800 drum revolutions.
4-2

.. - . J
Figure 4.2. Photographs of Upper Freeport PA -- (a) moist feed to the balling drum and agglomerates generated after (b) 100, (c) 200 and (d) 400 drum revolutions.
4-3

On the other hand, a few samples tend to grow rapidly by coalescence into raspberry shaped
pellets where the individual granules that came together do not deform and keep their identity.
We have observed this to be a problem more so with extremely fine coal feed samples. Figure
4.3 shows the spherical and raspberry type coal pellets that we have encountered during our
experimental studies. Needless to say the raspberry growth is highly undesirable because the
agglomerates tend to be rather porous and weak. Figure 4.3 also includes a mechanistic
representation of the formation of spherical agglomerates with binary coalescence and cohesive
growth as well as the raspberry type growth.
Figure 4.4 presents the size distribution of agglomerates at various stages of their growth.
It is seen that the size distribution gets broader as the agglomerates grow larger. Depending on
the intended use of the coal pellets such as dust free transportation, such widening of the
distribution might be desirable because it leads to higher packing density of all the pellets put
together. It is often reported that most of the agglomerate size distribution obtained from batch
pelletization experiments conform to a similarity size distribution. We shall quantitatively
analyze the size distribution results from this study in the next section.
From a practical stand point analyzing pellet growth kinetics and pelletization behavior and
the influence of operating variables by considering the complete size distributions is not
convenient. Accordingly we make use of average pellet diameter (computed by using Equation
3-3) for further discussion.
4.2 Reproducibility of Pelletization Kinetics
A major obstacle that we have encountered during the initial stages of the project was
reproducibility of batch pelletization results with Illinois #6. Figure 4.5 shows the batch
pelletization results with Illinois #6 coal where average pellet diameter is plotted as a function
4-4

(a) Coalescence'
OO (b) Raspbeny growth
0 0 0 0 O00 0 0 0 ooooo
. I
Figure 4.3. Schematic of formation and photographs of (a) spherical and (b) raspberry shaped pellets.
4-5

- - -
28% wt. Moisture - 0 600 - 0 800 A 1000 -
-
12 16 20 0 4 8 Pellet Diameter, mm
Figure 4.4. Size distribution of coal pellets at different stages of growth during a batch pelletization experiment with Upper Freeport PA fine coal sample.
4-6

E E L- a, Y
i (II
8
E m .- 5
16 . I I
Q I I I I
- - Illinois No. 6
0.5% wt. Corn Starch 40% wt. Moisture -
0 400 800 1200 1600
12 -
8
4
0
Drum Revolutions
Figure 4.5. Reproducibility of coal pelletization experiments (Illinois #6 Sample).
4-7

. of number of drum revolutions. This figure indicates the typical problem associated with the
reproducibility of the experimental results. Using extreme precautions in conducting the
experiments, we were able to improve the reproducibility of the results. However, we found
that it is often necessary to repeat an experiment several times and take average of several
measurements in order that any reasonable interpretation of the data becomes
possib1e.experimental results. It took several months in resolving the reproducibility problem.
Because Illinois No. 6 coal could not be depended upon to maintain a consistent surface
composition, despite precautions such as purging storage drums with argon, further
reproducibility studies were conducted with Upper Freeport PA. Figure 4.6 demonstrates that
reasonably good reproducibility was obtained at 26 % and 30 % added moisture. Each curve has
a fairly narrow variation of the weight mean diameter. However, the 28% curve contains a
critical region. Three distinct regions are observed on this curve.
1.
2.
3.
The early part of the curve, where nucleation occurs predominantly, experiments show small
variations in the weight mean diameter of the product pellets.
The transition region, where pellet growth by coalescence dominates, turns out to be the
most critical region where there is a significant variation in the weight mean diameter and
poor reproducibility.
Finally, in the ball growth region there tend to be small variations in the weight mean
diameter.
The critical region, which exhibits large variability, is probably due to the extreme sensitivity
of the pelletizing curve to any kind of experimental perturbation. For example, although the
feed for pelletization is rubbed through a 6 mesh screen to fluff the moist feed, there must be
some variation in the size of the minus 6 mesh product between different experiments. This
4-8

0 400 800 1200 1600 Drum Revolutions
Figure 4.6. Reproducibility of cod pelletization experiments (Upper Freeprt PA sample).
4-9

variation in feed moisture size could then alter the size distribution of the nuclei and resulting
kinetics in the critical region.
All in all, we discovered that pelletization behavior of coal fines in general is highly sensitive
to even minor variations in the coal characteristics especially changes (such as oxidation) taking
place during storage and pellet feed sample preparation.
4.3 Influence of Feed Moisture
Figure 4.7 shows the effect of feed moisture on the pelletization behavior of Upper Freeport
coal fines. As is normally observed, the rate of pellet growth increases with increased feed
addition. As pointed out earlier, reproducibility was not very good and it often necessitated to
conduct several experiments and take average values for the weight mean diameter before any
meaningful trends could be established as was done in this case from the results in Figure 4.6.
Of course it must be realized that the pelletization is possible only within the narrow range of
moistures, Le., between about 26 to 30 percent for Upper Freeport coal sample. Outside this
range the feed gets either too dry to pelletize or too wet to make a green pellet.
Figure 4.8 shows the influence of the moisture content on the batch pellet growth behavior
of Illinois No. 6 coal. Again, as expected the pellet growth rate increased with increased
moisture addition. Nevertheless, the growth rate is found to be inductive and erratic, in that
with low moisture addition, the pellets tend to grow slowly during the first several drum
revolutions (induction) with clumping type growth at a later stage. We found that the overall
growth behavior of Illinois #6 coal fines is fairly erratic in that the pellets obtained from this
coal are not smooth like with others. This particular coal pelletized with some consistency in
the range of 28 to 32 percent added moisture in March 1990. But, within two months, the same
coal sample pelletized with moisture additions ranging from 34 to 38 percent added moisture.
4-10

Upper Freeport PA
- Q)
.
0 400 800 1200 1600 Drum Revolutions
Figure 4.7. Effect of feed moisture content on the batch pelletization kinetics of the Upper Freeport PA sample.

Illinois No. 6 0.5% wt. Corn Starch
Moisture, wt % 12 0 38 0 40 i
U ’ I I I t I I I 400 800 1200 1600 0
Drum Revolutions Figure 4.8. Effect of feed moisture content on the batch pelletization kinetics of the Illinois No. 6 sample.
4-12

By September 1990, the moisture requirements for pelletization had increased up to 42 to 44
percent added moisture (Figure 4.9).
Fuerstenau et al. [18] found that the surface pH of this coal sample had shifted significantly
from a near-neutral @H=6.5) to an acidic @H=4) over a period of 4 months. They concluded
that this pH shift was caused by auto-oxidation of ash-forming compounds including sulfur-
compounds, despite the inert storage conditions. They also observed a shift in the
hydrophobicity of this coal, towards increasing hydrophillicity. The pH shift is probably caused
by auto-oxidation, caused by sulfur-bearing compounds reacting with atmospheric oxygen and
residual moisture to form sulfuric acid. The oxygen could be retained within the pores of the
coal and not displaced by argon when purging the stored samples. These kind of factors result
in the erratic pelletization behavior by Illinois #6 sample.
In contrast to bituminous coals, the pelletization behavior of Bethlehem anthracite is more
stable as evidenced by Figure 4.10. These curves exhibit small variability, throughout all
different moisture additions. Again, increasing moisture addition increases the rate of growth.
But the shape of the growth curves is substantially different from those for Upper Freeport and
Illinois #6 coals. The only way we can explain this difference is in terms of the occurrence of
different pellet growth mechanisms and this topic is addressed in the next section in more detail.
4.4 Influence of Addition of Dodecane
This section discusses the influence of addition of dodecane on the pellet growth behavior.
Dodecane is used as a collector during flotation of fine coals. Kinetic data from the pelletization
experiments on the four coal samples are presented in Figures 4.11 through 4.14. Results from
Figures 4.11 and 4.12 for Upper Freeport and Pittsburgh #8 coals show that dodecane addition
decreases their growth rate. Figure 4.13 for Illinois #6 does not show any definitive trend in
4-13

16
12
8
4
I I I I I I
Illinois No. 6 Moisture, wt 9
0 42 0 4 4
0 ' I I I I I I I
0 400 800 1200 1600 Drum Revolutions
Figure 4.9. Moisture reproducibility problems with Illinois No. 6
4-14

16
E E 1 2 -
h' g -
i!
P Q)
E .w
(II
S 0
E .I m 4
0
Drum Revolutions
f I I I I I f
Bethlehem Anthracite Moisture, wt. % -
0 30 0 32 A 34 -
- -
- -
0 - -
f I I I I I I
Figure 4.10. Effect of feed moisture content on the batch pelletization kinetics of the Bethlehem Anthracite sample.
4-15

Upper Freeport PA 28% wt. Moisture
0 400 800 1200 1600 Drum Revolutions
Figure 4.11. Influence of dodecane addition on the batch pelletization kinetics of the Upper Freeport PA sample.
4-16
16
E E 1 2 - L” a
E +I,
rn b’ 8 - r rn i!
s E .E? 4
0
Figure 4.12. Influence of dodecane addition on the batch pelletization kinetics of the Pittsburgh N0.8 sample.
I I I I I I I
Pittsburgh No. 8 34% wt. Moisture
- - 0 Dodecane, Ib/ton -
0 0.0 0 2.4 -
- - - - -
3
I I e I e t I
4-17

. .
16
12
8
4
0
0 A
I a
13 Illinois No. 6 44% wt. Moisture Dodecane, Ib/ton
0 0.0 0 2.4 A 4.8
400 800 1200 1600 0
Drum Revolutions
Figure 4.13. Influence of dodecane addition on the batch pelletization kinetics of the Illinois N0.6 sample.
4-18

16 I I I 1 I I I
Bethlehem Anthracite 34% wt. Moisture Dodecane, Ib/ton
0 0.0 -
a 2.4 . - -
.E? 4 - 3
- - .
0 I I I I I I I
Figure 4.14. Influence of dodecane addition on the batch pelletization kinetics of the Bethlehem Anthracite sample.
4-19

the change in the pelletization behavior. Also, the pelletization behavior of Bethlehem anthracite
is not influenced by the addition of dodecane.
We know that the addition of dodecane makes the surface of the coal matter more
hydrophobic. Then we recognize that pendular and capillary forces are weaker in holding the
particles within an agglomerate. Also when two agglomerates encounter each other, the
efficiency of coalescence is also lowered. These two factors are expected to give rise to lower
growth rates. While the pelletization behavior of Upper Freeport and Pittsburgh #8 coals
(Figures 4.11 and 4.12) agree with the above explanation, Illinois #6 does not because of its
erratic and unstable surface properties. In the case of Bethlehem anthracite, addition of
dodecane does not change its already high hydrophobicity and as such does not lead to any
change in the pelletization rates.
An analysis of the data and a formal interpretation of the role of dodecane on the
pelletization behavior should be attempted especially in terms of the possible implications of
ultimate analysis, functional groups, and structural effects of coals.
4.5 Effect of Addition of Dextrin
Influence of the addition of dextrin on the batch pelletization behavior of coal fines is
presented in Figures 4.15 through 4.18. All the three bituminous coals (Figures 4.15,4.16 and
4.17), indicate that the addition of can significantly accelerate the kinetics. For Upper Freeport
PA coal, the effect of the acceleration is equivalent to up to 4% of added moisture (Figure 4.15)
and is similar in magnitude for Pittsburgh No. 8 (Figure 4.16) and Illinois No. 6 (Figure 4.17).
It is known that dextrin causes the surface of coal to become hydrophilic. This increased
hydrophillicity is expected to give rise to higher efficiency of coalescence and more stable and
stronger agglomerates both factors leading to increased growth rate. Our experiments clearly
4-20

Drum Revolutions
Figure 4.15. Effect of dextrin addition on the batch pelletization kinetics of the Upper Freeport PA sample.
4-2 1

E E 12 5 0
* o i 16 I I I I I I *
Pittsburgh No. 8 34% wt. Moisture
- Dextrin, wt. % -
0 0
0- 0 400
0
/ 0 1 A 2
800 1200 1600 Drum Revolutions
Figure 4.16. Effect of dextrin addition on the batch pelletization kinetics of the Pittsburgh N0.8 sample.
4-22

I I
Illinois No. 6 - 42% wt. Moisture
Dextrin, wt. % - 0 0 0 1 A 2
-
m Q)
- I - .
- -
0 . I I I I I I
Drum Revolutions
Figure 4.17. Effect of dextrin addition on the batch pelletization kinetics of the Illinois N0.6 sample.
4-23

E E L- Q) .cI
E Q
c Q Q)
5
E E m .I
5
16
12
8 -
4 -
0 ,
I I I I I I I
- Bethlehem Anthracite
- Dextrin, wt. % - -
30% wt. Moisture
0 0
0 1 - -
.. 0 -
II 13 0 - -
a I a I a I a
Figure 4.18. Effect of dextrin addition on the batch pelletization kinetics of the Bethlehem Anthracite sample.
4-24

indicate that the increase in the growth rate reaches an asymptotic limit at about 1 % addition of
dextrin.
Bethlehem anthracite does not show any change in its pellet growth behavior due to the
addition of dextrin (Figure 4.18). Since this sample of anthracite is relatively pure, with only
a very small percent of hydrogen and volatile compounds (Table 3.2), it is expected that there
would be few surface sites for the adsorption of dextrin. Conversely, since the three bituminous
coal samples do contain significant amounts of volatiles and hydrogen, there would be many
more surface sites for dextrin adsorption and increased hydrophillicity.
4.5.1 Film Flotation Results
This section discusses our efforts to characterize the causes for the effect of dextrin by
making use of a relatively new technique called film flotation developed by Hornsby and Leja
(1984) and Fuerstenau et.al. (1990). The film flotation experiments were conducted on the as
received and dextrin treated samples of Bethlehem anthracite, Illinois N0.6. Pittsburgh No. 8,
and Upper Freeport, PA coals and the results are presented in Figures 4.19 through 4.22.
The film flotation technique consist of placing a monolayer of particles onto the surface of
a liquid of a known surface tension. Depending on the surface energy of the particles, the
particles separate into a sink or float fraction. As the surface tension is varied, the particles are
partitioned into lyophobic (float) or lyophillic (sink) fractions. The weight percent of the
lyophobic fraction is then plotted as a function of the solution surface tension to produce a
"wetting tension distribution diagram" and the mean surface tension and contact angle are
calculated by following the procedure recommended by Fuerstenau et.al. The mean surface
tension and the contact angle are good measures of wettability and as the particle wettability is
increased the mean surface tension increases and the contact angle decreases.
4-25

4 0 n
100
80
60
40
20
0
I I 8
- Upper Freeport PA - - Dextrin, wt. % - . 0 0
0 1 ' - - - - - - - -
- I I I -
Surface Tension, mN/m
Figure 4.19. Cumulative weight fraction of lyophobic particles as a function of their wetting surface tension for Upper Freeport PA coal fine sample.
4-26

Surface Tension, mN/m
Figure 4.20. Cumulative weight fraction of lyophobic particles as a function of their wetting surface tension for Pittsburgh No. 8 coal fine sample.
4-27

100 v) Q) 0 I
.I
0
5 80 a h’ 2 60 P
i5i a 3 C; 0 0 20 40
i 5
0 0
I I I I I
p”: - 9 O .
Illinois No. 6 Dextrin, wt. %
0 0 0 1
-
- rn
- - - /Y; - 1 ’
I I a 0 &“ - e I e
20 40
Surface Tension, mN/m
60 80
Figure 4.21. Cumulative weight fraction of lyophobic particles as a function of their wetting surface tension for Illinois N0.6 coal fine sample.
4-28

100 v)
0 II aa
5 80 n
E
.- 0
60 P, 0 s J
0 4 40 n
2 E' 03
20
Surface Tension, mN/m
I I e I e I
. Bethlehem Anthracite - Dextrin, wt. %
- 0 0 0 1 -
- m
- - -
0- e I e
Figure 4.22. Cumulative weight fraction of lyophobic particles as a function of their wetting surface tension for Bethlehem anthracite coal fine sample.
4-29

The present film flotation experiments were carried out by sprinkling a monolayer of
100X150 mesh particles on the surface of an aqueous methanol solution and then separating the
sink and float fractions. The aqueous methanol solutions ranged from pure water (surface
tension 72.8 mN/m) to pure methanol (surface tension 22.4 mN/m). This set of experiments
was conducted at 2OoC. The surface tension of the aqueous methanol solutions was determined
by using a Fisher Tensiometer. The cumulative lyophobic distributions for these four coals are
presented in Figures 4.19 through 4.22. The wetting parameters, (Le., mean surface tension
and contact angle) derived from the film flotation results are given in Table 4.1. These results
show that the cumulative distribution curve of the dextrin-treated coal shifts to a higher wetting
surface tension as compared with that of the as-received samples. All these data clearly indicate
that the percentage of hydrophobic surface sites decrease with the addition of dextrin. Also, as
expected, the addition of dextrin increases the mean surface tension values and decreases the
contact angle, a clear indication of increased wetting (or increased hydrophillicity).
There are some remarkable observations in these pelletization kinetic data. First, the
pelletization rate of Bethlehem anthracite does not change with the addition of dextrin in spite
of the fact that there is a substantial increase in the surface wettability. In contrast all the other
three coals exhibit noticeable increase in the growth rates with the addition of dextrin which
caused increased wettability. We feel that the structure of coal and such functional groups as
carboxylic and phenolic groups play a major role in actually determining the pelletization
behavior in conjunction with the surface wettability in itself. An interpretation of these factors
should be attempted in the future work.
4-30

Table 4.1. Contact angles for as-received and dextrin treated coal fines.
coal
Bethlehem Anthracite
Illinois No. 6
Pittsburgh No. 8
Modification
As-Received 1% Dextrin
As-Received 1% Dextrin
As-Received 1% Dextrin
Upper As-Received Freeport, PA 1% Dextrin
mN/m
57.5 72.0
49.0 70.5
42.5 68.0
45.0 55.0
4-3 1
43 10
57 14
69 22
64 47

4.6 Influence of Coal Weathering
Figure 4.7 showed the pelletization behavior of as-received Upper Freeport coal fines with
different addition of moisture contents. Like most coals, this coal could be pelletized only over
a narrow range of moisture additions of 25 to 32 percent by weight (dry basis). With lower
moisture addition, the Upper Freeport coal exhibits a much longer induction period followed by
a rapid, clumping type growth.
Next set of experiments were carried out on Upper Freeport coal sample that was stored for
13 weeks in open drums and subjected to weathering. Pelletization of this weathered coal with
32 percent moisture was found to be extremely slow. Figure 4.23 presents the growth curves
for the as-received and weathered samples of Upper Freeport coals. The behavior of weathered
coal is similar to that of the as-received coal with low moisture addition.
Subsequently, we conducted tests on the weathered sample by increasing the moisture
addition to a substantial amount, Le. up to 36 percent. These results are also shown in Figure
4.23 in which the growth curve for the as-received sample is included for comparison purposes.
It is clear that the growth rate could be increased by increasing the moisture addition. We
believe that the differences in the pelletization behavior of the as-received and weathered coals
must result from surface oxidation and the resulting changes in wetting behavior.
In order to see if the weathering influenced the growth mechanisms during the pelletization
process, we have plotted the size distributions of pellets (with 10 mm weight mean diameter)
produced with the as-received and weathered samples. These results are given in Figure 4.24.
The pellet size distribution is not changed in spite of the inductive type of growth with the
weathered sample. This indicates that the mechanisms of pellet growth are not altered by
weathering.
4-32

0 . * Oxidized 0 AsReceived
. -
Upper Freeport PA
0 400 800
Drum Revolutions 1200 1600
Figure 4.23. Influence of weathering oxidation of on the pelletization behavior of Upper Freeport PA coal fine sample.
4-33

I00 m I I I m I I I I
- Upper Freeport PA - 32% wt. Moisture ki 80 -
E 0 AsReceived 3
i i .. 0 Oxidized w c
- 60 - E
n . 'is 40
a Q) > tu
- .
- - I
E - 6 2 0 - -
- I n 0
8 12 16 20 0 4
Pellet Diameter, mm
Figure 4.24. Size distribution of agglomerates produced from as-received and oxidized samples of Upper Freeport PA coal fines.
4-34

It is well known that during storage, coal samples undergo weathering essentially causing
surface oxidation. We believe that the differences in the pelletization behavior of the as-received
and weathered coals must result from this surface oxidation. Surface oxidation increases
wettability of the coal which in turn can increase the moisture requirement for pelletization. It
is also believed that oxidized coal immobilizes substantial quantities of moisture thus less
moisture becomes available for pelletization. One method to check this hypothesis is valid is
to determined the air dried moisture of as received and weathered coals and then determine the
free moisture of pellet feeds. This free moisture shall correspond to the moisture available for
pelletization.
4.7 Control of Coal Pellet Growth Process
Surging is a common phenomenon in conventional pelletization circuits (see also Section 6).
This is reported to be caused by uncontrolled occurrence of various mechanisms of pellet
formation and growth. It is desirable to control the pelletization process by deliberately
changing the extent of contribution from each mechanisms through redesign of the circuit or
proper control of the operating conditions. In this context, we have found that nuclei growth
by rapid coalescence, as opposed to coalescence followed by compaction, results in raspberry
type growth (Figure 4.3). The raspberry shape is not as desirable as spherical pellets.
We have conducted several qualitative experiments to analyze the raspberry type growth and
see if it could be prevented. Normally coalescence involves two pellets at a time. But in the
case of raspberry type growth a number of pellets stick together at a time resulting in a growth
as represented in Figure 4.3. The cause for this kind of growth, we believe, is related to the
excess stickiness on the pellet surface, lower deformability, and above all the light weight of the
4-35

coal agglomerates. Accordingly, we decided to try two methods which are expected to reduce
the rapid coalescence.
The first method was aimed at reducing the stickiness of the pellet surface. As the particle
size becomes smaller the pellets formed out of that becomes smoother. This results in a larger
contact during collisions and in turn increases the possibility of coalescence. Hence, we tried
to study the effect of feed size distribution on the pelletization behavior of coal and found that
coarser distribution would reduce coalescence and result in spherical pellets. -It was found that
coarser distributions would reduce the raspberry type of growth. The second method was based
on the reduction in the coalescence mechanism by deliberately promoting layering mechanism.
We also found that coarse powders tend to layer more readily than finer coals. The fine coals
tend to nucleate and give rise to raspberry growth.
Our experiments indicate that the feed size distribution is critical in determining the growth
mechanism and the shape of the pellets. It may not always be possible to know the size
distribution of fine coal feed for pelletization, because it may come from any number of sources
such as (i) the mine site, (ii) the refuse pond, or (iii) the preparation plant. For example, the
coal fines recovered from the refuse ponds may contain as much as 80 percent -325 mesh
particles whereas the coal sample from a preparation plant may be somewhat coarser. If the coal
is already in the finer than desired form there is no way of getting a coarse feed. Under such
conditions layering will be the most appropriate method for prevention of raspberry .type growth.
In general, it is recommended to generate as coarse a size distribution as possible by blending
fine and coarse coals.
4-36

5.0 MATHJ3MATICAL MODELING OF COAL PELLETIZATION PROCESS
In Chapter 4 we have discussed the influence of such operating variables as feed moisture
content and additive content on the batch pelletization behavior of coal fines in a qualitative
manner. In this chapter we shall attempt to develop suitable mathematical models for describing
the coal pelletization kinetics.
5.1 Mathematical Modeling of Pelletization Process
The process of pelletization consists of tumbling moist fines in a rotating drum. Pellet size
distributions are determined at various stages of the pellet growth and the average pellet diameter
is then presented as a function of number of drum revolutions. Such a curve is called pellet
growth kinetic curve. Figure 5.1 shows a typical growth curve form an experiment involving
pelletization of taconite concentrates [54, 551. This curve shows a characteristic sigmoidal
shape. Kapur and Fuerstenau [3l] also observed such a shape with the pelletization of
pulverized limestone and suggested that the pelletization process could be recognized to proceed
through three stages of growth: (i) nuclei, (ii) transition, and (iii) ball growth region.
Earlier, careful tracer studies were conducted to identify the mechanisms of agglomerate
formation and growth and it was discovered [55] that the major mechanisms are (i) coalescence,
(ii) breakage, and (iii) layering which have been depicted in Figure 2.2. Based on physical
reasoning and extensive experimental observations, it is now agreed that the agglomerate growth
during the nuclei-growth region occurs primarily by coalescence and during the ball growth
region by breakage and layering. During the initial nuclei-growth stage, highly porous nuclei
are generated by pendular bonds between loosely held moist particles due to the presence of
water between the irregularly packed network of particles. On tumbling this moist charge in the

A I 1 1 I 1 0 E
E lo- a
L
-
TAC 0 NI TE 10.8X W T WATER
A 0.5% WT. BENTONITE w n - EXP - 0 1 0 2 A 3 0 4
0 500 1000 I500 2000 2500 NUMBER OF DRUM REVOLUTIONS, t
Figure 5.1. Typical pelletization curve for a taconite iron ore concentrate 1531.
5-2
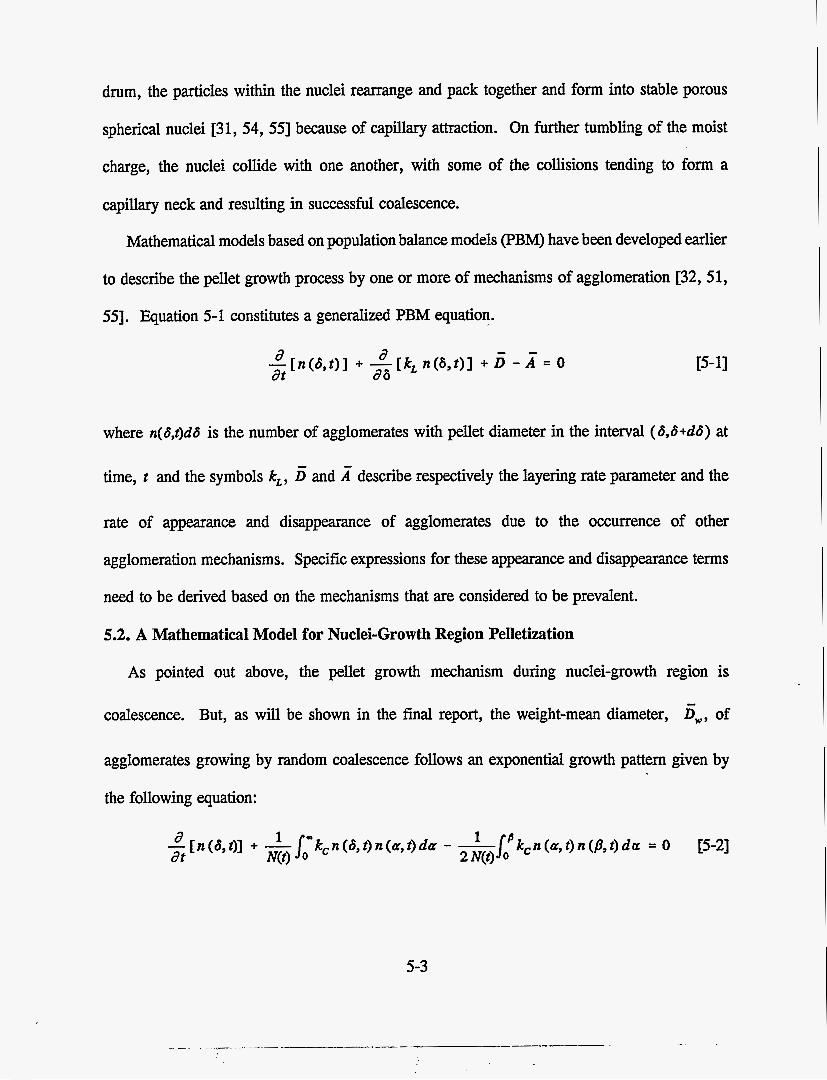
drum, the particles within the nuclei rearrange and pack together and form into stable porous
spherical nuclei [31, 54, 551 because of capillary attraction. On further tumbling of the moist
charge, the nuclei collide with one another, with some of the collisions tending to form a
capillary neck and resulting in successful coalescence.
Mathematical models based on population balance models (PBM) have been developed earlier
to describe the pellet growth process by one or more of mechanisms of agglomeration [32,51,
551. Equation 5-1 constitutes a generalized PBM equation.
d d at d6 -[n(6,?)] + -[kL n ( 6 , t ) l + 5 - A = 0 15-11
where n(6,t)dd is the number of agglomerates with pellet diameter in the interval (6,6+d6) at
time, t and the symbols kL, 5 and describe respectively the layering rate parameter and the
rate of appearance and disappearance of agglomerates due to the occurrence of other
agglomeration mechanisms. Specific expressions for these appearance and disappearance terms
need to be derived based on the mechanisms that are considered to be prevalent.
5.2. A Mathematical Model for Nuclei-Growth Region Pelletization
As pointed out above, the pellet growth mechanism during nuclei-growth region is
coalescence. But, as will be shown in the final report, the weight-mean diameter, E,,,, of
agglomerates growing by random coalescence follows an exponential growth pattern given by
the following equation:
5-3

where N(z) = J*n(a,t) dS and 63 = 2 + p3; and kc is the coalescence rate parameter. When 0
the coalescence rate parameter is not dependent on the size of agglomerates that are undergoing
coalescence, then the process is called random coalescence and the Equation 5-2 can be readily
solved [31, 32, 511 obtaining Equations 5-3 and 5-4 for the weight-size distribution and weight-
mean diameter of the agglomerates:
and
Ew = ZJO) exp( kct ) (5-4)
where W is the cumulative mass fraction of pellets smaller than the pellet diameter 6 (in mm).
It has been shown that size distribution given by Eq..5.3 is normalizable as shown in Eq. 5.5
in the following. In other words the cumulative size distribution becomes pseudo-time
independent. Such distributions are called self-preserving [31, 32, 511 which can be expressed
as
where r,~ = 6&.
Now we see that Equation 5-4 demands that the weight mean diameter changes exponentially
with time. An assessment of the results shown in Figures 5-2, 5-3 and 5-4, shows that the
Upper Freeport and Pittsburgh #8 coals follow this prediction fairly closely, while exhibit nuclei
type growth is not observed with the Bethlehem coal. Indeed our experimental observations
substantiate this observation in that the more hydrophobic anthracite particles do not go grow
by random coalescence.
5-4

Upper Freeport PA .
0 400 800 1200 1600 Drum Revolutions
Figure 5.2. Effect of feed moisture content on the batch pelletization kinetics of the Upper Freeport PA sample (same as Figure 4.6). The solid lines in the figure show the exponential type of growth predicted by random coalescence model of Eq. 5.2.
5-5

E E * ti- E (II
ii
16 I I I I I I I 1
t Pittsburgh No. 8 34% wt. Moisture Dodecane, Ib/ton
0 0.0 0 2.4
0 0 0 400 800 1200 1600
Drum Revolutions
Figure 5.3. Effect of dextrin addition on the batch pelletization kinetics (same as Figure 4.12).
5-6

16 I I I I I I I
Bethlehem Anthracite Moisture, wt. % -
0 30 - 0 32 A 34 .
- . -
t
0 400 800 1200 1600 Drum Revolutions
Figure 5-4. Effect of feed moisture content on the batch pelletization kinetics of the Bethlehem Anthracite sample (same as Figure 4-10).
5-7

In order to test the above theoretical predictions quantitatively, we tried to curve fit the
experimental data from Figures 5.2, 5.3 and 5.4 to Eq. 1 and found better than 98 percent
agreement with the theory for the Upper Freeport and Pittsburgh coals. The results are shown
in Figures 5.2 and 5.3 where the solid curves correspond to Eq. 5-4. As can be seen from
Figures 5.5 to 5.8 both the cumulative and the normalized distributions are in perfect agreement
with the theoretical predictions (solid lines in the figures) as required by Eqs. 5-4 and 5-5. We
also found that the agreement between the theory and experiment for the size distributions is
better than 95 percent. While the Upper Freeport and Pittsburgh coals showed agreement,
Bethlehem coal does not follow the random coalescence model as evidenced by Figure 5.4 for
the growth curve and Figure 5.9 for the pellet size distribution.
5.3 Breakage and Layering Process
It is expected that the breakage and layering mechanism is predominant during the ball-
growth region of a batch agglomeration process. We shall develop a mathematical model and
Compare the theoretical predictions with the experimental results.
Figure 5.10 shows specific interpretation of the breakage and layering process. In other
words, we assume that the agglomerates of a given size can either break completely into extreme
fragments or undergo a certain amount of abrasion. The resulting fines are expected to be
layered instantaneously onto the surviving pellets. Further, we propose that the rate of breakage
of agglomerates into small fines is inversely proportional to its diameter. In other words, the
smaller pellets are more likely to be crushed into extreme fines at a higher rate than the larger
ones. As per the layering, we make the standard assumption that the rate of increase of the
mass of an agglomerate is proportional to its exposed surface area which in turn signifies that
the rate of change of diameter of an agglomerate due to layering is constant. Making use of
5-8

0 4 a 12 Pellet Diameter, mm
16 20
Figure 5.5. Size distribution of Upper Freeport PA (as received) pellets. The solid lines are the predictions of the pellet size distribution by the random coalescence model (Eq. 5.3).
5-9

L Q) S ii
E n E
Y S Q)
Q)
ul .- P
E’
Q) > tu .I U
I
100 R I , I I I I
80 -
60 - -
40 - .
20 -
I I I I I I . I
0 1300 0 1500
4 8 12 16 20 0
Pellet Diameter, mm
Figure 5.6. Size distributions of pellets produced with weathered Upper Freeport PA coal sample. The size distributions are also in agreement with the random coalesecence model (Eq. 5.3).
5-10

L Q) E ii
b n E
Y c Q) 0
m .I z E’
Q) > m .I .L., - 3 0
Upper Freeport PA 28% wt. Moisture
Normalized Pellet Diameter
Figure 5.7. Normalized size distributions from the data reported in Figure 5.5 on Upper Freeport PA (as received) sample.
5-1 1
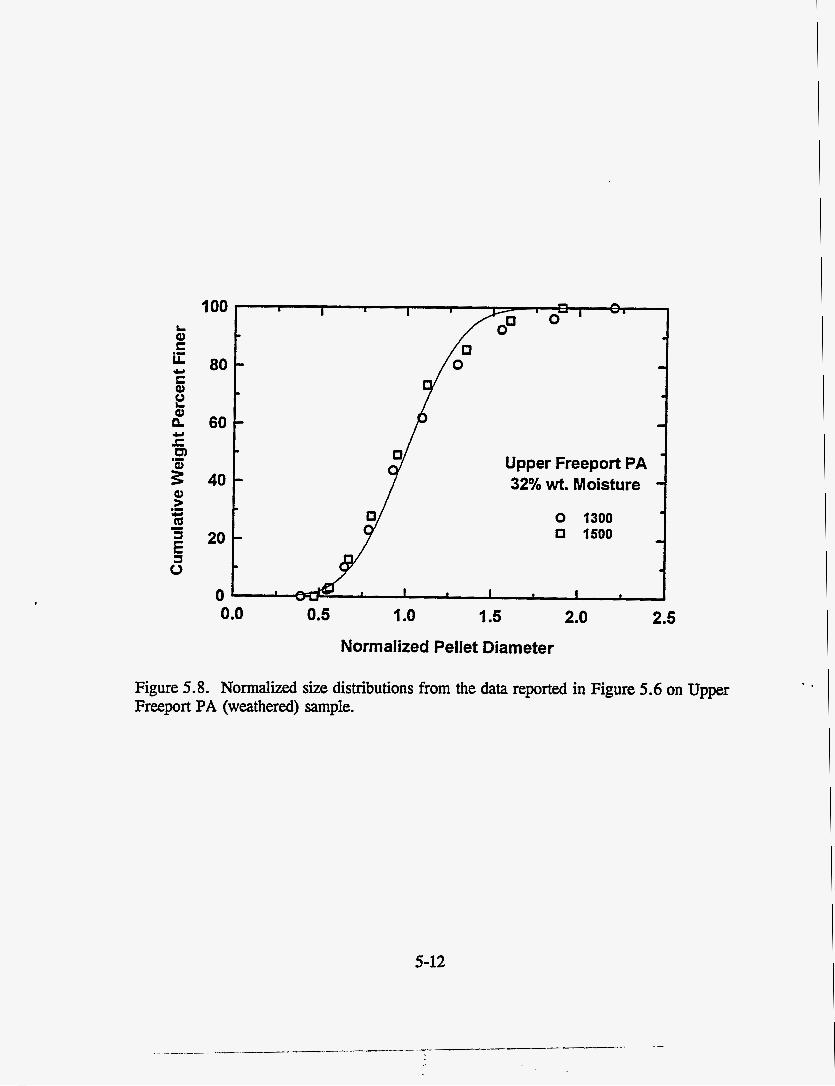
Upper Freeport PA 32% wt. Moisture
Normalized Pellet Diameter
Figure 5.8. Normalized size distributions from the data reported in Figure 5.6 on Upper Freeport PA (weathered) sample.
5-12

1
- 0 1 t I I I I I I
40t 2ol
A 7 J Bethlehem Anthracite 32% wt. Moisture
0 100 0 200 A 400 V 800
Normalized Pellet Diameter
Figure 5.9. Normalized size distributions of the pellets produced with Bethlehem anthracite sample. The figure does not show agreement with the random coalescence model.
5-13
, . . .- 7..

Bre 1 kage \I/
Layering
1
Figure 5.10. Schematic of breakage and layering mechanism.
5-14 .

these assumptions gives rise to the following model equation:
where n(b,t)d6 is the number of agglomerates with pellet diameter in the interval (6,6+d8) and
the symbols kB and kL describe the breakage and layering rate parameters respectively and have
the units of mm/sec. A general solution to the above equation does not seem possible.
Nevertheless, it is instructive to carry out a moment analysis of the model equation by making
use of Eq. 2.
MJt) = [os8rn(8yt)d8 (5-7)
From the definition of the moments, we note that M3 corresponds to the total mass of
agglomerating charge in the drum. Further, we recognize that the weight-mean diameter,Ew
and weight-diameter variance, ut are related to the total moments as follows:
and
2 M, uw(t) = - - M3
(5-9)
Multiplying both the right and left hand sides of Eq. 1 by 8' and integrate over all r , we obtain:
5-15

for r * 0 .
(5-10)
Since the total mass of the charge remains constant during a batch operation, we require:
= o - m3
dt
Then for the special case of r = 3 , we have from Eqs. 5 and 6:
- - dM3 - (-kB + 3kJM2 = 0 dt
or
(5- 1 1)
(5-12)
(5-13)
since Mz # 0. This is a very interesting physical requirement that the layering rate constant
must always be 1/3 of the breakage rate constant. There is no way, we would have guessed this
requirement with out the present mathematical model and analysis.
Thus from Eqs. 8 and 5, we obtain:
Further, combining Eqs. 3, 4 and 9 gives rise to:
5-16
(5-14)
(5-15)

and
do: dt
= o -
Solving Eqs. 10 and 11, we get:
and
(5-16)
(5- 1 8)
where to is the time at which the breakage and layering process sets in. These are two other
amazingly simple, elegant, but informative results.
Out of all the pelletization kinetic results we obtained, Bethlehem anthracite appears to be
governed by the breakage and layering mechanism. Figure 5.11 shows the conhation of these .
predictions where the weight-mean diameter, &, is found to increase linearly with time. The
constancy requirement for the weight-diameter variance implies that the weight-diameter
distribution must undergo a parallel shift as the growth occurs by breakage and layering and the
results shown in Figure 5.12 are in reasonable agreement. As a matter of fact, the condition
that the variance of the distribution remains constant clearly indicates that the size distribution
undergoes a lateral shift with time; the shift occurring due to the smaller agglomerates getting
crushed and layered onto the surface of the surviving pellets. Figure 5.13 shows that the size
distributions of pellets produced with the Bethlehem anthracite do undergo such a lateral shift.
This is a very impressive mathematical analysis and is in contrast to the breakage and
layering model proposed by Capes and Danckwerts (1965), where they assumed that only the
5-17

E E L" a Y
E" Q
E Q a
E
s 0 E .I
5
16 I I I I I I I
Bethlehem Anthracite
12 Moisture, wt. %
0 32 A 34
0 ' * I I I a I I I 0 400 800 1200 1600
Drum Revolutions
Figure 5.11. Linear growth rate of agglomerates produced With Bethlehem anthracite as predicted by Eq. 5.16.
5-18
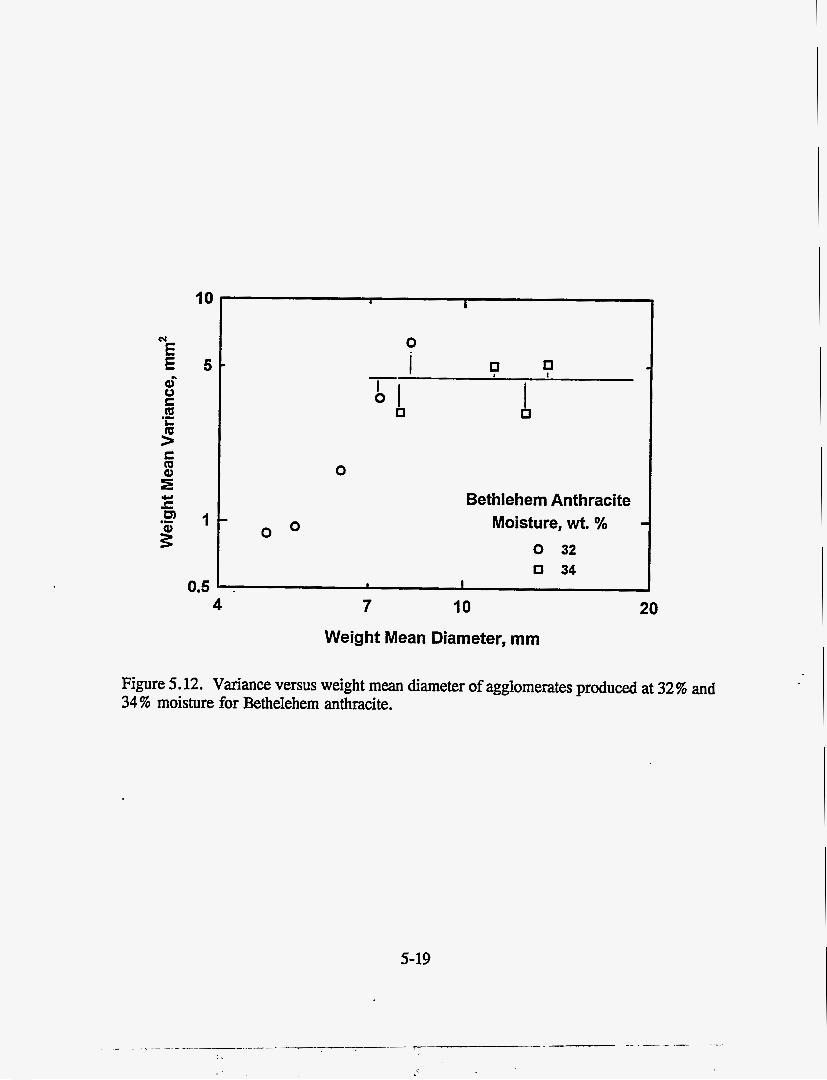
I C
5
1
I I
0
0.5 4
0
0 0
Bethlehem Anthracite Moisture, wt. % -
0 32 0 34
a I
7 10 Weight Mean Diameter, mm
20
Figure 5.12. Variance versus weight mean diameter of agglomerates produced at 32% and 34% moisture for Bethelehem anthracite.
5-19

Bethlehem Anthracite 34% wt. Moisture / / / A 1
0 A 0 50 0 100 A 400 n / / / cn
40
2ol 0
/ /
/ 0
A
/’ /
A 0 0 - 0 I , / u/* A ,
U I . I *
0 4 8 12 16 20 Pellet Diameter, rnm
Figure 5.13. Pellet size distributions for 32% moisture run with Behtlehem anthracite.
5-20

smallest agglomerates undergoes crushing and the resulting fragments are layered onto the
surviving granules. Under this assumption, they have shown that the granule size distribution
results in a self-preseming form. A detailed analysis of the granule size distributions (and their
moments) obtained with different samples of coal has been made and is shown that there exists
no self preserving form. Thus, we conclude that breakage and layering mechanisms during
agglomeration of such coals as Bethlehem anthracite occur with finite possibility of granules of
all sizes (not just the smallest of the population) subject to breakage and with simultaneous
layering of broken fragments on to the surviving agglomerates.
5-2 1

6.0 CoafAggfom: A DYNAMIC SIMULATOR FOR COAL PELLETIZATION
The unit operation of pelletization is intended to alleviate the problems associated with
the handling, storage and processing of fine coals which are being produced in increased
quantities. It is expected that there will be three steps in an industrial coal production system
[52] -- (i) feed preparation, (ii) pellet production, and (E) pellet curing. Feed preparation
step constitutes mixing of fine coals with desired additives (binders, conditioning agents,
fluxes, etc.) and bridging liquids (water, polymeric additives, etc.). The second and main
step of agglomerate production is taken place in balling circuits where desired size pellets
(commonly known as green pellets) are formed. The final step is where green coal pellets
are cured either by thermal drying or simple stockpiling.
It is commonly recognized that the agglomerate production step is fairly critical in that a
good quality green pellet is a prerequisite for a good quality cured pellet. Accordingly the
pellet production process needs to be better understood and better engineered. Results
presented in the earlier sections provide us an increased understanding of the kinetics and
modeling of the coal pelletization process. Based on the results of these studies and realizing
that a computer simulation system would be quite useful in engineering a coal pelletization
circuit, we have undertaken the development of CoalAgglom, a simulator for studying the
agglomeration of coal pelletizing circuits. This simulator has been adapted from CCBDnun,
a general purpose simulator that was developed for studying the dynamic behavior of closed
circuit balling drums reported earlier [74]. We have incorporated several substantial
improvements into Coa/Agg/orn which include making the simulator truly object-oriented,
6-1

introducing model correlations that are appropriate for coal agglomeration, and fixing run-
time errors that existed in the original versions.
In this section we -- (i) introduce and describe a generalized flowsheet for coal
pelletization, (ii) discuss highlights of the mathematid model that form the basis for
simulation, (iii) make a broad introduction to CoalAgg/om simulator, and finally (iv) present
a few case studies to demonstrate some of the capabilities of the simulator.
6.1 A Generalized Balling Drum Circuit
A conventional balling drum circuit is made up of a closed circuit arrangement of a
balling drum and a size separation unit, usually a roller screen (Figure 6.1). Depending on
the throughput capacity of the plant there can be several balling circuits running in parallel.
Past experiences with the closed-circuit balling circuits indicate that they exhibit a cyclic
behavior in the production of finished pellets and in the quantity of undersize agglomerates
recycled to the drum [S, 25, 741. Occasionally, it is found that surging can become so
severe that the pelletizing drum or the recycle belt can get overloaded leading to tipping of
these units. Only way overload problem can be solved is by manually shoveling and
removing the extra material in the drum or the recycle belts. Besides surging is found to
result in variation of the green pellet product. Accordingly, new design and operating
control strategies are desirable that would help minimize the inherent surging problem.
Evaluation of any new strategies in an industrial plant is an expensive proposition, especially
if the viability is not demonstrated. That is when computer simulation would be found most
useful in carrying out a preliminary assessment of any proposed strategies.
The approach that was taken with the CCBDnun simulation package was to generalize the
balling circuit layout and so as to provide maximum flexibility in its operation 1741. This
6-2
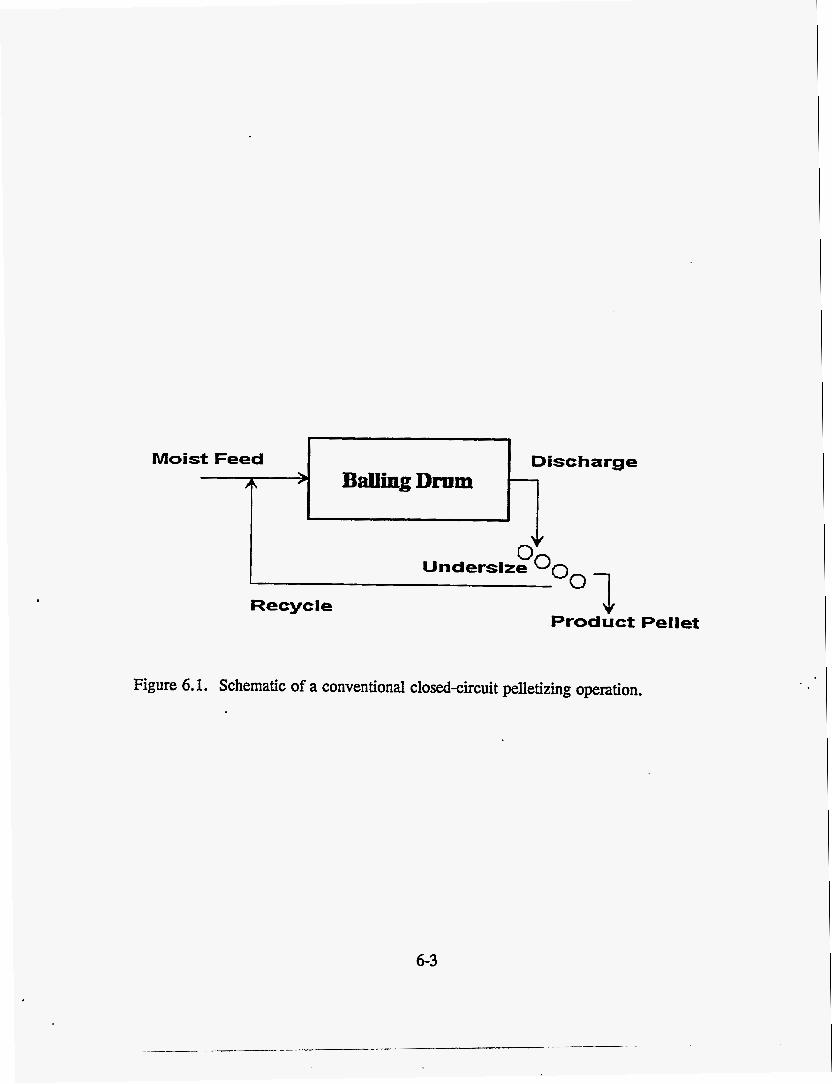
M o i s t Feed A >
Figure 6.1. Schematic of a conventional closed-chcuit pelletizing operation.
D i s c h a r g e BaUingDram -
6-3

involved introducing three additions to the conventional circuit: (i) a feed splitter, (ii) a
seeding drum, and (iii) an undersize pellet splitter. The same flowsheet was also adapted for
Coa/Agg/om. The generalized flowsheet is shown in Figure 6.2. The fist two changes are
to enable production of controlled quantity of seed pellets which are then added to the main
balling drum. The third change provides the flexibility of recycling only a desired portion
but not all of the undersize pellets to the main drum. The portion of recycle that is diverted
to stock pile can be brought back to the mixer where it is shredded and fed to the circuit.
This proposed flexible flowsheet could offer a practical solution to improve the
performance of the balling circuits and to produce green pellets with consistent quality.
Nevertheless, they must be carefully studied in a pilot or a full scale plant and the practical
and economic feasibility of such modifications must be established.
6.2 Mathematical Model for Simulation
Simulation of the pelletizing circuits requires - (i) relatively straight forward logic and
algebraic calculations for combining, splitting and directing the process streams and (ii) a
mathematical model for the pelletization process occurring in the seeding drum and the main
drum. We have adapted the agglomeration models developed by Sastry [52, 601 which
constituting the description of the evolution of the state of the pelletizing charge in time and
drum geometry space. The state of the pelletizing charge is described in terms of mass of
moist fines and size distribution of the pellets. The changes in the pellet size distribution and
mass of moist fines are quantified in terms of the following three agglomeration mechanisms:
- nucleation of moist fines into small seeds,
- coalescence of small seeds resulting in well formed seed pellets, and
- layering of moist fines onto the well formed seed pellets.
6-4

To Stock We MCtPelleteV
Figure 6.2. Flowsheet of a generalized balling drum circuit that is designed for flexibility of operation.
6-5

These three mechanisms are quantified respectively by the process parameters hS, kS and
E. These parameters are determined by the pelletizing nature of the feed material and by
such operating conditions as mixer speed, feed moisture, and feed rate.
It is assumed that in the seeding drum the pellet growth occurs only by nucleation and
coalescence mechanisms. In the main drum, all the three mechanisms are considered to take
place simultaneously but to different extents depending on the process parameters, the
amount of recycle (and new seeds from the seeding drum) and feed addition rate to the main
drum. Subsequently, size distribution of the discharge pellets from the drum is calculated
along with the size distribution and mass flow information on the undersize (recycle) and
product pellets.
6.3 An Overview of CoafAggfom
Coa/Agg/om is developed for IBM/PC-AT and compatible personal computers and runs
under Microsoft Windows 3.x with DOS 3.3 (or higher). Minimum recommended hardware
requirements are an Intel 80386-25 Mhz processor (with a math coprocessor) with 4 MB of
RAM, 80 MI3 capacity hard disk, a mouse, and an Enhanced Graphics Adapter (EGA) or a
Video Graphics Array (VGA) monitor. The software is designed by following advanced
object-orientation principles and is written in C+ + programming language. The system
offers modem graphic-user interface (CUI) consisting of pop-up menus, dialog boxes, along
with user interaction through a mouse. As such, the keyboard need be used minimally.
Also, such state-of-the-art features as on-line context sensitive help, automatic input data
validation, user-definable report generation are incorporated. Following paragraphs present a
brief walk through Coa/Agg/om so as to give a touch and feel of this advanced simulator.
6-6

To run Coa/Agg/om, one initiates a Windows session and double clicks the Coa/Agg/om
icon. After displaying an introductory screen, CoalAgglom presents the main menu (Figure
6.3). Each menu item offers a number of choices which are accessed through drop-down
submenus shown in Figure 6.3. The first item on the menu is File, the subitems offer such file
functions as input, save, and print. The Edit menu item enables data editing and exchange
within Coa/Agg/om system and with other Windows applications. Through the Inputs menu,
the user can choose to enter the relevant settings, parameters and data to run a Coa/Agg/om
simulation. Then by using the Simulation menu, the user can either perform a simulation in
a batch mode or an interactive mode, or review a previously run simulation. The results can
be viewed via the Outputs menu in the form of tables and graphs. The Help menu item allows
access to the help index and version number information of the running application. The help
feature is also included in all the Coa/Agg/om screens thus enabling the users to obtain context
sensitive help.
For example, when a user selects the Circuit Settings ... option under the Inputs menu
item, the window shown in Figure 6.4 would appear. This window presents a fill-in-the-form
type data entry dialog box for entering such relevant data about the circuit as dimensions of the
seeding drum, the main balling drum. The entire Coa/Agg/om data entry system is provided
with automatic data validation. After entering valid data into the Circuit Settings screen, the
user may want to input the material specifications for the simulation. This can be accomplished
either by clicking the OK button and entering Material Specifications ... option through the
Inputs menu or directly from the Circuit Settings screen by clicking Material> > button.
Either one of the actions takes the simulator to Figure 6.5.
6-7

I I I I I
save... U save As...
I
1 Beview I Import.,
Bnt... Printer Sefup,
I Operating CondItIonr J Intersdive...
Batch-
Figure 6.3. The main menu bar and the submenu lists from Coa/Agg/om.
6-8

mlc Edit Inputs Simulation Outputs Window Help
D ~ ~ c ~ c Y - a
Length. n Slope. deg 1-1
[pg@&gq ... ... .... .... .. ..... x
Figure 6.4. Fill-in-the-form type data entry dialog box for Circuit Settings.
6-9

Figure 6.5 shows an example of the data entry screen for Material Specifications in which
a range checking error message screen has appeared reporting that the user entered an out of
range value of 500 (presumably wanting to enter 5.00) for the specific gravity of the feed
material. The user can also obtain context sensitive help by clicking the Help button located in
each of the Coa/Agg/om screens. Further, the user can obtain the current flowsheet
configuration by clicking the Flowsheet button located in most of the CoalAgglom screens at
which time a drop-down box will present the flowsheet shown in Figure 6.2. The user would
enter all the necessary inputs and subsequently performs either a Batch or Interactive
simulation. This takes the user to the simulation panel shown in Figure 6.6.
As seen in Figure 6.6, the simulation panel is divided into five subwindows including
Operating Conditions, Simulation Controls, a table of Simulation Results, and two
dynamically scrolling plots of simulation results. The simulation run can be controlled by
pressing one of the control buttons in the Simulation Controls panel: Go, Restart, and End.
The simulation is initiated by clicking the Go button which turns into Pause which can
subsequently clicked to pause the run. At this time the Pause button changes to Continue, and
the user may change the operating conditions such as percent feed to main drum, feed moisture,
and screen size in the Operating Conditions window either by entering the desired value
directly or by clicking the spin buttons. The spin buttons allow the associated value to be
increment4 or decremented by pressing the up or down arrows respectively. After the desired
changes in the operating conditions are made, the user presses the Continue button in the
Simulation Controls subwindow to continue with the simulation. As the simulation is
performed the results are displayed in one tabular and two graphical windows with a scroll
effect. The simulation is carried out until the preset time limit is reached or when the user
6-10

'PIOC- Paradsrt
@ The value for the pelletizlng feed material spcdflc gravity should be between 1-00 and 6.00 I
Figure 6.5. The data entry screen for Material Specifications. The figure also shows the error message box resulting from range checking on the feed specific gravity.
6-1 1

Adda're.kgfi
X F m d t o S D d t u 1 - J
Trim HZU to SD dntm x mitt I".nnI Trim HZU lo main dim. X 1 1
X Urize to As- 1-1 Screen opening. m I-(
s / z G i i q kL 1-1
6.70 10.72 31.04 28.60 10.70
50 32.44 31.70 10.72 51 30.74 32.03 10.73 52 28.71 29.85 10.74 53 28.87 28.39 10.73 54 30.49 29.21 10.72 55 31.28 30.78 10.72 56 30.50 31.04 10
I I A L i i i
Figure 6.6. The Coa/Agg/om simulation panel showing the subwindows for operating conditions, simulation controls, and a table and two plots of simulation results. Plotted results correspond to the response of the balling circuit to a step change in feed moisture.
6-12

clicks on Pause and End buttons in the Simulation Controls window. The user can navigate
through the Outputs menu item to preview and print any one of the output tables and plots.
6.4 A Case Study
This section presents simulation results from a few case studies that are intended to
demonstrate some of the typical simulation capabilities of Coa/Agg/om. To keep the case
studies simple, the runs were made with the circuit settings and material specifications given
respectively in Figures 6.4 and 6.5. The operating conditions under which the simulation was
performed are listed in Figure 6.7, which is actually a listing produced by the
Outputs/Operating Conditions ... menu option. The simulation was started with a feed rate
of 30 tph (all to the main drum) and feed moisture of 30 percent by weight. The simulation time
is shown as number of cycles which corresponds to number of residence times in the main drum.
Results from the initial 58 cycles are shown in the two plots given in Figure 6.6. The plots
are for the normalized recycle mass which is circulating load to the main drum and for the
normalized product pellet mass. It can be seen from Figure 6.6 that by 30 cycles of sirnulation,
the process underwent two surge cycles with circulating load changing between about 180 and
300 percent and production rate fluctuating between 50 and 150 percent of feed addition rate.
This surging behavior will continue for ever if the feed moisture is maintained at 30 percent.
At 30 cycles, the feed moisture was changed to 32 percent and within about 15 cycles (which
correspond to about 8 minutes in the real time) the process became stable with circulating load
settling to about 100 percent. This portion of the simulation thus shows that the circuit can be
stabilized by properly choosing the feed moisture. The actual level of feed moisture will be
determined by such material properties as seeding and layering rate constants.
6-13

Faed F d AddtveXFd -TridZO%- Usze Scrn I Cy* Rate H2M: kg/t SdDr Sdng H a i n Rscy Opng -~
~~~ I 0 30.00 30.00 0.00 0 . 0 0 0 . 0 0 0 . 0 0 100 .0 10.00 *- at t i u 30 Feed moisture changed to 32.00% 30 30.00 32.00 0 .00 0 .00 0.00 0.00 100 .0 10.00
*- at tire 60 Circuit fsed rate changed to 35.00tph 60 35.00 32.00 0 . 0 0 0 .00 0 - 0 0 0 . 0 0 100 .0 10.00
*m.o at tire 00 U s i z e to Recycle changed to 80.00X 1 0 0 35.00 32.00 0 . 0 0 0 . 0 0 0 . 0 0 0 . 0 0 00 .0 1 0 . 0 0 *- at tire 85 U s i z e to Recycle changed to 05.00X
05 35.00 32.00 0.00 0.00 0 . 0 0 0.00 05 .0 10 .00 *- at tire 90 U s i z e to Recycle changed to 90.00% 90 35.00 32.00 0 . 0 0 0.00 0 . 0 0 0 . 0 0 90.0 1 0 . 0 0 *- at tire 95 U s i z e to Recycle changed to 95.00X 95 35.00 32.00 0 . 0 0 0 . 0 0 0 .00 0 . 0 0 95.0 10.00 *- at tire 100 Usize to Recycle changed to 100.00% 100 35.00 32.00 0 .00 0 .00 0.00 0.00 100.0 10.00 *- at tire 120 Circuit f e d rate changed to 40.00tph 120 40.00 32.00 0.00 0 . 0 0 0 . 0 0 0 . 0 0 100.0 1 0 . 0 0 *- at tire 130 F e d to SD drum changed to 10.00X 130 40.00 32.00 0 . 0 0 10.00 0 . 0 0 0 . 0 0 1 0 0 . 0 10.00
Figure 6.7. Listing of operating conditions that were used for the balling circuit case study.
6-14

At cycle time 60, the circuit feed rate was increased to 35 tph (Figure 6.7). The pellet
production rate results are shown in Figure 6.8. Again, the circuit becomes cyclic with
production rate fluctuating between 60 and 150 percent. A simple manual control strategy of
cutting down the feed back of undersize as recycle to the circuit to 80 percent and progressively
bringing back to 100 percent within a total of 20 cycles (10 minutes of real time) was tried.
Such control strategy is found to bring the system into control as seen in Figure 6.8.
At cycle time 120, circuit feed rate was again increased to 40 tph and the simulator response
is shown in Figure 6.9. As expected the system gets back to surging. While manipulating the
undersize return to the main drum does work, we wanted to show that tandem operation of a
seeding drum and a main drum also works effectively. At cycle time 130,lO percent of the feed
(i.e. 7 tph) was diverted to the seeding drum, and the discharge from the seeding drum is fed
to the main drum along with the remaining 90 percent feed (Le., 63 tph) to the main drum.
Within another 20 or so cycles the system again came to stable operation.
The present case study clearly demonstrates that it is possible to stabilize the balling circuits
and to increase their throughput by making appropriate changes in the operating conditions.
The fundamental reason for the circuit to become stable is that various strategies (adjusting
the feed moisture, manipulating the quantity of undersize pellets returned to the drum as recycle
or splitting the feed to generate and introduce fresh seed pellets) that were employed result in
controlling the relative Occurrence of new seed generation by the mechanisms of nucleation and
coalescence and of continued pellet growth by the mechanism of layering. A balance between
seed generation and pellet growth must be struck in order that the circuit stays stable.
We must also recognize that there can be some practical limitations in implementing the
modifications suggested above. For example, there can be limitation with the mechanical design
6-15

I O’ sb 80 1 ao
Figure 6.8. Response of the balling circuit - (i) to a step change in feed rate from 30 tph to 50 tph at cycle #60 and (E) to a manual control action involving amount of undersize fed back as recycle to the circuit so as to bring the circuit to stability.
6-16

I I I I I ProdM
I I 140 160
Time
Figure 6.9. Response of the balling circuit - (i) to a step increase in feed rate to 70 tph at cycle #120 and (ii) to the introduction of pre-formed seeds from a seeding drum at cycle #130 to bring the circuit to stability.
6-17

and trouble free operation of splitters for circuit feed and undersize pellets. Further, even
though the throughput rate can be increased in principle, in practice one must ensure that the
load capacities of the drums and the conveyor belts are within operating ranges.
6.5 Summary and Conclusions
In this section, we introduced Coa/Agg/om, a dynamic simulator for balling drum circuits.
The simulator incorporates state-of-the-art software features including graphic user-interface,
automatic data validation and context sensitive help and is easy-to-use. The simulator is based
on a mathematical model that was found to adequately describe the behavior of balling circuits.
After providing a walk through of the simulator features, a case study to demonstrate the
simulation capability of Coa/Agg/om was presented. The case study was intended to
demonstrate the flexibility built into the simulator so as to investigate the influence of different
operating strategies and the desirability of introducing a seeding drum into the circuit.
It is desirable to incorporate two main features - (i) automatic control system and (ii) online
optimization in the future versions of Coa/Agg/om . The first feature would enable offline
investigation and identification of new control strategies and the second feature is intended to
eventually integrate the Coa/Agg/om simulator with the pelletizing plant control computer
system for online optimization of the process.
A complimentary copy of the present version of the simulation program Coa/Agg/om can
be obtained by writing to the Principal Investigator at the address shown on the front page.
6-18

7.0 CONCLUSIONS AND RECOMMENDATIONS
Agglomeration by the unit operation of pelletization consists of tumbling moist fines in drums
or discs. Past experimental work and limited commercial practice have shown that pelletization
can alleviate the problems akociated with fine coals. However, it was recognized that there
exists a serious need for delineating the fundamental principles of fine coal pelletization.
Accordingly, a research program has been carried involving four specific topics: (i) experimental
investigation of coal pelletization kinetics, (ii) understanding the surface principles of coal
pelletization, (iii) modeling of coal pelletization processes, and (iv) simulation of fine coal
pelletization circuits. This final report summarized the major findings and provided relevant
details of this research effort. Following list includes a summary of our research findings and
a few recommendations for future studies on coal pelletization.
0
0
0
0
0
Past research on coal pelletization was quite limited and most of the work reported is of applied nature.
A batch experimental technique has been used to investigate the pelletization of fine coals. Three bituminous coals and one anthracite coal has been studied in this program.
Reproducibility of the experimental results was found to be a serious problem. Carehl experimentation helped improved the reproducibility, but it was often necessary to repeat the experiments several times and use the average results.
Moisture of coal fines is the most critical variable that determines the rate of pelletization. Also there exists a narrow range of moisture contents over which pelletization is possible. Outside this range, the fine coal feed tknds to be too dry or too wet for pelletization.
Addition of dodecane, a collector for coal flotation, is found to decrease pellet growth. This is attributed to poor efficiency of pellet formation and growth by coalescence due primarily to the increased hydrophobicity with the addition of dodecane. It is desirable to carry out a detailed study in ascertaining the role of collectors on pelletization.
0 Addition of dextrin which increases, the wettability of coal, resulted in accelerated rate of . pellet growth. It is felt that the structure of coal and such functional groups as carboxylic
7-1

and phenolic groups play a major role in determining the influence of dextrin on coal pelletization. A further study should be carried out in understanding these factors.
0 Addition of dodecane and dextrin did not influence the pelletization behavior of anthracite. It is anticipated that because anthracite is highly hydrophobic to begin with, addition of surface active agents such as dodecane and dextrin does not result in any noticeable change in its surface properties.
0 The three bituminous coals used in the work could be modeled with pellet growth by random coalescence. The process model predicted exponential pellet growth and self-preserving pellet size distributions. Experimental results are found to be in agreement with the model predictions.
In contrast, growth of anthracite pellets could be best modeled in terms of the Occurrence of breakage and layering type growth mechanism. The mathematical model predicted linear pellet growth along with mere shift in the pellet size distributions and the experimental results are in reasonable agreement.
0 Qualitative experiments carried out with fine coals showed that raspberry type growth becomes predominant as the coals get finer. The raspberry-shaped coal pellets were found to be fairly weak. It was observed that the raspberry type growth can be reduced by blending coarse coals into the fine coal feeds. A formal quantitative study would be helpful in providing guidelines for industrial operation of coal pelletizing systems.
Pelletization circuits are known to be inherently unstable in their operation. An interactive simulator called Coa/Agg/om was developed to carry out what-if, why-so and how-to type simulations of coal pelletization process. For example, the simulator can be very useful -- to understand the behavior of pelletization circuits, to identify suitable operating conditions, to investigate novel pelletizing circuit lay-outs and to develop new control strategies for stable operation.
0 Detailed process engineering experiments must be carried out in the future with a view to validate the mathematical models and to quantify such mechanisms of pellet formation and growth as nucleation, coalescence, layering, and breakage. These studies would then enable to quantitatively describe a given fine coal sample, to perform computer simulations that are most relevant to the fme coal under investigation and eventually to provide the necessary guidelines for the optimal design and efficient operation of coal pelletization circuits.
7-2

8.0 REFERENCES
1.
2.
3.
4.
5.
6.
7.
8.
9.
10.
11.
12.
Aplan, F. F., "How the Nature of Raw Coal Influences its Cleaning," Industral Practice of Fine Coal Processing, Society of Mining Engineers, 1988, pp. 99-111.
Baker, A. F., McKeever, R. E. and Deurbrouck, A. W., "Development and Demonstration of a Lignite Pelletizing Process," DE-82012007 DOE/RI-PMTC-12-82, 1982, pp. 43.
Balajee, S. R. and Iwasaki, I., "Adsorption Mechanism of Starches in Flotation and Flocculation of Iron Ores," Transactions of the Society of Mining Engineers, AIME, Vol. 244, 1969, pp. 401-406.
Calhoun, F. P., "Coal Pelletizing," Mining Congress Jouml , 1962, pp. 38-49.
Capes, C. E. and Danckwerts, P. V., "Granule Formation by the Agglomeration of Damp Powders, Part 1: The Mechanism of Granule Growth," Trans. Imtn. Gem. Engrs, Vol. 43, 1965, pp. T116-T124.
Capes C. E. and Danckwerts, P. V., "Granule Formation by the Agglomeration of Damp Powders, Part 2: The Distribution of Granule Sizes ," Trans. Imtn. Chem. Engrs, Vol. 43, 1965, pp. T125-T130.
Carveth, J. L. and Lang, W. A., "Coal Balling Experiments," Proceedings of the 2nd Biennial Conference of m e Institute for Briquetting and Agglomeration 19th Biennial Conference, 1951, pp. 81-91.
Carter, G. C. and Wright, F., "Analysis of Sintering and Pelletizing - Including Laboratory Investigations, 'I Advances in Extractive Metallurgy, IMM, London, 1968, pp. 89.
Charmbury, H. B., "Pelletizing Process Recovers Marketable Coal from Slurry," Coal Utilization, 1962, pp. 19-22.
Conkle, H. N., "Pelletizing/Reslurrying as a Means of Distributing and Firing Clean Coal, I' Final Report, DOE Project No. DE-AC22-90PC90166, September 1992.
Cross, M., "Mathematical Model of Balling Drum Circuit of a Pelletizing Plant," Ironmaking and Steelmaking, Vol. 4, 1977, pp. 159.
Diao, J. and Fuerstenau, D. W., "Characterization of the Wettability of Solid Particles by Film Flotation, 1. Experimental Investigation," Colloids and Su@ces @re-print), 1991.
8-1

13.
14.
15.
16.
17.
18.
19.
20.
21.
22.
23.
24.
25.
26.
Diao. J. and Fuerstenau, D. W., "CharacteIization of the Wettability of Solid Particles by Film Flotation, 2. Theoretical Analysis," Colloids and Su?j%ces @re-print), 1991.
Egan, H. N., "Pelletizing Fine Coal Recovered From Pumped Refuse," Mining Engineering, 1967, pp. 73-75.
Elmquist, S. A. et al. , "Developmental Research Study of Coal-Fines Agglomeration for Fixed-Bed Gasification - Final Report," DE-84001822 DOE/FE/05147 - 1488,1983, pp. 451.
England, C., Kushida, R. and Dacksla C., "Continuous Extrusion of Coal," Chem. Engng. Prog., 1958, pp. 92-94.
Fisher, R. A., "On the Capillary Forces in an Ideal Soil, Correction of Formulae given by W. B. Haines," J. Agricultural Science, Vol.16, 1926, pp. 492-505.
Fuerstenau, D. W. et al., "Coal Surface Controls for Advanced Fine Coal Flotation," Annual Report No. 1, Project No. DE-AC22-88PC88878, October 1, 1988 - December 31, 1989.
Fuerstenau, D. W. et al., "Assessing the Wettability and Degree of Oxidation of Coal by Film Flotation," Energy and Fuels, 2, 1988, pp. 237.
Fuerstenau, D. W. et al., "Estimation of the Distribution of Surface Sites and Contact Angles on Coal Particles from Film Flotation Data', Energy and Fuels, 4, 1990, pp. 34.
Goldstick, T. K., "A Survey of the Literature Pertinent to Iron Ore Pelletizing," in Agglomeration, Inter Science Publishers, New York, 1962 pp. 1067 - 1104.
Haley, K. M. and Apuli, W. E., "Pelletizing on a Horizontal Grate Machine," Agglomeration, Ed., W. A. Knepper, Inter Science, NY, 1962, pp. 931.
Handfield-Jones, R. V. R., "Factors Affecting the Balling of Coal," Ph.D. Thesis, 1976, University of Nottingham.
Hinkle, R. G., "Case History: Agglomeration of Coal Fines At A Fossil Fuel Power Station," Proceedings of the Institute for Briquetting and Agglomeration 19th Biennial Conference, Vol. 19, 1985, pp. 49-59.
Hutton, C. A. and Gould, R. N., "Cleaning Up Coal: A Study of Coal Cleaning and Cleaned Coal," Ballinger Publ. Cambridge, Massachusetts, 1982.
Ilmoni, P. A., "Prepared Discussion - Pelletizing on a Horizontal Grate Machine," Agglomeration, Ed., W. A. Knepper, Inter Science, NY, 1962, pp. 958.
8-2

27.
28.
29.
30.
31.
32.
33.
34.
35.
36.
37.
38.
39.
40.
Iwasaki. I. and Lai, R. W., "Starches and Starch Products as Depressants in SoapFlotation of Activated Silica From Iron Ores, I' Transactions of the Society of Mining Engineers, AIME, 1965, pp. 364-371.
Jenkinson, D. E., "Coal Preparation - the next 25 years," Mine and Quarry, Vol. 13(6), 1984, pp. 26-32.
Jones, G. S. and Meecham, D. B., "Pelletisation of Fine Coal: Part I," Mine and QWV, Vol. 16, NO. 7-8, 1987, pp. 43-47.
Jones, G. S. and Meecham, D. B., "Pelletisation of Fine Coal: Part II," Mine and Quarry, Vol. 16, No. 9, 1987, pp. 42-45.
Kapur P. C. and Fuerstenau, D. W., "Kinetics of Green Pelletization," Trans. AIME, Vol. 229, 1964, pp. 348-355.
Kapur, P. C., "Balling and Granulation," Advances in Chemical Engineering, Vol.II, Academic Press, New York, 1978, pp. 56-123.
Luckie, P. T. and Spier, T. S., "The Application of the Pelletizing Process to the U.S. Coal Industry," Proc. of the 9th Biennial Briqwtting Conference of the International Briquetting Association, Denver, Colorado, 1965, pp. 61-75.
Lyne, C. W. and Johnston, H. G., "The Selection of Pelletisers," Powder Technology, 1981, Vol. 29, pp. 211-216.
Matoney, J. P. and Sastry, K. V. S., "Conceptual Design and Economic Analysis of Coal Pelletizing Circuits," 20th Biennial Conference of the Institute for Briquetting and Agglomeration, Orlando, Florida, 1987.
Mehrotra, V. P., "Fine Coal Agglomeration," Ph. D. Thesis, University of California,Berkeley , 1980.
Mehrotra, V. P. and Sastry, K. V. S., "Pendular Bond Strength Between Unequal-Sized Spherical Particles," Powder Technology, Vol. 25, 1980, pp. 203-2141.
Mehrotra, V. P. and Sastry, K. V. S., "Pelletization of Coal Fines: State,of-the-Art," Agglomeration '81, 1981, pp. H36-H51.
Mehrotra V. P., Morey, B. and Sastry, K. V. S., "Oil Agglomeration Offers Technical and Economical Advantages," Mining Engineering, Vol. 32, No.81980, pp. 1230-1234.
Mehrotra, V. P. and Sastry, K. V. S., "Moisture Requirements and Role of Ash and Microporosity in Pelletization of Coal Fines," Powderechmlogy, Vol. 47, 1986, pp. 51-59.
8-3

41. Mehrotra, V. P. and Sastry, K. V. S., "Influence of Binders on the Pelletization Behavior of Coal Fines," , Trans. SME, Vol. 274 (1983), pp. .
42. Mezey, E. J., Seonmgwoo, M. and Folsom, D., "Fuel Contaminants - Vo1.4: Application of Oil Agglomeration to Coal Wastes," U.S. Environmental Protection Agency ReportNo. EPA - 600/7-79-0256, 1979.
43. Miller, J. D., Laskowski, J. S. and Chang, S. S., "Dextrin Adsorption by OxidizedCoal," Colloids and Sug?zces, Vol. 8, 1983, pp. 137-151.
44. Nelson, S. G. et al., "A Literature Review and Binder and Coal Selection for Research Studies on Coal Agglomeration," Department of Energy Report DOE/FE/O5 147--T3 DE82 011040, 1982.
45. Newitt, D. M. and Conway-Jones, J. M., "A Contribution to the Theory and Practiceof Granulation," Trans. Instn. Chem. Engrs., Vol. 36, 1958, pp. 422-442.
46. Nimerick, K. K. and Laflin, K. K., "In-Transit Wind Erosion Losses of Coal and Method of Control," Mining Engineering, Vol. 31, No. 8, 1979, pp. 1236-1240.
47. Onyemaobi, 0. O., "Factors Affecting the Pelletisation of Froth-Floated Coals," Powder Technology, Vol. 64, 1991, pp. 191-198.
48. Pietsch, W. et al, "Tensile Strength of Moist Agglomerates," I and EC Product Research and Development, Vol. 8, No. 1, 1969, pp. 58-62.
49. Rubio J. and De Leon, A. , "Agglomeration of Brazilian Coal Fines," Proceedings of the 20th Biennial Conference of the Institute for Briquetting and Agglomeration, 1987, pp. 225-244.
50. Rumpf, H. , "The Strength of Granules and Agglomerates," Agglomeration, Interscience, New York, 1962, pp. 379-418.
51. Sastry, K. V. S. , "Similarity Size Distribution of Agglomerates During Their Growth by Coalescence in Granulation or Green Pelletization", Int. J. Min. Proc., Vol. 2, pp. 187-294 (1975).
52. Sastry, K. V. S., "Mathematical Modeling of Pellet Growth Processes and Computer Simulation of Pelletizing Circuits, I' Agglomeration-81 , NMA, Nuremberg, Germany, 1981, pp. A122-A127.
53. Sastry, K. V. S. and Fuerstenau, D. W., "Laboratory Simulation of .Closed-Circuit Balling Drum Operation by Locked-Cycle Experiments," Trans. AIME, Vo1.258, 1975, pp. 335-340.
8-4

. 54.
55.
56.
57.
58.
59.
60.
61.
62.
63.
64.
65.
66.
~
Sastry, K. V. S. and Fuerstenau, D. W., "A Laboratory Method for Determining the Balling Behavior of Taconite Concentrates," Trans. SME. , Vol. 250, 1971, pp. 64-67.
Sastry, K. V. S. and Fuerstenau, D. W., "Mechanisms of Agglomerate Growth in Green Pelletization," Powder Techmlogy, Vol. 7, 1973, pp. 97-105.
Sastry, K. V. S. and Fuerstenau, D. W., "Kinetics and Process Analysis of Agglomeration of Particulate Materials, It Agglomeration '77, AIME, New York, 1977, pp. 381-402.
Sastry, K. V. S., and Fuerstenau, D. W., "Pelletization of Fine Coals," Final Report for Electric Power Research Institute, CS-2198, 1982.
Sastry, K. V. S. and Mehrotra, V. P., "Laboratory Investigations on Coal Pelletization," Proc. of the 16th Biennial Conference of the Institute of Briqwtting and Agglomeration, San Diego, California, Vol. 15, 1979, pp. 119-131.
Sastry, K. V. S. and Mehrotra, V. P., "Pelletization of coal fines: State-of-the-Art," in Agglomeration '81, Proceedings of the 3rd. Int. Sy. of Agglomeration, Nueremberg, West Germany, 1981.
Sastry, K. V. S. and Sastry, S. K., "Introducing CCBDrum, A Dynamic Simulator for Closed Circuit Balling Drum Operation," Proc. of ZBA, 1991.
Sastry, K. V. S. et.al., "Role of Binders during Pelletization of Iron Ore Concentrates-Pellet Growth and Strength Aspects, Agglomeration '85, ISWAIME, 1985, pp. 41-48.
Schubert, H., "Principles of Agglomeration," International Chemical Engineering, Vol. 21, NO. 3, 1981, pp. 363-377.
Schlussberycht, T. D. et al., "Agglomeration of Fine Coal for The Fixed Bed Gasification, Final Report, BMFT-FB-T-85-109 Bonn. FRG Bundesministerium fuer Forschung und Technologie. , 1985, pp. 287.
Solomon, J. A. and Enright R. J., "An Investigation into Powder Compaction with Particular Emphasis on Low Volatile Bituminous Coal," Proc. of the 8th. Biennial Conference of the IntematiOnal Briqwtting Association, Denver, Colorado, 1963, pp. 61-71.
Tsukamoto, M., Hijiriyama, M., Uemura, N. and Nishida, S., "Studies of Binders," Tetsu To Hagane, Vol. 69, 1983, S803.
Wakeman, J. S., "Method for the Evaluation of Data from the Batch Testing of Green Pellets," Trans. AIME, Vol. 252, 1972, pp. 83-86.
8-5

67. Watan, S., "The Pelletizing of Pulverized Coal," Bessatsu Kagaku Kogyo, Vol. 27, No. 17, 1983, pp. 91-101.
68. Wen, W. W. et al., "A Humic Acid Binder for Pelletizing of Fine Coal," Proceedings of the loth International Coal Preparation Congress, 1986.
69. Wen, W. W., "Fuel Agglomerates and Method of Agglomeration," US Patent No. 4,615,712, 1986.
70. Wen, W. W., Bergman, P. D. and Deurbrock, A. W., "A Humic Acid Binder for Pelletizing of Fine Coal," loth International Coal Preparation Congress, Edmonton, Canada, 1986.
71. Yang, G. C. C., "Interfacial Properties of Coal and Their Role in Coal Preparation," Ph.D. Dissertation, University of California, Berkeley, 1983.
72. Yoshida, Y. et al.,"Hot briquetting of Non-Caking coal," Proc. of the loth. Biennial Conference of the Institute for Briquetting and Agglomeration, Albuquerque, New Mexico, 1967, pp. 104-111.
73. You, Young-Soo, "The Interfacial Chemistry of Coal and its Relation to Coal Flotation," Ph.D. Thesis, University of California, Berkeley, 1983.
8-6
Related Documents