J. Fluid Me&. (1986), vol. 169, pp. 151-172 Printed in Great Britain 151 Unstable jet-edge interaction Part 2 : Multiple frequency pressure fields By RUHI KAYKAYOGLU AND DONALD ROCKWELL Lehigh University, Bethlehem, PA 18015 (Received 30 August 1984 and in revised form 11 September 1985) In Part 1 of this investigation we addressed the instantaneous pressure field at a leading-edge due to single frequency jet-edge interactions ; here we consider edge pressure fields and associated vortex interaction patterns at the edge having a number of (at least six) well-defined spectral components. Each of the spectral components is present along the entire extent of the approach shear layer upstream of the edge; the relative amplitudes of these components are preserved in the conversion process from the free (approach) shear layer to the surface pressure field, the key link being complex, but ordered patterns of vortex interaction at the edge. Moreover, the predominant spectral components can be reasoned on the basis of these visualized vortex interactions by considering the vortex array in the incident shear layer. The spectral character of the surface pressure field changes dramatically with edge location in the incident shear layer, or vortex array. If the edge is symmetrically located within the vortex array of the incident jet, a low-frequency component prevails due to large-scale vortex formation; however, with an asymmetrically disposed edge, the most unstable frequency of the jet dominates due to direct vortex impingement upon the edge, and the mean-square pressure amplitude (encompassing all spectral components) is double that of the symmetrical interaction. Irrespective of the type of interaction and the manner in which energy is partitioned between spectral components, the mean-square pressure due to the sum of all spectral components decays approximately as z-~ immediately downstream of the tip of the edge. However, each spectral component tends either to a maximum or minimum amplitude as the tip of the edge is approached, depending upon the class of vortex array-edge interaction. 1. Introduction Observation of self-sustaining oscillations of the edge-tone type were first observed by Sondhaus (1854), and since then there have been a wide variety of investigations including those of Powell (1961), in addition to those assessed by Karamcheti et al. (1969) and Rockwell & Naudascher (1979), with emphasis on the overall features of the oscillations such as frequency jumps occurring with variations of streamwise lengthscale and Reynolds number. Particular attention has been given to oscillations having a single, predominant frequency of oscillation. In practical situations involving impingement of a shear layer upon a leading edge, the shear flow may have a number of spectral components and, in the extreme case of turbulent flow, a wide range of them. The issue of how, and to what degree, the spectral distribution of shear-layer kinetic energy is transformed to surface-pressure fluctuations as the flow negotiates the edge is a problem of central importance in the areas of unsteady structural loading, flow-induced noise, and unsteady heat transfer. Part 1 of this investigation (Kaykayoglu & Rockwell 1986) addresses the simplest case of a single

Welcome message from author
This document is posted to help you gain knowledge. Please leave a comment to let me know what you think about it! Share it to your friends and learn new things together.
Transcript
J. Fluid Me&. (1986), vol. 169, pp. 151-172
Printed in Great Britain
151
Unstable jet-edge interaction Part 2 : Multiple frequency pressure fields
By RUHI KAYKAYOGLU AND DONALD ROCKWELL Lehigh University, Bethlehem, PA 18015
(Received 30 August 1984 and in revised form 11 September 1985)
In Part 1 of this investigation we addressed the instantaneous pressure field at a leading-edge due to single frequency jet-edge interactions ; here we consider edge pressure fields and associated vortex interaction patterns at the edge having a number of (at least six) well-defined spectral components. Each of the spectral components is present along the entire extent of the approach shear layer upstream of the edge; the relative amplitudes of these components are preserved in the conversion process from the free (approach) shear layer to the surface pressure field, the key link being complex, but ordered patterns of vortex interaction at the edge. Moreover, the predominant spectral components can be reasoned on the basis of these visualized vortex interactions by considering the vortex array in the incident shear layer.
The spectral character of the surface pressure field changes dramatically with edge location in the incident shear layer, or vortex array. If the edge is symmetrically located within the vortex array of the incident jet, a low-frequency component prevails due to large-scale vortex formation; however, with an asymmetrically disposed edge, the most unstable frequency of the jet dominates due to direct vortex impingement upon the edge, and the mean-square pressure amplitude (encompassing all spectral components) is double that of the symmetrical interaction.
Irrespective of the type of interaction and the manner in which energy is partitioned between spectral components, the mean-square pressure due to the sum of all spectral components decays approximately as z - ~ immediately downstream of the tip of the edge. However, each spectral component tends either to a maximum or minimum amplitude as the tip of the edge is approached, depending upon the class of vortex array-edge interaction.
1. Introduction Observation of self-sustaining oscillations of the edge-tone type were first observed
by Sondhaus (1854), and since then there have been a wide variety of investigations including those of Powell (1961), in addition to those assessed by Karamcheti et al. (1969) and Rockwell & Naudascher (1979), with emphasis on the overall features of the oscillations such as frequency jumps occurring with variations of streamwise lengthscale and Reynolds number. Particular attention has been given to oscillations having a single, predominant frequency of oscillation. In practical situations involving impingement of a shear layer upon a leading edge, the shear flow may have a number of spectral components and, in the extreme case of turbulent flow, a wide range of them. The issue of how, and to what degree, the spectral distribution of shear-layer kinetic energy is transformed to surface-pressure fluctuations as the flow negotiates the edge is a problem of central importance in the areas of unsteady structural loading, flow-induced noise, and unsteady heat transfer. Part 1 of this investigation (Kaykayoglu & Rockwell 1986) addresses the simplest case of a single

152 R. Kaykayoglu and D . Rockwell
frequency shear layer upon an edge, and characterizes the flow interactions in the leading-edge region in conjunction with the unsteady pressure fields. Herein, we extend consideration of this basic problem to the case of multiple-frequency shear layers incident upon the edge, whereby each of the dominant (primary) components of the shear layer is well defined and directly linked to the unsteady pressure field along the edge.
Even in a free, non-impinging shear layer there can arise a number of discrete components due to nonlinear effects (Miksad 1972). In general, as an unstable shear layer evolves in the streamwise direction, its spectral content changes from a single predominant frequency to several discrete frequency components, then eventually to a broader spectral content, and finally to a turbulence spectrum. External excitation at the shear-layer origin by loudspeakers at two different frequencies, say fa and f b , enhances production, and coherence, of additional spectral components nfa&mfb through nonlinear interaction between f a and f b (Miksad 1973). Since the shear layer is very long in the downstream direction, the discrete nature of these multiple-frequency components eventually disappears due to the onset of phase incoherence between components and associated broadening of the frequency spec- trum. However, in the event that the length of the shear layer in the streamwise direction is finite, due to eventual impingement or reattachment of the flow, it is possible to capture the coherent, multiple-frequency oscillation before significant disorganized behaviour sets in. Moreover, the shear layer-edge interaction in the impingement region forces the upstream region of the shear layer in a manner analogous to external excitation of the corresponding non-impinging shear layer (Rockwell 1983). Such a well-posed oscillation allows investigation of the problem of central interest herein: interaction of a multiple component instability wave with a leading-edge.
Finite-length shear layers appear in a variety of configurations (Rockwell 1983), and it has recently been established that at longer lengthscales and higher Reynolds numbers, a number of discrete frequencies may be present (Knisely & Rockwell 1982 ; Lucas & Rockwell 1984). These multiple frequencies within the shear layer are related to modulation of the most unstable frequency p of the shear layer by a subharmonic frequency component(s) P/n having its origin in the shear-leading (impingement) edge interaction. To date, however, the relationship between the unstable shear layer incident upon the leading edge, vortex interaction patterns a t the edge, and the spectral nature of the unsteady pressure field along the surface of the edge has not been established. I n particular, one may point to the following unresolved issues.
The unsteady shear layer incident upon the edge typically has a number of discrete spectral components; each component has a defined amplitude relative to the others. As the flow negotiates the edge, the relative amplitudes of these components may be modified due to the edge interaction process and one expects the dominant spectral components of the leading-edge pressure field to be related in some fashion to those of the incoming shear layer. This conversion process in the leading-edge region is linked to distortionlinteraction of vortical structures there which become more complex as the number of spectral components increases. The question arises as to whether these vortex interactions can be synthesized into basic types of patterns, thereby establishing a link between the spectral content of the incident shear layer, the vortex interaction pattern, and the surface pressure field along the edge.
I n turn, there remains the issue of how each of the spectral components of pressure varies with streamwise distance downstream of the tip of the edge, and the manner in which this variation is altered with the type of interaction of vortical structures a t the leading edge.
Unstable jet-edge interactions. Part 2 153
2. Experimental system and instrumentation The experimental system and techniques described in Part 1 were employed in this
study. By using a relatively long impingement lengthscale Llw = 7.5, it was possible to induce persistent, multiple-frequency oscillations, with the approach-jet structure and the jet-edge interaction having a much more complex character than that of Part 1. Consequently, the spectral analysis techniques described therein became particularly crucial for this phase of the investigation.
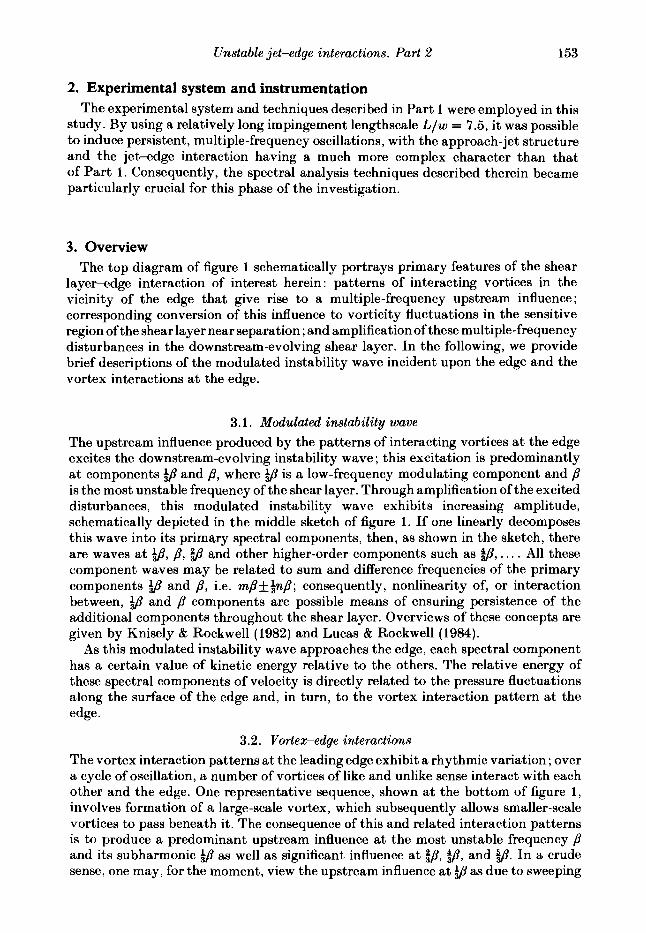
3. Overview The top diagram of figure 1 schematically portrays primary features of the shear
layer-edge interaction of interest herein : patterns of interacting vortices in the vicinity of the edge that give rise to a multiple-frequency upstream influence; corresponding conversion of this influence to vorticity fluctuations in the sensitive region of the shear layer near separation ; and amplification of these multiple-frequency disturbances in the downstream-evolving shear layer. In the following, we provide brief descriptions of the modulated instability wave incident upon the edge and the vortex interactions at the edge.
3.1. Modulated instability wave The upstream influence produced by the patterns of interacting vortices at the edge excites the downstream-evolving instability wave ; this excitation is predominantly at components @ and 8, where is a low-frequency modulating component and /3 is the most unstable frequency of the shear layer. Through amplification of the excited disturbances, this modulated instability wave exhibits increasing amplitude, schematically depicted in the middle sketch of figure 1. If one linearly decomposes this wave into its primary spectral components, then, as shown in the sketch, there are waves at $/3, /3, and other higher-order components such as tp , . . . . All these component waves may be related to sum and difference frequencies of the primary components $,!I and p, i.e. m/3+$/3; consequently, nonlinearity of, or interaction between, @ and /3 components are possible means of ensuring persistence of the additional components throughout the shear layer. Overviews of these concepts are given by Knisely & Rockwell (1982) and Lucas & Rockwell (1984).
As this modulated instability wave approaches the edge, each spectral component has a certain value of kinetic energy relative to the others. The relative energy of these spectral components of velocity is directly related to the pressure fluctuations along the surface of the edge and, in turn, to the vortex interaction pattern at the edge.
3.2. Vortex-edge interactions The vortex interaction patterns at the leading edge exhibit a rhythmic variation ; over a cycle of oscillation, a number of vortices of like and unlike sense interact with each other and the edge. One representative sequence, shown a t the bottom of figure 1, involves formation of a large-scale vortex, which subsequently allows smaller-scale vortices to pass beneath it. The consequence of this and related interaction patterns is to produce a predominant upstream influence at the most unstable frequency /3 and its subharmonic $ as well as significant influence at !/3, $, and $3. In a crude sense, one may, for the moment, view the upstream influence at as due to sweeping
154 R. Kaykayoglu and D . Rockwell
Upstream Vortex-dge
influence Conversion region
Modulated
wave (4 instability
+ . .
FIGURE 1 . Overview of central features of a multi-frequency jet-dge interaction showing: (a ) basic components of oscillation cycle; ( b ) decomposition of modulated instability wave ; (c) and decomposition of vortex-edge interactions giving rise to upstream influence.
of the large-scale vortex up past the edge and that at /3 due to vortices passing along the edge.
We now turn to details of the modulated instability wave, then to those of the vortex-edge interactions.
Unstable jet-edge interactions. Part 2 155
4. Modulated instability wave In the approach shear layer, i t is possible to define at least six discrete components.
Concepts of modulation of the upstream region of the shear layer, nonlinear interaction between spectral components, as well as 4- and G-spectra and eigenfunction amplitudes are addressed by Kaykayoglu (1984). Here we briefly note certain features of the multiple-frequency shear layer upstream of the leading edge.
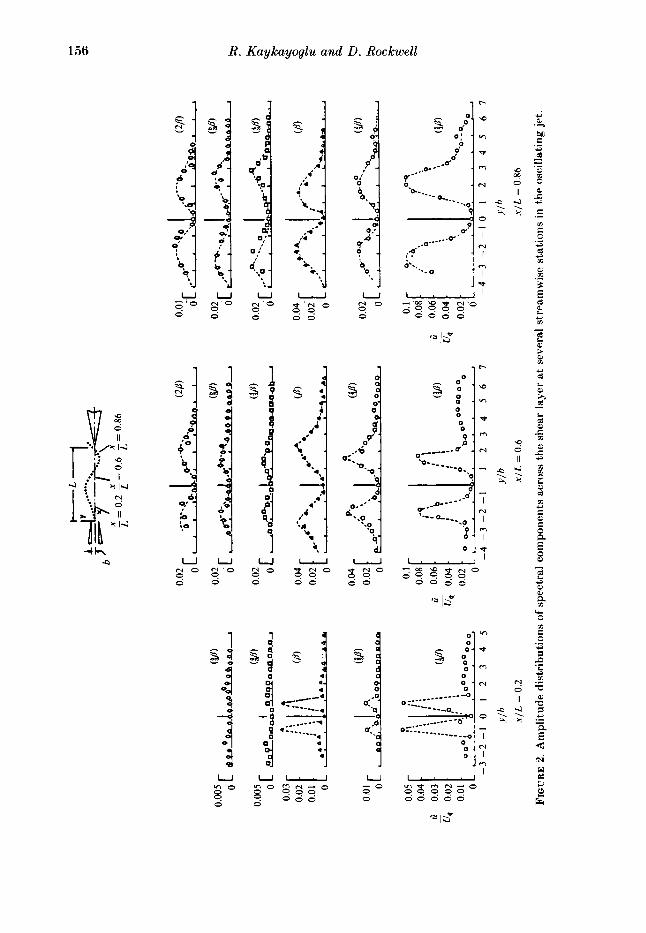
Figure 2 shows ti-distributions for the five predominant spectral components as a function of streamwise distance along the shear layer. Taking, for the moment, the amplitude of each of these components as the area under each respective 4 vs. y distribution, it is evident that the components /3 and $3 dominate at locations immediately downstream of separation ( z / L = 0.2) and upstream of the leading edge ; their difference frequency g has substantial amplitude as well.
If, in addition to the 4-distribution of figure 2, one considers the corresponding G-distributions, then the integrated kinetic energy of the fluctuations at a given streamwise station becomes
Ec,c = JII [($,'+($)']d(t).
As discussed by Kaykayoglu (1984), there is clear dominance of Ec,c at components p and $3 throughout the streamwise extent of the shear layer, substantial values of Ec,+ at their difference frequency 9, and significant values a t g, 3, and 28. Moreover, Kaykayoglu also notes that occurrence of all of these components is in accord with what is expected from nonlinearity and nonlinear interaction, i.e. m/3f?$ where m and n are integers.
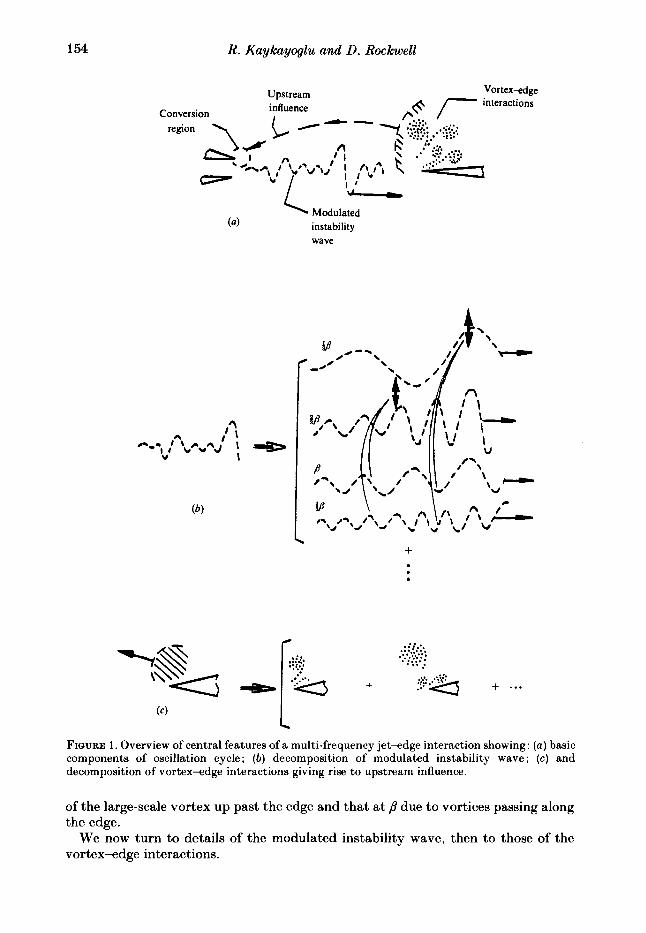
The correlation between the velocity fluctuations u' and v' for the predominant spectral components /3 and $3 (at a location just upstream of the leading edge) is given in figure 3. For both components, it is zero at the centreline. Moreover, in both cases, the gradient a(u")/ay at the centreline is large; consequently, one expects that a small displacement of the tip of the edge from the centreline would give rise to substantially different leading-edge pressure fields and vortex-edge interaction patterns, an issue which we address subsequently.
5. Vortex-edge interactions Central to the conversion process from the incident shear layer to the surface-pressure
fluctuations along the edge and the associated upstream influence of the edge region are the types of vortex interaction patterns that occur adjacent to the edge. As a result of extensive flow visualization, it is possible to discern a number of ordered patterns in the region of the edge. In this section, we first define the fundamental interaction mechanisms associated with a single concentration of vorticity incident upon the leading edge. Then, as a means of introduction to the interaction of an array of vortices with the edge, we consider an overview of idealized rows of vortices approaching the edge, and the trajectories of single vortices and groups of vortices within this idealized array. Thereafter, we consider the actual vortex field array-edge interactions and the spectral composition of the pressure fluctuations at the tip of, and along the surface of, the edge.
5.1. Fundamental interaction mechanisms at an edge On the basis of extensive flow visualization herein, as well as that of previous investigations of various types of periodic, single-frequency interactions (Ziada &
6 F L M 169
156 R. Kaykayoglu and D . Rockwell
-Ih
U 6. g o
9 U N O
0 9
L--' * N O
0 0 9 9
f
u- m o m r 4 - 0 0 0 0 0 8 0 0 0
U N O
8
U - 0
2
1 "
- I
I
I
N
m
l a I5
0 - 0
2 : 0
0
ci
N Z II
- I
I
I
N
ci
d I -
p!
It 0

Unstable jet-edge interactions. Part 2
8 , I 1 -
O---o--d- - -__- 1 --.--by
-0.003 -0.015 0 0.0015 0.003 -~ u'(4A u'(M)/ q
157
FIGURE 3. Variation of dimensionless velocity correlation across the shear layer at a location immediately upstream of the impingement edge ( x / L = 0.86) for predominant spectral components.
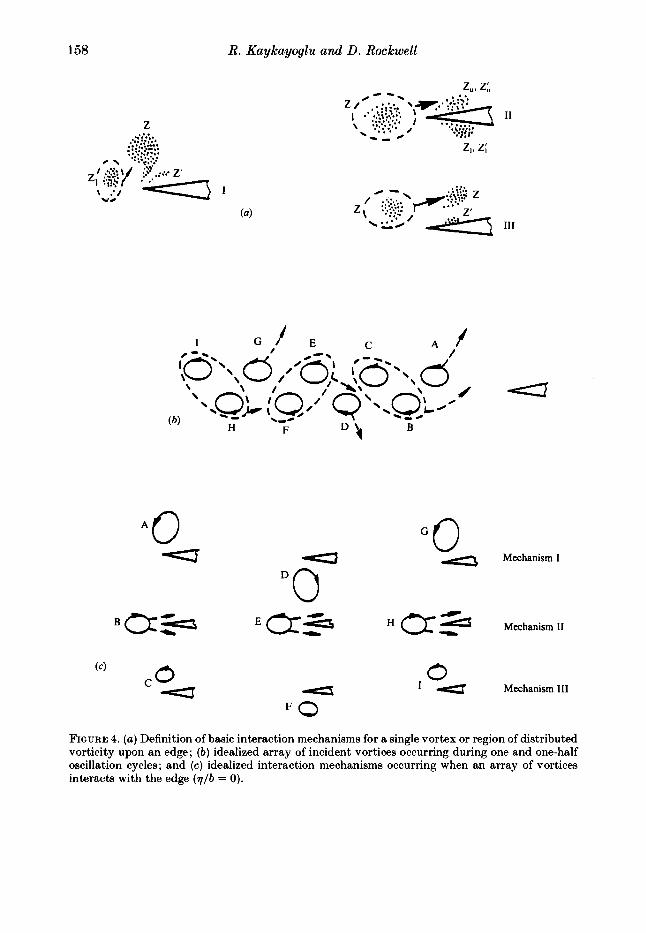
Rockwcll 1982 ; Kaykayoglu & Rockwell 1985, 1986), one may differentiate regions of unsteady vorticity fluctuations in the vicinity of an edge into the basic mechanisms designated as I, 11, and I11 in figure 4(a). In all cases, the incident region of vorticity Z retains its identity, though it may exhibit increased concentration or distension as the edge is negotiated. Moreover, all interactions will produce regions of secondary vorticity fluctuations Z of varying amplitude and concentration due to viscous effects.
Consider the incident vortex Z and its trajectory as shown in mechanism I; the upward sweeping and continued development of the incident vortex Z will produce a secondary separation from the tip of the edge. Depending upon the details of the interaction, this secondary separation may lead to either distributed or concentrated vorticity of opposite sense Z' relative to the incident vortex. Another type of interaction, designated as mechanism 11, involves splitting of the incident vortex Z into Z, and Z, and corresponding secondary fluctuations of vorticity ZL and Z;. Finally, in the case of mechanism 111, the incident vortex Z passes above (or below) the surface of the edge in such a manner that the region of secondary vorticity Z' is barely discernible.
6-2
158 R. Kaykayoglu and D . Rockwell
L
q Mechanism I
a ,=I Mechanism I1
0 (4 C U Mechanism 111
0 - I U
FO FIGURE 4. (a) Definition of basic interaction mechanisms for a single vortex or region of distributed vorticity upon an edge; (b ) idealized array of incident vortices occurring during one and one-half oscillation cycles ; and (c) idealized interaction mechanisms occurring when an array of vortices interacts with the edge ( T / b = 0).

Unstable jet-edge interactions. Part 2 159
Of course, for the multiple vortex patterns of interest herein, these fundamental interaction mechanisms do not occur in isolation; rather, each vortex is part of a group of vortices, and the system must be considered as a whole. Nevertheless, i t is useful to view these mechanisms with regard to locally induced pressure fluctuations, taking advantage of what we know about single-vortex interaction patterns from simultaneous visualization and pressure measurements of individual vortex-edge interactions herein, as well as related investigations of different types of single vortex-edge studies (Kaykayoglu & Rockwell 1985,1986), namely mechanism I that involves sweeping of the vortex about the tip of the edge will produce particularly large pressure fluctuations there. Mechanism I1 may produce substantial tip ampli- tudes, depending upon the precise details of the interaction. Finally, mechanism 111 does not yield large amplitudes at the tip; in fact, the peak pressure amplitude may be downstream of the tip along the surface of the edge. The fact that these general relations between the local interaction pattern and amplitude of the locally induced pressure are approximately valid for the multiple-vortex array was substantiated by simultaneously viewing the instantaneous pressure trace and the visualized interaction on the split-screen video.
In the following, we define the patterns of the vortices that eventually interact with the edge, then address the actual interaction.
5.2. Idealized rows of vortices approaching the leading edge and their trajectories at the edge
In describing the multiple-vortex pattern upstream of and at the edge, we employ the term ‘vortex’ in the liberal sense - an apparent concentration of vorticity corresponding to an agglomeration of dye; this interpretation is justified by the vorticity contours in the preliminary j e k d g e calculations of Ohring (1983). In the actual flow, the degree of concentration of vorticity of each vortex is changing with time. The length and time scales in our experiments were such that diffusion of vorticity was not significant. Here we are concerned only with the vortex trajectories and interactions.
For the type of interaction described herein, there are four or five discernible vortices in the leading-edge region at a given time. As the flow evolves, older vortices pass downstream and new ones are born in the unstable jet shear layer upstream of the edge. The actual process of vortex production and interaction will be described subsequently. However, at this point it is helpful to identify all the vortices that interact with the edge over period of time. To emphasize the rhythmic and repeatable nature of the oscillation, we consider a total of nine vortices representing one and one-half cycles of the interaction pattern (figure 4b) . Vortices which enter the edge interaction region with increasing time are designated successively as A, B, C, . . . . Vortices A, C, E, G , and I all have the same sense of vorticity, and likewise for vortices B, D, F, and H. The dashed lines indicate the relative trajectory of each vortex, or pairs of vortices. One sees that vortex A travels away from the centreline of the jet, and B and C successively move under it. This is followed by the mirror image involving vortices D, E, and F and repetition of the first interaction by G, H, and I. If one considers each of the vortices separately, then it is helpful to construct a matrix showing interaction of each vortex with respect to the edge (figure 4c) . In essence, A, D, and G show mechanism I described in the foregoing, B, E, and H show mechanism 11, and finally C, F, and I show an interaction corresponding to mechanism 111.
Since vortices tend to interact in groups of three, we expect that the pressure field
160 R. Kaykayoglu and D . Rockwell
along the surface of the edge will have components :P, where P is a reference frequency and n is an integer. We designate P to bc the inherently unstable frequency of the shear layer as predicted from spatial stability theory (Mattingly & Criminale 1971) ; in figure 4 ( b ) , it corresponds to the frequency of appearance of vortices in either the top or bottom row, i.e. A, C, E . . .in the top row or B, D, F. . .in the bottom row. From figure 4 ( b ) , it is evident that each third vortex in, for example, the top row grows to a large scale and is swept away from the edge (vortices A, G. . . ) . Consequently, along the upper surface of the edge, one expects a pronounced pressure fluctuation a t frequency $3, as well as higher-frequency components :/3 corresponding to the more frequency passage of vortices in the top row, i.e. A, B, C, . . . . The exact amplitudes of these higher components depends upon the local vortex-vortex and vortex-dge interaction described subsequently. At this juncture, however, we point out that, in succession, vortices A, a combination of B and C, and a severed portion of E travel along the upper surface giving rise to approximately the P-component, as well as additional components from the fact that the B-C combination is not completely coalesced, and the non-uniform spacing between successive vortices that travel along the upper surface. Similar reasoning holds for the bottom surface of the edge.
At the tip of the edge, however, we expect contributions at frequencies twice the values of the aforementioned $, . . . , components, i.e. a t !/I,. . . , due to the fact that the pressure there cannot discriminate whether a vortex trajectory is upward or downward. For example, the same tip-pressure perturbation will be induced by vortex A and vortex D. Consequently, the successive sweeping of A, D, G, . . .past the tip will induce a pronounced component a t fP. Similarly, A, B, C, D, E.. . and portions of certain of them past the tip will give rise to a component at 2,!l as well as other components due to non-uniform spacing between vortices. Before turning to the spectra, which give evidence for the occurrence of these components, we first consider the actual jekedge interaction.
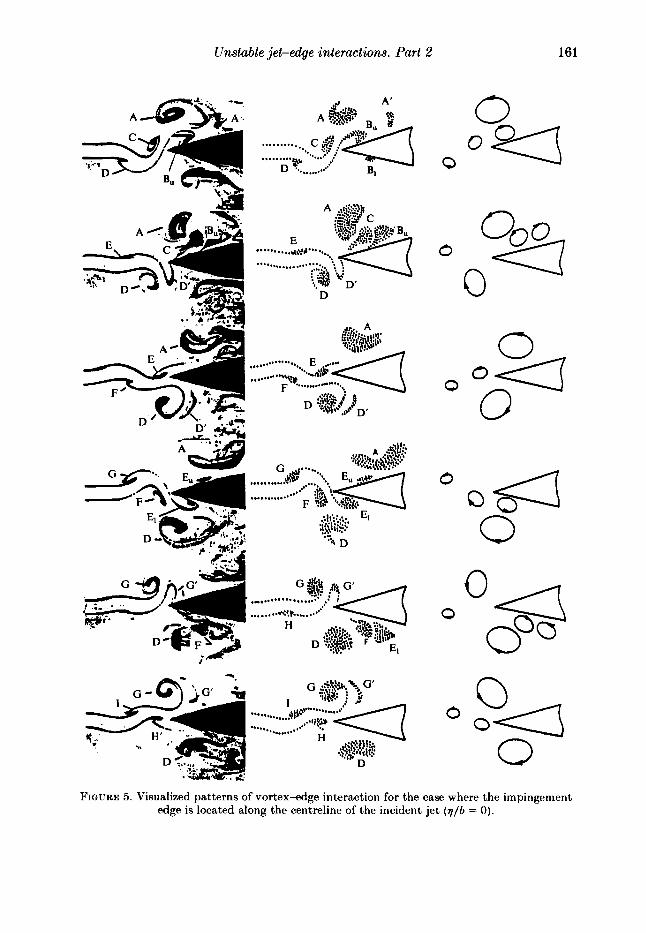
Figure 5 shows a typical oscillation cycle. The first column gives dye visualization, the second column schematics based on dye visualization over several cycles of oscillation, and the third column idealized vortex patterns; the scale of these idealized vortices represents the approximate extent of the dye concentration and is not necessarily proportional to the circulation of the vortex. In the first photo, a t the start of the oscillation cycle, the incident shear-layer vortex A has grown to a large scale and is about to sweep vortices B and C beneath it. Weakly concentrated vorticity A’ has evolved from sweeping of vortex A past the edge. (Of course, there will be a region of vorticity ( )‘ of opposite sense corresponding to each vortex past the edge; here we designate only those that are clearly visible in the photos.) Moreover, this first photo shows the severed vortex B, i.e. B, and B,, with the extent of B, being a small fraction of B,. In the second photo, vortices B, and C pass beneath vortex A, and continued roll-up of D produces a region of secondary vorticity of opposite sense D’. In the third photo, vortex D continues to grow, and the major share of E, i.e. El, and F have moved together beneath large-scale vortex D. As this occurs, t h e large-scale vortex G grows and a region of secondary vorticity G’ develops. Finally, in the sixth photo, we see that vortices H and 1 are about to pass between vortex G and the edge. By comparing these vortex patterns with the idealized vortex patterns in the right column and the trajectories of figure 4. the repetitive nature of the vortex trajectories and interaction is again emphasized. In the following. we attempt to link together thcsc pattcrns w i t h the primary features of the pressure fluctuations along the surface of thc leading cdgr.
Unstable jet-edge interactions. Part 2 161
A'
........... ... .........
D
...............
0
FIGURE 5. Visualized patterns of vortex-dge interaction for the case where the impingement edge is located along the centreline of the incident jet ( v / b = 0).
162 R. Kaykayoglu and D. Rockwell
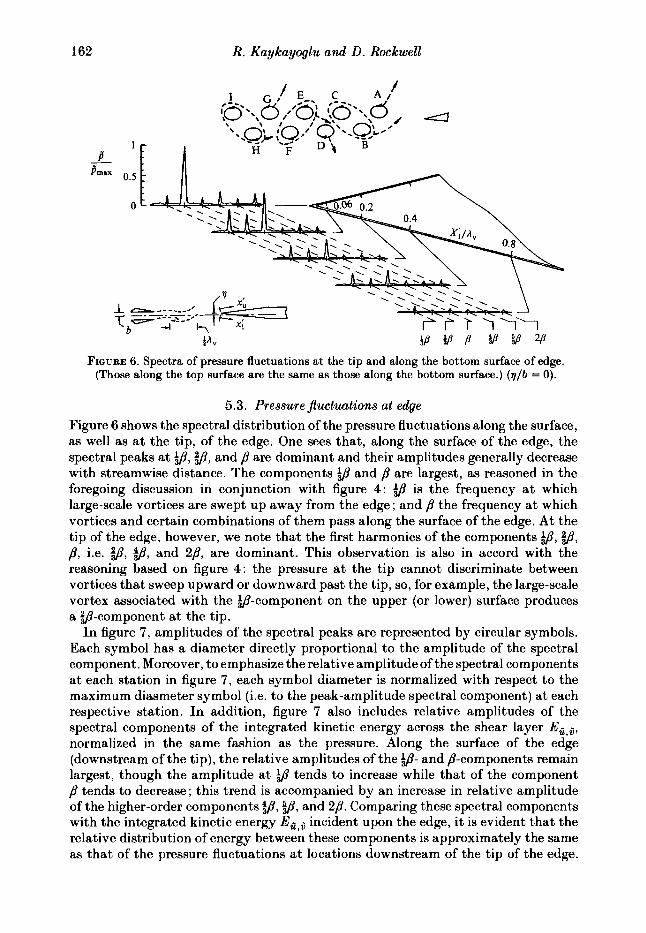
FIQURE 6. Spectra of pressure fluctuations at the tip and along the bottom surface of edge. (Those along the top surface are the same as those along the bottom surface.) ( q / b = 0).
5.3. Pressure jluctuations at edge Figure 6 shows the spectral distribution of the pressure fluctuations along the surface, as well as at the tip, of the edge. One sees that, along the surface of the edge, the spectral peaks at $?, 2#, and p are dominant and their amplitudes generally decrease with streamwise distance. The components and p are largest, as reasoned in the foregoing discussion in conjunction with figure 4: $3 is the frequency at which large-scale vortices are swept up away from the edge; and /3 the frequency at which vortices and certain combinations of them pass along the surface of the edge. At the tip of the edge, however, we note that the first harmonics of the components g, a&, p, i.e. 3, @, and 2p, are dominant. This observation is also in accord with the reasoning based on figure 4: the pressure at the tip cannot discriminate between vortices that sweep upward or downward past the tip, so, for example, the large-scale vortex associated with the $?-component on the upper (or lower) surface produces a 2#-component a t the tip.
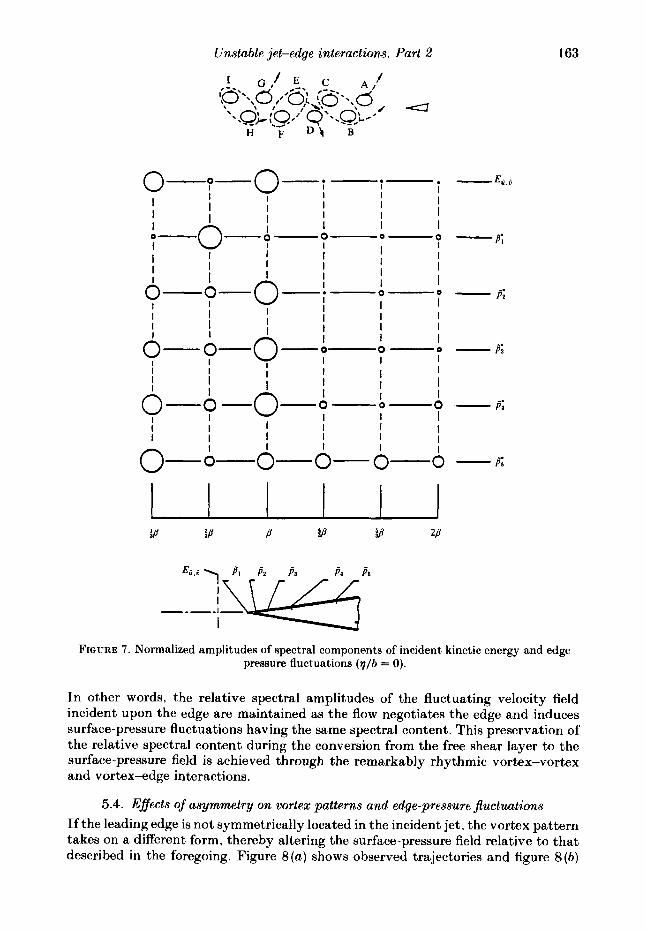
I n figure 7, amplitudes of the spectral peaks are represented by circular symbols. Each symbol has a diameter directly proportional to the amplitude of the spectral component. Moreover, to emphasize the relative amplitude of the spectral components a t each station in figure 7, each symbol diameter is normalized with respect to the maximum diasmeter symbol (i.e. to the peak-amplitude spectral component) a t each respective station. I n addition, figure 7 also includes relative amplitudes of the spectral components of the integrated kinetic energy across the shear layer E,,,, normalized in the same fashion as the pressure. Along the surface of the edge (downstream of the tip), the relative amplitudes of the $9- and P-components remain largest, though the amplitude at tends to increase while that of the component p tends to decrease; this trend is accompanied by an increase in relative amplitude of the higher-order components $3,5$, and 2p. Comparing these spectral components with the integrated kinetic energy Ecs6 incident upon the edge, i t is evident that the relative distribution of energy between these components is approximately the same as that of the pressure fluctuations at locations downstream of the tip of the edge.
Unstable jet-edge interactions, Part 2 163
0-0- n I I
I I
I I I
O - 0 I I
I I
I I
I I 1
I
I I
u-i-i-* 1 I I I I I I I I
0-. 0- I !
- " - I I I
I I I
I I I
I I I I
I I I I
I &i-o-e I
0-0- 1
I I I I I I I I I I
I I
I I
I I I
0-0 I 0- 0-0-0 I I I I I I I
&7-o- I 0 I
I I I I I I
I I I I I I I
I I I
I 1 I I I
I I I
1 I I I
O-O-O-~-O- 0
FIGURE 7 . Normalized amplitudes of spectral components of incident kinetic energy and edge pressure fluctuations ( v / b = 0).
In other words, the relative spectral amplitudes of the fluctuating velocity field incident upon the edge are maintained as the flow negotiates the edge and induces surface-pressure fluctuations having the same spectral content. This preservation of the relative spectral content during the conversion from the free shear layer to the surface-pressure field is achieved through the remarkably rhythmic vortex-vortex and vortex-dge interactions.
5.4. Effects of asymmetry on vortex patterns and edge-pressure jluctuations If the leading edge is not symmetrically located in the incident jet, the vortex pattern takes on a different form, thereby altering the surface-pressure field relative to that described in the foregoing. Figure 8 ( a ) shows observed trajectories and figure 8(b )

164 R. Kaykayoglu and D. Rockwell
(4
.O Mechanism 1
0 c 4 1 0 111
FIGURE 8. Idealized array of (a) incident vortices and ( b ) interaction mechanisms for the case where the edge is located off centreline of the incident jet, i.e. asymmetrical interaction ( q / b = 0.75).
the interaction mechanisms of the incident vortices for an edge offset q / b = 0.75, where b is the jet half-width. In the lower row, each vortex, i.e. B, D, F, H , has a slightly downward trajectory such that i t impinges directly upon the tip of the edge, whereas the upper row of vortices passes above the edge; in the upper row, A and G continue to roll-up as they sweep upward and away from the edge and C and I respectively pass beneath them. Moreover, vortex E rolls up but no smaller-scale vortex passes beneath it. Recalling that the frequency represents the rate of appearance of vortices in either the upper or lower row, it follows that the bottom row B, D, F, H will produce a particularly pronounced pressure amplitude a t p. On the other hand, the upper row produces: a component at +/3 due to vortices A, G ; C, I ; and E, K. There will also be a component a t due to successive passage of A, C, E, G, I ; and other components due to the non-uniform spacing between successive vortices. At the tip of the edge, there will be detectable contributions from both the upper and lower rows, most obviously a t 2p as well as at higher harmonics of other components.
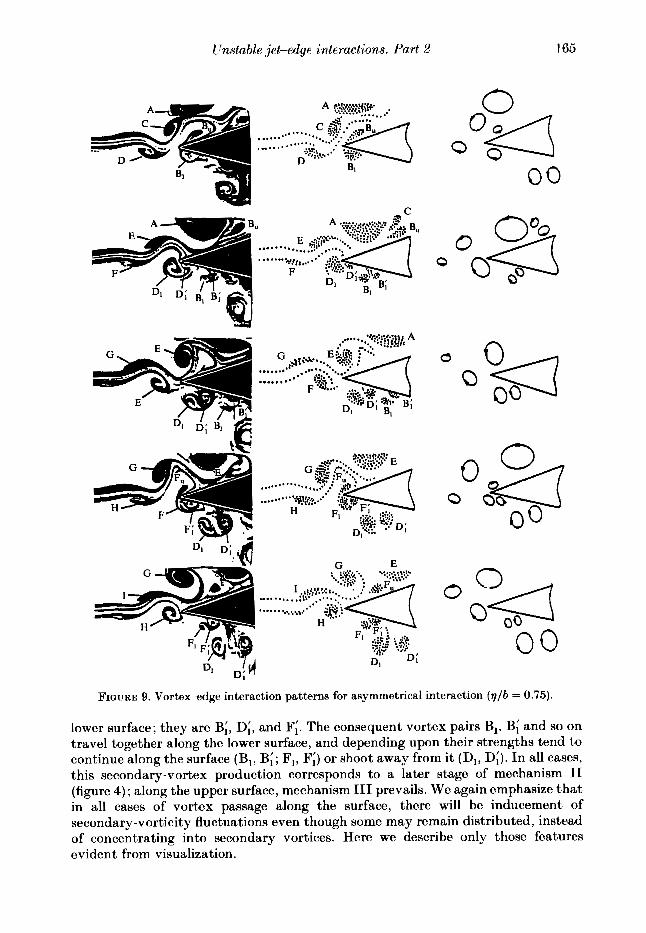
Figure 9 defines the actual jet-edge interaction. Vortices B, D, F, and H impinge directly upon the edge, and experience distension into portions passing above or below the edge, designated as mechanism I1 in figure 4; for B, for example, the upper and lower portions are B, and B,. The degree of distension varies from vortex to vortex; for D, the portion of it passing along the upper surface is barely discernible. However, there is evidence of secondary-vortex production due to travel of B,, D,, F, along the
165 Unstable jet-edge interactions. Part 2
G E
FIGIJRE 9. Vortex-dge interaction patterns for asymmetrical interaction ( y l b = 0.75).
lower surface; they are B;, D;, and F;. The consequent vortex pairs B,, B; and so on travel together along the lower surface, and depending upon their strengths tend to continue along the surface (B,, B;; F,, F;) or shoot away from it (D,, D;). In all cases, this secondary-vortex production corresponds to a later stage of mechanism I1 (figure 4) ; along the upper surface, mechanism I11 prevails. We again emphasize that in all cases of vortex passage along the surface, there will be inducement of secondary-vorticity fluctuations even though some may remain distributed, instead of concentrating into secondary vortices. Here we describe only those features evident from visualization.
166 R. Kaykayoglu and D . Rockwell
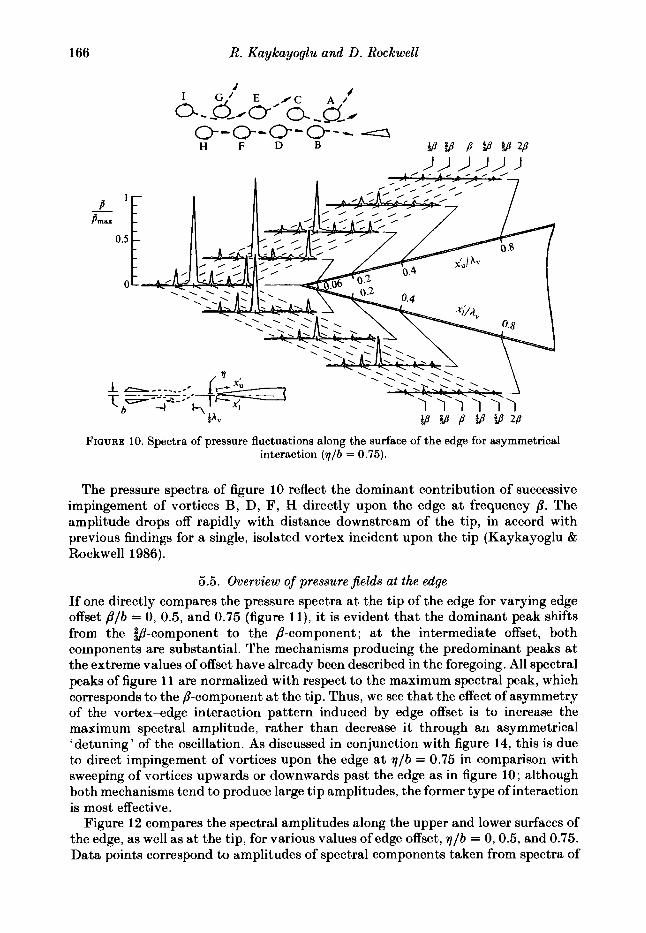
FIGURE 10. Spectra of pressure fluctuations along the surface of the edge for asymmetrical interaction ( v /b = 0.75).
The pressure spectra of figure 10 reflect the dominant contribution of successive impingement of vortices B, D, F, H directly upon the edge at frequency 8. The amplitude drops off rapidly with distance downstream of the tip, in accord with previous findings for a single, isolated vortex incident upon the tip (Kaykayoglu & Rockwell 1986).
5.5. Overview of pressure jields at the edge If one directly compares the pressure spectra a t the tip of the edge for varying edge offset P / b = 0, 0.5, and 0.75 (figure l l ) , it is evident that the dominant peak shifts from the @component to the ,&component; a t the intermediate offset, both components are substantial. The mechanisms producing the predominant peaks at the extreme values of offset have already been described in the foregoing. All spectral peaks of figure 11 are normalized with respect to the maximum spectral peak, which corresponds to the P-component at the tip. Thus, we see that the effect of asymmetry of the vortex-dge interaction pattern induced by edge offset is to increase the maximum spectral amplitude, rather than decrease i t through an asymmetrical ‘detuning’ of the oscillation. As discussed in conjunction with figure 14, this is due to direct impingement of vortices upon the edge a t q / b = 0.75 in comparison with sweeping of vortices upwards or downwards past the edge as in figure 10; although both mechanisms tend to produce large tip amplitudes, the former type of interaction is most effective.
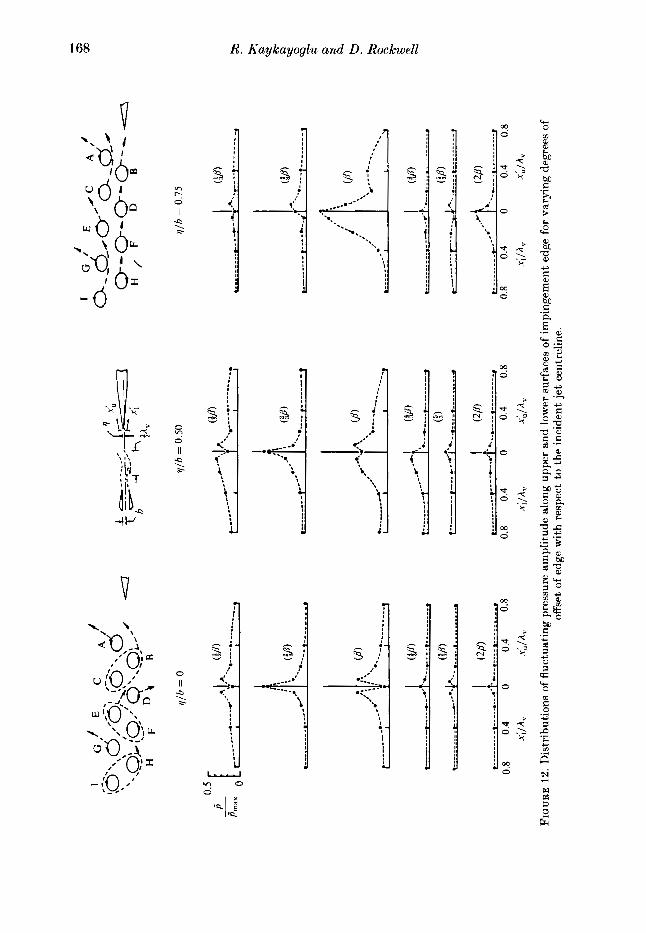
Figure 12 compares the spectral amplitudes along the upper and lower surfaces of the edge, as well as at the tip, for various values of edge offset, q / b = 0,0.5, and 0.75. Data points correspond to amplitudes of spectral components taken from spectra of
Unstable jet-edge interactions. Part 2 167
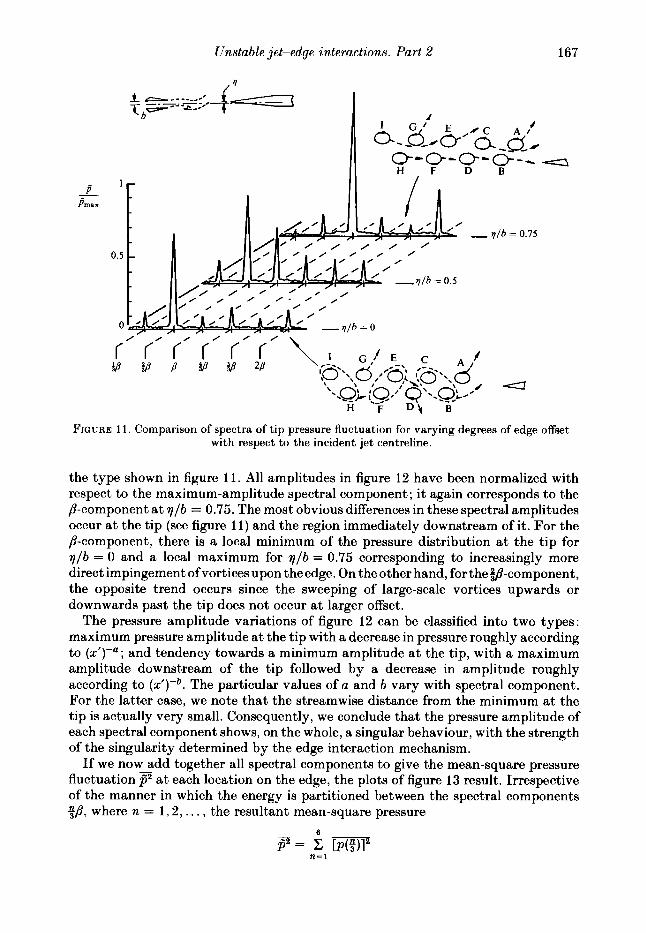
FIGURE 1 1 . Comparison of spectra of tip pressure fluctuation for varying degrees of edge offset with respect to the incident jet centreline.
the type shown in figure 11 . All amplitudes in figure 12 have been normalized with respect to the maximum-amplitude spectral component ; i t again corresponds to the P-component a t T / b = 0.75. The most obvious differences in these spectral amplitudes occur at the tip (see figure 11) and the region immediately downstream of it. For the P-component, there is a local minimum of the pressure distribution at the tip for T/b = 0 and a local maximum for q / b = 0.75 corresponding to increasingly more direct impingement ofvortices upon the edge. On the other hand, for thev-component, the opposite trend occurs since the sweeping of large-scale vortices upwards or downwards past the tip does not occur at larger offset.
The pressure amplitude variations of figure 12 can be classified into two types: maximum pressure amplitude a t the tip with a decrease in pressure roughly according to (z’)-“; and tendency towards a minimum amplitude a t the tip, with a maximum amplitude downstream of the tip followed by a decrease in amplitude roughly according to (x ’ ) -~ . The particular values of a and b vary with spectral component. For the latter case, we note that the streamwise distance from the minimum at the tip is actually very small. Consequently, we conclude that the pressure amplitude of each spectral component shows, on the whole, a singular behaviour, with the strength of the singularity determined by the edge interaction mechanism.
If we now add together all spectral components t o give the mean-square pressure fluctuation a t each location on the edge, the plots of figure 13 result. Irrespective of the manner in which the energy is partitioned between the spectral components !$, where n = 1 ,2 , . . . , the resultant mean-square pressure
n-i
v/h
= 0
.15
i1/h
= 0
v
/h =
0.5
0
I
P
FIG
UR
E
12. D
istr
ibut
ions
of
fluc
tuat
ing
pres
sure
am
plit
ude
alon
g up
per
and
low
er s
urfa
ces
of i
mpi
ngem
ent e
dge
for
vary
ing
degr
ees
of
offs
et o
f ed
ge w
ith
resp
ect
to th
e in
cide
nt j
et c
entr
elin
e.
Unstable jet-edge interactions. Part 2
0 0.4, 0.8 4 I A v
169
0 0.4 0.8 4ll&
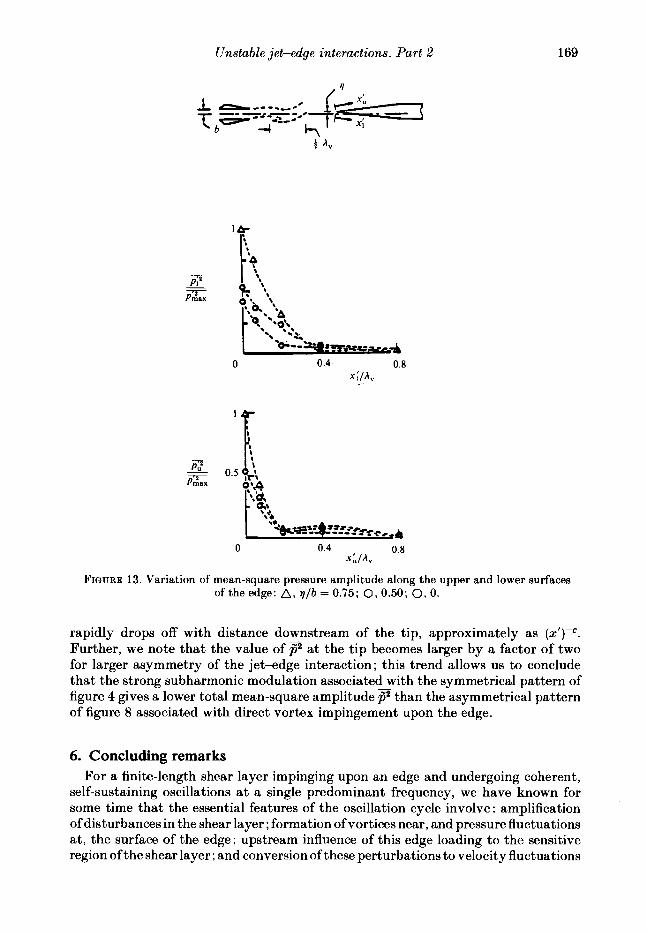
FIGURE 13. Variation of mean-square pressure amplitude along the upper and lower surfaces of the edge: A, y j b = 0.75; 0 , 0 . 5 0 ; 0 , O .
rapidly drops off with distance downstream of the tip, approximately as ( x ' ) -~ . Further, we note that the value of at the tip becomes larger by a factor of two for larger asymmetry of the jet-edge interaction; this trend allows us to conclude that the strong subharmonic modulation associated with the symmetrical pattern of figure 4 gives a lower total mean-square amplitude than the asymmetrical pattern of figure 8 associated with direct vortex impingement upon the edge.
6. Concluding remarks For a finite-length shear layer impinging upon an edge and undergoing coherent,
self-sustaining oscillations a t a single predominant frequency, we have known for some time that the essential features of the oscillation cycle involve : amplification of disturbances in the shear layer; formation of vortices near, and pressure fluctuations at , the surface of the edge; upstream influence of this edge loading t o the sensitive region of the shear layer; and conversion of these perturbations to velocity fluctuations
170 R. Kaykayoglu and D . Rockwell
near the separation edge, allowing subsequent amplification in the downstream region of the shear layer, etc. I n this investigation we have employed the same concept for the case of a multiple-frequency oscillation (see figure I ) , involving as many as six well-defined frequency components. Not only are the same spectral components present throughout the entire flow field and along the surface of the edge, but also their amplitudes relative to each other are approximately maintained throughout the oscillation cycle.
The unsteady shear layer approaching the impingement edge acts as the ‘amplifier’ for disturbances arriving a t its origin from the upstream influence of the edge. This shear layer has been termed a ‘modulated instability wave ’, in that one may view it as a classical instability wave arising from inherent instability of the shear layer undergoing modulation by a strong low-frequency component(s). The nonlinearity of this modulated wave, as well as possible nonlinear interaction between the predominant frequency components give a total of six well-defined frequency components. I n fact, all components are directly related to the sum and difference frequencies m/3 where $3 and /3 are the predominant components, suggesting that nonlinear interaction is a possible means of ensuring persistence of all six of these components along the entire extent of the shear layer. We have seen that as the modulated instability wave develops in the streamwise direction, the fluctuating kinetic energy of each of the six spectral components remains a t approximately the same relative amplitude with respect to the other components. That is, the /3- and !&components dominate along the entire extent of the shear layer, with substantial contributionsfrom the$3-component, and significant contributionsfrom the remaining spectral components. Since no vortex coalescence, or similar vortex-vortex inter- actions occur in the shear layer, there is no mechanism for redistribution of spectral energy from higher to lower components, as would be the case for an infinitely long shear layer. Because this redistribution does not occur and the same spectral components persist along the entire extent of the shear layer, grounds are established for a strongly coherent self-sustaining oscillation, provided that the shear layer-dge interaction and upstream influence also have the same predominant spectral com- ponents ; this is achieved by remarkable vortex-vortex and vortex-dge interactions in the impingement region.
As the unsteady shear layer interacts with the edge, there arise ordered patterns of vortices upstream of and at the edge. These vortex patterns provide the crucial link between the fluctuation energy of the incident shear layer and the pressure field along the surface of the edge. We have seen that the spectral content of the incident shear layer is the same as that of the surface-pressure fluctuations along the edge; moreover, the spectral content of both of them is compatible with predominant spectral components inferred from the visualized vortex-vortex and vortex-dge interactions.
Finally, the link between the unsteady events in the downstream region of the flow and shear-layer fluctuations in the upstream region of the flow is provided by the upstream influence ; it can be interpreted in terms of a fluctuating pressure field having its source at the edge. We have seen that the predominant spectral components /3, ?#, and are the same for the surface-pressure field near the tip of the impingement (leading) edge and the fluctuating shear layer near the upstream separation edge. In other words, the spectral content of the loading on the impingement edge is imprinted upon the sensitive region of the shear layer near separation to close the feedback loop of the oscillation cycle. An interesting avenue for further investigation involves determination of the instantaneous force fluctuations acting on the surface of the edge
Unstable jet-edge interactions. Part 2 171
at each of the spectral components. This involves acquisition of the streamwise phase variation of each of the components along the surface of the edge. Particular insight would be provided by an investigation relating the spectral nature of the surface- pressure fluctuations and the overall force on the surface of the edge to the energy fluctuations induced in the upstream region of the jet near separation. Herein, it is demonstrated that there is a well-defined relationship between the pattern of vortex-dge interactions and the spectral content of the pressure field as the transverse placement of the edge is varied ; conclusively establishing the relationship with the upstream region of the shear layer remains for study.
Particularly intriguing are the types of vortex-dge interaction patterns, the associated pressure fields, and how they vary with offset of the impingement edge in the incident shear layer. For the case where the edge is symmetrically disposed in the incident shear layer, i t is possible to visualize the source of the low-frequency modulating component as sweeping of vortices across the tip of the edge as they continue to roll-up into large-scale structures which, in turn, allows smaller-scale vortices to pass beneath them ; these small-scale vortices are linked to the higher- frequency components appearing in the pressure spectrum. When the edge is symmetrically located in the incident jet, or incident vortex array, the very tip of the edge sees pressure perturbations at twice the frequency as those on the upper or lower surface of the edge. Consequently, the first harmonics of the components dominant along the surface of the edge are most pronounced at the tip. This observation has important consequences for an edge inserted in any shear flow : near the tip, the predominant spectral components will be at much higher frequency than those along the downstream surface of the edge.
If the edge is not located on the line of symmetry of the incident jet, or of the incident vortex array, the loading a t the tip takes on a completely different form, since certain of the vortices impinge directly upon the tip of the edge rather than sweeping past i t as in the symmetrical case. In fact, the spectral component having the peak amplitude is about twice as large as that for the case of symmetrical interaction. Moreover, if one sums all the spectral components to give the mean-square (total) pressure fluctuation, i t is substantially larger for the asymmetrical interaction where the vortices impinge directly upon the tip of the edge. Intuitively speaking, one might expect that when asymmetry is introduced into the vortex array-dge interaction, the strength of the oscillation would be ‘detuned’ to give smaller pressure amplitudes along the surface of the edge, smaller upstream influence, and thereby small amplitudes of the incident shear layer. As we have seen, this is not the case due to the particular nature of the vortex-dge interaction. I n the broader sense, for a shear layer having an arbitrary arrangement of coherent structures, we expect that the localized interaction of the vortices with the edge will determine the amplitude of the edge loading and the overall strength of the oscillation.
We are pleased to acknowledge primary support of the Office of Naval Research (Contract No. N00014-83-K-0399) and supplemental support of the National Science Foundation (Grant No. MEA-8114352). I n earlier, related studies, the Volkswagen Foundation contributed to the development of certain of the instrumentation employed herein.
172 R. Kaykayoglu and D . Rockwell
R E F E R E N C E S
KARAMCHETI, K. , BAUER, A. B., SHIELDS, W. L., STEGEN, G. R. & WOOLEY, J. P. 1969 Some features of an edge-tone field. N A S A Headquarters Conference, Basic Aeronaut. Noise Research, NASA Special Publication, 207, pp. 275304.
KAYKAYOCLU, R. 1984 Interactions of unstable shear layers with leading edges and associated pressure fields. Ph.D. dissertation, Department of Mechanical Engineering and Mechanics, Lehigh University, Bethlehem, Pennsylvania.
KAYKAYOCLU, R. & ROCKWELL, I). 1985 Planar jet-edge interactions: flow mechanisms and instantaneous pressure fields. J. Fluid Mech. 156, 43-61,
KAYKAYOCLU, R. & ROCKWELL, D. 1986 Unstable jet-dge interaction. Part 1 . Instantaneous pressure fields a t a single frequency. J. Fluid Mech. 169, 125-149.
KNISELY, C. & ROCKWELL, D. 1982 Self-sustained low-frequency components in an impinging shear layer. J . Fluid Mech. 116, 157-186.
LUCAS, M. & ROCKWELL, D. 1984 Self-excited jet: upstream modulation and multiple frequencies. J. Fluid Mech. 147, 333-352.
MATTINCLY, G. E. & CRIMINALE, W. 0. 1971 Disturbance characteristics in a plane jet. Phys. Fluids 14, 2258-2264.
MICHALKE, A. 1965 On spatially growing disturbances in an inviscid shear layer. J. Fluid Mech.
MIKSAD, R. W. 1972 Experiments on the nonlinear stages of free shear layer transition. J . Fluid Mech. 56, 695-719.
MIKSAD, R. W. 1973 Experiments on nonlinear interactions in the transition of a free shear layer. J. Fluid Mech. 59, 1-21.
OHRINC, S. 1983 Numerical solution of an impinging jet flow problem. Presented at the Fifth GAMM Conference, Rome, October, 1983. David Taylor Naval Ship Research and Development Center, Maryland.
POWELL, A. 1961 On the edgetone. J. Acoust. Soc. Am. 33, 395409. ROCKWELL, D. 1983 Oscillations of impinging shear layers. AZAA J. 21, 645-664. ROCKWELL, D. & NAUDASCHER, E. 1979 Self-sustained oscillation of impinging shear layers. Ann.
SONDHAUS, K. 1854 Uber d. beim Austreten d. Luft enstehenden Tone. Annalen der Physik und
ZIADA, S. & ROCKWELL, D. 1982 Vortex-leading edge interaction. J. Fluid Mech. 118, 7S107.
23, 521-544.
Rev. Fluid Mech. 11, 67-94.
Chemie 91, 2 14-240.
Related Documents