University of Michigan Health System Program and Operations Analysis Analysis of the Central Intake Process at University of Michigan Home Care Services Final Report To: Kenneth Bandy, Director, Home Care Services Mandy McKay, Project Manager, Quality & Compliance Mark Van Oyen Ph. D., Associate Professor – Industrial and Operations Engineering 481 From: Industrial and Operations 481 Group 6, Home Care Services Intake Analysis Andrew Gutting Jing Ma Nikita Vardya Ilir Xholi Date of Submission: April 23, 2010

Welcome message from author
This document is posted to help you gain knowledge. Please leave a comment to let me know what you think about it! Share it to your friends and learn new things together.
Transcript

University of Michigan Health System
Program and Operations Analysis
Analysis of the Central Intake Process at University of Michigan Home Care Services
Final Report
To: Kenneth Bandy, Director, Home Care Services Mandy McKay, Project Manager, Quality & Compliance
Mark Van Oyen Ph. D., Associate Professor – Industrial and Operations Engineering 481
From: Industrial and Operations 481 Group 6, Home Care Services Intake Analysis Andrew Gutting Jing Ma Nikita Vardya Ilir Xholi Date of Submission: April 23, 2010
2
Table of Contents Executive Summary .........................................................................................................................3
Introduction ..............................................................................................................................7
Background ......................................................................................................................7
Goals and Objectives ......................................................................................................................8
Key Issues ..............................................................................................................................8
Project Scope ..............................................................................................................................9
Current Situation .........................................................................................................................9
Approach and Methodology .....................................................................................................10
Results ............................................................................................................................11
Simulation ............................................................................................................................32
Conclusions .........................................................................................................................33
Recommendations/Action Plan .................................................................................................34
Expected Outcome .........................................................................................................................36

3
Executive Summary The transition of hospital patients to the home frequently requires the utilization of home care services. The University of Michigan Hospitals & Health Centers (UMHHC) services patients who require home care services upon discharge from the hospital, such as home medical equipment, home infusion therapy, or home nursing care. These services are provided by three different providers within University of Michigan Home Care Services (UMHCS): Michigan Visiting Nurses (MVN), HomeMed, and MedEQUIP. Currently, little information exists about the patient intake referral process in UMHCS. The purpose of this project is to gain an understanding of the current intake process and evaluate the process efficiency. Several conclusions and recommendations regarding the amount of time staff members spend processing referrals are presented below. Background UMHCS is comprised of five total health care providers, which will be referred to as departments. These are the following:
• Michigan Visiting Nurses (MVN) • HomeMed • MedEQUIP • Wheelchair Seating Services • Michigan Visiting Care
Each provider has dedicated referral processing areas and staff for processing referrals. The team analyzing the current situation focused on three departments: MVN, MedEquip, and HomeMed. The staff members across these departments perform similar tasks using different methods, which creates waste in the process, especially for those patients who require multiple types of care or care from more than one department.
Methodology
The team divided the project into four stages: observation and interviews, data collection, data analysis, and recommendations. During the first phase, data collection, the team interviewed and observed the intake referral staff and supervisors for the three departments. The MedEQUIP staff is separated into General Intake staff and Continuous Positive Airway Pressure/Bi-level Positive Airway Pressure (CPAP/BiPAP) staff. The team then created data collection sheets for a Beeper Study, Ladder Log Study, and Task Volume Study, which are explained in the following sections. A summary of participating staff members appears in the table below.

4
Table 1: Staff Levels MVN 4 HomeMed 4 MedEQUIP - Gen. Intake 11 MedEQUIP - CPAP/BiPAP 4 Grand Total 23
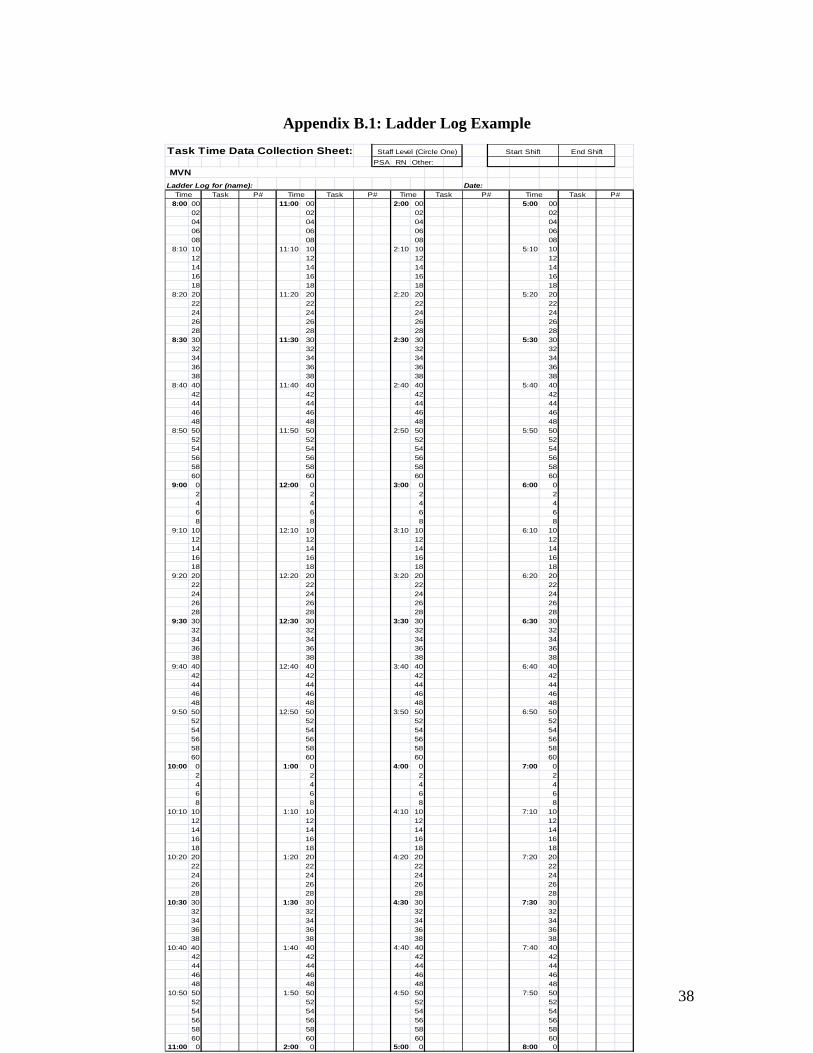
Ladder Log Study After initial interviews and observations, the team conducted a ladder log study to determine the amount of time spent on each intake activity. Staff members were given a Ladder Log Study form consisting of two parts: a patient information sheet and a ladder log sheet. The patient information sheet listed the name of each patient, along with patient information such as insurance provider, type of care required and expected date of discharge from the hospital. The ladder log sheet listed different times of the day, and staff members tracked their daily activities next to the corresponding time. The team divided all intake activities into five or six different task chunks. Staff members used the two forms simultaneously to track the amount of time they spend on each task chunk for each patient. The Ladder Log study terminated once the staff member listed information for 50 patients. Table 2: Task Descriptions Task Description
1 Initial Questioning, Obtain Demographics, Receive Referral
2 Additional Communication with Patient or Discharge Planners
3 Data Entry and Paperwork 4 Insurance Verification
Beeper Study The team used beepers to gather information on the proportion of time spent on each intake activity. During the beeper study, the staff were given a beeper and a data collection form. The beeper vibrated an average of four times an hour according to a random Poisson distribution. The data collection form listed different tasks performed by staff in separate rows. These tasks were more specific than the task chunks in the ladder log study and could be considered sub-tasks of the original five task chunks. The staff put a tally mark in the appropriate box (the intersection of the time the beeper vibrated and the current task being performed) every time the beeper vibrated throughout the day. Data was collected for the following number of staff members over five different days of the week for an average of seven working hours per day.

5
Task Volume Study Finally, each staff member who completed a Beeper Study and Ladder Log study in MVN and HomeMed participated in the Task Volume study, which analyzed the frequency of different occurrences or obstacles such as the denial of service to a patient, a change in the discharge date, and missing patient information within the referral. Similar to the Beeper Study, the Task Volume study was conducted over five different days of the week for seven working hours per day. The staff placed a tally mark on the data collection form in the appropriate box every time they came across the obstacle or task. Findings and Conclusions Based on the results of the Beeper Study, Ladder Log Study, and Task Volume Studies, as well as general observations of the intake process, a summary of recommendations to the intake staff and supervisors appears below. Quantitative Findings The average time a Home Care staff member takes to process a referral based on the Ladder Log Study and the Beeper Study was found to be 31 minutes with a standard deviation of 5. This time was found to be different across each department, with the biggest difference between MVN and MedEQUIP. A summary of the total time to process a referral broken down by task for each department is illustrated in Figure 1 below.
Figure 1: Processing Time by Task Figure 1 shows that staff spends the majority of their time performing Task 3. Much of this is due to the complex system of entering data. The Task Volume Study revealed that Home Care receives an average of 21 referrals per day through their electronic system. Around 47% of these referrals are incomplete, meaning they are missing patient information, such as prescription, patient demographics, or following physician information. Qualitative Findings After initial interviews and observations, the team was able to draw several conclusions about the current process efficiency. Staff members spend much more time processing

6
incomplete referrals than they do complete referrals because they must track down all of the missing patient information to accurately determine a schedule and estimate of cost for the patient. The high volume of incomplete referrals is mainly due to the fact that the Discharge Planners who create these referrals work in the hospital, while the Home Care Intake Staff works offsite from the hospital. Additionally, referrals are currently written in a way that is centered around the provider or the type of care the patient requires, rather than the patient themselves. For this reason, patients who require simultaneous care from different departments present difficulties for the electronic data handling system and by Home Care Staff. Recommendations The team recommends that the Home Care Department be moved to the Hospital to improve communication between Discharge Planners and Intake Staff. The Intake Staff should use standardized work across all five departments whenever possible. Finally, the system used to handle data entry for patient information should be standardized for each department and made more user-friendly to reduce the amount of time staff takes to enter data. The reduction of data entry time can potentially lead to optimized staff levels and referral processing time.

7
Introduction The transition of patients from the hospital to home frequently requires the utilization of home care services. In FY 2009, the University of Michigan Hospitals & Health Centers (UMHHC) had a total of 43,186 acute care discharges, 40% of which required post acute care service such as home medical equipment, home infusion therapy or home nursing care. These services are provided by MedEQUIP, HomeMed, and Michigan Visiting Nurses (MVN), respectively. The coordination of this care plays an important role in the patient throughput process in the health system as well as impacting the successful transition of the patients to other venues of care. The intake process, by which incoming referrals from the hospital to MedEQUIP, HomeMed, and MVN are processed by intake staff, is critical to patient throughput. The director of the University of Michigan Home Care Services (UMHCS) is concerned that the current process maybe be redundant and could be improved by reducing waste. Therefore, the UMHCS director would like to know if standardizing and centralizing the intake referral process between MedEQUIP, HomeMed, MVN, and the hospital would result in increased efficiency. To gain a better understanding of the current state of the process, the director used a team of Industrial and Operations Engineering students to perform time studies on the tasks performed by intake staff and to stratify the referral data with the objective of identifying redundancies and waste. Based on this analysis, the team has recommended actions to centralize and standardize the intake referral process. The purpose of this report is to provide a summary of the UMHCS patient intake process and a list of recommendations of how to improve this process.
Background UMHCS provides the majority of home care support for patients who have been recently discharged from the UMHHC with home care needs. UMHCS is comprised of five providers, which include the following:
• HomeMed Home Infusion Services • MedEQUIP Home Medical Equipment • Michigan Visiting Care • Michigan Visiting Nurses (MVN) • Wheelchair Seating Services
Currently, each provider has dedicated referral processing areas and staff for managing and processing patient referrals. The purpose of UMHCS is to facilitate the discharge of the UMHHC patients in an efficient and timely manner by allowing patients to be discharged earlier while continuing their required care at home. The UMHHC patients' Length of Stay (LOS) for inpatients is directly proportional to costs, meaning that the longer a patient stays in the hospital, the more it costs UMHHC to keep them there. Discharging patients from the hospital system and continuing their care through UMHCS is significantly reduces real costs and potential opportunity costs by freeing up inpatient space in the hospital system

8
for other patients. Since UMHHC operates on average at 90% capacity, an efficient discharge rate is critical. Additionally, UMHCS expects a large increase of patient referrals in the near future, making this issue of even greater importance. The team was asked to focus on three of the providers, MedEQUIP, HomeMed, and MVN. These providers have very similar referral processing, yet their staffs are independent and not centralized even though they all fall under the umbrella of UMHCS. Also, some patients require multiple services at once. Under these circumstances, the same intake referral process is performed separately for each of the needs, which is redundant and wasteful. Goals and Objectives The primary goal for the UMHCS Intake project was to determine the current state of the intake referral process, particularly the average amount of time that staff members take to complete a referral. The activities of the intake staff were observed and measured to determine the proportion of time spent on each activity, ultimately providing the time elapsed between the arrival of a referral and the acceptance or rejection of the patient from UMHCS. To make appropriate recommendations to centralize and standardize the process, the previously mentioned information was analyzed and stratified to accomplish the following objectives:
• Eliminate redundant referral process tasks in intake within individual services and for patients who utilize multiple services (MedEQUIP, HomeMed, and MVN)
• Increase the capacity for referrals by UMHCS, thereby diminishing the Length of Stay (LOS) for UMHHC patients
• Reduce wasted efforts that do not add to the intake process value stream • Improve the overall quality of care and patient satisfaction provided by
UMHCS through reduced processing time Once the current state is established, the ultimate goal of the project is to standardize and centralize the intake referral process across each provider such that the UMHCS intake process operates as one system. Key Issues After examining the patient intake referral process within UMHCS, the team concluded that the primary parties involved in this project include Home Care Services employees, nurses, clinicians, patient service assistants, supervisors, the UMHCS Project Manager, and UMHCS Director. The overall plan includes initial observation and interviews of staff, data collection via beeper and ladder log studies by staff, analysis of data, and final recommendations. The following key issues create the need for the project:
9
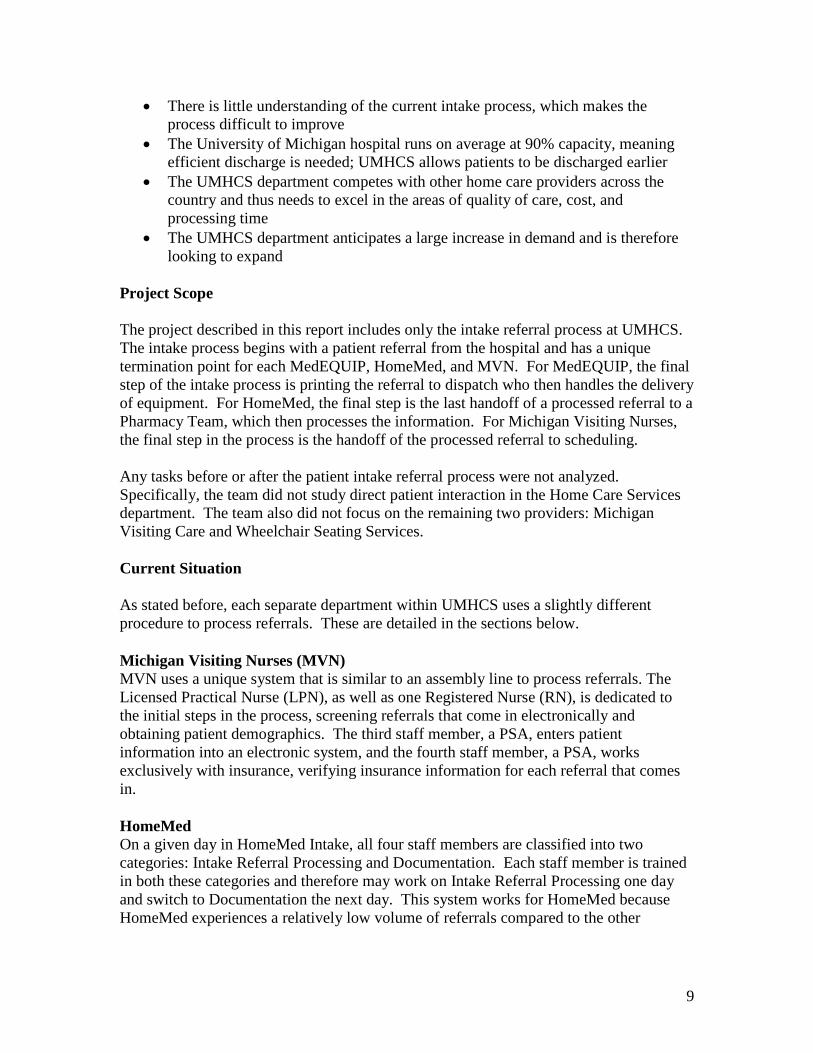
• There is little understanding of the current intake process, which makes the process difficult to improve
• The University of Michigan hospital runs on average at 90% capacity, meaning efficient discharge is needed; UMHCS allows patients to be discharged earlier
• The UMHCS department competes with other home care providers across the country and thus needs to excel in the areas of quality of care, cost, and processing time
• The UMHCS department anticipates a large increase in demand and is therefore looking to expand
Project Scope The project described in this report includes only the intake referral process at UMHCS. The intake process begins with a patient referral from the hospital and has a unique termination point for each MedEQUIP, HomeMed, and MVN. For MedEQUIP, the final step of the intake process is printing the referral to dispatch who then handles the delivery of equipment. For HomeMed, the final step is the last handoff of a processed referral to a Pharmacy Team, which then processes the information. For Michigan Visiting Nurses, the final step in the process is the handoff of the processed referral to scheduling. Any tasks before or after the patient intake referral process were not analyzed. Specifically, the team did not study direct patient interaction in the Home Care Services department. The team also did not focus on the remaining two providers: Michigan Visiting Care and Wheelchair Seating Services. Current Situation As stated before, each separate department within UMHCS uses a slightly different procedure to process referrals. These are detailed in the sections below. Michigan Visiting Nurses (MVN) MVN uses a unique system that is similar to an assembly line to process referrals. The Licensed Practical Nurse (LPN), as well as one Registered Nurse (RN), is dedicated to the initial steps in the process, screening referrals that come in electronically and obtaining patient demographics. The third staff member, a PSA, enters patient information into an electronic system, and the fourth staff member, a PSA, works exclusively with insurance, verifying insurance information for each referral that comes in. HomeMed On a given day in HomeMed Intake, all four staff members are classified into two categories: Intake Referral Processing and Documentation. Each staff member is trained in both these categories and therefore may work on Intake Referral Processing one day and switch to Documentation the next day. This system works for HomeMed because HomeMed experiences a relatively low volume of referrals compared to the other

10
divisions in Home Care. This causes the total referral processing time to be very large because staff members can dedicate up to an entire day to Documentation. MedEQUIP MedEQUIP has the most staff members relative to the other divisions. Even though MedEQUIP may receive less new referrals than other providers, they receive numerous restart referrals, which are referrals for patients already in the Home Care System. Most of the referrals received by MedEQUIP are for complex orders involving more than one type of care. It is for this reason that MedEQUIP referrals take longer to process and the MedEQUIP division requires more than double the amount of staff members than other providers. Continuous Positive Airway Pressure (CPAP) The CPAP division of MedEQUIP operates on a system similar to MVN. All staff members working in CPAP are PSAs. One PSA handles the beginning of the process, including initial screening and obtaining patient demographics. The next staff member determines whether or not the patient qualifies for care based on the patient's diagnosis. The third staff member verifies prescriptions and the last staff member handles all that is left in the process, including insurance verification, completeness verification, and ticket editing. The seemingly uneven workload between the first three staff members and the last staff member causes a bottleneck before the fourth staff member. Approach and Methodology The team divided the project into four stages: observation and interview, data collection, data analysis, and recommendations. During the first phase, data collection, the team interviewed and observed the intake referral staff for MVN, HomeMed, and MedEQUIP. The MedEQUIP staff is separated into General Intake staff and Continuous Positive Airway Pressure/Bi-level Positive Airway Pressure (CPAP/BiPAP). The team then created data collection sheets for a Beeper Study, Ladder Log Study, and Task Volume Study, which are explained in the following sections. Beeper Study After initial interviews and observations, the team conducted a beeper study to gather information on the proportion of time spent on each intake activity. During the beeper study, the staff were given a beeper and a data collection form. The beeper was set to vibrate an average of four times an hour according to a random Poisson distribution. The data collection form listed different tasks performed by staff in separate rows (See Appendix A). The staff was instructed to put a tally mark in the appropriate box (the intersection of the time the beeper vibrated and the current task being performed) every time the beeper vibrated throughout the day. Data was collected for the following number of staff members over five different days of the week for an average of seven working hours per day.

11
Table 1: Staff members participating in study Unit Number of Staff MVN Total 4 Registered Nurse 1 Licensed Practical Nurse 1 Patient Services Assistant 2 HomeMed Total 4 Patient Services Assistant 4 MedEQUIP 11 Lead Patient Services Assistant 1 Patient Services Assistant 10 CPAP 4 Patient Services Assistant 4 Grand Total 23
Ladder Log Study Each staff member who completed a beeper study was asked to perform a Ladder Log study to determine the amount of time spent on each intake activity. The staff was given a Ladder Log Study form (see Appendix) consisting of two parts. The first part is the patient information sheet, which helps to stratify patient data by referral type, expected discharge date, whether the patient is considered new or restart, type of service provided, single therapy or multiple therapy, payer type, same day or next day service need, along with other variables. Each time the intake referral staff member processes work related to a different patient, she will add the patient's information to the form. The Ladder Log study terminates once the staff member has listed information for approximately 30-50 patients. The second part of the Ladder Log form consists of the Ladder Log itself. The tasks from the beeper study were divided into six categories or “task chunks.” The staff member used the two forms to track the amount of time she spends on each task chunk for each patient. Task Volume Study Each person in MVN and HomeMed who completed a Beeper Study and Ladder Log study was asked to participate in the Task Volume study (MedEQUIP did not participate in the task volume study due to time constraints). The study analyzed the frequency of different occurrences or obstacles such as the denial of service to a patient, a change in the discharge date, and missing patient information within the referral. Similar to the Beeper Study, the Task Volume study was conducted over five different days of the week for approximately seven working hours per day. The Task Volume Study form closely resembles the Beeper Study form with the exception of the task list. The staff was asked to place a tally mark in the appropriate box every time they came across the obstacle or task. Results The team analyzed the data from each of the methods described above and concluded the following findings:

12
Michigan Visiting Nurses (MVN) The results for MVN are broken up by each study conducted: Beeper, Ladder Logs, and Task Volume. Ladder Log Study MVN had six tasks to keep track of during their ladder log study. They were as follows: Table 2: MVN Ladder Log Task Description
T Task Name Task Explanation
T1 ECIN
Screening/Information Gathering
Any work related to scanning ECIN, checking
demographics, service area, prescription
T2 Extra Communications
Any extra communication with any internal or
external entities regarding the referral such as
communication with DCPs, clinicians,
scheduling, other staff, responding to
commentary, etc.
T3 Data Entry
Any work related to entering patient information into
McKessen, new or existing patients, OB,
Lack of Following Physician.
T4 Insurance Verification
Any work related to verifying insurance of the
patient, creating EOC, phone calls regarding
insurance, phone calls to patients, any required additional insurance
information
T5 Misc. Activities
Personal time, checking email, administrative/staff meetings, bathroom, lunch
breaks

13
Every minute of the intake staff’s day was recorded as one of these five primary tasks to get an idea of the average length of each task as well as the variation. Each task was coupled with a unique patient and after 50 patients were accumulated, the study was complete. For patient related tasks (T1-T4) Table 3 shows the data retrieved from the ladder logs. Table 3: Task statistics for patient related activities for MVN
T Average (min)
Stand. Dev. (min) N
T1 5.84 4.09 88 T2 7.68 4.67 146 T3 6.57 4.24 82 T4 5.91 4.24 87
T_TOTAL 25.99 3.93 403 The average time it takes to process a referral sent to MVN is approximately 26 minutes with a standard deviation of 3.93 minutes. Also, T2 occurred 146 times during data collection, versus 88, 82, and 87 times for T1, T3, and T4, respectively. A significant portion (7.68 minutes) of the total time it takes to process a referral is tied up in extra communications. Not only is this the largest proportion of time, it is also the most variable with a standard deviation of 4.67. It is also worth noting that the second most time consuming task is T3, data entry with an average of 6.57 minutes and a standard deviation of 4.24 minutes. For proportion of time spent on patient related tasks, the total time in minutes spent on T1, T2, T3, and T4 was taken. These results are show in Table 4 in minutes. Table 4: Proportion of Time Spent On Patient Related Activities MVN
T Total Time Percentage N T1 576.50 21.4% 88 T2 1208.50 44.9% 146 T3 610 22.7% 82 T4 294 10.9% 87
T_TOTAL 2689 100.0% 403 Again, attention is drawn to the extra communication as 44.9% of total time is spent performing this task. Also, the second most common task is data entry at 22.7%. Data for Task 5 was not used because it proved to be significant upon analysis. Please see the Appendix for data regarding Task 5 information. As far as the stratification variables the team did not find any significant results. A One-way ANOVA test was conducted between the length of the tasks and the stratification variables for all combinations. For MVN, one significant interaction was found, and this was between the length of Task 4 and insurance provider. The box plot and ANOVA test output are in Figure 1 and 2, respectively.

14
ThirdMEDIBC
25
20
15
10
5
0
Insurance
T4_T
otal
Boxplot of T4_Total
Figure 1: Boxplot of T3 Length vs. Insurance Provider One-way ANOVA: T4_Total versus Insurance Source DF SS MS F P Insurance 2 283.3 141.6 8.16 0.001 Error 37 642.3 17.4 Total 39 925.6 S = 4.167 R-Sq = 30.60% R-Sq(adj) = 26.85% Individual 95% CIs For Mean Based on Pooled StDev Level N Mean StDev -----+---------+---------+---------+---- BC 13 3.962 2.787 (-------*-------) MEDI 12 4.667 2.125 (--------*-------) Third 15 9.767 5.973 (-------*------) -----+---------+---------+---------+---- 3.0 6.0 9.0 12.0 Pooled StDev = 4.167
Figure 2: One-way ANOVA of T3 Length vs. Insurance Provider The insurance provider was stratified by Blue Cross/Blue Shield providers, Medicaid/Medicare providers, and Third party providers. The nameless boxplot in Figure 2 was for provider fields that were left blank in the ladder logs. The boxplot shows that Medicaid/Medicare providers task longer to verify insurance as compared to other providers. This is supported by the ANOVA test showing a P-value of 0. Although the R-

15
Sq is low at 30.60%, and this is significant because of all the other variation that is possible within data entry. Other ANOVA tests on the other stratification variables can be found in the Appendix. Beeper Study The team found that there was a wide array of tasks that each employee spent small amounts of time on. As such, most of these tasks were grouped together to form the “Other” category depicted in Figure 3 below, which accounts for 27% of the employees’ times throughout the day. The next three highest categories were “checking email,” “send alert to scheduling,” and “enter data into McKesson” (a software suite used for employee record keeping), with frequencies of 12%, 10%, and 10%, respectively.
Figure 3: Percentage of time spent on the ten most frequent tasks by MVN intake staff The beeper study data were further broken down to show the frequency of tasks at various time intervals throughout the day. Figures four through six below show the frequency of the ten most frequent tasks performed by MVN intake staff during three, three-hour time periods in their work day: 8:00 am – 11:00 am, 11:00 am – 2:00 pm, and 2:00 pm – 5:00 pm.

16
Figure 4: Percentage of time spent on the ten most frequent tasks from 8:00 am–11:00 am
Figure 5: Percentage of time spent on the ten most frequent tasks from 11:00 am–2:00 pm

17
Figure 6: Percentage of time spent on the ten most frequent tasks from 2:00 pm–5:00 pm Similar to the data for the whole workday, the data broken down into time intervals shows that “other” is the predominant frequency because of the large number of individual tasks that the staff performs. The next three most frequent tasks after “other,” differ, however. Between 8:00 am and 11:00 am, the staff spends 16% of their time checking email, 9% of their time scanning ECIN, and 9% of their time communicating with Discharge Planning. Between 11:00 am and 2:00 pm, the staff spends 18% of their time entering data into McKesson, 11% of their time checking email, and 9% of their time reviewing and printing the ECIN sheet. Lastly, between 2:00 pm and 5:00 pm, the staff spends 15% of their time sending alerts to scheduling, 10% of their time completing insurance documentation and verification, and 10% of their time communicating with Discharge Planning. The Beeper Study analysis also yielded the proportion of time that staff spent on the phone (15%) as opposed to off the phone (85%). The complete beeper study data for MVN can be found in the Appendix. Task Volume Study The Task Volume study, which was collected within a time frame of one week, captured information for 133 Electronic Referrals than came to MVN. The staff members collected a multitude of statistics on the referrals using the data collection form, which include information on the completeness of the referral, the time the referral was received, the referral type, and extra communication with discharge planners. A summary of these statistics is illustrated in Table 5 below.

18
Table 5: Statistics Collected by MVN staff (N=133 Referrals) Statistic Frequency Referral Received After Patient Discharged 4 Referrals Received Same Day Patient was Discharged 2 Referrals Unable to Accept 8 Communicate with Discharge Planning 67 Obtain Missing Demographics 34 Complete Referrals 71 Incomplete Referrals 62
The most important of these statistics is the number of incomplete referrals received from Discharge Planning, which represented 47% of total referrals, meaning first time quality was only 53%. The missing or incorrect information that contributed to the incomplete referrals is summarized in Figure 7.
Figure 7: Breakdown of Complete and Incomplete Referrals Figure 7 shows that the three main contributors to incomplete referrals are No Length of Stay (LOS) included, Lack of Following Physician included, and Incorrect Instructions for the patient. These represent a high volume of referrals and create difficulty for the intake staff processing the referrals. HomeMed The HomeMed intake staff completed two separate sets of tasks in their processing of referrals: referral intake and documentation. The team, therefore, analyzed data for each of the beeper, ladder log, and task volume studies for both sets of tasks.

19
Beeper Study Similarly to MVN, HomeMed also completes a large number of individual tasks when performing both referral intake and documentation. Figures 8 and 9 below show that staff spent the majority of their time completing “other” tasks.
Figure 8: Percentage of time spent on the ten most frequent tasks by HomeMed staff during regular referral intake.
Figure 9: Percentage of time spent on the ten most frequent tasks by HomeMed staff during documentation.

20
When performing regular referral intake, the staff is predominantly completing initial questiong of patients to obtain demographic data, verifying insurance, and checking email. When performing documentation, the staff spends a higher proportion of their time creating certificates of medical neccesity (CMN) and obtaining documentation for the prior authorization (PA). The beeper study data is next shown divided into three-hour time intervals to identify tasks that are occuring more frequently at certain times of the day. For referral intake tasks, the data shows that, after “other,” the most frequent tasks are verifying insurance, entering patient data into HcN (a software suite used for employee record keeping), checking email, and performing initial questiong of patients to identify demographic and logistical data. For documentation, the most frequent tasks are “other,” creating certificates of medical necessity (CMNs), processing/obtaining documentation for prior authorizations (PAs). Figures 10 through 15 below show the data for HomeMed referral intake and documentation broken down by time.
Figure 10: Percentage of time spent on the ten most frequent referral intake tasks from 8:00 am–11:00 am

21
Figure 11: Percentage of time spent on the ten most frequent referral intake tasks from 11:00 am–2:00 pm
Figure 12: Percentage of time spent on the ten most frequent referral intake tasks from 2:00 pm–5:00 pm
22
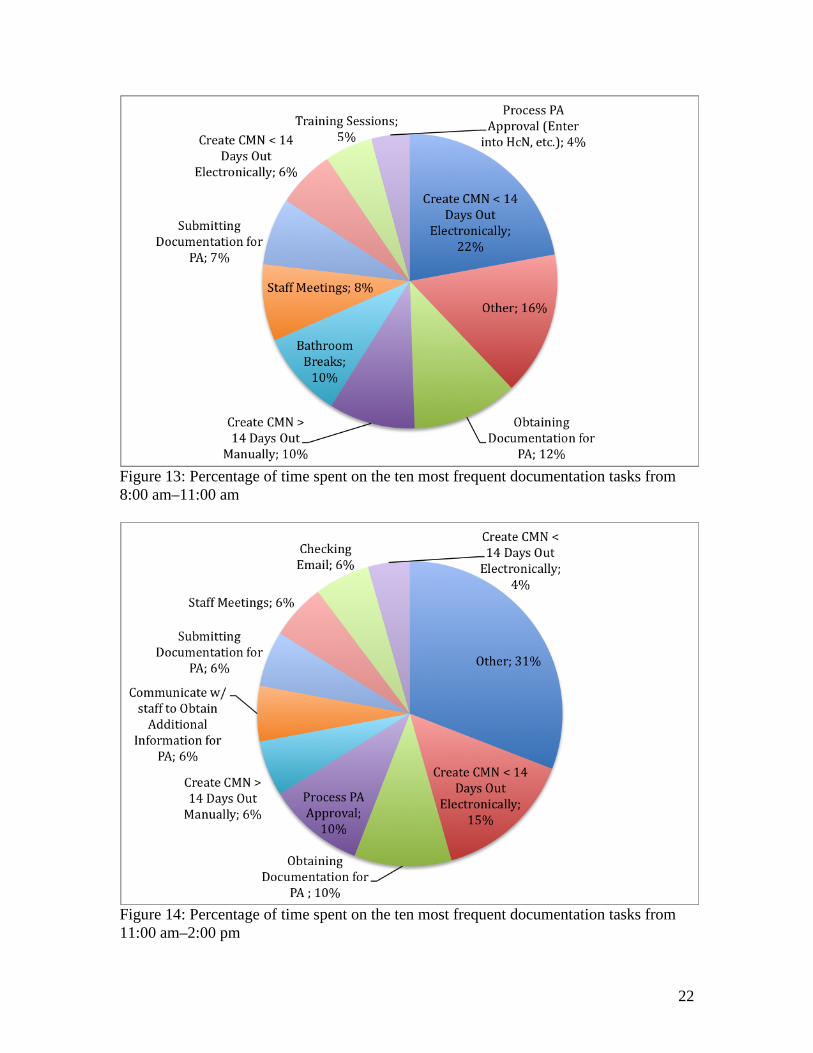
Figure 13: Percentage of time spent on the ten most frequent documentation tasks from 8:00 am–11:00 am
Figure 14: Percentage of time spent on the ten most frequent documentation tasks from 11:00 am–2:00 pm

23
Figure 15: Percentage of time spent on the ten most frequent documentation tasks from 2:00 pm–5:00 pm The HomeMed data was also analyzed to determine the proportion of time that intake staff spent on the phone to off the phone while performing tasks. For both referral intake and documentation tasks, the staff completed most of their duties while off the phone. The staff was off the phone 61% and 72% for referral intake and documentation tasks, respectively. The complete beeper study data for HomeMed can be found in Appendix C. MedEQUIP The MedEQUIP department intake staff is separated between general MedEQUIP staff and CPAP staff. The two groups perform very different tasks in the intake process and were therefore analyzed separately for each of the three studies that were conducted. Ladder Log Study MedEQUIP had six tasks to keep track of during their ladder log study. They are depicted in the Table 6 below:

24
Table 6: MVN Ladder Log Task Description T Task Name Task Explanation
T1 ECIN
Screening/Information Gathering
Any work related to scanning ECIN, checking
demographics, service area, prescription
T2 Extra Communications
Any extra communication with any internal or
external entities regarding the referral such as
communication with DCPs, clinicians,
scheduling, other staff, responding to
commentary, etc.
T3 Data Entry
Any work related to entering patient
information into Fastrack, new or existing patients, OB, Lack of Following Physician, SSP forms,
Oxygen forms
T4 Insurance Verification
Any work related to verifying insurance of the
patient, creating EOC, phone calls regarding
insurance, phone calls to patients, any required additional insurance
information
T5 Non-new patient related activities
Any work related to processing of Non new
referrals
T6 Misc. Activities
Personal time, checking email, administrative/staff
meetings, bathroom, lunch breaks
Tasks 1-4 were defined specifically in the scope of processing a new referral whereas T5 was defined as other tasks that involved patient care, but not for a new referral. This was done to get an understanding of the time it takes to process a new referral. Every minute

25
of the intake staff’s day was recorded as one of these six primary tasks to get an idea of the average length of each task as well as the variation. Each task was coupled with a unique patient and after 30 patients were accumulated, the study was complete. For patient related tasks (T1-T5) Table 7 shows the data retrieved from the ladder logs. These values are in minutes. Table 7: Task Statistics for Processing a New Referral for MedEQUIP
T Average Stand. Dev. N T1 10.12 9.02 199 T2 5.59 5.29 121 T3 11.45 10.89 213 T4 8.55 6.40 110
T_TOTAL 35.70 8.79 643 The data shows that the most time consuming task was data entry at 11.45 minutes with a high standard deviation of 10.89 minutes. The number of occurrences also supports this as the ladder logs observed 213 instances of this, compared to 199, 121, and 110 for T1, T2, and T4, respectively. This data also supports the team's observations of staff often typing in data into Fastrack as well as often filling out paper work for certain medical equipment such as SPP forms and Patient Order Forms. Again, extra communication (T2) is a significant portion of the total referral process time, which should be eliminated in a future state. The team was also interested in how much time was spent on any patient related activity (including T5). Table 8 shows these results. Table 8: Proportion of Time Spent On Patient Related Tasks for MedEQUIP
T Total Time Percentage N T1 1396 8.9% 199 T2 676 4.3% 121 T3 2438 15.5% 213 T4 941 6.0% 110 T5 10279 65.3% 394
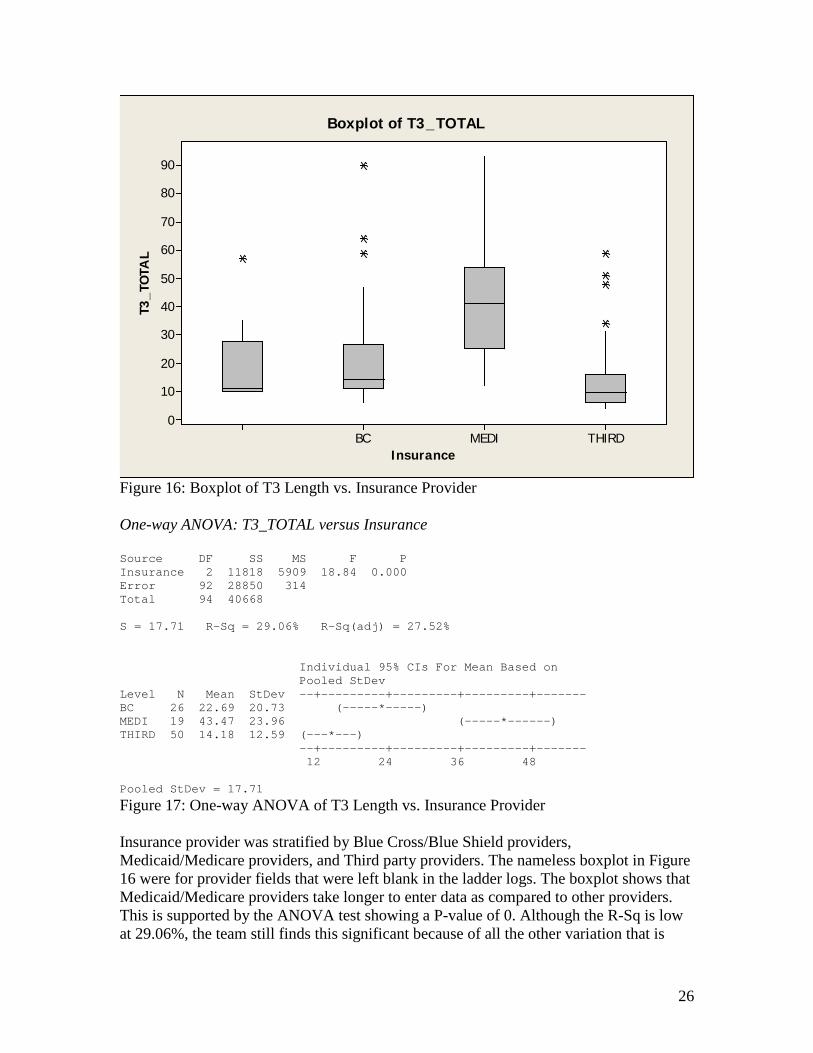
T_TOTAL 15730 100.0% 1037 The data shows that a majority of the workload for MedEQUIP staff is spent on patient care for non-new patients at 65.3 percent of their time. Data entry (T3) takes up the largest proportion of time for processing a new referral. Since T6 was not used in the analysis, that data can be found in the attached appendix. As far as the stratification variables the team did not find any significant results. A One-way ANOVA test was conducted between the length of the tasks and the stratification variables for all combinations. For MedEQUIP, there was one significant interaction, and this was between the length of Task 3 (data entry) and insurance provider. The boxplot and ANOVA test output are in Figure 16 and 17, respectively.
26
THIRDMEDIBC
90
80
70
60
50
40
30
20
10
0
Insurance
T3_T
OTA
LBoxplot of T3_TOTAL
Figure 16: Boxplot of T3 Length vs. Insurance Provider One-way ANOVA: T3_TOTAL versus Insurance Source DF SS MS F P Insurance 2 11818 5909 18.84 0.000 Error 92 28850 314 Total 94 40668 S = 17.71 R-Sq = 29.06% R-Sq(adj) = 27.52% Individual 95% CIs For Mean Based on Pooled StDev Level N Mean StDev --+---------+---------+---------+------- BC 26 22.69 20.73 (-----*-----) MEDI 19 43.47 23.96 (-----*------) THIRD 50 14.18 12.59 (---*---) --+---------+---------+---------+------- 12 24 36 48 Pooled StDev = 17.71
Figure 17: One-way ANOVA of T3 Length vs. Insurance Provider Insurance provider was stratified by Blue Cross/Blue Shield providers, Medicaid/Medicare providers, and Third party providers. The nameless boxplot in Figure 16 were for provider fields that were left blank in the ladder logs. The boxplot shows that Medicaid/Medicare providers take longer to enter data as compared to other providers. This is supported by the ANOVA test showing a P-value of 0. Although the R-Sq is low at 29.06%, the team still finds this significant because of all the other variation that is

27
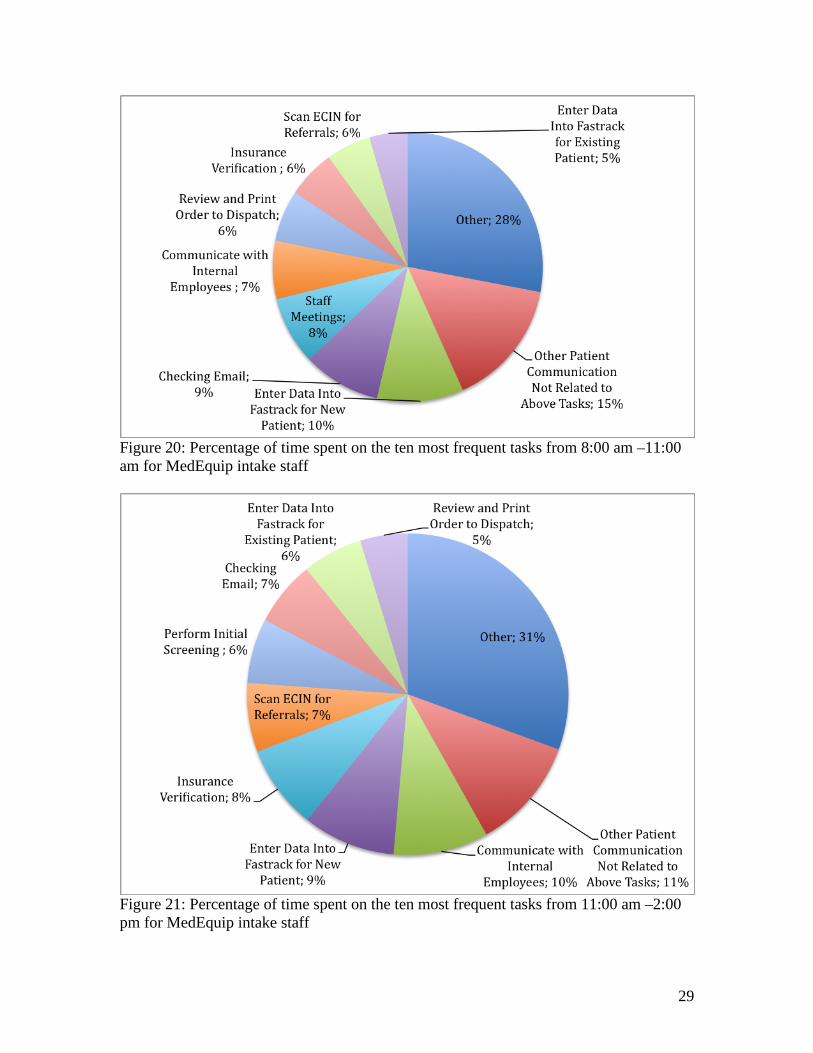
possible within health insurance verification. Other ANOVA tests on the other stratification variables can be found in the Appendix. Beeper Study Eight staff members in general MedEQUIP and four in CPAP collected beeper study data to identify which tasks occurred most frequently. Both groups performed over 25 tasks that were accounted for in the data collection sheet, and thus only the ten most frequent tasks are presented. In addition, since there were such a large number of tasks, “other” is the category that occurred most frequently (31% for MedEQUIP and 36% for CPAP). The next three most frequent tasks for MedEQUIP are communicating with the patient not pertaining to any of the general tasks that were accounted for, entering data into Fastrack (a software suite used for patient record keeping), and checking email. For CPAP, the tasks are verifying insurance, speaking with the patient on the phone to obtain additional information, and entering data into Fastrack. Figures 18 and 19 show these results
Figure 18: Percentage of time spent on the ten most frequent tasks by general MedEquip staff

28
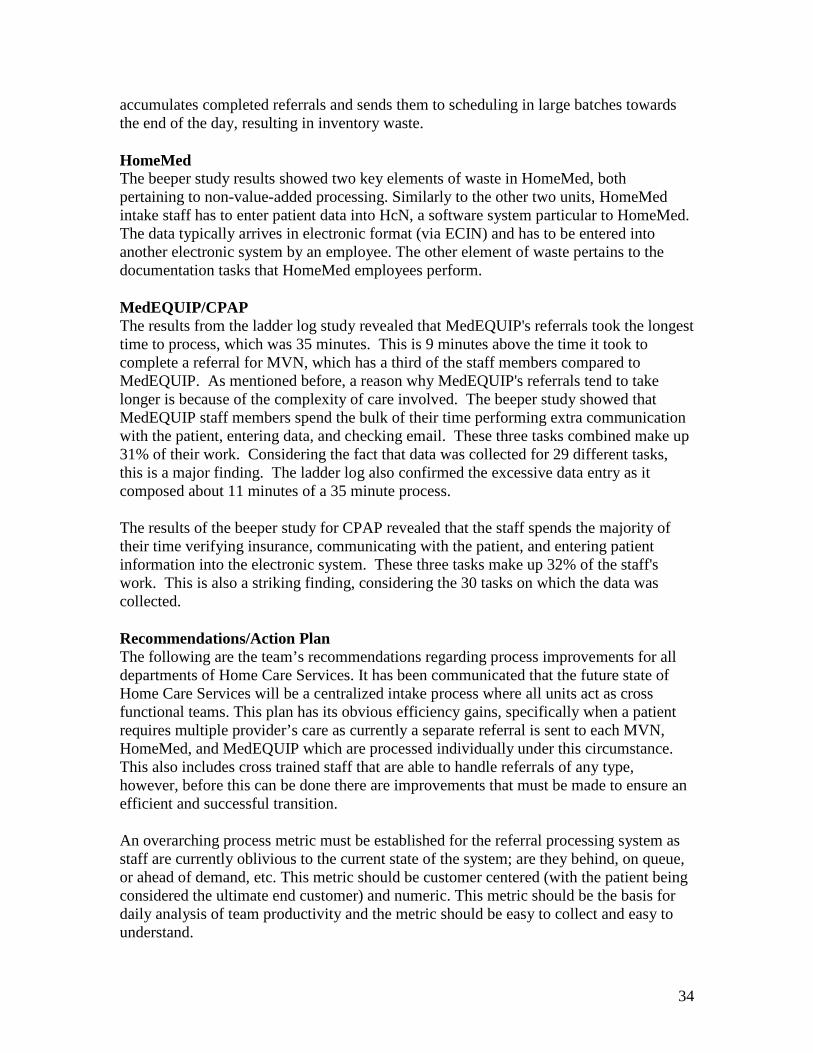
Figure 19: Percentage of time spent on the ten most frequent tasks by CPAP staff Similarly to MVN and HomeMed, the beeper study data is next shown divided into three-hour time intervals to identify tasks that are occuring more frequently at certain times of the day. For MedEquip, after “other,” the most frequent tasks do not vary much between the three time periods. Performing other patient communication not related to prespecified tasks, entering data into Fastrack, checking email, and communicating to internal staff such as dispatch are the predominant tasks in each of the three time periods. The tasks in CPAP are more variable when observed for certain time intervals in the day. For example, between 8:00 am and 11:00 am, verifying insurance, attending staff meetings, and speaking to the patient on the phone are the most frequent tasks. However, between 11:00 am and 2:00 pm, editing the referral ticket is the most frequent task after “other,” and between 2:00 pm to 5:00 pm, printing and stamping the perscription makes into the top three most frequent. Figures 20 through 25 below show the results of MedEQUIP and CPAP broken down by time.
29
Figure 20: Percentage of time spent on the ten most frequent tasks from 8:00 am –11:00 am for MedEquip intake staff
Figure 21: Percentage of time spent on the ten most frequent tasks from 11:00 am –2:00 pm for MedEquip intake staff

30
Figure 22: Percentage of time spent on the ten most frequent tasks from 2:00 pm –5:00 pm for MedEquip intake staff
Figure 23: Percentage of time spent on the ten most frequent tasks from 8:00 am –11:00 am for CPAP intake staff

31
Figure 24: Percentage of time spent on the ten most frequent tasks from 11:00 am –2:00 pm for CPAP intake staff
Figure 25: Percentage of time spent on the ten most frequent tasks from 2:00 pm –5:00 pm for CPAP intake staff The complete Beeper Study results for MedEQUIP can be found in Appendix C.

32
Simulation Problem Formulation To estimate the performance of the future state of the centralized intake department a simulation model should be developed. Based on the data the team collected on service time, referral arrival time and variability, a simple model was designed, though it is limited in several aspects. Objective The objective of the model is to formulate a model using ProModel simulation package to describe the current state system for the 3 departments (MVN, HomeMed and MedEQUIP) and to predict the future state performance of the central intake department. Model Conceptualization Due to the limitation of the data, a dependable service time distribution was only created and used for MVN and HomeMed. In terms of arrival pattern, only ECIN data could be used. As a result, CPAP’s referral arrival pattern cannot be obtained. The team developed a model that describes the process of all the departments. However the simulation only included MedEQUIP and MVN. In the model, each intake staff is treated as a location, with capacity of 1, meaning one staff can only process at most 1 referral in any given time. The queue could be built up if the subsequent locations are full. For MVN, the coming referrals first either go to staff1 or staff2, since the work flow in MVN is sequentially designed. After 1 referral has been processed by either staff1 or staff2, it will be past to staff3, if she is available. Similarly, the referral will be past to staff4 once it was finished processing by staff3. Staff4 will complete the whole process. As of MedEQUIP, all the staffs can work parallel. That is, all the intake staff can handle each referral individually without help from other people. In this situation, once a referral has arrived, it will be directed to 1 idle staff to get processed, or has to wait for the next available staff. In the future state, all the staffs are cross-trained so that each one of them could handle any kind of referral individually. As a result, the 2 kinds of arrivals are combined together. Model Transition Based on the raw data collected, the team obtained the inter arrival time for MVN and MedEQUIP. Both have exponential distribution with mean of 26.4min and 42.4min, respectively. The process time for staff in MedEQUIP is normally distributed with mean of 35.7 minutes and standard deviation of 8.79 minutes. For MVN, the mean process time was calculated for staff1 and 2 using the sum of the two independent random numbers. The inter arrival time for the future state (Home Care Service as a whole) was obtained by taking the weighted average of the arrivals of MVN and MedEQUIP. The process time for the cross-trained staff was calculated by taking the weighted average of the total process time of two kinds of referrals with T2 (excessive communication) excluded.

33
Validation Due to the limited amount of data, the model is not fully validated. The current and future state utilizations were obtained for comparison. Also, the assumption was made that the arrival pattern would not change in the future, which is a strong assumption. Outputs Table 9: Simulation output showing processing time and utilizations
MVN MedEquip Current Future Current Future
Average Processing Time(Min) 25.99 18.31 35.7 30.11
Average Utilization 0.754 0.554 0.812 0.554 Conclusions The results depicted above gave several insights into the referrals processing procedures at MVN, HomeMed, and MVN. The team was able to identify several inefficiencies and areas for improvement for each unit of Home Care Services. Across all three units, the largest inefficiencies arose from processing waste and the lack of standardized work. Each of the three units devotes a large portion of their time to data entry, which is non-value-added time. Extra communication occurs between internal staff members as well as between staff members and the hospital, leading to increased processing time. MVN The beeper study results for MVN showed that entering data into McKesson accounted for approximately 10% of employees’ time. The process entails printing an ECIN ticket (which typically arrives electronically) and copying the data on the sheet into the McKesson system. Essentially, the person performing this task is manually copying data from one electronic system into another electronic system. Communicating with Discharge Planning was also identified as one of the key non value-added activities that MVN intake staff perform. According to the ladder logs, this activity was approximately 45% of the time required to process a new referral. The need for this extra communication arises because most of the incoming referrals are incomplete or need further clarification. The intake staff therefore need to call the discharge planners to identify missing data (e.g.. lack of following physician, no prescription, etc.), clarify illegible handwriting, and clarify instructions. During the team’s initial interviews with MVN staff, the incompleteness of referrals was stressed as the root issue for most delays in referral processing. After completing a referral, the MVN intake staff sends an alert to the scheduling department, marking the end of the referral intake process. When the referral is complete, an intake staff member has to physically deliver a form to the scheduling department. Due to the nature of this processing step, the data showed that sending an alert to scheduling takes up 15% of the time during the period between 2:00 pm – 5:00 pm, but is not one of the ten most frequent tasks during the two periods before that. The MVN staff
34
accumulates completed referrals and sends them to scheduling in large batches towards the end of the day, resulting in inventory waste. HomeMed The beeper study results showed two key elements of waste in HomeMed, both pertaining to non-value-added processing. Similarly to the other two units, HomeMed intake staff has to enter patient data into HcN, a software system particular to HomeMed. The data typically arrives in electronic format (via ECIN) and has to be entered into another electronic system by an employee. The other element of waste pertains to the documentation tasks that HomeMed employees perform. MedEQUIP/CPAP The results from the ladder log study revealed that MedEQUIP's referrals took the longest time to process, which was 35 minutes. This is 9 minutes above the time it took to complete a referral for MVN, which has a third of the staff members compared to MedEQUIP. As mentioned before, a reason why MedEQUIP's referrals tend to take longer is because of the complexity of care involved. The beeper study showed that MedEQUIP staff members spend the bulk of their time performing extra communication with the patient, entering data, and checking email. These three tasks combined make up 31% of their work. Considering the fact that data was collected for 29 different tasks, this is a major finding. The ladder log also confirmed the excessive data entry as it composed about 11 minutes of a 35 minute process. The results of the beeper study for CPAP revealed that the staff spends the majority of their time verifying insurance, communicating with the patient, and entering patient information into the electronic system. These three tasks make up 32% of the staff's work. This is also a striking finding, considering the 30 tasks on which the data was collected. Recommendations/Action Plan The following are the team’s recommendations regarding process improvements for all departments of Home Care Services. It has been communicated that the future state of Home Care Services will be a centralized intake process where all units act as cross functional teams. This plan has its obvious efficiency gains, specifically when a patient requires multiple provider’s care as currently a separate referral is sent to each MVN, HomeMed, and MedEQUIP which are processed individually under this circumstance. This also includes cross trained staff that are able to handle referrals of any type, however, before this can be done there are improvements that must be made to ensure an efficient and successful transition. An overarching process metric must be established for the referral processing system as staff are currently oblivious to the current state of the system; are they behind, on queue, or ahead of demand, etc. This metric should be customer centered (with the patient being considered the ultimate end customer) and numeric. This metric should be the basis for daily analysis of team productivity and the metric should be easy to collect and easy to understand.

35
A standardized approach must be agreed upon as to how to process any referral. In general, all staff perform the same tasks for each referral, but in totally different manners and sequences. Without a controlled standardized approach, new proposed improvements have no basis for validation as to whether or not referral processing is better. Although a standardized approach should be the goal, staff should be encouraged to experiment with processing improvements and validate them against the standardized approach. If these experiments show results, a new standard should be implemented. Standardization in general clarifies expectations, reduces variability and overburdening, and improves the quality of work. Visual management is also a key recommendation for continuous process improvements. The aforementioned process metrics must be visible and clear to all staff at any time. Other valuable metrics should also be visible such as the frequency of certain issues such as incomplete referrals. These visible metrics must be clear so that when management makes use of gemba walks, they can identify the issues and work to solve any issues immediately. Although staff is involved with the process, they are often busy doing “work arounds” for problems arising on the floor instead of seeing issues as they arise and solving root causes. A management staff is that is more often physically closer to the process will be able to support staff in their problem solving efforts as well as be able to solve issues outside of their employees control as they arise. The extra communication issues must be resolved. Total elimination of extra communication may not be feasible, but marginalizing a very large majority of it is feasible. Staff and leaders must work with discharge planning to solve this issue because it is a waste on both the perspective of the intake staff and the discharge planners. Home Care Services needs to clearly set the expectations to discharge planning of what information they require to process referrals efficiently and properly. These expectations can be used as a communication tool to further develop a new interaction process whether that means changing the organization of what is on the referrals or adding and subtracting sections that are unneeded. Data entry is also a non-valued added task taking much of the referral processing time. Much of the records being dealt with are electronic in nature so there exists mechanisms from which information can be translated from one database package to another. Specifically, ECIN referrals are electronic records, however staff have been observed printing off the referral and manually entering the information into their respective clinical databases. Similar to the extra communication, it may not be feasible to auto-translate all useful information from the ECIN scripts to the clinical database, however this can be done for a large majority of the information. Home Care Services can work with their IT staff to explore potential solutions to these issues as they have a large impact on referral processing. Specifically concerning the MVN and CPAP intake staff, they have developed an assembly line system for processing referrals. Two staff handle initial information gathering and extra communications. The referral is then handed off to the third staff

36
person for a data entry. Finally, the data entry staff passes this referral onto the fourth staff person who does the insurance verification. This process creates a bottle neck between the first two staff and the data entry staff. Queues begin to build up here. This is not a very effective utilization of staff persons. The team recommends that each staff member handles the referral from start to finish. Expected Outcome After the action plan stated above and the elimination of extra communication between intake staff and discharge planners (T2), UMHCS will be able to handle over 20% more referrals than before. This number was calculated using the following equation: [(MVN T2 * #MVN Referrals/year) + (MedEQUIP T2 * #MedEQUIP Referrals/year) + (HomeMed T2 * #HomeMed Referrals/year)] * % Incomplete Referrals / 265 days/year [(7.68 x 4120) + (5.59 x 2052) + (6.63 x 2390)] x (47%) = 461.84 hr/8hr work day = 57.73 days saved / 265 days/year = .21 = 21% The results of the simulation also illustrate that after the reduction or elimination of T2, staff members will only be a little over 50% utilized, which means that UMHCS will be able to handle the expected increase in referral demand. After intake staff have implemented a system to measure performance and supervisors review these metrics weekly, UMHCS will always know the current state of their intake process and be able to make improvements accordingly.

37
Appendix A: Beeper Study Example
38
Task Time Data Collection Sheet:PSA RN Other:
Ladder Log for (name): Date:
8:00 00 11:00 00 2:00 00 5:00 0002 02 02 0204 04 04 0406 06 06 0608 08 08 08
8:10 10 11:10 10 2:10 10 5:10 1012 12 12 1214 14 14 1416 16 16 1618 18 18 18
8:20 20 11:20 20 2:20 20 5:20 2022 22 22 2224 24 24 2426 26 26 2628 28 28 28
8:30 30 11:30 30 2:30 30 5:30 3032 32 32 3234 34 34 3436 36 36 3638 38 38 38
8:40 40 11:40 40 2:40 40 5:40 4042 42 42 4244 44 44 4446 46 46 4648 48 48 48
8:50 50 11:50 50 2:50 50 5:50 5052 52 52 5254 54 54 5456 56 56 5658 58 58 5860 60 60 60
9:00 0 12:00 0 3:00 0 6:00 02 2 2 24 4 4 46 6 6 68 8 8 8
9:10 10 12:10 10 3:10 10 6:10 1012 12 12 1214 14 14 1416 16 16 1618 18 18 18
9:20 20 12:20 20 3:20 20 6:20 2022 22 22 2224 24 24 2426 26 26 2628 28 28 28
9:30 30 12:30 30 3:30 30 6:30 3032 32 32 3234 34 34 3436 36 36 3638 38 38 38
9:40 40 12:40 40 3:40 40 6:40 4042 42 42 4244 44 44 4446 46 46 4648 48 48 48
9:50 50 12:50 50 3:50 50 6:50 5052 52 52 5254 54 54 5456 56 56 5658 58 58 5860 60 60 60
10:00 0 1:00 0 4:00 0 7:00 02 2 2 24 4 4 46 6 6 68 8 8 8
10:10 10 1:10 10 4:10 10 7:10 1012 12 12 1214 14 14 1416 16 16 1618 18 18 18
10:20 20 1:20 20 4:20 20 7:20 2022 22 22 2224 24 24 2426 26 26 2628 28 28 28
10:30 30 1:30 30 4:30 30 7:30 3032 32 32 3234 34 34 3436 36 36 3638 38 38 38
10:40 40 1:40 40 4:40 40 7:40 4042 42 42 4244 44 44 4446 46 46 4648 48 48 48
10:50 50 1:50 50 4:50 50 7:50 5052 52 52 5254 54 54 5456 56 56 5658 58 58 5860 60 60 60
11:00 0 2:00 0 5:00 0 8:00 0
Time
MVN
Time TimeP#TaskP#Time Task Task P#
End Shift
Task P#
Staff Level (Circle One) Start Shift
Appendix B.1: Ladder Log Example

39
Appendix B.2: Ladder Log Example
Patient Info:Restart New SSP OB HIT
Ex. ECIN Phone Fax Other X X
P1 ECIN Phone Fax Other
P2 ECIN Phone Fax Other
P3 ECIN Phone Fax Other
P4 ECIN Phone Fax Other
P5 ECIN Phone Fax Other
P6 ECIN Phone Fax Other
P7 ECIN Phone Fax Other
P8 ECIN Phone Fax Other
P9 ECIN Phone Fax Other
P10 ECIN Phone Fax Other
P11 ECIN Phone Fax Other
P12 ECIN Phone Fax Other
P13 ECIN Phone Fax Other
P14 ECIN Phone Fax Other
P15 ECIN Phone Fax Other
P16 ECIN Phone Fax Other
P17 ECIN Phone Fax Other
P18 ECIN Phone Fax Other
P19 ECIN Phone Fax Other
P20 ECIN Phone Fax Other
P21 ECIN Phone Fax Other
P22 ECIN Phone Fax Other
P23 ECIN Phone Fax Other
P24 ECIN Phone Fax Other
P25 ECIN Phone Fax Other
P26 ECIN Phone Fax Other
P27 ECIN Phone Fax Other
P28 ECIN Phone Fax Other
P29 ECIN Phone Fax Other
P30 ECIN Phone Fax Other
P31 ECIN Phone Fax Other
P32 ECIN Phone Fax Other
P33 ECIN Phone Fax Other
P34 ECIN Phone Fax Other
P35 ECIN Phone Fax Other
P36 ECIN Phone Fax Other
P37 ECIN Phone Fax Other
P38 ECIN Phone Fax Other
P39 ECIN Phone Fax Other
P40 ECIN Phone Fax Other
P41 ECIN Phone Fax Other
P42 ECIN Phone Fax Other
P43 ECIN Phone Fax Other
P44 ECIN Phone Fax Other
P45 ECIN Phone Fax Other
P46 ECIN Phone Fax Other
P47 ECIN Phone Fax Other
P48 ECIN Phone Fax Other
P49 ECIN Phone Fax Other
P50 ECIN Phone Fax Other
Example:
7:00 0 7:30 30
2 32
4 34
6 36
8 38
7:10 10 7:40 40
12 42
14 44
16 46
T4 18 48
T57:20 20 7:50 50
X 22 52
24 54
26 56
28 58
Interruption Example
P#
web-DENIS CPAPSusan B. Anthony 2/24/2010 XList of Therapies/Services:Prior Auth Obtained By:
Task
Same Day Next Day
TimeTaskTime P#
Patient Name Expected D/C Referral Type
This Log is intended to show when and how long it takes to receive, investigate, and respond to a referral sent by any referral source for different patients. On the sheet you will see only 2 major
columns, 1 for the task length, 1 for the patient number.
Instructions For Using This Ladder Log:
T1 P1
ECIN Screening - Any work related to scanning ECIN, checking demographics, service area, insurance, following physician, diagnosis, care service
T1
Extra Communication - Any extra communication with any internal or external entities regarding the referral such as communication with DCPs, clinicians, scheduling, other
staff, responing to commentary (!), etc.T2
P3
T2 P3
P2
T4 Bathroom
T2 P1
T2 x
Interruptions - minute or less interruptions in current taskPatient Number - in order to track how much time is spent on referrals regarding the
same patientP#T3
T1 P2
Misc Activities - personal time, checking email, administrative/staff meetings, bathroom, lunch breaks
Data Entry - Any work related to entering patient information into McKessen, new or existing patients, OB, Lack of Following Physician.
T3
Insurance Verification - Any work related to verifying insurance of the patient, creating EOC, phone calls regarding insurance, phone calls to patients, any required additional
insurance information
Insurance ProvidorBCN

40
Appendix C: Beeper Study Results Table 1: Proportion of time spent on each task for MVN staff Task % of Total Time Enter Data Into McKesson for New Patient 17.1% Checking Email 9.8% Communicate with D/C Planning/Practice Management 8.9% Review and Print Order & ECIN (Supporting Documents) 8.1% Complete Additional Insurance Documentation/Verification 8.1% Fill Out Referral Log and Hand Off to Data Entry 6.5% Scan ECIN for Initial Referals or Alert Messages/Updates 5.7% Send Alert to Scheduling 5.7% Create Estimate of Cost (EOC) 5.7% Distribute Referral to Scheduling 4.1% Communication/issue w/ staff 4.1% Data Enter O.B. Information 3.3% Bathroom Breaks 3.3% Enter Data Into McKesson for Existing Patient 2.4% Other 2.4% Create Patient labels for Patient Files 1.6% Communicate with Patient: Verify Address/Contact Info 1.6% Assign Referral to Self 0.8% Perform Initial Screening 0.8%
Table 2: Proportion of time spent on each referral intake task for HomeMed staff Task % of Total Time Other 21.8% Initial Questioning (What, where, when, who will pay) 13.0% Verify Insurance 10.9% Checking Email 10.6% Enter Patient Into HcN 8.8% Performing Eligibility Screen 4.5% Staff Meetings 4.5% Set Up Nursing 4.2% Hand Off to Team 3.6% Walk-In Visit 3.6% Bathroom Breaks 3.6% Obtaining Demographics 2.7% Contact Patient (Communicate Information) 2.4% Create Estimate of Cost (EOC) 2.1% Fax 1.5% Manage/Communicate Order Changes 1.2% Complete Clinic Rationale 0.6%

41
Table 3: Proportion of time spent on each documentation task for HomeMed staff Task % of Total Time Work Related to CMN or PA (Medicaid) Create CMN > 14 Days Out (Manually) 10.9% Obtaining Documentation for PA 8.1% Create CMN < 14 Days Out (Electronically) 5.0% Communicate w/ Physician to Obtain Additional Info for PA 3.2% Submitting Documentation for PA 2.7% Process PA Approval (Enter into HcN, etc.) 2.7% Resubmit Documentation for PA 0.9% Work Related to CMN or PA (All Other Insurances) Create CMN < 14 Days Out (Electronically) 18.1% Create CMN > 14 Days Out (Manually) 5.4% Submitting Documentation for PA 3.2% Process PA Approval (Enter into HcN, etc.) 3.2% Communicate w/ Physicia. to Obtain Additional Info for PA 1.4% Resubmit Documentation for PA 1.4% Obtaining Documentation for PA 0.9% Work Related to Insurance Changes Process PA Approval (Enter into HcN, etc.) 3.6% Verify Insurance Change 2.7% Submitting Documentation for PA 2.3% Create CMN < 14 Days Out (Electronically) 1.8% Create CMN > 14 Days Out (Manually) 1.8% Communicate w/ Physician to Obtain Additional Info for PA 1.4% Resubmit Documentation for PA 0.9% Obtaining Documentation for PA 0.5% Administrative Responsibilities and Personal Time Bathroom Breaks 5.9% Staff Meetings 5.4% Checking Email 4.1% Training Sessions 2.3%

42
Table 4: Proportion of time spent on each task by MedEQUIP staff Task % of Total Time Other Patient Communication Not Related to Above Tasks 14.0% Enter Data Into Fastrack for New Patient 9.2% Checking Email 8.1% Communicate with Internal Employees 7.6% Scan ECIN for Initial Referals or Alert Messages/Updates 7.5% Insurance Verification (Gather Information via phone, CareWebb) 7.1% Enter Data Into Fastrack for Existing Patient 5.7% Review and Print Order to Dispatch 5.6% Perform Initial Screening 4.0% Staff Meetings 3.9% Extra Paper Work for Insurance Verification 3.5% Communicate with D/C Planning/Practice Management 3.1% Fill out Patient Order Forms 2.7% Walk-In Visit 2.4% Any Referral Processing AFTER Printing Ticket to Dispatch 2.3% Breaks 2.0% Look up New Patient information via MCIT 1.9% Communicating cost to D/C Planning or Patient 1.5% Gather Final Documents for Scanning 1.5% Taking Survey 1.3% Other 1.0% Change Alerts 0.9% Review Hold Report 0.8% Scan ECIN for Referral Distribution for Team 1 and 2 0.8% Extra Paper Work for Equipment (Oxygen, SSP, etc.) 0.6% Patient Complaint 0.5% Assign Referral to Other Staff 0.3% Training Sessions 0.3% Process Travel Patient Requests 0.1%

43
Table 5: Proportion of time spent on each task by CPAP staff Task % of Total Time Verify Insurance 15.9% Edit Ticket 13.2% On the phone w/ Patient (setting up appt. or discussing Rx) 12.6% Other 11.9% Print and Stamp Prescription 9.3% Enter Information Into Fastrack 8.6% Verify Prescription (on phone, faxing docs, etc.) 7.1% Staff Meetings 6.8% Send Email to CPAP Team/Tech 5.1% Patient Order Follow-up (post set-up status, supply needs, etc.) 3.8% Print Ticket 3.5% Handle Pending Authorizations 3.3% Check Prior Authorization (fax/call requests for authorization) 3.1% On the phone w/ referral source 2.9% Track down missing paperwork 2.6% Verify completeness of referral 2.2% Mail Patient Itinerary 2.2% Review baseline titration study or other documentation 1.8% Review Face Sheet 1.5% Checking Email 1.5% Verify Patient Information (DOB, address, phone) and physician 1.3% Determine if patient qualifies for care based on diagnosis: 1.3% Bathroom Breaks 1.1% Receive Referral (Patient calls, Physician Calls, fax, etc.) 0.9%
OSA 0.9% Call Patient with EOC 0.9%
CSA 0.7% Other 0.7% Forward Ticket to Confirmation 0.4% Walk-In Visit 0.4% Check Delivery Field 0.2%

44
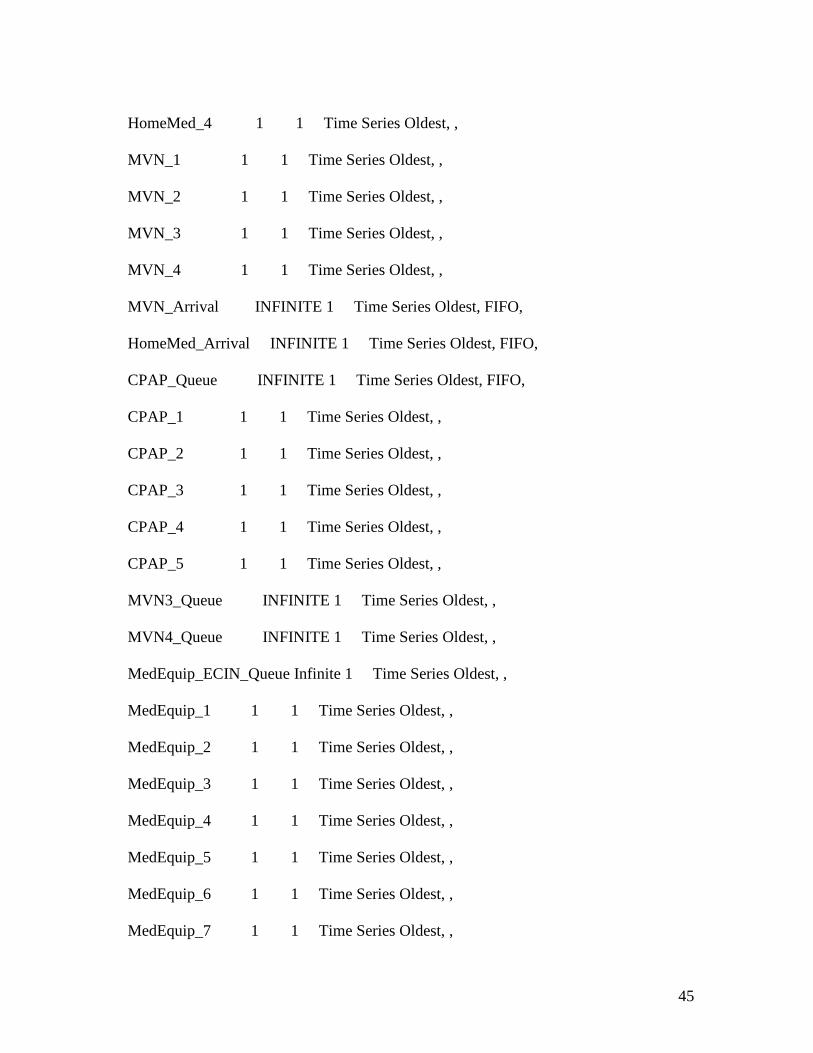
Appendix D: Simulation Source Code ******************************************************************************** * * * Formatted Listing of Model: * * \\storage.adsroot.itcs.umich.edu\home\windat.V2\Desktop\IOE 474 Project-Final.MOD * * * ******************************************************************************** Time Units: Minutes Distance Units: Feet ******************************************************************************** * Locations * ******************************************************************************** Name Cap Units Stats Rules Cost ------------------- -------- ----- ----------- -------------- ------------ HomeMed_1 1 1 Time Series Oldest, , HomeMed_2 1 1 Time Series Oldest, , HomeMed_3 1 1 Time Series Oldest, ,
45
HomeMed_4 1 1 Time Series Oldest, , MVN_1 1 1 Time Series Oldest, , MVN_2 1 1 Time Series Oldest, , MVN_3 1 1 Time Series Oldest, , MVN_4 1 1 Time Series Oldest, , MVN_Arrival INFINITE 1 Time Series Oldest, FIFO, HomeMed_Arrival INFINITE 1 Time Series Oldest, FIFO, CPAP_Queue INFINITE 1 Time Series Oldest, FIFO, CPAP_1 1 1 Time Series Oldest, , CPAP_2 1 1 Time Series Oldest, , CPAP_3 1 1 Time Series Oldest, , CPAP_4 1 1 Time Series Oldest, , CPAP_5 1 1 Time Series Oldest, , MVN3_Queue INFINITE 1 Time Series Oldest, , MVN4_Queue INFINITE 1 Time Series Oldest, , MedEquip_ECIN_Queue Infinite 1 Time Series Oldest, , MedEquip_1 1 1 Time Series Oldest, , MedEquip_2 1 1 Time Series Oldest, , MedEquip_3 1 1 Time Series Oldest, , MedEquip_4 1 1 Time Series Oldest, , MedEquip_5 1 1 Time Series Oldest, , MedEquip_6 1 1 Time Series Oldest, , MedEquip_7 1 1 Time Series Oldest, ,
46
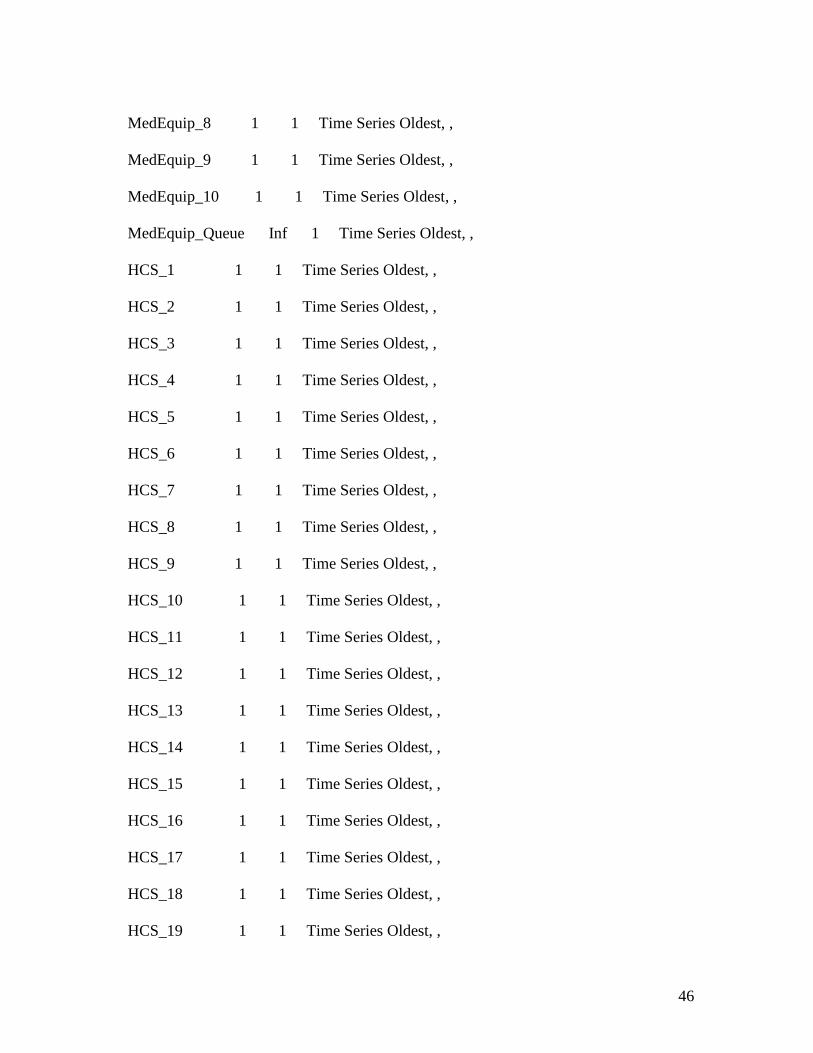
MedEquip_8 1 1 Time Series Oldest, , MedEquip_9 1 1 Time Series Oldest, , MedEquip_10 1 1 Time Series Oldest, , MedEquip_Queue Inf 1 Time Series Oldest, , HCS_1 1 1 Time Series Oldest, , HCS_2 1 1 Time Series Oldest, , HCS_3 1 1 Time Series Oldest, , HCS_4 1 1 Time Series Oldest, , HCS_5 1 1 Time Series Oldest, , HCS_6 1 1 Time Series Oldest, , HCS_7 1 1 Time Series Oldest, , HCS_8 1 1 Time Series Oldest, , HCS_9 1 1 Time Series Oldest, , HCS_10 1 1 Time Series Oldest, , HCS_11 1 1 Time Series Oldest, , HCS_12 1 1 Time Series Oldest, , HCS_13 1 1 Time Series Oldest, , HCS_14 1 1 Time Series Oldest, , HCS_15 1 1 Time Series Oldest, , HCS_16 1 1 Time Series Oldest, , HCS_17 1 1 Time Series Oldest, , HCS_18 1 1 Time Series Oldest, , HCS_19 1 1 Time Series Oldest, ,

47
HCS_20 1 1 Time Series Oldest, , HCS_21 1 1 Time Series Oldest, , HCS_22 1 1 Time Series Oldest, , HCS_23 1 1 Time Series Oldest, , HCS_Queue INFINITE 1 Time Series Oldest, , ******************************************************************************** * Entities * ******************************************************************************** Name Speed (fpm) Stats Cost ---------- ------------ ----------- ------------ Referral 150 Time Series ******************************************************************************** * Processing * ******************************************************************************** Process Routing

48
Entity Location Operation Blk Output Destination Rule Move Logic -------- ------------------- ------------------ ---- -------- ----------- ------- ------------ Referral HomeMed_Arrival 1 Referral HomeMed_1 EMPTY 1 Referral HomeMed_2 EMPTY Referral HomeMed_3 EMPTY Referral HomeMed_4 EMPTY Referral HomeMed_1 WAIT n(15,5) MIN 1 Referral EXIT FIRST 1 Referral HomeMed_2 WAIT n(15,5) MIN 1 Referral EXIT FIRST 1 Referral HomeMed_3 WAIT n(15,5) MIN 1 Referral EXIT FIRST 1 Referral HomeMed_4 WAIT n(15,5) MIN 1 Referral EXIT FIRST 1 Referral MVN_Arrival 1 Referral MVN_1 EMPTY 1 Referral MVN_2 EMPTY Referral MVN_1 WAIT n(13.52,6.45) MIN 1 Referral MVN3_Queue FIRST 1 Referral MVN_2 WAIT n(13.52,6.45) MIN 1 Referral MVN3_Queue FIRST 1 Referral MVN3_Queue 1 Referral MVN_3 EMPTY 1 Referral MVN_3 WAIT n(6.57,2.9) MIN 1 Referral MVN4_Queue FIRST 1 Referral MVN4_Queue 1 Referral MVN_4 FIRST 1 Referral MVN_4 WAIT n (5.91,4.24) MIN

49
1 Referral EXIT FIRST 1 INC MVN TS_MVN = Clock()- TS_MVN Total_ATS_MVN = (Total_ATS_MVN + ATS_MVN)/MVN Referral CPAP_Queue 1 Referral CPAP_1 FIRST 1 Referral CPAP_2 FIRST Referral CPAP_3 FIRST Referral CPAP_4 FIRST Referral CPAP_5 FIRST Referral CPAP_1 WAIT 15 MIN 1 Referral EXIT FIRST 1 Referral CPAP_2 WAIT 15 MIN 1 Referral EXIT FIRST 1 Referral CPAP_3 WAIT 15 MIN 1 Referral EXIT FIRST 1 Referral CPAP_4 WAIT 15 MIN 1 Referral EXIT FIRST 1 Referral CPAP_5 WAIT 15 MIN 1 Referral EXIT FIRST 1 Referral MedEquip_ECIN_Queue INC ECIN IF ECIN >= 2 THEN { Route 2 ECIN = ECIN - 1 } ELSE

50
{ Route 1 ECIN = ECIN - 1 } 1 Referral MedEquip_1 FIRST 1 2 Referral MedEquip_2 FIRST 1 Referral MedEquip_4 FIRST Referral MedEquip_5 FIRST Referral MedEquip_6 FIRST Referral MedEquip_7 FIRST Referral MedEquip_8 FIRST Referral MedEquip_9 FIRST Referral MedEquip_10 FIRST Referral MedEquip_3 FIRST Referral MedEquip_Queue 1 Referral MedEquip_2 FIRST 1 Referral MedEquip_3 FIRST Referral MedEquip_4 FIRST Referral MedEquip_5 FIRST Referral MedEquip_6 FIRST Referral MedEquip_7 FIRST Referral MedEquip_8 FIRST Referral MedEquip_9 FIRST

51
Referral MedEquip_10 FIRST Referral MedEquip_1 Wait n(35.7,8.79) min 1 Referral EXIT FIRST 1 Referral MedEquip_2 wait n(35.7,8.79) min 1 Referral EXIT FIRST 1 Referral MedEquip_3 wait n(35.7,8.79) min 1 Referral EXIT FIRST 1 Referral MedEquip_4 wait n(35.7,8.79) min 1 Referral EXIT FIRST 1 Referral MedEquip_5 wait n(35.7,8.79) min 1 Referral EXIT FIRST 1 Referral MedEquip_6 wait n(35.7,8.79) min 1 Referral EXIT FIRST 1 Referral MedEquip_7 wait n(35.7,8.79) min 1 Referral EXIT FIRST 1 Referral MedEquip_8 wait n(35.7,8.79) min 1 Referral EXIT FIRST 1 Referral MedEquip_9 wait n(35.7,8.79) min 1 Referral EXIT FIRST 1 Referral MedEquip_10 wait n(35.7,8.79) min 1 Referral EXIT FIRST 1 Referral HCS_Queue 1 Referral HCS_1 EMPTY 1 Referral HCS_2 EMPTY

52
Referral HCS_3 EMPTY Referral HCS_4 EMPTY Referral HCS_5 EMPTY Referral HCS_6 EMPTY Referral HCS_7 EMPTY Referral HCS_8 EMPTY Referral HCS_9 EMPTY Referral HCS_10 EMPTY Referral HCS_11 EMPTY Referral HCS_12 EMPTY Referral HCS_13 EMPTY Referral HCS_14 EMPTY Referral HCS_1 Wait 0.39*n(35.7,8.79)+0.61*n(26.0,4.42) min 1 Referral EXIT FIRST 1 Referral HCS_2 Wait 0.39*n(35.7,8.79)+0.61*n(26.0,4.42) min 1 Referral EXIT FIRST 1 Referral HCS_3 Wait 0.39*n(35.7,8.79)+0.61*n(26.0,4.42) min 1 Referral EXIT FIRST 1 Referral HCS_4 Wait 0.39*n(35.7,8.79)+0.61*n(26.0,4.42) min 1 Referral EXIT FIRST 1 Referral HCS_5 Wait 0.39*n(35.7,8.79)+0.61*n(26.0,4.42) min 1 Referral EXIT FIRST 1 Referral HCS_6 Wait 0.39*n(35.7,8.79)+0.61*n(26.0,4.42) min

53
1 Referral EXIT FIRST 1 Referral HCS_7 Wait 0.39*n(35.7,8.79)+0.61*n(26.0,4.42) min 1 Referral EXIT FIRST 1 Referral HCS_8 Wait 0.39*n(35.7,8.79)+0.61*n(26.0,4.42) min 1 Referral EXIT FIRST 1 Referral HCS_9 Wait 0.39*n(35.7,8.79)+0.61*n(26.0,4.42) min 1 Referral EXIT FIRST 1 Referral HCS_10 Wait 0.39*n(35.7,8.79)+0.61*n(26.0,4.42) min 1 Referral EXIT FIRST 1 Referral HCS_11 Wait 0.39*n(35.7,8.79)+0.61*n(26.0,4.42) min 1 Referral EXIT FIRST 1 Referral HCS_12 Wait 0.39*n(35.7,8.79)+0.61*n(26.0,4.42) min 1 Referral EXIT FIRST 1 Referral HCS_13 Wait 0.39*n(35.7,8.79)+0.61*n(26.0,4.42) min 1 Referral EXIT FIRST 1 Referral HCS_14 Wait 0.39*n(35.7,8.79)+0.61*n(26.0,4.42) min 1 Referral EXIT FIRST 1 ******************************************************************************** * Arrivals * ********************************************************************************

54
Entity Location Qty Each First Time Occurrences Frequency Logic -------- ------------------- ---------- ---------- ----------- --------------- ------------ Referral MVN_Arrival 1 INFinite E(26.4) ATS_MVN = Clock() Referral MedEquip_ECIN_Queue 1 INF E(42.4) Referral HCS_Queue 1 INF E(42.4)+e(26.4) ******************************************************************************** * Attributes * ******************************************************************************** ID Type Classification ---------- ------------ -------------- ECINS Integer Location ATS_MVN Real Entity ******************************************************************************** * Variables (global) * ********************************************************************************

55
ID Type Initial value Stats ------------- ------------ ------------- ----------- ECIN Integer 0 Time Series MVN Integer 0 Time Series Total_ATS_MVN Real 0 Time Series TS_MVN Real 0 Time Series

56
Appendix E: Data-Findings-Conclusions-Recommendations Table
Data, Logic, and/or
Observations
Findings Conclusions Recommendations Action Plan & Implementation
MedEQUIP = 35 min/referral MVN = 26 min/referral
MedEQUIP has the longest referral processing time out of the three divisions
MedEQUIP has a high referral volume as well as numerous orders in a single referral compared to other Home Care Divisions
Standardize the Intake Referral Process for all three division of Home Care
Create one centralized Home Care Services department that is patient centered, as opposed to care centered (centering around the type of patient care needed)
Beeper Study
Top ten tasks (w/ respect to proportion) common across all divisions are Data Entry, Insurance Verification, and Extra Communication with Patient and/or Discharge Planner
Largest proportion of time is spent in extra communication with Discharge Planners
Increase the proximity of Intake Staff and Discharge Planning to reduce communication errors
Move the Intake staff to the U of M Hospital onsite so that they have a direct communication line with Discharge Planning
Task Volume Study
53% of referrals that come in electronically are complete 47% of referrals that come in electronically are incomplete
Many Referrals that come in Electronically from the Discharge Planners are incomplete and missing information such as Patient Demographics, Prescription, or Length of Stay
Increase the proximity of Intake Staff and Discharge Planning to reduce communication errors
Move the Intake staff to the U of M Hospital onsite so that they have a direct communication line with Discharge Planning
Assembly Line System at MVN and CPAP
MVN and CPAP staff divide work so that each staff member is specialized in a different part of the process
The specialization of staff causes a bottleneck in the process, especially before the data entry process
Do not use the assembly line system. Do not have specialized staff.
Cross train staff members to handle all referral tasks so that each staff member can handle a referral from beginning to end

57
Appendix F: Flowcharts of Intake Processes Figure 1: Michigan Visiting Nurses
Figure 2: HomeMed

58
Figure 3: MedEQUIP
Figure 4: CPAP
Related Documents