University of Bath PHD Drug handling in fit and frail elderly people Ellmers, Susan E. Award date: 1991 Awarding institution: University of Bath Link to publication Alternative formats If you require this document in an alternative format, please contact: [email protected] Copyright of this thesis rests with the author. Access is subject to the above licence, if given. If no licence is specified above, original content in this thesis is licensed under the terms of the Creative Commons Attribution-NonCommercial 4.0 International (CC BY-NC-ND 4.0) Licence (https://creativecommons.org/licenses/by-nc-nd/4.0/). Any third-party copyright material present remains the property of its respective owner(s) and is licensed under its existing terms. Take down policy If you consider content within Bath's Research Portal to be in breach of UK law, please contact: [email protected] with the details. Your claim will be investigated and, where appropriate, the item will be removed from public view as soon as possible. Download date: 15. Sep. 2022

Welcome message from author
This document is posted to help you gain knowledge. Please leave a comment to let me know what you think about it! Share it to your friends and learn new things together.
Transcript

University of Bath
PHD
Drug handling in fit and frail elderly people
Ellmers, Susan E.
Award date:1991
Awarding institution:University of Bath
Link to publication
Alternative formatsIf you require this document in an alternative format, please contact:[email protected]
Copyright of this thesis rests with the author. Access is subject to the above licence, if given. If no licence is specified above,original content in this thesis is licensed under the terms of the Creative Commons Attribution-NonCommercial 4.0International (CC BY-NC-ND 4.0) Licence (https://creativecommons.org/licenses/by-nc-nd/4.0/). Any third-party copyrightmaterial present remains the property of its respective owner(s) and is licensed under its existing terms.
Take down policyIf you consider content within Bath's Research Portal to be in breach of UK law, please contact: [email protected] with the details.Your claim will be investigated and, where appropriate, the item will be removed from public view as soon as possible.
Download date: 15. Sep. 2022

DRUG HANDLING IN FIT & FRAIL ELDERLY PEOPLE
Submitted by Susan E Ellmers for the degree of PhD
of the University of Bath 1991
COPYRIGHT
"Attention is drawn to the fact that copyright of this thesis rests with its author. This copy of the thesis has been supplied on condition that anyone who consults it is understood to recognise that its copyright rests with its author and that no quotation from the thesis and no information derived from it may be published without the prior written consent of the author”.
This thesis may be made available for consultation within the University Library and may be photocopied or lent to other libraries for the purposes of consultation.

UMI Number: U601946
All rights reserved
INFORMATION TO ALL USERS The quality of this reproduction is dependent upon the quality of the copy submitted.
In the unlikely event that the author did not send a complete manuscript and there are missing pages, these will be noted. Also, if material had to be removed,
a note will indicate the deletion.
Dissertation Publishing
UMI U601946Published by ProQuest LLC 2013. Copyright in the Dissertation held by the Author.
Microform Edition © ProQuest LLC.All rights reserved. This work is protected against
unauthorized copying under Title 17, United States Code.
ProQuest LLC 789 East Eisenhower Parkway
P.O. Box 1346 Ann Arbor, Ml 48106-1346

5 0 5 ^^'TO

DEDICATION
To my dogs
A faithful friend is the medicine of life. (Ecclesiasticus vi, 16)

ACKNOWLEDGEMENTS
I would like to acknowledge the importance to me of the following individuals and organisations, who have each in their own way contributed to
the completion of this thesis.
My family who are always there? Dr. Luke Parker, without whose practical help and support life would have been much harder; Dr. Lidia Notarianni, who has my sincere thanks for her encouragement and guidance? Dr. Chris Lovell, whose expertise in eczema management has seen me through some bad times, and whose advice has shown me the way forward? Dr. Roy Jones and the staff at the Research Institute for the Care of the Elderly, for their help and use of the excellent HPLC? Staff at St. Martin's Hospital, for their friendly co-operation? The General Practitioners at St. Mark's Road Surgery, Bath, who allowed me to enlist the help of their staff, computer and patients to carry outmuch of this work? The University of Bath, for providingfinancial support, and the School of Pharmacy &Pharmacology for the use of its facilities. I am also grateful to Gustav Mahler (1860-1911) whose music helped me through the long nights. I would finally like to thank all those volunteers who took part in this study, without whose participation and co-operation none of this would have been possible.

ABBREVIATIONS
AUC area under the time v plasma concentration curveCCr creatinine clearance (ml/min)CCram creatinine clearance from morning urinecollection (ml/min)CCrn creatinine clearance from overnight urine
collection (ml/min)CCrpm creatinine clearance from afternoon + eveningurine collection (ml/min)
. . . ?CCr/SA creatinine clearance normalized to 1.73m bodysurface area (ml/min/1.73m )
CCrO-6 creatinine clearance 0 - 6h postdose (ml/min)dCCrn difference between measured 24h CCr & CCrn
= CCr - CCrn%CCrn percent difference between CCr & predicted CCr= CCr / CCrn x 100Cl apparent clearanceCl/kg apparent clearance per kg bodyweightClr renal clearanceClr/kg renal clearance per kilogram bodyweightClrO-6 renal clearance 0 - 6h postdoseCls apparent serum clearanceCls/kg apparent serum clearance per kilogram bodyweightDIG digoxin%Du percent of dose administered recovered in urineFM Frumil tabletsFRU frusemideFS frusemide BP tabletsHPLC high performance liquid chromatographyM.Sc mobility scorePAR paracetamolPARG paracetamol glucuronidePARS paracetamol sulphateQ1 & Q3 lower (25%) & upper (75%) quartiles

ABBREVIATIONS (contd)
RIA radioimmunoassaySA body surface areaSCr serum creatinine concentration (mg/lOOml)s.d. standard deviation[SDIG] serum digoxin concentration[SPAR] serum paracetamol concentrationtl/2 elimination half-lifeUCr urinary creatinine (mg)[UCr] urinary creatinine concentration (mg/lOOml)free UPAR urinary paracetamolUPARG+S urinary paracetamol glucuronide + sulphatetotal UPAR total urinary paracetamol (UPAR + UPARG+S)Vd volume of distribution

MEDICAL ABBREVIATIONS
AF atrial fibrillationCa carcinomaCABG coronary artery bypass graftCCF congestive cardiac failureCOAD chronic obstructive airways diseaseCVA cerebrovascular accidentDVT deep vein thrombosis# fractureGU gastric ulcerHH hiatus herniaIDDM insulin dependent diabetes mellitusIH inguinal herniaIHD ischaemic heart diseaseLVF left ventricular failureMI myocardial infarctionMND motor neurone diseaseMS multiple sclerosisNG neoplastic growthNIDDM non-insulin dependent diabetes mellitusNOF neck of femurOA osteoarthritisPE pulmonary embolusRA rheumatoid arthritisSOB shortness of breathTHR total hip replacementTIA transient ischaemic attackTURP trans-urethral resection of the prostateUC - ulcerative colitisURTI upper respiratory tract infectionUTI urinary tract infection

vi
ABSTRACT
1 "The elderly" do not form a single homogeneous group, and those to whom medication is most commonly prescribed were identified as forming at least two separate groups: those who are active & able to live independently in the community, and those who are infirm & immobile, requiring help with activities of daily living. Definitions were constructed to enable these groups to be readily differentiated without laboratory investigations, using a combination of social & functional criteria. Terms "fit" & "frail" were used to describe these two populations.
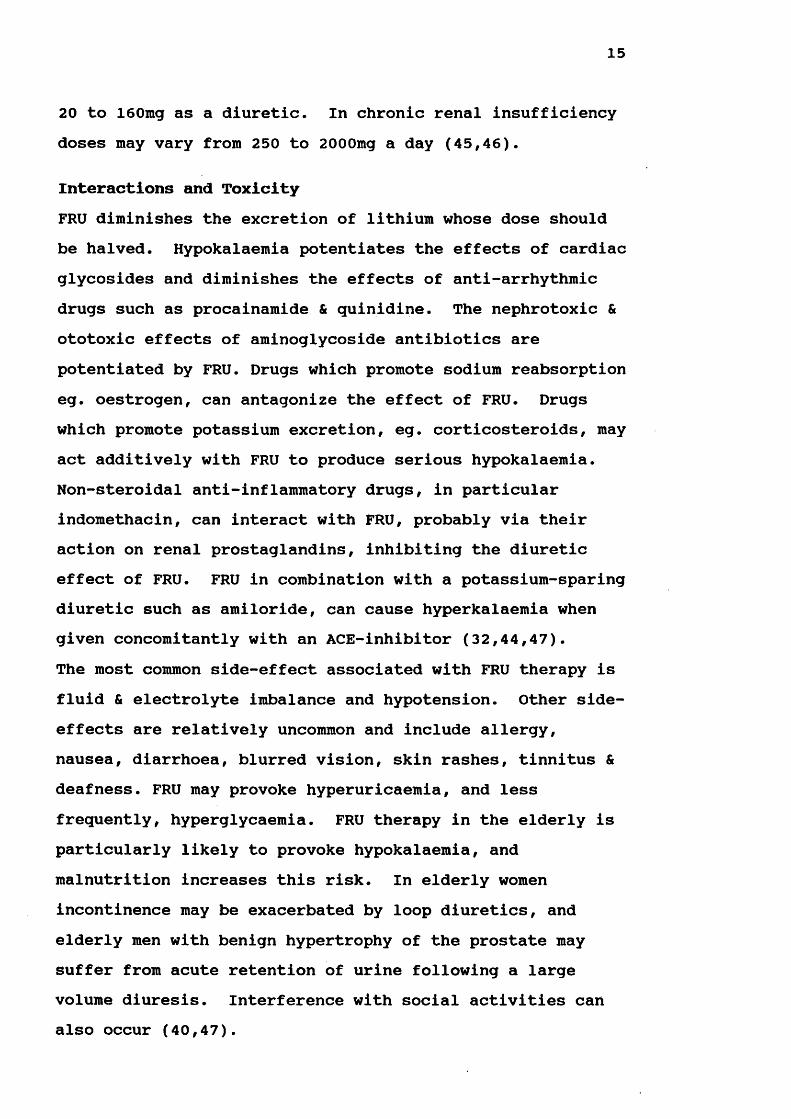
2 Creatinine clearance was measured in 245 elderly people. In addition to those subjects who were defined as fit or frail, a third group of healthy elderly people were . recruited from the Research Institute for the Care of the Elderly volunteer panel & categorised as "very fit". CCr, UCr & SCr were significantly different between females & males. No significant difference was found between the CCr of age-matched very fit & fit subjects, although both groups exhibited the normal reduction in CCr known to occur with increasing chronological age. Frail subjects had significantly lower CCr than their age-matched very fit & fit counterparts, suggesting that frailty imposes an additional decrement on CCr in old age.
3 CCr calculated from the usual 24h urine collection was found to be accurately & reliably predicted when urine collections of about 8h were instead employed. Time of day over which the collection was carried out appeared to have little effect on prediction accuracy, although an overnight urine collection is probably the simplest &

vii
most convenient to carry out. Neither diuretic use, magnitude of measured CCr nor frailty influenced the accuracy of CCr prediction.
4 CCr was predicted using serum creatinine concentration in conjunction with a variety of equations available for the purpose. Accuracy of prediction was greatest when equations were employed which incorporated patients age & bodyweight, but in all cases this method was found to be less reliable than those using reduced urine collection times. Accuracy of CCr prediction by equation was not influenced by diuretic use, although those subjects with the lowest CCr, who were mostly frail, tended to have CCr overpredicted.
5 Elimination t^^2 and serum & renal clearance of frusemide were measured and compared between groups of fit & frail elderly subjects. Those subjects taking Frusemide BP tablets cleared FRU less efficiently than those taking Frumil tablets. No significant difference was found between the mean % dose recovered in urine of the fit & frail groups. FRU tended to be increased & FRU clearances reduced in the frail groups. CCr was also significantly lower in the frail groups. When fit & frail subjects taking Frumil were age-matched, the rate of FRU excretion remained slightly reduced in the frail group. While CCr appears to be more important than frailty in the determination of the rate of FRU elimination, frailty is associated with a reduced CCr below that expected from age alone.
6 Paracetamol was selected as a model drug to compare the efficiency of hepatic drug clearance between fit & frail

viii
elderly subjects. The frail group had a significantly increased elimination reduced serum clearance &reduced recovery of urinary PAR + metabolites. The frail group was significantly older, and so fit & frail subjects were age-matched and again compared? similar trends remained. While impaired absorption in frail subjects could explain the reduced clearances observed in this group, the increased tl/2 could not be accounted for in this way. These results suggest that hepatic drug clearance is impaired in frail subjects.
7 Serum & renal clearance of digoxin were compared between groups of fit & frail subjects, all of whom had been regularly taking DIG for a variety of cardiovascular conditions, and were known to be in steady-state. Clearance was found to be significantly reduced in frail subjects who also had a reduced CCr, while % dose recovered in urine over 24h was similar between both groups. When fit & frail subjects were matched for CCr this trend was lost. These results suggest that the additional reduction in CCr associated with frailty, rather than frailty per se, may impair the efficiency of DIG elimination in the frail elderly.
8 Results from this thesis suggest that when drugs are prescribed for frail elderly patients, dosage levels should take into account the additional decrement in renal & hepatic drug clearance which appears to be associated with this state. If frail elderly patients received reduced dosages compared to their fit counterparts, the excess of dose-related adverse drug reactions known to occur in elderly people may be prevented.

ix
CONTENTSpage
Dedication Acknowledgements Abbreviations Medical Abbreviations Abstract
CHAPTER ONE : INTRODUCTION 11.1 Physiological & Pharmacokinetic changes of old age 2
1.2 Who are the frail elderly? 71.3 Creatinine clearance studies in the elderly 101.4 Drug studies in the elderly 121.4.1 Frusemide 131.4.2 Paracetamol 171.4.3 Digoxin 191.5 Scope of thesis 25
CHAPTER TWO : MATERIALS & METHODS 282.1 Compounds 282.2 Human volunteers 292.2.1 Administration of drugs 302.2.2 Treatment & storage of biological samples 302.3 Instrumentation 312.3.1 Radioimmunoassay 312.3.2 Analysis of digoxin 312.3.3 High performance liquid chromatography 322.3.4 Analysis of creatinine 332.3.5 Analysis of frusemide 362.3.6 Analysis of paracetamol 382.4 Statistical analysis & treatment of data 41
1
iiiiivvi

X
CHAPTER THREE : CREATININE CLEARANCE IN ELDERLY PEOPLE 433.1 Introduction 4 33.2 Procedure 4 33.3 Results of CCr studies 453.3.1 Influence of diuretics on CCr prediction 493.3.2 Measured v predicted CCr 503.3.3 Influence of frailty on CCr prediction 523.5 Discussion 903.5.1 CCr in elderly people 903.5.2 Influence of diuretics on CCr 933.5.3 Influence of frailty on CCr 933.6 Prediction of CCr 953.6.1 Prediction of CCr from 98reduced urine collections3.6.2 Prediction of CCr from SCr & equations 1013.7 Conclusions 106
CHAPTER FOUR : FRUSEMIDE EXCRETION IN ELDERLY PEOPLE 1084.1 Introduction 1084.2 Procedure 1084.3 Results of Pharmacokinetic Parameters 1104.3.1 Frumil v frusemide 1104.3.2 Females v males 1104.3.3 Subjects taking Frumil 1104.3.4 Subjects taking frusemide 1114.4 Comparison of Parameters for Fit v Frail 1124.4.1 Subjects taking Frumil 1124.4.2 Subjects taking Frusemide 1134.4.3 Age-Matched group taking Frumil 1134.5 Discussion 1164.5.1. Frusemide kinetics 1164.5.2 Elimination half-life 1174.5.3 Apparent serum clearance of Frusemide 127

xi
4.5.4 Renal clearance of Frusemide 1284.5.5 Urine volume & Frusemide dose 1314.5.6 Frusemide recovery in urine 1314.6 Frusemide Kinetics in Fit & Frail Elderly 1324.6.1 Comparison of age 1324.6.2 Mobility score 1334.6.3 Comparison of elimination half-lives 1334.6.4 Comparison of apparent serum clearance 1354.6.5 Comparison of renal clearance 1364.6.6 Comparison of urine volume & %Du 1364.6.7 Age-matched subjects taking Frumil 1384.7 Conclusions 138
CHAPTER FIVE : PARACETAMOL METABOLISM IN THE ELDERLY 1455.1 Introduction 1455.2 Procedure 1455.3 Results of Pharmacokinetic Parameters 1475.3.1 All subjects 1475.3.2 Female subjects 1485.3.3 Male subjects 1485.3.4 Comparison of male and female results 1495.4 Comparison of Parameters for Fit v Frail 1505.4.1 All subjects 1505.4.2 Female subjects 1505.4.3 Male subjects 1515.4.4 Age-sex matched pairs 1525.5 Discussion 1555.5.1 Introduction 1555.5.2 Paracetamol kinetics 155 *5.5.3 Elimination half-life 1565.5.4 Apparent clearance 1585.5.5 Free paracetamol in urine 1605.5.6 Paracetamol glucuronide & sulphate excretion 160

xii
5.5.7 Total urinary paracetamol 1615.6 Paracetamol Kinetics in Fit & Frail Elderly 1615.6.1 Sex difference 1615.6.2 Comparison of age 1615.6.3 Mobility scores 1625.6.4 Comparison of elimination half-lives 1625.6.5 Comparison of apparent clearance 1625.6.6 Comparison of free paracetamol in urine 1635.6.7 Comparison of paracetamol glucuronide & sulphate conjugates in urine
164
5.6.8 Comparison of total paracetamol in urine 1645.6.9 Comparison between age-sex matched groups 1655.6.10 Relevance of tobacco & alcohol consumption 1665.7 Conclusions 167
CHAPTER SIX : DIGOXIN EXCRETION IN ELDERLY PEOPLE 1766.1 Introduction 1766.2 Procedure 1766.3 Results of Pharmacokinetic Parameters 1796.3.1 Female subjects taking Digoxin 1796.3.2 Male subjects taking Digoxin 1806.3.3 Comparison of female & male results 1816.4 Comparison of Parameters for Fit & Frail 1826.4.1 All subjects 1826.4.2 Female subjects 1836.4.3 Male subjects 1846.5 Discussion 1886.5.1 Digoxin dose & usage 1886.5.2 Serum digoxin levels 1906.5.3 Total body clearance of digoxin 1946.5.4 Renal clearance of digoxin 1996.5.5 Non-renal excretion of digoxin 2006.5.6 Urinary excretion of digoxin 201

xiii
6.6 Digoxin Excretion in Fit & Frail Elderly 2036.6.1 Sex difference 2036.6.2 Comparison of age & mobility score 2036.6.3 Comparison of digoxin dose & [SDIG] 2046.6.4 Comparison of excretion of digoxin in urine 2056.6.5 Comparison of digoxin clearance 2066.7 Conclusions 208
CHAPTER SEVEN : STUDIES IN FIT & FRAIL ELDERLY PEOPLE 212
One Anothers Light 224
REFERENCES 225
APPENDICES 235Appendix A 236Appendix B 238Appendix C 243Appendix D 280Appendix E 311Appendix F 337

1
CHAPTER ONE INTRODUCTION
At present about 20% of the British population are aged 60 years or over and demographic trends indicate a continual expansion in the proportion of elderly people in developed countries in the foreseeable future (1,2). This increase is predicted to be steepest in the very elderly age group, and while the UK already has 2 million people aged over 80, 12% of the population will be over 75 by the year 2020 (3,4). Disability increases with age and over 40% of retired people are limited in their activities by chronic ill health, with this figure increasing sharply for the very elderly (5). The proportion of those who are housebound increases from 1% of the population in the age group 65-69 to over 20% after 85 (6,1).From these statistics it is not surprising that the elderly are the major consumers of prescribed medication, and figures from the British Pharmaceutical Industry for 1985 indicate that they account for 35-40% of drug expenditure (3,7). Adverse drug reactions are known to be two to three times more likely in the elderly age group due to their increased drug consumption and altered drug response.In recognition of these patterns of drug use & misuse licensing authorities have now set down requirements for studies to be conducted on new drugs in old age. As FI Caird commented "For new drugs likely to be a risk for the elderly there are stringent requirements for testing in old age, and close monitoring. Thus what has for years been immoral & unethical has suddenly become compulsory” (8).

2
1.1 PHYSIOLOGICAL & PHARMACOKINETIC CHANGES OF OLD AGEVarious physiological changes associated with the normal ageing process are implicated in the excess of adverse drug reactions occurring in old age. The main changes seen even in the absence of specific pathology are listed belowi) decreased gastric acid secretion & reduced GX motilityii) altered body compositioniii) decreased plasma albumin concentrationiv) decreased liver mass & hepatic blood flowv) decreased renal blood flow, GFR & tubular secretion
These physiological changes can influence pharmacokinetic profiles via alterations in drug handling during absorption distribution, metabolism and/or excretion as given below.
Drug AbsorptionChanges in function of the gastrointestinal tract in old age include a reduction in gut surface area, a decrease in gastric parietal cells leading to reduced gastric acid secretion (to elevate luminal pH), and impaired splanchnic blood flow, gastric motility & gastric emptying (9,10).Most drugs in clinical use are absorbed via passive diffusion and neither rate nor extent of absorption appears to be significantly delayed following these age-related changes (11). Studies comparing the rate & extent of absorption of paracetamol, sulphamethizole, phenylbutazone, lorazepam & aspirin have shown no difference between groups of young & elderly subjects (12,13,14). However, active transport mechanisms appear not to function as well in the elderly and the absorption of some vitamins & minerals such as iron, calcium & thiamine may be impaired (15,16).

3
DistributionBody composition changes with age when the proportion of lean body mass and body water declines and adipose tissue increases (9). Studies relating muscle mass to age have shown a 30% reduction by the age of 80, and this figure is further increased by ill health & immobility (17). While this trend is seen in both sexes, elderly males tend to retain a greater proportion of muscle : adipose tissue than their female counterparts of similar age & weight (17).
The degree of plasma protein binding also determines drug distribution. Many basic drugs have a high affinity for oxacid glycoprotein whose concentration tends to increase in old age (18). Binding of basic drugs such as propranolol may thus increase in the elderly but this change is not considered clinically relevant. Acidic drugs have a higher affinity for plasma albumin whose concentration declines in old age (18). While this decrease is small in the healthy elderly, differences are more pronounced in the presence of chronic disease and also malnutrition, thought to affect up to 12% of those aged over 80 (19). Thus binding of acidic drugs is reduced in old age but again clinical relevance is usually not significant. However, when an increase in free fraction occurs in conjunction with pharmacokinetic changes greater clinical significance may be assumed.
Hepatic MetabolismMetabolism by the liver is, for the majority of drugs, the rate-limiting factor in their duration of action, and many studies have been conducted in an attempt to determine whether the efficiency of hepatic metabolism is compromised in the elderly. Hepatocytes carry out a range of reactions

4
which contribute to the removal of drugs, traditionally termed Phase I & Phase II biotransformations. Phase I reactions include oxidation, reduction & hydrolysis which render drugs more polar. Phase II reactions involve conjugation of the drug or its Phase I metabolite(s) to a larger endogenous substituent such as glucuronide, sulphate or acetate to give a much more polar compound, facilitating excretion into urine. Whilst no clear pattern has arisen from studies into age-related changes in drug metabolism, two general trends have emerged :-i) drugs undergoing hepatic microsomal oxidation (Phase I) are likely to be more slowly metabolised in the elderly (eg. diazepam) whilst those that are conjugated (Phase II) are usually not influenced by age (eg. lorazepam),ii) drugs with high hepatic clearances & extraction ratios, which undergo extensive first-pass metabolism during oral dosing, may show substantially increased bioavailability in old age (20).These trends associated with hepatic senescence could be due to either a decrease in number or activity of enzymes responsible for biotransformation, or a reduction in rate of drug delivery to the liver (impaired hepatic blood flow)
Hepatic blood flow, rather than microsomal-enzyme activity, is the major determinant of total clearance of many commonly used drugs that are collectively termed "flow limited" or "highly extracted" drugs (eg. chlormethiazole). Studies have shown conclusively that apparent hepatic blood flow declines with age, by about 35% in those over 65 years compared to those under 40 years, even after allowing for changes in body weight (21). Furthermore, liver perfusion (liver blood flow per unit of liver volume) has also been

5
found to fall by about 11%. The relevance of this is that drugs which are readily metabolized by the liver will exhibit an increased bioavailability after oral dosing since the degree of first-pass metabolism is reduced.
Other drugs undergo "capacity limited" metabolism when the hepatic extraction ratio is low (eg antipyrine,imipramine). Studies have failed to show a correspondence between activity or affinity of specific Phase I enzymes & chronological age in humans (19,20,21,22). However, using ultrasound it has been shown unequivocally that liver volume is negatively correlated with age, when expressed in absolute terms or in relation to body weight, and a 28% fall in liver volume has been noted in those over 65 years when compared to those aged less than 40 (21).Thus changes in liver size may be the major factor determining decreased elimination of capacity-limited drugs with age, and any changes in enzyme activity are secondary to this, at least in the healthy elderly (21).
To date, the consensus of opinion is thus : liver size & blood flow declines with increasing age, and the reduced elimination of both capacity-limited & flow-limited drugs seen in the elderly is likely to be due to these morphological and physiological changes. These changes may at least in part explain the excess of dose-related adverse drug reactions in old age. Unfortunately there is no easy way of assessing the efficiency of an individuals hepatic drug clearance before initiating treatment with hepatically metabolised drugs. This emphasises the need for research into the change in hepatic function in old age.

6
Renal ExcretionThe best documented alteration in pharmacokinetics with age is the reduction in rate of renal drug elimination.Between the fourth & eighth decades of life human kidneys lose approximately a fifth of their weight from a variety of morphological changes (23). Beginning in mid life, renal blood flow decreases progressively from about 600ml/min at age 40 to 300ml/min at age 85 (24). Similarly a normal GFR of 120ml/min at age 40 declines to about 60ml/min at age 85 and this closely correlates with a decline in creatinine clearance (25). Tubular mass declines in a comparable way to renal blood flow & GFR, and both tubular secretion & reabsorption are impaired in old age (24). Essentially, ageing produces impaired homoeostatic flexibility, with the kidneys less able to conserve water and salts, and also less able to handle a water or solute load (26,27).
For any drug whose clearance is accomplished entirely or partially by renal excretion of the parent drug, rate of elimination will decline in proportion to the inevitable reduction in GFR and tubular secretion observed in old age. Thus accumulation of the parent drug or renally excreted metabolites may occur if drug dosages are not altered appropriately when prescribing for elderly people. Fortunately renal function may be estimated by a variety of methods to facilitate the accurate calculation of drug dosage levels when renally cleared drugs with a narrow therapeutic window are prescribed. The accuracy with which renal function may be predicted has itself been subject to extensive research since errors in prediction could lead to inappropriate therapy.

7
1.2 WHO ARE THE FRAIL ELDERLY?Even in the absence of discernable disease there is a substantial heterogeneity in the physiological abilities of old people. Some remain independent until well into their ninth decade, exhibiting little loss of function even atthis advanced age, while others require full care soonafter retirement. It is possible that lifestyle rather than the intrinsic ageing process underlies much of the age change in physiological processes. To date few studies have attempted to identify physiological and biochemical differences between those elderly who are generally fit and active and those who are almost entirely dependent on others in the absence of acute physical illness. Mostresearch into drug handling in old age has concentrated ongroups of "fit individuals", frequently ill defined, and implicit extrapolations have subsequently been made for frail patients (28). The fit elderly are undoubtedly an easier group to study since they are able to give valid informed consent, and are free from disease and subsequent medications which may confound the effect of old age per se. Conversely, their less fit counterparts are frequently unable to give informed consent, posing a range of ethical dilemmas before the trial outset; in addition, they will almost without exception be receiving medications which may interfere with the studies.The first attempt to standardize the selection of subjects for studies into the effects of ageing was made when a working party was set up within the framework of the European Community EURAGE Concerted Action Programme on Ageing. The resulting document, "The Senieur Protocol", was published in 1984 to establish strict admission

8
criteria for studies on immunogerontology in man, based on clinical information and biochemical data, and setting limits for pharmacological interference (29). The aim was to contribute to the dissection of the influence of disease versus ageing on the immune system. However, the exclusion criteria set down to select healthy participants is extreme and impracticable for the purposes of the present set of investigations.An alternative operational definition has been proposed by a second group in an attempt to dissociate biological and chronological age and the terms "fit" & "frail” have been coined for this purpose (28); their definitions are below The fit elderly are individuals, over 65 years of age, living independently at home or in sheltered accommodation. They are freely ambulant and without significant hepatic, renal, cardiac, respiratory or metabolic disorder on either clinical examination or laboratory investigation. They do not receive regular prescribed medication.The frail elderly are individuals, over 65 years of age, dependent on others for activities of daily living, and often in institutional care. They are not independently mobile; whilst they do not have overt cardiac, respiratory, hepatic, renal or metabolic disease minor abnormalities may be revealed on laboratory investigation. They may require regular prescribed drug therapy. Conditions contributing to frailty commonly include Alzheimer's disease, multiinfarct cerebro-vascular disease, Parkinsonism, osteoporosis, osteoarthritis, and healed fracture events.
Although the distinction proposed is based primarily on social and functional criteria it is paralleled by psychological and physiological differences. Using these

9
definitions differences in hepatic function between the fit & frail elderly has undergone investigation. While the fit elderly exhibit the normal biological reduction in liver volume & blood flow associated with old age the frail elderly appear to possess an additional decrement in hepatic function to further reduce hepatic drug metabolism, which may be due to a reduction in the specific activity of some hepatic enzymes (19,20,22,30). While the fit elderly similarly undergo a reduction in renal function as a normal consequence of ageing, it has yet to be determined whether an additional decrement is imposed upon the frail elderly to further reduce drug clearance beyond that expected. The frail elderly also appear to have reduced mental function, reduced total body potassium, alterations in electrolytes, and a reduced serum albumin is apparently common (28).
Distinction between apparently different groups of elderly people is obviously important in the field of gerontological research and geriatric practice. However, the definitions above appear to exclude the majority of elderly people who are usually cared for by General Practitioners, who have the appearance of '•fitness11 whilst taking regular medications for well controlled chronic conditions. It seems important that the differences between these elderly subjects and their less fit counterparts, who have similar chronic conditions but are nevertheless considerably more infirm, be examined. Therefore, the main aim of this thesis was to successfully identify, define and compare these groups of elderly people, in terms of renal function and hepatic & renal drug clearance.

10
1.3 CREATININE CLEARANCE STUDIES IN ELDERLY PEOPLE For drugs whose clearance is accomplished entirely or partially by renal excretion of the intact drug, total clearance will predictably decline in approximate proportion to the reduced GFR. It is therefore desirable to know the GFR of a patient before such drugs are prescribed to prevent accumulation, particularly when the therapeutic window is narrow.Creatine occurs almost exclusively in muscle where it serves to guarantee the continuous supply of energy necessary to perform work. The breakdown of creatine liberates energy and creatinine is the final metabolic product of this process. Creatinine is released into the bloodstream at an almost constant rate in a person not taking severe exercise and in the absence of active muscle damage, and subsequently renally excreted mainly by glomerular filtration, although a variable amount is actively secreted by the renal tubules (31,32).For some time it has been recognized that knowledge of renal function would be advantageous in order to assess the degree of renal damage in certain disease states, to measure changes in renal function over time, and to aid prescribing of drugs. For GFR to be accurately measured the ideal substance should be metabolically inert and excreted exclusively by glomerular filtration, ie. neither reabsorbed nor secreted by renal tubules. In 1926 it was suggested that since creatinine is produced at a constant rate, and excretion is mainly via glomerular filtration, measurement of endogenous creatinine clearance (CCr) would provide a good estimate for GFR (33). This could be practically carried out by collecting urine for 24 hours

11
and comparing the quantity of creatinine excreted in urine with the concentration of creatinine in serum. Since the rate of urine production would be known, creatinine clearance could then be calculated as for any other clearance value, to give an estimate of GFR.Since this time many studies have been carried out to compare CCr with GFR measured by other more specific methods. Serum creatinine concentration (SCr) has also been suggested to provide a good estimate of renal function with the advantage that it is easier to obtain (34,35). However, the decline in muscle mass & lean body mass in old age is often overlooked, and since SCr levels depend upon creatinine turnover as well as renal function, the reduced renal function in the elderly usually does not give a meaningful elevation in SCr (36). To many it appeared that the most helpful & easily obtained result would be if SCr was measured and then used to predict CCr by use of a mathematical formula. Various formulae have subsequently been produced, the earliest in 1959 (37), and to date 12 equations & 4 nomograms exist. Further studies have attempted to determine which, if any, formula most accurately predicts CCr in healthy individuals and in those with specific disease states. One problem addressed in this thesis is whether these formulae predict CCr equally well in both fit & frail elderly subjects. Accuracy of CCr prediction using formulae is also compared with that using a urine collection of less than 24 hours duration. If CCr can be accurately predicted, prescribing of drugs which are renally cleared may thus be made safer in this age group who are at greatest risk of adverse drug reactions.

12
1.4 DRUG STUDIES IN ELDERLY PEOPLEA number of studies have been conducted to determine which groups of drugs the elderly are most frequently prescribed, and of those, which are associated with the highest incidence of adverse reactions. The most recently published study to examine drug use in patients admitted to hospital found that out of all the principal drug groups prescribed, diuretics were the most commonly prescribed drug, identified in over 40% of admissions (38). Also significant in patients' drug regimes were hypnotics & anticonvulsants (25%), analgesics & antipyretics (25%) and digitalis alkaloids (16%). For this population, adverse drug reactions were identified in 10% of subjects taking medication, and drug classes most frequently implicated were antidysrhythmics, antihypertensives, NSAIDS, diuretics and digitalis alkaloids.
The aim of this thesis was to examine the efficiency of drug elimination in elderly people and to determine whether frail subjects exhibited an altered pattern of excretion when compared to their fit counterparts. This would be most relevant if the drugs which were most commonly prescribed and frequently implicated with an excess of adverse drug reactions were investigated. When drug usage in the Bath area was examined, both in the community and hospitals, frusemide, either alone or in combination with amiloride, was the diuretic most frequently prescribed. Frusemide is eliminated mainly via renal excretion, and so it seemed appropriate to choose a second drug which is hepatically cleared to compare the two modes of drug clearance. Paracetamol was found to be the most commonly used drug known to be solely hepatically cleared. The

13
excess morbidity & mortality associated with digoxin use has been well documented for many years, and this seemed to be a suitable third drug for close investigation.Therefore, in addition to the studies relating to measurement & prediction of CCr in fit & frail elderly people, this thesis was extended to investigate the efficiency of excretion/metabolism of three "model" drugs, that is, frusemide & digoxin which undergo mainly renal excretion, and paracetamol whose elimination is accomplished via hepatic metabolism.
1.4.1 FRUSEMIDEThe elderly receive a disproportionate number of drugs on prescription, and diuretics are one of the most common classes prescribed - it has been estimated that one third of people aged over 65 take a diuretic (39,40,41). By definition a diuretic induces a diuresis of water & solutes with the loss of sodium essential for the anti-oedema effect. However, sodium loss is inevitably accompanied by loss of other ions, and this is a potentially serious side- effect (42). Modern diuretics have revolutionized the treatment of oedema, and removal of fluid from peritoneal & pleural cavities by aspiration, or from the limbs by the insertion of tubes, is now rarely practised (43). Although these agents are invaluable in the control of hypertension, congestive cardiac failure & other oedematous conditions, widespread use of diuretics is often questionable, and some older persons undoubtedly receive diuretics inappropriately to reduce gravitational ankle oedema (39). Thus the risk- benefit ratio should always be considered before initiating diuretic therapy, and their prescription should be regularly reviewed during chronic therapy (42).

14
Mode of Action and Therapeutic UsesFrusemide (furosemide, FRU) is a member of the group of ••loop” or "high-ceiling" diuretics - the others are bumetanide, piretanide & ethacrynic acid. All have a rapid onset of action, cause a brisk diuresis and have a short duration of action (32). FRU is a "loop" diuretic since it appears to inhibit specific enzymes concerned with pumping chloride ions (and therefore NaCl) across lining cells of the ascending limb of the loop of Henle. The site of action is reached intraluminally after the drug has been excreted by the proximal tubules. Potassium secretion into the distal convoluted tubule is increased because of the exchange of potassium for sodium, under the influence of aldosterone and increased intraluminal sodium, and this leads to increased potassium loss. In addition to the effects on ions, FRU increases blood flow through the renal medulla. This tends to reduce efficiency of the counter- current multiplier system in the loop, since this depends on a hypertonic medulla, resulting in less reabsorption of water from the collecting tubules (32,42,44). In addition, FRU is also thought to cause systemic venous dilatation and hence a reduction in cardiac pre-load. This property is utilized in the treatment of acute pulmonary oedema, where i.v. FRU will reduce pulmonary venous pressure and vascular congestion within a few minutes, well before it has an appreciable diuretic effect (44).FRU is used to treat a number of conditions including acute pulmonary oedema, acute & chronic renal failure, hypertension, and peripheral oedema associated with cardiac failure, hepatic disease, nephrotic syndrome, and drug use (eg carbenoxolone). FRU is prescribed at a daily dose of
15
20 to 160mg as a diuretic. In chronic renal insufficiency doses may vary from 250 to 2000mg a day (45,46).
Interactions and ToxicityFRU diminishes the excretion of lithium whose dose should be halved. Hypokalaemia potentiates the effects of cardiac glycosides and diminishes the effects of anti-arrhythmic drugs such as procainamide & quinidine. The nephrotoxic & ototoxic effects of aminoglycoside antibiotics are potentiated by FRU. Drugs which promote sodium reabsorption eg. oestrogen, can antagonize the effect of FRU. Drugs which promote potassium excretion, eg. corticosteroids, may act additively with FRU to produce serious hypokalaemia. Non-steroidal anti-inflammatory drugs, in particular indomethacin, can interact with FRU, probably via their action on renal prostaglandins, inhibiting the diuretic effect of FRU. FRU in combination with a potassium-sparing diuretic such as amiloride, can cause hyperkalaemia when given concomitantly with an ACE-inhibitor (32,44,47).The most common side-effect associated with FRU therapy is fluid & electrolyte imbalance and hypotension. Other side- effects are relatively uncommon and include allergy, nausea, diarrhoea, blurred vision, skin rashes, tinnitus & deafness. FRU may provoke hyperuricaemia, and less frequently, hyperglycaemia. FRU therapy in the elderly is particularly likely to provoke hypokalaemia, and malnutrition increases this risk. In elderly women incontinence may be exacerbated by loop diuretics, and elderly men with benign hypertrophy of the prostate may suffer from acute retention of urine following a large volume diuresis. Interference with social activities can also occur (40,47).

16
FRUSEMIDE DISPOSITION Absorption and DistributionFRU is incompletely but fairly rapidly absorbed from the gastrointestinal tract, with a bioavailability of around 61% (48). Following absorption, FRU is extensively bound to the plasma protein albumin, with the usual percentual binding of 97.7% decreasing in renal impairment, advanced illness and old age (49,50,51,52). Peak plasma concentrations occur about 60 minutes after oral ingestion, and although the extent of FRU absorption may be reduced in severe cardiac failure (53,54), age does not appear to influence FRU absorption (55). Effects of an oral dose are seen within an hour of administration, and last for 4-6h. When given i.v. FRU takes effect after 5 minutes, with a duration of action of around 2h (47).
Metabolism and ExcretionFRU has a biphasic half-life, the terminal phase representing elimination, which has a half-life of about 90 minutes (53,56,57,58). Elimination is prolonged in renal impairment, acute pulmonary oedema & congestive heart failure and also in old age (57,58,59,60,61,62). FRU is mainly excreted unchanged in the urine, with active tubular secretion, via the nonspecific organic acid pathway excreting bound FRU, and glomerular filtration eliminating free drug (48). Metabolism to FRU-glucuronide appears to occur, and CSA (4-chloro-5-sulphamoyl-anthranilic-acid) may be another metabolite although this is controversial (58,60 62). FRU is also excreted into the bile (53,61). Non-renal excretion is thought to become more important when renal function is compromised (59,60).

17
1.4.2 PARACETAMOLAcetanilide was first introduced into medicine in 1886 as an antipyretic but was found to increase methaemoglobin (32). The search for safer alternatives led to the development of phenacetin & paracetamol, derivatives of acetanilide. Phenacetin was initially very popular until it was found to possess nephrotoxic properties - this led to a subsequent decline in usage (63). From this point on the use of PAR increased and it is now widely used for many minor complaints.
Mode of Action & Therapeutic UsesParacetamol (acetaminophen, PAR) is a moderately water & lipid soluble weak organic acid with a pKa of 9.5 which is largely unionised over the physiological range of pH (64). It has antipyretic & analgesic actions similar to aspirin but only a weak anti-inflammatory action (65). Its mode of action may be similar to that of aspirin and dependent on inhibition of prostaglandin synthesis (66). PAR is used to treat a variety of conditions including mild pain, headache dysmenorrhoea & pyrexia. It is invariably taken orally, in an adult dose of 500-1000mg every 6-8h (max 4g/24h). It is often used in combination with other analgesics eg codeine.
Interactions and ToxicityPAR interacts with phenytoin & phenobarbitone which increase its metabolism, probably through enzyme induction (67,68). PAR metabolism is also increased by desipramine (69) and reduced by chloramphenicol (70).Adverse affects are rarely seen with therapeutic doses - skin rashes & haematological reactions have been noted (71). Liver damage resulting in jaundice, and kidney

18
damage may follow chronic use of PAR (66,72). In overdose however, paracetamol can be extremely toxic with only 7g causing acute centrilobar hepatic necrosis, and 15g causing death (47). The mechanism of hepatic toxicity involves a highly reactive metabolite which is usually inactivated by conjugation with hepatic glutathione. Hepatic glutathione is rapidly used up by toxic doses of PAR, and when stores are reduced to less than 30% of normal, excess metabolite is free to combine with cell constituents to cause damage (73). There are no clinical manifestations of poisoning and maximum abnormalities of liver function tests can be delayed for 3 days? the plasma PAR concentration is therefore often used as a guide to prognosis. Exogenous glutathione does not enter cells readily but precursors such as methionine and N-acetyl cysteine can penetrate to combine with the intermediate and avert hepatic toxicity if administered sufficiently early (32).
PARACETAMOL DISPOSITION Absorption and DistributionParacetamol absorption is negligible from the stomach but rapid from the small intestine? peak plasma concentrations occur 30-120 minutes after ingestion of solid dose formulations (12). Absorption rate is influenced by gastric emptying rate which is increased by posture & drugs such as metoclopramide, and reduced by food and drugs such as morphine & loperamide? extent of absorption is unchanged. Age does not appear to affect the rate or amount of PAR absorbed (12,13,74). PAR undergoes dose-dependent first- pass metabolism with 90% bioavailability for a lg dose, and distributes throughout most tissues & fluids except CSF & fat, with no protein binding at a therapeutic dose (64).

19
Metabolism and EliminationPAR is extensively metabolised with only 2-5% of a therapeutic dose appearing unchanged in urine - the major metabolites are sulphate & glucuronide conjugates. A minor fraction is converted by cytochrome P-450-dependent hepatic mixed function oxidase to a highly reactive intermediate, usually inactivated by further conjugation with glutathione which is metabolised into PAR cysteine & PAR mercapturic acid. In healthy subjects approximately 85-95% of a lg dose appears in urine within 24h? about 4% as unchanged PAR, 55% as glucuronide, 30% as sulphate, 4% as cysteine & 4% as mercapturic acid conjugates (75). These proportions may change in old age? the percentage of PAR glucuronide may increase and the percentage of PAR cysteine decrease with increasing age (76).PAR is filtered at the glomerulus with subsequent extensive reabsorption, while PAR conjugate clearances suggest active renal tubular secretion (77). Plasma PAR concentration-time curves are multiexponential with a short half-time for the initial distribution phase (about 3-19 minutes). The elimination phase undergoes first order kinetics from 2-12h post-dose, with a half-life in the range of 1.9-2.5h (78). Total body clearance is about 5ml/kg/min in healthy young volunteers but may be reduced in old age (13,74,79,80,81).
1.4.3 DIGOXINDigitalis has been in clinical use for many centuries with the first description of its therapeutic effect in cardiac oedema published by William Withering in 1785. The active components of digitalis are collectively termed "cardiac glycosides”, and all share an aglycone ring wherein the pharmacologic activity resides, combined with one to four

20
sugar molecules that modify the pharmacokinetic properties (42,44). All have characteristic electrophysiological & inotropic effects on the heart (82), but isolation of the individual components has led to production of standardized formulations. By far the most commonly prescribed glycoside used in the UK is digoxin, although digitoxin is occasionally used as an alternative. All subjects in the "Digoxin Study” were prescribed digoxin and so the scope of this thesis is limited to discussion of digoxin alone.
Mode of Action and Therapeutic UsesDigoxin (DIG) is a polar compound consisting of a steroid nucleus with an OH side group (44), and its two main pharmacological properties utilized in therapeutics are(i) the production of complex electrophysiological changes in cardiac conducting tissue to slow heart rate (negative chronotropic effect).(ii) the ability to increase force & velocity of myocardial contraction (positive inotropic effect).
These two properties lend themselves to the use of DIG in the treatment of supraventricular tachyarrhythmias and CCF. In atrial tachycardias (in particular atrial fibrillation) DIG is singularly effective in reducing heart rate to improve ventricular filling, and this property remains beneficial until heart rate falls below 60bpm. In cardiac failure the principal therapeutic action is the positive inotropic effect on the myocardium. The desirability of this is controversial, particularly long term, since the benefit of reducing heart size and thus reducing oxygen demand is offset by an increase in work load and associated oxygen demand of the failing heart in the face of

21
myocardial disease (42,82,83,84,85,86). Thus DIG is no longer the drug of choice for patients with heart failure in sinus rhythm (45,47).
Cardiac glycosides inhibit the ATPase responsible for the sodium pump. Their electrophysiological effects are thought to be due to changes in transroembrane potential brought about directly by that inhibition. The effect on cardiac muscle is probably due to changes in intracellular free calcium secondary to changes in intracellular sodium concentrations brought about by that inhibition (44).
DIG has a narrow therapeutic window, and the daily dosage is therefore variable and dependent on a number of factors. When renal function is normal, the recommended maintenance dose is 0.25-0.5mg or 5mcg/kg daily reduced to 0.125-0.25mg or 2mcg/kg daily in old age & renal insufficiency (44,87).
Interactions and ToxicityA number of drugs have been shown to affect DIG pharmacokinetics and these are summarized in Table 1.4.1 (82,88); Interactions of clinical importance are given in bold type.
Table 1.4.1 Agents affecting DIGOXIN pharmacokinetics Alteration AgentsDecreased absorption charcoal, antacids, dietary fibre,
neomycin, cytotoxic agents, kaolin, metoclopramide, sulphasalazineIncreased absorption antibiotics (inhibits gut flora)
anticholinergics (propantheline)Inhibition of renal quinidine, quinine, verapamiltubular secretion spironolactone, trimethoprim,
triamtereneDecreased Vd quinidineIncreased [SDIG] amiodarone,aspirin, diltiazem,(mechanisms unknown) indomethacin, nifedipine,flecainide, nicardipine

22
In addition to these pharmacokinetic interactions, other drugs may give rise to pharmacodynamic interactions. Hypokalaemia is associated with an increased myocardial sensitivity to DIG (89), which may be induced by a variety of drugs eg. corticosteroids, potassium wasting diuretics, acetazolamide and carbenoxolone (45,46). Myocardial responsiveness may also be enhanced by other electrolyte disturbances eg. hyperkalaemia, hypercalcaemia and hypomagnesaemia, also hypoxia & acidosis (88).
Disease states known to affect response to DIG are given in Table 1.4.2 (42,82). Although old age is not especially associated with increased myocardial sensitivity, DIG elimination rate is reduced due to the inevitable decline in renal function (90,91,92). In addition, DIG Vd is reduced in old age and changes in body composition also influence DIG distribution to increase [SDIG] (9,10,93).
Table 1.4.2 Effect of disease state on response to DIGDisease State Altered ResponseRenal disease decreased DIG elimination & VdCCF decreased DIG elimination
increased Vd in oedematous patientHyperthyroidism reduced myocardial sensitivity
increased renal elimination & VdHypothyroidism enhanced myocardial sensitivity
reduced renal elimination & VdGastrointestinal decreased absorption, vomitingdisease & diarrhoea may reduce [K ]Muscle wasting disease reduced binding to skeletal musclePulmonary disease increased myocardial sensitivity
during hypoxia & acidosisAcute MI increased myocardial sensitivityHepatic disease no significant changesDiabetes insipidus no significant changesobesity no significant changes

23
Although knowledge of [SDIG] is generally thought to be useful in the diagnoses of both DIG toxicity & sub-maximal therapy, interpretation depends not only on the absolute level but also on the clinical status of the subject, since presence of factors known to influence myocardial response affect the clinical outcome. This is discussed in chapter 6
Toxicity is dose related, but the threshold at which signs first appear varies greatly between individuals (89,94). Symptoms of DIG toxicity fall into five categories as given in Table 1.4.3 (42,46,85,93). Moreover, the less serious manifestations of toxicity do not serve as a reliable warning of cardiotoxicity which is potentially fatal (93).
Table 1.4.3 Clinical features of digoxin toxicitySystem Signs & SymptomsGastrointestinal anorexia, nausea, vomiting,
diarrhoea salivationNeurological malaise, fatigue, confusion,
facial pain, insomnia, depression, vertigo, hallucinations, dizziness, coloured and hazy vision (green or yellow haloes), transient psychosis, sweating
Cardiological palpitations, arrhythmias, syncopebradycardia, heart block
Blood high SDIG level with low potassiumMiscellaneous gynaecomastia, skin reactions
DIGOXIN DISPOSITION Absorption and DistributionLimited absorption takes place from the stomach and the majority is passively absorbed from the proximal part of the small intestine (95,96) with peak plasma concentrations seen between 45 & 105 minutes after ingestion of a solid dose formulation (82,91). Factors which influence the rate

24
of absorption have little effect on the total amount absorbed, but those which influence the extent of DIG absorption determine [SDIG] at all times (97), as discussed in chapter 6.Following ingestion, 60-70% of the administered dose is available for systemic circulation in most subjects, although this figure can vary, sometimes due to disease, gut flora or tablet formulation (44,47,82,91,98,99,100,101) DIG is widely distributed and so Vd is large (61/kg), but may be reduced in old age & renal insufficiency and increased in hyperthyroidism (82,91,93,98,102,103,104,105, 106). The largest proportion of circulating DIG is taken up by skeletal muscle, with the liver, heart, brain & kidneys also binding smaller amounts (107). DIG is 20% bound to plasma proteins but the large Vd makes any interaction at the site of binding clinically unimportant (47,92,98). DIG does not bind to adipose tissue and dosage calculations are more reliable if based on lean body mass rather than actual bodyweight for obese subjects (108,109).
Metabolism and EliminationAlthough DIG is usually reported to be excreted unchanged in urine, evidence suggests that metabolism may at times be extensive. A number of metabolites have been detected in urine, particularly after chronic dosing, when detection is facilitated by their long elimination half-life (97,98,110, 111). The degree of metabolism varies between subjects, is independent of renal function, and possibly under pharmaco- genetic control (110,112).In most subjects however, renal excretion of unchanged DIG by passive glomerular filtration & active tubular secretion is the most important route of elimination (82,92,98).

25
Approximately one third of the dose absorbed may be excreted by nonrenal routes eg secretion into bile (82). Following i.v. administration, DIG pharmacokinetics may be described by a two- or three-compartment model, although steady state kinetics after multiple dosing may be sufficiently described by a one-compartment model (44,92,93 105,113). Distribution is complete 6h after ingestion, and blood sampling for [SDIG] estimation should be carried out after this time (114). Elimination half-life is variable and related to renal function (91,93,104); estimates of mean t ^ 2 have varied eg. 37h in healthy young subjects,70h in nontoxic elderly people, 79h in those with renal impairment, and the highest values for DIG t-|y2 have been reported as 118h in elderly people with symptoms of toxicity, and 189h in a subject with renal insufficiency (91,93,98,102,104). Total body clearance has also been found to decline in old age & renal impairment (91,98,104). Due to the long attainment of steady-state commonlytakes in excess of a week if a fixed daily dose of DIG is administered (44). In emergencies a therapeutic [SDIG] level may be obtained more quickly by administration of a loading dose, eg. 15mcg/kg in divided doses over 12h (44, 45). However, this is often associated with an increased incidence of gastrointestinal side effects and slower digitalisation is preferable in most non urgent cases (47).
1.5 SCOPE OF THE THESISTo even the most casual observer a substantial heterogeneity in the abilities of old people can be seen to exist, although in the past many studies have considered "the elderly" to form a single homogeneous group. Whilst

26
age-related changes in renal & hepatic function have been extensively investigated, most studies have used "fit" elderly subjects, often ill defined, and the results extrapolated to encompass the entire elderly population. However, recent research has suggested that hepatic & renal function, and consequently drug clearance, may differ between those who are fit & active and those who are frail & immobile (28).Many elderly people living in the community have an appearance of "fitness" whilst having a well controlled chronic disease which requires medication but causes little interference with activities of daily living. Conversely, those elderly people frequently found in nursing homes or long-stay hospital wards have an appearance of "frailty", seeming less well than their active counterparts despite being of similar age and having comparable diagnoses. In addition, those in care tend to be prescribed more drugs and be more severely restricted in their mobility and ability to carry out activities of daily living. Attempts have been made to define particular sub-groups of old people but none appear to encompass the majority.Therefore, the aim of this thesis was primarily to identify and define distinct groups of elderly people who together form the majority of the aged in the community and in care? the two resulting groups were termed "fit" and "frail".
Elderly people consume a disproportionate quantity of drugs and both groups studied were frequent users of prescribed medication. It is often desirable to know a patients renal function before renally excreted drugs are prescribed but CCr is often difficult to accurately measure in elderly patients, particularly when confused or incontinent.

27
CCr was measured in both fit & frail groups and compared to determine whether renal function differed significantly between the groups when matched for sex, age & weight.The estimation of CCr from a single SCr and use of a mathematical equation has been offered as an alternative, with results readily obtained from minimal effort. Since renally excreted drugs are commonly prescribed to both fit & frail elderly people, the accuracy with which CCr is estimated in these groups was examined, using a variety of equations and timed urine collections of less than 24 hours duration.
Following this, the efficiency of renal clearance of frusemide and digoxin was examined and compared between groups. Unfortunately, hepatic function cannot be measured as readily as renal function and so comparable studies could not be conducted to determine whether differences in hepatic function existed between the two groups of elderly people. Therefore, paracetamol was chosen as a model drug and the efficiency of its hepatic clearance measured and compared between the fit & frail groups.
To summarise, the aim of this work was to identify, define and compare groups of fit & frail elderly people in terms of renal function, and hepatic and renal drug clearance. Since frail elderly patients seem to exhibit an excess of adverse drug reactions when compared to their fit counterparts, increased understanding of the differences in efficiency of drug clearance between fit & frail elderly people may reduce the incidence of drug-related morbidity & mortality in those at greatest risk.

28
CHAPTER TWO MATERIALS and METHODS
2.1 COMPOUNDSDrugsi) Frusemide tablets BP 40mg (non-proprietary brands,
supplied by patients own Pharmacy on prescription)ii) Frumil tablets (frusemide 40mg, amiloride HC1 5mg,
Rorer Pharmaceuticals, Eastbourne, Sussex. Various lots supplied by patients Pharmacist on prescription)
iii) Lanoxin tablets (62.5, 125 or 250micrograms Digoxin BP Wellcome Medical Division, Crewe, Cheshire. Various lots supplied by patients Pharmacist on prescription)
iv) Paracetamol tablets BP 500mg (Sterwin Medicines, Guildford. Lot 1EF539, supplied by Pharmacy Dept,St. Martin's Hospital, Bath.)
Analytesi) Creatinine 10.0mmol/l in 0.1M HC1, C4H2N30 mw=113
(BDH Chemicals Ltd., Poole. Lot 7778120H)ii) Creatinine 0.088, 0.265 & 0.883mmol/l in 0.02M HC1
(Sigma Chemical Company. Lot 128F-6149)iii) Frusemide BP (furosemide) C^H^jCl^OgS mw=330.8
(Sigma Chemical Company. Lot 26F-0636)iv) Paracetamol BP (4-acetominophenol, acetaminophen)
CH^CONHCgH^OH mw=151 (Pharmacy, University of Bath)
Solventsi) acetonitrile (methyl cyanide) HPLC grade CH3CN mw=41
(Fisons, Loughborough)ii) isopropanol HPLC grade (CH3)2CHOH mw=60 (Fisons)iii) methanol HPLC grade CH3OH mw=32 (Fisons)

29
Kitsi) Coat-A-Count Digoxin containing digoxin antibody-
125coated tubes, [ I] digoxin & calibrators 0-8 ng/ml (Diagnostic Products Corp., USA. Lot TKDI1 365 & 387).
Other Chemicalsi) acetic acid AR grade CH3C00H mw=60.1 (Fisons)ii) beta-glucuronidase enzyme from Helix pomatia.
activity: 440000 beta-glucuronidase, 15000 sulphatase units/g solid (Sigma. Lot 88F-7325)
iii) orthophosphoric acid 88% AR H3P04 mw=98 (Fisons)iv) potassium dihydrogen orthophosphate KH2P04 mw=136
(Fisons)v) sodium acetate HPLC grade CH3COONa mw=136.1 (Fisons)vi) sodium hydroxide AR grade NaOH mw=40 (BDH)
2.2 HUMAN VOLUNTEERSStudies were carried out in accordance with the Declaration of Helsinki (Venice revision 1983) and studies received approval from the Bath District Research Ethical Committee. Before participation in a study, approval was given by the subjects Consultant Geriatrician or General Practitioner. Volunteers gave informed consent (verbal witnessed or written) and were free to withdraw from the study at any time without explanation. Subjects of both sexes aged between 64 & 100 years were recruited froma) Wards 1, 2, 3, 4, 21 & 22 of St. Martins Hospital, Bath.b) Patients registered with General Practitioners at
St. Mark's Road Surgery, Widcombe, Bath.c) Subjects on the volunteer panel of the Research
Institute for the Care of the Elderly, St. Martins Hospital, Bath.

30
Exclusion criteria were as below :-a) inability to give informed consentb) incontinencec) an acute episode of illnessd) co-medication with drugs interacting with the study drug
Records were made of the following :-a) date of birth and age to nearest yearb) height & weight (surface area calculated from this)c) all drugs currently being taken (prescribed or over-the-
counter), the dose & frequency.d) diagnoses and blood results if availablee) approximate amount of meat consumed during the study
The mobility of each subject was assessed during the study using a mobility rating scale devised for the studies (appendix A2). From their independence, mobility & ability to carry out activities of daily living, each subject was also categorized as fit or frail according to the definitions used during these studies (appendix Al).
2.2.1 Administration of drugsDrugs were administered orally under supervision, taken with a glass of water, in the upright position. Drugs were given in the morning after a light breakfast eaten at least one hour previously, unless otherwise stated. Urine was voided immediately prior to dosing when the time was noted.
2.2.2 Treatment & storage of biological samplesSamples were processed as soon as possible after collection Urine was collected into a plastic jug or bottle for continent subjects, or into a catheter bag for catheterised patients, and saved in sealed plastic bottles labelled with

31
the subjects name and time of voiding. Urine volume was measured and, when required, grouped into aliquots each spanning about 6-8h, before freezing. Blood was taken using plain Vacutainer tubes, labelled, and left to clot for one hour before being spun at 2000rpm for 15m. Serum was then collected & frozen. Frusemide-containing samples were wrapped in silver foil and processed in subdued light. Samples were stored at -20°C prior to analysis; serum in 2x5ml or 2x1.5ml plain glass tubes and urine in 2x20ml or 2x1.5ml aliquots. Samples were defrosted once just before use, and used within their stability period? 6 months for creatinine, 2 months for FRU & DIG, 6 weeks for PAR.
2 . 3 INSTRUMENTATIONDuring periods pf analytical work balances were checked monthly, and pipettes weekly, for accuracy and constancy.
2.3.1 RadioimmunoassayRadioactivity was measured using a LKB Wallac 1275 GammaCounter (Pharmacia Ltd, Milton Keynes). The counter was
125set to the appropriate isotope ( I) and counts measured over 60s. Equipment was operated at ambient temperature.
2.3.2 Analysis of DigoxinDIG was assayed using a commercially available RIA kit. Serum DIG was analysed as per the data sheet (appendix B1). Although the diagnostic kit was intended for use with serum the method was validated using urine diluted with water, and thus the same method was employed to measure urinary DIG. Calibrators supplied were used to construct calibration curves. Urine was diluted 1 in 10 or 1 in 20 to ensure that readings fell within the calibration range.

32
Quantitation of Digoxin in serum & urineThe mean net count for each calibration tube and patientsample were calculated as below :-
net counts = mean count - mean NSB count The binding for each concentration was then found as a percent of maximum binding (MB), with the nonspecific binding (NSB) corrected counts of the A tubes taken as 100%
percent bound = (net counts / net MB counts) x 100 Using logit-log paper percent bound was plotted against concentration for each of the calibrators to form a line. Digoxin concentrations for the unknowns were then estimated from the line by interpolation.
2.3.3 High Performance Liquid ChromatographyHPLC is a technique used to separate components of a chemical mixture. Components are initially dissolved in liquid solvent and forced to flow through a chromatographic column at a stable pressure of normally between 1000-3000 psi. Following application onto the column, the mixture is resolved into its components which are separately eluted & selectively detected using a uv monitor. This technique is therefore amenable to the separation of compounds which occur naturally as a mixture eg. biological fluids. The specificity of the system is such that components can be quantified to a high precision.
Mobile phase was pumped at a constant flow rate by a CM4000 pump (Laboratory Data Control, (LDC), Stone, Staffs), which provides a pulseless flow using dual-reciprocating pistons. Samples were either injected onto the column using a Promis II autosampler (LDC) or via a rheodyne valve (model 7125), fitted with a 20ul or lOOul loop. Detection was by a

33
SM4000 variable uv wavelength detector (LDC) and signals were recorded & plotted by a Cl10 (LDC) printer/integrater. Mobile phase was made up using high purity salts (HPLC grade) and double distilled deionised (DDDI) water. After adjustment to the required pH, mobile phase was filtered through a 0.45um membrane filter (Millipore), and before use degassed by purging with helium for 10m. The columns (15cm or 25cm x 4.5mm internal diameter) were constructed from stainless steel tubing, and packed with reversed phase micro-particle (5um) silica (Hypersil ODS, Shandon Ltd., Cheshire). Equipment was operated at ambient temperature and all samples were run in duplicate.
No internal standards were employed as sample preparation in all cases was by simple dilution. Calibration curves were constructed for each drug in urine & serum appropriately diluted, and the correlation coefficient r, gradient m, & intercept c, were calculated by linear least- squares regression. For linearity to be assumed over the chosen range r was required to be near to unity (r > 0.980)
2.3.4 Analysis of creatinineCreatinine was assayed in urine (U) & serum (S) by HPLC using a modification of the method by Ginman & Colliss,1985 (115).
Chromatographic conditions Wavelength 233nm Range 0.1Flow rate lml/m Chart speed 5mm/mColumn RP Hypersil 5um ODS 25cm x 4.5mm i.d. (LDC)

34
Mobile Phaseurine 12% CH3CN : 88% 0.05M CH3COONa (6.80g/l) to pH 6.5 serum 0.2% CH3CN : 99.8% 0.05M CH3C00Na to pH 7.5
Using the above conditions the retention time was 2.4 & 3.2 minutes for creatinine in human urine & serum respectively, and typical chromatograms are given in Fig. 2.3.1
Sample Treatment(i) Urine Analysis
100U1 or 50ul U + 900U1 (U/10) or 950ul (U/20) DDDII mix, lOOul U/10 or U/20 + 200ul CH3CN + 800ul DDDIW mix, centrifuge for 10m at 13000rpm
20ul taken for HPLC analysis
(ii) Serum AnalysislOOul serum + 200ul CH3CN + 500ul DDDI water
I lOOul water or lOOul 0.088 mmol/1 Cr y mix, centrifuge for 20m at 13000rpm
20ul taken for HPLC analysis
Calculation of Serum Creatinine Concentration Linearity over the expected range of creatinine in serum was verified. Due to the wide interindividual variation in SCr, [SCr] was determined by "spikeing" samples with creatinine, and comparing the mean peak height of duplicate samples before and after "spikeing”. The concentration of creatinine in each sample was determined by the equation overleaf
pH adjustment by glacial acetic acid
Stock Solutions Working Solutions0.088 mmol/1 creatinine 0.265 mmol/1 creatinine 0.883 mmol/1 creatinine
samesamesame

35
Fig. 2.3.1Typical chromatograms of CREATININE in(a) human urine and(b) human serum
O3
i— i— i— r
(b)
...V
oco
i— i— i— i— r0 1 2 3 0 1 2 3 4MINUTES MINUTES

36
® - y2 - Yiwhere y1 = mean unspiked peak height
y2 = mean spiked peak heightm = gradient of line (linear from standard curve)
then x = y^/m where x is unknown SCr in unspiked sample
Standard CurveThe calibration curve was constructed from 0-40ug/ml and was linear over this range for peak height & area (r=0.998) The coefficient of variation was i) 0.8% at lug/ml (n=10)
ii) 0.7% at 40ug/ml (n=10)
2.3.5 Analysis of frusemideFrusemide (FRU) was assayed in urine & serum by HPLC using a modification of the method by Karreman et al 1982 (116).
Chromatographic conditions Wavelength 230nmRange 0.01Flow rate lml/mChart speed 5mm/mColumn RP Hypersil 5um ODS 15cmx4.5mm i.d. (Jones)
Mobile Phase53% methanol : 47% 0.02M KH2P04 (2.72g/l) to pH 3.0
pH adjustment by orthophosphoric acid
Analyses were carried out in subdued light. Using the above conditions the retention time was 3.48m for FRU in urine & serum; typical chromatograms are given in Fig 2.3.2
Stock Solution Working Solutions(a) lmg/ml FRU in methanol (a) diluted 1/10 & 1/100 with
H2 °

Fig. 2.3.2Typical chromatograms of FRUSEMIDE(a) human urine and(b) human serum
(b)
a)
ZT /
L _o 1 :
in
1 i — i— i— i
2 3 4 5 6 7 MINUTES
FRU

38
Sample TreatmentThe following were added to an eppendorf tube :(1) Urine Analysis
50ul urine + 950ul DDDI water mix, centrifuge for 10m at 13000rpm 20ul taken for HPLC analysis
1
(11) Serum Analysis
J
500ul serum + 500ul CH3CNmix, centrifuge for 20m at 13000rpm20ul taken for HPLC analysis
Standard CurveA calibration curve was constructed from 0 - 2 . 0 ug/ml and was linear over this range for peak height & area (r=0.990) The coefficient of variation was i) 3.1% at 0.lug/ml (n=10)
ii) 2.3% at 2.0ug/ral (n=10)
2.3.6 Analysis of paracetamolParacetamol was assayed in human urine (U) & serum (S) byHPLC using a modification of the method by Adriaenssens1978 (117).
Chromatographic conditionsWavelength 254nmRange 0.1(U) 0.02(S)Flow rate lml/mChart speed 5mm/mColumn RP Hypersil 5 ODS 15cm x 4.5mm i.d. (Jones)
Nobile Phaseurine 5% isopropanol : 95% 0.08M KH2P04 (10.9g/l) to pH 3.0serum 3% isopropanol : 97% 0.08H KH2P04 to pH 3.0
pH adjustment by orthophosphoric acid

39
Using the above conditions the retention time was 4.68 &3.28 minutes respectively for PAR in human urine & serum,and typical chromatograms are given in Fig. 2.3.3.
Stock Solution Working Solutions(a) lmg/ml PAR in methanol (a) diluted 1/10 & 1/100 with
»2°
Sample TreatmentThe following were added to an eppendorf tube
i) Urine AnalysislOOul urine + 900ul DDDI water (U/10)
I Mix, lOOul U/10 + 200ul CH3CN + 900ul DDDI water y Mix, centrifuge for 10m at 13000rpm
lOOul taken for HPLC analysis
ii) Urine Analysis of Paracetamol Glucuronide & Sulphate Paracetamol glucuronide & sulphate conjugates were assayed as PAR following enzymatic hydrolysis (at 37°C for 24h) by sulphatase and beta-glucuronidase.
iii) Serum AnalysislOOul serum + 200ul CH3CN + 900ul DDDI water
X Mix, centrifuge for 20m at 13000rpm 20ul taken for HPLC analysis
Standard CurveThe calibration curve was constructed from 0 - 1 5 ug/ml andwas linear over the range for peak height & area (r=0.990)The coefficient of variation was i) 3.2% at 0.2ug/ml (n=10)
ii) 0.7% at lOug/ml (n=10)

40
Fig. 2.3.3Typical chromatograms of PARACETAMOL in(a) human urine and(b) human serum
o: < a
(a) (b)
V
t— r0 1 2 3 4 MINUTES
cr<CL
I— I— I I— I0 1 2 3 4 MINUTES

41
2.4 STATISTICAL EVALUATION & TREATMENT OF RESULTS StatisticsStatistical analyses were performed using the computer package "Minitab" version Release 7.Results were expressed as means & standard deviations (s.d.). Upper & lower quartiles (Q3 & Ql) and medians were also quoted in particular instances.
Statistical difference between two means was determined using the Mann-Whitney U test with statistical significance occurring at a probability of p<0.05 (5%).
Correlations between parameters were determined using Pearsons correlation coefficient for normally distributed samples, or when n > 50, or Spearmans coefficient of rank correlation for non-normally distributed samples and when n < 50. Due to the large number of correlations performed within each data set (eg. 15 columns x 14 rows) it was highly likely that Type II errors (ie. null hypothesis falsely accepted) would occur by chance. To reduce this probability statistical significance was taken to occur at p<0•01 (1%) for Pearsons & Spearmans correlations.
CalculationsElimination half-life, t]y2f was calculated from the plotof log [drug] v time, where kel is the elimination rateconstant from m = -kel then tl/2 = 0.693
2.303 kel
Serum clearance, Cls = dose x fraction absorbedAUC
- AUC is the area under the [serum] v time curve

42
Renal clearance, Clr = dose recovered in urine[drug]
- [drug] is the concentration of drug in serum at the mid-time point for the urine collection.
Creatinine clearance, CCr *■ UCr x v x 100SCr x 1440
- UCr is the urinary creatinine concentration (mg/lOOml)- v is the urine flow rate (ml/24 hours)- SCr is the serum creatinine concentration (mg/ml)
Body surface area, SA ■ AQ .Hal.Wa2- AQ is 0.0235- H is the height in cm, al is 0.42246- W is the weight in kg, a2 is 0.51456

43
CHAPTER THREE CREATININE CLEARANCE IN ELDERLY PEOPLE
3.1 INTRODUCTIONFor drugs whose elimination is accomplished entirely or partly by renal excretion, total clearance will decline in proportion to the inevitable reduction in GFR occurring in old age. It is often desirable to know a patients' GFR before such drugs are prescribed to prevent accumulation, particularly when the therapeutic window is narrow. In clinical practice renal function is often estimated by measurement of creatinine clearance (CCr), involving the assay of creatinine in serum & a 24h urine sample. Alternatively, specially derived formulae may be utilized to predict CCr from serum creatinine alone, with the advantage of speed & convenience. Few studies have addressed the question of whether these "short-cut" methods are valid in the elderly, when inaccuracy of prediction may lead to inappropriate drug therapy. In this study CCr was measured in an heterogeneous group of old people and compared with the predicted CCr obtained from SCr and use of equations. In addition CCr was calculated from urine collections of about 8h, carried out at various times of day, and their accuracy to predict 24h CCr compared. The influence of mobility & frailty on CCr and its prediction were also investigated.
3.2 PROCEDUREVery fit, fit & frail people, as defined in appendix Al, aged 60 years and over were invited to take part in the study. Exclusion criteria are given in 2.2. Subjects were

44
recruited specifically for the CCr study from patients in St. Martins hospital, from General Practice, and from the Research Institute volunteer panel. In addition, subjects taking part in the Frusemide, Paracetamol & Digoxin studies (chapters 4, 5 & 6) were included in the present study since 24h urine collections were also necessary, providing the opportunity to maximize the use of collected material. Each subject was provided in advance with an information sheet (appendix Cl, standard or enlarged type) and given the opportunity to question Dr L Parker (GP trainee) or myself about the study prior to its commencement. On the morning of the study subjects emptied their bladder, noted the time, and from then on collected all urine for 24h, either in a single vessel or in a separate container per specimen, labelled with the time of voiding. When the latter method was employed the separate samples were later combined into 3 aliquots, each of approximately 8h, the final aliquot spanning the time spent in bed overnight. On completion of the urine collection, blood was taken in the morning after an overnight fast or meat-free breakfast. Forms given in appendix C2 (urine in aliquots) & C3 (single 24h urine collection) were completed during the study. Samples were assayed for creatinine as per 2.3.4.
During the study subjects were questioned about their daily activities and mobility, and were categorized as very fit, fit or frail and had their mobility scored according to the mobility rating devised for the study (appendix A1 & A2). Current medication was noted and subjects were weighed and had their height measured where possible. Drugs taken & demographic details are given in appendices C4,D3,E3,F3.

45
Correlations were determined using Pearsons correlation with significance levels being taken at p<0.01 for reasons outlined in 2.4. Groups (males v females and fit v frail) were compared using the Mann-Whitney test with significance levels being taken at p<0.05.
3.3 RESULTS OF CREATININE CLEARANCE STUDIES 245 subjects (146F) successfully participated in the study to compare measured with predicted CCr, 194 (116F) of whom collected urine in aliquots enabling CCr from 24h & 8h urine collections to be compared. 115 subjects (71F) took part in the CCr study only, 34 (21F) also took part in the frusemide study, 49 (30F) in the paracetamol study & 47 (24F) in the digoxin study. For the CCr study 35 (21F) subjects were very fit, 113 (70F) fit & 97 (55F) frail.The 11 equations & 1 nomogram used to predict CCr from SCr are given in Fig. 3.1.
Comparison of Hales and FemalesData from males & females were compared with results given in appendix C6 & Figs 3.2 to 3.4. No significant difference was seen between sexes for age, M.Sc, urine vol or CCr/SA but the groups differed in every other respect. The males weighed significantly more, had a greater SA & excreted more UCr. Minimum, maximum & mean SCr values were also greater in the male group, likewise CCr although CCr/SA was similar between groups. These results suggest that males produce and excrete more creatinine, probably due to their increased weight & muscle mass, giving rise to disparate values for UCr, SCr & CCr. Because of these differences data from males & females were analysed separately.

46
FemalesIndividual results for all 24h urine collections are given in appendices C5, D5, E5 & F5. Results from the entire female group are summarized in appendix C7 and correlations between parameters are given in appendix C8.Age ranged from 60-100y (77±8? mean±s.d.) and significantly correlated with M.Sc, weight, urine vol, UCr & CCr.Mobility score ranged from 1-5 and significantly correlated with urine volume, UCr, SCr & CCr.UCr ranged from 240-2441mg (823+313) and correlated with age, M.Sc, weight, urine volume & CCr. SCr varied from 0.34-4.32mg/100ml (1.39±0.69), correlating with M.Sc & CCr. CCr ranged from 7-141ml/min (48.7+24.1), correlating with age, M.Sc, urine volume, UCr & SCr. Similar correlations were seen for CCr/SA.
116 female urine collections were stored as aliquots enabling CCr from collections of less than 24h to be calculated. The 24h collection was divided into a morning collection (CCram), afternoon/evening collection (CCrpm), and overnight collection (CCrn), each varying in length according to the pattern of urine excretion exhibited by the subject. In all cases CCrn was calculated from urine produced during the time spent in bed overnight. Collection periods ranged from 2.42-11.OOh for CCram, 2.08-l4.75h for CCrpm, and 4.25-18.OOh for CCrn for females & males. Differences between 24h CCr & CCr from reduced collections was determined for each subject ie CCr - CCram = dCCram? a negative value would result if predicted CCr>measured CCr. CCr from reduced collection times were also expressed as %24h CCr ie. CCr/CCram x 100 = %CCram; a value less than 100 would result when predicted CCr > measured CCr.

47
CCram, CCrpm & CCrn are given in appendix C7 with the correlation coefficient between each reduced collection & 24h CCr and the equation of the resulting line. Plots of measured v predicted CCr for each of the three reduced urine collections are given in Figs. 3.3.1 to 3.3.3.
For the 116 females with CCr calculated from reduced urine collection times, 24h CCr varied from 7-141ml/min (49+26). CCram varied between l-160ml/min (51±30) dCCram varied from “57-36ml/min (“2.0+13.3) and %CCram from 5-263% (103+32). The correlation coefficient between CCr & CCram was 0.901? the line had a gradient of 1.05 and y intercept of ”0.45. CCrpm varied between 2-156ml/min (52±32) dCCrpm ranged from “80-39ml/min (~3.3±15.3) while %CCrpm varied from 20-332% (107±40). The correlation coefficient between CCr & CCrpm was 0.877, the gradient was 1.06 and the intercept 0.37. CCrn varied from 6-153ml/min (46±26), dCCrn ranged from “41-42 ml/min (2.4+10.3) and %CCrn from 27-241% (96±25).The correlation coefficient between CCr & CCrn was 0.922, the gradient was 0.93 and the intercept 1.21.
CCr, CCr/SA or CCr/70kg were calculated using 11 equations & 1 nomogram numbered El to El2 and where applicable female modifications are expressed as ExF. Formulae & authors are given in Fig. 3.1. Results are given in appendix C7 with the correlation coefficient and equation of the regression line between measured & predicted CCr for each formulae. Measured v predicted CCr were plotted and are given in Figs. 3.3.4 to 3.3.23.The “ideal” formula, when plotted against measured CCr, would have a correlation coefficient of 1, a gradient of 1 and an intercept of 0. No formula exhibited these

characteristics and so the 5 "best fit" formulae were selected for further investigation. Female modifications in all except one case did not increase the accuracy of prediction of CCr, and so 4 formulae chosen were common with those suggested for males. Equations selected were El, E4, E9, E10 & E11F. Plots of measured CCr v %CCr for the reduced urine collections and 5 best fit equations are given in Figs. 3.3.24 to 3.3.31.
MalesIndividual results for all 24h urine collections are given in appendices C5, D5, E5 & F5 and results from the male group are summarized in appendix C9. Correlations betweenparameters are given in appendix CIO.Age ranged from 60-97y (76+8) and significantly correlated with M.Sc, SA, urine vol, UCr & CCr.Mobility score ranged from 1-5, correlating with age, weight, SA, urine volume, UCr, SCr & CCr.UCr ranged from 302-2624mg (1192±433), correlating with age, M.Sc, weight, SA, urine volume & CCr. SCr varied from 0.55-6.71mg/100ml (1.67+1.01), correlating with CCr & M.Sc. CCr ranged from 10-193ml/min (61±30) & CCr/SA from 10-164 ml/min/1.73m2 (56+26). Both correlated with age, M.Sc, weight, SA, urine volume, UCr & SCr.
78 male urine collections were stored as aliquots enablingCCr from collections of less than 24h to be calculated, and results are shown in appendix C9.For these subjects 24h CCr ranged from 10-193ml/min (60+31) CCram varied from 6-195ml/min (68+41) with dCCram ranging from -87-17ml/min (-8±22) & %CCram from 30-350% (112±49). The correlation coefficient between CCr & CCram was 0.846,

49
the gradient was 1.11 and a y intercept 1.6.CCrpm varied between 9-209ml/min (63+37) dCCrpm from -75-29 ml/min (-4+14), %CCrpm from 37-274% (105±30). The correlation coefficient was 0.925, the gradient 1.09 & the intercept -1.5.CCrn ranged from 3-186ml/min (54±30), dCCrn from -43-50 ml/min (6+14), %CCrn from 7-149% (92+22). The correlation coefficient was 0.905, the gradient 0.87 and intercept 1.8. Plots of measured v predicted CCr for each of the reduced urine collections are given in Figs. 3.4.1 to 3.4.3.
CCr, CCr/SA or CCr/70kg were calculated from SCr using 11 equations & 1 nomogram as in Fig. 3.1. Results are given in appendix C9 with the correlation coefficient & equation of the line between measured & predicted CCr for each formulae. Measured v predicted CCr were plotted and given in Figs. 3.4.4 to 3.4.15.No formula was "ideal" and so the 5 best fit formula were selected - these were El, E4, E9, E10 & Ell. Plots of measured CCr v %CCr for each reduced urine collection & the 5 best fit equations are given in Figs. 3.4.16 to 3.4.23.
3.3.1 Influence of Diuretics on CCr Prediction FemalesFemales were divided into groups according to whether or not they took diuretics and results are shown in appendix Cll. The 60 females who took diuretics during the study were older and less mobile than the 86 who did not. CCr tended to be lower in those taking diuretics but this was not significant. CCram, CCrpm & CCrn were reduced for those taking diuretics, but this was only significant for CCrpm (p<0.02). dCCrn tended to be greater in those who

50
did not take diuretics (p<0.05), but dCCram & dCCrpm were unchanged. The accuracy of CCr prediction using 5 selected formulae did not appear to be affected by diuretics.
MalesMales were divided into two groups according to whether or not diuretics were taken and results are shown in appendix C12. The 36 males who took diuretics during the study tended to be older and less mobile (p<0.002) than the 63 males who did not. CCr tended to be reduced in those taking diuretics, with a small difference seen when CCr/SA was compared (p<0.05). CCram, CCrpm & CCrn tended to be reduced in the group taking diuretics but this was not significant. The difference between 24h & 8h CCr was not influenced by diuretic taking. The accuracy of CCr prediction using the 5 selected formulae was not altered significantly when diuretics were taken.
3.3.2 Measured CCr vs Predicted CCr FemalesWhen measured v predicted CCr were plotted for the 5 best fit formulae the accuracy of prediction was seen to alter with magnitude of the measured CCr. If the "ideal" line of measured = predicted CCr was drawn, the point of interception between the two lines occurred between 40 & 50ml/min. Below this point there was a tendency to overestimate CCr, above this point CCr tended to be underestimated with the greatest discrepancies seen for extremevalues of measured CCr. Subsequently, females were dividedinto groups of CCr > 50ml/min & CCr < 50ml/min andcompared. Results are given in appendix Cl3.Those with CCr < 50ml/min were older, less mobile, excreted

51
less UCr but had a greater SCr. The accuracy of CCr prediction for urine collections less than 24h was not compromised by a reduced CCr, with no statistical difference seen between absolute or percent differences for CCram, CCrpm or CCrn. However, when CCr was predicted using the formulae a significant difference was seen between both the absolute & percent differences of the predicted CCr.CCr tended to be overestimated when measured CCr < 50ml/min and underestimated when measured CCr > 50ml/min.
MalesWhen measured v predicted CCr was plotted for the males, a similar pattern was seen, with the accuracy of prediction changing with the measured CCr. The intercept between the lines measured v predicted CCr and measured ** predicted CCr occurred between 30 & 40ml/min. Although a lower intercept was seen between measured & predicted CCr than for the female group, males were still divided into groups of CCr > 50ml/min & CCr < 50ml/min since it is below this point that renal dysfunction starts to become important in drug dosage calculations (45). Groups were compared with results given in appendix C14.Those with CCr < 50ral/min were older, less mobile, excreted less UCr & had a higher SCr. CCram & CCrpm remained comparable to 24h CCr for both groups, but CCrn tended to overestimate CCr when CCr was < 50ml/min. When CCr predicted by the formulae were examined a significant difference was seen between both the absolute and percent difference of the predicted CCr. CCr tended to be overestimated when measured CCr < 50ml/min and underestimated when CCr > 50ml/min.

52
3.3.3 Influence of Frailty on CCr prediction FemalesFemales were divided into two groups of all fit (very fit + fit) & frail subjects and compared with results in appendix C15. The frail group was 6.4y older, less mobile, excreted less UCr (934mg v 639mg), had a greater SCr (1.24mg/dl v 1.63mg/dl) & lower CCr (57ml/min v 36ml/min). The accuracy of CCr prediction was not compromised for urine collections of less than 24h in this group. However, when CCr was predicted using the equations both the absolute & percent differences were significantly different between fit & frail groups. CCr tended to be overestimated in the frail group who had a low measured CCr, and underestimated in the fit group where the greatest measured CCr values were seen. The frail group was significantly older than the fit group and it was not possible to determine whether frailty or increased age was the more important determinant of the reduced CCr seen in the frail group. Very fit, fit & frail female subjects were therefore age matched and compared with results in appendix C16,C17,C18.
When age matched, no statistical differences were seen between the very fit & fit female groups in terms of M.Sc, weight, SA, urine volume, UCr, SCr or CCr. CCrpm & CCrn closely predicted 24h CCr but CCram overestimated 24h CCr for the fit group when compared to the very fit group. For each of the serial collections, the regression coefficient was not less than 0.919 and the gradient of the measured v predicted line closely approached unity. The accuracy of CCr prediction using equations was not significantly different between very fit & fit groups, but the variation in accuracy of prediction was wide. The regression

53
coefficient varied between 0.889-0.565, and those with the greatest CCr tended to have CCr underpredicted.
When age matched fit & frail female groups were compared, frail subjects were less mobile with a significantly lower urine volume, UCr & CCr. There was no difference between groups for weight, SA or SCr. The accuracy of prediction of CCr for urine collections less than 24h was not compromised in the frail group and there was a good correlation between measured & predicted CCr. However, the accuracy of CCr prediction using equations differed significantly between groups. CCr tended to be underpredicted in the fit group who had the greater measured CCr, and overpredicted in the frail group. The correlation between measured & predicted CCr was less good than for the serial 8h urine collections.
When age matched very fit & frail female groups were compared frailty was associated with a reduced M.Sc, urine output, UCr & CCr, although both groups were similar in weight. Accuracy of CCr prediction was comparable between the groups for urine collections less than 24h when the correlation between measured & predicted CCr was good. However, the accuracy of CCr prediction using the formulae differed between groups, with the very fit group showing a strong tendency towards underprediction & the frail group exhibiting a strong tendency towards overprediction.
MalesMales were divided into two groups of all fit & frail subjects and compared; results are given in appendix C19. The frail group was on average 6.5y older, less mobile, had a lower urine output, excreted less UCr (1371mg v 950mg), had a greater SCr (1.42mg/dl v 2.00mg/dl) and lower CCr

54
(73ml/min v 44ml/min). The accuracy of CCr prediction for urine collections less than 24h was not compromised forCCram or CCrn although CCrpm tended to overestimate CCr inthe fit group (p<0.05). However, accuracy of CCr prediction using the 5 best eguations varied significantly between groups. CCr tended to be underpredicted in both groups but the degree of underprediction was greater in the fit group who had the greater measured CCr. The frail group was older than the fit group, and in order to separate out the influence of frailty against increased age, very fit, fit & frail males were age matched and compared, with the resultsgiven in appendices C20, C21 & C22.
No statistical differences were seen between age matched very fit & fit male groups for M.Sc, weight, SA, urine vol, SCr or CCr, although UCr excretion was lower in the fit group. Accuracy of CCr prediction from reduced urine collections was not significantly different between groups, although CCrpm was the least accurate. CCr predicted from equations tended to be less than the measured CCr for both groups, with the discrepancy between measured & predicted CCr significantly greater for the very fit group.
When age matched fit & frail male groups were compared frail subjects were significantly less mobile, had a lower weight & SA, excreted less UCr, with a lower CCr. Both CCrpm & CCrn accurately predicted CCr for both groups but CCram tended to underpredict CCr in the frail group (p<0•05)• Using the equations CCr tended to be underpredicted in both groups, with the degree of underprediction greater in the fit group.
When age matched very fit & frail male groups were compared

55
a similar pattern was seen, although most differences failed to reach significance with only 7 subjects in each group. The frail group was significantly less mobile, weighed less & excreted less UCr than their very fit counterparts, and CCr tended to be reduced in the frail group (76+16ml/min fit, 58±29ml/min frail). The accuracy of CCr prediction using both reduced urine collections and equations was not significantly different between groups although CCr tended to be underpredicted most in the very fit group who had the greater measured CCr.

56
Fig. 3.1EQUATIONS FOR THE PREDICTION OF CREATININE CLEARANCE age - years SCr - mg/lOOml weight - kg
EQUATION 1 - COCKCROFT & GAULT, 1976 - (118)MALES (El)CCr (ml/min) = (140 - age) (weight)72 x SCrFEMALES (E1F)CCr males x 0.85
EQUATION 2 - JELLIFFE, 1971 - (119)MALES (E2) 0CCr (ral/min/1.73m ) = 100 - 12
SCrFEMALES (E2F) 0CCr (ml/min/1.73m ) = 80 - 7SCr
EQUATION 3 - JELLIFFE, 1973 - (120) MALES (E3) 0CCr (ml/min/1.73m ) = 98 - 0.8(aqe-20)gCrFEMALES (E3F)CCr males x 0.9
EQUATION 4 - JELLIFFE & JELLIFFE, 1972 - (121)MALES (E4)step 1 E = weight (29.3 - 0.203 age)step 2 R =1.035 - (0.0037 x SCr)step 3 E __ = ESS x R = EF corrstep 4 CCr (ml/min) = ESCr x 1 4 .4
FEMALES (E4F)step 1 E = weight (25.1 - 0.175 age) then as for malesSo
EQUATION 5 - EDWARDS & WHYTE, 1959 - (37) (E5)CCr (ml/min/1.73m ) = 94.3 - 1.8
SCr

57
Fig. 3.1 (contd)EQUATION 6 - WAGNER, 1971 - (122) MALES (E6)CCr (ml/min) = 1.96 - 1.19 (log SCr) FEMALES (E6F)CCr (ml/min) = 1.85 - 1.18 (log SCr)
EQUATION 7 - ROWE, 1976 - (123)(E7) 2CCr (ml/min/1.73m ) = 165.57 - 0.80(age)
EQUATION 8 - ROWE, 1976 - (124)(E8)CCr (ml/min/1.73m2) = 133 - 0.64 (age)
EQUATION 9 - MAWER, 1976 - (125)MALES (E9)step 1 Q = weight (29.3 - (0.203 x age))Step 2 Q__ = Q (1 - (0.003 scr))cr corr crstep 3 CCr (ml/min) = Qcr14.4 x SCrFEMALES (E9F)Qcr = QCr males x 0,8
EQUATION 10 - HULL, 1981 - (126) MALES (E10)CCr (ml/min/70kq) = (145 - aqe) - 3SCrFEMALES (E10F)CCr (ml/min/70kg) = CCr male x 0.85
EQUATION 11 - GATES, 1985 - (127)MALES (Ell) - -CCr (ml/min) =89.4 (SCr“1,z)+(55-age) [0.005(89.4) (SCr*"1,1) ]FEMALES (Ell) - - , -CCr (ml/min) =60 (SCr“-L*‘L) + (56-age) [0.005(60) (SCr“J"-L) ]
NOMOGRAM 1 (E12) - SIERSBAEK-NIELSEN, 1971 - (129)

2600
2600
2400-
2200
2000
1800
ieoa
1400
1200
1000
800
600
400
200
o-
Fig. 3.2 Distribution of UCr in Fit & Frail 58Female and Hale Elderly Subjects
a aA A
AA A
AA
A £A
AAAA Aer*r*
A A A £ *A
AA A
A A A A
A---
FIT FRAIL FIT FRAILFEMALES FEMALES MALES MALES
O = fit subject a= frail subject — median
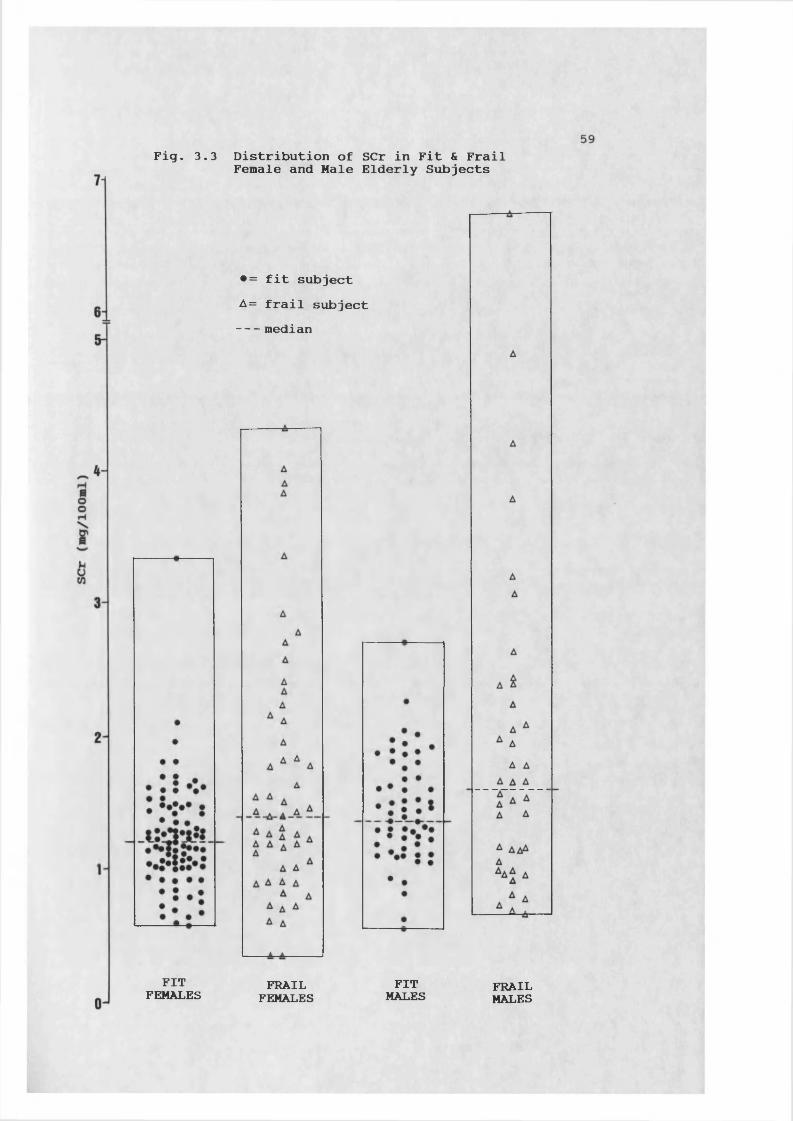
Fig. 3.3 Distribution of SCr in Fit & FrailFemale and Male Elderly Subjects
•= fit subject A= frail subject median
FITFEMALES FRAILFEMALESFITMALES FRAILMALES

Fig. 3.4
130
"a 120-nJ 110-c 100-
FITFEMALES
Distribution of CCr/SA in Fit & FrailFemale and Male Elderly Subjects
▲▲ a ▲A A A A AA A iA A A a A
t*A fA*
FRAILFEMALES
■= fit subject A= frail subject median
FITMALES FRAILMALES

predicted
CCram
(ml/min)
61
Fig. 3.3.1 Predicted CCram v Measured 24h CCrfor Female Subjects210
180
150
120
90
1.05CCr 0.901 116 p < 0.001
CCram60 * 2J** * *30 *** *
23*
+ +0 30 60 90 120
measured CCr (ml/min)

predicted
CCrn
(ml/min)
predicted
CCrpm
(ml/min)
62
Fig. 3.3.2 Predicted CCrpm v Measured 24h CCrfor Female Subjects
150
120
90 *2,CCrpm = 1.06CCr + 0.37 r = 0.877 n = 116 p < 0.001
**60 3*'22*
32**33
3032**
3K
+-0 +30 60 90 120
measured CCr (ml/min)
Fig. 3.3.3 Predicted CCrn v Measured 24h CCr for Female Subjects
150
120
90 ***23, = 0.93CCr +1.21 = 0.922 = 116 < 0.001
CCrn* 3.
60 4 ***
*430
**2
0 ++0 30 60 90 120
measured CCr (ml/min)
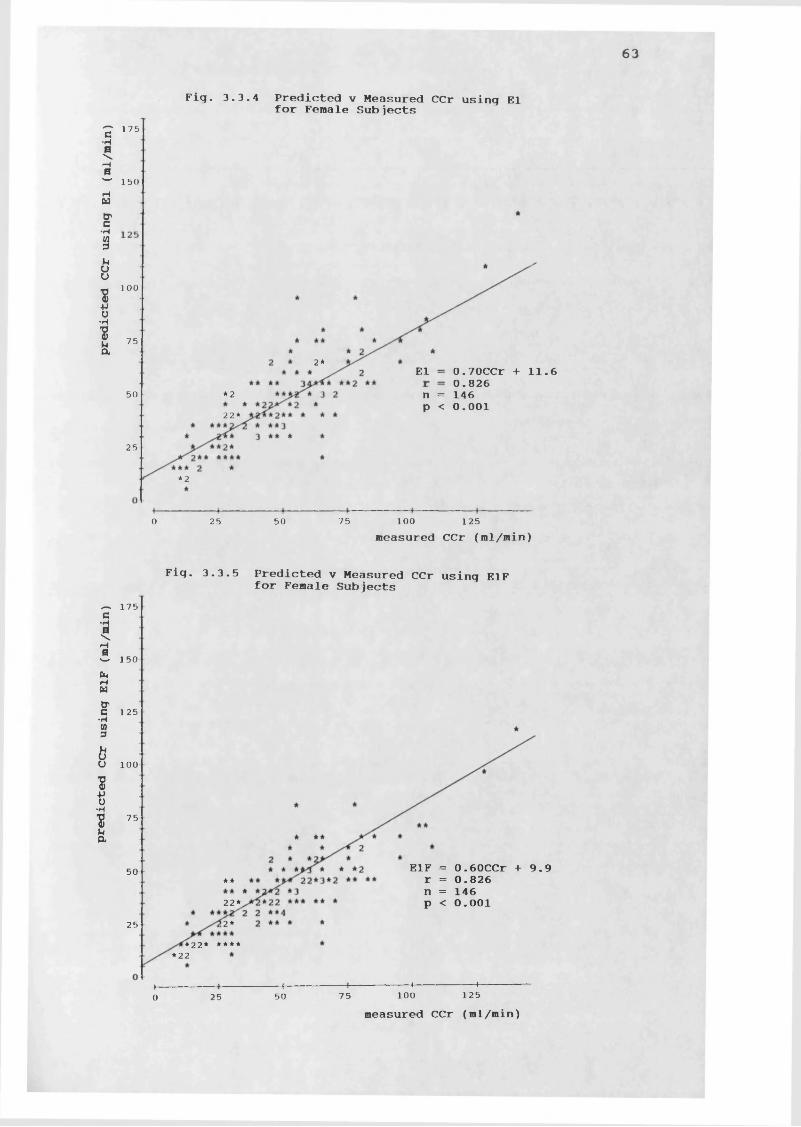
predicted CCr using
E1F (ml/min)
predicted CCr using
El (ml/min)
63
Fig. 3.3.4 Predicted v Measured CCr using Elfor Female Subjects175
150
100
752* El 0.70CCr +11.6 0.826 n = 146 p < 0.00150 *2
22*25
*2
1000 25 50 75 125measured CCr (ml/min)
Fig. 3.3.5 Predicted v Measured CCr using E1F for Female Subjects175
150
125
100
75
E1F = 0.60CCr +9.9 r = 0.826 n = 146 p < 0.00150 **
22*2*25
*22* *****22
+4+0 25 50 75 100 125measured CCr (ml/min)

predicted CCr using
E2F (ml
/min/1.73
m
64
Fig. 3.3.6 Predicted v Measured CCr using E2for Female Subjects280<N
H
C 2403
3200CJM
I§ 160bu
v 120•pu•H
■8h 80Cl
E2 1.18CCr/SA +13.7 0.779 146 p < 0.001**
323 >2242******242
40 **2
+ + +0 40 80 120 160 200
measured CCr/SA (ml/min/1.73m2)
Fig. 3.3.7 Predicted v Measured CCr using E2F for Female Subjects245CM
210
175
140
105E2F = 0.95CCr/SA +13.6 r = 0.779 n = 146 P < 0.00170
*22 >2*23*3*2 42****235
-*-105
-h140
-(-175
+-0 35 70
measured CCr/SA (ml/min/1.73m2)

predicted CCr using
E3F (ml/ain/1.73m
65
Fig. 3.3.8 Predicted v Measured CCr using E3for Female Subjects210
\ 180
150
120
90
E3 = 0.67CCr/SA +10.6 r = 0.844 n = 146 p < 0.00160
*22*3 3*422*22**2
30
222 *
h120
+-0 60 90 15030 2measured CCr/SA (ml/min/1.73m )
Fig. 3.3.9 Predicted v Measured CCr using E3F for Female Subjects210
180
150
120
90
**60 ** E3F = 0.61CCr/SA +9.6 r = 0.844 n = 146 p < 0.001** *23*4 *-2"*"2 32 *2*
23232*30
222 *
—H 90
+-0 15012030 60
measured CCr/SA (ml/min/1.73m2)

predic
ted CCr using
E4F (el/.in)
predicted CCr using
E4
6 6
for Female Subjects175
150
125
100
**75
E4 0.78CCr +13.1 0.826 146 0.001
**50
23*
*2*25
+ + +0 25 50 75 100 125
measured CCr (ml/min)
Fig. 3.3.11 Predicted v Measured CCr using E4Ffor Female subjects175
150
100
75
*2* E4F = 0.67CCr +11.1 r = 0.826 n = 146 p < 0.001* *50 *3*222* *
***2*/ *2* •''*****2**
**2 *
25
*22
+ + +0 25 50 75 100 125
measured CCr (ml/min)

predicted CCr using
E5 (ml/min/1.73m
67
Fig. 3.3.12 Predicted v Measured CCr using E5for Female Subjects280
240
200
E5 = l.UCCr/SA +22.5 r = 0.779 n = 146 p < 0.001
160
120
*22 ̂ 232280322
**240
*23
+ h200
+ h120
+ —h 80 160400measured CCr/SA (ml/min/1.73m2)

6 8
Fig. 3.3.13 Predicted v Measured CCr using E6for Female Subjects
350•H
300
W 250
200•H * * * E6 = 1.29CCr + 16.1 r = 0.696 n = 146 P < 0.001
22100* >*2 2 * 2222 *
2 A43**2444* / 43**42*2 2*22*523* *50*2
*23
++0 50 100 150 200 250
measured CCr (ml/min)
Fig. 3.3.14 Predicted v Measured CCr using E6F for Female Subjects
240•H
200
120
•H **80 *2
**2 yi**2*/2*24**
** 2*32*2^3344** E6F l.OlCCr +8.8 0.774 n = 146 p < 0.00140
*32
h120
+-0
—H 40 80
measured CCr (ml/min)

predict
ed CCr using
E8 (ml/min/1.73s2)
predic
ted CCr using
E7 (ml/»in/1.73»
69
50
Fig. 3.3.15 Predicted v Measured CCr using E7for Female Subjects
<N110
953*52*2***32*
80
65
E7 = 0.07CCr/SA + 100 r = 0.293 n = 146 p < 0.001
35
0 30 60 90 120 150 2measured CCr/SA (ml/min/1.73m )
Fig. 3.3.16 Predicted v Measured CCr using E8 for Female Subjects
90 **23*52*2***32*
22 * **2 * *3* * *75
60E8 = 0.06CCr/SA +80.6 r = 0.293 n = 146 p < 0.00145
30
15
0 30 60 90 120 150measured CCr/SA (ml/min/1.73m2)

predicted CCr using
E9F (ml/min)
predicted CCr using
E9 (ml/min)
70
Fig. 3.3.17 Predicted v Measured CCr using E9for Female Subjects
E9 0.76CCr +12.7 0.825 146 0.001
*250 22* *
22**22*25
+0 25 50 75 100 125
measured CCr (ml/min)
Fig. 3.3.18 Predicted v Measured CCr using E9F for Female Subjects175
150
125
75**
2 ** *2* * **3̂*'2**/22*3 2>*̂ *3 *"*22* * * * *
50 0.60CCr +10.20.8251460.001
E9F* *23*2*25
**22* *** *22 *
+ ♦0 25 50 75 100 125
measured CCr (ml/min)

predicted CCr using
E10F
(ml/ain/70kg)
predicted CCr using
E10 (ml/ain/7Okg)
71
Fig. 3.3.19 Predicted v Measured CCr using E10for Female Subjects200
160
120
80*22* E10 0.75CCr/70kg +12.9 0.858 146
0.001'2*2522 4*2*40
**2
+-0 160 2001208040measured CCr/70kg (ml/min/70kg)
Fig. 3.3.20 Predicted v Measured CCr using E10F for Female Subjects
160
*2, E10F = 0.64CCr/70kg + 11.0 r = 0.858 n = 146 p < 0.001*322 22*
**2 33 2*25
+0 200120 1608040measured CCr/70kg (ml/min/70kg)

predicted CCr using
E11F
(ml/min)
predicted CCr using
Ell (ml/min)
72Fig. 3.3.21 Predicted v Measured CCr using Ell
for Female Subjects
300
200
Ell 1.19CCr +10.8 0.726 146 0.001
100 22*2£**432*
2 * 2+3* 2 2 4 2 3 * tf)*444*23 * 2 2 * * *
50
*32
+ 4-0 50 100 150 200 250
measured CCr (ml/min)Fig. 3.3.22 Predicted v Measured CCr using ElIF for Female Subjects
175
150
100
75
2*50 E11F 0.70CCr + 12.9 0.716 146 p < 0.00125
*2*
—t- 75
h100 12525 50
measured CCr (ml/min)

predict
ed CCr using
E12 (ml/min)
73
Fig. 3.3.23 Predicted v Measured CCr using E12 for Female Subjects
80
60**3 *22**2
2* E12 = 0.57CCr +13.2 r = 0.784 n = 143p < 0.001
403*
* * * *
20* 2 *
I------- 1-------1-------1-------1 - ■■ ■ >----0 20 40 60 80 100
measured CCr (ml/min)

%CCrpm
%CCram
74
Fig. 3.3.24 Measured 24h CCr v % Predicted CCramfor Female Subjects
250
200
150
* * *2*42
1002 * **2
50
+ +0 30 60 90 120
measured CCr (ml/min)
Fig. 3.3.25 Measured 24h CCr v % Predicted CCrpm for Female Subjects
300
250
200
150
22eae* 22100
*2
2 *
50
Ol+
0 30 60 90 120measured CCr (ml/min)

%CCrEl
%CCrn
75
Fig. 3.3.26 Measured 24h CCr v % Predicted CCrnfor Female Subjects
250
200
150
100
50
* * * **4 * 2
*2 * * 2 * * 2* * *►*-- 322*----*4 **— 322*-232*-**2 *3 *2 332* ** * *** 2 * 2 * ** * .* * * * * ** ** *
30 60 90 120measured CCr (ml/min)
Fig. 3.3.27 Measured 24h CCr v % Predicted CCr Using El for Female Subjects
300
250
200
1502*22
100 ***22
50 * ***
+30 60 90 120
measured CCr (ml/min)

%CCrE4
76
Fig. 3.3.28 Measured 24h CCr v % Predicted CCrUsing E4 for Female Subjects
250
200
150**
* *100
2*50
+0 30 60 90 120
measured CCr (ml/min)
Fig. 3.3.29 Measured 24h CCr v % Predicted CCr Using E9 for Female Subjects300
250
2000\Wuu<#>
150 ****2*22
* *100*4**22* * 2*50 ***
+0 30 60 90 120
measured CCr (ml/min)

77
Fig. 3.3.30 Measured 24h CCr v % Predicted CCrUsing E10 for Female Subjects
300
250
O 200HH150
*2**6* 22-***22*2** *
2 2 2 2 2 * **2 32 * *
100
50
0 40 80 120 160 200measured CCr/70kg (ml/min/70kg)
Fig. 3.3.31 Measured 24h CCr v % Predicted CCr Using E11F for Female Subjects
350
300
250
Wu<#»
200
150
100
50
**2 *2* ** * ** *2* *4*2 2 *2 *
3****2*22* ** ** 2 * *** **32 *
4 2** 2 *33 * ****** 2 * ** * * ** * *2
** *
30 60 90 120measured CCr (ml/min)

predic
ted
CCrpm
(ml/min)
predicted CCram
(ml/min)
78
Fig. 3.4.1 Predicted CCram v Measured 24h CCrfor Male Subjects
175
140
70 CCram l.UCCr + 1.58 0.846 78 0.001
*22**35 3*
140 17535 1050 70measured CCr (ml/min)
Fig. 3.4.2 Predicted CCrpm v Measured 24h CCr for Male Subjects245
210
175
140
105 2***1.52CCrpm = 1.09CCr r = 0.925 n = 78p < 0.001
70
35
035 1050 70 140 175
measured CCr (ml/min)

predicted
CCrn
(ml/min)
79
Fig. 3.4.3 Predicted CCrn v Measured 24h CCr for Male Subjects245
210
175
140
**105
0.87CCr +1.78 0.905 78p < 0.001
CCrn2** *70
2 3,35
-h105
+0 140 17535 70measured CCr (ml/min)

predicted
CCr using
E2 (ml/min/1.73m )
predicted
CCr using
El (ml/min)
80
Fig. 3.4.4 Predicted v Measured CCr using Elfor Male Subjects
140
105
70 *2 El = 0.64CCr +8.2 r = 0.862 n = 99 p < 0.0013*.*235 2**2*
+ -h175
-h105
+ +14070350
measured CCr (ml/min)
Fig. 3.4.5 Predicted v Measured CCr using E2 for Male Subjects210
150
120
90
60 E2 0.85CCr/SA + 13.7 0.726 99 0.001
*** *30
+0 30 60 90 120 150
measured CCr/SA (ml/min/1.73m2)

predicted
CCr using
E4 (ml/mi
n) predicted
CCr using
E3 (ml/min/1.73m
81
Fig. 3.4.6 Predicted v Measured CCr using E3for Male Subjects
90
60E3 0.53CCr/SA + 9.7 0.781 99
0.001
***2*3 0
**2*22*++
0 30 60 90 120 150measured CCr/SA (ml/min/1.73m2)
Fig. 3.4.7 Predicted v Measured CCr using E4for Male Subjects245
210
175
140
105
**70 *2
0.71CCr +9.3 0.861 99p < 0.001
E42*2** *35
*23k*++
0 35 70 105 140 175measured CCr (ml/min)

82
Fig. 3.4.8 Predicted v Measured CCr using E5for Male Subjects
210
180
in 150
•H 120
90
•H0.80CCr/SA + 22.4 0.726 99p < 0.001
E5*2
30
1500 30 60 90 120measured CCr/SA (ml/min/1.73m2)
Fig. 3.4.9 Predicted v Measured CCr using E6 for Male Subjects245
C•H0\*H0 210vnMc5 1753° 1401+>0J 105
70E6 = 0.72CCr +21.3 = 0.670 = 99
< 0.00135
0 35 70 105 140 175measured CCr (ml/min)

predicted CCr using
E8 (ml/min/1.73m2)
predicted
CCr using
E7 (ml/min/1.73m
83
Fig. 3.4.10 Predicted v Measured CCr using E7for Male Subjects
120**
22*22****3** *90
E7 = 0. UCCr/SA + 98.6 r = 0.420 n = 99p < 0.00160
30
30+ —h
900 12060 150measured CCr/SA (ml/min/1.73m2)
Fig. 3.4.11 Predicted v Measured CCr using E8 for Male Subjects
90IT**- *??32422 ***
0.08CCr/SA +79.4 0.420 99 0.001
E8
30
-\-15090 120
measured CCr/SA (ml/min/1.73m̂ )600 30

predicted CCr using
E10 (ml/min/70kg)
predicted CCr using
E9 (ml/min)
84
Fig. 3.4.12 Predicted v Measured CCr using E9for Male Subjects245
210
70 E9 = 0.69CCr +9.0 = 0.861 = 99 < 0.001
*235
*2
-h17514070 1050 35
measured CCr (ml/min)
Fig. 3.4.13 Predicted v Measured CCr using E10 for Male Subjects210
150
120
90
*2 E10 = 0.68CCr/70kg +8.0 r = 0.804 n = 99p < 0.001
**
30****
*2 H120+-0 150906030
measured CCr/70kg (ml/min/70kg)

predicted
CCr using
E12 (ml/min)
predicted
CCr using
Ell (ml/min)
85
Fig. 3.4.14 Predicted v Measured CCr using Ellfor Male Subjects
245
210
175
140
105
70
Ell = 0.67CCr + 15.9 r = 0.694 n = 99 p < 0.001
2*2235
*2
-h140
+-0 17535 70 105measured CCr (ml/min)
Fig. 3.4.15 Predicted v Measured CCr using El2 for Male Subjects
40
105
**70
E12 = 0.63CCr +9.6 r = 0.844 n = 99 p < 0.00122 *22**235
***-H105
+-0 17514035 70measured CCr (ml/min)

*CCrP“
%CCram
Fig. 3.4.16 Measured 24h CCr v % Predicted CCramfor Male Subjects
350
300
250
200
150
100
50
*
*
*
** *
* * *** *
*** * ** 2 ** 3 2 * *
* ** *2* * *
* * *** * 2 * * *3 * 3* * *
* * ** * *
**
35 70 105 140 175measured CCr (ml/min)
Fig. 3.4.17 Measured 24h CCr v % Predicted CCrpm for Male Subjects
250
200
150
100
50
*
**
* * ** 2
* *** * ** 2** 3** * 2* 2 * 2 * * ** 2 * *
2 **— *"---*---- 3 * Z * * *
** * ** * * ***
* * ** *
*
35 70 105 140 175measured CCr (ml/min)

%CCrEl
%CCm
87
Fig. 3.4.18 Measured 24h CCr v % Predicted CCrnfor Male Subjects
150
22100
2 *
* *50
0 35 70 105 140 175measured CCr (ml/min)
Fig. 3.4.19 Measured 24h CCr v % Predicted CCr Using El for Male Subjects300
250
200
150
100
50
*** * **
* * * * ** *
* 2* * 1* *** 2 * 3 *2 ** *
2 * * * * * * * * *** *2 2* * * * *2 2 *
* * 2 * *
2 * * * * * *2 * ** * *
35 70 105 140 175measured CCr (ml/min)

%CCrE9
%CCrE4
88
Fig. 3.4.20 Measured 24h CCr v % Predicted CCrUsing E4 for Male Subjects
250
200
150
* * * * *
100 2**** * *2 *2 *****3 **3**2**2 * * * * * *
* * * 22 *50
+0 35 70 105 140 175
measured CCr (ml/min)
Fig. 3.4.21 Measured 24h CCr v % Predicted CCr Using E9 for Male Subjects*
*
*
*
* *2* 2* * * * *
* * ** 2* * *
* * * * 2 * 3 *2 ** ** 2 2** * * * 2 * * * * *
*2 * * * * * * * 2 ** A *1 1 1 i
* * * * *2 * 3 * * *
* ** *
*
H------------ 1------------|------------,------------1---------- H0 35 70 105 140 175
measured CCr (ml/min)

%CCrEllF
%CCrE10
89Fig. 3.4.22 Measured 24h CCr v % Predicted CCrUsing E10 for Male Subjects
300
250
200
2 *
150
22* * 23***23 * ** *** 3 * * ***
100* 2 *
* *
50
+0 35 70 105 140 175
measured CCr/70kg (ml/min/70kg)
Fia 3.4.23 Measured 24h CCr v % Predicted CCr Using Ell for Male Subjects250
200
150
100
50
0
* * * *
* * ** * * * * * 2 * * *
* * * * ** *2 * * 2 * * * ** ** **2 2 * *** * * * 2 * 2 2 * * *— *-**— *-------*— **------------
* * * * *2 * * ** * * *2 * *2 * *
*** * * *
35 70 105 140 175measured CCr (ml/min)

90
3.5 DISCUSSIONCreatinine clearance was measured and predicted, using 11 equations, one nomogram, and urine collections of less than 24h* in a heterogeneous group of elderly people. The influence Of immobility & frailty on 24h CCr and the accuracy of its prediction were investigated.
3.5.1 Creatinine Clearance in Elderly People Comparison of Male & Female ResultsElderly males studied were matched in terms of age & M.Sc with their female counterparts but they Weighed more, had a greater SA, and significantly higher mean values for SCr, UCr & CCr. When CCr was normalized to 1.73m SA the difference in CCr was no longer significant. This suggests that part of the difference observed may be due to the inequality in weight between the sexes. One longitudinal study of people of working age found UCr excretion to be 33% greater in males, although the difference was reduced when expressed per kg bodyweight. While SCr was also found to be elevated by 21% in the males, CCr was only modestly increased, by about 8% when expressed per kg bodyweight (129). Others found SCr to be significantly higher in healthy males than females even when differences in body surface area were taken into account (130). Another study investigating renal function in 70 & 75 year olds found no sex difference with respect to GFR (131). A fourth study also reported little difference in normalized CCr between elderly males & females (132). Young males usually have a greater proportion of muscle per kg bodyweight than females although this may not necessarily be so in old age when the proportion of muscle to adipose tissue declines (108,132). Creatinine levels in serum & urine are strongly influenced

91
by total muscle mass (31,129,133,134), and even If the muscles fat ratio is similar in elderly males & females, males in this study weighed on average 10kg more than females and it is likely that their total muscle mass was greater. This may explain the difference in UCr & SCr observed between sexes.Equations to predict CCr, often in ml/min, utilize SCr & weight, both of which were significantly different between sexes. Moreover, some include a "female correction factor” to take into account the difference in muscle mass between sexes. One aim of this study was to determine if CCr was more accurately predicted for females in the presence of this factor, and so was more appropriate to analyse male & female data separately and then compare results.
FemalesFemales studied ranged in age from 60-100y and increasing age was associated with a reduction in mobility. This was accompanied by a reduction in UCr excretion, probably due to the decline in muscle mass associated with a sedentary existence, suggesting that the mobility rating scale gave a reasonable measure of activity. While no correlation was seen between age & SCr, CCr declined with increasing age. This trend has been extensively reported as an inevitable consequence of ageing, occurring even in the absence of active renal disease (123,128,131,135,136). Longitudinal studies have suggested that CCr declines from the age of 30 onwards with an acceleration in rate after age 50 (23,123), although considerable interindividual overlap occurs.In the present study CCr/SA ranged from 8-167ml/min/1.73m2 (52+26) with most subjects having a measured CCr below that quoted for a "normal” female of 80-100rol/min/1.73m2? those

92
who were immobile and very elderly generally had the lowest values. Other studies have reported similar CCr values for elderly people. Mixed sex groups of elderly people, with mean ages of 75 & 88y, had CCr of 60 & 47ml/min (136,137), while CCr was found to be 57±18 & 77+23 ml/min in groups of females with mean ages of 76 & 83y (132). 19 elderly infirm females (79±6y), had a mean CCr of 51+16ml/min but this value was calculated from two 8h urine collections and all subjects had chronic indwelling urethral catheters (87).SCr was mainly within normal limits despite some subjects having a lower than normal CCr. This will be discussed in more detail later in the chapter. UCr varied greatly within the female group from 240-2441mg (823+313). While some data at the lower end of the range could have resulted from incomplete urine collections, steps were taken to ensure that these were discarded. Other studies have reported UCr excretion to be 1173mg/24h/1.73m2 & 785mg/24h in groups with mean ages of 67 & 75y (26,136) & 746mg/24h in patients (63±16y) with rheumatoid arthritis (138).
MalesAge of the male group ranged from 60-97y and increased age was again associated with reduced mobility; both old age & immobility were associated with a decline in UCr. As for the females, increasing age was associated with reduced renal function as measured by CCr, which ranged from 10-164 ml/min/1.73m2 (56+26). Other studies found CCr to be 110 & 97ml/min/1.73m in healthy males between 65-74 & 75-84y respectively (54) which is higher than the present results. UCr Varied considerably between males from 302-2624mg/24h (1192+433), and these values are in accordance with others reported. Groups of fit elderly males aged between 65-74y

93
& 75-84y excreted 1409±25mg & 1259±45mg of UCr in 24h (123)
3*5*2 Influence of Diuretics on CCrThe elderly are known to take a disproportionate quantity of drugs, and diuretics are one of the most commonly prescribed classes* The 36 females & 60 males taking diuretics during the study were compared with subjects who were not, to determine whether diuretic use was associated with a change in CCr. For both sexes a small reduction in CCr was seen for those taking diuretics but this was not significant. Those taking diuretics were older and significantly less mobile which may explain the slight trend in CCr observed. Overall, diuretics do not appear to influence CCr and it was therefore not necessary to treat those taking diuretics separately.
3*5*3 Influence of Frailty on CCrThe elderly are not a homogeneous group but possess a range of physical abilities. The least able are usually found in care differing from their fit counterparts in the community by their limited mobility and altered body composition & posture. It is possible that these factors associated with infirmity may influence renal blood flow and hence renal function. In this study females & males were divided up into groups of fit & frail subjects and compared. For both sexes the frail group was significantly older than the fit group and the way in which frailty contributed to CCr could not be determined. Very fit, fit & frail subjects were therefore age matched & compared in an attempt to eliminate the effect of increasing age on CCr.For both sexes UCr, SCr, CCr & CCr/SA was not statistically different between very fit & fit groups, suggesting that

94
chronic but well controlled non-renal conditions are not generally associated with loss of renal function.Subsequent studies in this thesis have compared drug excretion in fit & frail groups and similar results would probably have been obtained if very fit instead of fit subjects had been used. When either very fit or fit groups were compared with their frail age-matched counterparts, a similar trend was seen for both sexes. The frail group was significantly less mobile than the fit since information on mobility was used to categorize subjects. UCr was significantly lower in the frail groups, probably due to a reduced muscle mass resulting from severely restricted mobility. Urine volume was also reduced in frailty although this was only significant for the females. It is possible that the frail group more often had incomplete urine collections, although most frail subjects were in care and urine collections were therefore supervised. Elderly subjects in general are at risk of dehydration and those in care particularly so (24,139), and this may explain the reduced urinary output in the frail group, likely to be a real observation.CCr & CCr/SA were significantly lower in the frail groups, but no statistical difference was seen for SCr between groups although frailty appeared to be associated with an increased SCr. A SCr value is dependent on both the rate of production & excretion of creatinine, and weight tended to be reduced in the frail groups. In addition, frail subjects are more likely to have muscle atrophy as a result of restricted mobility & chronic illness, and UCr was seen to be significantly reduced in this group. Thus the reduction in CCr associated with frailty would not necessarily be

95
reflected in a raised SCr. Another group of sick elderly people, mean age 80y, had a GFR of 41ml/min when measured
eiby the single shot Cr-EDTA method. Although the authors concluded that GFR was reduced in sick elderly people compared to their fit counterparts no parallel trial was carried out in the fit elderly, and results were compared with those reported by other groups who had measured GFR by other means (135).
3.6 PREDICTION OF CREATININE CLEARANCE In clinical practice GFR may be estimated by measuring endogenous creatinine clearance. While the accuracy with which CCr predicts GFR is subject to debate CCr measurement nevertheless remains in clinical usage as it is relatively easy and inexpensive to carry out compared to other methods
ci a Qivtavailable such as Cr-EDTA, Tc-DTPA or inulin clearance (31,33,36,134). To determine CCr a timed 24h urine collection is required together with a single blood sample. Concentration of creatinine in urine & serum are then measured, and since the volume of urine passed in 24h is known, a clearance value can be calculated for creatinine. One of the main criticisms of this method of GFR estimation is that an accurately timed 24h urine collection is at best difficult to achieve and at worst impossible in, for example, a confused, incontinent elderly patient. Besides this difficulty there is the obvious delay in obtaining a result, a particular drawback when GFR needs to be known before certain drugs can be prescribed. Since analyses of both urine & serum are required the cost of the test is increased and additional errors are introduced, in addition to those inherent in timing & collecting urine (140).

96
Within-subject variation in UCr excretion may be wide even in healthy people where the coefficient of variation has been found to be around 13%, even when urine is collected under strictly controlled conditions (141,142). Such variation is therefore likely to be due to true day-to-day alterations in creatinine production & excretion rather than methodological inaccuracies.Studies have shown that not all creatinine is excreted via glomerular filtration, with some eliminated via tubular secretion? this route is thought to become more important in chronic renal failure, although proteinuria does not appear to exert a significant effect on the degree of secretion (123,143,144,145,146,147). Thus CCr may overestimate GFR, although a good correlation has been observed between CCr & GFR as measured by inulin clearance where some of the likely causes of variation (eg diet & activity) do not exist (148).It has been suggested that more information is gained from knowledge of SCr alone (34,35). This has the advantage of speed & convenience, with a reduction in cost. However,SCr is usually assayed using a modification of the Jaffe reaction which has been shown to be non-specific for creatinine. Other substances able to react with the active moiety include protein, glucose, ascorbic acid, keto-acids, pyruvate, acetone, bilirubin & cepha antibiotics (35,149, 150). "Total chromagen” (creatinine + non-creatinine chromagens) rather than creatinine alone is measured, and this is an obvious source of inaccuracy when a SCr value is relied upon. In the present study SCr & UCr were measured using HPLC in order to eliminate this source of analytical error, since this method has been shown to be more specific

97
(115,151,152,153).A postprandial rise in SCr & UCr has been reported after a cooked meat-containing meal, which can give a falsely elevated SCr level, although CCr is not influenced by dietary factors (153,154,156). In this study blood was taken in the morning following the 24h urine collection in all subjects, following an overnight fast or a meat-free breakfast. Most subjects were asked about their meat intake but few consumed quantities near to the 225g or more of lean meat used in other studies.A further criticism of the use of SCr alone to estimate renal function is that the normal range quoted is much wider than the variation in SCr observed for an individual, even when analytical errors are taken into account (157,158 159). Since SCr is related to GFR in a reciprocal fashion, when renal function is normal or only mildly impaired small changes in SCr represent large changes in GFR (35,36,134). This can be a particular problem in the frail elderly and in specific conditions such as rheumatic disease, paralysis and burns where the disease process and physical inactivity leads to a reduced muscle mass and lowered creatinine production (31,123,131,136,138,160,161,162,163). Abnormal body compositions may therefore produce a normal SCr in the presence of renal impairment and an over-estimation of CCr when the classical equations are employed.One solution to this problem would be to develop more reference ranges for SCr for a variety of body weights & ages (35,134,158,163). A reduction in urine collection time would offer an advantage over the traditional 24h urine collection, particularly for those groups of patients where SCr is difficult to interpret (36). Alternatively, a better

98
method for predicting CCr from SCr would enable more easily interpreted results to be obtained from SCr without the inherent difficulties associated with a urine collection.
3.6.1 Prediction of CCr From Reduced Urine Collections Few studies have evaluated the accuracy of using a reduced urine collection interval to estimate 24h CCr despite the fact that the difficulties inherent in carrying out a 24h urine collection are well known. Studies investigating the change in urine output with time of day in healthy young subjects have found a reduction overnight (26,164). However this pattern is reversed in elderly subjects who excrete a higher proportion of water, sodium, potassium & solute output at night irrespective of fluid intake during the evening (26,165). Frail elderly females resident in hospital were nursed supine in bed for 3 days or upright in chairs for an 8h period each day for 3 days and their urine output examined (166). All exhibited a complete absence of "morning tide" of water & electrolytes regardless of position. The first day of total bedrest was associated with a large diuresis, and patients nursed in chairs also produced a large nocturnal urine output when returned to bed. After a 3 day period of bedrest the first session of nursing in chairs was characterized by oliguria. The authors concluded that changes in posture were important determinants of urinary output patterns, and may account for the frequent nocturia seen in elderly subjects.Another study investigated urine output in healthy males during normal activity & rest in the antiorthostatic position (167). While diuresis was enhanced in the antiorthostatic position, SCr & CCr did not appear to change with position. Conversely, two other studies found
99
an increase in both diuresis & CCr in healthy males & patients with fluid-retaining states in the supine position compared to when sitting upright (168,169).Those who have measured the circadian variation in CCr or GFR have found a small but pronounced reduction in CCr occurring during the night in healthy young subjects (156, 164,170). This pattern remains when subjects are fasted to eliminate any dietary effect, and is also seen in paralysed patients and is therefore unlikely to be due to changes in muscle activity. CCr has been observed to change little during a 2h period of normal activity compared to that during 2h of immobilization in healthy males (171) although a period of unusually heavy exercise may give rise to an increased UCr & SCr (134,142). However, strict control of diet & activity is reported to have little influence on the within subject variation in UCr (142).
In this study urine was collected in aliquots in 76 males & 116 females to determine whether urine collections of less than 24h could be used to accurately predict 24h CCr.Urine was collected over time periods of 4-12h to represent morning, afternoon/evening and night urine collections. Since urine was passed as usual collection periods varied in length although the night collection always represented that urine passed during the hours spent in bed overnight. For both male & female groups CCram, CCrpm & CCrn, when plotted against 24h CCr had a high correlation coefficient, a gradient near to unity and a y intercept close to 0 (appendix C7). CCram & CCrpm overestimated CCr by a mean figure of between 2-8 ml/min while CCrn underestimated CCr by about 5-10ml/min. The small reduction in CCr observed overnight is in agreement with other studies following the

100
diurnal variation in CCr. Other comparisons of CCr from urine collections less than 24h with traditional 24h CCr have generally chosen shorter time periods over which to collect urine. One study compared CCr from a lh collection with a 24h collection in healthy young males and found good correlations between them (172). A second compared CCr calculated from urine collections of 2, 4 & 24h with GFR measured using " mTc-DTPA (147). GFR was overestimated by all urine collection methods with the 2h collection seen to be least accurate. Patients with CCr < 50ml/min were more likely to have CCr overestimated than those with CCr > 50 ml/min. No similar studies have been carried out in elderly people. A very short urine collection would not be practical in the elderly who more frequently suffer from incomplete bladder emptying, difficulty in micturition and dehydration. The accurate timing required would also pose problems on a busy ward. Although water loading to increase urine flow was used to facilitate a one hour urine collection, results were less accurate (172), and problems would be experienced in the elderly. One study saw CCr increased in healthy young & elderly males following water loading, with the elderly group appearing less able to efficiently excrete excess water (27).
The accuracy of CCr prediction using urine collection periods less than 24h was compared between those with CCr > 50ml/min & those with CCr < 50ml/min. For both females & males the correlation between measured & predicted CCr remained good and was not compromised at the extremes of 24h CCr. Diuretic use did not appear to influence accuracy of CCr prediction for any of the collection periods.Males & females were divided up into groups of very fit,

101
fit & frail age matched subjects and CCr prediction compared. While frailty was strongly associated with a reduction in 24h CCr, predictability was not generally compromised in any group. For each group CCrn remained slightly less than 24h CCr while CCram and less so CCrpm were slightly greater than 24h CCr.
3.6.2 Prediction of CCr from SCr and Equations From as far back as 1959 groups of workers have attempted to devise either an equation or nomogram to accurately predict CCr from SCr. Early equations consisted of a simple mathematical relationship between SCr & CCr but their validity was found to be limited. The reduction in CCr with increasing age and the relationship of SCr to bodyweight or lean body mass led to the development of more complex equations and to date 12 equations & 4 nomograms exist for use in adults (31,118,119,120,121,123,125,126,128 133,135,173,174,175,176,177,178). A further variety of studies have been carried out to evaluate the use of these formulae in healthy young & elderly subjects and in patients with a variety of conditions.In the present study the accuracy of CCr prediction using a variety of formulae was assessed in a heterogeneous group of elderly people. A 24h urine collection was successfully completed by 146 females & 99 males aged between 60-100y, and used to calculate CCr. Each individuals SCr was then used to predict CCr using 11 equations (El-Ell) and 1 nomogram (E12), and the absolute & percent differences between measured & predicted CCr were determined.When predicted v measured CCr was plotted for each equation and both sexes a large variation in accuracy between equations was seen; those which relied upon a simple

102
relationship between SCr & CCr without the incorporation of age or weight factors were the least accurate. Although these equations are the most easy to use and remember, they have little place in the clinical practice due to their poor predictability, and so they were not used any further in the statistical analyses. Those equations found to predict CCr best were similar for both sexes and were El (Cockcroft & Gault), E4 (Jelliffe & Jelliffe), E9 (Mawer), E10 (Hull) & Ell (Gates).In only one case (Ell) did the "female correction factor” enhance predictability for females and the other selected equations were used in the same form for both sexes. While few studies have investigated the usefulness of the female correction factor, those studies that have are divided in opinion. Two studies have found the use of a correction factor to be unnecessary in elderly females (137,179), although in the former study the sample size was small. Others studies found a correction factor of 0.9 & 0.84 more appropriate when El & E3 were used (180,181). Body composition is known to change in old age, with the proportion of fat to muscle increasing and body water decreasing (108,182). Thus in the elderly it is possible that males & females differ little in respect to muscle:fat proportions particularly when muscle atrophy is present. Accuracy of CCr prediction was similar for the 5 best fit equations for both sexes. Correlation coefficients for predicted v measured CCr ranged from 0.716-0.858 & 0.694- 0.862, gradients from 0.70-0.78 & 0.64-0.71, and intercepts from 11.6-13.1 & 8.0-15.9 for females & males respectively. Mean predicted CCr agreed well with mean measured CCr for each equation, but the accuracy of prediction was not

103
constant across the spectrum of measured CCr. When predicted v measured CCr was plotted those with the lowest measured CCr tended towards overprediction, and those with the highest CCr tended towards underprediction. This pattern was most pronounced for the females.Out of the 5 best fit equations E10 & Ell were the least accurate and most variable for both sexes. The most accurate and least variable equations were El & E4 for the females and E4 & E9 for the males.Using the 5 ”best fit” equations subjects were divided into groups of those with a CCr > 50ml/min & those with a CCr < 50 ml/min. For both sexes the error of prediction was seen to alter between groups. Those with measured CCr > 50ml/min tended to have CCr underestimated by the equations, while those with a measured CCr < 50ml/min tended to have CCr overestimated, and the change in prediction accuracy between the two groups was significant in all cases.The line of measured v predicted CCr for the females was shifted to the left of that for males with the degree of overprediction greater and underprediction lower for the females. The use of a female correction factor would have improved the position of the female line with respect to the male line, although the correlation coefficient would not be improved. It seems likely that a correction factor of 0.95 would be more appropriate, if thought necessary, in this group, since 0.90 or 0.85 reduced the accuracy of prediction considerably.Using a similar technique the accuracy of CCr prediction for females & males taking diuretics was compared to those who did not and appeared to be independent of diuretic use. The accuracy of CCr prediction in very fit, fit & frail age

104
matched groups of males & females were then compared. For the females, very fit & fit groups had comparable measured CCr and while CCr tended to be underpredicted the degree of underprediction was similar between groups. The very fit males tended to have a greater measured CCr than the fit group, and consequently the degree of underprediction was significantly greater in the very fit group. Frailty was associated with a significantly reduced measured CCr for both sexes when compared with their age matched fitter counterparts. For the females, the frail group had the lowest measured CCr & exhibited consistently overpredicted CCr using the selected equations. For the males, very fit, fit & frail groups all tended to have CCr underpredicted, although the degree of underprediction was lowest in the frail group who had the lowest measured CCr.
Other studies have compared the accuracy of CCr predictionusing a variety of equations on selected groups ofsubjects. Most have investigated CCr prediction in healthypeople with a range of ages and found a good correlationbetween measured & predicted CCr (118,119,128,174,176,177,180,181,183,184,185). El predicted GFR measured by 99mTc-
51DTPA or Cr-EDTA at least as accurately as 24h CCr m two studies although only 35 patients carried out 24h urine collections in the former study (147,185). Two groups investigated CCr prediction in elderly people (88 & 70y) and found good correlations between measured & predicted CCr using El (132,137). Another group found E12 to best predict CCr for elderly people (72y) with measured CCr of between 25-89 ml/min (186). However, debilitated elderly females resident in nursing homes were found to have CCr overpredicted using El & E3, although urine collections of

105
8h were used to calculate a 24h CCr without validation (87). These subjects were also chronically catheterised, which may have adverse effects on renal function.Several studies have examined CCr prediction in patients with renal impairment and found differing results, although in all cases renal function was stable; only E4 & E9 may be used when renal function is changing. CCr was predicted accurately in a group of Chinese patients with renal impairment using El (177). Another study found CCr predicted more accurately using E9 & E10 than El & E3 in patients with renal dysfunction (126). A further study concluded that E2 best predicted CCr if patients had a SCr > 1.5mg/dl, while CCr of those with SCr < 1.5mg/dl was best predicted using E2 (178).Accuracy of CCr prediction appears to breakdown for patients with hepatic dysfunction using E1,E3,E9 & E10 (126). Others have found CCr poorly predicted in gross RVF and low cardiac output states using E12 and CCF using E1,E3 & E9 (187). Males with extensive burns have been found to have CCr overpredicted using E2 & E3, with El & E12 giving better results although the tendency towards overprediction remained when measured CCr < 60ml/min (188). This study also found that the use of lean body mass in place of actual bodyweight did not improve accuracy of prediction. CCr overprediction has also been found for both paraplegics & tetraplegics using El, with the authors recommending a correction factor of 0.8 for paraplegics & 0.6 for tetraplegics (160). Patients with rheumatoid arthritis also had CCr overpredicted by 20ml/min using El & E12 (138).

106
3.7 CONCLUSIONSCCr was measured & predicted for a range of elderly people, and those who were frail had a reduced renal function when compared to their fit counterparts if age-sex matched.
Urine collections of less than 24h predicted CCr better than any equation or nomogram studied, for both males & females. Predictability of CCr from a reduced urine collection was not influenced by the magnitude of measured CCr, or compromised in frailty. Those taking diuretics had CCr predicted equally well as those who were not. CCrpm & CCrn were the most accurate and least variable, with CCrpm tending to overpredict CCr slightly and CCrn tending to underpredict CCr.Given that CCr tends to overpredict GFR, it would seem most appropriate to employ an overnight urine collection to estimate CCr and GFR. This could simply be carried out if urine passed before going to bed was discarded, and the time noted. All urine passed overnight would then be collected, up until and including that passed on getting up, when the time would again be noted. Blood for SCr determination could then be taken, and the two specimens sent together for analysis.
Of the 11 equations & 1 nomogram studied none predicted CCr as accurately as reduced urine collections. The variability was greater, and the predictability varied with magnitude of measured CCr. Those with the lowest measured CCr tended to have CCr overpredicted by the greatest degree. Frailty is associated with a reduced CCr and it is on this population that the formulae are most often applied, and who are at greatest risk of adverse drug reactions.

107
The literature suggests that the greatest inaccuracies in CCr prediction occur in subjects suffering from conditions which produce an abnormal body composition. Therefore weight loss & muscle atrophy commonly seen with frailty would be likely to cause inaccuracies in CCr prediction, and results from the present study confirm this.
Data from this study suggests that use of urine collections less than 24h, particularly when carried out overnight, predicts CCr more accurately than any of the existing equations or nomograms. The accuracy of CCr prediction using a reduced urine collection is valid for both fit & frail elderly people, even in the presence of renal impairment, and immobility and diuretic use do not appear to affect the results.

108
CHAPTER FOUR FRUSEMIDE EXCRETION IN ELDERLY PEOPLE
4.1 INTRODUCTIONIt has been estimated that one in three elderly people regularly take diuretics. Currently one of the most widely prescribed diuretic formulation is co-amilofruse (frusemide 40mg + amiloride 5mg? 39). Frusemide excretion in man has been the subject of a number of studies which have used both healthy volunteers and patients with particular diagnoses. However, there appears to have been little work carried out specifically in elderly patients with multiple pathology with associated immobility and data compared with those of similar age whose lifestyle is not restricted by chronic disease. In this study frusemide (FRU) excretion was studied in elderly people taking FRU chronically, who were either "fit" (well controlled chronic illness, mobile & living independently) or "frail" (similar diagnoses but immobile & lack of independence) in an attempt to determine the influence of immobility and frailty on FRU elimination.
4.2 PROCEDUREFit & frail elderly people aged over 64y were invited to take part in the study. All were non-acutely ill and had been regularly taking FRU as frusemide (FS) or Frumil (FM) tablets, for chronic illness of cardiovascular origin, for a minimum of one month. Exclusion criteria are given in 2.2. Each subject was provided with an information sheet (appendix Dl, standard or enlarged type) and given the opportunity to question Dr L Parker (GP trainee) or myself about the study prior to its commencement.

109
On the morning of the study subjects were asked to empty their bladder and then take their usual FRU tablet with a glass of water, in the upright position. FRU dose varied according to individual prescriptions which were not altered for the study. Tablets were taken after a light breakfast of toast or cereal then food & drink was avoided for the next hour, after which time both were taken freely.
During the study subjects were questioned about their day- to-day activities & mobility. They were categorized as fit or frail and had their mobility scored according to the mobility rating devised for the study (Appendix Al, A2).The form given in appendix D2 was completed during the study when co-medication was noted and subjects were weighed & measured. Demographic details & drugs taken are given in Appendix D3.
5-10ml of blood was taken at 2,4,8 & 24h & urine collected for 24h after dosing. FRU is light sensitive so all samples were collected and stored in lightproof containers. FRU was measured in all samples, UCr in all urine samples, and SCr in serum at 24h. Urine samples collected over 24h were assayed in 3 aliquots each of about 8h, with the final aliquot spanning the time spent in bed overnight. Methods of analysis for creatinine & FRU are given in 2.3.4 & 2.3.5
Elimination AUC, apparent serum clearance (Cls),Cls/kg, renal clearance (Clr), Clr/kg, Clr from 0-6h (Clr 0-6), and CCr were calculated as per 2.4.Correlations were determined using Spearmans correlation with significance levels taken as p<0.01 to reduce the chance of Type II error. Groups were compared using the Mann-Whitney test when significance levels were p<0.05.

110
4.3 RESULTS OF PHARMACOKINETIC PARAMETERS 35 subject (22F) successfully completed the study? results from Individuals for FRU & creatinine measurements are given in appendices D4 & D5, and summarized in appendix D6.
4.3.1 Fmmil v FrusemideData from FM & FS groups were compared using the Mann- Whitney test with results given in appendix D7. A significant difference was seen for elimination t1/2 which ranged from 0.82-11.90h (4.49±2.85) for FM & 1.36-20.17h (9.83+5.55) for FS (p<0.01). Clearances were not significantly different between groups although the FS group consistently had a greater variability & s.d. No other statistical differences were seen. However, the above differences in kinetic parameters were considered important enough for the FS & FM groups to be treated separately.
4.3.2 Females v MalesData were divided into male & female groups for both those taking FM & FS and compared using the Mann-Whitney test with results given in appendices D8 & D9.The FM group comprised of 16 females & 9 males. UCr was significantly greater in the male group (1279±252mg M, 776± 258mg F?p<0.001) as was SA (p<0.02) & weight (p<0.03). No other significant differences were seen.6 females & 4 males took FS. When the sexes were compared no significant differences were seen.From these results it seemed most appropriate for FM & FS groups to be of mixed sex since no significant differences were seen between sexes in terms of FRU clearance
4.3.2 Subjects Taking Frumil25 of the 35 participants in the study took either 1 or 2

Ill
FM tablets and a summary of results & correlations from this FM group are given in appendices D7 & D8.Age ranged from 65-100y (80±9), correlating with urine volume (p<0.001). Mobility score ranged from 1-4 and correlated with CCr (p<0.01).Elimination showed a wide interindividual variation of0.82-11.90h (4.49+2.8) correlating with no other parameter. Apparent serum clearance, Cls, exhibited an 18 fold range from 16-279ml/min (116±69), correlating with Clr (p<0.001). Cls/kg showed a narrower interpatient range of 0.31-4.36 ml/min/kg (1.72±0.99). Renal clearance, Clr, was also highly variable with a range of 10-197ml/min (81.8+54.5), correlating with %Du (p<0.01); Cls & Cls/kg (p<0.001).While Clr/kg was less variable, Clr 0-6h was more so (range 7-520ml/min? 170±131).Dose of FRU ranged from 40-80mg and did not correlate with any other parameter. Urine volume/24h varied between 472- 2761ml (1515+564). Percent dose in urine, %Du, ranged from 8.3-69.1% (36.2+16.2), correlating only with Clr.UCr ranged from 365-1524mg and correlated with CCr/SA, urine vol & weight (p<0.01); CCr & SA (p<0.001). SCr varied from 1.00-4.19mg/100ml (1.86+0.84), correlating with CCr. CCr varied from 9-77ml/min (41.8+19.8) and correlated with M.Sc, SCr & urine volume (p<0.01)? UCr (p<0.001). CCr/SA ranged from ll-67ml/min/1.73m2.
4.3.4 Subjects taking Frusemide10 subjects studied took FS at a dose varying from 40 to 120mg. A summary of results & correlations are given in appendices D12 & D13.For this group age ranged from 67-89y (77±9). Elimination ti/2 var*ed widely from 1.36-20.17h (9.83±5.55). Cls varied

112
from 14-422ml/min (114±139) & Clr from ll-289ml/min (79±91) Numbers were limited in the FS group, and so while many trends seen were similar to the FM group, few reached significance. Significant correlations similar to the FM group were: Clr v Cls & Cls/kg. Correlations reaching significance in the FS group but not in the FM group were : urine volume v Cls (p<0.01); & tjy2 v Clr (p<0.01).
4.4 COMPARISON OF PARAMETERS FOR FIT V FRAIL GROUPS Since pharmacokinetic parameters did not appear to be affected by sex, groups studied were of males + females. Proportionally more frail than fit subjects were found to be taking FS. Since tjy2 was increased & Cls tended to be reduced in those taking FS, data from subjects taking FS & FM were analysed separately.
4.4.1 Subjects Taking FrumilResults from fit (n=14) & frail (n=ll) subjects taking FM are given in appendix D14 and Figs. 4.4.1 to 4.4.6.The frail group were on average 8y older than the fit group who were significantly more mobile. FRU dose differed between groups - all fit & 6 frail subjects took 40mg FRU,5 frail subjects took 80mg of FRU.No significant difference was seen between groups for t ^ 2 (4.00+3•33h fit, 5.12+2.06h fr), although it tended to be lower in the fit group who exhibited the greater range.CCr & CCr/SA were significantly greater in the fit than frail group (CCr: 51±18ml/min fit, 30±17ml/min fr.?p<0.02). Urine volume also tended to be greater in fit subjects although %Du was comparable between fit & frail groups.Cls & Clr were consistently greater in the fit subjects taking FM, even when corrected for bodyweight, but this was

113
not statistically significant.Fit & frail groups were similar for UCr, SCr, weight & SA.
4.4.2 Subjects taking FrusemideResults from fit (n=3) & frail (n=7) subjects taking FS are given in appendix D15. Both groups were similar in age (72±6y fit, 80±9y fr) but fit subjects were significantly more mobile. All fit & 4 frail subjects took 40mg FRU, 2 frail subjects took 80mg & 1 took 120mg.The fit group taking FS tended to have a lower tjy2 but this was not significant (4.00±3.33h fit, 5.12±2.06h fr). Cls & Cls/kg were again reduced in the frail group as were Clr, Clr/kg & Clr 0-6h, but none of these observations reached statistical significance. Groups were similar for urine volume, %Du, UCr, SCr, CCr, weight & SA.
4.4.3 Age-Matched Group taking FrumilThe inequality in age between fit & frail groups for those taking FM meant that the effects of frailty & age could not be separated. It was not possible to age-sex match subjects and so sub-groups were formed of the 8 oldest fit & 7 youngest frail subjects. Results are given in appendix D16. Despite the equalization in age between groups, fit subjects remained significantly more mobile than frail subjects. Elimination t ^ 2 was found to be significantly greater in the frail group (3.69±3.53h fit, 5.09±1.68h fr.? p<0.05). However, while clearances again tended to be reduced in the frail group significance was not reached.No other statistical differences were seen.

tl/2
(hours)
Fig. 4.4.1
12
Distribution of FRU tl/2 in Fit & Frail Elderly People taking FRUMIL
10
3e 4-
FIT FRAIL
Fig. 4.4.2 Distribution of CCr/SA in Fit &Frail Elderly People taking FRUMIL
70
60
5 50 a
40
30
20
10
FIT FRAIL
Fig 4.4.3 Distribution of Urine Voluae / 24 hours in Fit & Frail Elderly People Taking FRUMIL
3000
« 1000•Hu3
0- FIT FRAIL
fit subject k = frail subject
114

115
Fig. 4.4.5 Distribution of FRU Cls in Fit & Fig. 4.4.4 Distribution of %Du in Fit & Frail Frail Elderly People taking FRUMIL
Elderly People taking FRUMIL
70
60
50
40
30
20
10
300
~ 200c
100
FIT FRAIL
Fig. 4.4.6 Distribution of FRU Clr in Fit &Frail Elderly People taking FRUMIL
200
cma
® 100hrHo3
FIT FRAIL
FIT FRAIL
fit subject A = frail subject
115

116
4.5 DISCUSSIONIn this study the elimination of FRU was investigated in elderly people chronically taking FS or FM, with varying degrees of immobility & frailty. FRU excretion was followed to determine whether immobility or frailty appeared to influence the efficiency of elimination.
4.5.1 Frusemide Kinetics17 fit & 18 frail subjects with mobility scores ranging from 1 to 4 took part in the study. 25 were taking FM, and of those 14 were fit. FRU kinetics were followed from 3-24h post-dose and over this period underwent first-order kinetics, with log serum [FRU] v time yielding a linear plot. This agrees with other studies where FRU disappearance has been described by an open two compartment model, with the biexponential decline in serum [FRU] resolving into 2 first-order disposition constants (53,56, 57,58). The first phase predominantly describes distribution and has a half-life approximating to 10m, with peak serum concentrations occurring about 60 minutes after oral dosing (53,60,189). The longer second phase corresponds to drug elimination whose tjy2 is estimated to be 50-70 minutes in controls (48).Only the elimination phase was followed in the present study, since this involved fewer blood samples being taken. Sampling times were therefore chosen such that distribution would be complete and peak plasma concentration passed before sampling. Analysis of results showed that blood sampling times were not optimal and would have been more consistent had samples been taken earlier and closer together. An improved scheme for sampling would have been2.3.4.5 & 6h post-dose. Correlation coefficient of log

117
serum [FRU] v time, used to calculate t±/2 > varied between 0.997-0.821 (0.942+0.05? mean+s.d.) and in a few cases had to be calculated from 2 time points. An initial pilot study would have been advantageous.
No statistical difference was seen between sexes for t1^2 or Cl, for FS or FM. This agrees with other studies which have found that FRU excretion is not influenced by sex (56, 58,62). The groups discussed were therefore of mixed sex.
4.5.2 Elimination Half-lifeElimination t^y2 was determined in all but one subject taking FS (F49F) whose case will be discussed later. The range in tjy2 for the remaining subjects was wide, from 0.82 - 11.90h (4.49+2.85) for the group taking FM & 1.36 - 20.17h (9.83+5.55) for those taking FS.Means & ranges are greater than those reported from investigations of FRU excretion in young healthy individuals where mean tjy2 has been estimated as 52±15, 36±5, 51+4 & 70+16 minutes when FRU was assayed by HPLC (61 190,191,192). Earlier work on FRU disposition involving paper chromatography, spectrofluorometry or radiolabelling are thought to have been less specific? using these methods mean t^y2 estimates have ranged from 26-72 minutes (48).
Studies of FRU elimination in particular disease states have found a wider variation in mean t^/2 ' patients with uraemia were found to have a 3 fold prolongation in tjy2 compared to controls (51+4m controls, 156+25m uraemics; p<0.05) although in the same study (59) patients with nephrotic syndrome were found to have a similar tjy2 to controls (54+6m). Another study compared FRU t1^2 in those suffering from renal failure with controls - averaged
118
0.79h in controls & ranged from 1.15-24.58h in patients(61). While the longest t^^s were found in those withadvanced renal disease, 2 patients with CCr of 8 & 6ml/minhad ti/2 s of 1-42 & 1.55h, comparable with controls.Investigations into FRU disposition in patients with acutepulmonary oedema found that elimination t1 varied widely1/ zfrom 127-1190m and presence of acute MI or differences in the severity of pulmonary oedema did not correlate with variations in (58)* Patients with heart failure werealso found to have an increased elimination tjy2 compared to normals (60). Patients with decompensated heart failure not previously treated with FRU had a mean tjy2 of 92m while those with cardiac decompensation under long term FRU treatment had a mean t1^2 of 134m.Studies of FRU disposition in old age have concluded that increased age appears to prolong elimination t^^2, although to what extent is uncertain. When FRU was administered to healthy "elderly" volunteers (age 64±4y), mean t1^2 was 102 ±33m (62-149m), compared to 70±20m seen in healthy young volunteers (57). A second study (62) used elderly patients (70-93y) already on FRU long term for chronic disease, and found tjy2 to range from 59-317m.Elimination t ^ 2 obtained in the present study are greater than those seen in healthy young & elderly volunteers, but agree with those obtained in patients suffering from cardiovascular disease or chronic renal impairment. All subjects used in the present study were already taking FRU for treatment of a specific disease state, that is, no "healthy" volunteers were used. The fit & frail definitions are relative terms, and fit subjects were far less disabled by their illness than frail subjects.

119
FRU t1/2 has been reported as increasing in old age,although the degree by which it changes is not certain (57,62). The present study aimed to determine whether frailtyor immobility influenced FRU elimination and so the agerange of subjects studied was relatively narrow. Absenceof correlation between t^y2 & age for those taking FM isnot contrary to previous studies since the majority ofsubjects were aged between 70-86y. Mean t1/0 was 4.31±3.73hl / zfor those aged 70-78y & 4.40±2.02h for those aged 80-86y. Only 6 subjects taking FM were outside the age ranges. Similarity of mean tjy2 between the cohorts explains the lack of correlation seen between age & t1^2 i-n the FM group For subjects taking FS, a tendency towards a correlation between age & t^y2 was seen. For those aged 67-69y tjy2 was 5.30+2.64h & for those aged 81-89y the mean was 15.49+ 4.72h? 2 subjects were outside these ranges, aged 78 & 89y. The difference in t1^2 between cohorts gives rise to the trend towards a correlation between age & t^y2 despite the small age range and limited numbers used. However, all subjects aged 81-89y were frail while of those aged 67-69y 2 were fit & 2 frail. The correlation between age & may have arisen due to the loss of fitness associated with an increase in age, rather than age per se.
No correlations were seen between t^^2 & SCr, CCr or CCr/SA FRU is highly protein bound (approximately 98%) and so elimination is mainly via active secretion into the kidney tubule lumen via the non-specific organic acid secretory pathway (194), since only free drug can be excreted by glomerular filtration (48). Both GFR & tubular secretion are known to decline with age although controversy exists over whether the rates are linked. The reduction in GFR

120
with age, even in the absence of significant pathology, is now well documented (123,136) and observed in this study for all participating subjects (age v CCr? p<0.02).Less is known about the decline in tubular function with age, since it is much more difficult to measure. Tubular mass has been show to decline with age but the loss of tubular function is not a homogeneous process and not associated with a commensurate contraction of kidney mass. The question of whether the nephron degenerates as a unit is unresolved. One study (195) concluded that a significant correlation between dimensions of the glomerulus & proximal tubules in young subjects was lost as the kidney aged. Hypertrophy of tubules in nephrons with normal or even absent glomeruli was observed. Conversely, other workers who examined 100 kidneys from subjects who died suddenly showed that after the fourth decade the volume of glomeruli & tubules diminished at the same rate (196). Since the majority of FRU is excreted by tubular secretion, tjy2 would not necessarily correlate with CCr if proximal tubules & glomeruli degenerated at differing rates.A plot of CCr v tjy2 shows that for those taking FM or FS in this study, subjects with compromised renal function can have a prolonged or normal t ^ 2 compared to those of a similar age with good renal function. Some studies have shown a direct correlation to exist between CCr & t^^2 (58) while others have not (59,61). The variation in tjy2 may be explained by differences in rate of tubular & glomerular degeneration which may occur in old age & renal impairment. In renal failure endogenous anions may accumulate which can compete with anionic drugs for the active anion secretory pathway (59). Variations in concentrations of endogenous

121
anions may influence the amount of FRU excreted by the tubules. Alternatively, the diversity of t^/2 could be due to differences in nonrenal clearance (61), discussed presently.Differences could also be due to changes in Vd or body composition between individuals. Elimination tjy2 a hybrid quantity, depending on both clearance & Vd. Since ti/2 inversely proportional to Cl, any change in Cl is only reflected in an increased t^/2 if Vd is not significantly altered in those being compared. Age is known to be associated with alterations in body composition, which in turn affect Vd (9). A decline in lean body mass & increase in adipose-tissue in relation to total body mass is generally seen in old age (10,108,197), and variations in their proportions between subjects could influence Vd and hence t^/2 in this study. Weight & SA did not correlate with t^/2 for FM or FS, and these are known to influence Vd, but do not reflect body composition.The apparent Vd of an extensively protein-bound drug may be influenced by changes in the extent of binding to plasma proteins (9,18). Studies have consistently shown an age- related decline in albumin, which appears to be the only plasma protein with which FRU binds (52). The reduction in albumin may be large when elderly subjects are poorly nourished, have advanced or chronic illness or are severely debilitated (49). Studies have shown the percentual binding of FRU to albumin to be slightly but significantly reduced in serum from elderly patients than in serum from controls (96.5+0.7% v 97.7+0.3%) with a positive correlation between protein binding and albumin concentration (50). Decreased binding has also been found in acute renal failure (51,52),

122
nephrotic syndrome & ureamia (59) and in anephric patients (56). The age & disease-related changes in the free fraction of FRU could influence Vd to complicate interpretation of the differences in elimination t^y2 observed between subjects.
One frail subject (F49F) taking FS had only one measurable serum [FRU], at 1.92h, with a low recovery of FRU in urine (8.6%). The subject was obese (84kg), oedematous, had a CCr of 55ml/min and was not taking any other drugs concomitantly which were known to influence FRU absorption or elimination. Although it is possible that the daily dose of FRU was not taken, and that FRU detected was from a late dose the previous day, this is unlikely since the patient was hospitalized. These observations suggest that either reduced absorption or increased metabolism were occurring. Although no other person had only one detectable serum [FRU], a wide variation in t1^2 was seen between subjects which cannot be accounted for by changes in CCr as discussed above.Age per se has not been reported as influencing drug absorption except in a very few specific cases. Early work carried out on kinetics in the elderly found absorption of sulphamethizole, phenylbutazone & paracetamol unchanged (13). Later reports agreed with this finding, including one where absorption of FRU was investigated and found to be only very slightly decreased in old age (55). However, reports with regards to FRU absorption in disease states have varied, and it is thought that reduced absorption may in certain cases be responsible for "diuretic resistance". This term has been used to describe cases where even large doses of oral diuretic have evoked a very small response

123
(43). One case was reported of a patient with ideopathic oedema who exhibited a change in FRU bioavailability according to the degree of oedema - it varied from 75% in the oedema-free to only 17% in the oedematous state.Kinetic parameters were similar in both states and response to i.v. FRU was unchanged (198). It was proposed that the changes were due to reduced absorption from the gastrointestinal tract which was affected by oedema.Another group reported erratic and incomplete absorption of FRU in CHF (199). Patients with severe CHF were given oral & i.v. doses of FRU & AUC ratios compared. Average absorption was 61%, consistent with previous reports (48), but varied widely from patient to patient (31-79%).Kinetics were again comparable between patients. Another study reported no difference in FRU bioavailability between patients with CCF & controls, although again the interindividual variation was wide but the within subject variation was low (200). Other studies have reported FRU bioavailability to vary from 34-80% in heart failure (48) with a decrease also seen in patients with uraemia or nephrotic syndrome. Reports have also suggested than FRU is ineffective orally when CCr is less than 3ml/min thought to again be due to impaired absorption from the GI tract since i.v. FRU remains effective (43,201). Conflicting results were obtained by another group of workers investigating FRU absorption in decompensated heart failure (54). Each subject served as their own control, with FRU absorption compared before and after cardiac compensation. While lag time & time to peak serum concentrations decreased by 57% & 27%, and peak serum [FRU] increased by 27%, no significant changes occurred for absorption or

124
elimination AUC or absorPti°n of D-xylose, when thetwo states were compared. This suggests a qualitative but not quantitative, alteration in FRU absorption in decompensated heart failure. This was thought to be a contributing factor to diuretic resistance seen in some patients.There have also been reports of malabsorption of FRU by phenytoin, which can reduce absorption by 50%, with a corresponding reduction in Cmax but unchanged clearances. The mechanism for malabsorption is not clear (202).It is possible that reduced FRU absorption could account for a low serum [FRU] & %Du in subjects such as F49F but no reports have found an associated change in kinetics. This would imply that even if reduced absorption occurred in some cases it could not account for the variation in tjL/2*
Mobility score was not correlated with suggesting thatmobility is unlikely to be an important determinant of FRU excretion rate. From these results it would appear that while age & probably clinical condition may influence FRU elimination no direct correlations exist which can beused to predict t1^2 for a particular subject. Other factors are important and will be discussed in 4.5.3.
Subjects taking FS were found to have a significantly greater t^y2 than those FM - when all t^^s were ranked, subjects taking FS were responsible for 5 out of 6 highest results. It seems that either the presence of amiloride in FM influences FRU disposition, or those subjects prescribed FS are in some way different from those prescribed FM. Considering the 10 subjects taking FS, more were frail (n=7) than fit (n=3). They tended to pass less urine than

125
the FM group despite the dose of FRU being greater for some FS individuals. Fluid intake was not measured in either group. While no significant differences were seen between clearances of the groups, inspection of data showed that the lower quartile was consistently lower, and s.d. greater, in the FS group for Cls, Cls/kg & Clr. FM & FS groups were similar in age, mobility, UCr, SCr, CCr & CCr/SA.Two frail subjects (F14GPF & F51F) taking FS were also taking spironolactone but their 11/2S not appear todiffer from those only taking FS. Other workers have reported a lack of pharmacokinetic interaction between spironolactone and FRU, although a trend towards a higher clearance and lower 2 for FRU was seen (203)? if spironolactone influenced FRU excretion it would have been in the opposite direction to that observed between FS & FM groups. With only two subjects taking spironolactone a definitive statement cannot be made but there appears to be no need to exclude them from the FS data.Two fit subjects (F05GPF & M17GPF) taking FM were also taking a non steroidal anti-inflammatory drug (NSAID) concomitantly. An interaction has been reported to occur between indomethacin & FRU, probably due to inhibition of prostaglandin synthesis (42,43), resulting in a loss of response to FRU and possible reduction in FRU renal clearance. The two subjects taking a NSAID had relatively high tjy2s but M17GPF had a low CCr. If an interaction had occurred in these subjects, the effect would be an increased t.jy2. Since those taking FM have a significantly lower tjy2 the use of a NSAID by two subjects in the FM cannot explain the result. Amiloride is a potassium

126
sparing diuretic seldom used alone, but frequently administered in combination with thiazide or loop diuretics to attenuate their potassium wasting effects. It is a basic drug eliminated by filtration and active secretion via the nonspecific organic base secretory pathway of the proximal tubule. A study of amiloride disposition in the elderly has shown that age appears to reduce clearance and increase probably due to a reduced GFR observed inold age (204).
No studies have compared FRU disposition when alone and in combination with amiloride, and so the possibility of a pharmacokinetic interaction between FRU & amiloride during absorption, distribution or elimination cannot be ruled out. Amiloride is unlikely to influence FRU absorption since it is not related to any drug known to do so.Albumin has high capacity but low affinity binding for most cationic drugs, with a low capacity but high affinity for acidic drugs. There are no reports of amiloride binding to albumin making this mode of interaction also unlikely.FRU is secreted by the organic acid pathway while amiloride is secreted by the organic base pathway, so no competition would be likely at that site.It is difficult to explain the difference observed between FM & FS groups on the basis of a pharmacokinetic interaction, although the possibility remains. A more likely explanation may be the preponderance of LVF observed in the FS group when compared to those taking FM. This difference in pathology between the groups may account for the reduced efficiency of elimination in the FS group.From these results it seems likely that there is a difference between those taking FS & FM despite comparable

127
kidney function & mobility, and thus more appropriate to treat the groups separately than to combine data.
4.5.3 Apparent Serum Clearance of Frusemide To determine a drugs total body clearance i.v. administration is necessary. This was not possible and so oral FRU was given and apparent (relative) serum clearance (Cls) was calculated. FRU is rapidly but incompletely absorbed from the gastro-intestinal tract, with 50-70% of an oral dose being available for systemic circulation (48, 53,193,199,205). A figure of 50% of the dose administered was used to calculate Cls in this study, it being assumed that absorption was similar for all individuals studied. Studies have shown that while age does not appear to significantly alter FRU absorption (55,62), bioavailability of FRU may be altered in some disease states as discussed in 4.5.2. All subjects studied were elderly and clinically stable and whilst the percentage of dose recovered in urine varied between subjects, no significant difference was seen between fit & frail groups. These results suggest that the assumption is reasonable, although it could only be proven with comparative i.v. and oral studies.Using a figure of 50% systemic bioavailability, Cls ranged from 16-279ml/min (116±69) in the FM & 14-422ml/min (115± 139) in the FS group. Cls/kg ranged from 0.31-4.36ml/min/kg (1.72+0.99) in the FM & 0.23-6.59ml/min/kg (1.90±2.09) in the FS group. Other workers have calculated Cls followingi.v. FRU and obtained different values according to the method of analysis. When HPLC has been employed, Cls in young healthy volunteers has been estimated at 194±35, 170+19, 219±49 & 170±19ml/min (56,57,61), 2.18±0.12 & 2.54+ 0.96ml/min/kg (59,206). Studies of FRU excretion in old age

128
have calculated Cls to be 129+1lml/min in healthy elderly subjects (64+4y) & 73+27 ml/min in elderly patients with cardiovascular disease on long term FRU therapy (57,62).Cls has been reported to be 86+16ml/min in patients with cardiac decompensation previously untreated with FRU & 69+ 22ml/min in patients with cardiac decompensation under long term FRU therapy (60). Cls in renal failure has also been investigated, and estimated to be 66±19ml/min in anephric patients, 2.96+0.51 & 2.54+0.96ml/min/kg & 80+29ml/min in those with nephrotic syndrome (56,59,61,206). Patients with uraemia have been reported to have Cls of 0.62+0.1ml/min/kg (59). Estimates of Cls in the present study are lower than those seen in healthy young volunteers, but are comparable with those for elderly and chronically ill subjects. There is a wide interpatient variation however, with a very high Cls being seen in a few individuals.
For subjects taking FM or FS, Cls correlated with CCr & CCr/SA in agreement with findings from other studies (58,5961). While renal function appears to be a determinant of FRU Cl, it is not the only one, since a few subjects with low CCr had a high Cls. GFR is known to decline with age and this could lead to the reduction in Cls observed in those studies carried out in elderly subjects. The importance of renal function in FRU excretion would also explain the reduction in Cls seen in patients with nephrotic syndrome or uraemia. Reasons for the interindividual variations seen will be discussed in 4.5.4.
4.5.4 Renal Clearance of FrusemideClr in the present study was calculated to be 82±55ml/min (1.24+0.85ml/min/kg) for subjects taking FM and 79+91ml/min

129
(1.37+1.40ml/min/kg) for those taking FS. This agrees with other groups investigating FRU Clr in elderly & chronically ill patients. A mean Clr of 75+9ml/min was found for healthy elderly (57), 40+18ml/min for chronically ill elderly (62), 1.18±0.29 & 1.31+0.59ml/min/kg in patients with nephrotic syndrome (59,206), & 0.06+0.01ml/min/kg in uraemics (59). FRU Clr is generally agreed to be reduced in old age & chronic illness compared to healthy young volunteers.There was a tendency for Clr to be correlated with CCr in both the FM & FS groups. This has been observed in other studies (62,48) but not all (58,59). Where a correlation has been found, it is thought to be due to the role renal function plays in FRU excretion in urine, when tubular secretion decreases with GFR. However, this correlation is not seen in all studies, suggesting that other routes of elimination besides renal excretion are possible.In severe renal impairment accumulation of endogenous anions may inhibit active anion transport and thus reduce Clr of drugs such as FRU (59).When renal clearance is subtracted from total body clearance the product represents that FRU cleared by nonrenal routes. In this study nonrenal clearance, Clnr, could not be calculated since oral administration only enabled Cls to be estimated, but Cls & Clr were correlated. Studies have found Clnr to approximate to 42% of Cls in healthy elderly (57) and 47% in the chronically ill elderly on long term FRU (62). In uraemia Clnr was reduced by 41% of that seen in normals but in nephrotic syndrome it tended to increase (59), as confirmed in a second study (206). Controversy exists about nonrenal routes of FRU excretion.

130
Radiolabelling studies have detected FRU in bile which may be one route of elimination, increasing when renal function is impaired (53,61). It has been suggested that FRU is metabolized to FRU-glucuronide & 4-chlor-5-sulphamoyl- anthranilic-acid (58,60,62). The glucuronide conjugate has been detected in urine of patients administered FRU, with elderly appearing to excrete less than young volunteers (5762). The amount of glucuronide excreted has been reported to vary from 0.7mg/24h in subjects not previously treated with FRU, to 7mg/24h in subjects given FRU for a minimum of 6 months, when a 40mg dose is given i.v. (60). This has given rise to the idea that chronic FRU therapy may induce glucuronidation, to enable t1^2 to be normal despite a reduced CCr. With the advent of HPLC, while FRU- glucuronide has been detected, CSA has not. Any remaining FRU not excreted renally, secreted into bile or metabolized to FRU-glucuronide may be metabolized by another route but evidence is lacking.It is possible that the degree of nonrenal elimination may have varied between subjects in the present study. Elimination not correlate with CCr suggesting thatfiltration alone is not responsible for FRU excretion. If tubular secretion declines at a similar rate to GFR, the lack of correlation suggests that extrarenal elimination is taking place. The wide interindividual variation in both ti/2 and clearance also suggests that nonrenal excretion may be occurring, to differing degrees in those studied. Subjects on long term FRU may have developed an enhanced glucuronidation pathway which could give rise to a near normal t^/2 in some with low CCr. Clearance is calculated assuming 50% bioavailability but reports indicate that this

131
may change with clinical condition, and this could explain the variation in Cl. Elimination t1^2 is not calculated using dose absorbed and yet a wide variation is also seen with this parameter. It seems likely that extrarenal metabolism has occurred in some subjects studied.
4.5.5 Urine Volume & Frusemide DoseUrine volume passed over 24h ranged from 472-2761ml (1515+ 564) for subjects taking FM & 656-3217ml (1450+819) for those taking FS. Volumes were lower than would be expected following a potent diuretic, suggesting that some subjects were fluid-depleted. Urine volume was not related to FRU dose for either group, whilst urine volume correlated with Cls for subjects taking FS.
4.5.6 Frusemide Recovery in UrineAll fit subjects taking FM took 40mg FRU & frail subjects took 40 or 80mg FRU. Of those taking FS, all fit subjects took 40mg & frail subjects took 40,80 or 120mg FRU. The absolute amount of FRU in urine could not be compared & so percent of dose recovered in urine was calculated (%Du). Means & ranges of %Du were similar for both groups - subjects taking FM excreted from 8-69% (36+16) & those taking FS excreted 9-65% (33+15).Elderly patients have been reported as excreting 22-55% of an oral dose in urine as FRU & FRU-glucuronide, with recovery increasing to 51-84% after i.v. injection (62). Urinary recovery of an oral dose was reported to drop to 1.4% & 0.7% in patients with CCr of 3ml/min (61).
One subject taking FS & 5 taking FM excreted more than 50% of dose administered. This suggests that in some cases in excess of 50% of the dose is absorbed although this figure

132
was used in clearance calculations.The wide interpatient range of %Du suggests that either absorption is not comparable or nonrenal excretion differs between subjects. FRU metabolites were not assayed and so it is not possible to say from the data which is the most likely. Studies report a change in both absorption and nonrenal excretion in certain disease states.It is possible that urine was not collected accurately for 24h, and this gave the wide variation in %Du, but this would only account for those subjects excreting lower than expected amounts. The urine collection could have been carried out for longer than 24h but this would have involved the omission of at least one dose of FRU which would not have been acceptable to many of the participants. A collection period in excess of 24h would also have caused more inconvenience for those subjects who were mobile, and while this possibility was examined it was not felt to be practicable particularly in the community.Subjects with the shortest did not excretesignificantly more of the dose, also suggesting that a longer collection period would not have increased recovery. %Du was related to CCr for both groups but this relationship failed to reach significance. FRU excretion is only partially dependent on GFR as previously discussed, and this route of elimination appears to become less important with a decline in renal function. This could explain the weak correlation seen.
4.6 FRUSEMIDE KINETICS IN FIT & FRAIL ELDERLY PEOPLE4.6.1 Comparison of Age14 fit & 11 frail subjects took FM. Age was significantly

133
different between groups, with the fit being on average 8y younger than the frail. This arose from a scarcity of •'young" immobile volunteers - only 2 subjects below 80y were frail. It would have been possible to recruit more immobile subjects if the study been extended to more than one general practice. At the time this was not possible but this method was later used in the digoxin study where recruitment was difficult. A sub-group was formed of FM subjects in the age range 76-86y in an attempt to separate the influence of age and frailty on parameters measured. This will be discussed in 4.6.8
3 fit & 7 frail subjects took FS and age was not significantly different between groups.
4.6.2 Mobility ScoreMobility score was significantly different between fit & frail groups as expected since fit & frail definitions included information on mobility. For those taking FM there was little overlap of scores between groups - 1 fit & 5 frail subjects had a mobility score of 3. No overlap was seen for the FS group - all fit subjects had a score of 1.
4.6.3 Comparison of Elimination Half-livesFor those subjects taking FM, no significant difference was found for t1^2 between fit & frail groups despite the age difference, although the trend was towards a reduced t^^2 in fit subjects (4.00±3.33h fit, 5.12±2.06h fr). The range of tjy2 was greater in the fit group with 3 subjects (F05GPF, M08GPF & M10GPF) having t ^ s of 9.13, 11.90 &7•56h. These subjects all had mobility scores of 1, and CCr of 55, 29 & 77ml/min respectively. The high tjy2 & reduced CCr of M08GPF were probably linked, but the CCr of

134
the other 2 subjects were normal for their age and cannot explain the - M10GPF had the highest CCr of the entiregroup. None were on drugs known to interact with FRU disposition. This would suggest that neither age or CCr can be used to predict FRU t^y2 in the elderly. Fitness and clinical condition may be important, but all 3 subjects were highly mobile at the time of the study. However, 22 months after the study, both M08GPF & M10GPF were deceased, although the cause of death was not known. Unfortunately, overall mortality rates in fit & frail groups were not known. Subjects were categorized as fit or frail according to a combination of factors detectable by eye. No biochemical or haematological tests were carried out since this was thought to be more relevant and applicable to the situation faced by the prescriber. Had blood tests been carried out it is possible that undiagnosed pathology may have been detected in those subjects now deceased which may have led to them being categorized as frail rather than fit. If fit & frail definitions included results from blood tests the usefulness would be limited, particularly in general practice.For those taking FS, 3 were fit & 7 frail. Fit subjects had a smaller range, a lower mean t ^ 2 and smaller s.d. than frail subjects but these observations failed to reach significance. One fit subject (F22GPF) recruited from general practice had subsequently died. Again the disparity between t1^2 & CCr can be seen - one fit subject with a CCr of 45ml/min had a t1^2 of 9.33h and another with a CCr of 50ml/min had a t^^2 of 1.36h. Other factors besides CCr and mobility appear to be important in the determination of tjy2.

135
As previously discussed, elimination t ^ 2 is a hybrid function of both Cl & Vd. Groups were matched for weight & SA but body composition & hence Vd may have differed between fit & frail subjects. However, the assumption that absorption is comparable for all subjects, made for Cl calculation, may not be correct. Differences seen between the fit & frail for t1^2 is therefore important since is calculated without the inclusion of % dose absorbed.
4.6.4 Comparison of Apparent Serum Clearance For those taking FM, Cls ranged from 47-273ml/min (130+64) for fit & 16-279ml/min (98±64) for frail subjects (p<0.2). Although the ranges are similar for both groups there is a trend towards an increased Cls in the fit group.The fit had a significantly greater CCr than the frail group (p<0.02). If Cls v CCr is plotted for fit & frail a relationship between them can be seen with a few notable exceptions. One frail subject (F47F) had a CCr of 33ml/min but a Cls of 278ml/min. This subject is separate from the rest of the frail group but the reason for this is not clear. The category she was placed in was correct considering her clinical condition.Results indicate that other factors besides CCr and fitness category appear to influence Cls. It is possible that the assumption made about absorption in the calculation of Cls may not be correct, and that differences in absorption may have given rise to the differences in Cls.
For the FS group Cls of fit varied from 39-422ml/min (187+ 206) & 14-263ml/min (78±96) for frail subjects (p<0.4).The results show that fit subjects tended to have greater Cls, but there were only 3 subjects in that group, and the

136
s.d. was wide. However, one frail subject with a CCr of 28ml/min had a Cls of 263ml/min which emphasises the difficulty in determining what factors influence FRU Cls. When Cls was expressed per kg bodyweight the differences between fit and frail groups observed remained the same.
4.6.5 Comparison of Renal ClearanceFor those taking FM, Clr ranged from 22-197ml/min (85±55) in fit & 10-176ml/min (78+57) in frail subjects (p<0.7).The fit group had higher minimum, maximum, Q1 and mean values for Cls, but Q3 and median were greater for the frail group. While CCr correlated with Cls for the FM group, this was not the case for Clr. Subjects with a low CCr had some of the highest Clr values. A similar pattern was seen for Clr/kg when the fit and frail groups were compared•CCr had been calculated over 24h and also over 3 time periods each approximating to 6-8h. The CCr 0-6h was compared with the Clr 0-6h and with a few exceptions the pattern seemed to be more predictable, and the correlation was significant when all those taking FM were considered (p<0•01). CCr 0-6h appears to be a more reliable predictor of FRU Clr, but other factors are also important.
For the FS group, Clr ranged from 24-289ml/min (124±144) for the fit & ll-109ml/min (52±40) for the frail group.Clr was higher for the fit group but there were only 3 subjects in that group. When CCr 0-6h was plotted against Clr 0-6h a relationship was seen but was not significant.
4.6.6 Comparison of Urine Volume & % Dose Excreted in Urine For the FM group, urine volume ranged from 928-2761ml (1727 ±567) for the fit & 472-1880ml (1245±449) for the frail

137
group (p<0.06). Volumes were low suggesting that some subjects were fluid depleted. One fit subject and 2 frail subjects passed volumes less than 1000ml but these subjects did not excrete the lowest % dose in urine, suggesting that urine collections were accurate. Frail subjects tended to pass lower volumes despite being administered on average a greater dose of FRU. However, measurement of fluid intake was not attempted in either group, although this may have provided some useful information on accuracy of urine collection.
%Du ranged from 12-61% (34±15) for the fit & 8-69% (39±17) for the frail group, with the similarity in %Du suggesting a comparable accuracy of urine collection between groups. However, there was no correlation between FRU dose & urine volume. The dose response curve for FRU is not linear and there is a ceiling response - if the dose of FRU is doubled the diuresis would not necessarily also double (48).It is possible that subjects with a low urine output poorly absorbed the FRU or suffered circulatory fluid depletion which could contribute to a reduced urine output. Elderly patients have an impaired capacity to reabsorb water, manifested by a reduction in maximum concentrating ability (24,207), and this can readily lead to dehydration, both from lack of water and sodium. Diuretic use can upset the normal physiological state and hospital routine may compound this problem (40,139). This can lead to fluid depletion which may account for the reduced urine volumes.
For the FS group, urine volume ranged from 1093-1458ml (1245±190) for the fit & 656-3217ml (1553±1010) for the frail group. %Du varied from 29-34% (32+2) in the fit &

138
9-65% (33+19) in the frail. There appears to be little difference between the fit & frail groups taking FS in terms of response to, or excretion of FRU in urine.
4.6.7 Age-Matched Subjects Taking FrumilSubjects taking FM aged between 76-86y were selected to form fit & frail subgroups, to enable the influences of age & frailty to be separated, and appendix D16 gives the results. When fit (n=8) & frail (n=7) groups no longer differed in age, mobility score remained significantly different. UCr, SCr, CCr, weight, SA, %Du & urine volume were similar between groups.Both Cls & Clr tended to be lower in the frail group, but this was not significant, and this trend disappeared when Cl was normalized for bodyweight. However, elimination ti/2 was significantly higher in the frail group, with the mean value differing by 1.4h.
4.7 CONCLUSIONSThe elimination of FRU was followed in fit & frail elderly people with chronic illness of cardiovascular origin, with the aim of determining whether mobility & “fitness” influenced FRU excretion. FRU had to be administered orally, and blood samples were not taken at optimum time intervals. These limitations meant that data was interpreted with caution.
Elimination t1/2 was calculated by estimating the gradient of time v log serum [FRU] plot. Blood sampling was not optimal with the correlation coefficient of the line varying? in a few cases t1^2 was calculated from two time points. Elimination a hybrid quantity, depending

139
on both clearance and Vd. Vd is in turn influenced by weight, body composition, and plasma-protein binding, all of which can change in old age & chronic disability. There are inherent errors in the accuracy of FRU analysis by HPLC, although the coefficient of variation was low (3.1% at 0.lug/ml, 2.3% at 2.0ug/ml), and further difficulties were experienced in the collection & assay of a light- sensitive compound. In order to calculate apparent clearance it was assumed that absorption was comparable for all subjects studied. However, a review of the literature showed that the assumption may be invalid in some cases. Furthermore, groups of subjects were small and heterogeneous. Because of flaws in this study comparisons made should be considered orientating & qualitative rather than definitive & quantitative.
All participants were regularly taking FRU for a variety of cardiovascular problems. None were "healthy” volunteers and the terms "fit” and "frail” were therefore used relatively in this study, according to the definitions given in appendix Al. The lifestyle of fit individuals appeared to be relatively unaffected by the presence of chronic disease and all were able to live independently in the community. On the other hand frail subjects experienced some degree of disablement through chronic illness, and although none were acutely ill, all were unable to live independently, requiring assistance with activities of daily living. Those classified as frail were also likely to have more significant pathology, and be taking more drugs. The definitions did not require biochemical or haematological tests to be carried out since this was thought to best represent the situation usually faced by
140
the prescriber. Had a battery of tests been run it is possible that some fit subjects may have been recategorized as frail. This would have had the effect of increasing numbers in the frail group but the trends observed would have most likely remained the same.
Subjects taking FS appeared to eliminate FRU less efficiently than those taking FM. While there was no statistical difference between subjects taking FS & FM with respect to CCr or mobility score, those subjects taking FS were more likely to be frail. The decision to prescribe FS rather than FM may have been made on the basis of diagnosis (more subjects taking FS had LVF), or results from biochemical tests obtained by the physician. Since there appeared to be a difference between those taking FM & FS the groups were kept separate rather than combined which had been the original intention. Despite the reduced numbers seen in FS and FM, both exhibited similar patterns.
Since the calculation of t ^ 2 in some cases involved the use of only two time points, and estimation of clearance necessitated the use of an unsubstantiated assumption, the findings from both will be combined to form a general statement.Although significance was rarely reached, there appeared to be a trend towards a decreased elimination rate of FRU in frail subjects compared to their fit counterparts, and this trend remained when FM subjects were age-matched. While CCr tended to be related to clearance, t1y2 was not* it known that FRU is eliminated at least partially via the kidney? the minor fraction of free drug being excreted by glomerular filtration and the bound drug excreted via

141
secretion by proximal tubules (48). Studies have failed to show conclusively whether degeneration of tubules and glomeruli occurs at similar rates during the aging process (23). If rates are comparable, then the lack of correlation between elimination rate & CCr, remarkable in a few cases, suggests that either tubular secretion is inhibited or other excretory mechanisms are also responsible for the removal of FRU from the body.In severe renal impairment, particularly with uraemia, endogenous anions may accumulate and compete with anionic drugs for secretion via the proximal tubule. If this occurred in some subjects it could account for those cases where Clr is especially low. Competition can occur to differing degrees, but this would not explain the apparently high Cls seen in some subjects with a low CCr.
Absorption of FRU following administration of a solid dose formulation is not complete (48), but even if systemic bioavailability approximated to 50% of the dose administered, recovery of unchanged FRU in urine was often substantially lower. Studies using i.v. administration have also showed a urinary recovery less than 100% (57,60). This suggests the existence of alternative pathways by which FRU may be eliminated, with the relative importance varying between individuals. Since the advent of HPLC, frusemide glucuronide, a metabolite of FRU, has been detected in urine (57,62), while the more controversial CSA has not. While it is not known whether other metabolic pathways exist, studies have shown that FRU may also be secreted into bile and excreted in the faeces (53,61).In the present study only unchanged FRU in urine was assayed, and it is not possible to comment on whether

142
alternative metabolic pathways were responsible for the excretion of part of the FRU administered. However, those individuals with a low CCr who also had a low FRU mayhave eliminated FRU via other mechanisms besides renal clearance of unchanged FRU.
Frail subjects appeared to have consistently increased tjy2s and reduced clearances compared to fit subjects, although this was only significant when subjects taking FM were age-matched. Frail subjects had a significantly lower CCr and this could be the explanation for the difference. Other studies have noted that while renal clearance is reduced in elderly compared to young volunteers the proportion of FRU cleared nonrenally is unchanged (57). If in the present study fit subjects excreted more FRU renally due to an increased GFR and accompanying increased tubular secretion, with both groups excreting similar quantities of FRU via nonrenal mechanisms this could explain the results. Fit & frail groups differed in many ways. The frail were much less mobile than the fit, spending more time sitting and supine. The difference in posture between the groups could explain the changes in FRU kinetics, since marked circulatory and plasma volume changes occur in the upright compared to the supine position (208). Benzylpenicillin, also eliminated via the nonspecific organic acid secretory pathway, has been shown to have an increased renal clearance but reduced first-order rate constant for metabolism when patients were subject to bedrest as opposed to normal activity. The authors concluded that bed rest per se could bring about pronounced changes in the distribution, metabolism and excretion of drugs relative to values obtained in ambulatory subjects (41,209). It was

143
thought that these changes, which have also been seen following physical exercise, could be due to an increased metabolic rate seen in active subjects.Changes ih posture may influence CCr, although evidence has been inconclusive. One study observed no change in CCr when subjects were rested in the antiorthostatic position compared to when they underwent ordinary ambulatory activities (167). However, a considerable increase in diuresis and sodium excretion was observed in the antiorthostatic position. When FRU was orally administered a summation of the effects of diuretic and antiorthostatic position was seen, thought to be due to different mechanisms of action. Another study found an increase in CCr, diuresis & natriuresis in the supine compared to a sitting position for "normals” and patients with hypoalbuminaemic states (168). CCr increased further when the subject was placed in the head down tilt position. Patients with cirrhosis and ascites given bumetanide i.v. have been found to have an increased GFR, and enhanced diuretic and natriuretic response when supine than when in the upright position (210). However, the kinetics of bumetanide in the different positions were not investigated.In the present study frail patients, who were more likely to be inactive and spend longer in the supine position, had a lower CCr and reduced elimination of FRU. This suggests that the differences observed are not mainly due to differences in posture, although they may attenuate the effect of old age & frailty. To determine the effect of posture, a study could to be carried out with each subject acting as their own control and FRU administered on two
144
occasions with subjects either upright or supine. Frail subjects were less "well" than fit subjects although all were suffering from cardiovascular disease. Prolonged inactivity is known to cause gradual deterioration of cardiovascular function, and frail subjects may have a reduced cardiac output, stroke volume and renal plasma flow (57). These difference in clinical status between the two groups may have influenced FRU elimination.
To conclude, fit elderly people appeared to handle an oral dose of FRU more efficiently than their frail counterparts. Age appears to be associated with a decline in FRU elimination and this is partly related to the inevitable decline in kidney function seen with increasing age. In a few individuals impaired renal function, and hence reduced CCr, seemed to have little bearing on FRU elimination which was more efficient than would be expected. It would seem likely that FRU is eliminated by nonrenal routes, which may be enhanced in some individuals with poor renal function. The qualitative differences observed between fit and frail elderly people may in part be due to the inevitable differences in activity, posture and blood flow. More work needs to be done to investigate the probable routes of FRU metabolism in order to determine the cause of differences observed in this study.

145
CHAPTER FIVE PARACETAMOL METABOLISM IN ELDERLY PEOPLE
5.1 INTRODUCTIONParacetamol (PAR) is a commonly used mild analgesic whose elimination is accomplished by hepatic metabolism. A number of studies have been performed to investigate PAR disposition in both young & elderly healthy volunteers but little work has been done in the chronically ill, disabled elderly. In this study an acute dose of PAR (lg) was given to elderly people who were either "fit" (well & living independently in the community) or "frail” (having chronic illness, immobility & loss of independence). PAR excretion was followed to determine the influence of immobility & frailty.
5.2 PROCEDUREFit & frail elderly people aged over 64y were invited to take part in the study. Exclusion criteria are given in 2.2. Agreement of the volunteers' GP or Geriatrician was received before proceeding with the study. Each subject was provided in advance with an information sheet (appendix FI, standard or enlarged type) and able to question myself or Dr L Parker (trainee GP) prior to commencement of the study. Subjects avoided taking any PAR-containing preparation from the night before the study start.
On the morning of the study subjects ate a light breakfast of toast or cereal and an hour later emptied their bladder and took 2 x 500mg PAR tablets with a glass of water, either standing or sitting upright. Food was avoided for at least an hour after dosing, and thereafter taken freely.

146
During the study subjects were questioned about their day- to-day activities & mobility, categorized as fit or frail, and had their mobility scored according the mobility scale devised for the study (appendices A1 & A2). The form given in appendix F2 was filled in during the study when subjects were weighed & measured and any medications taken were noted. Demographic details, diagnoses & drugs taken are given in appendix F3.
5-10ml of blood was taken at 0,3,4,6 & 12h and all urine collected for 24 hours after dosing. PAR was measured in all samples, UCr in all urine samples, and SCr in serum at time 0. Urine samples collected over 24h were assayed in 3 aliquots each as near to 8 hours as possible with the final aliquot spanning the hours spent overnight in bed. Analytical methods for PAR & creatinine are given in 2.3.3,
For patients prescribed PAR regularly or "as required", further doses were omitted for 12h after the lg test dose until the last blood sample was taken. After this time PAR was avoided wherever possible until completion of the study. If any patient required PAR after 12h then urine was voided before PAR was taken, to provide a final urine specimen for UPAR analysis. The urine collection continued for measurement of UCr excretion only.
PAR elimination half-life ' AUC * apparent clearance(Cl) were calculated as per 2.4. From the urine data free urinary paracetamol (UPAR), PAR glucuronide + sulphate conjugates (UPARG+S), and total UPAR (free PAR + UPARG+S) were determined. SCr & UCr were measured to calculate CCr.
Correlations between parameters were determined using

147
Spearmans coefficient of rank correlation with significance levels taken to occur at p<0.01. Groups of fit & frail subjects and males & females were compared using the Mann- Whitney U test, with significance occurring at p<0.05.
5.3 RESULTS OF PHARMACOKINETIC PARAMETERS 5.3.1 All Subjects56 subjects successfully participated in the study (34F & 22M). One patient (F37P) was later found to be taking phenytoin, known to interact with PAR metabolism, and so these results were excluded from statistical analyses (67, 211). Individual results are given in appendices F4 & F5. Results & correlations from the entire group (males + females) are summarized in appendices F6 & F7.Age ranged from 64-97y (80+8; mean±s.d.) and was not related to M.Sc or t1^2 but correlated with Cl, total UPAR, UCr, CCr & CCr/SA (p<0.01).Mobility score correlated with CCr (p<0.01)? UPARG+S, total UPAR & UCr (p<0.001).PAR elimination t^^2 correlated with Cl & Cl/kg (p<0.01).A large inter-individual range was seen for Cl (5.3-38.71/h a multiple of 7.3), which correlated with age, t1/2, CCr & CCr/SA (p<0.01); urine volume, UCr, SA & weight (p<0.001). However, Cl/kg exhibited a smaller range (0.12-0.591/h/kg? a multiple of 4.8) and only correlated with t-jy2 (p<0.01). Urine volume correlated with age, UPARG+S, total UPAR, CCr & weight (p<0.01); Cl, UCr & SA (p<0.001).Free UPAR showed no correlations. Between 0 (none detected) & 101.5mg of free UPAR (30.5±21.3), and 289.2-1192.lmg of total UPAR (715.1+185.3mg) were recovered in urine over 24h Of this an average of 680.8+184.8mg PAR equivalents (187.7-

148
1109.8mg) were as PAR glucuronide + sulphate. UPARG+S & total UPAR correlated with M.Sc & UCr (p<0.001)? urine volume, age & CCr (p<0.01).SCr ranged from 0.50-3.78mg/100ml (1.38+0.66), correlating with CCr/SA & CCr (p<0.001). CCr varied from 10-105ml/min (48+25) and CCr/SA from ll-115ml/min/l.73m2 (51±24). Both correlated with age, M.Sc, Cl, UPARG+S, total UPAR (p<0.01) UCr, SCr, weight & SA (p<0.001).
5.3.2 Female SubjectsResults & correlations from all female subjects are given in appendices F8 & F9. The females were not well matched with respect to age & mobility, with no females below the age of 80 years having a mobility score of 3 or less. This gave a correlation between age & mobility score (p<0.01). Many of the relationships previously seen in 5.2.1 failed to reach significance when only the females were considered but the trends remained noticeable and formed a similar pattern to the entire group. Significant correlations were: age v M.Sc & urine vol (p<0.01); M.Sc v UCr, UPARG+S & total UPAR (p<0.01)? t^ / 2 v Cl (p<0.01); Cl V tjy2' urine vol, UCr & CCr (p<0.01), weight & SA (p<0.001)? UPARG+S v M.Sc & total UPAR (p<0.01)? Total UPAR v M.Sc, urine vol & UPARG+S (p<0.01); SCr v CCr (p<0.001)? CCr v Cl, weight &SA (p<0.01), UCr & SCr (p<0.001)
5.3.3 Male SubjectsResults & correlations from all male subjects are given in appendices F10 & Fll. Males were well matched with respect to age & mobility score which were not correlated. Age & SCr were correlated (p<0.01), a relationship not seen with the females or the entire group. Overall, the male group

149
exhibited a similar pattern of correlations as the entire group, but the reduction in numbers caused most trends to only approach significance. Significant correlations were:- age v SCr (pcO.Ol); M.Sc v UPARG+S, total UPAR & UCr (p<0.01)? Total UPAR & UPARG+S v M.Sc (p<0.01), UCr (p<0.001); UCr v M.Sc, UPARG+S, total UPAR, CCr, weight &SA (p<0.01)? SCr v CCr (p<0.01); CCr v UCr & SCr (p<0.01).
5.3.4 Comparison of Male and Female ResultsResults from females & males were compared using the Mann-Whitney test and the results are given in appendix FI2.The pattern of correlations seen for females & males were similar with few exceptions. The males were better matched for age & mobility, with mobility scores evenly spanning the range of ages. Thus the correlation of age v mobility score seen for the female group was not reproduced for the males. The mean age was lower for the males (78+8y M, 82+8y F) but this difference was not significant. Mobility scores were similar.The male group had a significantly greater t1^2 (3.32+1.15h M, 2.80+0.69h F? p<0.04) but they exhibited a wider range and hence standard deviation. A significant difference also existed between [SPAR] at 3 & 4h post-dose reflecting the difference in t^^2 between sexes.SCr was significantly increased for the males (1.65±0.78 M, 1.20+0.50mg/dl F?p<0.02) likewise UCr (970+504mg M, 696+252 mg F?p<0.05).The male group had a significantly greater weight (66+14kg M, 58±15kg F?p<0.04) & SA.Cl, Cl/kg, urine vol, free UPAR, UPARG+S, total UPAR, CCr & CCr/SA were not significantly different between sexes.

150
5.4 COMPARISON OF PARAMETERS FOR FIT V FRAIL GROUPS5.4.1 All SubjectsSubjects were divided into fit & frail groups according to the definitions given in appendix A1 and compared. Results for the entire group (females + males) are given in appendix F13 and Figs. 5.4.1 to 5.4.6.There was a 6 year age difference between fit & frail groups (75±8y fit, 84±7y fr.?p<0.01), largely due to the lack of immobile females under 80y.From the serum PAR data significant differences were seen between groups for t1^2 (2.67±0.46h fit, 3.38±1.16 fr; p<0.005), Cl (18±7ml/min fit, 14±5ml/min fr?p<0.02) &Cl/kg (p<0.05). [SPAR] at 3h & 4h were not significantly different.From the UPAR data no difference between fit & frail groups was found for free UPAR excretion, but UPARG+S & total UPAR were significantly greater for the fit group (p<0.002).This was reflected in the difference in excretion rate of total UPAR from 0-7 & 0-15h post-dose (p<0.01). Fit subjects passed significantly more urine during the 24h collection period (1392±551ml fit, 1037±465ml fr?p<0.02). SCr was similar for both groups (1.28+0.41mg/dl fit, 1.50± 0.85 mg/dl fr), while UCr & CCr were significantly greater for the fit group (p<0.002 & p<0.05). The difference in CCr/SA approached significance (p<0.06) but [UCr] did not. Weight & SA were comparable between groups.
5.4.2 Female SubjectsFit & frail female groups were compared and the results are given in appendix FI4. The females were poorly matched in terms of age, with an 8y difference between the mean age of the fit & frail groups (78+9y fit, 86+5y fr.?p<0.01).

151
The frail females had a significantly increased elimination ti/2 (2.59+0.35h fit, 3.04±0.91h fr?p<0.05), although no statistical difference was seen between fit & frail females for Cl (17±8ml/min fit, 14±5ml/min fr), Cl/kg or [SPAR] at 3h or 4h.While there was no difference between free UPAR excretion for the two groups, frail females excreted significantly less UPARG+S & total UPAR (p<0.02).UCr excretion was significantly greater in the fit group (789+231mg fit, 556±221mg fr?p<0.02).There was no difference in urine volume, [UCr], SCr, CCr or CCr/SA between the fit & frail groups who were matched in terms of bodyweight & SA.
5.4.3 Hale SubjectsFit & frail groups of male subjects were compared and the results are given in appendix F15. The two groups were well matched for age (76+8y fit, 80+9y fr).From the serum PAR data was 9reater frail group(2.79+0.59h fit, 3.85+1.34h fr?p<0.02), who also showed a significant reduction in both Cl & Cl/kg (Cl: 21+5ml/min fit, 14+5ml/min fr?p<0.01). [SPAR] at 3 & 4h were also significantly lower for the fit males (p<0.02).From the UPAR data there was no difference between the groups for free UPAR, but the frail males excreted significantly less UPARG+S (p<0.02) & total UPAR (p<0.04), with the rate of total UPAR excretion at 0-7h & 0-15h postdose significantly lower in this group (p<0.02 & p<0.005). Urine volume & UCr excretion were significantly lower in the frail group (p<0.03).There was no difference between groups for [UCr], SCr, CCr, CCr/SA, weight & SA.

152
5.4.4 Age-Sex Hatched PairsSome of the differences seen between the fit & frail groups could be confounded by their disparity in ages and so 32 subjects were age-sex matched to within one year to give 16 pairs. Results & correlations from these groups are given in appendices F16, F17 & F18.With equalization of mean ages, the increased tjy2 in the frail group remained (2.69±0.52h fit, 3.52±1.37h fr;p<0.02) Cl & Cl/kg both tended to be reduced in the frail group (Cl: 17±5ml/min fit, 14+6ml/min fr) but neither reached statistical significance (p<0.07).Free UPAR excretion was similar between groups while UPARG+S & total UPAR were again significantly reduced in the frail group.Urine volume, UCr, SCr, CCr, CCr/SA, weight & SA did not differ significantly between fit & frail groups.

PAR
tl/2
(hours)
Fig. 5.4.1Distribution of PARACETAMOL t.. in Fit & Frail Elderly People '
7-
5-
3-
FIT FRAIL
40
Fig. 5.4.2Distribution of PARACETAMOL clearance in Fit & Frail Elderly People
aiHW 30HH01
20
10-
FIT FRAIL
Fig. 5.4.3Distribution of CCr in Fit & Frail Elderly People in the PARACETAMOL Study120-
c 100-
*
BO-
40-
20-
0J
.i_______
A * A
FIT FRAIL
= fit subject = frail subject
median
153

Pig. 5.4.4Distribution of free UPAR in Fit & Frail Elderly People
100-
NS'~80-&3<0u* 60-
40-
20-
AA A
- a - —
A AA
A *-A------
FIT FRAIL
1100-
5 900<N\ICO+
d 700
500*
300H
Fig. 5.4.5Distribution of UPARG+S inFit & Frail Elderly People
Fig. 5.4.6Distribution of total UPAR inFit & Frail Elderly People
■CL - .©_
1100
900-
S 700-
500
300-
fit FRAIL FIT FRAIL
0= fit subject A = frail subject median
154

155
5.5 DISCUSSION5.5.1 IntroductionIn this study a therapeutic dose of PAR was given orally to 55 elderly people with varying degrees of immobility and frailty. Their mobility was scored from 1 (most mobile) to 5 using a rating scale devised for the study, according to their activity in general and during the study. Subjects were also categorized as fit or frail. The excretion of PAR was followed with serum PAR data allowing elimination AUC, apparent Cl & Cl/kg to be calculated. Urine PAR data enabled free UPAR, UPARG+S and total UPAR to be determined. SA, SCr, CCr and CCr/SA were also calculated.
5.5.2 Paracetamol Kinetics29 fit (18F) & 26 frail (15F) elderly people took part in the study, with mobility scores ranging from 1 to 5. PAR kinetics from 3-12h after dosing were followed and appeared to undergo first-order kinetics, with log [SPAR] v time yielding a linear plot. This agrees with other studies of PAR pharmacokinetics (64). The sampling times chosen were past the peak [SPAR] and the maximal [SPAR] had been reached in every subject before the 4h sample. PAR absorption from a solid dose formulation is reported to give peak [SPAR] around 0.79h postdose in young volunteers (12) and 0.74h in elderly subjects (13), with distribution complete at 1-1.5h (212). Sampling times in the present study anticipated both the absorption and distribution phases to be well passed. The correlation coefficient of log [SPAR] v time approximated to unity in all cases (r>0.947), enabling accurate estimation of t^y2, AUC & Cl.
There was a significant difference between the females &

156
males for t1 ,̂2 and [SPAR] at 3 & 4h, and so for these the sexes will be discussed separately. No differences were seen for other pharmacokinetic parameters and so the sexes will be combined, and only the entire group discussed.
5.5.3 Elimination Half-lifeA circadian variation in the rate of PAR elimination has been reported with t-jy2 being reduced by 15% when given at 6am compared to 2pm (213). PAR was therefore administered at a similar time of day for all subjects, between 0730 & 1050. The mean elimination for the female group was2•80+0.69h (range 1.96-6.09h), and for males 3.32±1.15h (1.97-7.33h). The ranges, similar for both sexes, spanned an almost fourfold range. The mean t1^2 are higher than those quoted in other texts but within the ranges cited. Reports of elimination t1^2 have varied, ranging from 1.9-3.3h in young subjects (mean age 29y? 79) and 1.9-4.3h (79), 1.43-3.45h (80) & 1.9-4.3h (12) for elderly subjects with mean ages of 70, 77 & 71y respectively.The group in the present study were older (80.3±8.3y) than elderly groups in other studies, who have used only healthy volunteers. The markedly raised t.jy2 se©n here in a few individuals suggests that the physical condition of the subject may influence the rate of PAR elimination. Elimination t ^ 2 was not related to age for either sex, even when subjects were grouped into ten year cohorts, and the mean t^^2 for each group compared. This study aimed to determine changes in PAR kinetics with mobility and frailty in old age, so the age range examined was narrower than in other studies where young and elderly groups have been compared. Comparisons of PAR tjy2 in young and elderly volunteers are inconclusive, with different authors stating

157
both that age increases PAR tjy2 (80,13) and does not affect PAR t^^2 (79).
The female group had a significantly lower t1^2 (p<0.04) and [SPAR] at 3 & 4h than the male group, while Cl & Cl/kg were not statistically different. The males were on average 8kg (14%) heavier than the females with a 12% greater SA. Drug distribution is known to be influenced by body composition & weight, and PAR has been shown to distribute into excess bodyweight over ideal bodyweight by a factor of 0.44 (108). This suggests an incomplete distribution of the non-lipophilic drug into body fat. References report a decline in PAR Vd with age, when a higher proportion of bodyweight comprises of fat, with elderly females having a lower Vd than elderly males (79, 80). Since Cl = (Vd x 0.693)/t1^2 it is possible that a reduction in both Vd & fci/2 cou^^ produce no change in Cl. It therefore seems likely that inequality in weight & body composition between sexes may be an important factor in the explanation of the reduced tjy2 seen in the female group. Furthermore, the amount of UCr excretion was significantly greater in the male group although [UCr] was comparable, emphasizing the difference in body composition (especially muscle mass) between the sexes.Elimination t ^ 2 is influenced by both Cl & Vd, with Vd being related to body weight and composition. Cl, which is independent of Vd is therefore a preferable pharmacokinetic parameter to use when comparisons are being carried out, particularly when weight & SA are not closely matched between groups (9). Sex differences have not been noted by other groups (12,79,80) and since Cl & Cl/kg were not statistically different for males & females, the disparity

158
in would appear to be for the above reasons.Elimination t ^ 2 was correlated with Cl & Cl/kg, and since tjy2 is mathematically related to Cl this correlation is to be expected. However, t^y2 was not correlated with other parameters measured.
5.5.4 Apparent ClearanceIn order to calculate apparent Cl it was assumed that PAR absorption was complete and did not differ between groups. PAR is known to be readily absorbed from the small intestine, and is thought to undergo first-pass metabolism in the liver, with a bioavailability of about 90% for a lg dose (146). From the data collected it could not be shown unequivocally that bioavailability was comparable for all subjects studied and so the apparent (relative) clearance was calculated, using the dose administered rather than that reaching the circulation.From the literature neither age nor renal impairment appears to significantly influence the extent of PAR absorption although the rate may vary (9,12,13,74,212). PAR is absorbed from the small intestine and absorption rate is therefore related to the rate of gastric emptying (64). Absorption is slowed if gastric emptying is delayed by food, posture or certain drugs, and increased by drugs such as metoclopramide, but the total amount absorbed is not affected.In the present study factors known to affect the rate of PAR absorption were standardized in order to maximize absorption without disruption to the volunteers normal routine. All subjects were allowed only a light breakfast at least one hour before the start of the study, and abstained from further food for at least an hour after PAR

159
administration. Tablets were administered either with the patient sitting upright or standing, although posture during the study varied. Only subjects F26 & M35 were taking drugs known to affect gastric emptying (both oral S/R morphine sulphate, appendix F3).
Previous studies have shown PAR Cl, when administered orally or iv, to be reduced in old age, but the magnitude with which Cl has varied with age has been inconclusive (13,74,79,80,81). In the present study mean Ci for the
- 1entire group was 16.3±6.41/h (range 5.3-38.7), and Cl/kg(
0.27-0.101/h/kg (0.12-0.59). These values are similar to those reported in other studies where oral PAR was administered to elderly people. A mean-Cl of 0.25+0.081/h/kg was calculated using data from~28 healthy elderly volunteers with a mean age of 77 years (80). Individual Cl values were highly variable spanning a sevenfold range and Cl/kg an almost fivefold range.
The excretion of PAR conjugates would be expected to be positively linked to the rate of PAR elimination, since PAR glucuronide and sulphate form the majority of metabolised PAR. Cl correlated with CCr & CCr/SA, but not with SCr. Although unchanged PAR is hepatically metabolised, its metabolites are renally excreted. Therefore if Cl is related to conjugate formation, and their rate of excretion is related to renal function, then a correlation between PAR Cl & renal function is likely to result. Since SCr is a less satisfactory measure of renal function than CCr, particularly in cases of muscle wasting, this may explain why SCr does not appear to be correlated with Cl while CCr is. Cl/kg was not correlated with any of the parameters

160
suggesting that the correlations for Cl were at least in part due the way in which weight was related to the other parameters.
5.5.5 Free Paracetamol in UrineBetween 0-10% (31+21mg) of the dose administered appeared in urine as free PAR. This agrees with other reports where it is cited that unchanged PAR forms approximately 2-5% of PAR excreted in the urine (64). Free UPAR was not affected by any other parameter examined. Excretion of free UPAR is via glomerular filtration although subsequent extensive passive tubular reabsorption occurs (212), thought to be primarily dependent on urine flow rate. These results suggest that passive tubular reabsorption is not disproportionately affected by age or mobility.
5.5.6 Paracetamol Glucuronide & Sulphate Excretion in Urine Recovery of total UPAR averaged 715±185mg with PAR glucuronide & sulphate forming between 118-1110mg (681±185; 68%) of the total. As a proportion of all PAR excreted, approximately 55% is in the form of UPARG & 30% as UPARS (214). Results from the present study are within this range.UPARG+S elimination was correlated with mobility score & CCr. Polar conjugates are excreted primarily by active tubular secretion and so it would be expected that their elimination is strongly influenced by CCr as the results show. This agrees with others examining PAR dispositon in patients with renal failure (212). Their study showed that while excretion of free UPAR differed little between normal subjects and patients with renal failure, elimination of PAR conjugates was increasingly impaired with a decline in

161
renal function.CCr is documented as declining in old age (123) and this correlation is seen in this study. This most likely explains the correlation of UPARG+S & age. The correlation of mobility score with CCr may explain the relationship between UPARG+S excretion & mobility score but it is possible that conjugate excretion is affected by mobility.
5.5.7 Total Urinary ParacetamolCorrelations for total UPAR are similar to those for UPARG+S, since total UPAR = free UPAR + UPARG+S. UPAR conjugates form a greater proportion of total UPAR excreted than free UPAR, so the similarity in correlations is to be expected.
5.6 PARACETAMOL KINETICS IN FIT & FRAIL ELDERLY PEOPLE5.6.1 Sex DifferenceFit & frail groups were further divided into male & female groups, and trends seen were similar between them. Therefore, fit & frail groups are of mixed sex except where specific differences were seen - these are discussed under each heading where applicable.
5.6.2 Comparison of AgeResults from 29 fit & 26 frail elderly were used in this study. Fit subjects were on average 6y younger than their frail counterparts (77±8y fit, 84±7y fr.?p<0.01), largely due to the scarcity of frail females below the age of 80y. Fit & frail males were matched with respect to age (p<0.3). 32 subjects were age-sex matched to enable the influence of age on parameters to be excluded. This is discussed in 5.6.9.

162
5.6.3 Mobility ScoresThe two groups differed significantly in their mean mobility scores as would be expected, since the mobility of the subject was taken into consideration when they were categorized as fit or frail. Fit subjects had a mean mobility score of 1.5+0.7 & frail subjects a mean score of 3.7+0.7. There was some overlap between groups with respect to mobility score, with 3 fit and 11 frail people having a score of 3. This is due to the definitions used taking into account not only mobility but also clinical condition of the subject. The remaining fit elderly scored 1 (n=18) or 2 (n=8), and the frail elderly 4 (n=ll) or 5 (n=4).
5.6.4 Comparison of Elimination Half-lifesMean PAR elimination t^/2 was 2.67+0.46h (1.96-3.60) for the fit group compared to 3.38±1.16h (2.20-7.33) for the frail group, and this difference was highly significant (p<0.003). While there was some overlap between groups, a distinct difference could be seen, with a wider variation in t1^2 for the frail group (Fig. 5.4.1).Elimination t^y2 is affected by Vd & Cl, and it is possible that the difference could be explained by changes in Cl or Vd occurring with increasing frailty. Weight & SA were similar between groups suggesting that Vd was also comparable. It is worthy of note that the significant difference in t ^ 2 remained when groups were further divided into females & males or age-sex matched pairs, suggesting that a difference in Vd is unlikely to be responsible for this result.
5.6.5 Comparison of Apparent ClearanceThe true Cl could not be calculated since PAR was given

163
orally necessitating instead the calculation of apparent Cl. While fit & frail groups were matched for weight & SA, a significant difference was observed between mean Cl (p<0•02), with the difference in Cl/kg approaching significance (p<0.06). The frail group showed an overall reduction in Cl & Cl/kg which approximated to 77% & 83% of those of the fit group, although a degree of overlap was seen (Fig. 5.4.2). This suggests that frailty may be an important influence on PAR clearance, but not the sole determinant. On considering the entire group the effect of age could not be excluded, due to an age difference of 6y between groups. For this reason groups were subdivided to give two smaller age-sex matched groups and the results are discussed in 5.6.9.
The influence of diet on conjugation reactions in man has been examined (215). It has been found that PAR Cl undergos a 17% increase following a diet high in cruciferous vegetables for 10 days, with an 8% increase in recovery of PARG in urine 24h post-dose. This may explain the differences observed since individuals in the community may well consume a diet different both in content and calories than those in institutions.
5.6.6 Comparison of Free Paracetamol in Urine The absolute amounts of free UPAR did not differ between fit and frail groups, with the ranges and mean values being comparable (Fig. 5.4.3). No correlations were seen between mobility, age, Cl or CCr and free UPAR and this finding would suggest that frailty does not influence free UPAR excretion either. Unchanged UPAR is eliminated by glomerular filtration with extensive passive reabsorption,

164
and these findings suggest that this method of elimination does not exhibit a reduction in capacity with frailty.
5.6.7 Paracetamol Glucuronide & Sulphate Conjugate in Urine The amount of conjugated PAR excreted was significantly reduced in the frail elderly, with the mean UPARG+S approximating to 80% of that for the fit elderly. Again there was overlap between the ranges for the groups (323- 1109mg fit, 188-896mg fr.) but the frail group occupied a distinctly lower range (Fig. 5.4.5).This implies that either less conjugate was formed, leading to the reduction in Cl & t1y2 observed in the frail group, or else the conjugates were formed at a similar rate but not as efficiently excreted. In the latter case conjugates could accumulate particularly if active tubular excretion was reduced in frailty. This cannot be concluded from this study, since the passage of the conjugates in blood was not followed. CCr was significantly different between groups, with the frail group showing an overall reduction in CCr (p<0.04). This again would suggest that the conjugates could accumulate, particularly if the patient was on longterm, regular therapy.When the sexes are separately considered, CCr is comparable for fit & frail groups, while the amount of PARG+S excreted remained significantly less in the frail groups. This would indicate that less conjugate was formed, rather than it accumulating due to a reduced CCr.
5.6.8 Comparison of Total Paracetamol Excreted in Urine There was a significant difference between the absolute quantities of free plus conjugated UPAR (total UPAR) excreted in the urine, with the frail group excreting on

165
average 80% of that excreted by the fit group (782±184mg fit, 623±148mg fr? p<0.002). This can be explained by observing excretion of free UPAR & UPARG+S. No difference in free UPAR excretion was seen between fit & frail groups, while the elimination of UPARG+S differed significantly.The sum of these components gives total UPAR, and PAR conjugate in urine exceeds that of the free PAR. The contribution of UPARG+S is therefore greater, leading to the observed significance, reduced compared with UPARG+S alone.
The rate of total UPAR excretion from 0-7h & 0-15h postdose was found to be significantly lower for the frail group. From these results it is not possible to determine whether a reduction in the formation of conjugates or their accumulation is responsible for their reduced elimination rate.
It would seem likely, given the differences in t1^2 & Cl between the fit & frail groups, that formation of conjugates is reduced in frailty. From this study it is not possible to determine whether glucuronide or sulphate formation, or both, are reduced. The lower CCr seen in the frail group suggest that PAR conjugates could accumulate in the body, contributing to the reduced recovery in frailty. The result is that PAR is cleared less efficiently in the frail person, with sustained levels of both PAR and its conjugates, although the effects of increased levels of PAR and PAR conjugates are not known.
5.6.9 Comparisons Between Age-Sex Matched Groups.Because the differences observed between fit & frail groups could be exaggerated by the difference in mean ages, a

166
subgroup was formed using an age-sex matching technique. Pairs of individuals of the same sex were formed having a similar age + 1 year. Mobility scores between individuals in a pair were as diverse as possible. 16 age-sex matched pairs resulted who formed fit & frail groups. Differences between these groups were again examined (appendix F18).
Mean elimination t^y2 remained significantly shorter in the fit group despite the reduction in numbers (p<0.03), and the range of values was narrower in the fit group (1.97 - 3.60h) than the frail group (2.20-7.33h). Both Cl & Cl/kg were lower in the frail group but this trend failed to reach significance (p<0.07). Free UPAR excretion was unchanged between groups, but UPARG+S & total UPAR excretion were reduced significantly in the frail group, who also had a significantly lower rate of total UPAR elimination over 0-15h postdose (p<0.03). CCr, SCr, urine volume, UCr, weight & SA were similar between groups.
5.6.10 Relevance of Tobacco and Alcohol Consumption6 fit & 3 frail subjects smoked tobacco, although only one from each group smoked in excess of 10 cigarettes per day. B°th fcl/2 * Cl values for smokers were distributed evenly throughout the ranges, suggesting that smoking was not likely to be responsible for the differences observed although the numbers involved are too small for a definitive statement. Moderate smoking (about 10/day) has been reported as having little effect on PAR metabolism, while heavy smoking (about 40/day) appears to induce conjugation with glucuronic acid, but not sulphates (163).
1 fit & 2 frail subjects admitted to excess consumption of alcohol (>14 units/week F, >21 units/week M). With only 3

167
participants known to drink alcohol in excess the importance of this cannot be determined from this study.
5.7 CONCLUSIONSIn this study lg of PAR was given to 55 elderly people with varying degrees of immobility & frailty. PAR in serum was followed from 3-12h post-dose, and a 24h urine collection was carried out. Various pharmacokinetic parameters were calculated from the serum data, and PAR & PAR conjugate excretion in urine was measured.
Mobility score appeared to be associated with an increase in t1y2 and a reduction in Cl, although these correlations were only of borderline significance. However, an increase in mobility score was strongly correlated with a reduction in excretion of both UPARG+S & total UPAR, while the Elimination of free UPAR did not change significantly. Frailty was consistently associated with an increase in tjy2 and reduction in Cl & Cl/kg? the change in remained significant when individual sexes were considered, while the difference in Cl approached significance. In all cases free UPAR did not appear to be affected by frailty while UPARG+S & total UPAR were significantly reduced.These observations could be the result of a number of differences between fit & frail elderly.
A difference in absorption of PAR seems to be an unlikely explanation for the differences between the fit & frail groups. Authors have found that absorption rate is affected by factors such as age, posture, gastric emptying rate & diet, but there are no reports of an age-related reduction in the extent of drug absorption via passive

168
diffusion (9,12,13,74,212,214). Although increased PAR absorption with frailty could explain the elevated [SPAR] at 3 & 4h, the increased tjy2 & reduced Cl could not be accounted for by a change in absorption since PAR kinetics are independent of dose. Furthermore, the reduced recovery of total UPAR also indicates that increased PAR absorption in the frail group is unlikely.
Dietary intake could differ between those who are frail & institutionalized and those who are fit & self-caring in the community. PAR metabolism is known to be increased in subjects eating a diet high in cruciferous vegetables, when it seems that induction of the glucuronidation pathway by certain indoles occurs (215). Diets consumed by the fit & frail groups were not standardized, but many elderly people, even those who are relatively mobile, often appear to consume a diet lacking in fresh vegetables for economic reasons (49).
Each subject took the PAR tablets in the upright position, either sitting or standing. This was the only attempt made to standardize posture during the study. The frail group were much less mobile than the fit group, and tended to spend longer in bed and more time semi-recumbent or supine. It has been noted that bed rest per se can bring about pronounced changes in distribution, metabolism & excretion of drugs relative to values obtained in ambulatory subjects (209). One study followed serum levels & urinary excretion of i.m. benzylpenicillin in subjects when in bed and subsequently when ambulatory (41). The fraction of the dose excreted unchanged and the renal clearance of the drug were significantly increased, and the first-order rate constant

169
was significantly decreased during bed rest. This was thought to be due to an increased "metabolic rate” in ambulatory subjects or marked plasma circulatory volume differences found in upright and recumbent subjects (208).
It is possible that PAR metabolism may also be influenced by the above factors. However, prolonged bed rest can cause a deterioration in cardiovascular function which is associated with a decrease in plasma volume, and many of the frail subjects had been immobile for some time. It is not possible to say whether a difference in posture could at least in part account for the changes in PAR metabolism seen in frail subjects, but it can certainly not be discounted.
Associated with the differences in posture seen between the two groups of elderly subjects is the obvious variation in physical activity. The fit group were generally more active than the frail group who had a very restricted pattern of activity. Studies have investigated the effect of both acute & chronic exercise on drug disposition. One examined the effect of chronic exercise in a group of young people using each subject as their own control (216). It was found that as fitness improved, as measured by an increase in maximal oxygen uptake, so the hepatic metabolism of model drugs antipyrine & aminopyrine also increased. It is not known whether the enhanced hepatic metabolism was accompanied by changes in other liver enzymes. This result has been reproduced in other studies suggesting that chronic exercise which increases physical fitness is accompanied by accelerated hepatic biotransformation of low clearance drugs.

170
Studies on the effect of chronic exercise on the metabolism of high clearance drugs however, have been inconclusive (216).The effect of acute physical exercise on liver blood flow has been studied using indocyanine green (ICG) which has a high hepatic extraction ratio. ICG t^y2 is prolonged by vigorous physical exercise and the greater the degree of exercise the greater the prolongation in tjy2 (217)- Using this method a 60% reduction in liver blood flow during exercise has been estimated. A second acute exercise study involved the use of propranolol, another high clearance drug (218). During exercise ICG Cl was significantly reduced but propranolol exhibited a reduced tjy2 & AUC.This result was unexpected since the ICG Cl indicated a reduction in liver blood flow, and so a rise in propranolol ti/2 was also anticipated. The explanation offered for this was that the absorption of the drug may have been affected, although other studies have not shown this to be likely. The reduction in liver blood flow seen with vigorous exercise could have resulted in a lower bioavailability of propranolol, explaining the reduced AUC. Exercise could have also increased the Cl of the drug but this seems to be contrary to a reduced liver blood flow.The study concluded that other factors besides exercise may have influenced propranolol Cl on the study day. Low clearance drugs, such as antipyrine, with capacity limited hepatic elimination do not appear to undergo a change in metabolism with acute exercise.
No studies have been carried out on the effect of acute or chronic exercise on the kinetics of PAR, a low clearance drug exhibiting capacity limited metabolism. Studies on

171
the metabolic effects of chronic exercise are more likely to be relevant to this study than those on acute exercise. The frail elderly were not as physically fit or active as their fit counterparts. Since metabolism of other drugs with a low hepatic extraction ratio appears to be stimulated by an increase in physical activity, it is possible that the same could be true for PAR. Although the actual activity of each subject was not studied the mobility scale and the fit & frail definitions included an assessment of each subjects activity. It would seem likely that the increased activity seen in the fit subjects may increase their general "metabolic rate” and stimulate liver blood flow thereby enhancing PAR metabolism.
During hepatic senescence liver histology appears to alter little. There is a rise in the average cell size in people over 60 years and an increase in the number of cells with large nuclei, but the significance of this is not clear (30). It is now well documented that both liver size and blood flow decline with age as discussed in 1.1 (9,21,30, 81,219,220).In the present study age & t1y2 were not correlated while a negative correlation was found between age & Cl, even over the small range of ages studied. When fit & frail groups were compared t^y2 & Cl were significantly different, suggesting that other factors besides age difference were important in the determination of PAR metabolism. When subjects were subdivided to give two age-sex matched groups, the significant difference between remai-nec*while the difference in Cl approached significance.This agrees with another study where PAR Cl was found to be greatest in young people compared with healthy elderly

172
people, with those elderly people who were frail having the lowest PAR Cl (81). When PAR Cl was expressed per unit volume of liver, no difference was found between fit young & elderly people but there was a significant difference between the fit & frail elderly.While we were not able to measure liver volume in the present study, it would seem likely that a similar case would be found if we had. That is, that the reduction in liver volume in old age is partly responsible for the decline in Cl seen for many drugs with increasing age, but an additional factor, such as the general health of the subject, adds an additional decrement to the hepatic clearance of a drug.
It is possible that the frail elderly may have reduced liver perfusion resulting in increased drug bioavailability. Following first-pass metabolism approximately 90% of an oral dose of PAR is found in the circulation. Any changes in bioavailability would have to be extreme before changes were seen in the order of this study, although any changes occurring as a result of frailty may be more important for drugs with a much lower bioavailabi1ity.It is possible that the enzyme systems responsible for conjugation reactions have a lower activity or affinity for substrate, to explain the results observed. A reduction in conjugation would produce sustained [SPAR] levels and less conjugate excretion into urine, as this study found. From the literature it would appear that enzyme systems may be variably affected by age & frailty. Frailty rather than age has been shown to influence plasma levels of the enzyme aspirin esterase, found to be significantly lower in a
173
group of frail hospitalized elderly patients compared with healthy elderly & young volunteers (221). Conversely an in vitro study failed to detect an age associated decline in microsomal mono-oxygenase activity or affinity in man (222). The effect of frailty on this system was not been determined in vitro.Acetanilide Cl has been found to be similar in fit & frail elderly but significantly lower than in young subjects. However, when Cl was expressed per unit volume of liver no difference in Cl was found, suggesting that a decline in liver size was responsible for the reduced Cl seen in old age (220).
The present study only compared PAR Cl in fit & frail elderly people and so a definitive statement on the importance of age cannot be made. It would appear that frailty does have an effect on PAR metabolism, and it is possible that liver volume and/or blood flow could be reduced in the frail elderly compared to their fit counterparts.Glucuronide & sulphate conjugates were not assayed separately in urine or in serum and so the influence of frailty upon conjugate formation cannot be commented on. Frail subjects excreted significantly less UPARG+S & total UPAR, suggesting that their formation may be impaired. It is possible that the reduction in CCr seen in the entire group when comparing fit & frail subjects was responsible for this. When CCr was comparable, for single sex & age- sex matched groups, the increase in and reduction inCl remained. As previously discussed, patients with renal impairment have been found to excrete less PAR conjugate although it appears to be formed at a similar rate than

174
those with normal kidney function, leading to accumulation of conjugate in the body (212). In a study where PAR conjugates were quantified, glucuronide, but not sulphate conjugate formation was impaired in frail subjects compared to fit subjects of a similar age (81). This could offer an explanation to the results observed in the present study, since a sustained [SPAR], increased t^y2, reduced clearance and recovery of UPARG+S would fit with this hypothesis.
In summary, PAR elimination t^y2 was increased and apparent clearance reduced in subjects who were frail & immobile compared with their fit, mobile counterparts of similar age. Various hypotheses could explain these findings.It is possible that PAR absorption was altered in the frail group but from the literature this seems unlikely.Diet may have varied between fit & frail groups, and it is known that certain foods, and chemicals contained in them, can induce metabolic pathways. A diet containing more fresh vegetables consumed by the fit group could explain the findings.A difference in activity & posture between the two populations could also afford an explanation, with differences in plasma & circulatory volumes, and changes in liver perfusion, causing the inequality in PAR metabolism observed.Liver size & blood flow are known to be reduced in old age, and they may be reduced further in frailty. Any reduction in liver volume could reduce the metabolism of a hepatically cleared drug with a low extraction ratio. Enzymes responsible for conjugation reactions in the liver could have a reduced activity or affinity in frailty explaining both the reduction in elimination and the lower

175
recovery of PAR conjugates in urine.Although none of these explanations can be proven from the present study, it is highly probable that more than one factor is important. Changes in activity & posture may well be important, perhaps in some way influencing the activity of the conjugating enzymes, which appear to reduce PAR conjugation reactions.The effect of sustained PAR levels in the body is not known, nor the accumulation of PAR conjugates which is likely to occur when renal function is reduced. However, it would seem reasonable that PAR is prescribed with caution in the very old, frail elderly person.Further work needs to be carried out to determine whether a similar effect is seen for other drugs eliminated by conjugation reactions.
176
CHAPTER SIX DIGOXIN EXCRETION IN ELDERLY PEOPLE
6.1 INTRODUCTIONDigoxin has been used in therapeutics for over two hundred years but its use is still associated with increased mortality & morbidity. Digoxin has a narrow therapeutic index (0.8-2.0ng/ml) and it is desirable to know which factors most influence the rate of elimination in order to prevent toxicity. For this reason digoxin (DIG) disposition has been extensively researched, with studies using both healthy volunteers & patients. While many studies have used elderly subjects, none have compared DIG excretion in those with varying degrees of immobility & ill health.In this study DIG excretion was investigated in elderly people who were either "fit” (mobile, controlled chronic illness, living independently) or "frail" (immobile, poorly controlled chronic illnesses, loss of independence) in an attempt to determine whether frailty & immobility affected the efficiency of DIG elimination.
6.2 PROCEDUREFit & frail elderly people aged over 64y were invited to take part in the study. All were chronically ill, mostly with AF or CCF, and had been regularly taking the same dose of DIG for a minimum of 3 weeks. Exclusion criteria are given in 2.2. Each subject was given an information sheet (appendix El, standard or enlarged type) and had the opportunity to question myself or Dr L Parker (GP trainee) about the study prior to its commencement.On the morning of the study subjects emptied their bladder

177
and took their usual DIG tablet with a glass of water, in the upright position. DIG dose varied according to individual prescriptions which were not altered for the study. All tablets were manufactured by Wellcome (Lanoxin), but were from different batches as dispensed by the patients' own Pharmacist. Tablets were generally taken after a light breakfast of toast or cereal, with food and drink being freely taken thereafter.
During the study subjects were questioned about their day- to-day activity & mobility, categorized as fit or frail and had their mobility scored according to the mobility rating used in the study (appendix Al, A2). The form given in appendix E2 was completed during the study when subjects were weighed & measured and had their co-medication noted. Demographic details & drugs are given in appendix E3.
The ideal sampling time for DIG has been calculated to be llh post-dose, when [SDIG] best estimates DIG concentration at "steady-state” (114). 5-10ml of blood was thereforetaken at 11 & 24h and urine collected for 24h after dosing. DIG was assayed in serum at llh & all urine samples, UCr in all urine samples, SCr in serum at 24h. Urine collected over 24h was assayed in 3 aliquots each as near to 8h as possible, the final aliquot spanning the hours spent in bed overnight. Analytical methods are given in chapter 2.About 5 days later a second blood sample was taken llh post-dosing. [SDIG] on the two occasions were compared to ensure that subjects were in steady state ([SDIG] samples did not differ by > 15%), and the mean value used in subsequent calculations.

178
Total body clearance & renal clearance were calculated and2expressed per kg bodyweight & 1.73m SA as below:-
Total body clearance = dose x fraction absorbedClt (ml/min) [SDIG] x dosing intervalwhere fraction absorbed was 67%
Renal clearance = DIG recovered in urine/24hClr (ml/min) [SDIG]
Non-renal clearance = Clt - ClrClnr (ml/min)
UCr, SCr & CCr were also determined for each subject.
ComplianceOn initiation of therapy, steady state is only reached when 5 half-lives have elapsed, that is for DIG about 8 days inhealthy subjects, if a set dosage is administered each day.If a loading dose is given, steady state is reached sooner (44). The therapeutic range is only valid if steady state has been reached and sampling is at least 6h post-dose when absorption & distribution are complete (114). If compliance is poor the relationship between dose, [SDIG] & therapeutic range does not hold, and a low [SDIG] could be indicative of underdigitalisation or failure to comply. All participants when asked "how frequently do you take your heart tablet?”, gave the reply "every day”, but compliance of all subjects could not be assumed. This is a continual problem when steady state kinetics are investigated, particularly when ambulant subjects are used who take medications unsupervised.
49 subjects (26F) successfully completed the study of whom 25 were frail. Results were considered statistically for the entire group (F + M) and for separate sexes.

179
Correlations were determined using Spearmans Correlation Coefficient and significance levels taken to occur when p<0.01. Fit & frail groups, and males & females, were compared using the Mann-Whitney U test with significance taken to occur at p<0.05.
6.3 RESULTS OF PHARMACOKINETIC PARAMETERS6.3.1 Female Subjects Taking DigoxinResults from individuals are given in Appendices E4 & E5, with results & correlations from the female group summarized in appendices E6 & E7.Age ranged from 73-96y (82±6y? mean±s.d.) and correlated with no other parameter studied. Mobility score ranged from 1-5 (2.8+1.4), correlating with Clt & Clt/kg (p<0.01). DIG dose was 0.0625, 0.125 or 0.25mg daily (0.135±0.07) and correlated with [SDIG] (p<0.01) & UDIG (p<0.001).Urine volume/24h varied from 490-2059ml (1133±461), while DIG in urine in 24h, UDIG, varied from 19.4-165.9ug (57+33) correlating with only with DIG dose (p<0.001). Percent dose recovered in urine in 24h, %Du, varied from 19.0-82.8% (45+19) correlating with Clr, Clr/kg, Clnr & Clnr/kg.Serum DIG concentration [SDIG], ranged from 0.14-3.OOng/ml (0.91+0.72) and correlated with dose (p<0.01); Clt, Clt/kg, Clr & Clr/kg (p<0.001).Total body clearance Clt, varied from 19-224ml/min (95±54) for females, & Clt/kg from 0.40-4.47ml/min/kg and both correlated with MSc, SCr & CCr (p<0.01)? [SDIG], Clr,Clr/kg & Clnr (p<0.001).Renal clearance Clr, varied from 10-171ml/min (66±47) and Clr/kg from 0.18-3.30ml/min/kg (1.23+0.88). Both correlated with SCr, CCr & %Du (p<0.01); [SDIG], Clt & SCr.

180
SCr ranged from 0.34-2.69mg/dl (1.09+0.66) correlating with CCr, Clt, Clt/kg, Clr & Clr/kg (p<0.01). CCr varied from 9-141ml/min (63±32), and CCr/SA from ll-167ml/min/l.73m2 (70+38). CCr correlated with SCr, Clt, Clt/kg & Clr/kg (p<0.01) & Clr (p<0.001).Weight varied from 35-76kg (53.9+10.1) and did not correlate with any parameter measured.
6.3.2 Male Subjects Taking Digoxin23 subjects studied were male and results & correlations from this group given in appendices E8 & E9. Males were less old than females - male age varied from 66-89y (78+6) while mobility score varied from 1-4. Age correlated with dose & UDIG (p<0.01). Mobility score correlated with CCr (p<0.01). Correlations of age v Clt & Clr seen in the female tended towards significance for the males.DIG dose was 0.0625, 0.125 or 0.25mg daily (0.152±0.07) and correlated with UDIG (p<0.001) as for the females, in addition with age & Clt. Urine volume/24h was greater for males than females, varying from 492-3742ml (1603±784).UDIG & [UDIG] were similar for both sexes, UDIG varying from 23-164ug (69+34) and correlating with dose and also age, CCr & Clr. %Du was also comparable, ranging from 25.0-84.9% (47.7+16.4) for males correlating with Clnr & Clnr/kg (p<0.001).[SDIG] ranged from 0.26-1.70ng/ml (0.65+0.36), correlating with Clt/kg & Clr/kg (p<0.01) as for the females.Clt ranged from 34-264ml/min (128±69) & Clt/kg from 0.55- 3.46ml/min/kg (1.58+0.9), correlating with dose, CCr, [SDIG], Clnr & Clnr/kg (p<0.01); Clr & Clr/kg (p<0.001). These relationships are similar to those seen for the female group.

181
Clr varied from 27-194ml/min (85+45) and Clr/kg from 0.42- 2.28ml/min/kg (1.17+0.55), correlating with UDIG & [SDIG] (p<0.01); CCr, Clt & Clt/kg (p<0.001), in a pattern similar to that for the females.SCr ranged from 0.55-2.37mg/dl (1.13+0.42) and correlated with no other parameter. CCr ranged from 29-193ml/min (82+ 33) and CCr/SA from 37-164ml/min/l.73m2, correlating with MSc, UDIG & Clt (p<0.01) and Clr (p<0.001).Weight varied from 41-96kg (71.6±12.4) for the male group.
6.3.3 Comparison of Female & Male ResultsResults from female & male groups were compared using theMann-Whitney Test and results are given in appendix E10.Males were younger than females (78+6y M, 82+6y F) and thisdifference approached significance, but the groups hadsimilar mobility scores. DIG dose prescribed was similarfor male & female groups, with UDIG, %Du & [SDIG] beingcomparable between groups, although urine volume wasgreater in the male group (1603±784 M, 1133+461 F?p<0.02).UCr excretion was also significantly greater for the malegroup (1273±484mg M, 816±475mg F;p<0.001), with thedifference in [UCr] tending towards significance betweengroups. SCr was similar between groups (1.13+0.42 M, 1.09±0.66 F) but CCr was greater for the males (82+33 M, 63+32 Fp<0.03) while CCr/SA was not significantly different.Clt, Clr & Clnr were not significantly different between
2sexes even when expressed per kg or 1.73m SA.These results suggest that the male & female groups studied did not differ in their ability to eliminate DIG. Results were therefore combined and correlations re-examined, with results given in appendices Ell & E12. A similar pattern of correlations were seen when the results were combined

182
and these will subsequently be discussed.
6.4 COMPARISON OF PARAMETERS FOR FIT V FRAIL GROUPS6.4.1 All SubjectsSubjects were divided into fit or frail groups according to definitions given in appendix A1 and compared, with results given for the entire group in appendix E13, and Figs. 6.4.1 to 6.4.8.Of the 49 subjects participating in the study, 25 were frail. Fit & frail groups were matched for age & DIG dose, but were significantly different in terms of mobility score. The fit passed a significantly greater urine volume than the frail group (1517±520 fit, 1216±780 fr.?p<0.01), and also weighed significantly more (p<0.05), with a greater SA (p<0.05).DIG dose & [SDIG] were not significantly different between groups although the frail group exhibited a greater mean SDIG level and levels also tended to be higher when those taking similar dosages were compared (Figs. 6.4.1-6.4.3). UDIG, [UDIG] and %Du were not significantly different between fit & frail groups (%Du: 46+6 fit, 47+19 fr).Total clearance was significantly greater for the fit group (133+67 fit, 89+52 fr.;p<0.02) and this difference remained when Clt was expressed per kg bodyweight or normalized to 1.73m2 SA.Renal clearance also tended to be greater in the fit group (86+43 fit, 65+48 fr.?p<0.06) but this trend became less distinct for Clr/kg (p<0.2) & Clr/SA (p<0.2), although minimum, maximum, Q1 & Q3, median & mean values remained consistently lower in the frail group.Clnr was not significantly different between groups.

183
UCr was significantly greater in the fit group (1170+371 fit, 915+625 fr.;p<0.02) but [UCr] was not. SCr did not differ significantly between groups but frail subjects showed a greater range (0.55+1.66mg/dl fit, 0.34+2.69mg/dl fr). CCr & CCr/SA were both significantly greater for the fit group (CCr/SA: 83±24 fit, 63+37 fr.?p<0.002).
6.4.2 Female Subjects26 female subjects participated in the study and 14 were frail. Results from this group are shown in appendix E14. Fit & frail groups of female subjects were matched for age (81+5y fit, 83±7y fr) but fit subjects were significantly more mobile (p<0.001).Urine volume was significantly greater for the fit group (1488+423ml fit, 833±210ml fr.;p<0.001) while groups were similar for weight & SA (p<0.2).DIG dose was similar between groups but the mean [SDIG] tended to be greater in the frail group (0.63+0.48 fit,1.15±0.81 fr).Neither UDIG or %Du were significantly different between groups but [UDIG] was statistically greater (p<0.04) for frail subjects due to the reduced volume of urine passed. Clt was significantly greater for the fit group (112±43 fit 80+59 fr.;p<0.04), with the difference tending towards significance for Clt/SA (p<0.06), but being lost for Clt/kg. For both Clt, Clt/SA & Clt/kg, Ql, Q3, median & mean were greater for the fit than frail group.No statistical difference was seen between Clr, Clr/kg & Clr/SA for the fit & frail female groups, but in all cases the fit tended to have greater values than the frail group, for minimum, maximum, Ql, Q3, median and mean.Clnr was similar between groups.

184
UCr was significantly greater in the fit group (939+314 fit 712+569 fr.?p<0.04), but [UCr] was not, SCr exhibited a greater variability in the frail group, while both CCr & CCr/SA were significantly greater for the fit group (CCr: 73+16 ml/min fit, 54+40ml/min fr.?p<0.02).
6.4.3 Male SubjectsOf the 23 male subjects in the study, 11 were frail.Results from fit & frail male groups are shown in appendix El5. Groups were matched for age (77±7y fit, 79+6y fr) but fit subjects were significantly more mobile (p<0.001).Fit & frail groups passed similar urine volumes although the fit group tended to weigh more and have a greater SA. There was no statistical difference between DIG dose or [SDIG] for fit & frail groups - %Du, UDIG & [UDIG] were also similar.Clt, Clt/kg & Clt/SA were not statistically different between groups of subjects, but again fit subjects had greater values of minimum, maximum, Ql & Q3, median & mean. There was no significant difference between Clr, Clr/kg & Clr/SA for the groups, but again Ql, Q3, median & mean tended to be greater in the fit group.Median & mean Clnr & Clnr/kg were greater in the fit group but this was not significant.UCr & [UCr] tended to be greater in the fit group. Although the range for SCr was wider in the frail group there was no significant difference between fit & frail groups. Both CCr & CCr/SA were statistically greater for the fit males (CCr: 96±34ml/min fit, 66+26ml/min fr.;p<0.025).

[SDIGJ (ng/al)
Fig. 6.4.2 Distribution of [SDIG] Levels in Fit 6 Frail Elderly People Taking 125ecg DIGOXIN Daily
Fig. 6. l.l Distribution of (SDIG1 Levels in Fit 6 Frail Elderly People Taking 62.5ecg DIGOXIN Daily
O3W•1-•
▲ •kk
FRAIL 0 FIT
Fig. 6.4.3 Distribution of [SDIG1 Levels in Fit 6 Frail Elderly People Taking 250acg DIGOXIN Daily
0J
• = fit subject 4 = frail subject
185

Fig. 6.4.4 Distribution of %Du in Fit & Frail Elderly People Talcing DIGOXIN
80-
70-
60-
50-
i 40- *30-
20-
10-
Fig. 6.4.5 Distribution of Clt/SA in Fit & FrailElderly People Talcing DIGOXIN
300-1-
200- -
100- -
FIT FRAIL
Fig. 6.4.6 Distribution of Clr/SA in Fit & Frail Elderly People Taking DIGOXIN
FI T F R A I L
200-
100
FIT FRAIL
fit subject frail subject -median 186

Fig. 6.4.7 Distribution of Clnr/kg in Fit & FrailElderly People Taking DIGOXIN
• = fit subject A= frail subject median
FIT FRAIL
CCr/SA
(ml/
min/
I.73
m‘
Fig. 6.4.8 Distribution of CCr/SA in Fit & FrailElderly People Taking DIGOXIN
160 -
140-
120
100
80 -
60
FIT F R A I L
■ = fit subject a = frail subject median

188
6.5 DISCUSSION6.5.1 Digoxin Dose and UsageDIG elimination was followed in a heterogeneous group of elderly people prescribed DIG chronically for a variety of cardiovascular conditions, and the influence of fitness and mobility on DIG excretion was investigated.24 fit & 25 frail elderly people aged 66-96y completed the study. From the medical notes 33 subjects (67%) had been prescribed DIG for AF with or without CCF or LVF, and of those 30 were in AF during the study. Of the remainder, 5 (10%) were taking DIG for CCF or LVF alone, 5 (10%) for other cardiac conditions and 6 (12%) for no obvious reason. Clinicians agree that a fast ventricular rate in the presence of an irregular supraventricular tachyarrhythmia is a definite indication for DIG therapy. However, the role of DIG in the treatment of CCF alone remains controversial, and DIG is now rarely the treatment of choice for this condition (42,85,88,233). If both AF & CCF are justifiable indications for DIG therapy 22% of patients studied were probably prescribed DIG unnecessarily.Reports on drug usage have freguently shown DIG therapy to be questionable, particularly in the elderly, but the incidence of inappropriate prescribing in this study compares favourably with others. One study in 1977 showed 24 patients registered with a General Practice to be taking DIG, 18 of whom were in sinus rhythm (84). Another study reviewed medical records of 150 outpatients prescribed DIG and found 42% taking DIG for a questionable reason (224). Prevalence of DIG prescribing in 5 Irish nursing homes was found to be 21%, with the prescription inappropriate in 48% of patients (225). Prevalence of DIG prescribing in English

189
nursing homes was found to be 11.5% (226). Another recent report from Canada found that 14% of nursing home residents took DIG, with the prescription seeming inappropriate in 70% of cases (227). Conversely, another study found DIG therapy to be questionable in only 4 out of 77 elderly patients (228). These subjects had recently been discharged from hospital after acute admission and this may explain the low incidence of unnecessary DIG.Most of the above studies subsequently withdrew DIG where the drug seemed inappropriate, and few patients suffered a deterioration in health necessitating restitution of DIG therapy (84,98,225,227,228,229).
In this study subjects were taking DIG at a daily dose of 0.0625mg (n=12), 0.125mg (n=24) or 0.25mg (n=13? 0.78-5.81 ug/kg/day). No subject was taking alternate day therapy, or a combination of tablet strengths. Dosages are lower than those recommended by the manufacturer (0.25-0.5mg/day for normal CCr, 0.125-0.25mg daily in the elderly? 46) or British National Formulary (0.125mg daily in the elderly; 45). Others recommend a dosage of 2-5ug/kg/day depending on renal function (44) or 1.6ug/kg daily for those with end-stage renal failure (103).DIG dosage has steadily declined in recent years as reports have suggested an increase in mortality & morbidity associated with its use (230). A dose of 0.0625mg daily has become a popular "geriatric dose” because of these fears and increasing awareness that DIG clearance is reduced in old age (91). While toxicity is unlikely from a daily dose of 0.0625mg, a large proportion of patients are under- digitalised as a result, and this dose is only appropriate in those with severe renal impairment or much reduced

190
bodyweight. The use of inadequate doses are of little therapeutic consequence in patients with sinus rhythm, when the prescription is often unnecessary. However, in renal failure & hypokalaemia patients may be exposed to toxicity. In patients with AF the apparent widespread use of inadequate doses may be cause for concern (225).
6.5.2 Serum Digoxin Levels[SDIG] levels obtained for each DIG dose are shown below:-
DIG dose (mg) n [SDIG] (ng/ml)0.0625 12 0.14 - 1.380.125 24 0.28 - 3.000.250 13 0.44 - 2.50
No statistical difference was seen between sexes.The therapeutic range for DIG is 0.80-2.OOng/ml, although many clinicians aim to maintain [SDIG] between 1.0-1.5ng/ml (44,98). While the preferred range is unaltered in old age (90) & renal failure (103,231), control of supraventricular dysrhythmias may require a [SDIG] level of up to 3ng/ml, when the therapeutic benefit from control of heart rate offsets the increased probability of side effects.From [SDIG] alone, subjects found to be subtherapeutic, therapeutic or toxic in this study are given below:-
DIG dose/mg 0.0625 0.125 0.250 Total
subtherapeutic1015631(63%)
therapeutic286
16(33%)
toxic0112(4%)
From clinical observations of heart rate and appearance of side effects, 5 subjects appeared to be subtherapeutic
191
(F01, M25,F33,F44,F52) and 1 toxic (F37) with AF. The prescription of DIG was also questionable in some cases, particularly in the absence of AF when [SDIG] was subtherapeutic. In such cases DIG can often be withdrawn (84,98,225,228,229). Signs & symptoms of toxicity are dose related (94), with [SDIG] above 3ng/ml, or a daily maintenance dose in excess of 0.7mg or 6ug/kg, invariably associated with side effects (89). However, studies have shown there to be considerable overlap in the [SDIG] at which toxicity occurs when [SDIG] may be as low as lng/ml (85,103,228).Although [SDIG] is generally thought to be a useful diagnostic aid where over or under-digitalisation are suspected, some groups have proposed that knowledge of [SDIG] adds little to the clinical picture when the physician already has information on DIG dose, renal function, serum K+ & cardiac status (232,233). Evaluation of the use and outcome of [SDIG] assays have also shown that few are carried out in appropriate circumstances (86). [SDIG] can only be interpreted in the clinical context since numerous other factors need to be taken into account including thyroid & renal function & electrolyte balance (85,86,89,233,234).These results suggest that a dose of 0.0625mg daily is unlikely to produce [SDIG] levels within the therapeutic range except in severe renal impairment; those with AF and subtherapeutic levels (n=22) may have benefitted from an increased dose and those without AF whose [SDIG] was below 0.8ng/ml (n=9) could probably have been withdrawn from DIG. Other studies have also drawn similar conclusions where a substantial proportion of underdigitalisation has been

192
found following a daily dose of 0.0625mg (225,235,236). A daily dose of 0.125mg is more appropriate in the elderly and carries only a small risk of toxicity but O.lmg tablets would be a useful alternative. The recommendation of 0.25mg daily in the elderly with CCr greater than 25ml/min (102,237) may be too high for those with a low bodyweight.
Toxicity is more likely to occur at a lower [SDIG] in patients with hypothyroidism, hypokalaemia, hyperkalaemia or other electrolyte disturbances, where the myocardium is sensitized to DIG (89,92,98). Hypothyroidism renders patients more sensitive to DIG and side effects may occur within the therapeutic range (238,239). Conversely, hyperthyroidism is associated with DIG resistance where larger than usual doses are required to control supraventricular dysrhythmias and an increased GFR associated with this condition enhances renal clearance (237). The maintenance dose of DIG should always be reviewed when the thyroid dysfunction is brought under control.In this study subjects with thyroid disorders were receiving treatment to render them euthyroid, but possible over or under treatment of the thyroid disorder could affect their DIG sensitivity. 4 subjects were hypothyroid (F04,F17,F21,F46), 2 were previously hyperthyroid (F33,M23) No hypothyroid subjects exhibited any signs of toxicity, but F33 appeared to be clinically subtherapeutic when taking 0.125mg DIG daily, giving [SDIG] of 1.03ng/ml but a pulse rate of 102bpm.Both low (<3.5mmol/l) and elevated (>5mmol/l) serum potassium levels are associated with the appearance of DIG toxicity when [SDIG] is within the therapeutic range (89). Hypokalaemia can arise from diuretic therapy which is often

193
used in combination with DIG for the treatment of CCF.Other causes of low serum K+ include poor nutrition, diarrhoea & vomiting and chronic wasting disease. In cases of suspected toxicity both serum K+ & [SDIG] should be measured. No subject in the community had had a recent K+ measurement despite 34 regularly taking a diuretic, whereas 1 patient in hospital (F17) had had K+ measured & 2 patients had [SDIG] levels taken during their admission. Despite the recommendation that [SDIG] can only be interpreted in the clinical context, this appears to be rarely the case.
For a given dose [SDIG] was found to be highly variable, exhibiting an eleven-fold range for those taking 0.125mg daily. [SDIG] is influenced by dose, and for an individual an increase in dose is accompanied by a proportional increase in [SDIG], since DIG pharmacokinetics are independent of dose after single doses & at steady state (92,240,241). However, for any DIG dose a considerable interindividual variation in [SDIG] is seen, even within a group of patients with comparable CCr (242).In this study [SDIG] correlated with dose, Clt & Clr for females; Clt & Clr for males? dose, UDIG, Clt & Clr for the entire group. In all cases [SDIG] & CCr appeared to be correlated with a significance level of p<0.05. These correlations are in agreement with those reported by other groups (236,240). Some have subsequently attempted to devise a nomogram or equation to enable [SDIG] to be predicted for given dose & renal function (103,243,244,245) while others have constructed a scoring system to aid selection of an appropriate DIG dose (246). Investigations have shown that while dose & CCr are the most important

194
determinants of [SDIG], plots of measured v predicted [SDIG] consistently yield a degree of unexplained variance, suggesting that other factors need to be taken into account (89,91,92,103,236,240,242). Incorporation of additional parameters such as age, sex, lean body mass & [albumin] into equations has not been shown to significantly increase the accuracy of prediction with the degree of scatter remaining clinically unacceptable (105,113,184,235,245,247, 248); in one instance calculated [SDIG] level overestimated actual measured level in 33% of patients studied (242). Substantial interindividual variation in [SDIG] may be due to differences in one or more of the following aspects of DIG disposition: absorption, distribution, protein binding, drug interactions, diagnoses, metabolism, elimination or compliance. The way in which these factors can alter DIG disposition in old age & ill health are discussed in 1.4.3.
6.5.3 Total Body Clearance of DigoxinTotal body clearance was calculated from [SDIG] & fraction of dose absorbed (67%) and found to range from 19-224ml/min (95±54) for females, 34-264ml/min (128+69) for males. Many other studies have calculated DIG elimination half-life or [SDIG], but where Clt has been determined results are similar to those in the present study. One study (91) found mean Clt to be 37±6ml/min for elderly subjects (age 81±2y) and 106+14ml/min for younger subjects (47±5y). Another calculated Clt to be 109+17ml/rain for a group of elderly males (78+2y), assuming 95% absorption (242).No statistical difference was seen for Clt, Clt/kg & Clt/SA between females & males, suggesting that DIG excretion is similar in both sexes. This has also been concluded in other studies (184,247), although the prediction of [SDIG]

195
has been found to be more accurate for females (228,244).
In order to calculate Clt it was assumed that all subjects absorbed an equal fraction of the DIG dose administered, but this cannot be proven from data in this study. For a drug in steady state, the extent, but not the rate, of absorption is important in determining the concentration of drug in the blood at all times (44). While age per se has not been shown to affect the extent of drug absorption (including DIG) via simple diffusion, certain disease states have (9,12,13,91,235). Therefore, the data is interpreted with caution.
Clt correlated with mobility score, SCr, CCr, [SDIG], Clr & Clnr for females; CCr, dose, [SDIG], Clr & Clnr for males; age, mobility score, SCr, CCr, [SDIG], Clr & Clnr for the entire group. Previous studies have shown DIG Clt to be reduced in old age (91), as seen in the present study for the entire group despite the relatively narrow age range examined (66-96y). Age is associated with a decline in CCr and this was seen in the present study. While a definitive statement cannot be made on the relative importance of age & CCr in Clt determination, it would seem that CCr is the more important when correlation coefficients are observed. Females: age v CCr r=-0.375; age v Clt r=-0.426; CCr v Clt r=0.659. Males: age v CCr r=-0.504; age v Clt r=-0.453;CCr v Clt r=0.573.An increase in mobility score was significantly correlated with a decrease in Clt for the females & entire group, tending towards significance for the males. In this study mobility score was evenly distributed throughout the age range so that no correlation was seen between these two

196
parameters. However, a correlation was seen between mobility score & CCr, known to strongly influence Clt, and it is again difficult to separate out the importance of these two factors.The effect of chronic exercise on DIG kinetics has not been investigated since it would involve chronic dosing to healthy subjects. However, the effect of acute exercise on DIG distribution has been examined in two studies. One study measured [DIG] in thigh muscle & serum following two weeks of dosing with DIG, before & after one hours exercise (249). Increased binding of DIG to muscle was seen immediately following exercise accompanied by a reductionin [SDIG]? 30 minutes later [SDIG] had increased, but notto pre-exercise levels. The ratio [muscle DIG]/[serum DIG] was greater after exercise suggesting that mobilization of DIG from other tissue compartments was responsible for the increased [DIG] in muscle observed after exercise. The second study however, failed to show a change in [SDIG]following a period of maximal exercise (250).Changes in posture & physical activity have marked effects on cardiac output & plasma volume and cause alterations in the concentration of nonfilterable constituents, although the extent to which these changes influence drug disposition has been given little attention (171,251). One study compared [SDIG] in 8 healthy volunteers after 2h of normal physical exercise with that after 2h of recumbency (171). Rest in the supine position was associated with a relative increase in [SDIG] of 63% although interindividual variation was considerable (28-91%) while urinary excretion of DIG remained unchanged. The combined effect of these observations was a decline in Clr although CCr remained

197
unchanged. Recumbency has been shown to produce 7-8% increase in plasma volume which cannot account for the increase in [SDIG]. A reduced Clr could be the result of a lowered tubular secretion associated with a decline in renal blood flow at rest. Alternatively, changes in DIG binding to muscle could be responsible for the increased [SDIG] since muscle binds about 60% of the body store of DIG, any change in binding can have a profound effect on [SDIG].A second study investigated the effect of rest in the supine position on [SDIG] in outpatients taking DIG chronically (252). Rest was associated with a rise in [SDIG] which appeared to reach "steady state” after 2h. [SDIG] increased by a mean of 28% although again the interindividual variation was great (0-75%). This suggests that everyday physical activity may affect [SDIG], but in an unpredictable and variable fashion.In the present study all subjects took DIG in the morning, and [SDIG] was measured llh post-dose after a full day of activity or inactivity. It is possible that the level of activity, as rated using the mobility score, and posture, may have influenced [SDIG]. If DIG binding to skeletal muscle is greatest in those who were most active (lowest mobility score) this would have the effect of reducing [SDIG] & increasing Clt, as seen in the present study. Stimulation of renal blood flow by physical activity could also enhance Clr.It is possible that mobility alone can influence Clt, although to what extent cannot be determined. When subjects were ranked in order of decreasing CCr a trend was seen towards a reduction in Clt. However, one subject with a

198
2CCr of 34ml/min/l.73m had a Clt of 1 -97ml/mm/kg, while2another with a CCr of 97ml/mm/l.73m had a Clt of
1.28ml/min/kg. It is apparent that while there is astatistically strong correlation between CCr & Clt, other factors besides CCr are important.Other studies which have investigated the effect of CCr on Clt using patients with renal failure have also found adegree of unexplained variance (105). Mobility may be anadditional factor in the determination of DIG Clt, but it seems likely that any influence is small.The variation in Clt may alternatively be explained by an unequal extent of absorption occurring between subjects.The effects of disease states & drug interactions on DIG absorption have been discussed in 1.4.3. At steady state the amount of drug absorbed is equal to that excreted.In this study the percentage of dose excreted unchanged in urine was variable, ranging from 19-83% (45+19) for females & 25-85% (48+16) for males? 8 subjects had more than 67% unchanged DIG in urine. Possible reasons for this could include increased absorption, differences in compliance or lack of specificity of the assay. Extent of DIG absorption has been reported to vary between subjects but most studies were carried out before the standardization of DIG tablets, when variation in bioavailability was partly due to differences in dissolution rate. Comparative studies using i.v. and oral formulations would be needed to determine whether absorption in elderly people was constant. It remains possible that the extent of absorption may have varied among the population studied, although it is not possible to say by how much. A low %Du may be indicative of more extensive metabolism and non-renal elimination.

199
6.5.4 Renal Clearance of DigoxinRenal clearance was calculated from [SDIG] & DIG excretedunchanged in urine in 24h and varied from 10-171ml/min (66+47) for females, 27-194 ml/min (85+45) for males. The ratioof renal clearance of DIG/renal clearance of creatinine,Clr/CCr, varied from 0.3 3-2.46 (1.09+0.56) for females,0.55-1.79 (1.03+0.34) for males. In another study, mean Clr
2 .was found to range from 83-119ml/min/l.73m m healthy2 . volunteers & 53-73ml/mm/l.73m in elderly patients with
heart failure? chronic renal failure was also seen to beassociated with a reduced Clr (92). A second study foundClr to vary from 4-57ml/min, with a mean Clr/CCr of 1.04,in a group of elderly people aged between 65-94y (237).
In many subjects renal excretion of unchanged DIG is the most important route of elimination. Nomograms & equations for [SDIG] prediction usually include information on CCr since most of that DIG renally excreted is via glomerular filtration of which CCr is an estimate (chapter 2). Using data from the present study, a plot of CCr v [SDIG] for each DIG dose gave a straight line for the majority of subjects, and a high CCr was associated with a low [SDIG]. However, a small but significant proportion of subjects fell outside this relationship, usually with a greater than expected [SDIG] given their CCr. This considerable scatter has been noted in other studies (253), causing difficulties with prediction of [SDIG] as previously discussed. When DIG half-life is plotted against CCr a similar variation has been seen (92,93).These results suggest that clearance of DIG & creatinine are related and may possibly be excreted via a common pathway. However, the wide range in Clr/CCr seen in this

200
study suggests that this relationship does not hold for all subjects. Clr was found to correlate with SCr, CCr, %Du, [SDIG] & Clt for females; CCr, UDIG & Clt for males? age, mobility score, SCr, CCr, %Du, UDIG, SDIG & Clt for the entire group.Previous studies have also shown Clr to be reduced in old age (91,237) probably due to the inevitable decline in CCr seen with advancing years, since CCr & Clr are closely related in most cases. Again it is not possible to say whether mobility asserts an additional effect on Clr or whether the correlation is the result of the relationship between CCr & mobility. The effect of exercise on the renal excretion of DIG has not been fully investigated, but it seems likely that CCr is more important than mobility, which may assert a small additional influence on Clr.
6.5.5 Non-renal Excretion of Digoxin When renal clearance is subtracted from total body clearance the product represents that DIG which is cleared by other "non-renal” routes. This DIG may either be excreted unchanged by an alternative route eg. secretion into bile, or else metabolized to form a compound that can be renally eliminated or excreted by another route. It is now thought that nonrenal routes of excretion are responsible for the elimination of approximately 20-40% of the administered dose although metabolism appears to be more extensive in about 10% of those taking DIG (254,255).
In this study Clnr ranged from -30-105ml/min for females & -35-130ml/min for males? 8 subjects had a negative value for Clnr (Clr>Clt). This suggests that some subjects may have absorbed in excess of 67% of the dose. An increase in

201
DIG available for systemic circulation would have the effect of increasing Clt to create a positive value for Clnr. Lack of specificity in the DIG assay could also account for this result if other compounds in serum or urine cross-reacted with the DIG antibody.Clnr for most subjects was calculated to be greater than zero, suggesting that not all DIG was eliminated unchanged in urine. The range for Clnr suggests that the importance of the non-renal route(s) may vary between individuals, and it has been proposed that DIG metabolism may increase during chronic therapy (111). Most subjects studied had been taking DIG for a number of years - only one subject (M55) had recently been prescribed DIG and 3 weeks had elapsed before inclusion into the study. Compromised renal function is often associated with an enhancement of non- renal routes of elimination. However, in this study Clnr was independent of both CCr & Clr, suggesting that renal function does not determine Clnr. Similar conclusions have been drawn by other groups investigating DIG metabolism in those with renal impairment (110), and faecal excretion of DIG and metabolites has not been found to alter greatly when renal function is diminished (256). It has also been shown that the total body clearance of DIG, which includes both renal & extrarenal clearances, is in a linear relationship with renal clearance of creatinine (104). The pattern of correlations suggests that mobility is not a factor in the determination of Clnr, and cannot explain the variation in Clnr observed in this or other studies.
6.5.6 Urinary Excretion of DigoxinSince subjects in this study were taking a variety of doses, DIG excreted in urine in 24h was expressed as a

202
percentage of dose administered. %Du ranged from 19-83% for females, 25-85% for males, and there was no significant difference between sexes. Other studies have found %Du to vary from 12-69% (42±4) in a group of 20 elderly people (237), and to average 36+28% in 53 hospitalized elderly people with a mean age of 72y (236). The latter study noted that neither a variation in weight nor co-administration of diuretics affected %Du, but a decrease in CCr was associated with a reduction in %Du. Another study found mean %Du to be 59+6% (range 38-82%) in a group of elderly people with heart failure taking good bioavailability tablets (257).In the present study %Du correlated with Clr & Clnr for females; Clnr for males? UDIG, Clr & Clnr for the entire group. Neither age, mobility score or CCr appeared to influence %Du, but Clr appears to be an important determinant. Those with a low %Du could either have absorbed less DIG or metabolized a relatively greater proportion of the dose. It has been estimated that around 10% of those taking DIG are subject to reduced absorption due to the action of various enteric organisms (85). An additional 10% exhibit a more extensive metabolic pathway when between 20-55% of the dose is excreted as a DIG metabolite (98). The degree of metabolism is probably not related to renal function, which is in agreement with the findings from this study where no correlation was seen between %Du or Clnr & CCr.Whenever a 24h urine collection is required, there are inherent problems in obtaining an accurate collection, except when patients are catheterised. Males generally have less problem collecting urine, but no difference was

203
seen between sexes for %Du, suggesting that collections were comparable in accuracy between males & females. Inaccuracy of urine collection cannot explain the results from those individuals having a greater than average recovery.
6.6 DIGOXIN EXCRETION IN FIT & FRAIL ELDERLY PEOPLE6.6.1 Sex DifferenceSubjects were divided into fit & frail groups which were further separated into males & females. Males were less elderly than females but this was not statistically significant. Trends between fit & frail groups were similar when sexes were separated, and %Du, [SDIG], Clt, Clr, Clnr were not significantly different for males & females. Fit & frail groups are therefore of mixed sex except were specific differences were seen (UCr, CCr, weight, SA). These will be discussed under each heading where applicable.
6.6.2 Comparison of Age & Mobility ScoreData were collected from 24 (12F) fit & 25 (14F) frail subjects taking DIG long-term. Mobility score was evenly distributed throughout the age range, so that while no significant difference was seen between ages of fit & frail groups, mobility score was significantly greater in the frail group. There was no overlap between groups with respect to mobility score - fit subjects scored 1 (n=17) or 2 (7), frail subjects scored 3 (13), 4 (8) or 5 (4). To achieve an even distribution of scores throughout the age range it was necessary to extend recruitment of subjects beyond the one General Practice and hospital used in previous studies. Patients were therefore recruited from

204
an additional 5 General Practices & 4 Community Hospitals. Although the time taken for recruitment was increased, it enabled fit & frail groups to be comparable for age so that the effects of other factors such as frailty & CCr could be more clearly elucidated.
6.6.3 Comparison of Digoxin Dose & [SDIG]Subjects were prescribed 0.0625, 0.125 or 0.25mg DIG daily, with no significant difference seen between fit & frail groups in terms of daily dosage or dose per kg bodyweight. [SDIG] tended to be greater in the frail group, who exhibited a wider variation for a given dose, but these observations failed to reach significance. As discussed in6.5.2 the determination of [SDIG] is complex, and frail could differ from fit subjects at any stage of DIG disposition.Reduced absorption of DIG in fit subjects could explain the lower [SDIG], particularly if they consumed a diet higher in bran fibre or fat both of which have been shown to impair absorption of DIG. However, %Du was similar between groups suggesting that both absorption & metabolism are comparable.Vd of DIG has been shown to be reduced in the elderly (106) but similar within a group of elderly subjects (237), although the effect of frailty is not known. No significant difference in weight or SA was seen between fit & frail groups when separated according to sex while the trend seen for [SDIG] remained. Body composition can influence DIG distribution, and fit subjects would be more likely to have a greater proportion of muscle as indicated by an increased UCr, which could reduce [SDIG]. Frailty is likely to be associated with a greater degree of muscle wasting.

205
Polypharmacy is most likely to occur in frail subjects who generally have multiple pathology requiring numerous drugs. 19 frail & 2 fit subjects were in care during the study.It is possible that those at home took DIG less regularly than those in care who are more likely to have their medications supervised. This could account for the reduced [SDIG] seen in fit subjects, and while the blood samples taken 5 days apart appeared to indicate that all participants were in steady state, this cannot be proved unequivocally. Polypharmacy among the least fit could give rise to more drug interactions which could increase [SDIG] in the frail elderly.The most significant differences between the fit & frail groups were those of mobility score & CCr. In 6.5.3 the relationship between CCr & mobility was discussed and it was difficult to say whether mobility independently contributed to the [SDIG] & clearance. Hales had a significantly greater CCr than females although the difference was reduced for CCr/SA. For both sexes CCr & CCr/SA were significantly greater in the fit than frail groups. CCr appears to be the most important factor in the determination of [SDIG] and it seems likely that this would explain at least some of the difference observed in [SDIG] between fit & frail groups.
6.6.4 Comparison of Excretion of Digoxin In Urine Urine volume & UCr excreted in 24h was significantly greater in males than females, and so fit & frail groups compared were of separate sexes. Urine volume & UCr were significantly greater in the fit group of females. A similar trend was seen for UCr in males, but urine volume was comparable between groups. While it is possible that

206
urine collections were incomplete for frail groups, UCr would be expected to be greatest in those who are most active, since the quantity of creatinine excreted is related to muscle mass.Range & mean %Du were similar between fit & frail groups, for both sexes, suggesting that frailty, immobility or reduced CCr did not significantly influence the quantity of unchanged DIG excreted in urine. It would seem that the extent of both DIG absorption & metabolism did not differ significantly between fit & frail groups, otherwise % recovery of unchanged DIG in urine would be expected to be different between groups.
6.6.5 Comparison of Digoxin ClearanceTotal body clearance could not be.calculated since DIG was administered orally and the exact fraction of dose absorbed was not known, and so apparent body clearance was instead determined. Renal clearance was calculated from [SDIG] at steady state & DIG in urine, and therefore did not require such assumptions to be made. Clnr was taken to be the difference between Clt & Clr.The fit had a significantly greater Clt than the frailgroup when the entire group and females were considered,and this observation tended towards significance for males.The significance of this relationship was reduced when Clt
2was expressed per kg bodyweight or 1.73m SA, but the trend could still clearly be seen.Fit tended to have a greater Clr than frail for the entire group, males & females, but in all cases this trend failed to reach significance. Median & mean Clr, Clr/kg & Clr/SA were consistently lower in the frail groups, likewise Q1 & Q3. Clnr, Clnr/kg & the ratio Clr/CCr were similar for
207
each group. The observed difference in Clt between fit & frail groups could be due to either an unequal extent of absorption, difference in CCr, or influence of frailty. Since clearance is independent of Vd, changes in body composition cannot explain the differences seen. In 6.6.4 %Du was discussed in relation to fit & frail groups. While urine volumes differed between groups %Du did not, suggesting that absorption & metabolism were similar between groups, even though extent may vary between individuals. Both Clt & Clr correlated with CCr, as in other studies, since in most individuals the majority of DIG is eliminated by glomerular filtration and to a lesser degree tubular secretion.CCr was significantly different between fit & frail groups and this is likely to explain some of the observed differences in Clt & Clr. Although those with the lowest CCr tended to have the lowest Clt & Clr values, this was not unequivocally so, and this degree of variability also seen in other studies confounds any predictive method for [SDIG] based on CCr. The ratio Clr/CCr was similar between groups, and close to unity, suggesting that creatinine &DIG are cleared by a common pathway. Clnr was comparable between groups suggesting that the degree of non-renal elimination is unchanged in the frail state. Other studies have found that Clnr is similar for a range of renal functions and results from the present study are in agreement with these findings (104,256).From these results it would appear that the association between frailty & CCr is the most likely cause of the trend towards a reduced Clt & Clr seen in the frail groups.Since mobility score & CCr were correlated, it is difficult

208
to say whether frailty & immobility has an additional influence on Clt & Clr above that from CCr.
In an attempt to separate out the influence of frailty from CCr, sub-groups of fit & frail males were formed. Subjectswere selected whose CCr/SA was within the range 45-105
2ml/min/1.73m and using this method subgroups of 11 fit & 8 frail males were formed. Results are given in appendix E16. The distribution of CCr & mobility score amongst females did not facilitate the formation of fit & frail subgroups for females, and sexes were not combined since males had a greater CCr than females.No significant difference was seen between fit & frail males with respect to age, dose, CCr & CCr/SA. With the equalization of CCr between fit & frail groups no significant difference was seen between groups for [SDIG], Clt, Clr or Clnr. These results would suggest that frailty & immobility exert little, if any, additional influence on the determination of DIG clearance. CCr appears to be the most important of those factors measured, and appears to be reduced in frailty. The unexplained variance observed in the prediction of [SDIG] is unlikely to be accounted for by the fitness of the subject.
6.7 CONCLUSIONSThe elderly are frequently prescribed digoxin because of an increased prevalence of the two primary indications for digoxin therapy, namely atrial fibrillation and congestive cardiac failure, associated with old age (242,258).However, widespread use of the drug has resulted in rates of toxicity which can approach 20% of hospitalized geriatric patients taking digoxin (259). There is also a

209
significant incidence of underdigitalisation (91,225), and this is becoming more common as digoxin doses fall (230) following fears of increased mortality and morbidity associated with its use.DIG has a narrow therapeutic ratio and many studies have been carried out in an attempt to accurately predict serum [DIG], Many factors have been found to influence [SDIG] but the scatter between measured and predicted [SDIG] remains wide, and the unexplained variance has rendered the use of nomograms and equations clinically unacceptable. While dose & renal function appear to be the most important determinants of [SDIG], other factors which also contribute include extent of absorption, distribution, metabolism & excretion, also disease state, compliance and drug interactions as discussed in 6.5.The aim of the present study was to determine whether immobility & frailty exert an additional influence on the determination of [SDIG] and efficiency of elimination.
When patterns of correlations were examined many of the parameters studied were interrelated, and it was hard to make a definitive statement on the importance of mobility. Results appeared to indicate that if mobility does influence the efficiency of DIG elimination, then that influence is only slight and of minor significance compared to that of renal function. This suggests that incorporation of a "mobility factor" into an equation used to predict [SDIG] would not significantly enhance prediction accuracy and account for a degree of unexplained variance.When subjects were divided into fit & frail groups a similar conclusion was drawn. The fit group had a greater total body clearance & renal clearance than the frail group

210
but this was confounded by the increased CCr seen in fit subjects. Males were divided further into fit & frail groups, each with a similar CCr range, and clearances reexamined. It was found that the trend towards an increased clearance in fit subjects was lost, with Clt & Clr becoming comparable for both groups. This suggested that the differences observed between fit & frail groups could partially be explained by the difference in CCr.Thus while frailty, as defined for the purposes of this study, cannot be proposed as an explanation for the variability in [SDIG], the difference in renal function between fit & frail subjects should be considered. Many of the equations devised to predict [SDIG] also predict CCr from SCr and do not take into account frailty. This mayexplain some of the inaccuracies seen when nomograms orequations are employed. Nevertheless, when CCr is measured and plotted against [SDIG] or Clt a straight line is not seen, suggesting that the difference in CCr is not solely responsible for the scatter. Further work is required todetermine which other factors besides those alreadymentioned are important in the determination of [SDIG].
From this study it was observed that a significant proportion of subjects on DIG were underdigitalised, with 63% having [SDIG] less than 0.8ng/ml. It has previously been proposed that the decline in DIG dosage in recent years has been the result of numerous articles published which have found a significant degree of DIG toxicity in those taking DIG (225,230). The popular "geriatric dose" of 0.0625mg daily is inappropriate in all but the most severe cases of renal insufficiency or muscle wasting, and subtherapeutic [SDIG] levels can give cause for concern in

211
those with uncontrolled AF. However, toxicity is unlikely with this dose and would only be seen in patients exhibiting an enhanced sensitivity to DIG. A maintenance dose of 0.125mg daily would appear to be the most appropriate dose for elderly subjects, alternatively a O.lmg tablet may increase the proportion of subjects with [SDIG] within the therapeutic range.Further to this is the question of when the prescription for DIG is appropriate which remains a controversial issue. While it is agreed that DIG therapy is necessary in supraventricular tachyarrhythmias, its role in CCF remains uncertain. Results from the present study suggest that prescribing trends are changing so that fewer patients are prescribed DIG in the absence of AF. Nevertheless, a proportion of patients remain who have been prescribed DIG, often in small doses, for a number of years on the basis of an uncertain diagnoses. Review of patients in General Practice on long term DIG would seem to be appropriate, since all are at risk of toxicity, particularly if concomitant diuretic therapy results in hypokalaemia.
Despite the vast literature concerning patterns of DIG elimination, more work needs to be carried out to determine causes of extensive interindividual variability observed for both [SDIG] & clearances. Those patients on long term DIG should be regularly reviewed since therapy is not without hazard, and a change in clinical condition can force [SDIG] beyond the therapeutic range. If the prescription remains appropriate, then steps should be taken to ensure that the patient receives maximal therapy to adequately control the condition but minimize the possibility of toxic side effects.

CHAPTER SEVENCONCLUSIONS FROM STUDIES IN FIT & FRAIL ELDERLY PEOPLE
Demographic trends indicate that the proportion of elderly people in the community is likely to expand in developed countries in the foreseeable future. Prevalence & incidence of ill health and disability increases in old age and it is not therefore surprising that those over retirement age are the main consumers of prescribed medication. In this age group adverse drug reactions are known to be two to three times more common due to the increased drug consumption and altered drug response. Knowledge of these facts has stimulated research into age-related changes in drug handling in an attempt to reduce the incidence of adverse drug reactions and make drug usage in the elderly safer.
Far from forming a single homogeneous group, the elderly can readily be seen to differ widely in their physical abilities even in the absence of discernable disease. Some elderly people remain independent, exhibiting little loss of function, until well into their ninth decade, while others appear to require full care soon after retirement. Many studies have been carried out to identify and quantify physiological changes associated with increasing chronological age, and these have subsequently been extended to investigate age-related changes in drug disposition. However, most such studies have been carried out using healthy elderly volunteers who themselves are frequently ill defined, and it is not yet widely known whether ill health & immobility contribute an additional decrement to the decline in many physiological functions associated with ageing.

213
As discussed in 1.2, the first precise definition of the "healthy elderly" was made in 1976 in the "Senieur Protocol", the result of a concerted working party to establish admission criteria for immunogerontological studies (29). However, this definition was not subsequently employed in drug studies, probably because it is too exacting for widespread use, with multiple clinical, biochemical & haematological investigations required before recruitment into a study. The number of potential volunteers disqualified from participation in a study by the strict exclusion criteria set down in the Senieur Protocol would appear to be too great for practicable usage in the majority of studies.
An alternative operational definition was proposed by a second group in 1988 in an attempt to dissociate biological & chronological age, and the terms "fit" & "frail" were coined for the purpose (28)? the exact definitions are given in 1.2. Whilst the definitions used by this group are much less strict than those in the Senieur Protocol, they nevertheless require both clinical examination & laboratory investigations. Frail subjects were dissociated from their fit counterparts by their loss of independence, impaired ability to carry out activities of daily living, reduced mobility and probable requirement for prescribed medication. Whilst frail subjects could suffer from certain musculoskeletal and cardiovascular conditions, both fit & frail subjects were required to be free from significant hepatic, renal, cardiac, respiratory or metabolic disorders to fulfil the admission criteria.
Using these later definitions studies have found the frail

214
elderly to have reduced mental function, reduced total body potassium & albumin, and alterations in other electrolytes when compared to their fit counterparts. While the fit elderly exhibit the normal biological reduction in hepatic volume & blood flow, the frail elderly appear to possess an additional decrement in hepatic drug clearance, possibly due to a reduction in the specific activity of some hepatic enzymes. However, it is not yet known whether the normal reduction in renal function observed in the fit elderly is exaggerated in frail patients to further reduce renal drug clearance beyond that expected.
The main shortfall in the use of these later definitions is that the majority of elderly subjects in both the community and in care are not included, since most have some significant pathology requiring regular medication. Thus, those elderly people with well controlled chronic conditions which do not adversely influence quality of life are excluded from possible investigation despite their appearance of "fitness”. Important changes in drug disposition could potentially be missed in those groups of elderly people most commonly prescribed medication either in General Practice or hospital.
The primary aim of this thesis was to devise working definitions which could readily differentiate between the two groups of elderly people most commonly encountered in clinical practice, that is, those who are well & active despite the presence of a chronic condition, and those who are infirm & relatively immobile in the presence of similar diagnoses. The groups thus defined were termed "fit” & "frail" since these titles most appropriately describe the

215
two populations, and precise definitions are given in appendix Al.Together the fit & frail groups appear to form the majority of those elderly people for whom medication is prescribed. The definitions were constructed in such a way as to be easily applied to an individual without reliance on laboratory investigations, and thus they are composed of social & functional criteria. In the course of the following studies few individuals were not readily categorized.
The main criticism of these operational definitions is that without the use of laboratory investigations undiagnosed pathology may lead to a frail subject being categorized as fit, although the converse is unlikely to occur. While this problem was recognised, the reduction in accuracy was felt to be more than offset by the ease of application of the definitions.
Once the main populations of elderly people were defined, studies were carried out to determine whether fit & frail groups of elderly people differed in terms of renal function, and renal & hepatic drug clearance using model drugs frusemide, digoxin & paracetamol.
It is often desirable to know a patients renal function when drugs are prescribed whose elimination is accomplished via renal clearance, in order to prevent their accumulation. Since renal function is known to decline in old age, the margin for safety is reduced for renally excreted drugs with a narrow therapeutic window.Creatinine clearance, taken as an estimate of glomerular filtration rate, was measured in a wide range of elderly

216
people in order to determine whether drug dosage levels should take into account the "fitness” of an individual. Since the classical measurement of CCr is a difficult & lengthy procedure, equations to predict CCr have previously been constructed using SCr alone. Therefore, in addition to the usual 24h CCr measurement, CCr was predicted using 12 different equations, and also urine collections of less than 24 hours. Measured & predicted CCr were compared between groups of fit & frail elderly people to determine whether frailty compromised the accuracy of CCr prediction.
In addition to the fit & frail subjects invited to participate in this study from General Practice & long-stay hospital wards, elderly people were recruited from the R.I.C.E. volunteer panel. All were free from discernable disease on clinical examination & laboratory investigations, fully mobile, and living independently in the community, and none were taking regular medication. These subjects were termed "very fit" and this group was taken to be comparable to the healthy elderly groups defined by previous investigators.When the CCr of the very fit group was compared with the CCr of those defined as "fit" for the purposes of the ensuing drug studies, no significant difference was found between them. This suggests that the fit group as defined in this thesis is similar to those fit groups defined in other studies, at least in terms of renal function and probably renal drug clearance. The advantage of the present fit definition is that subjects included in the admission criteria are more frequently found in the clinical setting and thus more truly representative of those elderly people active in the community.

217
A statistical difference was seen between the sexes in terms of UCr, SCr & CCr and so results from males & females were analysed separately although similar patterns were seen for both groups. For both sexes CCr was found to decline with increasing age. CCr was compared between the very fit, fit & frail elderly males & females, and found to be comparable between the very fit & fit groups. However, frailty appeared to contribute an additional decrement to an individuals CCr since frail groups had a consistently reduced CCr when compared to their fit counterparts of similar age & weight.
Using urine collections of about 8 hours, predicted CCr closely approximated to measured 24h CCr for most elderly people studied. Accuracy of prediction did not appear to be influenced by diuretic use, magnitude of measured CCr, nor frailty. However, CCr prediction using any of the 12 equations was less reliable, particularly when equations were employed which relied only upon the SCr level. While diuretic use did not affect the outcome, CCr was consistently overpredicted using the equations in those with the lowest measured CCr, ie. the frail elderly, who are probably at greatest risk from adverse drug reactions.
From this study it would seem that CCr can be most accurately predicted in elderly subjects using a urine collection of less than 24 hours. Urine collections carried out overnight are probably the most accurate & convenient, although time of day has little influence on prediction accuracy. Furthermore, diuretic use, magnitude of measured CCr and frailty do not appear to compromise the accuracy of prediction. In the elderly, CCr seems to be less well

218
predicted using any of the classical equations, although equations into which age & bodyweight are incorporated yield the most favourable results. Using this method of prediction CCr is likely to be overestimated in those frail individuals who have a low measured CCr. Differences in body composition between fit & frail subjects are probably important in the explanation of the reduction in prediction accuracy associated with frailty. These finding have important consequences when CCr is predicted in the course of drug dosage calculations, since those who are frail would seem to be more likely to receive an inappropriate dose. This has not previously been recognised.
From the CCr study it appears that frail subjects are likely to have a reduced CCr when compared to their fit counterparts of a similar age & sex, and it would therefore seem reasonable to suppose that renal drug clearance is also reduced in frailty. In order to test this hypothesis the renal excretion of frusemide, a commonly used diuretic, was followed in fit & frail elderly people, and the efficiency of elimination compared between the two groups. Although the frusemide study was flawed with respect to sampling times, the results were taken to be orientating and qualitative.All subjects in this study were prescribed frusemide as Frumil or frusemide BP tablets, to treat a variety of cardiovascular conditions. Therefore, no subject was fit according to the definitions of other groups, although many were fully mobile and able to live independently in the community. It was these subjects who were categorized as fit for the purposes of the present study.

219
Subjects taking Frumil appeared to eliminate FRU more efficiently than those taking frusemide and so two separate groups were formed according to the preparation taken. Despite the likelihood that two populations were present, patterns observed between fit & frail groups were similar. Frail subjects tended to have an increased elimination tl/2 and reduced serum & renal clearance when compared to their fit counterparts, although it was not clear whether this trend was due to the reduced CCr also observed in the frail group or due to frailty per se. In an attempt to separate out the influences of age, CCr and frailty, fit & frail subjects taking Frumil were age-matched and the groups again compared. When no significant difference was seen for age or CCr between the two groups, frail subjects still appeared to eliminate FRU less efficiently although this observation was only of borderline significance. However, it appeared that some subjects with a low CCr excreted FRU rapidly, suggesting that in some cases nonrenal routes of elimination were important.
These results suggest that while frailty may be responsible for a small reduction in FRU elimination rate this is probably of only limited clinical significance. More important is the additional decrement in CCr which seems to be contributed by the frail state, which could be due to differences in activity, posture and renal blood flow between the two groups.
Unfortunately hepatic function cannot be measured as easily as renal function since the standard liver function tests are more a measure of hepatic damage. Therefore, since parallel studies could not be run for hepatic as renal

220
function, it was instead necessary to monitor the elimination of a model drug whose clearance is accomplished solely by hepatic metabolism. Paracetamol, a widely used and well tolerated analgesic, was selected as the model drug since it is known to be extensively metabolised, with only 5% of the therapeutic dose excreted unchanged in urine.Paracetamol & clearance were measured and comparedbetween groups of fit & frail subjects, and it was found that both kinetic parameters were consistently altered in frailty in such a way as to suggest impaired PAR metabolism. This observation remained when subjects were age-matched. Possible explanations for these results could include a reduction in liver perfusion or hepatic enzyme activity occurring in frailty, which could be the result of differences in diet, activity or posture. Although the exact mechanisms by which the reduction in hepatic metabolism occurred in frail subjects could not be elucidated from this study, it seems likely that reduced clearance of the model drug reflects a real difference in hepatic function between the fit & frail elderly.
Digoxin elimination has been widely investigated in elderly people since its use is associated with increased morbidity & mortality in this age group. While many studies have attempted to quantify the importance of a number of factors known to influence serum DIG concentration at steady state, a high degree of unexplained variance has rendered any resulting equations unworkable in clinical practice.Digoxin clearance was therefore compared in fit & frail subjects in order to determine whether frailty could contribute to this unexplained variance.

221
Fit & frail groups were comparable in age & bodyweight, but a significant difference was seen between them for CCr and DIG clearance. When the effects of renal function and frailty were separated by matching fit & frail subjects for CCr, the difference in DIG clearance between the groups was lost. This suggested that whilst frailty appeared to contribute little, if any, influence to [SDIG] for a given dosage, the reduction in CCr associated with frailty could explain a degree of the unexplained variance observed in other studies.
The detection of physiological differences between fit & frail groups defined in this thesis suggests that at least two populations of elderly people do in fact exist. While the definitions set down for the purposes of the studies differed from those used by previous groups, some constancy lay between them since the very fit subjects used in the CCr study had similar renal function to the fit subjects used in ensuing studies.The question of why the frail elderly should handle some drugs less efficiently than their fit counterparts is not easy to answer, and little work to date has addressed this problem.It is likely that differences in activity & posture between the two groups, with subsequent changes in blood flow patterns, may in part be responsible for some of the changes seen. However, few frail subjects appear to revert to the fit state even after hospital admission for mobilization & rehabilitation and so it was not possible to determine prospectively whether an increase in fitness & activity is associated with improved drug handling in particular patients used as their own controls. This would
222
be suitable material for further study although numbers would be limited by the low incidence of recovery observed during the course of these studies.Differences in muscle mass & overall body composition are probably also important in the explanation of the changes associated with frailty.Another important factor may be a difference in the extent of drug absorption which could occur between the groups, and again this has been poorly investigated to date. However, in both the frusemide & digoxin studies percent dose recovered in urine was similar between fit & frail groups which suggests that extent of absorption differs relatively little between them.
The importance of these findings may be seen in the light of drug dosage calculations which are at times necessary when potentially toxic drugs are prescribed whose therapeutic window is narrow. While numerous nomograms & equations exist to facilitate the selection of a correct therapeutic dosage which is unlikely to produce toxic side effects, none appear to take into account the physical condition of the patient beyond their renal or hepatic function, which is in itself often unknown. Results from this study suggest that CCr may be lower than expected for a given age & weight in frail elderly subjects, and this can lead to obvious discrepancies in drug dosage calculations. In addition, hepatic drug clearance, at least in drugs whose metabolism is via conjugation with sulphate or glucuronide moieties, may also be impaired in the frail elderly when compared to their fit counterparts.
The well documented excess of adverse drug reactions

223
observed in people over retirement age is undoubtedly due in part to the increased consumption of prescribed medication observed in this age group. However, it is possible that the incidence of such reactions could be reduced if the physical abilities of patients were taken into account when drugs were prescribed in addition to the normal reduction in renal and hepatic drug clearance known to occur in old age. If drug dosage levels were further reduced in those with the appearance of frailty it is possible that dose-related drug reactions could be reduced in this group of elderly people who are at greatest risk of their occurrence.

One another's light
It's hard to guess what brought me here,Away from where I've hardly ever been and now Am never likely to go again.Faces are lost, and places passed At which I could have stopped And stopping, been glad enough.Some faces left a mark?And I on them might have wrought Some kind of charm or spell To make their futures work,But it's hard to guess How one thing on another Works an influence.We pass-And lit briefly by one another's light Think the way we go is right.
By Brian Pattenfrom "Vanishing Tricks"Reproduced by kind permission of Unwin Hyman Ltd.

225
R E F E R E N C E S

226
REFERENCES
1 Khaw KT. Geriatric Med (1991);39-442 Denham MJ. Care of the Elderly (1990);2(6):219-2203 Swift CG. Br Med J (1988);296:913-9154 Mills E. Care of the Elderly (1989);1(4):2025 Victor CR. Age Ageing (1989);18:387-3916 Kay DWK. Age Ageing (1989);18:73-767 Weedle PB, Poston JW. Pharm J (1985);4538 Turner P. Postgard Med J (1989);65:218-2209 Greenblatt DJ, Sellers EM, Shader Rl. N Engl J Med (1982);306(18):1081-108810 Hontamat SC, Cusack BJ, Vestal RE. N Engl J Med (1989);321(5):303-30911 Cromarty JA. Pharm J (1985);511-51412 Divoll H, Ameer B, Abernethy DR, Greenblatt DJ. J Am Ger Soc (1982);30(4):240-24413 Triggs EJ, Nation RL, Long A, Ashley JJ. Eur J Clin Pharmacol (1975);8:55-6214 Greenblatt D, Allen M, Locnisker A et al. Clin Pharmacol Ther (1979);26:103-11315 Montgomery R, Haeney MR, Ross IN. Q J Med (1978);47:197-21116 Bender A. J Am Ger Soc (1974);22:29617 Hyatt RH, Whitelaw MN, Bhat A, Scott S, Maxwell JD. Age Ageing (1990);19:330-618 Verbeeck RK, Cardinal JA, Wallace SM. Eur J Clin Pharmacol (1984),*27:91-9719 George G, Wynne HA, Woodhouse KW. Age Ageing (1990),*19:364-36720 Rawlins HD, James OFW, Williams FM, Wynne H, Woodhouse KW. Q J Med (1987);46(243):545-721 Woodhouse KW, Wynne HA. Clin Pharmacokin (1988),*15:287-9422 Summer bell J, Yelland C, Woodhouse KW. Age Ageing (1990) ,*19:128-13023 McLachlan MSF. Lancet (1978) ,*143-14524 Papper S. Geriatrics (1973) ,*83-8725 Rowe J, Andres R, Tobin J, Norris A, Shock A. J Gerontol (1976);31(2):155-16326 Kirkland JL, Lye M, Levy DW, Banerjee AK. Br Med J (1983),*287:1665-166727 Crowe M, Forsling H, Rolls B, Phillips P, Ledingham J. Age Ageing (1987);16:285-29328 Woodhouse K, Wynne H, Baillie S, James 0, Rawlins H. Quart J Med (1988),*68(255):505-629 Lighart GJ, Corberand JX, Fournier C et al. Mech Ageing Development (1984),*28:47-5530 Wynne HA, James OFW. Age Ageing (1990);19:l-3

3132
333435363738394041424344
45
46474849505152535455565758
227
Lott RS, Hayton Wl. Dru Intell & Clin Pharm (1978);12:140-150 Bowman WC, Rand HJ. Textbook of Pharmacology - second edition - (1982).Blackwell Scientific Publications, Oxford.Kampmann JP, Holholm Hansen J. Br J Clin Pharmacol (1981);12:7-14Morgan DB, Dillon S, Payne RB. Postgard Med J (1978) ,*54:302-310Payne RB. Ann Clin Biochem (1986),*23:243-250Gabriel R. Br Med J (1986) ,*293:1119-1120Edwards KGD, Whyte HM. Australas Ann Med (1959);8:218Trewin VF, Lawrence CJ, Veitch GBA, Luscombe DK. Care of the Elderly (1991) ,*3:193-8 Myers MG, Weingert HE, Fisher RH, Gryfe Cl, Shulman HS. Age Ageing (1982),*11:213-221 Anon. Br Med J (1978);l:5-6Schmidt H, Roholt K. Acta Pathol Microbiol Scand (1966),*68:396Opie LH. (1987) second edition Drugs for the Heart Grune & Stratton Inc.Anon. Lancet (1979);1:253-254Grahame-Smith DG, Aronson JK. Oxford Textbook of Clinical Pharmacology & Drug Therapy (1990); Oxford University PressBritish National Formulary (1991);21:Published by British Medical Association &Royal Pharmaceutical Society of Great Britain.ABPI Data Sheet Compendium (1990-1991). Published by Datapharm Publications Ltd., London. Martindale The Extra Pharmacopoeia (1982);28th Edition:The Pharmaceutical Press.Benet LZ. J Pharmacokin Biopharm (1979);7(1):l-27Rikans LE. Life Sci (1986) ,*39(11): 1027-1036Andreasen F, Husted S. Acta Pharmacol Toxicol (1980) ,*47:202-207Andreasen F. Acta Phaemacol Toxicol (1973),*32:417-429Andreasen F, Jakobsen P. Acta Pharmacol Toxicol (1974) ,*35:49-57Beerman B, Dalen E, Lindstrom B, Rosen A. Eur J Clin Pharmacol (1975),*9:57-61Vasko M, Brown-Cartwright D, Knochel J, Nixon J, Brater D. Ann Int Med (1985),*102:314-4Kerremans ALH, Gribnau FWJ. Clin Exper Hyper -Theory & Practice (1983);A5(2):271-284Andreasen F, Hansen HE, Mikkelsen E. Eur J Clin Pharmacol (1978);13:41-48Andreasen F, Hansen U, Husted S, Jansen J. Br J Clin Pharmacol (1983),*16:391-7Perez J, Sitar DS, Ogilvie Rl. Br J Clin Pharmacol (1980),*9:471-478

59606162636465666768697071727374757677787980818283848586878889
228
Rane A, Villeneuve J, Stone W, Nies A et al. Clin Phariac Ther (1978);24:199-207Andreasen F, Mikkelsen E. Eur J Clin Pharmacol (1977);12:15-22Beerman B, Dalen E, Lindstrom B. Clin Pharmacol Ther (1977);22(1):70-78Andreasen F, Christensen C, Jakobsen F, Morgan C. Acta Pharmacol Toxicol (1981);49:223-9Goldberg M. JAMA (1982);247(1):64-65Prescott LF. Br J Clin Pharmacol (1980);10(2):91S-298SBeaver WT. Am J Med Sci (1966);251:576-599Plotz PH, Kimberley RP. Arch Int Med (1981);141:343-8Perucca E, Richens A. Br J Clin Pharmacol (1979);7:201-6Wilson JT. Am J Dis Child (1978);132:466Hall RC. Postgrad Med J (1976);52:139Buchanan N, Moodley GP. Br Med J (1979);2:307Wilson HTH. Br J Derm (1975);92:213Johnson GK, Tolamn KG. Ann Int Med (1977);87:302Mitchell J, Thorgeirsson S, Potter W et al. Clin Pharmacol Ther (1974),*16:676-684Fulton B, James OFW, Rawlins MD. Br J Clin Pharmacol (1979);7(4):418P Forrest J, Adriaenssens P, Finlayson N, Prescott L. Clin Pharmacol Ther (1979),*15:427-31Oldham HG. PhD Thesis, University of Bath (1983)Prescott LF, Wright H. Br J Pharmacol (1973),*49:602-613Clements JA, Prescott LF. J Pharm & Pharmacol (1976),*24:707-709Divoll H, Abernethy DR, Ameer B, Greenblatt DJ. Clin Pharmacol Ther (1982);31(2):151-6Briant RH, Dorrington RE, Cleal J, Williams FA. J Am Ger Soc (1976);24(8):359-361Wynne H, Cope L, Herd B, Rawlins M, James 0, Woodhouse K. Age Ageing (1990),*19:419-424Mooradian AD. Clin Pharmacokin (1988) ,*15:165-179Johnston GD, McDevitt DG. Lancet (1979),*1:567-570Hull SM, Mackintosh A. Lancet (1977),*2:1054-1055Smith TW. N Engl J Med (1988);1:358-365Bailie GR, Angaran DM. Pharm J (1986),*1:392-393Drusano GL, Muncie HL, Hoopes JM, Damron DJ, Warren JW. J Am Ger Soc (1988),*36:437-441Brodie MJ, Hallworth MJ. Hosp Update (1987);2:612-624Aronsen JK, Grahame-Smith DG, Wigley FM. Q J Hed (1978);67(186):111-122

90
919293949596979899100
101
102
103104105106107108109110
111
112113114115116117118119
229
O'Malley K, Kelly J. Ageing & Responsiveness to Drugs. In Recent Advances in Clinical Pharnacology, eds Turner P, Shand D. (1983) Chruchill Livingston.Cusack B, Kelly J, O'Malley K, Noel J et al. Clin Phanacol Ther (1979);25(6): 772-776Iisalo E. Clin Pharnacokin (1977);2:1-16Reid J, Kennedy RD, Caird FI. Age Ageing (1983);12:29-37Henry DA, Lowe JM, Lawson DH, Whiting B. Postgrad Med J (1981);57;358-362Beerman B, Hellstroi K, Rosen A. Clin Sci (1972);43:507-518Hall WH, Doherty JE. Digestive Dis (1971);16:903-908Greenblatt DJ, Siith TW, Koch-Weser J. Clin Phanacokin (1976);1:36-51Aronson JK. Clin Phanacokin (1980),*5:137-149Peters U, Falk LC, Kalnan SH. Arch Intern Med (1978),*138:1074-1076Lindenbaun J, Mellow HH, Balckstone MO, Butler VP. N Engl J Med (1971),*285:1344-7Heizer WD, S«ith TW, Goldfinger SE. N Engl J Med (1971),*285:257-259Caird FI, Kennedy RD. Age Ageing (1977),*6:21-28Gault MH, Jeffrey JR, Chirito E, Ward LL. Nephron (1976) ,*17:161-187Koup JR, Jusko WJ, Elwood CM, Kohli RK. Clin Phanacol Ther (1975),* 18(1):9-21Jusko WJ, Szefler SJ, Goldfarb Al. J Clin Phanacol (1974),*15:525-535Aronson JK, Grahaie-Siith DG. Br J Clin Phanacol (1976),*3:1045-1051Doherty JE, Perkins WH, Flanigan WJ. Ann Int Med (1967),*66:116-124Abernethy DR, Greenblatt DJ. Clin Phanacokin (1982),*7:108-124Ewy GA, Groves BN, Ball MF. Circulation (1971),*44:810-814Gault MH, Longerich L, Loo J, Ko P et al. Clin Phanacol Ther (1984),*35(1)*.74-82Peters U, Falk LC, Kalian SM. Arch Int Med (1978),*138:1074-1076Gault H, Vasdev S, Vlasses P, Longerich L, Dawe M. Clin Phanacol Ther (1986),*39:530-6Keller F, Molzahn M, Ingerowski R. Eur J Clin Phanacol (1980),*18:433-441Nicholson PW, Dobbs SM, Rodgers EM. Br J Clin Phanacol (1980) ,*9:467-470Giman RFA, Colliss JS. Clin Chei (1985);31(2):331-332Karreians A, Tan Y, Van Ginnekan C, Gribnau F. J Chroiatog (1982),*229:129-139Adrianssens PI, Prescott LF. Br J Clin Phanacol (1978);6(1):87Cockcroft DW, Gault MH. Nephron (1976),*16:31-41Jelliffe RW. Lancet (1971);1:975-976

120
121122
123124125126127128129130131132133134135136137138139140141142143144145146147148149
230
Jelliffe RW. Ann Int Hed (1973);79(4):604 Jelliffe RW, Jelliffe SM. Math Biosci (1972);14:17-24Wagner JG. Chapter 3. Biopharmaceutic & relevent pharmacokinetics. Hamilton, IL.Drug Intelligence Publications. (1971):222-233Rowe J, Andres R, Tobin J, Norris A, Shock A. J Gerontol (1976);31(2):155-163 Rowe JW, Andres R, Tobin JD. Ann Int Med (1976);84:567-579 Mawer GE. Clin Phanacokin (1976) ;1:67-78Hull J, Hak L, Koch G, Wargin W, Chi S, Mattocks A. Clin Phan Ther (1981);29:516-521 Gates GF. An J Kid Dis (1985);5:199-205Siersbaek-Nielsen K, Molholm-Hansen J, Kampmann J, Kristensen M. Lancet (1971);1:1134James G, Sealey J, Aldenan M, Ljungman S, Mueller F. An J Hyperten (1988);1:124-31Rosano T, Brown H. Clin Chem (1982);28(11):2330-2331Landahl S, Aurell M, Jagenburg R. J Clin Exp Gerontol (1981);3(l):29-45Durakovic Z. Nephron (1986);44:66-69Bjornsson TD. Handbook of Clinical Pharmacokinetics (1983);3:277-300Smith SA. Postgrad Hed J (1988)?64:204-208Denham MJ, Hodkinson HM, Fisher M. Age Ageing (1975);4:32-36Friedman SA, Raizner AE, Rosen H, Solomon NA. Ann Int Med (1972);76:41-45Gral T, Young M. J Am Ger Soc (1980);28(11):492-496Boers M, Dijkmans B, Breedveld F, Mattie H. Br J Rheumat (1988);27:233-5Leaf A. New Engl J Med (1984);311(12):791-792Rosano TG, Brown HH. Clin Chem (1982);28(11):2330-2331Wheeler LA, Sheiner LB. Am J Clin Pathol (1979),*72:27-31Greenblatt DJ, Ransil B, Harmatz J et al. J Clin Phanacol (1976);321-8Hilton PJ, Lavender S, Roth Z, Jones NF. Lancet (1969);2:1215-1216Favre HR, Wing AJ. Br Hed J (1968);l:84-86Mitch WE, Collier VO, Walser M. Clin Sci (1980),*58:327-335Rawlins HD, Henderson DB, Hi jib AR. Eur J Clin Pharmacol (1977) ,*11:283-286Waller DG, Fleming JS, Ramsey B, Gray J. Postgrad Med J (1991),*67:42-46Bennett WH, Porter GA. Br Med J (1971),*4:84-86Kroll MH, Hagengruber C, Elin RJ. Clin Chem (1984);30(10):1664-1666

150151152153154156157158159160161162163164165166167168169170171172173174175176177178179180181
231
Bowers LD. Clin Chei (1980);26(5):551-554Chiou WL, Gadalia MAF, Peng GW. J Pharm Sci (1978);67(2):182-187Okuda T, Oie T, Nishida H. Clin Chem (1983);29(5):851-853Hayersohn H, Conrad KA, Achari R. Br J Pharmacol (1983);15:227-230Jacobsen FR, Christensen CK, Hogensen CE et al. Br Hed J (1979);1:1049-1050Pasternack A, Kuhlback B. Scand J Clin Lab Invest (1971);27:l-7Fraser CG, Fogarty Y. Br Hed J (1989);298:1659-1660Fraser CG, Cummings ST, Wilkinson SP, Neville RG et al. Clin Chei (1989);35(5):783-6 Fraser CG. Pharm J (1990);1:449-451Hirahmadi H, Byrne C, Barton C, Penera N, Gordon S, Vaziri N. Paraplegia (1983);21:23-29Nived 0, Sturfelt G, Westling H, White T. Br Hed J (1983),*286:684-685Jungner I, Jungner G. Acta Hed Scand (1960);166(5):357-368Bahemuka H, Hodkinson H, Denham HJ, Padmore G. Age Ageing (1974)?3:43-48Stanbury SW, Thomson AE. Clin Sci (1951),*10:267-293Armstrong-Esther CA, Hawkins LH. Nursing Times (1982),*1263-1265Guite H, Bliss H, Hainwaring-Burton R, Thomas J, Drury P. Age Ageing (1988),*17:241-8Noskov VB. Fiziologiya (1982);8(4):638-641Karnad DP, Tembulkar P, Abraham P, Desai NK. Lancet (1987),*2:525-528Beguarnardi H, Santini C, Trevisani F, Baraldini H, Ligabue A. Gut (1985),*26:629-635Wesson LG. Hedicine (1964),*43:547-592Pedersen KE, Hadsen J, Kjaer K, Kiltgaard NA, Hvidt S. Clin Pharmacol Ther (1983),*303-308 Richardson JA, Philbin PE. JAHA (1971);216(6):987-990 Spyker DA, Guerrant RL. Hosp Formulary (1981),*1:132-139Bjornsson T, Cocchetto D, HcGowen F, Verghese C. Clin Pharmacokin (1983),*8:365-369Hawer GE, Knowles BR, Lucas SB, Stirland RH, Tooth JA. Lancet (1972),*1:12-15Hallynck T, Soep H, Thomis J, Boelaert J et al. Clin Pharmacol Ther (1981),*30(3): 414-421Robertshaw H, Lai KN, Swaminathan R. Br J Clin Pharmacol (1989),*28:275-280Rhodes P, Rhodes R, HcClelland G, Culbertson V et al. Clin Pharm (1987),*6:399-406Parker RA, Bennett WH, Porter GA. Dialysis & Transplant (1980),*9(3):251-252Paladino JA, Kapfer JA, DiBona JR. Hosp Formulary (1986),*21:709-715Yeh TL, Silkaitis RD. Ann Int Hed (1977);87(3):380

232
182 Hume R. J Clin Pathol (1966);19:389-391183 Charleson HA, Bailey RR, Stweart A. New Zealand Hed J (1980);92:425-426184 Hyneck HL, Johnson HH, Wagner JG, Williams GW. Am J Hosp Pharm (1981);38:69-73185 Sinton TJ, Leacy EA, Cowley DH. Pathol (1986);18:445-447186 Tsujimoto G, Sasaki T, Ishizaki T, Suganuma T. Br J Clin Pharmac (1982),*13:493-500187 Sawyer W, Canaday B, Poe T, Webb C, Porter S, et al. Am J Clin Pathol (1982),*78:823-838188 Lott RS, Uden DL, Wargin WA, Strate RG, Zaske DE. Am J Hosp Pharm (1978);35:717-720189 Andreasen F, Hansen U, Hogensen C, Pedersen E. Br J Clin Pharmacol (1984);18:65-74190 Honari J, Blair AD, Cutler RF. Clin Pharmacol Ther (1978);22:395-401191 Rane A, Villeneuve J, Stone W, Nies A, Branch R. Clin Pharmac Ther (1978);24:199-207192 Smith DE, Brater DL, Lin ET, Benet LZ. J Pharmacokinet Biopharm (1978);193 Branch RA, Roberts CJC, Homeida H, Levine D. Br J Clin Pharmacol (1977);4:121-127194 Cutler RE, Blair AD. Clin Pharmacokin (1979);4;279-296195 Oliver J, MacDowell HJ. Clin Invest (1961),*46:1093196 Dormady EH, Offer J, Woodhouse HA. J Path Bact (1983),*109:195197 Loi CH, Vestel RE. Pharmacol Ther (1988) ,*36:131-149198 Odlind BG, Beerman B. Br Hed J (1980);2:1577199 Greither A, Goldman S, Edelen JS, Cohn K, Benet LZ. Am J Cardiol (1976);37:139200 Brater DC, Seiwell R, Anderson S, Burdette A et al. Kidney Int (1982);22:171-176201 Tilstone WJ, Fine A. Clin Pharmacol Ther (1978),*23:644202 Fine A, Henderson IS, Horgan DR, Tilstone WJ. Br Hed J (1977),*2:1061-1062203 Homeida H, Roberts CJC, Branch R. Clin Pharmacol & Ther (1977);22(4):402-409204 Somogyi A, Hewson D, Huirhead H, Bochner F. Br J Clin Pharmacol (1990);29:1-8205 Kelly HR, Cutler R, Forrey A, Kirapel B. Clin Pharmacol Ther (1973);15(2):178-186206 Andreasen F, Hikkelsen E. Eur J Clin Pharmacol (1977);12:15-22207 Chaudhry A, Bing R, Castleden C, Swales J, Napier C. Eur J Clin Pharmacol (1984),*27:303-6208 Vargas E, Lye H. Exp Gerontol (1982),*17:445-452209 Levy G. J Pharm Sci (1967);56(7):928-9210 Ring-Larsen H, Henriksen J, Wilken C, Clausen J et al. Br Hed J (1986),*292:1351-3211 Bock K, Wiltfang J, Blume R, Ullrich D, Bircher J. Eur J Clin Pharmacol (1987),*31:677-683212 Prescott LF, Speirs GC, Critchley AJH et al. Eur J Clin Pharmacol (1989);36: 291-297

213214215216217218219220
221222223224225226227228229230231232233234235236237238239240241242243
233
Shively CA, Vesell ES. Clin Pharnacol Ther (1975);18(4):413-424Forrest JAH, Cleients JA, Prescott LF. Clin Pharnacokinet (1982);7:93-107Pantuck EJ, Pantuck CB, Anderson KE et al. Clin Pharnacol Ther (1984);35(2):161-9Boel J, Andersen L, Rasnussen B, Hansen S, Dossing H. Clin Pharnacol Ther (1984);36:121-6Dossing M. Clin Pharnacokin (1985);10:426-431Arends BG, Bohn ROB, Kenenade JE, Rahn KH, Baak HA. Eur J Clin Pharnacol (1986);31:375-7Nies AS, Shand DG, Wilkinson GR. Clin Pharnacokin (1976);1:135-155Wynne HA, Cope LH, Janes OFW, Rawlins HD, Woodhouse KW. Age Ageing (1989);18:415-418Williams FH, Wynne HA, Woodhouse KW, Rawlins HD. Age Ageing (1989);18:39-42Wynne H, Hutch E, Janes 0, Wright P, Rawlins H, Woodhouse K. Age Ageing (1988);17:401-5Tinnis AD. Postgrad Hed J (1989);65:715-717Carlson KJ, Lee CS, Goroll AH, Leahy H, Johnson RA. J Chron Dis (1985);38(9):733-9 Nolan L, Kenny R, O'Halley K. Br J Clin Pharnacol (1989);27:367-370 Weedle PB. Postgrad Hed J (1988);64:292-296 Hacarthur C. Postgrad Hed J (1990);66:940-942Goldstein RL, Stanton BA, Lipson HJ. Arch Phys Hed Rehab (1986);67:34-37 Dali JL. Br Hed J (1970);2:705-706 Pedoe HDT. Lancet (1978);2:931-933Jusko WG, Weintraub H. Clin Pharnacol Ther (1974);18:449-454 Ingelfinger JA, Goldnan P. N Engl J Hed (1976);294(16):867-870 Brodie HJ, Feely J. Br J Hed (1988);296:1110-1113Huffann DH, Crow JW, Pentikainen P, Azarnoff DL. An Heart J (1976);91(1):28-34Dobbs R, Royston J, O'Neill C, Deshnukh A et al. Eur J Clin Pharnacol (1987);32:611-4Falch D. Acta Hed Scand (1973) ,*194:251-256Roberts HA, Caird FI. Age Ageing (1976);5:214-223Doherty JE, Perkins WH. Ann Int Hed (1966);64:489Croxson HS, Ibbertson HK. Br Hed J (1975),*3:566-570Okada R, Hager W, Graves P, Hayersohn H, Perrier D, Harcus F. Circul (1978),*58:1196-1203 Dobbs SH, Parkes J, Rodgers EH. Br J Clin Pharnacol (1974),*3:940-941 Hooradian AD, Wynn EH. Arch Int Hed (1987),*147:650-653 Jelliffe RW, Brooker G. An J Hed (1974);5:63-68

244245246247248249250251252253254255256257258259
234
Paulson HF, Welling PG. J Clin Pharmacol (1976);2:660-665Dobbs SM, Hawer G, Rodgers E, Woodcock B, Lucas S. Br J Clin Pharmacol (1976);3:231-7 Nicholson PW, Dobbs S, McGill A, Rodgers E, Slater E. Br Heart J (1978);40:177-183 Wagner J, Yates J, Willis P, Sakmar E, Stoll R. Clin Pharmacol Ther (1973);15(3):291-301 Simonson W, Stennett DJ. Am J Hosp Pharm (1978);35:943-947 Jogestrand T, Sundqvist K. Clin Physiol (1981);1:99-104 Taubert K, Shapiro W. Am Heart J (1975);89:79-86Felding P, Tryding N, Petersen P, Border M. Scand J Clin Lab Invest (1980) ,*40:615-621Jogestrand T, Norlander R. Br J Clin Pharmacol (1983);15:55-58Baylis EM, Hall MS, Lewis G, Marks V. Br J Med (1972);1:338-341Koup J, Greenblatt D, Jusko W, Koch-Weser J. J Pharnacokin Biopharm (1975);3:181-192Sumner DJ, Russell AJ. Br J Clin Pharmacol (1976);3:221-229Marcus F, Petersen A, Salel A, Kapadia G. J Pharmacol Exp Ther (1966),*152:372-382Iisalo E, Ruikka I. Acta Med Scand (1974),*196:59-63Morris DC, Hurst JW. Curr Probl Cardiol (1980);5:1-51Williamson J, Chopin JM. Age Ageing (1980);9:73-80

235
A P P E N D I C E S

236
Appendix A1
DEFINITIONS
FRAIL Unable to perform activities of daily living. Help required to live alone, or else live in Part III, residential or nursing home, or hospital. Unable to walk far unaided, and rarely able to go outside. Usually on regular medication, often for a number of conditions, which adversely affect quality of life.
FIT Able to perform activities of daily living unaided& safely live independently without support. May be on regular medication, but the condition for which it is prescribed is well controlled, and does not affect quality of life.
VERY Able to perform all activities of daily livingFIT unaided & safely live independently without support.
No abnormal pathology detectable on clinical examination & laboratory investigation. Occasional over-the-counter preparations may be taken, but no regular prescribed medication.This definition is used in the CCr study only.

237
Appendix A2
MOBILITY SCORE
1 - Fully Mobile
2 - LimitedMobility
3 - RestrictedMobility
4 - Chairbound
5 - Bedbound
Free walking both inside & outside the home for a good distance without effort, possible limitations only on longer distances.
Free walking within the home or ward but limited mobility outdoors. At times housebound. Able to manage stairs.
Sits for most of the day. Only able to walk short distances to the toilet & rooms on the same level. Unable to manage stairs.
Able to sit upright in chair or wheelchair. Requires help to transfer, unable to walk more than a few steps.
Restricted to bed for the majority of time & unable to weight bear. May leave bed for short periods eg. toileting, but unable to sit upright. Requires help with feeding & needs to be turned in bed.

238
Appendix B1
Conl A Cminl Digoxin • J
Coat-A-Count® DIGOXIN
is a solid-phase ,25I radioiinm unoassay designed for the quantitative m easurem ent of digoxin in serum . It is intended strictly for in vitro diagnostic use as an aid in m onitoring the therapeutic adm in istration of this cardioglycoside.
Catalog N um bers: TK D I1 (100 tubes) T K D I2 (200 tubes) T K D I5 (500 tubes) T K D IX (1000 tubes).
The 100-tube kit contains not more than 3 m icrocuries (111 kilobecquerels) of radioactive IZ5!-digoxin; the 200-tubc ^ kit contains not m ore than 6 m icrocuries (222 kilobecquerels); the 500-tube kit contains not m ore th an 15
m icrocuries (555 kilobecquerels), and the 1000-tube kit contains not m ore than 30 m icrocuries (1110kilobecquerels).
In t r o d u c t io nThe Coat-A-Count procedure is a solid-phase radioim m unoassay, w herein I25I-labeled digoxin com petes for a fixed tim e w ith digoxin in the patient sam ple for antibody sites. The antibody being im m obilized to the wall of a polypropylene tube, decanting the supernatant suffices to term inate the com petition and to isolate the antibody-bound fraction of the radiolabeled digoxin. C ounting the tube in a gamm a counter then yields a num ber, w hich converts by way of a calibration curve to a m easure of the digoxin present in the patient sample.
P ro c e d u re There is only one reagent to dispense, and a single one-hour incubation. All com ponents aresupplied ready to use. No centrifuge is requ ired . Sam ple and tracer additions can be handled sim ultaneously, if desired, w ith the help of an autom atic pipetter-diluter. The sim plicity of the Coat-A-Count p rocedure recom m ends it for high-volume testing.
S e p a ra t io n The coated-tube methodology offers significant advantages in reliability, as well as speed andconvenience, since the tube :■ can be vigorously decanted, w ithout loss of antibody-bound material. This results in a clean separation of bound from free, w ith negligible nonspecific binding.
D a ta R e d u c tio n Conventional RIA techniques of calculation and quality control a re applicable. The assay has been optim ized for linearity in a logit-log representation th roughout the range of its calibrators. Moreover, the computation can be sim plified by om itting the correction for nonspecific binding, w ithout com prom ising results or quality control.
C a lib ra t io n The kit is equipped w ith hum an serum -based standards having digoxin values ranging from0.5 to 8 ng/ml (0.6 -10.2 nmol/l). T he calibrators are supplied in liquid form, ready to use.
C o u n ts The tracer has a high specific activity, w ith total counts in th e order of 50,000 cpm at iodination.M axim um binding is approximately 50%, m inim izing the counting tim e requ ired for adequate precision .
A ccu racy Extensive recovery experim ents have show n that the assay is accurate over a broad spectrumof digoxin values. Its accuracy has been fu rth er verified in patient com parison studies against a well-established, double-antibody digoxin radioim m unoassay.
S p ec ific ity The an tiserum is highly specific for digoxin, w ith very low crossreactiv ity to other com poundsthat might be present in patient sam ples. Neither protein, lipem ia, bilirubin nor hemolysis has any effect on the assay.
S e n s i t iv i ty The procedure can detect as little as 0.1 ng/ml. CVs are low and uniform , and no end of runeffect has been observed in assays involving as m any as 300 tubes.
J

2 • Coat-A-Count Digoxin
M a t e r ia ls S u p p lie d — I n i t i a l P r e p a r a t io n■ Precautions: Before opening the kit, review the paragraphs on safety, printed on the inside front cover as they relate to the safe handling and disposal of reagents containing radioactivity, human serum-derived material and sodium azide.
CatalogNumber
Coated Tubes Supplied
Vials of Tracer Supplied
Sets of Calibrators Supplied
TKDIITKD12TKDI5TKDIX
100200500
1000
125
10
1 DIGOXIN ANTIBODY-COATED TUBES TDI1100 (200,* 500,t 1 0 0 0 polypropylene tubes coated w ith antibodies to digoxin and packaged in zip-lock bags. Store refrigerated and protected from m oisture, carefully resealing the bags after opening: stable at 2 -8 ° C for at least one year from the date of m anufacture. Color: orange.
2 I125I| DIGOXIN TDI2O ne vial (two vials,* five v ia ls.t ten v ia lst) of iodinated digoxin supplied in liquid form, ready to use. Each vial conta ins 105 m l. Store refrigerated: stable at 2 -8 °C for at least 30 days after opening, or until the expiration date m arked on the vial.
3 DIGOXIN CALIBRATORS DIC3-8O ne set (two se ts .t th ree se tsf) of six vials, labeled A through F, of digoxin calibrators supplied in liquid form, ready to use. The zero calibrator A contains 5 ml, and each of the rem aining calibrators B through F contains 2 m l. Store refrigerated: stable at 2 -8 °C for at least 30 days after reconstitution.
T he calibrators contain respectively 0, 0.5, 1, 2, 4 and 8 nanogram s of digoxin per m illiliter (ng/ml) in processed hu m an serum ; equivalently: 0, 0.6, 13, 2.6, 5.1 and 10.2 nanomoles per liter (nmol/1). Interm ediate calibration poin ts can be obtained by m ixing the calibrators in suitable proportions. The life of the calibrators may be extended by freezing. Aliquot if necessary to avoid repeated freezing and thawing.
‘ Pertains to the 200-tube TKDI2 kit. tP e rta in s to the 500-tube TKDI5 kit. tP e rta in s to the 1000-tube TKDIX kit
M a t e r ia ls R e q u ire d B u t N o t P ro v id e d• G am m a c o u n te r-co m p a tib le w ith standard 12 x 75m m tubes• Vortex m ixer
Radioimmunoassay:• Plain 12x 7 5 m m polypropylene tu b e s - fo r use as NSB tubes, available from DPC• M icropipets: 100 fi\ and 1000 fi\
For the 1.0 ml reagent addition, a reliable repeating dispenser |Nichiryo or equivalent) is also suitable With the help of an automatic pipetter-diluter, sample and reagent additions may be handled simultaneously.
• Incubation ba th capable of m aintaining 3 7 °C -n e ith e r an oven nor a heat block is suitable.• Foam decan ting rack -av ailab le from DPC
A tri-level, hum an serum -based im m unoassay control, containing digoxin as one of over 25 assayed constituents, is available from DPC (catalog num ber: CON6).

239
Coat-A-Count Digoxin • ^
S p e c im e n C o lle c t io nT he patient need not be fasting, and no special preparations are necessary. C ollect blood by ven ipuncture into plain tubes, an d separate the se ru m from the cells. The tim e of collection should be noted. T he procedure calls for 100/d of se ru m per tube.
The sam ples m ay be stored under refrigeration for seven days, or for up to tw o m onths frozen at -2 0 °C . Before assay, allow the sam ples to com e to room tem perature and mix by gentle sw irling or inversion. Aliquot, if necessary, to avoid repeated thaw ing and freezing. Do not attem pt to thaw frozen specim ens by heating them in a w ater bath .
R a d io im m u n o a s s a y P ro c e d u reAll components must be at normal room temperature before use.
1 P la in T \ibes: Label four p lain (uncoated) 12x75m m polypropylene tu b es T (total counts) and NSB (nonspecific binding) in duplicate.
Because nonspecific binding in the Coat-A-Count procedure is characteristically low, the NSB tubes may be safely omitted without compromising accuracy or quality control.
C oated T\ibes: Label twelve Digoxin Antibody-Coated Tubes A (m axim um binding) and B through F in duplicate. Label additional antibody-coated tubes, also in duplicate, for controls and patient sam ples.
Calibrators_____________ ng/ml________________nmol/1A(MB) 0 0B 0.5 0.6C 1 1.3D 2 2.6E 4 5.1F 8 10.2
2 Pipet 1 0 0 /i l of the zero calibrator A into the NSB and A tubes, and! 1 0 0 /ll of each remaining calibrator,control and patient sample into the tubes prepared. P ip et d irec tly to th e b o tto m .
3 Add 1.0 ml of | U5I] Digoxin to every tube. Vortex.Laboratories equipped with a reliable pipetter-diluter may handle steps 2 and1 3 simultaneously. No more than ten minutes should elapse during the dispensing of the tracer. Set the T tubes aside for counting (at step 6); they require no further processing.
4 Incubate for 60 m in u te s a t 37°C.Use a waterbath; neither an oven nor a heat block is suitable. The incubation may be shortened to as little as 30 minutes (at 37°C), at the expense of slightly less binding.
3 Decant thoroughly.Removing all visible moisture will greatly enhance precision. Using a foam decanting rack, decant the contents of all tubes (except the T tubes) and allow them to drain for 2 or 3 minutes. Then strike the tubes sharply on absorbent paper to shake off all residual droplets.
0 Count for 1 minute in a gamma counter.

• Coat-A-Count Digoxin
A lternate "STAT" ProcedureW hen circum stances requ ire fast tu rnaround , the following "stat" p rocedure may be used . The assay does not reach equilibrium under the conditions described below, and thus the tim ing must be m eticulously controlled. The "stat" p rocedure should be relied on only for rough answ ers and only for one or tw o patient sam ples (plus controls). Careful selection of controls w ith digoxin concentrations above and below the region of interest will enhance the reliability of the results.
1 C o a le d T u b es: Label six Digoxin Antibody-Coated Tubes A (m axim um binding), B and E. Label additionaltubes in duplicate for the patient sample(s) and controls.
Calibrator______________ ng/nij________________nmol/l_______A|M15] 0 0B 0.5 0.6E 4 5.1
2 Pipet 1 0 0 /d of the calibrators, patient sample(s) and controls into the tu b es p repared . P ipe t d irec tly to th e b o tto m .
3 Add 1.0 ml of Buffered (1251) Digoxin to every tube. Vortex.
4, Incubate for 15 m inu tes at 50°CUse a waterbath: neither an oven nor a heat block is suitable.
3 D ecant thoroughly, and count for 1 m inute in a gam m a counter.
C a lc u la t io n o f R e s u ltsTo calculate digoxin concentrations from a logit-log representation of the calibration curve, first calculate for each p a ir of tu b es the average NSB-corrected counts per m inute:
Net C oun ts = Average CPM m inus Average NSB CPM
Then determ ine the binding of each pair of tu b es as a percent of m axim um binding (MB), w ith the NSB-corrected counts of the A tubes taken as 100%:
Percent B ound = Net C o u n ts x jqqN et M B C ounts
The calculation can be simplified by omitting the correction for nonspecific binding; sam ples w ith in range of the calibrators yield v irtua lly the sam e results w hen Percent Bound is calculated d irectly from Average CPM.
Using the logit-log graph paper provided w ith the kit, plot Percent Bound on the vertical axis against C oncentration on the horizontal axis for each of the calibrators B through F, and d raw a straight line approxim ating the pa th of these five points. Digoxin concentrations for the unknow ns m ay then be estim ated from the line by interpolation. Although o ther approaches are acceptable, data reduction by the logit-log m ethod just described has.certain advantages in this co n tex t-fo r example, in allowing easier recognition of deviant calibration points - since the Coat-A-Count Digoxin procedure has been optim ized for linearity in that representation.

240
Ctuil A ( 'm in i Digo.xin • C
E x am p le: The figures tabulated below are for illustration only and should not be used to calculate results from another assay.
IVi beDuplicate
CPMAverage
CPMNet
CPMF’ercenlBound
Digoxinng/ml
T48,85148,991 48,921
NSB184186 185 0
A|MB)21,75121.919 21,835 21.650 100.0% 0
B17,47517,455 17.465 17,280 79.8% 0.5
C15,10215,038 15,070 14,885 68.8% 1.0
D10,90310,861 10,882 10,697 49.4% 2.0
E7,1856,895 7,040 6,855 31.7% 4.0
F4,3544,464 4,409 4,224 19.5% 8.0
Unknowns:
XI15,61016,076 15,843 15,658 72.3% 0.8
X212,28612,202 12,244 12,059 55.7% 1.5
X37,5577,793 7,675 7,490 34.6% 3.6
Q u a lity C on tro l P aram eters: T = 48,921 cpm . %NSB = 0.4%. %MB = 44.3% .20% In te rcep t = 7.5 ng/m l. 50% In tercep t = 2.0 ng/m l. 80% In tercep t = 0.5 ng/m l.
Q u a l i t y C o n tr o lR ecord K eeping: It is good laboratory practice to record for each assay tthe lot num bers and reconstitution datesof the com ponents used .
S a m p le H an d lin g: The instructions for handling and storing patient sam files and com ponents should be carefully observed. Dilute high patient se ru m sam ples w ith the kit's zero calibrator p rio r to assay. All sam ples, including the calibrators and controls, should be assayed in duplicate. It is good laboratory p ractice to use a disposable-tip m icropipet, changing the tip betw een sam ples, in order to avoid carry-over contam ination. Pairs of control tubes m ay be spaced throughout the assay to help verify the absence of significant drift. Inspect the results for agreem ent w ith in tube pairs, and take care to avoid carry-over from sam ple to sam ple.
Controls: Controls or serum pools w ith low, intermediate and high digoxin concentrations should routinely be assayed as unknow ns, and the results charted from day to day as described in J.O. W estgard et al, "A m ulti-rule chart for quality control" Clinical Chemistry 2 7 (1981) 493-501. See also Scandinavian Journal o f Clinical and Laboratory In vestigation 44 (1984) Suppl 171 and 172. Repeat sam ples are a valuable additional tool for monitoring interassay precision.
D ata R ed u ction : It is good practice to construct a graph of the calibration curve as a visual check on the appropriateness of the transform ation used , even w here the calculation of results iis handled by computer. See fu rther S.E. Davis et al, "R adioim m unoassay data processing w ith a sm all program m able calculator" Journal o f Imm unoassay I (1980) 15-25; and R.A. Dudley et al, "Guidelines for im m unoassay data reduction" Clinical Chemistry 31 (1985) 1264-71.
Q. C. P aram eters: We recom m end keeping track of these perform ance m easures:• T = Total C ounts (as counts per minute)• %NSB = 100 x (Average NSB C ounts + Total Counts)• %MB = 100 x ((Average MB C ounts minus Average NSB Counts) * Toltal Counts)And the 20, 50 and 80 percent "intercepts,” w here• 20% = Digoxin Concentration at 20 Percent Bound, etc.

^ • Coat-A-Count Digoxin
P e r fo r m a n c e C h a ra c te r is t ic sIn the sections below, digoxin results a re expressed as nanogram s of digoxin per milliliter (ng/ml). To convert to nanomoles per liter (nmol/1), m ultiply by 1.281:
ng/m l x 1.281 — nmol/1
SensitivityForty zero calibrator (m axim um binding) tubes were processed in a single assay, along w ith a set of non-zero calibrators and controls. M ean and standard deviation w ere calculated for the counts-per-m inute of the forty zero tubes. Then, from a standard curve prepared by the logit-log technique and using th is m ean as th e zero point, the apparent digoxin concentration w as determ ined at increasing standard deviations from the m ean.
Mean + SD of Apparent Approximate40 MB tubes Mean minus % B/B0 Concentration Sensitivity
2SD 97.1% 0.0418,995 ± 268 3SD 95.7% 0.06 0.1 ng/ml
______________________________ 4SD___________ 94.3%___________ 0 0 8 ________________ ■
The detection limit (or "least detectable dose") of an assay is com m only defined as the apparent concentration two standard deviations below the counts at m axim um binding or else as the concentration at 95% B/B0. By the more conservative definition, the Coat-A-Count Digoxin assay has a detection limit of approxim ately 0.1 ng/ml.
KineticsTo determ ine the effect of em ploying incubation tim es other than 1 hour at 37°C or 15 m inutes at 50°C, as specified on pages 3 and 4, respectively, assays w ere set up in parallel, using incubations of 30, 60, 90 and 120 m inutes at 37°C and 10, 15 and 20 m inutes at 50°C. Various quality control perform ance m easu res were m onitored, including: nonspecific binding and m axim um binding (percent of total counts); the correlation coefficient (rho) of the logit-log line; the assay CV, based on the b inding of the replicates; the 20, 50 and 80 percent intercepts (ng/ml); and the binding of the calibrators (% B/B0). In addition, several sam ples w ere assayed as u n k n o w n s in each of the assays.
Parameter 30 min 37° 6 0 m in 37° 90 min 37° 120 min 37° 10 min 50° 15 m in 50° 20 min 50°Total Counts 46,734 cpm 43 ,046 cpm 44,256 cpm 42,818 cpm 44,001 cpm 43,715 cpm 42,868 cpm% NSB 1.3% 1.2% 1.2% 0.7% 0.5% 0.5% 0.4%% MB 27% 38% 47% 50% 22% 28% 28%rho -0.997 -0 .9 9 7 - 0.999 - 0.998 -0 .996 - 0.998 - 0.995Assay CV 1.7% 1.7% 1.8% 1.8% 2.9% 1.9% 1.8%Intercep ts:
20% B/B0 8.8 ng/ml 7.3 ng/ml 6.4 ng/ml 6.1 ng/ml 11.4 ng/ml 10.4 ng/ml 10.0 ng/ml50% B/B0 2 4 2.0 1.8 1.6 2.7 2.3 2.380% B/B0 0.7 0.6 0.5 0.5 0.6 0.5 0.6
C alib rators:B —0.5 ng/ml 84% 82% 81% 78% 83% 80% 79%C - l 0 73% 70% 66% 63% 72% 70% 72%D —2.0 57% 51% 48% 46% 58% 54% 55%E - 4 .0 36% 32% 29% 28% 41% 38% 37%F -8 .0 22% 19% 17% 16% 25% 24% 23%
Sam ples:1 0.6 ng/ml 0 .6 ng/ml 0.4 ng/ml 0.5 ng/ml 0.5 ng/ml 0.5 ng/ml 0.5 ng/ml2 0.9 0.8 0.8 0.9 0.9 0.8 0.83 0.9 1.0 1.0 0.9 0.8 1.0 0.74 1.8 1.7 1.7 1.6 1.9 1.8 1.65 1.8 1.9 2.0 1.8 1.7 1.8 1.76 1.8 2.0 1.9 1.9 1.6 1.8 1.87 2 5 2.7 2.7 2.5 2.3 2.4 2.58 2.7 2.9 3.1 2.9 2.5 2.6 2.79 3.1 3.3 3.2 3.3 2.8 3.1 3.010 3.6 4.0 3.8 3.5 3.6 3.6 3.9Mean: 2.0 ng/ml 2.1 ng/ml 2.1 ng/ml 2.0 ng/ml 1.9 ng/ml 1.9 ng/ml 1.9 ng/ml
Based on these and sim ilar results, one hour at 37°C was chosen as the Basic Procedure, and fifteen m inutes at 50°C was chosen as the "STAT" Procedure.

241
CoiU-A-Counl Diqoxin 7PrecisionThe reliability of D iagnostic P roducts Corporation's Coat-A-Count Digoxin p rocedure was assessed by exam ining its reproducibility on sam ples selected to represent a range of digoxin levels.
In traassay: Statistics w ere calculated for each of three sam ples from the resu lts of 20 p a irs of tubes in a single assay.
Sample Mean0.72.55.9
SD0.050.100.20
CV
7.1% 4 0% 3.4%
Interassay: Statistics were calculated for each of th ree sam ples from the results of pairs of tubes in 10 differentassays.
Sample Mean0.72.15.5
SO0.0560.120.22
CV8.0%5.7%4.0%
DriftTo determ ine w hether there is any position effect due to delays in the addition of reagents or decanting, pairs of tubes were spaced throughout a long assay for each of th ree sam ples. The results show no significant position (or "end of run") effect even in assays of as m any as 300 tubes.
Sample1st Pair
of TubesTubes
Intervening2nd Pair of Tubes
TubesIntervening
0 8 2.5 5.4
138138138
0.92.45.5
170170170
3rd Pair of Tubes
0.92.55.3
Effect of LipemiaThe kit's high calibrator (8 ng/ml) was serially diluted w ith a lipemic serum pool. T h is causes the degree of lipem ia to increase as the digoxin concentration (due to the calibrator) decreases. These d ilutions w ere assayed along w ith the unspiked lipem ic pool. The results show good recoveries even in the p resence of severe lipemia.
Dilution of 8 ng/ml
OObserved
EExpected
% O/E Recovery
unspiked 0.216 in 32 4.3 4 1 105%8 in 32 2.0 2.2 91%4 in 32 1.0 1.2 83%2 in 32 0.7 0.7 100%1 in 32 0.4 0.4 100%
Protein EffectTo sim ulate various protein concentrations, experim ents w ere perform ed in which 6.0 ml aliquots of a hum an serum pool w ere freeze-dried and then reconstituted w ith various volum es of water. Each reconstitu ted aliquot w as then assayed by the Coat-A-Count Digoxin procedure. Note that aliquots reconstituted w ith half the original volum e rep re sent an extrem ely high protein concentration, in the order of 14 gm /dl. T hese results indicate that even w ide variations in protein have v irtually no effect on the Coat-A-Count Digoxin assay.
Protein O E % O/EExperiment Reconstitution Concentration Observed Expected Recovery
1 3.0 ml 2.00 x - 14.0 gm/dl 4.6 4.6 100%6.0 l.OOx - 7.0 2.3 — (100%)
12.0 0.50 x - 3.5 1.1 1.2 92%2 3.0 ml 2.00 x -1 4 .0 gm/dl 11.3 12.0 94%
6.0 1 00 x - 7.0 6 0 — (100%)12.0 0.50x - 3.5 2.9 3.0 100%
3 3 0 ml 2.00 x - 14 0 gm/dl 4.0 4.0 100%6.0 l.OOx - 7.0 2.0 — (100%)
12.0 0.50 x - 3.5 1.0 1.0 100%4 3.0 ml 2.00 x - 14 0 gm/dl 11.0 11.2 98%
6.0 l.OOx - 7 0 5.6 -*> (100%)12.0 0.50 x - 3.5 3.0 2.8 107%

• Coat-A-Count Digoxin
SpecificityT he digoxin a n tise ru m is highly specific for digoxin, w ith an extremely low crossreactivity to o ther naturally occurring steroids or therapeu tic d rugs that m ay be present in patient samples.
ng/ml ApparentCompound Added Concentration- ngdnl CrnssrenctivityDeslanoside C 10 5.4 0.54
5 2.6 0.521 0.5 0.50
Lanatoside 100 33.3 0.3310 3.6 0.36
1 0.5 0.50
Digitoxin 1,000 3.7 0.0037500 2.1 0.0042
Dihydrodigoxin 5 0.06 0.0121 0 —
Cortisol 100,000 0.6 0.0000064,000 0.05 0.000013
From the table it is clear that the Coat-A-Count Digoxin procedure is not suitable for use on patients receiving either D eslanoside C or Lanatoside, tw o com pounds w ith m olecular struc tu res sim ilar to that of digoxin.
Effect of B ilirubin and HemolysisT'o sim ulate severe icterus, th ree serum sam ples were spiked with 20 mg/dl of bilirubin. In another experim ent, to sim ulate m ild, m oderate and severe hemolysis, th ree serum sam ples w ere spiked w ith 10, 15 and 30 /d /m l of packed red blood cells. All sam ples were assayed both spiked and unspiked by the Coat-A-Count Digoxin procedure with the following results.
Bilirubin Packed Red Blood Cells /d/mlSample Unspiked 20 mg/dl Sample Unspikcd 10________ 15________ 30
1 0.9 1.2 1 0.9 0.9 0.9 1.02 2.5 2.5 2 2 5 2.5 2.5 2.63 6.1 5 8 3 6.1 5.9 5.7 5.6
T he results show that neither severe icterus (bilirubin up to 20 mg/dl) nor gross hemolysis has any effect on the Coat-A- Count Digoxin p rocedure .
M atrix EffectsThe Coat-A-Count Digoxin calibrators are hum an serum based. To determ ine the effect on the assay of preparing the calibrators in o ther m atrix m aterials, several digoxin free m aterials were assayed by the Coat-A-Count procedure. Note that all resu lts a re below the detection lim it of the assay.
ApparentDigoxin
Matrix % B/B0 ConcentrationNormal Human Serum
Charcoal-Absorbed, #393 101.0% 0.00 ng/mlNormal Human Serum
Charcoal-Absorbed, #059 97.2% 0.04 ng/mlNormal Human Plasma
Heparinized, Charcoal Absorbed 104.0% _5% Bovine Serum Albumin 100.0% 0.00 ng/ml10% Human .Serum Albumin
Charcoal-Absorbed 96.5% 0.07 ng/ml

242
Coat-A-Count Digoxin • 0
Effect of AnticoagulantsTo determ ine w hether anticoagulants interfere w ith the assay, blood was collected from six norm al volunteers into plain, heparin ized and EDTA vacutainer tubes. All sam ples were assayed by the Coat-A-Count Digoxin procedure, w ith the following results.
Sample Serum Heparin EDTA1 5.9 5.4 5.42 4.6 4.9 5.13 5.7 4.1 5.74 5.7 5.1 5.35 5.6 5.0 5.86 5.1 5.3 5.4
Average: 5.4 5.0 5.5
O n the basis of these results it is recom m ended that sam ples be collected as se rum .
ParallelismSix patient serum sam ples w ere assayed both undiluted and diluted w ith the kit's zero calibrator. The observed and expected values are presented below in ng/ml.
ample DilutionO E % O/E
Observed Expected Recovery Sample DilutionO E % O/E
Observed Expected Recovery1 8 in 8 (undiluted) 6.1 4 8 in 8 (undiluted) 6.9
4 in 8 2.9 3.0 97% 4 in 8 3.6 3.5 103%2 in 8 1.6 1.5 107% 2 in 8 1.8 1.7 106%1 in 8 0.9 0.8 113% 1 in 8 0.9 0.9 100%
2 8 in 8 (undiluted) 5 8 5 8 in 8 (undiluted) 6.74 in 8 2.8 2.9 97% 4 in 8 3.4 3.4 100%2 in 8 1.4 1.5 93% 2 in 8 1.8 1.7 106%1 in 8 0 8 0.7 114% 1 in 8 0.9 0.8 113%
3 8 in 8 (undiluted) 6.8 6 8 in 8 (undiluted) 7.24 in 8 3.0 3.4 88% 4 in 8 3.6 3.6 100%2 in 8 1.5 1.7 88% 2 in 8 1.8 1.8 100%1 in 8 0.8 0.9 89% 1 in 8 1.0 0.9 111%
Curve D isplacem entFour sam ples w ere each assayed by the Coat-A-Count Digoxin procedure in assays w hich included one-to-one d ilutions of the sam ple w ith each of the calibrators A through F.
SampleO
ObservedE
Expected% O/E
Recovery SampleO
ObservedE
Expected% O/E
Recovery1 unspiked 0.0 3 unspiked 0.81 + A (0) 0.0 0.0 100% 3 4 A (0) 0.5 0.4 125%1 + B (0.5) 0.3 0.3 100% 3 4 B (0.5) 0.7 0.7 100%I + C (1) 0.5 0.5 100% 3 4 C (1) 1.0 0.9 111%1 + D (2) 1.0 1.0 100% 3 4 D (2) 1.4 1.4 100%/ + E (4) 2.0 2.0 100% 3 4 E (4) 2.5 2.4 104%/ 4 F (8) 3.8 4.0 95% 3 4 F (8) 4.3 4.4 98%2 unspiked 0.4 4 unspiked 2.82 4 A (0) 0 2 0.2 100% 4 4 A (0) 1.3 1.4 93%2 4 B (0.5) 0.4 0.5 80% 4 4 B (0.5) 1.7 1.7 100%2 4 C (1) 0.8 0.7 114% 4 + C (1) 2.0 1.9 105%2 4 D (2) 1.2 1.2 100% 4 4 D (2) 2.4 2.4 100%2 4 E (4) 2.1 2.2 95% 4 4 E (4) 3.4 3.4 100%2 4 F (8) 4.2 4.2 100% 4 4 F (8) 5.2 5.4 96%

• Coat-A-Count Digoxin
C om parison w ith a Reference M ethodW ith DPC's well-established Double Antibody Digoxin radioim m unoassay serving as the reference m ethod, 100 patient sam ples w ere sim ultaneously assayed by the solid-phase Coat-A-Count kit and by the Double Antibody kit. Linear regression analysis of the results yielded the following relationship.
(Coat-A-Count) » 0.97 (D ouble A n tibody) - 0.05 ng/mlr = 0.988 SEE = 0.16 n = 100
C l in ic a l A p p lic a t io n sIm m unoassay has proved itself a particu larly useful aid in determ ining drug overdoses in patients treated w ith cardiac glycosides. T he technique is also useful (a) in clarifying situations w here a patien t’s sym ptom s m ight be due either to in trinsic heart d isease or to digitalis intoxication; (b) w here there is doubt concerning the type of digitalis preparation th e patient is ta k in g - in th is case, digitoxin im m unoassay is also necessary ; (c) for m easuring the digoxin ingestion of patients w ith an inadequate history of previous dosage; (d) in docum enting cases of underdigitalization as well as digitalis (digoxin) excess; (e) in m onitoring the toxic response in patients w ith m yocardial d isease associated w ith hypokalem ia, hypom agnesem ia, hypercalcem ia, hypoxia and alkalosis, w hich are particularly sensitive to digitalis; and (f) in preventing overdigitalization, particularly in patients w hose renal function is deteriorating or for w hom an increased digoxin dosage is contem plated.
T he high sensitivity of digoxin im m unoassay is especially necessary in view of the sm all differences and occasional overlap that exist betw een therapeutic and toxic levels of circulating digoxin. (Intoxication is defined in term s of a rrhy thm ias and d istu rbances of cardiac conduction due to the drug's presence.) Sm ith et al, in 1969, reported serum digoxin concentrations of 0.8 - 2.4 ng/ml (1.0 - 3.1 nmol/1) in nontoxic patients, and 2.1 - 8.7 ng/ml (2.7 - 11.1 nmol/1) in toxic patients, based on data taken six hours post-dose in patients w ith norm al renal function.8 M ore recent clinical investigations have confirm ed the association of toxicity w ith serum levels above 2 ng/ml. However, sole reliance on the digoxin concentration for the determ ination of digitalis toxicity is not w arran ted and m ust be supplem ented w ith additional clinical and e lectrocardiographic inform ation.
References
1 V.P. Butler Jr. and J. L indenbaum , Am . J. Med. 58 (1975) 460.
2 J E. Doherty, / Am . Med. Assoc. 239 (1978) 2594.
3 M IL G ault et al, Nephron 17 (1976) 161.
4 D.H. Huffm an et al, Am. Heart J. 91 (1976) 28.
3 N. Rietbrock and R.G. Aiken, Deutsche Med. Wschr.105 (1980) 1622.
0 B. Shapiro et al, Sem. Nucl. Med. 5 (1975) 205.
7 W. Shapiro, CRC Crit. Rev. Clin. Lab. Sci. 9 (1978) 321.
g T.W. Smith et al, New EnglandJ. Med. 281 (1969) 1212.
Q T.W. Sm ith, N ew England J. Med. 288 (1973) 719 and942.
I Q T.W. Sm ith, Am. J. Med. 58 (1975) 470.
1 1 M . Weintraub, Clinical Pharmacokinetics 2 (1977) 205.
1 2 G Wettrell, Acta Paediatr. Scand. 257, Suppl. (1976) 7.
T echnical A ssistance: If questions arise concerning the Coal A-Count Digoxin reagents, or for fu rther advice ontechnique, data reduction, quality control or expected values, please contact DPC and ask for 'T echnical Services."(213) 776-0180(800) 678-6699Telex 4720518Fax (213) 642-0192
B 782IDr̂ CDiagnostic Products Corporation5700 West 96 th Street Protocol Date:Los Angeles, CA 90045 Novem ber 5, 1986

243
Appendix ClINFORMATION SHEET FOR KIDNEY FUNCTION STUDY
Dr. Parker is carrying out a project with St. Marks Road surgery and the Research Institute for Care of the Elderly, St. Martins Hospital, looking at the way in which kidneys function as the body ages. This involves collecting all urine passed during a 24 hour period. Thank you for helping us with this study.These instructions should be followed carefully during the period of the study. If you are not sure what to do at any time, then let someone know - phone the numbers given at the bottom of this sheet.1) When you wake up note the exact time at which you empty
your bladder (pass water) first thing. Throw thisspecimen away, into the toilet.
2) Each and every time you pass a urine specimen afterthis time, for the next 24 hours, please collect it, inthe container provided. ALL urine should be collected, even at night time.
3) Exactly 24 hours later, from the passing your first sample of water (into the toilet) please pass your final specimen, and save it.
4) Dr. Parker will call or telephone during the first day of the study, to check that you are having no problems with the urine collection. He will call to take a small blood sample first thing in the morning when the urine collection is completed.
5) Please record how much meat you eat during the study.6) Dr. Parker will ask you at what time you got up, and
went to bed, on the study day, and how far you walked that day.
Very many thanks.
NAME.......DAY OF STUDY
TIME URINE COLLECTION STARTED
TIME URINE COLLECTION TO FINISH
MEAT EATEN
IN CASE OF QUERY PLEASE DO NOT HESITATE TO CONTACT SUE ELLMERS (STUDY CO-ORDINATOR) AT WORK ON BATH 835866OR AT HOME ON BATH 834963

244
Appendix C2MEASUREMENT OF 24h CREATININE CLEARANCE IN THE ELDERLY
Name : ........................... Study No. : . .Address : ........................... Study Date : . .
............................. Mobility Score :
............................. Height/cm. . . .Tel. No : ...........................
Weight/kg. . . .D.O.B. : ...........................Age : ........................... SA/m2...........G.P. : ...........................Diagnoses : .........................................
Continent or catheterised: Drugs : .................
Start urine colln.......... Date (discard urine)Urine Samples
alcohol
Time
tobacco
meat
1)2)3)4)5)6)7)8) 9)
10)11)12)13)14)
Vol/ml Combined
TOTAL URINE VOL : IN HRS
Comments

245
Appendix C3MEASUREMENT OF SINGLE 24h CCR IN THE ELDERLY
Name : .......................... Study No. : . . . .Address : .......................... Study Date : . . . .
............................. Mobility Score : . .Tel. No : ..........................
D.O.B. : ...............................Age : ...............................: .............................
Height/cm : .......................Weight/kg : .......................
•
Diagnoses : .......................
Continent or catheterised:Drugs : ...........................
BM-StixTime Collection started : . . . . First urine specimen discarded Y/N
PHproteinglucose
Total volume urine ...............smoker
Total collection period .......... hoursTime of blood sample ............
Meat Eaten: R.I.C.E.St. Martins Hospital, Bath. (Tel : 835866)
Comments. . ' .......................
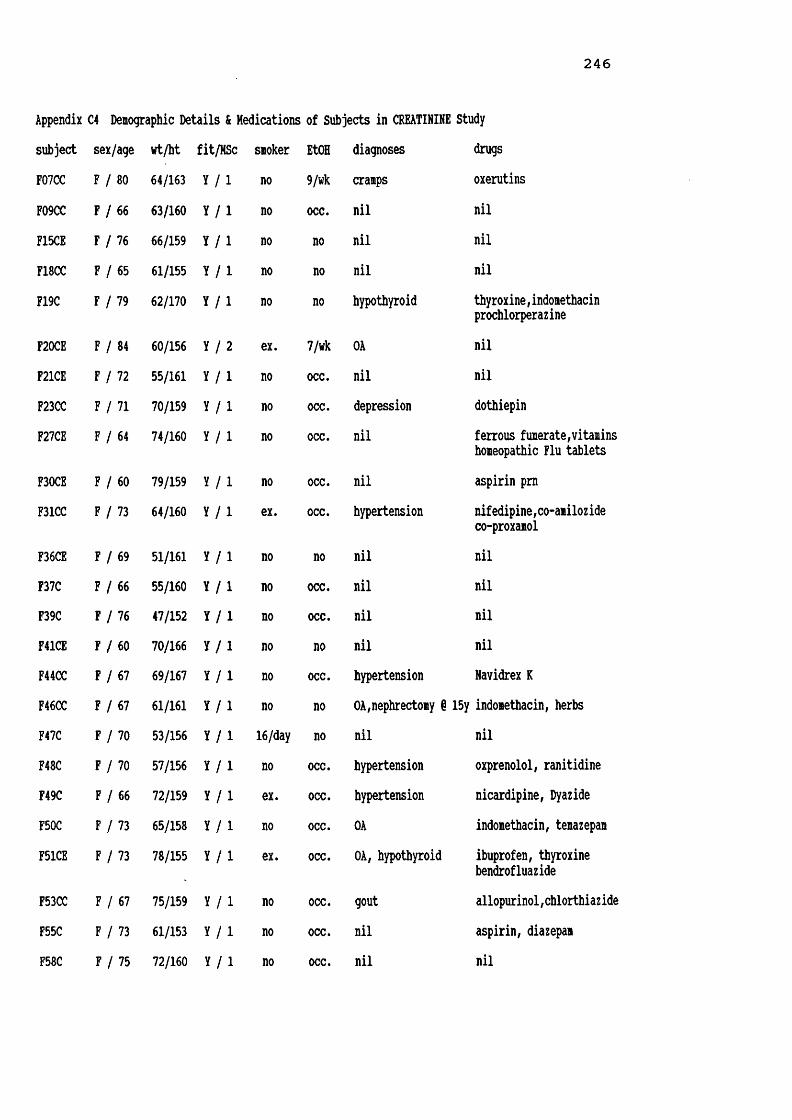
246
Appendix C4 Denographic Details & Medications of Subjects in CREATININE Studysubject sex/age wt/ht fit MSc smoker EtOHF07CC F 80 64/163 Y 1 no 9/wkF09CC F 66 63/160 Y 1 no occ.F15CE F 76 66/159 Y 1 no noF18CC F 65 61/155 Y 1 no noF19C F 79 62/170 Y 1 no no
F20CE F 84 60/156 Y 2 ex. 7/wkF21CE F 72 55/161 Y 1 no occ.F23CC F 71 70/159 Y 1 no occ.F27CE F 64 74/160 Y 1 no occ.
F30CE F 60 79/159 Y 1 no occ.F31CC F 73 64/160 Y 1 ex. occ.
F36CE F 69 51/161 Y 1 no noF37C F 66 55/160 Y 1 no occ.F39C F 76 47/152 Y 1 no occ.F41CE F 60 70/166 Y 1 no noF44CC F 67 69/167 Y 1 no occ.F46CC F 67 61/161 Y 1 no noF47C F 70 53/156 Y 1 16/day noF48C F 70 57/156 Y 1 no occ.F49C F 66 72/159 Y 1 ex. occ.F50C F 73 65/158 Y 1 no occ.F51CE F 73 78/155 Y 1 ex. occ.
F53CC F 67 75/159 Y 1 no occ.F55C F 73 61/153 Y 1 no occ.F58C F 75 72/160 Y 1 no occ.
diagnoses drugscranps oxerutinsnil nilnil nilnil nilhypothyroid thyroxine,indonethacinprochlorperazineOA nilnil nildepression dothiepinnil ferrous funerate,vitaminshomeopathic Flu tabletsnil aspirin p mhypertension nifedipine,co-amilozideco-proxanolnil nilnil nilnil nilnil nilhypertension Navidrex KOA,nephrectomy § 15y indonethacin, herbsnil nilhypertension oxprenolol, ranitidinehypertension nicardipine, DyazideOA indomethacin, temazepamOA, hypothyroid ibuprofen, thyroxinebendrofluazidegout allopurinol,chlorthiazidenil aspirin, diazepamnil nil

247
Appendix C4 Denographic Details & Medications of Subjects in CREATININE Study (contd)subject sex/age wt/ht fit MSc smoker EtOH diagnoses drugsF59C F 72 66/143 Y 1 no occ. nild renal impairment
Burinex K, KC1 Beconase
F60C F 63 60/164 Y 1 no occ. hypertension Tenoret, multivitauF62C F 73 77/155 Y 1 no occ. nil nilF63C F 66 60/162 Y 1 no 14/wk migrainedepression propranolol,dothiepj AlophenF65C F 75 73/175 Y 1 no occ. Ca breast tamoxifenF66CE F 60 75/165 Y 1 no occ. nil nilF68CC F 79 70/165 Y 1 no occ. nil aspirinF69CC F 73 67/170 Y 1 no occ. PA B12 injectionsF71CE F 64 63/160 Y 1 no 14/wk nil nilF73CC F 65 79/164 Y 1 no occ. nil nilF74C F 70 60/155 Y 1 no occ. OA diclofenacF75CC F 70 65/163 Y 1 no occ. nil nilF76CE F 67 80/167 Y 1 ex. occ. hypothyroid thyroxineF78CE F 66 66/169 Y 1 no 7/wk nil nilF81CE F 65 62/158 Y 1 ex. 3/wk nil piperazine oestroneF86CC F 67 56/161 Y 1 no occ. nil bisacodylF91CE F 68 56/157 Y 1 10/day 3/wk nil nilF93C F 66 76/167 Y 1 ex. 21/wk nil betahistineF94CC F 73 70/149 Y 1 1/day occ. nil nitrazepamF96CE F 64 53/150 Y 1 no occ. nil nilF97CC F 71 59/164 Y 1 no occ. nil nilH08CC H 84 85/184 Y 1 1/day
cigar yesnod. nil nil
H22CC H 70 90/175 Y 1 no occ. nil RenniesH35CE H 71 77/179 Y 1 ex. occ. nil nilM38C H 65 58/161 Y 1 no occ. depression mianserinH43C H 60 93/177 Y 1 no yes ?
excessnil nil

248
Appendix C4 Denographic Details & Medications of Subjects in CREATININE Study (contd)subject sex/age wt/ht fit/MSc smoker EtOH diagnoses drugsM54CC M 62 60/166 Y / l no occ. nil nilM57CE M 68 71/166 Y / l 8/day 7/wk nil nilM61CC M 73 88/183 Y / l no occ. nil nilM64C M 75 68/168 Y / l ex. occ. glaucoma pilocarpine EDM67CE M 64 79/183 Y / l heavy-pipe occ. nil nil
M72CC M 72 80/184 Y / l no occ. nil nilH77CE M 72 67/173 Y / l ex. occ. nil nilM79CE M 73 63/162 Y / l 2/day occ. nil nilM80CC M 66 81/175 Y / l no 40/wk nil nilM82CC M 66 78/172 Y / l no no nil nilM83CC M 67 81/171 Y / l no 20/wk nil nilM84CE M 65 70/171 Y / l no 7/wk nil nilH85CC M 67 84/180 Y / l no occ. nil nilH92CC H 68 78/171 Y / l yes 14/wk nil nilH95CE M 70 66/164 Y / l no 1/wk nil nilH98CE M 64 74/172 Y / l no occ. nil nilM99CC M (65 66/168 Y / l no occ. nil nilH100CE M 64 70/164 Y / l no 9/wk nil nilF08C F 87 50/142 N / 4 no no Parkinsonism temazepam
F09CF12C
F15C F
F16C
78 65/160 N / 3 no74 71/170 N / 4 no
82 65/150 N / 4 no
78 41/150 N / 4 no
diverticulitisno CVAno anaemia, leg ulcerhypertension
no OA, schizophrenia(burnt out)no NIDDM, catheterisedCVA & L hemiplegia ex-alcoholic
noneNeonaclex K,oxprenolol dihydrocodeine,hydralaz ine temazpen,iron sulphateprocyclidine,fluphanazine ispagula husktolbutaiide,terodiline

249
Appendix C4 Demographic Details & Medications of Subjects in CREATININE Study (contd)subject sex/age Wt/ht fit MSc smoker EtOIF17C F 79 83/178 N 4 no no
F18C F 84 45/163 N 3 no no
F21C F 88 50/152 N 4 no no
F22C F 73 63/157 N 4 no no
F24C F 77 92/157 N 4 no no
F25C F 79 44/152 N 4 no no
F28C F 86 50/163 N 3 occ. occ
F29C F 83 45/150 N 3 no noF30C F 83 55/160 N 3 no noF31C F 84 N 4 no noF34C F 79 83/178 N 3 no noF37C F 73 63/157 N 3 no noF39C F 88 N 4 no no
F41C F 81 50/163 N 3 no no
F42C F 88 48/152 N 4 no no
F44C F 89 43/157 N 3 no no
F46C F 71 55/152 N 3 no no
F02GPC F 78 83/152 Y 1 no no
F04GPC F 79 55/152 Y 1 no no
diagnoses drugscellulitis L leg tamoxifen,paracetamolmastectomy 1978 temazepammentally subnormal thioridazine,Milparpressure sorediverticulitis noneCVA, OACVA & R hemiplegia paracetamol,lactuloseMI 1986CVA & R hemiplegia Trasidrex,paracetamolhypertension, OA aspirinspasticity of legs paracetamol,temazepam? MS, catheterised prochlorperazineRA, constipation mianserin,aspirinweight loss ispaghula husk?acoustic neuroma nonehypertension, IHD lactulose,sennadiarrhoea, falls ampicillinmastectomy 1978 tamoxifen,paracetamolCVA & R hemiplegia paracetamol,lactulosehypotension ranitidine,paracetamolt R arm, falls fludrocortisone,temazepamfast AF, CCF digoxin,co-amilofruseisosorbide DN,temazepamtachycardia, TIA's digoxin,co-amilofrusetemporal arteritis aspirin,paracetamolCVA & L hemiplegia prednisoloneNIDDM, below knee digoxin,timolol EDamputation MilparAF, falls digoxin,co-proxamolmitral valve disease warfarin,temazepam carebral embolus '75 bendrofluazidehypertension captopril,canesten creambilateral THRsinusitis none

2 5 0
Appendix 04 Demographic Details & Medications of Subjects in CREATININE Study (contd)subject sex/age wt/ht fit MSc smoker EtOH diagnoses drugsF05GPC F 78 51/163 Y 1 no no epilepsy carbamazepine,phenytoin inositol nicotinateF07GPC F 80 62/165 Y 1 no no hypothyroid, reflux thyroxine,cinnarazineF09GPC F 80 56/147 Y 1 no occ. cervical spondylosis co-proxamol,nabumetone neuritisM02C M 80 71/180 N 4 no no CVA & hemiplegia thioridazineM04C M 88 65/175 N 5 ex. occ. HI, OA, COAD catheterised Neonaclex K,chlormethiazole mianserin,paracetamolM06C M 68 70/180 N 3 yesheavy yes7 hypertensiondepressionex-alcoholic
allopurinol,atenololchlormethiazolethioridazineM07C M 80 80/170 N 3 no no CVA, diverticulitis ranitidineM10C M 78 55/173 N 5 no no IED, CCF, anaemia Frumil,FeS04,paracetamolM13C M 68 72/173 N 4 no no IDDM, catheterised CVA & L hemiplegia
Actrapid,MonotardibuprofenM14C M 87 58/163 N 3 no no asthma, OA leg ulcer Frumil,aminophylline diazepam,paracetamol salbutamol & Becotide inh.H19C M 97 50/170 N 5 no no COAD metoclopramide,ranitidineM20C M 88 88/175 N 4 ex. 7/wk OA, COAD catheterised Neonaclex K,paracetamol mianserinM23C M 81 60/163 N 4 no no CVA & hemiplegia urinary frequency Frumil, acebutolol
M26C M 78 63/168 N 4 no occ. CVA,hemiplegia,NIDDH oxprenolol,paracetamolM27C M 83 65/178 N 5 N/K N/K AF, CCF, CVA digoxin,ampicillin
protriptyline,aspirinM32C M 76 62/178 N 4 no no ? MIlung fibrosis Atrovent & salbutamol nebs Becotide inh,ranitidineM35C M 81 60/178 N 4 N/K N/K NIDDM, glaucoma
ulcer L legglibenclamide,co-proxamol pilocarpine ED
H43C M 72 86/168 N 4 N/K no AF,CCF,hypertension digoxin,Frumil,folic acid Parkinsonism sodium valproatedementia, epilepsy ascorbic acid,paracetamol CVA, hemiplegia

251
Appendix C4 Demographic Details & Medications of Subjects in CREATININE Study (contd) subject sex/age wt/ht fit/MSc smoker EtOH diagnoses drugsM01GPC M / 82 67/173 Y / l no no cardiac pacemaker peptic ulcer warfarin,aminophylline cimetidineM03GPC M / 76 87/174 Y / l no yes ? excess
OA, renal stone diclofenac,quinine sulphate
M06GPC M / 79 68/168 Y / l no no nocturia MucaineH08GPC M / 82 74/175 Y / l no no hypertension
migrainepropranolol,paracetamol
HIOGPC M / 82 75/174 Y / l no 7/wk DO yeast tabletsM11GPC M / 88 66/170 Y / l no no cholecystectomy digoxin
wt = weight (kg)ht = height (cm)fit = fit Yfrail NMSc = mobility scoreEtOH = alcohol (units/week)

2 5 2
Appendix C5 SCr, OCr & CCr, calculated over 8 & 24
subject [SCr]mg/dl urinecolln T.inthourstotalmgOCr [OCr]mg/dl
F07CC 1.35 24.00 24.00 1128.0 44.4F09CC 1.25 141021450700
7.167.599.2524.00
351.1404.7440.91196.7
64.943.472.357.4F18CC 1.48 24.00 24.00 983.7 83.0F23CC 1.00 1350
223507006.848.758.4124.00
411.5497.6 472.11381.2
137.2110.667.495.3
F31CC 1.08 1430220007007.507.50 9.0024.00
432.3399.4 226.21057.9
49.139.9 60.346.9F44CC 1.06 24.00 24.00 968.2 52.5F46CC 1.14 135022400640
6.838.84 8.0023.67
612.7345.9284.01242.6
102.143.229.952.9F53CC 1.04 24.00 24.00 989.5 83.2F68CC 1.14 24.00 24.00 1087.6 60.1F69CC 1.20 143023150700
7.508.757.75 24.00
258.6 314.1321.7 894.4
95.837.656.453.4F73CC 1.07 24.00 24.00 863.9 94.5F75CC 1.65 160022080700
9.006.138.8724.00
378.2239.1313.7931.0
109.9103.149.576.9F86CC 1.53 24.00 24.00 1119.5 43.7F94CC 1.62 150023450700
8.008.757.2524.00
349.4 331.9 246.1927.4
50.385.1100.969.8F97CC 2.96 24.00 24.00 1190.8 65.4F15CE 1.26 24.00 24.00 753.5 38.9
hour periods, for Subjects in CREATININE study
urinevol/ml CCrml/min24hCCrml/min 1 24h CCr SAm2
24hCCr1.73m2
2540 58 1.70 595419336102084
657164 66
9810897 1.65 701185 46 1.59 503004507001450
1009594 96
1049998 1.67 9988010003752255
89823968
13112157 1.68 701845 63 1.76 626008009502350
1315752 77
1707468 1.66 801190 66 1.77 651810 66 1.77 652708355701675
485058 52
92961121.78 50
914 56 1.85 523442326341210
423936 39
10810092 1.70 402560 51 1.57 566953902441329
453935 40
1139888 1.65 421820 28 1.62 301935 42 1.67 43

Appendix C5 SCr, OCr & CCr, calculated for 8 & 24h
subject [SCr]ig/dl urinecolln T.inthourstotalmgOCr [OCr]mg/dl
F20CE 1.37 130022300700
6.009.508.50 24.00
152.6426.9378.8958.3
87.282.141.959.9
F21CE 0.91 132900200652
6.4810.856.5423.87
281.5396.7277.5955.7
67.057.1 45.5 55.4
F27CE 1.48 130024000700
6.0011.007.0024.00
345.8509.9 372.51228.2
46.876.763.161.6
F30CE 1.05 1405232606507.089.347.4123.83
483.7579.0520.21582.9
191.283.484.7101.4F36CE 1.49 131022300700
6.169.348.5024.00
270.6 415.1325.6 1011.3
62.170.2 62.065.2F41CE 1.23 24.00 24.00 1135.8 57.8F51CE 1.29 24.00 24.00 1116.9 60.2F66CE 1.27 24.00 24.00 1141.2 61.0F71CE 0.84 14252140
07007.427.269.3224.00
318.2304.3 347.9970.4
92.0127.9101.1104.6F76CE 1.80 1430
230007007.508.50 8.0024.00
433.1379.5375.71188.3
76.779.7 107.385.4
F78CE 1.06 1437221507007.617.648.7524.00
226.1228.2210.1664.4
36.124.034.830.5F81CE 1.13 13172206
06466.288.828.6723.77
252.7391.9397.51042.1
99.9 47.344.9 53.0
F91CE 1.03 24.00 24.00 915.5 151.3
253
periods, for Subjects in CREATININE study (contd)24h 24h
urine CCr CCr I 24h SA CCrvol/il ml/min ml/min CCr m2 1.73m2175 31 63520 55 112905 54 1101600 49 1.59 53420 80 110695 67 92610 78 1071725 73 1.57 81739 65 112665 52 90590 60 1031994 58 1.76 57253 108 103694 98 93614 111 1061561 105 1.81 101436 49 104591 50 106525 43 911552 47 1.52 541965 64 1.78 621855 60 1.78 581870 62 1.83 59346 85 106238 83 104344 74 93928 80 1.65 84565 53 115476 41 89350 43 931391 46 1.88 42626 47 107950 47 107604 38 862180 44 1.75 42253 59 91828 66 102886 68 1051967 65 1.64 68605 62 1.54 69

254
Appendix C5 SCr, OCr & CCr, calculated for 8 & 24h periods, for Subjects in CREATININE study (contd)
subject [SCr]ig/dl urinecolln T.inthourstotalngOCr [OCr]ig/dl urinevol/il
CCril/iin24hCCril/iin
1 24h CCr SAu2
24hCCr1.73U2F96CE 1.15 153021200700
8.505.839.6724.00
369.8208.2353.2931.2
44.637.475.150.2
8305564701856
63525356
1139395 1.47 66
F19C 1.16 24.00 24.00 665.3 53.2 1250 40 1.73 40F37C 1.02 132022300700
6.339.178.5024.00
310.3488.5403.21202.0
50.749.574.456.2
6129865422140
808778 82
9810695 1.56 91F39C 0.79 1405
221007206.098.079.1723.33
248.4324.9356.7930.0
100.648.3 57.560.4
2476736201540
868582
84
10210198
1.40 101F47C 1.24 13522329
06566.879.617.4523.93
365.2 418.9374.2 1158.3
41.995.2 97.468.3
8724403841696
71596865
109911051.51 74
F48C 1.23 24.00 24.00 945.0 66.5 1420 53 1.57 59F49C 1.46 24.00 24.00 1036.9 60.5 1715 49 1.73 49F50C 1.28 24.00 24.00 994.8 46.5 2140 54 1.67 56F55C 1.27 24.00 24.00 786.0 41.4 1900 43 1.57 47F58C 1.20 24.00 24.00 1038.8 59.4 1750 60 1.78 58F59C 1.28 24.00 24.00 1022.3 56.5 1810 55 1.55 62F60C 1.19 141022400640
7.178.508.2523.92
283.9 374.3328.9 987.1
76.961.340.655.1
3696118101790
55 625658
95107971.65 61
F62C 1.22 24.00 24.00 968.4 39.9 2430 55 1.76 54F63C 1.10 15302330
07008.50 8.007.50 24.00
322.3 354.9276.4 953.6
102.0105.0106.3104.3
316338260914
576756 60
9511293 1.63 64
F65C 0.89 1535230507008.597.497.9224.00
397.3 476.6355.4 1229.3
151.1157.370.2114.7
2633035061072
8711984 96
9112488 1.87 89
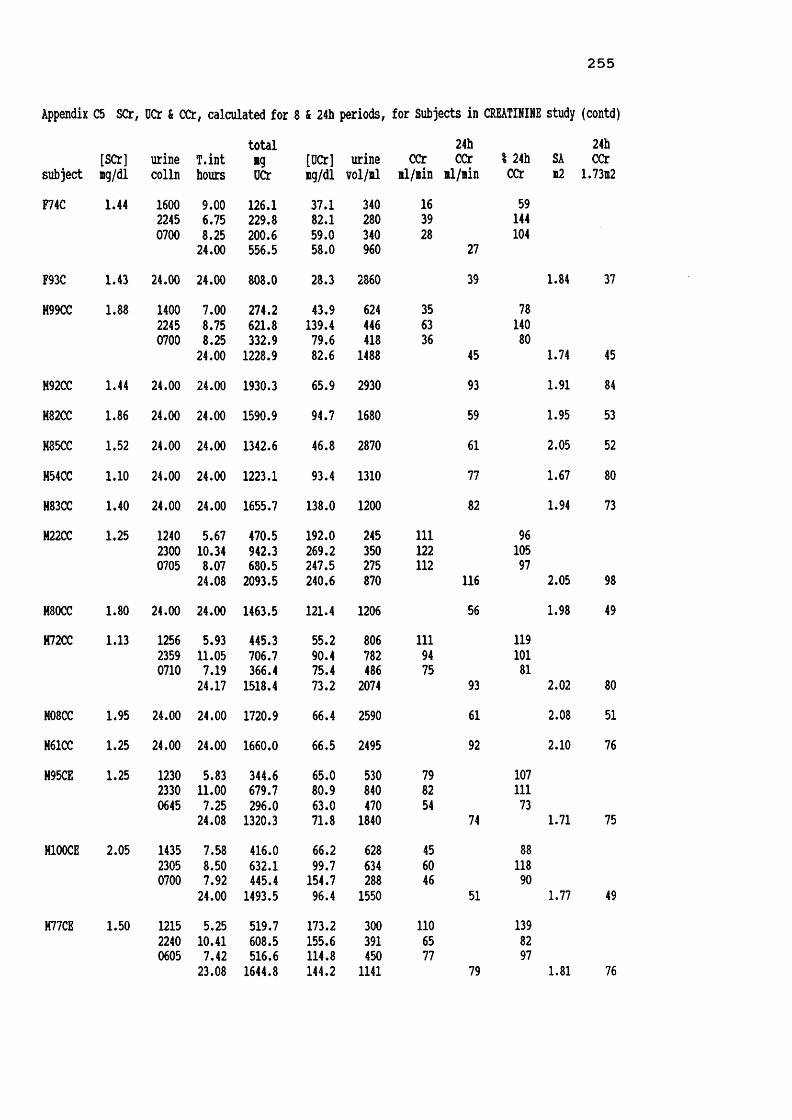
2 5 5
Appendix C5 SCr, DCr & CCr, calculated for 8 & 24h periods, for Subjects in CREATININE study (contd)
subject [SCr]mg/dl urinecolln T.inthours
totalngOCr [OCr]ng/dlurinevol/nl
CCrnl/nin24hCCrnl/nin ? 24h CCr SAn2
24hCCr1.7312F74C 1.44 160022450700
9.006.758.2524.00
126.1229.8200.6556.5
37.182.159.058.0
340280340960
163928 27
59144104
F93C 1.43 24.00 24.00 808.0 28.3 2860 39 1.84 37M99CC 1.88 1400
224507007.008.758.2524.00
274.2621.8332.91228.9
43.9139.479.682.6
6244464181488
35 633645
7814080
1.74 45M92CC 1.44 24.00 24.00 1930.3 65.9 2930 93 1.91 84H82CC 1.86 24.00 24.00 1590.9 94.7 1680 59 1.95 53M85CC 1.52 24.00 24.00 1342.6 46.8 2870 61 2.05 52H54CC 1.10 24.00 24.00 1223.1 93.4 1310 77 1.67 80H83CC 1.40 24.00 24.00 1655.7 138.0 1200 82 1.94 73H22CC 1.25 124023000705
5.6710.348.0724.08
470.5 942.3680.5 2093.5
192.0269.2247.5240.6
245350275870
111122112 116
96 10597 2.05 98H80CC 1.80 24.00 24.00 1463.5 121.4 1206 56 1.98 49H72CC 1.13 125623590710
5.9311.057.1924.17
445.3706.7366.4 1518.4
55.290.475.473.2
8067824862074
1119475 93
11910181 2.02 80
H08CC 1.95 24.00 24.00 1720.9 66.4 2590 61 2.08 51H61CC 1.25 24.00 24.00 1660.0 66.5 2495 92 2.10 76H95CE 1.25 123023300645
5.8311.007.2524.08
344.6679.7 296.01320.3
65.0 80.963.0 71.8
5308404701840
798254 74
10711173 1.71 75H100CE 2.05 1435
230507007.588.507.9224.00
416.0632.1 445.41493.5
66.299.7154.796.4
6286342881550
45 6046
51
8811890
1.77 49H77CE 1.50 121522400605
5.2510.417.4223.08
519.7608.5516.6 1644.8
173.2 155.6 114.8144.2
3003914501141
1106577 79
13982971.81 76

256
Appendix C5 SCr, OCr & CCr, calculated for 8 & 24h periods, for Subjects in CREATININE study (contd)total 24h 24h[SCr] urine T.int ng [OCr] urine CCr CCr I 24h SA CCrsubject lg/dl colln hours OCr mg/dl vol/il nl/nin nl/nin CCr n2 1.73n2
M35CE 1.54 1400 7.00 421.6 163.4 258 65 932220 8.33 611.4 178.3 343 79 1130700 8.67 509.0 184.4 276 64 9124.00 1542.0 175.8 877 70 1.94 62H67CE 1.52 24.00 24.00 1208.6 64.3 1880 55 2.01 48H57CE 1.66 24.00 24.00 1216.5 116.4 1045 51 1.78 49H84CE 1.06 24.00 24.00 1783.0 57.5 3100 117 1.82 111H98CE 2.25 1420 7.34 436.1 75.2 580 44 1022010 5.83 387.5 161.5 240 49 1140630 10.33 552.2 83.7 660 40 93
23.50 1375.8 93.0 1480 43 1.86 40H79CE 1.81 1315 6.25 307.0 102.3 300 45 1322230 9.25 452.9 123.1 368 45 1320700 8.50 118.5 127.4 93 13 3824.00 878.4 115.4 761 34 1.67 35H38C 1.23 1410 7.17 457.4 79.4 576 86 1182100 6.83 347.2 86.8 400 69 950700 10.00 485.7 138.8 350 66 9024.00 1290.3 97.3 1326 73 1.60 79H43C 1.36 24.00 24.00 1775.0 59.0 3010 91 2.10 75H64C 1.19 1255 5.92 359.7 81.8 440 85 1162300 10.08 499.9 81.3 615 69 950700 8.00 385.8 148.4 260 68 9324.00 1245.4 94.7 1315 73 1.76 71F08C 1.50 1320 7.58 302.1 39.8 760 44 1422000 6.67 125.1 37.7 332 21 680545 9.75 241.3 38.2 632 27 8724.00 668.5 38.8 1724 31 1.43 37F09C 4.32 1425 6.42 191.7 84.1 228 12 1202130 7.08 30.6 38.7 79 2 200730 10.00 378.5 48.4 782 15 15023.50 600.8 55.2 1089 10 1.71 10F12C 2.56 1420 8.33 389.4 120.2 324 30 1252000 5.67 126.0 217.2 58 14 580600 10.00 355.9 92.7 384 23 9624.00 871.3 113.7 766 24 1.85 22F15C 1.24 1600 6.00 191.4 41.1 466 43 1162040 4.67 135.5 123.2 110 39 1051005 13.42 340.6 66.1 515 34 9224.09 667.5 61.2 1091 37 1.67 39

257
Appendix C5 SCr, OCr & CCr, calculated for 8 & 24h
subject [SCr]ng/dl urinecollnT.inthours
totalngOCr [OCr]ng/dlF16C 1.19 14001800
06008.004.0012.0024.00
164.997.4252.5514.8
37.217.2 23.0 24.4F17C 1.30 15152300
09305.757.75 10.50 24.00
164.3140.0384.5688.8
82.2157.3108.6107.1F18C 1.81 144518300700
7.423.7512.5023.67
6.5254.8222.9 484.2
130.0172.2112.6137.9
F21C 3.82 1330183007006.504.5012.5023.50
120.3209.9342.9 673.1
101.999.099.799.9F22C 1.43 133020470600
7.507.289.2224.00
346.8289.2333.3969.3
60.7 66.059.7 61.9F24C 3.89 140022001000
4.008.00 12.00 24.00
159.1371.6429.6 960.3
137.2178.747.077.5F28C 1.56 24.00 24.00 314.4 22.4F25C 1.25 141518300600
8.254.25 11.50 24.00
118.367.753.5239.5
78.9147.2100.996.2
F29C 1.22 1525194006508.424.2511.1723.84
139.1 85.7200.1 424.9
41.299.741.346.8
F30C 2.23 133021300600
7.50 8.008.50 24.00
250.8205.9 339.4 796.1
97.2 152.536.560.2
F31C 1.02 1400183006008.004.5011.5024.00
207.4 157.1248.5 613.0
68.239.618.329.8
periods, for Subjects in CREATININE study (contd)24h 24hurine CCr CCr I 24h SA CCrvol/nl ml/nin nl/nin CCr b2 1.73n2
443 29 97566 34 1131100 29 972109 30 1.33 39200 37 10089 23 62354 47 127643 37 2.04 315 1 5148 63 332198 16 84351 19 1.43 23
118 8 62212 20 154344 12 92674 13 1.47 15571 54 115438 46 98558 42 891567 47 1.68 49116 17 100208 20 118915 15 881239 17 2.04 151406 14 1.52 16150 19 14646 21 16253 6 46249 13 1.38 17338 23 9686 28 117484 24 100908 24 1.38 31258 25 100135 19 76929 30 1201322 25 1.58 27304 42 100397 57 1361355 35 832056 42

258
Appendix C5 SCr, OCr & CCr, calculated for 8 & 24h periods, for Subjects in CREATININE study (contd)total 24h 24h[SCr] urine T.int *9 [OCr] urine CCr CCr % 24h SA CCrsubject ng/dl colln hours OCr ig/dl vol/nl il/iin il/nin CCr a2 1.7312
F34C 1.39 1300 7.00 167.3 75.4 222 29 1042215 9.25 189.4 124.6 152 25 890530 7.25 201.4 51.6 390 33 11823.50 558.1 73.0 764 28 2.03 24
F37C 1.62 1400 8.00 233.4 77.8 300 30 1252100 7.00 252.3 95.9 263 37 1540600 9.00 82.5 64.5 128 9 38
24.00 568.2 82.2 691 24 1.68 25F39C 2.24 1430 8.33 268.1 75.9 353 24 1041830 4.00 104.5 67.0 156 19 82
0600 11.50 353.0 59.3 595 23 10023.83 725.6 65.7 1104 23F41CD 2.10 1200 5.00 92.2 31.8 290 15 107
2300 11.00 164.9 33.3 495 12 860700 8.00 148.0 31.5 470 15 10724.00 405.1 32.3 1255 14 1.52 16
F42CD 1.82 1430 7.50 270.4 39.5 685 33 1102130 7.00 253.4 105.6 240 33 1100645 9.25 334.4 113.4 295 33 110
23.75 858.2 70.3 1220 30 1.44 35F44CD 1.76 1300 7.25 161.2 76.8 210 21 1242000 7.00 122.7 85.2 144 17 1000630 10.50 159.6 67.9 235 14 8224.75 443.7 75.3 589 17 1.38 21F46CD 4.01 1330 3.50 34.5 115.0 30 4 572100 7.50 161.1 76.7 210 9 1290700 10.00 175.9 59.0 298 7 100
21.00 371.5 69.1 538 7 1.54 8F02GPC 1.34 24.00 24.00 915.5 58.7 1560 47 1.91 43F04GPC 1.11 24.00 24.00 1111.3 73.4 1515 70 1.54 78F05GPC 1.01 24.00 24.00 896.9 47.2 1900 62 1.52 70F07GPC 1.59 24.00 24.00 882.9 42.8 2064 39 1.70 39F09GPC 1.29 24.00 24.00 673.0 44.6 1510 36 1.54 41H02C 1.14 23.00 23.00 634.1 41.2 1538 40 1.88 37H03C 1.14 1310 5.17 240.3 31.0 775 68 1191900 5.83 284.8 49.0 581 71 1250500 10.00 294.6 51.7 570 43 75
21.00 819.7 42.6 1926 57 1.88 53

259
Appendix C5 SCrf OCr & CCr, calculated for 8 & 24h periods, for Subjects in CREATININE study (contd)total 24h 24h[SCr] urine T.int ig [OCr] urine CCr CCr I 24h SA CCrsubject ng/dl colln hours OCr ng/dl vol/nl nl/nin nl/nin CCr 12 1.73n2
H04C 6.71 1300 4.00 124.0 139.3 89 8 802100 8.00 302.3 129.2 234 9 900500 8.00 372.2 33.2 1122 12 12020.00 798.5 55.3 1445 10 1.78 10
H05C 6.71 1300 6.00 205.7 123.2 167 9 822100 8.00 289.6 108.9 266 9 820700 10.00 521.7 52.2 1000 13 11824.00 1017.0 71.0 1433 11 1.78 10
H06C 1.94 1330 6.50 201.5 231.6 87 27 752030 7.00 288.5 267.1 108 35 970700 10.50 527.5 214.4 246 43 11924.00 1017.5 230.7 441 36 1.88 34
M07C 0.98 1530 6.50 178.7 91.6 195 47 961930 4.00 127.6 83.9 152 54 1100855 13.42 362.8 62.2 583 46 9423.92 669.1 71.9 930 49 1.68 51H10C 2.43 1210 2.42 138.4 108.1 128 39 1862005 7.92 204.9 36.5 562 18 860645 10.67 285.5 47.4 602 18 8621.01 628.8 48.7 1292 21 1.63 22H13C 1.05 1400 8.00 335.8 65.6 512 67 1062220 8.33 369.3 41.2 897 70 1110600 7.67 246.8 65.6 376 51 8124.00 951.9 53.3 1785 63 1.87 58H14C 2.62 1500 5.50 98.8 33.2 298 11 442255 7.92 353.8 89.8 394 28 1120945 10.83 473.9 55.4 856 28 11224.25 926.5 59.9 1548 25 1.63 26M19C 2.05 24.00 24.00 415.6 51.7 804 14 1.54 16H20C 4.86 1500 9.00 263.8 77.6 340 10 832200 7.00 218.8 124.3 176 11 920600 8.00 333.4 45.7 730 14 11724.00 816.0 65.5 1246 12 1.78 11H23C 1.77 1430 7.50 233.3 57.5 406 29 1212045 6.25 133.8 77.8 172 20 830740 10.92 251.1 163.1 154 22 9224.67 618.2 84.5 732 24 1.66 25H26C 1.66 1440 8.42 241.3 86.2 280 29 671645 2.08 244.2 290.7 84 118 2740640 13.92 548.0 50.9 1076 40 9324.42 1033.5 71.8 1440 43 1.72 43

2 6 0
Appendix C5 SCr, OCr & CCr, calculated for 8 & 24b periods, for Subjects in CREATININE study (contd)
subject[SCr]ng/dl
urinecolln T.inthours
totalngOCr
[OCr]ng/dlurinevol/nl
CCrnl/nin
24hCCrnl/nin
I 24h CCr SA12
24hCCr1.7312
H27C 1.51 1135153006005.583.9214.5024.00
615.7262.441.9920.0
150.9145.8130.9 148.4
40818032620
122743 42
2901767 1.80 41
M43CD 1.52 1425201010002.425.7513.8322.00
280.3162.7549.2992.2
59.629.7 140.570.4
4705483911409
1273144 49
2596390 2.03 38
H01GPC 1.47 24.00 24.00 1385.6 99.7 1390 65 1.80 63H03GPC 1.35 24.00 24.00 1305.4 77.5 1685 67 2.07 56H06GPC 1.30 24.00 24.00 1559.4 131.6 1185 83 1.80 80H08GPC 1.50 24.00 24.00 1492.7 130.9 1140 69 1.91 63H10GPC 1.97 24.00 24.00 1257.0 84.1 1495 44 1.92 40M11GPC 1.60 24.00 24.00 1110.0 61.0 1820 48 1.78 47

Appendix C6 Females (F) v Hales (H) in 24h & 8h CCr Study - Mann-Whitney Test
Fmin
Fmax
Fmedian
Fmean
Fs.d.
HminHmax
Mmedian
Hmean
Hs.d.
age (years) 60 100 78.0 77.1 8.4 60 97 78.0 76.3 8.2mobility score 1± 5 1.0 2.1 1.3 1 5 1.0 2.2 1.4 •height (cm) 137 178 157.0 157.4 7.9 147 187 172.0 171.5 7.3 ****weight (kg) 36 94 60.5 60.8 12.8 40 96 71.0 71.0 12.1 ****LBM (kg) 30 57 42.1 42.2 5.7 34 60 50.0 50.0 5.6 ****SA (m2) 1.23 2.15 1.63 1.64 0.22 1.36 2.20 1.82 1.83 0.18urine volume (ml) 249 3217 1333 1375 584 360 3742 1440 1517 641OCr (mg in 24h) 240 2441 834 823 313 302 2624 1223 1192 433 ****[OCr] (mg/lOOml) 22.4 420.8 60.8 67.9 39.7 26.9 240.6 77.5 87.3 39.7[SCr] (mg/lOOml) 0.34 4.32 1.24 1.39 0.69 0.55 6.71 1.45 1.67 1.01 **24h CCr (ll/min) 7 141 47.0 48.7 24.1 10 193 59.0 60.5 30.0 ***24h CCr/SA (ml/min/1.73m2) 8 167 50.0 51.8 26.3 10 164 53.0 56.4 26.1
CCram (ml/min) 1 160 49.0 50.5 30.4 6 195 63.5 67.6 41.1 **CCrpm (ml/min) 2 156 49.0 51.9 31.6 9 209 61.5 63.2 36.9 *CCm (ml/min) 6 153 43.0 46.1 26.2 3 186 51.5 53.9 30.3
* p<0.05 ** p<0.005 ***' p<0.001 ** ** p<0.0001

262
Appendix C7 Summary of Results From All Females in CCr Prediction Studyn min max median mean s.d. 951 C.I. r m
age (years) 146 60 100 78.0 77.1 8.4 76 - 78lobility score 146 1 5 1.0 2.1 1.3 1.9 - 2.3height (ci) 146 137 178 157.0 157.4 7.9 156 - 159veight (kg) 146 36 94 60.5 60.8 12,8 59 - 63SA (12) 146 1.23 2.15 1.63 1.64 0.22 1.60 - 1.67urine vol (ll) 146 249 3217 1333 1375 584 1279 - 1470tiie interval (h) 146 21.00 25.42 24.00 23.88 0.52 23.79-23.96OCr (mg/24h) 146 240 2441 834 823 313 772 - 874[OCr] (ig/lOOil) 146 22 421 60.8 67.9 39.7 61.4 - 74.4[SCr] (ig/lOOil) 146 0.34 4.32 1.24 1.39 0.69 1.27 - 1.5024h CCr (il/iin) 116 7 141 46.5 48.5 26.1 44 - 53CCrai (il/iin)dCCraiICCram
1161161161-575
1603626349.0-1.0102.5
50.5-2.0102.630.413.332.0
45 - 56 4.5 - 0.597 - 1090.901 1.05
CCrpi (il/iin)dCCrpiICCrpm116116116
2-802015639332
49.0-2.0103.051.9-3.3107.4
31.615.339.846 - 58 -6.1 - -0.5 100 - 115
0.877 1.06
CCm (il/iin)dCCmICCrn116116116
6-412715342241
43.02.097.046.12.496.4
26.210.325.141 - 51 0.5 - 4.392 - 101
0.922 0.93
CCr (il/iin) 146 7 141 47.0 48.7 24.1 45 - 53CCr/SA(il/iin/1.73i2) 146 8 167 50.0 51.8 26.3 48 - 56
CCr/70kg (ml/min/70kg) 146 9 207 52.5 57.1 30.9 50-62
El (il/iin) dEl 146 6-41 13344 44.92.1 45.82.9 20.513.6 42 - 49 0.826 0.7
E1F (il/iin) dElF 146 5-26 11348 38.17.9 38.99.8 17.413.8 36 - 42 0.826 0.6
E2 (il/iin/1.73n2) dE2 146 11-12428235
68.7-17.8 75.0-23.2
39.925.5 68 - 82 0.779 1.18
E2F (ll/lin/1.73l2) dE2F146 11-70 22838 57.5
-6.462.6-10.8 31.920.1 57 - 68 0.779 0.95
-0.45
0.37
1.21
11.6
9.9
13.7
13.6

2 6 3
Appendix C7 Summary of Results From All Females in CCr Prediction Study (contd)cn min max median mean S.d. 951 C.I. r m
E3 (ml/*in/1.73m2) 146 10 159 43.2 45.4 20.9 42 - 49 0.844 0.67dE3 -28 43 7.1 6.4 14.2E3F (ml/iin/1.73i2) 146 9 143 38.9 40.9 18.8 38 - 44 0.844 0.61dE3F -21 51 11.5 10.9 14.5E4 (ml/min) 146 7 149 49.8 51.2 22.8 47 - 55 0.826 0.78dE4 -53 42 -2.4 -2.5 13.9E4F (ml/min) 146 6 126 42.4 43.5 19.4 40 - 47 0.826 0.67dE4F -36 45 4.3 5.2 13.6E5 (ml/min/1.73n2) 146 20 276 74.3 80.2 37.6 74 - 86 0.779 1.11dE5 -118 28 -23.4 -28.4 23.8E6 (ml/min) 146 16 329 70.6 78.9 44.7 72 - 86 0.696 1.29dE6 -202 36 -22.5 -30.2 32.9E6F (ml/min) 146 13 253 54.9 61.2 34.4 56 - 67 0.774 1.01dE6F -126 42 -6.9 -12.6 24.7E7 (ml/min/1.73m2) 146 86 118 103.2 103.9 6.7 103 - 105 0.293 0.07dE7 -101 61 -56.2 -52.1 25.2E8 (ml/min/1.73m2) 146 69 95 83.1 83.6 5.3 83 - 85 0.293 0.06dE8 -80 82 -35.3 -31.8 25.2E9 (ml/min) 146 7 144 48.2 49.5 22.1 46 - 53 0.825 0.76dE9 -49 43 -1.1 -0.8 13.8E9F (ml/min) 146 6 115 38.5 39.6 17.7 37 - 42 0.825 0.60dE9F -28.2 46.9 7.5 9.1 13.8E10 (ml/min/70kg) 146 10 203 53.0 56.0 27.1 52 - 60 0.858 0.75dE10 -40 48 -0.1 1.2 15.9E10F (ml/min/70kg) 146 9 172 45.1 47.6 23.0 44 - 51 0.858 0.64dElOF -27 56 8.5 9.6 16.2Ell (ml/min) 146 13 297 60.8 68.7 39.5 62 - 75 0.726 1.19dEll -167 41 -15.5 -20.0 27.6E11F (ml/min) 146 12 178 42.7 46.9 23.5 43 - 51 0.716 0.70dEllF -54 49 3.8 1.8 18.0E12F (ml/min) 143 8 86 39.0 40.6 16.1 38 - 43 0.784 0.57dE12F -31 46 7.0 7.1 13.7

264
Appendix C8
nobility score
weight (kg)
SA (m2)
urine volume (ml)
OCr (mg)
[SCr] (mg/lOOml)
CCr (ml/min)
CCr/SA(ml/min/1.73m2)
Correlation Coefficient for All Females in CCr Prediction Study (n=146)
age0.513***
H.Sc weight SA 0 vol. OCr [SCr]
-0.330*** -0.192
-0.180 -0.079 0.804***-0.438*** -0.441*** 0.357*** 0.247**-0.463*** -0.421*** 0.468*** 0.339*** 0.464***0.116 0.306*** 0.033 0.140 -0.138 0.001
-0.358*** -0.438*** 0.204 0.094 0.274*** 0.561*** -0.619***-0.293*** -0.394*** 0.002 -0.081 0.194 0.446*** -0.636***
** p<0.01 *** p<0.001

265
Appendix C9 Summary of Results From All Hales in CCr Prediction Studyn min max median
age (years) 99 60 97 78.0mobility score 99 1 5 1.0height (cm) 99 147 187 172.0weight (kg) 99 40 96 71.0SA (m2) 99 1.36 2.20 1.82urine vol (ml) 99 360 3742 1440time interval (h) 99 20.00 27.33 24.00UCr (mg/24h) 99 302 2624 1223[OCr] (mg/100ml) 99 27 241 77.5[SCr] (mg/lOOml) 99 0.55 6.71 1.4524h CCr (ml/min) 78 10 193 57.5CCram (ml/min) 78 6 195 63.5dCCram 78 -87 17 0.0ICCram 78 30 350 100.0CCrpm (ml/min) 78 9 209 61.5dCCrpm 78 -75 29 -2.0ICCrpm 78 37 274 106.5CCrn (ml/min) 78 3 186 51.5dCCm 78 -43 50 3.0ICCrn 78 7 149 93.5CCr (ml/min) 99 10 193 59.0CCr/SA(ml/min/1.73m2) 99 10 164 53.0
CCr/70kg (ml/min/70kg) 99 10 169 54.7
El (ml/min) dEl 99 8-27 14551 44.313.3E2 (ml/ain/1.73m2) dE2 99 3-88 17044 57.00.3E3 (ml/min/1.73m2) dE3 99 7-31.6 10855.6 37.616.8E4 (ml/min) dE4 99 9-36 16248 49.66.7
mean s.d. 951 C.I. r m76.3 8.2 74 - 782.2 1.4 1.9 - 2.5
171.5 7.3 170 - 17371.0 12.1 69 - 731.83 0.18 1.79 - 1.871517 641 1389 - 164523.89 0.90 23.71 - 24.071192 433 1106 - 127887.3 39.7 79.4 - 95.21.67 1.01 1.47 - 1.8759.6 31.4 53 - 6767.6-8.0112.0
41.122.1 48.658 - 77 -13.0--3.0 101 - 123
0.846 1.11
63.2-3.6105.436.914.329.8
55 - 72 -6.8 - -0.499 - 1120.925 1.09
53.95.792.430.313.522.0
47 - 61 2.7 - 8.8 87 - 970.905 0.87
60.5 30.0 55 - 6756.4 26.1 51 - 62
59.2 27.0 54 - 65
46.813.8 22.215.7 42 - 51 0.862 0.64
61.7-5.3 30.621.4 56 - 68 0.726 0.85
39.317.1 17.616.6 36 - 43 0.781 0.53
52.2 24.7 47 - 57 0.861 0.718.4 15.3
1.58
-1.52
1.78
8.2
13.7
9.7
9.3

Appendix C9 Sumary of Results Froi All Hales in CCr Prediction Study (contd)n lin iax ledian lean s.d. 951 C.I. r 1 C
E5 (nl/min/1.73i2) 99 12 170 63.2 67.7 28.9 62 - 73 0.726 0.80 22.4dE5 -90 37 -6.1 -11.3 20.5E6 (il/iin) 99 9 186 58.6 64.6 32.1 58 - 71 0.670 0.72 21.3dE6 -103.6 1.0 -4.1 25.3E7 (il/iin/1.73i2) 99 88 118 103.2 104.5 6.5 104 - 106 0.420 0.11 98.6dE7 -92 52 -48.8 -48.1 24.1E8 (il/iin/1.73i2) 99 71 95 83.1 84.1 5.2 83 - 85 0.420 0.08 79.4dES -72 75 -28.8 -27.7 24.4E9 (il/iin) 99 8 156 48.0 50.4 23.9 46 - 55 0.861 0.69 9.0dE9 -33 49 8.8 10.1 15.4E10 (il/iin/70kg) 99 7 137 45.7 48.0 22.7 43 - 53 0.804 0.68 8.0dE10 -42.5 58 10.4 11.2 16.1Ell (il/iin) 99 8 172 50.7 56.5 29.0 51 - 62 0.694 0.67 15.9dEll -82 53 7.6 4.0 23.1E12 (il/iin) 97 12 148 47.0 48.5 22.1 44 - 53 0.844 0.63 9.6dE12 -32 52 13.0 13.1 16.0

267
Appendix CIO Correlation Coefficient for All Hales in CCr Prediction Study (n=99)
nobility scoreage0.423
***
H.Sc weight SA 0 vol. OCr [SCr] CCr
weight (kg) -0.253 -0.376***
SA (n2) -0.269**
-0.381***
0.947***
urine volume (nl) -0.329***
-0.288**
0.362***
0.385***
OCr (ng) -0.442***
-0.550***
0.566***
0.585***
0.431tit
[SCr] (ng/lOOnl) 0.206 0.292**
-0.016 -0.049 -0.097 -0.094
CCr (nl/nin) -0.421***
-0.512***
0.424***
0.476***
0.438***
0.610***
-0.593
fCr/SA(nl/nin/1.73i2) -0.420
***-0.499
***-0.274 0.321
**0.406
***0.555
***-0.634
***0.980
***
** p<0.01 *** p<0.001

268
Appendix Cll Influence of Diuretic Dse on CCr Prediction in Females - Hann-Whitney Test
no diuretics taken (no D; n=86) diuretics taken (D; n=60)no D mean no D s.d. no D r no D 1 no D c Dmean Ds.d. Dr DI Dc
age (years) 75.6 8.2 79.3 8.2mobility score 1.9 1,2 2.4 1,3weight (kg) 60.4 11.0 61.3 15.1SA (m2) 1.62 0.17 1.66 0.27urine volume (ml) 1423 592 1306 570OCr (mg in 24h) 152 326 782 291[OCr] (mg/lOOml) 70.1 47.9 64.8 23.6[SCr] (mg/lOOml) 1.31 0.60 1.49 0.79CCr (ml/min) 52.1 26.0 43.9 20.5CCr/SA(ml/min/1.73m2) 29.0 29.1 21.9 20.6
CCram (ml/iin) dCCram 55.2-2.1 34.211.9 0.942 1.11 -3.8 44.9-1.9 24.414.9 0.795 0.92 5.4
CCrpm (ll/min) dCCrpm 58.6-5.5 33.316.7 0.865 0.99 5.8 43.8-0.8 27.513.0 0.890 1.16 -6.2
CCrn (ml/min) dCCm 49.93.3 29.08.5 0.957 0.96 -0.9 41.71.3 21.912.2
0.841 0.88 4.0
El (ml/min) dEl
47.74.4 20.014.1 0.844 0.65 13.8 43.00.8 21.012.70.811 0.83 6.7
E4 (ml/min) dE4 53.2-1.2 22.313.9 0.844 0.73 15.4 48.2-4.4 23.513.8 0.810 0.93 7.6
E9 (ml/min) dE9 51.40.6221.613.9 0.844 0.70 15.0 46.6
-2.822.713.5
0.810 0.90 7.4
E10 (ml/min/70kg) dE10 58.92.7 28.816.2 0.885 0.74 13.5 51.7-1.0 24.115.3 0.792 0.82 10.3
E11F (ml/min) dEllF 48.93.1
25.118.8 0.730 0.71 12.2 43.90.0 20.916.7 0.674 0.69 13.8
* p<0.05 ** p<0.02
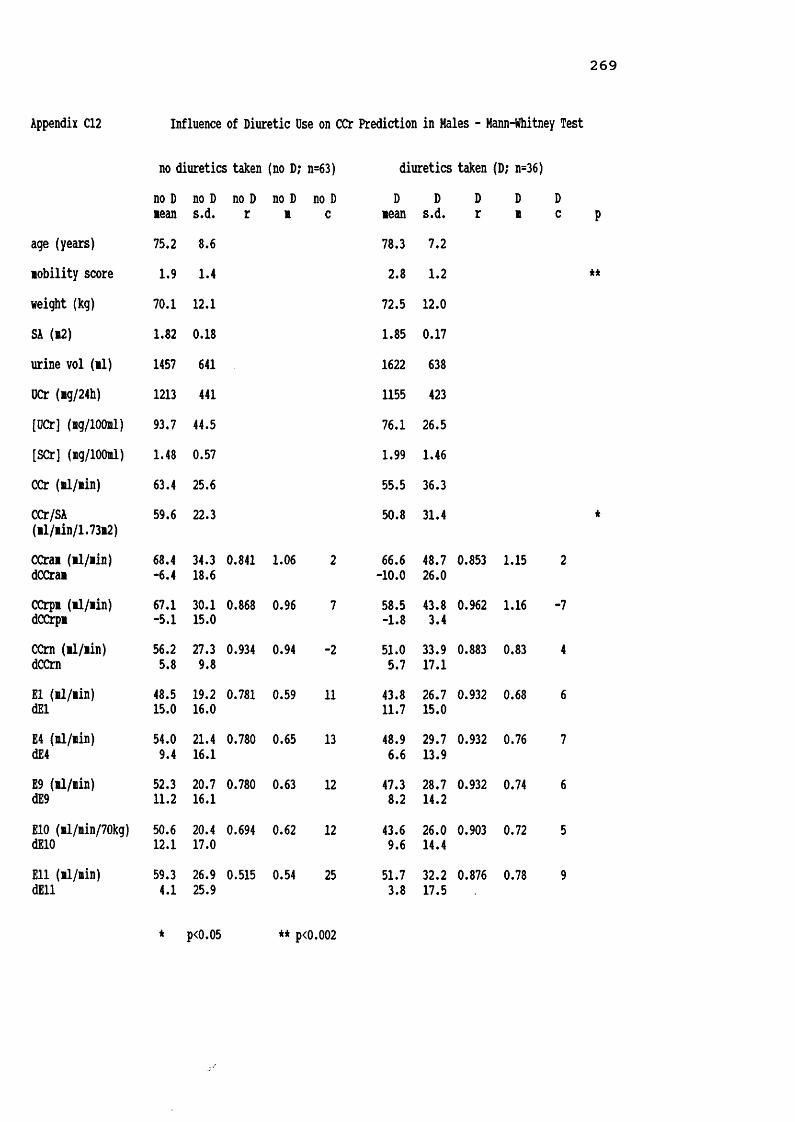
Appendix C12 Influence of Diuretic Use on CCr Prediction in Hales - Mann-Whitney Test
no diuretics taken (no D; n=63) diuretics taken (D; n=36)no D nean no D s.d. no D r no D n no D c Dnean Ds.d. Dr Dn
age (years) 75.2 8.6 78.3 7.2nobility score 1.9 1.4 2.8 1.2weight (kg) 70.1 12.1 72.5 12.0SA (n2) 1.82 0.18 1.85 0.17urine vol (il) 1457 641 1622 638UCr (ng/24h) 1213 441 1155 423[UCr] (ng/lOOnl) 93.7 44.5 76.1 26.5[SCr] (ng/lOOml) 1.48 0.57 1.99 1.46CCr (nl/nin) 63.4 25.6 55.5 36.3CCr/SA(nl/nin/1.73n2) 59.6 22.3 50.8 31.4
CCrai (il/iin) dCCrai 68.4-6.4 34.318.6 0.841 1.06 2 66.6-10.0 48.726.0
0.853 1.15
CCrpn (il/iin) dCCrpn 67.1-5.1 30.115.0 0.868 0.96 7 58.5-1.8 43.83.4 0.962 1.16
CCm (nl/nin) dCCrn 56.25.8 27.39.8 0.934 0.94 -2 51.05.7 33.917.1 0.883 0.83
El (nl/nin) dEl 48.515.0 19.216.0 0.781 0.59 11 43.811.7 26.715.0 0.932 0.68
E4 (nl/nin) dE4 54.09.4 21.416.1 0.780 0.65 13 48.96.6 29.713.9 0.932 0.76
E9 (nl/nin) dE9 52.311.2 20.716.1 0.780 0.63 12 47.38.2 28.714.2 0.932 0.74
E10 (nl/nin/70kg) dE10 50.612.1 20.417.0 0.694 0.62 12 43.69.6 26.014.4 0.903 0.72
Ell (nl/nin) dEll 59.34.1 26.925.9 0.515 0.54 25 51.73.8 32.217.5 0.876 0.78
* p<0.05 ** p<0.002

270
Appendix C13 Influence of 24h CCr on prediction of CCr in Females - Mann-Whitney TestCCr/SA > 50il/nin/1.73m2 (n=75) CCr/SA < 50ml/iin/1.73m2 (n=71)
> 50 mean
> 50 s.d. > 50
r> 50 m
> 50 c
< 50 mean< 50 s.d. < 50 r
< 50 m < 50
cage (years) 74.3 8.1 80.1 7.6mobility score 1.5 0.9 2.8 1.3weight (kg) 62.0 11.1 59.4 14.4SA (m2) 1.64 0.16 1.63 0.27urine volume (ml) 1522 551 1220 582UCr (mg in 24h) 987 280 649 247[SCr] (ng/lOOml) 1.09 0.35 1.70 0.8124h CCr (ml/min) 66.4 18.6 30.0 12.224h CCr/SA (ml/min/1.73m2) 70.6 22.3 32.0 11.5
dCCramtCCram -2.2104.8 15.223.3 0.825 1.07 -2.9 -1.9101.0 11.437.4 0.807 1.21 -4.3
dCCrpmfcCCrp* -4.9107.3 17.226.7 0.783 1.05 1.6 -1.7107.5 13.247.6 0.679 0.98 2.2
dCCmICCra 4.393.8 11.716.0 0.861 0.96 -1.6 0.598.38.630.2 0.806 0.93 1.4
dElIE1 10.1122.2 12.535.8 0.773 0.77 5.4 -4.797.1 10.232.6 0.776 1.03 3.7
dE4m
3.6109.5 13.331.9 0.775 0.86 5.9 -8.886.6 11.628.9 0.775 1.15 4.3
dE9%E9 5.6
113.2 13.033.0 0.775 0.83 5.7 -7.589.5
11.229.9 0.775 1.11 4.1
dElOIE10 8.5116.0 14.936.5 0.866 0.84 3.9 -6.694.8 13.033.6 0.668 0.92 9.6
dEHF%E11F 9.8130.5 17.240.2 0.746 1.03 -12.1 -6.7
89.214.733.8
0.455 0.57 19.4
P**
**
*
**
**
**
**
* p<0.001 ** p<0.0001

Appendix C14 Influence of 24h CCr on prediction of CCr in Hales - Mann-Whitney TestCCr/SA > 50ml/min/I.73m2 (n=58) CCr/SA < 50ml/min/1.73m2 (n=41)
> 50 mean > 50 s.d. > 50 r
> 50 m > 50 c< 50 mean
< 50 s.d.< 50 r
< 50 m < 50 c P
age (years) 74.0 7.0 79.6 8.7 ***nobility score 1.7 1.1 2.9 1.4 ****veight (kg) 73.6 11.6 67.2 11.9 *SA (i2) 1.87 0.17 1.77 0.18 *urine volume (ml) 1675 715 1294 437 *DCr (mg in 24h) 1361 411 953 346 ****[OCr] (mg/lOOml) 92.7 41.6 79.5 35.9[SCr] (mg/lOOml) 1.24 0.35 2.28 1.3024h CCr (ml/min) 79.3 23.1 34.0 14.6 ****24b CCr/SA (nl/nin/1.73m2) 73.3 18.9 32.5 12.9 ****
dCCramiCCram -9.8111.3 21.526.1 0.791 1.10 2 -5.8113.9 23.869.8 0.592 1.25 -2
dCCrpmiCCrpm -4.4104.6 12.317.3 0.925 1.16 -8 -2.6106.517.042.2
0.672 1.11 -1
dCCrnICCm 8.788.4 15.318.5 0.830 0.92 -2 1.797.5 9.425.6 0.793 0.86 3 **
**dEl%E1 20.7142.5 15.639.6 0.744 0.64 8 30.0116.3 12.630.7 0.780 0.68 7 ********dE4IE4 14.0127.7 16.235.4 0.744 0.71 9 0.5104.0
9.627.5 0.777 0.75 8 ********dE9%E9 16.1132.1 16.036.6 0.744 0.68 9 1.6107.5 0.5106.9 0.778 0.73 8 ********dElO%E10 16.9136.3 16.839.9 0.667 0.67 8 3.2117.7 10.933.2
0.696 0.76 5 *****dEll%E11 9.5
123.2 24.739.2 0.533 0.63 20 -3.799.4
18.236.0 0.433 0.58 18 ******
* p<0.05 ** p<0.006 ***p<0.001 **** p<0.0003

2 7 2
Appendix C15 All Fit v Frail Females in CCr Prediction Study - Mann-Whitney Test
all fit females (n=91) all frail females (n=55)all fit all fit all fit all fit all fit frail frail frail frail frail
mean s.d. r m c mean s.d. r m cage (years) 74.0 7.5 82.4 7.0mobility score 1.2 0.4 3.6 0.6weight (kg) 62.8 11.2 57.5 14.6SA (m2) 1.65 0.16 1.61 0.29urine volume (ml) 1578 517 1039 536UCr (mg in 24h) 934 239 639 335[SCr] (mg/lOOml) 1.24 0.42 1.63 0.9424h CCr (ml/min) 56.6 19.5 35.5 25.524h CCr/SA (ml/min/1.73m2) 59.6 20.7 39.0 29.5
dCCramtCCram -0.399.4 13.324.7 0.867 1.05 -2.5 -4.2106.513.139.1 0.921 1.14 -1.1
dCCrpmICCrpm -3.8107.9 11.923.7 0.882 1.01 3.0 -2.8106.9 18.753.6 0.841 1.11 -1.2
dCCm%CCm 2.596.6 11.125.8 0.877 0.91 2.8 2.396.1 9.424.4 0.934 0.91 0.9
dEl%E1 6.4114.8 12.527.4 0.768 0.63 14.4 -2.898.4 13.545.9 0.856 0.83 9.0
dE4IE4 0.6102.9 12.724.3 0.771 0.71 16.1 -7.687.5 14.440.9 0.856 0.93 10.1
dE9%E9 2.5106.4 12.625.1 0.770 0.68 15.5 -6.290.5
14.142.2 0.856 0.90 9.8
dElOIE10 5.1109.5 14.326.2 0.809 0.63 18.8 -5.396.3 16.448.0 0.860 0.90 9.8
dEllFIE11F 8.8121.0 13.9
30.7 0.712 0.59 14.7 -9.687.1 18.349.7
0.855 1.05 7.7
P****
****
***
*
****
*****
****
********
*******
********
********
********
* p<0.05 ** p<0.005 *** p<0.0005 **** p<0.0001

273
Appendix C16 Very Fit v Fit Females - CCr Prediction Study - Mann-Whitney Test
very fit females (n=17) fit females (n=17)v.fitmean v.fits.d. v.fitr
v.fitm
v.fitcfitmean
fits.d. fitr fitm fitcage (years) 69.4 4.5 69.1 4.7mobility score 1.0 0.0 1.1 0.2weight (kg) 61.5 9.2 65.9 9.8SA (m2) 1.63 0.13 1.70 0.13urine volume (ml) 1613 500 1605 496UCr (mg in 24h) 1000 139 981 217[SCr] (ng/lOOml) 1.27 0.49 1.17 0.2224h CCr (ml/min) 59.4 15.5 61.2 21.124h CCr/SA (ml/min/1.73m2) 63.6 18.9 62.5 21.9
dCCraitCCram -3.2105.3 3.35.3 0.978 0.97 5.4 6.187.4 12.022.2 0.928 1.1 -15.0
dCCrpmICCrpm -0.1100.1 4.46.6 0.967 1.0 -2.7 -8.6115.4 10.819.2 0.919 0.99 9.2
dCCrn$CCrn 1.897.0 3.55.6 0.965 1.0 -2.8 2.098.1 4.65.8 0.986 0.90 4.8
dEl%E1 7.5118.6 14.126.7 0.565 0.53 20.4 3.9105.6 12.920.5 0.800 0.55 24.0
dE4%E4 1.8
106.814.723.9 0.570 0.59 22.3 -2.595.1
12.718.4 0.802 0.61 26.5
dE9IE9 3.7110.5 14.524.7 0.570 0.57 21.6 -0.498.3 12.719.0 0.802 0.59 25.7
dE10IE10 7.4113.5 17.026.1 0.713 0.50 27.4 1.3100.512.719.1 0.889 0.59 25.8
dEHFIE11F 11.5126.7 8.320.2 0.847 0.73 4.7 11.7123.0 13.626.9 0.791 0.47 20.8
* p<0.03

274
Appendix C17 Fit v Frail Females - CCr Prediction Study - Mann-Whitney Test
fit females (n=38) frail females (n=38)fitmean fits.d. fitr fitm fit
Cfrailmean frails.d. frailr frailm frailc
age (years) 79.8 5.9 79.9 6.1mobility score 1.3 0.5 3.6 0,6weight (kg) 62.0 13.0 59.0 14.8SA (m2) 1.64 0.19 1.61 0.24urine volume (ml) 1422 488 1082 604OCr (mg in 24h) 851 256 661 371[SCr] (mg/lOOml) 1.28 0.50 1.63 1.0124h CCr (ml/min) 52.0 22.3 37.7 28.524h CCr/SA (ml/min/1.73m2) 54.8 22.9 41.3 34.0
dCCramICCram 0.497.4 14.725.3
0.863 1.06 -3.9 -4.5108.2 14.743.0 0.915 1.12 -0.4
dCCrpi%CCrpm -3.8108.0 14.128.2 0.869 1.05 0.9 -4.5110.4 21.961.4 0.827 1.10 0.4
dCCrntCCrn 1.998.9 13.230.8 0.841 0.84 7.0 3.692.8 10.525.6 0.933 0.92 -0.6
dElIE1 6.5115.8 12.828.4 0.818 0.67 10.8 -3.794.5 15.247.2
0.849 0.79 11.6
dE4m 0.9103.2 13.025.1 0.819 0.75 12.2 -8.784.3 16.142.1 0.849 0.89 13.0
dE9%E9 2.6106.7 12.926.0 0.819 0.72 11.8 -7.287.2 15.743.6 0.849 0.86 12.6
dE10%E10 5.4110.4 14.427.0 0.829 0.64 16.4 -6.492.2 17.548.4 0.872 0.88 12.1
dEllF 5.5 15.3 0.731 0.59 16.0 -10.3 19.7 0.841 1.07 7.5
****
**
**
***
IE11F 114.0 33.6 88.5 55.7
***
***
***
**
***
* p<0.002 ** p<0.001 *** p<0.0005 **** p<0.0001

2 7 5
Appendix C18 Very Fit v Frail Feiales - CCr Prediction Study - Mann-Whitney Test
very fit feiales (n=8) frail feiales (n=8)v.fitlean v.fits.d. v.fit
rV.fit1 v.fitc fraillean
frails.d.
frailr
frailB
frailc
age (years) 72.5 4.2 72.4 4.6■obility score 1.0 0.0 3.6 0.5weight (kg) 62.4 10.1 60.1 16.9SA (i2) 1.64 0.13 1.62 0.32urine voluie (il) 1721 525 1043 498OCr (ig in 24h) 1035 113 629 210[SCr] (ig/lOOil) 1.31 0.69 1.56 1.3724h CCr (nl/nin) 61.8 16.2 43.6 41.024h CCr/SA (il/iin/1.73i2) 66.0 20.6 48.4 49.8
dCCraiICCrai -1.5102.0 4.05.7 0.893 0.96 4.6 -18.0132.5 27.890.1 0.919 1.07 14.1
dCCrpiICCrpi -1.3101.8 5.27.1 0.855 1.02 -0.5 7.088.2 7.432.1 0.992 0.99 -6.3
dCCrnICCrn 0.899.3 4.05.3 0.883 0.84 11.8 0.593.0 15.238.9 0.980 1.12 -6.9
dEl%E1 11.7125.8 10.020.5 0.787 0.62 12.0 -7.379.4 11.525.2 0.965 0.83 14.5
dE4m
6.0113.0 10.113.8 0.790 0.69 12.9 -13.071.3
10.722.6 0.965 0.94 15.9
dE9IE9 7.9116.9 10.019.0 0.790 0.67 12.5 -11.273.8 10.823.4 0.965 0.90 15.4
dE10IE10 11.8120.6 13.620.9 0.903 0.61 16.0 -11.276.3 12.522.6 0.978 0.94 14.4
dEllFIE11F 13.9133.8
4.818.6 0.955 0.93 -9.4 -11.780.8 16.826.5 0.961 1.21 2.4
* p<0.05 ** p<0.01 *** p<0.005 **** p<0.002
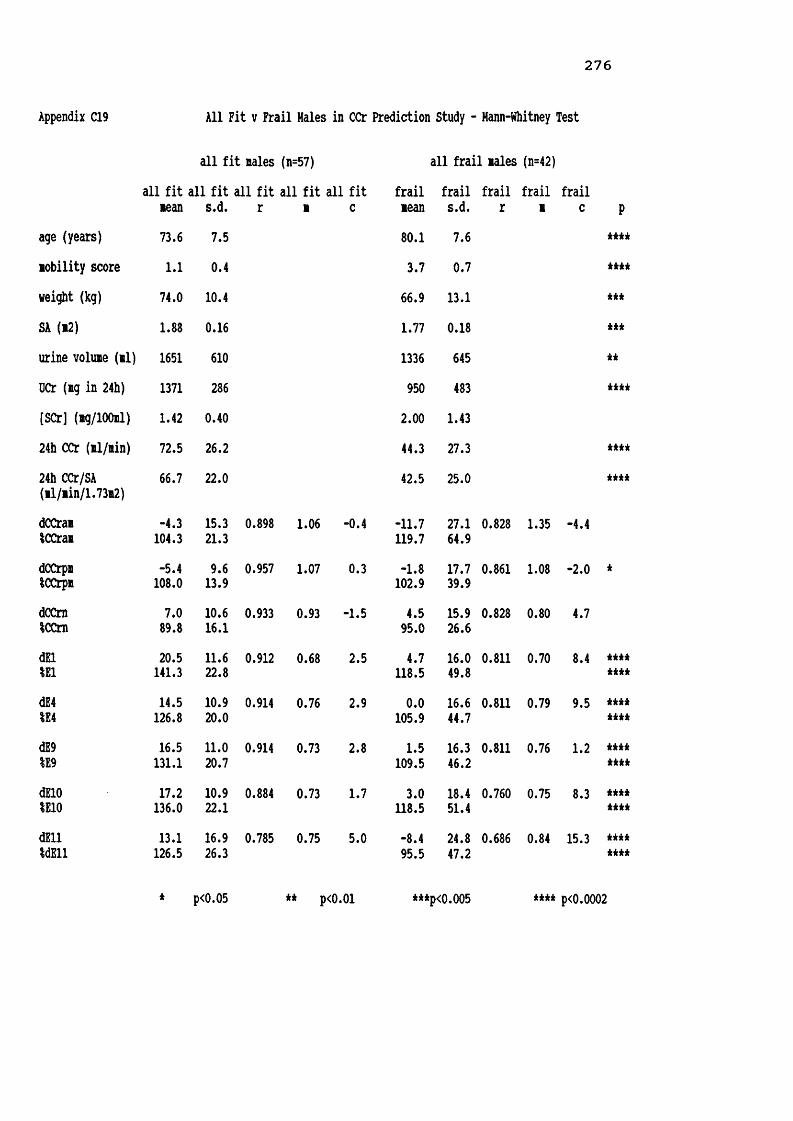
2 7 6
Appendix C19 All Fit v Frail Hales in CCr Prediction Study - Hann-Whitney Test
all fit nales (n=57) all frail Bales (n=42)all fit all fit all fit all fit all fit frail frail frail frail frail
Bean s.d. r B C Bean s.d. r B Cage (years) 73.6 7.5 80.1 7.6Bobility score 1.1 0.4 3.7 0.7weight (kg) 74.0 10.4 66.9 13.1SA (b2) 1.88 0.16 1.77 0.18urine voluie (ul) 1651 610 1336 645UCr (ng in 24h) 1371 286 950 483[SCr] (ag/lOOnl) 1.42 0.40 2.00 1.4324b CCr (Bl/ain) 72.5 26.2 44.3 27.324b CCr/SA (Bl/Bin/1.73n2) 66.7 22.0 42.5 25.0
dCCraiiCCras -4.3104.3 15.321.3 0.898 1.06 -0.4 -11.7119.7 27.164.9 0.828 1.35 -4.4
dCCrpnSCCrpa -5.4108.0 9.613.9 0.957 1.07 0.3 -1.8102.9 17.739.9 0.861 1.08 -2.0
dCCrnICCrn 7.089.8 10.616.1 0.933 0.93 -1.5 4.595.0 15.926.6 0.828 0.80 4.7
dEl%E1 20.5141.3 11.622.8 0.912 0.68 2.5 4.7118.5 16.049.8 0.811 0.70 8.4
dE4%E4 14.5126.8 10.920.0 0.914 0.76 2.9 0.0105.9
16.644.7 0.811 0.79 9.5
dE9%E9
16.5131.1
11.020.7 0.914 0.73 2.8 1.5109.5
16.346.2 0.811 0.76 1.2
dElO%E10 17.2136.0 10.922.1 0.884 0.73 1.7 3.0118.5 18.451.4 0.760 0.75 8.3
dEll%dEll 13.1
126.516.926.3 0.785 0.75 5.0 -8.495.5
24.847.2 0.686 0.84 15.3
P****
****
******
****
**** * * * < i
* p<0.05 ** p<0.01 ***p<0.005 **** p<0.0002

2 7 7
Appendix C20 Very Fit v Fit Hales - CCr Prediction Study - Hann-Whitney Test
very fit males (n=12) fit males (n=12)v.fitmean v.fits.d. V.fitr v.fitm v.fitc fitmean fits.d. fitr fitm fitc
age (years) 68.5 3.2 68.7 3.3mobility score 1.0 0.0 1.3 0.8weight (kg) 76.4 8.5 69.8 14.2SA (m2) 1.91 0.13 1.81 0.24urine volume (ml) 1765 743 1437 526OCr (mg in 24h) 1573 230 1225 381[SCr] (mg/lOOml) 1.47 0.32 1.38 0.3724h CCr (ml/min) 78.3 23.3 65.7 20.124h CCr/SA (ml/min/1.73m2) 70.8 20.0 62.5 15.8
dCCramICCram -4.0102.9 15.220.7
0.896 1.20 -10.9 -4.9104.916.523.2
0.937 1.39 -19.9
dCCrpmICCrpm -5.3110.0 9.917.6 0.913 0.83 18.5 -7.6113.0 9.012.9 0.958 1.11 0.3
dCCra%CCm 9.187.0 7.19.2 0.959 0.99 -8.5 10.184.3 18.426.7 0.722 0.66 11.7
dEl%E1 24.7145.2 13.520.9 0.886 0.48 16.2 13.0124.3 10.218.9 0.882 0.61 12.4
dE4IE4 18.877.8 12.611.1 0.887 0.53 17.7 7.391.0 9.813.1 0.879 0.68 13.8
dE9IE9 20.8135.5 12.919.3 0.886 0.52 17.1 9.2116.0
9.917.8 0.879 0.66 13.4
dElO%E10 20.8140.0 12.019.6 0.887 0.46 18.0 10.1119.5 10.018.6 0.822 0.75 6.8
dEllFIE11F 23.3141.6 13.219.3 0.883 0.50 15.8 3.5
112.124.035.9 0.321 0.34 40.0
**
**
**
**
* p<0.03 ** p<0.02

2 7 8
Appendix C21 Fit v Frail Hales - CCr Prediction Study - Hann-Whitney Test
fit nales (n=31) frail nales (n=31)fitnean fit
s.d. fitrfitn
fitc
frailnean
frails.d.
frailr
frailn
frailc P
age (years) 78.0 6.9 77.9 6.9nobility score 1.2 0.5 3.6 0.6 i t * * *
weight (kg) 72.8 10.5 66.0 11.0 *SA (i2) 1.86 0.16 1.76 0.16 *urine volune (nl) 1546 472 1399 706OCr (ng in 24h) 1260 240 993 532 ****[SCr] (ng/lOOml) 1.46 0.42 1.60 0.7724h CCr (nl/nin) 64.9 19.5 49.2 25.3 **24h CCr/SA (nl/nin/1.73i2) 60.5 17.5 47.7 23.7 i t
dCCraniCCran -2.2102.3 15.021.8 0.911 1.00 2.5 -17.5139.1 27.571.3 0.667 1.01 17.2 i t*dCCrpn%CCrpn -7.0109.8 8.612.6 0.975 1.08 0.8 -3.1103.9 21.947.3
0.787 1.13 -4.0
dCCrniCCrn 6.190.0 9.317.9 0.961 0.97 -3.9 4.792.3 17.330.2 0.788 0.90 0.9
dEl 18.4142.6 10.225.2 0.855 0.69 1.6 5.6119.8 18.356.8 0.700 0.57 15.4 **** i t i t i t it
dE4%E4 12.880.8 10.0
13.7 0.860 0.78 1.6 0.4109.6 18.942.1 0.699 0.64 17.4 ir irittfc****dE9%E9 14.6131.7 9.922.7 0.860 0.75 1.5 2.0110.8 18.752.7 0.699 0.62 16.8 i t i t i t it
i t i t i t i t
dElO%E10 15.8137.3 10.624.5 0.835 0.73 1.4 3.4116.7 21.257.1 0.653 0.63 15.8 ***
i t * * *
dEllF%E11F 8.5120.6 15.625.7 0.747 0.89 -1.4 -9.494.5 27.950.7 0.540 0.68 25.3 ********
* p<0.05 ** p<0.01 *** p<0.001 **** p<0.0005

279
Appendix C22 Very Fit v Frail Hales - CCr Prediction Study - Hann-Whitney Test
very fit nales (n=7) frail nales (n=7)v.fitnean v.fits.d. v.fitr V.fitn v.fitC frailnean frails.d. frailr frailn frailc
age (years) 69.3 3.4 69.1 3.3nobility score 1.0 0.0 3.4 0.5weight (kg) 76.6 8.8 64.0 11.3SA (n2) 1.91 0.15 1.76 0.16urine volune (nl) 1881 647 1675 645UCr (ng in 24h) 1519 145 1153 688[SCr] (ng/lOOnl) 1.44 0.30 1.57 0.8924h CCr (nl/nin) 76.0 15.5 58.4 29.324h CCr/SA (nl/nin/1.73n2) 68.7 12.7 57.9' 32.2
dCCran%CCran -6.3106.7 17.223.0 0.897 2.00 -62.5 -29.0151.3 38.777.1 0.626 1.48 3.1
dCCrpiICCrpn -3.0106.0 11.316.3 0.516 0.45 40.7 11.572.5 15.427.1 0.891 1.34 -29.6
dCCraICCm 8.387.8 8.010.3 0.808 0.88 -0.2 2.0104.3 21.437.2 0.357 0.30 35.4
dEl%E1 22.2143.0 10.023.0 0.766 0.57 10.7 7.7129.9 27.483.3 0.491 0.41 26.8
dE4m
16.379.2 9.912.3 0.772 0.64 11.0 2.1116.9 28.571.6 0.491 0.46 29.7
dE9%E9 18.3133.3 9.921.2 0.772 0.62 10.7 4.0121.2 28.177.6 0.491 0.44 28.8
dE10IE10 18.8137.7 10.222.2 0.662 0.41 22.7 5.4127.1 33.984.0 0.589 0.58 22.9
dEllF%E11F 20.5137.6 8.415.1 0.851 0.62 8.5 -10.5108.0 40.572.3 0.473 0.73 26.4
* p<0.05 ** p<0.0001

280
Appendix D1INFORMATION SHEET FOR WATER TABLET STUDY
Dr. Parker is carrying out a project with the St. Marks Road GP's surgery, and the Research Institute for the Care of the Elderly, St. Martins Hospital, looking at the way in which the water tablets you are taking are handled by your body. Thank you for helping us with this study.These instructions should be followed carefully during the period of the study. If you are not sure what to do at any time , then let someone know. Phone numbers are given at the bottom of this sheet.1) Take your water tablets (Frumil or Frusemide) at your usual time and write the exact time on this paper.2) After taking your tablets please empty your bladder
(pass water) as soon as you possibly can. Throw this specimen away into the toilet.
3) Each and every time you pass a urine specimen after this time, please collect it, in a container provided. Write on the container the time at which the urine was collected. ALL urine should be collected, even at night time. If you should happen to run out of containers in which to collect urine, a clean jam jar, or similar, covered in silver foil or paper, will do.
4) Exactly 24 hours later from the time of taking your water tablets, collect a final urine specimen & save it5) You may take your next water tablet once you have
collected the final urine specimen.6) Dr. Parker will call three times during the first day
of the study, to take blood samples, (during the day time), and once again the following morning.7) Please record how many times you eat meat during the
study and approximately how much you eat.8) Dr. Parker will ask you at what time you got up & went to bed on the study day, and how far you walked.
Very many thanks.
DAY URINE COLLECTION TO START
TIME WATER TABLET TAKEN
MEAT EATEN
IN CASE OF QUERY PLEASE DO NOT HESITATE TO CONTACTSUE ELLMERS (STUDY CO-ORDINATOR) AT WORK ON BATH 835866 OR
AT HOME ON BATH 834963

281
Appendix D2STUDY TO MEASURE FRUSEMIDE METABOLISM IN THE ELDERLY
Name : ..........................Study No..............Address : .........................Study Date............
........................... Mobility Score. . . .......................... Height/cm..........
Tel No. : .......................Weight/kg. . .
2......................... Surface area/mJ
Diagnoses : ...................................
D.O.BAgeG.P.
Continent or catheterised Drugs : .................
Intended Time for FRU to be taken :Time FRU taken : Dose FRU given :
INTENDED ACTUALBlood samples : 2 h ............ -.................4 h ............ -.................8 h ............ -.................
2 4 h ............ -.................Urine samples : Time Vol/ml
1) -...................2) -...................alcohol 3) -.............4) .......... -...................5) .......... -...................tobacco 6) ............ -...................7) ........................... - ................................................8) -...................meat 9) -.............
10) -...................11) -...................12) - ...................13) .......... -...................
TOTAL URINE VOL : IN HRSComments :RICE, St. Martins Hospital, Bath. Tel : 834963
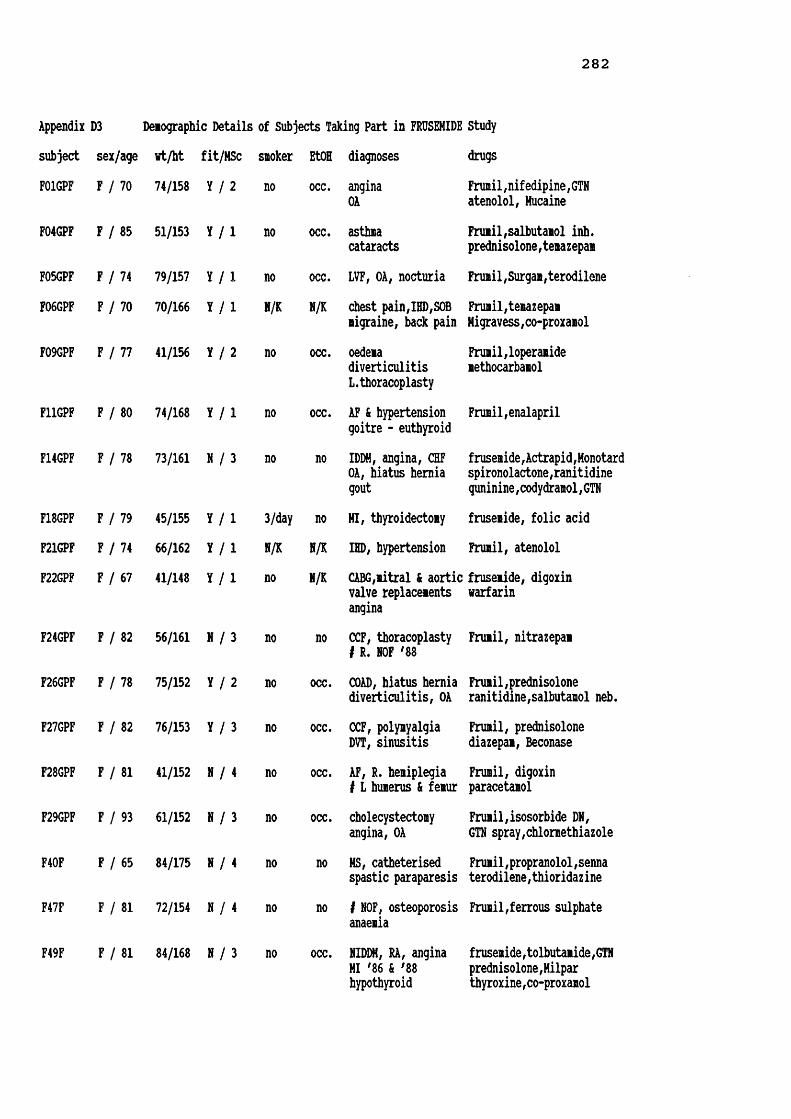
282
Appendix D3 Demographic Details of Subjects Taking Part in FRUSEMIDE Study subject sex/age wt/ht fit/MSc sioker EtOH diagnoses drugsF01GPF
F04GPF
70 74/158 Y / 2
85 51/153 Y / 1
no occ. anginaOAno occ. asthmacataracts
Frumi1,nifedipine,GTN atenolol, MucaineFrumil,salbutamol inh. prednisolone,temazepam
F05GPF F 74 79/157 Y / l no occ. LVF, OA, nocturia Frumil,Surgam,terodileneF06GPF F 70 70/166 Y / l N/K N/K chest pain,IHD,SOB migraine, back pain
Frumil,temazepam Higravess,co-proxamolF09GPF F 77 41/156 Y / 2 no occ. oedeiadiverticulitisL.thoracoplasty
Frumil,loperamide methocarbamol
F11GPF F 80 74/168 Y / l no occ. AF & hypertension goitre - euthyroid
Frumil,enalapril
F14GPF F 78 73/161 N / 3 no no IDDM, angina, CHF OA, hiatus hernia goutfrusemide,Actrapid,Monotard spironolactone,ranitidine guninine,codydramol,GTN
F18GPF F 79 45/155 Y / l 3/day no HI, thyroidectomy frusemide, folic acidF21GPF F 74 66/162 Y / l H/K N/K IHD, hypertension Frumil, atenololF22GPF F 67 41/148 Y / l no N/K CABG,iitral & aortic fruseiide, digoxin valve replaceients warfarin
anginaF24GPF F 82 56/161 N / 3 no no CCF, thoracoplasty # R. NOF '88 Frumil, nitrazepam
F26GPF F 78 75/152 Y / 2 no occ. COAD, hiatus hernia diverticulitis, OA Frumil,prednisolone ranitidine,salbutamol neb.F27GPF F 82 76/153 Y / 3 no occ. CCF, polymyalgia DVT, sinusitis
Frumil, prednisolone diazepam, Beconase
F28GPF F 81 41/152 N / 4 no occ. AF, R. hemiplegia i L humerus & femur Frumil, digoxin paracetamol
F29GPF F 93 61/152 N / 3 no occ. cholecystectomy angina, OA
Frumil,isosorbide DN,GTN spray,chlormethiazoleF40F F 65 84/175 N / 4 no no MS, catheterised spastic paraparesis Frumil,propranolol,senna terodilene,thioridazineF47F F 81 72/154 N / 4 no no 1 NOF, osteoporosis anaemia
Frumil,ferrous sulphate
F49F F 81 84/168 N / 3 no occ. NIDDM, RA, angina HI '86 & '88 hypothyroidfrusemide,tolbutamide,GTN prednisolone,Hilpar thyroxine,co-proxamol

283
Appendix D3 Demographic Details of Subjects Taking Part in FRUSEMIDE Study (contd) subject sex/age wt/ht fit/MSc smoker EtOH diagnoses drugsF50FF51F
F52F
F55F
M02GPF
M03GPF
H07GPF M
M08GPF M
M10GPF M
M13GPF M
H16GPF M
M17GPF H
H25GPF M
M45F
M48F
M53F
M54F
100 38/152 N67 36/157 N
95 50/139 N
87 78/165 N
86 92/169 N
82 71/158 N
78 88/172 Y
78 69/172 Y
67 81/173 Y
67 78/176 Y
83 91/166 Y
84 93/175 N
69 64/162 Y
69 70/185 N
89 64/170 N
76 63/173 N
88 49/175 N
no 7/wk osteoporosis Frumil,Milpar,co-codamolheavy occ. muscular dystrophy frusemide,spironolactoneGU, heart failure ranitidineno occ. pleural effusion Frumil, GTN
LVF temazepamno no CCF, COAD, OA frusemide,captopril,digoxin
chest infection prednisolone,isosorbide DNBecotide&salbutamol inh.no no LVF, COAD, anxiety Frumil, digoxintrigeminal neuralgia aminophyllineN/K N/K claudication, COAD Frumil, Beconasehypertension salbutamol inh.N/K N/K angina,asthma,gout Frumil,GTN,prednisolonecataracts & myopia aminophylline,allopurinolIHD, leg oedemaN/K N/K cardiac murmur Frumil,digoxin,Gavisconpartial gastrectomy nitrazepam,folic acidR. Dupytrons cytamenN/K N/K R leg ulcer Frumil,verapamil,dothiepincervical laminectomy carbamazepine,temazepamno no CHF, COAD, asthma Frumil,prednisoloneblind L eye, gout salbutamol&Atrovent nebspipe occ. LVF, hypertension Frumil, oxprenololvaricose leg ulcerno no LVF, hypertension Frumil,captopril,digoxinTURP, renal colic diclofenac,diazepamN/K N/K angina,LVFrenal calculus diverticulitis
no LVF, leg ulcersno
no
no
no
frusemide, captopril GTN, digoxin, aspirin
frusemide, captopril paracetamol, senna
yes LVF, peripheral frusemide,captopril,Milparvascular disease, morphine sulphate,thyroxinebelow knee amputationocc. CVA '89
flavoxate,Trental
Frumil,baclofen,aspirin bladder instability terodilene,co-proxamol Duovent & Bricanyl inh.no CVA '87, hypothyroid frusemide,sinemet,thyroxine
MI ;82, # NOF prednisolone,pivampicillin

284
Appendix D4 FRUSEMIDE in Urine and Serun of Subjects in FRU StudyFRU urine ng FRU cun SFRU tinesubject dose urine T.int [UFRU] vol in ng sanple fron [SFRU]start ig colln lins ig/dl ml urine UFRU tine 0 hour ncg/dl
F01GPF 40 0910 115 0.68 411 2.79 2.79 0915 2.00 31.33@ 0715 1020 70 0.36 340 1.21 4.00 1112 3.95 17.671121 61 0.45 154 0.69 4.69 1520 8.08 4.091233 72 0.87 69 0.60 5.29 0718 24.05 1.111402 89 1.15 53 0.61 5.901740 218 0.19 335 0.65 6.552000 140 0.07 290 0.19 6.742205 125 0.12 144 0.17 6.910430 385 0.01 720 0.04 6.950655 145 0.01 245 0.03 6.98
H02GPF 80 0715 75 2.19 185 4.05 4.05 0755 1.92 115.93§ 0600 0800 45 2.57 226 5.81 9.86 1000 4.00 41.070915 75 11.84 76 9.00 18.86 1405 8.08 14.551045 90 4.44 66 2.93 21.76 0605 24.08 4.281230 105 3.55 62 2.20 23.991500 150 3.09 58 1.79 25.781700 120 1.93 45 0.87 26.652000 180 1.57 72 1.13 27.782400 240 0.96 90 0.86 28.640600 360 0.50 125 0.63 29.27
M03GPF 80 0900 105 1.48 330 4.89 4.89 0915 2.00 129.68§ 0715 1100 120 0.00 545 11.73 16.62 1120 4.08 67.081215 75 2.27 385 8.74 25.36 1519 8.07 18.201715 300 2.32 164 3.80 29.16 0715 24.00 3.872300 345 1.83 134 2.45 31.610530 390 1.16 122 1.42 33.030720 110 1.00 8 0.08 33.11F04GPF 40 0845 75 1.58 60 0.95 0.95 0930 2.00 52.56§ 0730 0955 70 1.24 266 3.29 4.24 1135 4.08 23.771220 145 2.38 228 5.43 9.67 1535 8.08 12.091625 245 3.07 83 2.55 12.22 0740 24.00 0.001745 80 2.18 44 0.96 13.182120 215 1.81 80 1.45 14.630645 565 2.01 167 3.35 17.98F05GPF 40 0915 120 0.71 406 2.87 2.87 0915 2.00 29.00§ 0715 1105 110 1.03 217 2.23 5.10 1120 4.08 34.971335 150 1.00 228 2.28 7.38 1520 8.08 15.411635 180 0.86 154 1.32 8.70 0715 24.00 6.502115 280 0.49 237 1.15 9.850440 445 0.17 450 0.77 10.620645 125 0.08 220 0.17 10.79F06GPF 40 1147 107 0.61 432 2.65 2.65 1205 2.08 61.45§ 1000 1346 119 1.07 628 6.73 9.38 1407 4.12 40.851433 47 0.92 142 1.30 10.68 1800 8.00 7.171643 130 0.57 430 2.44 13.12 0947 23.78 0.001955 192 0.36 611 2.22 15.340600 605 0.39 230 0.89 16.230958 258 0.42 50 0.21 16.44

2 8 5
Appendix D4 FRUSEMIDE in Urine and Serum of Subjects in FRU Study (contd)FRU urine mg FRU cum SFRU time
subject dose urine T.int [UFRU] vol in mg sample from [SFRU]start mg colln mins mg/dl ml urine UFRU time 0 hour mcg/dlH07GPF 40 1020 75 0.93 108 1.00 1.00 1105 2.00 24.59§ 0905 1110 50 1.08 130 1.41 2.41 1300 3.92 17.84
1210 60 1.59 107 1.70 4.11 1720 8.25 3.421310 60 1.39 108 1.50 5.61 1544 30.65 0.001445 95 1.20 138 1.66 7.271615 90 0.70 150 1.05 8.322025 250 0.74 157 1.16 9.480030 245 0.25 165 0.41 9.890510 280 0.06 594 0.37 10.260900 230 0.04 318 0.13 10.39
M08GPF 40 1100 150 0.83 223 1.84 1.84 1030 2.00 34.18§ 0830 1600 300 1.74 212 3.68 , 5.52 1230 4.00 24.702030 270 1.19 232 2.77 8.29 1630 8.00 14.772315 165 0.77 88 0.68 8.97 0833 24.05 7.050700 465 0.51 232 1.19 10.160829 89 0.48 60 0.29 10.45
F09GPF 40 0845 85 1.72 339 5.82 5.82 0925 2.08 48.60§ 0720 1130 165 3.81 155 5.91 11.73 1120 4.00 28.111730 360 2.46 139 3.42 15.15 1520 8.00 13.492330 360 0.52 174 0.91 16.06 0722 24.030430 300 0.15 265 0.40 16.460700 150 0.23 100 0.23 16.69
H10GPF 40 2127 147 0.51 807 4.12 4.12 2110 2.17 42.06e 1900 2223 56 0.98 245 2.41 6.53 2245 3.75 39.91
2343 80 1.19 248 2.95 9.48 0925 14.42 15.040430 287 1.70 172 2.93 12.41 1905 24.08 16.250948 318 1.62 97 1.57 13.981300 192 1.63 62 1.01 14.991448 108 0.54 156 0.84 15.831642 114 0.38 168 0.63 16.461908 146 0.89 120 1.07 17.53
F11GPF 40 1000 120 1.15 435 5.01 5.01 1105 3.08 69.90§ 0800 1145 105 1.99 486 9.65 14.66 1303 5.05 20.831330 105 3.22 138 4.45 19.11 1605 8.08 1.061545 135 3.32 74 2.46 21.57 0818 24.30 0.001815 150 1.87 60 1.12 22.692130 195 0.86 122 1.05 23.740110 220 0.47 114 0.54 24.280530 260 0.05 110 0.06 24.340730 120 0.01 165 0.01 24.35
M13GPF 40 0950 175 0.47 528 2.46 2.46 0857 2.03 55.096 0655 1125 95 0.97 117 1.13 3.59 1058 4.05 19.661345 140 0.82 107 0.88 4.47 1520 8.42 0.00
1610 145 0.08 262 0.20 4.67 0705 24.17 0.002205 355 0.04 375 0.15 4.820650 525 0.00 555 0.00 4.82
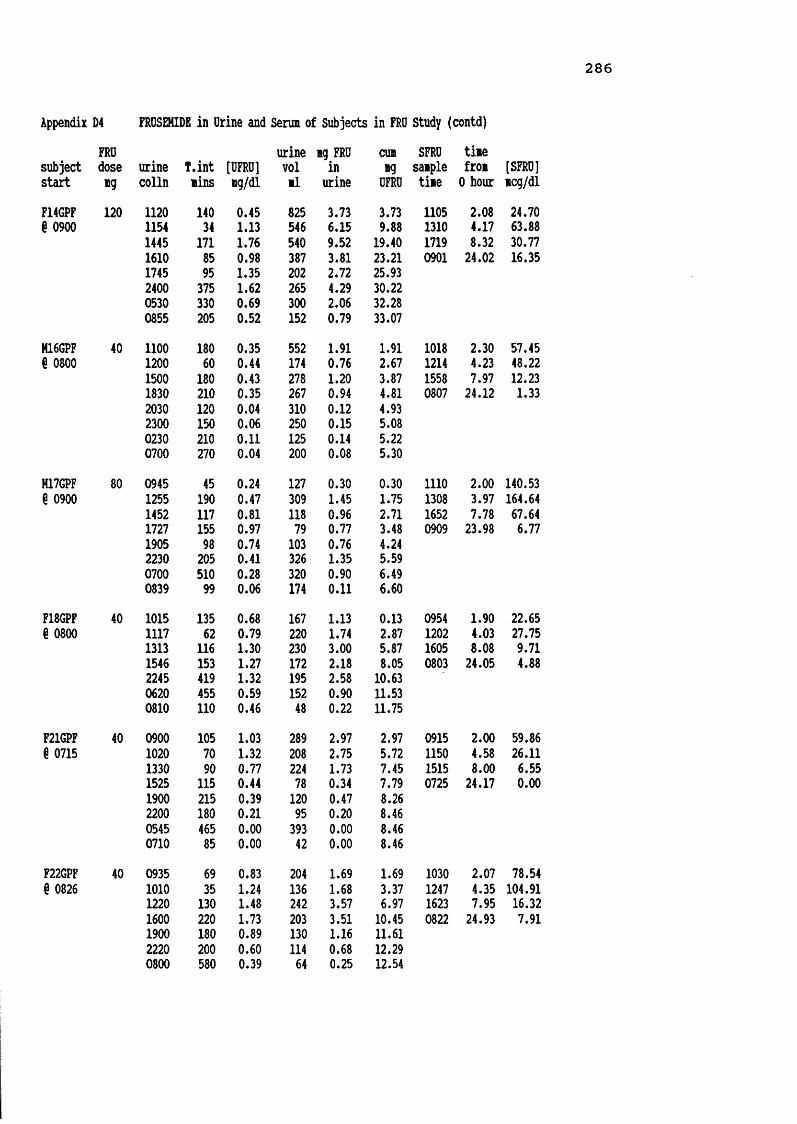
2 8 6
Appendix D4 FROSEHIDE in Drine and Serum of Subjects in FRO Study (contd)FRO urine mg FRO cum SFRO time
subject dose urine T.int [UFRO] vol in mg sample from [SFRO]start mg colln tins mg/dl ll urine OFRO time 0 hour mcg/dlF14GPF 120 1120 140 0.45 825 3.73 3.73 1105 2.08 24.70§ 0900 1154 34 1.13 546 6.15 9.88 1310 4.17 63.88
1445 171 1.76 540 9.52 19.40 1719 8.32 30.771610 85 0.98 387 3.81 23.21 0901 24.02 16.351745 95 1.35 202 2.72 25.932400 375 1.62 265 4.29 30.220530 330 0.69 300 2.06 32.280855 205 0.52 152 0.79 33.07
M16GPF 40 1100 180 0.35 552 1.91 1.91 1018 2.30 57.45§ 0800 1200 60 0.44 174 0.76 2.67 1214 4.23 48.22
1500 180 0.43 278 1.20 3.87 1558 7.97 12.231830 210 0.35 267 0.94 4.81 0807 24.12 1.332030 120 0.04 310 0.12 4.932300 150 0.06 250 0.15 5.080230 210 0.11 125 0.14 5.220700 270 0.04 200 0.08 5.30
H17GPF 80 0945 45 0.24 127 0.30 0.30 1110 2.00 140.53g 0900 1255 190 0.47 309 1.45 1.75 1308 3.97 164.64
1452 117 0.81 118 0.96 2.71 1652 7.78 67.641727 155 0.97 79 0.77 3.48 0909 23.98 6.771905 98 0.74 103 0.76 4.242230 205 0.41 326 1.35 5.590700 510 0.28 320 0.90 6.490839 99 0.06 174 0.11 6.60
F18GPF 40 1015 135 0.68 167 1.13 0.13 0954 1.90 22.65§ 0800 1117 62 0.79 220 1.74 2.87 1202 4.03 27.751313 116 1.30 230 3.00 5.87 1605 8.08 9.711546 153 1.27 172 2.18 8.05 0803 24.05 4.882245 419 1.32 195 2.58 10.630620 455 0.59 152 0.90 11.530810 110 0.46 48 0.22 11.75F21GPF 40 0900 105 1.03 289 2.97 2.97 0915 2.00 59.866 0715 1020 70 1.32 208 2.75 5.72 1150 4.58 26.11
1330 90 0.77 224 1.73 7.45 1515 8.00 6.551525 115 0.44 78 0.34 7.79 0725 24.17 0.001900 215 0.39 120 0.47 8.262200 180 0.21 95 0.20 8.460545 465 0.00 393 0.00 8.460710 85 0.00 42 0.00 8.46
F22GPF 40 0935 69 0.83 204 1.69 1.69 1030 2.07 78.54§ 0826 1010 35 1.24 136 1.68 3.37 1247 4.35 104.911220 130 1.48 242 3.57 6.97 1623 7.95 16.32
1600 220 1.73 203 3.51 10.45 0822 24.93 7.911900 180 0.89 130 1.16 11.612220 200 0.60 114 0.68 12.290800 580 0.39 64 0.25 12.54

2 8 7
Appendix D4 FRDSEHIDE in Drine and Serui of Subjects in FRO Study (contd)FRO urine ng FRO cun SFRU tinesubject dose urine T.int [UFRO] vol in ng sanple fron [SFRU]
start *g colln nins mg/di nl urine OFRO tine 0 hour ncg/dlF24GPF 40 1130 150 1.59 417 6.63 6.63 1100 2.00 38.54@ 0900 1555 265 1.76 350 6.17 12.80 1314 4.23 23.04
2135 340 1.32 44 0.58 13.38 1650 7.83 6.860830 655 1.35 235 3.18 16.56 0903 24.05 3.67M25GPF 40 1035 145 1.26 575 7.22 7.22 1022 2.20 24.98g 0810 1230 115 0.82 179 1.46 8.68 1216 4.10 9.51
1445 135 1.61 75 1.21 9.89 1608 7.97 0.001845 240 1.05 129 1.35 11.24 0800 23.83 0.002230 225 0.55 203 1.12 12.360345 315 0.46 171 0.78 13.140745 240 0.44 126 0.55 13.69
F26GPF 40 1000 90 0.72 235 1.69 1.69 1026 1.93 49.20§ 0830 1045 45 1.78 330 5.87 7.56 1230 4.00 21.521145 60 1.58 350 5.53 13.09 1630 8.00 0.001430 165 2.08 240 5.00 18.09 0822 23.87 0.000230 720 0.66 80 0.53 18.620545 195 1.02 128 1.31 19.930745 120 0.43 145 0.63 20.56
F27GPF 40 0935 65 1.57 58 0.91 0.91 1043 2.22 103.93@ 0830 1055 80 2.56 130 3.33 4.24 1247 4.28 131.311230 95 2.72 250 6.79 11.03 1655 8.42 19.051515 165 2.49 205 5.10 16.13 0838 24.13 0.002330 495 0.66 140 0.92 17.050545 375 1.13 160 1.80 18.850805 140 0.05 80 0.04 18.89
F28GPF 40 1000 120 2.48 168 4.17 4.17 1000 2.00 114.00@ 0800 1155 115 4.27 238 10.16 14.33 1153 3.88 107.861610 255 5.26 110 5.79 20.12 1606 8.10 44.86
2200 350 0.00 255 0.00 20.12 0755 23.92 4.880230 270 0.00 190 0.00 20.120800 330 0.00 320 0.00 20.12F29GPF 40 1010 130 1.04 48 0.50 0.50 0948 1.80 24.42§ 0800 1145 95 1.65 210 3.47 3.97 1202 4.03 46.24
1340 115 2.77 315 8.73 12.70 1555 7.92 30.732100 440 4.46 225 10.04 22.74 0732 23.53 0.000115 255 2.33 135 3.14 25.880740 385 1.01 175 1.76 27.64
F40F 40 1130 255 0.93 870 8.11 8.11 0930 2.25 51.85§ 0715 1640 310 2.53 120 3.03 11.14 1130 4.25 34.00
2015 215 3.83 90 3.45 14.59 1530 8.25 8.832400 225 2.58 180 4.65 19.24 0700 23.75 0.000400 240 0.33 350 1.14 20.380715 195 0.34 270 0.91 21.29

2 8 8
Appendix D4 FRUSEMIDE in Urine and Serna of Subjects in FRU Study (contd)FRU urine ng FRU cun SFRU tinesubject dose urine T.int [UFRU] vol in ng sanple fron [SFRU]start ng colln nins ng/dl nl urine UFRU tine 0 hour ncg/dl
M45F 80 0900 130 0.99 350 3.47 3.47 0930 2.67 32.57g 0650 1130 150 1.38 324 4.47 7.94 1137 4.79 19.091445 195 1.95 116 2.26 10.20 1540 8.84 8.642245 480 0.92 182 1.68 11.88 0700 24.17 2.000247 242 0.21 590 1.23 13.110630 223 0.49 655 3.21 16.320715 45 0.34 96 0.33 16.65F47F 80 1245 58 0.93 415 3.87 3.87 1337 1.83 45.39G 1147 1400 75 1.98 375 7.41 11.28 1600 4.22 22.061700 180 2.58 220 5.67 16.95 2000 8.22 4.38
2230 330 2.78 110 3.06 20.01 1125 23.37 1.670620 470 1.43 215 3.07 23.080945 205 1.19 115 1.37 24.451210 145 0.98 90 0.88 25.33M48F 40 1115 210 1.83 200 3.66 3.66 0955 2.17 127.35g 0745 1635 320 2.69 160 4.30 7.96 1145 4.00 92.010815 940 1.55 548 8.49 16.45 2140 13.92 38.920720 23.58 26.00F49F 40 1300 180 1.69 108 1.83 1.83 1155 1.92 70.10G 1000 1400 60 1.80 20 0.36 2.19 1615 6.25 0.001520 80 1.15 80 0.92 3.11 2145 11.75 0.001645 85 0.48 62 0.30 3.41 0715 21.25 0.002000 195 0.00 50 0.00 3.412130 90 0.00 18 0.00 3.410225 295 0.00 310 0.00 3.410550 205 0.00 178 0.00 3.410950 240 0.00 14 0.00 3.41F50F 40 0900 120 1.63 110 1.79 1.79 0945 2.75 108.00§ 0700 1115 135 1.62 102 1.65 3.44 1140 4.67 73.801615 300 3.11 30 0.93 4.37 2130 14.50 0.000015 480 1.50 30 0.45 4.82 0700 24.00 0.000700 405 0.39 200 0.77 5.59F51F 40 0855 100 2.52 410 10.33 10.33 0945 2.50 93.36G 0715 1025 90 1.57 225 3.54 13.87 1150 4.58 56.961120 55 2.85 75 2.14 16.01 1620 9.08 13.801200 40 0.23 225 0.52 16.53 0655 23.67 8.511340 100 4.61 80 3.69 20.221720 220 2.66 110 2.93 23.150630 790 1.07 260 2.77 25.92F52F 40 1120 195 2.46 188 4.62 4.62 0955 1.83 210.92§ 0805 1900 460 2.56 75 1.92 6.54 1130 3.42 230.242230 210 2.80 70 1.96 8.50 2120 13.25 27.740230 240 2.22 130 2.88 11.38 0742 23.62 11.920610 220 1.69 86 1.45 12.830750 100 1.69 36 0.61 13.44
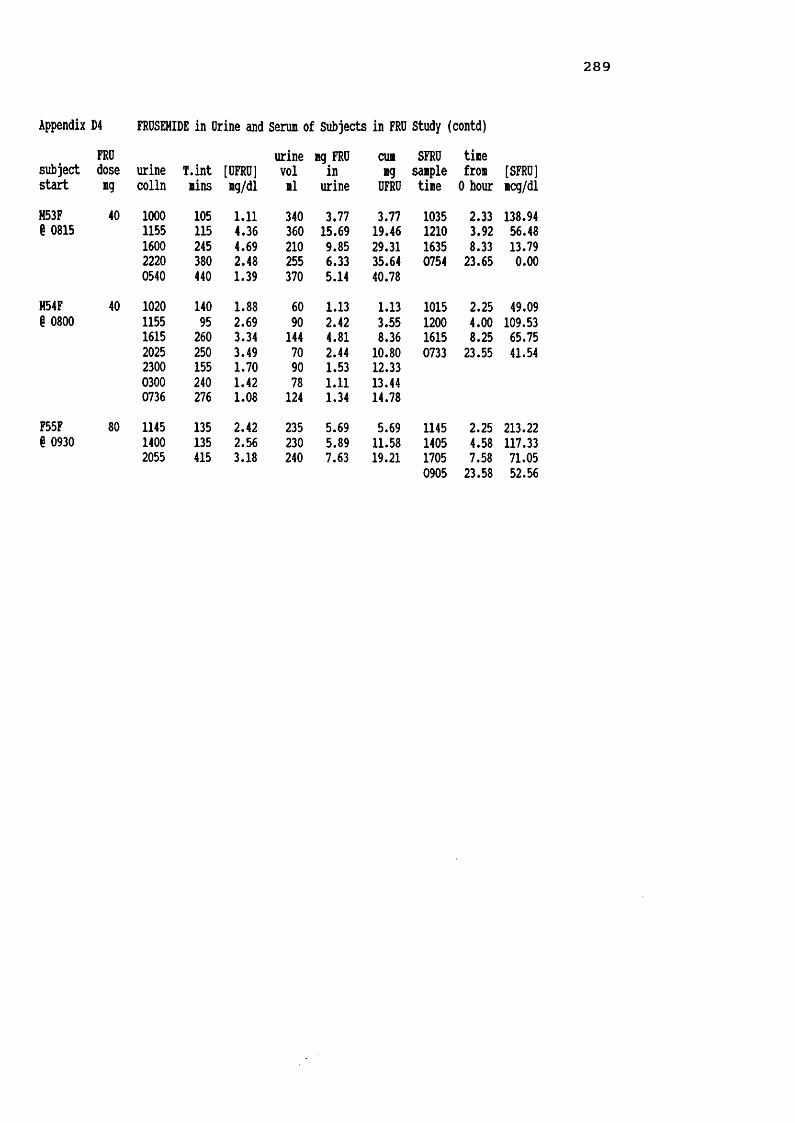
2 8 9
Appendix D4 FROSEHIDE in Drine and Serum of Subjects in FRU Study (contd)FRU urine ng FRU cun SFRU tinesubject dose urine T.int [UFRU] vol in ng sanple fron [SFRU]start ng colln nins ng/dl nl urine UFRU tine 0 hour ncg/dl
M53F 40 1000 105 1.11 340 3.77 3.77 1035 2.33 138.94§ 0815 1155 115 4.36 360 15.69 19.46 1210 3.92 56.481600 245 4.69 210 9.85 29.31 1635 8.33 13.792220 380 2.48 255 6.33 35.64 0754 23.65 0.000540 440 1.39 370 5.14 40.78H54F 40 1020 140 1.88 60 1.13 1.13 1015 2.25 49.09§ 0800 1155 95 2.69 90 2.42 3.55 1200 4.00 109.531615 260 3.34 144 4.81 8.36 1615 8.25 65.752025 250 3.49 70 2.44 10.80 0733 23.55 41.542300 155 1.70 90 1.53 12.330300 240 1.42 78 1.11 13.440736 276 1.08 124 1.34 14.78F55F 80 1145 135 2.42 235 5.69 5.69 1145 2.25 213.22§ 0930 1400 135 2.56 230 5.89 11.58 1405 4.58 117.332055 415 3.18 240 7.63 19.21 1705 7.58 71.050905 23.58 52.56

2 9 0
Appendix D5 SCr, UCr, & CCr, calculated over 8 & 24 hour periods, for Subjects in FRUSEMIDE Studytotal 24h 24h[SCr] urine T.int ng [DCr] urine CCr CCr % 24h SA CCrsubject ig/dl colln hours UCr ug/dl vol/ml nl/nin nl/nin CCr n2 1.73n2
F01GPF 1.16 1402 6.78 122.4 11.92 1027 26 432205 8.05 486.5 63.26 769 87 1450655 8.83 374.0 38.76 965 61 10223.66 982.9 35.60 2761 60 1.83 57
H02GPF 1.41 1500 9.00 438.3 65.12 673 58 942400 9.00 505.5 244.19 207 66 1060600 6.00 319.3 255.42 125 63 10224.00 1263.0 125.67 1005 62 2.10 51H03GPF 1.56 1215 5.00 227.9 18.09 1260 49 1532300 10.75 350.4 117.60 298 35 1090720 8.33 140.5 108.10 130 18 5624.08 718.9 42.59 1688 32 1.79 31F04GPF 1.00 1220 4.83 145.6 26.28 554 50 1142120 9.00 222.5 107.51 207 41 930645 9.42 249.8 149.58 167 44 10023.25 617.9 66.58 928 44 1.49 51F05GPF 1.70 1335 6.33 265.6 31.21 851 41 752115 7.67 440.6 112.69 391 56 1020645 9.50 611.4 91.26 670 63 11523.50 1317.8 68.92 1912 55 1.88 50F06GPF 1.03 1643 6.72 325.6 19.95 1632 78 1471955 3.20 150.2 24.58 611 76 1430958 14.05 304.3 108.67 280 35 6623.97 780.1 30.92 2523 53 1.81 50H07GPF 1.75 1615 7.17 479.6 64.73 741 64 1100030 8.25 520.5 161.66 322 60 1030900 8.50 465.0 50.99 912 52 9023.92 1465.3 74.19 1975 58 2.07 49H08GPF 2.70 1600 7.50 303.5 69.76 435 25 86
2315 7.25 360.1 112.54 320 31 1070829 9.23 463.1 158.60 292 31 10723.98 1126.6 107.6 1047 29 1.83 27
F09GPF 1.15 1130 4.17 142.9 28.93 494 50 1062330 12.00 349.9 111.78 313 42 890700 7.50 281.5 77.12 365 54 11523.67 774.3 66.07 1172 47 1.34 61M10GPF 1.32 2343 4.72 307.8 23.68 1300 82 1060948 10.08 580.7 215.88 269 73 959.33 585.2 115.66 506 79 10324.13 1473.9 71.03 2075 77 1.99 67F11GPF 1.46 1545 7.75 340.9 30.09 1133 50 942130 5.75 320.7 176.19 182 64 1210730 10.00 430.9 110.76 389 49 9223.50 1092.4 64.11 1704 53 1.88 49

291
Appendix D5 SCr, DCr, & CCr, calculated over 8 & 24h periods, for Subjects in FRUSEMIDE Study (contd)total 24h 24h[SCr] urine T.int ng [DCr] urine CCr CCr I 24h SA CCrsubject mg/dl colln hours DCr ig/dl vol/ml nl/nin nl/nin CCr 12 1.7312
M13GPF 1.30 1345 6.83 310.7 41.31 752 58 812205 8.33 632.3 99.27 637 97 1350650 8.75 407.9 73.49 555 60 83
23.91 1350.9 69.49 1944 72 1.96 64F14GPF 1.95 1445 5.75 334.4 17.50 1911 50 1092400 9.25 486.0 56.91 854 45 98
0855 8.92 462.8 102.38 452 44 9623.92 1282.9 39.88 3217 46 1.83 43M16GPF 1.59 1500 7.00 423.3 42.16 1004 63 912300 8.00 568.5 68.74 827 74 107
0700 8.00 532.1 163.72 325 70 10123.00 1523.9 70.68 2156 69 2.08 58H17GPF 4.19 1457 5.95 387.8 70.00 554 26 130
2230 7.55 357.9 70.45 508 19 950839 10.15 425.5 86.14 494 17 8523.65 1171.2 75.27 1556 20 2.15 16
F18GPF 1.11 1546 7.77 242.5 30.74 789 47 1042245 6.98 222.0 113.87 195 48 1070810 9.42 267.7 133.86 200 43 9624.17 732.3 61.85 1184 45 1.40 56
F21GPF 1.59 1330 6.25 305.3 42.35 721 51 1022200 8.50 419.2 143.06 293 52 1040710 9.17 427.2 98.20 435 49 9823.92 1151.7 79.48 1449 50 1.74 50F22GPF 1.41 1600 7.57 272.8 34.75 785 43 1652220 6.33 185.7 76.10 244 35 1350800 9.67 62.5 97.72 64 8 3123.57 521.1 47.68 1093 26 1.41 34F24GPF 1.28 1555 6.92 473.9 61.79 767 89 1782135 5.67 47.3 107.53 44 11 22
0830 10.92 382.3 162.70 235 46 9223.50 903.6 86.39 1046 50 1.60 54M25GPF 1.60 1445 6.58 274.6 33.12 829 43 862230 7.75 428.0 128.91 332 58 1160745 9.25 433.9 146.08 297 49 9823.58 1136.4 77.94 1458 50 1.71 51F26GPF 1.62 1430 6.00 168.3 14.57 1155 29 1000230 12.00 135.1 168.90 80 12 410745 5.25 357.6 130.98 273 70 241
23.25 661.0 43.83 1508 29 1.81 28F27GPF 3.34 1515 6.75 238.2 37.04 643 18 1292330 8.25 214.8 153.44 140 13 93
0805 8.58 199.7 83.19 240 12 8623.58 653.0 63.83 1023 14 1.83 13

2 9 2
Appendix D5 SCr, DCr, & CCr, calculated over 8 & 24h periods, for Subjects in FRUSEMIDE Study (contd)total 24h 24h[SCr] urine T.int ng [DCr] urine CCr CCr % 24b SA CCrsubject ng/dl colln hours DCr ng/dl vol/il nl/nin nl/nin CCr n2 1.73n2
F28GPF 2.77 1610 8.17 83.1 16.10 516 6 502200 5.83 150.2 58.90 255 16 1080800 10.00 263.4 51.65 510 16 108
24.00 496.4 38.75 1281 12 1.33 16F2SGPF 1.44 1340 5.67 110.8 19.34 573 23 852100 7.33 148.3 65.93 225 23 85
0740 10.67 293.8 94.78 310 32 11923.67 553.0 49.91 1108 27 1.63 29F40F 1.77 1130 4.25 135.0 15.52 870 30 97
2015 8.75 214.0 101.90 210 23 740715 11.00 450.0 56.25 800 39 12624.00 799.0 42.50 1880 31 2.15 25
M45F 3.20 1445 7.75 408.0 51.65 790 27 962245 8.00 245.0 134.62 182 16 570715 8.50 658.0 49.07 1341 40 14224.25 1311.0 56.68 2313 28 1.90 25
F47F 1.43 1700 5.21 183.0 18.12 1010 41 1242230 5.50 108.0 98.18 110 23 701210 13.67 396.0 94.29 420 34 10324.38 687.0 44.61 1540 33 1.72 33
M48F 1.66 1115 3.50 49.2 24.62 200 14 611635 5.33 132.6 82.89 160 25 1090815 15.67 383.8 70.03 548 25 10924.50 566.0 62.33 908 23 1.75 23F49F 0.72 1645 6.75 209.9 77.75 270 72 1312130 4.75 103.8 152.66 68 51 93
0950 12.33 336.2 66.98 502 63 11523.83 650.0 77.38 840 55 2.00 48F50F 3.34 1615 4.25 57.4 191.35 30 7 580700 14.75 442.0 192.17 230 15 125
1115 4.25 74.2 72.78 102 9 7523.25 573.0 158.29 362 12 1.28 17F51F 1.11 1340 6.42 391.7 38.59 1015 92 2631720 3.67 45.4 41.25 110 19 540630 13.16 115.0 44.24 260 13 37
23.25 552.1 39.86 1385 35 1.26 49F52F 2.91 1120 3.25 31.5 16.73 188 6 672230 11.17 111.5 76.90 145 6 67
0750 9.33 222.3 88.23 252 14 15623.75 365.0 62.39 585 9 1.41 11M53F 1.98 1600 8.00 797.8 87.67 910 84 3502220 7.33 223.9 87.79 255 26 1081020 12.00 380.4 78.92 482 25 11327.33 1420.0 86.22 1647 24 1.54 27

293
Appendix D5 SCr, DCr, & CCr, calculated over 8 & 24h periods, for Subjects m FRUSEMIDE Study (contd)
[SCr] urine T.intsubject ng/dl colln hoursM54F 1.78 161523000736
8.256.758.6023.60
F55F 1.81 14002055 4.506.9211.42
totalng [DCr] urine CCrDCr ng/dl vol/il ll/nin251.3 85.49 294 29183.3 114.59 160 25236.8 117.21 202 26671.0 102.29 656261.9 56.33 465 54333.9 139.14 240 44596.0 84.54 705
24h 24hCCr % 24h SA CCrnl/nin CCr n2 1.73n263545746 1.54 51
1.91
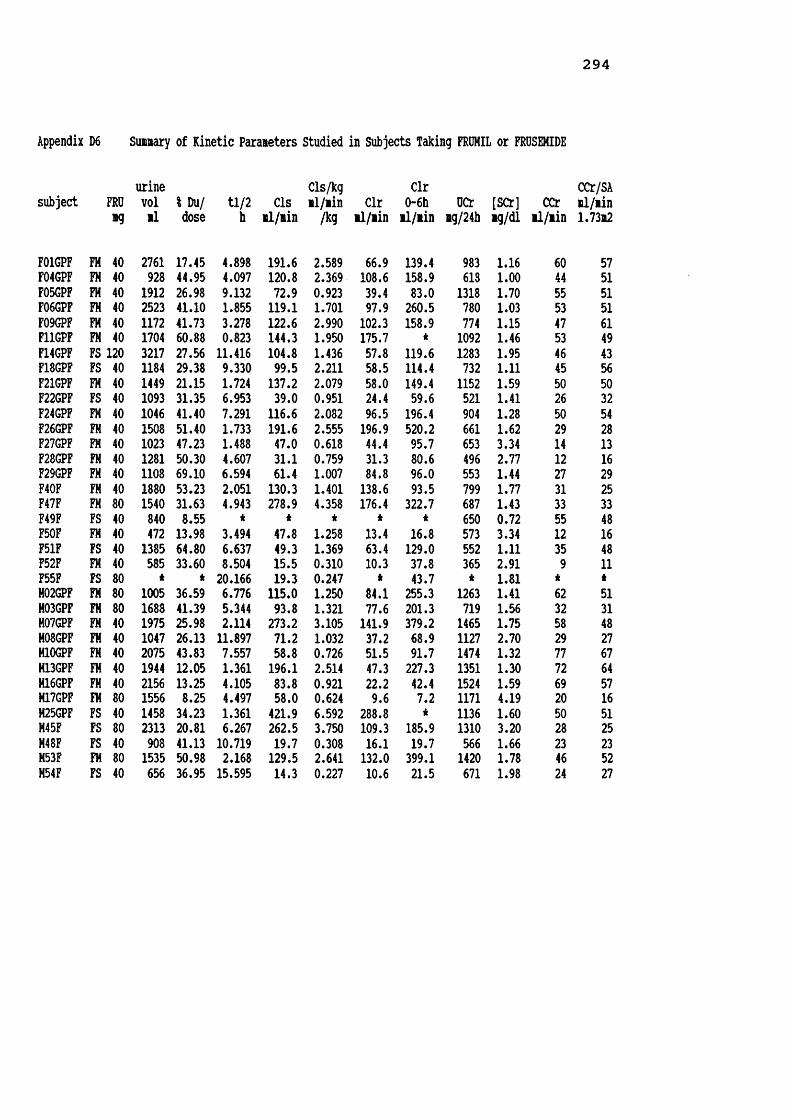
294
Appendix D6 Summary of Kinetic Parameters Studied in Subjects Taking FRUMIL or FRUSEMIDE
subject FRU urinevol 1 Du/ tl/2 CIS
Cls/kgml/min Clr
Clr0-6h UCr [SCr] CCr CCr/SA
ml/min
F01GPF FM
mg
40
ml
2761
dose
17.45
h
4.898
ml/min
191.6
/kg
2.589
ml/min
66.9
ml/min
139.4
mg/24h
983
mg/dl
1.16
ml/min
60
1.73m2
57F04GPF FH 40 928 44.95 4.097 120.8 2.369 108.6 158.9 618 1.00 44 51F05GPF FM 40 1912 26.98 9.132 72.9 0.923 39.4 83.0 1318 1.70 55 51F06GPF FM 40 2523 41.10 1.855 119.1 1.701 97.9 260.5 780 1.03 53 51F09GPF FM 40 1172 41.73 3.278 122.6 2.990 102.3 158.9 774 1.15 47 61F11GPF FM 40 1704 60.88 0.823 144.3 1.950 175.7 * 1092 1.46 53 49F14GPF FS 120 3217 27.56 11.416 104.8 1.436 57.8 119.6 1283 1.95 46 43F18GPF FS 40 1184 29.38 9.330 99.5 2.211 58.5 114.4 732 1.11 45 56F21GPF FM 40 1449 21.15 1.724 137.2 2.079 58.0 149.4 1152 1.59 50 50F22GPF FS 40 1093 31.35 6.953 39.0 0.951 24.4 59.6 521 1.41 26 32F24GPF FM 40 1046 41.40 7.291 116.6 2.082 96.5 196.4 904 1.28 50 54F26GPF FM 40 1508 51.40 1.733 191.6 2.555 196.9 520.2 661 1.62 29 28F27GPF FM 40 1023 47.23 1.488 47.0 0.618 44.4 95.7 653 3.34 14 13F28GPF FM 40 1281 50.30 4.607 31.1 0.759 31.3 80.6 496 2.77 12 16F29GPF FM 40 1108 69.10 6.594 61.4 1.007 84.8 96.0 553 1.44 27 29F40F FM 40 1880 53.23 2.051 130.3 1.401 138.6 93.5 799 1.77 31 25F47F FM 80 1540 31.63 4.943 278.9 4.358 176.4 322.7 687 1.43 33 33F49F FS 40 840 8.55 * * * * * 650 0.72 55 48F50F FM 40 472 13.98 3.494 47.8 1.258 13.4 16.8 573 3.34 12 16F51F FS 40 1385 64.80 6.637 49.3 1.369 63.4 129.0 552 1.11 35 48F52F FM 40 585 33.60 8.504 15.5 0.310 10.3 37.8 365 2.91 9 11F55F FS 80 * * 20.166 19.3 0.247 * 43.7 * 1.81 * *H02GPF FM 80 1005 36.59 6.776 115.0 1.250 84.1 255.3 1263 1.41 62 51H03GPF FM 80 1688 41.39 5.344 93.8 1.321 77.6 201.3 719 1.56 32 31M07GPF FM 40 1975 25.98 2.114 273.2 3.105 141.9 379.2 1465 1.75 58 48H08GPF FM 40 1047 26.13 11.897 71.2 1.032 37.2 68.9 1127 2.70 29 27M10GPF FM 40 2075 43.83 7.557 58.8 0.726 51.5 91.7 1474 1.32 77 67H13GPF FM 40 1944 12.05 1.361 196.1 2.514 47.3 227.3 1351 1.30 72 64H16GPF FM 40 2156 13.25 4.105 83.8 0.921 22.2 42.4 1524 1.59 69 57H17GPF FM 80 1556 8.25 4.497 58.0 0.624 9.6 7.2 1171 4.19 20 16M25GPF FS 40 1458 34.23 1.361 421.9 6.592 288.8 * 1136 1.60 50 51M45F FS 80 2313 20.81 6.267 262.5 3.750 109.3 185.9 1310 3.20 28 25M48F FS 40 908 41.13 10.719 19.7 0.308 16.1 19.7 566 1.66 23 23M53F FM 80 1535 50.98 2.168 129.5 2.641 132.0 399.1 1420 1.78 46 52M54F FS 40 656 36.95 15.595 14.3 0.227 10.6 21.5 671 1.98 24 27
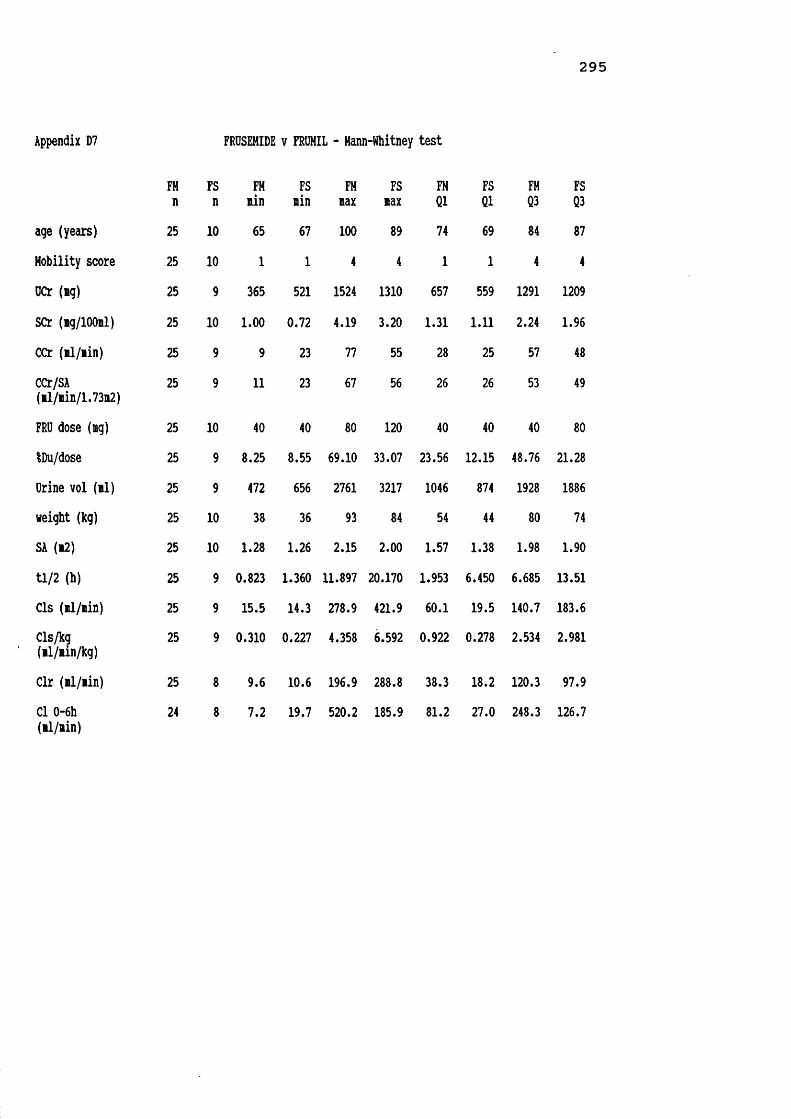
2 9 5
Appendix D7 FRUSEMIDE v FRUMIL - Mann-Whitney test
FM FS FM FS FM FS FM FS FM FSn n nin nin nax nax Q1 Q1 Q3 Q3age (years) 25 10 65 67 100 89 74 69 84 87Mobility score 25 10 1 1 4 4 1 1 4 4UCr (ng) 25 9 365 521 1524 1310 657 559 1291 1209SCr (ng/lOOnl) 25 10 1.00 0.72 4.19 3.20 1.31 1.11 2.24 1.96CCr (nl/nin) 25 9 9 23 77 55 28 25 57 48CCr/SA(nl/nin/1.73m2) 25 9 11 23 67 56 26 26 53 49
FRU dose (ig) 25 10 40 40 80 120 40 40 40 80IDu/dose 25 9 8.25 8.55 69.10 33.07 23.56 12.15 48.76 21.28Urine vol (nl) 25 9 472 656 2761 3217 1046 874 1928 1886weight (kg) 25 10 38 36 93 84 54 44 80 74SA (*2) 25 10 1.28 1.26 2.15 2.00 1.57 1.38 1.98 1.90tl/2 (h) 25 9 0.823 1.360 11.897 20.170 1.953 6.450 6.685 13.51Cls (nl/nin) 25 9 15.5 14.3 278.9 421.9 60.1 19.5 140.7 183.6Cls/kg(nl/nin/kg) 25 9 0.310 0.227 4.358 6.592 0.922 0.278 2.534 2.981
Clr (nl/nin) 25 8 9.6 10.6 196.9 288.8 38.3 18.2 120.3 97.9Cl 0-6h (nl/nin)
24 8 7.2 19.7 520.2 185.9 81.2 27.0 248.3 126.7

Appendix D7 FRUSEMIDE v FRUMIL - Hann-Whitney test (contd)
FMmedian FSmedian
FMmean
FSmean
FMs.d.
FSs.d.
age (years) 80.0 78.5 79.6 77.4 8.5 8.9Mobility score 2.0 3.0 2.4 2.8 1.2 1.3UCr (mg) 904 671 957 825 351 324SCr (ig/lOOil) 1.590 1.630 1.864 1.655 0.839 0.678CCr (il/min) 46.0 35.0 41.8 36.9 19.8 12.3CCr/SA(il/min/1.73m2) 48.8 43.5 40.3 39.2 17.6 12.4
FRU dose (ng) 40.0 40.0 48.0 56.0 16.3 28.0IDu/dose 41.10 31.35 36.18 32.75 16.17 15.35Urine vol (ml) 1535 1184 1515 1450 564 819weight (kg) 71.0 64.0 68.8 61.8 16.9 16.1SA (12) 1.810 1.730 1.770 1.661 0.261 0.267tl/2 (h) 4.105 9.330 4.493 9.830 2.849 5.550Cls (il/iin) 116.6 49.3 116.3 114.5 68.5 139.1Cls/kg(ll/min/kg) 1.401 1.369 1.723 1.899 0.988 2.092
Clr (il/iin) 77.6 58.2 81.8 78.7 54.5 90.8Cl 0-6h (il/iin) 144.4 87.0
** p<0.01170.1 86.7 131.3 59.5

297
Appendix D8 Female v Hale Elderly taking FROHIL - Hann-Whitney test
Female Hale Female Hale Female Hale Female Hale Female Halen n min min max max Q1 Q1 Q3 Q3age (years) 16 9 65 67 100 86 74 72 84 84Hobility score 16 9 1 1 4 4 1 1 4 3DCr (mg) 16 9 365 719 1318 1524 584 1149 963 1470SCr (mg/lOOml) 16 9 1.00 1.30 3.34 4.19 1.19 1.37 2.52 2.24CCr (ml/min) 16 9 9 20 60 77 17 31 52 71CCr/SA(ml/min/1.73m2) 16 9 11 16 61 67 18 29 51 60
FRO dose (mg) 16 9 40 40 80 80 40 40 40 80iDu/dose 16 9 13.98 8.25 69.10 50.97 28.14 12.65 51.12 42.61Drine vol (ml) 16 9 472 1005 2761 2156 1029 1291 1836 2025weight (kg) 16 9 38 49 93 93 50 70 75 92SA (m2) 16 9 1.28 1.54 2.15 2.15 1.43 1.81 1.83 2.09tl/2 (h) 16 9 0.823 1.360 9.132 11.900 1.763 2.140 6.181 7.170Cls (ml/min) 16 9 15.5 58.0 278.9 273.2 51.2 65.0 142.5 162.8Cls/kg(ml/min/kg) 16 9 0.310 0.624 4.358 3.105 0.944 0.823 2.508 2.577
Clr (ml/min) 16 9 10.3 9.6 196.9 141.9 40.7 29.7 131.1 108.1Clr/kg(ml/min/kg) 16 9 0.206 0.103 2.756 2.694 0.629 0.392 2.313 1.353
Cl 0-6h (ml/min) 15 9 16.8 7.2 520.2 399.1 83.0 55.7 196.4 317.3

2 9 8
Appendix D8 Fenale v Hale Elderly taking FROHIL - Hann-Whitney test (contd)
Feialemedian Haleaedian Fenaleaean Haleaean Feaales.d. Hales.d. Page (years) 80.5 78.0 80.5 77.9 9.4 7.0Hobility score 2.5 2.0 2.5 2.2 1.3 1.1OCr (ig) 730.5 1351.0 775.5 1279.3 257.5 251.6 **SCr (ng/lOOnl) 1.525 1.590 1.812 1.956 0.805 0.938CCr (al/nin) 38.5 58.0 36.2 51.7 17.6 20.7CCr/SA(nl/ain/1.73n2) 41.0 51.1 37.1 46.0 17.4 17.4
FRU dose (ig) 40.0 40.0 42.5 57.8 10.0 21.1IDu/dose 41.56 26.12 40.38 28.71 15.48 15.4Orine vol. (nl) 1365 1688 1431 1665 626 423weight (kg) 65.0 81.0 63.1 79.1 15.8 14.4 *SA (12) 1.730 1.990 1.671 1.946 0.245 0.195 *ti/2 (h) 3.796 4.500 4.157 5.090 2.605 3.332Cls (il/iin) 119.9 93.8 114.3 119.9 68.8 71.9Cls/kg(■1/iin/kg) 1.826 1.250 1.809 1.570 1.040 0.927
Clr (il/iin) 90.7 51.5 90.1 67.0 58.4 46.2Clr/kg(il/ain/kg) 1.394 0.636 1.411 0.938 0.859 0.799
Cl 0-6h (il/ain) 139.4 201.3 160.7 185.8 127.8 143.5
* p<0.03 ** p<0.001

2 9 9
Appendix D9 Feaale v Hale Elderly taking FRDSEMIDE - Mann-■Whitney test
Feaale Male Feaale Male Feaale Male Feaale Male Feaale Malen n nin nin nax nax Q1 Q1 Q3 Q3
age (years) 6 4 67 69 87 89 67 69 83 89Mobility score 6 4 1 1 4 4 1 2 4 4DCr (ag) 5 4 521 566 1283 1310 536 592 1008 1266SCr (ng/lOOnl) 6 4 0.72 1.60 1.95 3.20 1.01 1.62 1.85 2.90CCr (al/ain) 5 4 26 23 55 50 31 23 51 45CCr/SA(al/nin/1.73n2) 5 4 32 23 56 51 38 23 52 45
FRO dose (ag) 6 4 40 40 120 80 40 40 90 70IDu/dose 5 4 8.55 20.81 64.80 41.13 18.05 24.17 48.08 40.08Orine vol (tl) 5 4 840 656 3217 2313 967 719 2301 2099weight (kg) 6 4 36 63 84 70 40 63 80 69SA (*2) 6 4 1.26 1.54 2.00 1.90 1.30 1.58 1.93 1.86tl/2 (h) 5 4 6.64 1.36 20.17 15.60 6.80 2.59 15.79 14.38Cls (al/nin) 5 4 19.3 14.3 104.8 421.9 29.1 15.7 102.2 382.0Cls/kg(al/ain/kg) 5 4 0.247 0.230 2.211 6.590 0.599 0.250 1.823 5.880
Clr (al/ain) 4 4 24.4 10.6 63.8 288.8 32.8 12.0 62.5 243.9Cl 0-6h (al/ain) 5 3 43.7 19.7 129.0 185.9 51.7 19.7 124.3 185.9
Clr/kg (al/ain/kg) 4 4 0.60 0.17 1.77 4.51 0.64 0.19 1.65 3.77

300
Appendix D9 Female v Hale Elderly taking FRUSEMIDE - Mann-Whitney test (contd)
Femalemedian Malemedian Femalemean Malemean Females.d. Males.d.age (years) 78.5 78.5 76.5 78.8 8.0 11.3Mobility score 3.0 3.5 2.7 3.0 1.4 1.4UCr (mg) 650 904 748 921 311 359SCr (mg/lOOml) 1.260 1.820 1.352 2.110 0.466 0.746CCr (il/iin) 45.0 26.0 41.4 31.3 11.2 12.7CCr/SA(ml/min/1.73m2) 47.6 26.2 45.3 31.4 8.7 12.9
FRU dose (mg) 40.0 40.0 60.0 50.0 33.5 20.0IDu/dose 29.37 35.59 32.33 33.28 20.32 8.78Urine vol (ml) 1184 1183 1544 1334 956 734weight (kg) 59.0 64.0 59.5 65.3 21.1 3.2SA (m2) 1.615 1.730 1.618 1.725 0.331 0.148tl/2 (h) 9.33 8.49 10.90 8.49 5.53 6.09Cls (ml/min) 49.3 141.1 62.4 179.6 37.9 198.7Cls/kg(ml/min/kg) 1.37 2.03 1.24 2.72 0.72 3.06
Clr (ml/min) 58.2 62.7 51.1 106.2 18.0 129.9Cl 0-6h (ml/min) 114.4 21.5 93.3 75.7 38.8 95.4
Clr/kg (ml/min/kg) 1.046 0.91 1.115 1.62 0.529 2.03
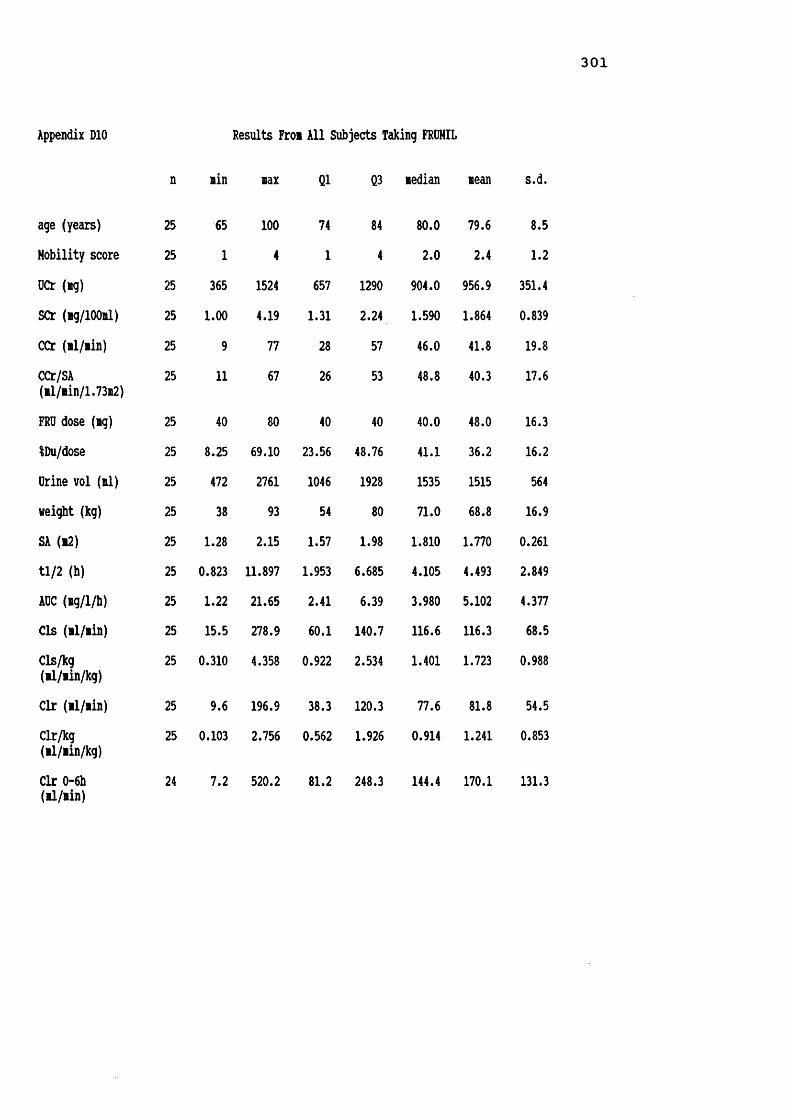
301
Appendix DIO
n
age (years) 25
Mobility score 25
OCr (ng) 25
SCr (ig/lOOnl) 25
CCr (nl/nin) 25
CCr/SA(nl/nin/l.73m2)
25
FRU dose (ng) 25
iDu/dose 25
Orine vol (nl) 25
weight (kg) 25
SA (n2) 25
tl/2 (h) 25
AOC (ng/l/h) 25
Cls (nl/nin) 25
Cls/kg(nl/nin/kg)
25
Clr (nl/nin) 25
Clr/kg(nl/nin/kg)
25
Clr 0-6h (nl/nin)
24
Results Fron All Subjects
nin nax 01 Q3
65 100 74 841 4 1 4
365 1524 657 12901.00 4.19 1.31 2.24
9 77 28 5711 67 26 53
40 80 40 408.25 69.10 23.56 48.76472 2761 1046 192838 93 54 80
1.28 2.15 1.57 1.981.823 11.897 1.953 6.6851.22 21.65 2.41 6.3915.5 278.9 60.1 140.71.310 4.358 0.922 2.534
9.6 196.9 38.3 120.3>.103 2.756 0.562 1.926
7.2 520.2 81.2 248.3
ing FROHIL
nedian mean s.d.
80.0 79.6 8.52.0 2.4 1.2
904.0 956.9 351.41.590 1.864 0.83946.0 41.8 19.848.8 40.3 17.6
40.0 48.0 16.341.1 36.2 16.21535 1515 56471.0 68.8 16.91.810 1.770 0.2614.105 4.493 2.8493.980 5.102 4.377116.6 116.3 68.51.401 1.723 0.988
77.6 81.8 54.50.914 1.241 0.853
144.4 170.1 131.3

302
Appendix Dll Spearmans Coefficient of Rank Correlation for Subjects taking FROHIL
ageyears M.Sc OCrmg [SCr] CCr CCr/SA mg/dl ml/min 1.73m2 FROmg %Du/doseurinevolml
weightkg SAm2
n 25 25 25 25 25 25 25 25 25 25 25KSc 0.441
OCr 0.468 0.439
SCr 0.279 0.483 0.108
CCr 0.507 0.601*** 0.784an 0.632***CCr/SA 0.432 0.517 0.604*** 0.775**** 0.871****ig FRU 0.229 0.424 0.153 0.111 0.056 0.055
% Du/ dose
0.031 0.172 0.393 0.095 0.256 0.142 0.097
0 vol 0.685**** 0.387 0.600Hi 0.265 0.640*** 0.442 0.042 0.208
weight 0.278 0.263 0.609*** 0.063 0.458 0.099 0.118 0.218 0.549***SA 0.323 0.308 0.687**** 0.048 0.506 0.148 0.118 0.242 0.573*** 0.979****tl/2 0.294 0.152 0.032 0.012 0.066 0.021 0.180 0.134 0.195 0.090 0.090
Cls 0.506 0.271 0.317 0.488 0.503 0.449 0.069 0.026 0.436 0.164 0.196
Cls/kg 0.359 0.113 0.127 0.499 0.329 0.443 0.097 0.021 0.200 0.202 0.169
Clr 0.298 0.065 0.005 0.466 0.222 0.245 0.097 0.549*** 0.161 0.011 0.009
*** p<0.01 **** p<0.001

303
Appendix D12
n
age (years) 10Hobility score 10UCr (ig) 9SCr (ng/lOOnl) 10CCr (nl/nin) 9CCr/SA(nl/nin/1.73i2) 9
FRU dose (ng) 10IDu/dose 9Urine vol (nl) 9weight (kg) 10SA (n2) 10tl/2 (h) 9AUC (ng/l/h) 9Cls (nl/nin) 9Cls/kg(nl/nin/kg) 9
Clr (nl/nin) 8Clr/kg(nl/nin/kg) 8
Clr 0-6h (nl/nin) 8
Results From All
nin nax Q1
67 89 691 4 1
521 1310 5590.72 3.20 1.1123 55 2523 56 26
40 120 408.55 64.80 24.19656 3217 87436 84 44
1.26 2.00 1.381.360 20.170 6.4500.79 34.44 2.9414.3 421.9 19.50.227 6.592 0.278
10.6 288.8 18.20.168 4.512 0.337
19.7 185.9 27.0
Taking FRUSEMIDE
Q3 nedian nean
87 78.5 77.44 3.0 2.8
1209 671 8251.96 1.630 1.65548 35.0 36.949 43.5 39.2
80 40.0 56.039.04 31.35 32.751886 1184 145074 64.0 61.8
1.90 1.730 1.66113.510 9.330 9.83020.16 8.55 11.81183.6 49.3 114.52.981 1.369 1.899
97.9 58.2 78.71.720 1.046 1.369
126.7 87.0 86.7
s.d.
8.91.3324
0.67812.312.4
28.015.3581916.1
0.2675.55011.13139.12.092
90.81.399
59.5

304
Appendix D13 Spearoans Coefficient of Rank Correlation for Subjects Taking FRUSEMIDEurine Cls/kg
age MSc UCr SCr CCr CCr/SA FRU IDu/ vol weight SA tl/2 Cls nl/ninyears ng ng/dl nl/nin 1.73n2 ng dose nl kg n2 h nl/nin /kg
n 10 10 9 10 9 9 10 9 9 10 10 9 9 9M.Sc 0.507
UCr 0.067 0.235
SCr 0.229 0.306 0.579
CCr 0.284 0.494 0.350 0.456
CCr/SA 0.381 0.518 0.050 0.652 0.733
ng FRU 0.011 0.131 0.701 0.631 0.146 0.263
% Du/ 0.045 0.510 0.517 0.022 0.550 0.067 0,496doseU vol 0.591 0.332 0.600 0.282 0.350 0.217 0.730 0.217
weight 0.450 0.119 0.531 0.232 0.476 0.195 0.564 0.718 0.094
SA 0.470 0.161 0.513 0.261 0.373 0.296 0.539 0.715 0.047 0.985
tl/2 0.726 0.543 0.111 0.301 0.429 0.332 0.297 0.095 0.492 0.377 0.333
CIS 0.596 0.656 0.639 0.075 0.819 0.450 0.216 0.557 0.900 0.100 0.067 0.767***
Cls/kg 0.581 0.702 0.602 0.167 0.797 0.524 0.108 0.535 0.820 0.017 0.000 0.800 0.983kkkk
Clr 0.641 0.450 0.452 0.182 0.738 0.533 0.195 0.286 0.754 0.120 0.119 0.881 0.907 0.929kkk kkk kkk
*** p<0.01 **** p<0.001
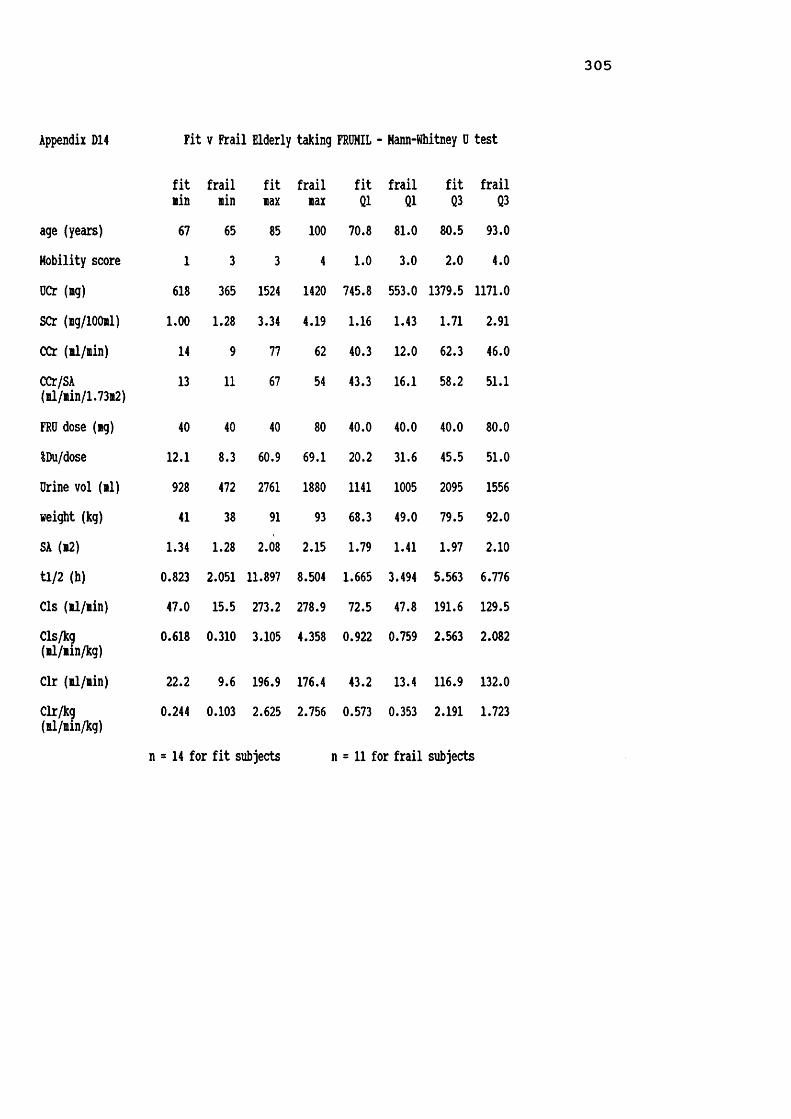
Appendix D14 Fit v Frail Elderly taking FRUMIL - Hann-Whitney 0 test
fit frail fitlin nin lax
age (years) 67 65 85Hobility score 1 3 3OCr (lag) 618 365 1524SCr (ng/lOOnl) LOO 1.28 3.34CCr (nl/iin) 14 9 77CCr/SA(nl/nin/1.73n2) 13 11 67
FRO dose (ng) 40 40 40$Du/dose 12.1 8.3 60.9Drine vol (nl) 928 472 2761weight (kg) 41 38 91SA (12) 1.34 1.28 2.08tl/2 (h) 0.823 2.051 11.897Cls (il/iin) 47.0 15.5 273.2Cls/kg(■1/iin/kg) 0.618 0.310 3.105
Clr (il/nin) 22.2 9.6 196.9Clr/kg(nl/iin/kg) 0.244 0.103 2.625
frail fit frail fit frailnax Q1 Q1 Q3 Q3100 70.8 81.0 80.5 93.04 1.0 3.0 2.0 4.0
1420 745.8 553.0 1379.5 1171.04.19 1.16 1.43 1.71 2.9162 40.3 12.0 62.3 46.054 43.3 16.1 58.2 51.1
80 40.0 40.0 40.0 80.069.1 20.2 31.6 45.5 51.01880 1141 1005 2095 155693 68.3 49.0 79.5 92.0
2.15 1.79 1.41 1.97 2.108.504 1.665 3.494 5.563 6.776278.9 72.5 47.8 191.6 129.54.358 0.922 0.759 2.563 2.082
176.4 43.2 13.4 116.9 132.02.756 0.573 0.353 2.191 1.723
n = 14 for fit subjects n = 11 for frail subjects

306
Appendix D14 Fit v Frail Elderly taking FROHIL - Mann-Whitney D test (contd)
fit frail fit frail fit frailledian nedian lean lean s.d. s.d. Page (years) 77.5 82.0 76.0 84.1 5.7 9.6 **Hobility score 1.0 4.0 1.5 3.5 0.7 0.5 ***DCr (ig)) 1109.5 719.0 1069.4 814.0 328.3 340.0SCr (ig/lOOil) 1.525 1.770 1.622 2.171 0.652 0.974CX̂ : (ll/iin) 53.0 31.0 50.7 30.4 17.5 17.0 **CCr/SA(nl/nin/1.73m2) 50.6 28.7 48.1 30.3 15.2 15.8 *
FRO dose (mg) 40.0 40.0 40.0 58.2 0.0 20.9iDu/dose 34.04 41.39 33.86 39.13 15.33 17.47Drine vol (il) 1808 1281 1727 1245 567 449weight (kg) 74.5 61.0 72.4 64.4 13.2 20.5SA (12) 1.830 1.630 1.824 1.700 0.202 0.318tl/2 (h) 2.696 4.943 4.004 5.115 3.334 2.064Cls (il/iin) 121.7 93.8 130.7 98.0 64.3 72.2Cls/kg(il/iin/kg) 2.014 1.258 1.862 1.546 0.872 1.137
Clr (il/iin) 62.5 84.1 85.0 77.7 54.5 56.8Clr/kg(il/iin/kg)
0.891 1.093 1.252 1.226 0.842 0.907
* p<0.05 ** p<0.02 *** p<0.001

307
Appendix D15 Fit v Frail Elderly taking FRUSEMIDE - Mann-Whitney test
fit frail fit frail fit frail fit frail fit frailn n sin sin sax sax 01 01 Q3 Q3
age (years) 3 7 67 67 79 89 67 69 79 88Mobility score 3 7 1 3 1 4 1 3 1 4UCr (ng) 3 6 521 552 1136 1310 521 563 1136 1290SCr (ng/lOOil) 3 7 1.11 0.72 1.60 3.20 1.11 1.22 1.60 1.98CCr (si/sin) 3 6 26 23 50 55 26 24 50 48CCr/SA 3 6 32 23 56 48 32 25 56 48(ml/iin/1.73m2)FRU dose (ng) 3 7 40 40 40 120 40 40 40 80iDu/dose 3 6 29.37 8.55 34.22 64.80 29.37 17.75 34.22 47.04Orine vol (si) 3 6 1093 656 1458 3217 1093 794 1458 2539weight (kg) 3 7 41 36 64 84 41 63 64 78SA (12) 3 7 1.31 1.26 1.71 2.00 1.31 1.54 1.71 1.91tl/2 (h) 3 6 1.36 6.27 9.33 20.17 1.36 6.54 9.33 16.74Cls (il/iin) 3 6 39.0 14.3 422.0 262.5 39.0 18.0 422.0 144.2Cls/kg(■1/sin/kg) 3 6 0.95 0.23 6.59 3.75 0.95 0.24 6.59 2.01
Clr (ffll/min) 3 5 24.4 10.6 288.8 109.3 24.4 13.4 288.8 86.6Clr/kg(sl/sin/kg) 3 5 0.60 0.17 4.51 1.77 0.60 0.21 4.51 1.67
Cl 0-6h (sl/nin) 2 6 59.6 19.7 114.4 185.9 59.6 21.0 114.4 143.2

3 0 8
Appendix D15 Fit v Frail Elderly taking FROSEHIDE - Hann-Whitney test (contd)
fitmedianfrailmedian fit
meanfrailmean
fits.d.
frails.d.
age (years) 69.0 81.0 71.7 79.9 6.4 9.0Mobility score 1.0 4.0 1.0 3.6 0.0 0.5DCr (mg) 732 660 796 839 313 358SCr (mg/lOOml) 1.410 1.810 1.373 1.776 0.247 0.782CCr (il/iin) 45.0 31.5 40.3 35.2 12.7 12.9CCr/SA(ml/min/1.73m2) 50.6 35.2 46.0 35.7 12.5 11.9
FRO dose (mg) 40.0 40.0 40.0 62.9 0.0 31.5IDu/dose 31.35 32.25 31.65 33.30 2.44 19.33Orine vol (ml) 1184 1147 1245 1553 190 1010weight (kg) 45.0 70.0 50.0 66.9 12.3 15.5SA (12) 1.400 1.830 1.473 1.741 0.210 0.258tl/2 (h) 6.95 11.07 5.88 11.80 4.09 5.35Cls (ll/sin) 100.0 34.5 187.0 78.3 206.0 96.4Cls/kg(ml/min/kg) 2.21 0.84 3.25 1.22 2.96 1.36
Clr (ml/min) 58.5 57.8 123.9 51.5 143.8 40.2Clr/kg(ml/min/kg) 1.30 0.79 2.14 0.91 2.09 0.74
Cl 0-6h (ml/min) 87.0 81.7 87.0 86.6 38.7 68.3
* p<0.0001

3 0 9
Appendix D16 Fit v Frail Age Hatched Elderly taking FRUMIL - Hann-Whitney test
fit frail fit frail fit frail fit frail fit frailn n ain ain aax aax Q1 Q1 Q3 Q3age (years) 8 7 77 76 85 86 78 81 83 84Mobility score 8 7 1 3 3 4 1 3 2 4UCr (ag) 8 7 618 496 1524 1420 655 687 1381 1263SCr (ag/lOOnl) 8 7 1.00 1.28 3.34 4.19 1.23 1.41 2.46 2.77CCr (al/ain) 8 7 14 12 69 62 29 20 57 50CCr/SA(al/ain/1.73a2) 8 7 13 16 61 54 27 16 56 52
FRO dose (ag) 8 7 40 40 40 80 40 40 40 80IDu/dose 8 7 13.25 8.25 60.88 50.97 26.01 31.62 50.36 50.300 vol (ill) 8 7 928 1005 2156 1688 1029 1046 1907 1556weight (kg) 8 7 41 41 91 93 56 49 85 92SA (i2) 8 7 1.34 1.33 2.08 2.15 1.57 1.54 2.02 2.10tl/2 (h) 8 7 0.82 2.17 11.90 7.29 1.55 4.50 4.10 6.78Cls (il/iin) 8 7 47.0 31.1 273.2 278.9 74.3 58.0 179.8 129.5Cls/kg(al/ain/kg) 8 7 0.618 0.624 3.105 4.358 0.949 0.759 2.881 2.641
Clr (al/ain) 8 7 22.2 9.6 196.9 176.4 39.0 31.3 167.3 132.0Clr/kg(al/ain/kg) 8 7 0.244 0.103 2.625 2.756 0.550 0.763 2.465 2.694
Clr 0-6h (al/ain) 7 7 42.4 7.2 520.2 399.1 68.9 80.6 379.2 322.7

310
Appendix D16 Fit v Frail Age Hatched Elderly taking FRUMIL - Mann-Whitney test (contd)
fitmedian frailmedian fitmean frailmean fits.d. frails.d.age (years) 79.0 82.0 80.1 81.7 2.9 3.1mobility score 2.0 3.0 1.8 3.4 0.7 0.5DCr (lg) 933 904 989 951 368 341SCr (mg/lOOml) 1.605 1.560 1.826 2.060 0.796 1.064CCr (ll/sin) 45.5 33.0 42.9 36.4 17.9 17.5CCr/SA(ml/min/1.73m2) 48.6 33.2 41.9 36.1 16.9 16.6
FRO dose (mg) 40.0 80.0 40.0 68.6 0.0 19.5iDu/dose 43.34 41.39 38.94 37.22 15.77 14.530 vol (nl) 1340 1535 1439 1379 468 270weight (kg) 74.5 64.0 70.6 66.6 17.1 20.2SA (12) 1.830 1.720 1.791 1.747 0.258 0.297tl/2 (h) 2.70 4.94 3.69 5.09 3.53 1.68Cls (il/iin) 121.7 115.0 131.8 117.6 72.8 79.3Cls/kg(il/iin/kg) 2.159 1.321 1.942 1.862 0.973 1.310
Clr (il/iin) 105.4 84.1 103.7 86.8 65.4 56.7Clr/kg(al/ain/kg) 1.871 1.093 1.575 1.435 0.980 1.002
Clr 0-6h (ml/min) 158.9 201.3 203.5 208.9 178.3 134.6
* p<0.05 ** p<0.005

311
Appendix ElINFORMATION SHEET FOR HEART TABLET STUDY
Dr. Parker is carrying out a project with St. Mark's Road Surgery looking at the way in which the heart tablets (Digoxm or Lanoxin) you take are handled by your body.This will involve noting the exact time at which your heart tablet was taken on 2 occasions, collecting your urine for 24 hours, and having 3 blood samples taken over 5 days.YOUR MEDICATION WILL NOT BE ALTERED OR STOPPED DURING THE TRIAL.These instructions should be followed carefully during the study. If you are not sure what to do at any time, then let someone know. Phone numbers are given at the bottom of the page. If you change your mind and no longer want to help us, also phone these numbers.1) On the morning of the study please do not take your heart tablet until Dr. Parker calls. When he arrives, he will ask you to empty your bladder. Following this, you may then take your heart tablet.2) Every time you pass urine after taking the tablet please collect it all, in a separate container provided. Write on the container your name, and time at which the urine was passed. ALL urine should be collected, even at night time. If you should happen to run out of containers in which to collect urine, a clean jam jar, or similar, will do.3) Eleven hours after taking your heart tablet Dr Parker will call at your home, and take a small blood sample from you. You must continue to collect your urine.4) Exactly 24 hours from when you started the urine collection, you must again pass urine, and save it. Dr Parker will again call on you, take a blood sample, and collect the urine. Once the urine collection has been completed, you may take your heart tablet as usual.5) About 5 days later, a further blood sample will be taken Dr. Parker will arrange this with you at the time of the study. We will need to know the exact time you took your heart tablet, but no urine collections will be necessary.6) If you are taking any other tablets, you may take these as normal, but let us know what you have taken.Dr. Parker will call at................on..................Please do not take your heart tablet until he arrives.Dr. Parker will then call at....... on ............. eveningand again at...............on................... morningPlease do not take your next heart tablet until he arrives.We will phone you to arrange the last visit, which will be about five days later.IN CASE OF QUERY, PLEASE DO NOT HESITATE TO CONTACT SUE ELLMERS (STUDY CO-ORDINATOR) AT WORK ON BATH 835866
OR AT HOME ON BATH 834963
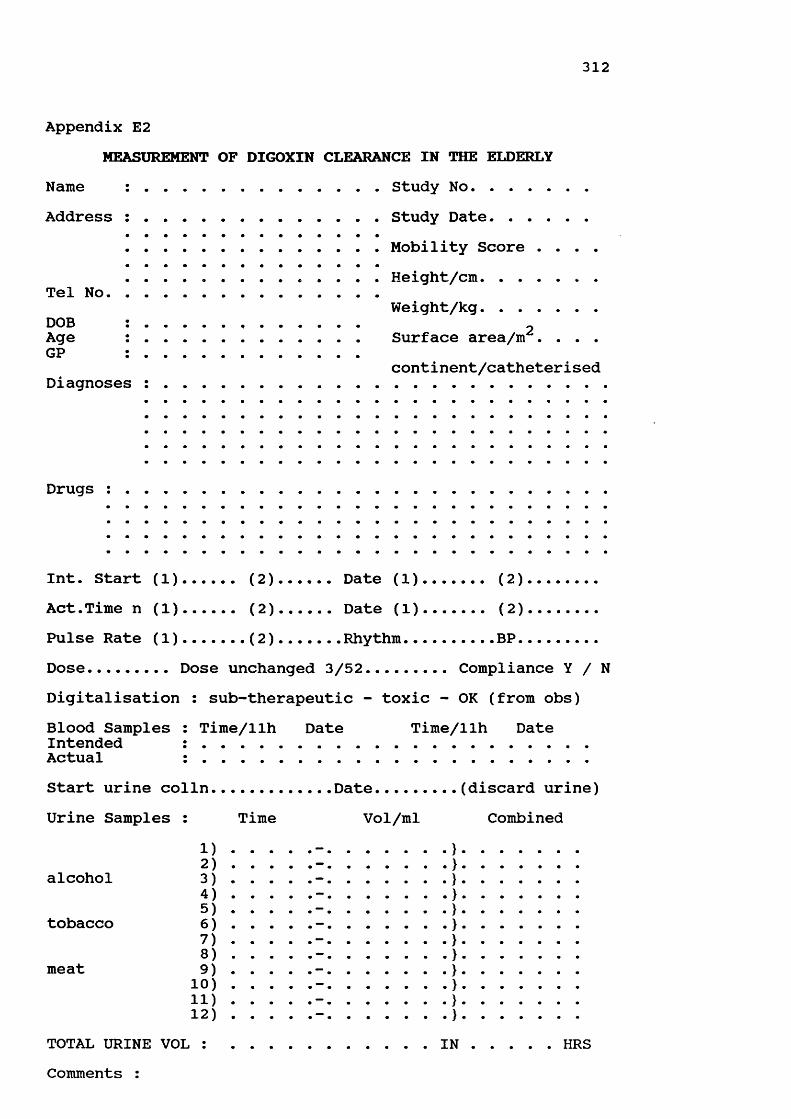
312
Appendix E2MEASUREMENT OF DIGOXIN CLEARANCE IN THE ELDERLY
Name : .......................... Study No..............Address : ......................... Study Date............
........................... Mobility Score . . . .
........................... Height/cm............Tel No............................. Weight/kg............DOB : .................................. 2Age : ........................ Surface area/m . . . .GP : ........................
continent/catheterised Diagnoses : ..............................................
Drugs :
Int. Start (1)...... (2).....Date (1)........ (2).......Act.Time n (1)...... (2).....Date (1)........ (2).......Pulse Rate (1)...... (2)...... Rhythm..........BP.........Dose......... Dose unchanged 3/52......... Compliance Y / NDigitalisation : sub-therapeutic - toxic - OK (from obs)
Time/llh Date Time/llh DateBlood SamplesIntendedActualStart urine col In............. Date....Urine Samples : Time Vol/ml
(discard urine) Combined
alcohol
tobacco
meat
1)2)3)4)5)6)7)8) 9)10)
11)12)TOTAL URINE VOL : ...................... INComments :
HRS

313
Appendix E3 Demographic Details and Medications of Subjects Taking Part in DIGOXIN Study subject sex/age wt/ht fit/MSc smoker EtOH diagnoses drugsF01D F 77 35/137 Y / 2 yes occ. AF, confusion
1 L. NOF '89 digoxin, paracetamol
F02D F 79 76/178 Y / 2 no occ. AFCCF & SOBdigoxin,prednisolone bendrofluazide,temazepam
F04D F 81 65/174 N / 5 3/day 7/wk cellulitis L leg thyroidectomy depression catheterised
digoxin,paracetamol calcuim heparin inj. temazepam
F05D F 90 45/165 N / 5 no no decreased mobility catheterised digoxin,spironolactone frusemide,paracetamol,MilparF08DGP F 81 41/152 N / 4 no 14/wk CCF, fast AF
CVA, catheterised # L femur, PE 1984digoxin,co-amilofruse bisacodyl
F11D F 75 50/151 N / 4 no no fast AF, LVF, CVA digoxin, trimethoprimF12DGP F 79 51/151 Y / l no 14/wk LVF, OA, piles
inguinal herniadigoxin,GTN,Aldactide co-proxamol,Epogam
F14DGP F 90 52/151 Y / l no 1/wk glaucoma digoxinF15DGP F 82 54/156 Y / 2 no no AF, diverticulitis digoxinF16DGP F 78 60/152 Y / l no occ. CCF, lild asthma cystitis
digoxin,Havidrex K,GTN salbutamol inh.F17DGP F 74 60/155 N / 3 no 4/wk AF, COAD, OA, THR hypothyroid digoxin, Aldactide thyroxineF18DGP F 73 48/164 Y / l no occ. litral incompetance LV hypertrophy AF, TIA ;87
digoxin,warfarin,Dyazide verapamil
F19DGP F 76 75/165 Y / l no 14/wk AF, OA digoxin,nifedipine,amiloride spinal decompression diclofenac,frusemideF20D F 85 61/149 N / 3 no no AF, angina, CCF NIDDM, blind dicjoxin, co-amilofruse glibenclamide,co-codaprinF21DGP F 90 45/155 N / 4 no no AF, CVA 1978 hypothyroid digoxin, aspirin diazepam, co-amilofruseF22D F 83 59/150 N / 3 no occ. AF, gout, OA, THR varicose ulcers
digoxin, bumetanide morphine sulphate,lactuloseF24DGP F 96 44/148 N / 3 no occ. AF,partially sighted digoxin, co-amilofruseF29D F 90 46/149 N / 4 no no AF, CCF, CVA 1982 digoxin, co-amilofruseF30D F 81 53/152 N / 5 no no AF,CCF,IHD,leg ulcer digoxin,captopril,cefadroxil Ca L breast & mets frusemide, vits B & C inj.

314
AppendixsubjectF33D
F34DGP
F37DGP
F44D
F46DGP F
F52DGP FF54DGP F
H03D H
H06D H
H09DGP
H10DGP
H13DGP H
H23D H
H25D H
M26D H
M31DGP H
E3 Demographic Details and Hedications sex/age wt/ht fit
76 47/153 N
83 58/174
82 51/145
N
Y
77 43/160 N
84 54/159 Y
84 62/16584 66/153
79 75/178 N
79 62/168 N
66 96/178 Y
84 64/179 N
79 75/173 Y
68 80/187 Y
87 41/162 N
79 85/165
79 64/183
MSc smoker EtOH 3 no occ.
5 no no
2 no no
3 occ. 14/wk
1 no occ.
2 no
1 no
of Subjects Taking Part in DIGOXIN Study (contd)diagnoses drugsAF, LVF, COAD digoxin, co-amilofrusethyrotoxicosis 1977 chlormethiazole,salbutamolAF, R. THR digoxin, co-amilofruseCVA & L hemiplegia temazepamCVA 1972, anaemia digoxin,warfarin,FeS04mitral valve disease tetrabenazine,co-amilofrusecervical spondylosis digoxin,PremarinCVA & R hemiplegia lofepramine,thioridazineAF, depression lactulose,paracetamol
2 no occ.
4 no occ.
4 ex. 7/wk
1 no occ.
3 ex. 7/wk
2 occ. 7/wk pipeno
4 no occ.
3 no 21/wk
AFhypothyroidism
no AF
digoxin,bendrofluazide thyroxine,Slow Kdigoxin,frusemide,nebumetone
AF, chest pain digoxin,diclofenac,Gavisconcervical spondylosis captopril,bumetanideCCF, HI 1977, SOB emphysema, HH
LVF, OA, THR cellulitis L leg Ca prostateDC? colostomy AF, CCF
digoxin,co-amilofruse,Hilpar salbutamol neb,prednisolone lofepramine,co-dydramol cef adroxil, temazepamdigoxin, frusemide diclofenac, quinine flucloxacillin, Hilpardigoxin,bendrofluaz ide GTN spray
AF, CCF, emphysema digoxin, co-amilozide R nephrectomy 1947 GTN, Hucaine, oxygenAF, HI 1987 & 1989 LVF, PE 1970 digoxin, nitrazepam co-amilofrusecardiomyopathy 1989 digoxin,frusemide,captopril thyrotoxicosis 1989 warfarin,captopril fast AF, CCF, TIA's co-dydramolAF, pseudomembranous digoxin, theophylline colitis 1990, COAD Duovent inh., temazepam erythema multiforma
3 no occ. COAD, OA digoxin, co-amilofruse salbutamol inh., temazepam
OA, bowel resection digoxin, temazepam depression paracetamol, senna? alcoholic ispagula husk

315
Appendix E3 Demographic Details and Medications of Subjects Taking Part in DIGOXIN Study (contd) subject sex/age wt/ht fit/MSc smoker EtOH diagnoses drugs
noM35DGP M / 89 60/169 Y / 1
H36DGP M / 70 78/184 Y / 1
H40DGP H / 75 78/179 Y / 1
M41DGP H / 85 71/178 Y / 1
H42DGP H / 82 69/171 Y / 1
M43DGP M / 78 75/172 Y / 1
M47DGP M / 88 80/162 N / 3M48DGP H / 78 74/162 Y / l
M49D M / 81 67/182 N / 4
M50DGP M / 81 77/165 N / 3
M51DGP M / 76 95/178 Y / 1H53DGP M / 67 65/171 N / 3
no
H38DGP M / 80 61/165 Y / l no
no
no
no
no
nono
no
no
nono
M55DGP M / 67 55/171 N / 3 ex.
no AF, cholecystectomy digoxin prostatectomy
21/wk prostatectomy post-op arrest AF, CVA x 2
digoxin, aspirin ascorbic acid,
no angina, HI 1976 digoxin,nifedipine,GTNhypertension isosorbide dinitrateTURP, claudication inosital nicotinate
occ. fast AF,IHD,iitral digoxinstenotic lurmur
no angina cataracts digoxin,oxprenolol,GTN naftidrofuryl oxalateno CVA digoxin,Aldactide,aspirinmitral valve disease ranitidine,Gavisconquinine sulphate,lofepramine
prochlorperazine inosital oxalateno lild CCF, AF
glaucoma digoxinpilocarpine & timolol ED
no AF,CCF,gangrene toe digoxin, co-amilofruse21/wk nephrectomy '42 (TB) digoxin,bendrofluazideurinary frequency allopurinol,aminophylline diclofenacocc. AF, RA, leg ulcers digoxin,co-amilofruseurinary retention ibuprofen,penicillin Vindoramine
digoxin,co-amilofruse prednisolone,gliclazide salbutamol & Pulmicort inh. erythromycin
occ. COADcor pulmonale
occ. AF & IHDno AF, angina, COAD indigestion
occ. COAD, MI 1990 ex. heavy smoker
ftEtOHocc.
= fit: Y for fit, N for frail = alcohol consumption- approx. units per week = occasional alcohol consumption
digoxindigoxin,co-amilofruse theophylline,prednisolone isosorbide HN,ranitidine salbutamol & terbutaline nebdigoxin,co-amilofruse,GTN prednisolone,salbutamol nebs isosorbide DN,theophylline ranitidine,temazepk

316
Appendix E4 Summary of Results from the DIGOXIN Study
Ho. H.Sc fit SCr (UCrl tine CCr U vol U DIG U DIG S DIG dose \ Du total Cl renal Cl■g/dl ig/dl hours ■l/iin ■1 ■cg/24h ■cg/dl ng/ii ■eg ■l/iin ■1/ain1 2 Y 0.62 0.50 125.0 116.322 2 Y 1.27 65.5 25.42 69.6 2059 51.77 2.51 0.83 62.5 82.83 35.04 43.314 5 N 2.69 420.8 23.83 63.5 580 23.80 4.10 0.80 125.0 19.04 72.70 20.665 5 N 2.19 3.00 125.0 19.398 4 N 2.38 95.9 23.15 29.8 1026 23.90 2.33 0.39 62.5 38.24 74.56 42.5611 4 N 0.36 85.6 23.92 141.2 852 50.70 5.95 0.26 125.0 40.56 223.69 135.4212 1 Y 0.58 75.8 24.00 84.9 936 43.42 4.64 0.48 125.0 34.74 121.17 62.8214 1 Y 0.59 38.3 24.00 78.7 1746 49.39 2.83 0.20 62.5 79.02 145.40 171.4915 2 Y 0.62 108.9 24.05 108.1 888 52.89 5.96 0.46 125.0 42.31 126.43 79.8516 1 Y 0.72 44.5 24.07 80.1 1871 28.65 1.53 0.14 62.5 45.84 207.71 142.1117 3 N 1.05 98.7 23.93 68.7 1050 77.96 7.42 0.32 125.0 62.37 181.75 169.1818 1 Y 0.64 61.5 24.00 73.5 1102 43.05 3.91 0.28 62.5 68.88 103.86 106.7719 1 Y 1.27 58.4 24.05 64.1 2010 97.74 4.86 1.08 250.0 39.10 107.70 62.8520 3 N 0.82 66.9 23.91 44.1 776 74.53 9.60 1.74 250.0 29.81 66.85 29.7521 4 N 1.18 100.4 24.50 28.4 490 23.74 4.84 0.68 62.5 37.98 42.76 24.2422 3 N 1.18 45.3 23.50 31.3 1150 41.31 3.59 0.50 125.0 33.05 116.32 57.3724 3 N 0.72 32.5 24.00 31.3 1000 52.00 5.20 2.50 250.0 20.80 46.53 14.4429 4 N 0.69 71.9 24.25 35.1 490 78.00 15.92 1.31 125.0 62.40 44.40 41.3530 N 2.32 38.8 24.33 9.4 820 19.40 2.37 1.38 62.5 31.04 21.07 9.7633 3 M 0.88 45.1 24.83 27.0 786 72.70 9.25 1.03 125.0 58.16 56.47 49.0234 5 N 0.60 57.7 24.00 61.6 922 86.90 9.43 1.00 125.0 69.52 58.16 60.3537 2 Y 0.67 32.9 24.00 49.4 1449 63.31 4.37 0.88 250.0 25.32 132.18 49.9644 3 N 0.34 74.3 25.34 126.6 881 165.90 18.83 1.24 250.0 66.36 93.81 92.9146 1 Y 0.75 63.4 24.03 78.3 1336 39.80 2.98 0.53 125.0 31.84 109.74 52.1552 2 Y 1.61 84.6 24.00 63.9 1752 85.10 4.86 1.85 250.0 34.04 62.88 31.9454 2 Y 1.66 101.5 24.00 52.0 1224 20.90 1.71 0.36 62.5 33.44 80.78 40.323 4 N 2.08 115.6 27.00 77.9 2270 46.96 2.07 0.30 62.5 75.14 96.93 108.706 4 N 2.37 114.3 24.01 45.6 1362 67.12 4.93 1.70 125.0 53.70 34.21 27.429 1 Y 1.18 133.4 24.50 106.0 1378 90.00 6.53 0.52 250.0 36.00 223.69 120.1910 3 N 1.16 91.0 25.04 44.6 854 44.70 5.23 0.59 125.0 35.76 98.58 52.6113 Y 1.05 85.8 24.00 83.2 1466 62.00 4.23 0.49 125.0 49.60 118.69 87.8723 1 Y 0.55 49.3 24.00 193.3 3105 117.80 3.79 0.45 250.0 47.12 258.49 181.7925 4 N 0.73 49.3 24.00 28.8 614 22.80 3.71 0.49 62.5 36.48 59.35 32.3126 3 N 0.98 104.0 25.25 108.4 1548 106.10 6.85 0.38 125.0 84.88 153.05 193.9031 3 N 0.80 139.8 23.50 61.0 492 62.50 12.70 0.71 250.0 25.00 163.83 61.1335 1 Y 0.91 87.7 23.92 84.9 1264 52.70 4.17 0.28 125.0 42.16 207.71 130.7036 1 Y 1.45 222.4 23.28 87.2 794 72.60 9.14 0.44 250.0 29.04 264.36 114.5838 1 Y 1.10 106.3 24.58 82.4 1258 32.70 2.60 0.26 62.5 52.32 111.85 87.3440 1 Y 0.92 116.0 23.83 99.5 1128 88.90 7.88 0.76 125.0 71.12 76.53 81.2341 1 Y 0.61 72.9 24.00 105.1 1266 52.90 4.18 0.64 125.0 42.32 90.87 57.4042 1 Y 1.41 101.9 24.15 68.0 1364 61.90 4.54 1.08 125.0 49.52 53.85 39.8043 1 Y 1.09 59.0 24.05 88.4 2356 64.10 2.72 0.50 250.0 25.64 232.64 89.0347 3 N 1.41 60.8 24.22 46.7 1574 25.60 1.63 0.31 62.5 40.96 93.81 57.3548 1 Y 1.28 68.4 23.83 56.1 1502 58.40 3.89 1.30 125.0 46.72 44.74 31.2049 4 N 0.95 38.5 24.00 48.0 1707 54.00 3.16 0.72 125.0 43.20 80.78 52.0850 3 N 0.91 30.7 24.25 86.8 3742 86.40 2.31 0.99 125.0 69.12 58.75 60.6151 1 Y 1.16 104.6 24.00 102.3 1634 125.90 7.71 0.75 250.0 50.36 155.09 116.5753 3 N 1.13 93.0 23.28 82.8 1406 163.90 11.66 0.98 250.0 65.56 118.69 116.1455 3 N 0.77 38.1 24.00 96.0 2795 32.60 1.17 0.41 125.0 26.08 141.85 55.22

3 1 7
Appendix E5 SCr, DCr & CCr, calculated over 8 & 24 hour periods, for Subjects in DIGOXIN Studytotal 24h 24h[SCr] urine T.int mg [OCr] urine CCr CCr % 24h SA CCrsubject ng/dl colln hours OCr ig/dl vol/Bl il/flin nl/nin CCr 12 1.73112
F02D 1.27 1515 6.75 348.7 37.7 925 68 971845 3.50 145.6 34.7 420 55 790955 15.17 853.5 119.5 714 74 106Totals 25.42 1347.8 65.5 2059 70 1.95 62F04D 2.69 1330 3.50 420.4 362.4 116 74 1161550 2.33 430.3 589.5 73 114 1780950 18.00 1589.8 406.6 391 55 86Totals 23.83 2440.5 420.8 580 64 1.79 61F08GPD 2.38 1730 10.65 320.6 81.7 334 18 600600 12.50 662.9 95.8 692 37 123Totals 23.15 983.5 95.9 1026 30 1.33 39F11D 0.34 1400 5.67 184.8 72.2 256 160 1132045 6.75 185.9 68.8 270 135 960815 11.50 358.7 110.0 326 153 109Totals 23.92 729.4 85.6 852 141 1.46 167F12GPD 0.58 1545 7.50 128.2 46.8 274 49 580130 9.75 454.3 93.5 486 134 1580815 6.75 126.6 71.9 176 54 64Totals 24.00 709.1 75.8 936 85 1.48 99F14GPD 0.59 1300 5.75 191.9 37.2 516 94 1192315 10.25 253.7 26.0 976 70 890715 8.00 223.0 87.8 254 79 100Totals 24.00 668.6 38.3 1746 79 1.49 91F15GPD 0.62 1350 6.13 288.8 87.5 330 127 1182150 8.00 353.6 92.1 384 119 1100745 9.92 324.8 186.7 174 88 81Totals 24.05 967.2 108.9 888 108 1.55 121F16GPD 0.72 1400 6.07 186.1 82.3 226 71 892245 8.75 306.4 40.5 756 81 1010800 9.25 340.0 38.2 889 85 106Totals 24.07 832.5 44.5 1871 80 1.61 86F17GPD 1.05 1200 3.93 182.0 82.0 222 74 1072245 10.75 487.8 112.9 432 72 1040800 9.25 366.7 92.6 396 63 91Totals 23.93 1036.5 98.7 1050 69 1.63 73F18GPD 0.64 1325 5.92 150.1 61.0 246 66 892305 9.67 285.2 71.0 402 77 1040730 8.41 242.9 53.5 454 75 101Totals 24.00 678.2 61.5 1102 74 1.49 85

3 1 8
Appendix E5 SCr, OCr & CCr, calculated over 8 & 24h periods, for Subjects in DIGOXIN Study (contd)total 24h to 4*. cr[SCr] urine T.int ug [OCr] urine CCr CCr % 24h SA CCrsubject ug/dl colln hours OCr ug/dl vol/nl ul/nin ul/uin CCr n2 1.7312
F19GPD 1.27 1330 5.30 276.7 28.3 979 69 1082240 9.17 427.0 83.4 512 61 950815 9.58 469.5 90.5 519 64 100Totals 24.05 1173.2 58.4 2010 64 1.87 59F20D 0.82 1330 5.58 83.8 40.0 222 32 731930 6.00 156.9 53.7 292 53 1200750 12.33 273.1 104.2 262 45 102Totals 23.91 518.8 66.9 776 44 1.61 47F21GPD 1.18 1310 7.17 328.0 96.5 340 65 2320630 17.33 163.9 109.2 150 13 46Totals 24.50 491.9 100.4 490 28 1.40 35F22D 1.18 1200 5.50 194.0 32.2 602 50 1611930 7.50 103.0 37.9 272 19 610600 10.50 224.1 81.2 276 30 97Totals 23.50 521.1 45.3 1150 31 1.59 34F24GPD 0.72 1120 4.83 81.0 10.8 750 39 1261630 5.17 73.2 81.3 90 33 1060630 14.00 170.5 106.6 160 28 90Totals 24.00 324.7 32.5 1000 31 1.36 40F29GPD 0.69 1145 4.00 47.4 37.6 126 29 831930 7.75 41.5 90.2 46 13 370800 12.50 263.4 82.8 318 51 146Totals 24.25 352.3 71.9 490 35 1.40 43F30D 2.32 0700 10.00 98.5 133.1 74 7 781500 8.00 141.9 31.1 456 13 1442120 6.33 77.5 26.7 290 9 100Totals 24.33 317.9 38.8 820 9 1.51 11F33D 0.88 1140 3.50 38.2 15.9 240 21 782030 8.83 111.9 32.9 340 24 890900 12.50 204.6 99.3 206 31 115Totals 24.83 354.7 45.1 786 27 1.43 33F34GPD 0.60 1400 6.00 124.9 24.9 502 58 941905 5.08 126.3 63.2 200 69 1110800 12.92 281.2 127.8 220 60 97Totals 24.00 532.4 57.7 922 62 1.68 63F37GPD 0.67 1330 5.25 164.1 15.1 1087 78 1592220 8.83 261.2 76.8 340 74 1510815 9.92 51.0 232.0 22 13 27Totals 24.00 476.3 32.9 1449 49 1.45 59F44D 0.34 1415 6.25 184.0 167.2 110 144 1132210 7.92 209.0 133.1 157 129 1020920 11.17 262.0 42.7 614 115 91Totals 25.34 655.0 74.3 881 127 1.39 158

3 1 9
Appendix E5 SCr, OCr & CCr, calculated over 8 & 24h periods, for Subjects in DIGOXIN Study (contd)total 24h 24h[SCr] urine T.int ug [OCr] urine CCr CCr % 24h SA CCrsubject ug/dl colln hours OCr ug/dl vol/ul ul/uin nl/nin CCr u2 1.73U2
F46GPD 0.75 1600 7.50 251.2 103.8 242 74 952130 5.50 204.9 84.0 244 83 1060832 11.03 390.8 46.0 850 79 101Totals 24.03 846.9 63.4 1336 78 1.56 87F52GPD 1.61 1415 8.75 424.9 107.8 394 50 782100 6.75 377.9 57.4 658 58 910530 8.50 680.2 97.2 700 83 130Totals 24.00 1482.0 84.6 1752 64 1.70 65F54GPD 1.66 1245 4.42 281.4 44.1 638 64 1232200 9.25 397.6 126.6 314 43 830820 10.33 461.5 169.7 272 45 87Totals 24.00 1140.5 101.5 1224 52 1.70 53F01D 0.62 1.17F05D 2.19 1.44M03D 2.08 0830 10.50 1080.5 114.3 945 82 1051845 10.25 1198.0 120.4 995 94 1210100 6.25 345.6 104.7 330 44 56Totals 27.00 2624.1 115.6 2270 78 1.93 70H06D 2.37 1530 6.17 479.7 58.1 825 55 1201940 4.17 102.6 131.5 78 17 370920 13.67 974.9 212.4 459 50 109Totals 24.01 1557.2 114.3 1362 46 1.71 46M09GPD 1.18 1330 6.50 654.9 153.0 428 142 1342200 8.50 785.2 133.0 590 130 1230730 9.50 398.2 110.6 360 59 56Totals 24.50 1838.3 133.4 1378 106 2.20 83H10GPD 1.16 1630 7.12 183.7 113.4 162 37 822330 7.00 180.8 83.7 216 37 820925 10.92 412.6 86.7 476 54 120Totals 25.04 777.1 91.0 854 45 1.79 43M13GPD 1.05 1400 5.00 407.1 46.5 876 129 1552115 7.25 462.3 122.3 378 101 1220900 11.75 388.2 183.1 212 52 63Totals 24.00 1257.6 85.8 1466 83 1.91 75M23GPD 0.55 0900 10.75 664.7 117.0 568 187 971530 6.50 449.6 23.8 1888 209 1082215 6.75 415.3 64.0 649 186 96Totals 24.00 1529.6 49.3 3105 193 2.04 164H25D 0.73 1500 4.00 74.0 127.6 58 42 1451915 4.25 27.9 139.6 20 15 521100 15.75 200.5 37.4 536 29 100Totals 24.00 302.4 49.3 614 29 1.36 37

Appendix E5 SCr, OCr & CCr, calculated over 8 & 24h periods, for Subjects in DIGOXIN Study (contd)total 24h 24h[SCr] urine T.int ug [UCr] urine CCr CCr 1 24h SA CCrsubject ug/dl colln hours OCr ug/dl vol/ul ul/nin ul/uin CCr n2 1.73U2
M26D 0.98 1445 6.25 717.2 99.3 722 195 1812130 6.75 439.8 81.4 540 111 1030945 12.25 455.6 159.3 286 63 58Totals 25.25 1609.6 104.0 1548 108 2.00 94
H31GPD 0.80 1135 3.92 202.5 151.1 134 108 1771730 5.91 140.2 143.1 98 49 800710 13.67 345.0 132.7 260 53 87Totals 23.50 687.7 139.8 492 61 1.80 59
H35GPD 0.91 1345 5.42 289.3 272.9 106 98 1152230 8.75 460.0 86.5 532 96 1130815 9.75 358.6 57.3 626 67 79Totals 23.92 1107.9 87.7 1264 85 1.69 87H36GPD 1.45 1550 7.83 555.8 402.7 138 82 942225 6.58 507.3 248.7 204 89 1020717 8.87 703.0 155.5 452 91 104Totals 23.28 1766.1 222.4 794 87 2.00 75H38GPD 1.10 1250 5.08 287.2 105.6 272 86 1052200 9.17 496.3 143.4 346 82 1000820 10.33 553.7 86.5 640 81 99Totals 24.58 1337.2 106.3 1258 82 1.68 85H40GPD 0.92 1505 7.08 372.9 126.9 294 95 952100 5.92 358.4 122.7 292 110 1100750 10.83 577.3 106.5 542 97 97Totals 23.83 1308.6 116.0 1128 100 1.98 87M41GPD 0.61 1545 7.75 271.3 222.3 122 96 912100 5.25 235.8 94.3 250 123 1170800 11.00 415.8 46.5 894 103 98Totals 24.00 922.9 72.9 1266 105 1.88 97H42GPD 1.41 1345 4.80 432.3 184.7 234 106 1562252 9.12 427.9 105.9 404 55 810906 10.23 530.4 73.1 726 61 90Totals 24.15 1390.6 101.9 1364 68 1.82 65M43GPD 1.09 1357 5.98 387.5 60.4 642 99 1132242 8.75 549.0 68.3 804 96 1090801 9.32 453.1 49.8 910 74 84Totals 24.05 1389.6 59.0 2356 88 1.91 80M47GPD 1.41 1515 7.25 334.8 37.0 904 55 1172115 6.00 229.9 74.7 308 45 960813 10.97 391.6 108.2 362 42 89Totals 24.22 956.3 60.8 1574 47 1.92 42M48GPD 1.28 1510 9.33 395.5 138.3 286 55 982320 8.17 462.0 70.0 660 74 1320540 6.33 169.2 30.4 556 35 63Totals 23.83 1026.7 68.4 1502 56 1.85 53

321
Appendix E5 SCr, OCr & CCr, calculated over 8 & 24h periods, for Subjects in DIGOXIN Study (contd)total 24h 24h
[SCr] urine T.int ng [OCr] urine CCr CCr 1 24h SA CCrsubject ug/dl colln hours OCr ug/dl vol/nl nl/iin nl/nin CCr 12 1.73B2H49D 0.95 1430 6.00 185.7 24.6 755 54 1132205 7.58 166.4 58.6 284 39 81
0830 10.42 304.5 45.6 668 51 106Totals 24.00 656.6 1707 48 1.84 45M50GPD 0.91 1515 7.08 22.5 31.1 1679 135 155
2130 6.25 350.7 83.9 418 103 1180825 10.92 775.0 47.1 1645 130 149Totals 24.25 1148.2 30.7 3742 87 1.90 79H51GPD 1.16 1400 6.25 372.9 181.0 206 86 842330 9.50 747.1 125.8 594 113 111
0745 8.25 589.6 70.7 834 103 101Totals 24.00 1709.6 104.6 1634 102 2.18 81M53GPD 1.13 0757 10.87 707.2 106.2 666 96 116
1456 6.98 332.4 63.4 524 70 842022 5.43 268.4 124.3 216 73 88Totals 23.28 1308.0 93.0 1406 83 1.77 81
H55GPD 0.77 1525 7.67 326.9 21.1 1550 92 962230 7.08 423.8 56.9 745 130 1350745 9.25 313.0 62.6 500 73 76Totals 24.00 1063.7 38.1 2795 96 1.62 103

322
Appendix E6 Suaaary of Results Froa All Feaale Subjects Taking DIGOXIHn ain aax Q1 Q3 nedian aean s.d.
age (years) 26 73 96 77 84 81.5 81.9 5.8nobility score 26 1 5 2 4 3.0 2.8 1.4urine voluae (al) 24 490 2059 828 1421 1013 1133 461OCr (ng in 24h) 24 318 2441 499 1024 693.7 816.0 474.5[OCr] (ag/lOOal) 24 32.5 420.8 45,1 93.3 66.2 82.1 75.8[SCr] (mg/lOOml) 26 0.34 2.69 0.62 1.36 0.785 1.092 0.662CCr (al/ain) 24 9 141 32 79 63.7 62.5 32.0CCr/SA(al/ain/1.73a2) 24 11 167 41 87 61.6 69.7 37.9
dose (ug) 26 62.5 250.0 62.5 156.2 125.0 134.6 70.0IDu 24 19.0 82.8 32.1 62.4 38.7 45.28 18.53ODIG (ug in 24h) 24 19.4 165.9 31.4 77.1 51.24 56.95 32.7[ODIG] (ug/lOOal) 24 1.5 18.8 2.9 7.1 4.7 5.79 4.27[SDIG] (ng/al) 26 0.14 3.00 0.382 1.26 0.740 0.913 0.715Clt (al/ain) 26 19 224 54 123 87.3 94.9 53.6Clt/SA(al/ain/1.73a2) 26 23 265 60 146 98.3 107.9 62.0
Clt/kg (al/ain/kg) 26 0.398 4.474 1.011 2.430 1.627 1.804 1.039Clr (al/ain) 24 10 171 34 90 51.1 66.3 46.7Clr/SA(al/nin/1.73n2) 24 11 199 34 109 58.7 74.3 53.1
Clr/kg (al/ain/kg) 24 0.184 3.298 0.547 1.990 0.976 1.234 0.882Clr/CCr 24 0.326 2.461 0.689 1.446 0.970 1.091 0.565Clnr (al/ain) 24 -30 105 5 61 40.3 34.5 33.9Clnr/kg (al/ain/kg) 24 -0.583 2.092 0.109 1.069 0.589 0.637 0.647weight (kg) 26 35 76 46 60 52.5 53.9 10.1SA (a2) 26 1.17 1.95 1.42 1.64 1.50 1.54 0.17
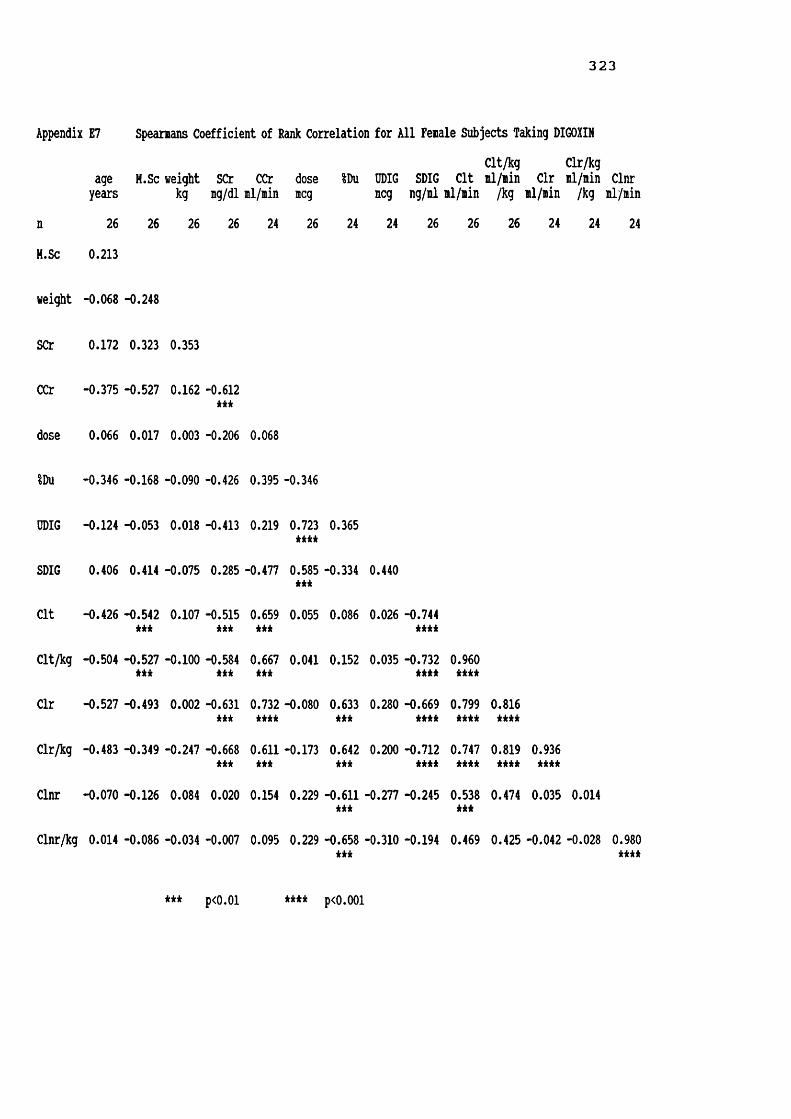
323
Appendix E7 Speamans Coefficient of Rank Correlation for All Female Subjects Taking DIGOXINClt/kg Clr/kg
age H.Sc weight SCr CCr dose %Du ODIG SDIG Clt ml/min Clr ml/min Clnr years kg ig/dl ml/min meg meg ng/ml ml/min /kg ml/min /kg ml/minn 26 26 26 26 24 26 24 24 26 26 26 24 24 24H.Sc 0.213
weight -0.068 -0.248
SCr 0.172 0.323 0.353
CCr -0.375 -0.527 0.162 -0.612 H i
dose 0.066 0.017 0.003 -0.206 0.068
IDu -0.346 -0.168 -0.090 -0.426 0.395 -0.346
ODIG -0.124 -0.053 0.018 -0.413 0.219 0.723H i i
0.365
SDIG 0.406 0.414 -0.075 0.285 -0.477 0.585H i
-0.334 0.440
Clt -0.426 -0.542H i
0.107 -0.515H i
0.659*** 0.055 0.086 0.026 -0.744H i i
Clt/kg -0.504 -0.527 *** -0.100 -0.584H i
0.667H i
0.041 0.152 0.035 -0.732H i i
Clr -0.527 -0.493 0.002 -0.631 *** 0.732H i i
-0.080 0.633H i
0.280 -0.669H i i
Clr/kg -0.483 -0.349 -0.247 -0.668H i
0.611H i
-0.173 0.642*** 0.200 -0.712H i i
Clnr -0.070 -0.126 0.084 0.020 0.154 0.229 -0.611H i
-0.277 -0.245
Clnr/kg 0.014 -0.086 -0.034 -0.007 0.095 0.229 -0.658 -0.310 -0.194***
*** ****
*** p<0.01 **** p<0.001

324
Appendix E8 Summary of Results From All Hale Subjects Taking DIGOXINn min max
age (years) 23 66 89mobility score 23 1 4urine volume (ml) 23 492 3742OCr (mg in 24b) 23 302 2624[OCr] (mg/lOOml) 23 30.7 222.4[SCr] (mg/lOOml) 23 0.55 2.37CCr (ml/min) 23 29 193CCr/SA(ml/min/1.73m2) 23 37 164
dose (ug) 23 62.5 250.0IDu 23 25.0 84.9ODIG (ug in 24h) 23 22.8 163.9[ODIG] (ug/lOOml) 23 1.2 12.7[SDIG] (ng/ml) 23 0.26 1.70Clt (ml/min) 23 34 264Clt/SA(ml/min/1.73m2) 23 35 229
Clt/kg (ml/min/kg) 23 0.552 3.462Clr (ml/min) ' 23 27 194Clr/SA(ml/min/1.73m2) 23 28 168
Clr/kg (ml/min/kg) 23 0.422 2.281Clr/CCr 23 0.546 1.788Clnr (ml/min) 23 -35 130Clnr/kg (ml/min/kg) 23 -0.416 1.734weight (kg) 23 41 96SA (m2) 23 1.36 2.20
Q1 Q3 median mean s.d.75 81 79.0 77.8 6.41 3 2.0 2.2 1.2
1258 1707 1406 1603 784956 1557 1308 1273 48459.0 114.3 91.00 90.56 42.30.91 1.28 1.090 1.130 0.42356 99 83.1 81.9 33.452 87 79.0 75.2 27.2
125.0 250.0 125.0 152.2 70.136.0 53.7 46.7 47.73 16.3547.0 88.9 62.00 69.24 34.332.7 6.9 4.2 5.08 3.050.41 0.76 0.520 0.654 0.35777 164 111.8 127.8 69.276 158 107.5 117.4 59.5
1.173 2.560 1.780 1.583 0.90053 116 81.2 85.0 45.151 97 71.0 77.7 38.0
0.787 1.449 1.041 1.167 0.5450.699 1.228 1.034 1.060 0.337
7 79 30.6 39.7 44.10.111 0.848 0.411 0.581 0.629
64 78 74.0 71.6 12.41.77 1.98 1.880 1.860 0.182

325
Appendix E9 Speamans Coefficient of Rank Correlation for All Hale Subjects Taking DIGOXINClt/kg Clr/kg
age H.Sc weight SCr CCr dose IDu ODIG SDIG Clt ml/min Clr il/iin Clnr years kg ug/dl ml/min meg meg ng/ml ml/min /kg ml/min /kg ml/minn 23 23 23 23 23 23 23 23 23 23 23 23 23 23H.Sc 0.236
weight -0.447 -0.350
SCr -0.164 0.041 0.226
CCr -0.504 -0.570 0.584 -0.340*** ***
dose -0.606 -0.405 0.357 -0.067 0.498***
IDu -0.007 0.131 0.253 0.173 0.145 -0.290
ODIG -0.594 -0.292 0.605 0.047 0.588 0.759 0.366*** *** *** ****
SDIG -0.081 0.021 0.016 0.141 -0.182 0.317 0.166 0.418
Clt -0.453 -0.377 0.300 -0.171 0.573 0.626 -0.401 0.324 -0.536*** ***
Clt/kg -0.329 -0.326 -0.010 -0.299 0.456 0.495 -0.463 0.131 -0.609 0.939*** kkkk
Clr -0.403 -0.378 0.526 -0.122 0.731 0.462 0.179 0.555 -0.474 0.799 0.691kkkk kkk kkkk kkk
Clr/kg -0.377 -0.269 0.270 -0.159 0.623 0.348 0.156 0.401 -0.589 0.788 0.776 0.931kkk kkk kkkk kkkk kkkk
Clnr -0.112 -0.286 -0.126 -0.229 0.088 0.431 -0.933 -0.193 -0.300 0.637 0.678 0.101 0.110**** *** ***
Clnr/kg -0.046 -0.264 -0.272 -0.301 0.057 0.324 -0.923 -0.299 -0.356 0.583 0.686 0.045 0.106 0.977kkkk kkk kkk kkkk
*** p<0.01 **** p<0.001

326
Appendix E10 Fenale v Male Elderly Taking DIGOXIN - Hann-Whitney Testfenalen nalen fenalenedian
age (years) 26 23 81.5nobility score 26 23 3.0urine voluie (nl) 24 23 1013OCr (ng in 24b) 24 23 694[OCr] (ng/lOOml) 24 23 66.2[SCr] (ng/lOOil) 26 23 0.785CCr (nl/nin) 24 23 63.7CCr/SA(nl/nin/1.73n2) 24 23 61.6
dose (ncg) 26 23 125.0%Du 24 23 38.67ODIG (ncg in 24h) 24 23 51.24[ODIG] (ncg/lOOnl) 24 23 4.742[SDIG] (ng/nl) 26 23 0.740Clt (nl/nin) 26 23 87.3Clt/SA(nl/nin/1.73n2) 26 23 98.3
Clt/kg (nl/nin/kg) 26 23 1.627Clr (nl/nin) 24 23 51.1Clr/SA(nl/nin/1.73n2) 24 23 58.7
Clr/kg (nl/nin/kg) 24 23 0.976Clnr (nl/nin) 24 23 40.3Clnr/kg (nl/nin/kg) 24 23 0.589Clr/CCr 24 23 0.970weight (kg) 26 23 52.5SA (12) 26 23 1.500
nalenedian fenalenean nalenean fenales.d. nales.d.79.0 81.9 77.8 5.8 6.42.0 C
O
CM 2.2 1.4 1.21406 1133 1603 461 7841308 816 1273 475 48491.0 82.1 90.6 75.8 42.31.090 1.092 1.130 0.662 0.42383.2 62.5 81.9 32.0 33.479.0 69.7 75.2 37.9 27.2
125.0 134.6 152.2 70.0 70.146.72 45.28 47.73 18.53 16.3562.00 56.95 69.24 32.70 34.334.179 5.791 5.078 4.266 3.0520.520 0.913 0.654 0.715 0.357111.8 94.9 127.8 53.6 69.2107.5 107.9 117.4 62.0 59.5
1.583 1.804 1.780 1.039 0.90081.2 66.3 85.0 46.7 45.171.0 74.3 77.7 53.1 38.1
1.041 1.234 1.167 0.882 0.54530.6 34.5 39.7 33.9 44.10.411 0.637 0.581 647 0.6291.060 1.091 1.034 0.565 0.33774.0 53.9 71.6 10.1 12.41.880 1.540 1.860 0.174 0.182
* p<0.03 ** p<0.02 *** p<0.001

3 2 7
Appendix Ell Sunnary of Results Fron All Subjects Taking DIGOXINn nin nax Q1 Q3 nedian nean s.d.
age (years) 49 66 96 77 84 80.0 80.0 6.3aobility score 49 1 5 1 4 3.0 2.5 1.3urine volune (nl) 47 490 3742 881 1634 1264 1363 676DCr (ng in 24h) 47 302 2624 657 1348 983.5 1039.6 527.2[OCr] (ng/lOOnl) 47 30.7 420.8 49.3 101.9 74.30 86.21 61.21[SCr] (ng/lOOnl) 49 0.34 2.69 0.71 1.28 0.980 1.110 0.557CCr (nl/nin) 47 9 193 47 87 69.6 72.0 33.8CCr/SA(ml/min/1.73m2)
47 11 167 46 87 69.8 72.4 32.9
dose (ug) 49 62.5 250.0 93.8 250.0 125.0 142.9 69.9IDu 47 19.04 84.88 33.44 62.37 42.31 46.48 17.35ODIG (ug in 24h) 47 19.4 165.9 41.3 78.0 54.00 62.97 33.71[ODIG] (ug/lOOnl) 47 1.17 18.83 2.83 6.85 4.37 5.44 3.70[SDIG] (ng/nl) 49 0.14 3.00 0.40 1.02 0.590 0.792 0.585Clt (nl/nin) 49 19 264 59 144 98.6 110.3 63.0Clt/SA 49 23 265 65 154 99.6 112.4 60.4(il/iin/1.73i2)Clt/kg (nl/nin/kg) 49 0.398 4.474 1.036 2.468 1.583 1.793 0.966Clr (nl/nin) 47 10 194 41 109 60.4 75.4 46.4Clr/SA 47 11 199 41 97 59.3 76.0 45.8(Bl/min/1.73m2)Clr/kg (nl/nin/kg) 47 0.184 3.298 0.717 1.469 1.004 1.201 0.729Clr/CCr 47 0.326 2.461 0.699 1.314 1.007 1.063 0.463Clnr (nl/nin) 47 -35 130 6.87 64 31.5 37.0 38.9Clnr/kg (nl/nin/kg) 47 -0.583 2.092 0.111 1.015 0.508 0.610 0.632weight (kg) 49 35 96 51 75 61.0 62.2 14.2SA (n2) 49 1.17 2.20 1.49 1.89 1.690 1.690 0.239

328
Appendix E12 Spearmans Coefficient of Rank Correlation for All Subjects Taking DIGOXINClt/kg Clr/kgage H.Sc weight SCr CCr dose IDu ODIG SDIG Clt ml/min Clr ml/min Clnr years kg mg/dl ml/min meg meg ng/ml ml/min /kg ml/min /kg ml/min
n 49 49 49 49 47 49 47 47 49 49 49 47 47 47H.Sc 0.282
weight -0.369 -0.372 ***
SCr 0.027 0.212 0.356
CCr -0.507 -0.507 0.424 -0.378**** **** ***
dose -0.255 -0.203 0.234 -0.160 0.300
IDu -0.207 -0.041 0.174 -0.153 0.274 0.303
ODIG -0.388 -0.195 0.394 -0.196 0.094 0.742 0.380*** *** **** ***
SDIG 0.231 0.286 0.066 0.202 -0.371 0.454 -0.109 0.407*** ***
Clt -0.487 -0.492 0.264 -0.345 0.653 0.318 -0.132 0.189 -0.669**** **** **** ****
Clt/kg -0.390 -0.408 -0.092 -0.486 0.523 0.204 -0.186 0.021 -0.694 0.920*** *** **** **** **** ****
Clr -0.527 -0.429 0.314 -0.375 0.754 0.142 0.417 0.384 -0.633 0.826 0.729**** *** **** *** *** **** **** ****
Clr/kg -0.466 -0.333 -0.009 -0.478 0.642 0.043 0.399 0.267 -0.673 0.775 0.796 0.926*** *** **** *** **** **** **** ****Clnr -0.065 -0.212 -0.038 -0.074 0.116 0.360 -0.815 -0.216 -0.233 0.552 0.591 0.049 0.054
**** **** ****
Clnr/kg 0.032 -0.134 -0.194 -0.114 0.037 0.289 -0.838 -0.305 -0.221 0.471 0.560 -0.038 0.018 0.977*** *** **** ****
*** p<0.01 **** P<0.001

329
Appendix E13 Fit v Frail Elderly Subjects Taking DIGOXIN - Mann-Whitney Testfit frail fit frailn n min min
age (years) 24 25 66 67nobility score 24 25 1 3urine volume (ml) 23 24 794 490OCr (mg in 24h) 23 24 476 302[OCr] (mg/lOOml) 23 24 32.9 30.7[SCr] (mg/lOOml) 24 25 0.55 0.34CCr (ml/min) 23 24 49 9CCr/SA(ml/min/1.73m2) 23 24 52 11
dose (ug) 24 25 62.5 62.5IDu 23 24 25.3 19.0DDIG (ug in 24h) 23 24 20.9 19.4[ODIG] (ug/lOOml) 23 24 1.53 1.17[SDIG] (ng/ml) 24 25 0.14 0.26Clt (ml/min) 24 25 35 19Clt/SA(ml/min/1.73m2) 24 25 31 23
Clt/kg (ml/min/kg) 24 25 0.461 0.398Clr (ml/min) 23 24 31 10Clr/SA(ml/min/1.73m2)
23 24 29 11
Clr/kg (ml/min/kg) 23 24 0.422 0.184Clnr (ml/min) 23 24 -30 -35Clnr/kg (ml/min/kg) 23 24 -0.583 -0.416Clr/CCr 23 24 0.500 0.326weight (kg) 24 25 35 41SA (m2) 24 25 1.17 1.33
fit frail fit frail fit frailmax max Q1 Q1 Q3 Q3
90 96 76 78 84 85
2 5 1 3 2 4
3105 3742 1224 778 1752 1513
1838 2624 850 499 1391 1127
222.4 420.8 59.0 45.1 104.6 100.0
1.66 2.69 0.63 0.75 1.27 1.75
193 141 68 31 99 82
164 167 65 39 87 77
250.0 250.0 78.1 93.7 250.0 125.082.8 84.9 34.0 31.5 50.4 64.8125.9 165.9 43.4 27.4 85.1 78.09.14 18.83 2.83 2.57 4.86 9.381.85 3.00 0.38 0.40 0.81 1.28264 224 83 52 195 118229 265 83 57 175 122
3.462 4.474 1.238 0.984 3.025 1.899182 194 50 30 117 85199 180 53 34 99 89
3.298 2.820 0.808 0.583 1.479 1.348130 105 13 3 70 44
1.923 2.092 0.194 0.049 1.183 0.9052.179 2.461 0.666 0.707 1.139 1.400
96 85 54 46 76 662.20 2.00 1.55 1.42 1.94 1.80

330
Appendix E13 Fit v Frail Elderly Subjects Taking DIGOXIN - Mann-Whitney Test (contd)fitmedian frail
median fitmeanfrailmean fits.d. frail
s.d. Page (years) 79.0 81.0 78.9 81.0 5.9 6.7mobility score 1.0 3.0 1.3 3.6 0.5 0.8 ****urine volume (ml) 1378 961 1517 1216 520 780 **UCr (mg in 24h) 1173 709 1170 915 371 625 **[OCr] (mg/lOOil) 75.8 73.1 84.5 87.9 40.0 77.2[SCr] (mg/lOOml) 0.985 0.980 0.988 1.228 0.353 0.688CCr (ml/min) 82.4 47.4 85.2 59.4 29.0 33.7 ***CCr/SA(ml/min/1.73m2) 83.3 46.8 82.6 62.6 24.1 37.4 ■kilt
dose (ug) 125.0 125.0 151.0 135.0 75.8 64.2%Du 42.32 40.76 46.06 46.88 6.00 18.89DDIG (ug in 24h) 58.40 53.00 63.30 62.65 26.95 39.73[ODIG] (ug/lOOml) 4.18 5.06 4.41 6.43 1.95 4.65[SDIG] (ng/ml) 0.500 0.720 0.628 0.949 0.393 0.695Clt (ml/min) 117.5 74.6 132.8 88.7 66.7 51.8 **Clt/SA(ml/min/1.73m2) 122.4 75.9 131.7 93.9 60.6 55.2 *
Clt/kg (ml/min/kg) 2.098 1.206 2.060 1.537 0.968 0.911 *Clr (ml/min) 81.2 53.9 86.1 65.2 43.4 47.8Clr/SA(ml/min/1.73m2) 79.6 55.3 84.4 67.9 43.9 47.1
Clr/kg (ml/min/kg) 1.187 0.927 1.309 1.098 0.722 0.736Clnr (ml/min) 41.2 24.9 45.5 28.9 41.7 35.0Clnr/kg (ml/min/kg) 0.553 0.927 0.684 1.098 0.649 0.736Clr/CCr 0.981 1.062 1.006 1.117 0.423 0.502weight (kg) 67.5 59.0 66.5 58.1 14.7 12.7 *SA (m2) 1.760 1.620 1.757 1.626 0.253 0.201 *
* p<0.05 ** p<0.02 *** p<0.003 **** p<0.001

331
Appendix E14 Fit vfit frai
age (years) 12 1nobility score 12 1urine volune (nl) 11 1CCr (ng in 24h) 11 1[OCr] (ng/lOOnl) 11 1[SCr] (ng/lOOnl) 12 1CCr (nl/nin) 11 1CCr/SA 11 1(nl/nin/1.73n2)dose (ug) 12 1%Du 11 1ODIG (ug in 24h) 11 1[DDIG] (ug/lOOnl) 11 1[SDIG] (ng/il) 12 1Clt (nl/nin) 12 1Clt/SA 12 1(nl/nin/1.73n2)Clt/kg (nl/nin/kg) 12 1Clr (nl/nin) 11 1Clr/SA 11 1(nl/nin/1.73n2)Clr/kg (nl/nin/kg) 11 1Clnr (nl/nin) 11 1Clnr/kg (nl/nin/kg) 11 1Clr/CCr 11 1weight (kg) 12 1SA (n2) 12 1
Frail Elderly Fenales Takingfitnin frailnin fitnax frailnax73 74 90 961 3 2 5
888 490 2059 1150476 318 1482 244132.9 32.5 108.9 420.80.58 0.34 1.66 2.6949 9 108 14153 11 121 167
62.5 62.5 250.0 250.025.3 19.0 82.8 69.520.9 19.4 97.7 165.91.53 2.33 5.96 18.830.14 0.26 1.85 3.0035 19 208 22431 23 223 265
0.461 0.398 3.462 4.47432 10 172 16933 11 199 180
0.515 0.184 3.298 2.820-30 -2 98 105
-0.583 -0.039 1.923 2.0920.500 0.326 2.179 2.461
35 41 76 661.17 1.33 1.95 1.79
- Hann-Whitney Testfit frail fit frailQ1 Q1 Q3 . ®77 77 84 901 3 2 5
1102 678 1871 1013678 354 1173 85644.5 45.2 84.6 97.30.62 0.67 1.27 2.2264 29 80 6659 35 91 68
62.5 109.4 218.7 156.233.4 30.4 68.9 62.439.8 23.8 63.3 78.02.51 3.85 4.86 9.510.30 0.47 0.87 1.4787 44 131 9987 54 166 119
1.277 0.961 2.745 2.02443 23 107 7741 25 124 89
0.611 0.408 2.224 1.602-3 6 68 46
-0.070 0.137 1.183 0.9710.666 0.704 1.452 1.621
51 45 65 591.48 1.40 1.70 1.62

3 3 2
Appendix E14 Fit v Frail Elderly Females Taking DIGOXIN - Mann-Whitney Test (contd)fit
median frailmedianfitmean frailmean fits.d. frails.d. P
age (years) 80.5 82.0 80.7 83.0 4.6 6.6mobility score 1.5 4.0 1.5 3.9 0.5 0.9 ***urine volume (ml) 1449 852 1488 833 423 210 ***UCr (mg in 24h) 850 521 939 712 314 569 *[OCr] (mg/lOOml) 63.4 71.9 66.9 94.9 24.4 100.6[SCr] (mg/lOOml) 0.695 0.965 0.917 1.243 0.414 0.803CCr (ml/iin) 73.5 35.1 73.0 53.7 16.3 39.5 **CCr/SA(ml/min/1.73m2) 85.4 43.4 78.9 61.9 21.0 47.4 *
dose (ug) 125.0 125.0 130.2 138.4 77.5 65.7IDu 39.10 38.24 47.03 43.79 20.19 17.70DD1G (ug in 24h) 49.4 52.0 52.4 60.8 22.7 39.8[UDIG] (ug/lOOml) 3.91 5.95 3.65 7.60 1.43 5.04 *[SDIG] (ng/ml) 0.490 1.015 0.632 1.154 0.476 0.811Clt (ml/iin) 113.0 62.5 112.4 79.9 43.1 58.6 *Clt/SA(ml/min/1.73m2) 131.4 69.3 127.0 91.6 52.6 66.6
Clt/kg (ml/min/kg) 2.253 1.099 2.102 1.548 0.919 1.100Clr (ml/min) 62.8 42.6 76.7 57.5 45.1 48.1Clr/SA(ml/min/1.73m2) 59.6 55.4 84.2 66.0 53.1 53.7
Clr/kg (ml/min/kg) 0.980 0.972 1.371 1.118 0.896 0.889Clnr (ml/min) 41.5 22.9 38.7 30.9 38.6 30.4Clnr/kg (ml/min/kg) 0.624 0.509 0.683 0.598 0.732 0.593Clr/CCr 0.776 0.980 1.040 1.134 0.536 0.607weight (kg) 54.0 48.5 57.0 51.3 11.6 8.1SA (m2) 1.555 1.450 1.585 1.501 0.205 0.137
* p<0.04 ** p<0.02 *** pCO.OOl

3 3 3
Appendix E15 Fit v Frail Elderly Hales Taking DIGOXIN - Hann-Whitney Testfit frail fit frailn n min min
age (years) 12 11 66 67mobility score 12 11 1 3urine volume (ml) 12 11 794 492OCr (mg in 24h) 12 11 923 302[OCr] (ng/lOOnl) 12 11 49.3 30.7[SCr] (mg/IOOml) 12 11 0.55 0.73CCr (ml/min) 12 11 56 29CCr/SA(ml/min/1.73m2) 12 11 52 37
dose (ug) 12 11 62.5 62.5IDu 12 11 25.6 25.0DDIG (ug in 24h) 12 11 32.7 22.8[DDIG] (ug/lOOml) 12 11 2.60 1.17[SDIG] (ng/ml) 12 11 0.26 0.30Clt (ml/min) 12 11 45 34Clt/SA(ml/min/1.73m2) 12 11 42 35
Clt/kg (ml/min/kg) 12 11 0.605 0.552Clr (ml/min) 12 11 31 27Clr/SA(ml/min/1.73m2) 12 11 29 28
Clr/kg (ml/min/kg) 12 11 0.422 0.442Clnr (ml/min) 12 11 -4 -35Clnr/kg (ml/min/kg) 12 11 -0.053 -0.416Clr/CCr 12 11 0.546 0.575weight (kg) 12 11 60 41SA (m2) 12 11 1.68 1.36
fit frail fit frail fit frailmax max Q1 Q1 Q3 Q3
89 87 71 79 82 81
2 4 1 3 1 4
3105 3742 1260 854 1601 2270
1838 2624 1145 688 1665 1557
222.4 139.8 69.5 38.5 113.6 114.3
1.45 2.37 0.91 0.80 1.26 1.41
193 108 83 46 104 87
164 103 75 43 87 81
250.0 250.0 125.0 62.5 250.0 125.071.1 84.9 37.5 35.8 50.2 69.1125.9 163.9 54.3 32.6 89.7 86.49.14 12.70 3.82 2.07 7.41 6.851.30 1.70 0.44 0.38 0.76 0.98264 164 80 59 230 142229 158 71 76 212 132
3.462 2.579 1.056 1.173 3.199 1.826182 194 63 52 119 109154 168 57 49 98 97
2.272 2.281 0.867 0.777 1.460 1.449130 99 16 -2 81 44
1.734 1.682 0.226 -0.022 1.197 0.8391.540 1.788 0.643 0.699 1.138 1.396
96 85 70 62 80 772.20 2.00 1.83 1.71 2.03 1.92

3 3 4
Appendix E15 Fit v Frail Elderly Hales Taking DIGOXIN - Mann-Whitney Test (contd)fitmedian frailmedian fitmean frailmean fits.d. frails.d. P
age (years) 78.0 79.0 77.2 78.5 6.8 6.2lobility score 1.0 3.0 1.1 3.4 0.3 0.5 ***urine volume (ml) 1543 1669 1371 1548 614 963OCr (mg in 24h) 1363 1064 1382 1154 289 627[OCr] (mg/lOOml) 94.8 91.0 100.6 79.6 45.5 37.6[SCr] (mg/lOOml) 1.095 0.980 1.059 1.208 0.279 0.544CCr (ml/min) 87.8 61.0 96.4 66.1 33.9 25.6 **CCr/SA(ml/min/1.73m2) 82.3 58.6 86.0 63.44 27.1 23.0 *
dose (ug) 125.0 125.0 171.9 130.7 71.1 65.3IDu 46.92 43.20 45.16 50.53 11.83 20.44ODIG (ug in 24h) 63.1 54.0 73.3 64.8 27.5 41.4[ODIG] (ug/lOOml) 4.20 3.71 5.12 5.04 2.15 3.93[SDIG] (ng/il) 0.510 0.590 0.623 0.689 0.310 0.414Clt (ll/iin) 136.9 96.9 153.2 100.0 80.9 41.3Clt/SA(ml/min/1.73m2) 119.1 86.9 136.4 96.7 69.8 39.0
Clt/kg (ml/min/kg) 1.733 1.447 2.017 1.522 1.054 0.645Clr (ml/min) 88.4 57.3 94.8 74.3 41.7 48.1Clr/SA(ml/min/1.73m2) 85.3 55.2 84.6 70.2 35.9 40.5
Clr/kg (ml/min/kg) 1.207 0.822 1.253 1.074 0.554 0.545Clnr (ml/min) 30.7 27.0 51.8 26.5 45.0 41.2Clnr/kg (ml/min/kg) 0.424 0.403 0.685 0.467 0.596 0.673Clr/CCr 1.032 1.122 0.975 1.098 0.307 0.370weight (kg) 75.0 65.0 76.0 66.8 1.1 12.3SA (m2) 1.910 1.800 1.928 1.786 0.164 0.178
* p<0.05 ** p<0.025 *** p<0.001

3 3 5
Appendix E16 Fit v Frail Elderly Hales Matched for CCr - Mann-Whitney Testfit frail fit n n nin frailnin
age (years) 11 8 66 67nobility score 11 8 1 3urine volune (nl) 11 8 794 492OCr (ng in 24h) 11 8 923 657[OCr] (mg/lOOnl) 11 8 59.0 30.7[SCr] (ng/lOOnl) 11 8 0.61 0.77CCr (nl/nin) 11 8 56 46CCr/SA(nl/nin/1.73n2) 11 8 52 45
dose (ug) 11 8 62.5 62.5%Du 11 8 25.6 25.0UDIG (ug in 24b) 11 8 32.7 32.6[ODIG] (ug/lOOnl) 11 8 2.60 1.17[SDIG] (ng/nl) 11 8 0.26 0.30Clt (nl/nin) 11 8 45 34Clt/SA(nl/nin/1.73n2) 11 8 42 35
Clt/kg (nl/nin/kg) 11 8 0.61 0.55Clr (nl/nin) 11 8 31 27Clr/SA(nl/nin/1.73n2) 11 8 29 28
Clr/kg (nl/nin/kg) 11 8 0.42 0.44Clnr (nl/nin) 11 8 -4 -35Clnr/kg (nl/nin/kg) 11 8 -0.05 -0.42Clr/CCr 11 8 0.546 0.575weight (kg) 11 8 60 55SA (n2) 11 8 1.68 1.62
fit frail fit frail fit frailnax nax Q1 Q1 Q3 Q3
89 81 75 70 82 81
2 4 1 3 1 4
2356 3742 1258 1373 1502 2664
1838 2624 1108 782 1710 1596
222.4 139.8 72.9 38.2 116.0 115.3
1.45 2.37 0.92 0.83 1.28 1.84
106 108 82 51 102 94
97 103 75 49 87 91
250.0 250.0 125.0 125.0 250.0 218.771.1 84.9 36.0 30.4 50.4 73.6125.9 163.9 52.9 48.7 88.9 101.29.14 12.70 3.89 2.13 7.71 10.461.30 1.70 0.44 0.39 0.76 0.99264 164 77 64 224 150229 158 67 59 211 147
3.46 2.58 0.98 0.87 3.10 2.38131 194 57 53 117 114134 168 53 51 95 110
2.18 2.28 0.81 0.78 1.43 1.70130 99 13 -8 81 761.73 1.68 0.19 -0.11 1.31 1.261.540 1.788 0.585 0.626 1.139 1.400
96 85 69 63 78 772.20 2.00 1.82 1.73 2.00 1.92
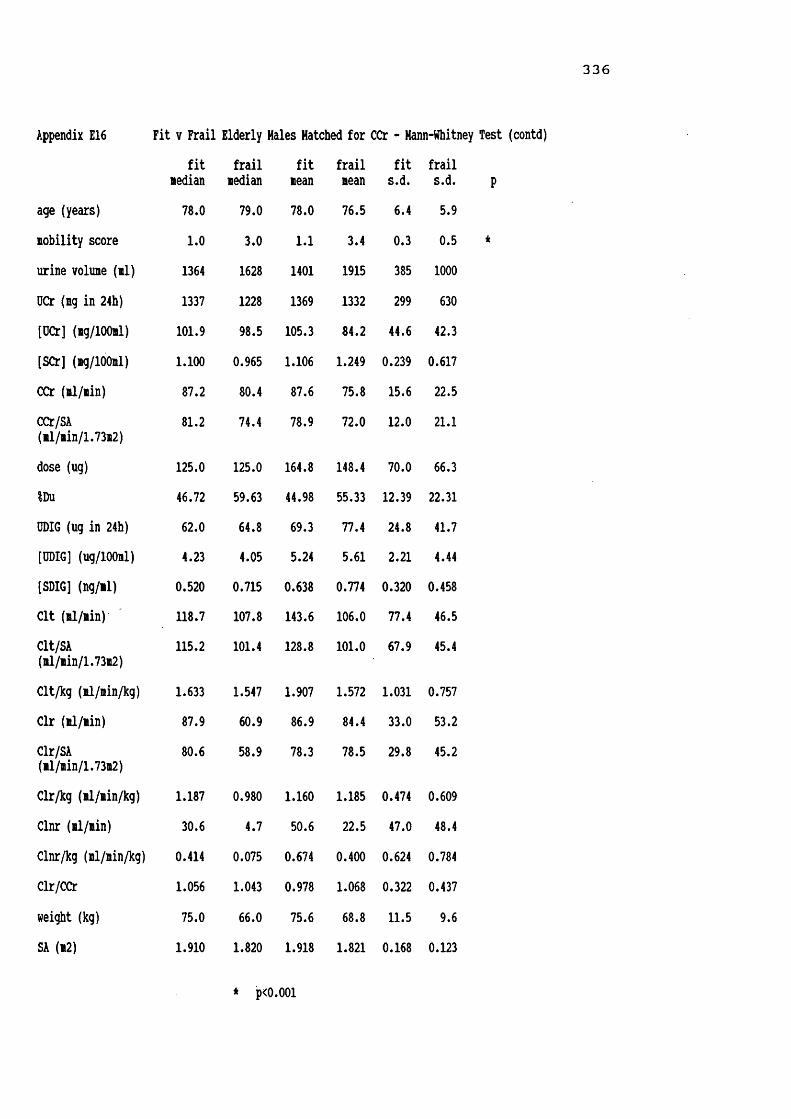
336
Appendix E16 Fit v Frail Elderly Hales Hatched for CCr - Hann-Whitney Test (contd)fit
medianfrail
medianfitmean
frailmeanfit
s.d.frails.d. p
age (years) 78.0 79.0 78.0 76.5 6.4 5.9nobility score 1.0 3.0 1.1 3.4 0.3 0.5 *urine volume (ml) 1364 1628 1401 1915 385 1000OCr (mg in 24h) 1337 1228 1369 1332 299 630[OCr] (mg/lOOml) 101.9 98.5 105.3 84.2 44.6 42.3[SCr] (mg/100ml) 1.100 0.965 1.106 1.249 0.239 0.617CCr (ml/min) 87.2 80.4 87.6 75.8 15.6 22.5CCr/SA(ml/min/1.73m2) 81.2 74.4 78.9 72.0 12.0 21.1
dose (ug) 125.0 125.0 164.8 148.4 70.0 66.3IDu 46.72 59.63 44.98 55.33 12.39 22.31ODIG (ug in 24h) 62.0 64.8 69.3 77.4 24.8 41.7[ODIG] (ug/lOOml) 4.23 4.05 5.24 5.61 2.21 4.44[SDIG] (ng/il) 0.520 0.715 0.638 0.774 0.320 0.458Clt (ml/min) 118.7 107.8 143.6 106.0 77.4 46.5Clt/SA(ml/min/1.73m2) 115.2 101.4 128.8 101.0 67.9 45.4
Clt/kg (ml/min/kg) 1.633 1.547 1.907 1.572 1.031 0.757Clr (ml/min) 87.9 60.9 86.9 84.4 33.0 53.2Clr/SA(nl/min/1.73m2) 80.6 58.9 78.3 78.5 29.8 45.2
Clr/kg (ml/min/kg) 1.187 0.980 1.160 1.185 0.474 0.609Clnr (ml/min) 30.6 4.7 50.6 22.5 47.0 48.4Clnr/kg (ml/min/kg) 0.414 0.075 0.674 0.400 0.624 0.784Clr/CCr 1.056 1.043 0.978 1.068 0.322 0.437weight (kg) 75.0 66.0 75.6 68.8 11.5 9.6SA (m2) 1.910 1.820 1.918 1.821 0.168 0.123
* pcO.OOl

337
Appendix FIINFORMATION SHEET FOR PARACETAMOL STUDY
Dr. Parker is carrying out a project with the St. Marks Road GP's surgery, and the Research Institute for the Care of the Elderly, St. Martins Hospital, looking at the way in which paracetamol tablets are handled by your body.These instructions should be followed carefully during the period of the study. If you are not sure what to do at any time then let someone know. Phone numbers are given at the bottom of this sheet. If you change your mind and do not wish to help, please also phone these numbers.1) On the morning of the study Dr. Parker will call, and ask you to empty your bladder. You will then have a
small blood sample taken. Following this, you will be required to take the two paracetamol tablets provided.2) Each and every time you pass urine after taking the tablets, please collect it, in a separate container
provided. Write on the container your name, and the time at which the urine was collected. ALL urine should be collected, even at night time. If you should happen to run out of containers in which to collect urine, a clean jam jar, or similar, will do. If you need to have your bowels open, empty your bladder first.
3) Exactly 24 hours later from when you took the paracetamol tablets, collect a final urine specimen, and save it.
4) Dr. Parker will need to take a further 5 blood samples during the day of the study (during the day time).Each time he needs a sample he will call at your house.
5) Dr. Parker will ask you at what time you got up, and went to bed on the study day, and how far you walked.
6) If you usually take tablets containing paracetamol, please do not take any from bedtime of the day before the study, and do not take any further paracetamol during the study until the blood sampling is complete.
7) If you are taking any other tablets you may take theseas usual, but let Dr. Parker know.Very many thanks.
IN CASE OF QUERY PLEASE DO NOT HESITATE TO CONTACTSUE ELLMERS (STUDY CO-ORDINATOR ) AT WORK ON BATH 835866 OR
AT HOME ON BATH 834963

338
Appendix F2STUDY TO MEASURE PARACETAMOL METABOLISM IN THE ELDERLY
Name : ....................... Study No. . .Address : ....................... Study Date. .
......................... Mobility ScoreTel. N o . : .......................Height/cm. . .D.O.B. : ..................... Weight/kg. . .Age : ...................... 2G.P. : ...................... Surface area/mDiagnoses : .....................................
Continent or catheterised: Drugs : ................
Intended Time for Par. to be taken :Time Paracetamol taken : Dose Paracetamol taken :
INTENDED ACTUALBlood Samples : O h .............- ...............3 h .............-...............4 h .............-...............6 h .............— ...............9 h .............- ...............1 2 h .............-...............
Time 24h urine colIn started : .......... (discard urine)Urine samples : Time Vol/ml Combined
1) . • • }..............2) . . . .— }..............3) . . . }.............alcohol 4 ) . . . . - ............}.............5) . . . . —........... }.............6) . . . .- }..............tobacco 7 ) . . . . - ............}.............8) . . . }..........9) . . . .-........... >.............
10) . . . .- }..............11) . . . .- >..............12) . . . >..............
TOTAL URINE VOL........................ IN............... hrsComments

3 3 9
Appendix F3 Demographic Details of Subjects Taking Part in PARACETAMOL Studysubject sex/age wt/ht fit MSc smoker EtOIF01GPP F 78 59/153 Y 2 no no
F02GPP F 88 50/160 Y 1 no 3/wl
F03GPP F 79 42/155 Y 1 3/day no
F04GPP F 81 57/165 Y 1 no occH05GPP M 82 75/175 Y 2 no occ
F06GPP F 82 45/139 Y 2 no no
F07GPP F 84 60/150 Y 2 no occ
F08GPP F 74 50/148 Y 1 no occH09GPP M 75 76/160 Y 1 no occF10GPP F 80 51/152 Y 1 no occM11GPP M 80 76/147 Y 1 no noF12GPP F 74 67/164 Y 1 no no
F13GPP F 74 66/161 Y 1 >20/day 7/wl
H14P M 80 84/183 N 4 no 14/wl
F15GPP F 67 87/153 Y 1 no 1/wl
H16GPP M 73 56/158 Y 1 1/4 oz occF17GPP F 78 75/148 Y 2 no noH18GPP M 69 69/169 Y 1 pipe no
F19GPP F 67 62/166 Y 2 no no
M20P M 81 81/165 N 3 no noF21P F 93 38/145 N 4 no no
diagnoses drugspalpitations propranolol,Betnovate creamdry skin, cramp quinine sulphatehypertension Navidrex K, nitrazepamresected NG colon calcium, cod liver oilMonastry Herbs, yeastblind, MI 88, CHD frusemidethyroidectomy paracetamolhypothyroid thyroxine, cinnarizinerecent UTI prednisolone, paracetamolasthma terbutaline & budesonide inh.RA, hiatus hernia Indocid,cimetidine,hypertension Gaviscon, Tenoret 50bilateral THR astemizole, paracetamolhypertension Gaviscon, vits B & Cminor skin lesion Yeastvitemacular degen. salbutamol inh., Benylinred eyes, deaf chloramphenicol eye ointmentgout, hiatus hernia oxytetracycline, Gavisconblind R eye hydrocortisone,pilocarpine &glaucoma, OA Propine eye dropsCa L breast tamoxifen, nitrazepammastectomy co-proxamolOA, leg ulcers indomethacin/ tib & fibhiatus hernia Burinex K, ranitidineURTI, phlebitis Gaviscon, co-proxamolpolymyalgia naproxen, paracetamolOA nonemigraine, partial paracetamolthyroidectomyCOAD aminophylline SR,salbutamol &night cramps beclomethasone inh.,R THR, knee pain naproxen,paracetamol,sennadepression amitriptylline,falls & i lofepramine, KClpetit mal epilepsy naproxen, paracetamol

340
Appendix F3 Demographic Details of Subjects Taking Part in PARACETAMOL Study (contd)subject sex/age wt/ht fit/HSc smoker EtOH diagnoses drugsF22P F 84 42/148 N 3 no no AF, glaucoma R THR, blind R eye
digoxin, pilocarpine ED Asilone, Hilpar
M23P H 88 55/165 N 3 no no ? Ca prostate IHD
cimetidine, Hilpar paracetamol, multivitamins
M24P M 73 61/173 N 3 5cigars 4/wk hiatus hernia, TURP terodiline, temazepamM25P M 66 89/179 Y 3 10/day no ? normal pressure hydrocephalus, IHD Hilpar, paracetamol
F26P F 82 72/154 N 4 no no osteoporosis t L & R femur, leg ulcer & cellulitis
ranitidine, diclofenac morphine sulphate, senna
F27P F 84 46/147 N 3 no no cataracts, OA gastric erosions
Haxitrol ED
F28P F 80 67/156 H 3 10/day no t L Colies haematuria
amitripylline, co-proxamol
M29P M 72 57/173 N 4 no no CVA x 3L. hemiparesis enalapril,Hilpar,frusemide hydralazine,metoprololF30GPP F 68 47/162 Y 2 no occ. emphysema salbutamol&beclonethasone
inh., oxygenM31GPP M 68 84/172 Y 1 no 1/wk OA, indigestion Betnovate, mag.trisil.mixH32P M 97 40/170 N 5 no no bronchitis, R THR cataracts, deafness temazepam, senna hydroxycobalamineM33P H 76 74/169 N 4 no no CVA x 2, TORP COAD, THR X 2
ranitidine, Neonaclex K prochlorperazine, diazepam aspirin, glycerine supps.
H34P H 86 46/164 N 3 no no renal failure folic acidM35P M 71 54/159 Y 3 10/day occ. Ca lung anaemia ibuprofen,morphine sulphate prednisolone,lactuloseM36P M 73 50/156 Y 3 no 7 gastric erosions iron deficiency anaemia, R THR ex-alcoholic
Praxilene, ranitidine multivitamins, senna paracetamol, FeS04
F37P F 78 79/160 N 4 no no epilepsy, UTIs CVA, L hemiplegia phenytoin, temazepam paracetamolF38P F 89 52/158 N 5 no no URTI, Parkinsons
cholecystectomycatheterisedco-benodopa, selegilene ibuprofen, lactulose co-amilofruse
F39P F 82 94/158 N 4 no 2/wk Ca R breast ? lung nets, partial thyroidectomy
co-amilofruse, GTN tamoxifen, naproxen

341
Appendix F3subject sex/age
Demographic Details of Subjects Taking Part in PARACETAMOL Study (contd) wt/ht fit/MSc smoker EtOH diagnoses
F40P F
F41P F
F42GPP FF43P F
F44P F
M45GPP MF46GPP F
F47GPP FF48GPP F
F49GPP F
H50P M
F51P F
F52P FM53GPP M
F54GPP F
M55GPP HH56GPP M
82 58/150 N
80 62/162 N
9490
6486
6494
90
83
86
81
8987
50/137 N 39/152 N
89 70/150 N
54/173 N 68/158 N
53/160 Y 36/150 Y
92/149 Y
— /175 N
93 40/140 N
42/150 H 74/183 N
87 67/152 Y
69/169 Y 60/173 Y
4 no
4 no
nono
no
no
nono
no no
4 no 5/wk3 20/day no
no occ.no occ.
1 no 7/wk
5 no no
4 no no
4 no4 no
no
no no
no occ.no 7/wk
cataractsdepressionpsoriasisOTIdyspnoeaarthritisIDDM, leg ulcer OTI, subarachnoid haemorrhage 1973cholecystectomy 1974, ORTIMNDOA, seronegative arthropathy cholecystectomy colonic resectionlumpectomykyphosis, eczema polymyalgiabilat. mastectomy phlebitisMNDpressure sorehypothyroid, OA depression
drugstemazepam ispagula huskdithranol 21, paracetamol senna, chlormethiazole Hilpar, trimethoprimsennaparacetamol sol. insulin
bendrofluazide,ampicillin lofepramine,paracetamolnoneprednisolone,Neonaclex K salbutamol,fenopren triazolam,lactulose paracetamoltamoxifenBetnovate cream calcium, lactuloseco-amilofruseco-proxamolvit. C, aspirin, Milpar paracetamol, Fybogelthyroxine, paracetamol lofepramine
infected leg ulcer Milpar, paracetamolCVAs, leg ulcer paracetamolTURP, orchidectomy ex-alcoholicOA, cholecystectomy ranitidine, temazepam quiescent lymphoma Gaviscon, paracetamolcholecystectomy paracetamolTOR, RIH repair hypertension atenolol, ibuprofen co-amilozide
F = female M = male wt = weight (kg) ht = height (cm)
ft = fit ( Yes or No )MSc = mobility scoreEtOH = alcohol consumption in approx. units per weekocc. indicates irregular consumption of small amounts

342
Appendix F4 PARACETAMOL Kinetics in Fit and Frail Elderly People0-7h 0-15htotal total totalsubject T.int 0 vol UPAR OPAR OPAR OPAR serus T.int [SPAR] tl/2start hours ffll mg ug ng/nin ng/iin sasple hours ng/dl kel hours AOC
F01GPP 7.00 236 10.1 368.7 0.878 0.888 1030 0.00 0.000 0.242 2.859 81.98§1030 6.33 284 17.5 341.6 1320 2.83 1.54010.25 880 26.4 183.8 1442 4.20 1.06823.58 1400 14.0 894.1 1640 6.17 0.5941930 9.00 0.2932230 12.00 0.160F02GPP 7.00 140 10.2 572.4 1.363 0.966 1050 1.83 1.913 0.264 2.624 82.07§0900 8.00 384 7.9 297.3 1255 3.92 1.0068.50 334 6.4 91.8 1500 6.00 0.45723.50 858 24.5 961.5 1810 9.17 0.177
2100 12.00 0.121F03GPP 8.00 182 10.4 436.6 0.910 0.734 0900 0.00 0.004 0.234 2.959 188.17§0900 8.75 405 0.0 301.5 1200 3.00 6.5787.25 420 0.0 63.8 1307 4.12 1.11024.00 1007 10.4 801.9 1500 6.00 0.6551755 8.92 0.339
2120 12.33 0.159F04GPP 5.50 370 29.5 414.6 1.256 0.990 0955 0.00 0.000 0.318 2.180 53.47§1000 8.00 444 0.0 387.2 1257 2.95 1.05110.75 820 0.0 196.2 1400 4.00 0.83324.25 1634 29.5 998.0 1613 6.22 0.4281845 8.75 0.1942145 11.75 0.071F06GPP 6.00 154 7.3 153.1 0.425 0.555 0850 0.00 0.009 0.239 2.899 100.31§0855 6.75 390 13.0 271.3 1200 3.08 1.76311.17 350 10.1 175.7 1250 3.92 1.45723.92 894 30.3 600.1 1500 6.08 0.8041755 9.00 0.3802103 12.13 0.206F07GPP 6.66 50 2.9 107.9 0.270 0.340 0925 0.00 0.017 0.291 2.383 64.69§0930 6.17 110 5.9 153.9 1225 2.92 1.31011.17 263 5.0 74.7 1332 4.03 0.97724.00 423 13.8 336.5 1522 5.87 0.5111830 9.00 0.2042130 12.00 0.095F08GPP 7.75 355 15.6 215.9 0.464 0.406 0915 0.00 0.001 0.332 2.085 50.21§0915 6.33 345 4.4 127.0 1218 3.05 1.0119.92 740 5.4 62.0 1321 4.10 0.80824.00 1440 25.4 404.9 1525 6.17 0.3891819 9.07 0.158
2122 12.12 0.055F10GPP 5.50 184 20.5 208.5 0.632 1.232 1003 0.00 0.002 0.235 2.952 72.32§1008 7.00 525 19.2 715.5 1311 3.05 1.18611.75 675 0.0 73.2 1418 4.17 0.97524.25 1384 39.7 997.2 1608 6.00 0.6161915 9.12 0.3152140 11.53 0.169
Cl Cl 1/h 1/h/kg12.20 0.207
12.18 0.244
5.31 0.126
18.70 0.328
9.97 0.222
15.46 0.258
19.92 0.398
13.83 0.271

343
Appendix F4 PARACETAMOL Kinetics in Fit and Frail Elderly People (contd)0-7h 0-15htotal total totalsubject T.int 0 vol UPAR UPAR UPAR UPAR serum T.int [SPAR] tl/2start hours il ig ng mg/min mg/min sample hours ag/dl kel hours AUC
F12GPP 7.42 338 0.0 640.3 1.438 0.924 0825 0.00 0.000 0.354 1.960 43.02@0835 6.33 230 0.0 121.9 1146 3.18 0.8779.50 532 0.0 91.2 1239 4.07 0.70023.25 1100 0.0 853.5 1435 6.00 0.3821728 8.88 0.1422033 11.97 0.043
F13GPP 6.08 260 11.3 637.0 1.746 1.048 0845 0.00 0.073 0.278 2.490 25.86@0850 8.42 659 16.3 274.4 1200 3.17 0.4509.50 855 13.3 77.8 1250 4.00 0.37924.00 1774 40.9 989.1 1445 5.92 0.2011737 8.78 0.0992050 12.00 0.039F15GPP 5.67 108 6.1 284.8 0.837 0.659 1040 0.00 0.000 0.205 3.380 78.59@1050 6.58 181 7.9 199.7 1408 3.30 1.19212.25 830 0.0 158.3 1507 4.28 0.97624.50 1119 14.0 642.8 1709 6.32 0.624
2002 9.20 0.3922225 11.58 0.209F17GPP 7.50 688 1.9 483.3 1.074 0.749 0810 0.00 0.024 0.265 2.613 59.35@0815 7.50 830 5.4 190.7 1115 3.00 1.0408.42 890 7.4 50.0 1223 4.13 0.86723.42 2408 14.7 724.0 1422 6.12 0.485
1714 8.98 0.2232014 11.98 0.108F19GPP 5.83 99 8.0 181.7 0.519 0.573 0905 0.00 0.000 0.254 2.725 133.05@0915 7.50 279 8.2 276.3 1220 3.08 2.6481315 4.00 2.07713.33 378 16.2 458.0 1535 6.33 0.7831818 9.05 0.454
2115 12.00 0.253F21P 0923 0.00 0.187 0.243 2.849 107.51@0930 1209 2.65 1.975
1326 3.93 1.4821526 5.93 0.8121820 8.83 0.4102049 11.32 0.242
F22P 6.58 62 8.2 183.6 0.464 0.481 1000 0.00 0.000 0.249 2.788 99.36@1003 3.50 32 4.2 107.4 1306 3.05 1.77614.00 414 33.9 299.8 1403 4.00 1.45224.08 508 46.3 590.9 1540 5.62 0.8961829 8.43 0.4442100 10.95 0.256
F26P 6.42 612 24.9 370.8 0.962 0.791 0950 0.00 0.041 0.289 2.397 50.13@0952 7.08 538 13.2 269.7 1255 3.05 0.9368.00 1118 21.0 173.9 1348 3.93 0.72221.50 2268 59.1 814.4 1550 5.97 0.4261853 9.02 0.2192135 11.72 0.071
Cl Cl 1/h 1/h/kg23.25 0.347
38.67 0.586
12.72 0.146
16.85 0.225
7.52 0.121
9.30 0.245
10.06 0.240
19.95 0.281

3 4 4
Appendix F4 PARACETAMOL Kinetics in Fit and Frail Elderly People (contd)0-7h 0-15htotal total total Cl
0.268
subject T.int 0 vol UPAR UPAR UPAR UPAR serum T.int [SPAR] tl/2 Clstart hours ml mg mg ig/min mg/min sample hours mg/dl kel hours AUC 1/hF27P 6.92 160 10.0 299.9 0.722 0.392 0840 0.00 0.000 0.233 2.977 82.83 12.07@0845 7.17 208 10.8 31.3 1156 3.18 1.38510.08 430 1.6 44.0 1245 4.00 1.16624.17 798 22.5 375.1 1530 6.75 0.600
1749 9.07 0.3222115 12.50 0.164F28P 7.17 214 13.3 708.4 1.647 0759 0.00 0.314 0.220 3.146 61.45 16.27@0800 1050 2.83 1.1581201 4.02 0.7227.17 214 13.3 708.4 1403 6.05 0.3721714 9.23 0.166
2003 12.05 0.125F30GPP 7.13 426 27.2 446.0 1.043 0.756 0721 0.00 0.054 0.314 2.204 48.97 20.42@0728 6.62 638 12.5 177.8 1025 2.95 0.98310.08 910 17.4 52.5 1131 4.05 0.74323.83 1974 57.1 676.3 1339 6.18 0.3751609 8.68 0.1611821 10.80 0.091F37P 7.42 442 21.5 469.3 1.054 1.062 0920 0.00 0.000 0.374 1.853@0923 2.08 156 5.4 135.8 1237 3.23 0.39014.67 777 17.8 153.9 1350 4.45 0.28424.17 1375 44.8 758.9 1615 6.87 0.1191822 9.98 0.0362125 12.03 0.000F38P 7.00 160 0.0 154.7 0.368 0.363 0840 0.00 0.164 0.114 6.089 86.67 11.54@0847 5.25 102 0.0 112.4 1205 3.30 0.96711.92 320 0.0 275.4 1335 4.80 0.65224.17 582 0.0 542.5 1545 6.97 0.4701810 9.38 0.3962110 12.38 0.266F39P 4.17 305 5.9 132.5 0.529 0.627 1205 3.02 0.809 0.228 3.038 47.92 20.87@0904 9.33 654 13.3 375.5 1307 4.05 0.64810.67 840 8.6 127.9 1600 6.93 0.31824.17 1799 27.8 635.8 1800 8.93 0.1872103 11.98 0.108F40P 6.08 45 5.1 110.5 0.303 0.650 1215 3.03 1.602 0.284 2.440 81.26 12.31@0913 2.67 216 11.4 230.6 1319 4.10 1.56615.08 850 15.6 361.3 1607 6.90 0.93923.83 1111 32.1 702.4 1807 8.90 0.6252110 11.95 0.315F41P 6.00 102 1.1 113.3 0.315 1205 3.03 1.602 0.284 2.440 81.26 12.31@0903 1304 4.02 1.2081515 6.20 0.5946.00 102 1.1 113.3 1810 9.12 0.307
2105 12.03 0.117
0.434
0.222
0.199
0.199

345
Appendix F4 PARACETAMOL Kinetics in Fit and Frail Elderly People (contd)0-7h 0-15htotal total totalsubject T.int 0 vol UPAR UPAR UPAR UPAR serum T.int [SPAR] tl/2start hours nl ng ng ng/nin lg/nin sample hours ng/dl kel hours AUC
F42GPP 6.47 52 2.9 121.5 0.313 0.678 1130 2.90 1.406 0.233 2.976 134.57€0836 6.50 198 8.1 406.3 1234 3.97 2.1939.60 110 3.9 60.4 1436 6.00 1.33022.57 360 14.9 588.2 1743 9.12 0.6352031 11.92 0.345F43P 4.30 28 1.0 36.2 0.140 1024 3.08 1.353 0.290 2.393 65.12§0719 1128 4.15 0.903
1313 5.90 0.5204.30 28 1.0 36.2 1618 8.98 0.2591910 11.85 0.091
F44P 5.33 91 5.1 223.9 0.700 1218 3.02 1.227 0.263 2.636 62.50§0917 1317 4.00 0.8711515 5.97 0.5025.33 91 5.1 223.9 1817 9.00 0.2322115 11.97 0.106
F46GPP 6.17 170 8.4 391.6 1.058 1.007 1222 2.98 0.880 0.315 2.198 39.12§0923 4.75 404 6.4 267.9 1317 3.90 0.6111535 6.20 0.26610.92 574 14.8 659.5 1833 9.17 0.1022114 11.85 0.050
F47GPP 6.00 235 20.3 541.0 1.503 0.994 1245 2.92 0.805 0.255 2.718 39.27§0950 7.25 502 16.9 249.0 1354 4.07 0.52510.75 564 9.6 70.3 1554 6.07 0.28324.00 1301 46.8 860.3 1855 9.08 0.1282154 12.07 0.068F48GPP 6.25 94 10.4 153.5 0.409 0.678 1246 2.93 2.374 0.267 2.591 127.93§0950 7.83 334 21.1 419.5 1348 3.97 1.8488.17 220 7.9 120.6 1549 5.98 1.08022.25 648 39.4 693.6 1856 9.10 0.4502155 12.08 0.214F49GPP 3.73 284 14.4 203.4 0.909 0.778 1216 2.98 0.951 0.265 2.612 48.19§0917 8.00 158 23.7 344.3 1314 3.95 0.70811.75 426 0.0 132.7 1519 6.05 0.37323.48 868 38.1 680.4 1819 9.03 0.1532116 11.98 0.086F51P 6.67 70 9.2 184.8 0.462 1202 2.93 1.760 0.235 2.947 97.39§0906 15.00 750 38.0 399.3 1257 3.85 1.380
1505 5.98 0.76321.67 820 47.2 584.1 1830 9.40 0.3282058 11.87 0.212F52P 2.92 160 6.8 112.9 0.644 0.660 1155 2.77 1.386 0.213 3.260 76.38§0909 8.42 186 10.2 336.3 1252 3.72 0.998
6.35 322 5.7 189.2 1458 5.82 0.58817.69 668 22.8 638.4 1822 9.22 0.2862050 11.68 0.183
Cl Cl 1/h 1/h/kg7.43 0.149
15.36 0.394
16.00 0.229
25.56 0.376
25.46 0.480
7.82 0.217
20.75 0.226
10.27 0.257
13.09 0.312

346
Appendix F4 PARACETAMOL Kinetics in Fit and Frail Elderly People (contd)
total 0-7htotal 0-15htotalSubject T.int 0 vol OPAR UPAR UPAR UPAR serun T.int [SPAR]start hours nl ng ng ng/nin ng/nin sanple hours ng/dl
F54GPP 1124 2.73 1.049@0840 1238 3.97 0.7281439 5.98 0.3721740 9.00 0.1682037 11.95 0.075H05GPP 6.00 116 9.7 265.3 0.737 1.393 1000 0.00 0.000@1000 7.50 297 12.0 369.8 1253 2.88 0.98910.75 780 7.0 165.9 1400 4.00 0.81724.25 1193 28.6 801.0 1615 6.25 0.4641855 8.92 0.205
2140 11.67 0.062H09GPP 7.50 545 60.9 723.1 1.607 1.270 0910 0.00 0.001@0915 6.50 705 19.7 343.7 1215 3.00 0.88310.00 770 1.7 125.4 1320 4.08 0.80324.00 2020 82.3 1192.1 1522 6.12 0.5951815 9.00 0.259
2120 12.08 0.147M11GPP 7.50 252 9.4 373.1 0.829 0.740 0827 0.00 0.000@0835 6.25 265 0.0 237.7 1150 3.25 0.86210.17 499 0.0 164.6 1242 4.12 0.71523.92 1016 9.4 775.4 1437 6.03 0.427
1730 8.92 0.1882036 12.02 0.068M14P 4.22 240 10.2 164.7 0.651 0.592 0950 0.00 0.099@0952 8.77 330 6.8 296.7 1258 3.10 0.83610.43 515 0.0 187.6 1351 3.98 0.67823.42 1085 17.0 649.0 1600 6.13 0.4101902 9.17 0.234
2210 12.30 0.151M16GPP 4.00 140 8.3 112.4 0.468 1041 0.00 0.088@1050 1406 3.27 0.9631504 4.23 0.7634.00 140 8.3 112.4 1704 6.23 0.4402000 9.17 0.219
2222 11.53 0.220M18GPP 7.92 499 13.5 600.1 1.263 0.833 0825 0.00 0.024@0830 7.53 780 6.9 172.4 1126 2.93 0.7398.25 563 0.0 41.3 1235 4.08 0.59023.70 1842 20.4 813.8 1425 5.92 0.359
1726 8.93 0.1722030 12.00 0.087M20P 6.57 76 8.0 97.4 0.247 0.416 0853 0.00 0.002@0855 5.66 170 13.2 207.7 1200 3.08 1.19411.77 776 17.5 275.0 1258 4.05 0.88324.00 1022 38.8 580.1 1509 6.23 0.398
1810 9.25 0.1842040 11.75 0.119
kel tl/2hours AOC0.281 2.463 50.80
0.297 2.330 46.93
0.180 3.861 57.06
0.178 3.602 64.72
0.241 2.874 43.13
0.259 2.679 59.62
Cl Cl 1/h 1/h/kg
19.69 0.294
18.79 0.251
16.18 0.213
21.31 0.280
17.53 0.209
15.45 0.276
23.19 0.336
16.77 0.210

347
Appendix F4 PARACETAMOL Kinetics in Fit and Frail Elderly People (contd)0-7h 0-15htotal total totalSubject T.int 0 vol OPAR OPAR OPAR OPAR serun T.int [SPAR] tl/2 Cl Clstart hours ml ng ng ng/nin ng/nin sanple hours ng/dl kel hours AOC 1/h 1/h/kg
M23P 6.67 60 2.8 149.9 0.375 1.062 0830 0.00 0.086 0.207 3.343 69.88 14.13 0.260§0830 5.42 235 11.5 620.3 1130 3.00 1.16012.08 422 18.8 1230 4.00 0.92624.17 717 33.1 770.2 1430 6.00 0.5001740 9.17 0.2602034 12.07 0.170
M24P 7.50 418 9.5 282.6 0.628 0.646 0910 0.00 0.058 0.186 3.734 76.52 13.07 0.214§0913 5.00 445 5.7 202.3 1232 3.33 1.07711.75 735 17.1 443.9 1318 4.08 0.98924.25 1598 32.3 928.8 1514 6.02 0.5971804 8.85 0.3532114 12.02 0.222M25P 0900 0.00 0.000 0.352 1.971 37.86 26.41 0.297§0930 1223 2.88 0.9121326 3.93 0.6571519 5.82 0.2381812 8.70 0.0982122 11.87 0.037H29P 6.25 234 5.6 84.6 0.226 0.445 1025 0.00 0.000 0.172 4.025 40.99 24.40 0.436§1030 5.08 235 6.0 217.8 1344 3.23 0.6471441 4.18 0.46511.33 469 11.5 302.4 1638 6.13 0.2851940 9.17 0.1552158 11.47 0.136M31GPP 7.33 626 33.7 506.2 1.151 0.765 0717 0.00 0.000 0.245 2.834 33.37 29.97 0.357§0725 8.42 964 18.6 217.2 1023 2.97 0.6048.25 740 0.0 164.3 1133 4.13 0.43124.00 2330 52.3 887.7 1340 6.25 0.2681610 8.75 0.147
1813 10.80 0.084M32P 21.33 360 26.7 544.8 0.426 0927 0.00 0.000 0.153 4.533 112.79 8.87 0.227§0930 1240 3.17 1.4111337 4.12 1.21421.33 360 26.7 544.8 1530 6.00 0.8751830 9.00 0.5192132 12.03 0.367M33P 7.50 164 18.3 229.3 0.510 0.536 0907 0.00 0.000 0.257 2.699 67.08 14.91 0.201§0908 6.00 260 19.3 204.7 1204 2.93 1.28911.17 698 27.4 184.6 1307 3.98 0.95824.67 1122 65.0 618.6 1510 6.03 0.518
1810 9.03 0.2322114 12.10 0.119M34P 6.83 152 16.5 32.4 0.079 0.144 0900 0.00 0.153 0.095 7.332 173.07 5.78 0.126§0907 3.84 216 18.9 59.8 1208 3.02 1.44712.08 896 66.1 197.0 1308 4.02 1.33622.75 1264 101.5 289.2 1510 6.05 0.9871812 9.08 0.7332110 12.05 0.620

348
Appendix F4 PARACETAMOL Kinetics in Fit and Frail Elderly People (contd)0-7h 0-15htotal total totalSubject T.int 0 vol OPAR OPAR OPAR OPAR serun T.int [SPAR] tl/2 Cl Cl
start hours ml ng ng ng/nin ng/nin sanple hours ng/dl kel hours AOC 1/h 1/h/kgM35P 6.70 238 15.9 322.1 0.801 0.753 0848 0.00 0.000 0.261 2.655 51.58 19.39 0.359§0850 5.55 668 23.9 231.4 1217 3.45 0.908
10.25 1205 26.3 147.0 1322 4.53 0.67522.50 2111 66.0 700.5 1526 6.60 0.4161828 9.63 0.1792105 12.25 0.092
M36P 6.33 44 5.2 210.0 0.553 0.739 0900 0.00 0.062 0.308 2.247 46.22 21.64 0.433§0905 5.92 70 8.0 333.1 1210 3.08 0.97111.75 481 18.7 203.8 1315 4.17 0.647
24.00 595 31.9 746.9 1510 6.08 0.3381820 9.25 0.1392115 12.17 0.053
H45GPP 5.42 465 31.4 354.5 1.090 0.708 1032 3.03 1.475 0.246 2.812 82.61 12.11 0.224§0730 7.10 126 4.7 177.7 1133 4.05 1.17912.23 390 13.1 227.4 1335 6.08 0.643
24.75 981 49.2 759.6 1633 9.05 0.3271943 12.22 0.153H50P 6.20 190 7.5 116.4 0.313 0.469 1217 3.07 1.028 0.238 2.910 54.46 18.36 ★§0913 5.55 324 26.6 214.0 1328 4.25 0.68612.33 778 0.0 266.1 1519 6.10 0.38624.08 1292 34.1 596.5 2055 11.70 0.112M53GPP 1138 3.13 0.241 0.157 4.417 80.05 12.49 0.169§0830 1232 4.03 0.9391441 6.18 0.9081739 9.15 0.4942135 13.08 0.247M55GPP 5.67 214 11.2 226.4 0.666 0.716 1133 3.00 0.913 0.195 3.556 57.67 17.34 0.251§0833 8.58 642 10.1 385.7 1232 3.98 0.7209.25 746 0.0 138.9 1429 5.93 0.45723.50 1602 21.4 751.1 1717 8.73 0.2632030 11.95 0.151M56GPP 3.67 106 2.7 54.8 0.249 0.552 1151 2.98 0.932 0.204 3.395 56.13 17.82 0.297§0853 10.67 546 2.2 420.3 1251 3.98 0.7009.75 1082 5.8 282.1 1445 5.87 0.452
24.09 1734 10.7 757.2 1730 8.62 0.2662049 11.93 0.136

349
Appendix F5 SCr, UCr & CCr, calculated over 8 & 24h periods, for Subjects in PARACETAMOL Studytotal 24h 24hsubject/ [SCr] urine T.int ig [OCr] urine CCr CCr 1 24h SA CCrstart ng/dl colln hours OCr mg/dl vol/ml nl/nin il/nin CCr m2 1.7312
F01GPP 1.46 1630 7.00 134.1 56.83 236 22 790930 2250 6.33 186.6 65.71 284 34 1210905 10.25 250.2 28.43 880 28 100Totals 23.58 570.9 40.78 1400 28 1.60 30
F02GPP 1.80 1800 7.00 223.6 159.87 140 30 911100 0200 8.00 350.8 91.35 384 41 1241030 8.50 343.9 102.97 334 37 112Totals 23.50 918.3 107.03 858 33 1.50 38F03GPP 1.58 1700 8.00 177.7 97.66 182 23 850900 0145 8.75 285.5 70.49 405 34 126
0900 7.25 161.9 38.55 420 24 89Totals 24.00 625.1 62.08 1007 27 1.35 35F04GPP 1.17 1530 5.50 204.9 55.37 370 53 1101000 2330 8.00 244.8 55.14 444 44 921015 10.75 377.0 45.98 820 50 104Totals 24.25 826.7 50.60 1634 48 1.63 51F06GPP 2.11 1455 6.00 84.8 55.07 154 11 650855 2140 6.75 191.0 48.98 390 22 1290850 11.17 227.4 64.85 350 16 94Total 23.92 503.2 56.29 894 17 1.34 21F07GPP 1.27 1610 6.66 38.7 77.35 50 8 530930 2220 6.17 90.6 82.40 110 19 1270930 11.17 148.9 56.63 263 17 113Totals 24.00 278.2 65.77 423 15 1.60 16F08GPP 0.82 1700 7.75 252.2 71.04 355 66 1100915 2320 6.33 174.6 50.61 345 56 930915 9.92 284.6 38.47 740 58 97Totals 24.00 711.4 49.40 1440 60 1.45 72F10GPP 1.15 1530 5.50 81.36 44.22 184 21 541000 2230 7.00 400.6 76.31 525 83 2131015 11.75 174.6 25.86 675 22 56Totals 24.25 656.6 47.44 1384 39 1.48 46F12GPP 0.91 1555 7.42 * 293.22 86.75 338 72 970830 2215 6.33 256.73 111.62 230 74 1000745 9.50 390.82 73.46 532 75 101Totals 23.25 940.8 85.52 1100 74 1.76 73F13GPP 1.03 1450 6.08 257.3 98.96 260 68 860845 2315 8.42 471.6 71.56 659 91 1150845 9.50 446.6 52.23 855 76 96Totals 24.00 1175.5 66.26 1774 79 1.74 79F15GPP 0.92 1630 5.67 268.9 249.02 108 86 1101050 2305 6.58 302.3 167.04 181 83 1061120 12.25 482.8 58.17 830 71 91Totals 24.50 1054.0 94.19 1119 78 1.96 69

350
Appendix F5 SCr, UCr & CCr, calculated over 8 & 24h periods, for Subjects in PARACETAMOL Study (contd)total 24h 24hsubject/ [SCr] urine T.int ng [OCr] urine CCr CCr 1 24h SA CCr
start ig/dl colln hours OCr ig/di vol/il ll/nin nl/nin CCr n2 1.73n2F17GPP 0.92 1545 7.50 308.4 44.82 688 74 930815 2315 7.50 373.7 45.03 830 90 1130740 8.42 356.5 40.06 890 77 96Totals 23.42 1038.6 43.13 2408 80 1.79 78F19GPP 1.53 1500 5.83 122.9 124.20 99 23 550910 2230 7.50 256.1 91.79 279 37 88
0910 10.67 542.4 226.01 240 55 131Totals 24.00 921.4 149.10 618 42 1.46 50F22P 2.14 1630 6.58 105.0 169.34 62 12 920955 2000 3.50 52.9 165.44 32 12 921000 14.00 240.3 58.04 414 13 100Totals 24.08 398.2 78.38 508 13 1.33 17F26P 0.90 1525 6.42 171.0 27.94 612 49 1110900 2230 7.08 167.4 31.11 538 44 1000630 8.00 168.8 15.10 1118 39 89Totals 21.50 507.2 22.36 2268 44 1.77 43F27P 0.69 1535 6.92 169.4 105.87 160 59 1900840 2245 7.17 46.7 22.46 208 16 52
0850 10.08 98.4 22.88 430 24 77Totals 24.17 314.5 39.41 798 31 1.37 40F30GPP 1.00 1438 7.13 180.0 43.66 426 43 910730 2115 6.62 217.6 34.10 638 55 1170720 10.08 266.2 29.25 910 44 94Totals 23.83 669.8 33.93 1974 47 1.46 56F37P 1.00 1640 7.42 306.0 69.23 442 69 1300915 1845 2.08 90.1 57.76 156 72 138
0925 14.67 366.4 47.16 777 42 79Totals 24.17 762.5 55.46 1375 53 1.90 48F38P 0.89 1550 7.00 110.2 68.86 160 29 1040850 2105 5.25 41.6 40.74 102 15 54
0900 11.92 212.6 66.43 320 33 118Totals 24.17 364.4 62.61 582 28 1.52 32F39P 1.53 1300 4.17 158.0 51.81 305 41 870850 2220 9.33 385.8 58.99 654 45 960900 10.67 491.1 58.47 840 50 106Totals 24.17 1034.9 57.53 1799 47 2.07 39F40P 1.25 1520 6.08 63.0 139.88 45 14 470915 1800 2.67 159.2 73.70 216 79 263
0905 15.08 321.7 37.85 850 28 93Totals 23.83 543.9 48.96 1111 30 1.58 33F41P 1.39 1445 24.00 459.4 31.90 1440 23 23 1.69 230845

351
Appendix F5 SCr, OCr & CCr, calculated over 8 & 24h periods, for Subjects in PARACETAMOL Study (contd)total 24h 24hsubject/ [SCr] urine T.int ig [OCr] urine CCr CCr I 24h SA CCrstart mg/dl colln hours OCr mg/dl vol/il ml/min ml/min CCr m2 1.7312
F42GPP 0.59 1500 6.47 129.1 248.25 52 56 740832 2130 6.50 359.9 181.77 198 156 2050706 9.60 117.1 106.47 110 34 45Totals 22.57 606.1 168.40 360 76 1.41 93F44P 0.88 1330 11.00 384.5 86.80 443 66 1140230 2025 6.92 256.8 92.71 277 70 1210330 7.08 128.4 46.20 278 34 59Totals 25.00 769.7 77.13 998 58 1.74 58F46GPP 1.01 1530 6.17 292.0 171.75 170 78 1320920 2015 4.75 207.0 51.24 404 72 1220830 12.25 335.4 145.85 230 45 76Totals 23.17 834.4 103.78 804 59 1.75 59F47GPP 0.69 1545 6.00 258.6 110.06 235 104 1010945 2300 7.25 327.2 65.17 502 109 1060945 10.75 439.2 77.87 564 99 96Totals 24.00 1025.0 78.79 1301 103 1.55 115F48GPP 0.78 1600 6.25 101.4 107.84 94 35 850945 2350 7.83 202.8 60.72 334 55 1340800 8.17 125.6 57.07 220 33 80Totals 22.25 429.8 66.32 648 41 1.23 58F49GPP 0.82 1300 3.73 101.7 35.82 284 55 860916 2100 8.00 240.1 151.95 158 61 950845 11.75 396.1 92.98 426 69 108Totals 23.48 737.9 85.01 868 64 1.99 56F51P 1.16 1545 6.67 70.3 100.46 70 15 680905 0645 15.00 266.8 35.57 750 26 118Totals 21.67 337.1 41.11 820 22 1.26 31F52P 1.19 1200 2.92 123.0 76.87 160 59 1480909 2025 8.42 200.6 107.87 186 33 830246 6.35 175.6 52.72 322 37 93Totals 17.69 499.2 74.72 668 40 1.34 52F54GPP 1.70 1505 6.50 305.1 44.61 684 46 1120835 2200 6.92 278.7 46.76 596 39 950910 11.17 439.5 62.78 700 39 95Totals 1023.3 51.68 1980 41 1.71 41F21P 2.80 1.25F28P 2.06 1.73F43P 0.50 1.29M05GPP 1.68 1600 6.00 230.1 198.37 116 38 801000 2330 7.50 387.3 130.42 297 51 1041015 10.75 571.6 73.28 780 53 108Totals 24.25 1189.0 99.67 1193 49 1.92 44

352
Appendix F5 SCr, OCr & CCr, calculated over 8 & 24h periods, for Subjects in PARACETAMOL Study (contd)total 24h 24hsubject/ [SCr] urine T.int ug [OCr] urine CCr CCr 1 24h SA CCrstart ng/dl colln hours OCr ng/dl vol/ul ul/iin il/uin CCr u2 1.73U2
M09GPP 1.29 1645 7.50 509.7 93.53 545 88 1170830 2315 6.50 375.4 53.25 705 75 1000915 10.00 506.4 65.77 770 65 87Totals 24.00 1391.5 68.89 2020 75 1.86 70M11GPP 1.30 1600 7.50 385.7 153.05 252 66 970830 2215 6.25 363.0 136.98 265 74 109
0825 10.17 526.0 105.42 499 66 97Totals 23.92 1274.7 125.46 1016 68 1.80 66H14P 0.69 1403 4.22 227.1 94.64 240 130 1240950 2249 8.77 379.1 114.88 330 104 990915 10.43 412.7 80.15 515 96 91Totals 23.42 1018.9 93.91 1085 105 2.06 88H16GPP 0.81 2300 5.50 287.4 105.28 273 108 1401730 0845 9.75 278.5 57.79 482 59 77
1750 9.08 344.1 35.99 956 78 101Totals 24.33 910.0 53.18 1711 77 1.58 84M18GPP 1.61 1625 7.92 526.4 105.49 499 69 1170830 2357 7.53 392.3 50.30 780 54 920812 8.25 421.8 74.92 563 53 90Totals 23.70 1340.5 72.77 1842 59 1.81 56M20P 3.78 1524 6.57 158.8 208.93 76 11 690850 2104 5.66 227.7 133.93 170 18 1130850 11.77 459.2 59.17 776 17 106Totals 24.00 845.7 82.75 1022 16 1.94 14H23P 2.38 1500 6.67 56.9 94.84 60 6 300820 2025 5.42 260.6 110.89 235 34 1700830 12.08 362.0 85.78 422 21 105Totals 24.17 679.5 94.77 717 20 1.60 21H24P 2.24 1630 7.50 1188.1 284.22 418 118 1550900 2130 5.00 574.7 129.14 445 86 1130915 11.75 716.8 97.52 735 45 59Totals 24.25 2479.6 155.17 1598 76 1.72 77M29P 1.47 2025 10.08 63.6 10.51 605 7 441030 1025 14.00 266.2 43.00 619 22 138Totals 24.08 329.8 26.94 1224 16 1.64 16M31GPP 1.11 1435 7.33 470.0 75.08 626 96 1070715 2300 8.42 525.3 964 94 1040715 8.25 449.7 740 82 91Totals 24.00 1445.0 2330 90 2.02 77M32P 1.65 0640 21.33 354.4 98.44 360 17 17 1.36 210920

3 5 3
Appendix F5 SCr, OCr & CCr, calculated over 8 & 24h periods, for Subjects in PARACETAMOL Study (contd)total 24h 24hsubject/ [SCr] urine T.int ng [OCr] urine CCr CCr % 24h SA CCrstart ng/dl colln hours OCr ng/dl vol/nl nl/nin nl/nin CCr n2 1.73n2
M33P 0.94 1530 7.50 304.5 185.67 164 72 900800 2130 6.00 282.5 108.64 260 83 1040840 11.17 523.3 74.97 698 83 104Totals 24.67 1111.1 99.03 1122 80 1.88 73M34P 3.07 1550 6.83 76.1 50.06 152 6 600900 1940 3.84 83.9 38.83 216 12 1200745 12.08 243.0 27.12 896 11 110Totals 22.75 403.0 31.88 1264 10 1.45 11M35P 0.90 1542 6.70 196.3 82.47 238 54 950900 2115 5.55 201.3 30.14 668 67 1180730 10.25 300.9 24.97 1205 54 95Totals 22.50 698.5 33.09 2111 57 1.56 64M36P 1.10 1520 6.33 136.2 309.51 44 33 750900 2115 5.92 178.5 254.93 70 46 1050900 11.75 375.6 78.09 481 48 109Totals 24.00 690.3 116.01 595 44 1.48 51M45GPP 0.65 1250 5.42 122.7 26.39 465 58 950725 1956 7.10 96.4 76.47 126 35 570810 12.23 367.9 94.33 390 77 126Totals 24.75 587.0 59.84 981 61 1.61 65H50P 2.36 1527 6.20 92.6 48.73 190 11 85 *0915 2100 5.55 107.9 33.31 324 14 1080920 12.33 242.7 31.19 778 14 108Totals 24.08 443.2 34.30 1292 13M55GPP 1.87 1410 5.67 258.2 120.67 214 41 910830 2245 8.58 479.8 74.73 642 50 1110800 9.25 456.7 61.22 746 44 98Totals 23.50 1194.7 74.58 1602 45 1.81 43H56GPP 1.89 1140 3.67 100.8 95.11 106 24 650800 2220 10.67 420.2 76.96 546 35 950805 9.75 494.6 45.71 1082 45 122Totals 24.09 1015.6 58.57 1734 37 1.70 38M25PM53GPP 1.873.23 2.121.94

354
Appendix F6 Results fron All Subjects Taking PARACETAMOLn nin nax Q1 Q3 nedian nean s.d.
age (years) 55 64 97 74 87 81 80.3 8.3tl/2 (h) 55 1.960 7.332 2.463 3.260 2.834 3.004 0.928Cl (1/h) 55 5.31 38.67 12.11 19.95 16.00 16.263 6.421Cl (1/h/kg) 54 0.121 0.586 0.214 0.316 0.248 0.2689 0.0947[SPAR] G 3h (ng/dl) 51 0.450 6.578 0.913 1.411 1.051 1.304 0.872[SPAR] § 4h (ng/dl) 53 0.379 2.193 0.704 1.138 0.871 0.959 0.385urine vol. (nl) 50 360 2408 816 1653 1120.5 1236.1 76.4free OPAR (ng) 51 0.0 101.5 14.0 40.9 27.8 30.51 21.34OPARG+S (ng) 43 187.7 1109.8 562.3 793.4 670.4 680.8 184.8total OPAR (ng) 43 289.2 1192.1 596.5 814.4 702.4 715.1 185.3OCr (ng in 24h) 50 315 2480 502 1028 724.7 805.5 55.6[OCr] (ng/lOOnl) 50 22.4 168.4 47.5 94.3 66.29 72.75 4.89SCr (ng/lOOnl) 55 0.50 3.78 0.90 1.70 1.19 1.382 0.656CCr (nl/nin) 50 10 105 28 70 45 48.0 25.0CCr/SA(nl/nin/1.73n2) 49 11 115 33 70 51 50.7 23.7
weight (kg) 54 36 40 50 72 60 60.8 15.1SA (n2) 54 1.23 2.12 1.46 1.80 1.62 1.640 0.235

Appendix F7 Spearaans Coefficient of Rank Correlation for All Subjects Taking PARACETAMOL
ageyears M.Sc tl/2hours Cl1/h Cll/h/kg
urinevolmlfreeUPARng
DPARG+SngtotalDPARng UCrng SCr CCr CCr weight ng/dl nl/nin 1.73m2 kg
n 55 55 55 55 54 50 51 43 43 50 55 50 49 54M.Sc 0.282
tl/2 0.133 0.255
Cl 0.394kkk 0.309 0.402***Cl/kg 0.169 0.249 0.377*** 0.731****0 vol 0.467*** 0.358 0.047 0.516**** 0.275
freeDPAR
0.179 0.051 0.034 0.039 0.004 0.249
UPARG+S 0.378 0.572kkkk 0.154 0.375 0.258 0.462*** 0.050
totalDPAR 0.415*** 0.536**** 0.172 0.381 0.276 0.496*** 0.140 0.992kkkkOCr 0.391*** 0.533**** 0.149 0.507**** 0.101 0.494kkkk 0.046 0.551kkkk 0.534****SCr 0.135 0.063 0.200 0.137 0.230 0.040 0.124 0.028 0.028 0.039
CCr 0.450*** 0.368*** 0.159 0.453*** 0.178 0.377*** 0.005 0.434*** 0.426*** 0.730**** 0.599•kkkkCCr/SA 0.416*** 0.321 0.157 0.385*** 0.211 0.304 0.004 0.384*** 0.371*** 0.596**** 0.650**** 0.963kikltweight 0.327 0.197 0.105 0.548**** 0.114 0.443*** 0.047 0.284 0.277 0.720**** 0.034 0.520 0.315 ****SA 0.334 0.161 0.055 0.598**** 0.043 0.481kkkk 0.014 0.326 0.321 0.723**** 0.053 0.528 0.315kkkk 0.973kkkk
*** p<0.01 **** p<0.001

356
Appendix F8 Results from Female Subjects Taking PARACETAMOLn min max Q1 Q3 median mean s.d.
age (years) 33 64 94 78 89 82 81.8 8.0tl/2 (h) 33 1.960 6.089 2.418 2.968 2.718 2.795 0.693Cl (1/h) 33 5.31 38.67 10.17 19.94 13.83 15.41 6.86Cl (1/h/kg) 33 0.121 0.586 0.219 0.320 0.244 0.2695 0.1040[SPAR] G 3h (mg/dl) 31 0.450 6.578 0.967 1.760 1.192 1.490 1.066[SPAR] G 4h (mg/dl) 32 0.379 2.193 0.724 1.337 0.976 1.053 0.435urine vol. (ml) 30 360 2408 766 1488 1054 1166 552free UPAR (mg) 26 0.0 59.1 14.8 42.2 28.7 29.95 16.38UPARG+S (mg) 25 322.7 968.5 557.2 826.8 642.3 673.4 184.1total UPAR (mg) 25 336.5 998.0 589.5 856.9 680.3 703.4 188.1UCr (mg in 24b) 30 315 1176 489 926 647.4 695.8 252.2[UCr] (mg/lOOml) 30 22.4 168. ̂ 42.6 85.1 62.3 69.9 6.4[SCr] (mg/lOOml) 33 0.50 2.80 0.89 1.50 1.06 1.201 0.496CCr (ll/min) 30 13 103 28 61 42 46.2 22.6CCr/SA(il/min/1.73m2) 30 16 115 33 62 48 50.1 23.0
weight (kg) 33 36 94 45 67 57 57.7 15.2SA (m2) 33 1.23 2.07 1.36 1.74 1.55 1.567 0.222

3 5 7
Appendix F9 Spearmans Coefficient of Rank Correlation for Female Subjects Taking PARACETAMOL
ageyears M.Sc tl/2hours Cl1/h Cl1/h/kgurinevol.ml
freeDPARmg
DPARG+SmgtotalDPARmg OCrmg SCr CCr CCr weight mg/dl ml/min 1.73m2 kg
n 33 33 33 33 33 30 26 25 25 30 33 30 30 33M.Sc 0.489***tl/2 0.130 0.361
Cl 0.301 0.305 0.542***Cl/kg 0.083 0.185 0.566*** 0.718****0 vol 0.544kkk 0.298 0.318 0.563*** 0.303
freeDPAR
0.152 0.019 0.166 0.188 0.273 0.352
DPARG+S 0.352 0.525kkk 0.237 0.288 0.148 0.515 0.214
totalDPAR 0.370 0.511*** 0.252 0.306 0.180 0.548kkk 0.308 0.993kkkkOCr 0.443 0.513*** 0.299 0.559kkk 0.183 0.460 0.169 0.461 0.433
SCr 0.066 0.061 0.154 0.298 0.277 0.050 0.070 0.101 0.137 0.002
CCr 0.272 0.390 0.274 0.600*** 0.335 0.369 0.058 0.372 0.334 0.736kkkk 0.612****CCr/SA 0.193 0.379 0.261 0.470 0.370 0.217 0.079 0.333 0.290 0.583kkk 0.685kkkk 0.947kkkkweight 0.323 0.181 0.118 0.582kkkk 0.076 0.452 0.108 0.259 0.239 0.656kkkk 0.083 0.518*** 0.271
SA 0.329 0.220 0.166 0.662**** 0.021 0.527*** 0.118 0.354 0.332 0.661kkkk 0.111 0.538*** 0.289 0.974****
*** p<0.01 **** p<0.001

358
Appendix F10 Results froa Hale Subjects Taking PARACETAMOLn ain aax Q1 Q3 aedian Bean s.d.
age (years) 22 64 97 72 84 78 77.9 8.4tl/2 (h) 22 1.971 7.332 2.673 3.766 3.021 3.319 1.145Cl (1/h) 22 5.78 29.97 14.00 21.39 17.44 17.55 5.61Cl (1/h/kg) 22 0.126 0.436 0.211 0.317 0.251 0.2679 0.0805[SPAR] § 3h (ag/dl) 20 0.640 1.475 0.867 1.186 0.967 1.017 0.249[SPAR] § 4h (ag/dl) 21 0.431 1.336 0.668 0.949 0.763 0.814 0.234urine vol. (al) 20 360 2330 1018 1728 1244 1341 519free DPAR (ag) 20 8.3 101.5 17.9 51.5 32.1 37.03 25.46OPARG+S (ag) 18 187.7 1109.8 560.2 777.6 722.4 691.2 190.5total DPAR (ag) 18 289.2 1192.1 613.1 804.2 754.1 731.2 185.5DCr (ag in 24h) 20 330 2480 610 1255 963 970 504[OCr] (ag/lOOal) 20 26.9 155.2 54.5 98.9 73.7 77.1 33.9SCr (ag/lOOal) 22 0.65 3.78 1.01 1.98 1.63 1.653 0.777CCr (al/ain) 20 10 105 18 76 53 50.8 28.7CCr/SA(al/ain/1.73a2) 19 11 88 21 73 56 51.5 25.3
weight (kg) 21 39 89 55 76 69 65.8 13.9SA (m2) 21 1.36 2.12 1.59 1.93 1.80 1.755 0.210

359
Appendix Fll Spearmans Coefficient of Rank Correlation for Hale Subjects Taking PARACETAMOL
age H.Sc yearsn 22 22H.Sc 0.098
tl/2 0.409 0.252
Cl 0.457 0.349
Cl/kg 0.500 0.396
0 vol 0.313 0.558
free 0.130 0.217UPARUPAR 0.372 0.718G+S ***total 0.456 0.651UPAR ***UCr 0.241 0.673
***
SCr 0.565 0.004***
CCr 0.518 0.296
CCr/SA 0.523 0.173
weight 0.201 0.284
SA 0.198 0.119
tl/2 Cl Cl hours 1/h 1/h/kg22 22 21
0.560
0.552 0.861 ****
0.056 0.355 0.267
0.164 0.295 0.296
0.242 0.445 0.405
0.265 0.361 0.356
0.288 0.274 0.021
0.185 0.175 0.278
0.188 0.123 0.004
0.157 0.133 0.007
0.354 0.437 0.020
0.288 0.358 0.057
*** p<0.01
urine free UPARvol UPAR G+Sml ng ng20 20 18
0.137
0.477 0.211
0.411 0.135 0.9814*4*
0.495 0.047 0.8034444
0.049 0.095 0.108
0.278 0.074 0.501
0.304 0.078 0.463
0.270 0.065 0.399
0.385 0.006 0.337
**** p<0.001
totalUPAR UCr [SCr]mg ng mg/dl18 20 22
0.776444
0.183 0.117
0.558 0.709 0.691444 444
0.507 0.624 0.688444 444
0.385 0.716 0.006444
0.337 0.661 0.029444
CCr CCr weight 'min 1.73m2 kg20 19 21
0.9814444
0.544 0.439
0.515 0.389 0.9534444

3 6 0
Appendix F12 Female v Hale Elderly Subjects Taking PARACETAMOL - Mann-Whitney Test
femalen
malen female
median
age (years) 33 22 82.0mobility score 33 22 2.0tl/2 (hours) 33 22 2.718Cl (1/h) 33 22 13.83Cl (1/h/kg) 33 21 0.270[SPAR] § 3h (mg/dl) 31 20 1.192[SPAR] § 4h (mg/dl) 32 21 0.976urine volume (ml) 30 20 1054free DPAR (mg) 31 20 25.37OPARG+S (mg) 25 18 642.3total DPAR (mg) 25 18 680.3OCr (mg in 24h) 30 20 647[DCr] (mg/lOOml) 30 20 62.34[SCr] (mg/lOOml) 33 22 1.060CCr (ml/min) 30 20 41.5CCr/SA(ml/min/1.73m2) 30 19 48.0
weight (kg) 33 21 57.0SA (m2) 33 21 1.550
* p<0.05 **
malemedianfemalemean
malemean
females.d.
males.d. P
78.0 81.8 77.9 8.0 8.43.0 2.4 2.7 1.3 1.4
3.021 2.795 3.319 0.693 1.145 *17.44 15.41 17.55 6.86 5.610.251 0.244 0.268 0.104 0.0810.967 1.490 1.017 1.066 0.249 **0.763 1.053 0.814 0.435 0.234 *1244 1166 1341 552 51932.08 26.30 37.03 17.37 25.46722.4 673.4 691.2 184.1 190.5754.1 703.4 731.2 188.1 185.5963 696 970 252 504 *
73.67 69.87 77.06 35.22 33.941.630 1.201 1.653 0.496 0.777 **53.0 46.2 50.8 22.6 28.756.0 50.1 51.5 23.0 25.3
69.0 57.7 65.8 15.2 13.9 *1.800 1.567 1.755 0.222 0.210 **4
p<0.02 *** p<0.005

361
Appendix F13 Fit v Frail Elderly Subjects Taking PARACETAMOL - Hann-Whitney Test
fitn frailn fitaedian frailaedian fitmean frailaean fits.d. frails.d. P
age (years) 29 26 78 83 77.3 83.5 8.2 7.3 ***nobility score 29 26 1 4 1.5 3.7 0.7 0.7 ****tl/2 (hours) 29 26 2.624 2.977 2.668 3.379 0.457 1.162 ****Cl (1/h) 29 26 18.70 13.07 18.210 13.980 6.990 5.070 **Cl (1/h/kg) 29 25 0.276 0.228 0.292 0.243 0.105 0.076 *[SPAR] 6 3h (ag/dl) 27 24 0.983 1.258 1.318 1.289 1.155 0.379[SPAR] § 4h (ag/dl) 28 25 0.783 0.958 0.880 1.047 0.376 0.382urine voluae (al) 28 22 1392 1010 1392 1037 551 465 **free DPAR (ag) 27 24 28.64 27.74 30.59 30.42 19.81 23.38OPARG+S (ag) 25 18 766.0 567.8 749.5 585.5 176.8 153.7 ****total OPAR (ag) 25 18 775.4 607.5 781.6 622.7 183.5 147.5 ****total OPAR (ag) 0 - 7h 25 18 0.837 0.487 0.889 0.575 0.419 0.369
total OPAR (ag) 0 - 15h 25 18 0.755 0.610 0.809 0.608 0.249 0.239 ***
OCr (ag in 24h) 28 22 919.8 526.0 905.6 678.0 290.3 471.0[OCr] (ag/lOOal) 28 22 66.29 68.67 73.36 71.97 31.32 39.01[SCr] (ag/lOOal) 29 26 1.17 1.22 1.279 1.497 0.409 0.846CCr (nl/nin) 28 22 49 31 54.2 40.2 22.2 26.7 *CCr/SA(al/ain/1.73a2) 28 21 56 39 56.3 43.1 21.2 25.2
weight (kg) 29 25 60 56 62.9 58.4 14.6 15.7SA (m2) 29 25 1.63 1.61 1.668 1.612 0.222 0.250
* p<0.05 ** p<0.02 *** p<0.01 **** p<0.003

362
Appendix F14 Fit v Frail Elderly Females Taking PARACETAMOL - Mann-Whitney Test
fit frail fitn n median
age (years) 18 15 79nobility score 18 15 1tl/2 (hours) 18 15 2.613Cl (1/b) 18 15 16.16Cl (1/h/kg) 18 15 0.251[SPAR] § 3h (mg/dl) 17 14 1.051[SPAR] 6 4h (mg/dl) 18 14 0.921urine volume (ml) 18 12 1210free DPAR (mg) 17 14 29.1OPARG+S (mg) 19 9 750.4total DPAR (mg) 16 9 762.9FPAR/PARG+S 16 9 0.043total OPAR (mg) 0 - 7h 16 9 0.909
total DPAR (mg) 0 - 15h 16 9 0.756
OCr (mg in 24h) 18 12 782.3[OCr] (mg/lOOml) 18 12 64.2[SCr] (mg/lOOml) 18 15 1.09CCr (ml/min) 18 12 45CCr/SA(ml/min/1.73m2) 18 12 54
weight (kg) 18 15 58SA (m2) 18 15 1.58
* p<0.05 **
frail fit frail fit frailnedian mean mean s.d. s.d. P
84 78.3 86.1 8.5 4.9 ***4 1.4 3.7 0.5 0.7 ****
2.947 2.594 3.035 0.354 0.913 *12.31 16.71 13.84 7.90 5.180.243 0.285 0.251 0.125 0.0711.369 1.577 1.384 1.402 0.4241.082 0.988 1.137 0.428 0.4461013 1268 812 535 56422.9 29.10 22.91 16.25 18.67573.3 727.2 577.7 198.0 110.2 **590.9 757.1 608.0 201.4 118.8 **0.052 0.043 0.052 0.024 0.0290.529 0.922 0.645 0.435 0.396
0.655 0.781 0.671 0.236 0.234
503.2 789.2 555.8 231.9 221.1 **60.1 71.7 67.2 33.3 39.31.06 1.203 1.199 0.406 0.60136 50.9 39.3 24.5 18.440 54.7 43.3 24.1 20.3
52 59.2 55.9 14.8 16.01.52 1.589 0.154 0.207 0.244
p<0.03 *** p<0.01 **** p<0.001

Appendix F15 Fit v Frail Elderly Hales Taking PARACETAMOL - Mann-Whitney Test
fit frail fit frail fit frail fit frailn n median median mean mean s.d. s.d.
age (years) 11 11 73 81 75.7 80.1 7.7 8.9nobility score 11 11 1 4 1.6 3.8 0.9 0.8tl/2 (hours) 11 11 2.834 3.734 2.788 3.850 0.587 1.337Cl (1/h) 11 11 19.39 14.31 20.68 14.31 4.46 4.97Cl (1/h/kg) 11 10 0.297 0.212 0.305 0.228 0.062 0.082[SPAR] § 3h (ng/dl) 10 10 0.913 1.177 0.877 1.156 0.119 0.270[SPAR] § 4h (ng/dl) 10 11 0.708 0.939 0.684 0.932 0.113 0.256urine volume (nl) 10 10 1722 1104 1615 1066 535 338free OPAR (mg) 10 10 25.0 33.6 33.12 40.93 25.54 26.12OPARG+S (mg) 9 9 766.0 562.3 789.2 593.2 132.6 194.7total OPAR (ng) 9 9 775.4 618.6 825.1 637.4 147.3 177.7FPAR/PARG+S 9 9 0.037 0.061 0.045 0.113 0.030 0.163total OPAR (ng) 0 - 7h 9 9 0.769 0.375 0.832 0.458 0.405 0.304
total OPAR (ng) 0 - 15h 9 9 0.753 0.503 0.862 0.544 0.278 0.239
OCr (mg in 24h) 10 10 1192 633 1115 825 275 643[OCr] (ng/lOOml) 10 10 70.8 88.3 76.4 77.7 28.9 39.9[SCr] (ng/lOOml) 11 11 1.30 1.71 1.403 1.904 0.400 0.985CCr (nl/nin) 10 10 58 19 60.1 41.4 17.1 35.4CCr/SA(ml/nin/L73m2) 10 9 60 21 59.3 42.9 15.4 31.9
weight (kg) 11 10 69 59 68.9 62.3 12.6 15.0SA (m2) 11 10 1.81 1.68 1.787 1.720 0.196 0.229
* p<0.05 ** p<0.02 *** p<0.006 **** p<0.001

364
Appendix F16 Results from Age-Sex Hatched Group Taking PARACETAMOL
n min max 01 Q3 median mean s.d.age (years) 32 64 94 77 88 82 81.8 7.4tl/2 (h) 32 1.971 7.332 2.405 3.393 2.905 3.104 1.102Cl (1/h) 32 5.78 26.41 12.13 18.77 15.46 15.685 5.208Cl (1/h/kg) 31 0.126 0.436 0.214 0.294 0.251 0.2583 0.0754[SPAR] § 3h (mg/dl) 30 0.647 2.374 0.927 1.361 1.050 1.186 0.388[SPAR] § 4h (mg/dl) 31 0.465 2.193 0.708 1.166 0.833 0.966 0.383urine volume (ml) 29 360 2020 801 1519 1111.0 1135.8 449.8free OPAR (mg) 26 0.0 101.5 16.5 38.4 29.9 31.88 22.86OPARG+S (mg) 25 187.7 1109.8 566.1 769.2 670.3 677.7 208.4total OPAR (mg) 25 289.2 1192.1 598.3 788.2 702.4 710.8 208.7OCr (mg in 24b) 29 315 2480 458 1021 690.3 804.0 446.8[OCr] (mg/lOOml) 29 26.9 168.4 49.8 101.7 66.33 77.03 38.3[SCr] (mg/lOOml) 32 0.50 3.07 0.84 1.85 1.26 1.368 0.622CCr (ml/min) 29 10 105 26 66 41 45.6 24.6CCr/SA(ml/min/1.73m2) 28 11 93 32 66 45 48.4 22.9
weight (kg) 31 36 92 50 69 58 60.7 13.9SA (m2) 31 1.23 2.12 1.48 1.80 1.63 1.647 0.219

365
Appendix F17 Spearmans Coefficient of Rank Correlation for Age-Sex Hatched Subjects Taking PARACETAMOL
age H.Sc yearsn 32 32H.Sc 0.185
tl/2 0.015 0.233
Cl 0.285 0.238
Cl/kg 0.096 0.325
0 vol 0.368 0.239
free 0.195 0.007UPARUPAR 0.295 0.561G+S ***total 0.366 0.510UPARUCr 0.168 0.451
[SCr] 0.068 0.132
CCr 0.254 0.230
CCr/SA 0.242 0.128
weight 0.298 0.147
SA 0.344 0.081
tl/2 Cl Cl hours 1/h 1/h/kg32 32 31
0.426***
0.378 0.702 ****
0.193 0.256 0.084
0.057 0.273 0.423
0.201 0.312 0.329
0.234 0.306 0.318
0.186 0.422 0.059
0.110 0.135 0.019
0.112 0.220 0.084
0.115 0.161 0.107
0.165 0.638 0.019 ****0.129 0.660 0.018
****
*** p<0.01
urine free UPARvol UPAR G+Sml mg mg29 30 24
0.083
0.520 0.095
0.523 0.183 0.986 ****
0.408 0.020 0.604 ***
0.402 0.066 0.210
0.148 0.093 0.364
0.094 0.181 0.288
0.392 0.067 0.250
0.414 0.046 0.284
**** p<0.001
totalUPAR UCr [SCr]mg mg mg/dl24 29 32
0.604***
0.197 0.144
0.371 0.702 0.523 **** ***
0.288 0.558 0.569 *** ***
0.268 0.704 0.155 ****
0.314 0.718 0.188 ****
CCr CCr weight ml/min 1.73i2 kg29 28 31
0.970****
0.515 0.345 ****
0.529 0.345 0.975 **** ****

366
Appendix F18 Fit v Frail Age-Sex Hatched Subjects Taking PARACETAMOL - Mann-Whitney Test
fit frail fit frail fit frail fit frailn n Median Median Mean Mean s.d. s.d. p
age (years) 16 16 82 82 81.9 81.7 7.4 7.7Mobility score 16 16 1 4 1.6 3.6 0.7 0.7 ***tl/2 (hours) 16 16 2.602 3.062 2.688 3.520 0.519 1.368 *Cl (1/h) 16 16 17.08 14.29 17.08 14.29 4.68 5.47Cl (1/h/kg) 16 15 0.264 0.222 0.272 0.243 0.054 0.093[SPAR] § 3h (Mg/dl) 15 15 0.971 1.160 1.141 1.231 0.411 0.371[SPAR] § 4h (Mg/dl) 16 15 0.783 0.958 0.897 1.039 0.323 0.437urine volune (m1) 15 14 1193 1098 1237 1027 522 343free OPAR (Mg) 14 16 29.5 32.1 30.73 33.03 18.59 27.20OPARG+S (Mg) 13 11 746.5 602.5 760.9 587.5 202.5 181.6 **total OPAR (Mg) 13 11 757.2 633.8 791.6 623.3 213.1 171.5 *total OPAR (ng) 0 - 7h 13 11 0.666 0.375 0.762 0.573 0.424 0.415
total OPAR (Mg) 0 - 15h 13 11 0.740 0.592 0.842 0.592 0.311 0.251 *
OCr (Mg in 24h) 15 14 910 565 876 727 308 562[OCr] (Mg/lOOMl) 15 14 68.9 61.2 78.9 75.1 31.2 45.8[SCr] (ng/lOOnl) 16 16 1.30 1.04 1.413 1.324 0.434 0.778CCr (Ml/Min) 15 14 44 31 46.2 44.9 18.5 30.5CCr/SA(Ml/Min/1.73M2) 15 13 46 40 48.2 48.5 17.6 28.6
weight (kg) 16 15 60 56 63.1 58.1 15.7 11.8SA ( m2) 16 15 1.67 1.61 1.672 1.620 0.240 0.200
* p<0.03 ** p<0.02 *** p<0.0001
Related Documents