Copyright 1987 by The Cerontological Society of America The 1982 National Long-Term Care Survey and Informal Caregivers Survey provided data for the first national estimates of informal caregivers to noninstitutionalized disabled elders. The descriptive profile confirmed previous research findings that informal caregivers are predominantly female, that a sizeable proportion is over age 65, and that a minority use formal services. There also was evidence for competing demands: 2 1 % reported child care responsibilities, 9% indicated that they had quit their jobs, and 20% reported other work conflict. Key words: Informal care, Caregiving to aged Caregivers of the Frail Elderly: A National Profile 1 Robyn Stone, Dr. PH, 2 Gail Lee Cafferata, PhD, 2 and Judith Sangl, MPH : Over the past few decades the importance of fam- ily and friends in providing long-term care to the elderly has been established. Much of this literature has been focused on the composition of the informal caregiving network and the responsibilities and time commitments of caregivers. Some researchers (see, for example, Cantor, 1983; Horowitz & Dobrof, 1982; Litwak, 1985; Shanas, 1979; Stephens & Christianson, 1986) have described the variety of sources for care, including spouses, children, other relatives, friends, and neighbors. Others (see, for example, E. Brody, 1981; Cicirelli, 1981; Stoller, 1983) have focused on the role of adult children, daughters in particular, in providing care to elderly parents. The studies have shed new light on the nature and magnitude of the informal care system and have raised questions about the capacity of informal care- givers to continue providing the bulk of long-term care. These studies, however, have not been espe- cially helpful in the development of new policy be- cause the conclusions have often been based on small, nonrepresentative samples of caregivers re- stricted to a particular geographic region, socioeco- nomic status, and living arrangement (i.e., living with the dependent person). Many of the samples are drawn from individuals participating in formal ser- vice programs, an approach which introduces a sig- nificant selection bias. Finally, most of the studies are limited to analyses of the primary caregiver. 1 An earlier version of this paper was presented at the 32nd Annual Meeting of the American Society on Aging, San Francisco, CA, March, 1986. The authors are grateful for the programming assistance of Mark Guag- liardo and Ase Sewall of Social and Scientific Systems, Inc., Bethesda, Maryland. The views contained in this paper are those of the authors and no official endorsement by the National Center for Health Services Research, the Health Care Financing Administration or the Department of Health and Human Services is intended or should be inferred. 2 Division of Intramural Research, National Center for Health Services Research and Health Care Technology Assessment, 5600 Fishers Lane, Parklawn Building, Room 18A-55, Rockville, MD 20857. 3 Office of Research, Health Care Financing Administration, 6325 Security Boulevard, 2B14 Oak Meadows, Baltimore, MD 21207. Data from the 1982 National Long- Term Care Sur- vey are useful for bridging knowledge gaps. For the first time, this database provides national estimates of family members, friends, and other unpaid help- ers who assist disabled elderly persons living outside of institutions. A descriptive profile affords research- ers the opportunity to compare national estimates of caregiver characteristics, involvement, and behavior with findings from studies of smaller, nonrepresen- tative samples of informal caregivers. It is not within the scope of this discussion to review the vast literature on informal caregiving to the frail elderly population. Readers should refer to Horowitz's (1985a) comprehensive discussion of family caregiving and to Doty's (1986) review of the public policy issues associated with informal care. It is useful, however, to set the context for the national profile of family caregivers. Horowitz (1985a) identified four successive but overlapping phases in the development of knowl- edge pertaining to the family caregiver: family aban- donment of the older person, the elderly as family member, the family as caregiver, and the relation- ship between formal and informal care. Empirical research spanning 4 decades has succeeded, in large part, in shattering the myth of family abandonment, what Shanas (1979) has referred to as the "hydra- headed monster" of gerontology. In fact, Litwak (1985) has pointed out that helpers feel an even stronger extended family orientation than do the elderly themselves. Studies have firmly established that the elderly are part of family networks (Shanas, 1979), that they maintain close contact with relatives, friends, and neighbors (Kovar, 1986), and that a pat- tern of intergenerational reciprocity prevails among most family units (Cantor, 1975; Lee & Ellithorpe, 1982). This pattern of reciprocity begins to shift with a deterioration in the financial or the health status of the elderly person. The choice of caregiver tends to follow an hierar- chical pattern, what Shanas et al. (1968) referred to as 616 The Gerontologist at Boston University on December 31, 2014 http://gerontologist.oxfordjournals.org/ Downloaded from

Welcome message from author
This document is posted to help you gain knowledge. Please leave a comment to let me know what you think about it! Share it to your friends and learn new things together.
Transcript
Copyright 1987 byThe Cerontological Society of America
The 1982 National Long-Term Care Survey and Informal Caregivers Survey provided data forthe first national estimates of informal caregivers to noninstitutionalized disabled elders. The
descriptive profile confirmed previous research findings that informal caregivers arepredominantly female, that a sizeable proportion is over age 65, and that a minority use formal
services. There also was evidence for competing demands: 2 1 % reported child careresponsibilities, 9% indicated that they had quit their jobs, and 20% reported other
work conflict.Key words: Informal care, Caregiving to aged
Caregivers of the Frail Elderly: A NationalProfile1
Robyn Stone, Dr. PH,2 Gail Lee Cafferata, PhD,2 and Judith Sangl, MPH:
Over the past few decades the importance of fam-ily and friends in providing long-term care to theelderly has been established. Much of this literaturehas been focused on the composition of the informalcaregiving network and the responsibilities and timecommitments of caregivers. Some researchers (see,for example, Cantor, 1983; Horowitz & Dobrof, 1982;Litwak, 1985; Shanas, 1979; Stephens & Christianson,1986) have described the variety of sources for care,including spouses, children, other relatives, friends,and neighbors. Others (see, for example, E. Brody,1981; Cicirelli, 1981; Stoller, 1983) have focused onthe role of adult children, daughters in particular, inproviding care to elderly parents.
The studies have shed new light on the nature andmagnitude of the informal care system and haveraised questions about the capacity of informal care-givers to continue providing the bulk of long-termcare. These studies, however, have not been espe-cially helpful in the development of new policy be-cause the conclusions have often been based onsmall, nonrepresentative samples of caregivers re-stricted to a particular geographic region, socioeco-nomic status, and living arrangement (i.e., living withthe dependent person). Many of the samples aredrawn from individuals participating in formal ser-vice programs, an approach which introduces a sig-nificant selection bias. Finally, most of the studies arelimited to analyses of the primary caregiver.
1An earlier version of this paper was presented at the 32nd AnnualMeeting of the American Society on Aging, San Francisco, CA, March, 1986.The authors are grateful for the programming assistance of Mark Guag-liardo and Ase Sewall of Social and Scientific Systems, Inc., Bethesda,Maryland. The views contained in this paper are those of the authors and noofficial endorsement by the National Center for Health Services Research,the Health Care Financing Administration or the Department of Health andHuman Services is intended or should be inferred.
2Division of Intramural Research, National Center for Health ServicesResearch and Health Care Technology Assessment, 5600 Fishers Lane,Parklawn Building, Room 18A-55, Rockville, MD 20857.
3Office of Research, Health Care Financing Administration, 6325 SecurityBoulevard, 2B14 Oak Meadows, Baltimore, MD 21207.
Data from the 1982 National Long- Term Care Sur-vey are useful for bridging knowledge gaps. For thefirst time, this database provides national estimatesof family members, friends, and other unpaid help-ers who assist disabled elderly persons living outsideof institutions. A descriptive profile affords research-ers the opportunity to compare national estimates ofcaregiver characteristics, involvement, and behaviorwith findings from studies of smaller, nonrepresen-tative samples of informal caregivers.
It is not within the scope of this discussion toreview the vast literature on informal caregiving tothe frail elderly population. Readers should refer toHorowitz's (1985a) comprehensive discussion offamily caregiving and to Doty's (1986) review of thepublic policy issues associated with informal care. Itis useful, however, to set the context for the nationalprofile of family caregivers.
Horowitz (1985a) identified four successive butoverlapping phases in the development of knowl-edge pertaining to the family caregiver: family aban-donment of the older person, the elderly as familymember, the family as caregiver, and the relation-ship between formal and informal care. Empiricalresearch spanning 4 decades has succeeded, in largepart, in shattering the myth of family abandonment,what Shanas (1979) has referred to as the "hydra-headed monster" of gerontology. In fact, Litwak(1985) has pointed out that helpers feel an evenstronger extended family orientation than do theelderly themselves. Studies have firmly establishedthat the elderly are part of family networks (Shanas,1979), that they maintain close contact with relatives,friends, and neighbors (Kovar, 1986), and that a pat-tern of intergenerational reciprocity prevails amongmost family units (Cantor, 1975; Lee & Ellithorpe,1982). This pattern of reciprocity begins to shift with adeterioration in the financial or the health status ofthe elderly person.
The choice of caregiver tends to follow an hierar-chical pattern, what Shanas et al. (1968) referred to as
616 The Gerontologist
at Boston U
niversity on Decem
ber 31, 2014http://gerontologist.oxfordjournals.org/
Dow
nloaded from
the "principle of substitution." The primary care-giver is usually a wife or, if the wife is not available, anadult daughter. In the absence of both, anotherrelative assumes the major caregiver responsibility.Finally, where no family members are available, frailelderly persons turn to neighbors or friends forassistance.
The data indicated that widowed, divorced ornever married elderly persons prefer to live near butin separate quarters from their relatives, what Rosen-mayr (1977) calls "intimacy at a distance." It is sug-gested in the caregiver literature, however, that asthe health status of the older person deteriorates,shared households become a more common phe-nomenon (Noelker & Poulshock, 1982; Troll, 1971).
Caregiving activities vary widely across familiesand range from helping with transportation to 24-hour care (Cantor, 1980; Horowitz, 1985b; McKinlay& Tennstedt, 1986). Horowitz (1985a) conceptualizedcaregiving behavior as falling into four broad catego-ries: emotional support, direct service provision,linkage with the formal service sector, and financialassistance. Cantor (1980) has noted that family andfriends do not specialize or concentrate help in se-lected areas but tend to increase services accordingto the needs of the care recipient.
There are, however, important gender differencesin the provision of care. Women offer significantlyhigher levels of overall assistance (Horowitz, 1985b;Stoller, 1983). They are much more likely than malesto attend to the personal hygiene needs of the carerecipient and to engage in household tasks and mealpreparation. In contrast, male caregivers typicallyprovide transportation and help the older personwith home repairs and financial management.
The costs and, to a lesser extent, the benefits ofproviding informal care have been examined in manystudies. Horowitz (1985a) has emphasized the exten-sive variation in the degree of stress reported bycaregivers. Moreover, researchers examining care-giver burden (Cicirelli, 1981; Noelker & Poulshock,1982; Zarit et al., 1980) have consistently noted thatthe reported level of stress is much less than wouldbe expected.
Findings from a myriad of studies indicated thatthe most pervasive consequence of caregiving is theemotional strain generated by the burdens placed onthe caregiver (Cantor, 1983; Frankfather et al., 1981;George & Gwyther, 1986; Horowitz & Dobrof, 1982).Competing demands, and childrearing and employ-ment in particular, have been considered potentialsources of stress. Many caregivers cited neglect offamilial responsibilities as a major concern (Archold,1983; Rathbone-McCuan, 1976), and there is someevidence of family conflict (Adams et al., 1979;Noelker & Poulshock, 1982).
It is suggested by research findings (Cantor, 1983;Lang & Brody, 1983; Traveler's Companies, 1985) thatmany working caregivers experience conflict be-tween the demands of employment and their eldercare responsibilities. Studies of the degree to whichemployment impinges on caregiving have producedequivocal results. Nardone (1980) and Soldo and
Myllyluoma (1983) analyzed aggregate data and iden-tified female labor force participation as a significantfactor influencing rates of institutionalization of el-derly persons. Findings from several communitystudies, however, indicated that employment statusis not related to the overall amount of help provided(Brody, 1981; Cantor, 1980; Noelker & Poulshock,1982). Stoller (1983) observed gender differences inthe impact of employment on level of parental care-giving. Although being employed decreased the av-erage level of a son's assistance by 20 hours permonth, employment was not a significant predictorof caregiver hours among daughters.
One of the major issues currently under review bypolicymakers and researchers is the role of the for-mal sector in supporting informal caregivers and theproper mix of informal and formal services requiredto meet the needs of noninstitutionalized elderlycare recipients (S. Brody et al., 1978; Callahan et al.,1980; Litwak, 1985). Litwak and his associates (Dobrof& Litwak, 1977; Litwak & Figueira, 1970) postulatedthat dependency needs of an older person are meteffectively by a balance between formal services andinformal supports, by their shared function. The in-formal system is better adapted to perform the non-uniform aspects of care; that is, those that are sim-ple, idiosyncratic, unpredictable or require contin-gencies. The formal care system is better able tohandle those aspects of care which require expertknowledge and large scale resources. According tothis theory, the care of an elderly person requires theinvolvement and coordination of both sectors.
Soldo and Manton (1985) found that extremelydisabled elderly persons living with spouses usedformal services only after they had become inconti-nent and their condition warranted specialized medi-cal attention. Among disabled older persons livingwith children, the use of formal providers was pre-cipitated by the need for extensive supervision com-bined with incontinence and medical needs. Sug-gested by these findings is that the use of the formalcare system occurred only after the care needs hadbecome more than the family and ancillary helperscould handle alone.
The caregiving process is indeed complex. Someclarification can be gained by addressing the follow-ing questions. Who are the caregivers and care recip-ients? Do caregivers experience competing familialand work demands? What is the nature and level ofcaregiver commitment? What are the characteristicsof primary versus secondary caregivers? Who usesformal services?
Methods
Sample
Data were drawn from the Informal CaregiversSurvey (ICS), a component of the 1982 National Long-Term Care Survey (LTC) conducted by the Bureau ofthe Census for the Department of Health and HumanServices. The LTC was designed to estimate the per-sonal characteristics and use of health-related ser-
Vol. 27, No. 5,1987 617
at Boston U
niversity on Decem
ber 31, 2014http://gerontologist.oxfordjournals.org/
Dow
nloaded from
vices by disabled noninstitutionalized elderly per-sons in the United States. The sample for the surveywas established by drawing records from the Medi-care Health Insurance Skeleton Eligibility Write-offFiles (i.e., the files listing all Medicare enrollees). Arandom sample of approximately 36,000 persons wasscreened by telephone to determine if the candidatehad a long-term problem with at least one Activity ofDaily Living (ADL) such as dressing or bathing, or oneInstrumental Activity of Daily Living (IADL) such asshopping, housecleaning or transportation. Readersshould refer to Macken (1986) for a detailed discus-sion of methodological issues and sampling proce-dures. This procedure produced a sample of 6,393persons representing a population of 5.1 million.Study participants were interviewed on a range oftopics related to health status, level of disability,sources of long-term care assistance, personal re-sources, and family situation. Of the interviews, 26%were conducted with proxies who were at least 15years-old and knowledgeable about the sample per-son's health care needs.
Respondents representing 2 million elderly dis-abled persons reported that the elders had a prob-lem with one or more ADLs. Of this subpopulation,approximately 1.8 million elders received ADL helpfrom one or more unpaid caregivers. The InformalCaregivers Survey (ICS), conducted by the NationalOpinion Research Center, was designed to collectdetailed information on this population of unpaidhelpers. During the interviews on impairment, re-spondents of the LTC were asked to identify personswho gave them ADL assistance. Helpers who were 14years of age or older and were reportedly providingassistance with at least one ADL were eligible forselection into the ICS sample. The National OpinionResearch Center selected 2,369 caregivers for the ICSinterview; 280 cases were deemed ineligible. Thethree major reasons for ineligibility were that thecaregiver did not give the impaired person ADL help,the caregiver was paid, or the caregiver was less than14 years old. (See Bradburn, 1986, for a detaileddiscussion of ineligibility.)
Of the 2,089 eligible cases, 1,924 caregivers (ap-proximately 92%) representing 2.2 million personscaring for 1.6 million disabled elders completed in-terviews conducted between October 1982 and Janu-ary 1983. The discrepancy between the 1.8 millionADL-impaired elders with unpaid helpers repre-sented in the LTC and the 1.6 million persons withcaregivers represented in the ICS was due primarilyto the exclusion of ineligible persons.
Of the sample, 16% had ceased providing careduring the interval between their initial identificationas a caregiver and the interview. These individualswere administered the same questionnaire as thecurrent caregivers, except that the questions werephrased in the past tense.
Both the LTC and ICS samples were selected usingproportionate stratification techniques in which itwas assumed that the sample was representative ofthe population in terms of geographic region, size ofplace, and size of the Medicare population. The
survey data were weighted to adjust for discrepan-cies between the composition of the sample and theinformal caregiver population. Readers should referto Tourangeau (1986) for a detailed discussion ofsampling and weighting procedures.
These individuals represented a select population;that is, they had chosen to become caregivers. TheICS did not collect information on reasons for thisdecision, and there is no way to compare theseindividuals to persons who had chosen not to be-come caregivers. Comparisons of this caregiver pop-ulation with national estimates of their age peers inthe general population indicated that these individ-uals were members of a biased group. For example,younger caregivers were less likely to be marriedthan their counterparts in the overall population. Incontrast, older caregivers were more likely to bemarried. Caregivers also were more likely to reportadjusted family incomes below the poverty line thanwere individuals in the population at large. Further,they were much less likely to be employed. Finally, itwas revealed by a comparison of the self-assessedhealth status of these caregivers with their age peersin the overall U.S. population that the former per-ceived themselves to be in poorer health.
Measures
Major characteristics of informal caregivers wereoperationalized by grouping caregivers into threemajor categories: spouse, child, and other. The thirdcategory included children-in-law, siblings, grand-children, other relatives, friends, and other unpaidhelpers. These relationships were collapsed into onecategory because the numbers in each subgroupwere too small to provide reliable national estimates.
Caregivers were defined as primary caregiver onlyif they reported main responsibility for taking care ofthe disabled person and there were no other help-ers; primary caregiver with informal help if they hadmain responsibility but were one of several unpaidcaregivers caring for the disabled person, primarycaregiver with informal and formal help if they hadmain responsibility but provided care with the assis-tance of unpaid and paid help, and secondary care-giver if they did not have main responsibility for careof the disabled person.
Care recipients were defined as having an ADLlimitation if they reportedly received active personalassistance, directive assistance, or supervision withat least one of the following daily activities: bathing,dressing, feeding, transfer, toileting, or indoor mo-bility. An ADL score was derived using the procedurefollowed by Liu et al. (1985). For each respondent,the number of ADL limitations was summed.
Other caregiver characteristics used included age,racial background (white, non-white), living arrange-ments (lived with disabled person, did not live withdisabled person), family structure (marital status,number of children less than 18 years of age inhousehold), employment status, and perceivedhealth status (excellent, good, fair or poor). The
618 The Gerontologist
at Boston U
niversity on Decem
ber 31, 2014http://gerontologist.oxfordjournals.org/
Dow
nloaded from
caregiver's total family income was adjusted for fam-ily size using the 1982 U.S. Bureau of the Censusdefinition of poverty line income ($9,862 for a familyof four) as the base of comparison. The other incomegroups were defined in relation to the poverty lineincome: income near the poverty line (near poor),from more than 1.00 to 1.25 times; low income, frommore than 1.25 to 2.00 times; middle income, frommore than 2 to 4 times; and high income, fromgreater than 4 times poverty line income in 1982.
Caregiver commitment was measured in terms ofthe amount of time devoted to caregiving responsi-bilities and the tasks performed. Time variables in-cluded the number of years and days per week spenton caregiving and the average number of extra hoursper day devoted to these responsibilities. Caregivertasks were limited to assistance with ADLs andlADLs; the ICS did not inquire about the provision ofemotional and financial support or linkage with theformal care sector.
The ADL functions included personal care hygienetasks (help with eating, bathing, dressing, toileting)and personal care mobility tasks (help with getting inand out of bed; getting around inside). In additionrespondents were asked about the administration ofmedication, including giving injections, medica-tions, and bandaging.
The IADL functions were defined in terms ofwhether or not the caregiver spent extra time oneach activity. Household tasks included meal prepa-ration, housecleaning, and laundry. Other IADLtasks included shopping, transportation, and han-dling the finances of the elderly care recipient.
Analytical MethodsDifferences between subgroups were tested using
Z-scores having asymptomatic normal properties,based on the rounded figures at the 0.05 level ofsignificance. For example, as shown in Table 2, gen-der differences in level of caregiver responsibilitywere examined by comparing the percentage of hus-bands versus wives, daughters versus sons, andother female caregivers versus other male caregiversrepresented in each of the four subcategories ofcaregiver responsibility. Unless otherwise noted,only statistically significant differences between esti-mates are discussed.
Results
Who Are the Care Recipients?
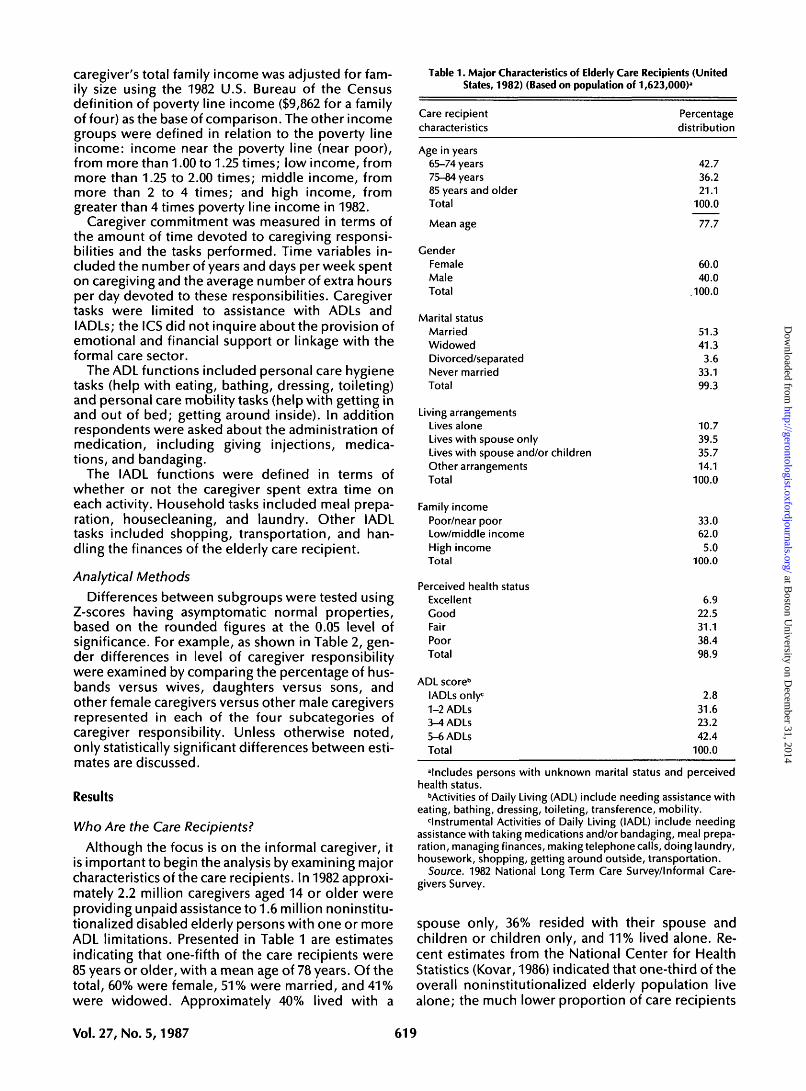
Although the focus is on the informal caregiver, itis important to begin the analysis by examining majorcharacteristics of the care recipients. In 1982 approxi-mately 2.2 million caregivers aged 14 or older wereproviding unpaid assistance to 1.6 million noninstitu-tionalized disabled elderly persons with one or moreADL limitations. Presented in Table 1 are estimatesindicating that one-fifth of the care recipients were85 years or older, with a mean age of 78 years. Of thetotal, 60% were female, 51% were married, and 41%were widowed. Approximately 40% lived with a
Table 1 . Major Characteristics of Elderly Care Recipients (UnitedStates, 1982) (Based on population of 1,623,000)'
Care recipientcharacteristics
Age in years65-74 years75-84 years85 years and olderTotal
Mean age
GenderFemaleMaleTotal
Marital statusMarriedWidowedDivorced/separatedNever marriedTotal
Living arrangementsLives aloneLives with spouse onlyLives with spouse and/or childrenOther arrangementsTotal
Family incomePoor/near poorLow/middle incomeHigh incomeTotal
Perceived health statusExcellentGoodFairPoorTotal
ADL score"lADLs only:1-2 ADLs3-4 ADLs5-6 ADLsTotal
Percentagedistribution
42.736.221.1
100.0
77.7
60.040.0
.100.0
51.341.33.6
33.199.3
10.739.535.714.1
100.0
33.062.05.0
100.0
6.922.531.138.498.9
2.831.623.242.4
100.0
'Includes persons with unknown marital status and perceivedhealth status.
•"Activities of Daily Living (ADL) include needing assistance witheating, bathing, dressing, toileting, transference, mobility.
instrumental Activities of Daily Living (IADL) include needingassistance with taking medications and/or bandaging, meal prepa-ration, managing finances, making telephone calls, doing laundry,housework, shopping, getting around outside, transportation.
Source. 1982 National Long Term Care Survey/Informal Care-givers Survey.
spouse only, 36% resided with their spouse andchildren or children only, and 11% lived alone. Re-cent estimates from the National Center for HealthStatistics (Kovar, 1986) indicated that one-third of theoverall noninstitutionalized elderly population livealone; the much lower proportion of care recipients
Vol.27, No. 5,1987 619
at Boston U
niversity on Decem
ber 31, 2014http://gerontologist.oxfordjournals.org/
Dow
nloaded from
living alone underscored the association betweendisability and shared living arrangements.
In all, 31% of the elderly persons perceived theirhealth status as fair and 38% reported their healthstatus as poor. Moreover, 42% reported difficultywith at least five ADLs, whereas 3% of the elderly carerecipients reported no ADL limitations even thoughonly caregivers providing ADL assistance were eligi-ble for the survey. Tourangeau (1986) has noted thatbecause of the complexities of the sample design, itis possible that some ineligible caregivers were in-cluded in the ICS sample.
Who Are the Caregivers?
Shifting the focus to the caregiver as the unit ofanalysis, summarized in Table 2 are major character-istics of the informal caregivers by their relationshipto the care recipient. These estimates supported thefindings of previous researchers that informal care-givers to the frail aged are primarily female. Themajority (72%) were women, with adult daughterscomprising 29% of all caregivers and wives constitut-ing 23% of this population. It is interesting to note,however, that husbands comprised 13% of informalcaregivers.
Approximately 70% of the population were pri-mary caregivers with the remainder playing a sec-ondary role. One-third of the caregivers were soleproviders, 29% were primary caregivers with one ormore unpaid helpers and only 10% received paidhelp in addition to unpaid assistance. Althoughwives and husbands constituted the majority of thesole caregivers (60% and 55%, respectively), daugh-ters were twice as likely as sons to assume the pri-mary responsibility with no assistance. Further, thedata supported anecdotal reports and previous em-pirical research findings that sons are much morelikely than daughters to be secondary caregivers.
The average age of the caregiver population was57.3 years; 25% of them, however, were 65 to 74years old and 10% were 75 years or over. Not surpris-ingly, husbands were the oldest caregivers, with anaverage age of 73 years.
With respect to living arrangements, it was re-vealed by the data that three-quarters of the care-givers shared households with the care recipients.Because the majority of the disabled elders receivingassistance from these caregivers reported at leastone ADL limitation, the large proportion of sharedaccommodations observed was most likely a func-tion of the high level of impairment among the carerecipients. Analyses not detailed in this paper didreveal a positive relationship between level of dis-ability and shared living arrangements.
Findings from two previous large-scale studies ofinformal caregivers to the frail elderly indicated sig-nificantly lower proportions of shared living arrange-ments. Approximately 57% of the caregivers partici-pating in the National Long-Term Care ChannelingDemonstration (Stephens & Christianson, 1986) and54% of the caregivers participating in a survey ineastern Massachusetts (McKinlay & Tennstedt, 1986)reported sharing households with the elderly care
620
recipient. The lower proportion observed in theformer study may be attributable to the fact that thedisabled elders were high users of community-basedservices, enabling them to live independently. Thediscrepancy in the proportion of shared living ar-rangements between the ICS sample and the Massa-chusetts sample may be explained by the fact that thecare recipients in the latter study were less disabledthan in the former.
Several other important findings related to theeconomic and physical well-being of this caregiverpopulation. Although the majority (57%) reportedadjusted family incomes in the low to middle range,almost 1 in 3 had 1982 incomes falling within the pooror near poor category. One-third also rated theirgeneral health status as fair or poor.
Competing DemandsThese data provided some interesting insights into
the prevalence of two important sources of caregiverstress: competing familial obligations and work con-flict. With respect to the former, the estimates shownin Table 3 indicated that about one-fifth of the overallcaregiver population, one-quarter of the caregivingchildren, and one-third of the other nonspousalcaregivers reported the presence of children underthe age of 18 in the household.
The data in Table 3 also revealed that 31% of allcaregivers were employed, with 44% of the daugh-ters and 55% of the sons in the labor force. Approxi-mately 9% reportedly left the labor force to care for adisabled elderly person. The likelihood of a husbandor wife quitting work to provide care was essentiallythe same (14% and 11%, respectively); 12% of thedaughters left their jobs to become caregivers ascompared with only 5% of the sons. This observationis consonant with a previous study of caregiver atti-tudes among three generations of women (Brody etal., 1983) in which it was found that the majority ofrespondents expected working daughters ratherthan sons to quit their jobs or to rearrange their workschedules for parent care.
Of all caregivers, 20% reported conflicts betweenwork and caregiving resulting in them having to altertheir work schedules in some fashion. Among the 1million caregivers who had been employed duringsome part of the caregiving experience, 20% cut backon hours, 29% rearranged their schedules and 19%took time off without pay to fulfill caregiver obliga-tions. Wives were more likely than husbands to rear-range their schedules. Daughters were more likelythan sons to use all three alternatives.
Caregiver Commitment
The duration of caregiving ranged from less than 1year to 43 years. The majority of caregivers, as shownin Table 4, had been providing unpaid assistance for1 to 4 years; one-fifth, however had been caring forthe disabled person for 5 years or more. As wasnoted in the Methods section, 16% ceased providingcare during the 3-month interval between their initialidentification as a caregiver and the interview. Of the
The Gerontologist
at Boston U
niversity on Decem
ber 31, 2014http://gerontologist.oxfordjournals.org/
Dow
nloaded from
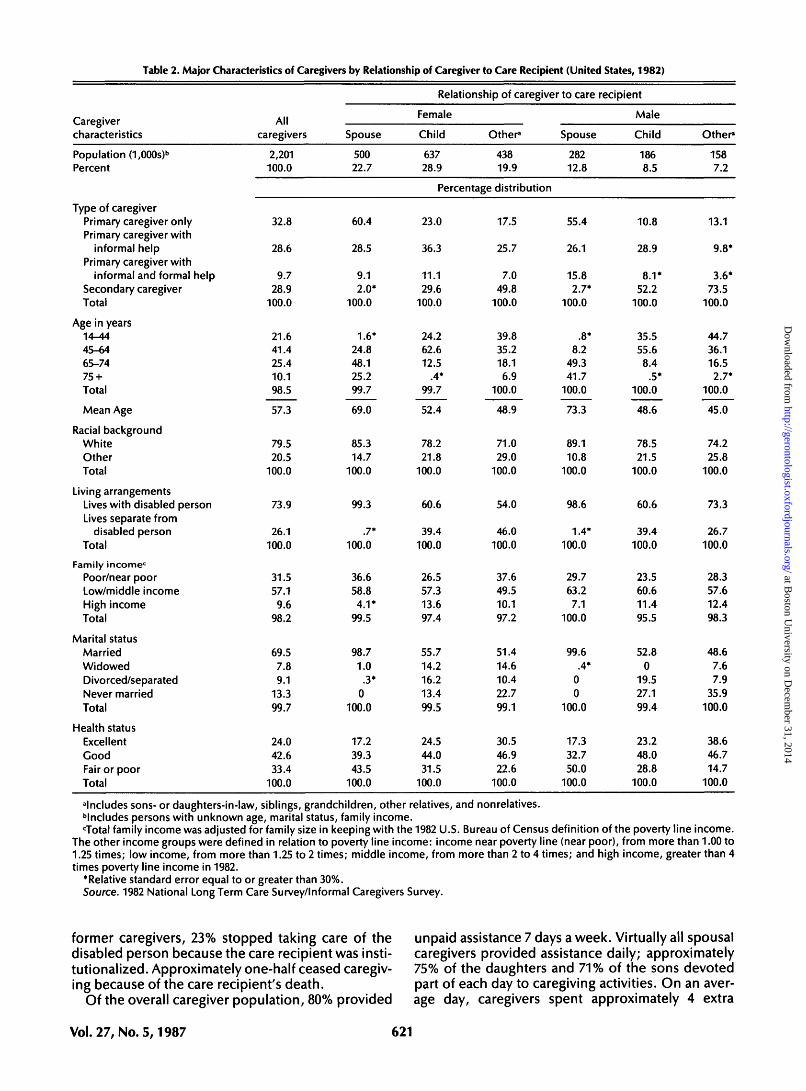
Table 2. Major Characteristics of Caregivers by Relationship of Caregiver to Care Recipient (United States, 1982)
Caregivercharacteristics
Population (1,000s)b
Percent
Type of caregiverPrimary caregiver onlyPrimary caregiver with
informal helpPrimary caregiver with
informal and formal helpSecondary caregiverTotal
Age in years14-4445-6465-7475 +Total
Mean Age
Racial backgroundWhiteOtherTotal
Living arrangementsLives with disabled personLives separate from
disabled personTotal
Family income0
Poor/near poorLow/middle incomeHigh incomeTotal
Marital statusMarriedWidowedDivorced/separatedNever marriedTotal
Health statusExcellentGoodFair or poorTotal
Allcaregivers
2,201100.0
32.8
28.6
9.728.9
100.0
21.641.425.410.198.5
57.3
79.520.5
100.0
73.9
26.1100.0
31.557.19.6
98.2
69.57.89.1
13.399.7
24.042.633.4
100.0
Spouse
50022.7
60.4
28.5
9.12.0*
100.0
1.6*24.848.125.299.7
69.0
85.314.7
100.0
99.3
.7*100.0
36.658.8
4.1*99.5
98.71.0
.3*0
100.0
17.239.343.5
100.0
Relationship of caregiver to care recipient
Female
Child
63728.9
Other"
43819.9
Spouse
28212.8
Percentage distribution
23.0
36.3
11.129.6
100.0
24.262.612.5
.4*99.7
52.4
78.221.8
100.0
60.6
39.4100.0
26.557.313.697.4
55.714.216.213.499.5
24.544.031.5
100.0
17.5
25.7
7.049.8
100.0
39.835.218.16.9
100.0
48.9
71.029.0
100.0
54.0
46.0100.0
37.649.510.197.2
51.414.610.422.799.1
30.546.922.6
100.0
55.4
26.1
15.82.7*
100.0
.8*8.2
49.341.7
100.0
73.3
89.110.8
100.0
98.6
1.4*100.0
29.763.27.1
100.0
99.6.4*
00
100.0
17.332.750.0
100.0
Male
Child
1868.5
10.8
28.9
8.1*52.2
100.0
35.555.68.4
.5*100.0
48.6
78.521.5
100.0
60.6
39.4100.0
23.560.611.495.5
52.80
19.527.199.4
23.248.028.8
100.0
Other*
1587.2
13.1
9.8*
3.6*73.5
100.0
44.736.116.52.7*
100.0
45.0
74.225.8
100.0
73.3
26.7100.0
28.357.612.498.3
48.67.67.9
35.9100.0
38.646.714.7
100.0
"Includes sons- or daughters-in-law, siblings, grandchildren, other relatives, and nonrelatives."Includes persons with unknown age, marital status, family income.cTotal family income was adjusted for family size in keeping with the 1982 U.S. Bureau of Census definition of the poverty line income.
The other income groups were defined in relation to poverty line income: income near poverty line (near poor), from more than 1.00 to1.25 times; low income, from more than 1.25 to 2 times; middle income, from more than 2 to 4 times; and high income, greater than 4times poverty line income in 1982.
*Relative standard error equal to or greater than 30%.Source. 1982 National Long Term Care Survey/Informal Caregivers Survey.
former caregivers, 23% stopped taking care of the unpaid assistance 7 days a week. Virtually all spousaldisabled person because the care recipient was insti- caregivers provided assistance daily; approximatelytutionalized. Approximately one-half ceased caregiv- 75% of the daughters and 71% of the sons devoteding because of the care recipient's death. part of each day to caregiving activities. On an aver-
Of the overall caregiver population, 80% provided age day, caregivers spent approximately 4 extra
Vol. 27, No. 5,1987 621
at Boston U
niversity on Decem
ber 31, 2014http://gerontologist.oxfordjournals.org/
Dow
nloaded from
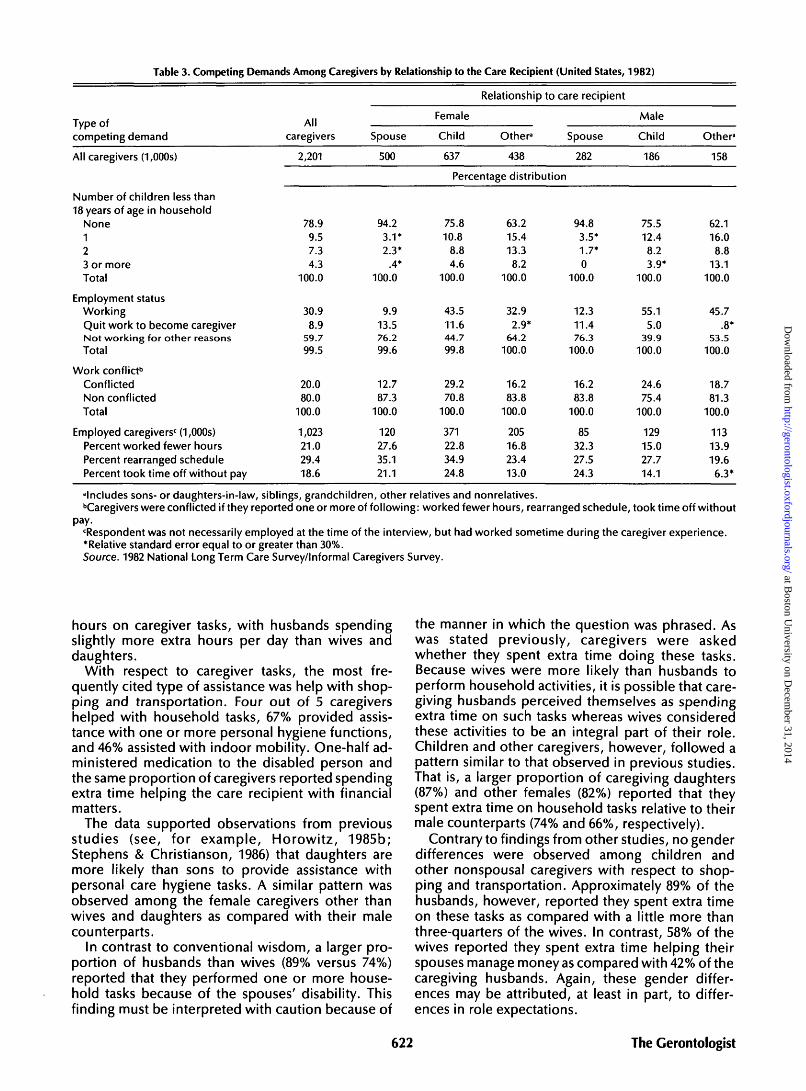
Table 3. Competing Demands Among Caregivers by Relationship to the Care Recipient (United States, 1982)
TvDe ofcompeting demand
All caregivers (1,000s)
Number of children less than18 years of age in household
None123 or moreTotal
Employment statusWorkingQuit work to become caregiverNot working for other reasonsTotal
Work conflict6
ConflictedNon conflictedTotal
Employed caregiversc (1,000s)Percent worked fewer hoursPercent rearranged schedulePercent took time off without pay
Allcaregivers
2,201
78.99.57.34.3
100.0
30.98.9
59.799.5
20.080.0
100.0
1,02321.029.418.6
Spouse
500
94.23.1*2.3*
.4*100.0
9.913.576.299.6
12.787.3
100.0
12027.635.121.1
Relationship to care recipient
Female
Child
637
Other3
438
Spouse
282
Percentage distribution
75.810.8
8.84.6
100.0
43.511.644.799.8
29.270.8
100.0
37122.834.924.8
63.215.413.38.2
100.0
32.92.9*
64.2100.0
16.283.8
100.0
20516.823.413.0
94.83.5*1.7*0
100.0
12.311.476.3
100.0
16.283.8
100.0
8532.327.524.3
Male
Child
186
75.512.48.23.9*
100.0
55.15.0
39.9100.0
24.675.4
100.0
12915.027.714.1
Other8
158
62.116.08.8
13.1100.0
45.7.8*
53.5100.0
18.781.3
100.0
11313.919.66.3*
'Includes sons- or daughters-in-law, siblings, grandchildren, other relatives and nonrelatives.bCaregivers were conflicted if they reported one or more of following: worked fewer hours, rearranged schedule, took time off without
pay.'Respondent was not necessarily employed at the time of the interview, but had worked sometime during the caregiver experience.•Relative standard error equal to or greater than 30%.Source. 1982 National Long Term Care Survey/Informal Caregivers Survey.
hours on caregiver tasks, with husbands spendingslightly more extra hours per day than wives anddaughters.
With respect to caregiver tasks, the most fre-quently cited type of assistance was help with shop-ping and transportation. Four out of 5 caregivershelped with household tasks, 67% provided assis-tance with one or more personal hygiene functions,and 46% assisted with indoor mobility. One-half ad-ministered medication to the disabled person andthe same proportion of caregivers reported spendingextra time helping the care recipient with financialmatters.
The data supported observations from previousstudies (see, for example, Horowitz, 1985b;Stephens & Christianson, 1986) that daughters aremore likely than sons to provide assistance withpersonal care hygiene tasks. A similar pattern wasobserved among the female caregivers other thanwives and daughters as compared with their malecounterparts.
In contrast to conventional wisdom, a larger pro-portion of husbands than wives (89% versus 74%)reported that they performed one or more house-hold tasks because of the spouses' disability. Thisfinding must be interpreted with caution because of
the manner in which the question was phrased. Aswas stated previously, caregivers were askedwhether they spent extra time doing these tasks.Because wives were more likely than husbands toperform household activities, it is possible that care-giving husbands perceived themselves as spendingextra time on such tasks whereas wives consideredthese activities to be an integral part of their role.Children and other caregivers, however, followed apattern similar to that observed in previous studies.That is, a larger proportion of caregiving daughters(87%) and other females (82%) reported that theyspent extra time on household tasks relative to theirmale counterparts (74% and 66%, respectively).
Contrary to findings from other studies, no genderdifferences were observed among children andother nonspousal caregivers with respect to shop-ping and transportation. Approximately 89% of thehusbands, however, reported they spent extra timeon these tasks as compared with a little more thanthree-quarters of the wives. In contrast, 58% of thewives reported they spent extra time helping theirspouses manage money as compared with 42% of thecaregiving husbands. Again, these gender differ-ences may be attributed, at least in part, to differ-ences in role expectations.
622 The Gerontologist
at Boston U
niversity on Decem
ber 31, 2014http://gerontologist.oxfordjournals.org/
Dow
nloaded from
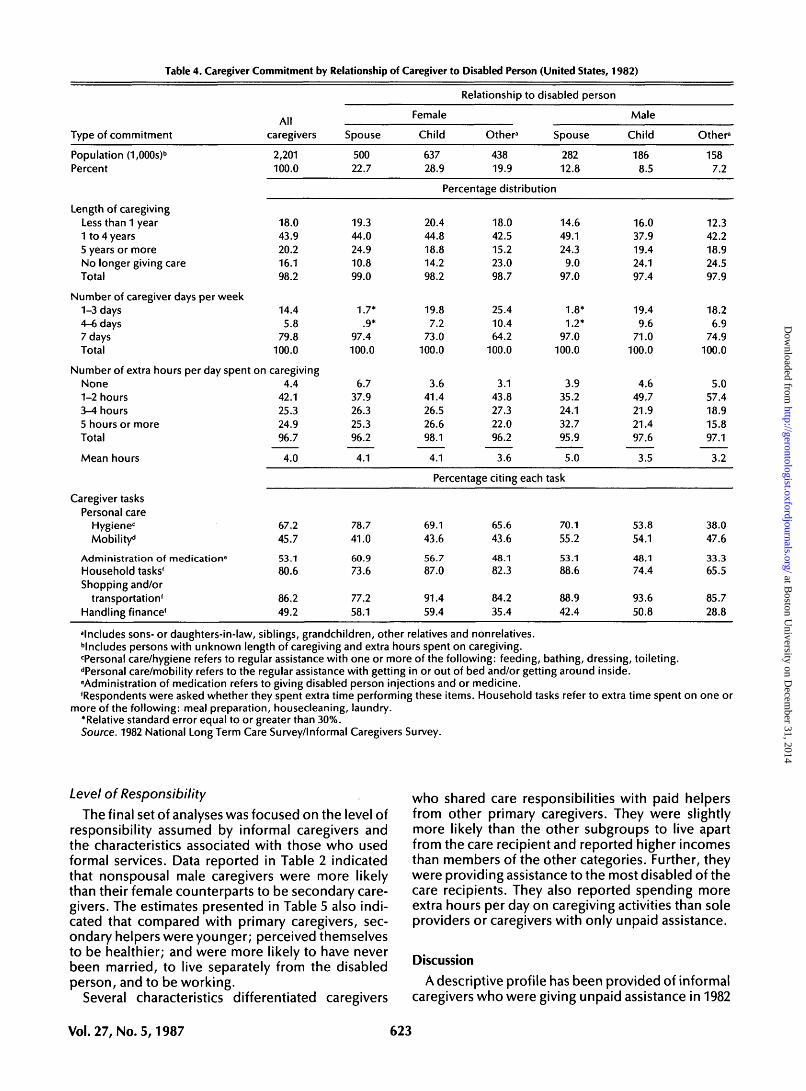
Table 4. Caregiver Commitment by Relationship of Caregiver to Disabled Person (United States, 1982)
Type of commitment
Population (1,000s)b
Percent
Length of caregivingLess than 1 year1 to 4 years5 years or moreNo longer giving careTotal
Number of caregiver days per week1-3 days4-6 days7 daysTotal
Allcaregivers
2,201100.0
18.043.920.216.198.2
14.45.8
79.8100.0
Number of extra hours per day spent on caregivingNone1-2 hours3-4 hours5 hours or moreTotal
Mean hours
Caregiver tasksPersonal care
Hygienec
Mobility*1
Administration of medicatione
Household tasks'Shopping and/or
transportation'Handling finance'
4.442.125.324.996.7
4.0
67.245.7
53.180.6
86.249.2
Spouse
50022.7
19.344.024.910.899.0
1.7*.9*
97.4100.0
6.737.926.325.396.2
4.1
78.741.0
60.973.6
77.258.1
Relationship to disabled person
Female
Child
63728.9
Other3
43819.9
Spouse
28212.8
Percentage distribution
20.444.818.814.298.2
19.87.2
73.0100.0
3.641.426.526.698.1
4.1
18.042.515.223.098.7
25.410.464.2
100.0
3.143.827.322.096.2
3.6
14.649.124.39.0
97.0
1.8*1.2*
97.0100.0
3.935.224.132.795.9
5.0
Percentage citing each task
69.143.6
56.787.0
91.459.4
65.643.6
48.182.3
84.235.4
70.155.2
53.188.6
88.942.4
Male
Child
1868.5
16.037.919.424.197.4
19.49.6
71.0100.0
4.649.721.921.497.6
3.5
53.854.1
48.174.4
93.650.8
Other3
1587.2
12.342.218.924.597.9
18.26.9
74.9100.0
5.057.418.915.897.1
3.2
38.047.6
33.365.5
85.728.8
"Includes sons- or daughters-in-law, siblings, grandchildren, other relatives and nonrelatives.••Includes persons with unknown length of caregiving and extra hours spent on caregiving.•Personal care/hygiene refers to regular assistance with one or more of the following: feeding, bathing, dressing, toileting.dPersonal care/mobility refers to the regular assistance with getting in or out of bed and/or getting around inside.Administration of medication refers to giving disabled person injections and or medicine.'Respondents were asked whether they spent extra time performing these items. Household tasks refer to extra time spent on one or
more of the following: meal preparation, housecleaning, laundry.'Relative standard error equal to or greater than 30%.Source. 1982 National Long Term Care Survey/Informal Caregivers Survey.
Level of Responsibility
The final set of analyses was focused on the level ofresponsibility assumed by informal caregivers andthe characteristics associated with those who usedformal services. Data reported in Table 2 indicatedthat nonspousal male caregivers were more likelythan their female counterparts to be secondary care-givers. The estimates presented in Table 5 also indi-cated that compared with primary caregivers, sec-ondary helpers were younger; perceived themselvesto be healthier; and were more likely to have neverbeen married, to live separately from the disabledperson, and to be working.
Several characteristics differentiated caregivers
who shared care responsibilities with paid helpersfrom other primary caregivers. They were slightlymore likely than the other subgroups to live apartfrom the care recipient and reported higher incomesthan members of the other categories. Further, theywere providing assistance to the most disabled of thecare recipients. They also reported spending moreextra hours per day on caregiving activities than soleproviders or caregivers with only unpaid assistance.
Discussion
A descriptive profile has been provided of informalcaregivers who were giving unpaid assistance in 1982
Vol.27, No. 5,1987 623
at Boston U
niversity on Decem
ber 31, 2014http://gerontologist.oxfordjournals.org/
Dow
nloaded from
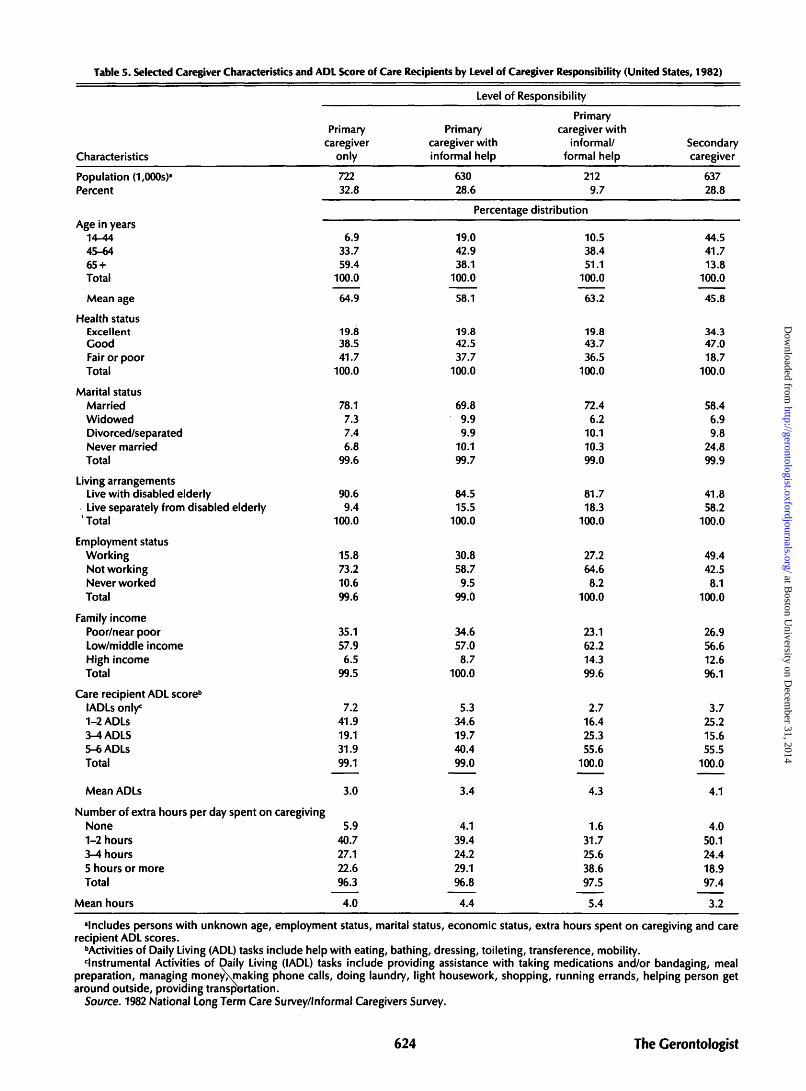
Table 5. Selected Caregiver Characteristics and ADL Score of Care Recipients by Level of Caregiver Responsibility (United States, 1982)
Characteristics
Population (1,000s)a
Percent
Age in years14-4445-6465 +Total
Mean age
Health statusExcellentGoodFair or poorTotal
Marital statusMarriedWidowedDivorced/separatedNever marriedTotal
Living arrangementsLive with disabled elderlyLive separately from disabled elderly
' Total
Employment statusWorkingNot workingNever workedTotal
Family incomePoor/near poorLow/middle incomeHigh incomeTotal
Care recipient ADL score6
lADLs only0
1-2ADLS3-4ADLS5-6ADLSTotal
Mean ADLs
Primarycaregiver
only
72232.8
6.933.759.4
100.0
64.9
19.838.541.7
100.0
78.17.37.46.8
99.6
90.69.4
100.0
15.873.210.699.6
35.157.96.5
99.5
7.241.919.131.999.1
3.0
Number of extra hours per day spent on caregivingNone1-2 hours3-4 hours5 hours or moreTotal
Mean hours
5.940.727.122.696.3
4.0
Level of Responsibility
Primarycaregiver withinformal help
63028.6
Primarycaregiver with
informal/formal help
2129.7
Percentage distribution
19.042.938.1
100.0
58.1
19.842.537.7
100.0
69.89.99.9
10.199.7
84.515.5
100.0
30.858.79.5
99.0
34.657.08.7
100.0
5.334.619.740.499.0
3.4
4.139.424.229.196.8
4.4
10.538.451.1
100.0
63.2
19.843.736.5
100.0
72.46.2
10.110.399.0
81.718.3
100.0
27.264.68.2
100.0
23.162.214.399.6
2.716.425.355.6
100.0
4.3
1.631.725.638.697.5
5.4
Secondarycaregiver
63728.8
44.541.713.8
100.0
45.8
34.347.018.7
100.0
58.46.99.8
24.899.9
41.858.2
100.0
49.442.58.1
100.0
26.956.612.696.1
3.725.215.655.5
100.0
4.1
4.050.124.418.997.4
3.2
"Includes persons with unknown age, employment status, marital status, economic status, extra hours spent on caregiving and carerecipient ADL scores.
••Activities of Daily Living (ADL) tasks include help with eating, bathing, dressing, toileting, transference, mobility.'Instrumental Activities of Daily Living (IADL) tasks include providing assistance with taking medications and/or bandaging, meal
preparation, managing money\making phone calls, doing laundry, light housework, shopping, running errands, helping person getaround outside, providing transportation.
Source. 1982 National Long Term Care Survey/Informal Caregivers Survey.
624 The Gerontologist
at Boston U
niversity on Decem
ber 31, 2014http://gerontologist.oxfordjournals.org/
Dow
nloaded from
to noninstitutionalized elderly persons with one ormore ADL limitations. These national estimates con-firmed several key findings of previous researcherswho had studied smaller, nonrepresentative samplesof caregivers. Substantiated by this study was the oft-reported observation that informal caregivers arepredominantly female, with wives and daughtersproviding the bulk of care. The data also revealedthat roughly one-third of the caregivers were overage 65, a finding which supported previous researchfindings that the informal care system is partiallycomposed of the young-old caring for the old-old.
A substantial proportion of caregivers were jug-gling familial and employment responsibilities whichplaced competing demands upon them. These roleconflicts may represent an even greater challenge tofuture cohorts of caregivers. Due to longer life ex-pectancy and delayed childbearing, an increasingproportion of women will be in the position of pro-viding care to both children under the age of 18 aswell as elderly parents. These social trends, coupledwith the projected increase in labor force participa-tion rates among older women, imply that work andfamily obligations may conflict with caregiving re-sponsibilities to a greater extent than they do today.
This national profile also confirmed the findings ofprevious studies which have documented the lowuse of formal care by caregivers. The analyses indi-cated that caregivers tended to provide care alone orwith assistance from unpaid helpers. Less than 10%reported the use of paid services, and those who didrely on formal care were assisting the most severelyimpaired elders. This finding supported the observa-tions of other researchers (Horowitz, 1985a; Soldo &Manton, 1985) that formal care is viewed as a lastresort when the responsibilities become too com-plex to handle alone or with informal assistance.
Highlighted in this study were several phenomenawhich ran counter to previous observations. A largerproportion of caregivers and care recipients werefound to share living arrangements than has beenobserved by other researchers. One probable expla-nation for this discrepancy is the difference in sam-ple selection criteria. The current analyses also re-vealed a reversed pattern of instrumental tasksperformed by spousal caregivers; husbands weremore likely to perform household chores and shop-ping, whereas wives were more likely to help withfinancial management. This role reversal may be at-tributed to the way in which the questions werephrased. These findings contradicting previous re-search highlighted the problems inherent in compar-ing studies and underscored the need to pay particu-lar attention to how samples are selected and howmajor variables are defined and operationalized.
Several other findings provided new insights intothe caregiver experience. Husbands, typically over-looked in the caregiver research, were the old-est subgroup of caregivers and reported spendingthe greatest number of extra hours fulfilling care-giver responsibilities. Further, about one-half ofthem provided this care with no informal or paidassistance. Thus, it is important that future research
be focused on caregiving husbands as well as wives.Another important finding was the observation
that 16% of the sampled caregivers ceased givingassistance during the interval between their identifi-cation as an eligible respondent and their interview.This phenomenon attested to the dynamic nature ofthe caregiving process and the rapid changes whichcan occur within a relatively short period.
In sum, an introduction to the wealth of nationaldata now available on informal caregivers to thedisabled elderly has been provided. These data willallow researchers to explore in more detail questionsconcerning the composition of informal care net-works and their role in helping to keep frail eldersout of institutions. The 1982 Long-Term Care Surveyand Informal Caregivers Survey contain detailed in-formation about the benefits and burdens of caregiv-ing which will help researchers to assess the emo-tional, physical, and financial costs of providinginformal care. Researchers will be able to examinethe impact of competing familial and employmentdemands on the amount and types of care provided.
Policymakers may use these data to examine theimplications of various policy options. For example,they might use these national estimates to ascertainhow many caregivers would be eligible for the Childand Dependent Care Tax Credit under alternativesets of criteria. Similarly, decision makers in theprivate sector could use the estimates on work con-flict to support the development of new programstargeted to employed caregivers.
All of the issues surrounding informal care cannotbe addressed in these surveys, and there is a need foradditional data to enhance understanding of a com-plex process. The cross sectional nature of the Infor-mal Caregivers Survey limits the ability of research-ers to study the dynamics of caregiving. Therefore,longitudinal data is needed which will enable re-searchers to trace changes in caregiver burden andcommitment over time and to examine the role ofthese changes in the decision to institutionalize anelderly relative or friend.
There also is a need for detailed information on theattitudes toward and use of community- and home-based services such as adult day care, home healthcare, and respite services. Much of the current policydiscussion on family caregiving is centered on twoissues: the efficacy of financial incentives versusdirect services in strengthening the informal caresystem and the degree to which caregivers substituteformal services for informal care. National estimatesof caregiver preferences and use of specific serviceswould contribute to a greater understanding of therelationship between formal and informal care andwould allow testing for substitution effects.
Finally, the 1982 Long-Term Care Survey indicatedthat approximately 2.4 million aged individuals arereceiving unpaid help with one or more instrumentalactivities of daily living, even though they receive nounpaid ADL assistance. More information is neededto document the experience of these caregivers andthe degree to which their responsibilities changeovertime.
Vol.27, No. 5,1987 625
at Boston U
niversity on Decem
ber 31, 2014http://gerontologist.oxfordjournals.org/
Dow
nloaded from
References
Adams, M., Caston, M. A., & Danis, B. C. (1979). A neglected dimension inhome care of elderly disabled persons: Effect on responsible familymembers. Paper presented at the 32nd Annual Meeting of the Geronto-logical Society of America. Washington, DC.
Archold, P. G. (1983). The impact of parent-caring on women. FamilyRelations, 32, 39-45.
Bradburn, H. M. (1986). Informal caregivers: Report on ineligibles. In P.Gayer (Ed.), National long-term care survey and national survey ofinformal caregivers, 1982: Report on methods and procedures used inthe surveys, Part 2 Documentation. Springfield, VA: National TechnicalInformation Services, No. PB 86161791.
Brody, E. M. (1981). Women in the middle and family help to older people.The Cerontologist, 25,19-29.
Brody, E. M., Johnsen, P. T., Fulcomer, M. C , & Lang, A. M. (1983).Women's changing roles and help to the elderly: Attitudes of threegenerations of women. Journal of Gerontology, 38, 597-607.
Brody, S., Poulshock, S. W., & Masciocchi, C. (1978). The family caring unit:A major consideration in the long term support system. The Cerontolo-gist, 78,556-561.
Callahan, J. J., Diamond, L. D., Giele, J. Z., & Morris, R. (1980). Responsibil-ity of families for their severely disabled elders. Health Care FinancingReview, Winter, 29-48.
Cantor, M. (1975). Life space and social support system of the inner cityelderly of New York. The Cerontologist, 15, 23-34.
Cantor, M. (1980). The informal support system, its relevance in the lives ofthe elderly. In E. Borgatta & N. McCloskey (Eds.), Aging and society.Beverly Hills: Sage Publications.
Cantor, M. H. (1983). Strain among caregivers: A study of experience in theUnited States. The Cerontologist, 23, 597-604.
Cicirelli, V. G. (1981). Helping elderly parents: The role of adult children.Boston: Auburn House.
Dobrof, R., & Litwak, E. (1977). Maintenance of family ties of long-term carepatients. Rockville, MD: National Institute of Mental Health.
Doty, P. (1986). Family care of the elderly: The role of public policy. MilbankMemorial Fund Quarterly, 64, 34-75.
Frankfather, D., Smith, M. J., & Caro, F. G. (1981). Family care of the elderly:Public initiatives and private obligations. Lexington, MA: LexingtonBooks.
George, L. K., & Gwyther, L. P. (1986). Caregiver well-being: A multidimen-sional examination of family caregivers of demented adults. The Geron-tologist, 26, 253-259.
Horowitz, A. (1985a). Family caregiving to the frail elderly. In C. Eisdorfer(Ed.), Annual Review of Gerontology and Geriatrics, Volume 5. NewYork: Springer.
Horowitz, A. (1985b). Sons and daughters as caregivers to older parents:Differences in role performance and consequences. The Gerontologist,25, 612-617.
Horowitz, A., & Dobrof, R. (1982). The role of families in providing long-term care to the frail and chronically ill elderly living in the community:Final Report submitted to HCFA. New York: Brookdale Center onAging.
Kovar, M. G. (1986). Aging in the eighties: Preliminary data from theSupplement on Aging to the National Health Interview Survey, UnitedStates, January-June 1984. /Advance Data from Vital and Health Statistics.775DHHS Pub. No. PHS 86-1250. Hyattsville, MD: Public Health Service.
Lang, A. M., & Brody, E. M. (1983). Characteristics of middle aged daughtersand help to their elderly mothers. Journal of Marriage and Family, 45,193-202.
Lee, G. R., & Ellithorpe, E. (1982). Intergenerational exchange and subjec-tive well-being among the elderly. Journal of Marriage and the Family,44, 217-224.
Litwak, E. (1985). Helping the elderly: The complementary roles of informalnetworks and formal systems. New York: Guilford Press.
Litwak, E., & Figueira, J. (1970). Technological innovation and ideal forms offamily structure in an industrial society. In R. Hill & R. Konig (Eds.),Families in east and west: Socialization process and kinship ties. Paris:Mouton.
Liu, K., Manton, K., & Liu, B. M. (1985). Home care expenses for thedisabled elderly. Health Care Financing Review, 7, 51-58.
Macken, C. L. (1986). A profile of functionally impaired elderly personsliving in the community. Health Care Financing Review, 7, 33-49.
McKinlay, J. B., & Tennstedt, S. L. (1986). Social networks and the care offrail elders. Final Report. NIH/NIA Grant No. AG-3869. Boston, MA:Boston University.
Nardone, M. (1980). Characteristics predicting community care for mentallyimpaired older persons. The Gerontologist, 20, 661-668.
Noelker, L. S., & Poulshock, S. W. (1982). The effects on families of caringfor impaired elderly in residence. Final Report submitted to AOA.Cleveland, OH: Benjamin Rose Institute.
Rathbone-McCuan, E. (1976). Geriatric day care: A family perspective. TheCerontologist, 76, 517-521.
Rosenmayr, L. (1977). The family — a source of hope for the elderly. In E.Shanas & M. Sussman (Eds.), Family bureaucracy and the elderly. Dur-ham, NC: Duke University Press.
Shanas, E. (1979). Social myth as hypothesis: The case of the family relationsof old people. The Gerontologist, 19, 3-9.
Shanas, E., Townsend, P., Wedderburn, D., Friis, H., Milhoj, P., & Ste-houwer, J. (1968). Old people in three industrial societies. New York:Atherton Press.
Soldo, B. J., & Manton, K. G. (1985). Health status and service needs of theoldest old: Current patterns and future trends. Milbank Memorial FundQuarterly/Health and Society, 63, 286-319.
Soldo, B. J., & Myllyluoma, J. (1983). Caregivers who live with dependentelderly. The Gerontologist, 23, 605-611.
Stephens, S. A., & Christianson, J. B. (1986). Informal care of the elderly.Lexington, MA: Lexington Books.
Stoller, E. P. (1983). Parental caregiving by adult children. Journal of Mar-riage and the Family, November, 851-858.
Tourangeau, R. (1986). Informal caregivers: Report on sampling. In P. Gayer(Ed.), National long-term care survey and national survey of informalcaregivers, 1982: Report on methods and procedures used in the sur-veys, Part 2 documentation. Springfield, VA: National Technical Infor-mation Service, No. PB 86161791.
Travelers Companies. (1985). The Travelers employee caregiver survey.Unpublished manuscript.
Troll, L. E. (1971). The family of later life: A decade review. Journal ofMarriage and the Family, 33, 263-290.
Zarit, S. H., Reever, K. E., & Back-Peterson, J. (1980). Relatives of theimpaired elderly: Correlates of feelings of burden. The Gerontologist,20, 649-655.
626 The Gerontologist
at Boston U
niversity on Decem
ber 31, 2014http://gerontologist.oxfordjournals.org/
Dow
nloaded from
Related Documents