Università degli Studi di Milano CORSO DI DOTTORATO DI RICERCA IN BIOLOGIA VEGETALE E PRODUTTIVITÀ DELLA PIANTA COLTIVATA (65R) AGR07 Docente Guida: Prof. Attilio Scienza Docenti di Supporto: Prof. Osvaldo Failla Dott. Fabio Nocito Tesi di Dottorato di: Francis Fogarty Matr. R07938 THE EFFECT OF SHADING ON THE ON THE FLAVONOID PATHWAY DURING GRAPE BERRY RIPENING IN THREE AGLIANICO BIOTYPES Anno Accademico 2009-2010

Welcome message from author
This document is posted to help you gain knowledge. Please leave a comment to let me know what you think about it! Share it to your friends and learn new things together.
Transcript

1
Università degli Studi di Milano
CORSO DI DOTTORATO DI RICERCAIN
BIOLOGIA VEGETALE E PRODUTTIVITÀ DELLA PIANTA COLTIVATA
(65R) AGR07
Docente Guida: Prof. Attilio ScienzaDocenti di Supporto: Prof. Osvaldo Failla Dott. Fabio Nocito
Tesi di Dottorato di:Francis Fogarty
Matr. R07938
THE EFFECT OF SHADING ON THE ON THE FLAVONOID PATHWAY DURING GRAPE BERRY
RIPENING IN THREE AGLIANICO BIOTYPES
Anno Accademico 2009-2010
Index
Abstract 5Foreword 7
Grape ripeness 7
Polyphenols and Flavonoids 9
A “colourful model for genetics” 10
The purpose of this work 11
Introduction 13
Grapevine Flavonoids 13
Polyphenol and Flavonoid chemistry 13
Phenols 13
Polyphenols 13
Phenolic compounds in grapes and wines. 14
Non-flavonoid polyphenols 14
Phenolic Acids 14
Hydrolyzable tannins 16
Stilbenes 16
Flavonoids 17
Flavones 17
Anthocyanins 18
Flavonols and Flavononols 22
Flavan-3-ols, Proanthocyanidins and Condensed Tannins 23
Flavonoids and grape ripening 26
A dynamic view. 26
Anthocyaninsʼ kinetics: synthesis and degradation 26
Tanninsʼ kinetics 27
2

Flavonolsʼ kinetics 28
Molecular aspects of grapeʼs flavonoids 29
Flavonoid Biosynthesis in grapes 29
Flavonoid regulation and transport in plants 31
The regulatory genes of the flavonoid pathway 31
The flavonoid transport network 33
The regulation of the flavonoid pathway in the grapevine 36
Structural Genes 36
Transcription factors 39
MYB factors 39
bHLH and WDR factors 42
Flavonoid transport in the grapevine 42
Light and flavonoids 44
Factors influencing the flavonoid pathway. 44
The role of light and shading. 44
The effect of light on anthocyanins 46
The effect of light on flavonols 48
The effect of light on tannins 49
The effect of light on the flavonoid pathwayʼs genes transcription 49
Aglianico 52
Origin and main characteristics 52
Flavonoid composition of Aglianico 53
The expression of the flavonoid pathway in Aglianico 54
A model for grape intra-variety variability 55
Materials and Methods 57
Plant material and experimental design 57
Determination of the metabolite profiling 58
Gene expression analysis 59
3

Results 62
Metabolite kinetics 62
The effect of shading on ripening kinetics 62
Physiological and technological variables 62
Phenolic compounds 65
Ripening kinetics in the three Aglianico biotypes 67
Physiological and technological variables 67
Phenolic compounds 70
The anthocyanin profiling 73
The effect of shading on the anthocyanin profiling 73
The anthocyanin profiling of the three Aglianico biotypes 74
Gene expression 78
Discussion 88
The effect of cluster shading on the flavonoid pathway 88
The effect of shading on flavonoid kinetics. 89
The effect of shading on the transcription of the genes of the flavonoid pathway 91
Structural genes: 91
Transcription factors: 93
Anthocyanin Transporters: 94
The expression of the flavonoid pathway in three monophyletic Aglianico biotypes. 94
Conclusions 97
Acknowledgment 99
Bibliography 100
4
Abstract
Polyphenols play a crucial role in wine making: they are involved in the oxidation
reactions and in the determination of the sensorial quality of wine, particularly the
astringency and the structure (tannins) and the color of red wines (anthocyanins). Some
polyphenols have nutraceutical properties and are responsible for the benefit of moderate
consumption of red wine on human health. Anthocyanins are a very well known group of
phenolic compounds responsible for red, blue and purple pigmentation in plants,
particularly in some flowers (eg, Petunia) and in many fruits, including red grape berries.
Anthocyanins are synthesised in the flavonoid pathway. Previous studies (Downey et al,
2004; Fujita et al 2007; Rustioni et al, 2006) have demonstrated that cluster shading may
significantly influence anthocyanin synthesis and, in general, the whole flavonoid pathway.
More studies are necessary to elucidate the role of shading in the regulation of the
pathway. For this reason we have chosen to study the response to shading in very closely
related biotypes of a red berry cultivar of Vitis vinifera.
Aglianico is a very famous red cultivar traditionally grown in Southern Italy in many
separated areas. Recent study (Costantini et al, 2005) have demonstrated that several
byotipes of Aglianico, although showing clearly different phenotypes, they are originated
from the same original genotype. For this reason, Aglianico is considered a good model for
intra-variety variability. Three main biotypes of Aglianico (Vulture, Taurasi and Taburno)
were selected to carry out this work.
A vineyard collecting the three biotypes was chosen as experimental site. In the
experimental vineyard the biotypes are grown in the same environmental and agronomic
conditions. Before veraison, clusters from each biotype underwent two different
treatments: 12 clusters were covered with a shading screen designed to exclude light 5

without modifying temperature and relative humidity; other clusters were completely
exposed to sunlight through defoliation of the bottom leaves of the canopy.
Physiological and technological variables such as sugars, pH and titrable acidity, and
the accumulation kinetics of the each polyphenol species were measured. The relative
expression of CHS2, F3ʻ5ʻH, F3ʼH, F3H, DFR1, LDOX1, UFGT, OMT, AM1, AM3, GST4,
LAR2, FLS4, MYB5a, MYB5b, MYB12 and MYBA1 was analysed by means of Real Time
PCR.
This work describes the behaviour of the three biotypes regarding both the
accumulation of primary and secondary metabolites as well as the differential expression
of the flavonoid biosynthethic genes.
In the mean time it describes the accumulation of primary and secondary metabolites
and transcriptional expression of the genes of the flavonoid pathway in response to the
grape berry shading treatment.
This work is the first report about the effect of grape bunch exposure on the
expression of the F3ʼ5ʼH and F3ʼH genes, and on the AM1, AM3 and GST4 anthocyanin
transporters.
6

Foreword
Grape ripeness
Grape berry growth follows a double sigmoid pattern (Coombe, 1992). The berryʼs
volume increases during stages I and III, while it is constant during the lag phase (stage
II). During stage I carbohydrates are mainly used for seed development, cell proliferation
and organic acid synthesis. During phase III the titrable acidity decreases while there is
accumulation of sugars and secondary metabolites until ripeness.
So, grape ripening appears as the harmonious evolution of several distinct biological
processes simultaneously converging towards a particular level that makes the fruit edible
and/or ready for wine making. Grape ripeness, or grape maturity, is the physiological stage
in which this level is achieved, and it is the ideal moment for harvest. The achievement of
ripeness is the result of the natural interaction between a genotype (the variety) and its
environment, but it is also the result of the ability of farmers choosing the best viticultural
practices.
Ripeness is a very broad concept, and it isnʼt easy to give a universal practical
definition for it. It is even more difficult in Vitis vinifera, because grapes are non climateric
fruits and the physiological status of the whole plant influences the ripening process. Biotic
and abiotic stresses alter the kinetics of some processes, thus some metabolites may not
reach the optimal level with the best timing. The definition of “optimal level” is also difficult:
it strongly depends on the winemaking objective (i.e., the optimal acidity level of the fruits
is different weather the grapes are for making sparkling wine or for making a long ageing
red wine), and it may also depend on what a farmer regards as typical for a certain variety
7

in a certain area: so, in some way, we can say that “ripeness is in the eye of the
beholder” (Hellman, 2004):
The concept of ripeness itself can be seen from different points of view:
• “Evolutionary ripeness”. The only purpose for a grapevine to develop berries is
reproduction. The berriesʼ functions are to carry and protect the seeds until they are
ready to germinate, and then attract disseminating animals. All the physiological
processes going on in the berry follow this logic. When the seeds are not ready, berries
need to be hidden, unsavoury and hard to digest. When the seeds are mature berries
needs to visible, fragrant, appetising and nutrient for animals (e.g. the European starling)
that eat grapes and eventually scatter the seeds originating new plants.
• “Physiological ripeness”. From a strict physiological point of view, ripeness is achieved
when seeds are ready to germinate. All the following processes can be interpreted as a
sort of cellular senescence phenomenon involving the lysis of the middle lamella and the
production of secondary metabolites.
• “Technological ripeness”. From a classic enological point of view, ripeness is the optimal
ripening stage for wine production. The concept of “technological ripeness” normally
refers to the sugars/acids ratio. This is a basic quality index and it is a fundamental
requirement for any wine, but it is not sufficient for high quality products.
• “Aromatic ripeness”. Grape is ripe when it has the highest content of odour and flavour
active compounds and of their precursors. The level of these compounds must
guarantee the aromatic quality of wine over time.
• “Phenolic ripeness”. Phenolic ripeness refers to the amount and structure of phenolic
compounds in the grape, and their potential extractability during the maceration process.
From this point of view, grapes are ripe when anthocyanins reach the maximum
concentration, tannins have the optimal structure, all other polyphenols reach the ideal
concentration and the extractability of the polyphenols is highest. Hence, from this point 8

of view, the lysis of the middle lamella and the production of secondary metabolites are
not considered as senescence phenomena, but as main processes leading to ripeness.
When technological, aromatic and phenolic ripeness are achieved simultaneously
there has been an ideal interaction between the plant and the territory, the season and
farmerʼs ability. Biotic or abiotic stresses, poor seasonal weather, mistakes in the choice of
the cultivar or in the farming practices and a low viticultural suitability of the territory cause
the asynchronous achievement of the different levels of ripeness, compromising wine
quality (Ribereau-Gayon et al., 1998).
Polyphenols and Flavonoids
Polyphenols, and flavonoids particularly are a crucial group of compounds in wine
making. They are responsible for the sensorial differences in colour and taste between
white and red wines. Polyphenols are also very interesting from a nutritional and health
care point of view, particularly in the prevention of heart diseases.
High quality polyphenols are one of the keys to the achievement of high quality
wines. Good vineyard management is crucial to this purpose. Polyphenols are extracted
mainly from grape seeds and skins during the wine making process, and subsequently
they undergo several oxidation, hydrolysis and condensation reaction during wine ageing.
This way polyphenols change their original structure forming very complex molecules
which can be very difficult to study with chemical and physical methods. The quantity and
quality of the polyphenols contained in grapes, their extraction during wine making and the
conditions in which they undergo all the chemical processes modifying their structure
determine the quality of the wine.
In the past wine makers had a very simple and pragmatic concept of grape ripeness,
taking into account only a few variables easy to measure. Nowadays is more important to 9
understand grape ripeness deeply, as quality variables such as polyphenols and aroma-
active compounds are becoming more and more important.
Molecular biology is a powerful tool to investigate grape ripening, and particularly, the
analysis of the expression levels of the genes involved in the synthesis of polyphenols may
give us new insight, allowing us to understand better a complex phenomenon such as
grape ripening.
A “colourful model for genetics”
Flavonoids are the major red, blue and purple pigments in plants. For this reason
they have have been a research topic for many centuries and they have played a main
role in many important scientific breakthroughs.
Robert Boyle (1927 - 1691) long studied the colour of plants. In 1664 he first
published an essay about the chemical properties of plant pigments in Experiments and
considerations touching colours. The colour of flowers was one of the major characters
studied by Gregor Mendel (1823 - 1883) leading him to the postulation of the principles of
inheritance. Barbara McClintock (1902 - 1992) first discovered the “jumping
genes” (transposons) studying the flavonoid pathway in Zea mais, and she was awarded
with the Nobel Prize in 1983.
Breeders and farmers, in the search for new and original ornamental plants and
crops, created a vast variety of individuals with a complete range of tones and colours in
fruits and flowers using traditional breeding techniques. Modern breeding and
transformation techniques produced even more variability. The complexity of phenotypic
expressions is a very valuable resource for scientists. The flavonoid pathway is a well
characterised, multi-branched metabolic pathway that leads to the production of several
different metabolites that are stored in different parts of the cell. 10
This pathway presents many features that makes it an ideal model for several kinds
of scientific studies:
• it is active in many different species;
• it is differentially regulated from a spatial and temporal point of view;
• it is organ and tissue specific;
• it is under a strong transcriptional control;
• its regulation system involves the interaction of different transcription factor families;
• it features a complex transport network involving different mechanisms and transporters;
• it responds to a number of endogenous and environmental stimuli.
• Nevertheless, many of the molecular mechanism are still not completely characterised,
and others are still far from being really understood.
For all these reasons, the flavonoid pathway may well be considered a “colourful
model” (Winkel-Shirley, 2001) for the genetic spatial and temporal control of a metabolic
pathway and for the intracellular compartmentation of secondary metabolites.
The purpose of this work
The grapevine germoplasm is a good example of a vast resource of phenotypical
variation, making it is a good model-species to study the flavonoid pathway in fruit trees.
Flavonoids are crucial compounds determining the quality of grapes and wine.
Furthermore they determinate of the colour of berry skin and they are considered a reliable
tool in grape chemotaxonomy. Among many environmental factors influencing flavonoid
synthesis, light is clearly one of the most important. The quantity of light received by grape
berries is, to a certain extent, easy to manage through proper viticultural practices. The
training system, the rowʼs orientation and the number of leaf layers present in the fruit
zone are key factors influencing the grapesʼ sunlight exposure, hence the grapesʼ
11
flavonoid accumulation. Researchers devoted a lot of work to elucidate the effect of light
on the flavonoid metabolism in grape berries. However, many aspects are far from being
completely understood.
Aglianico is one of the most important and ancient red grape cultivars of Southern
Italy. It is well known not only for the excellent wine it produces, but also for its plasticity
and its ability to adapt to different environments and training systems. Aglianico shows a
great range of biotypes with different phenotypic expressions, making it a good resource to
investigate intra-variety variability.
This work analyses the effect of cluster shading in three closely related biotypes of
Aglianico, with a particular focus on the kinetics of flavonoid accumulation and on the
transcription of the key genes of the flavonoid pathway. In the mean time, this work
investigates the intra-variety variability of Aglianico biotypes.
The first part of the introduction to the experimental work will regard the up-to-date
knowledge about the chemical properties of the grapesʼ phenolic compounds, their
metabolism and their ripening kinetics. An important part will be devoted to analysis of the
molecular aspect of flavonoid metabolism, regulation and transport in model species and
in the grapevine. It will follow a review over the effects of sunlight and shading on the
flavonoid pathway in Vitis vinifera. Eventually, the cultivar Aglianico will be described,
focusing on its important role as a model for intra-varietal variability.
12
Introduction
Grapevine Flavonoids
Polyphenol and Flavonoid chemistry
Phenols
A phenol is an organic compound made of an aromatic ring bound to a oxydrilic
group (Russo et al., 1998).
They can form very strong hydrogen bonds and they have very high melting and
boiling points ( e. g. 41°C and 182°C for the phenol) and they are moderately soluble.
Phenols react very easily with sodium hydroxide forming sodium phenoxide, while they
are scarcely reactive towards carbonates.
Phenol is a weak acid (Ka = 10^-11), but its acidity is much stronger when
electrophilic substituents are present the ortho and para positions. Nevertheless, in mustsʼ
and winesʼ pH conditions, phenols are hardly dissociated to phenates.
The canonical forms stabilising the phenol create a negative charge density in the
ortho and para positions. For this reason phenols react very easily in those positions with
electrophilic compounds such as the carbocations. As it happens for alcohols, The
oxydrilic group of the phenols may react with anhydrides and chlorides acids forming an
ester (Russo et al., 1998).
Polyphenols
Polyphenols are similar to phenols, but the aromatic ring is bound to more than one
oxydrilic group. An example of a simple polyphenol is phloroglucinol (1,3,5-13

trihydroxybenzene): a aromatic ring with three oxydrilic substituents in meta position. This
compound is stabilized by 10 contributing structures delocalizing a negative charge density
in the ortho and para positions, hence phloroglucinol is very reactive towards carbocations
(Russo et al., 1998).
Phenolic compounds in grapes and wines.
Wine contains several kinds of different phenolic compounds which can be classified
into two main groups: flavonoids and non-flavonoids. Flavonoids are molecules
characterized by a particular 15 carbons structure formed by two polyphenolic rings with
an tetrahydropyran heterocycle between them. Flavonoids can be classified depending on
the oxidation degree of the heterocycle. The most common flavonoids in grapes and wines
are flavonols, flavans and anthocyanins. Non-flavonoids are polyphenols with a different
kind of structures: phenolic acids, stilbenes and hydrolysable tannins. The latter derive
from the wood of barrels, thus they can be found in wine but they do not naturally occur in
grapes (Ribereau-Gayon et al., 1998; Monagas et al., 2005).
Non-flavonoid polyphenols
Phenolic Acids
Phenolic acids are organic acids made of an aromatic ring directly or indirectly bound
to a carboxylic group. Benzoic and hydroxycinnamic acids are two types of phenolic acids
naturally occurring in the mesocarp and in the skin of grape berries. Their concentration in
wines strongly depends on the wine making process and varies between 10 and 20 mg/l in
white wines up to 100-200 mg/l in red wines. Although phenolic acids are not very
important from a sensorial point of view, they can be the substrate for certain micro-
organisms (e.g. Brettanomyces) giving origin to volatile phenols (vinyl and ethyl phenols)
which may cause major aroma problems in wine because of their distinctive unpleasant
odour (Ribereau-Gayon., 1998).
14
Benzoic (or hydroxybenzoic) acids have a simple C6-C1 structure. In this model the
carboxylic group is directly bound to the benzenic ring. Benzoic acids are distinguished by
the number and the type of substituents in the aromatic ring. The most important benzoic
acids in grapes are the protocatechuic, vanillic, siringic and p-hydroxybenzoic acids, while
salicilic and gentisic acids are found only in traces. The ratio among the benzoic acids
content in grapes, and particularly the ratio between siringic and vanillic acids, is variety
dependent (Kallithraka et al., 2007). Benzoic acids in grapes are found as heterosides, but
in wine they are released in the free form by acid hydrolysis. Sometimes, benzoic acids
are found as esters of Hydrolysable tannins, in this case they are released by alkaline
hydrolysis. Benzoic acids in wine may derive also by the thermic degradation of more
complex compounds such as the anthocyanins. Many benzoic acids derivates have been
found in wine such as metyl and etyl- vanillate, etyl-p-hydroxybenzoate metyl and etyl -
protocatechuiate, etyl- gallate and the glucose esters of vanillic acid. (Monagas et al.,
2005).
Cinnamic (or hydroxycinnamic) acids have a C6-C3 structure. Caffeic, p-coumaric,
ferulic and sinapic acid are the cinnamic acids found in grapes and wines, and they differ
from one another for the substituents of the aromatic ring. The tartaric esters of these
acids may cause wine darkening in presence of polyphenoloxydases. Cinnamic acids are
more common in grapes in the trans form rather than the cis one. The cinnamic acids can
form esters with the glucose of monoglucosidic anthocyanins, producing acilated
anthocyanins. In wine also glucose esters of the p-coumaric and ferulic acids, trans-etyl-
caffeoate, trans-etyl-coumarate and the corresponding tartaric esters. Cinnamic acids are
also present in the cis and trans 4-O-glucosides forms.
Cinnamic acids are contained in the vacuole of the cells of the pulp and skin of the
grape berries. Higher concentrations are found in the pulp. In this tissue caffeic acid is the
15
most present, followed by p-coumaric acid and ferulic. In the skin the ratio among the
different types of cinnamic acids is cultivar dependent (Ribereau-Gayon et al., 1998;
Monagas et al., 2005).
Hydrolyzable tannins
Tannins are compounds able to form stable bonds with proteins and other vegetal
polymers such as polysaccharides. From a chemical perspective, tannins are large
phenolic molecules deriving from the polymerization of monomeric units containing
phenolic groups. A tannin polymer must reach a certain dimension to form a stable
complex with proteins, anyway, if the polymer is too large it cannot reach the active site of
proteins and, thus, there is no complex formation. Molecular mass of tannins ranges
between 600 and 3500 Da (Ribereau-Gayon et al., 1998; Jöbstl et al., 2004).
In wine there are two classes of tannins: hydrolyzable and condensated. The latter
belong to the group of flavonoid polyphenols and they derive from the grapes. On the
other hand, hydrolyzable tannins do not derive from grapes, but from the oak of the
wooden barrels where wine is conserved and aged. Hydrolyzable tannins can also
artificially added to the wine as commercial products. Hydrolyzable tannins can be
classified into gallotannins and ellagitannins depending on weather they release gallic or
ellagic acid by acid hydrolysis. Hydrolyzable tannins are very important during the aging of
both white and red wines for their oxydability and for their organoleptic properties
(Ribereau-Gayon et al., 1998).
Stilbenes
Stilbenes are low molecular mass phenolic compounds with a particular kind of
structure: two aromatic rings linked by a ethylenic or an ethanic group. Each aromatic ring
has one or more phenolic functions.The most well-known stilbene is trans-resveratrol
(3,5,4ʼ-trans-trihydroxystilbene) and its cis isomer. Other important stilbenes in grapes and
wines are the heterosides of resveratrol (piceids), piceotanonl (4 ʼ,3,4,5-
16

tetrahydroxystilbene), pterostilbene (trans-3,5 dimetil-4ʼ-hydroxystilbene) and the cyclic
dimers and trimers of resveratrol (viniferines) (Monagas et al., 2005; Ribereau-Gayon et al.
1998b; Bavaresco and Fregoni, 2000). Recently, several other stilbenes have been
identified: 3,5,3ʼ,4ʼ-tetrahydroxystilbene-3-O-glucoside (trans-astringin), 2,4,6-trihydroxy-
phenanthrene-2-O-glucoside, resveratrol-2-C-glucoside, E-viniferin-diglucoside, pallidol-3-
O-glucoside, pallidol-3,3ʼʼ-diglucoside and partenocissin-A (Monagas et al., 2005). The
relative proportion of stilbenic compounds is cultivar specific (Kallithraka et al., 2007)
Significative concentration of resveratrol can be found in wine. In red wines cis and
trans resveratrol ranges between 0,3 and 12 mg/l, depending on agronomical,
technological and environmental factors and on the cultivar. In grapes stilbenes are
concentrated mostly in the seeds and in the skin, hence the wine making technique greatly
influences the final concentration in wine of these compounds.
General interest for stilbenes, and more specifically for resveratrol, is caused by their
nutraceutical properties. In 1992 Renaud and De Lorgeril publish a paper revealing the
famous french paradox. Studying data from several european countries, the authors
showed a direct link between daily consumption of animal fats and the incidence of heart
disease deaths. France represented an exception to this rule, having a paradoxical
situation showing a low frequency of deaths related to heart diseases and a high
consumption of animal fats. The only variable able to solve this contradiction is the regular
consumption of red wine. The positive effect of red wine is connected also to the presence
of resveratrol. (German and Walzem, 2000)
Flavonoids
Flavones
Flavones, also known as anthoxantines, are yellow pigments widespread in plants.
Flavones are often found in the as glucosides. The aglicones goes under the name of
17
Anthoxantidin. Flavones are also found forming complexes with tannins. Several flavones
have been identified in plants, however these compounds are not frequently found in fruits.
In the grapevine they are mainly present in the leaves, mainly apigennin-8-C-glucoside,
apigenin-7-O-glucoside, Luteolin and Luteolin-7-O-glucoside (Monagas et al., 2005).
Flavones are formed by a 15 carbon skeleton, configured following a C6-C3-C6
pattern featuring three typical rings. The A ring is similar to a molecule of phloroglucinol
bound to a oxygen unsaturated heterocycle known as the C ring. The B ring is the lateral
6 carbon cycle. The heterocycleʼs carbons 2 and 3 have a double bond. These carbons
have a sp2 hybridisation. In this hybridisation one s and two p orbitals are combined
forming three hybrid sp2 orbitals while one p orbital is not hybridised. The three sp2 orbitals
are on the same plane, and they form a 120° angle among each other, while the p orbital
is perpendicular to the plane. (Russo et al., 1998). This kind of hybridization is responsible
for the planarity and conformational rigitdity of the flavone and of its derivatives. Therefore,
they do not have cis or trans diastereoisomers.
Flavonoids are phenolic compounds that share the same C6-C3-C6 structure as the
flavones, and they are classified depending the oxidation degree of the heterocycle.
Anthocyanins
Anthocyanins are important plant pigments responsible for the red, violet and blue
colours of several fruit and flowers of many plants. They are responsible for the colour of
the skin of red grapes and of the colour of the pulp of some grape cultivar (teinturier
cultivars). Anthocyanins are heterosides, the corresponding aglycones are called
anthocyanidins. Anthocyanins are amphoteric substances: in acid environments they are
red, in a neutral solution they are violet and their metallic salts are blue. The core of the
molecule of anthocyanins is benzopyrilium, a molecule formed by a benzenic ring bound to
a heterocycle with 3 carbons and an oxygen. A phenol is bound to the position 2 of the
18
heterocycle, forming the 2-phenyl-benzopyrilium cation, also known as flavylium (Riberau-
Gayon et al., 1998; Russo et al., 1998).
Anthocyanidins derive from 3,5,7-trihydroxyflavylium and the differ from each other
for the hydroxyl and/or methoxyl substituents of the lateral ring. Six main species of
anthocyanidins are known: cyanidin (3,3ʼ,4ʼ,5,7-pentahydroxyflavylium), peonidin (3-
methyl-3,4ʼ,5,7-tetrahydroxyflavylium), delphinidin (3,3ʼ,4ʼ,5ʼ,5,7-esahydroxyflavylium),
petunidin (5ʼ-methyl-3,3ʼ4ʼ,5,7-pentahydroxyflavylium), malvidin (3ʼ,5ʼ-dimethyl-3,4ʼ,5,7-
tetrahydroxyflavylium), pelargonidin (3,4ʼ,5,7-tetrahydroxyflavylium). The latter is not found
in Vitis, and therefore is absent in grapes and wine. The color of the anthocyanidins
depends on the kind and number of substituents and on the solventʼs pH. The substituents
give different chemical properties to each anthocyanidin: malvidin is more sensible to
thermal degradation as the methyl substituents activate the B ring, making the aliphatic
chain easier to break down to a chalcone, while cyanidin is more resistant to high
temperatures. On the other hand, the methyl substituents of malvidin protect it from
oxydation, while cyanidin is more easily oxidized (Ribereau-Gayon et al., 1998, Monagas
et al., 2005) .
Anthocyanins are found bound to several sugars, mono, di- and tri- saccharides. The
most common of them is glucose. There are monoglycosylated and diglycosylated
anthocyanins. The glucose is usually bound to the 3 or 3,5 positions with a beta-glycosidic
bond. Vitis vinifera grapes only contain mono-glycosylated anthocyanins, while
diglycosylated anthocyanins are found in american species such as V. riparia and V.
rupestris. The “diglycosylated anthocyanins” character is dominant, and it is found in Vitis
vinifera hybrids with american species. The sugar residue of the anthocyanidin may form
an ester with an acetic, p-coumaric or caffeic acid, forming acylated anthocyanins. Each
grape variety has a typical anthocyanin profiling, in other wordsa specific pattern of the
19
relative concentration of each anthocyanin. The anthocyanin profiling is under a strong
genetic control, ant the influence of the environment is limited. For this reason, red berry
grapevine cultivars can be classified into groups (Mattivi et al., 2006):
• cultivars with a higher proportion of disubstituted anthocyanins (e.g. Nebbiolo);
• cultivars with a higher proportion of trisubstituted anthocyanins (e.g. Merlot);
• cultivars with a high p-coumarates / acetates ratio (e.g. Dolcetto);
• cultivars with a low p-coumarates / acetates ratio (e.g. Barbera);
• cultivars with no acylated anthocyanins (e.g. Pinot Noir);
• cultivars with high proportion of acylated anthocyanins (e.g. Cabernet Sauvignon).
In red grape cultivars, anthocyanins are located in the inner layer of the skin. At
veraison, when anthocyanin synthesis begins, they are strongly bound to the tonoplast.
During the grape ripening, anthocyanins are released into the vacuole, making color
extraction easier during wine making. Anthocyanins have a primary role in winemaking as
they are responsible for the colour of red wines. The colour of these pigments depends on
the molecular structure, on the pH and on the interaction with other substances present in
wine such as SO2 (Ribereau-Gayon et al., 1998).
The molecular structure of anthocyanins depends on the number and on the nature
of the B-ring substuents: Pelargonidin is monosubstituted and it is orange while Malvidin is
trisubstituted and it is mauve. The increase in the number of substituents causes a
batochromic shift (red shift), moving the absorbance peak to a longer wavelenght.
Glycosylation and acylation cause the opposite phenomenon, an ipsochromic shift: the
moleculeʼs absorbance peak moves to a shorter wavelength and the colour becomes more
orange. (Ribereau-Gayon et al. 1998; Monagas et al 2005).
Anthocyanins change colour depending on the pH: in acid solution they are red and
they loose colour as pH rises up to pH 3.5, at pH 4 they are blue and they eventually
20
become yellow in an alkaline environment. Anthocyanins may assume four different
structures in wine and equilibrium occurs among them: the flavylium cation (A+), the
quinoidal base (AO), the carbinol base (AOH) and a cis or trans chalcone (C). The
flavylium is a red cation and it has a positive charge localised on the oxigen and it is
stabilised by six resonance structures. The quinoidal base is blue and it is defined by a
ketonic group with a fast proton transfer reaction formed from one of the phenolic hydroxyl
groups of the flavilyum. The flavylium may undergo a proton transfer after a hydration
reaction, as a result a colourless carbinol base is formed with an hydroxyl functional group
in position 2 or 4. The heterocycle of the carbinol base may form a cis or a trans chalcone
by tautomerization. There are three equilibria occuring among these molecules:
• A+ + H2O <----> AOH + H+ (pKa = 2,93)
• A+ <----> AO + H+ (pKa = 3,41)
• AOH <----> C (Kt = 0,61)
Low pH favours the formation of the more coloured and stable forms, while at higher
pH the equilibrium moves towards the colourless and unstable forms (AOH and C).
Chalcones are very unstable compounds and they easily break down to 2,4,6-
trihydroxybenzaldeyde and syringic acid. This causes the definitive loss of anthocyanins,
as this reaction is irreversible in wine conditions. Anthocyanins are in the vacuole, where
the pH condition are optimal for stabilising the colour (Bruillard and Dubois, 1977), (Chen
and Hrazdina, 1982), (Monagas et al., 2005).
In the vacuole of the grapeʼs skin cell anthocyanins interact also with other
molecules (cofactors) such as organic compounds (i.e. flavonols) or metal cations forming
molecular associations or complexes. This may result in an enhancement in the
absorbance and in some cases, a shift in the wavelength of the maximum absorbance of
the pigment. This phenomenon is known as copigmentation . Copigmentation explains the
21
differences in colour between the berriesʼ skins and the must, and it may account up to
50% of the colour of young wines. (Boulton, 2001).
Free anthocyanins undergo many reactions during wine ageing. They form stable red
complexes with condensed tannins. If the anthocyanin and the tannin are linked by an
ethanal bridge, the resulting complex is particularly stable. The formation of these
molecules prevents the complete decoloration of red wine due to the complete loss of free
anthocyanin caused by chemical degradation or by other causes (i.e. the decolorating
action of SO2, precipitation), (Brouillard et al., 1997), (Ribereau-Gayon et al., 1998).
Flavonols and Flavononols
Flavonols and flavononols are yellow coloured molecules. Flavonols (3-hydroxy-
flavone)are the hydroxyl derivatives of the flavone, and they have the same typical 15
carbon structure with two benzenic rings connected by an oxygen hetherocycle.
Flavononols derive from the flavanone: the structure is similar to the flavone, but it lacks a
double bond in the hetherocycle (Russo et al., 1998).
Flavonols are more common than flavononols in grapes and wines. They are the
yellow pigments present in both white and red berry grapes as well as in a large number of
other fruit and flowers. There are three major species of flavonols n grapes and wines,
distinguished by the substituents of the B-ring: 3-4ʼ-dihydroxy-flavone (kaempferol), 3,3ʼ-4-
trihydroxy-flavone (quercitin) and 3,3ʼ,4ʼ,5ʼ-tetrahydroxy-flavone (myricetin). Small
quantities of isorhamnetin may be found as well. The proportion of flavonols is cultivar
dependent, and myricetin is totally missing in white berry grapes (Mattivi et al., 2006).
Flavonols are found as mono- or disaccharide glycoside . The sugar is bound to the
hydroxyl in position 3. 8 monosaccharide and 3 disaccharide species are found in grapes.
(Monagas et al., 2005). The concentration of flavonols in red wines reaches a few hundred
22

mg/l, while in white wines ranges between 1 and 3 mg/l. Glycoside flavonols are rapidly
hydrolysed during the wine making process, so they are found only as aglycones in wine.
Flavonols are involved in the protection against UV radiation (Flint et al., 1985). They
act also as cofactor in the copigmentation of several fruits and flowers. Full light exposed
grapes have higher levels of flavonols. The concentration of flavonols in the grapes
depends also on the variety, on the thickness of the skin, on the dimension of the berries
and on the skin/berry ratio (Monagas et al., 2005).
Flavononols are not as yellow compared to flavonols. Dihydroquercitin (3,3ʼ,4ʼ-
trihydroxy-flavanonone) is the most important flavononol; dihydromyricetin and
dihydrokaempferol (both as glycoside and aglycones), engeletin and astilbin are also
found in grapes (Monagas et al., 2005).
Flavonols and flavonols contribute to the nutraceutical properties of wine (Tapas et
al., 2008)
Flavan-3-ols, Proanthocyanidins and Condensed Tannins
Flavans are a very important class of polyphenols in enology. This class is made of
several molecules: some are relatively simple, others are very heavy and complex
polymers. Flavan-3-ols are the simplest and they are the monomeric units of bigger
molecules. Dimeric and trimeric flavan-3-ols are called proanthocyanidins, bigger polymers
are generally called condensed tannins.
Flavan-3-ols are the hydroxyl-derivatives of the flavan. The structure is similar to that
of other flavonoids: two C6 benzene cycles bound to a C3 saturated oxygen heterocycle.
However, the carbon 3 of the heterocycle shows an hydroxyl functional group. As opposed
to other flavonoids, flavan-3-ols are not planar molecules. The carbons 2 and 3 of the
flavan-3-ol show a sp3 hybridisation (as opposed to sp2). This kind of hybridisation allows a
limited rotation in cyclic molecules, causing the formation of cis and trans diastereomers 23

(Russo et al. 1998). The trans isomers are called catechins (catechin and gallocatechin),
while the cis isomers are called epicatechins (epicatechin and epigallocatechin) (Monagas
et al. 2005). Because of the sp3 hybrydisation, C2 and C3 become chirality centres. For
each chirality centre there is an R and an S enantiomer. Enantiomers are optically active
and they have a (+) or (-) form. Hence, each flavan-3-ol diastereomer has two
enantiomers:
• (+)-catechins (C2=R, C3=S)
• (-)-catechins (C2=S, C3=R)
• (+)-epicatechins (C2=S, C3=S)
• (-)-epicatechins (C2=R, C3=R)
(+)-catechins and (-)-epicatechins are the most present isomers in grapes. Catechin
and epicatechin have two hydroxyl functional groups in 3ʼ and 4ʼ. In the berry skin are also
found the 3ʼ-4ʼ-5ʼ hydroxyl flavan-3-ols, and they are called (+)-gallocatechin and (-)-
epigallocatechin. In total there are 8 possible flavan-3-ols (Ribereau-Gayon et al. 1998).
Proanthocyanidins and condensed tannins are formed by the polymerisation of
flavan-3-ols (Dixon et al, 2005). The oligomers and polymers form stable bonds with
proteins and polysaccharides, including the proteins in the mouth, causing wine
astringency (Gambuti et al., 2006). The stability of these complexes depend on the
tanninʼs dimension and on the number of free phenolic groups. Monomeric flavan-3-ols are
too small to form stable complexes with proteins.
Proanthocyanidins are classified on the basis of the kind of chemical bond:
• Proanthocyanidins A (C30H24O12): dimer proanthocyanidins with two flavan-3-ols
condensed with a C4-C6 or a C4-C8 bond (interflavanic bond) and forming an ether
between the C2 of the first unit and the C5 and C7 of the terminal unit.
24

• Proanthocyanidins B (C30H26O12): dimer proanthocyanidins with only a C4-C6 or C4-C8
interflavanic bond.
• Proanthocyanidins C: trimer proanthocyanidins with only a C4-C6 or C4-C8 interflavanic
bond.
• Proanthocyanidins D: trimer proanthocyanidins. In this case the first two monomers have
the interflavanic bond only, but the central and the terminal monomer have both the
interflavanic and the ether bond.
Oligomer proanthocyanidins, condensed proanthocyanidins or, more simply,
condensed tannins are polymers with more than three units. The molecular mass of these
tannins can go over 3000 Da. There is a great number of possible isomers, and studying
these molecules deeply can be a difficult task (Heiderich and Smith, 2005).
In a hot and acid medium The interflavanic bond breaks down releasing an unstable
carbocation producing, eventually, an anthocyanin. For this reason flavan-3-ol polymers
are called proanthocyanidin (Bate-Smith, 1975). More specifically, procyanidins produce
cyanidin from catechin and epicatechin, while prodelphinidins produce delphinidin from
gallocatechin and epigallocatechin. (Monagas et al., 2005).
Condensed tannins are the typical tannins of grapes. Their concentration in wine
ranges between 100 mg/l in white wine and 4.000 mg/l in red wines. It varies depending
on the grape cultivar, farming practices and the season. They are present in all the solid
part of grapes: in the skin, in the seeds and in the stalk. During wine ageing the can
precipitate, they may undergo many structural changes and they may form stable
complexes with other organic compounds. Some reaction positively influence the sensorial
quality of wine, others may be negative (i.e. proteinic colour break) (Riberau-Gayon et al.,
1998).
25
Flavonoids and grape ripening
A dynamic view.
Total polyphenol content increases during grape ripening reaching the highest level
at full ripeness. After this peak, the concentration of polyphenols may decrease during
senescence. The accumulation kinetics of each flavonoid class is not the same: for
example anthocyanin synthesis begins at veraison, while tannins are synthesised also in
earlier stages of the berryʼs development.
Anthocyaninsʼ kinetics: synthesis and degradation
Anthocyanin synthesis in red grape berry skins starts at veraison. In the first phase
synthesis is very rapid and there is a massive accumulation of pigments. In this stage
anthocyanin accumulation kinetics is parallel to sugar accumulation, and up to 90% of total
pigments can be synthesised in this first phase. Anthocyanin kinetics stops following sugar
accumulation and accumulation slows down towards full maturity (Coombe & McCarthy
2000; Guidoni et al., 2004; Braidot et al., 2008).
Anthocyanin degradation occurs in parallel to the synthesis, but the molecular
mechanisms and the importance of its contribution to anthocyanin kinetics is still to be
clarified. The catabolic activity may be due either to the chemical instability of the pigments
(particularly to high temperature) or to specific enzymatic activity, or even to transport
issues. Anthocyanin degradation was reported in many fruits and flowers (Borovsky et al,
2004; Steyn et al. 2005; Vaknin et al., 2005; Zhang et al., 2005). Anthocyanin turnover
under high temperature growing conditions has been shown also in grapes (Mori et al
2007). Polyphenoloxydases (PPOs) might be involved in the enzymatic degradation of
anthocyanins, but PPOs are mostly found in the chloroplast, and they could hardly reach
26
anthocyanins stored in the vacuole. In 2006, Ono and his co-worker first found a flavonoid
biosynthetic PPO (Aureusidin Synthase, AS) involved in the enzymatic oxydation of
chalcone for the production of aurones in yellow snapdragon petal cells. They showed that
AS is localised in the vacuole (Ono et al., 2006). So, the presence in the vacuole of other
PPOs that may have a role in anthocyanin degradation canʼt be excluded.
Tanninsʼ kinetics
Tannin accumulation in the seeds and in the skins begins at fruit set and it continues
until veraison. At this stage there is peak in the concentration of tannins. After the onset of
ripening the concentration of tannins normally remains constant, or it may diminish for
dilution, because the synthesis of flavan-3-ols is not significative and it does not follow
berry growth and sugar accumulation after veraison (Harbertson et al., 2002; Bogs et al.,
2005; Fournand et al., 2006). The composition of tannins changes in different organs.
At veraison grapes seeds contain mostly low molecular weight flavans. After the
onset of ripening there is a dramatic decrease in flavan-3-ols and proanthocyanidins (90%
and 60% respectively). This results in the change of the seed coatʼs colour. Nevertheless,
the average degree of polymerisation of the seeds tannins is low throughout the whole
ripening period. Thus, seed tannins are the major responsible for the excessive
astringency of wine. The contribution of seeds tannins to wine depends not only on the
absolute concentration in the seed, but also on the average number of seeds per berry
(Kennedy et al., 2000; Harbertson et al., 2002).
Grape berry skins have different tannin structure. The molecular weight of tannins
increases during berry development and the proportion of flavan-3-ols and
proanthocyanidin diminishes accordingly. For this reason the high-molecular-weight skinʼs
tannins contribution to wineʼs astringency is smaller than the seedʼs. (Kennedy et al., 2001;
Kennedy et al., 2002; Harbertson et al., 2002; Fournand et al., 2006).
27
Flavonolsʼ kinetics
Flavonol kinetics are interesting. The maximum concentration per fresh weight is
about 9 weeks prior to veraison. Flavonol concentration decreases dramatically in 4-5
weeks and then slowly diminishes until harvest. Analysing flavonol quantity per berry (or
per berry skin area), the situation is opposite: flavonols accumulate until veraison. After the
onset of ripening, flavonol accumulation slows down or stops and flavonol content remains
constant. This indicates that flavonol synthesis is active throughout the whole berry
development . Furthermore, flavonol synthesis is very much influenced by the
environment, especially by light. (Downey et al., 2003; Fujita et al., 2006; Matus et al.,
2009).
28
Molecular aspects of grapeʼs flavonoids
Flavonoid Biosynthesis in grapes
Polyphenols are synthesised in grape berries following the same multi-branched
phenylpropanoid pathway described in many plant species, although with some
peculiarities (e.g. the absence of monosubstituted anthocyanins) (Sparvoli et al., 1994;
Boss et al., 1996, Mol et al., 1998; Winkel-shirley, 2001; Shubert et al., 2003; Matus et al.,
2009). The early steps of the pathway are the transformation of phenilalanine to cinnamate
first, and then to p-coumarate by the phenilalanine-ammonia-lyase (PAL) and
cinnamate-4-hydroxylase (C4H) respectively. The p-coumarate may either produce
cinnamic esters ending the synthesis, or produce the coumaroil-CoA through the action of
the 4-coumarate-CoA-ligase (4CL). This compound is the substrate of two alternative
enzymes: the chalcone sinthase (CHS) or the stilbene sinthase (StSy) producing the
chalcone (2,4,6,4ʼ-tetrahydroxychalcone) or the stilbenes respectively.
The chalcone is the first flavonoid synthesised in this pathway. The action of the
chalcone isomerase (CHI) (producing the 5,7,4ʼ-trihydroxyflavone) and of the flavonoid-3-
hydroxylase (F3H) produce the dihydrokaempferol. This flavononol is the substrate of two
alternative enzymes: the flavonoid-3ʼ-hydroxylase (F3ʼH) and the flavonoid-3ʼ5ʼ-
hydroxylase (F3ʼ5ʼH) obtaining dihydroquercitin and dihydromyricetin respectively. The
flavononls are the substrate of the flavonol-synthase (FLS) producing the corresponding
flavonol: quercetin, myricetin and kaempferol. This is a very important part of the pathway:
F3ʼH leads to cyanidin-based disubstituted anthocyanins and procyanidins, while F3ʼ5ʼH
leads to delphinidin-based trisubstituted anthocyanins and prodelphinidins. In grapevine
monosubstituded anthocyanins (pelargonidin) are absent: this is due to the selectivity of
grapevineʼs dihydroflavonol reductase (DFR) that does not accept dihydrokaempferol,
29
while dihydroquercetin and dihydromyricetin are accepted to produce the
leucoanthocyanidins (leucyanidin and leucodelphinidin respectively). Leucoanthocyanidin
dioxygenase (LDOX) synthesise anthocyanidins that are eventually glycosylated by the
UDP-glucose-flavonoid-3-glucosyltransferase (UFGT). The cyanidin-3-glucoside and the
delphinidin-3-glucoside are the first stable anthocyanin to be synthesised (Sparvoli et al.,
1994; Boss et al., 1996, Mol et al., 1998; Winkel-shirley, 2001; Shubert et al., 2003;).
Methoxylated anthocyanins are produced through the action of the anthocyanin O-
methyltransferase (OMT) from cyanidin-3-glucoside (peonidin-3-glucoside) and
delphinidin-3-glucoside (malvidin-3-glucoside and petunidin-3-glucoside) (Hugueney et al.,
2009). Acylation may occur after anthocyanin biosynthesis. Anthocyanin acyltransferase
have been identified in other species but not yet in the grapevine (Fujiwara et al., 1998;
Luo et al. 2007).
Tannins are synthesised starting from leucoanthocyanindins and anthocyanidins. The
trans flavan-3-ols (catechins) are formed from the reduction of leucoanthocyanidins by the
leucoanthocyanidin reductase (LAR), while the cis isomers (epicatechins) are synthesised
from the anthocyanidins by the anthocyanidin reductase (ANR). (Shubert et al., 2003; Xie
et al., 2003; Tanner et al., 2003; Dixon et al., 2005). Polymerisation of flavan-3-ols and the
synthesis of proanthocyanidin are still to be clarified. Some evidence in Arabidopsis
thaliana suggest the enzymatic activity of a polymerase (TT10), but they are not
conclusive, thus, other possible mechanisms, such as non enzymatic polymerisation and
acid catalysis, canʼt yet be excluded (He et al. 2008; Kleindt et al., 2010; Zhao et al.,
2010).
30
Flavonoid regulation and transport in plants
The regulatory genes of the flavonoid pathway
Flavonoids synthesis is tissue, organ and time specific. There is a wide range of
colour patterns in several flowers, fruits and seeds. In grape vine, flavonoid composition
changes in different parts of the berries (pulp, skin, seeds) and in different physiological
stages(fruit set, veraison, ripeness), for example: the structure of tannins is different in the
seeds and in the skins; the synthesis of anthocyanins starts at veraison while other
flavonoids are synthesised earlier. Thus, the flavonoid pathway must have a very refined
spatial and temporal regulation.
Numerous studies show that most of the regulation of this pathway is due to
coordinated transcriptional control of the structural genes (Mol et al., 1998; Winkel-Shirley,
2001; Koes et al., 2005; Lepiniec 2006; Dixon and Pasinetti, 2001). Also post-
transcriptional control was reported for some genes (Pairoba and Walbot, 2003; Johansen
and Wilson, 2008). Several regulators controlling the flavonoid pathway were identified for
the first time mostly in Arabidopsis thaliana, Zea mays, and Petunia hybrida mutants.
In all species the regulation of the flavonoid pathway involves three kinds of
transcription factors: MYB, basic helix-loop-helix (bHLH or MYC) and WDR (or WD40)
repeat proteins. The interaction among these factor indicates that they are part of a
transcription activation pathway that acts directly on the structural genes, without
intermediate regulators (Koes et al., 2005; He et al., 2008).
In maize, the ZmC1 and the ZmR (and ZmB) belong to the MYB and bHLH
transcription factor families respectively. Each family has several paralog genes and their
different expression patterns are able to explain the distribution of anthocyanin-related
pigmentation in maize. The ectopic expression of ZmC1 and ZmB triggers anthocyanin
31

synthesis in otherwise colourless tissues (Mol et al., 1998). ZmC1 binds directly to the
promoter region of the structural gene, but this is not sufficient to trigger transcription. The
presence of its partner ZmR is essential. bHLH proteins donʼt seem to bind DNA, so the
transcription activation probably follows different mechanisms (Koes et al. 2005).
WDR are highly conserved regulators and they are found also in algae, fungi and
animals (even human) that do not synthesise flavonoids (Koes et al., 2005). Although they
play a central role in numerous biological pathways, how exactly these proteins actually
regulate other genes from a molecular point of view is not completely clear. No WDR
domain has been reported to have intrinsic enzymatic activity. Recent interactome studies
suggest that they work as scaffolds interacting with other protein, peptides and nucleic
acid, using a different interaction modes (Stirnimann et al., 2010).
Simple models have been proposed for the activation of the flavonoid pathwayʼs
structural genes on the basis of this knowledge. These models involve the formation of a
MYB-bHLH-WDR (MBW) complex activating the transcription of the target gene: e.g., in
Arabidopsis TT2, TT8 and TTG1 (a MYB, a bHLH and a WDR factor respectively) form a
complex that directly activates BAN (ANR) transcription (Koes et al., 2005; He et al.,
2008). WDR genes are virtually ubiquitous, while MYBs and bHLHs are expressed only in
the tissues where flavonoids are synthesised. WDR domains are so highly conserved
during evolution, that some of these regulators are actually older than the pathway they
regulate. High-throughput studies show that they are probably involved in more interaction
pair s than any other domain (Stirnimann et al., 2010).
Possibly, a given WDR protein may be involved in the regulation of a number of
different pathways: for example, in A. thaliana , the WDR factor TTG1 activating the
flavonoid biosynthesis is also involved in the formation of hair. bHLH factors are also
pleitropic, even though to a lesser extent. Many studies have shown that bHLH are
32
involved in several processes that are apparently not so closely related to the flavonoid
pathway, In Petunia, PhAN1 (a bHLH) is involved, in the acidification of the vacuole in
petals, in the formation of the seed coat as well as in the pigmentation. In contrast, MYB
factors show more specificity to a single pathway or a single gene. Nevertheless, many
studies show that at least some of them have have a dual function: they directly activate
the structural genes, but they also activate the genes encoding for they bHLH partner.
(Koes et al., 2005; Stirnimann et al., 2010).
It is likely that WDR, bHLH and their complexes, that co-regulate numerous
processes, interact with specific MYB proteins to trigger specific branches of a pathway.
However, also the competition of alternative enzymes for a common substrate may play a
role, for example the inactivation of ANR leads to a higher anthocyanin synthesis (Xie et
al., 2003).
Furthermore, other transcription factors are associated with the regulation of the
flavonoid pathway. The gene families involved include WRKY domains, MADS box and
TFIIIA-like proteins (WIP). WRKY factors act downstream of the WDR protein. WRKY
seem to be directly regulated by MYB transcription factors. MADS gene directly control the
expression of BAN, while WIP proteins seem involved in proanthocyanindin polymerisation
(Koes et al., 2005; He et al., 2008).
Despite the identification of a great number of regulators, the question of the
“regulation of regulators” still needs for a comprehensive answer.
The flavonoid transport network
The flavonoid biosynthetic enzymes are found in the cytosol. Immunolocalization
experiments suggest that they are localised around the endoplasmic reticulum associated
cytochrome P450 proteins and that they are possibly organised as multi-enzyme
33

complexes. (Koes et al., 2005; Zhao and Dixon, 2010). Some flavonoid biosynthetic
enzymes have also been found in the tonoplast, in the chloroplast, in the cell wall and in
the nucleus (Saslowsky et al., 2005). Plastidial localisation of CHS has been reported also
in grapevine (Tian et al., 2008).
Anthocyanins and proanthocyanidins are found mostly in the vacuole. The pH
conditions of the vacuole, and the presence of co-pigments (flavonols, metals) allows the
formation of colour in the cells of the fruit skins or of flower petals. Flavonoids are found
even in the plastids, in the tonoplast, in the cell wall and the nucleus. (Hernandez et al,
2009; Zhao et al., 2010).
Thus, a complex transport system is required to store flavonoids into the right cell
compartment. The association of the multi-enzyme complexes to the endoplasmic
reticulum may facilitate flavonoid transport, while the co-localisation of the enzymes in
different parts of the cell could help meeting specific biosynthetic requirements in particular
conditions. (Koes et al., 2005; Zhao and Dixon, 2010).
Two different kinds of flavonoid transport mechanisms have been proposed, one
mediated by membrane vesicles formed from the endoplasmic reticulum and the Golgi
apparatus, the other mediated by transporters (including GSTs, ABCs and MATEs). It is
likely that both these mechanisms play a role inside the cellʼs flavonoid transport network.
Anthocyanoplasts (ACP) are cytoplasmic membrane-bound vecicles containing
anthocyanins and they are involved in the synthesis and transport of these flavonoids.
ACPs are exclusively found in grapevine cells and in red radish seedlings protoplasts
(Braidot et al., 2008; Zhao and Dixon 2010) and they originate from the fusion of a large
number of small vesicles. Inside the vacuole there are similar structures called
anthocyanic vacuolar inclusions (AVI). AVIs have been found in many species. AVIs are
anthocianic complexes containing proteins but, in contrast to anthocyanoplasts, they donʼt 34
have a proper membrane AVIs. It is likely that ACPs transport anthocyanins to vacuole,
while the AVIs represent the storage unit within the vacuole. However direct evidence
supporting vesicle transport are still to be found (Braidot et al., 2008; Zhao and Dixon
2010).
Gluthathione-S-transferases (GST) seem somehow involved in the flavonoid
transport network as well, but their exact role is not very clear. Infact, no natural occurring
gluthation-anthocyanin conjugates have yet been reported, but the GST protein itself can
bind the anthocyanins. Many studies support the hypothesis that it GST is a transport
related protein inside the flavonoid-protein complexes (Koes et al., 2005; He et al., 2008;
Kleindt et al., 2010; Zhao and Dixon, 2010).
ATP binding cassettes (ABC) are a broad, ubiquitous family of secondary metabolite
transporters. ABCs draw energy from ATP hydrolysis to transport metabolites across
membranes. There are indications of the involvement of ABCs also in flavonoid transport
in maize, barley and soybean but, to date, there is very little knowledge about their role
(Zhao and Dixon, 2010; Dixon and Passinetti, 2010).
Multi drug and toxic compound extrusion (MATE) proteins are a widespread, large
family of transporters using electrochemical gradient to transport secondary metabolites,
and they have been associated in anthocyanin and proanthocyanidin transport in many
species, including grapevine (He et al., 2008; Gomez et al., 2009). Many flavonoid
transporter show a strong substrate specificity (Zhao and Dixon, 2010). MATE transporters
need proton pumps to power transport, so they depend on the activity of different sorts of
H+ATPases mantaining the H+ gradient across the tonoplast. A mutation of the pump may
cause differences in the vacuole pH and in anthocyanin transport, resulting ultimately in a
colour shift (Zhao and Dixon, 2010).
35

The transport of flavonoids into the vacuole is not one-way only. Experiments in
legumes cell cultures showed the efflux of flavonoids from the vacuole to other parts of the
cell. It has also been proposed the involvement of the transport of flavonoids from the
vacuole to the apoplast (Buer 2010; Dixon and Pasinetti, 2010; Zhao and Dixon, 2010).
Many studies are needed to give a full understanding of the flavonoid transport
network both at cellular and long distance level.
The regulation of the flavonoid pathway in the grapevine
Structural Genes
Most of the flavonoid synthesis regulation in grape vine occurs at the transcriptional
level (Sparvoli et al., 1994; Boss et al., 1996). Furthermore, the transcriptional patterns of
structural genes explain most of the inter-variety differential phenotypic expression in the
berry colour (Kobayashi et al., 2001) and hue (Castellarin et Di Gaspero, 2007).
In 1994 PAL, CHS, CHI, F3H, DFR, LDOX, UFGT and StSy were first isolated and
characterised in Vitis vinifera (Sparvoli et al., 1994).
Several expression studies in grape flower and berries showed the expression of all
genes, except for UFGT, follow the same pattern: a peak in the first 4 weeks after
flowering, very low expression for about 6-8 weeks, another peak at veraison and stable
expression up to harvest. UFGT was never expressed until veraison, in accordance with
the appearance of anthocyanins (Boss et al, 1996). The same pattern is also shown in
white varieties, but UFGT is expressed in pigmented skin variety only (Kobayashi et al.,
2001; Ageorges et al., 2006; Castellarin and Di Gaspero, 2007). This suggests that all the
early genes of the pathway participate in the synthesis of all flavonoids, while UFGT is the
key for anthocyanin synthesis.
36

Goto-Yamamoto and co-workers isolated and characterised in 2002 CHS1, CHS2
and CHS3. RT-PCR showed these isogenes co-expressed with other genes of the
pathway, including UFGT. Later Q-PCR experiments confirmed that CHS1, CHS2 and
CH3, as well as CHI1, CHI2, F3H1, F3H2, DFR and LDOX, followed the same pattern as
UFGT in colouring Cabernet Sauvignon grape berry skins, showing a peak around 2
weeks post veraison. CHS2, CHS3, CH1 and F3H2 showed to be the predominant
isogenes in grapes among their family (Jeong et al, 2004).
F3ʻH and F3ʻ5ʻH were first isolated in grapevine in 2006 (Jeong et al., 2006; Bogs et
al., 2006). F3ʼH and F3ʼ5ʼH compete for the hydroxylation of the flavonoidsʼ B-ring. Recent
studies showed that F3ʼH is more expressed than F3ʼ5ʼH in the flower, the stem, the
tendril in the seed and in young berries. This is consistent with quercetin/myricetin and the
procyanidin/prodelphinidin ratio in these tissues. In ripening berries, F3ʼH is highly
expressed in both white and red cultivars before and after veraison. To the opposite,
F3ʼ5ʼH is activated at veraison in the cultivars that synthesise more trisubstituted
anthocyanins (Jeong et al., 2006;Bogs et al., 2006;Castellarin and Di Gaspero, 2007).
These findings suggest a strong transcriptional control in the determination of the B-ring
hydroxylation degree of anthocyanins, flavonols and proanthocyanidins. However, young
leaves showed a higher proportion of disubstituted anthocyanins despite a higher
expression of F3ʼ5ʼH (Jeong et al., 2006). Furthermore, other studies reported higher
accumulation of quercetin despite higher expression of F3ʼ5ʼH (Fujita et al.,2006). Hence,
the role of F3ʼH and F3ʼ5ʼH transcription in the determination of the composition of
flavonoids is not completely clear. Post-transcriptional regulation mechanisms or different
enzyme specificity might be involved as well.
High-throughput transcriptomic and gene expression studies highlighted the co-
expression of a OMT with the flavonoid biosynthetic genes (Ageorges et al., 2006;
37
Castellarin and Di Gaspero, 2007; Pilati et al., 2007; Cutanda-Perez et al., 2009;
Hugueney et al., 2009). A cation dependent anthocyanin-OMT was fully characterised in
grapevine in 2009. In vitro experiments showed that OMT (or AOMT) accepts cyanidin-3-
O-glucoside as well as delphinidin-3-O-glucoside and that it is able to yield all kinds of
methylated anthocyanin found in grapevine (malvidinin-3-O-glucoside, penonidin-3-O-
glucoside and petuidin-3-O-glucoside); OMT is active in vitro also with the aglycone
anthocyanidins and with flavonols, but not with flavan-3-ols. Tobacco transformation
experiments confirmed the ability to produce methylated anthocyanin (Hugueney et al.,
2009). The expression patterns confirm that OMT regulates the B-ring methoxylation
degree of anthocyanins in all cultivars. Cultivars with higher levels of methylated
anthocyanins express more OMT. However, its role in the methoxylation of flavonols is still
unclear (Castellarin and Di Gaspero, 2007; Hugueney et al., 2009).
The ratio between the expression of F3ʼ5ʼH/F3ʼH and of OMT/UFGT is explains most
of the phenotypic variability in berry colour among grape cultivars (Castellarin and Di
Gaspero, 2007).
Based on the expression pattern shown in many studies, it is possible to distinguish
between two groups of genes. Early flavonoid synthesis genes (EGs) are those showing
two peaks during berry development: the first one around fruit set and the second one
around veraison; late flavonoid synthesis genes (LGs) show only one peak at veraison and
they are not detected in the early stages of berry development. CHS, F3H, F3ʼH, F3ʼ5ʼH,
DFR and LDOX are EGs, while UFGT and OMT are LGs. However, some isoforms of EGs
behave as LGs, showing a differential regulation.
The flavan-3-ol genes ANR and LAR were isolated and characterised in 2005 (Bogs
et al., 2005; Fujita et al., 2005). Their expression is temporal and tissue specific. Similarly
to the EGs, they show a peak around fruit set. At veraison they have a modest activation.
38
This is consistent with the flavan-3-ol, proanthocyanidin and tannin accumulation kinetics.
Furthermore, the expression of LAR1 and LAR2 in the grape berry skins follow almost the
same pattern. The expression of LAR1 in the seeds doesnʼt change, but LAR2 is
completely different, showing a peak at veraison (Bogs et al., 2005; Fujita et al., 2005;
Fujita et al., 2007; Gagné et al., 2009; Lacampagne et al, 2010). This indicates that the
regulation system occurring in the seeds is different from that occurring in the berry skin.
Further studies are needed to elucidate the regulation of flavan-3-ol synthesis.
In 2003 and 2006, respectively two and five grapevine FLSs were cloned and
characterised. FLSs are expressed in several tissues and organs. FLS1(VvFLS2) showed
a constitutive, but significantly low, expression pattern. FLS2, FLS3, and FLS5 transcripts
were found in small and medium leaves, in flowers and buds, while FLS4 was the most
ubiquitous as it was detected in all leaves. In developing grape berries, FLS4 (VvFLS1)
and FLS5 have a “EG like” expression pattern, showing one peak around flowering and
one around veraison. This consistently with flavonol accumulation, while FLS2 was
detected only around flowering (Downey et al., 2003; Fujita et al., 2006).
Transcription factors
In grapevine the transcript activation of the flavonoid pathway is very likely to involve
an interaction of MYB, bHLH (MYC) and WDR-like factors, as described in other plant
species.
MYB factors
In grapes MYB transcription factors were first found and characterised in 2002 in
Kyoho, a tetraploid Vitis labruscana (Vitis labrusca X Vitis vinifera) variety. The authors
demonstrated that VlMYBA1 controls the expression of UFGT in Kyoho grapes
(Kobayashy et al., 2002). VlMYBA1 is a homolog of the VvMYBA1 gene, controlling UFGT
in Vitis vinifera. The absence of anthocyanins in white grape varieties is linked to the lack
39
of VvMYBA1 and UFGT transcrips in these cultivars. This is due to the loss of function of
VvMYBA1, caused by the insertion of a Gret1 retrotransposon in the promoter region of
VvMYBA1 (Kobayashi et al., 2004; Kobayashi et al., 2005; Lijavetzky et al., 2006). The
deletion of the functional VvMYBA1 allele causes the loss of pigmentation in the berry, this
caused the appearance of the new white variety Pinot Blanc from Pinot Noir (Yakushiji et
al, 2006). Bronze and white cabernet sauvignon sports have a similar deletion of functional
VvMYBA1 alleles (Walker et al, 2006). Furthermore, it has been shown that the generation
of red sports from white cultivars is associated with with a mutational function recovery of
VvMYBA1 (Azuma et al., 2009). Red grapes accumulate anthocyanin in the skin, and
VvMYBA1 shows specificity for this tissue. Some varieties (teinturier) accumulate
anthocyanin also in the pulp. Recent studies suggest that this is associated with the loss of
tissue specificity of VvMYBA1 (Jeong et al., 2006b). The VvMYBA1 Gret1 mutation is
widespread in white grape cultivars, while pigmented cultivars have at least one functional
copy of the gene. The allelic variation of VvMYBA1 is strongly associated with the
different fruit colour phenotype found in Vitis viniferaʼs cultivars (This et al., 2007; Azuma et
al., 2008). It has recently demonstrated that VvMYBA1-2 not only UFGT, but also GST and
AnthoMATE transporters (Cutanda-Perez et al., 2009).
Various MYB-factors are involved in the activation of the other structural genes of the
flavonoid pathway. VvMYB5a and VvMYB5b (Deluc et al., 2006; Deluc et al., 2008) are
involved in the expression of other genes of the flavonoid pathway such as CHS, CHI,
F3H, DFR, LDOX, LAR and ANR, but not to UFGT or FLS. For this reason they are
regarded as putative general regulator of the pathway.
VvMYBPA1 and VvMYBPA2 are putative regulators of proanthocyanidin biosynstesis.
They are particularly active on LAR and ANR, the key enzymes leading to the flavan-3-ols,
but also on other structural genes of the flavonoid pathway, but not UFGT or FLS.
40
VvMYBPA1 is more expressed in the seed, while VvMYBPA2 is more expressed in the
berry skin, indicating a tissue specific activity of these factors (Bogs et al., 2007; Terrier et
al., 2009).
VvMYB12 and VvMYBF1 are MYB-factors putatively associated to the expression of
FLS in grapevine reported in 2008 and 2009 (Matus et al., 2008; Czemmel et al., 2009).
Their sequence is almost identical and they are homologous to AtMYB12. The expression
of these genes is correlated to the accumulation of flavonols in the berry. Czemmel and
coworkers showed that it lacks of a bHLH binding site, so it is probably independent from a
bHLH factor, similarly to other FLS regulators in Arabidopsis and maize.
These studies indicate a very complex regulation system, but it seems that there are
some regulators involved in the general activation of the genes of the pathway, such as the
MYB5s, while other genes activate specific branches of the pathway, leading to the
synthesis of the target metabolites. With the knowledge available to date, the regulation
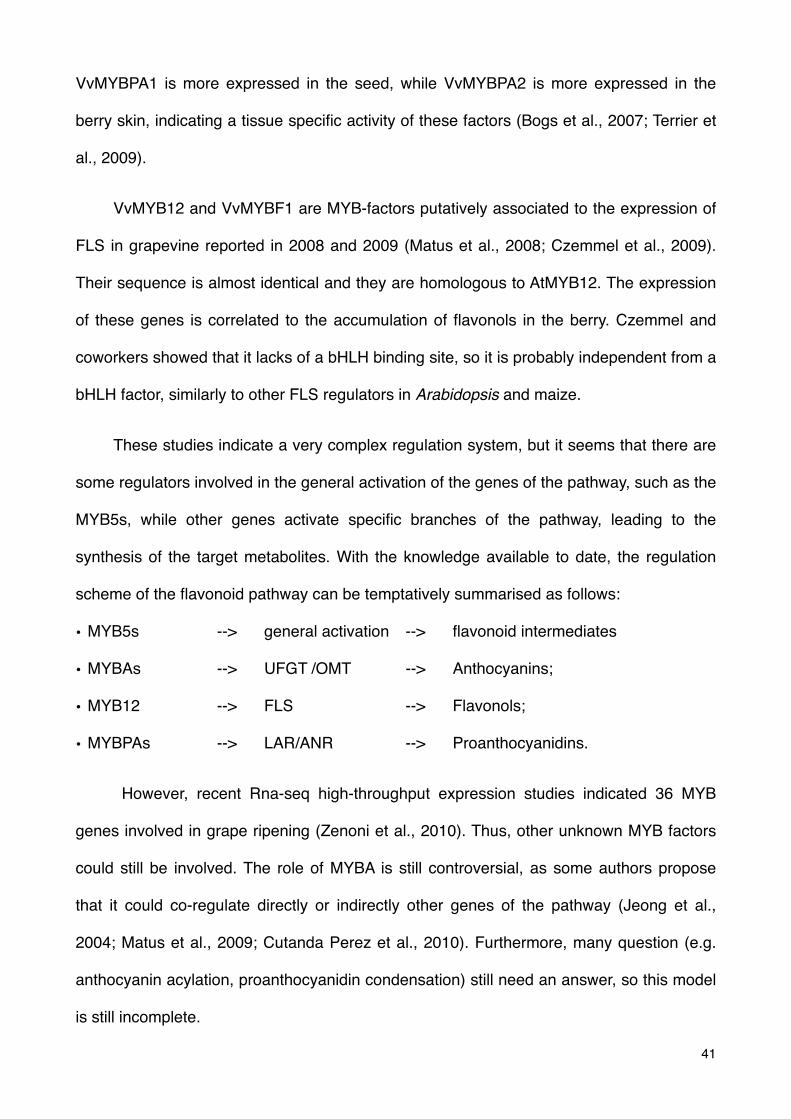
scheme of the flavonoid pathway can be temptatively summarised as follows:
• MYB5s --> general activation --> flavonoid intermediates
• MYBAs --> UFGT /OMT --> Anthocyanins;
• MYB12 --> FLS --> Flavonols;
• MYBPAs --> LAR/ANR --> Proanthocyanidins.
However, recent Rna-seq high-throughput expression studies indicated 36 MYB
genes involved in grape ripening (Zenoni et al., 2010). Thus, other unknown MYB factors
could still be involved. The role of MYBA is still controversial, as some authors propose
that it could co-regulate directly or indirectly other genes of the pathway (Jeong et al.,
2004; Matus et al., 2009; Cutanda Perez et al., 2010). Furthermore, many question (e.g.
anthocyanin acylation, proanthocyanidin condensation) still need an answer, so this model
is still incomplete.
41

bHLH and WDR factors
bHLH and WDR factors related to the flavonoid pathway were found in grapevine
only in 2010. The first studies suggest that some of these genes (VvMYC1, VvMYCA1,
VvWDR1) are implied in the transcriptional cascade that leads to flavonoid synthesis, and
that they are associated to MYBAs (Hicri et al., 2010; Matus et al., 2010). However, the
complex MYB-bHLH-WDR interactions regulating the flavonoid pathway in grapevine are
still far from being understood.
Flavonoid transport in the grapevine
In grape berries anthocyanins are stored in the vacuole of the cells of the first
external layer of the hypoderm. The other flavonoids are not only present in the vacuole,
but also in the tonoplast and in the cell wall of berries and seeds.
Vesicle transport is likely to be active as anthocyanins were found in ACPs and AVIs,
but this mechanism is still controversial (Braidot et al., 2008; Zhao and Dixon 2010).
High throughput and ectopic expression studies showed that a grapevine MATE-type
transporters (Antho-MATE) are co-expressed with the transcription factor VvMYBA1-2
(Ageorges et al., 2006) and VvMYBPA2 (Terrier et al., 2009) and therefore whit
anthocyanin ad proanthocyanidin synthesis respectively. Recently two antho-MATE
transporters (AM1 and AM3) were isolated and characterised in the grapevine (Gomez et
al., 2009). The authors demonstrated that these MATE proteins are acylation-dependent
anthocyanin transporters in grape berries. Interestingly, AM1 and AM3 seem to under the
control of different regulators. A GST was associated with fruit pigmentation in grapevine
for the first time in 2006 (Ageorges et al., 2006). Later, it was demonstrated that VvGST1
and VvGST4 are involved in anthocyanin transport into the vacuole (Conn et al., 2008).
VvGST4 expression pattern shows a particularly interesting expression peak at veraison.
42
Furthermore, it has been proposed that a homolog of the mammalian bilitranslocase (BTL)
may be involved in flavonoid translocation in the grapevine. Recent studies suggest that a
BLT-like translocator could be responsible for anthocyanin accumulation in the skin and for
intermediate metabolite translocation during grape berry development (Braidot et al.,
2008). Despite the number of transporters directly or indirectly associated to the flavonoid
pathway, little is known about the flavonoid transport network in grapevine, and more
studies are required to fully elucidate this system.
43

Light and flavonoids
Factors influencing the flavonoid pathway.
Flavonoid synthesis, transport and accumulation are strongly influenced by a number
of endogenous (e.g. physiological state of the plant, plant vigour, sink/source balance,
plant hormones) and environmental factors (e.g. water supply, soil fertility, viticultural
practices, temperature, sunlight, biotic adversities). Abscissic acid, auxins and ethylen
increase flavonoid synthesis, while giberellic acid inibites it (Jeong et al., 2004; Braidot et
al., 2008; Lacampagne et al., 2009). Wounding and pathogenesis have been identified as
negative factors (Braidot et al., 2008). Moderate water stress consistently enhances
anthocyanin synthesis (Castellarin et al., 2007) High vine vigour (and, consequently, all
farming practices leading to high vigour) has been identified as responsible for a lower
flavonoid content in the berries (Cortell et al., 2007). This may have a number of
physiological reasons (i.e. source\sink balance), but it also may be connected to a worse
exposure of grapes to sunlight due to the excessive vegetation. The anthocyanin profiling
is strongly cultivar dependent and it is successfully used for chemotaxonomy studies
(Mattivi et al., 2006; Ortega Regules, 2006), however cluster microclimate influences the
relative proportion of anthocyanins. Extreme high and low temperatures have a negative
effect on anthocyanin synthesis (Rustioni et al., 2006), (Mori et al, 2007). Light is
generally recognised as a positive factor for flavonoid synthesis, but in spite of many
studies, its role is not fully elucidated.
The role of light and shading.
Light is the energy supply for plants. This alone makes it one of the most important
environmental factor for plant life. Plants are able to sense several parameters (fluence,
44
wavelength, direction, duration) of ambient light. Light is a key factor to a great number of
physiological processes in plants, including seed germination, chloroplast movement,
flower induction and circadian rhythms. Four families of photoreceptors are known in
plants: phytochromes, cryptochromes, phototropines and presumably some kind of UV-
photoreceptors. The light signal perceived by the photoreceptors is mediated by a
transcriptional regulatory network that up- and down-regulates specific downstream genes,
activating or repressing entire metabolic pathways in response. The role of light in the
activation of the main metabolic pathways in plants was reviewed by Jiao et al. in 2007. In
higher plants, anthocyanin synthesis seems to be regulated by the phytochrome A and by
the UV-A and UV-B photoreceptors (Gollop et al., 2002)
Light have several roles in in the photoprotection, UV- screening and antioxidant
activity in plants (Hernandez et al., 2008; Agati and Tattini, 2010). In some species (e.g.
apple and petunia) light exclusion prevents fruits and flowers from accumulating red
pigments, but in the grapevine light is not essential for flavonoid biosynthesis, although it is
generally recognised as a positive factor (Downey et al., 2004). UV-A and UV-B radiation
influence many processes connected to plant development, morphology and physiology.
Synthesis of flavonoids is most effective plant response to UV stress, so it is not surprising
that the expression patterns of several genes of the flavonoid pathway showed a positive
correlation with UV radiation exposure (Guo et al., 2008).
In the past, many studies reported a higher quantity of anthocyanins and other
flavonoids in bunches exposed to higher light levels. However, some studies reported no
changes of anthocyanin levels of shaded and exposed bunches, and in some cases even
the opposite effect. Possible explanation for these contradictory effects are connected not
only to the cultivar, to the location and to the season, but also on the micro-climatic effect
of shading treatments. In particular, the negative effect of high temperature may have not
45

been taken into account accurately enough. The use of appropriate shading screens
(Downey et al., 2004; Rustioni et al., 2006) allow to minimise the effect of temperature,
allowing for a better understanding of the role of light.
The effect of light on anthocyanins
Sunlight exposition significantly increased the total anthocyanin content in Merlot
grapes (Spayd et al., 2002; Pereira et al., 2006). However, low light incidence alone
showed no significant effect on the total anthocyanin content of Merlot berries (Tarara et
al., 2008). Regardless the effect on the absolute concentration, shading caused a
proportional increase of acylated forms (Pereira et al., 2006; Tarara et al., 2008). The
influence of light on the anthocyanin profiling of Merlot is controversial: Pereira et al.
(2006) reported the relative increase of cyanidin-3-glucoside and peonidin-3-glucoside in
the shaded bunches, while Tarara et al., (2008) reported the opposite effect.
The anthocyanin content in in Pinot Noir was not significantly affected by sun
exposure (Price et al., 1995; Cortell and Kennedy 2006). Nevertheless, shading caused a
proportional increase of peonidin-3-glucoside in the anthocyanin profiling (Cortell and
Kennedy, 2006).
In Cabernet Sauvingon and Grenache grapes, cluster exposure to sunlight showed
two opposite effects: on the northern side of the canopy total anthocyanins and phenolics
increased, on the southern side of the of the canopy they were reduced. (Bergqvist et al.,
2001). In other works, shading reduced Cabernet Sauvignon anthocyanin content (Jeong
et al., 2004; Matus et al., 2009). The anthocyanin profiling of Cabernet Sauvingnon was
also affected by light (Matus et al., 2009).
In Shiraz grapes grown under artificial conditions, anthocyanin accumulation was
faster in exposed berries at the beginning of ripening. However, the anthocyanin content at
46
harvest were the same in both exposed and shaded berries. Conversely, shaded berries
accumulated more anthocyanins under open field conditions. Shaded berries accumulated
also a larger proportion of malvidin-3-glucoside (Haselgrove et al, 2000).
In another experiment, cluster shading in Shiraz grapes caused no changes (in two
seasons) or a a reduction in total anthocyanin (in one season). However, the authors
highlighted a change in the anthocyanin profiling in all years: shading resulted in a
decrease of delphinidin-based anthocyanins both on a relative and absolute basis,
(Downey et al., 2004). Accordingly, cluster shading in Shiraz grape caused no changes in
Shiraz grape berries total anthocyanin content, but the combined proportion of cyanidin-3-
glucoside and peonidin-3-glucoside increased from 18% in the control to 27% in the
shaded grapes (Ristic et al., 2007).
Cluster shading in Nebbiolo caused a lower accumulation of anthocyanins in the
early stages of berry ripening, while the concentration at harvest was the same of control
grapes. However, there was a shift in the anthocyanin composition, as the proportion of
methoxylated anthocyanins (malvidin particularly) was higher in exposed bunches
(Rustioni et al., 2006).
UV radiation showed a positive effect on anthocyanin accumulation in Gros Colman
grapes (Kataoka et al., 2003), while it showed no effect in Merlot, Cabernet Sauvignon and
Grenache grapes (Bergqvist et al., 2001; Spayd et al., 2002).
Many studies investigated the effect of bunch exposure on anthocyanin accumulation
in grapes, but the results are sometimes in contrast. The role of light may be difficult to
interpret because of the interference of temperature. The positive effect of cluster
exposure on total anthocyanin accumulation is evident when temperature is optimal for
synthesis and light is the only limiting factor. In warm weather, the positive effect of light
exposure can be contrasted by the high temperature reached during the day, hence bunch 47
exposure to sunlight show no or, in some cases, negative effects. Taken together, these
studies suggest that light has a larger effect slowing down or delaying anthocyanin
synthesis close to veraison rather than towards end of ripening, as the shaded and
exposed bunches often reach similar anthocyanin levels at full maturity. These findings
also indicate that light has an effect on the anthocyanin profiling, most of the times causing
a shift in the proportion of the disubstituted and trisubstituted anthocyanins and in the ratio
of acylated/non acylated anthocyanins.
The effect of light on flavonols
The role of light on flavonol synthesis in grape berries seems well established and it
is consistent with the UV-protection function exerted by these compounds.
Flavonols showed high concentration in exposed Pinot Noir berry skins (Price et al.,
1995; Cortell and Kennedy, 2006). Merlot berries exposed to sunlight showed up to 10 fold
more flavonols compared to shaded berries. (Spayd et al., 2002; Pereira et al., 2006;
Tarara et al., 2008). Cluster shading caused a significant reduction in the synthesis of
flavonols in Shiraz (Haselgrove et al., 2000; Downey et al., 2004; Ristic et al., 2007) and
Cabernet Sauvignon grapes (Matus et al., 2009). UV radiation also had a positive effect on
flavonoid accumulation (Spayd et al., 2002). Moreover, sunlight exposure specifically
increased the quantity of quercetin-glucoside in Merlot grapes, while the kaempferol-
glucoside remained unchanged. However, the authors did not detect the levels of
myricetin-glucoside (Tarara et al., 2008).
Taken together, these results point out that light is the most important factor
determining the levels of flavonols in grape berries.
48
The effect of light on tannins
Cluster shading in Shiraz grapes caused a reduction of condensed tannins in the
skins, while no effect was observed in the seeds. Furthermore, a significant reduction in
the proportion of epicatechin based flavan-3-ols was observed in shaded berries (Downey
et al., 2004). In 2007, cluster shading caused Shiraz grapes to accumulate more tannins in
the seeds and less tannins in the skins compared to control (Ristic et al., 2007).
Accordingly, cluster shading in Pinot Noir reduced the accumulation of skin tannins,
but in the seeds differences were very small (Cortell and Kennedy, 2006).
The accumulation pattern in Cabernet Sauvignon is very similar: shading caused a
lower accumulation of flavan-3-ols during berry development, however the differences
were smaller in both in the berry skin and in the seeds at harvest (Fujita et al., 2007).
In Shiraz and Pinot Noir, shading caused a shift in the flavan-3-ol composition. The
proportion of the cyanidin-based (catechin and epicatechin) sub-units was reduced by
shading Conversely, the proportion of the delphinidin-based (gallocatechin and
epicatechin) sub-units was increased (Downey et al., 2004; Cortell and Kennedy, 2006).
The shift in the flavan-3-ol composition resembles the anthocyanin profiling shift reported
for some cultivars.
The effect of light on the flavonoid pathwayʼs genes transcription
The effect of light on the transcription of the genes of the flavonoid pathway in the
grapevine was first described by Sparvoli et al., in 1994. Anthocyanin synthesis in cultivar
Lambrusco f.f. seedlings was triggered by 12 hours of continuous light. Six downstream
structural genes of the flavonoid pathway showed to be up-regulated by light: CHS, CHI,
F3H, DFR, LDOX and UFGT. The same genes where expressed at a very low level in the
49
seedlings grown in the dark. White light induces the expression of DFR in Gamay red cell
suspension cultures (Gollop et al., 2002).
In recent years some experiments attempted to elucidate the effect of shading on the
expression of the genes of the flavonoid pathway under open field conditions. CHS, CHI,
F3H, DFR, LDOX and UFGT were down-regulated in Cabernet Sauvignon shaded berries
(Jeong et al., 2004). Similarly, CHS2, LDOX, OMT and UFGT in Cabernet Sauvignon
berries were down-regulated by the shading treatment (Matus et al, 2009). These findings
seem to confirm the previous studies. However, Shading showed little or no effect on the
transcription of UFGT in Shiraz berry skins (Downey et al., 2004).
VvFLS1 is significantly more expressed in exposed Shiraz berry skins (Downey et al.,
2004). FLS4 (corresponding to VvFLS1) is more expressed in sunlight exposed Cabernet
Sauvignon and Merlot ripening grapes (Fujita et al., 2006; Matus et al., 2009). These
results are in accordance with the higher accumulation of flavonols in exposed berries
reported in several works. Surprisingly, the expression pattern of FLS5 in Merlot and
Cabernet Sauvignon seemed to be light-independent (Fujita et al., 2006), however the
enzymatic activity of the FLS5 protein still needs to be studied, in order to asses its role in
flavonol synthesis.
Shading affects the transcription of ANR and LAR to a lesser extent than FLS4 (Fujita
et al, 2007). During the early stages of development the expression of VvANR in shaded
berry skins was down-regulated, but cluster exposure showed no significant effect in the
later stages. VvLAR2 followed a similar pattern in the skins, while the expression of
VvLAR1 was unaffected by the shading treatment. In the seeds, both exposed and shaded
VvANR and VvLAR1 showed little or no difference during the whole berry development,
while VvLAR2 was surprisingly more expressed in the seeds of shaded berries (Fujita et
al., 2007). The differential control of light on the genes of this branch of the pathway
50

seems in accordance with some of the shifts in the flavan-3-ol composition caused by
shading.
In Cabernet Sauvignon, MYB12 was dramatically down-regulated by the shading
treatment, the expression of MYBA1 and MYB5a was also reduced, even though to a
lesser extent, while MYB5b and MYBPA was apparently unaffected (Matus et al., 2009).
Similarly, VvMYBA1 was down-regulated also in a previous experiment (Jeong et al.,
2004).
To date, information about the effect of shading on the key enzymes of the flavonoid
pathway is far from being complete. The elucidation of the effect of light on the regulation
network of the flavonoid pathway is only at the beginning, and it needs more knowledge to
be better understood. F3ʼH and F3ʼ5ʼH are key enzymes determining the composition of
the anthocyanin and flavan-3-ol profiling, and the shifts caused by shading suggest that
these genes may also be affected, but to date there is no data about the effect of light on
the expression of F3ʼH and F3ʼ5ʼH. Furthermore, to our knowledge, no data is available yet
on the effect of light on the expression of the genes encoding for anthocyanin transport-
related proteins. In this work the effect of cluster shading on the expression pattern of
several structural genes, transcription factors and transporters of the flavonoid pathway is
investigated.
51
Aglianico
Origin and main characteristics
Aglianico is a red grape cultivar widespread in Southern Italy renowned for the quality
of its wines. Aglianico is grown in several Italian Regions, but it is mainly cultivated in
Campania and Basilicata, and particularly in the provinces of Benevento, Avellino and
Potenza. Aglianico has several synonyms: Aglianica, Aglianichella, Aglianico del Vulture,
Aglianico Femminile, Aglianico Mascolino, Aglianico Nero, Aglianico Tringarulo, Aglianico
Zerpoluso, Aglianicuccia, Agliano, Agnanico, Agnanico di Castellaneta, Cascavoglia,
Cerasole, Ellanico, Ellenico, Fresella, Gagliano, Ghiandara, Ghianna, Ghiannara, Glianica,
Gnanico, Olivella di San Cosmo, Ruopolo, Sprierna, Tringarulo, Uva dei Cani, Uva di
Castellaneta.
The origin of this variety is very ancient. The cultivation of Aglianico is Southern Italy
is traditionally is dated back to the Greek colonization. Following this hypothesis, the name
“Aglianico” could derive from the word “Hellenica” (Boselli., 2003). However, the first
written evidence of the cultivation of Aglianico dates back to the 16th century. Anyway,
Aglianico has been grown in Southern Italy for many centuries.
Aglianico is well defined from the ampelographic point of view:
• medium-small, pentagonal or orbicular, three or five lobed, dark green leaves;
• V shaped petiolar sinus and U shaped lateral sinus;
• conic or cylindric, medium size, rather compact clusters;
• medium-small, spherical, blue-black berries.
The vegetative cycle is long: around 180 days from bud burst to full maturity. Bud
burst is early while veraison and ripening are late. It is a vigourous variety and yield is
52
high. Fruit-bering shoots are produced from the 3rd or the 4th node, with one (rarely two)
clusters per shoot. Lateral shoots are scarcely fertile.
The main traditional growing areas of Aglianico are Taburno, Taurasi (in Campania)
and Vulture (in Basilicata). A recent study investigated the differences in the grape wine-
making potential among the traditional Aglianico growing areas (Simone Di Lorenzo, 2009)
Vulture vineyards showed a larger homogeneity and a lower yield: Aglianico grapes
in this area generally accumulated high sugars although keeping a good acidity. The
grapes in Vulture showed also high levels of anthocyanin and tannins.In Taburno
vineyards were rather homogeneous, but grapes were generally low in sugars and
phenolic compounds. Taurasi showed intermediate results.
The results of this work indicate that the different wine-making potential of the grapes
are mainly due to the different environmental conditions in the three areas. However, over
time, different clonal lines have been selected in the different area. So, the genetic
component may play a role in the determination of the differences in Aglianico grapes.
Flavonoid composition of Aglianico
Aglianico is rich in phenolic compounds compared to other widespread cultivars like
Cabernet Sauvignon and Merlot (Moio et al., 2004). Aglianico shows a high quantity of
extractable polyphenols (between 3,6 and 3,9 g/kg grapes), a medium-high content of
anthocyanins (between 0.7 and 0.9 g/kg grapes) and a high content of proanthocyanidins
(between 3,4 and 3,7 g/kg grapes) (Mattivi et al., 2002; La Gatta et al., 2007)
Aglianicoʼs anthocyanin profiling is mainly composed of malvidin-3-glucoside (around
60% of total anthocyanins) followed by petunidin-3-glucoside and delphinidin-3-glucoside
(between 5% and 10% each) while peonidin-3-glucoside cyanidin-3-glucoside are very low
53
(less than 5% and 1% respectively); acylated anthocyanin range between 20% and 25% of
total anthocyanins. . Trisubstituted anthocyanins are over 90% of anthocyanin glucosides,
while p-coumarate-anthocyanindins are the main acylated form (Lovino et al., 2005;
Suriano et al., 2005; Mattivi et al., 2006).
Aglianico grapes have a high content of tannins. A high proportion of extractable
proanthocyanidins (between 40 and 45%) and flavans reactive to vanillin (between 70%
and 75%) are localised in the seeds (Mattivi et al., 2002).
Aglianico has a medium content of flavonols, and myricetin and quercetin derivatives
are the main flavonol (Mattivi et al., 2006; Tamborra and Esti, 2010).
The expression of the flavonoid pathway in Aglianico
As opposed to the well-known Pinot Noir, Cabernet Sauvignon, Merlot and Shiraz
grapes, very little work has been devoted to the study of the expression of the genes of the
flavonoid pathway in this particular variety. Castellarin and Di Gaspero, in 2007, studied
the transcriptional control on grape berry pigmentation. The authors analysed the
transcript levels of F3H, UFGT, GST, F3ʼH, F3ʼ5ʼH, MYBA, MYBB, MYBC and MYBD in
several ripening grape cultivars shoving different berry pigmentation patterns, including
Aglianico. The cumulative level of transcripts of all genes were high in Aglianico, compared
to other cultivars, meaning that this pathway is active in Aglianico ripening berries. This is
consistent with the high content of flavonoids shown by this cultivar. The expression of
UFGT and other anthocyanin genes was delayed compared to all cultivars. Aglianico
showed a high F3ʼ5ʼH/F3ʼH ratio, in accordance to the abundance of trisubstituted
anthocyanins, and a medium high OMT/UFGT ratio.
54

A model for grape intra-variety variability
Aglianico is characterised by a great intra-variety variability originating from the
conscious or unconscious selection operated over the centuries by farmers in the differen
(Caputo et al., 2009). The molecular basis of grape intra-variety variability are still largely
unknown, however it is connected to the occurrence of structural and epigenetic mutation,
normally at bud level, that are fixated through vegetative propagation (Shneider, 2006).
Among several “Aglianicos”, three main biotypes were selected in the the corresponding
main cultivation areas: Taurasi (from the province of Avellino), Taburno (from the province
of Benevento) and Vulture (from the province of Potenza) (Boselli, 2003). The
monophyletic origin of these biotypes was confirmed by DNA fingerprinting (Costantini et
al., 2005). The different behaviour shown by the Aglianico biotypes is a good example of
intra-variety variability, and it is the base for the genetic improvement of this grape variety.
The differences among the biotypes regard mainly the morphology of the bunches
and the timing of veraison and ripening. In particular, from a recent ampelographic survey
of Region Campania an the University of Naples:
• Taurasi has a conic-pyramidal cluster, often with a lateral cluster. Berries are round, the
skin is blue-black and the pulp is colourless. The average weight of clusters is low, the
weight of the berries is very low. Sugar accumulation is high and titrable acidity is
medium-high.It is not very vigourous, bud fertility is discrete and yield is consistent. It
may show a moderate millerandage (hen and chicken), depending on the season.
• Taburno has a conic-pyramidal cluster, often with a lateral cluster. Berries are round,
berry skin is blue-black and the pulp is colourless. The average weight of clusters is low,
the weight of the berries is low. Sugar accumulation is high and titrable acidity is
medium-high. Taburno is vigourous, with a discrete fertility and a high yield. It shows
moderate millerandage.
55
• Vulture has a medium compact, medium-small, medium-short, conic-cylindric cluster,
sometimes with a lateral cluster and with a short stem. Berries are round, the skin is blue
with bloom, the thickness of the skin is medium, and the pulp is colourless. Vigour is
medium, and the yield per hectar ranges from 4 to 10 tons, depending on the soil fertility.
Taburno has a lower bud average bud fertility, a later onset of ripening, a earlier
ripening and a higher cluster weight (SeSirca, 2001).
The three main Aglianico biotypes show differences also in the flavonoid
accumulation kinetics. In 2000 and 2001 the phenolic accumulation pattern Taburno,
Taurasi and Vulture biotypes was compared. Vulture presented high levels of anthocyanins
and low levels of tannins both in skins and seeds. Taburno had the lowest anthocyanins,
but the highest levels of seed tannins. Taurasi had an average behaviour (Moio et al.,
2004).
The differences in the transcription of the genes of the flavonoid pathway in
Aglianicoʼs biotypes has not been studied yet. The range of phenotypic expression shown
by Aglianico makes it a good model for studying the basis of intra-variety variability in
grape cultivars. For this reason in this work the effects of shading on the genes of the
flavonoid pathway in the three main biotypes of Aglianico will be studied.
56
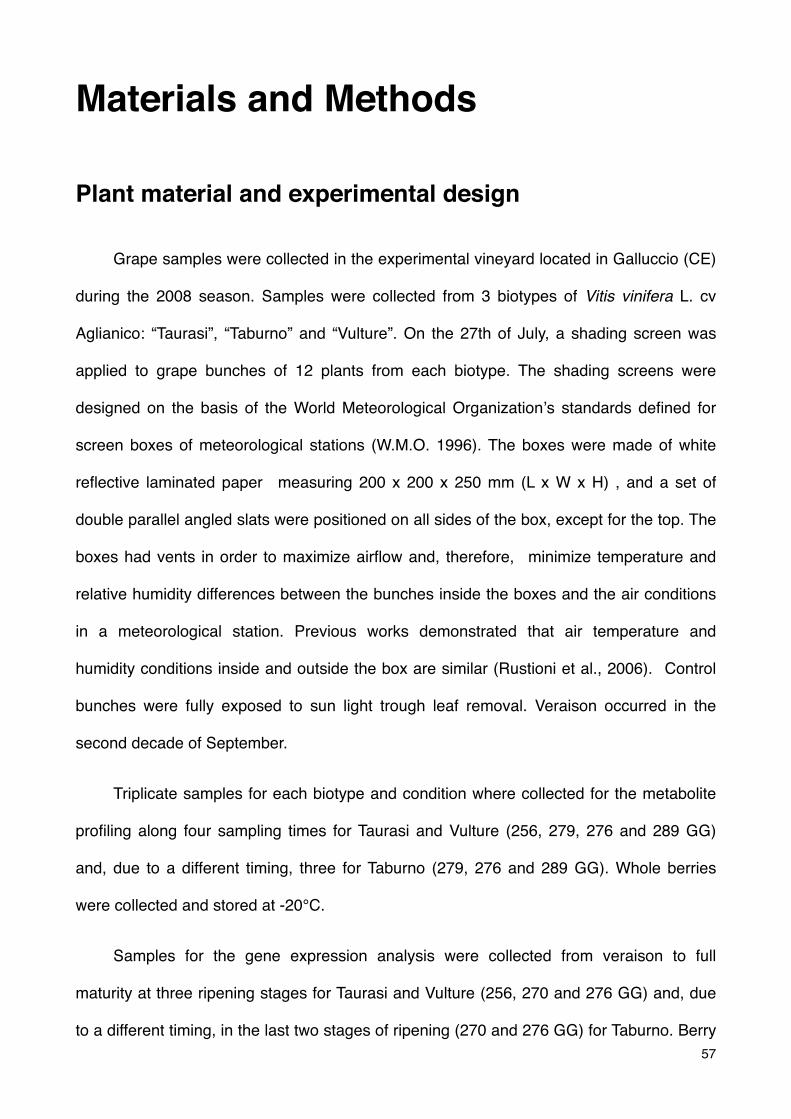
Materials and Methods
Plant material and experimental design
Grape samples were collected in the experimental vineyard located in Galluccio (CE)
during the 2008 season. Samples were collected from 3 biotypes of Vitis vinifera L. cv
Aglianico: “Taurasi”, “Taburno” and “Vulture”. On the 27th of July, a shading screen was
applied to grape bunches of 12 plants from each biotype. The shading screens were
designed on the basis of the World Meteorological Organizationʼs standards defined for
screen boxes of meteorological stations (W.M.O. 1996). The boxes were made of white
reflective laminated paper measuring 200 x 200 x 250 mm (L x W x H) , and a set of
double parallel angled slats were positioned on all sides of the box, except for the top. The
boxes had vents in order to maximize airflow and, therefore, minimize temperature and
relative humidity differences between the bunches inside the boxes and the air conditions
in a meteorological station. Previous works demonstrated that air temperature and
humidity conditions inside and outside the box are similar (Rustioni et al., 2006). Control
bunches were fully exposed to sun light trough leaf removal. Veraison occurred in the
second decade of September.
Triplicate samples for each biotype and condition where collected for the metabolite
profiling along four sampling times for Taurasi and Vulture (256, 279, 276 and 289 GG)
and, due to a different timing, three for Taburno (279, 276 and 289 GG). Whole berries
were collected and stored at -20°C.
Samples for the gene expression analysis were collected from veraison to full
maturity at three ripening stages for Taurasi and Vulture (256, 270 and 276 GG) and, due
to a different timing, in the last two stages of ripening (270 and 276 GG) for Taburno. Berry 57

skins for the gene expression analysis were manually separated from the mesocarp and
instantly frozen in liquid nitrogen and stored at -80°C until use.
The different sampling for Taburno are due to the peculiar ripening timing shown by
this biotype.
Determination of the metabolite profiling
In order to assess the progress of grape berry ripening and to associate the
physiological phases to the observed gene expression, we measured soluble solids, pH
and titrable acidity, total polyphenols, total flavonoids, non-anthocyanin flavonoids, tannins,
total anthocyanins and the anthocyanin profiling.
Grape juice was obtained by manual crushing of the grapes to determinate total
soluble solids (°Brix), pH and titrable acidity using a hand held refractometer (ATAGO CO.,
Ltd), a pH meter (Hanna) and an automatic titrator (Crison Compact Titrator).
Polyphenol extraction was performed from the skins of 20 randomly selected frozen
berries. Berry skins where added with 100 ml of Methanol/HCl 1%. Samples were kept in
the dark for 24 h and then filtered and stored in the dark until analysis.
An aliquot of the extraction mixture was diluted 1:32 with Ethanol:H2O:HCl 70:29:1
and the total anthocyanin content was evaluated by measuring the absorbance at
wavelength 535 nm, referring the values to a malvidin 3-glucoside calibration curve, while
total flavonoids and non anthocyanic flavonoids by registering the absorbance spectrum
between wavelength 230 nm and 700 nm.
50 µl of the extraction mixture were added with 0,5 ml of the Folin-Ciocalteu reagent
and 4ml of water. After 3 minutes the samples were added with 2 ml of Na2CO3 and water
to 10ml. After 90 minutes, total polyphenols were determined by measuring the
58

absorbance at wavelength 700 nm, referring the values to a (+) cathechin calibration
curve. In a 2ml eppendorf tube, 750 µl of extraction mixture diluted 1:1 were added with
200 mg of PVPP and thoroughly mixed. After 15 minutes at 4°C, samples were centrifuged
at 13000 rpm for 5 minutes. The supernatant was treated and analysed as previously
described for total polyphenols determination, and tannin concentration was calculated by
difference between total polyphenols and polyphenols after PVPP.
The anthocyanin profiling was analysd with a Shimadzu LC-10ADvp, SIL10ADvp
HPLC equipment. Chromatographic analysis was performed with a mobile phase linear
gradient of HClO3 0,3% in water as Solvent A and MeOH as solvent B at a constant flow-
rate of 0,45 ml/min. The gradient elution profile was the following: 0 min, 27% B, 73% A;
1-32 min, 43% B, 57% A; 32- 45 min, 68,5% B, 31,5% A; 45-47 min, 100% B; 3 min
constant 100% B. A wavelength of 520 nm was used for the absorbance detector.
Gene expression analysis
Total RNA from berry skins was exctracted with a protocol similar to the one
described by Moser et al. (2004). Grape berry skins were crushed to a powder with a
electric grinder in presence of N2 and stored at -80°C An extraction buffer (XT) was
prepared as follows: Na borate decahydrate 0,2 M; EDTA pH 8 0,03 M; SDS 1%(v/v); Na
deoxycholate 1% (w/v). Prior to use, the XT buffer buffer was warmed up to 50°C and
added with: β-Mercapto Ethanol 2%; Spermidin 0,05 M; Nonidet p-40 1%; PVP-40 2%.
The buffer was then warmed up to 80°C. 400 µg of crushed skins were added with
1400 µl of XT buffer 80°C in a 2 ml Eppendorf tube. Samples were kept at 80°C for 5
minutes and then 42°C for 1 hour; samples were then added with 120 µl 2M KCl and kept
for 45 minutes at 4°C. After centrifugation for 15 minutes at 8°C at 13000 RPM, the
supernatant was transfered into a new 2 ml Eppendorf tube and added with 1/3 v/v LiCL
59

8M and 1% β-ME and it was stored at 4°C overnight. Samples were centrifuged for 25
minutes at 8°C at 13000 RPM, the supernatant was discarded and added with 300 µl of
LiCl and 600 µl of H2O. Samples were again centrifuged for 15 minutes at 8°C at 13000
RPM; washing with LiCl was repeated until supernatant became colourless. Samples were
added with 600µl tris-HCl 10m pH 7,5 and 1/10 v/v K-acetate 2M pH 5,5 and kept for 10ʼ
minutes on ice. Samples were centrifuged for 15 minutes at 8°C for 13000 RPM, Added
with 0,9 volumes of IPA and stored for 1 hour at -20°C. Samples were centrifuged for 25
minutes at 8°C at 13000 RPM, supernatant was discarded and pellet was added with 1 ml
EtOH 80%. Samples were centrifuged for 15 minutes at 8°C at 13000 RPM, supernatant
was discarded and pellet was kept in vacuum until ethanol completely evaporated and
pellet was dry. Pellet was suspended in 100 µL RNase-free H2O.
Samples were treated with 60 µl of LiCl 8M (3M final) and thoroughly mixed, kept for
3 hours at 4°C and then centrifuged for 20 minutes at 4°C at 13000 RPM. supernatant was
discarded and pellet was added with 1 ml EtOH 80% and thoroughly mixed. Samples were
centrifuged for 15 minutes at 8°C at 13000 RPM, supernatant was discarded and pellet
was kept in vacuum until ethanol completely evaporated and pellet was dry. Pellet was
suspended in 100 µL RNase-free H2O.
RNA was subsequently purified and concentrated using the RNeasy mini kit (Qiagen)
following the manufacturerʼs protocol. The purified total RNA was treated with the DNAse I
AMP GRADE (Invitrogen). Total RNA quantity and quality was controlled with a nanodrop
spectrophotometer. cDNA synthesis was performed using the SUPERSCRIP III 1st strand
kit (Invitrogen) following the manufacturerʼs handbook. Relative transcript quantification of
target genes was performed through Real Time PCR using the Platinum SYBR Green
qPCR SuperMix-UDG with ROX (Invitrogen) following the manufacturerʼs protocol on an
Applied Biosystem 7300 Real Time PCR system (Applied Biosystem). Thermal cycling
60
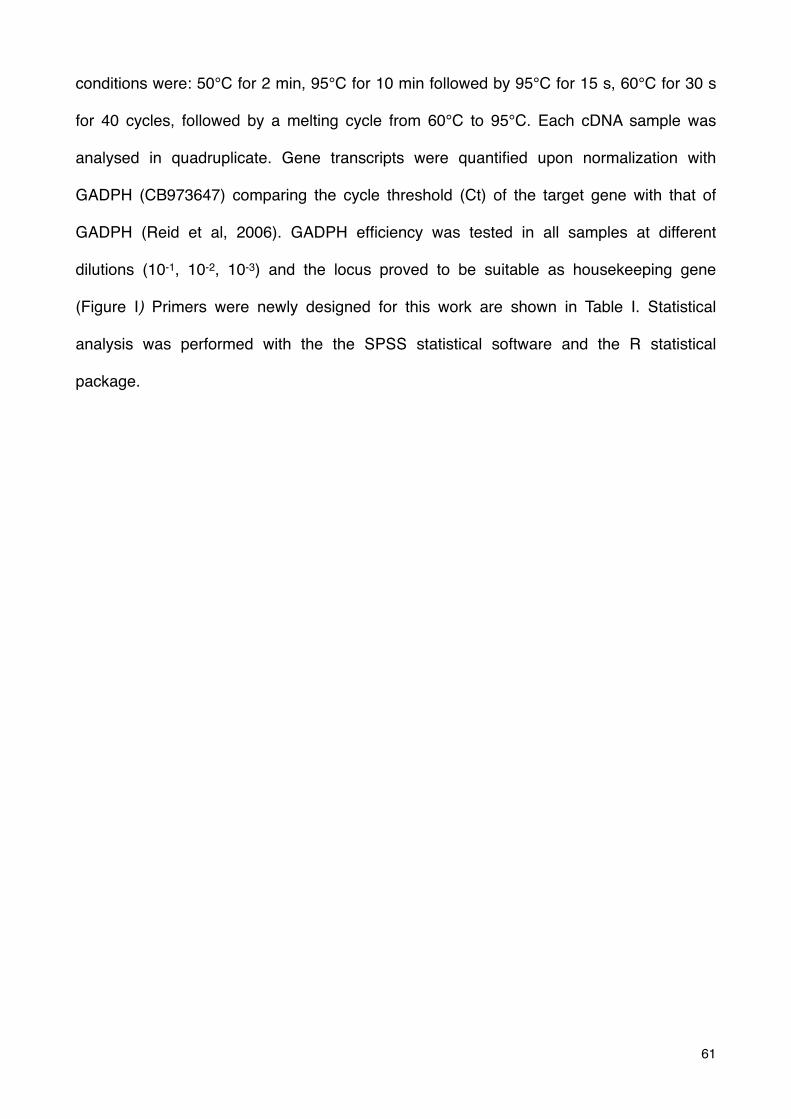
conditions were: 50°C for 2 min, 95°C for 10 min followed by 95°C for 15 s, 60°C for 30 s
for 40 cycles, followed by a melting cycle from 60°C to 95°C. Each cDNA sample was
analysed in quadruplicate. Gene transcripts were quantified upon normalization with
GADPH (CB973647) comparing the cycle threshold (Ct) of the target gene with that of
GADPH (Reid et al, 2006). GADPH efficiency was tested in all samples at different
dilutions (10-1, 10-2, 10-3) and the locus proved to be suitable as housekeeping gene
(Figure I) Primers were newly designed for this work are shown in Table I. Statistical
analysis was performed with the the SPSS statistical software and the R statistical
package.
61
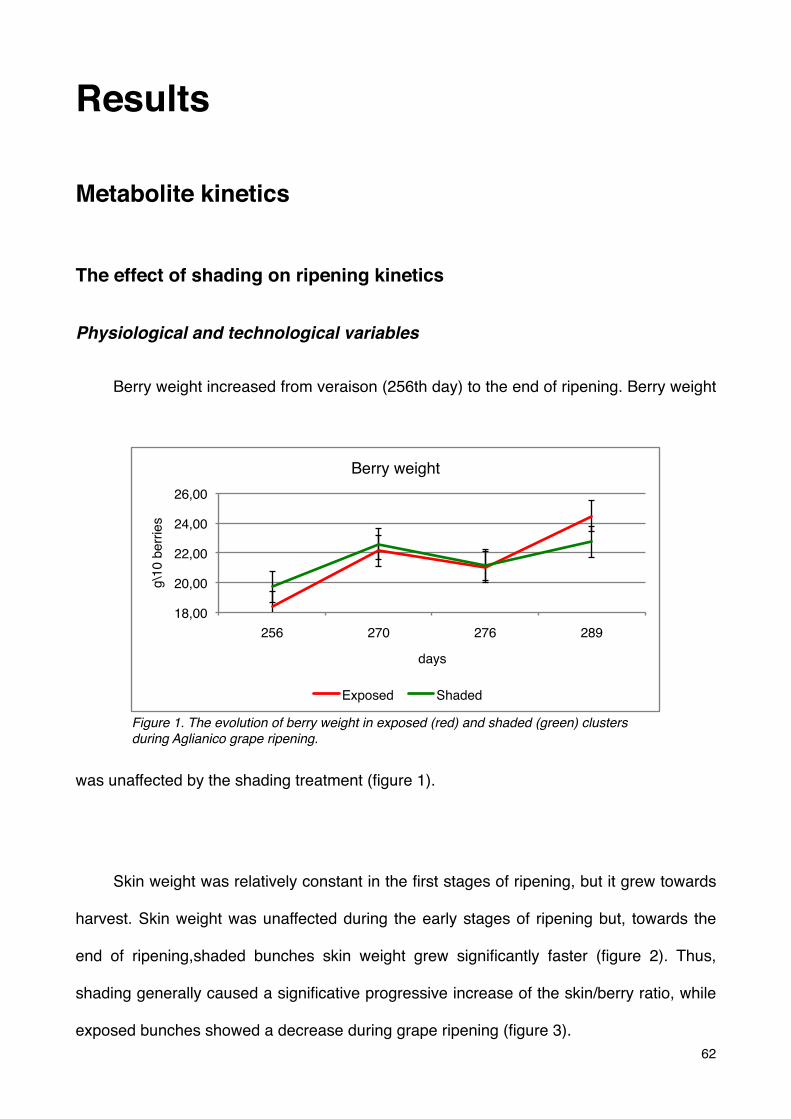
Results
Metabolite kinetics
The effect of shading on ripening kinetics
Physiological and technological variables
Berry weight increased from veraison (256th day) to the end of ripening. Berry weight
was unaffected by the shading treatment (figure 1).
Skin weight was relatively constant in the first stages of ripening, but it grew towards
harvest. Skin weight was unaffected during the early stages of ripening but, towards the
end of ripening,shaded bunches skin weight grew significantly faster (figure 2). Thus,
shading generally caused a significative progressive increase of the skin/berry ratio, while
exposed bunches showed a decrease during grape ripening (figure 3). 62
18,00!
20,00!
22,00!
24,00!
26,00!
256! 270! 276! 289!
g\1
0 b
err
ies!
days!
Berry weight!
Exposed! Shaded!
Figure 1. The evolution of berry weight in exposed (red) and shaded (green) clusters during Aglianico grape ripening.
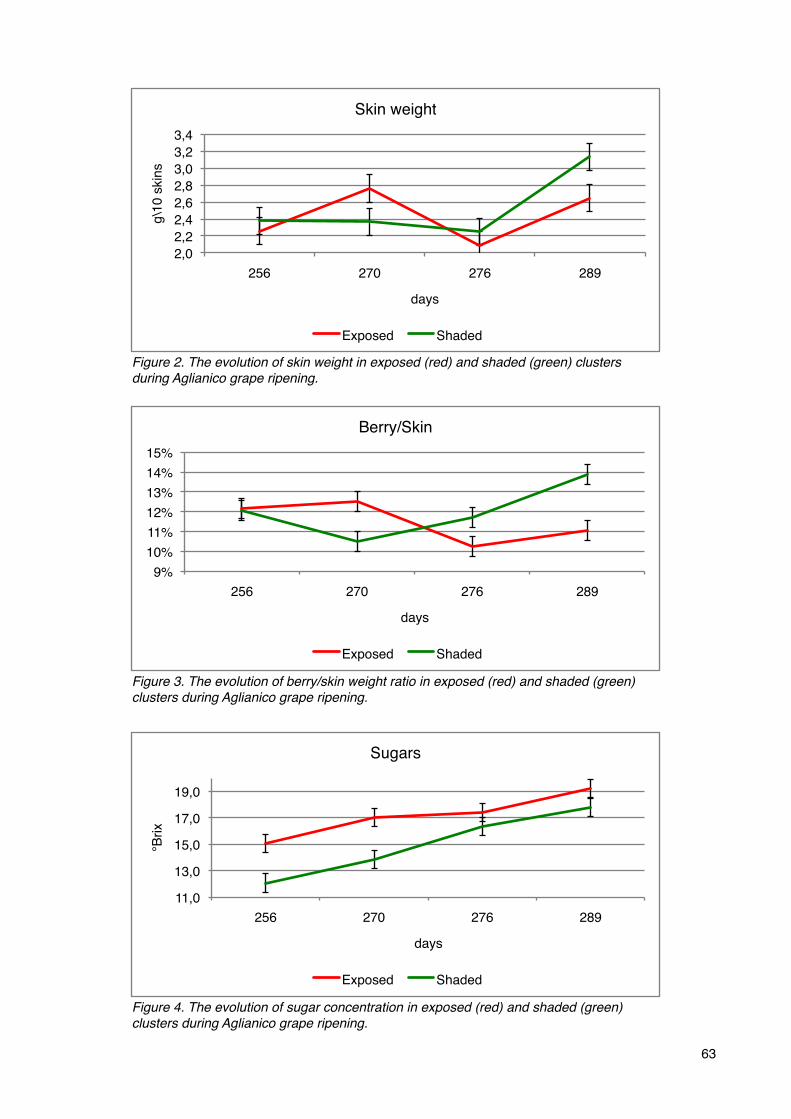
63
2,0!
2,2!
2,4!
2,6!
2,8!
3,0!
3,2!
3,4!
256! 270! 276! 289!
g\1
0 s
kin
s!
days!
Skin weight!
Exposed! Shaded!
Figure 2. The evolution of skin weight in exposed (red) and shaded (green) clusters during Aglianico grape ripening.
9%!
10%!
11%!
12%!
13%!
14%!
15%!
256! 270! 276! 289!
days!
Berry/Skin!
Exposed! Shaded!
Figure 3. The evolution of berry/skin weight ratio in exposed (red) and shaded (green) clusters during Aglianico grape ripening.
11,0!
13,0!
15,0!
17,0!
19,0!
256! 270! 276! 289!
°Brix!
days!
Sugars!
Exposed! Shaded!
Figure 4. The evolution of sugar concentration in exposed (red) and shaded (green) clusters during Aglianico grape ripening.

Sugar concentration grew constantly all-throughout the ripening peridod. Shading
caused a delay in the accumulation of sugars in the shaded bunches, however, towards
the end of ripening, exposed and shaded bunches showed no significant difference in
sugar concentration (Figure 4). Also pH showed a regular increase during ripening.
Shaded bunches showed a significantly lower pH at veraison, but no difference in pH was
shown in ripe exposed and shaded bunches (Figure 5). Consequently, titrable acidity
decreased steadily from veraison to ripening. Tirable acidity was significantly higher in
shaded berries all-throughout berry ripening, but differences got smaller towards the
harvest date (Figure 6).
64
3,00!
3,20!
3,40!
3,60!
3,80!
4,00!
256! 270! 276! 289!
days!
pH!
Exposed! Shaded!
Figure 5. The evolution of pH in exposed (red) and shaded (green) clusters during Aglianico grape ripening.
6,00
8,00
10,00
12,00
14,00
256 270 276 289
g/l
days
Titrable Acidity
Exposed Shaded
Figure 6. The evolution of titrable acidity in exposed (red) and shaded (green) clusters during Aglianico grape ripening.

Phenolic compounds
Total polyphenols generally showed a slow decrease in the first part of ripening and
a significant increase in the final stages. Shaded bunches decreased more rapidly, so at
harvest the content in total polyphenols was significantly lower than in exposed bunches
(Figure 7).
Total flavonoids remained constant in the first stages and showed a general increase
towards the end of ripening. Shaded bunches had a significant lower level of total
65
0!
100!
200!
300!
400!
500!
600!
700!
256! 270! 276! 289!
mg/k
g g
rapes!
days!
Total Polyphenols!
Exposed! Shaded!
Figure 7. The evolution of total polyphenols in exposed (red) and shaded (green) clusters during Aglianico grape ripening.
Figure 8. The evolution of total flavonoids in exposed (red) and shaded (green) clusters during Aglianico grape ripening.
800!
1000!
1200!
1400!
1600!
1800!
2000!
256! 270! 276! 289!
mg/k
g g
rapes!
days!
Total Flavonoids!
Exposed! Shaded!
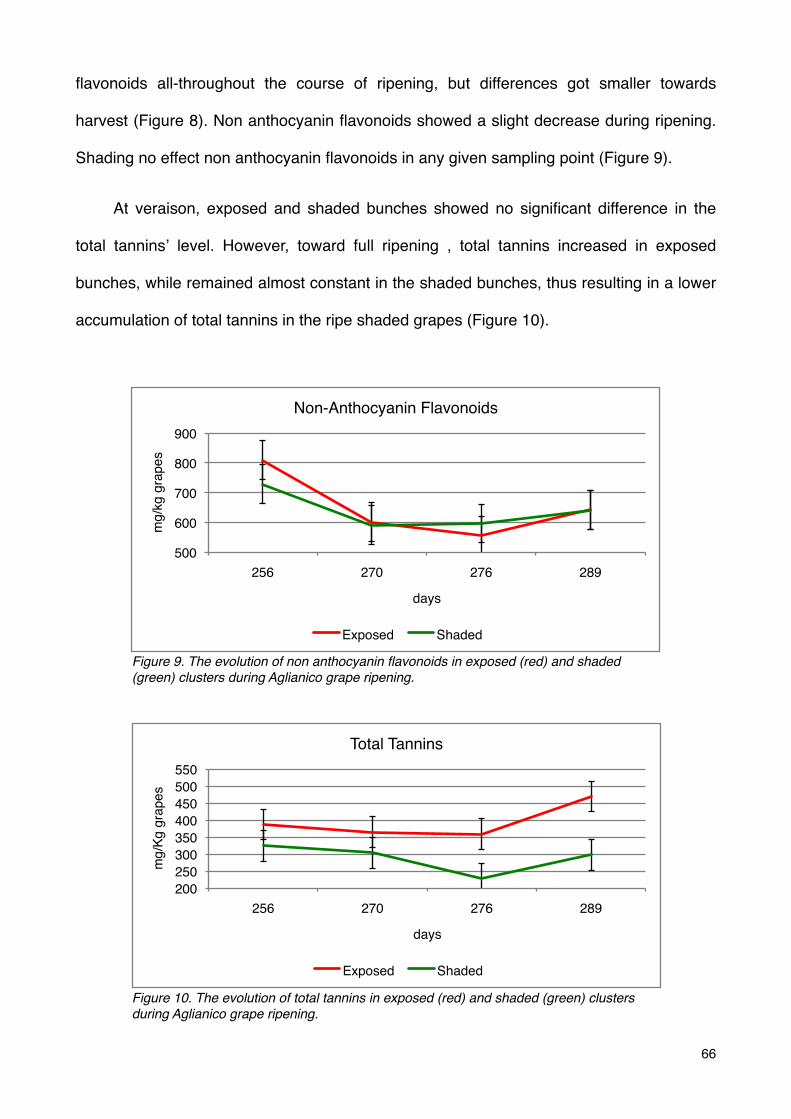
flavonoids all-throughout the course of ripening, but differences got smaller towards
harvest (Figure 8). Non anthocyanin flavonoids showed a slight decrease during ripening.
Shading no effect non anthocyanin flavonoids in any given sampling point (Figure 9).
At veraison, exposed and shaded bunches showed no significant difference in the
total tanninsʼ level. However, toward full ripening , total tannins increased in exposed
bunches, while remained almost constant in the shaded bunches, thus resulting in a lower
accumulation of total tannins in the ripe shaded grapes (Figure 10).
66
500!
600!
700!
800!
900!
256! 270! 276! 289!
mg/k
g g
rapes!
days!
Non-Anthocyanin Flavonoids!
Exposed! Shaded!
Figure 9. The evolution of non anthocyanin flavonoids in exposed (red) and shaded (green) clusters during Aglianico grape ripening.
200!
250!
300!
350!
400!
450!
500!
550!
256! 270! 276! 289!
mg/K
g g
rapes!
days!
Total Tannins!
Exposed! Shaded!
Figure 10. The evolution of total tannins in exposed (red) and shaded (green) clusters during Aglianico grape ripening.
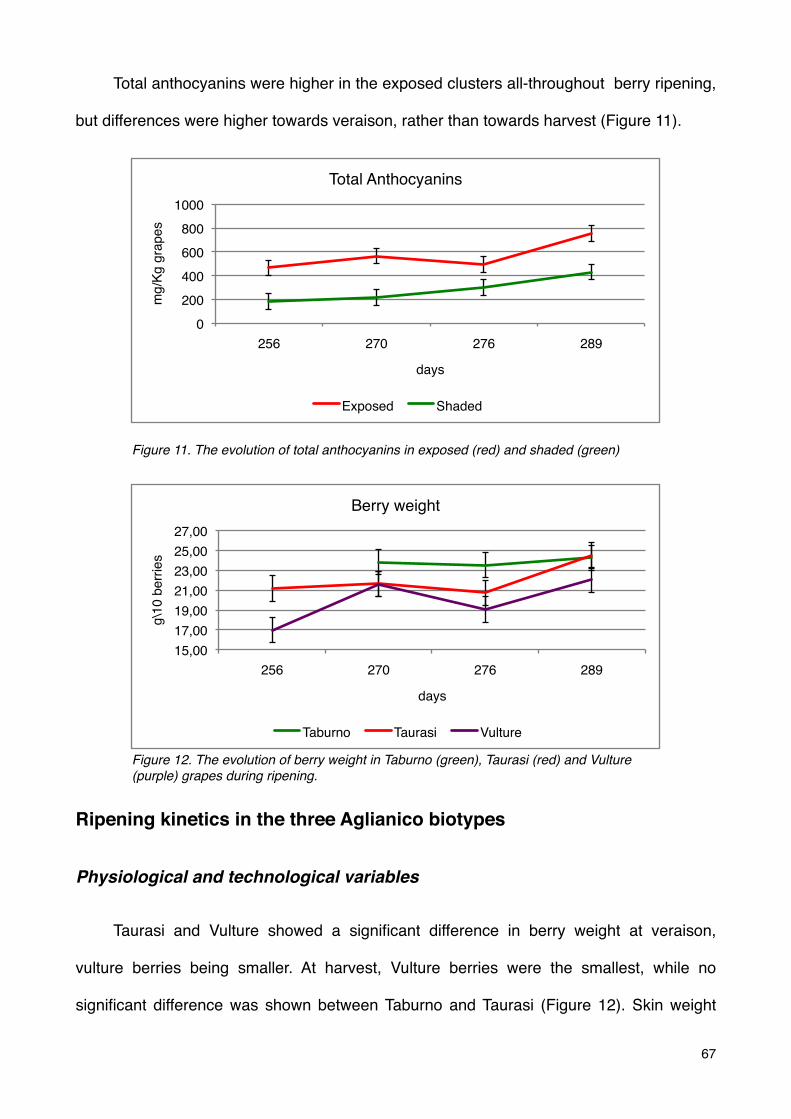
Total anthocyanins were higher in the exposed clusters all-throughout berry ripening,
but differences were higher towards veraison, rather than towards harvest (Figure 11).
Ripening kinetics in the three Aglianico biotypes
Physiological and technological variables
Taurasi and Vulture showed a significant difference in berry weight at veraison,
vulture berries being smaller. At harvest, Vulture berries were the smallest, while no
significant difference was shown between Taburno and Taurasi (Figure 12). Skin weight
67
Figure 11. The evolution of total anthocyanins in exposed (red) and shaded (green)
0!
200!
400!
600!
800!
1000!
256! 270! 276! 289!
mg/K
g g
rapes!
days!
Total Anthocyanins!
Exposed! Shaded!
15,00!
17,00!
19,00!
21,00!
23,00!
25,00!
27,00!
256! 270! 276! 289!
g\1
0 b
err
ies!
days!
Berry weight!
Taburno! Taurasi! Vulture!
Figure 12. The evolution of berry weight in Taburno (green), Taurasi (red) and Vulture (purple) grapes during ripening.

68
1,5!
2,0!
2,5!
3,0!
3,5!
256! 270! 276! 289!
g\1
0 s
kin
s!
days!
Skin weight!
Taburno! Taurasi! Vulture!
Figure 13. The evolution of skin weight in Taburno (green), Taurasi (red) and Vulture (purple) grapes during ripening.
8%!
9%!
10%!
11%!
12%!
13%!
14%!
15%!
256! 270! 276! 289!
days!
Berry/Skin!
Taburno! Taurasi! Vulture!
Figure 14. The evolution of the berry/skin weight ratio in Taburno (green), Taurasi (red) and Vulture (purple) grapes during ripening.
12,0!
14,0!
16,0!
18,0!
20,0!
22,0!
256! 270! 276! 289!
°Brix!
days!
Sugars!
Taburno! Taurasi! Vulture!
Figure 15. The evolution of sugars in Taburno (green), Taurasi (red) and Vulture (purple) grapes during ripening.

showed no significant difference among biotypes all-throughout the ripening process
(Figure 13). However, Taburno showed a lower skin/berry ratio in the early stages of
ripening, but it reached the same final level as Vulture and Taurasi (Figure 14).
Sugar content increased normally from veraison to harvest. Taurasi and Vulture
showed no significant difference in sugar concentration during the whole ripening period.
Taburno had very low levels of sugars in the beginning, but at the end of the season it
reached the same sugar concentration as Taurasi and Vulture (Figure 15).
pH increased in all biotypes during grape ripening. Taburno had a significantly lower
pH in the first part of ripening, while Taurasi and Vulture showed no differences between
each other during the whole ripening period. However, Taburno reached the same pH level
as Taurasi and Vulture at the end of ripening (Figure 16).
Titrable acidity in berries decreased during ripening in all biotypes. At veraison,
Taburno had the highest acid concentration, Vulture had the lowest, while Taurasi had an
intermediate level. However, at the end of the ripening period the three biotypes showed
no significant difference (Figure 17).
69
2,80!
3,00!
3,20!
3,40!
3,60!
3,80!
4,00!
256! 270! 276! 289!
days!
pH!
Taburno! Taurasi! Vulture!
Figure 16. The evolution of pH in Taburno (green), Taurasi (red) and Vulture (purple) grapes during ripening.
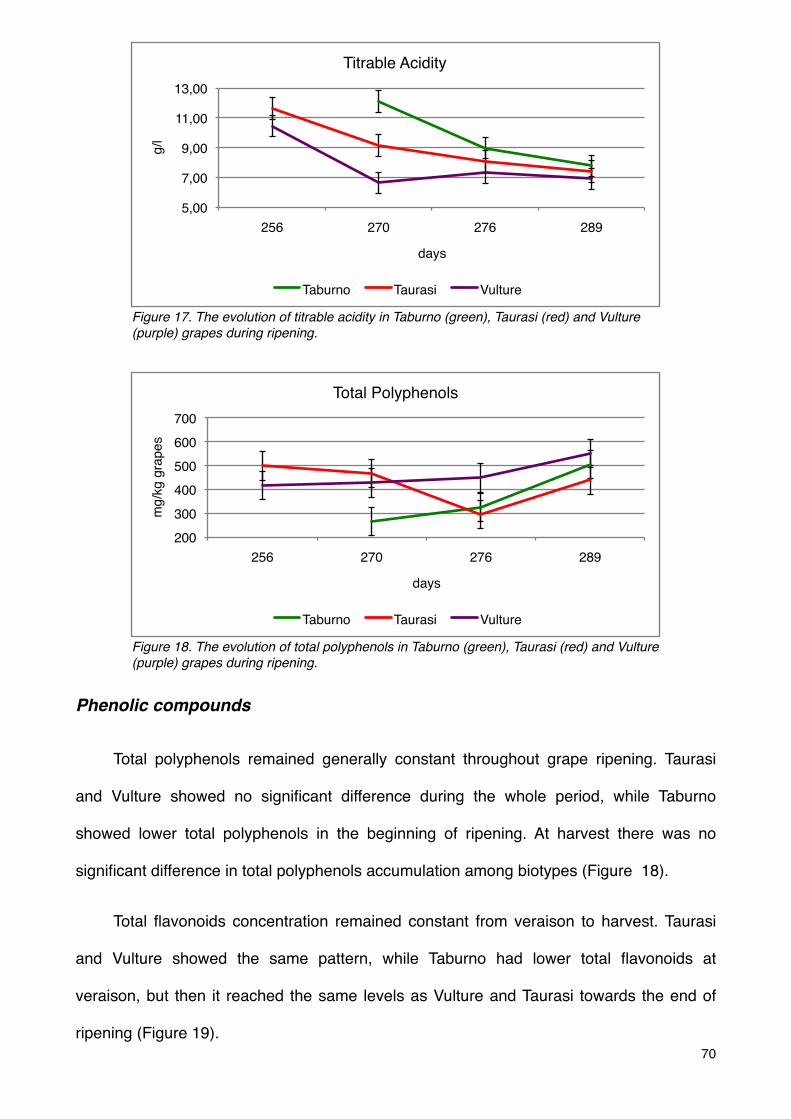
Phenolic compounds
Total polyphenols remained generally constant throughout grape ripening. Taurasi
and Vulture showed no significant difference during the whole period, while Taburno
showed lower total polyphenols in the beginning of ripening. At harvest there was no
significant difference in total polyphenols accumulation among biotypes (Figure 18).
Total flavonoids concentration remained constant from veraison to harvest. Taurasi
and Vulture showed the same pattern, while Taburno had lower total flavonoids at
veraison, but then it reached the same levels as Vulture and Taurasi towards the end of
ripening (Figure 19).70
5,00!
7,00!
9,00!
11,00!
13,00!
256! 270! 276! 289!
g/l!
days!
Titrable Acidity!
Taburno! Taurasi! Vulture!
Figure 17. The evolution of titrable acidity in Taburno (green), Taurasi (red) and Vulture (purple) grapes during ripening.
200!
300!
400!
500!
600!
700!
256! 270! 276! 289!
mg/k
g g
rapes!
days!
Total Polyphenols!
Taburno! Taurasi! Vulture!
Figure 18. The evolution of total polyphenols in Taburno (green), Taurasi (red) and Vulture (purple) grapes during ripening.
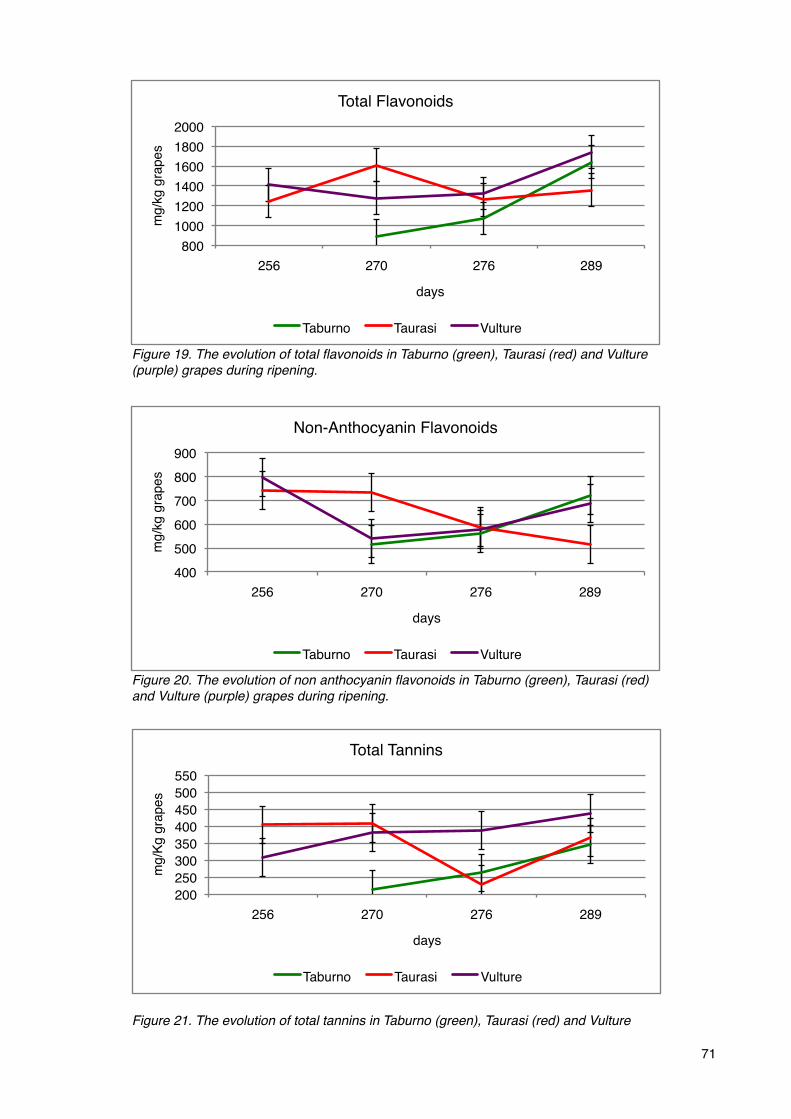
71
800!
1000!
1200!
1400!
1600!
1800!
2000!
256! 270! 276! 289!
mg/k
g g
rapes!
days!
Total Flavonoids!
Taburno! Taurasi! Vulture!
Figure 19. The evolution of total flavonoids in Taburno (green), Taurasi (red) and Vulture (purple) grapes during ripening.
400!
500!
600!
700!
800!
900!
256! 270! 276! 289!
mg/k
g g
rapes!
days!
Non-Anthocyanin Flavonoids!
Taburno! Taurasi! Vulture!
Figure 20. The evolution of non anthocyanin flavonoids in Taburno (green), Taurasi (red) and Vulture (purple) grapes during ripening.
Figure 21. The evolution of total tannins in Taburno (green), Taurasi (red) and Vulture
200!
250!
300!
350!
400!
450!
500!
550!
256! 270! 276! 289!
mg/K
g g
rapes!
days!
Total Tannins!
Taburno! Taurasi! Vulture!
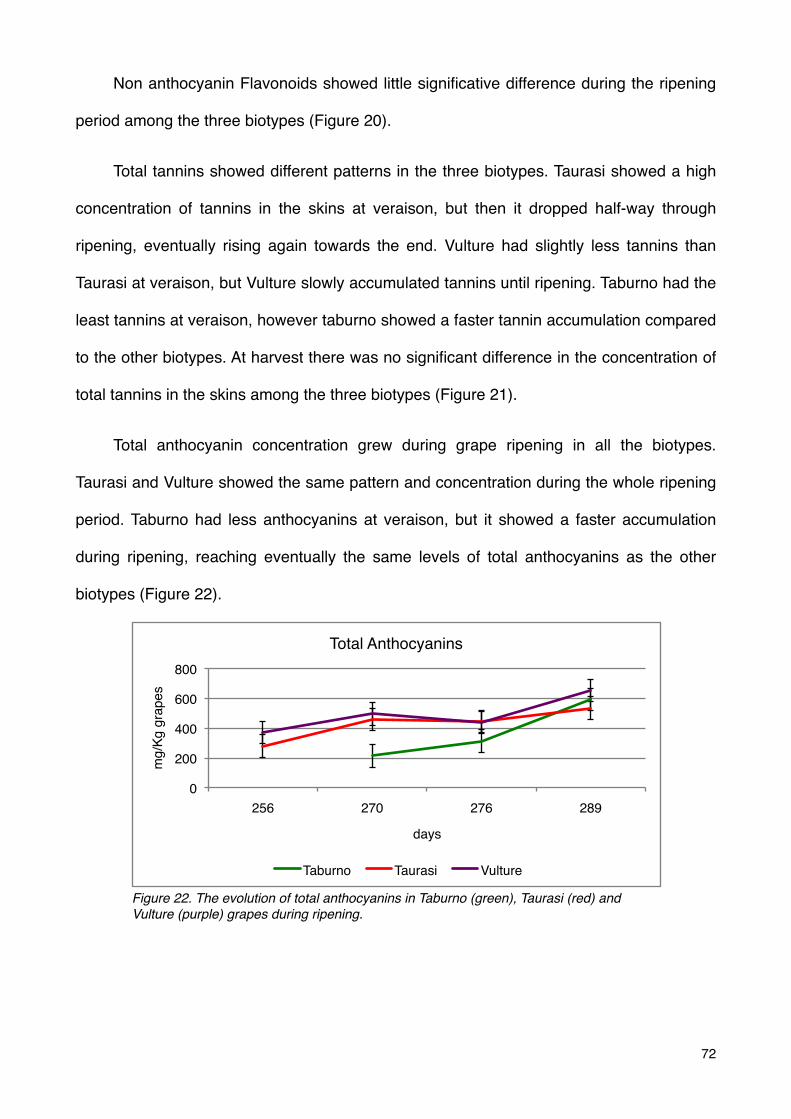
Non anthocyanin Flavonoids showed little significative difference during the ripening
period among the three biotypes (Figure 20).
Total tannins showed different patterns in the three biotypes. Taurasi showed a high
concentration of tannins in the skins at veraison, but then it dropped half-way through
ripening, eventually rising again towards the end. Vulture had slightly less tannins than
Taurasi at veraison, but Vulture slowly accumulated tannins until ripening. Taburno had the
least tannins at veraison, however taburno showed a faster tannin accumulation compared
to the other biotypes. At harvest there was no significant difference in the concentration of
total tannins in the skins among the three biotypes (Figure 21).
Total anthocyanin concentration grew during grape ripening in all the biotypes.
Taurasi and Vulture showed the same pattern and concentration during the whole ripening
period. Taburno had less anthocyanins at veraison, but it showed a faster accumulation
during ripening, reaching eventually the same levels of total anthocyanins as the other
biotypes (Figure 22).
72
0!
200!
400!
600!
800!
256! 270! 276! 289!
mg/K
g g
rapes!
days!
Total Anthocyanins!
Taburno! Taurasi! Vulture!
Figure 22. The evolution of total anthocyanins in Taburno (green), Taurasi (red) and Vulture (purple) grapes during ripening.

The anthocyanin profiling
The effect of shading on the anthocyanin profiling
Among the five anthocyanidins, shaded
aglianico grapes showed a very high
proportion of Malvidin (82%), a low proportion
of delphinidin, petunidin and peonidin (6%,
7% and 5% respectively) and a very low
proportion of cyanidin (less than 1%) (Figure
23). Exposed bunches also showed a very
high proportion of Malvidin (83%), a low
proportion of delphinidin, petunidin and
peonidin (5%, 8% and 8% respectively) and a
very low proportion of cyanidin (less than 1%)
(Figure 24). Free anthocyanidin-glucosides,
anthocyanidin-acetates and anthocyanidin-p-
coumarates were respectively 76%, 1% and
23% of total anthocyanins (Figure 25). In
e x p o s e d b e r r i e s 7 9 % w e r e f r e e
an thocyan id in -g lucos ides , 1% were
anthocyanidin-acetates and 20% were
anthocyanidin-p-coumarates (Figure 26). The
anthocyanin profiling showed no statistically
significant difference between shaded and
exposed berries.
73
5%!0%!
8%! 4%!
83%!
Exposed!
Delphinidin!
Cyanidin!
Petunidin!
Peonidin!
Malvidin!
Figure 24. The relative proportion of delphinidin-3-glucoside (dark blue), cyanidin -3-glucoside (red), petunidin -3-glucoside (green), peonidin -3-glucoside (purple) and malvidin -3-glucoside (light blue) in exposed Aglianico mature grapes.
6%!
0%!
7%! 5%!
82%!
Shaded!
Delphinidin!
Cyanidin!
Petunidin!
Peonidin!
Malvidin!
Figure 23. The relative proportion of delphinidin-3-glucoside (dark blue), cyanidin -3-glucoside (red), petunidin -3-glucoside (green), peonidin -3-glucoside (purple) and malvidin -3-glucoside (light blue) in shaded Aglianico mature grapes.

The anthocyanin profiling of the three Aglianico biotypes
Taburno showed a very high proportion of Malvidin (77%), a low proportion of
delphinidin, petunidin and peonidin (8%, 9% and 5% respectively) and a very low
proportion of cyanidin (1%) (Figure 27). Similarly Taurasi grapes had a very high
proportion of Malvidin (84%), a low proportion of delphinidin, petunidin and peonidin (4%,
6% and 6% respectively) and a very low proportion of cyanidin (less than 1%) (Figure 28).
Also the Vulture anthocyanin profiling showed a very high proportion of Malvidin (85%), a
low proportion of delphinidin, petunidin and peonidin (5%, 7% and 3% respectively) and a
less than 1% of cyanidin (Figure 29). Taburno showed 80% of free anthocyanin-
glucosides, 19% of anthocyanin-p-coumarates and 1% of anthocyanin-acetates (Figure
30); similarly, Taurasi had 75% of free anthocyanin-glucosides, 24% of anthocyanin-p-
coumarates and 1% of anthocyanin-acetates (Figure 31); Vulture showed a similar pattern
78% of free anthocyanin-glucosides, 21% of anthocyanin-p-coumarates and 1% of
anthocyanin-acetates (Figure 32). Aglianicoʼs biotypes showed no significant difference in
the anthocyanin profiling.
74
79%!
1%!
20%!
Exposed!
Free
Anthocyanidin
s!
Anthocyanidin
-acetates!
Antocyanidin-
p-coumarates!
Figure 26. The relative proportion of free anthocyanins (dark blue), anthocyanidin acetates (red) and anthocyanidin p-coumarates (green), in exposed Aglianico mature grapes.
76%!
1%!
23%!
Shaded!
Free
Anthocyanidin
s!Anthocyanidin
-acetates!
Antocyanidin-
p-coumarates!
Figure 25. The relative proportion of free anthocyanins (dark blue), anthocyanidin acetates (red) and anthocyanidin p-coumarates (green), in shaded Aglianico mature grapes.
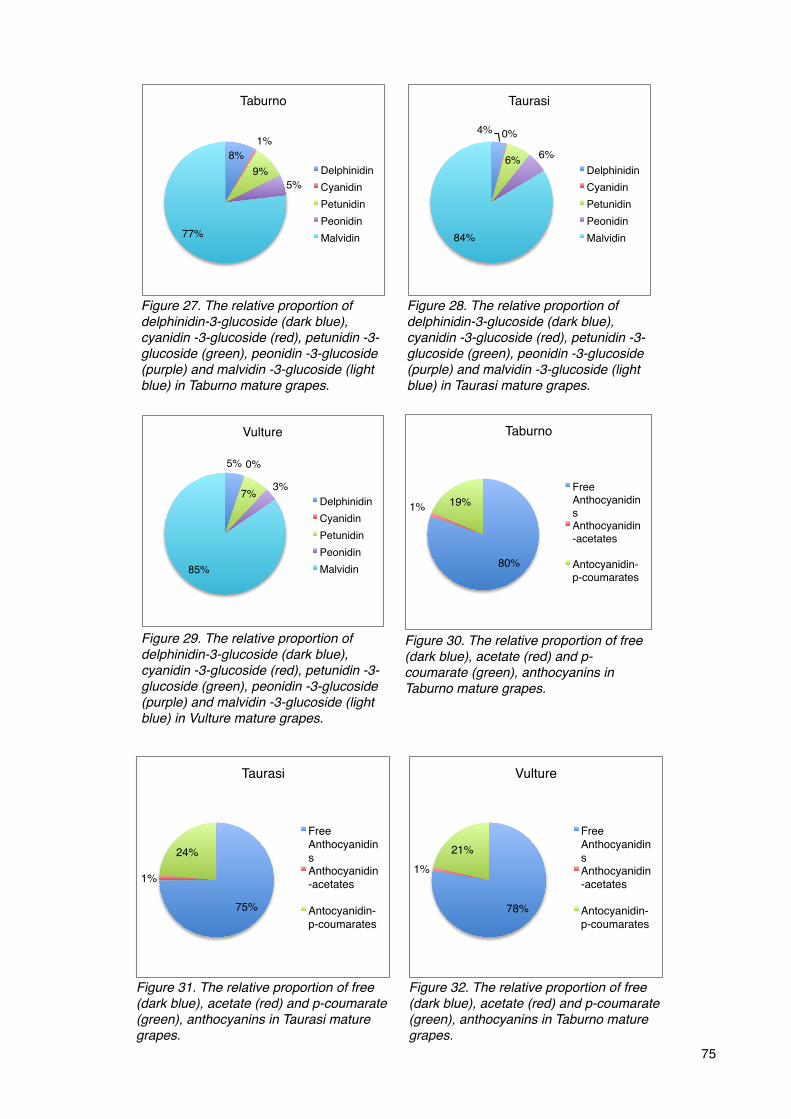
75
4%! 0%!
6%!6%!
84%!
Taurasi!
Delphinidin!
Cyanidin!
Petunidin!
Peonidin!
Malvidin!
Figure 28. The relative proportion of delphinidin-3-glucoside (dark blue), cyanidin -3-glucoside (red), petunidin -3-glucoside (green), peonidin -3-glucoside (purple) and malvidin -3-glucoside (light blue) in Taurasi mature grapes.
8%!
1%!
9%!
5%!
77%!
Taburno!
Delphinidin!
Cyanidin!
Petunidin!
Peonidin!
Malvidin!
Figure 27. The relative proportion of delphinidin-3-glucoside (dark blue), cyanidin -3-glucoside (red), petunidin -3-glucoside (green), peonidin -3-glucoside (purple) and malvidin -3-glucoside (light blue) in Taburno mature grapes.
80%!
1%!19%!
Taburno!
Free
Anthocyanidin
s!
Anthocyanidin
-acetates!
Antocyanidin-
p-coumarates!
Figure 30. The relative proportion of free (dark blue), acetate (red) and p-coumarate (green), anthocyanins in Taburno mature grapes.
5%!0%!
7%!3%!
85%!
Vulture!
Delphinidin!
Cyanidin!
Petunidin!
Peonidin!
Malvidin!
Figure 29. The relative proportion of delphinidin-3-glucoside (dark blue), cyanidin -3-glucoside (red), petunidin -3-glucoside (green), peonidin -3-glucoside (purple) and malvidin -3-glucoside (light blue) in Vulture mature grapes.
75%!
1%!
24%!
Taurasi!
Free
Anthocyanidin
s!
Anthocyanidin
-acetates!
Antocyanidin-
p-coumarates!
Figure 31. The relative proportion of free (dark blue), acetate (red) and p-coumarate (green), anthocyanins in Taurasi mature grapes.
78%!
1%!
21%!
Vulture!
Free
Anthocyanidin
s!
Anthocyanidin
-acetates!
Antocyanidin-
p-coumarates!
Figure 32. The relative proportion of free (dark blue), acetate (red) and p-coumarate (green), anthocyanins in Taburno mature grapes.

The average anthocyanin profiling of Aglianico resulted to be composed by 82% of
malvidin, 6% of delphinidin, 7% of petunidin, 5% of peonidin and less than 1% of cyanidin
(Figure 33), 78% of anthocyanin are as free glucosides, 21% are acetates and 1% are p-
coumarates (Figure 34).
76
Figure 33. The relative proportion of delphinidin-3-glucoside (dark blue), cyanidin -3-glucoside (red), petunidin -3-glucoside (green), peonidin -3-glucoside (purple) and malvidin -3-glucoside (light blue) in Aglianico mature grapes.
6%!0%!
7%! 5%!
82%!
Aglianico!
Delphinidin!
Cyanidin!
Petunidin!
Peonidin!
Malvidin!
78%!
1%!
21%!
Aglianico!
Free
Anthocyanidin
s!Anthocyanidin
-acetates!
Antocyanidin-
p-coumarates!
Figure 34. The relative proportion of free anthocyanins (dark blue), anthocyanidin acetates (red) and anthocyanidin p-coumarates (green), in Aglianico mature grapes.
Taburno
Exposed Shaded
gene\date 270 276 270 276
CHS2 0,3782 0,3046 0,1981 0,2758
F3'5'H 0,5143 0,3408 0,2667 0,2173
F3'H 0,0396 0,0308 0,0258 0,0396
F3H 0,3636 0,2322 0,1761 0,1414
FLS4 0,0158 0,0147 0,0006 0,0008
DFR1 0,0808 0,0292 0,0428 0,0222
LAR2 0,0026 0,0018 0,0013 0,001
LDOX1 0,7189 0,1916 0,5045 0,1217
UFGT 0,1051 0,0355 0,0112 0,069
OMT 0,1796 0,3165 0,0474 0,2427
AM1 0,009 0,0026 0,0075 0,0022
AM3 0,2153 0,1061 0,1761 0,0773
GST4 0,156 0,1378 0,0784 0,1014
MYB12 0,0012 0,0043 0,0002 0,0001
MYB5a 0,0059 0,14 0,0053 0,0379
MYB5b 0,0222 0,0307 0,0115 0,0355
MYBA1 0,0829 0,238 0,0465 0,1828
Table 1. The mean expression relative to GADPH of the CHS2, F3ʼ5ʼH, F3ʼH, F3H, FLS4, DFR1, LAR2, LDOX1, UFGT, OMT, AM1, AM3, GST4, MYB12, MYB5a, MYB5b, MYBA1 genes in exposed and shaded grape berry skins during Aglianico biotype Taburno ripening.
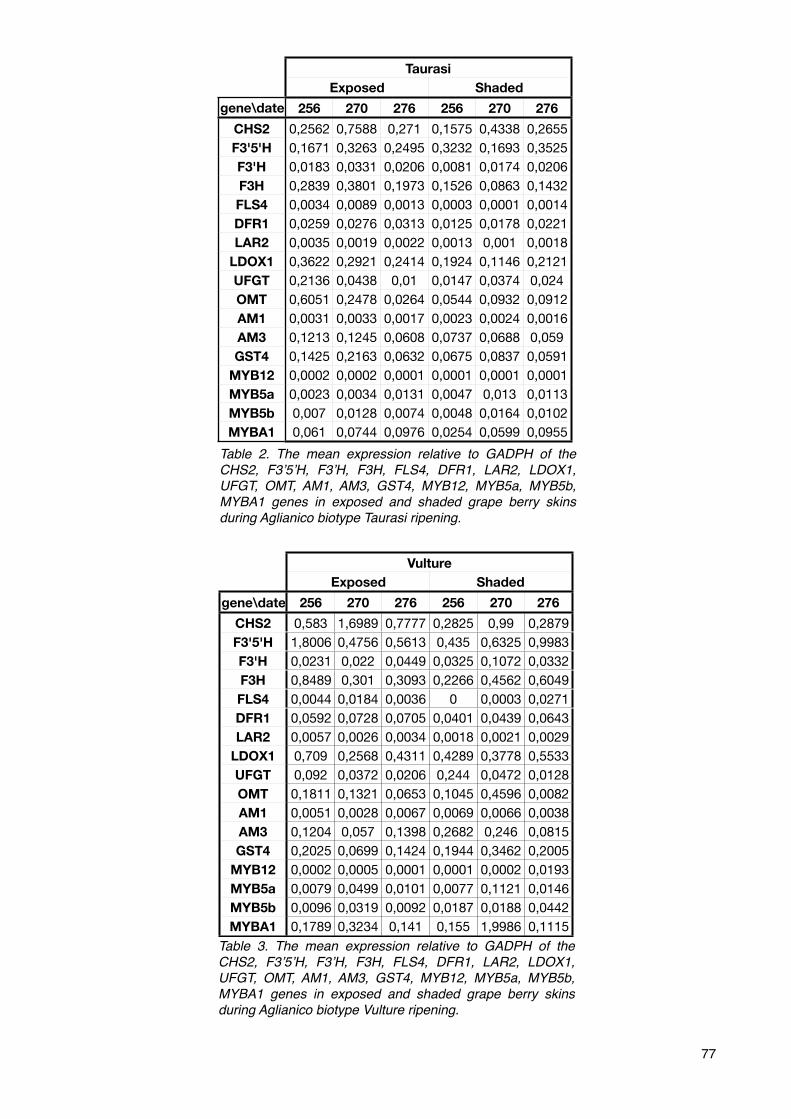
77
Taurasi
Exposed Shaded
gene\date 256 270 276 256 270 276
CHS2 0,2562 0,7588 0,271 0,1575 0,4338 0,2655
F3'5'H 0,1671 0,3263 0,2495 0,3232 0,1693 0,3525
F3'H 0,0183 0,0331 0,0206 0,0081 0,0174 0,0206
F3H 0,2839 0,3801 0,1973 0,1526 0,0863 0,1432
FLS4 0,0034 0,0089 0,0013 0,0003 0,0001 0,0014
DFR1 0,0259 0,0276 0,0313 0,0125 0,0178 0,0221
LAR2 0,0035 0,0019 0,0022 0,0013 0,001 0,0018
LDOX1 0,3622 0,2921 0,2414 0,1924 0,1146 0,2121
UFGT 0,2136 0,0438 0,01 0,0147 0,0374 0,024
OMT 0,6051 0,2478 0,0264 0,0544 0,0932 0,0912
AM1 0,0031 0,0033 0,0017 0,0023 0,0024 0,0016
AM3 0,1213 0,1245 0,0608 0,0737 0,0688 0,059
GST4 0,1425 0,2163 0,0632 0,0675 0,0837 0,0591
MYB12 0,0002 0,0002 0,0001 0,0001 0,0001 0,0001
MYB5a 0,0023 0,0034 0,0131 0,0047 0,013 0,0113
MYB5b 0,007 0,0128 0,0074 0,0048 0,0164 0,0102
MYBA1 0,061 0,0744 0,0976 0,0254 0,0599 0,0955
Table 2. The mean expression relative to GADPH of the CHS2, F3ʼ5ʼH, F3ʼH, F3H, FLS4, DFR1, LAR2, LDOX1, UFGT, OMT, AM1, AM3, GST4, MYB12, MYB5a, MYB5b, MYBA1 genes in exposed and shaded grape berry skins during Aglianico biotype Taurasi ripening.
Vulture
Exposed Shaded
gene\date 256 270 276 256 270 276
CHS2 0,583 1,6989 0,7777 0,2825 0,99 0,2879
F3'5'H 1,8006 0,4756 0,5613 0,435 0,6325 0,9983
F3'H 0,0231 0,022 0,0449 0,0325 0,1072 0,0332
F3H 0,8489 0,301 0,3093 0,2266 0,4562 0,6049
FLS4 0,0044 0,0184 0,0036 0 0,0003 0,0271
DFR1 0,0592 0,0728 0,0705 0,0401 0,0439 0,0643
LAR2 0,0057 0,0026 0,0034 0,0018 0,0021 0,0029
LDOX1 0,709 0,2568 0,4311 0,4289 0,3778 0,5533
UFGT 0,092 0,0372 0,0206 0,244 0,0472 0,0128
OMT 0,1811 0,1321 0,0653 0,1045 0,4596 0,0082
AM1 0,0051 0,0028 0,0067 0,0069 0,0066 0,0038
AM3 0,1204 0,057 0,1398 0,2682 0,246 0,0815
GST4 0,2025 0,0699 0,1424 0,1944 0,3462 0,2005
MYB12 0,0002 0,0005 0,0001 0,0001 0,0002 0,0193
MYB5a 0,0079 0,0499 0,0101 0,0077 0,1121 0,0146
MYB5b 0,0096 0,0319 0,0092 0,0187 0,0188 0,0442
MYBA1 0,1789 0,3234 0,141 0,155 1,9986 0,1115
Table 3. The mean expression relative to GADPH of the CHS2, F3ʼ5ʼH, F3ʼH, F3H, FLS4, DFR1, LAR2, LDOX1, UFGT, OMT, AM1, AM3, GST4, MYB12, MYB5a, MYB5b, MYBA1 genes in exposed and shaded grape berry skins during Aglianico biotype Vulture ripening.

Gene expression
In this work the expression level of the genes CHS2, F3ʼ5ʼH, F3ʼH, F3H, FLS4,
DFR1, LAR2, LDOX1, UFGT, OMT, AM1, AM3, GST4, MYB12, MYB5a, MYB5b, MYBA1 in
the skins of shaded and exposed berries of three Aglianico biotypes (Taburno, Taurasi,
Vulture) were assessed by mean of Real-Time PCR. In general, all genes were expressed,
to different extents, in all biotypes and in all conditions. The expression levels of each
gene in each condition are summarised for Taburno (Table 1), Taurasi (Table 2) and
Vulture (Table 3).
In general, the sampling date significantly affected the relative expression of CHS2,
UFGT and AM3. The relative expression of CHS2 was significantly higher on the second
sampling date (Figure 35), UFGTʼs expression level was significantly higher in the first
sampling date (veraison) than in the second and third (Figure 36). The relative expression
levels of AM3 were similar in the first two sampling dates, but it was significantly lower on
the last date (ripeness) (Figure 37). In general the sampling date ha no significant effect on
78
Figure 36. The mean expression relative to GADPH of the UFGT gene during Aglianico ripening. Error bars indicate MDS.
256 270 276
UFGT
days
2^!DCt
0.00
0.05
0.10
0.15
Figure 35. The mean expression relative to GADPH of the CHS2 gene during Aglianico ripening. Error bars indicate MDS.
256 270 276
CHS2
days
2^!DCt
0.0
0.2
0.4
0.6
0.8

the expression levels of the other genes of
the flavonoid pathway analysed in this work.
In general, shading significantly affected the
expression level of CHS2, F3H and LAR2.
The expression levels of these genes were
significantly lower in the berry skin of shaded
cluster (Figures 38, 39 and 40). The other
genes analysed in this work showed no
significant difference related in general to the
treatment.
Generally, biotype significantly influenced the
relative expression of a few of the genes analysed in this work. CHS2 was significantly
more expressed in Vulture grapes, while Taburno and Taurasi showed similar and lower
expression levels (Figure 41); F3ʼ5ʼH showed the same expression pattern: higher
expression in Vulture and lower expression in Taburno and Taurasi (Figure 42); F3ʼH was
79
Figure 37. The mean expression relative to GADPH of the AM3 gene during Aglianico ripening. Error bars indicate MDS.
256 270 276
AM3
days
2^!DCt
0.00
0.05
0.10
0.15
Exposed Shaded
CHS2
treatment
2^−D
Ct
0.0
0.1
0.2
0.3
0.4
0.5
0.6
0.7
Figure 38. The mean expression relative to GADPH of the CHS2 gene in exposed (red) and shaded (green) Aglianico grapes. Error bars indicate MDS.
Exposed Shaded
F3H
treatment
2^−D
Ct
0.0
0.1
0.2
0.3
0.4
Figure 39. The mean expression relative to GADPH of the F3H gene in exposed (red) and shaded (green) Aglianico grapes
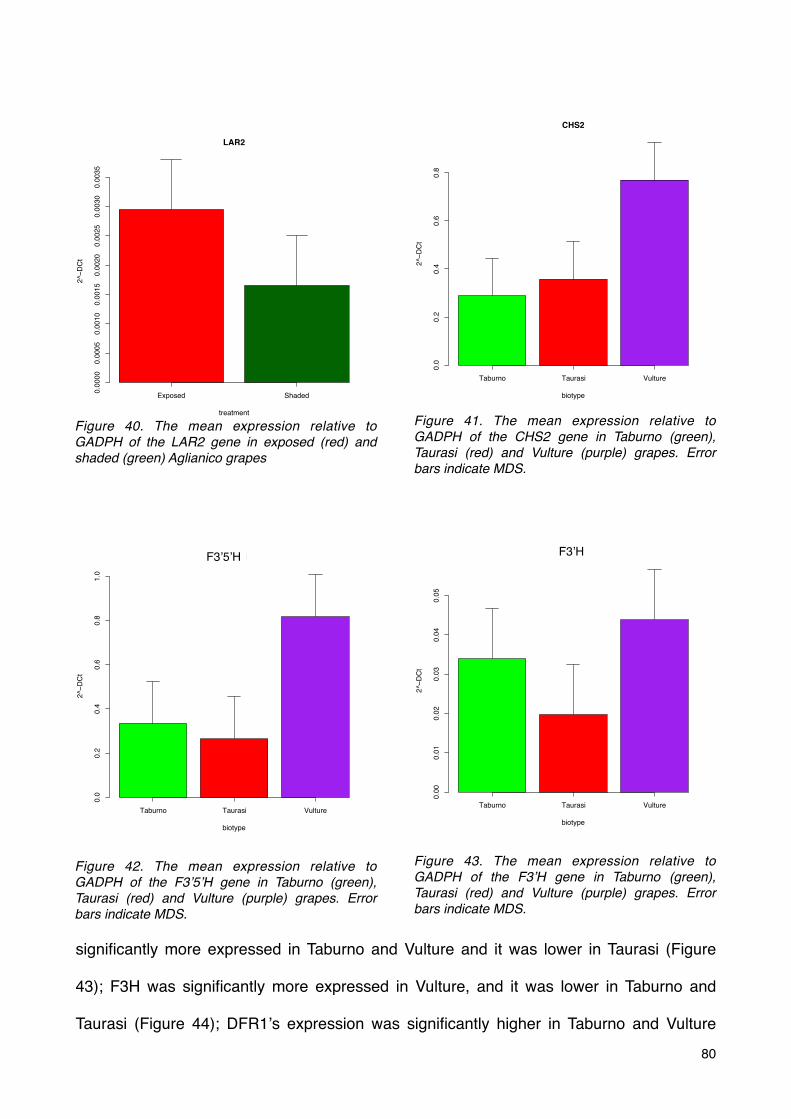
significantly more expressed in Taburno and Vulture and it was lower in Taurasi (Figure
43); F3H was significantly more expressed in Vulture, and it was lower in Taburno and
Taurasi (Figure 44); DFR1ʼs expression was significantly higher in Taburno and Vulture
80
Exposed Shaded
LAR2
treatment
2^−D
Ct
0.0000
0.0005
0.0010
0.0015
0.0020
0.0025
0.0030
0.0035
Figure 40. The mean expression relative to GADPH of the LAR2 gene in exposed (red) and shaded (green) Aglianico grapes
Taburno Taurasi Vulture
CHS2
biotype
2^−D
Ct
0.0
0.2
0.4
0.6
0.8
Figure 41. The mean expression relative to GADPH of the CHS2 gene in Taburno (green), Taurasi (red) and Vulture (purple) grapes. Error bars indicate MDS.
Figure 42. The mean expression relative to GADPH of the F3ʼ5ʼH gene in Taburno (green), Taurasi (red) and Vulture (purple) grapes. Error bars indicate MDS.
Taburno Taurasi Vulture
F3.5.H
biotype
2^−D
Ct
0.0
0.2
0.4
0.6
0.8
1.0
F3ʼ5ʼH
Figure 43. The mean expression relative to GADPH of the F3ʼH gene in Taburno (green), Taurasi (red) and Vulture (purple) grapes. Error bars indicate MDS.
Taburno Taurasi Vulture
F3.H
biotype
2^−D
Ct
0.00
0.01
0.02
0.03
0.04
0.05
F3ʼH

and lower in Taurasi (Figure 45); LDOX1 showed significantly lower expression levels in
Taurasi and higher expression in Taburno and Vulture (Figure 46); AM3 and AM1 were
significantly more expressed in Taburno and Vulture than Taurasi (Figures 47 and 48); the
relative expression levels of GST4 were higher in Vulture and lower in Taurasi and Vulture
(Figure 49). In general, FLS4, LAR2, UFGT, OMT, MYB12, MYB5a, MYB5b and MYBA1 81
Taburno Taurasi Vulture
F3H
biotype
2^−D
Ct
0.0
0.1
0.2
0.3
0.4
0.5
Figure 44. The mean expression relative to GADPH of the F3H gene in Taburno (green), Taurasi (red) and Vulture (purple) grapes. Error bars indicate MDS.
Taburno Taurasi Vulture
DFR1
biotype
2^−D
Ct
0.00
0.01
0.02
0.03
0.04
0.05
0.06
0.07
Figure 45. The mean expression relative to GADPH of the DFR1 gene in Taburno (green), Taurasi (red) and Vulture (purple) grapes. Error bars indicate MDS.
Taburno Taurasi Vulture
LDOX1
biotype
2^−D
Ct
0.0
0.1
0.2
0.3
0.4
0.5
Figure 46. The mean expression relative to GADPH of the LDOX1 gene in Taburno (green), Taurasi (red) and Vulture (purple) grapes. Error bars indicate MDS.
Taburno Taurasi Vulture
AM3
biotype
2^−D
Ct
0.00
0.05
0.10
0.15
Figure 47. The mean expression relative to GADPH of the AM3 gene in Taburno (green), Taurasi (red) and Vulture (purple) grapes. Error bars indicate MDS.

showed no significant difference in the average relative expression levels in Taburno,
Taurasi and Vulture.
82
Taburno Taurasi Vulture
AM1
biotype
2^−D
Ct
0.000
0.001
0.002
0.003
0.004
0.005
0.006
0.007
Figure 48. The mean expression relative to GADPH of the AM1 gene in Taburno (green), Taurasi (red) and Vulture (purple) grapes. Error bars indicate MDS.
Taburno Taurasi Vulture
GST4
biotype
2^−D
Ct
0.00
0.05
0.10
0.15
0.20
Figure 49. The mean expression relative to GADPH of the GST4 gene in Taburno (green), Taurasi (red) and Vulture (purple) grapes. Error bars indicate MDS.
256 270 276
ExposedShaded
F3H
days*treatment
2^−D
Ct
0.0
0.2
0.4
0.6
0.8
1.0
Figure 51. The mean expression relative to GADPH of the F3H gene in shaded (green) and exposed (red) ripening grapes. Error bars indicate MDS.
256 270 276
ExposedShaded
F3.5.H
days*treatment
2^−D
Ct
0.0
0.5
1.0
1.5
2.0
2.5
F3ʼ5ʼH
Figure 50. The mean expression relative to GADPH of the F3ʼ5ʼH gene in shaded (green) and exposed (red) ripening grapes. Error bars indicate MDS.

The sampling date and the treatment
significantly affected the expression
pattern of F3ʼ5ʼH: in exposed berries,
the relative expression of this gene was
significantly higher at veraison and then
it was lower towards ripening, in the
shaded berries the expression was
constant during the whole ripening
period, and it was lower than in the
exposed berries in the first sampling
date (Figure 50). F3H showed the same
expression pattern: higher expression at veraison in the exposed berries while constant
expression in the shaded grapes (Figure 51). FLS4 was more expressed in exposed
berries in the first two sampling dates, showing a significantly higher expression in the
second date, while the expression in shaded and exposed bunches was the same in the
last sampling date (Figure 52). in The sampling date and treatment interaction did not
significantly affected the expression pattern of the other genes analysed in the present
work.
The sampling date and the biotype influenced the expression pattern of CHS2,
DFR1, LDOX1, AM1, AM3 and MYB5a. On the first sampling date, Vulture and Taurasi
showed no significant difference for CHS2; on the second sampling date the relative
expression of CHS2 where highest in Vulture, lowest in Taburno and intermediate in
Taurasi; on the last sampling date Taurasi and Taburno had similar levels and Vulture was
slightly higher. In Taurasi and Vulture the expression levels of CHS2 were significantly
higher on the second sampling date, while no significant difference in the sampling dates
was shown by Taburno (Figure 53). The expression of DFR1 was constant in Taurasi and 83
256 270 276
ExposedShaded
FLS4
days*treatment
2^−D
Ct
0.00
0.01
0.02
0.03
0.04
0.05
0.06
Figure 52. The mean expression relative to GADPH of the FLS4 gene in shaded (green) and exposed (red) ripening grapes. Error bars indicate MDS.

Vulture, while it showed a decrease in Taburno grapes (Figure 54). The expression pattern
of LDOX1 was constant in Taurasi during the whole ripening period; In Vulture, showed a
U-shaped pattern, being significantly higher relative expression levels at veraison and
harvest, and a lower level on the second date; In Taburno, LDOX1 showed higher
84
256 270 276
TaburnoTaurasiVulture
CHS2
days*biotype
2^−D
Ct
0.0
0.5
1.0
1.5
2.0
Figure 53. The mean expression relative to GADPH of the CHS2 gene in Taburno (green), Taurasi (red) and Vulture (purple) ripening grapes. Error bars indicate MDS.
256 270 276
TaburnoTaurasiVulture
DFR1
days*biotype
2^−D
Ct
0.00
0.02
0.04
0.06
0.08
0.10
0.12
0.14
Figure 54. The mean expression relative to GADPH of the DFR1 gene in Taburno (green), Taurasi (red) and Vulture (purple) ripening grapes. Error bars indicate MDS.
256 270 276
TaburnoTaurasiVulture
LDOX1
days*biotype
2^−D
Ct
0.0
0.2
0.4
0.6
0.8
1.0
Figure 55. The mean expression relative to GADPH of the LDOX1 gene in Taburno (green), Taurasi (red) and Vulture (purple) ripening grapes. Error bars indicate MDS.
256 270 276
TaburnoTaurasiVulture
AM1
days*biotype
2^−D
Ct
0.000
0.002
0.004
0.006
0.008
0.010
0.012
Figure 56. The mean expression relative to GADPH of the AM1 gene in Taburno (green), Taurasi (red) and Vulture (purple) ripening grapes. Error bars indicate MDS.

expression levels on the second date and decreased towards ripening (Figure 55). The
expression pattern of AM1 was significantly different in Taburno, showing a decrease,
while it was constant in Vulture and Taurasi (Figure 56). The same pattern was shown by
AM2 (Figure 57). MYB5a relative expression was significantly higher in Vulture on the
second sampling date and in Taburno on the final sampling date (Figure 58).
The three-way interaction (day*biotype*treatment) showed significant diffeences in
the expression patterns of four genes. Vulture shaded grapes showed low expression
levels of F3ʼ5ʼH at veraison, but the expression of this gene was higher towards veraison;
conversely, the expression of F3ʼ5ʼH showed a significant peak at veraison and then
decreased in exposed Vulture berries; similarly, but less significantly, there was a decrease
in exposed and shaded Taburno; exposed and shaded Taurasi resulted similar and
constant during ripening (Figure 59). F3ʼH expression was constant throughout the whole
ripening period, in all conditions, except for a peak in the expression level in shaded
Vulture on the second sampling date (Figure 60). F3H showed a pattern very similar to
the one shown by F3ʼ5ʼH (Figure 61). The expression levels of AM3 were significantly
85
256 270 276
TaburnoTaurasiVulture
AM3
days*biotype
2^−D
Ct
0.00
0.05
0.10
0.15
0.20
0.25
0.30
0.35
Figure 57. The mean expression relative to GADPH of the AM3 gene in Taburno (green), Taurasi (red) and Vulture (purple) ripening grapes. Error bars indicate MDS.
256 270 276
TaburnoTaurasiVulture
MYB5a
days*biotype
2^−D
Ct
0.00
0.05
0.10
0.15
0.20
0.25
0.30
Figure 58. The mean expression relative to GADPH of the MYB5a gene in Taburno (green), Taurasi (red) and Vulture (purple) ripening grapes. Error bars indicate MDS.

higher in shaded Vulture and shaded and exposed Taburno grapes on the first and second
date, and decreased towards the third date (Figure 62).
86
F3.5.H
days*biotype*treatment
2^−D
Ct
256 270 276
0.0
0.5
1.0
1.5
2.0
2.5
Taburno_ExposedTaburno_ShadedTaurasi_ExposedTaurasi_ShadedVulture_ExposedVulture_Shaded
Figure 59. The expression relative to GADPH of the F3ʼ5ʼH gene in exposed Taburno (green), shaded Taburno (dotted green), exposed Taurasi (red), shaded Taurasi (dotted red), exposed Vulture (purple) and shaded Vulture (purple) during grape ripening. Error bars indicate MDS.
F3ʼ5ʼH F3.H
days*biotype*treatment
2^−D
Ct
256 270 276
0.00
0.05
0.10
0.15
Taburno_ExposedTaburno_ShadedTaurasi_ExposedTaurasi_ShadedVulture_ExposedVulture_Shaded
Figure 60. The expression relative to GADPH of the F3ʼH gene in exposed Taburno (green), shaded Taburno (dotted green), exposed Taurasi (red), shaded Taurasi (dotted red), exposed Vulture (purple) and shaded Vulture (purple) during grape ripening. Error bars indicate MDS.
F3ʼH
AM3
days*biotype*treatment
2^−D
Ct
256 270 276
0.0
0.1
0.2
0.3
0.4
Taburno_ExposedTaburno_ShadedTaurasi_ExposedTaurasi_ShadedVulture_ExposedVulture_Shaded
Figure 62. The expression relative to GADPH of the AM3 gene in exposed Taburno (green), shaded Taburno (dotted green), exposed Taurasi (red), shaded Taurasi (dotted red), exposed Vulture (purple) and shaded Vulture (purple) during grape ripening. Error bars indicate MDS.
F3H
days*biotype*treatment
2^−D
Ct
256 270 276
0.0
0.2
0.4
0.6
0.8
1.0
1.2 Taburno_Exposed
Taburno_ShadedTaurasi_ExposedTaurasi_ShadedVulture_ExposedVulture_Shaded
Figure 61. The expression relative to GADPH of the F3H gene in exposed Taburno (green), shaded Taburno (dotted green), exposed Taurasi (red), shaded Taurasi (dotted red), exposed Vulture (purple) and shaded Vulture (purple) during grape ripening. Error bars indicate MDS.

The ratio of the cumulative relative expression of F3ʼ5ʼH and F3ʼH and of F3ʼ5ʼH and
UFGT were calculated (Castellarin and Di Gaspero, 2007). The F3ʻ5ʻH/F3ʻH ratio was
significantly higher in exposed berries towards veraison and it decreased during ripening;
shaded berries showed a constant pattern for this index (Figure 63). The F3ʼ5ʼH/UFGT
ratio increased during ripening showing no difference between shaded and exposed
bunches (Figure 64).
87
0!
10!
20!
30!
40!
50!
60!
70!
256! 270! 276!
days!
F3'5'H/F3'H!
Exposed! Shaded!
Figure 63. The evolution of the ratio between the relative expression of the F3ʼ5ʼH and F3ʼH loci. Error bars indicating MDS.
0!
5!
10!
15!
20!
25!
30!
256! 270! 276!
days!
F3'5'H/UFGT!
Exposed! Shaded!
Figure 64. The evolution of the ratio between the relative expression of the F3ʼ5ʼH and UFGT loci. Error bars indicating MDS.

Discussion
The effect of cluster shading on the flavonoid pathway
Light is the energy supply of plants, thus one of the most important environmental
factors. It influences a great number of plantsʼ primary physiological processes, including
photosynthesis, flower induction and seed germination. (Jiao et al., 2007). Several works
investigated the effect of bunch exposure on the accumulation of flavonoid in grape berries
(Sparvoli et al., 1994; Price et al., 1995; Haselgrove et al., 2000); Bergqvist et al., 2001;
Gollop et al., 2002; Spayd et al., 2002; Downey et al., 2004; Jeong et al., 2004; Cortell and
Kennedy, 2006; Fujita et al., 2006; Pereira et al., 2006; Rustioni et al., 2006; Fujita et al.,
2007; Ristic et al., 2007; Guo et a., 2008; Tarara et al., 2008; Matus et al., 2009). However
results have been in some cases contradictory. Moreover, the role of light on the
expression of key genes of the pathway has not yet been established. The effect of light
exclusion applied to the grape bunch was investigated in the present work. Grape clusters
from three different Vitis vinifera Aglianico biotypes (Taburno, Taurasi and Vulture),
cultivated in similar agronomic conditions in the same experimental vineyard, were treated
with a shading screen before veraison. In the same time, control grapes were fully expose
to sunlight with leaf removal.
The shading treatment showed little or no effect on berry weigh, but it positively
affected berry skin weight and the skin/berry weight ratio. The accumulation pattern of
sugars and the evolution pattern of pH and titrable acidity show that the shading treatment
caused a initial delay in the onset of ripening. However, shaded bunches showed a faster
rate of sugar accumulation and acid consumption, so the differences between shaded and
exposed grapes were reduced, or even cancelled, towards the end of ripening. This
88
indicates that shading generally induced a delay of the onset of ripening, but in the mean
time shaded berries showed a sort of “recovery” phenomena in the second part of
ripening.
The effect of shading on flavonoid kinetics.
In this experiment, exposed berries accumulated more polyphenols, and particularly
more flavonoids, than shaded berries. However the differences between shaded and
exposed bunches were larger at veraison and smaller towards harvest, suggesting that
shading caused a delay in the start of flavonoid synthesis, but that, somehow, polyphenol
accumulation was faster in shaded berries, thus showing a sort of recovery in the second
part of ripening of ripening.
In this work, shading significantly reduced the accumulation of total anthocyanins in
Aglianico grapes. A similar result was observed in other cultivar such as Merlot (Spayd et
al., 2002; Pereira et al; 2006), Cabernet Sauvignon (Bergqvist et al., 2001; Jeong et al.,
2004; Matus et al., 2009), Shiraz (Downey et al., 2004) and Grenache (Bergqvist et al.,
2001). The differences in the anthocyanin accumulation indicate that in this experiment,
the shading treatment induced a later onset of pigment accumulation. Towards maturity
the differences in anthocyanin concentration of shaded and exposed bunches were
smaller, indicating that accumulation was faster in shaded grapes. In other works it was
observed a similar phenomena, and in some cases shaded bunches reached the same
anthocyanin concentration as the exposed bunches (Downey et al., 2004; Rustioni et al.,
2006; Ristic et al., 2007). Our results could confirm that the effect of shading is stronger
towards the onset of ripening, delaying the pigment accumulation, rather than in the late
stages of ripening. At the same time, shaded grapes show a higher efficiency towards the
89
end of ripening. The molecular basis of the “recovery” phenomena are not clear: it could
due to a faster synthesis, as well as to a different rate in anthocyanin catabolism.
In this experiment, the anthocyanin profiling of Aglianico showed no significant shift
due to bunch shading. The proportion of the single anthocyanidins, the trisubstituted
\disubstituted anthocyanin ratio and the glucoside\acylate anthocyanin ratio showed no
significant change in exposed and shaded berries. However, many works reported a shift
in the anthocyanin profiling correlated to light exposure in several varieties. The shift often
consisted in an increase of the proportion of disubstituted anthocyanin and of acylated
anthocyanins (Downey et al., 2004; Rustioni et al., 2006; Cortell and Kennedy, 2006,
Matus et al., 2009). This experiment suggests that the anthocyanin profile of Aglianico is
very stable towards light.
The accumulation pattern of total tannins in in some way resulted opposed to that of
anthocyanins: in this case the differences between exposed and shaded bunches was
bigger towards the end of ripening, exposed bunches accumulating more tannins in the
skin. A similar result was obtained in Pinot Noir (Cortell and Kennedy, 2006) and in Shiraz
(Downey et al., 2004; Ristic et al., 2006) grapes. Taken together, these results suggest
that there is a positive effect of light exposure on the accumulation of total tannins in grape
berries.
90
The effect of shading on the transcription of the genes of the flavonoid
pathway
Structural genes:
In this work all the genes of the pathway were steadily expressed during berry
ripening. In particular UFGT and AM3 where more expressed at the beginning of ripening,
and this is consistent with the higher speed of anthocyanin accumulation in the early
stages of berry ripening.
CHS2 and F3H were generally up-regulated in exposed bunches; in particular F3H
was more expressed in exposed berries at the beginning of ripening. This consistent with
the with the higher accumulation of polyphenols, flavonoid, anthocyanins, tannins in
exposed berries, as well as with the results shown in previous works (Sparvoli et al., 1994,
Jeong et al., 2004 and Matus et al., 2009). However, these authors showed that light
induced the expression also of the downstream genes of the pathway, namely DFR,
LDOX, OMT and UFGT. In the experimental conditions of this work, DFR, LDOX1, LAR2
and OMT showed no significant change in the relative expression pattern in shaded and
exposed berries. Surprisingly, in this work also the expression of UFGT was unaffected by
the treatment. A similar result was reported in Shiraz grapes (Downey et al., 2004); t.
The highest concentration of anthocyanin in exposed berries, however, is hardly
explained solely by the pattern of CHS2 and F3H. Several work pointed out that a higher
expression of UFGT leads to a higher anthocyanin concentration (Jeong 2004; Matus
2009). Moreover, shaded bunches, although having an overall lower concentration of
anthocyanins, showed a faster anthocyanin accumulation rate in the second part of
ripening. However, no gene was up-regulated in the shaded bunches at any time. Hence,
the “recovery” phenomena exhibited by shaded bunches finds no explanation in the
91
transcriptional pattern. Taking in due account these considerations, it is likely that the
effect of light on the accumulation of flavonoids in grape berries might be explained also by
other mechanisms. It can be reasonably speculated that one possiblity is a differential
post-transcriptional regulation induced by light/shading, another one could be a different
effect of light/shading on the catabolism of anthocyanins. More work is needed to verify
these hypotheses.
Many works, shading induced a shift in the anthocyaninin profiling, particularly in the
proportion of trisubstituted and disubstituted anthocyanins. The distribution of this ratio is
associated to the expression of F3ʻ5ʻH and F3ʻH, responsible for the hydroxylation of the
flavonoid B-ring. However, to our knowledge, there is no report on the effect of shading on
the transcriptional expression of the Fʼ3ʼ5ʼH and F3ʼH genes in grapes. Castellarin and Di
Gaspero, in 2007, showed that the F3ʼ5ʼH/UFGT and F3ʼ5ʼH/F3ʼH ratios are strongly
correlated to distribution of the proportion of trisubstituted and disubstituted anthocyanins
in several grape varieties. High ratios correspond to higher percentage of trisubstituted
anthocyanins in the berries. In this experiment the F3ʼ5ʼH/UFGT ratio increased steadily
during ripening with no significant change induced by treatment. This is consistent with the
stability and the high proportion of malvidin, petunidin and delphinidin shown by Aglianicoʼs
anthocyanin profiling. The F3ʼ5ʼH/F3ʼH ratio was significantly affected by the shading
treatment, however only at the beginning of ripening, with no effect, though, on the final
anthocyanin composition. A possible explanation for this is that the effect of light was lower
in the second part of ripening.
These findings suggest that the F3ʼ5ʼH/UFGT and F3ʻ5ʻH/F3ʻH ratios might be
important in determining the stability to light of Aglianicoʼs anthocyanin profiling. However,
this needs further investigation. Furthermore, post-transcriptional regulation and a
92
differential specificity and activity of the enzymes of the flavonoid synthesis of this cultivar
also might be involved in the determination of the anthocyanin profiling.
In this work the expression pattern of FLS4 and MYB12 resulted higher in exposed
berries, although not always significantly. Nevertheless, it is well established that light has
a positive effect on flavonol synthesis (Price et al., 1995; Haselgrove et al., 2000; Spayd et
al., 2002; Downey et al., 2004; Pereira et al., 2006; Cortell and Kennedy, 2006; Tarara et
al., 2008). Moreover, the expression of FLS4 was positively influenced by light in Shiraz,
Cabernet Sauvignon and Merlot (Downey et al., 2004; Fujita et al., 2006; Matus et al.,
2009). The, the results obtained in this work are consistent with current literature, for what
concerns the expression of FLS4 and its putative regulator MYB12, confirming a positive
effect of light.
Shading showed a negative effect on the accumulation of total tannins. This is
consistent with the expression of LAR2, that was significantly more expressed in the
exposed bunches. A similar result was obtained also by Fujita et al., in 2007. This suggest
that exposure to light positively influences the expression of the LAR2 gene in grape
berries.
Transcription factors:
In this experiment the shading treatment showed no effect on the transcription factors
MYB5a, MYB5b and MYBA1. This is consistent with the expression of DFR, LDOX1,
UFGT and OMT. In a previous work MYBA1 and MYB5a were up-regulated by bunch
exposure (Matus 2009). More work is needed to understand the effect of light on these
transcription factors
93

Anthocyanin Transporters:
To date, this is the first report about the effect of shading on the expression of these
transporters in the grapevine. The relative expression levels of AM1, AM2 and GST4
showed no significant difference between shaded and exposed clusters. This was
consistent with the relative accumulation pattern of acylated anthocyanins. This work
suggests that bunch exposure does not have a major role in the regulation of the
expression level of these transporters. However, the anthocyanin profiling of Aglianico is
particularly stable to light. AM1 and AM3 are involved in the transport of acylated
anthocyanins (Gomez et al., 2009), so it is likely that AM1, AM3 may show a different
behaviour in other cultivars, as shading often induces a shift in the proportion of acylated
anthocyanins.
The expression of the flavonoid pathway in three
monophyletic Aglianico biotypes.
Aglianico is one of the most important red grape varieties in Southern Italy. Three
different biotypes are traditionally recognised for this variety. Each biotype is named after
the historical growing region: “Aglianico di Taurasi”, “Aglianico del Taburno” and “Aglianico
del Vulture”. These biotypes were differentiated through the patient selection work of
farmers, choosing over the centuries the best plants in each territory that were more
suitable for the environmental peculiarities of each region and more respondent to the
farmers expectations. The genetic identity of these biotypes was confirmed by DNA
fingerprinting (Costantini et al., 2005). The phenotypic differences shown by the biotypes
are due to mutations and epigenetic modifications of the same original genotype. In order
to asses possible differences in polyphenol kinetics and in the expression of the genes of
94
the flavonoid pathway, the three biotypes were studied in an experimental vineyard in the
2008 campaign.
Vulture showed a slightly smaller berry compared to Taurasi and Taburno, and this is
consistent with current litterature (SeSirca, 2001, Simone Di Lorenzo 2009). However the
skin weight and the skin/berry rate showed no significant differences among biotypes at
harvest.
The patterns of sugar accumulation and of pH and titrable acidity evolution show
clearly a different timing of the onset of ripening in Taburno. However, after the delay, the
ripening kinetic seem faster as Taburno reaches the same final levels as Taburno and
Vulture.
Taburno shows a different timing also in the total polyphenol, total flavonoids and in
the non anthocyanin flavonoid accumulation kinetic. The levels of these metabolites in
Taburno are lower in the beginning of ripening, but there is no significant difference among
Taburno, Taurasi and Vulture towards the end of ripening.
Taburno, Taurasi and Vulture showed no difference in the final concentration of total
tannins in the skin at harvest. This is in contrast with previous reports (Moio et al., 2004).
However, Taburno showed a different pattern, as it had very low tannins towards veraison,
but it reached the same level as Vulture and Taurasi at harvest.
It was previously reported that Vulture accumulated the most anthocyanins, Taburno
the least and that Taurasi had an intermediate behaviour (Moio et al., 2004). Indeed,
Taburno showed a delay in the synthesis of pigments, but the accumulation rate of
anthocyanins was higher in this biotype towards the end of ripening, thus, in the
experimental conditions of this work, no significant difference was shown in the final
accumulation of anthocyanins among the biotypes.
95

No significant difference was shown in the anthocyanin profiling of the three biotypes.
In this work, the average anthocyanin profiling of Aglianico was composed by 82% of
malvidin, 6% of delphinidin, 7% of petunidin, 5% of peonidin and less than 1% of cyanidin;
78% of free anthocyanins and 22% of acylated anthocyanins. This result is consistent with
other previously published aglianico anthocyanin profiling (Lovino et al., 2005; Suriano et
al., 2005; Mattivi et al., 2006). The results of this work indicate that aglianico anthocyanin
profiling is very stable in different biotypes and in different conditions.
In this experiment, the average expression levels of CHS2, F3ʼ5ʼH, F3ʼH, F3H, DFR,
LDOX1, AM1, AM3 and GST4 were generally higher in Vulture and lower in Taurasi; in
Taburno, the expression levels of F3ʼH, DFR1, LDOX1, AM1 and AM3 where higher, while
those of CHS2, F3ʼ5ʼH, F3H, and GST4 were lower. To the higher expression levels of
these genes in Vulture it did not correspond a higher concentration of flavonoids in the
berries, compared to the other biotypes. However, the downstream genes of the pathway
(i.e. UFGT, OMT, FLS4) showed no significant difference among biotypes. Castellarin et
al., 2007 showed a strong correlation between the relative expression levels of UFGT and
the concentration of anthocyanins.Together with the result of this work, it suggest that they
might have a more important role in determining the final concentration of anthocyanins.
DFR1, LDOX1, AM1 and AM3 showed a different trend in among biotypes: they were
virtually constantly expressed in Taurasi and Vulture, while they showed significant peak in
the second date in Taburno, and a lower level towards harvest. No significant change
occurred among biotypes in the final concentration of flavonoids, however Taburno
showed a significantly different timing in the ripening kinetics. The expression patterns of
some of the genes show a different pattern in Taburno, this could be a symptom of a
different temporal control of the pathway in this biotype.
96
Conclusions
The three biotypes of Aglianico showed no significant difference in the levels of
primary and secondary at harvest, nor in the anthocyanin profiling. However they showed
a different ripening kinetic. In particular, Taburno showed a delay in the onset of ripening,
followed by a full recovery at the end of the ripening process. The expression pattern of
the genes of the flavonoid pathway showed some differences in the three biotypes,
however these differences might be due to the different timing shown by the biotypes.
The pattern shown by sugars, acids and phenolic compounds kinetics suggest that
the shading treatment caused generally a delay in the onset of ripening. However, shaded
bunches shower a faster accumulation of primary and secondary metabolites in the
second part of ripening, partially or totally recovering the initial delay. The expression of
CHS2, F3H, FLS4 and LAR2 are consistent with the higher accumulation of phenolics, and
particularly of tannins, shown in the exposed berries. However, in the experimental
conditions of this work, the shading treatment showed no significant effect in the
transcription levels of of the genes of the structural and regulatory genes of the flavonoid
pathway, and particularly particularly of UFGT. More over, no explanation of the recovery
shown by the shaded berries was found in the analysed gene patterns. This suggests that
the effect of light is not exerted only at the transcriptional level.
In many works, shading induced a shift in the anthocyanin profiling. However,
Aglianico showed a very stable anthocyanin profiling and no significant shift was induced
by light. This was supported by the similar F3ʼ5ʼH/UFGT (and partially by the F3ʼ5ʼH/F3ʼH
ratio) ratio expressed by shaded and exposed bunches.
97

The effect of cluster shading on the expression of AM1, AM3 and GST4 was for time
reported. The relative expression levels of these genes resulted unaffected by the
treatment, however more work is needed to elucidate the role of light in the regulation of
these transporters.
98

AcknowledgmentI thank Prof. Attilio Scienza and Prof Osvaldo Failla for their support and guidance
during my PhD work.Thanks also to Mara Rossoni PhD and Fabio Nocito PhD for the help
in the realisation of the metbolic and gene expression profiling. Thanks also the wine
estate Feudi di San Gregorio of Sorbo Serpico (Avellino), for funding this research.
A special thank also to all my PhD student fellow colleagues.
99
Bibliography
1) Agati G, Tattini M. (2010) Multiple functional role of flavonoids in photoprotection.
New Phytologist, 186(4): 786-793.
2) Ageorges A, Fernandez L, Vialet S, Merdinoglu D, Terrier N, Romieu C. (2006) Four
specific isogenes of the anthocyanin metabolic pathway are systematically co-
expressed with the red colour of grape berries. Plant Science 170: 372–383.
3) Azuma A, Kobayashi S, Goto-Yamamoto N, Shiraishi M, Mitani N, Yakushiji H,
Koshita Y. (2009) Color recovery in berries of grape (Vitis vinifera L.) ʻBenitakaʼ, a
bud sport of ʻItaliaʼ, is caused by a novel allele at the VvmybA1 locus. Plant Science
176: 470–478.
4) Azuma A, Kobayashi S, Mitani N, Shiraishi M, Yamada M, Ueno T, Kono A, Yakushiji
H, Koshita Y. (2008) Genomic and genetic analysis of Myb-related genes that
regulate anthocyanin biosynthesis in grape berry skin. Theoretical and Applied
Genetics 117: 1009–1019.
5) Bate-Smith EC. (1975) Phytochemistry of proanthocyanidins. Phytochemistry 14(4):
1107-1113.
6) Bavaresco L, Fregoni C. (2000) Physiological role and molecular aspects of
grapevine stilbenic compounds. In Molecular biology and biotechnology of grapevine
(Roubelakis-Angelakis KA, ed):153-182.
7) Bergqvist J, Dokoozlian N, Ebisuda N. (2001) Sunlight Exposure and Temperature
Effects on Berry Growth and Composition of Cabernet Sauvignon and Grenache in
100
the Central San Joaquin Valley of California. American Journal of Viticulture and
Enology 52(1): 1-7.
8) Bisson L. (2001) In search of optimal grape maturity. Pract Winery Vineyard Jul/Aug:
32–43.
9) Bogs J, O. Downey M, S. Harvey J, Ashton AR, Tanner GJ, Robinson SP. (2005)
Proanthocyanidin Synthesis and Expression of Genes Encoding Leucoanthocyanidin
Reductase and Anthocyanidin Reductase in Developing Grape Berries and
Grapevine Leaves. Plant Physiology 139: 652–663.
10) Bogs J, Ebadi A, McDavid D, Robinson SP. (2006) Identification of the Flavonoid
Hydroxylases from Grapevine and Their Regulation during Fruit Development. Plant
Physiology 140: 279–291.
11) Borovsky Y, Oren-Shamir M, Ovadia R, De Jong W, Paran I. (2004) The A locus that
controls anthocyanin accumulation in pepper encodes a MYB transcription factor
homologous to Anthocyanin of Petunia, Theoretical and Applied Genetics 109: 23–
29.
12) Boselli M. (2003) Gli Ambienti Campani. Viticolture 2: 61-112.
13) Boss PK, Davies C, Robinson SP. (1996) Analysis of the Expression of Anthocyanin
Pathway Genes in Developing Vitis vinifera 1. cv Shiraz Grape Berries and the
Implications for Pathway Regulation. Plant Physiology 111: 1059-1066.
14) Boulton R. (2001) The Copigmentation of Anthocyanins and Its Role in the Color of
Red Wine: A Critical Review. American Journal of Enology and Viticulture 52(2):
67-87.
101
15) Boyle R. (1664) Experiments and Considerations Touching Colours, with
Observations on a Diamond that Shines in the Dark.
16) Braidot E, Zancani M, Petrussa E, Peresson C, Bertolini A, Patui S, Macrì F, Vianello
A. (2008) Transport and accumulation of flavonoids in grapevine (Vitis vinifera L.)
Plant Signaling & Behavior 3: 9, 626-632.
17) Brouillard R, Dubois JE. (1977) Mechanism of the structural transformations of
anthocyanins in acidic media. Journal of the American Chemical Society 99(5):
1359–1364.
18) Brouillard R, George F, Fougerousse A. (1997) Polyphenols produced during red
wine ageing. Biofactors 6(4): 403-410.
19) Buer CS, Imin N, Djordjevic MA. (2010) Flavonoids: New Roles for Old Molecules.
Journal of Integrative Plant Biology 52(1): 98–111.
20) Caputo AR, Brini ML, Gasparro M, Pepe R, Coletta A, Antonacci D. (2009) Recupero
della biodiversità ampelografica dell'Aglianico a tutela della qualità del paesaggio
viticolo. 32nd World Congress of Vine and Wine.
21) Castellarin SD, Matthews MA, Di Gaspero G, Gambetta GA. (2007) Water deficits
accelerate ripening and induce changes in gene expression regulating flavonoid
biosynthesis in grape berries. Planta 227(1): 101-112.
22) Castellarin SD, Di Gaspero G. (2007) Transcriptional control of anthocyanin
biosynthetic genes in extreme phenotypes for berry pigmentation of naturally
occurring grapevines. BMC Plant Biology 7: 46-55.
23) Chen LJ, Hrazdina G. (1982) Structural transformation reactions of anthocyanins.
Experientia 38.
102

24) Conn S, Curtin C, Bezier A, Franco C, Zhang W. (2008) Purification, molecular
cloning, and characterization of glutathione S-transferases (GSTs) from pigmented
Vitis vinifera L. cell suspension cultures as putative anthocyanin transport proteins.
Journal of Experimental Botany 59(13): 3621–3634.
25) Coombe BG. (1992) Research on Development and Ripening of the Grape Berry.
American Journal of Enology and Viticulture 43(1): 101-110.
26) Coombe BG, McCarthy MG. (2000) Dynamics of grape berry growth and physiology
of ripening. Australian Journal of Grape and Wine Research 6(2):131–135
27) Cortell JM, Kennedy JA. (2006) Effect of Shading on Accumulation of Flavonoid
Compounds in (Vitis vinifera L.) Pinot Noir Fruit and Extraction in a Model System.
American Journal of Agricultural and Food Chemistry 54: 8510−8520.
28) Cortell JM, Halbleib M, Gallagher AV, Righetti TL, Kennedy JA. (2007) Influence of
Vine Vigor on Grape (Vitis vinifera L. Cv. Pinot Noir) Anthocyanins, Anthocyanin
Concentration and Composition in Fruit. American Journal of Agricultural and Food
Chemistry 55: 6575−6584.
29) Costantini L, Monaco A, Vouillamoz JF, Forlani M, Grando MS. (2005) Genetic
relationships among local Vitis vinifera cultivars from Campania (Italy). Vitis 44(1):
25–34.
30) Czemmel S, Stracke R, Weisshaar B, Cordon N, Harris NN, Walker AR, Robinson
SP, Bogs J. (2009) The Grapevine R2R3-MYB Transcription Factor VvMYBF1
Regulates Flavonol Synthesis in Developing Grape Berries. Plant Physiology 151:
1513–1530.
31) Cutanda-Perez MC, Ageorges A, Gomez C, Vialet S, Terrier N, Romieu C, Torregrosa
L. (2009) Ectopic expression of VlmybA1 in grapevine activates a narrow set of 103

genes involved in anthocyanin synthesis and transport. Plant Molecular Biology 69:
633–648.
32) Deluc L, Barrieu F, Marchive C, Lauvergeat V, Decendit A, Richard T, Carde JP,
Merillon JM, Hamdi S. (2006) Characterization of a Grapevine R2R3-MYB
Transcription Factor That Regulates the Phenylpropanoid Pathway. Plant Physiology
140: 499–511.
33) Deluc L, Bogs J, Walker AR, Ferrier T, Decendit A, Merillon JM, Robinson SP, Barrieu
F. (2008) The Transcription Factor VvMYB5b Contributes to the Regulation of
Anthocyanin and Proanthocyanidin Biosynthesis in Developing Grape Berries. Plant
Physiology 147: 2041–2053.
34) Dixon RA, Xie DY, Sharma SB. (2005) Proanthocyanidins – a final frontier in
flavonoid research? New Phytologist 165: 9–28.
35) Dixon RA, Pasinetti GM. (2010) Flavonoids and Isoflavonoids: From Plant Biology to
Agriculture and Neuroscience. Plant Physiology 154: 453–457.
36) Downey MO, Harvey JS, Robinson SP. (2003) Synthesis of flavonols and expression
of flavonol synthase genes in the developing grape berries of Shiraz and Chardonnay
(Vitis vinifera L.). Australian Journal of Grape and Wine Research 9: 110-121.
37) Fournand D, Vicens A, Sidhoum L, Souquet JM, Moutounet M, Cheynier V. (2006)
Accumulation and Extractability of Grape Skin Tannins and Anthocyanins at Different
Advanced Physiological Stages. American Journal of Agricultural and Food
Chemistry 54: 7331−7338.
38) Flint SD, Jordan PW, Caldwell MM. (1985) Plant protective response to enhanced
UV-B radiation under field conditions: leaf optical properties and photosynthesis.
Photochemistry and Photobiology 41(1): 95–99.104
39) Fujita A, Soma N, Goto-Yamamoto N, Shindo H, Kakuta T, Koizumi T, Hashizume K.
(2005) Anthocyanidin Reductase Gene Expression and Accumulation of Flavan-3-ols
in Grape Berry. American Journal of Enology and Viticulture 56(4): 336-342.
40) Fujita A, Goto-Yamamoto N, Aramaki I, Hashizume K. (2006) Orgar-Specigic
transcription of putative flavonol synthase genes of grapevine and effects on plant
hoemones and shading on flavonol biosynthesis in grape berry skins. Bioscience,
Biotechnology and Biochemistry 70(30):632-638.
41) Fujita A, Soma N, Goto-Yamamoto N, Mizuno A, Kiso K, Hashizume K. (2007) Effect
of Shading on Proanthocyanidin Biosynthesis in the Grape Berry. Journal of the
Japanese Society for Horticultural Science 76 (2): 112–119.
42) Fujiwara H, Tanaka Y,Yonekura-Sakakibara K, Fukuchi-Mizutani M, Nakao M,Fukui Y,
Yamaguchi M, Ashikari T, Kusumi T. (1998) cDNA cloning, gene expression and
subcellular localization of anthocyanin 5-aromatic acyltransferase from Gentiana
triflora. The Plant Journal 16(4): 421–431.
43) Gagnéa S, Lacampagnea S, Claissea O, Gény L. (2009) Leucoanthocyanidin
reductase and anthocyanidin reductase gene expression and activity in flowers,
young berries and skins of Vitis vinifera L. cv. Cabernet-Sauvignon during
development. Plant Physiology and Biochemistry 47(4): 282-290.
44) Gambuti A, Rinaldi A, Pessina R, Moio L. (2006) Evaluation of aglianico grape skin
and seed polyphenol astringency by SDS–PAGE electrophoresis of salivary proteins
after the binding reaction. Food Chemistry 97:614–620
45) Gomez C, Terrier N, Torregrosa L, Vialet S, Fournier-Level A, Verries G, Souquet JM,
Mazauric JP, Klein M, Cheynier V, Ageorges A. (2009) Grapevine MATE-Type
105
Proteins Act as Vacuolar H+-Dependent Acylated Anthocyanin Transporters. Plant
Physiology 150: 402–415.
46) Goto-Yamamoto N, Wan GH, Masaki K, Kobayashi S. (2002) Structure and
transcription of three chalcone synthase genes of grapevine (Vitis vinifera). Plant
Science 162: 867-872.
47) Guo J, Han W, Wang MH. (2008) Ultraviolet and environmental stresses involved in
the induction and regulation of anthocyanin biosynthesis. African Journal of
Biotechnology 7(25): 4966-4972.
48) Hanlin RL, Hrmova M, Harbertson JF, Downey MO. (2010) Condensed tannin and
grape cell wall interactions and their impact on tannin extractability into wine.
Australian Journal of Grape and Wine Research 16(1): 173–188.
49) Harbertson JF, Kennedy JA, Adams DO. (2002) Tannin in Skins and Seeds of
Cabernet Sauvignon, Syrah, and Pinot noir Berries during Ripening. American
Journal of Enology and Viticulture 53(1): 54-59.
50) Haselgrove L, Botting D, Van Heeswijck R, Hoj PB, Dry PR, Ford C, Iland PG. (2000)
Canopy microclimate and berry composition: The effect of bunch exposure on the
phenolic composition of Vitis vinifera L cv. Shiraz grape berries. Australian Journal of
Grape and Wine Research 6(2):141-149.
51) He F, Pan QH, Shi Y, Duan CQ. (2008) Biosynthesis and Genetic Regulation of
Proanthocyanidins in Plants. Molecules 13: 2674-2703.
52) German JB, Walzem RL. (2000) The health benefits of wine. Annual Review of
Nutrition 20: 561–93.
106

53) Gollop R, Even S, Colova-Tsolova V, Perl A. (2002) Expression of the grape
dihydroflavonol reductase gene and analysis of its promoter region. Journal of
expreimental botany 53(373): 1397-1409.
54) Hellman A. (2004) How to judge grape ripeness before harvest. Southwest regional
vine & wine conference, Albuquerque.
55) Herderich MJ, Smith PA. (2005) Analysis of grape and wine tannins: Methods,
applications and challenges. Australian Journal of Grape and Wine Research 11(2):
205–214.
56) Hernandez I, Alegre L, Van Breusegem F, Munné-Bosch S. (2009) How relevant are
flavonoids as antioxidants in plants? Trends in Plant Science 4(3): 125-132.
57) Hichria I, Heppel SC, Pillet J, Léon C, Czemmel S, Delrot S, Lauvergeat V, Bogs J.
(2010) The Basic Helix-Loop-Helix Transcription Factor MYC1 Is Involved in the
Regulation of the Flavonoid Biosynthesis Pathway in Grapevine. Molecular Plant
3(3): 509-523.
58) C. Honda, Kotoda N, Wada M, Kondo S, Kobayashi S, Soejima J, Zhang Z, Tsuda T,
Moriguchi T. (2002) Anthocyanin biosynthetic genes are coordinately expressed
during red coloration in apple skin. Plant Physiology and Biochemistry 40(11):
955-962.
59) Hugueney P, Provenzano S, Verriès C, Ferrandino A, Meudec E, Batelli G,
Merdinoglu D, Cheynier V, Schubert A, Ageorges A. (2009) A Novel Cation-
Dependent O-Methyltransferase Involved in Anthocyanin Methylation in Grapevine.
Plant Physiology 150(4): 2057–2070.
60) Jaakola L, Määttä K, Pirttilä AM, Törrönen R, Kärenlampi S, Hohtola A. (2002)
Expression of Genes Involved in Anthocyanin Biosynthesis in Relation to 107
Anthocyanin, Proanthocyanidin, and Flavonol Levels during Bilberry Fruit
Development. Plant Physiology 130: 729-739.
61) Jiao Y, Lau OS, Deng XW. (2007) Light-regulated transcriptional networks in higher
plants. Nature Reviews Genetics 8: 217-230.
62) Jeong ST, Goto-Yamamoto N, Kobayashi S, Esaka M. (2004) Effects of plant
hormones and shading on the accumulation of anthocyanins and the expression of
anthocyanin biosynthetic genes in grape berry skins. Plant Science 167: 247–252.
63) Jeong ST, Goto-Yamamoto N, Hashizume K, Esaka M. (2006) Expression of the
flavonoid 30 -hydroxylase and flavonoid 30 ,50 -hydroxylase genes and flavonoid
composition in grape (Vitis vinifera). Plant Science 170: 61–69.
64) Jeong ST, Goto-Yamamoto N, Hashizume K, Kobayashi S, Esaka M. (2006)
Expression of VvmybA1 Gene and Anthocyanin Accumulation in Various Grape
Organs. American Journal of enology and Viticulture 57(4): 507-510.
65) Jöbstl E, O'Connell J, Fairclough JPA, Williamson MP. (2004) Molecular Model for
Astringency Produced by Polyphenol/Protein Interactions. Biomacromolecules 5(3):
942–949.
66) Johansen W, Wilson RC. (2008) Viral suppressor proteins show varying abilities and
effectiveness to suppress transgene-induced post-transcriptional gene silencing of
endogenous Chalcone synthase in transgenic Arabidopsis. Plant Cell Reports 27(5):
911-921.
67) Kallithraka S, Mamalos A, Makris DP. (2007) Differentiation of young red wines based
on chemometrics of minor polyphenolic constituents.Journal of Agricultural and Food
Chemistry 55(9):3233–3239.
108

68) Kataoka I, Sugiyama A, Beppu K. (2003) Role of Ultraviolet Radiation in
Accumulation of Anthocyanin in Berries of 'Gros Colman' Grapes (Vitis vinifera L.).
Journal of the Japanese Society for Horticultural Science 72(1): 1-6.
69) Kleindt CK, Stracke R, Mehrtens F, Weisshaar B. (2010) Expression analysis of
flavonoid biosynthesis genes during Arabidopsis thaliana silique and seed
development with a primary focus on the proanthocyanidin biosynthetic pathway.
BMC Research Notes 3: 255.
70) Kennedy JA, Matthews MA, Waterhouse AL. (2000) Changes in grape seed
polyphenols during fruit ripening. Phytochemistry 55: 77−85.
71) Kennedy JA, Hayasaka Y, Vidal S, Waters EJ, Jones GP. (2001) Composition of
Grape Skin Proanthocyanidins at Different Stages of Berry Development. Journal of
Agricultural and Food Chemistry 49: 5348−5355.
72) Kennedy JA, Matthews MA, Waterhouse AL. (2002) Effect of Maturity and Vine Water
Status on Grape Skin and Wine Flavonoids. American Journal of Enology and
Viticulture 53(4): 268-274.
73) Kobayashi S, Ishimaru M, Ding CK, Yakushiji H, Goto N. (2001) Comparison of UDP-
glucose:flavonoid 3-O -glucosyltransferase (UFGT) gene sequences between white
grapes (Vitis vinifera) and their sports with red skin. Plant Science 160: 543–550.
74) Kobayashi S, Ishimaru M, Hiraoka K, Honda C. (2002) Myb-related genes of the
Kyoho grape (Vitis labruscana) regulate anthocyanin biosynthesis. Planta 215: 924–
933.
75) Kobayashi S, Goto-Yamamoto N, Hirochika H. (2004) Retrotransposon-Induced
Mutations in Grape Skin Color. Science 304(5673): 982.
109

76) Kobayashi S, Goto-Yamamoto N, Hirochika H. (2005) Association of VvmybA1 gene
expression with anthocyanin production in grape (Vitis vinifera) skin-color mutants.
Journal of the Japanese Society for Horticultural Science 74(3): 196-203.
77) Koes R, Vereij W, Quattrocchio F. (2005), Flavonoids: a colorful model for the
regulation and evolution of biochemical pathways.
78)
79) La Gatta B, Arace E, Gambacorta G, La Notte E, La Notte P. (2007) Phenolic
characterization of some native varieties of grapes and wines from southern Italy.
Acta Horticulturae 754: 65-72.
80) Lacampagne S, Gagné S, Geny L. (2010) Involvement of Abscisic Acid in Controlling
the Proanthocyanidin Biosynthesis Pathway in Grape Skin: New Elements Regarding
the Regulation of Tannin Composition and Leucoanthocyanidin Reductase (LAR) and
Anthocyanidin Reductase (ANR) Activities and Expression. Journal of Plant Growth
Regulation 29: 81–90.
81) Lepiniec L, Debeaujon I, Routaboul JM, Baudry A, Pourcel L, Nesi N and Caboche
M. (2006) Genetics and Biochemistry of Seed Flavonoids. Annual Review of Plant
Biology 57: 405–30.
82) Li J, Ou-Lee ATM, Raba R, Amundson RG, Lasta RL. (1993) Arabidopsis Flavonoid
Mutants Are Hypersensitive to UV-6 lrradiation. The Plant Cell 5: 171-179.
83) Lijavetzky D, Ruiz-García L, Cabezas JA, De Andrés MT, Bravo G, Ibáñez A, Carreño
J, Cabello F, Ibáñez J, Martínez-Zapater JM. (2006) Molecular genetics of berry
colour variation in table grape. Molecular Genetics and Genomics 276: 427–435.
110

84) Limone F. (2000) Caratterizzazione ampelografica di presunti cloni del vitigno
Aglianico. Economia Irpina, n° 3-4/2000.
85) Lovino R, La Notte E, Savino M, Suriano S. (2005) I costituenti polifenolici
dellʼAglianico del Vulture. Studio della loro stabilizzazione con tannini esogeni.
VigneVini n° 1-2/2005.
86) Luo J, Nishiyama Y, Fuell C, Taguchi G, Elliott K, Hill L, Tanaka Y, Kitayama M,
Yamazaki M, Bailey P, Parr A, Michael AJ, Saito K, Martin C. (2007) Convergent
evolution in the BAHD family of acyl transferases: identification and characterization
of anthocyanin acyltransferases from Arabidopsis thaliana. The Plant Journal 50:
678–695.
87) Mattivi F, Zulian C, Nicolini G, Valenti L. (2002) Wine, Biodiversity, Technology, and
Antioxidants. Annals of the New York Academy of Sciences 957: 37–56.
88) Mattivi F, Guzzon R, Vrhovsek U, Stefanini M, Velasco R. (2006) Metabolite Profiling
of Grape: Flavonols and Anthocyanins. Journal of Agricultural and Food Chemistry
54(20): 7692–7702.
89) Matus JT, Aquea F, Arce-Johnson P. Analysis of the grape MYB R2R3 subfamily
reveals expanded wine quality-related clades and conserved gene structure
organization across Vitis and Arabidopsis genomes. BMC Plant Biology 8: 83.
90) Matus JT, Loyola R, Vega A, Pena-Neira A, Bordeu E, Arce-Johnson P, Alcalde JA.
Post-veraison sunlight exposure induces MYB-mediated transcriptional regulation of
anthocyanin and flavonol synthesis in berry skins of Vitis vinifera. Journal of
Experimental Botany 60(3): 853–867.
111

91) Matus JT, Poupin MJ, Canon P, Bordeu E, Alcalde JA, Arce-Johnson P. (2010)
Isolation of WDR and bHLH genes related to flavonoid synthesis in grapevine (Vitis
vinifera L.) Plant Molecular Biology 72: 607–620.
92) Moio L, Gambuti A, Rinaldi A, Strollo D, Erbaggio A, Nifo Sarrapochiello L. (2004) La
frazione polifenolica dellʼuva e del vino Aglianico. Colori, odori ed enologia
dellʼAglianico, Regione Campania Assessorato Agricoltura.
93) Mol J, Grotewold E, Koes R. (1998) How genes paint flowers and seeds. Trends in
plant science 3(6): 212-216.
94) Monagas M, Bartolomé B, Gomez-Cordovés C. (2005) Updated knowledge about the
presence of phenolic compounds in wine. Critical Reviews in Food Science and
Nutrition 45: 85-118.
95) Mori K, Goto-Yamamoto N, Kitayama M, Hashizume K. (2007) Loss of anthocyanins
in red-wine grape under high temperature. Journal of Experimental Botany, 58(8):
1935–1945.
96) Moser C, Gatto P, Moser M, Pindo M, Velasco R.(2004) Isolation of functional RNA
from small amounts of different grape and apple tissues MOLECULAR
BIOTECHNOLOGY 26(2):95-99
97) Ono E, Hatayama M, Isono Y, Sato T, Watanabe R, Yonekura-Sakakibara K, Fukuchi-
Mizutani M, Tanaka Y, Kusumi T, Nishino T, Nakayama T. (2006) Localization of a
flavonoid biosynthetic polyphenol oxidase in vacuoles. The Plant Journal 45: 133–
143.
98) Oren-Shamir M. (2009) Does anthocyanin degradation play a significant role in
determining pigment concentration in plants? Plant Science 177: 310–316.
112

99) Ortega-Regules A, Romero-Cascales I, Lopez-Roca JM, Ros-Garcia JM, Gomez-
Plaza E. Anthocyanin fingerprint of grapes: environmental and genetic variations.
Journal of the Science of Food and Agriculture 86: 1460–1467.
100) Pairoma CF, Walbot V. (2003) Post-transcriptional regulation of expression of the
Bronze 2 gene of Zea mays L. Plant Molecular Biology 53: 75-87.
101) Pereira GE, Gaudillere JP, Pieri P, Hilbert G, Maucourt M, Deborde C, Moing A, Rolin
D. (2006) Microclimate Influence on Mineral and Metabolic Profiles of Grape Berries.
Journal of Agricultural and Food Chemistry 54: 6765−6775.
102) Pilati S, Perazzolli M, Malossini A, Cestaro A, Demattè L, Fontana P, Dal Ri A, Viola
R, Velasco R, Moser C. (2007) Genome-wide transcriptional analysis of grapevine
berry ripening reveals a set of genes similarly modulated during three seasons and
the occurrence of an oxidative burst at vèraison. BMC Genomics 8: 428-450.
103) Price SF, Breen PJ, Valladao M, Watson BT. (1995) Cluster Sun Exposure and
Quercetin in Pinot noir Grapes and Wine. American Journal of Enology and
Viticulture 46(2): 187-194.
104) Quattrocchio F, Wing JF, Leppen HTC, Moi JNM, Koes RE. (1993) Regulatory Genes
Controlling Anthocyanin Pigmentation Are Functionally Conserved among Plant
Species and Have Distinct Sets of Target Genes. The Plant Cell 5: 1497-1512.
105) Reid KE, Olsson N, Schlosser J, Peng F, Lund ST. (2006) An optimized grapevine
RNA isolation procedure and statistical determination of reference genes for real-time
RT-PCR during berry development.BMC Plant Biology 6(27)1471-2229
106) Renaud S, De Lorgeril M. (1992) Wine, alcohol, platelets, and the French paradox for
coronary heart disease The Lancet 339(8808):1523-1526.
113
107) Ristic R, Downey MO, Iland G, Bindon K, Leigh F, Herderich M, Robinson SP. (2007)
Exclusion of sunlight from Shiraz grapes alters wine colour, tannin and sensory
properties. Australian Journal of Grape and Wine Research 13(2): 53–65.
108) Ribereau-Gayon P, Glories Y, Maujean A, Dubourdieu D. (1998) Trattato do enologia.
Edagricole.
109) Russo G, Catelani G, Panza L, Pedrini P. (1998) Chimica organica, 2° edizione. Casa
editrice Ambrosiana.
110) Rustioni L, Rossoni M, Cola G, Mariani L, Failla O. (2006) Microclimatermico e
luminoso e accumulo di antociani in 'nebbiolo'. Quaderni di Scienze Viticole ed
Enologiche Università di Torino 28: 137-147.
111) Saslowsky DE, Warek U, Winkel BSJ. (2005) Nuclear Localization of Flavonoid
Enzymes in Arabidopsis. The Journal of Biological Chemistry 280(25): 23735–23740.
112) Schneider A. (2006) Aspetti genetici nello studio dei vitigni del territorio. Quaderni di
Scienze Viticole ed Enologiche, Università di Torino, n° 28/2005-2006.
113) SeSIRCA. (2001). La risorsa genetica della vite in Campania. Regione Campania,
Assessorato Agricoltura.
114) Simone Di Lorenzo GB.(2009) Cinetiche di maturità fenolica in Aglianico: effetti del
pedoclima nel Vulture, Taurasi e Taburno. Tesi di laurea in vitivinicoltura di territorio e
di precisione Università degli studi di Foggia.
115) Shubert A, Carra A, Riccomagno N. (2003) Biosintesi dei flavonoidi in Vitis vinifera.
Quaderni di Scienze Viticole ed Enologiche Università di Torino 26: 5-9.
114

116) Sparvoli F, Martin C, Scienza A, Gavazzi G, Tonelli C. (1994) Cloning and molecular
analysis of structural genes involved in fravonoid and stilbene biosynthesis in grape
(Vitis vinifera L.). Plant molecular biology 24: 743-755.
117) Spayd SE, Tarara JM, Mee DL, Ferguson JC. (2002) Separation of Sunlight and
Temperature Effects on the Composition of Vitis vinifera cv. Merlot Berries. American
Journal of Enology and Viticulture 53(3): 171-182.
118) Spelt C, Quattrocchio F, Mol JNM, Koes R. (2000) Anthocyanin1 of Petunia Encodes
a Basic Helix-Loop-Helix Protein That Directly Activates Transcription of Structural
Anthocyanin Genes. The Plant Cell 12: 1619–1631.
119) Stirnimann CU, Petsalaki E, Russell RB, Muller CW. (2010) WD40 proteins propel
cellular networks. Trends in Biochemical Sciences 35: 565–574.
120) Suriano S, Tarricone L, Savino M, Rossi MR. (2005) Caratterizzazione fenolica di uve
di Aglianico e Uva di Troia coltivate nel Nord Barese. LʼEnologo.
121) Tamborra P, Esti M. (2010) Authenticity markers in Aglianico, Uva di Troia,
Negroamaro and Primitivo grapes. Analytica Chimica Acta 660: 221–226.
122) Tapas AR, Sakarkar DM, Kakde RB. (2008) Flavonoids as Nutraceuticals: A Review.
Tropical Journal of Pharmaceutical Research 7(3): 1025-1031
123) Tarara JM, Lee J, Spayd SE, Scagel CF. (2008) Berry Temperature and Solar
Radiation Alter Acylation, Proportion, and Concentration of Anthocyanin in Merlot
Grapes. American Journal of Enology and Viticulture 59(3): 235-247.
124) Terrier N, Torregrosa L, Ageorges A, Vialet S, Verriès C, Cheynier V, Romieu C.
(2009) Ectopic expression of VvMybPA2 promotes proanthocyanidin biosynthesis in
115
Vitis vinifera L. and suggests additional targets in the pathway 1. Plant Physiology
149:1028-1041.
125) This P, Lacombe T, Cadle-Davidson M, Owens CL. (2007) Wine grape (Vitis vinifera
L.) color associates with allelic variation in the domestication gene VvmybA1.
Theoretical and Applied Genetics 114: 723–730.
126) Tian L, Wan SB, Pan QH, Zheng YJ, Huang WD. (2008) A novel plastid localization of
chalcone synthase in developing grape berry. Plant Science 175: 431–436.
127) Walker AR, Lee E, Robinson SP. (2006) Two new grape cultivars, bud sports of
Cabernet Sauvignon bearing pale-coloured berries, are the result of deletion of two
regulatory genes of the berry colour locus. Plant Molecular Biology 62: 623–635.
128) Winkel-Shirley B. (2001) Flavonoid Biosynthesis. A Colorful Model for Genetics,
Biochemistry, Cell Biology, and Biotechnology. Plant Physiology 126: 485–493.
129) Xie DY, Sharma SB, Nancy L. Paiva, Daneel Ferreira, Richard A. Dixon. (2003) Role
of Anthocyanidin Reductase, Encoded by BANYULS in Plant Flavonoid Biosynthesis.
Science 299(5605): 396–399.
130) Yakushiji H, Kobayashi S, Goto-Yamamoto N, Jeong S, Sueta T, Mitani N, Azuma A.
(2006) A skin color mutation of grapevine from black skinned pinot noir to white
skinned pinot blanc is caused by the deletiono of the functional VvmybA1 allele.
Bioscience, Biotechnology and Biochemistry 70(6): 1506-1508.
131) Yao LH, Jiang YM, Shi J, Tomas-Barberan FA, Datta N, Singanusong R, Chen SS.
(2004) Flavonoids in Food and Their Health Benefits. Plant Foods for Human
Nutrition 59: 113–122.
116
132) Zhang ZQ, Pang X, Xuewu D, Ji Z, Jiang Y. (2005) Role of peroxidase in anthocyanin
degradation in litchi fruit pericarp. Food Chemistry 90: 47–52.
133) Zhao J, Pang Y, Dixon RA. (2010) The Mysteries of Proanthocyanidin Transport and
Polymerization. Plant Physiology 153: 437–443.
134) Zhao J, Dixon RA. (2010) The ʻinsʼ and ʻoutsʼ of flavonoid transport. Trends in Plant
Science 15(2): 72-80.
135) Zenoni S, Ferrarini A, Giacomelli E, Xumerle L, Fasoli M, Malerba G, Bellin D,
Pezzotti M, Delledonne M. (2010) Characterization of transcriptional complexity
during berry development in Vitis vinifera using RNA-Seq1. Plant Physiology
Preview. DOI:10.1104/pp.109.149716.
117
Related Documents