Universidad de Huelva Departamento de Biología Ambiental y Salud Pública Association between medications and urinary PH Memoria para optar al grado de doctor presentada por: Juan Manuel Banda González Fecha de lectura: 12 de diciembre de 2013 Bajo la dirección de los doctores: Juan Alguacil Ojeda Joan Fortuny Moya Huelva, 2013

Welcome message from author
This document is posted to help you gain knowledge. Please leave a comment to let me know what you think about it! Share it to your friends and learn new things together.
Transcript
Universidad de Huelva
Departamento de Biología Ambiental y Salud Pública
Association between medications and urinary PH
Memoria para optar al grado de doctor presentada por:
Juan Manuel Banda González
Fecha de lectura: 12 de diciembre de 2013
Bajo la dirección de los doctores:
Juan Alguacil Ojeda Joan Fortuny Moya
Huelva, 2013
Doctorate Program in Health Sciences
Huelva University
Association between Medications and
Urinary pH
DOCTORAL THESIS
Juan Manuel Banda González

Department of Environmental Biology and Public Health
Doctorate Program in Health Sciences
School of Experimental Sciences
Association between Medications and Urinary pH
PhD dissertation presented by
Juan Manuel Banda González
Directors
Dr. Juan Alguacil Ojeda
Dr. Joan Fortuny Moya
Huelva, September of 2013


I want to thank… It would not have been possible to write this doctoral thesis without the help and support of the kind people around me, to only some of whom it is possible to give particular mention here.
Above all, this thesis would not have been possible without the help, patience, and guidance of my principal supervisor, Prof. Juan Alguacil, not to mention his enthusiastic encouragement, useful critiques and advices in keeping my progress on schedule. Thank you very much for all the support and many opportunities given.
I would like to express my very great appreciation to Dr Joan Fortuny for his valuable and constructive suggestions during the planning and development of this research work, highlighting his help in coding the medications used in the statistical analysis of this study. His willingness to give his time so generously has been very much appreciated.
Many thanks to all the amazing people I have met in the Department throughout my PhD, and especially to my fellow postgraduate student Rocío Capelo for her kindness and availability when I need it.
I would like to acknowledge the support of the Occupational and Environmental Epidemiology Branch, Division of Cancer Epidemiology and Genetics (National Cancer Institute, Department of Health and Human Services, Bethesda, MD, USA), particularly to Debra Silverman, Nathaniel Rothman and its staff. Also, I would like to thank the fellowship full support given by the Centre for Research in Environmental Epidemiology (Institut Municipal d’Investigació Mèdica, Barcelona), particularly to Manolis Kogevinas and its staff.
I wish to express my sincere gratitude to Prof. Maria João Bebianno from the University of Algarve for her full support, availability and supervision through my work as a PhD collaborator at the Centre of Marine and Environmental Research.
My most honest gratefulness to Dr Francisco José Martinez, Dr Jesús de la Rosa and Antonio Morillas for their support and guidance through my work at the University of Huelva, they made me feel in a familiar environment that drove me to make the first steps on the research world.
To all my special friends in Spain and UK who kept enduring my ups and downs and never stopped supporting me, who went out of their ways and selflessly kept making me smile. You know who you are.
Finally, my parents and sister have given me their unequivocal support and great patience throughout, as always, for which my mere expression of thanks likewise does not suffice.

Grants Intramural Research Program of the National Institutes of Health, National Cancer
Institute, Division of Cancer Epidemiology and Genetics (including NCI Contract
#N02-CP-11015); Fondo de Investigación Sanitaria/Spain (98/1274, 00/0745,
G03/174, G03/160, C03/09, C03/10).

A mis padres,
mi ejemplo a seguir

9/206
GENERAL INDEX
TABLE INDEX.................................................................................................................................................... 11
FIGURE INDEX.................................................................................................................................................. 12
SUMMARY .......................................................................................................................................................... 13
RESUMEN ........................................................................................................................................................... 16
1. INTRODUCTION ........................................................................................................................................... 21
ACID-BASE PHYSIOLOGY ........................................................................................................................... 21 Principles and definitions ............................................................................................................................. 21 Acid-base regulation and the kidney............................................................................................................. 22
HCO3− Reabsorption .............................................................................................................................................. 24
Titratable Acid ....................................................................................................................................................... 28 Ammoniagenesis and NH4
+ Excretion ................................................................................................................... 29 Ammonia production and transport in response to acidosis ................................................................................... 32 Ammonia production and transport in response to hypokalemia ........................................................................... 33
ACID-BASE DISORDERS INFLUENCIABLE BY MEDICATIONS ............................................................ 35 Assessment of acid-base status ..................................................................................................................... 35 Metabolic Acid-Base Disorders .................................................................................................................... 40
Pathophysiology ......................................................................................................................................................... 40 Metabolic Acidosis ..................................................................................................................................................... 41
Anion Gap ............................................................................................................................................................. 42 Positive-Anion Gap Acidosis ................................................................................................................................. 44
Lactic acidosis................................................................................................................................................... 44 Ketoacidosis ...................................................................................................................................................... 45 Acidosis secondary to renal failure ................................................................................................................... 45 Acidosis secondary to toxin ingestion ............................................................................................................... 46 Acidosis secondary to rhabdomyolysis ............................................................................................................. 46 Acidosis of unknown origin .............................................................................................................................. 46
Non-Anion Gap (Hyperchloremic) Acidoses ......................................................................................................... 46 Renal tubular acidosis ............................................................................................................................................ 47 Gastrointestinal acidosis ........................................................................................................................................ 47 Iatrogenic acidosis ................................................................................................................................................. 47 Unexplained hyperchloremic acidosis ................................................................................................................... 48
Metabolic Alkalosis .................................................................................................................................................... 48 Chloride-Responsive Alkalosis .............................................................................................................................. 49 Chloride-Resistant Alkalosis ................................................................................................................................. 50
Respiratory Acid-Base Disorders ................................................................................................................. 50 Pathophysiology ......................................................................................................................................................... 50 Respiratory Acidosis................................................................................................................................................... 51 Respiratory Alkalosis ................................................................................................................................................. 52
URINE PH ......................................................................................................................................................... 53 Overview .................................................................................................................................................................... 53 External factors influencing urine pH ......................................................................................................................... 54 Urinary pH measurement ............................................................................................................................................ 58
URINARY ALKALINIZATION ...................................................................................................................... 59 Alkalizing agents ........................................................................................................................................................ 62
URINARY pH AS A RISK FACTOR FOR DISEASE ..................................................................................... 63 Urinary pH and osteoporosis ...................................................................................................................................... 63 Urinary pH and kidney stones .................................................................................................................................... 65 Urinary pH and Bladder cancer .................................................................................................................................. 69
2. HYPOTHESIS ................................................................................................................................................. 73
3. OBJECTIVE .................................................................................................................................................... 77
4. MATERIALS AND METHODS .................................................................................................................... 81
STUDY DESIGN AND DATA COLLECTION ............................................................................................................. 81 DATA COLLECTION ............................................................................................................................................ 81 DESCRIPTION OF THE POPULATION......................................................................................................... 82 URINE PH MEASUREMENT ................................................................................................................................. 84
10/206
CODING OF MEDICATIONS .................................................................................................................................. 85 ATC CLASSIFICATION ................................................................................................................................ 85
STATISTICAL ANALYSIS ..................................................................................................................................... 88
5. RESULTS ......................................................................................................................................................... 91
RELATIONSHIP BETWEEN PH AND CONFOUNDING VARIABLES ............................................................................ 91 ASSOCIATION BETWEEN MEDICATIONS AND URINE PH. MAGNITUDE OF THE ASSOCIATION ESTIMATED BY
LOGISTIC REGRESSION. FIXED TERMS MODELS ................................................................................................... 94 RESULTS FOR THE ASSOCIATION BETWEEN MEDICATIONS AND URINE PH. MAGNITUDE OF THE ASSOCIATION
ESTIMATED BY LOGISTIC REGRESSION: STEP WISE ........................................................................................... 118
6. DISCUSSION ................................................................................................................................................. 123
DISCUSSION OF RESULTS FOR CARDIAC GLYCOSIDES ..................................................................... 123 Use of cardiac glycosides in heart failure and the importance of potassium homeostasis ......................... 123 Hypokalemic status of cardiac patients and the acidification of urine ....................................................... 125
Mechanisms involved in the generation of hypokalemia and its effect on renal ammonia metabolism .............. 125 Activity of Na+/K+-pumps in cardiac patients and its relation to potassium homeostasis and response to
digitalization........................................................................................................................................................ 126 Acid-base disturbances in patients suffering from heart failure and the acidification of urine .................. 130
Cardiac conditions symptoms and acidic urine ................................................................................................... 130 DISCUSSION OF RESULTS FOR ANXIOLYTICS ..................................................................................... 133
Anxiety disorders and chronic hyperventilation ......................................................................................... 133 The role of pCO2 in anxiety disorders ......................................................................................................... 137 Effects of psycholeptics in the Respiratory system ...................................................................................... 142
DISCUSSION OF RESULTS FOR DRUGS FOR THE RESPIRATORY SYSTEM ..................................... 144 Chronic bronchitis and asthma treatments: the effect of the ATC group of “drugs for obstructive airways
diseases” on urine pH ................................................................................................................................. 144 Role of ventilatory drive in asthma and chronic obstructive pulmonary disease (COPD): pathophysiologic
features and acid-base disturbances ........................................................................................................... 147 Relationship between asthma and anxiety disorders .................................................................................. 149
STRENGTHS .................................................................................................................................................. 151 LIMITATIONS ............................................................................................................................................... 152 IMPLICATIONS ............................................................................................................................................. 153
7. CONCLUSIONS ............................................................................................................................................ 159
8. BIBLIOGRAPHY .......................................................................................................................................... 163
9. APPENDIX ..................................................................................................................................................... 183
FREQUENCY OF MEDICATIONS REFERRED BY THE PARTICIPANTS ..................................................................... 183
11/206
TABLE INDEX
Table 1: pH of Selected Body Tissues .................................................................................................. 22
Table 2: Expression of renal producing enzymes and transporters in response to metabolic acidosis and
hypokalemia ...................................................................................................................................... 34
Table 3: Comparison of Components of Acid-Base Analysis Methods................................................ 37
Table 4: Causes of metabolic acidic disorders (normal vs elevated anion gap) .................................... 44
Table 5: Differential diagnosis for metabolic alkalosis ......................................................................... 49
Table 6: Assessment of dietary effects on acid-base balance................................................................ 55
Table 7: Potassium Content of Selected Foods ..................................................................................... 61
Table 8: Socio-demographic and cigarette smoking classification among controls ............................. 83
Table 9. Diagnostic groups among controls during hospitalization ...................................................... 84
Table 10: Influence of various factors on urine pH among controls ..................................................... 92
Table 11: Association between urine pH and stomatological preparations, and drugs for acid related
disorders. Magnitude of the association estimated by logistic regression. Fixed terms models ....... 95
Table 12: Association between urine pH and drugs for functional gastrointestinal disorders,
constipation, digestives and diabetes. Magnitude of the association estimated by logistic regression.
Fixed terms models ........................................................................................................................... 96
Table 13: Association between urine pH and Vitamins, and mineral supplements. Magnitude of the
association estimated by logistic regression. Fixed terms models .................................................... 97
Table 14: Association between urine pH and antithrombotic agents, and antianemic preparations.
Magnitude of the association estimated by logistic regression. Fixed terms models ....................... 98
Table 15: Association between urine pH and Cardiac Glycosides, vasodilators used in cardiac
diseases, and antihypertensives. Magnitude of the association estimated by logistic regression.
Fixed terms models ........................................................................................................................... 99
Table 16: Association between urine pH and diuretics. Magnitude of the association estimated by
logistic regression. Fixed terms models .......................................................................................... 100
Table 17: Association between urine pH and peripheral vasodilators, vasoprotectives, and beta
blocking agents. Magnitude of the association estimated by logistic regression. Fixed terms models
........................................................................................................................................................ 101
Table 18: Association between urine pH and calcium channel blockers. Magnitude of the association
estimated by logistic regression. Fixed terms models..................................................................... 102
Table 19: Association between urine pH and agents acting on the Renin-Angiotensin system, and lipid
modifying agents. Magnitude of the association estimated by logistic regression. Fixed terms
models ............................................................................................................................................. 103
Table 20: Association between urine pH and urologicals. Magnitude of the association estimated by
logistic regression. Fixed terms models .......................................................................................... 104
Table 21: Association between urine pH and systemic hormonal preparations. Magnitude of the
association estimated by logistic regression. Fixed terms models .................................................. 105
Table 22: Association between urine pH and antibacterials for systemic use. Magnitude of the
association estimated by logistic regression. Fixed terms models .................................................. 106
Table 23: Association between urine pH and drugs used in endocrine therapy and musculo-eskeletal
system. Magnitude of the association estimated by logistic regression. Fixed terms models ........ 107
Table 24: Association between urine pH and analgesics, and antiepileptics. Magnitude of the
association estimated by logistic regression. Fixed terms models .................................................. 108
Table 25: Association between urine pH and anxiolytics, hypnotics/sedatives, and antidepressants.
Magnitude of the association estimated by logistic regression. Fixed terms models ..................... 109
Table 26: Association between urine pH and drugs for obstructive airway diseases (inhalants), and
adrenergics for systemic use. Magnitude of the association estimated by logistic regression. Fixed
terms models ................................................................................................................................... 110
Table 27: Association between urine pH and other systemic drugs for obstructive airway diseases, and
cough and cold preparations. Magnitude of the association estimated by logistic regression. Fixed
terms models ................................................................................................................................... 111
Table 28. Influence of selected medications (p≤0.15) on urine pH. Magnitude of the association
estimated by logistic regression. Fixed terms models..................................................................... 115
12/206
Table 29. Influence of some medications on urine pH. Magnitude of the association estimated by
logistic regression: Step Wise Models ............................................................................................ 117
Table 30: Medications associated with hyperkalemia ......................................................................... 124
Table 31: Constantly acidic urine pH by use of “drugs for obstructive airway diseases” in chronic
bronchitis ......................................................................................................................................... 146
Table 32: Constantly acidic urine pH by use of “drugs for obstructive airway diseases” in asthma .. 147
FIGURE INDEX
Fig. 1. Overview of the role of the kidneys in acid-base balance .......................................................... 24
Fig. 2. Segmental HCO3- reabsorption .................................................................................................. 25
Fig. 3. Cellular mechanism for proximal tubule H+ and HCO3
- transport ............................................. 26
Fig. 4. Cellular mechanisms for H+ and HCO3
- secretion by intercalated cells of the collecting duct. . 27
Fig. 5. Cellular mechanism for the generation of “new HCO3-” through the titration of urinary buffers
(titratable acid) ....................................................................................................................................... 28
Fig. 6. General scheme for the production of HCO3- and NH4
+ from the renal metabolism of glutamine.
............................................................................................................................................................... 29
Fig. 7. Renal handling of NH4+. ............................................................................................................. 30
Fig. 8. Ammonia Metabolism in the Proximal Tubule .......................................................................... 32
Fig. 9. Schematic Representation of the Ammonia Transport Mechanisms along the Nephron
Segments................................................................................................................................................ 33
Fig. 10. Sequence of events in the action of catecholamines and beta2 agonists on active Na+,K
+
transport, Na+,K
+ distribution and contractile performance in skeletal muscle.....…………………...128
13/206
SUMMARY
Background. There are many common disorders/diseases that lead to changes in acid base
balance, such as asthma, chronic obstructive pulmonary disease (bronchitis or emphysema),
diabetic ketoacidosis, renal disease or failure, any type of shock (sepsis, anaphylaxis,
neurogenic, cardiogenic, hypovolemia), stress or anxiety which can lead to hyperventilation,
and some drugs (sedatives, opoids) leading to reduced ventilation.
Several factors can influence on urine pH: diet, body surface area, acute water load and
exercise. A chronic acidic load can cause a number of health conditions such as
osteoporosis, kidney disease, and muscle wasting. Acidic urine pH has been suggested to
play an important role in human bladder carcinogenesis by influencing the urine
concentration of active aromatic amines. Urine pH also plays an important role in the
formation of most types of kidney stones.
Some medications may also influence on urine pH in either direction. However, to date there
are no studies that have evaluated the association between medication use and urine pH.
Considering these premises, the present thesis focused on the association between
medication use after hospital discharge in a population from the control group of a case –
control study of bladder cancer and having constantly acidic urine pH.
Methods. Data collection for this research has been taken from a case-control study on
bladder cancer. We have limited subject inclusion and statistical analyses for this report to
the control subjects of the case-control study. In the case-control study, 1219 incident
transitional cell carcinoma (TCC) cases (84% of 1453 contacted cases) and 1271 hospital
controls (88% of 1442 controls) were recruited between June 1998 and June 2001 in 18
hospitals in the following regions in Spain: Barcelona, Vallès/Bages, Asturias, Alicante, and
Tenerife. Subjects were 21 to 80 years old at the time of diagnosis and resided in the
catchment areas of the 18 participating hospitals. Out of the 611 control subjects with
14/206
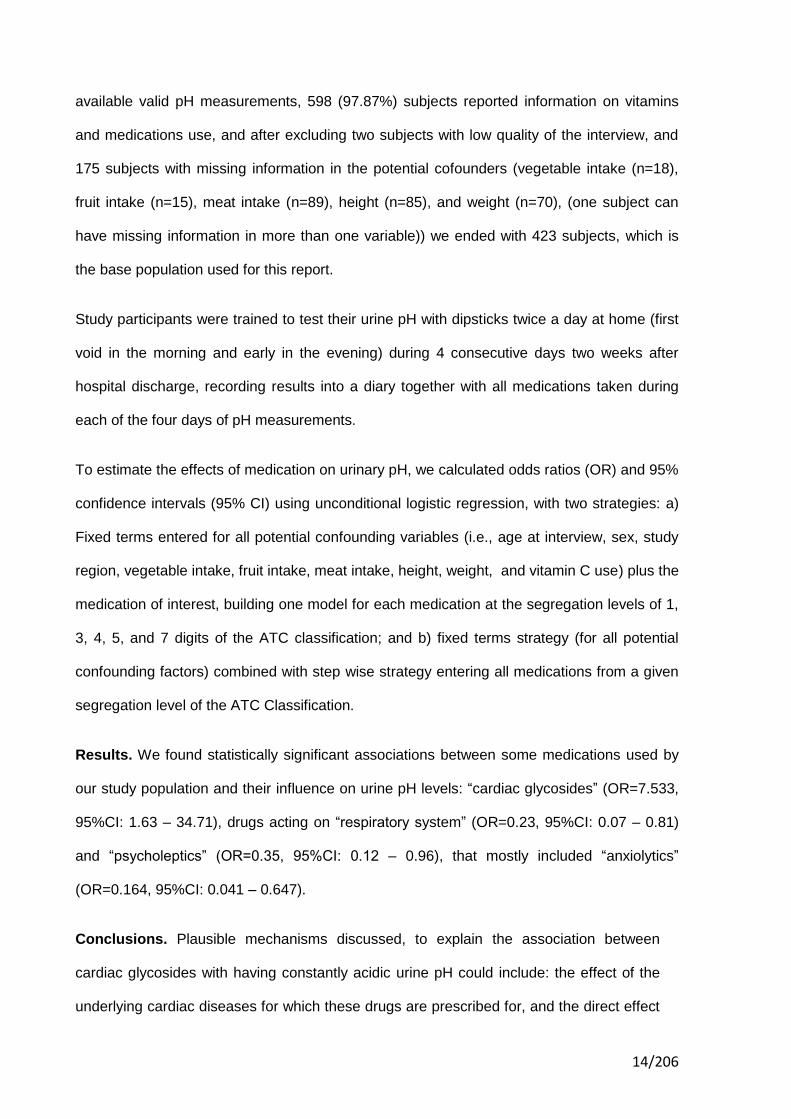
available valid pH measurements, 598 (97.87%) subjects reported information on vitamins
and medications use, and after excluding two subjects with low quality of the interview, and
175 subjects with missing information in the potential cofounders (vegetable intake (n=18),
fruit intake (n=15), meat intake (n=89), height (n=85), and weight (n=70), (one subject can
have missing information in more than one variable)) we ended with 423 subjects, which is
the base population used for this report.
Study participants were trained to test their urine pH with dipsticks twice a day at home (first
void in the morning and early in the evening) during 4 consecutive days two weeks after
hospital discharge, recording results into a diary together with all medications taken during
each of the four days of pH measurements.
To estimate the effects of medication on urinary pH, we calculated odds ratios (OR) and 95%
confidence intervals (95% CI) using unconditional logistic regression, with two strategies: a)
Fixed terms entered for all potential confounding variables (i.e., age at interview, sex, study
region, vegetable intake, fruit intake, meat intake, height, weight, and vitamin C use) plus the
medication of interest, building one model for each medication at the segregation levels of 1,
3, 4, 5, and 7 digits of the ATC classification; and b) fixed terms strategy (for all potential
confounding factors) combined with step wise strategy entering all medications from a given
segregation level of the ATC Classification.
Results. We found statistically significant associations between some medications used by
our study population and their influence on urine pH levels: “cardiac glycosides” (OR=7.533,
95%CI: 1.63 – 34.71), drugs acting on “respiratory system” (OR=0.23, 95%CI: 0.07 – 0.81)
and “psycholeptics” (OR=0.35, 95%CI: 0.12 – 0.96), that mostly included “anxiolytics”
(OR=0.164, 95%CI: 0.041 – 0.647).
Conclusions. Plausible mechanisms discussed, to explain the association between
cardiac glycosides with having constantly acidic urine pH could include: the effect of the
underlying cardiac diseases for which these drugs are prescribed for, and the direct effect
15/206
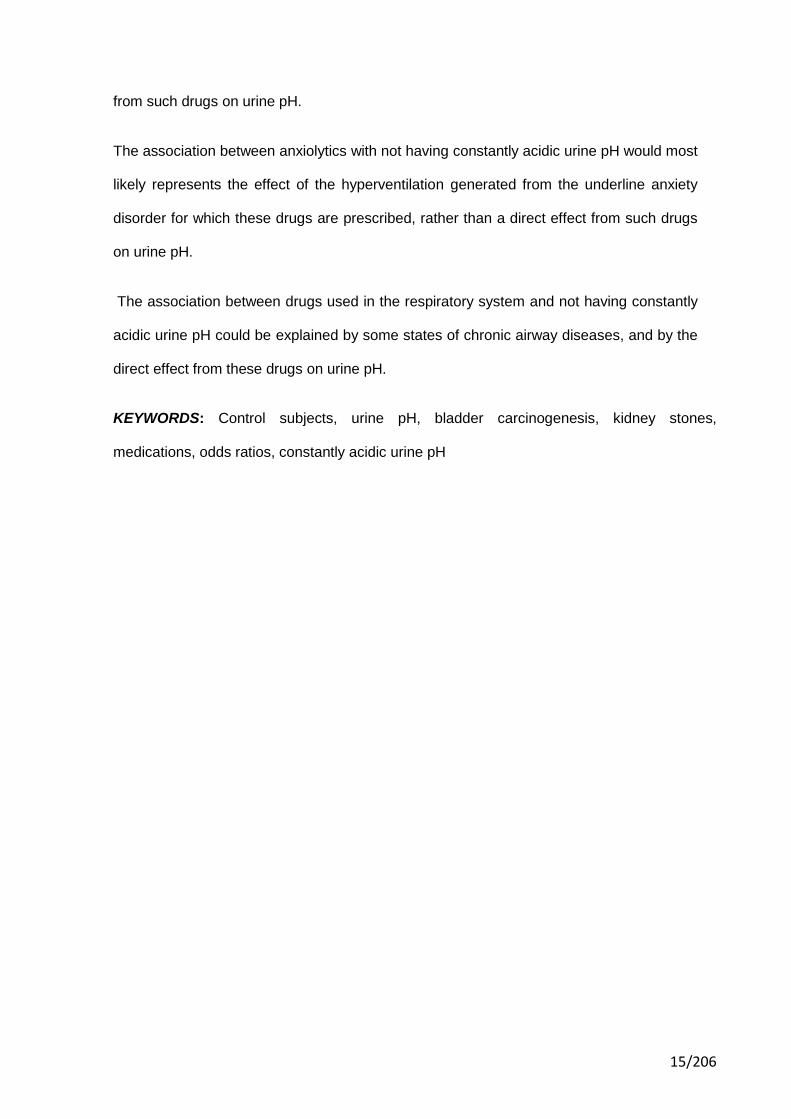
from such drugs on urine pH.
The association between anxiolytics with not having constantly acidic urine pH would most
likely represents the effect of the hyperventilation generated from the underline anxiety
disorder for which these drugs are prescribed, rather than a direct effect from such drugs
on urine pH.
The association between drugs used in the respiratory system and not having constantly
acidic urine pH could be explained by some states of chronic airway diseases, and by the
direct effect from these drugs on urine pH.
KEYWORDS: Control subjects, urine pH, bladder carcinogenesis, kidney stones,
medications, odds ratios, constantly acidic urine pH
16/206
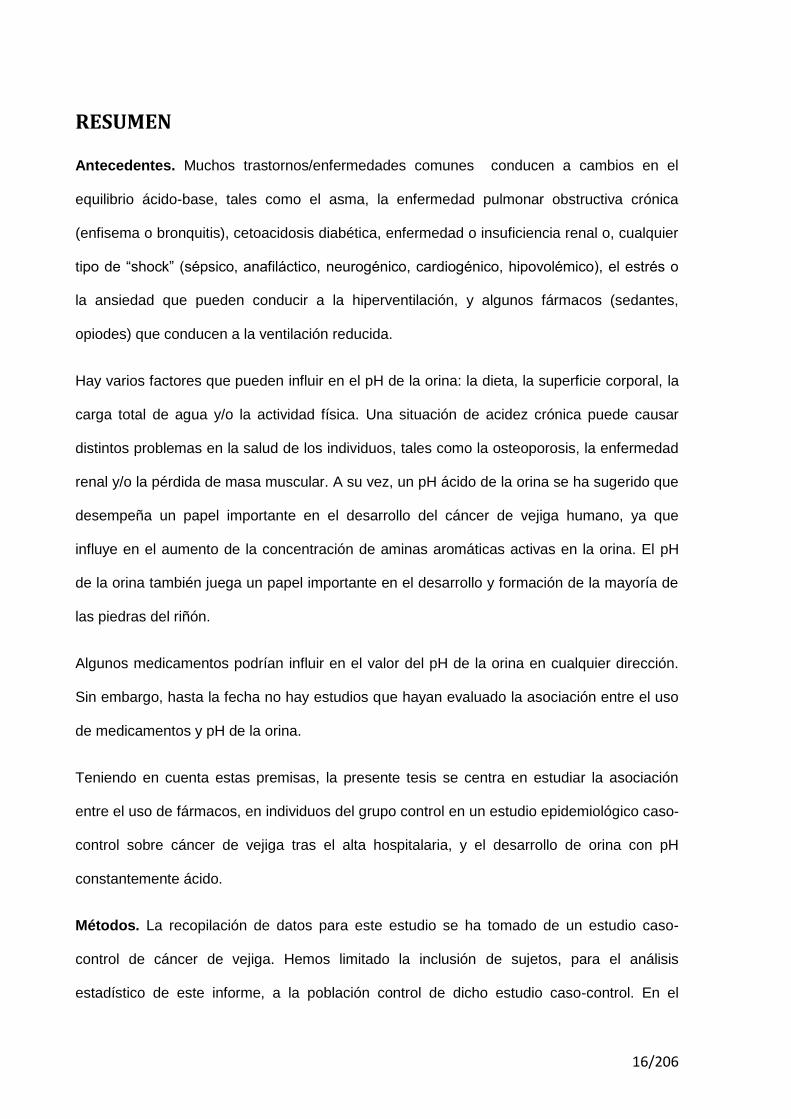
RESUMEN Antecedentes. Muchos trastornos/enfermedades comunes conducen a cambios en el
equilibrio ácido-base, tales como el asma, la enfermedad pulmonar obstructiva crónica
(enfisema o bronquitis), cetoacidosis diabética, enfermedad o insuficiencia renal o, cualquier
tipo de “shock” (sépsico, anafiláctico, neurogénico, cardiogénico, hipovolémico), el estrés o
la ansiedad que pueden conducir a la hiperventilación, y algunos fármacos (sedantes,
opiodes) que conducen a la ventilación reducida.
Hay varios factores que pueden influir en el pH de la orina: la dieta, la superficie corporal, la
carga total de agua y/o la actividad física. Una situación de acidez crónica puede causar
distintos problemas en la salud de los individuos, tales como la osteoporosis, la enfermedad
renal y/o la pérdida de masa muscular. A su vez, un pH ácido de la orina se ha sugerido que
desempeña un papel importante en el desarrollo del cáncer de vejiga humano, ya que
influye en el aumento de la concentración de aminas aromáticas activas en la orina. El pH
de la orina también juega un papel importante en el desarrollo y formación de la mayoría de
las piedras del riñón.
Algunos medicamentos podrían influir en el valor del pH de la orina en cualquier dirección.
Sin embargo, hasta la fecha no hay estudios que hayan evaluado la asociación entre el uso
de medicamentos y pH de la orina.
Teniendo en cuenta estas premisas, la presente tesis se centra en estudiar la asociación
entre el uso de fármacos, en individuos del grupo control en un estudio epidemiológico caso-
control sobre cáncer de vejiga tras el alta hospitalaria, y el desarrollo de orina con pH
constantemente ácido.
Métodos. La recopilación de datos para este estudio se ha tomado de un estudio caso-
control de cáncer de vejiga. Hemos limitado la inclusión de sujetos, para el análisis
estadístico de este informe, a la población control de dicho estudio caso-control. En el
17/206
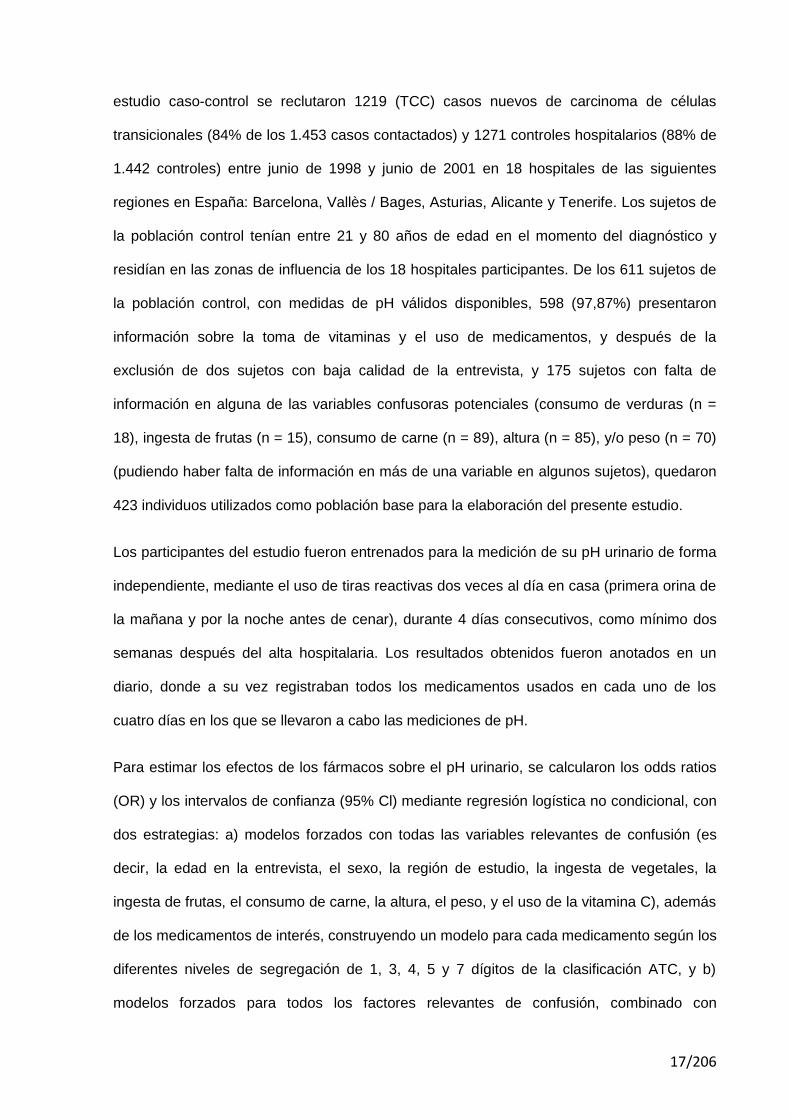
estudio caso-control se reclutaron 1219 (TCC) casos nuevos de carcinoma de células
transicionales (84% de los 1.453 casos contactados) y 1271 controles hospitalarios (88% de
1.442 controles) entre junio de 1998 y junio de 2001 en 18 hospitales de las siguientes
regiones en España: Barcelona, Vallès / Bages, Asturias, Alicante y Tenerife. Los sujetos de
la población control tenían entre 21 y 80 años de edad en el momento del diagnóstico y
residían en las zonas de influencia de los 18 hospitales participantes. De los 611 sujetos de
la población control, con medidas de pH válidos disponibles, 598 (97,87%) presentaron
información sobre la toma de vitaminas y el uso de medicamentos, y después de la
exclusión de dos sujetos con baja calidad de la entrevista, y 175 sujetos con falta de
información en alguna de las variables confusoras potenciales (consumo de verduras (n =
18), ingesta de frutas (n = 15), consumo de carne (n = 89), altura (n = 85), y/o peso (n = 70)
(pudiendo haber falta de información en más de una variable en algunos sujetos), quedaron
423 individuos utilizados como población base para la elaboración del presente estudio.
Los participantes del estudio fueron entrenados para la medición de su pH urinario de forma
independiente, mediante el uso de tiras reactivas dos veces al día en casa (primera orina de
la mañana y por la noche antes de cenar), durante 4 días consecutivos, como mínimo dos
semanas después del alta hospitalaria. Los resultados obtenidos fueron anotados en un
diario, donde a su vez registraban todos los medicamentos usados en cada uno de los
cuatro días en los que se llevaron a cabo las mediciones de pH.
Para estimar los efectos de los fármacos sobre el pH urinario, se calcularon los odds ratios
(OR) y los intervalos de confianza (95% Cl) mediante regresión logística no condicional, con
dos estrategias: a) modelos forzados con todas las variables relevantes de confusión (es
decir, la edad en la entrevista, el sexo, la región de estudio, la ingesta de vegetales, la
ingesta de frutas, el consumo de carne, la altura, el peso, y el uso de la vitamina C), además
de los medicamentos de interés, construyendo un modelo para cada medicamento según los
diferentes niveles de segregación de 1, 3, 4, 5 y 7 dígitos de la clasificación ATC, y b)
modelos forzados para todos los factores relevantes de confusión, combinado con
18/206
introducción de variables según estrategia “step wise” para todos los medicamentos de un
mismo nivel de segregación de la clasificación ATC.
Resultados. Se encontraron asociaciones estadísticamente significativas entre algunos
grupos de medicamentos utilizados por la población estudiada y su influencia en los niveles
de pH de la orina: "Glucósidos Cardíacos" (OR=7.533, 95%CI: 1.63 – 34.71), fármacos que
actúan sobre "Sistema Respiratorio" (OR=0.23, 95%CI: 0.07 – 0.81) y "Psicolépticos"
(OR=0.35, 95%CI: 0.12 – 0.96), que en su mayoría incluyen "Ansiolíticos" (OR=0.164,
95%CI: 0.041 – 0.647).
Conclusiones. Mecanismos plausibles discutidos para explicar la asociación entre los
glucósidos cardiacos y la generación de un pH de la orina constantemente ácida podrían
incluir tanto el efecto de las enfermedades cardíacas subyacentes para las que estos
fármacos son prescritos, como el efecto directo de los glucósidos cardíacos en el pH
urinario.
La asociación entre ansiolíticos con no generar un pH en la orina constantemente ácido,
sería más probable que representara el efecto de la hiperventilación generada en el
transcurso de los trastornos de ansiedad para los que estos fármacos son prescritos, en
lugar de un efecto directo de estos fármacos en el pH de la orina.
La asociación entre los fármacos que actúan en el Sistema Respiratorio y la no generación
de un pH de la orina constantemente ácido, podría explicarse por algunos estados de
enfermedades crónicas de las vías respiratorias para las que se prescriben estos fármacos,
además de por el efecto directo de estos fármacos sobre el pH de la orina.
PALABRAS CLAVE: Controles, pH de la orina, carcinogénesis de vejiga, cálculos renales,
medicamentos, odds ratios, orina constantemente ácida

19/206
1. Introduction

20/206
Introduction
21/206
1. INTRODUCTION
ACID-BASE PHYSIOLOGY
Principles and definitions
The normal free hydrogen ion concentration in the plasma is 0.000035 – 0.000045
mEq/L. Because this concentration is so low, pH is used to describe it. pH is the negative
logarithm of the free hydrogen ion concentration, shown as pH = -log [H+]. Thus, hydrogen
ion (H+) concentration defines the pH of a solution.
Only free hydrogen ions, also called protons, contribute to the measured pH. If hydrogen ions
are bound to other ions (such as phosphate or bicarbonate) or proteins, they are not free and
do not contribute to the measured pH. Solutes and proteins that can donate or release
hydrogen ions are referred to as acids, and those that can absorb or bind hydrogen ions are
referred to as bases.
The normal plasma pH is about 7.30 – 7.45 and must be maintained within this narrow range
for optimal physiological function. A number of physiologic processes such as (a) the
metabolic enzymes that maintain adenosine triphosphate (ATP) or energy stores within cells;
(b) transport proteins that move substances across cell membranes; and (c) signaling
systems that transmit messages between cells or intracellular compartments, are pH-
dependent, meaning they are most efficient when pH is normal. If pH levels change
significantly in either the acid (lower pH, higher free H+ concentration) or alkaline (higher pH,
lower free H+ concentration) direction, a number of physiologic processes required for life
become altered, and the homeostatic milieu begins to deteriorate.
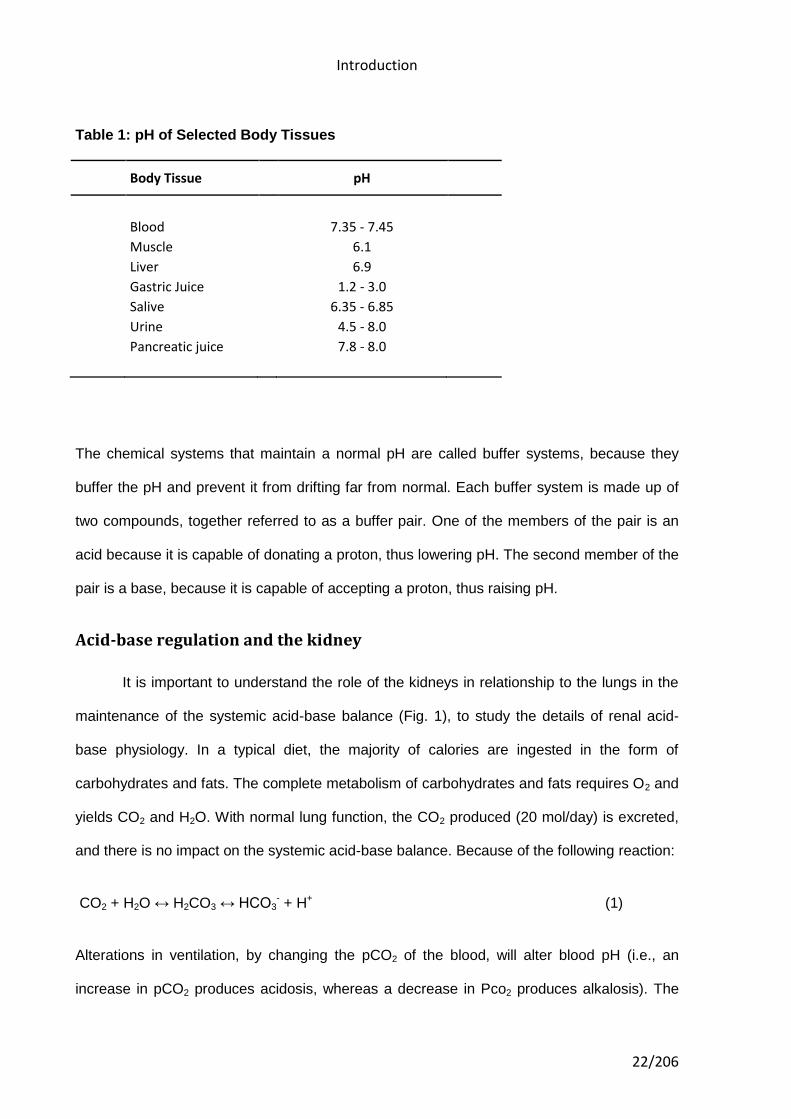
From a physiological perspective, the body has compartmentalized organ systems operating
within specific pH ranges (Table 1).
Introduction
22/206
Table 1: pH of Selected Body Tissues
Body Tissue pH
Blood 7.35 - 7.45
Muscle 6.1
Liver 6.9
Gastric Juice 1.2 - 3.0
Salive 6.35 - 6.85
Urine 4.5 - 8.0
Pancreatic juice 7.8 - 8.0
The chemical systems that maintain a normal pH are called buffer systems, because they
buffer the pH and prevent it from drifting far from normal. Each buffer system is made up of
two compounds, together referred to as a buffer pair. One of the members of the pair is an
acid because it is capable of donating a proton, thus lowering pH. The second member of the
pair is a base, because it is capable of accepting a proton, thus raising pH.
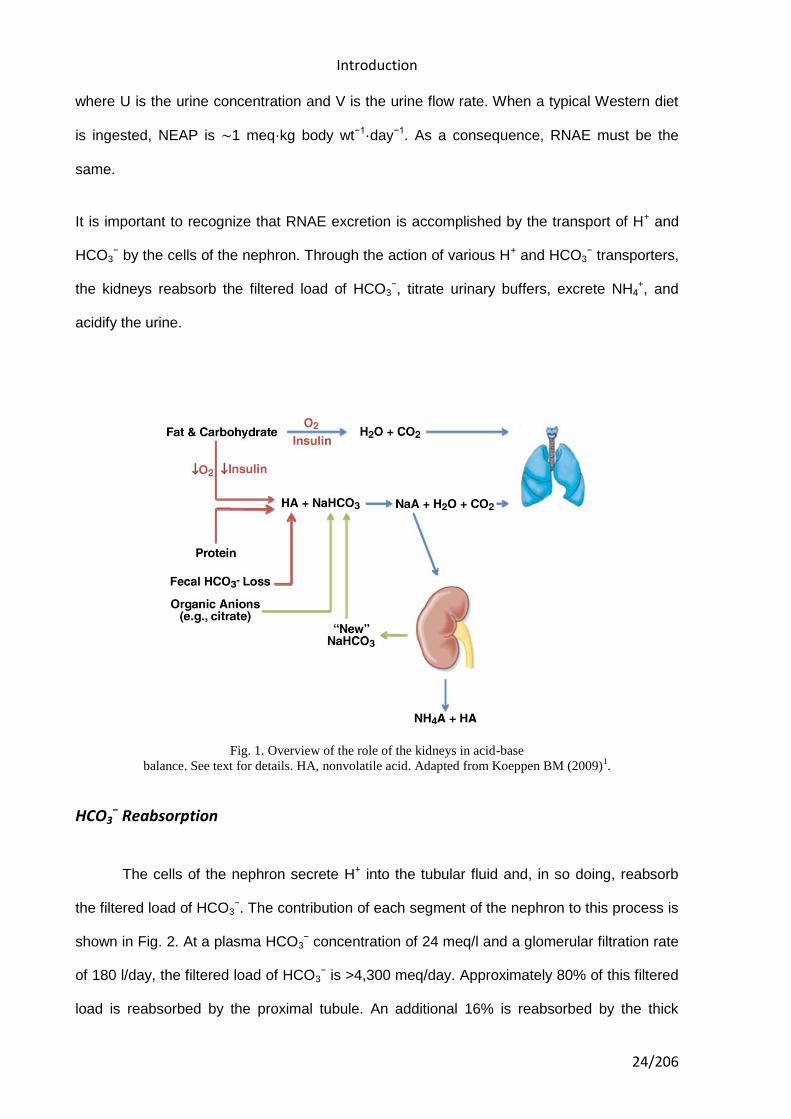
Acid-base regulation and the kidney
It is important to understand the role of the kidneys in relationship to the lungs in the
maintenance of the systemic acid-base balance (Fig. 1), to study the details of renal acid-
base physiology. In a typical diet, the majority of calories are ingested in the form of
carbohydrates and fats. The complete metabolism of carbohydrates and fats requires O2 and
yields CO2 and H2O. With normal lung function, the CO2 produced (20 mol/day) is excreted,
and there is no impact on the systemic acid-base balance. Because of the following reaction:
CO2 + H2O ↔ H2CO3 ↔ HCO3- + H+ (1)
Alterations in ventilation, by changing the pCO2 of the blood, will alter blood pH (i.e., an
increase in pCO2 produces acidosis, whereas a decrease in Pco2 produces alkalosis). The
Introduction
23/206
metabolism of the amino acids in protein may produce either acids or alkali depending on the
specific amino acid. However, the metabolism of dietary protein produces net acids (i.e., HCl
of H2SO4). These acids, often referred to as “nonvolatile acids,” are rapidly buffered:
HCl + NaHCO3 → NaCl + CO2 + H2O (2)
H2SO4 + NaHCO3 → Na2SO4 + 2CO2 + 2H2O (3)
The CO2 generated in this buffering process is excreted by the lungs, whereas the Na+ salts
of the acids are excreted by the kidneys, principally with NH4+ [i.e., NH4Cl and (NH4)2SO4]. In
the process of excreting NH4+, HCO3
− is generated and returned to the blood to replace the
HCO3− lost in titrating the nonvolatile acid. This process is described later.
Other dietary constituents result in the generation of alkali. For example, when organic
anions are metabolized to CO2 and H2O, H+ is consumed (i.e., HCO3− is produced). From a
dietary perspective, fruits and vegetables result in the generation of alkali, whereas meat,
grains, and dairy products generate acid. In addition, the diet may contain various acids and
alkalis that, when absorbed via the gastrointestinal tract, contribute to the net acid/alkali load
to the body. Finally, each day, HCO3− is lost in the feces and thus imparts an acid load to the
body. In a healthy individual consuming a “typical Western diet” (defined later in this
introduction), there is a net addition of acid to the body. This acid, referred to as net
endogenous acid production (NEAP), results in an equivalent loss of HCO3−, which must then
be replaced. Importantly, the kidneys excrete acid and, in the process, generate HCO3−.
Thus, the systemic acid-base balance is maintained when renal net acid excretion (RNAE)
equals NEAP. RNAE excretion can be quantitated by measuring the excretion of NH4+,
titratable acid (TA), and HCO3− (note that the excretion of H+ is ignored, since even at a urine
pH of 4.0, the concentration of H+ = 0.1 meq/l):
RNAE = UNH4+ x V + UTA x V – UHCO3- x V (4)
Introduction
24/206
where U is the urine concentration and V is the urine flow rate. When a typical Western diet
is ingested, NEAP is ∼1 meq·kg body wt−1·day−1. As a consequence, RNAE must be the
same.
It is important to recognize that RNAE excretion is accomplished by the transport of H+ and
HCO3− by the cells of the nephron. Through the action of various H+ and HCO3
− transporters,
the kidneys reabsorb the filtered load of HCO3−, titrate urinary buffers, excrete NH4
+, and
acidify the urine.
Fig. 1. Overview of the role of the kidneys in acid-base
balance. See text for details. HA, nonvolatile acid. Adapted from Koeppen BM (2009)1.
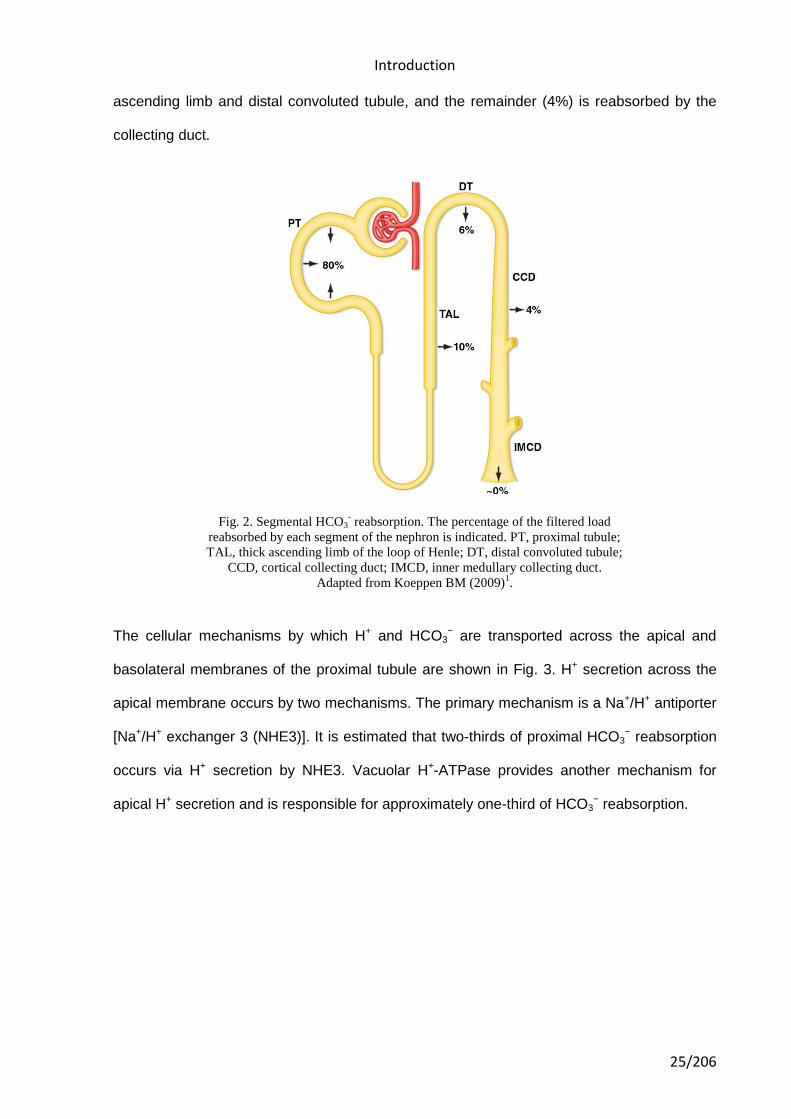
HCO3− Reabsorption
The cells of the nephron secrete H+ into the tubular fluid and, in so doing, reabsorb
the filtered load of HCO3−. The contribution of each segment of the nephron to this process is
shown in Fig. 2. At a plasma HCO3− concentration of 24 meq/l and a glomerular filtration rate
of 180 l/day, the filtered load of HCO3− is >4,300 meq/day. Approximately 80% of this filtered
load is reabsorbed by the proximal tubule. An additional 16% is reabsorbed by the thick
Introduction
25/206
ascending limb and distal convoluted tubule, and the remainder (4%) is reabsorbed by the
collecting duct.
Fig. 2. Segmental HCO3- reabsorption. The percentage of the filtered load
reabsorbed by each segment of the nephron is indicated. PT, proximal tubule;
TAL, thick ascending limb of the loop of Henle; DT, distal convoluted tubule;
CCD, cortical collecting duct; IMCD, inner medullary collecting duct.
Adapted from Koeppen BM (2009)1.
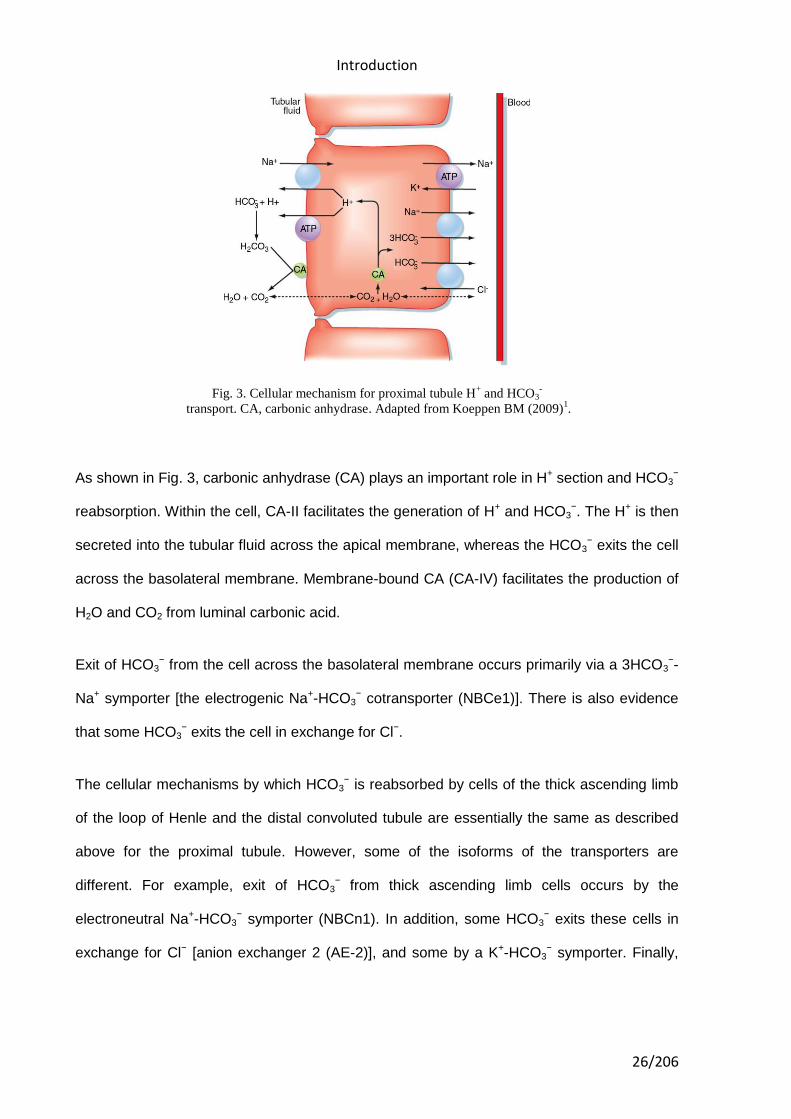
The cellular mechanisms by which H+ and HCO3− are transported across the apical and
basolateral membranes of the proximal tubule are shown in Fig. 3. H+ secretion across the
apical membrane occurs by two mechanisms. The primary mechanism is a Na+/H+ antiporter
[Na+/H+ exchanger 3 (NHE3)]. It is estimated that two-thirds of proximal HCO3− reabsorption
occurs via H+ secretion by NHE3. Vacuolar H+-ATPase provides another mechanism for
apical H+ secretion and is responsible for approximately one-third of HCO3− reabsorption.
Introduction
26/206
Fig. 3. Cellular mechanism for proximal tubule H+ and HCO3
-
transport. CA, carbonic anhydrase. Adapted from Koeppen BM (2009)1.
As shown in Fig. 3, carbonic anhydrase (CA) plays an important role in H+ section and HCO3−
reabsorption. Within the cell, CA-II facilitates the generation of H+ and HCO3−. The H+ is then
secreted into the tubular fluid across the apical membrane, whereas the HCO3− exits the cell
across the basolateral membrane. Membrane-bound CA (CA-IV) facilitates the production of
H2O and CO2 from luminal carbonic acid.
Exit of HCO3− from the cell across the basolateral membrane occurs primarily via a 3HCO3
−-
Na+ symporter [the electrogenic Na+-HCO3− cotransporter (NBCe1)]. There is also evidence
that some HCO3− exits the cell in exchange for Cl−.
The cellular mechanisms by which HCO3− is reabsorbed by cells of the thick ascending limb
of the loop of Henle and the distal convoluted tubule are essentially the same as described
above for the proximal tubule. However, some of the isoforms of the transporters are
different. For example, exit of HCO3− from thick ascending limb cells occurs by the
electroneutral Na+-HCO3− symporter (NBCn1). In addition, some HCO3
− exits these cells in
exchange for Cl− [anion exchanger 2 (AE-2)], and some by a K+-HCO3− symporter. Finally,
Introduction
27/206
the apical membrane Na+/H+ antiporter in the distal convoluted tubule may be the NHE2
isoform.
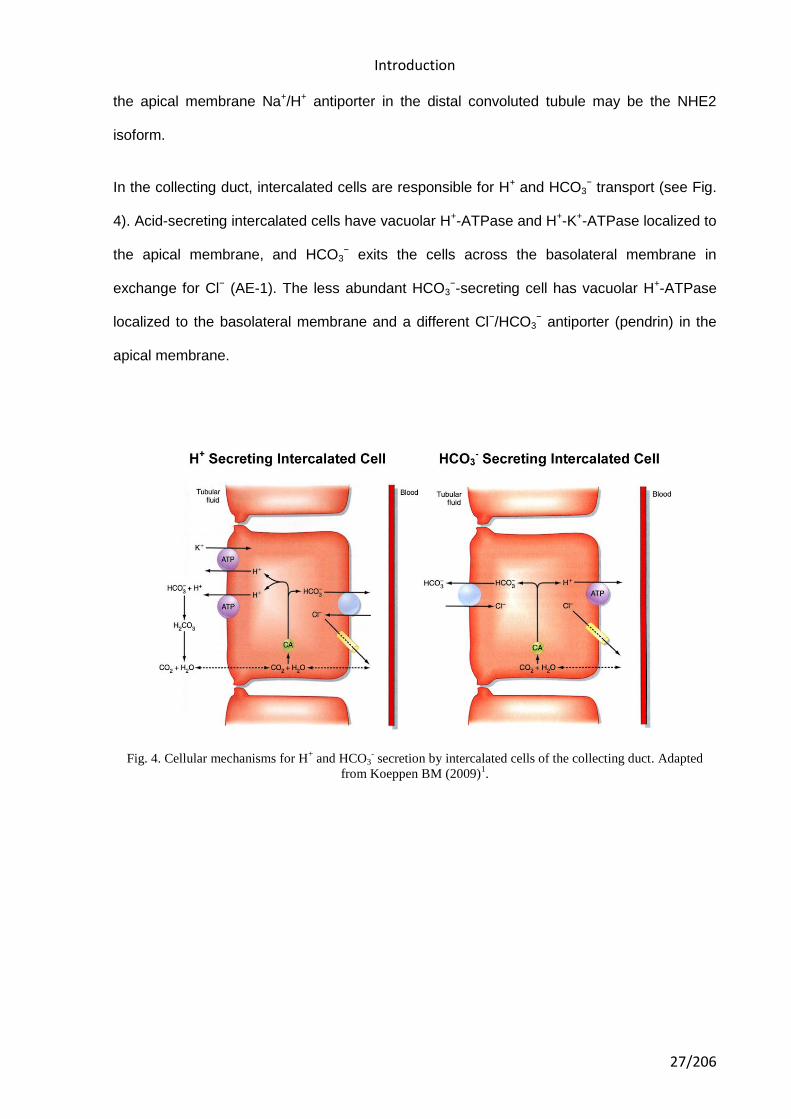
In the collecting duct, intercalated cells are responsible for H+ and HCO3− transport (see Fig.
4). Acid-secreting intercalated cells have vacuolar H+-ATPase and H+-K+-ATPase localized to
the apical membrane, and HCO3− exits the cells across the basolateral membrane in
exchange for Cl− (AE-1). The less abundant HCO3−-secreting cell has vacuolar H+-ATPase
localized to the basolateral membrane and a different Cl−/HCO3− antiporter (pendrin) in the
apical membrane.
Fig. 4. Cellular mechanisms for H+ and HCO3
- secretion by intercalated cells of the collecting duct. Adapted
from Koeppen BM (2009)1.
Introduction
28/206
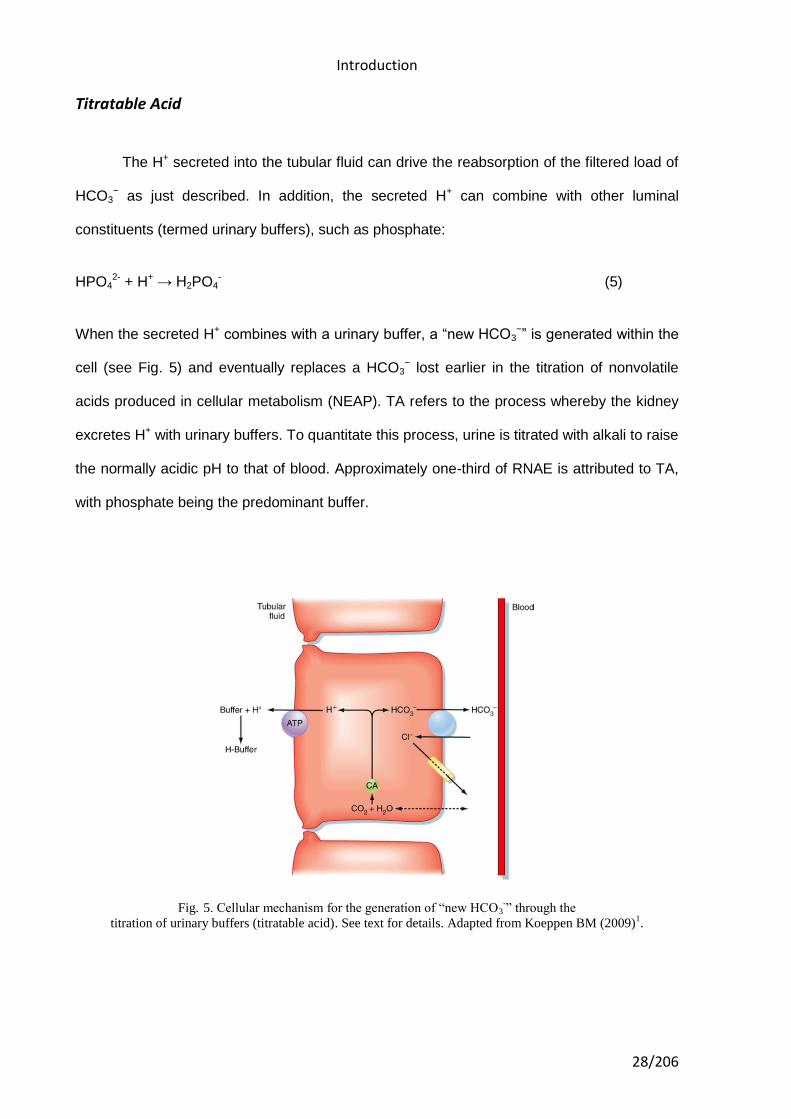
Titratable Acid
The H+ secreted into the tubular fluid can drive the reabsorption of the filtered load of
HCO3− as just described. In addition, the secreted H+ can combine with other luminal
constituents (termed urinary buffers), such as phosphate:
HPO42- + H+ → H2PO4
- (5)
When the secreted H+ combines with a urinary buffer, a “new HCO3−” is generated within the
cell (see Fig. 5) and eventually replaces a HCO3− lost earlier in the titration of nonvolatile
acids produced in cellular metabolism (NEAP). TA refers to the process whereby the kidney
excretes H+ with urinary buffers. To quantitate this process, urine is titrated with alkali to raise
the normally acidic pH to that of blood. Approximately one-third of RNAE is attributed to TA,
with phosphate being the predominant buffer.
Fig. 5. Cellular mechanism for the generation of “new HCO3-” through the
titration of urinary buffers (titratable acid). See text for details. Adapted from Koeppen BM (2009)1.
Introduction
29/206
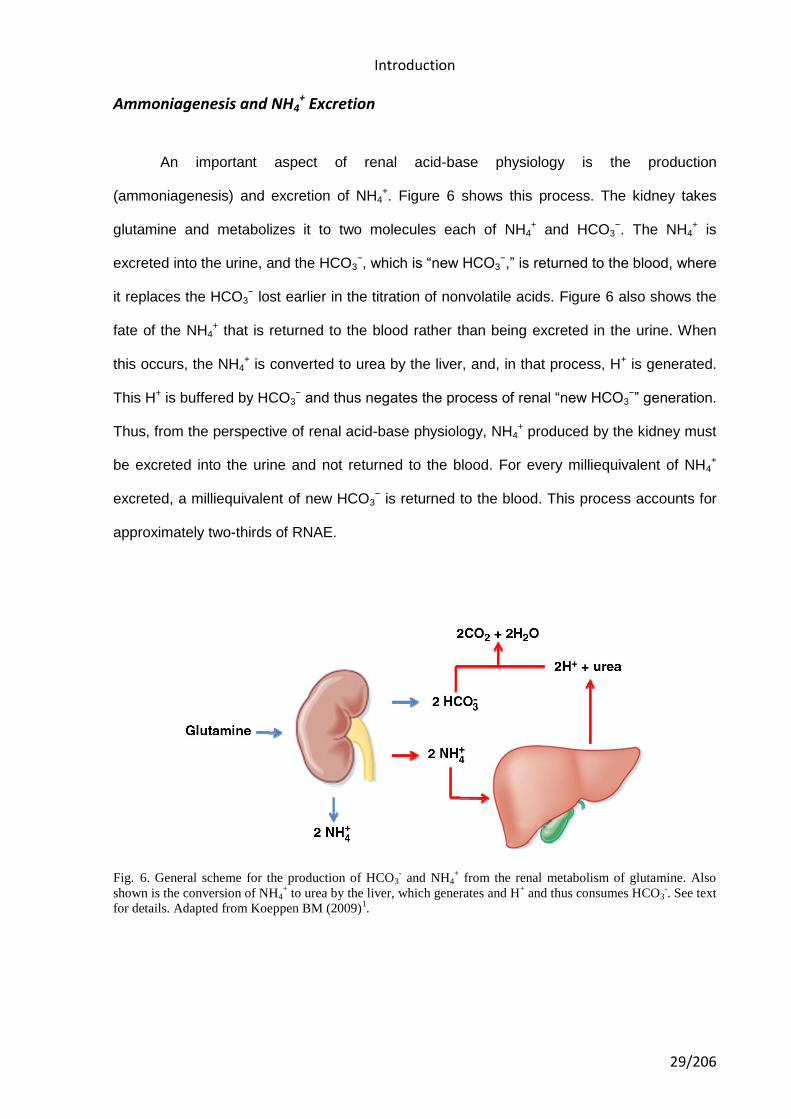
Ammoniagenesis and NH4+ Excretion
An important aspect of renal acid-base physiology is the production
(ammoniagenesis) and excretion of NH4+. Figure 6 shows this process. The kidney takes
glutamine and metabolizes it to two molecules each of NH4+ and HCO3
−. The NH4+ is
excreted into the urine, and the HCO3−, which is “new HCO3
−,” is returned to the blood, where
it replaces the HCO3− lost earlier in the titration of nonvolatile acids. Figure 6 also shows the
fate of the NH4+ that is returned to the blood rather than being excreted in the urine. When
this occurs, the NH4+ is converted to urea by the liver, and, in that process, H+ is generated.
This H+ is buffered by HCO3− and thus negates the process of renal “new HCO3
−” generation.
Thus, from the perspective of renal acid-base physiology, NH4+ produced by the kidney must
be excreted into the urine and not returned to the blood. For every milliequivalent of NH4+
excreted, a milliequivalent of new HCO3− is returned to the blood. This process accounts for
approximately two-thirds of RNAE.
Fig. 6. General scheme for the production of HCO3- and NH4
+ from the renal metabolism of glutamine. Also
shown is the conversion of NH4+ to urea by the liver, which generates and H
+ and thus consumes HCO3
-. See text
for details. Adapted from Koeppen BM (2009)1.
Introduction
30/206
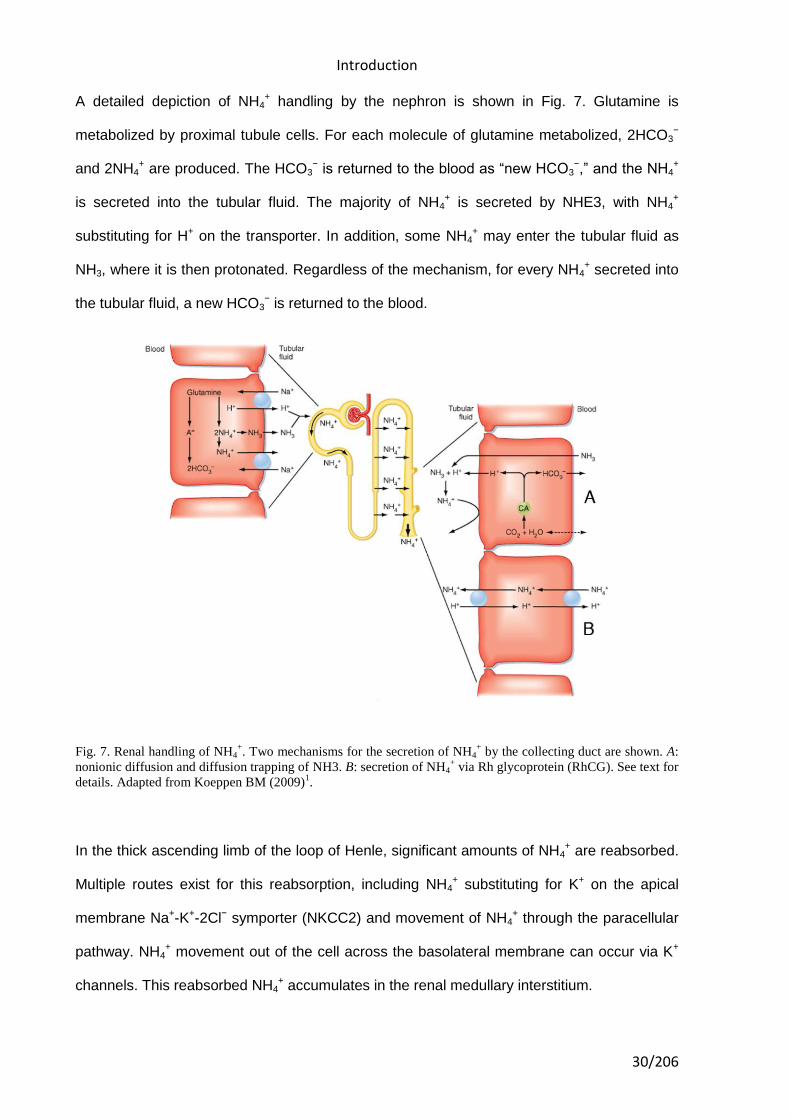
A detailed depiction of NH4+ handling by the nephron is shown in Fig. 7. Glutamine is
metabolized by proximal tubule cells. For each molecule of glutamine metabolized, 2HCO3−
and 2NH4+ are produced. The HCO3
− is returned to the blood as “new HCO3−,” and the NH4
+
is secreted into the tubular fluid. The majority of NH4+ is secreted by NHE3, with NH4
+
substituting for H+ on the transporter. In addition, some NH4+ may enter the tubular fluid as
NH3, where it is then protonated. Regardless of the mechanism, for every NH4+ secreted into
the tubular fluid, a new HCO3− is returned to the blood.
Fig. 7. Renal handling of NH4+. Two mechanisms for the secretion of NH4
+ by the collecting duct are shown. A:
nonionic diffusion and diffusion trapping of NH3. B: secretion of NH4+ via Rh glycoprotein (RhCG). See text for
details. Adapted from Koeppen BM (2009)1.
In the thick ascending limb of the loop of Henle, significant amounts of NH4+ are reabsorbed.
Multiple routes exist for this reabsorption, including NH4+ substituting for K+ on the apical
membrane Na+-K+-2Cl− symporter (NKCC2) and movement of NH4+ through the paracellular
pathway. NH4+ movement out of the cell across the basolateral membrane can occur via K+
channels. This reabsorbed NH4+ accumulates in the renal medullary interstitium.
Introduction
31/206
As noted above, if the NH4+ produced by the proximal tubule as a result of glutamine
metabolism is not excreted in the urine but instead is returned to the blood, it will be
metabolized to urea by the liver and, in that process, generate H+. If this occurs, the “new
HCO3−” generated by glutamine metabolism is negated. Thus, it is imperative that the NH4
+
reabsorbed by the thick ascending limb of the loop of Henle be resecreted into the tubular
fluid. This occurs by the collecting duct and is dependent on the ability of the collecting duct
to acidify the tubular fluid.
Our understanding of the mechanism of collecting duct NH4+ secretion is evolving as a result
of the discovery and characterization of Rh glycoproteins. Rh glycoproteins are NH4+
transporters similar to those found in yeast, plants, and bacteria. To date, three mammalian
Rh glycoproteins have been identified, and their role in renal NH3/NH4+ transport is being
elucidated. RhAG is found in erythrocytes, whereas RhGB and RhGC have been localized to
the kidneys (as well as other organs involved in NH4+ transport, such as the liver and
gastrointestinal tract). RhBG is found in distal nephron segments, beginning with the distal
convoluted tubule and continuing through the inner medullary collecting duct. The expression
in intercalated cells is greater than in principal cells. RhCG distribution along the nephron is
similar to that of RhBG, and it is present on both the apical and basolateral membranes.
Importantly, chronic acidosis increases RhCG expression in the outer and inner medullary
collecting ducts, and translocation of the transporter from an intracellular pool to the apical
membrane (note that RhBG expression does not change with chronic acidosis). Functional
studies of Rh glycoprotein have attempted to define the nature of NH3/NH4+ transport, and, to
date, the evidence is consistent with both electroneutral as well as electrogenic mechanisms.
Evidence for Na+-H+ antiport also exists. Since acidification of the tubular fluid is required for
NH4+ secretion, the operation of NH4
+/H+ antiporters on both the apical and basolateral
membranes of collecting duct cells, as shown in Fig. 7B, would explain this pH-dependent
NH4+ secretion.
Introduction
32/206
The pH dependency of NH4+ secretion has traditionally been explained by the process of
nonionic diffusion of NH3 with diffusion trapping of NH4+ in the tubular fluid (see Fig. 7A). It
remains to be determined how much of collecting duct NH4+ secretion occurs via this
mechanism and how much is mediated by RhCG or other NH3/NH4+ transporters.
After this general view of mechanisms involved in renal acid-base balance we will delve into
some situations where the acidification of urine is enhanced.
Ammonia production and transport in response to acidosis
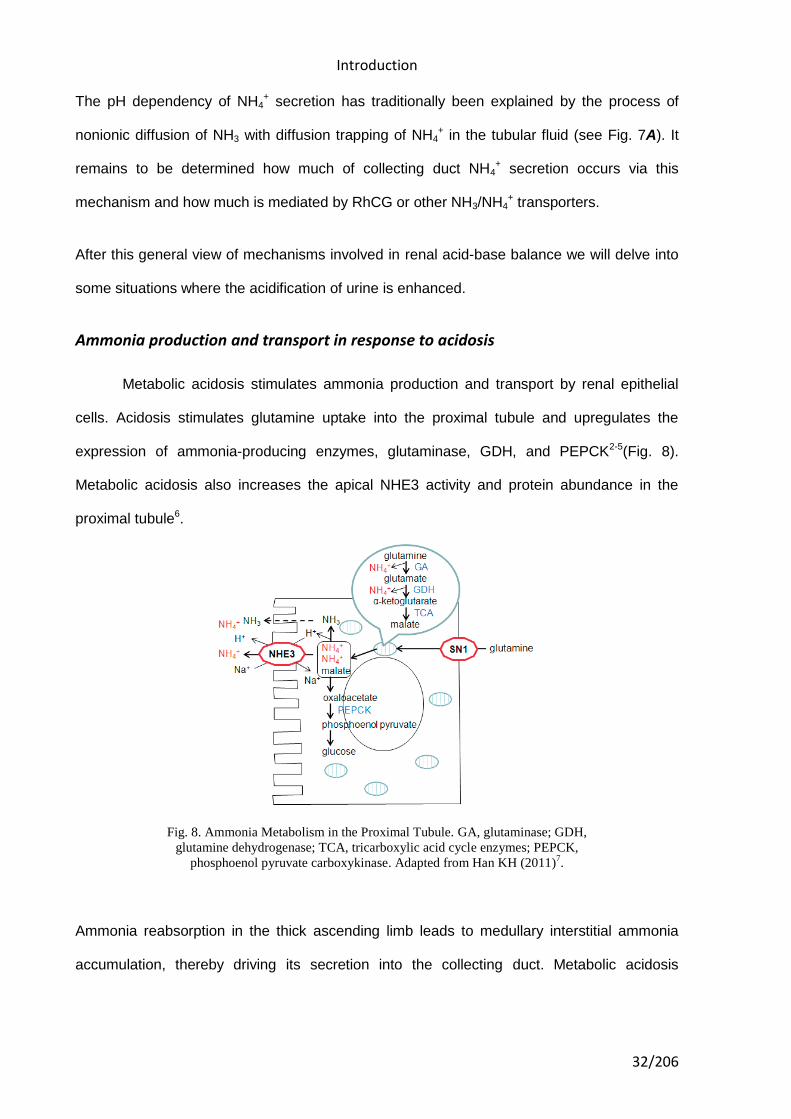
Metabolic acidosis stimulates ammonia production and transport by renal epithelial
cells. Acidosis stimulates glutamine uptake into the proximal tubule and upregulates the
expression of ammonia-producing enzymes, glutaminase, GDH, and PEPCK2-5(Fig. 8).
Metabolic acidosis also increases the apical NHE3 activity and protein abundance in the
proximal tubule6.
Fig. 8. Ammonia Metabolism in the Proximal Tubule. GA, glutaminase; GDH,
glutamine dehydrogenase; TCA, tricarboxylic acid cycle enzymes; PEPCK,
phosphoenol pyruvate carboxykinase. Adapted from Han KH (2011)7.
Ammonia reabsorption in the thick ascending limb leads to medullary interstitial ammonia
accumulation, thereby driving its secretion into the collecting duct. Metabolic acidosis
Introduction
33/206
stimulated NKCC2 mRNA and protein expression in the rat and increased NHE4 mRNA
expression in mouse thick ascending limb cells8,9.
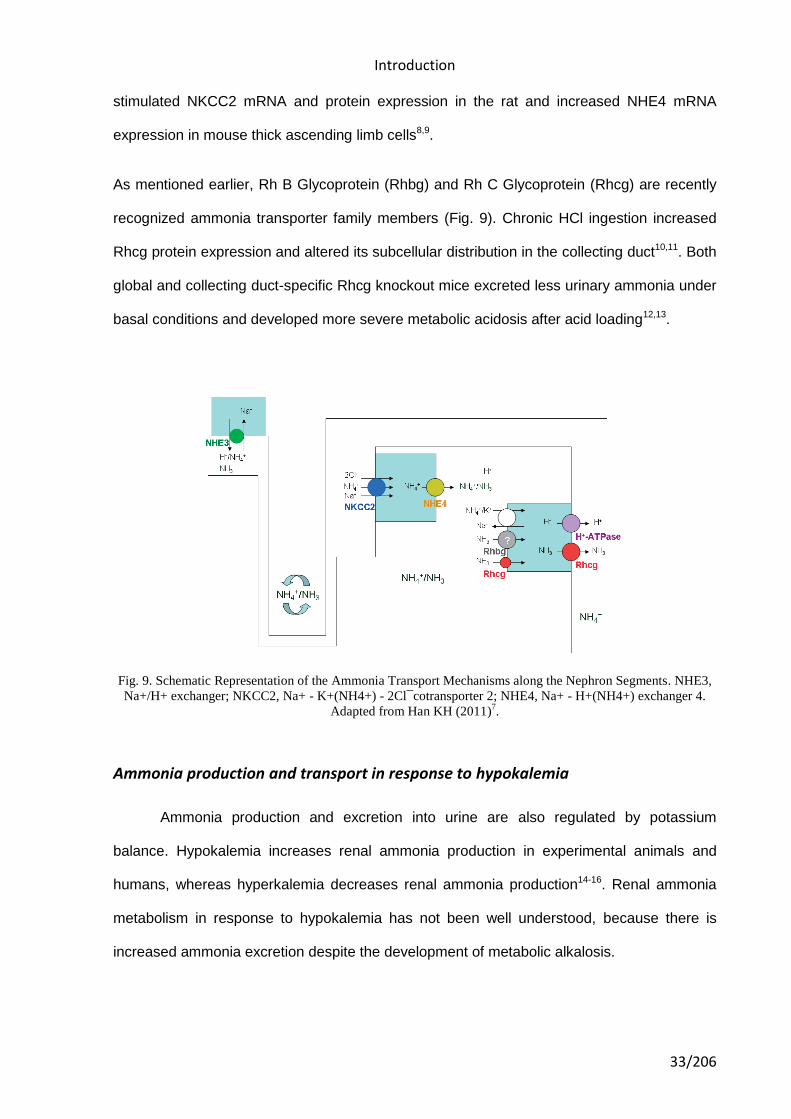
As mentioned earlier, Rh B Glycoprotein (Rhbg) and Rh C Glycoprotein (Rhcg) are recently
recognized ammonia transporter family members (Fig. 9). Chronic HCl ingestion increased
Rhcg protein expression and altered its subcellular distribution in the collecting duct10,11. Both
global and collecting duct-specific Rhcg knockout mice excreted less urinary ammonia under
basal conditions and developed more severe metabolic acidosis after acid loading12,13.
Fig. 9. Schematic Representation of the Ammonia Transport Mechanisms along the Nephron Segments. NHE3,
Na+/H+ exchanger; NKCC2, Na+ - K+(NH4+) - 2Cl¯cotransporter 2; NHE4, Na+ - H+(NH4+) exchanger 4.
Adapted from Han KH (2011)7.
Ammonia production and transport in response to hypokalemia
Ammonia production and excretion into urine are also regulated by potassium
balance. Hypokalemia increases renal ammonia production in experimental animals and
humans, whereas hyperkalemia decreases renal ammonia production14-16. Renal ammonia
metabolism in response to hypokalemia has not been well understood, because there is
increased ammonia excretion despite the development of metabolic alkalosis.
Introduction
34/206
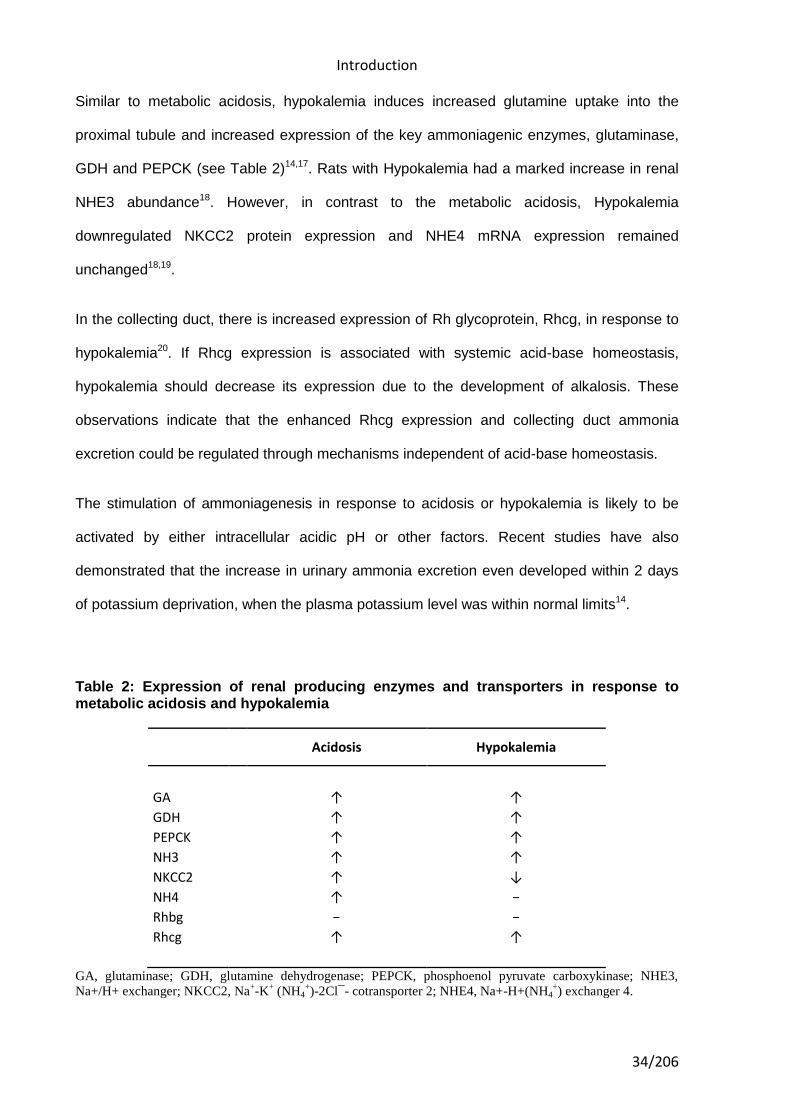
Similar to metabolic acidosis, hypokalemia induces increased glutamine uptake into the
proximal tubule and increased expression of the key ammoniagenic enzymes, glutaminase,
GDH and PEPCK (see Table 2)14,17. Rats with Hypokalemia had a marked increase in renal
NHE3 abundance18. However, in contrast to the metabolic acidosis, Hypokalemia
downregulated NKCC2 protein expression and NHE4 mRNA expression remained
unchanged18,19.
In the collecting duct, there is increased expression of Rh glycoprotein, Rhcg, in response to
hypokalemia20. If Rhcg expression is associated with systemic acid-base homeostasis,
hypokalemia should decrease its expression due to the development of alkalosis. These
observations indicate that the enhanced Rhcg expression and collecting duct ammonia
excretion could be regulated through mechanisms independent of acid-base homeostasis.
The stimulation of ammoniagenesis in response to acidosis or hypokalemia is likely to be
activated by either intracellular acidic pH or other factors. Recent studies have also
demonstrated that the increase in urinary ammonia excretion even developed within 2 days
of potassium deprivation, when the plasma potassium level was within normal limits14.
Table 2: Expression of renal producing enzymes and transporters in response to metabolic acidosis and hypokalemia
Acidosis Hypokalemia
GA ↑ ↑
GDH ↑ ↑
PEPCK ↑ ↑
NH3 ↑ ↑
NKCC2 ↑ ↓
NH4 ↑ −
Rhbg − −
Rhcg ↑ ↑
GA, glutaminase; GDH, glutamine dehydrogenase; PEPCK, phosphoenol pyruvate carboxykinase; NHE3,
Na+/H+ exchanger; NKCC2, Na+-K
+ (NH4
+)-2Cl¯- cotransporter 2; NHE4, Na+-H+(NH4
+) exchanger 4.
Introduction
35/206
ACID-BASE DISORDERS INFLUENCIABLE BY MEDICATIONS
There are many disorders/diseases that lead to changes in acid base balance. These
conditions are not rare or uncommon in clinical practice, but everyday occurrences on the
ward or in critical care. Conditions such as asthma, chronic obstructive pulmonary disease
(bronchitis or emphasaemia), diabetic ketoacidosis, renal disease or failure, any type of
shock (sepsis, anaphylaxsis, neurogenic, cardiogenic, hypovolaemia), stress or anxiety
which can lead to hyperventilation, and some drugs (sedatives, opoids) leading to reduced
ventilation. In addition, some symptoms of disease can cause vomiting and diarrhoea, which
effects acid base balance.
Management of acid–base disorders begins with accurate diagnosis, a process requiring two
tasks: First, reliable measurement of acid–base variables in the blood, a complex fluid
containing multiple ions and buffers; this task is an exercise in chemistry. Second, proper
interpretation of the data in relation to human health and disease allowing definition of the
patient’s acid–base status; this is an exercise in pathophysiology. The patient’s history,
physical examination, and additional laboratory testing and imaging, as appropriate, then
help the clinician to identify the specific cause(s) of the acid–base disturbance, and from that
information to undertake appropriate intervention21.
Assessment of acid-base status
In order to understand acid–base disorders, we must first agree on how to describe
and measure it. Since Sörensen (1868–1939) first introduced the pH notation, we have used
the pH scale to quantify acid–base balance. The pH scale has a tremendous advantage
because it lends itself to colorimetric and electrometric techniques. There is also some
physiologic relevance to the logarithmic pH scale22. pH is a complex variable, however. It is a
nonlinear transformation of H+ concentration – the logarithm of its reciprocal. Strictly
speaking, pH can only be thought of as a dimensionless representation of H+ concentration
and is not, itself, a concentration. Indeed, pH is actually the logarithmic measure of the
Introduction
36/206
volume required to contain 1 mol/l of H+. In blood plasma at pH 7.4, this volume is
approximately 25 million liters.
Regardless of how we express the concentration of H +, either directly or as the pH, it is
generally accepted that changes in blood H +concentration occur as the result of changes in
volatile [partial carbon dioxide tension (pCO2)] and nonvolatile acids (hydrochloric, sulfuric,
lactic, etc).
Since Hasselbalch adapted the Henderson equation to the pH notation of Sörenson, we have
used the following Henderson–Hasselbalch equation to understand the relationship between
respiratory and metabolic acid–base variables:
pH = pK × log [HCO3 /(0.03 × pCO2)]
Clinically, we refer to changes in volatile acids as 'respiratory' and changes in nonvolatile
acids as 'metabolic'. Any of the following indicators serves to identify an acid-base disorder:
1. An abnormal arterial blood pH (pH < 7.35 signifies acidemia; pH > 7.45 signifies
alkalemia).
2. An arterial PCO2 (pCO2) that is outside the normal range (35 to 45 mm Hg).
3. A plasma HCO3- concentration that is outside the normal range (22 to 26 mEq/L).
4. An arterial SBE that is either abnormally high (≥ 3 mEq/L) or abnormally low (≤ -3
mEq/L).
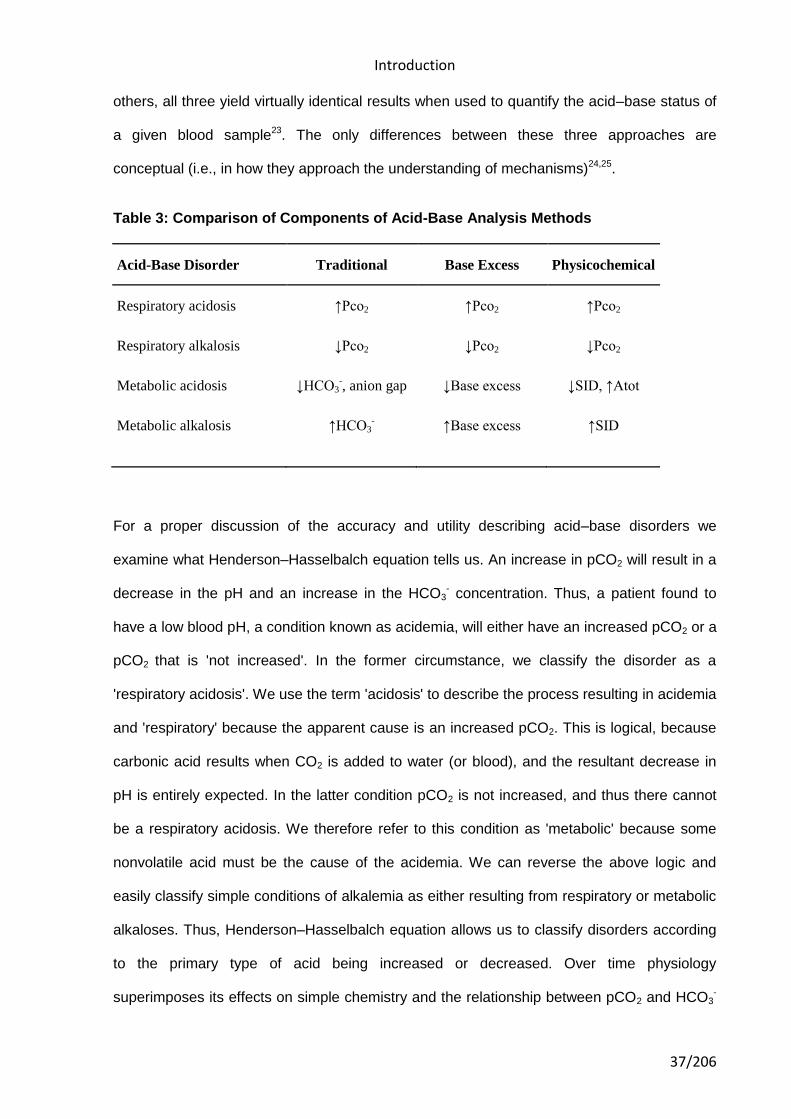
There are three major methods of quantifying acid–base disorders, and each differs only in
assessment of the 'metabolic' component. As shown on table 3, these three methods
quantify the metabolic component either by using HCO3- (in the context of pCO2), the
standard base excess (SBE), or the strong ion difference (SID). Although there has been
significant debate regarding the accuracy and utility of each method compared with the
Introduction
37/206
others, all three yield virtually identical results when used to quantify the acid–base status of
a given blood sample23. The only differences between these three approaches are
conceptual (i.e., in how they approach the understanding of mechanisms)24,25.
Table 3: Comparison of Components of Acid-Base Analysis Methods
Acid-Base Disorder Traditional Base Excess Physicochemical
Respiratory acidosis ↑Pco2 ↑Pco2 ↑Pco2
Respiratory alkalosis ↓Pco2 ↓Pco2 ↓Pco2
Metabolic acidosis ↓HCO3-, anion gap ↓Base excess ↓SID, ↑Atot
Metabolic alkalosis ↑HCO3- ↑Base excess ↑SID
For a proper discussion of the accuracy and utility describing acid–base disorders we
examine what Henderson–Hasselbalch equation tells us. An increase in pCO2 will result in a
decrease in the pH and an increase in the HCO3- concentration. Thus, a patient found to
have a low blood pH, a condition known as acidemia, will either have an increased pCO2 or a
pCO2 that is 'not increased'. In the former circumstance, we classify the disorder as a
'respiratory acidosis'. We use the term 'acidosis' to describe the process resulting in acidemia
and 'respiratory' because the apparent cause is an increased pCO2. This is logical, because
carbonic acid results when CO2 is added to water (or blood), and the resultant decrease in
pH is entirely expected. In the latter condition pCO2 is not increased, and thus there cannot
be a respiratory acidosis. We therefore refer to this condition as 'metabolic' because some
nonvolatile acid must be the cause of the acidemia. We can reverse the above logic and
easily classify simple conditions of alkalemia as either resulting from respiratory or metabolic
alkaloses. Thus, Henderson–Hasselbalch equation allows us to classify disorders according
to the primary type of acid being increased or decreased. Over time physiology
superimposes its effects on simple chemistry and the relationship between pCO2 and HCO3-
Introduction
38/206
is altered in order to reduce the alterations in pH. By carefully examining the changes that
occur in pCO2 and HCO3- in relationship to each, however, one can discern highly conserved
patterns. In this way rules can be established to allow one to discover mixed disorders and to
separate chronic from acute respiratory derangements. For example one such rule is the
convenient formula for predicting the expected pCO2 in the setting of a metabolic acidosis26:
pCO2 = (1.5 × HCO3-) + 8 ± 5
This rule tells us what the pCO2 should be secondary to the increase in alveolar ventilation
that accompanies a metabolic acidosis. If pCO2 does not change enough or changes too
much, we classify the condition as a 'mixed' disorder, with either a respiratory acidosis if the
pCO2 is still too high, or a respiratory alkalosis if the change is too great. This rule, along with
others has been recently translated to SBE terminology23:
pCO2 = (40 + SBE) ± 5
It is also very important to understand what the Henderson-Hasselbalch equation does not
tell us. First, it does not allow us to discern the severity (quantity) of the metabolic
derangement in a manner analogous to the respiratory component. For example, when there
is a respiratory acidosis, the increase in the pCO2 quantifies the derangement even when
there is a mixed disorder. However, the metabolic component can only be approximated by
the change in HCO3-. Second, Henderson-Hasselbalch equation does not tell us about any
acids other than carbonic acid. The relationship between CO2 and HCO3- provides a useful
clinical 'roadmap' to guide the clinician in uncovering the etiology of an acid–base disorder as
described above. The total CO2 concentration, and hence the HCO3- concentration, is
determined by the pCO2, however, which is in turn determined by the balance between
alveolar ventilation and CO2 production. HCO3- cannot be regulated independent of pCO2.
The HCO3- concentration in the plasma will always increase as the pCO2 increases, but this
is not an alkalosis. To understand how the pH and HCO3- concentration are altered
independent of pCO2, we must look beyond Henderson and Hasselbach27.
Introduction
39/206
The traditional method relies on analysis of changes in bicarbonate concentration and the
anion gap to assess the metabolic component. In general, an increased bicarbonate
concentration indicates a metabolic alkalosis and a decreased bicarbonate concentration
indicates a metabolic acidosis. The anion gap (AG) is used to classify metabolic acidosis into
high AG or normal AG type (explained below in metabolic acidosis section).
Siggaard and Anderson developed nomograms and algorithms that form the methodology for
analyzing acid-base status based on BE. Base excess quantifies the degree of metabolic
acidosis or alkalosis as the amount of acid or base that must be added to a sample of whole
blood in vitro to restore the pH of the sample to 7.40 while the Pco2 is held constant at 40
mm Hg. To correct for inaccuracies when applied in vivo, BE has been modified to
standardize the effect of hemoglobin and pCO2. The standard base excess (SBE) formula is
written as follows:
SBE = 0.9287 × (HCO3- – 24.4 + 14.83 × [pH – 7.4]), where SBE is given in mEq/L.
The SBE changes with any change in weak acid concentrations. A change in base excess
describes a change in the metabolic component of acid-base status, with positive BE
indicating metabolic alkalosis and negative BE indicating metabolic acidosis.
The physicochemical approach, sometimes referred to as Stewart’s approach, identifies
three independent variables that determine acid-base status: pCO2, strong ion difference
(SID), and total nonvolatile weak acids28,29. These variables also determine changes in
dependent variables, such as pH, HCO3-, CO3
2-, OH- and H+. The SID is the difference
between the sum of all strong cation concentrations and the sum of all strong anion
concentrations. All concentrations must be expressed in mEq/L. The formula for calculating
SID (in mEq/L) is as follows:
SID = [Na+ + K+ + Ca2+ + Mg2+] – [Cl- + Lactate].
Introduction
40/206
Attempts to identify which method of acid-base analysis is most correct or most clinically
useful have resulted in numerous debates and studies30-32.
The clinician should integrate the analysis of the acid-base status with the patient’s clinical
history and additional testing results when determining the most appropriate interventions.
Analysis of acid-base status in a critically ill patient at a single point in time provides only a
snapshot of a complex and rapidly changing environment.
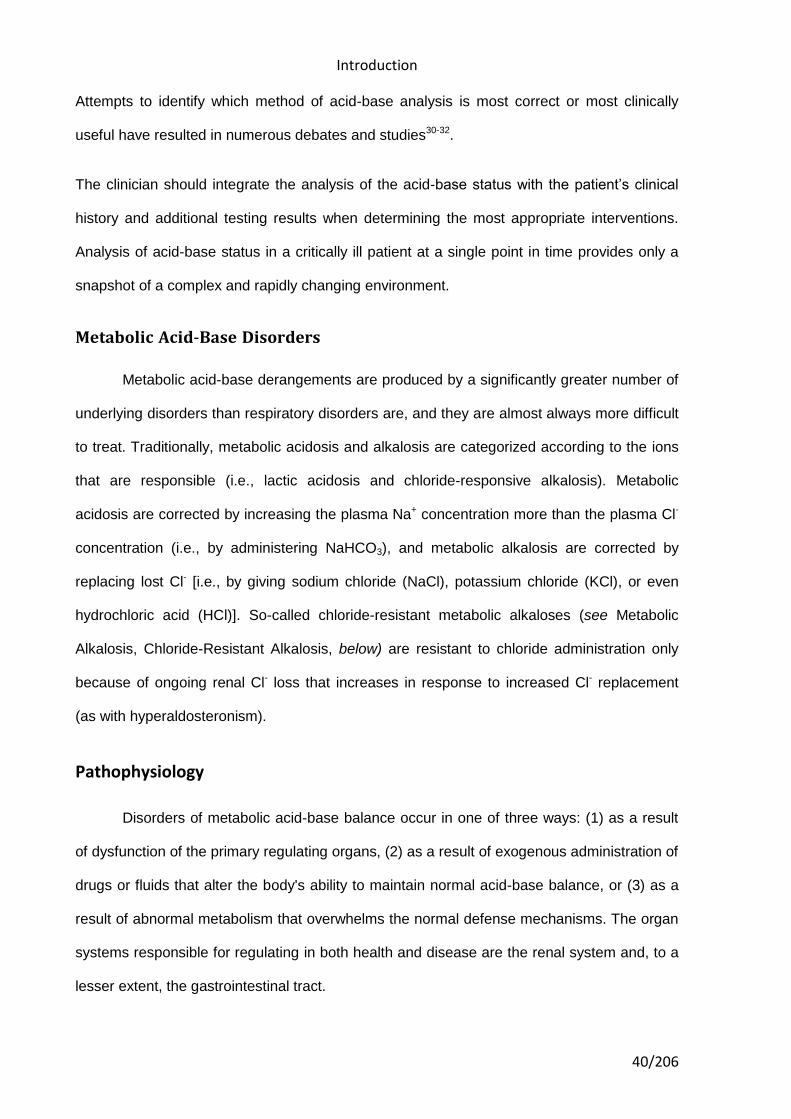
Metabolic Acid-Base Disorders
Metabolic acid-base derangements are produced by a significantly greater number of
underlying disorders than respiratory disorders are, and they are almost always more difficult
to treat. Traditionally, metabolic acidosis and alkalosis are categorized according to the ions
that are responsible (i.e., lactic acidosis and chloride-responsive alkalosis). Metabolic
acidosis are corrected by increasing the plasma Na+ concentration more than the plasma Cl-
concentration (i.e., by administering NaHCO3), and metabolic alkalosis are corrected by
replacing lost Cl- [i.e., by giving sodium chloride (NaCl), potassium chloride (KCl), or even
hydrochloric acid (HCl)]. So-called chloride-resistant metabolic alkaloses (see Metabolic
Alkalosis, Chloride-Resistant Alkalosis, below) are resistant to chloride administration only
because of ongoing renal Cl- loss that increases in response to increased Cl- replacement
(as with hyperaldosteronism).
Pathophysiology
Disorders of metabolic acid-base balance occur in one of three ways: (1) as a result
of dysfunction of the primary regulating organs, (2) as a result of exogenous administration of
drugs or fluids that alter the body's ability to maintain normal acid-base balance, or (3) as a
result of abnormal metabolism that overwhelms the normal defense mechanisms. The organ
systems responsible for regulating in both health and disease are the renal system and, to a
lesser extent, the gastrointestinal tract.
Introduction
41/206
Metabolic Acidosis
Traditionally, metabolic acidosis are categorized according to the presence or
absence of unmeasured anions. These unmeasured anions are routinely detected by
examining the plasma electrolytes and calculating the anion gap (AG) (see below).
Even extreme acidosis appears to be well tolerated by healthy persons, particularly when the
duration of the acidosis is short. For example, healthy individuals may achieve an arterial pH
lower than 7.15 and a lactate concentration higher than 20 mEq/L during maximal exercise,
with no lasting effects33. Over the long term, however, even mild acidemia (pH < 7.35) may
lead to metabolic bone disease and protein catabolism. Furthermore, critically ill patients may
not be able to tolerate even brief episodes of acidemia. There do appear to be significant
differences between metabolic and respiratory acidosis with respect to patient outcome, and
these differences suggest that the underlying disorder may be more important than the
absolute degree of acidemia34.
If prudence dictates that symptomatic therapy is to be provided, the likely duration of the
disorder should be taken into account. When the disorder is expected to be a short-lived one
(i.e., diabetic ketoacidosis), maximizing respiratory compensation is usually the safest
approach. Once the disorder resolves, ventilation can be quickly reduced to normal levels,
and there will be no lingering effects from therapy (i.e., by administering NaHCO3, there is a
risk of alkalosis when the underlying disorder resolves). When the disorder is likely to be a
more chronic one (i.e., renal failure), therapy is indicated. If increasing the plasma Na+
concentration is inadvisable for other reasons (i.e., hypernatremia), NaHCO3 administration
is inadvisable. It is noteworthy that NaHCO3 administration has not been shown to improve
outcome in patients with lactic acidosis35. In addition, NaHCO3 administration is associated
with certain disadvantages. Large (hypertonic) doses, if given rapidly, may actually reduce
blood pressure36 and may cause sudden, severe increases in pCO237. Accordingly, it is
important to assess the patient's ventilatory status before NaHCO3 is administered,
Introduction
42/206
particularly if the patient is not on a ventilator. NaHCO3 infusion also affects serum K+ and
Ca2+ concentrations, which must be monitored closely.
To avoid some of the disadvantages of NaHCO3 therapy, alternative therapies for metabolic
acidosis have been developed. Carbicarb is an equimolar mixture of sodium carbonate
(Na2CO3) and NaHCO338. Like NaHCO3, carbicarb works by increasing the plasma Na+
concentration, except that it does not raise the pCO2. THAM (tris-hydroxymethyl
aminomethane) is a synthetic buffer that consumes CO2 and readily penetrates cells39. It is a
weak base (pK = 7.9) and, as such, is unlike other plasma constituents. Although THAM has
been available since the 1960s, there is surprisingly little information available regarding its
efficacy in humans with acid-base disorders. In small uncontrolled studies, THAM appears to
be capable of reversing metabolic acidosis secondary to ketoacidosis or renal failure without
causing obvious toxicity; however, adverse reactions have been reported, including
hypoglycemia, respiratory depression, and even fatal hepatic necrosis, when concentrations
exceeding 0.3 mol/L are used. In Europe, a mixture of THAM, acetate, NaHCO3, and
disodium phosphate is available. This mixture, known as tribonate (Tribonat; Pharmacia &
Upjohn, Solna, Sweden), seems to have fewer side effects than THAM alone does, but as
with THAM, experience with its use in humans is still quite limited.
Anion Gap
Determination and utility of anion gap
The AG has been used by clinicians for more than 30 years and has evolved into a
major tool for evaluating acid-base disorders40. It is calculated—or, rather, estimated—from
the difference between the routinely measured concentrations of serum cations (Na+ and K+)
and the routinely measured concentrations of anions (Cl- and HCO3-). Normally, albumin
accounts for the bulk of this difference, with phosphate playing a lesser role. Sulfate and
lactate also contribute a small amount to the gap (normally, < 2 mEq/L); however, there are
also unmeasured cations (e.g., Ca2+ and Mg2+), which tend to offset the effects of sulfate and
Introduction
43/206
lactate except when the concentration of either one is abnormally increased. Plasma proteins
other than albumin can be either positively or negatively charged, but in the aggregate, they
tend to be electrically neutral41, except in rare cases of abnormal paraproteins (as in multiple
myeloma). In practice, the AG is calculated as follows:
AG = (Na++ K+) - (Cl-+ HCO3-)
The primary value of the AG is that it quickly and easily limits the differential diagnosis in a
patient with metabolic acidosis. When the AG is increased, the explanation is almost
invariably one of the following five disorders: ketosis, lactic acidosis, poisoning, renal failure,
and sepsis. In addition to these disorders, however, there are several conditions that can
alter the accuracy of AG estimation and are particularly frequent in critical illness42,43.
The primary problem with the AG is its reliance on the use of a supposedly normal range
produced by albumin and, to a lesser extent, phosphate. Concentrations of albumin and
phosphate may be grossly abnormal in patients with critical illness, and these abnormalities
may change the normal AG range in this setting. Thus, the normal AG for a given patient can
be conveniently estimated as follows27:
Normal AG = 2(albumin [g/dl]) + 0.5(phosphate [mg/dl])
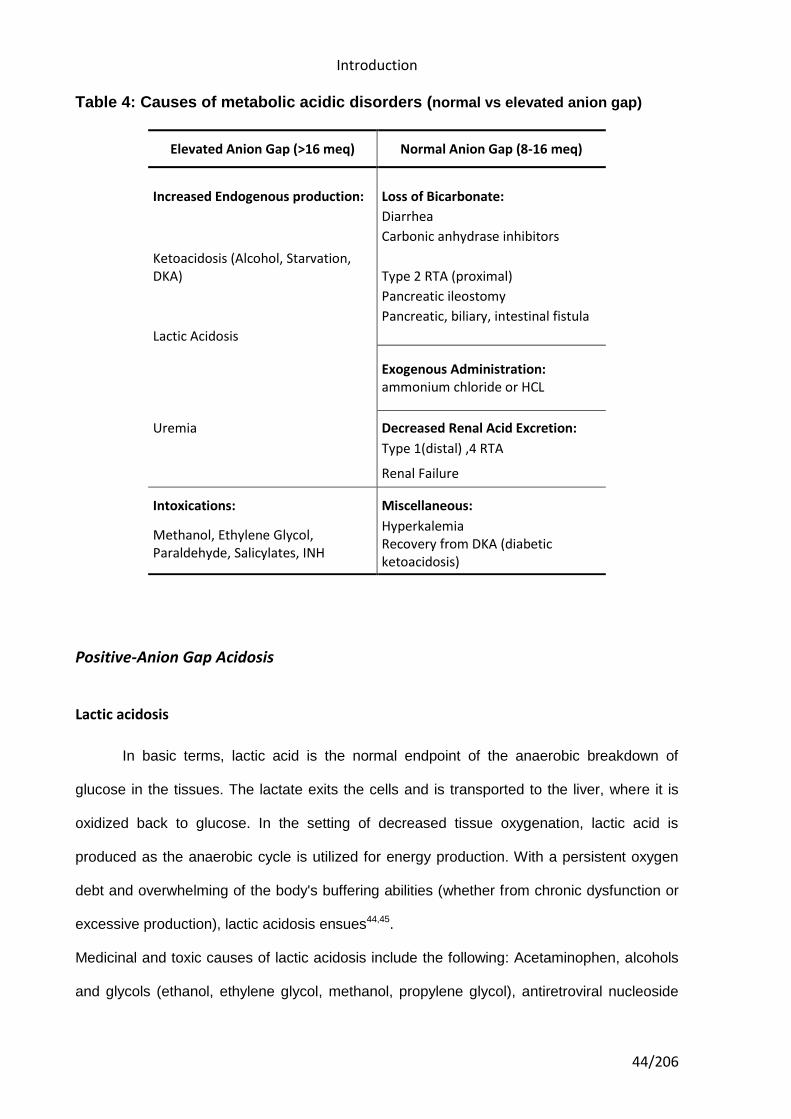
Most common causes for metabolic acidosis are resumed in Table 4.
Introduction
44/206
Table 4: Causes of metabolic acidic disorders (normal vs elevated anion gap)
Elevated Anion Gap (>16 meq) Normal Anion Gap (8-16 meq)
Increased Endogenous production: Loss of Bicarbonate:
Diarrhea
Carbonic anhydrase inhibitors
Ketoacidosis (Alcohol, Starvation, DKA) Type 2 RTA (proximal)
Pancreatic ileostomy
Pancreatic, biliary, intestinal fistula
Lactic Acidosis
Exogenous Administration: ammonium chloride or HCL
Uremia Decreased Renal Acid Excretion:
Type 1(distal) ,4 RTA
Renal Failure
Intoxications: Miscellaneous:
Methanol, Ethylene Glycol, Paraldehyde, Salicylates, INH
Hyperkalemia Recovery from DKA (diabetic ketoacidosis)
Positive-Anion Gap Acidosis
Lactic acidosis
In basic terms, lactic acid is the normal endpoint of the anaerobic breakdown of
glucose in the tissues. The lactate exits the cells and is transported to the liver, where it is
oxidized back to glucose. In the setting of decreased tissue oxygenation, lactic acid is
produced as the anaerobic cycle is utilized for energy production. With a persistent oxygen
debt and overwhelming of the body's buffering abilities (whether from chronic dysfunction or
excessive production), lactic acidosis ensues44,45.
Medicinal and toxic causes of lactic acidosis include the following: Acetaminophen, alcohols
and glycols (ethanol, ethylene glycol, methanol, propylene glycol), antiretroviral nucleoside
Introduction
45/206
analogs (zidovudine, didanosine, lamivudine), beta-adrenergic agents (epinephrine, ritodrine,
terbutaline), biguanides (phenformin, metformin), cocaine, cyanogenic compounds (cyanide,
aliphatic nitriles, nitroprusside), diethyl ether, 5-Fluorouracil, halothane, iron, isoniazid,
propofol, sugars and sugar alcohols (fructose, sorbitol, and xylitol), salicylates, strychnine,
sulfasalazine and valproic acid.
A 2010 study by Salpeter et al found that the oral antihyperglycemic agent metformin,
despite concerns to the contrary, is not associated with an increased risk for lactic acidosis
compared with other antihyperglycemic treatments46.
Ketoacidosis
Ketoacidosis is a metabolic state associated with high concentrations of ketone
bodies, formed by the breakdown of fatty acids and the deamination of amino acids. The two
common ketones produced in humans are acetoacetic acid and β-hydroxybutyrate. The
pathological metabolic state is marked by extreme and uncontrolled ketosis. In ketoacidosis,
the body fails to adequately regulate ketone production causing such a severe accumulation
of keto acids that the pH of the blood is substantially decreased. In extreme cases
ketoacidosis can be fatal.
Ketoacidosis is most common in untreated type 1 diabetes mellitus, when the liver breaks
down fat and proteins in response to a perceived need for respiratory substrate. Prolonged
alcoholism may lead to alcoholic ketoacidosis.
Acidosis secondary to renal failure
Although renal failure may produce a hyperchloremic metabolic acidosis, especially
when it is chronic, the buildup of sulfates and other acids frequently increases the AG;
however, the increase usually is not large47. Similarly, uncomplicated renal failure rarely
produces severe acidosis, except when it is accompanied by high rates of acid generation
(i.e., from hypermetabolism).
Introduction
46/206
Acidosis secondary to toxin ingestion
Metabolic acidosis with an increased AG is a major feature of various types of
intoxication (see Table 4). Generally, it is more important to recognize these conditions and
provide specific therapy for them than it is to treat the acid-base imbalances that they
produce.
Acidosis secondary to rhabdomyolysis
The extensive muscle tissue breakdown associated with myonecrosis may also be a
source of metabolic acidosis. In this situation, the acidosis results from accumulation of
organic acids. The myoglobinuria associated with the disorder may also induce renal failure.
In most cases, the diagnosis is a clinical one and can be facilitated by measuring creatinine
kinase or aldolase levels. Early identification and aggressive resuscitation may prevent the
onset of renal failure and improve the prognosis48.
Acidosis of unknown origin
Several causes of an increased AG have been reported that have yet to be
elucidated. An unexplained AG in the nonketotic hyperosmolar state of diabetes has been
reported49. In addition, even when very careful measurement techniques have been
employed, unmeasured anions have been reported in the blood of patients with sepsis50,51,
patients with liver disease52, and animals to which endotoxin had been administered53.
Furthermore, unknown cations also appear in the blood of some critically ill patients51. The
significance of these findings remains to be determined.
Non-Anion Gap (Hyperchloremic) Acidoses
Hyperchloremic metabolic acidosis occurs as a result of either an increase in the level
of Cl- relative to the levels of strong cations (especially Na+) or a loss of cations with retention
of Cl-. The various causes of such an acidosis can be distinguished on the basis of the
history and the measured Cl- concentration in the urine. When acidosis occurs, the kidney
Introduction
47/206
normally responds by increasing Cl- excretion; the absence of this response identifies the
kidney as the source of the problem. Extrarenal hyperchloremic acidoses occur because of
exogenous Cl- loads (iatrogenic acidosis) or because of loss of cations from the lower GI
tract without proportional loss of Cl- (gastrointestinal acidosis).
Renal tubular acidosis
Renal tubular acidosis (RTA) is a medical condition that involves an accumulation of
acid in the body due to a failure of the kidneys to appropriately acidify the urine54. When
blood is filtered by the kidney, the filtrate passes through the tubules of the nephron, allowing
for exchange of salts, acid equivalents, and other solutes before it drains into the bladder as
urine. The metabolic acidosis that results from RTA may be caused either by failure to
recover sufficient (alkaline) bicarbonate ions from the filtrate in the early portion of the
nephron (proximal tubule) or by insufficient secretion of (acid) hydrogen ions into the latter
portions of the nephron (distal tubule).
Gastrointestinal acidosis
Fluid secreted into the gut lumen contains more Na+ than Cl-; the proportions are
similar to those seen in plasma. Massive loss of this fluid, particularly if lost volume is
replaced with fluid containing equal amounts of Na+ and Cl-, will result in a decreased plasma
Na+ concentration relative to the Cl- concentration.
Iatrogenic acidosis
Two of the most common causes of a hyperchloremic metabolic acidosis are
iatrogenic, and both involve administration of Cl-. One of these potential causes is parenteral
nutrition. Modern parenteral nutrition formulas contain weak anions (i.e., acetate) in addition
to Cl-, and the proportions of these anions can be adjusted according to the acid-base status
of the patient. If sufficient amounts of weak anions are not provided, the plasma Cl-
Introduction
48/206
concentration will increase causing acidosis. The other potential cause is fluid resuscitation
with saline, which can give rise to a so-called dilutional acidosis (a problem first described
more than 40 years ago)55.
Unexplained hyperchloremic acidosis
Critically ill patients sometimes manifest hyperchloremic metabolic acidosis for
reasons that cannot be determined. Often, other coexisting types of metabolic acidosis are
present, making the precise diagnosis difficult. For example, some patients with lactic
acidosis have a greater degree of acidosis than can be explained by the increase in the
lactate concentration50, and some patients with sepsis and acidosis have normal lactate
levels56. In many instances, the presence of unexplained anions is the cause50-52, but in other
cases, there is a hyperchloremic acidosis.
Metabolic Alkalosis
Metabolic alkalosis occurs as a result of decrease of anions (i.e., Cl- from the stomach
and albumin from the plasma) or increases in cations (rare). Metabolic alkalosis can be
divided into those in which Cl- losses are temporary and can be effectively replaced
(chloride-responsive alkalosis) and those in which hormonal mechanisms produce ongoing
losses that, at best, can be only temporarily offset by Cl- administration (chloride-resistant
alkalosis). Like hyperchloremic acidosis, metabolic alkalosis can be confirmed by measuring
the urine Cl- concentration (see Table 5).
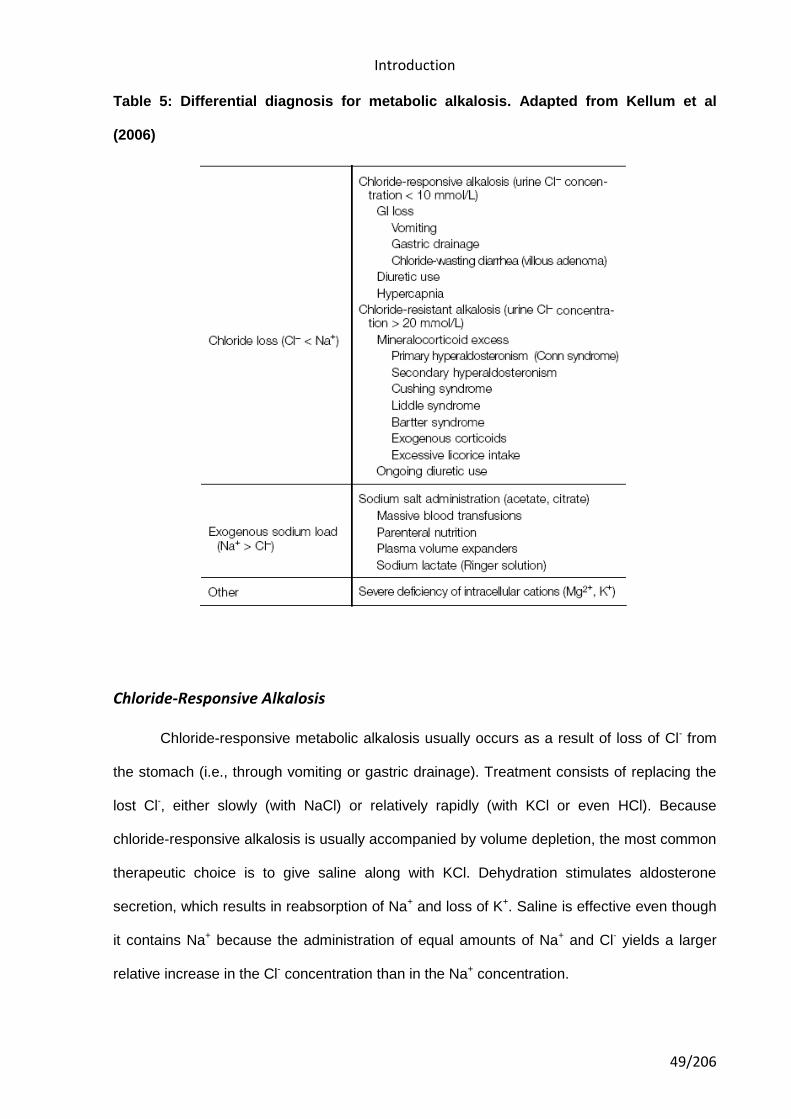
Introduction
49/206
Table 5: Differential diagnosis for metabolic alkalosis. Adapted from Kellum et al
(2006)
Chloride-Responsive Alkalosis
Chloride-responsive metabolic alkalosis usually occurs as a result of loss of Cl- from
the stomach (i.e., through vomiting or gastric drainage). Treatment consists of replacing the
lost Cl-, either slowly (with NaCl) or relatively rapidly (with KCl or even HCl). Because
chloride-responsive alkalosis is usually accompanied by volume depletion, the most common
therapeutic choice is to give saline along with KCl. Dehydration stimulates aldosterone
secretion, which results in reabsorption of Na+ and loss of K+. Saline is effective even though
it contains Na+ because the administration of equal amounts of Na+ and Cl- yields a larger
relative increase in the Cl- concentration than in the Na+ concentration.
Introduction
50/206
Diuresis and other forms of volume contraction cause metabolic alkalosis mainly by
stimulating aldosterone secretion; however, diuretics also directly stimulate excretion of K+
and Cl-, further complicating the problem and inducing metabolic alkalosis more rapidly.
Chloride-Resistant Alkalosis
Chloride-resistant alkalosis is characterized by an increased urine Cl- concentration (>
20 mmol/L) and ongoing Cl- loss that cannot be abolished by Cl- replacement. Most
commonly, the proximate cause is increased mineralocorticoid activity. Treatment involves
identification and correction of the underlying disorder.
Respiratory Acid-Base Disorders
Respiratory disorders are far easier to diagnose and treat than metabolic disorders
are because the mechanism is always the same, even though the underlying disease
process may vary. CO2 is produced by cellular metabolism or by the titration of HCO3- by
metabolic acids. Normally, alveolar ventilation is adjusted to maintain the pCO2 between 35
and 45 mm Hg. When alveolar ventilation is increased or decreased out of proportion to the
pCO2, a respiratory acid-base disorder exists.
Pathophysiology
CO2 is produced by the body at a rate of 220 ml/min, which equates to production of
15 mol/L of carbonic acid each day. By way of comparison, total daily production of all the
nonrespiratory acids managed by the kidney and the gut amounts to less than 500 mmol/L.
Pulmonary ventilation is adjusted by the respiratory center in response to pCO2, pH, and pO2,
as well as in response to exercise, anxiety, wakefulness, and other signals. Normal pCO2 (40
mm Hg) is attained by precisely matching alveolar ventilation to metabolic CO2 production.
pCO2 changes in predictable ways as a compensatory ventilatory response to the altered
arterial pH produced by metabolic acidosis or alkalosis.
Introduction
51/206
Respiratory Acidosis
When the rate of CO2 elimination is inadequate relative to the rate of tissue CO2
production, the pCO2 rises to a new steady state, determined by the new relation between
alveolar ventilation and CO2 production. In the short term, this rise in the pCO2 increases the
concentrations of both H+ and HCO3- according to the carbonic acid equilibrium equation.
Thus, the change in the HCO3- concentration is mediated not by any systemic adaptation but
by chemical equilibrium. The higher HCO3- concentration does not buffer the H+
concentration. The SID does not change, nor does the SBE. Tissue acidosis always occurs
in respiratory acidosis because CO2 inevitably builds up in the tissue.
If the pCO2 remains elevated, a compensatory response will occur, to return the H+
concentration to the normal range, by removing Cl- from the plasma space. If Cl- moves into
tissues or red blood cells, it will result in intracellular acidosis (complicated by the elevated
tissue pCO2); thus, to exert a lasting effect, Cl- must be removed from the body. The kidney
is designed to do this, whereas the GI tract is not (though the adaptive capacity of the GI
tract as a route of Cl- elimination has not been fully explored). Accordingly, patients with renal
disease have a very difficult time adapting to chronic respiratory acidosis.
Patients whose renal function is intact can eliminate Cl- in the urine; after a few days, and the
pH is restored to a value of 7.35. It is unclear whether this amount of time is necessary
because of the physiologic constraints of the system or because the body benefits from not
being overly sensitive to transient changes in alveolar ventilation. In any case, this response
yields an increased pH for any degree of hypercapnia. According to the Henderson-
Hasselbalch equation, the increased pH results in an increased HCO3- concentration for a
given pCO2. Thus, the 'adaptive' increase in the HCO3- concentration is actually the
consequence, not the cause, of the increased pH. As said before (see above), only changes
in the independent variables of acid-base balance (pCO2, strong ion difference (SID), and
Introduction
52/206
total nonvolatile weak acids) can affect the plasma H+ concentration, and HCO3-
concentration is not an independent variable.
Respiratory Alkalosis
Respiratory alkalosis may be the most frequently encountered acid-base disorder. It
occurs in residents of high-altitude locales and in persons with any of a wide range of
pathologic conditions, the most important of which are salicylate intoxication, early sepsis,
hepatic failure, and hypoxic respiratory disorders. Respiratory alkalosis also occurs in
association with pregnancy and with pain or anxiety. Hypocapnia appears to be a particularly
strong negative prognostic indicator in patients with critical illness. Like acute respiratory
acidosis, acute respiratory alkalosis results in a small change in the HCO3- concentration, as
dictated by the Henderson-Hasselbalch equation. If hypocapnia persists, the SID begins to
decrease as a consequence of renal Cl- reabsorption. After 2 to 3 days, the SID assumes a
new and lower steady state57.
Severe alkalemia is unusual in respiratory alkalosis. Management therefore is typically
directed toward the underlying cause. In general, these mild acid-base changes are clinically
important more for what they can alert the clinician to, in terms of underlying disease, than
for any direct threat they pose to the patient. In rare cases, respiratory depression with
narcotics is necessary.
Introduction
53/206
URINE pH
Overview
Urine is a typically sterile liquid by-product of the body secreted by the kidneys
through a process called urination and excreted through the urethra. Cellular metabolism
generates numerous by-products, many rich in nitrogen, that require elimination from the
bloodstream. These by-products are eventually expelled from the body in a process known
as micturition, the primary method for excreting water-soluble chemicals from the body.
These chemicals can be detected and analyzed by urinalysis.
Most animals have excretory systems for elimination of soluble toxic wastes. In humans,
soluble wastes are excreted primarily by the urinary system and, to a lesser extent in terms
of urea removed, by perspiration. The urinary system consists of the kidneys, ureters, urinary
bladder, and urethra. The system produces urine by a process of filtration, reabsorption, and
tubular secretion. The kidneys extract the soluble wastes from the bloodstream, as well as
excess water, sugars, and a variety of other compounds. The resulting urine contains high
concentrations of urea and other substances, including toxins. Urine flows from the kidney
through the ureter, bladder, and finally the urethra before passing from the body.
Urine pH is used to classify urine as either a dilute acid or base solution. Seven is the point
of neutrality on the pH scale. The glomerular filtrate of blood is usually acidified by the
kidneys from a pH of approximately 7.4 to a pH of about 6 in the urine. Depending on the
person's acid-base status, the pH of urine may range from 4.5 to 8.
The kidneys maintain normal acid-base balance primarily through the reabsorption of sodium
and the tubular secretion of hydrogen and ammonium ions. Urine becomes increasingly
acidic as the amount of sodium and excess acid retained by the body increases. Alkaline
urine, usually containing bicarbonate-carbonic acid buffer, is normally excreted when there is
Introduction
54/206
an excess of base or alkali in the body. Secretion of acid or alkaline urine by the kidneys is
one of the most important mechanisms that the body uses to maintain a constant body pH.
External factors influencing urine pH
Several researchers have noted that the contemporary Western diet has increased in
net acid load relative to diets of the ancestral pre-agricultural Homo sapiens58-60.
Quite possibly, this shift occurred because of the agricultural revolution and the ubiquity of
processed grains and shelf-stable food products devoid of essential nutritional components.
In addition to this underlying foundational change in diet, there is the overlay of various
nutritional fads that have risen and fallen over the past few decades. Most recently, the latest
diet trend has been an interest in high-protein foods accompanied by a compensatory
decrease in the phytochemical load from fresh fruits and vegetables. Indeed, high-protein
diets increase net dietary acid load and acidify the urine pH.59-62
Several factors can influence on urine pH: diet, body surface area, acute water load and
exercise63,64 (through lactic acidosis). Exposures to these factors cause fluctuations in urine
pH during the course of a 24 hours period63,65,66. Remer and Manz calculated the potential
renal acid loads of certain food groups and reported that alkaline-forming foods were
primarily vegetable and fruits, whereas acid-forming foods were derived from cheese, meat,
fish, and grain products61 (see Table 6).
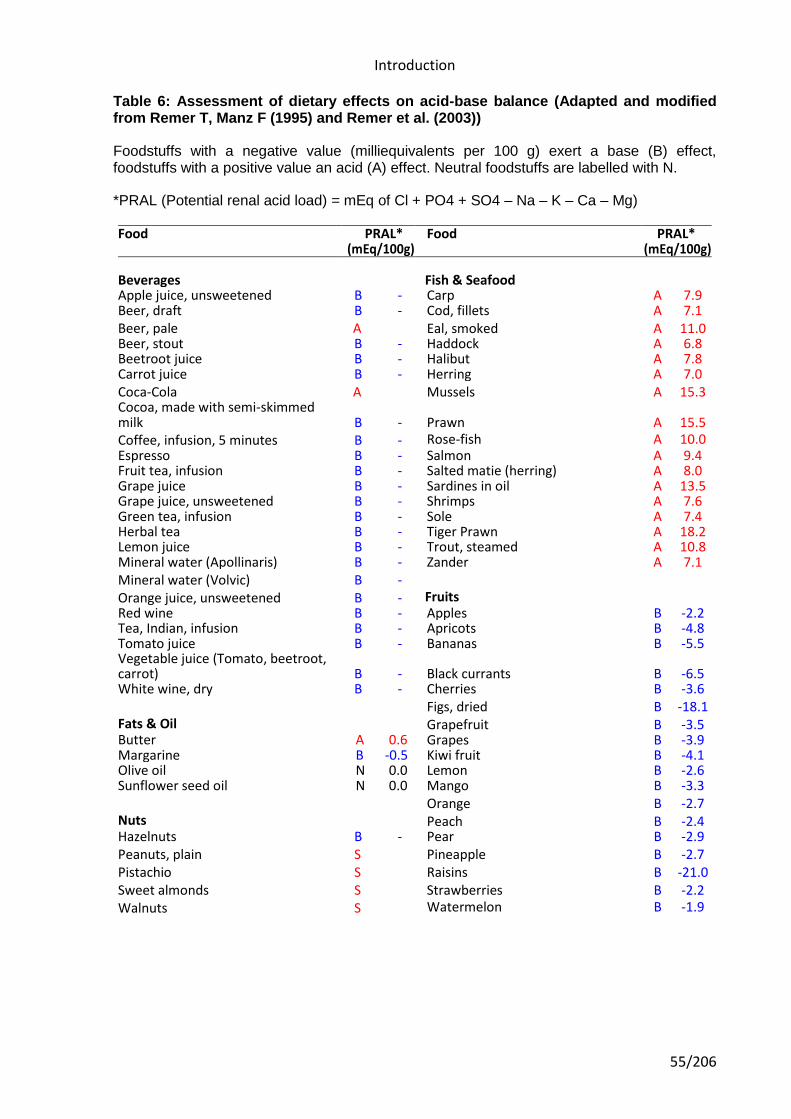
Introduction
55/206
Table 6: Assessment of dietary effects on acid-base balance (Adapted and modified from Remer T, Manz F (1995) and Remer et al. (2003))
Foodstuffs with a negative value (milliequivalents per 100 g) exert a base (B) effect, foodstuffs with a positive value an acid (A) effect. Neutral foodstuffs are labelled with N.
*PRAL (Potential renal acid load) = mEq of Cl + PO4 + SO4 – Na – K – Ca – Mg)
Food PRAL* Food PRAL* (mEq/100g) (mEq/100g)
Beverages Fish & Seafood Apple juice, unsweetened B - Carp A 7.9 Beer, draft B - Cod, fillets A 7.1 Beer, pale A Eal, smoked A 11.0 Beer, stout B - Haddock A 6.8 Beetroot juice B - Halibut A 7.8 Carrot juice B - Herring A 7.0 Coca-Cola A Mussels A 15.3 Cocoa, made with semi-skimmed milk B - Prawn A 15.5 Coffee, infusion, 5 minutes B - Rose-fish A 10.0 Espresso B - Salmon A 9.4 Fruit tea, infusion B - Salted matie (herring) A 8.0 Grape juice B - Sardines in oil A 13.5 Grape juice, unsweetened B - Shrimps A 7.6 Green tea, infusion B - Sole A 7.4 Herbal tea B - Tiger Prawn A 18.2 Lemon juice B - Trout, steamed A 10.8 Mineral water (Apollinaris) B - Zander A 7.1 Mineral water (Volvic) B -
Orange juice, unsweetened B - Fruits Red wine B - Apples B -2.2 Tea, Indian, infusion B - Apricots B -4.8 Tomato juice B - Bananas B -5.5 Vegetable juice (Tomato, beetroot, carrot) B - Black currants B -6.5 White wine, dry B - Cherries B -3.6 Figs, dried B -18.1 Fats & Oil s & Oil Grapefruit B -3.5 Butter A 0.6 Grapes B -3.9 Margarine B -0.5 Kiwi fruit B -4.1 Olive oil N 0.0 Lemon B -2.6 Sunflower seed oil N 0.0 Mango B -3.3 Orange B -2.7 Nuts Peach B -2.4 Hazelnuts B - Pear B -2.9 Peanuts, plain S Pineapple B -2.7 Pistachio S Raisins B -21.0 Sweet almonds S Strawberries B -2.2 Walnuts S Watermelon B -1.9
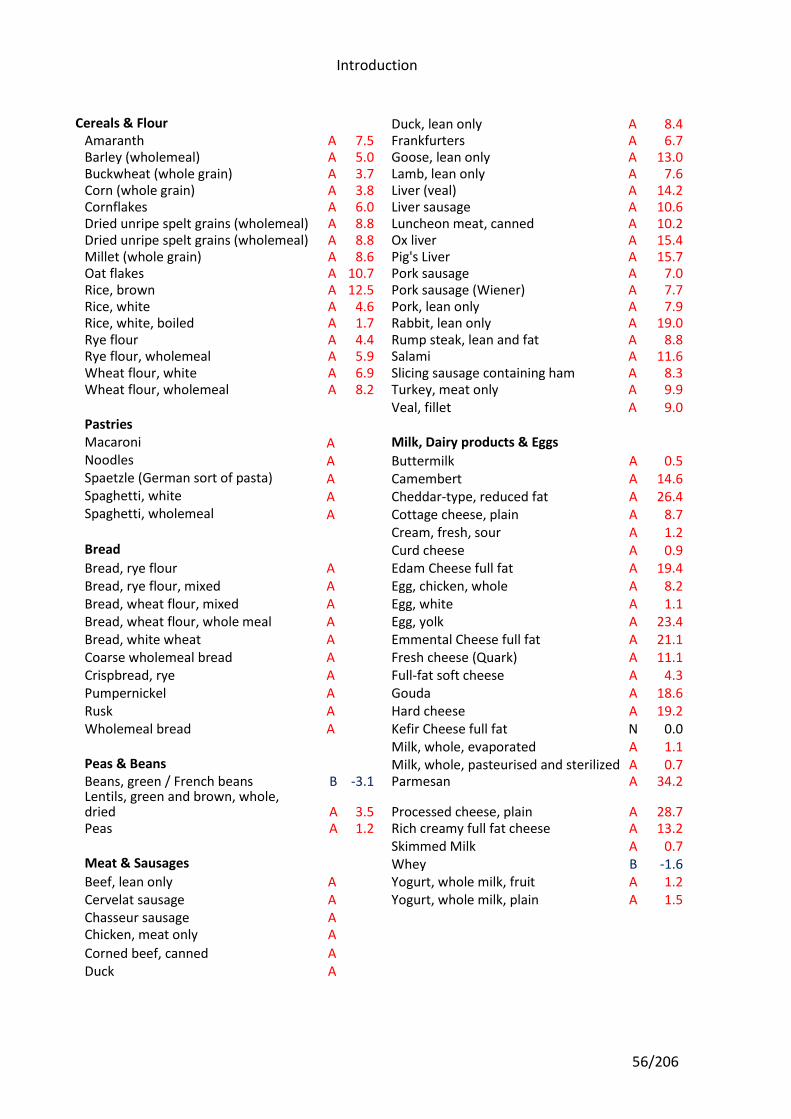
Introduction
56/206
Cereals & Flour Duck, lean only A 8.4 Amaranth A 7.5 Frankfurters A 6.7 Barley (wholemeal) A 5.0 Goose, lean only A 13.0 Buckwheat (whole grain) A 3.7 Lamb, lean only A 7.6 Corn (whole grain) A 3.8 Liver (veal) A 14.2 Cornflakes A 6.0 Liver sausage A 10.6 Dried unripe spelt grains (wholemeal) A 8.8 Luncheon meat, canned A 10.2 Dried unripe spelt grains (wholemeal) A 8.8 Ox liver A 15.4 Millet (whole grain) A 8.6 Pig's Liver A 15.7 Oat flakes A 10.7 Pork sausage A 7.0 Rice, brown A 12.5 Pork sausage (Wiener) A 7.7 Rice, white A 4.6 Pork, lean only A 7.9 Rice, white, boiled A 1.7 Rabbit, lean only A 19.0 Rye flour A 4.4 Rump steak, lean and fat A 8.8 Rye flour, wholemeal A 5.9 Salami A 11.6 Wheat flour, white A 6.9 Slicing sausage containing ham A 8.3 Wheat flour, wholemeal A 8.2 Turkey, meat only A 9.9
Veal, fillet A 9.0 Pastries Macaroni A Milk, Dairy products & Eggs Noodles A Buttermilk A 0.5 Spaetzle (German sort of pasta) A Camembert A 14.6 Spaghetti, white A Cheddar-type, reduced fat A 26.4 Spaghetti, wholemeal A Cottage cheese, plain A 8.7
Cream, fresh, sour A 1.2 Bread Curd cheese A 0.9 Bread, rye flour A Edam Cheese full fat A 19.4 Bread, rye flour, mixed A Egg, chicken, whole A 8.2 Bread, wheat flour, mixed A Egg, white A 1.1 Bread, wheat flour, whole meal A Egg, yolk A 23.4 Bread, white wheat A Emmental Cheese full fat A 21.1 Coarse wholemeal bread A Fresh cheese (Quark) A 11.1 Crispbread, rye A Full-fat soft cheese A 4.3 Pumpernickel A Gouda A 18.6 Rusk A Hard cheese A 19.2 Wholemeal bread A Kefir Cheese full fat N 0.0
Milk, whole, evaporated A 1.1 Peas & Beans Milk, whole, pasteurised and sterilized A 0.7 Beans, green / French beans B -3.1 Parmesan A 34.2 Lentils, green and brown, whole, dried A 3.5 Processed cheese, plain A 28.7 Peas A 1.2 Rich creamy full fat cheese A 13.2
Skimmed Milk A 0.7 Meat & Sausages Whey B -1.6 Beef, lean only A Yogurt, whole milk, fruit A 1.2 Cervelat sausage A Yogurt, whole milk, plain A 1.5 Chasseur sausage A Chicken, meat only A
Corned beef, canned A
Duck A
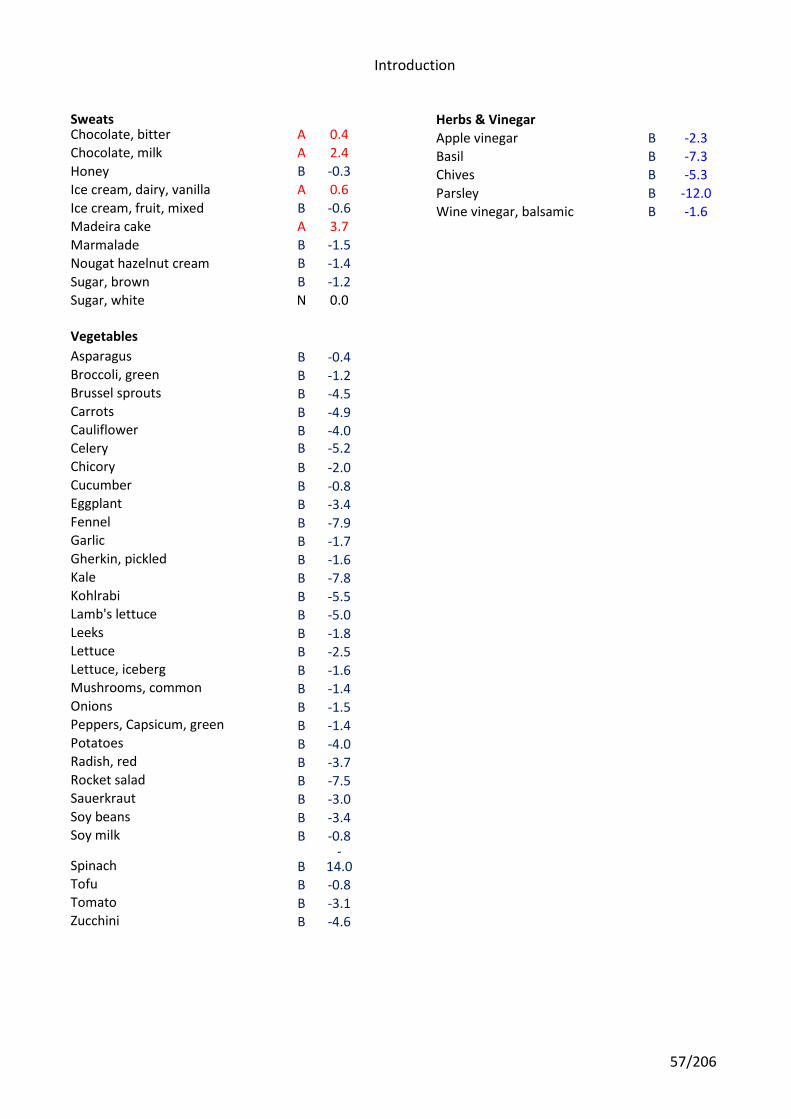
Introduction
57/206
Sweats Chocolate, bitter A 0.4 Chocolate, milk A 2.4
Honey B -0.3
Ice cream, dairy, vanilla A 0.6
Ice cream, fruit, mixed B -0.6 Madeira cake A 3.7
Marmalade B -1.5
Nougat hazelnut cream B -1.4
Sugar, brown B -1.2 Sugar, white N 0.0
Vegetables
Asparagus B -0.4 Broccoli, green B -1.2 Brussel sprouts B -4.5 Carrots B -4.9 Cauliflower B -4.0 Celery B -5.2
Chicory B -2.0 Cucumber B -0.8 Eggplant B -3.4 Fennel B -7.9 Garlic B -1.7 Gherkin, pickled B -1.6 Kale B -7.8 Kohlrabi B -5.5 Lamb's lettuce B -5.0 Leeks B -1.8 Lettuce B -2.5 Lettuce, iceberg B -1.6 Mushrooms, common B -1.4 Onions B -1.5 Peppers, Capsicum, green B -1.4 Potatoes B -4.0 Radish, red B -3.7 Rocket salad B -7.5 Sauerkraut B -3.0 Soy beans B -3.4 Soy milk B -0.8
Spinach B -
14.0 Tofu B -0.8 Tomato B -3.1 Zucchini B -4.6
Herbs & Vinegar
Apple vinegar B -2.3 Basil B -7.3 Chives B -5.3
Parsley B -12.0
Wine vinegar, balsamic B -1.6
Introduction
58/206
Urine pH fluctuates during the course of a 24 hour period. It tends to increase during the day
and to decrease during the night65,66. Subjects can be classified with respect to their urine pH
based on whether their urine during the day is mostly alkaline, acidic or with alkaline/acidic
fluctuations65. In some subjects these patterns change from day-to-day (Alguacil et al.
submitted).
Urinary pH measurement
There are several options to measure urine pH. The pH meter is used as the gold
standard67. While some reliable digital portable models are now available, pH meters must be
calibrated regularly, and they are more expensive than pH strips (also known as ‘pH paper_
or ‘pH dip strips). The accuracy of pH strips for urine pH measurements compared to the pH
meter has been assessed in studies on animals and humans with varied results68-71. There
have also been some attempts to estimate urine pH levels based on several factors that can
influence its value: diet composition, body surface area, acute water load and exercise (lactic
metabolism)61,63,64. As said before, Remer and Manz estimated the dietary acid load for a
number of food items accounting for intestinal absorption rates of individual nutrients, and
combined that information with BMI to estimate urine pH61. However, the estimation
approach only yields an average point estimate of the urine pH for a given individual, and
does not provide information on pH fluctuation patterns.
Murayama et al have identified three major patterns of urinary pH fluctuation during a 24-
hour period according to pH= 6.0 as baseline: acidic when all readings are below 6.0,
alkaline when all readings are above 6.0, and wide fluctuation below than and above than
6.065. However, little is known about whether urinary pH patterns from a given 24-hour period
stay constant over time. Clinicians and researchers relying in single spot AM urine samples
or even samples representative from 24-hour collections may not accurately classify subjects
with respect to day-to-day fluctuation of urinary pH. Alguacil et al estimated the minimum
number of urine pH measurements using pH strips needed to identify subjects with
Introduction
59/206
‘‘constantly acidic urine pH’’, defined as having urine pH ≤ 6.0 in two daily pH measurements
early in the morning and in the evening over a week period.
Over time, ingestion of a high dietary acid load can progress to a chronic low-grade level of
metabolic acidosis. The incidence of low-grade acidosis resulting from our modern diet has
been well documented58,60,72. A chronic acidic load can cause a number of health conditions
such as osteoporosis, kidney disease, and muscle wasting58. Sebastian et al articulates this
cause and effect relationship eloquently: “Increasing evidence . . . suggests that such
persisting, albeit low-grade, acidosis, and the relentless operation of responding homeostatic
mechanisms, result in numerous injurious effects on the body including dissolution to bone,
muscle wasting, kidney stone formation, and damage to the kidney”58.
URINARY ALKALINIZATION
The concept of acid-alkaline balance in the field of medicine is not entirely novel, as it
has been embraced by several groups within the medical community. Naturopathic medicine
has used the acid-alkaline balance as a theoretical model to explain the foundation of many
diseases. Allopathic medicine has examined pH modulation in specific organ systems such
as the kidney to control the formation of stones and the elimination of toxins. For example,
urine alkalinization has been part of the medical protocol for the management and prevention
of uric acid stones73,74.
Another aspect of the acid-alkaline balance is its role in detoxification, via either the acute
removal of a drug or poison due to overdose or a nutritional protocol to support metabolic
detoxification and decrease dietary toxins. Urinary pH alkalinization is a method employed
under acute medical settings for the enhanced elimination of toxins in the event of a severe
overdose. Conversely, acidification of urine also increases the elimination of specific toxins,
although to a seemingly lesser degree75,76. The method by which urine alkalinization works to
enhance toxin elimination is by the medically recognized process of “ion trapping,” which is
the ability to enhance urinary excretion of weak acids in alkaline urine, preventing the
Introduction
60/206
reabsorption of xenobiotics by renal tubules77,78. Proudfoot et al published a position paper
on urine alkalinization, approved by the American Academy of Clinical Toxicology, which
describes the use of urine alkalinization to ≥7.5 via intravenous sodium bicarbonate
administration for acute poisoning and toxicity77. In this extensive review, the effect of urine
alkalinization on the excretion of various pharmaceuticals and environmental toxins is
elucidated.
This report states that “urine alkalinization increases the urine elimination of chlorpropamide,
2,4-dichlorophenoxyacetic acid, difl unisal, fluoride, mecoprop, methotrexate, phenobarbital,
and salicylate”77. The potential of urine alkalinization to enhance toxin excretion is
exemplified by the work of Blank and Wolffram, wherein they modulated urine pH in pigs with
2% dietary sodium bicarbonate, changing the urine pH from 5.7 ± 0.2 to 8.3 ± 0.1, and
favorably impacted the excretion of ochratoxin A, a mycotoxin, from 9.3 ± 1.9% to 22.2 ±
4.3% of the dose79. Also, experimental and clinical studies confirm that urine alkalinization is
effective for salicylate poisoning78,80,81. Garrettson and Geller showed in humans that an
increase in urine pH from 6.1 to 8.1 changed the renal clearance of salicylate from 0.08 ±
0.08 L/h to 1.41 ± 0.82 L/h78.
Therefore, if the rapid removal of toxins can be achieved to a large extent with increasing
urine pH 2 points on the pH scale (which corresponds to a 100-fold decrease in H+ ions), it
would follow that smaller quantities of toxins may be removed on a prolonged basis if there
were a subtle increase of urine pH in the alkaline direction. Due to the logarithmic pH scale, a
small change in urine pH could have a disproportionately large effect on drug and xenobiotic
clearance77. The concept of “progressive” versus rapid alkalinization of urine may be useful
as an adjunct for integrative health approaches employing metabolic detoxification using
specific (nutritional) protocols. Traditionally, functional medicine has addressed detoxification
or the removal of harmful endo- or exogenous substances, from the aspect of upregulating
hepatic phase I and phase II enzymes to enable the chemical biotransformation of toxins into
water-soluble metabolites for excretion in the urine. With the added clinical procedure of
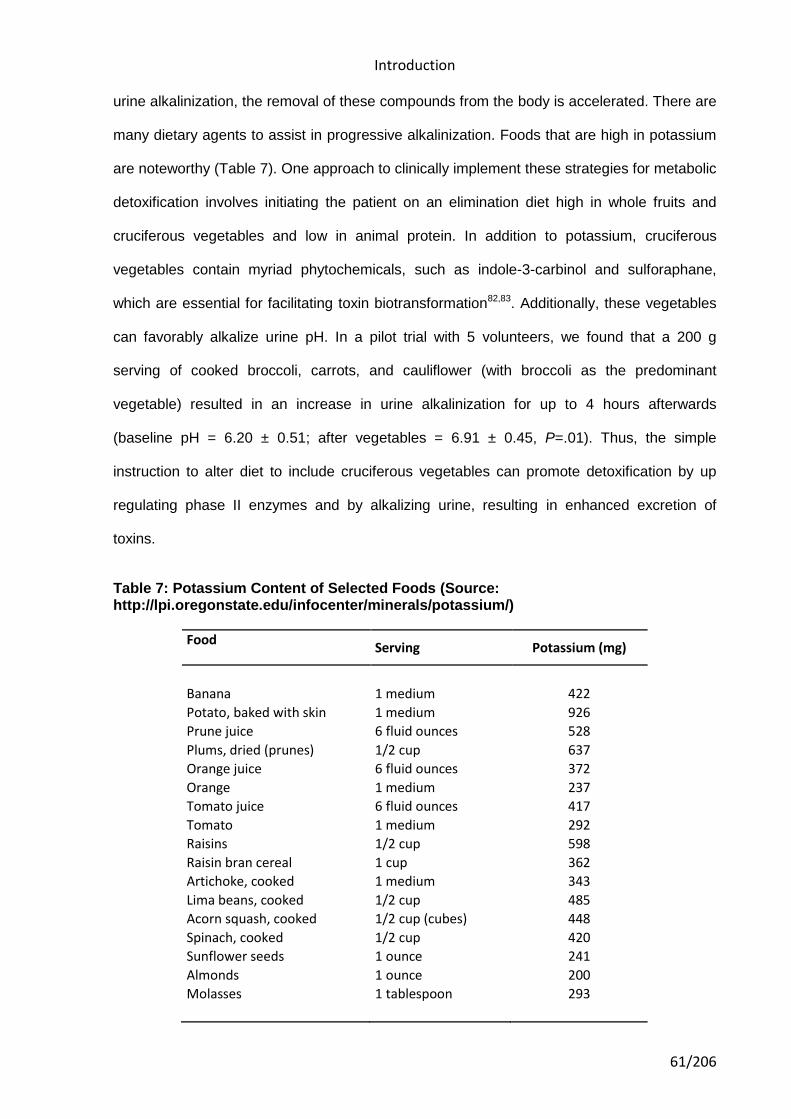
Introduction
61/206
urine alkalinization, the removal of these compounds from the body is accelerated. There are
many dietary agents to assist in progressive alkalinization. Foods that are high in potassium
are noteworthy (Table 7). One approach to clinically implement these strategies for metabolic
detoxification involves initiating the patient on an elimination diet high in whole fruits and
cruciferous vegetables and low in animal protein. In addition to potassium, cruciferous
vegetables contain myriad phytochemicals, such as indole-3-carbinol and sulforaphane,
which are essential for facilitating toxin biotransformation82,83. Additionally, these vegetables
can favorably alkalize urine pH. In a pilot trial with 5 volunteers, we found that a 200 g
serving of cooked broccoli, carrots, and cauliflower (with broccoli as the predominant
vegetable) resulted in an increase in urine alkalinization for up to 4 hours afterwards
(baseline pH = 6.20 ± 0.51; after vegetables = 6.91 ± 0.45, P=.01). Thus, the simple
instruction to alter diet to include cruciferous vegetables can promote detoxification by up
regulating phase II enzymes and by alkalizing urine, resulting in enhanced excretion of
toxins.
Table 7: Potassium Content of Selected Foods (Source: http://lpi.oregonstate.edu/infocenter/minerals/potassium/)
Food Serving Potassium (mg)
Banana 1 medium 422
Potato, baked with skin 1 medium 926
Prune juice 6 fluid ounces 528
Plums, dried (prunes) 1/2 cup 637
Orange juice 6 fluid ounces 372
Orange 1 medium 237
Tomato juice 6 fluid ounces 417
Tomato 1 medium 292
Raisins 1/2 cup 598
Raisin bran cereal 1 cup 362
Artichoke, cooked 1 medium 343
Lima beans, cooked 1/2 cup 485
Acorn squash, cooked 1/2 cup (cubes) 448
Spinach, cooked 1/2 cup 420
Sunflower seeds 1 ounce 241
Almonds 1 ounce 200
Molasses 1 tablespoon 293
Introduction
62/206
Moreover, alkalinization during metabolic detoxification may be particularly useful, as it is
believed that cellular pH and the blood buffering system shift to the acid side of ideal pH
reserve during detoxification due to increased circulation of xenobiotics and organic acids
(eg, glucuronic acid). Furthermore, organic cation transporters that are responsible for the
transport of xenobiotics in and out of the cell are pH-sensitive84,85.
Alkalizing agents
In addition to dietary changes, nutritional supplementation for a short-term course of 3
to 4 weeks with select botanicals can facilitate metabolic detoxification. It would be
appropriate to include specific alkalizing agents, such as potassium, within this nutritional
regimen (Table 7). Unfortunately, the mainstream Western diet is poor in potassium, as it
often lacks sufficient fruits and vegetables. The adequate intake (AI) established by the Food
and Nutrition Board of the Institute of Medicine for potassium is 4.7 g daily, which is the same
amount that is encouraged by the Dietary Approaches to Stop Hypertension (DASH) diet to
maintain lower blood pressure levels, decrease the effects of salt intake, decrease the risk of
kidney stones, and possibly reduce the incidence of bone loss. Current median intakes of
potassium in the United States are roughly 35% and 50% below the AI for men and women,
respectively. African Americans would particularly benefit from increased potassium intakes
due to their relatively low potassium intakes and high prevalence of elevated blood pressure
and salt sensitivity. For the healthy population, intake of potassium at levels higher than the
AI is not of particular high risk due to the ability of the kidney to excrete excess amounts.
However, potassium intakes should be closely monitored for patients with acute or chronic
renal failure and pre-existing heart disease and for those on medications that increase
potassium reserves in the body, such as potassium sparing medications.
Various potassium salts are available to alter urine pH. Studies using sodium bicarbonate
administration reveal little effect on urinary calcium excretion in contrast to studies that used
potassium bicarbonate or potassium citrate supplementation and found significant
Introduction
63/206
reductions86,87. Potassium citrate, a therapeutic regimen to prevent kidney stones, can
effectively alkalize urine. Doses of 4 to 8 g daily for 2 weeks in patients with homozygous
cystinuria have effectively alkalized urine88. Additionally, there are a number of studies on the
use of potassium citrate to counteract bone resorption caused by chronic acidemia of
protein-rich diets89-91.
The effects of potassium depend on its accompanying anion. Potassium chloride, commonly
used in processed food products, does not appear to have the same alkalizing ability as
potassium citrate. In a recent study, Jehle et al demonstrated that potassium citrate was
more efficacious than potassium chloride in increasing bone mineral density in
postmenopausal women with osteopenia92. Furthermore, potassium chloride led to
decreased bone mineral density in the lumbar spine. Potassium citrate supplementation in
these subjects resulted in a sustained and significant reduction in urinary calcium excretion
and an increase in urinary citrate excretion, indicating that alkalinization had occurred92,93.
Additionally, the citrate anion may be especially relevant for detoxification since it is an
intermediate of the Krebs cycle and can potentially play a role in energy production. As many
clinicians acknowledge from their experience, lack of energy is a common side effect of the
first stages of metabolic detoxification.
Therefore, eating foods that are high in citrate, such as certain fruits and vegetables, may be
beneficial. It is also worth noting that citrate is metabolized to bicarbonate in the body,
thereby further adding to the buffering potential.
URINARY pH AS A RISK FACTOR FOR DISEASE
Urinary pH and osteoporosis
Osteoporosis is a skeletal disease that is characterized by compromised bone
strength predisposing a person to an increased risk of fracture94. Bone strength is a
combination of bone density and bone quality. Overall bone strength is difficult to measure in
Introduction
64/206
the clinical setting. In the absence of fragility fracture, bone mineral density (BMD), a proxy
measure that accounts for up to 70% of bone strength, is the clinical tool used to diagnose
osteoporosis according to the classification of the WHO. BMD that is 2.5 standard deviations
or more below the mean BMD of a young adult reference population, which is a T-score of
−2.5 or less, qualifies for a diagnosis of osteoporosis95. As BMD decreases, fracture risk
increases96. Fractures associated with osteoporosis are a major cause of morbidity, disability,
mortality, and costs97. Mortality rate is increased by 20% in the year following a hip fracture98.
Furthermore, 50% of women who suffer from a hip fracture will not return to their usual level
of functioning and will depend on others for their daily activities; 20% of them will require
long-term care98. Therefore, it is crucial to prevent osteoporosis and fractures.
Osteoporosis is a disease that causes pain, disability, reduced quality of life99, mortality100,
and places substantial demands on health care budgets101,102. According to the acid-ash
hypothesis, the modern diet produces residual acid after metabolism59,103,104. This diet-
derived acid is thought to be buffered by bicarbonate from bone, followed by bone calcium
excretion in the urine59,103,104.
In order to maintain acid-alkaline balance throughout the various body systems, one system
may be required to support another. For example, the bone matrix contains a substantial
alkaline reserve such as calcium and magnesium cations that are released from the bone to
balance an overly acidic dietary load in the event of inadequate buffering capacity in the
blood. However, repeated borrowing of the body’s alkaline reserve in response to a
consistent increased (dietary) acid load can be potentially detrimental. In humans,
hypercalciuria and negative calcium balance due to calcium efflux from bone may lead to
metabolic bone disease and calcium nephrolithiasis59,105,106. In the chapter titled “Potassium”
of its report Dietary Reference Intakes for Water, Potassium, Sodium, Chloride, and Sulfate,
the Institute of Medicine Food and Nutrition Board states the following:
Introduction
65/206
“In the setting of an inadequate intake of bicarbonate precursors, buffers in the bone matrix
neutralize the excess diet-derived acid, and in the process, bone becomes demineralized.
Excess diet-derived acid titrates bone and leads to increased urinary calcium and reduced
urinary citrate excretion. The resultant adverse clinical consequences are possibly increased
bone demineralization and increased risk of calcium containing kidney stones”.
Conversely, dietary modification can positively influence bone metabolism. A diet favoring
neutralization of net endogenous acid production increases calcium and phosphate retention,
reduces bone resorption markers, and increases markers of bone formation in
postmenopausal women104. Furthermore, studies have demonstrated a positive association
between a high intake of alkali-rich fruits and vegetables with preservation of bone mineral
density72,107,108.
Numerous papers in the medical literature (experimental trials59,92,104,109-114, cross sectional
studies61,103, prospective studies72,107,115,116, and animal models117) identify the potential acid
load of the diet as a risk factor for osteoporosis. Well-respected textbooks and reference
works118 uphold this concept. Of public health importance, the acid-ash hypothesis is
marketed to the general public as the "alkaline diet", to decrease acidity, to help the body
regulate its pH, and to prevent numerous disease processes. Websites, lay literature,
magazine advertisements, and direct mail marketing encourage people to measure their
urine pH to assess their risk of osteoporosis as well as their general health status. Urine pH
of people consuming modern diets tends to be slightly acidic, with pH of approximately
6114,119. When urine pH is found to be acidic, the "alkaline diet" and the purchase of products
to achieve acid-base balance are advocated.
Urinary pH and kidney stones
Among urinary disorders, stone formation is of paramount importance. Kidney stones
are hard, rock like substances that form in the kidneys. The most common types of kidney
stones are calcium oxalate, calcium phosphate and uric acid stones. These stones form by
Introduction
66/206
the precipitation of concentrated amounts of minerals/ elements (calcium, oxalate,
phosphate, uric acid, etc.) found in the urine. Diet is one of several factors that can promote
or inhibit kidney stone formation. Other factors include heredity, environment, weight, and
fluid intake. The body uses food for energy and tissue repair. After the body uses what it
needs, waste products in the bloodstream are carried to the kidneys and excreted as urine.
Certain foods create wastes that may form crystals in the urinary tract. In some people, the
crystals grow into stones. For people who have had a kidney stone, preventing another will
be a priority. In addition to dietary changes, a person may need medicine to prevent kidney
stones. Metabolic risk factors involved in the generation of kidney stones are hypercalciuria,
hypocitraturia, hyperoxaluria, hyperuricosuria, and abnormally low urinary pH. Dietary-
environmental risk factors include high urinary sodium and low urine volume. Rare or less
commonly encountered risk factors are high urinary cystine, and alkaline urine from an
infection with urea-splitting organisms120. The first step in preventing kidney stones is to learn
what kind of stones a person’s body typically makes.
Types of kidney stones
• Calcium oxalate stones are the most common. They tend to form when the urine is acidic,
meaning it has a low pH. Some of the oxalate in urine is produced by the body. Calcium and
oxalate in the diet play a part but are not the only factors that affect the formation of calcium
oxalate stones. Dietary oxalate is an organic molecule found in many vegetables, fruits, and
nuts. Calcium from bone may also play a role in kidney stone formation.
• Calcium phosphate stones are less common. Calcium phosphate stones tend to form when
the urine is alkaline, meaning it has a high pH.
• Uric acid stones are more likely to form when the urine is persistently acidic, which may
result from a diet rich in animal proteins and purines—substances found naturally in all food
but especially in organ meats, fish, and shellfish.
• Struvite stones result from infections in the kidney. Preventing struvite stones depends on
staying infection free. Diet has not been shown to affect struvite stone formation.
Introduction
67/206
• Cystine stones result from a rare genetic disorder that causes cystine—an amino acid, one
of the building blocks of protein—to leak through the kidneys and into the urine to form
crystals.
Urinary pH plays an important role in the formation of most types of kidney stones121.
Although struvite stones and calcium phosphate require an alkaline pH for their formation,
acid uric stones, cystine stones, and to a lesser extent, calcium oxalate stones are more
easily formed in acidic urine65. Subjects with constantly acidic pH or constantly alkaline pH on
a day-to-day basis may be more likely to develop kidney stones recidives than those with
fluctuant urinary pH. The identification of the type of kidney stone combined with the
appropriate classification of the patients with respect to their urinary pH may enhance our
understanding of the process of kidney stone formation, as well as reduce the rate of
urolithiasis recurrence through improvements in treatment (including dietary counseling)122.
Various dietary changes have been recommended to halt stone recurrence, including
restricted intake of sodium, oxalate and animal proteins. Useful drugs include thiazide or
indapamide to control hypercalciuria, potassium citrate to correct hypocitraturia and undue
urinary acidity, and allopurinol for co-existing hyperuricemia or marked hyperuricosuria120.
Several medications—notably acyclovir, sulfonamides, methotrexate, indinavir, and
triamterene—are associated with the production of crystals that are insoluble in human urine.
Intratubular precipitation of these crystals can lead to acute renal insufficiency. Many patients
who require treatment with these medications have additional risk factors, such as true or
effective intravascular volume depletion and underlying renal insufficiency that increase the
likelihood of drug-induced intrarenal crystal deposition. Acute renal failure in this setting may
be preventable if it is anticipated by appropriate drug dosing, volume expansion with high
urinary flow, and alkalinization of the urine when appropriate. Renal failure may be reversible
if the drug is discontinued, and by volume repletion and alkalinization of the urine when
appropriate123.
Introduction
68/206
The majority of kidney stones found inside of the kidneys do not cause pain or symptoms.
However, once the stones “fall out of the kidney” and enter the ureter, severe pain and blood
in the urine may develop. The risk of a kidney stone “falling” out of a kidney and entering the
ureter is about 50 percent over a five year period. The pain from a stone in the ureter (now a
ureteral stone) occurs from the stone blocking the drainage of urine from the kidney to the
bladder. This pain can be incredibly severe and is often associated with nausea and
vomiting.
A variety of imaging techniques can be used to diagnosis kidney stones, but a non-contrast
CT scan is the single best test available today. It is generally believed that it takes at least
three months for a patient to form a kidney stone.
Once a kidney stone falls into the ureter and becomes a ureteral stone there are a variety of
treatment options available. First, hopefully the patient can pass the stone on his/her own.
There are some alpha-blocker medications available that have been shown to increase a
patient’s chances of passing a ureteral stone. The two most common surgical procedures
that may be needed to break up a stone that fails to pass are shockwave lithotripsy and
ureteroscopy with laser lithotripsy. Shockwave lithotripsy (ESWL) is the administration of
focused energy waves through the body onto the stone in order to break it up. Ureteroscopy
with laser lithotripsy involves an urologist inserting a scope up the urinary system to the level
of the stone and then using a laser to break it. Both surgeries are most commonly performed
in an outpatient setting with quick recovery times. These surgeries, as well as other types of
procedures, can also be used to treat kidney stones that are still in the organ, before they
have a chance to fall into the ureter and cause greater problems.
Frequently with surgery to treat kidney/ureteral stones, a ureteral stent may be placed. This
is a soft plastic tube that runs from the kidney, down the ureter and into the bladder. The
purpose of the stent is to keep the flow of urine draining from the kidney to the bladder.
Introduction
69/206
Ureteral stents are only temporary and need to be removed or exchanged after a certain
amount of time.
Urinary pH and Bladder cancer
Acidic urine pH has been suggested to play an important role in human bladder
carcinogenesis by influencing the urine concentration of active aromatic amines124. Liver-
synthesized N-Glucuronides of aromatic amines like 4-aminobiphenyl, N-hydroxy-4-
aminobiphenyl and N-acetylbenzidine are excreted into the urinary bladder, where they are
relatively stable under neutral pH conditions125,126. However, in the presence of acidic
conditions they are rapidly hydrolyzed leading to the formation of their corresponding
arylamines, which can then undergo further metabolism to form DNA adducts127,128.
There is also in vitro evidence that urine pH has a similar effect on aromatic amines derived
from cigarette smoke such as 4-aminobiphenyl (4-ABP) and its metabolite N-hydroxy-4-
aminobyphenyl (N-OH-4-ABP)126. For example, the half-life of 4-ABP N-glucuronide
conjugates, before being hydrolyzed, is 11 minutes at pH 5.5 and 37 ºC compared to over 3
hours at pH 7.4129. Further, a toxicokinetic study showed that urine pH was a strong
contributor to interindividual variation in DNA binding of ABP in the human bladder130.
Urine pH may modify the impact of tobacco use on risk of bladder cancer in a way that is
consistent with experimental data showing that acidic urine can result in cleavage of acid-
labile glucuronides of carcinogenic aromatic amines124.
A dose-response relationship in bladder cancer risk with increasing urinary acidity was
observed, with no association among nonsmokers, a weak association among former
smokers, a strong association among current smokers, and with evidence of interaction
between having consistently acidic urinary pH and heavy smoking131. Since urinary pH
was measured by cases after bladder cancer was diagnosed and treated, there is a
concern that urinary pH may have been directly or indirectly influenced by the disease
Introduction
70/206
itself132 or its treatment, resulting in a possible spurious association.
In addition, the activity of some of the drugs used for bladder cancer treatment is pH
dependant; hence, characterizing day-to-day urine pH variability might help to predict
therapeutic response and toxicity in some patients133.

71/206
2. Hypothesis

72/206
Hypothesis
73/206
2. Hypothesis
The use of some medications can be associated with the presence or the absence of
constantly acidic urine pH in humans. Some medications could influence directly the acid-
base status in humans. Also, it could be possible that some medical conditions for which
some medications are prescribed can influence the acid-base status.

74/206

75/206
3. Objective

76/206
OBJECTIVE
77/206
3. Objective To examine the association between subjects’ medication use after hospital discharge and
having constantly acidic urine pH

78/206

79/206
4. Material and methods

80/206
Material and methods
81/206
4. Materials and methods
Study design and data collection
Data collection for this research has been taken from a case-control study on bladder
cancer. To increase internal and external validity, we have limited subject inclusion and
statistical analyses for this report to the control subjects of the case-control study. In this
study, 1219 incident transitional cell carcinoma (TCC) cases (84% of 1453 contacted cases)
and 1271 hospital controls (88% of 1442 controls) were recruited between June 1998 and
June 2001 in 18 hospitals in the following regions in Spain: Barcelona, Vallès/Bages,
Asturias, Alicante, and Tenerife. Subjects were 21 to 80 years old at the time of diagnosis
and resided in the catchment areas of the 18 participating hospitals. Out of the 611 control
subjects with available valid pH measurements, 598 (97.87%) subjects reported information
on vitamins and medications use, and after excluding two subjects with low quality of the
interview, and 175 subjects with missing information in the potential cofounders (vegetable
intake (n=18), fruit intake (n=15), meat intake (n=89), height (n=85), and weight (n=70), (one
subject can have missing information in more than one variable)) we ended with 423
subjects, which is the base population used for this report. The study was approved by the
National Cancer Institute Institutional Review Board, as well as by the ethics committees of
all participating hospitals.
Data collection
All subjects were interviewed in the hospital using a computer-assisted personal
interview. Before the interview, written informed consent to participate in the study was
obtained from each subject. The questionnaire was designed to elicit detailed information on
smoking habits, dietary factors, fluid intake, medical conditions (infections bladder/kidney
stones, enlarged Prostate, circulatory diseases, heart problems, asthma, ulcers, diabetes,
Material and methods
82/206
osteoporosis, leukemia, cancer, benign tumors and others), occupational and residential
histories, and family history of cancer.
DESCRIPTION OF THE POPULATION
The distribution of selected socio-demographic variables, age, height, weight, current
BMI and daily urinary frequency in the study population and cigarette smoking is shown in
Table 8. There were more men (90.3%) than women (9.7%), most of control group subjects
were included in primary or less than primary education level (82.5%) and they were more
likely to be living with a spouse (82.5%).
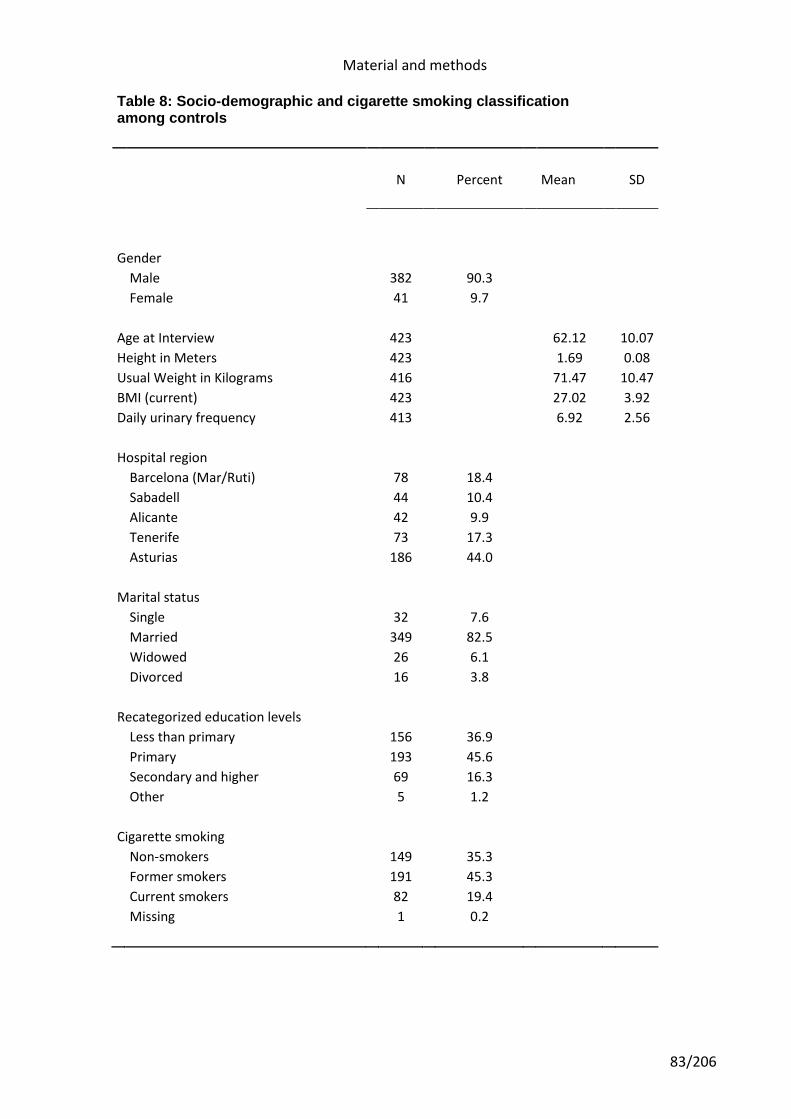
Material and methods
83/206
Table 8: Socio-demographic and cigarette smoking classification among controls
N Percent Mean SD
Gender
Male 382 90.3
Female 41 9.7
Age at Interview 423 62.12 10.07
Height in Meters 423 1.69 0.08
Usual Weight in Kilograms 416 71.47 10.47
BMI (current) 423 27.02 3.92
Daily urinary frequency 413 6.92 2.56
Hospital region
Barcelona (Mar/Ruti) 78 18.4
Sabadell 44 10.4
Alicante 42 9.9
Tenerife 73 17.3
Asturias 186 44.0
Marital status
Single 32 7.6
Married 349 82.5
Widowed 26 6.1
Divorced 16 3.8
Recategorized education levels
Less than primary 156 36.9
Primary 193 45.6
Secondary and higher 69 16.3
Other 5 1.2
Cigarette smoking
Non-smokers 149 35.3
Former smokers 191 45.3
Current smokers 82 19.4
Missing 1 0.2
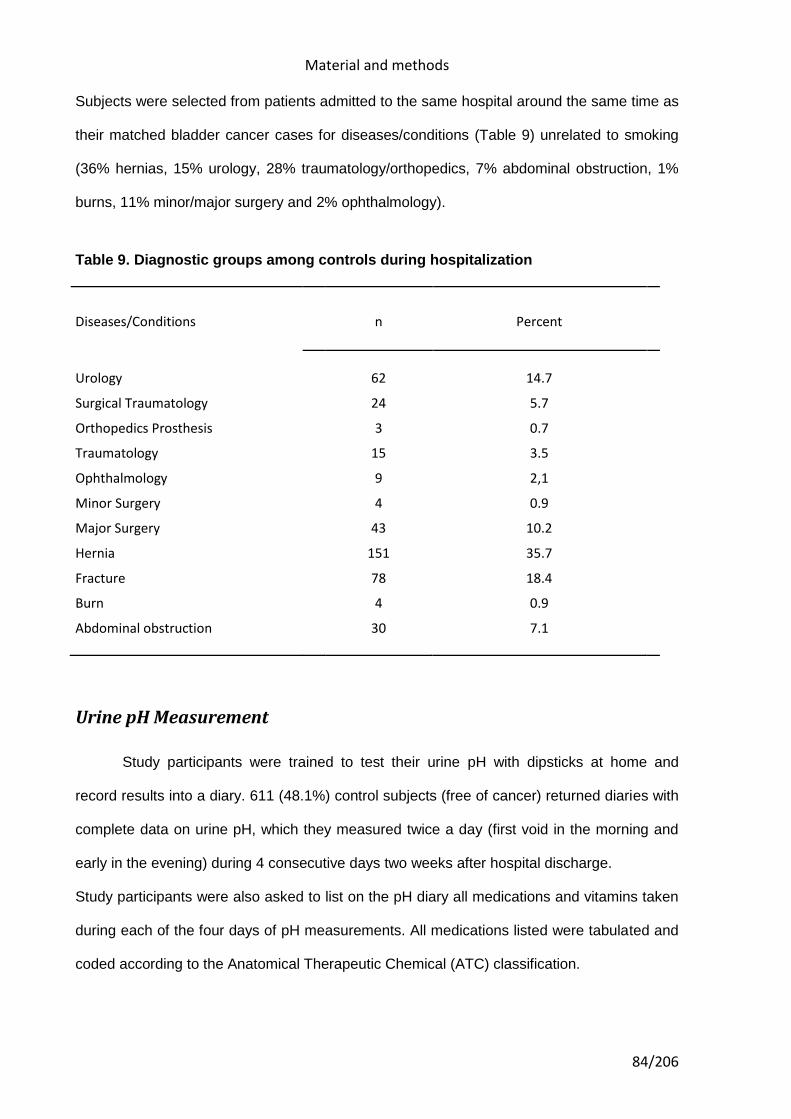
Material and methods
84/206
Subjects were selected from patients admitted to the same hospital around the same time as
their matched bladder cancer cases for diseases/conditions (Table 9) unrelated to smoking
(36% hernias, 15% urology, 28% traumatology/orthopedics, 7% abdominal obstruction, 1%
burns, 11% minor/major surgery and 2% ophthalmology).
Table 9. Diagnostic groups among controls during hospitalization
Diseases/Conditions n Percent
Urology 62 14.7
Surgical Traumatology 24 5.7
Orthopedics Prosthesis 3 0.7
Traumatology 15 3.5
Ophthalmology 9 2,1
Minor Surgery 4 0.9
Major Surgery 43 10.2
Hernia 151 35.7
Fracture 78 18.4
Burn 4 0.9
Abdominal obstruction 30 7.1
Urine pH Measurement
Study participants were trained to test their urine pH with dipsticks at home and
record results into a diary. 611 (48.1%) control subjects (free of cancer) returned diaries with
complete data on urine pH, which they measured twice a day (first void in the morning and
early in the evening) during 4 consecutive days two weeks after hospital discharge.
Study participants were also asked to list on the pH diary all medications and vitamins taken
during each of the four days of pH measurements. All medications listed were tabulated and
coded according to the Anatomical Therapeutic Chemical (ATC) classification.
Material and methods
85/206
Subjects who returned a complete urine diary were similar to those who did not with regard
to grams of fruits and vegetables intake, BMI, and smoking status. Subjects with all of their
pH readings less than or equal to 6.0 were categorized as having a consistently acidic urine
pH. As urinary pH reflects several factors that can vary over time, we adopted this
conservative definition to maximize the probability that such individuals would have had a
long-term tendency to have acidic urine.
Coding of medications
Drugs can be classified in different ways according to their mode of action, their
indications, or their chemical structure.
Each classification system will have its advantages and limitations and its usefulness will
depend on the purpose, the setting used and the user’s knowledge of the methodology.
Comparisons between countries may require a classification system different from that
needed for a local comparison (e.g. between different wards in a hospital). Of the various
systems proposed over the years, only two have survived to attain a dominant position in
drug utilization research worldwide. These are the «Anatomical Therapeutic» (AT)
classification developed by the European Pharmaceutical Market Research Association
(EPhMRA) and the «Anatomical Therapeutic Chemical» (ATC) classification developed by
Norwegian researchers.
ATC CLASSIFICATION
We coded the medications reported in the urine pH diary using the Anatomical
Therapeutic Chemical (ATC) classification system, where the active substances are divided
into different groups according to the organ or system on which they act and their
therapeutic, pharmacological and chemical properties. Drugs were classified in groups at five
different levels. Drugs are classified in groups at five different levels. The drugs are divided
into fourteen main groups (1st level), with pharmacological/therapeutic subgroups (2nd level).
The 3rd and 4th levels are chemical/pharmacological/therapeutic subgroups and the 5th level
Material and methods
86/206
is the chemical substance (active ingredient). The 2nd, 3rd and 4th levels are often used to
identify pharmacological subgroups when that is considered more appropriate than
therapeutic or chemical subgroups.
The main purpose of the ATC classification is as a tool for presenting drug utilization
statistics and it is recommended by WHO (Collaborating Centre for International Drug
Monitoring in Uppsala, Sweden) for use in international comparisons. The ATC classification
is also the basis for the classification of adverse drug reactions used by the WHO.
Nomenclature from International nonproprietary names (INN) is preferred. If INN names are
not assigned, USAN (United States Adopted Name) or BAN (British Approved Name) names
are usually chosen and WHO’s list of drug terms (Pharmacological action and therapeutic
use of drugs - List of Terms) is used when naming the different ATC levels.
Medicinal products are classified according to the main therapeutic use of their main active
ingredient, on the basic principle of assigning only one ATC code for each pharmaceutical
formulation (i.e. similar ingredients, strength and pharmaceutical form).
A medicinal product can be given more than one ATC code if it is available in two or more
strengths or formulations with clearly different therapeutic uses, and different pharmaceutical
forms for topical and systemic use are also given separate ATC codes.
The ATC system is not strictly a therapeutic classification system. At all ATC levels, ATC
codes can be assigned according to the pharmacological properties of the product.
Subdivision on the basis of mechanism of action will understandably be rather broad, since a
very detailed classification of this kind would result in having only one substance per
subgroup, which is better avoided (e.g. in the case of antidepressants). Some ATC groups
are subdivided into both chemical and pharmacological groups (e.g. ATC group J05A -
Agents affecting the virus directly). If a new substance fits in both a chemical and
pharmacological fourth level, the pharmacological group is normally chosen.
Material and methods
87/206
Substances classified as having the same ATC fourth level should not be considered as
pharmacotherapeutically equivalent since the profiles for their mode of action, therapeutic
effects, drug interactions and adverse drug reactions may differ.
As the drugs available and their uses are continuously changing and expanding, regular
revisions of the ATC system are necessary. An important principle is to keep the number of
alterations to a minimum. Before alterations are made, any potential difficulties arising for the
users of the ATC system are considered and related to the benefits that would be achieved
by the alteration.
Changes to the ATC classification would be made when the main use of a drug had clearly
changed, and when new groups are required to accommodate new substances or to improve
the specificity of the groupings.
Because the ATC system separates drugs into groups at five levels (described above),
statistics on drug utilization grouped at the five different levels can be provided. The
information available ranges from figures showing total use of all drug products classified e.g.
in main group C - Cardiovascular system (first level), to figures for the different subgroups
(i.e. second, third and fourth level) to figures for the use of the separate substances.
More detailed information can be obtained at the lower (i.e. the fourth and fifth) levels. The
higher levels are used if comparison of drug groups is the aim of a study (see Fig. 5). This
gives a better overview and trends in drug use related to different therapeutic areas can
easily be identified.
It has to be taken into account that all international standards demand compromises and a
drug classification system is no exception to this rule. Drugs may be used for two or more
equally important indications, and the main therapeutic use of a drug may differ from one
country to another. This will often result in several possible alternatives for classification, and
a decision has to be made regarding the main use.
Material and methods
88/206
Statistical Analysis
To estimate the effects of medication on urinary pH, we calculated odds ratios (OR)
and 95% confidence intervals (95% CI) using unconditional logistic regression, with two
strategies: a) Fixed terms entered for all potential confounding variables (i.e., age at
interview, sex, study region, vegetable intake, fruit intake, meat intake, height, weight, and
vitamin C use) plus the medication of interest, building one model for each medication at the
segregation levels of 1, 3, 4, 5, and 7 digits of the ATC classification; and b) fixed terms
strategy (for all potential confounding factors) combined with step wise strategy entering all
medications from a given segregation level of the ATC Classification with a p value for
entering variables=0.15, and a p value for excluding variables from the model=0.2.

89/206
5. Results

90/206
Results
91/206
5. RESULTS
Relationship between pH and confounding variables
The association between urinary pH and confounding factors that could potentially
influence urine pH, including diet composition (daily meat intake, vegetable intake, fruit
intake, and/or combined vegetable/fruit intake), gender, age, body surface area, cigarette
smoking status, alcohol consumption, urinary frequency, NSAIDs consumption, study region,
finished studies, marital status or season for pH measurement are shown on Table 10. Sex,
cigarette smoking status, alcohol consumption, urinary frequency, NSAIDs consumption,
usual BMI, grams of meat intake, and grams of vegetables intake were not significantly
associated to influence on having or not having consistently acidic urine pH. Age, study
region, finished studies, season for pH measurement, grams of fruits and grams of
vegetables/fruit intake were significantly associated to influence on having or not having a
constant acidification of urine among controls (Table 10).
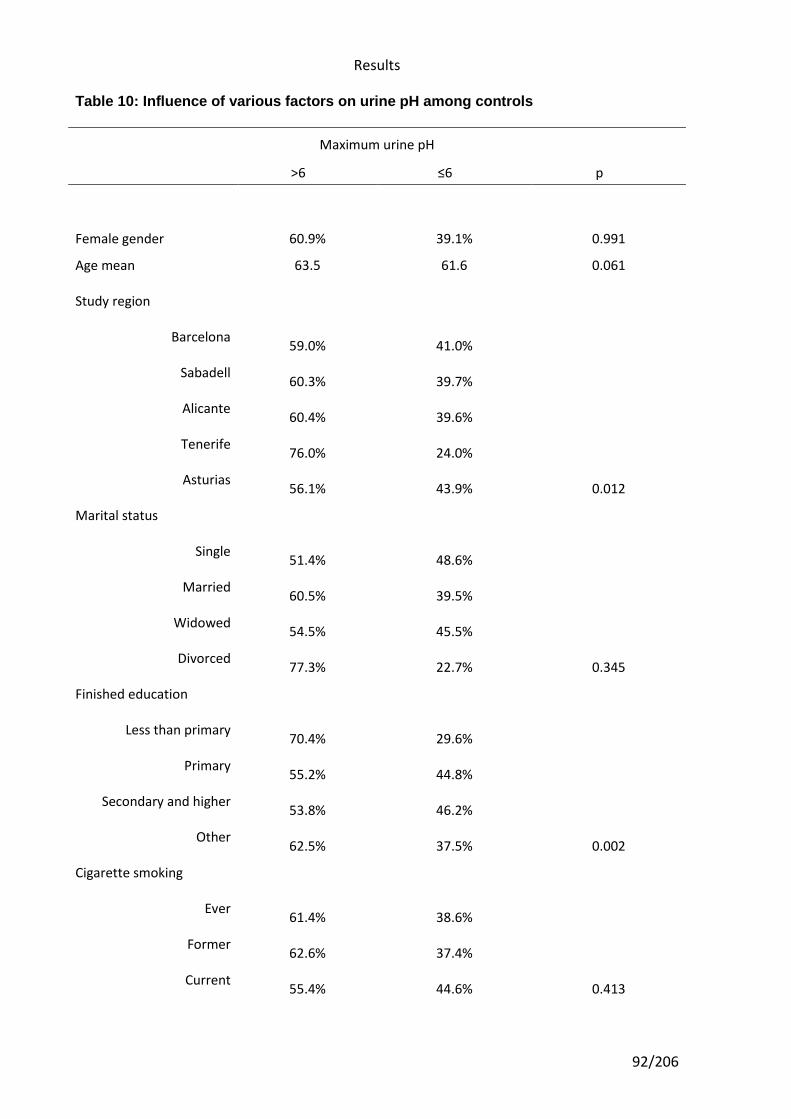
Results
92/206
Table 10: Influence of various factors on urine pH among controls
Maximum urine pH
>6 ≤6 p
Female gender 60.9% 39.1% 0.991
Age mean 63.5 61.6 0.061
Study region
Barcelona
Sabadell
Alicante
Tenerife
Asturias
59.0% 41.0%
60.3% 39.7%
60.4% 39.6%
76.0% 24.0%
56.1% 43.9% 0.012
Marital status
Single
Married
Widowed
Divorced
51.4% 48.6%
60.5% 39.5%
54.5% 45.5%
77.3% 22.7% 0.345
Finished education
Less than primary
Primary
Secondary and higher
Other
70.4% 29.6%
55.2% 44.8%
53.8% 46.2%
62.5% 37.5% 0.002
Cigarette smoking
Ever
Former
Current
61.4% 38.6%
62.6% 37.4%
55.4% 44.6% 0.413
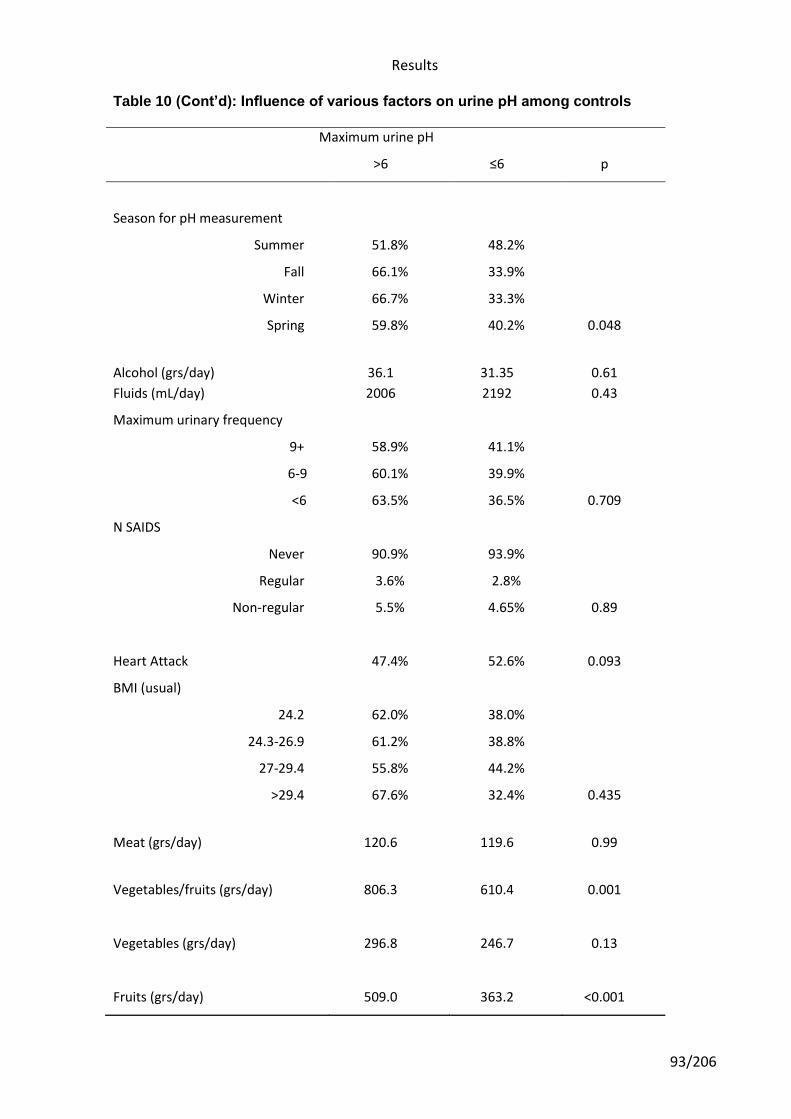
Results
93/206
Table 10 (Cont’d): Influence of various factors on urine pH among controls
Maximum urine pH
>6 ≤6 p
Season for pH measurement
Summer 51.8% 48.2%
Fall 66.1% 33.9%
Winter 66.7% 33.3%
Spring 59.8% 40.2% 0.048
Alcohol (grs/day)
36.1
31.35
0.61
Fluids (mL/day) 2006 2192 0.43
Maximum urinary frequency
9+
6-9
<6
58.9% 41.1%
60.1% 39.9%
63.5% 36.5% 0.709
N SAIDS
Never 90.9% 93.9%
Regular 3.6% 2.8%
Non-regular 5.5% 4.65% 0.89
Heart Attack
47.4%
52.6%
0.093
BMI (usual)
24.2 62.0% 38.0%
24.3-26.9 61.2% 38.8%
27-29.4 55.8% 44.2%
>29.4 67.6% 32.4% 0.435
Meat (grs/day)
120.6
119.6
0.99
Vegetables/fruits (grs/day)
806.3
610.4
0.001
Vegetables (grs/day)
296.8
246.7
0.13
Fruits (grs/day)
509.0
363.2
<0.001
Results
94/206
Association between medications and urine pH. Magnitude of the association estimated by logistic regression. Fixed terms models
In our study population, 163 subjects (38.5%) had acidic urine and 260 (61.5%) had
not acid urine pH values. The association (using logistic regression models) between
medication use after hospital discharge and having constantly acidic urine pH values are
shown in the Tables below (Tables 11 to 27).
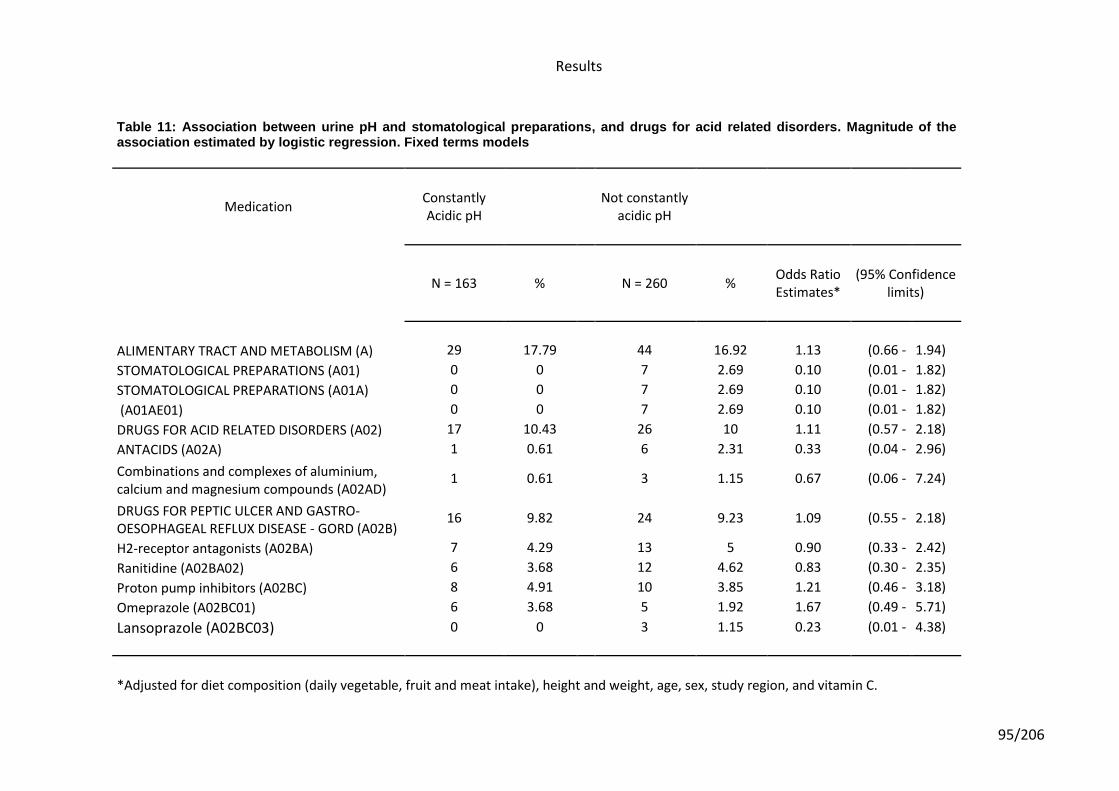
Results
95/206
Table 11: Association between urine pH and stomatological preparations, and drugs for acid related disorders. Magnitude of the
association estimated by logistic regression. Fixed terms models
Medication Constantly Acidic pH
Not constantly
acidic pH
N = 163 % N = 260 %
Odds Ratio Estimates*
(95% Confidence limits)
ALIMENTARY TRACT AND METABOLISM (A) 29 17.79 44 16.92 1.13 (0.66 - 1.94)
STOMATOLOGICAL PREPARATIONS (A01) 0 0 7 2.69 0.10 (0.01 - 1.82)
STOMATOLOGICAL PREPARATIONS (A01A) 0 0 7 2.69 0.10 (0.01 - 1.82)
(A01AE01) 0 0 7 2.69 0.10 (0.01 - 1.82)
DRUGS FOR ACID RELATED DISORDERS (A02) 17 10.43 26 10 1.11 (0.57 - 2.18)
ANTACIDS (A02A) 1 0.61 6 2.31 0.33 (0.04 - 2.96)
Combinations and complexes of aluminium, calcium and magnesium compounds (A02AD)
1 0.61 3 1.15 0.67 (0.06 - 7.24)
DRUGS FOR PEPTIC ULCER AND GASTRO-OESOPHAGEAL REFLUX DISEASE - GORD (A02B)
16 9.82 24 9.23 1.09 (0.55 - 2.18)
H2-receptor antagonists (A02BA) 7 4.29 13 5 0.90 (0.33 - 2.42)
Ranitidine (A02BA02) 6 3.68 12 4.62 0.83 (0.30 - 2.35)
Proton pump inhibitors (A02BC) 8 4.91 10 3.85 1.21 (0.46 - 3.18)
Omeprazole (A02BC01) 6 3.68 5 1.92 1.67 (0.49 - 5.71)
Lansoprazole (A02BC03) 0 0 3 1.15 0.23 (0.01 - 4.38)
*Adjusted for diet composition (daily vegetable, fruit and meat intake), height and weight, age, sex, study region, and vitamin C.
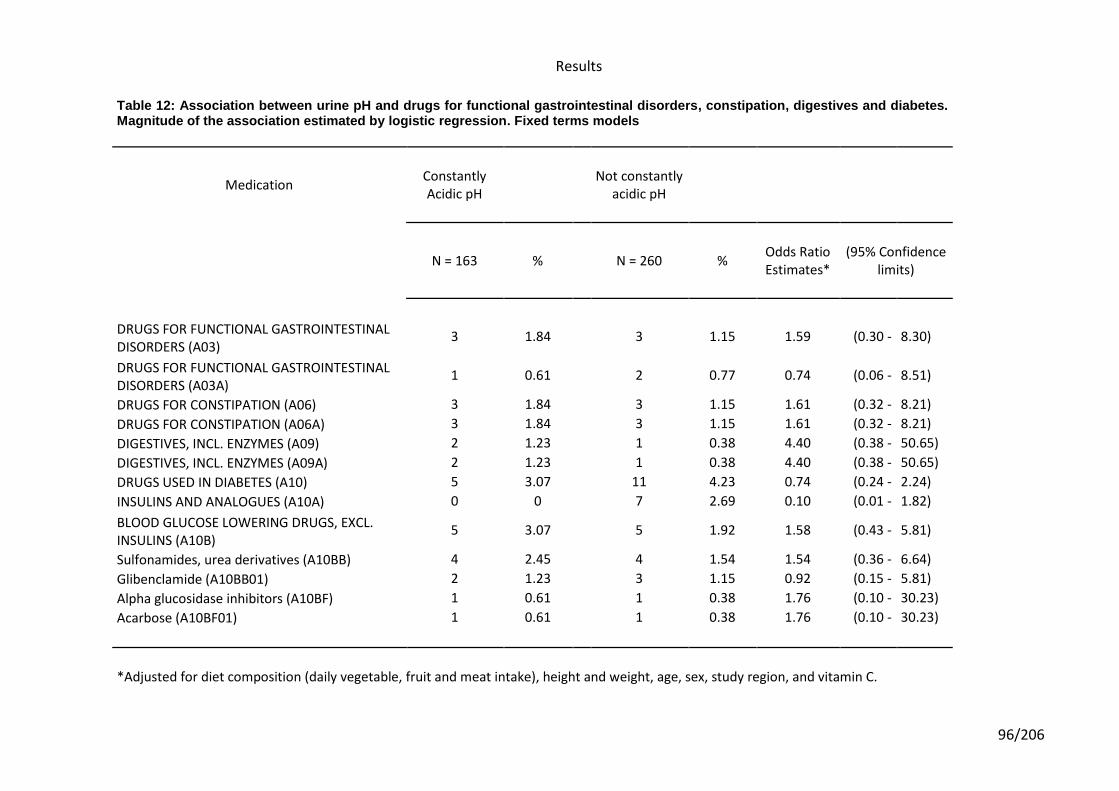
Results
96/206
Table 12: Association between urine pH and drugs for functional gastrointestinal disorders, constipation, digestives and diabetes. Magnitude of the association estimated by logistic regression. Fixed terms models
Medication Constantly Acidic pH
Not constantly
acidic pH
N = 163 % N = 260 %
Odds Ratio Estimates*
(95% Confidence limits)
DRUGS FOR FUNCTIONAL GASTROINTESTINAL DISORDERS (A03)
3 1.84 3 1.15 1.59 (0.30 - 8.30)
DRUGS FOR FUNCTIONAL GASTROINTESTINAL DISORDERS (A03A)
1 0.61 2 0.77 0.74 (0.06 - 8.51)
DRUGS FOR CONSTIPATION (A06) 3 1.84 3 1.15 1.61 (0.32 - 8.21)
DRUGS FOR CONSTIPATION (A06A) 3 1.84 3 1.15 1.61 (0.32 - 8.21)
DIGESTIVES, INCL. ENZYMES (A09) 2 1.23 1 0.38 4.40 (0.38 - 50.65)
DIGESTIVES, INCL. ENZYMES (A09A) 2 1.23 1 0.38 4.40 (0.38 - 50.65)
DRUGS USED IN DIABETES (A10) 5 3.07 11 4.23 0.74 (0.24 - 2.24)
INSULINS AND ANALOGUES (A10A) 0 0 7 2.69 0.10 (0.01 - 1.82)
BLOOD GLUCOSE LOWERING DRUGS, EXCL. INSULINS (A10B)
5 3.07 5 1.92 1.58 (0.43 - 5.81)
Sulfonamides, urea derivatives (A10BB) 4 2.45 4 1.54 1.54 (0.36 - 6.64)
Glibenclamide (A10BB01) 2 1.23 3 1.15 0.92 (0.15 - 5.81)
Alpha glucosidase inhibitors (A10BF) 1 0.61 1 0.38 1.76 (0.10 - 30.23)
Acarbose (A10BF01) 1 0.61 1 0.38 1.76 (0.10 - 30.23)
*Adjusted for diet composition (daily vegetable, fruit and meat intake), height and weight, age, sex, study region, and vitamin C.
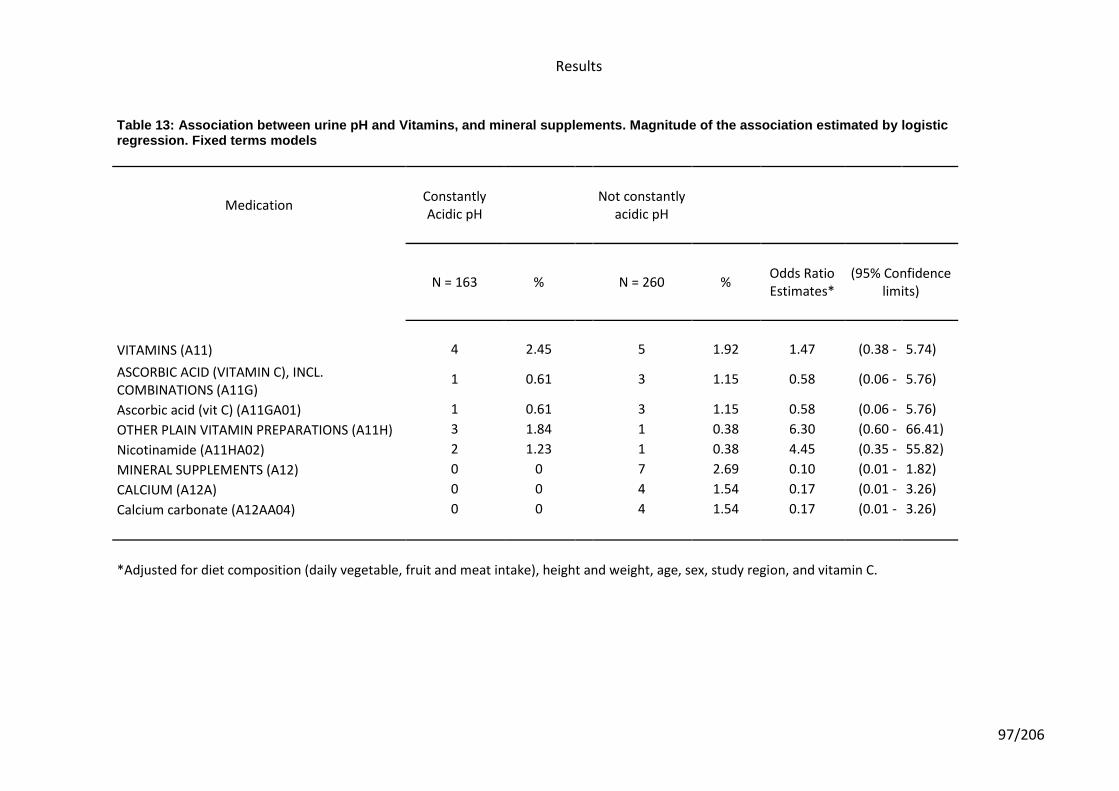
Results
97/206
Table 13: Association between urine pH and Vitamins, and mineral supplements. Magnitude of the association estimated by logistic regression. Fixed terms models
Medication Constantly Acidic pH
Not constantly
acidic pH
N = 163 % N = 260 %
Odds Ratio Estimates*
(95% Confidence limits)
VITAMINS (A11) 4 2.45 5 1.92 1.47 (0.38 - 5.74)
ASCORBIC ACID (VITAMIN C), INCL. COMBINATIONS (A11G)
1 0.61 3 1.15 0.58 (0.06 - 5.76)
Ascorbic acid (vit C) (A11GA01) 1 0.61 3 1.15 0.58 (0.06 - 5.76)
OTHER PLAIN VITAMIN PREPARATIONS (A11H) 3 1.84 1 0.38 6.30 (0.60 - 66.41)
Nicotinamide (A11HA02) 2 1.23 1 0.38 4.45 (0.35 - 55.82)
MINERAL SUPPLEMENTS (A12) 0 0 7 2.69 0.10 (0.01 - 1.82)
CALCIUM (A12A) 0 0 4 1.54 0.17 (0.01 - 3.26)
Calcium carbonate (A12AA04) 0 0 4 1.54 0.17 (0.01 - 3.26)
*Adjusted for diet composition (daily vegetable, fruit and meat intake), height and weight, age, sex, study region, and vitamin C.
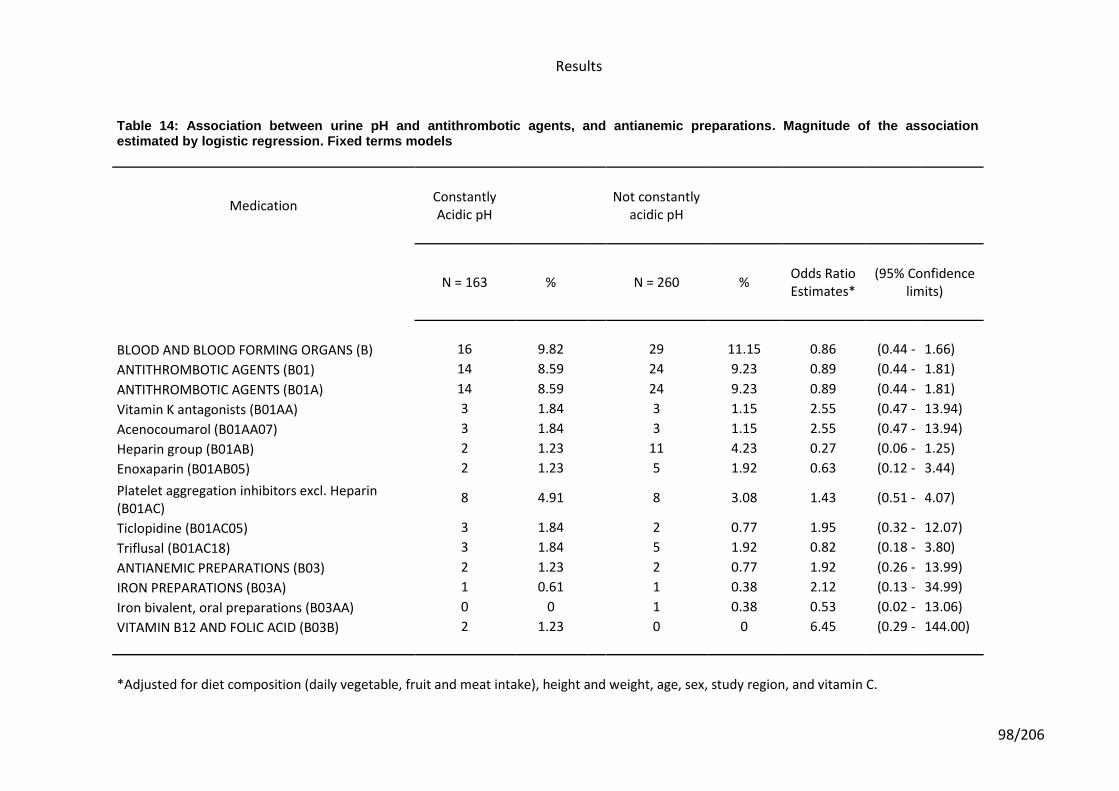
Results
98/206
Table 14: Association between urine pH and antithrombotic agents, and antianemic preparations. Magnitude of the association estimated by logistic regression. Fixed terms models
Medication Constantly Acidic pH
Not constantly
acidic pH
N = 163 % N = 260 %
Odds Ratio Estimates*
(95% Confidence limits)
BLOOD AND BLOOD FORMING ORGANS (B) 16 9.82 29 11.15 0.86 (0.44 - 1.66)
ANTITHROMBOTIC AGENTS (B01) 14 8.59 24 9.23 0.89 (0.44 - 1.81)
ANTITHROMBOTIC AGENTS (B01A) 14 8.59 24 9.23 0.89 (0.44 - 1.81)
Vitamin K antagonists (B01AA) 3 1.84 3 1.15 2.55 (0.47 - 13.94)
Acenocoumarol (B01AA07) 3 1.84 3 1.15 2.55 (0.47 - 13.94)
Heparin group (B01AB) 2 1.23 11 4.23 0.27 (0.06 - 1.25)
Enoxaparin (B01AB05) 2 1.23 5 1.92 0.63 (0.12 - 3.44)
Platelet aggregation inhibitors excl. Heparin (B01AC)
8 4.91 8 3.08 1.43 (0.51 - 4.07)
Ticlopidine (B01AC05) 3 1.84 2 0.77 1.95 (0.32 - 12.07)
Triflusal (B01AC18) 3 1.84 5 1.92 0.82 (0.18 - 3.80)
ANTIANEMIC PREPARATIONS (B03) 2 1.23 2 0.77 1.92 (0.26 - 13.99)
IRON PREPARATIONS (B03A) 1 0.61 1 0.38 2.12 (0.13 - 34.99)
Iron bivalent, oral preparations (B03AA) 0 0 1 0.38 0.53 (0.02 - 13.06)
VITAMIN B12 AND FOLIC ACID (B03B) 2 1.23 0 0 6.45 (0.29 - 144.00)
*Adjusted for diet composition (daily vegetable, fruit and meat intake), height and weight, age, sex, study region, and vitamin C.
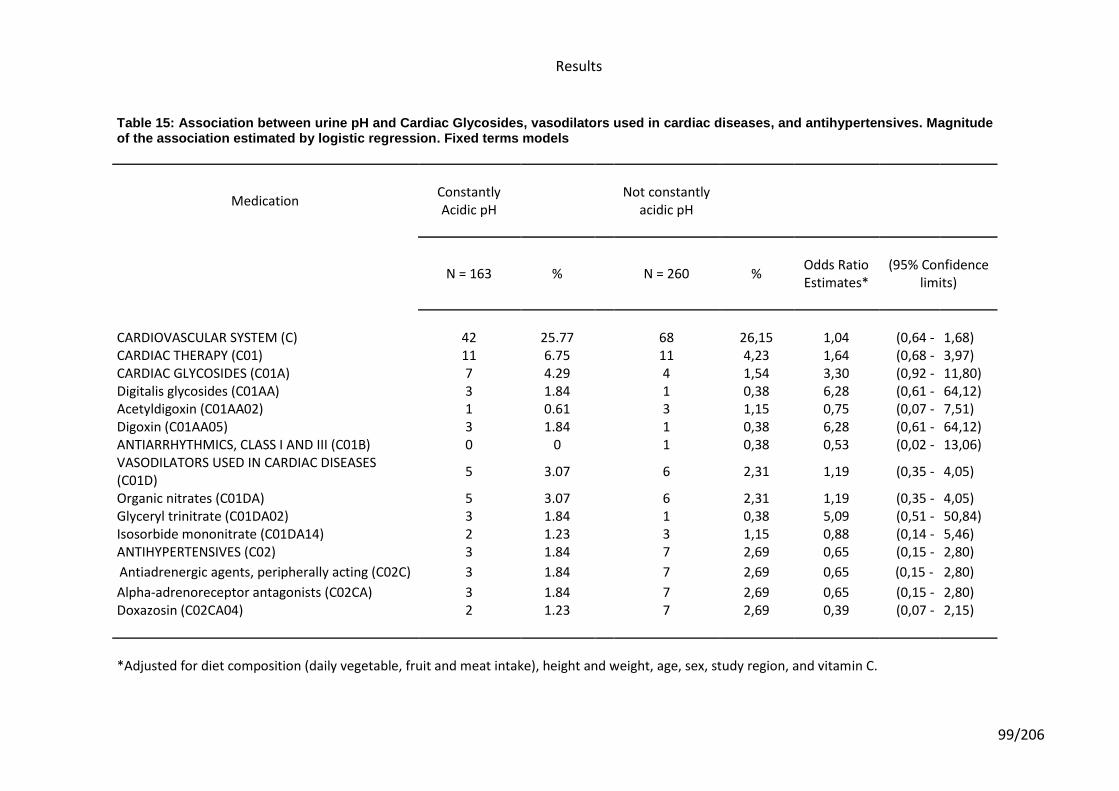
Results
99/206
Table 15: Association between urine pH and Cardiac Glycosides, vasodilators used in cardiac diseases, and antihypertensives. Magnitude of the association estimated by logistic regression. Fixed terms models
Medication Constantly Acidic pH
Not constantly
acidic pH
N = 163 % N = 260 %
Odds Ratio Estimates*
(95% Confidence limits)
CARDIOVASCULAR SYSTEM (C) 42 25.77 68 26,15 1,04 (0,64 - 1,68) CARDIAC THERAPY (C01) 11 6.75 11 4,23 1,64 (0,68 - 3,97) CARDIAC GLYCOSIDES (C01A) 7 4.29 4 1,54 3,30 (0,92 - 11,80) Digitalis glycosides (C01AA) 3 1.84 1 0,38 6,28 (0,61 - 64,12) Acetyldigoxin (C01AA02) 1 0.61 3 1,15 0,75 (0,07 - 7,51) Digoxin (C01AA05) 3 1.84 1 0,38 6,28 (0,61 - 64,12) ANTIARRHYTHMICS, CLASS I AND III (C01B) 0 0 1 0,38 0,53 (0,02 - 13,06) VASODILATORS USED IN CARDIAC DISEASES (C01D)
5 3.07 6 2,31 1,19 (0,35 - 4,05)
Organic nitrates (C01DA) 5 3.07 6 2,31 1,19 (0,35 - 4,05) Glyceryl trinitrate (C01DA02) 3 1.84 1 0,38 5,09 (0,51 - 50,84) Isosorbide mononitrate (C01DA14) 2 1.23 3 1,15 0,88 (0,14 - 5,46) ANTIHYPERTENSIVES (C02) 3 1.84 7 2,69 0,65 (0,15 - 2,80)
Antiadrenergic agents, peripherally acting (C02C) 3 1.84 7 2,69 0,65 (0,15 - 2,80)
Alpha-adrenoreceptor antagonists (C02CA) 3 1.84 7 2,69 0,65 (0,15 - 2,80) Doxazosin (C02CA04) 2 1.23 7 2,69 0,39 (0,07 - 2,15)
*Adjusted for diet composition (daily vegetable, fruit and meat intake), height and weight, age, sex, study region, and vitamin C.
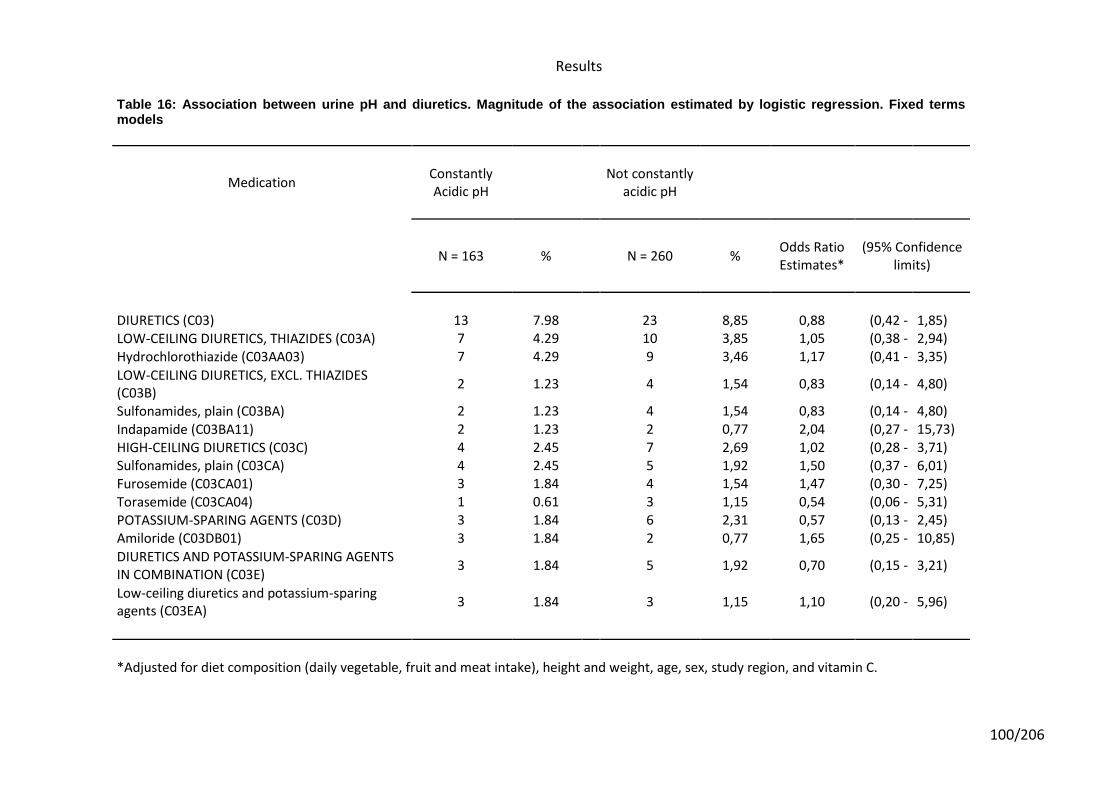
Results
100/206
Table 16: Association between urine pH and diuretics. Magnitude of the association estimated by logistic regression. Fixed terms models
Medication Constantly Acidic pH
Not constantly
acidic pH
N = 163 % N = 260 %
Odds Ratio Estimates*
(95% Confidence limits)
DIURETICS (C03) 13 7.98 23 8,85 0,88 (0,42 - 1,85) LOW-CEILING DIURETICS, THIAZIDES (C03A) 7 4.29 10 3,85 1,05 (0,38 - 2,94)
Hydrochlorothiazide (C03AA03) 7 4.29 9 3,46 1,17 (0,41 - 3,35)
LOW-CEILING DIURETICS, EXCL. THIAZIDES (C03B)
2 1.23 4 1,54 0,83 (0,14 - 4,80)
Sulfonamides, plain (C03BA) 2 1.23 4 1,54 0,83 (0,14 - 4,80)
Indapamide (C03BA11) 2 1.23 2 0,77 2,04 (0,27 - 15,73) HIGH-CEILING DIURETICS (C03C) 4 2.45 7 2,69 1,02 (0,28 - 3,71) Sulfonamides, plain (C03CA) 4 2.45 5 1,92 1,50 (0,37 - 6,01) Furosemide (C03CA01) 3 1.84 4 1,54 1,47 (0,30 - 7,25) Torasemide (C03CA04) 1 0.61 3 1,15 0,54 (0,06 - 5,31) POTASSIUM-SPARING AGENTS (C03D) 3 1.84 6 2,31 0,57 (0,13 - 2,45) Amiloride (C03DB01) 3 1.84 2 0,77 1,65 (0,25 - 10,85)
DIURETICS AND POTASSIUM-SPARING AGENTS IN COMBINATION (C03E)
3 1.84 5 1,92 0,70 (0,15 - 3,21)
Low-ceiling diuretics and potassium-sparing agents (C03EA)
3 1.84 3 1,15 1,10 (0,20 - 5,96)
*Adjusted for diet composition (daily vegetable, fruit and meat intake), height and weight, age, sex, study region, and vitamin C.
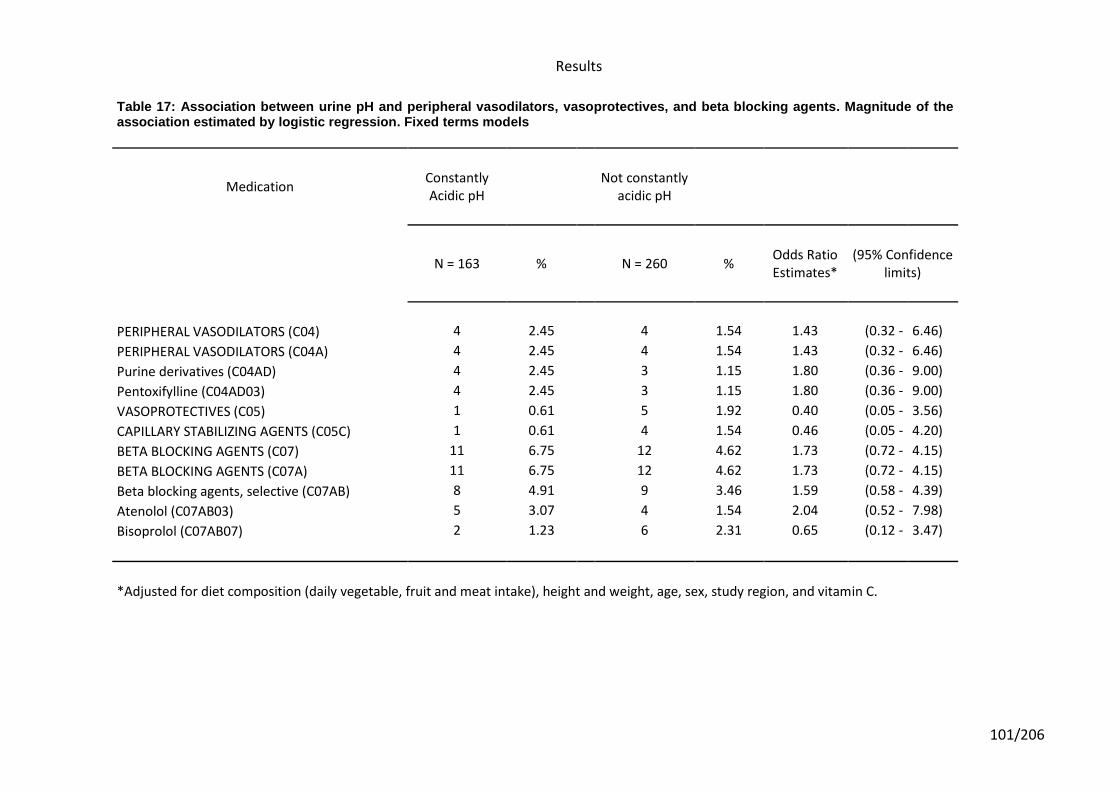
Results
101/206
Table 17: Association between urine pH and peripheral vasodilators, vasoprotectives, and beta blocking agents. Magnitude of the association estimated by logistic regression. Fixed terms models
Medication Constantly Acidic pH
Not constantly
acidic pH
N = 163 % N = 260 %
Odds Ratio Estimates*
(95% Confidence limits)
PERIPHERAL VASODILATORS (C04) 4 2.45 4 1.54 1.43 (0.32 - 6.46)
PERIPHERAL VASODILATORS (C04A) 4 2.45 4 1.54 1.43 (0.32 - 6.46)
Purine derivatives (C04AD) 4 2.45 3 1.15 1.80 (0.36 - 9.00)
Pentoxifylline (C04AD03) 4 2.45 3 1.15 1.80 (0.36 - 9.00)
VASOPROTECTIVES (C05) 1 0.61 5 1.92 0.40 (0.05 - 3.56)
CAPILLARY STABILIZING AGENTS (C05C) 1 0.61 4 1.54 0.46 (0.05 - 4.20)
BETA BLOCKING AGENTS (C07) 11 6.75 12 4.62 1.73 (0.72 - 4.15)
BETA BLOCKING AGENTS (C07A) 11 6.75 12 4.62 1.73 (0.72 - 4.15)
Beta blocking agents, selective (C07AB) 8 4.91 9 3.46 1.59 (0.58 - 4.39)
Atenolol (C07AB03) 5 3.07 4 1.54 2.04 (0.52 - 7.98)
Bisoprolol (C07AB07) 2 1.23 6 2.31 0.65 (0.12 - 3.47)
*Adjusted for diet composition (daily vegetable, fruit and meat intake), height and weight, age, sex, study region, and vitamin C.
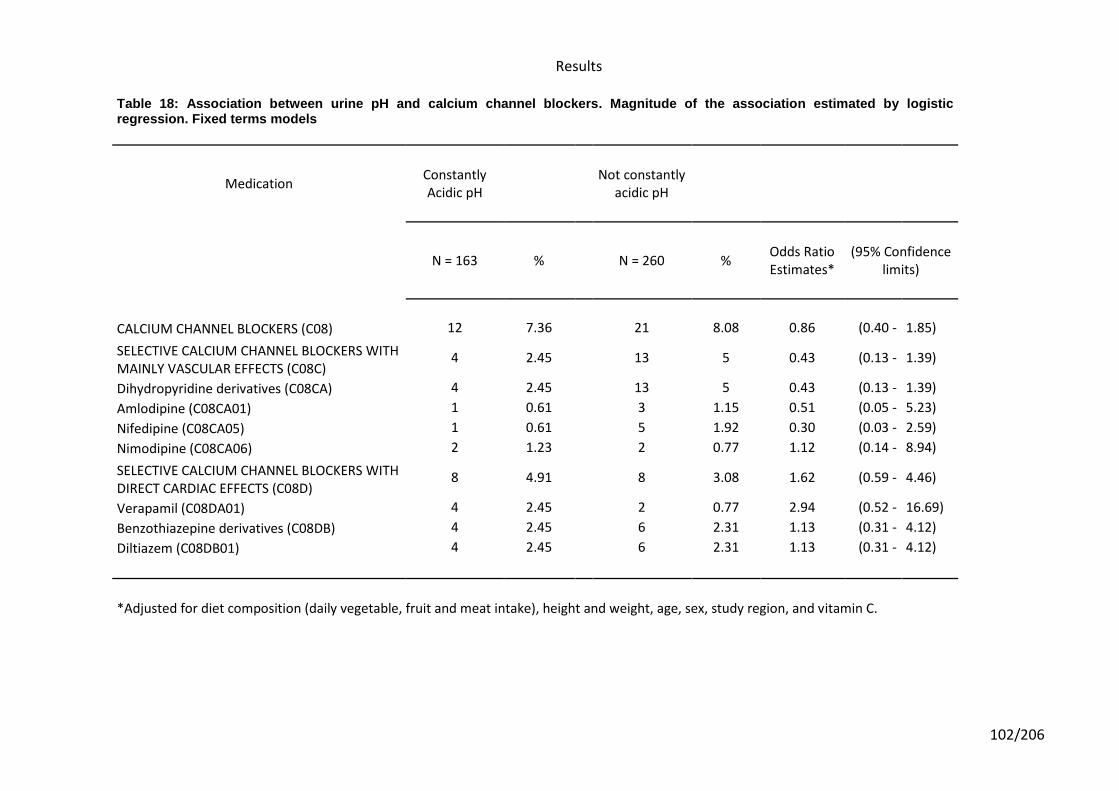
Results
102/206
Table 18: Association between urine pH and calcium channel blockers. Magnitude of the association estimated by logistic regression. Fixed terms models
Medication Constantly Acidic pH
Not constantly
acidic pH
N = 163 % N = 260 %
Odds Ratio Estimates*
(95% Confidence limits)
CALCIUM CHANNEL BLOCKERS (C08) 12 7.36 21 8.08 0.86 (0.40 - 1.85)
SELECTIVE CALCIUM CHANNEL BLOCKERS WITH MAINLY VASCULAR EFFECTS (C08C)
4 2.45 13 5 0.43 (0.13 - 1.39)
Dihydropyridine derivatives (C08CA) 4 2.45 13 5 0.43 (0.13 - 1.39)
Amlodipine (C08CA01) 1 0.61 3 1.15 0.51 (0.05 - 5.23)
Nifedipine (C08CA05) 1 0.61 5 1.92 0.30 (0.03 - 2.59)
Nimodipine (C08CA06) 2 1.23 2 0.77 1.12 (0.14 - 8.94)
SELECTIVE CALCIUM CHANNEL BLOCKERS WITH DIRECT CARDIAC EFFECTS (C08D)
8 4.91 8 3.08 1.62 (0.59 - 4.46)
Verapamil (C08DA01) 4 2.45 2 0.77 2.94 (0.52 - 16.69)
Benzothiazepine derivatives (C08DB) 4 2.45 6 2.31 1.13 (0.31 - 4.12)
Diltiazem (C08DB01) 4 2.45 6 2.31 1.13 (0.31 - 4.12)
*Adjusted for diet composition (daily vegetable, fruit and meat intake), height and weight, age, sex, study region, and vitamin C.
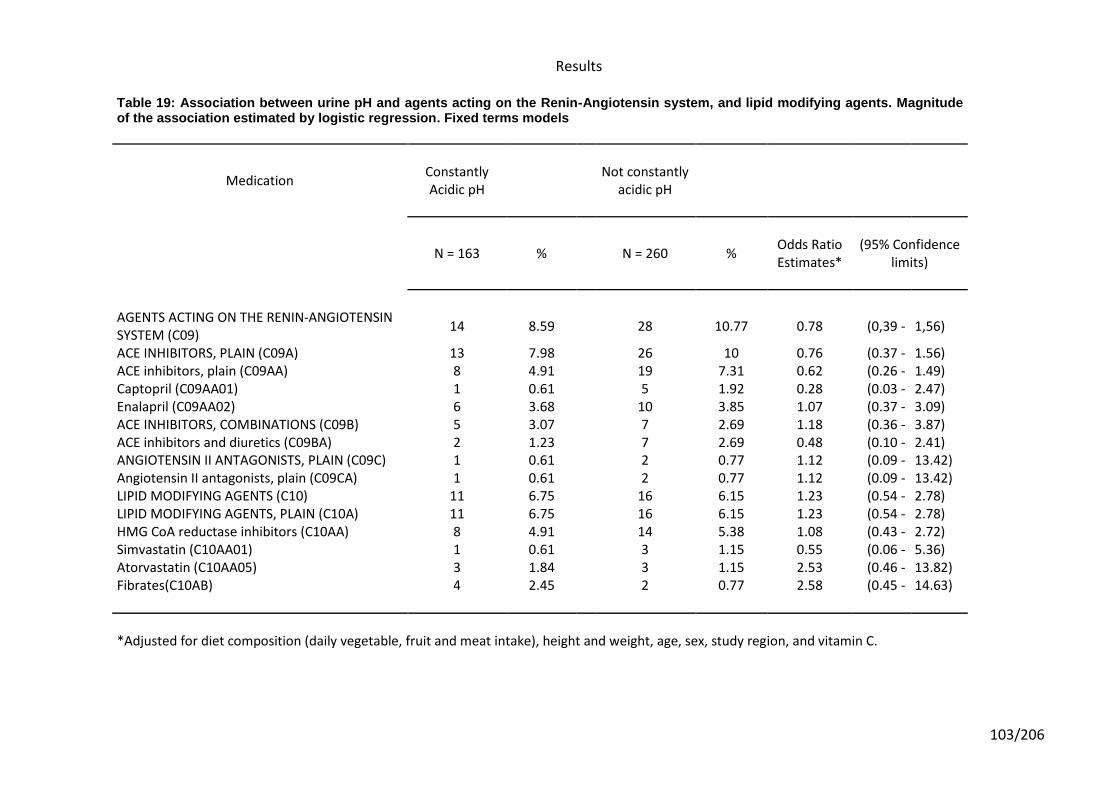
Results
103/206
Table 19: Association between urine pH and agents acting on the Renin-Angiotensin system, and lipid modifying agents. Magnitude of the association estimated by logistic regression. Fixed terms models
Medication Constantly Acidic pH
Not constantly
acidic pH
N = 163 % N = 260 %
Odds Ratio Estimates*
(95% Confidence limits)
AGENTS ACTING ON THE RENIN-ANGIOTENSIN SYSTEM (C09)
14 8.59 28 10.77 0.78 (0,39 - 1,56)
ACE INHIBITORS, PLAIN (C09A) 13 7.98 26 10 0.76 (0.37 - 1.56) ACE inhibitors, plain (C09AA) 8 4.91 19 7.31 0.62 (0.26 - 1.49) Captopril (C09AA01) 1 0.61 5 1.92 0.28 (0.03 - 2.47) Enalapril (C09AA02) 6 3.68 10 3.85 1.07 (0.37 - 3.09) ACE INHIBITORS, COMBINATIONS (C09B) 5 3.07 7 2.69 1.18 (0.36 - 3.87) ACE inhibitors and diuretics (C09BA) 2 1.23 7 2.69 0.48 (0.10 - 2.41) ANGIOTENSIN II ANTAGONISTS, PLAIN (C09C) 1 0.61 2 0.77 1.12 (0.09 - 13.42) Angiotensin II antagonists, plain (C09CA) 1 0.61 2 0.77 1.12 (0.09 - 13.42) LIPID MODIFYING AGENTS (C10) 11 6.75 16 6.15 1.23 (0.54 - 2.78) LIPID MODIFYING AGENTS, PLAIN (C10A) 11 6.75 16 6.15 1.23 (0.54 - 2.78) HMG CoA reductase inhibitors (C10AA) 8 4.91 14 5.38 1.08 (0.43 - 2.72) Simvastatin (C10AA01) 1 0.61 3 1.15 0.55 (0.06 - 5.36) Atorvastatin (C10AA05) 3 1.84 3 1.15 2.53 (0.46 - 13.82) Fibrates(C10AB) 4 2.45 2 0.77 2.58 (0.45 - 14.63)
*Adjusted for diet composition (daily vegetable, fruit and meat intake), height and weight, age, sex, study region, and vitamin C.
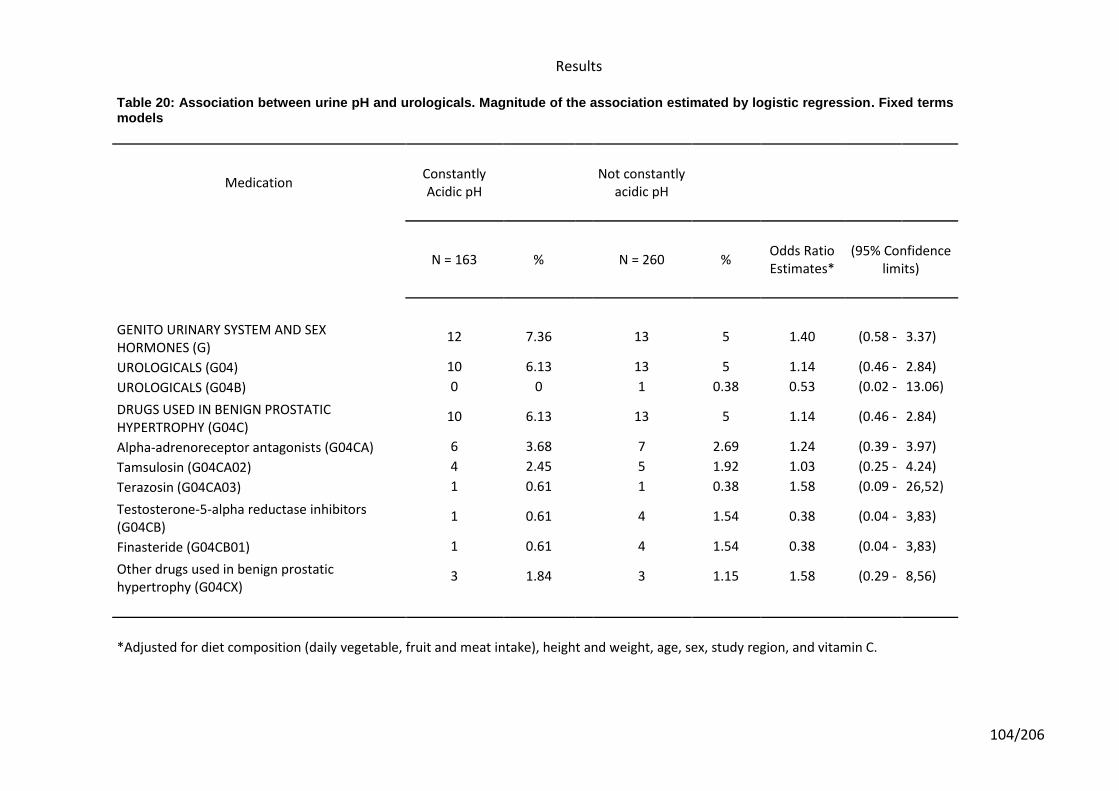
Results
104/206
Table 20: Association between urine pH and urologicals. Magnitude of the association estimated by logistic regression. Fixed terms models
Medication Constantly Acidic pH
Not constantly
acidic pH
N = 163 % N = 260 %
Odds Ratio Estimates*
(95% Confidence limits)
GENITO URINARY SYSTEM AND SEX HORMONES (G)
12 7.36 13 5 1.40 (0.58 - 3.37)
UROLOGICALS (G04) 10 6.13 13 5 1.14 (0.46 - 2.84)
UROLOGICALS (G04B) 0 0 1 0.38 0.53 (0.02 - 13.06)
DRUGS USED IN BENIGN PROSTATIC HYPERTROPHY (G04C)
10 6.13 13 5 1.14 (0.46 - 2.84)
Alpha-adrenoreceptor antagonists (G04CA) 6 3.68 7 2.69 1.24 (0.39 - 3.97)
Tamsulosin (G04CA02) 4 2.45 5 1.92 1.03 (0.25 - 4.24)
Terazosin (G04CA03) 1 0.61 1 0.38 1.58 (0.09 - 26,52)
Testosterone-5-alpha reductase inhibitors (G04CB)
1 0.61 4 1.54 0.38 (0.04 - 3,83)
Finasteride (G04CB01) 1 0.61 4 1.54 0.38 (0.04 - 3,83)
Other drugs used in benign prostatic hypertrophy (G04CX)
3 1.84 3 1.15 1.58 (0.29 - 8,56)
*Adjusted for diet composition (daily vegetable, fruit and meat intake), height and weight, age, sex, study region, and vitamin C.
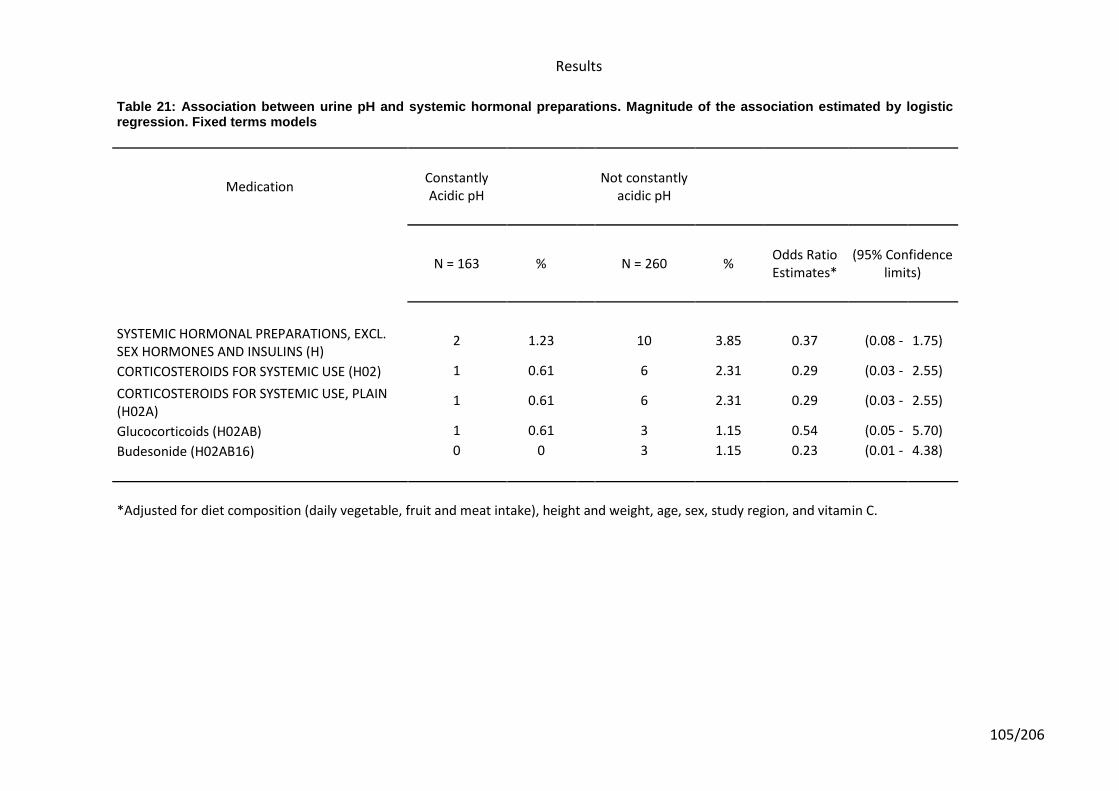
Results
105/206
Table 21: Association between urine pH and systemic hormonal preparations. Magnitude of the association estimated by logistic regression. Fixed terms models
Medication Constantly Acidic pH
Not constantly
acidic pH
N = 163 % N = 260 % Odds Ratio Estimates*
(95% Confidence limits)
SYSTEMIC HORMONAL PREPARATIONS, EXCL. SEX HORMONES AND INSULINS (H)
2 1.23 10 3.85 0.37 (0.08 - 1.75)
CORTICOSTEROIDS FOR SYSTEMIC USE (H02) 1 0.61 6 2.31 0.29 (0.03 - 2.55)
CORTICOSTEROIDS FOR SYSTEMIC USE, PLAIN (H02A)
1 0.61 6 2.31 0.29 (0.03 - 2.55)
Glucocorticoids (H02AB) 1 0.61 3 1.15 0.54 (0.05 - 5.70)
Budesonide (H02AB16) 0 0 3 1.15 0.23 (0.01 - 4.38)
*Adjusted for diet composition (daily vegetable, fruit and meat intake), height and weight, age, sex, study region, and vitamin C.
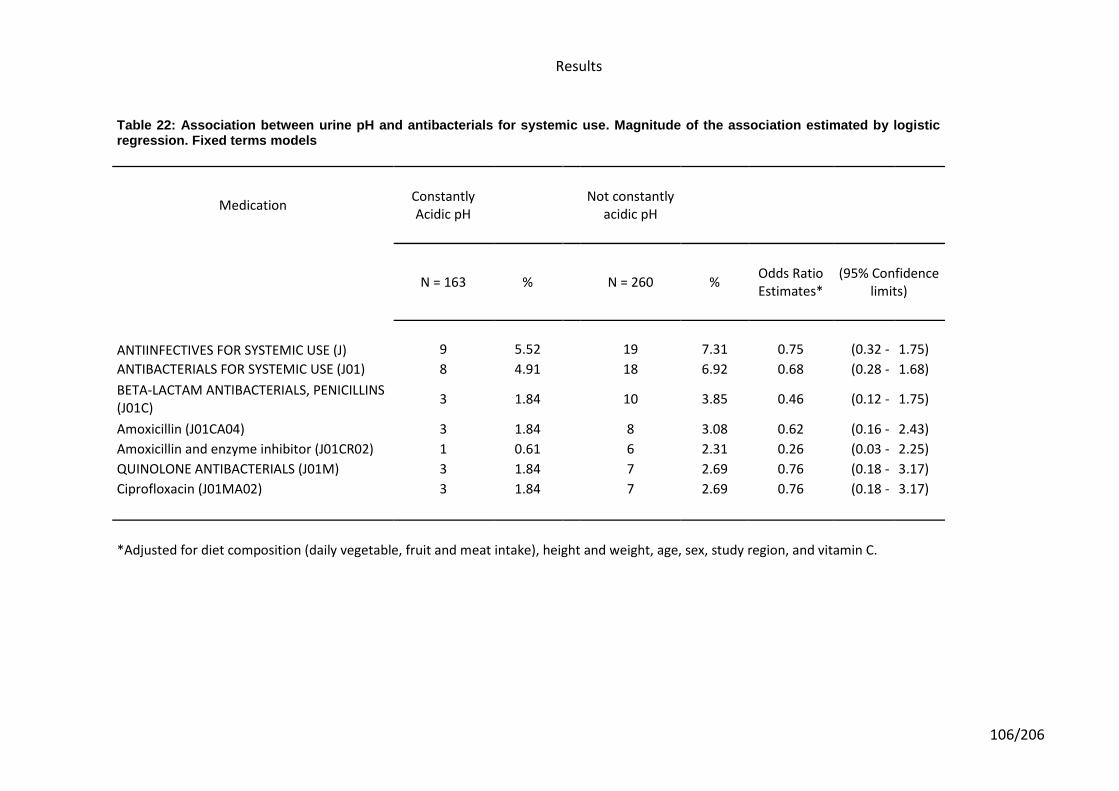
Results
106/206
Table 22: Association between urine pH and antibacterials for systemic use. Magnitude of the association estimated by logistic regression. Fixed terms models
Medication Constantly Acidic pH
Not constantly
acidic pH
N = 163 % N = 260 %
Odds Ratio Estimates*
(95% Confidence limits)
ANTIINFECTIVES FOR SYSTEMIC USE (J) 9 5.52 19 7.31 0.75 (0.32 - 1.75)
ANTIBACTERIALS FOR SYSTEMIC USE (J01) 8 4.91 18 6.92 0.68 (0.28 - 1.68)
BETA-LACTAM ANTIBACTERIALS, PENICILLINS (J01C)
3 1.84
10 3.85 0.46 (0.12 - 1.75)
Amoxicillin (J01CA04) 3 1.84 8 3.08 0.62 (0.16 - 2.43)
Amoxicillin and enzyme inhibitor (J01CR02) 1 0.61 6 2.31 0.26 (0.03 - 2.25)
QUINOLONE ANTIBACTERIALS (J01M) 3 1.84 7 2.69 0.76 (0.18 - 3.17)
Ciprofloxacin (J01MA02) 3 1.84 7 2.69 0.76 (0.18 - 3.17)
*Adjusted for diet composition (daily vegetable, fruit and meat intake), height and weight, age, sex, study region, and vitamin C.
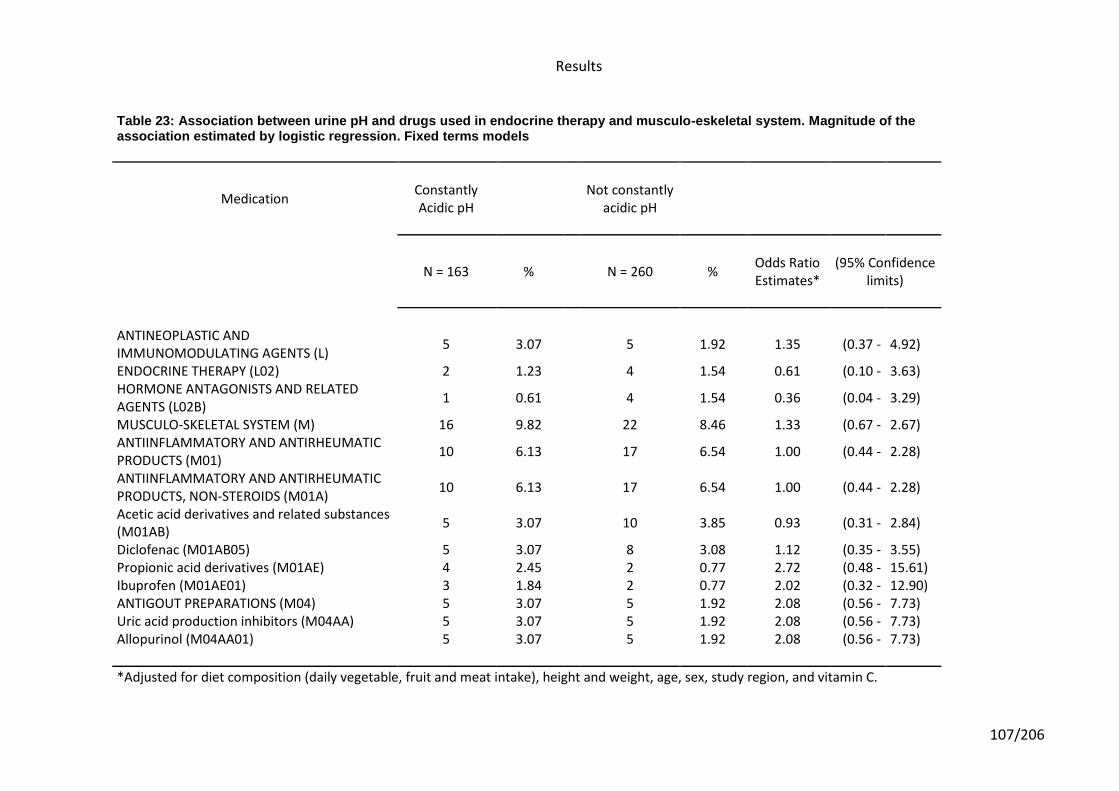
Results
107/206
Table 23: Association between urine pH and drugs used in endocrine therapy and musculo-eskeletal system. Magnitude of the association estimated by logistic regression. Fixed terms models
Medication Constantly Acidic pH
Not constantly
acidic pH
N = 163 % N = 260 %
Odds Ratio Estimates*
(95% Confidence limits)
ANTINEOPLASTIC AND IMMUNOMODULATING AGENTS (L)
5 3.07 5 1.92 1.35 (0.37 - 4.92)
ENDOCRINE THERAPY (L02) 2 1.23 4 1.54 0.61 (0.10 - 3.63) HORMONE ANTAGONISTS AND RELATED AGENTS (L02B)
1 0.61 4 1.54 0.36 (0.04 - 3.29)
MUSCULO-SKELETAL SYSTEM (M) 16 9.82 22 8.46 1.33 (0.67 - 2.67) ANTIINFLAMMATORY AND ANTIRHEUMATIC PRODUCTS (M01)
10 6.13 17 6.54 1.00 (0.44 - 2.28)
ANTIINFLAMMATORY AND ANTIRHEUMATIC PRODUCTS, NON-STEROIDS (M01A)
10 6.13 17 6.54 1.00 (0.44 - 2.28)
Acetic acid derivatives and related substances (M01AB)
5 3.07 10 3.85 0.93 (0.31 - 2.84)
Diclofenac (M01AB05) 5 3.07 8 3.08 1.12 (0.35 - 3.55) Propionic acid derivatives (M01AE) 4 2.45 2 0.77 2.72 (0.48 - 15.61) Ibuprofen (M01AE01) 3 1.84 2 0.77 2.02 (0.32 - 12.90) ANTIGOUT PREPARATIONS (M04) 5 3.07 5 1.92 2.08 (0.56 - 7.73) Uric acid production inhibitors (M04AA) 5 3.07 5 1.92 2.08 (0.56 - 7.73) Allopurinol (M04AA01) 5 3.07 5 1.92 2.08 (0.56 - 7.73)
*Adjusted for diet composition (daily vegetable, fruit and meat intake), height and weight, age, sex, study region, and vitamin C.
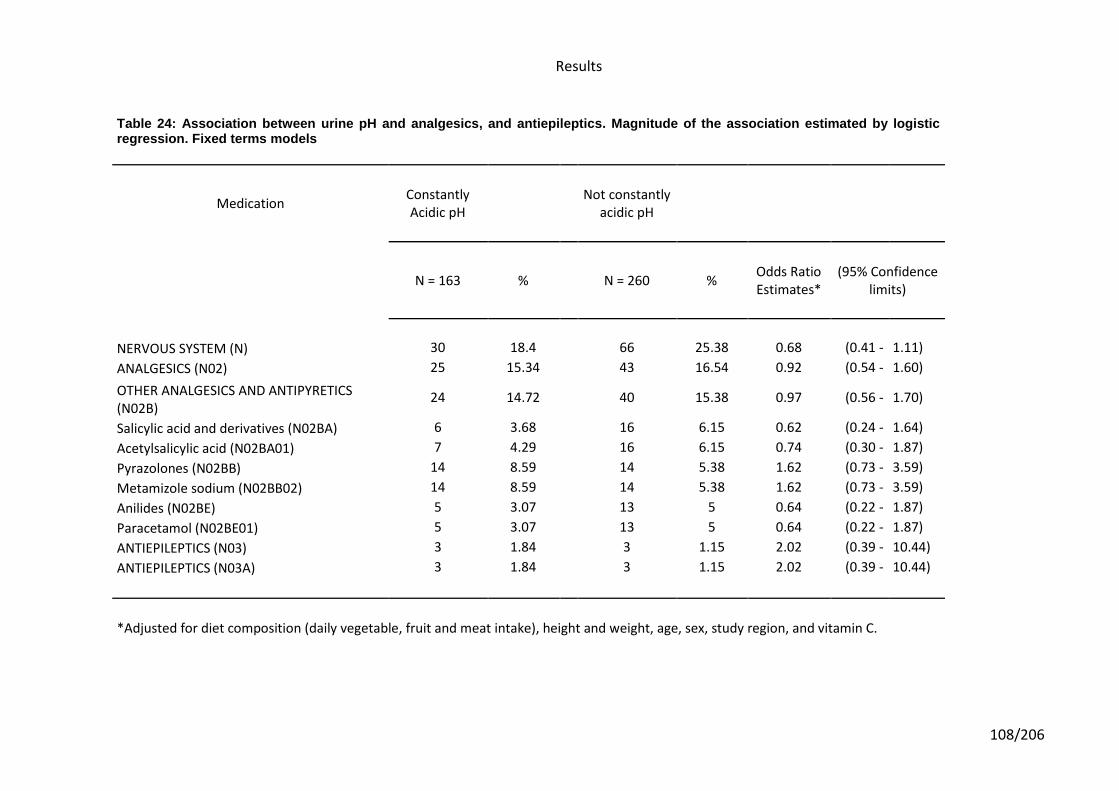
Results
108/206
Table 24: Association between urine pH and analgesics, and antiepileptics. Magnitude of the association estimated by logistic regression. Fixed terms models
Medication Constantly Acidic pH
Not constantly
acidic pH
N = 163 % N = 260 %
Odds Ratio Estimates*
(95% Confidence limits)
NERVOUS SYSTEM (N) 30 18.4 66 25.38 0.68 (0.41 - 1.11)
ANALGESICS (N02) 25 15.34 43 16.54 0.92 (0.54 - 1.60)
OTHER ANALGESICS AND ANTIPYRETICS (N02B)
24 14.72 40 15.38 0.97 (0.56 - 1.70)
Salicylic acid and derivatives (N02BA) 6 3.68 16 6.15 0.62 (0.24 - 1.64)
Acetylsalicylic acid (N02BA01) 7 4.29 16 6.15 0.74 (0.30 - 1.87)
Pyrazolones (N02BB) 14 8.59 14 5.38 1.62 (0.73 - 3.59)
Metamizole sodium (N02BB02) 14 8.59 14 5.38 1.62 (0.73 - 3.59)
Anilides (N02BE) 5 3.07 13 5 0.64 (0.22 - 1.87)
Paracetamol (N02BE01) 5 3.07 13 5 0.64 (0.22 - 1.87)
ANTIEPILEPTICS (N03) 3 1.84 3 1.15 2.02 (0.39 - 10.44)
ANTIEPILEPTICS (N03A) 3 1.84 3 1.15 2.02 (0.39 - 10.44)
*Adjusted for diet composition (daily vegetable, fruit and meat intake), height and weight, age, sex, study region, and vitamin C.
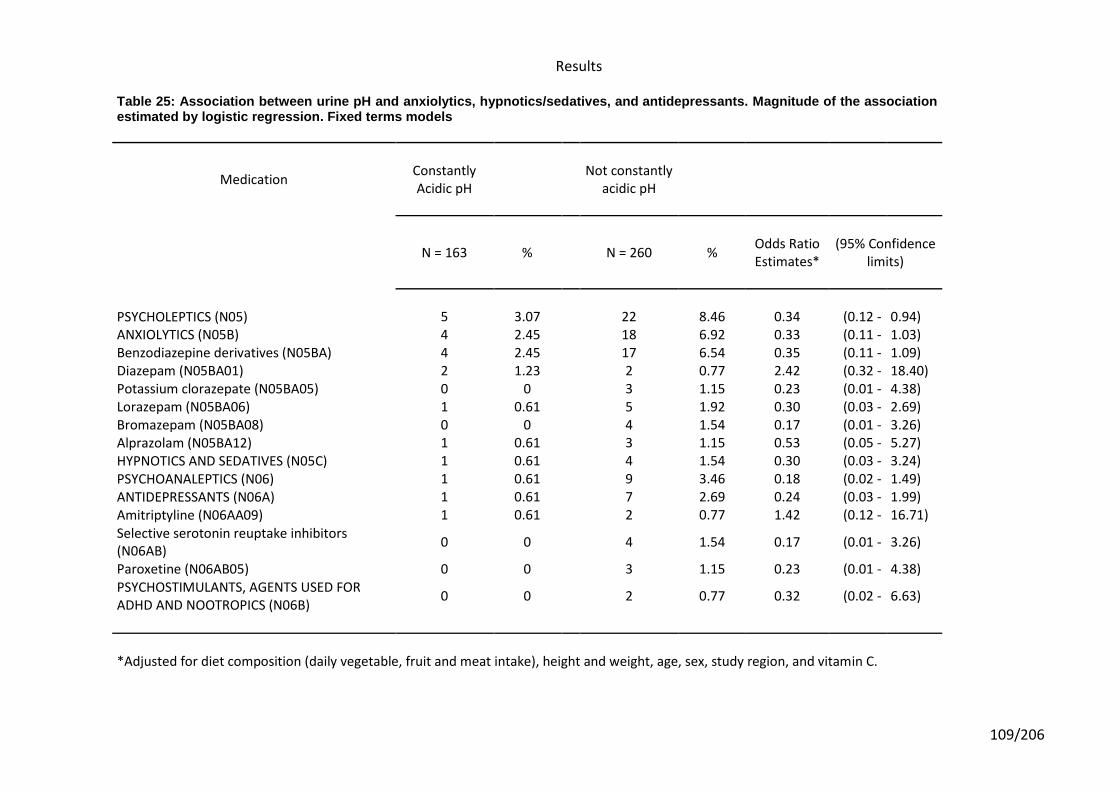
Results
109/206
Table 25: Association between urine pH and anxiolytics, hypnotics/sedatives, and antidepressants. Magnitude of the association estimated by logistic regression. Fixed terms models
Medication Constantly Acidic pH
Not constantly
acidic pH
N = 163 % N = 260 %
Odds Ratio Estimates*
(95% Confidence limits)
PSYCHOLEPTICS (N05) 5 3.07 22 8.46 0.34 (0.12 - 0.94) ANXIOLYTICS (N05B) 4 2.45 18 6.92 0.33 (0.11 - 1.03) Benzodiazepine derivatives (N05BA) 4 2.45 17 6.54 0.35 (0.11 - 1.09) Diazepam (N05BA01) 2 1.23 2 0.77 2.42 (0.32 - 18.40) Potassium clorazepate (N05BA05) 0 0 3 1.15 0.23 (0.01 - 4.38) Lorazepam (N05BA06) 1 0.61 5 1.92 0.30 (0.03 - 2.69) Bromazepam (N05BA08) 0 0 4 1.54 0.17 (0.01 - 3.26) Alprazolam (N05BA12) 1 0.61 3 1.15 0.53 (0.05 - 5.27) HYPNOTICS AND SEDATIVES (N05C) 1 0.61 4 1.54 0.30 (0.03 - 3.24) PSYCHOANALEPTICS (N06) 1 0.61 9 3.46 0.18 (0.02 - 1.49) ANTIDEPRESSANTS (N06A) 1 0.61 7 2.69 0.24 (0.03 - 1.99) Amitriptyline (N06AA09) 1 0.61 2 0.77 1.42 (0.12 - 16.71) Selective serotonin reuptake inhibitors (N06AB)
0 0 4 1.54 0.17 (0.01 - 3.26)
Paroxetine (N06AB05) 0 0 3 1.15 0.23 (0.01 - 4.38) PSYCHOSTIMULANTS, AGENTS USED FOR ADHD AND NOOTROPICS (N06B)
0 0 2 0.77 0.32 (0.02 - 6.63)
*Adjusted for diet composition (daily vegetable, fruit and meat intake), height and weight, age, sex, study region, and vitamin C.
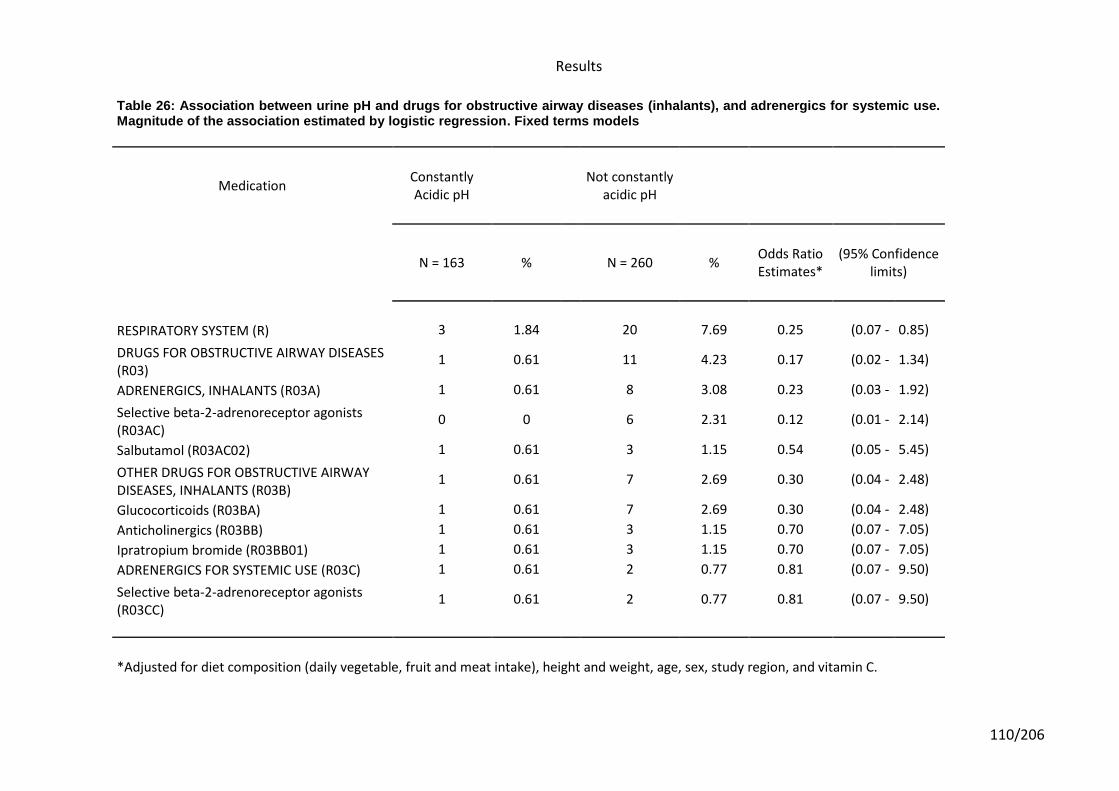
Results
110/206
Table 26: Association between urine pH and drugs for obstructive airway diseases (inhalants), and adrenergics for systemic use. Magnitude of the association estimated by logistic regression. Fixed terms models
Medication Constantly Acidic pH
Not constantly
acidic pH
N = 163 % N = 260 %
Odds Ratio Estimates*
(95% Confidence limits)
RESPIRATORY SYSTEM (R) 3 1.84 20 7.69 0.25 (0.07 - 0.85)
DRUGS FOR OBSTRUCTIVE AIRWAY DISEASES (R03)
1 0.61 11 4.23 0.17 (0.02 - 1.34)
ADRENERGICS, INHALANTS (R03A) 1 0.61 8 3.08 0.23 (0.03 - 1.92)
Selective beta-2-adrenoreceptor agonists (R03AC)
0 0 6 2.31 0.12 (0.01 - 2.14)
Salbutamol (R03AC02) 1 0.61 3 1.15 0.54 (0.05 - 5.45)
OTHER DRUGS FOR OBSTRUCTIVE AIRWAY DISEASES, INHALANTS (R03B)
1 0.61 7 2.69 0.30 (0.04 - 2.48)
Glucocorticoids (R03BA) 1 0.61 7 2.69 0.30 (0.04 - 2.48)
Anticholinergics (R03BB) 1 0.61 3 1.15 0.70 (0.07 - 7.05)
Ipratropium bromide (R03BB01) 1 0.61 3 1.15 0.70 (0.07 - 7.05)
ADRENERGICS FOR SYSTEMIC USE (R03C) 1 0.61 2 0.77 0.81 (0.07 - 9.50)
Selective beta-2-adrenoreceptor agonists (R03CC)
1 0.61 2 0.77 0.81 (0.07 - 9.50)
*Adjusted for diet composition (daily vegetable, fruit and meat intake), height and weight, age, sex, study region, and vitamin C.
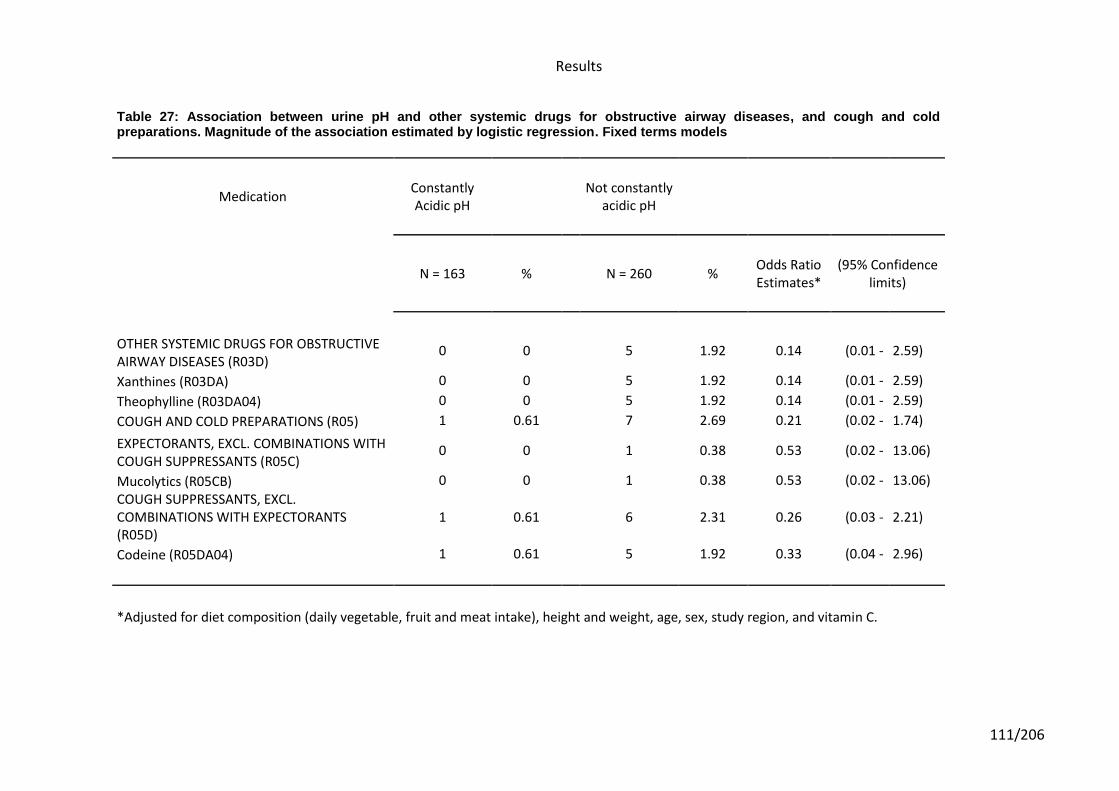
Results
111/206
Table 27: Association between urine pH and other systemic drugs for obstructive airway diseases, and cough and cold preparations. Magnitude of the association estimated by logistic regression. Fixed terms models
Medication Constantly Acidic pH
Not constantly
acidic pH
N = 163 % N = 260 %
Odds Ratio Estimates*
(95% Confidence limits)
OTHER SYSTEMIC DRUGS FOR OBSTRUCTIVE AIRWAY DISEASES (R03D)
0 0 5 1.92 0.14 (0.01 - 2.59)
Xanthines (R03DA) 0 0 5 1.92 0.14 (0.01 - 2.59)
Theophylline (R03DA04) 0 0 5 1.92 0.14 (0.01 - 2.59)
COUGH AND COLD PREPARATIONS (R05) 1 0.61 7 2.69 0.21 (0.02 - 1.74)
EXPECTORANTS, EXCL. COMBINATIONS WITH COUGH SUPPRESSANTS (R05C)
0 0 1 0.38 0.53 (0.02 - 13.06)
Mucolytics (R05CB) 0 0 1 0.38 0.53 (0.02 - 13.06)
COUGH SUPPRESSANTS, EXCL. COMBINATIONS WITH EXPECTORANTS (R05D)
1 0.61 6 2.31 0.26 (0.03 - 2.21)
Codeine (R05DA04) 1 0.61 5 1.92 0.33 (0.04 - 2.96)
*Adjusted for diet composition (daily vegetable, fruit and meat intake), height and weight, age, sex, study region, and vitamin C.
Results
112/206
The association between drugs included in the major group “Vitamins, and mineral
supplements” and urinary pH is shown in Tables 11-13. Some drugs acting on “alimentary
tract and metabolism” showed associations close to statistical significance. In Table 11 we
found that 2.7% of subjects without constantly acidic urinary pH reported taking
“stomatological preparations”, founding none of them with acidic urinary pH (OR=0.10,
95%CI: 0.01 – 1.82; p=0.058). A similar situation is shown in Table 17 where 2.7% of
subjects were taking drugs from the therapeutic group of “insulins and analogues” used in
diabetes, and again none of them had acidic urine pH (OR=0.10, 95%CI: 0.01 – 1.82;
p=0.058). Finally in this anatomical main group (“alimentary tract and metabolism”), we again
found (see Table 13) that 2.7% of our study population subjects were taking “mineral
supplements” (p=0.058) and none of them had acidic urine pH (OR=0.10, 95%CI: 0.01 –
1.82).
From drugs acting in the anatomical group of “blood and blood forming organs” we found that
the heparin group showed an association close to statistical significance (p=0.094) in Table
14, where subjects taking these medications found to be associated with non-development of
acidic urine pH (OR=0.27, 95%CI: 0.06 – 1.25).
The association between drugs acting on the cardiovascular system and urine pH are shown
from Table 5 to Table 19. An association close to statistical significance was found in the
pharmacological group of “cardiac glycosides” (p=0.067). Subjects taking cardiac glycosides
were three times more likely to have acidic urine pH (OR=3.30, 95%CI: 0.92 – 11.80).
Specifically, digoxin (see Table 15) showed a suggestion of an association with the
generation of acidic urine pH levels (OR=6.28, 95%CI: 0.61 – 64.12). The medications
included in the pharmacological groups of “antihypertensives, diuretics, peripheral
vasodilators, vasoprotectives, beta blocking agents, calcium channel blockers, agents acting
on the renin-angiotensin system and lipid modifying agents” did not show any association
with urinary pH in our study population (all p values above 0.15) (Tables 15-19).
Results
113/206
The results obtained for drugs acting on genito urinary system and sex hormones
(urologicals) were not found to have statistically significant association values in our analysis
(Table 20).
The results obtained for systemic hormonal preparations (excluding sex hormones and
insulins) were not found to have statistically significant association values in our analysis
(Table 21).
The results obtained for “antiinfectives for systemic use” did not reach statistically
significance in our analysis (Table 22).
The results obtained for antineoplastic and immunomodulating agents (endocrine therapy)
and for drugs acting in musculo-skeletal system were not statistically significant in our
analysis (Table 23).
In Table 24 and 25, we observe that drugs acting on the “nervous system” had an inverse
association with acidic urine pH close to statistically significance (OR=0.68, 95%CI: 0.41 –
1.11; p=0.125). Among these drugs statistically significant results were found in the group of
“psycholeptics”. Psycholeptics were found to be the most representatives on giving this
association to non-acidic urine development (OR=0.34, 95%CI: 0.12 – 0.94; p=0.038). Most
of this psycholeptics (Table 25) taken by our study subjects were in the pharmacological
group of “anxiolytics” (OR=0.33, 95%CI: 0.11 – 1.03) and more concretely most of them were
benzodiazepine derivatives (OR=0.35, 95%CI: 0.11 – 1.09). Also, “psychoanaleptics”
showed a suggestion of association with not development of acidic urine pH on our results
(OR=0.18, 95%CI: 0.02 – 1.49, p=0.113). Finally, “analgesics and antiepileptics” were not
found to have a significant influence on urine pH levels among our study population (Table
24).
Finally, the results for drugs used on the “respiratory system” were found to have statistically
significant asociation in our analysis results (OR=0.25, 95%CI: 0.07 – 0.85; p=0.027). In
Results
114/206
Table 26 and 27 we can see the suggested association with non-acidic urine pH that is given
by “drugs used in obstructive airway diseases” (OR=0.17, 95%CI: 0.02 – 1.34; p=0.092),
where “selective beta-2-adrenoreceptor agonists” (p=0.085) and “xanthenes”, more
concretely “theophylline” (p=0.125), showed the most significant results in our analysis. Also,
the use of “cold and cough preparations” showed a suggested association on the generation
of non-acidic urine pH in our analysis (p=0.147).
Next are shown (Table 28) all the medications most significantly associated in our statistical
analysis (p≤0.15) to influence on the generation or not generation of constantly acidic urine
(summarize from the results showed in Tables 11-27).
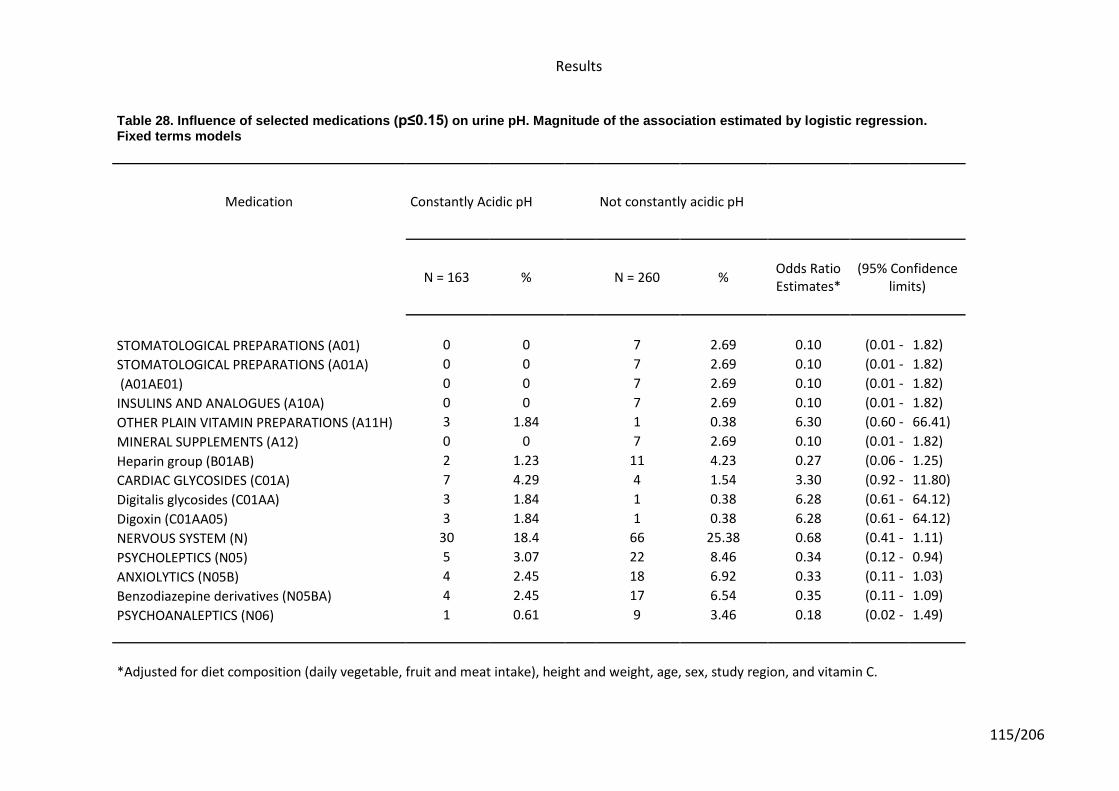
Results
115/206
Table 28. Influence of selected medications (p≤0.15) on urine pH. Magnitude of the association estimated by logistic regression. Fixed terms models
Medication Constantly Acidic pH Not constantly acidic pH
N = 163 % N = 260 %
Odds Ratio Estimates*
(95% Confidence limits)
STOMATOLOGICAL PREPARATIONS (A01) 0 0 7 2.69 0.10 (0.01 - 1.82)
STOMATOLOGICAL PREPARATIONS (A01A) 0 0 7 2.69 0.10 (0.01 - 1.82)
(A01AE01) 0 0 7 2.69 0.10 (0.01 - 1.82)
INSULINS AND ANALOGUES (A10A) 0 0 7 2.69 0.10 (0.01 - 1.82)
OTHER PLAIN VITAMIN PREPARATIONS (A11H) 3 1.84 1 0.38 6.30 (0.60 - 66.41)
MINERAL SUPPLEMENTS (A12) 0 0 7 2.69 0.10 (0.01 - 1.82)
Heparin group (B01AB) 2 1.23 11 4.23 0.27 (0.06 - 1.25)
CARDIAC GLYCOSIDES (C01A) 7 4.29 4 1.54 3.30 (0.92 - 11.80)
Digitalis glycosides (C01AA) 3 1.84 1 0.38 6.28 (0.61 - 64.12)
Digoxin (C01AA05) 3 1.84 1 0.38 6.28 (0.61 - 64.12)
NERVOUS SYSTEM (N) 30 18.4 66 25.38 0.68 (0.41 - 1.11)
PSYCHOLEPTICS (N05) 5 3.07 22 8.46 0.34 (0.12 - 0.94)
ANXIOLYTICS (N05B) 4 2.45 18 6.92 0.33 (0.11 - 1.03)
Benzodiazepine derivatives (N05BA) 4 2.45 17 6.54 0.35 (0.11 - 1.09)
PSYCHOANALEPTICS (N06) 1 0.61 9 3.46 0.18 (0.02 - 1.49)
*Adjusted for diet composition (daily vegetable, fruit and meat intake), height and weight, age, sex, study region, and vitamin C.
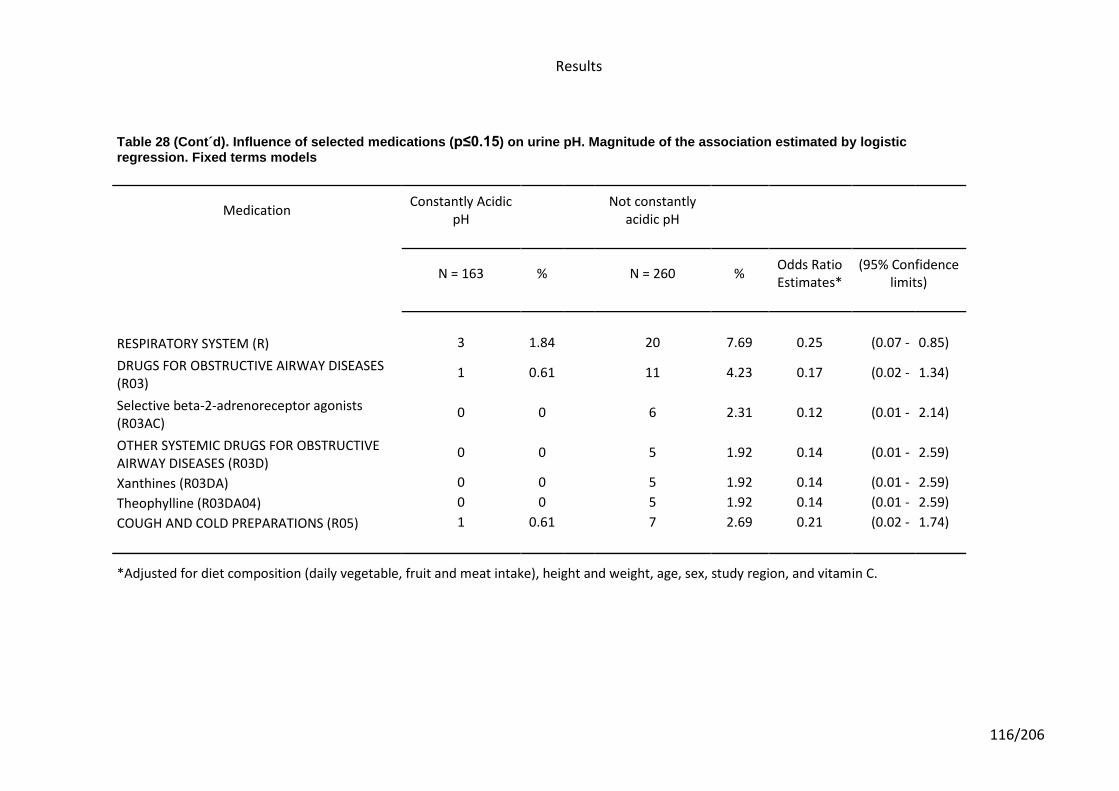
Results
116/206
Table 28 (Cont´d). Influence of selected medications (p≤0.15) on urine pH. Magnitude of the association estimated by logistic regression. Fixed terms models
Medication
Constantly Acidic pH
Not constantly acidic pH
N = 163 %
N = 260 % Odds Ratio Estimates*
(95% Confidence limits)
RESPIRATORY SYSTEM (R) 3 1.84
20 7.69 0.25 (0.07 - 0.85)
DRUGS FOR OBSTRUCTIVE AIRWAY DISEASES (R03)
1 0.61
11 4.23 0.17 (0.02 - 1.34)
Selective beta-2-adrenoreceptor agonists (R03AC)
0 0
6 2.31 0.12 (0.01 - 2.14)
OTHER SYSTEMIC DRUGS FOR OBSTRUCTIVE AIRWAY DISEASES (R03D)
0 0
5 1.92 0.14 (0.01 - 2.59)
Xanthines (R03DA) 0 0
5 1.92 0.14 (0.01 - 2.59)
Theophylline (R03DA04) 0 0
5 1.92 0.14 (0.01 - 2.59)
COUGH AND COLD PREPARATIONS (R05) 1 0.61
7 2.69 0.21 (0.02 - 1.74)
*Adjusted for diet composition (daily vegetable, fruit and meat intake), height and weight, age, sex, study region, and vitamin C.
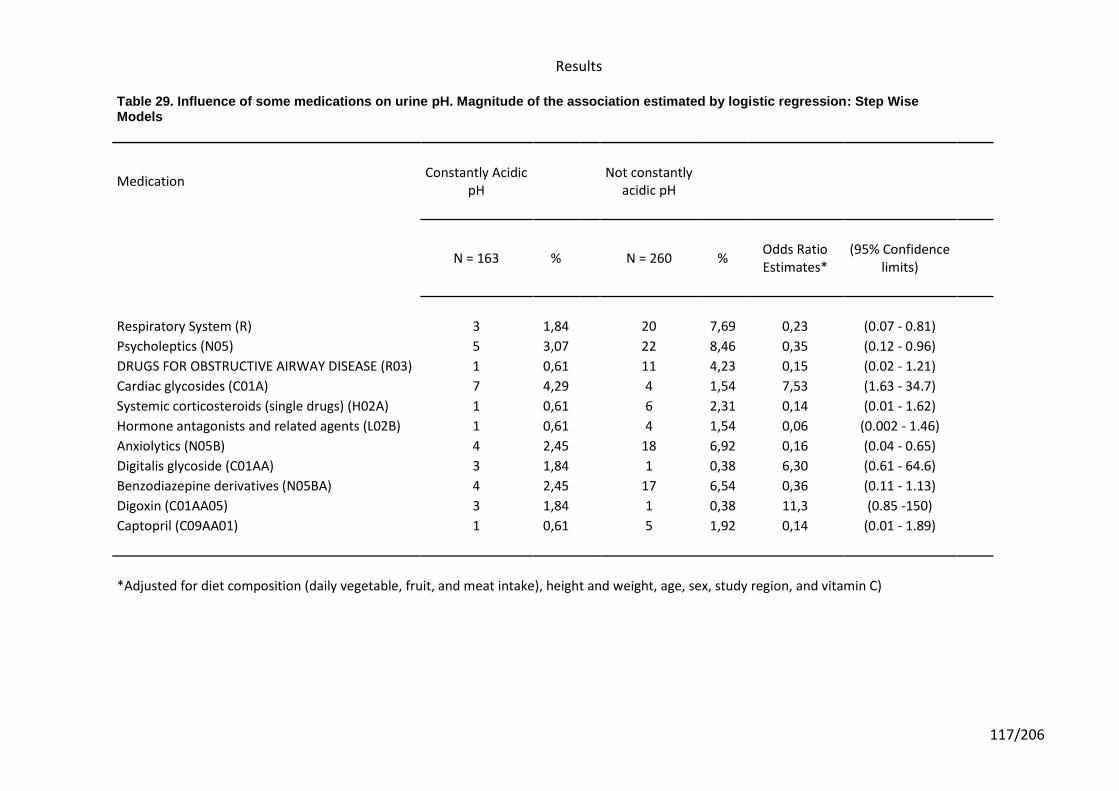
Results
117/206
Table 29. Influence of some medications on urine pH. Magnitude of the association estimated by logistic regression: Step Wise Models
Medication Constantly Acidic
pH
Not constantly acidic pH
N = 163 % N = 260 %
Odds Ratio Estimates*
(95% Confidence limits)
Respiratory System (R) 3 1,84 20 7,69 0,23 (0.07 - 0.81)
Psycholeptics (N05) 5 3,07 22 8,46 0,35 (0.12 - 0.96)
DRUGS FOR OBSTRUCTIVE AIRWAY DISEASE (R03) 1 0,61 11 4,23 0,15 (0.02 - 1.21)
Cardiac glycosides (C01A) 7 4,29 4 1,54 7,53 (1.63 - 34.7)
Systemic corticosteroids (single drugs) (H02A) 1 0,61 6 2,31 0,14 (0.01 - 1.62)
Hormone antagonists and related agents (L02B) 1 0,61 4 1,54 0,06 (0.002 - 1.46)
Anxiolytics (N05B) 4 2,45 18 6,92 0,16 (0.04 - 0.65)
Digitalis glycoside (C01AA) 3 1,84 1 0,38 6,30 (0.61 - 64.6)
Benzodiazepine derivatives (N05BA) 4 2,45 17 6,54 0,36 (0.11 - 1.13)
Digoxin (C01AA05) 3 1,84 1 0,38 11,3 (0.85 -150)
Captopril (C09AA01) 1 0,61 5 1,92 0,14 (0.01 - 1.89)
*Adjusted for diet composition (daily vegetable, fruit, and meat intake), height and weight, age, sex, study region, and vitamin C)
118/206
Results for the association between medications and urine pH. Magnitude of the association estimated by logistic regression: Step Wise
Table 29 shows the risk estimates for medications when building a logistic regression models
forcing all confounders to enter the model, and entering all medications at the same digit
level using a step wise strategy (p value to enter=0.15, p value to exit=0.20). Statistically
significant association of medication and its influence on urine pH levels were found for drugs
used on “Cardiovascular System”. In this main group we found that 4.29% of patients with
acidic urine pH were taking “cardiac glycosides” (OR=7.53, 95%CI: 1.64 – 34.7), where 1.7%
of subjects took “digitalis glycoside” and more concretely “digoxin” (OR=11.3, 95%CI: 0.85 –
150). We also had 0.61% of subjects with acidic pH taking “Captopril” in this main group.
Captopril use was not associated with acid urine pH levels (OR=0.14, 95%CI: 0.01 – 1.89).
“Systemic hormonal preparations” like “systemic corticosteroids (single drugs)” were taken by
0.61% of subjects with acid urine pH (OR=0.14, 95%CI: 0.01 – 1.62) and “hormone
antagonists and related agents” used as antineoplastic agents were taken by 0.61% of
patients with acid urine pH (OR=0.06, 95%CI: 0.002 – 1.46), and none of them was
associated with acid urine pH levels.
Also, 18.4% of subjects with acid urine pH were taking drugs used in the “nervous system”.
We found that 3.07% of subjects with acid urine pH were taking “psycholeptics”, founding in
this group statistically significant influence on urine pH levels (OR=0.35, 95%CI: 0.12 – 0.96).
Most of this psycholeptics taken by our study subjects were in the pharmacological subgroup
of “anxiolytics” (OR=0.16, 95%CI: 0.04 – 0.65) and specially “benzodiazepine derivatives”
(OR=0.36, 95%CI: 0.12 – 1.13).
Finally, we mention some drugs acting on “respiratory system”. They were found to have a
significant association with urine pH levels (OR=0.23, 95%CI: 0.07 – 0.81), where 0.61% of
subjects with acid pH were taking “drugs for obstructive airways diseases” (OR=0.15, 95%CI:

Results
119/206
0.02 – 1.22). Therefore, we can see that none of these drugs used on respiratory system
were associated with acid urine pH levels.

120/206

121/206
6. Discussion

122/206
Discussion
123/206
6. DISCUSSION
DISCUSSION OF RESULTS FOR CARDIAC GLYCOSIDES
Use of cardiac glycosides was found to be associated with having constantly acidic
urine pH. Cardiac glycosides are mainly used in the treatment of congestive heart failure and
cardiac arrhythmia. As our study is the first analyzing the association between use of such
group of drugs and consistently acidic urine pH, we cannot directly compare our results with
other studies. However, as discussed below, there is biological rationale to support our
findings.
Use of cardiac glycosides in heart failure and the importance of potassium homeostasis
Congestive heart failure (HF) is the most frequent cause of hospitalization for patients
older than 65 years, and continues to be a major public health burden among the ageing
population. The mean of age of our study subjects is around 63 years old. Most patients with
HF should be routinely managed with a combination of 3 types of drugs: a diuretic, an ACEI
or an ARB, and a beta-blocker134 and this treatment is associated with many limitations in
clinical practice135. Patients with evidence of fluid retention should take a diuretic until a
euvolemic state is achieved, and diuretic therapy should be continued to prevent the
recurrence of fluid retention. Even if the patient has responded favorably to the diuretic,
treatment with both an ACEI and a beta-blocker should be initiated and maintained in
patients who can tolerate them because they have been shown to favorably influence the
long-term prognosis of HF. Therapy with cardiac glycosides (mainly digoxin) as a fourth
agent may be initiated at any time to reduce symptoms, prevent hospitalization, control
rhythm, and enhance exercise tolerance. Its narrow therapeutic margin and its frequent
interactions with other drugs make cardiac glycosides (mainly digoxin) difficult to use.
Therefore, patients using cardiac glycosides are also usually using the above general
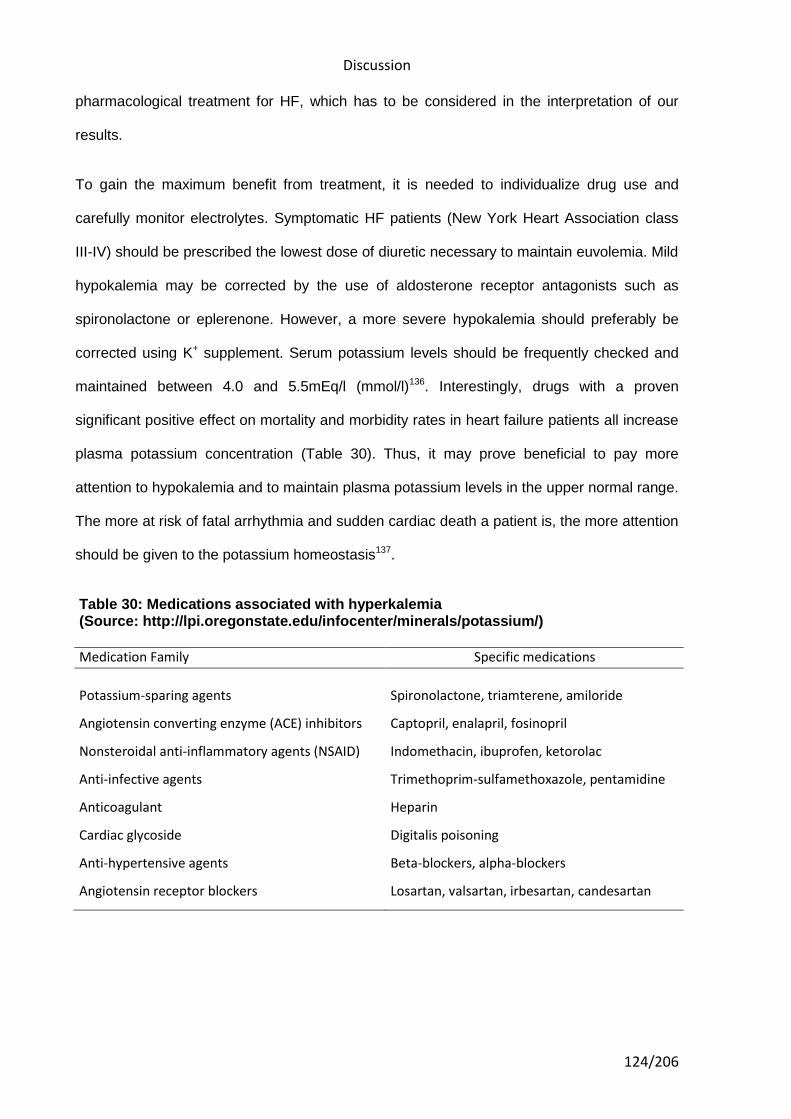
Discussion
124/206
pharmacological treatment for HF, which has to be considered in the interpretation of our
results.
To gain the maximum benefit from treatment, it is needed to individualize drug use and
carefully monitor electrolytes. Symptomatic HF patients (New York Heart Association class
III-IV) should be prescribed the lowest dose of diuretic necessary to maintain euvolemia. Mild
hypokalemia may be corrected by the use of aldosterone receptor antagonists such as
spironolactone or eplerenone. However, a more severe hypokalemia should preferably be
corrected using K+ supplement. Serum potassium levels should be frequently checked and
maintained between 4.0 and 5.5mEq/l (mmol/l)136. Interestingly, drugs with a proven
significant positive effect on mortality and morbidity rates in heart failure patients all increase
plasma potassium concentration (Table 30). Thus, it may prove beneficial to pay more
attention to hypokalemia and to maintain plasma potassium levels in the upper normal range.
The more at risk of fatal arrhythmia and sudden cardiac death a patient is, the more attention
should be given to the potassium homeostasis137.
Table 30: Medications associated with hyperkalemia (Source: http://lpi.oregonstate.edu/infocenter/minerals/potassium/)
Medication Family Specific medications
Potassium-sparing agents Spironolactone, triamterene, amiloride
Angiotensin converting enzyme (ACE) inhibitors Captopril, enalapril, fosinopril
Nonsteroidal anti-inflammatory agents (NSAID) Indomethacin, ibuprofen, ketorolac
Anti-infective agents Trimethoprim-sulfamethoxazole, pentamidine
Anticoagulant Heparin
Cardiac glycoside Digitalis poisoning
Anti-hypertensive agents Beta-blockers, alpha-blockers
Angiotensin receptor blockers Losartan, valsartan, irbesartan, candesartan
Discussion
125/206
Hypokalemic status of cardiac patients and the acidification of urine
It has been known for nearly a century that cardiovascular diseases are associated
with hypokalemia and potassium depletion in the heart138. Moreover, large-scale studies from
recent decades139-143 including, in total, more than 13,000 patients have shown that
hypokalemia is present in 7% to 17% of patients with hypertension, acute myocardial
infarction and heart failure. Also, up to 20% of hospitalized patients and up to 40% of patients
on diuretics suffer from hypokalemia144. Whereas hypokalemia has been ignored by some
investigators145, the risk induced by hypokalemia in cardiac patients seems relatively well
documented146,147. A recent study highlights the meaning of hypokalemia in heart failure
underlining that maintenance of normal potassium (K+) homeostasis has become an
increasingly important limiting factor in the therapy of heart failure (HF). With the application
of loop diuretics and digoxin, hypokalemia has become a frequent and feared side effect of
treatment.
Mechanisms involved in the generation of hypokalemia and its effect on renal ammonia metabolism
Subjects suffering from heart failure and fluid retention taking digitalis glycosides have
a combination of high aldosterone levels and an increased diuresis (more if is taken along
with diuretics) that tends to produce significant increases in the secretion and excretion of
potassium. It is important to differentiate between hypokalemia and potassium depletion.
Hypokalemia is generally defined as a serum potassium concentration that is lower than 3.5
mmol/L, while potassium depletion is generally defined as reduced K+ from total body stores.
In cardiac patients, hypokalemia and potassium depletion are often caused by an increased
loss of potassium through the kidneys due to nonpotassium-sparing diuretic therapy. This
effect is, furthermore, often aggravated by insufficient potassium intake due to reduced
appetite and the relatively low potassium content in modern food137.
Discussion
126/206
Hypokalemia is associated with increased ammoniagenesis and stimulation of net acid
excretion by the kidney in both humans and experimental animals14. In this context, though
with a not fully understood mechanism, there is increased ammonia excretion despite the
development of metabolic alkalosis. Recent studies have shown that hypokalemia induces
increased glutamine uptake into the proximal tubule, increasing the expression of the key
ammoniagenic enzymes (that would tend to acidify urine), GA (glutaminase), GDH
(glutamine dehydrogenase) and PEPCK (phosphoenol pyruvate carboxykinase)7,14. At the
same time, a hypokalemic status can also increase the expression of Rh glycoprotein (Rhcg)
an ammonia transporter in the collecting duct7 (see Figures 8 and 9, and Table 2). If Rhcg
expression is associated with systemic acid-base homeostasis, hypokalemia should
decrease its expression due to the development of alkalosis. These observations indicate
that the enhanced Rhcg expression and collecting duct ammonia excretion could be
regulated through mechanisms independent of acid-base homeostasis. The stimulation of
ammoniagenesis in response to acidosis or hypokalemia is likely to be activated by either
intracellular acidic pH or other factors. Recent studies have also demonstrated that the
increase in urinary ammonia excretion even developed within 2 days of potassium
deprivation, when the plasma potassium level was within normal limits14. Thus, the excretion
of ammonia by this mechanism would tend to acidify urine in a context independent of blood
acid-base homeostasis compensatory mechanisms.
Activity of Na+/K+-pumps in cardiac patients and its relation to potassium homeostasis and response to digitalization
In addition to hypokalemia due to potassium depletion, shift of potassium into stores
may cause a rapid reduction in serum potassium concentration to below 3.5 mmol/L, what is
particularly relevant in cardiac patients137. This may result from stimulation of the activity of
Na+/K+ pumps in skeletal muscles. In cardiac insufficiency, the decrease in the concentration
of Na+/K+-pumps in the myocardium is over a wide range correlated to the concomitant
reduction in ejection fraction. The regulatory and pathophysiological changes in the activity
Discussion
127/206
and concentration of Na+/K+-pumps are important for the contractile function of skeletal
muscle and heart as well as for K+ homoeostasis and the response to digitalization. The
digitalis glycosides exert their effects in patients with HF by virtue of their ability to inhibit
sodium-potassium (Na+-K+) adenosine triphosphatase (ATPase)148. Inhibition of this enzyme
in cardiac cells results in an increase in the contractile state of the heart, and for many
decades, the benefits of digitalis in HF were ascribed exclusively to this positive inotropic
action. However, recent evidence suggests that the benefits of digitalis may be related in part
to enzyme inhibition in noncardiac tissues. Inhibition of Na+-K+ ATPase in vagal afferent
fibers acts to sensitize cardiac baroreceptors, which in turn reduces sympathetic outflow from
the central nervous system149,150. In addition, by inhibiting Na+-K+ ATPase in the kidney,
digitalis reduces the renal tubular reabsorption of sodium151; the resulting increase in the
delivery of sodium to the distal tubules leads to the suppression of rennin secretion from the
kidneys152. These observations have led to the hypothesis that digitalis acts in HF primarily
by attenuating the activation of neurohormonal systems and not as a positive inotropic
drug153. Low serum K+ in HF may be also a marker of increased neurohormonal activity and
disease progression (see figure 10). Hence, congestive heart failure is often associated with
high levels of circulating adrenaline and noradrenaline. Because of stimulation of the beta
adrenoceptors in muscle and liver, this leads to hypokalemia, which predisposes to
ventricular arrhythmia, and increased ammoniagenesis and stimulation of net acid excretion
by the kidney 154.
Therefore, a predominant hypokalemic status in patients using cardiac glycosides would
drive to acidic urine pH, which can then be partly explained by both: heart failure condition by
itself, and its common treatment (including cardiac glycosides and other medications) with
hypokalemia as a common adverse effect. In fact, standard digitalization itself, with a dose of
digoxin sufficient to give a plasma concentration of 1.2 nM, can induce a significant
decreases in whole-body K+ and muscle K+ of 8 and 6% respectively155.
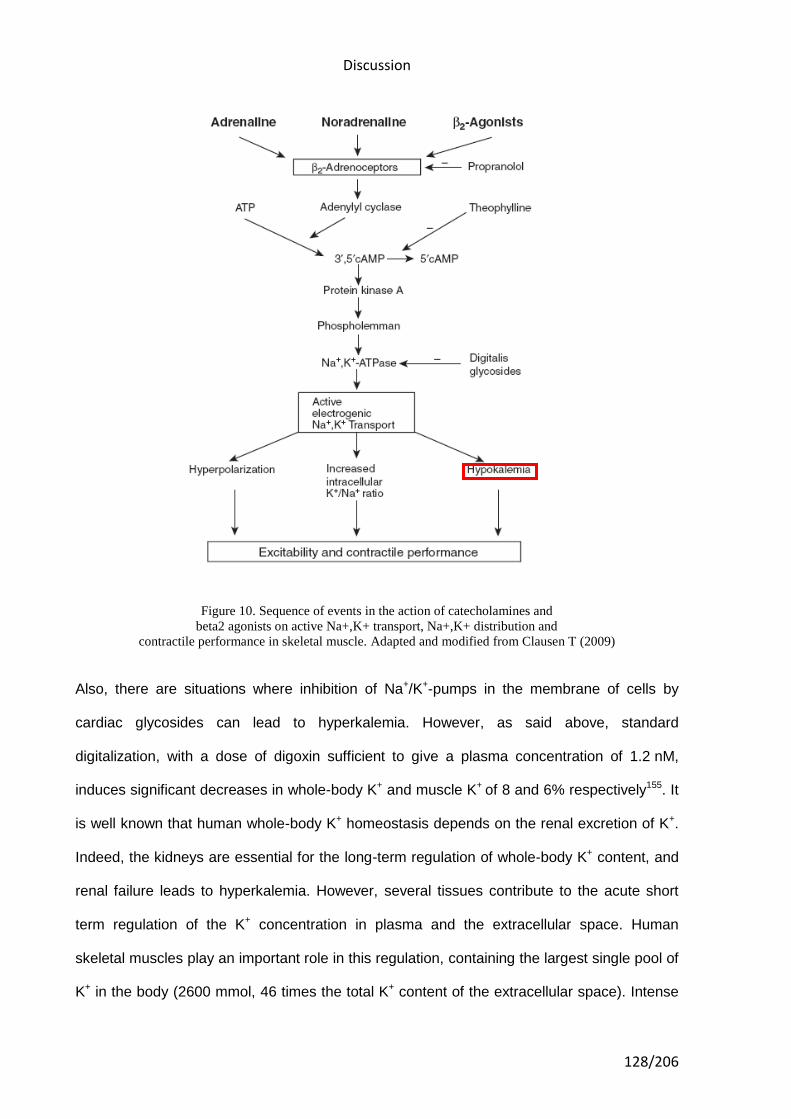
Discussion
128/206
Figure 10. Sequence of events in the action of catecholamines and
beta2 agonists on active Na+,K+ transport, Na+,K+ distribution and
contractile performance in skeletal muscle. Adapted and modified from Clausen T (2009)
Also, there are situations where inhibition of Na+/K+-pumps in the membrane of cells by
cardiac glycosides can lead to hyperkalemia. However, as said above, standard
digitalization, with a dose of digoxin sufficient to give a plasma concentration of 1.2 nM,
induces significant decreases in whole-body K+ and muscle K+ of 8 and 6% respectively155. It
is well known that human whole-body K+ homeostasis depends on the renal excretion of K+.
Indeed, the kidneys are essential for the long-term regulation of whole-body K+ content, and
renal failure leads to hyperkalemia. However, several tissues contribute to the acute short
term regulation of the K+ concentration in plasma and the extracellular space. Human
skeletal muscles play an important role in this regulation, containing the largest single pool of
K+ in the body (2600 mmol, 46 times the total K+ content of the extracellular space). Intense
Discussion
129/206
exercise may double arterial plasma K+ in one minute. This is because of excitation induced
release of K+ from the working muscle cells via K+ channels. This hyperkalemia is rapidly
corrected by reaccumulation of K+ into the muscle cells via Na+/K+ pumps, often leading to
hypokalemia. Already long ago, it was observed that in trained individuals, the exercise-
induced hyperkalemia was considerably reduced. More recently, it was shown that following
sprint training, the exercise-induced rise in plasma K+ was 19% lower than before, and this
was associated with an increase in the content of Na+/K+ pumps in skeletal muscle156. This
increase improves the capacity for the clearance of K+ from plasma and extracellular space.
It has repeatedly been demonstrated that training increases the content of Na+/K+ pumps in
human skeletal muscles157,158. Conversely, downregulation of the Na+/K+ pumps in skeletal
muscle as seen in cardiac failure, myotonic dystrophy or McArdle disease increases the
exercise-induced hyperkalemia155.
Another implication of a reduction in the concentration of Na+/K+-pumps in skeletal muscle is
that the muscular pool of digitalis receptors is decreased. Thus, after the administration of
digitalis glycosides, a larger fraction of the dose given will be available for distribution in the
extracellular volume, leading to a higher plasma concentration. In keeping with this it is a
well-known clinical experience that K+-deficient patients are more sensitive to digitalization159.
This relation has been explored in some experiments160 and illustrates the major influence of
the large muscular pool of digitalis glycoside receptors on the availability of digitalis
glycosides in plasma and offers an explanation for the increased sensitivity to digitalis in
patients suffering from K+ deficiency. It should be added that since K+ interferes with the
binding of digitalis to the Na+/K+-pump, the hypokalaemia associated with K+ deficiency
favours the binding of digitalis to all cells and increases the risk of intoxication. So a selective
inhibition of the Na+/K+ pumps as induced by intoxication with digitalis glycosides leads to
impairment of K+ uptake into the skeletal muscles. The ensuing hyperkalemia is a typical
finding following an overdose of cardiac glycosides161. A study of 91 patients with digoxin
intoxication showed that those with plasma K+ above 6.2 mM (26%) died162.
Discussion
130/206
Therefore, hypokalemia is commonly found in cardiac patients. As said above, the
hypokalemic status could be enhanced by the direct effect of standard digitalization, and it is
a common adverse effect of HF treatment. A predominant hypokalemic status, that would
significantly increases renal ammonia production and excretion, could explain the
development of a constant acidification of urine as we have observed.
Acid-base disturbances in patients suffering from heart failure and the acidification of urine
Disturbance in acid-base balance is commonly observed in patients with heart failure.
The most common disturbance is metabolic alkalosis combined with hypokalemia, and as
explained above in this section, this situation enhances the acidification of urine.
Compensatory mechanisms, coexistence of independent acid-base disorders and changes in
electrolytes complicate acid-base balance in the individual patients. As acid-base
disturbances have harmful effects on the cardiovascular system, precise diagnosis and
proper treatment are highly important163.
Also, when pulmonary edema develops, carbon dioxide retention occurs, resulting in
respiratory acidosis163, and a decreased tissue oxygen delivery may also produce lethal lactic
acidosis163. Excess ventilation during exercise with accompanying dyspnea is characteristic
of chronic heart failure (CHF), and these patients often exhibit increased minute ventilation
(Ve) relative to the Vco2, depending upon the fall in pH and pCO2, compared with normal
subjects164,165. So patients with CHF at resting conditions are often characterized by high
pCO2 and fall in pH (mainly when pulmonary edema develops). In this context of pulmonary
edema, the acidification of urine at resting conditions would be enhanced, while ventilation
when exercising is increased compared to healthy subjects164.
Cardiac conditions symptoms and acidic urine
The cardinal manifestations of HF are dyspnea and fatigue, which may limit exercise
tolerance, and fluid retention, which may lead to pulmonary congestion and peripheral
Discussion
131/206
edema. Both abnormalities can impair the functional capacity and quality of life of affected
individuals, but they do not necessarily dominate the clinical picture at the same time. Some
patients have exercise intolerance but little evidence of fluid retention, whereas others
complain primarily of edema and report few symptoms of dyspnea or fatigue. Because not all
patients have volume overload at the time of initial or subsequent evaluation, the term “heart
failure” is preferred over the older term “congestive heart failure”166.
Patients perceive different symptoms of heart failure decompensation167, but frequently
presents with shortness of breath with exertion, orthopnea, and paroxysmal nocturnal
dyspnea. For instance, in a recent study, from 371 patients suffering from HF, the dominant
symptom identified was difficulty breathing by 193 (52%) patients, fatigue by 118 (32%), and
abdominal discomfort and swelling each by 30 (8%) patients167. Risk factors for acute
decompensation include high dietary salt intake, medication noncompliance, cardiac
ischemia, dysrhythmias, renal failure, pulmonary emboli, hypertension, and infections168. A
dominant difficulty of breathing in the symptomatology of patients suffering from heart failure
could enhance the acidification of blood due to a decrease excretion of CO2, and this could
make these subjects more suitable to develop constant acidic urine.
Several other studies have shown associations between cardiac diseases and shortness of
breath. For example, obstructive sleep apnea (OSA) has adverse effects on blood pressure,
cardiovascular status, and mortality. Patients who have congestive heart failure have a high
prevalence of sleep-disordered breathing, with OSA occurring in 30% of such patients and
Cheyne-Stokes respiration in 40%169. Also, some patients do not improve or experience rapid
recurrence of symptoms while on standard medication for HF. Refractory heart failure (RHF)
is characterized by marked symptoms at rest or on minimal exertion despite maximal medical
therapy such as rest, sodium restriction, the status of digitalization, and mercurial diuretics170.
It should be added that due to dietary factors (diet poor on vegetables and fruits) related to
the development of the medical conditions for which cardiac glycosides are prescribed, often

Discussion
132/206
aggravated by insufficient potassium intake due to reduced appetite, the relatively low
potassium content in modern food, and together with a low exercise activity, may also
contribute in the enhancement of urine acidification61,171.
Discussion
133/206
DISCUSSION OF RESULTS FOR ANXIOLYTICS
Psycholeptics (mainly the group of anxiolytics) showed a significant association with
having non-constantly acidic urine pH in our study subjects. To date, this is the first study to
report such association, which makes impossible the comparison with other studies. We
discuss below some possible mechanisms to explain our findings that might include from a
direct effect of anxiolytics in the acid-base balance, to a more likely scenario where
anxiolytics use just reflect the underlining effect in urine pH through a hyperventilation
mechanism when present in anxiety disorders for which they are prescribed for.
Most of the anxiolytics reported by our study subjects were benzodiazepine derivatives.
Benzodiazepines are prescribed for short and long-term relief of insomnia, and moderate or
severe anxiety, that frequently are associated with depression. There are many types of
anxiety disorders that include panic disorder, obsessive compulsive disorder, post-traumatic
stress disorder, social anxiety disorder, specific phobias, and generalized anxiety disorder.
The physical effects of anxiety may include heart palpitations, tachycardia, hyperventilation,
muscle weakness and tension, fatigue, nausea, chest pain, shortness of breath, headache,
stomach aches, or tension headaches. As the body prepares to deal with a threat, blood
pressure, heart rate, perspiration, blood flow to the major muscle groups are increased, while
immune and digestive functions are inhibited (the fight or flight response). External signs of
anxiety may include pallor, sweating, trembling, and pupillary dilation. For someone who
suffers anxiety this can lead to a panic attack.
Anxiety disorders and chronic hyperventilation
Regarding the acid-base status of subjects suffering from anxiety disorders, it is
important to highlight the role of chronic hyperventilation, with multiple symptomatology due
to respiratory alkalosis, that is frequently associated with emotional disturbances such as
anxiety, panic and depression172, or with psychosomatic disorders such as irritable bowel,
effort syndrome and chronic pain. A possible explanation for our findings could be that
Discussion
134/206
respiratory alkalosis causes a decrease in the partial pressure of carbon dioxide (pCO2) and
an increase of bicarbonate (HCO3-) renal excretion that would contribute to the alkalinization
of urine in patients suffering from anxiety disorders173.
The literature on “hyperventilation syndrome” suggests that acute hyperventilation rarely
possess diagnostic or therapeutic problems. Chronic hyperventilation, however, with vague
and multiple symptomatology due to respiratory alkalosis and increased breathing work, is
often overlooked or misinterpreted, though it is a very common disorder of the general
patient population174. As said before, chronic hyperventilation is frequently associated with
anxiety, panic and depression. Studies on the pathogenesis of panic disorder (PD) have
concentrated on panic attacks. However, PD runs a chronic or episodic course and panic
patients remain clinically unwell between attacks175. Panic patients chronically hyperventilate,
but the implications of this are unclear. Regarding the relationship between panic,
hyperventilation and anxiety in a chronic status, the literature provides evidences and
hypotheses to have into account and to better predict the acid-base status of individuals
experiencing from these disorders: First, provocation of panic experimentally has indicated
that several biological mechanisms may be involved in the onset of panic symptoms.
Evidence from provocation studies using lactate, but particularly carbon dioxide (CO2)
mixtures, suggests that panic patients may have hypersensitive CO2 chemoreceptors. Klein
proposed that PD may be due to a dysfunctional brain's suffocation alarm and that panic
patients hyperventilate to keep pCO2 low. Second, studies of panic patients in the non-panic
state have shown EEG (electroencephalograph) abnormalities in this patient group, as well
as abnormalities in cerebral blood flow and cerebral glucose metabolism. These
abnormalities can be interpreted as signs of cerebral hypoxia that may have resulted from
hyperventilation. Third, cerebral hypoxia is probably involved in the causation of symptoms of
anxiety in sufferers of chronic obstructive pulmonary diseases. By chronically
hyperventilating, panic patients may likewise be at risk of exposure to prolonged periods of
cerebral hypoxia which, in turn, may contribute to the chronicity of their panic and anxiety
Discussion
135/206
symptoms. Fourth, chronic hyperventilation may engender a self-perpetuating mechanism
within the pathophysiology of PD, a hypothesis which warrants further studies of panic
patients in the non-panic state.
The level of a hyperventilation is thought to be higher among patients suffering from PD.
Some findings lend support to a group of studies showing differences in respiratory function
between panic disorder and other anxiety disorders populations, providing preliminary
support for the presence of a distinct "hyperventilation subtype" of panic disorder176.
Hyperventilation (i.e. CO2 exhalation in excess of metabolic demands) has been proposed as
being either an etiologic177 or a specific associated feature of panic disorder (PD)178. Several
studies comparing resting end-tidal CO2 (EtCO2) levels between PD patients and normal
controls (NC) have documented significant differences179-181, and recent findings seem to
suggest a respiratory preparedness for stress (ie, bronchodilation) in PD patients182.
However, it has been argued that low EtCO2 in panic patients may only reflect the profound
distress of an anxiety condition rather than being specific to panic disorder per se. For
example, psychological distress is known to produce increases in respiration rate183. More
recent studies have looked at EtCO2 levels in PD patients vs. other anxiety disorder patients.
De Ruiter et al.184 failed to find significant differences between groups of PD and generalized
anxiety disorder (GAD) patients, during either: rest, hyperventilation, exercise, or CO2
inhalation conditions. However, no measures of subjective distress were taken, thus making
the similarities difficult to interpret. Holt and Andrews185 found their sample of PD patients to
have higher baseline levels of anxiety than their comparison groups of social phobics, GAD
patients, and NCs, but found no differences in EtCO2. The authors concluded that their
baseline EtCO2 data may have been atypical. Thus, the issue of general distress resulting in
increased ventilation rate, vs. the specific role of hyperventilation in panic disorder remains a
controversial point. A study better addressed the results of such differences176, where
seventeen panic disorder patients (PD), 18 patients with generalized anxiety disorder (GAD),
and 20 normal control (NC) subjects were administered a psychophysiological evaluation
Discussion
136/206
composed of baseline, stressor, and recovery phases. Panic patients were measured for the
severity of respiratory symptoms during panic attacks. End-tidal CO2 (EtCO2) and
respiration rate were measured throughout the psychophysiological evaluation. The results
show that PDs demonstrated significantly lower baseline EtCO2 levels than the GADs and
NCs, in spite of being equivalent to GADs on baseline anxiety levels. Moreover, panic
patients reporting a high level of respiratory symptoms during panic attacks seemed to
account for the bulk of observed differences. A more recent study summarizes new findings
concerning the respiratory subtype (RS) of panic disorder (PD) since its first description,
where some characteristics, such as the increased sensitivity to CO2 and the higher familial
history of PD, clearly distinguish the RS from the non-RS. Nevertheless, there are also
controversial findings that need future researh186.
Explanations for the discrepancy in findings regarding resting measures of respiratory
function in panic disorder have generally taken two forms. First is the proposal that a biased
population sampling resulted in panic group compositions that were either high or low in
respiration-related processes187. Based on this suggestion, it is possible that a
hyperventilation subtype of panic disorder may exist, and the question then becomes one of
differentiating the subtypes. For example, we mentioned before that Klein188 proposed a
"suffocation alarm theory" of panic attack that suggests two classes of patients with panic
disorder: a) individuals who report intense breathing difficulty during panic, and b) individuals
who report little or no breathing difficulty during panic. There are no published studies
delineating methods on how to classify individuals who panic into the categories suggested
by Klein, although one such method may be to use the self-reported incidence of respiratory
symptoms during panic on standardized psychometric instruments (e.g., the Panic Symptom
Report)189. A second proposal for the contradictory findings of past research is that panic and
anxiety comparison groups have not been equated for, or otherwise controlled for baseline
levels of anxiety. It is possible that higher arousal levels in panic subjects are responsible for
Discussion
137/206
measured differences in respiratory function, rather than factors specific to panic disorder per
se187,190.
The role of pCO2 in anxiety disorders
Results of most studies provide some controversial findings by measured differences
in respiratory function, as controversial EtCO2 levels in PD or differences in respiratory
pattern between GAD and PD, where several mechanisms are involved in the onset of
symptoms. Some hypothesis suggest that panic patients may have hypersensitive CO2
chemoreceptors, (dysfunctional brain´s suffocation alarm in panic patients that trigger
hyperventilation to keep pCO2 low), or/and a hyperventilation subtype that need future
research. It is important to understand whether blood carbon dioxide (pCO2) levels generally
vary inversely with minute volume. For example, a person with increased minute volume (e.g.
due to hyperventilation) should demonstrate a lower blood carbon dioxide level. Although
minute ventilation (VE) is easily measured, it does not provide sufficient information for
assessing the adequacy of alveolar ventilation (VA), the component that affects gas
exchange. The tidal volume and the respiratory rate do not give any clue as to how much air
is ventilating dead space vs. alveolar space. Even if dead space ventilation (VD) and VA
were measurable, the measurements would not indicate how much carbon dioxide was being
produced in the body or how much VA was necessary to eliminate the carbon dioxide
production. Low pCO2 (hypocapnia) defines a state of hyperventilation. It has to be clear that
someone who is breathing fast and deep may be hyperventilating in the physiologic sense
(i.e., has a low pCO2) but then again may also be hypoventilating (has a high pCO2). The
latter could come about if most of the minute ventilation were going to dead space with very
little left over for VA (this situation may arise in severe chronic obstructive pulmonary disease
when there is a large amount of dead space from ventilation-perfusion imbalance).
Intracellular pH is strictly regulated in brain cells, and also marginal aberration of H+
concentration may cause big functional deviation in neurons191. Carbon dioxide concentration
Discussion
138/206
is one of the most important factors which influence the intra- and extracellular pH, because
CO2 is extremely diffusible and in this way we can rapidly send or extract H+ ions to or from
all tissues, all cells (nearly the same time) drawing breath rarely or frequently. CO2 passes
very quickly through the cell membranes and it forms carbonic acid with H2O which gives H+
ions. On the other hand ions get slowly through membranes, even H+-ion itself. That is
because they have electric charge and become hydrated, and this multiplies their radius, but
CO2 does not have either of them and it is soluble in lipids.
If we take our breath deeply or frequently our pulse speeds up proving that CO2 has left the
pacemaker cells of heart, and the alkalic cytoplasm allowes Ca2+ to enter in the cytosol. If we
keep on this kind of breathing for a long time, our pulse will slowly come back to the incipient
frequency because the organism compensates the alteration of pH in the cytosol. The lack of
H+ in cytosol increases conductance of Ca2+ and some other ions192, thus it increases
contraction, metabolism and O2 requirement193, and also increases excitability of neurons in
the peripherium and in the brain194. All these events can be explained by the simple fact that
lack of H+ (=alkalosis) increases transmembrane conductance of ions and (consequently)
increases active ion-pumping mechanisms too (because the original ion-status has to be
restored).
Alteration of carbon dioxide concentration can appear in the whole organism at the same
time. If it endures for a long time (several hours to one week), the organism starts to
“compensate”. Stability of extra- and intracellular pH is of high priority. Renal function and
tissular buffer mechanisms (mostly) restore the pH in the cytosol of the cells and in the
extracellular space, but the concentration of other ions is altered in the cytosol at the same
time. The development of the new ionmilieu needs 5-7 days195. Then chronic hypocapnia or
hypercapnia is followed by cascades which alter the whole ionmileu in the cells, they may
alter even the neurotransmitter/endocrine status196. The fact that intracellular pH is very
strictly regulated does not mean it cannot go wrong. It seems like human is a specie
especially endangered by the long-term alteration of carbon dioxide level. This is because
Discussion
139/206
he/she becomes hypo- or hypercapnic not only because of organic diseases, but of mental
disorders too, and – most importantly — because of his/her behaviour. The last one is
dangerous, because it may cause diseases of civilization. It is frequently asserted that it is
the “stress of life” itself that causes diseases of civilization (induced by “stress-hormones”)197.
In stress situations wild animals behave according to their instincts. The main behaviour is –
according to Cannon – the “fight or flight” response, which is a hyperarousal condition. In this
acute stress there is a strong catecholamine (adrenaline, noradrenaline) rush and an acute
hypocapnia as well. Wild animals during this hyperarousal condition will fight or flee, they
take physical exercise, and this physical activity/muscle-work results in increased carbon
dioxide production – this way they get a good chance to restore the decreased carbon
dioxide level. Contrarily human acute stress response mostly differs from that because of
their learnt behaviour. They mostly restrain their temper, the physical activity will fail and the
hyperventilation/hypocapnia endures long causing a range of ion-movements through
membranes and causing metabolic and endocrine alterations and illnesses because of the
alteration of “milieu interieur”. Namely, diseases of civilization are caused by the distress
evoked by the lack of instinctive reaction to stress. Nowadays some researchers start to
discover the theoretical significance of hyperventilation in stress induced illnesses198.
According to Tenney there is a feedback mechanism between carbon dioxide level and
catecholamine output of the organism199. In alkalosis condition catecholamine responsibility
and sympathicotonia increases (although catecholamine output slightly decreases)198-200.
Catecholamines, e.g. noradrenaline increase the Na+/H+ exchange in the cells201 that causes
alkalosis in the cytosol, similarly to the effect of hypocapnia. These catecholamines take
effect (at least partly) through causing intracellular alkalosis202. Cannon’s “fight or flight”
response means a strong sympathicotonia/ hyperarousal, because both catecholaminemia
and hyperventilation cause alkalosis in the cytosol.
Decreased H+ concentration (intracellular alkalosis, i.e. decreasing carbon dioxide
concentration in the case of acute hyperventilation) increases transmembrane Ca2+
Discussion
140/206
conductance, thus increases the amount of Ca2+ entering into the cytosol191. Catecholamines
activate the Na+/H+ exchange mechanism, causing intracellular alkalosis as well. Therefore
everything that decreases the concentration of intracellular (cytosolic) Ca2+ and/or H+
concentration — in resting/ basal state of cells — increases the Ca2+-conductance in neurons
and the excitability. H+ seems to be the most important ion which modifies Ca2+-conductance,
it can be considered a modifier of second messenger Ca2+. E.g. intracellular alkalosis, acute
hypocapnia, thyroxin and catecholamines increase arousal. Very simply written: the amount
of Ca2+ entering into the cytosol determines how strong the response is given by the neuron
(e.g. during neurotransmitter release)196,203. Ca2+ enters the cytosol partly through the plasma
membrane as a result of action potential, partly from the intracellular organelles (from
sacroplasmic reticulums and mitochondria). The bigger the Ca2+ extracytosolic/intracytosolic
(EC/IC) chemical potential is, the larger amount of Ca2+ will enter into the cytosol. That is why
Ca2+ pumping mechanisms (which need ATP energy) have great importance.
Panic attack is coursing with a cascade of events where hyperventilation has different roles
in different times. Chronic hyperventilation is probably a precondition of (respiratory subtype)
panic attack202. Chronic hyperventilation can be generated by either organic diseases (e.g.
asthma bronchiale) or mental conditions (e.g. sighing or crying for a tragedy).
Compensational mechanisms set off metabolic acidosis that neutralizes hyperventilational
alkalosis, this compensational process last at least for a week. In the state of compensated
hypocapnic alkalosis extra- and intracellular pH stays in the normal range. The depressed
pCO2 level starts to go up to the normal level (or slightly higher) before the attack. The
elevating carbon dioxide promptly diffuses into cells and causes acidosis, which increases
catecholamine release from different cells (e.g. noradrenaline release from locus
coeruleus)204. On the other hand, elevating carbon dioxide level also evokes acute
hyperventilation (through a brainstem reflex), which may be more vigorous than previously.
At this point hypercatecholaminemia (induced by previous acidosis) and alkalosis (abruptly
decreasing pCO2 level) evolve at the same time. Alkalosis multiplies CNS-responsiveness to
Discussion
141/206
catecholamine levels, and it lasts for several minutes to break down catecholemines. This
coexistence means an intense sympathicotonia, a very high arousal (panic attack).
According to this panic theory intra- and extracellular pH is thoroughly compensated before
the attack, but the acidosis would be overcompensated by acute hypocapnic alkalosis during
the attack. The main problem is that the different compensational mechanisms work out at
different rates. Carbon dioxide level can change in the whole organism in a few seconds, the
elimination of catecholamines lasts for several minutes, and the clearing of blood from
metabolic (“titratable”) acidity takes at least one week. This is one of the many reasons there
is no perfect compensational mechanism.
Acute and chronic hyperventilation may cause alterations and symptoms in almost any
organs, not only in the CNS193,205. GAD (generalized anxiety disorder) is pathogenetically
also like PD, but with important differences. pCO2 level shows great variability in PD (mainly
in the hypocapnic range), but it seems to be around the normal level in case of GAD
patients206. Respiration is extremely unstable and irregular in PD. Respiratory variability in
GAD is lower than in PD, though it is higher than physiologically. Alteration of pCO2 level
makes catecholamine levels fluctuate because of altering pH. Actual catecholamine levels
interfere with actual pCO2 levels, which results in arousal alterations (like PD). Namely both
pCO2 and catecholamine levels are fluctuating but with different rates – their effects on
arousal sometimes added together. Changes of carbon dioxide and catecholamine level may
affect on most neurons similarly. Neurons in the brain are working together. Those neurons
linked to each other in a row are able to multiply both hypo- and hyperarousal.
It has been supposed that there is a fluctuating pCO2 level slightly around the normal values
at GAD patients. Intracellular pCO2/pH and catecholamine level would keep changing
permanently, causing more or less arousal than in the healthy controls. That is why arousal
fluctuates permanently, even dysthymia can arise207. It has been argued that every
hyperarousal condition involves hypoarousal periods too. One of the reasons for this may be
that pH elevation (and pCO2 decrease) is predominant and has to be corrected from time to
Discussion
142/206
time (cytosolic pH is limited in a narrow range even in pathological conditions). This
hypothetic situation is compatible with our observed results on the association between use
of anxiolytics and development of not constantly acidic urine pH.
GAD means permanently fluctuating ventilation and altering arousal, which hypo- and
hyperarousal conditions affect each other and may cause vicious circles through
psychogenic mechanisms. This fluent alteration may result in depression and/or
psychosomatic disorders.
Effects of psycholeptics in the Respiratory system
Regarding the effect of these psycholeptics, aside of their sedative effects,
barbiturates and benzodiazepines are also known to have respiratory depressant effects.
Differing effects of the anxiolytic agent buspirone and diazepam on control of breathing have
been elucidated in few studies208,209. These studies compared ventilatory effects of the
nonsedating anxiolytic buspirone with those of the sedating anxiolytic diazepam. Diazepam
had no effect on resting ventilation but depressed response to CO2. In summary, buspirone
did not cause the depression of respiratory center chemosensitivity that was seen with
diazepam and produced less depression of load compensation in normal subjects. Changes
in respiratory pattern and arterial pCO2 after three repeated intravenous sedative doses of
midazolam 0.05 mg/kg or diazepam 0.15 mg/kg were shown in eight healthy male volunteers
in a randomized double-blind crossover design in other study210. Both drugs caused equal
changes in breathing pattern with a decrease in tidal volume, an increase in respiratory rate
and unaltered minute ventilation. These alterations in breathing pattern were associated with
CO2 retention. Despite increased plasma drug concentrations, subsequent doses did not
cause further changes in respiratory variables except for an increase in pCO2 after the
second dose of midazolam.
To conclude this section, to explain our observed association between use of psycholeptics
(mostly anxiolytics) and non-acidic urine, we believe there is a major explanation available:
Discussion
143/206
the development of a low blood pCO2 due to a predominant hyperventilation status on
patients suffering from anxiety disorders. This would normally drive to a respiratory alkalosis,
which would enhance the alkalinization of the urine. This mechanism would have a stronger
impact in urine pH than the direct effect of anxiolytics as depressants of the respiratory
system.
Discussion
144/206
DISCUSSION OF RESULTS FOR DRUGS FOR THE RESPIRATORY SYSTEM
Finally, drugs acting on the respiratory system were found to have a significant
association with not having acidification of urine, with a suggestion of a specific association
among users of drugs for obstructive airway diseases. Again, no specific studies are
available in the literature on the role of respiratory drugs and consistently acidic urine pH. We
discuss in the sections below the biologic mechanisms that would explain our findings,
triggered by the medication itself, or by the disease for which they are prescribed for.
Chronic obstructive pulmonary disease (COPD) is the occurrence of chronic bronchitis or
emphysema, a pair of commonly co-existing diseases of the lungs in which the airways
narrow over time. This limits airflow to and from the lungs, causing shortness of breath
(dyspnea). In clinical practice, COPD is defined by its characteristically low airflow on lung
function tests. In contrast to asthma, this limitation is poorly reversible and usually gets
increasingly worse over time.
Chronic bronchitis and asthma treatments: the effect of the ATC group of “drugs for obstructive airways diseases” on urine pH
Chronic bronchitis, a type of chronic obstructive pulmonary disease, is defined by a
productive cough that lasts greater than three months each year for at least two years in the
absence of other underlying disease. Symptoms of chronic bronchitis may include wheezing
and shortness of breath, especially upon exertion and low oxygen saturations. The cough is
often worse soon after awakening and the sputum produced may have a yellow or green
color and may be streaked with specks of blood. Chronic bronchitis is treated
symptomatically and may be treated in a nonpharmacologic manner or with pharmacologic
therapeutic agents. Typical nonpharmacologic approaches to the management of COPD
including bronchitis may include: pulmonary rehabilitation, lung volume reduction surgery,
and lung transplantation. Inflammation and edema of the respiratory epithelium may be
Discussion
145/206
reduced with inhaled corticosteroids. Wheezing and shortness of breath can be treated by
reducing bronchospasm (reversible narrowing of smaller bronchi due to constriction of the
smooth muscle) with bronchodilators such as inhaled long acting β2-adrenergic receptor
agonists (e.g., salmeterol) and inhaled anticholinergics such as ipratropium bromide or
tiotropium bromide. Mucolytics (also known as expectorants) may have a small therapeutic
effect on acute exacerbations of chronic bronchitis.
Asthma is the most common reason for presenting to emergencies with shortness of breath.
It is the most common lung disease in both developing and developed countries affecting
about 5% of the population. Other symptoms include wheezing, tightness in the chest, and a
non productive cough211. Medications used to treat asthma are divided into two general
classes: quick-relief medications used to treat acute symptoms; and long-term control
medications used to prevent further exacerbation. Fast–acting: short-acting beta2-
adrenoceptor agonists (SABA), such as salbutamol are the first line treatment for asthma
symptoms. Anticholinergic medications, such as ipratropium bromide, provide additional
benefit when used in combination with SABA in those with moderate or severe symptoms.
Anticholinergic bronchodilators can also be used if a person cannot tolerate a SABA. Long–
term control: corticosteroids are generally considered the most effective treatment available
for long-term control. Inhaled forms are usually used except in the case of severe persistent
disease, in which oral corticosteroids may be needed. Long-acting beta-adrenoceptor
agonists (LABA) such as salmeterol and formoterol can improve asthma control, at least in
adults, when given in combination with inhaled corticosteroids. Leukotriene antagonists may
be used in addition to inhaled corticosteroids, typically also in conjunction with LABA.
Evidence is insufficient to support use in acute exacerbations. External factors can influence
on how severe asthma responds to medical treatment, though the mechanisms are not fully
understood212.
Drugs used in the respiratory system, such as ATC group of “drugs for obstructive airways
diseases”, improve lung function in patients with lung diseases, such as asthma, emphysema
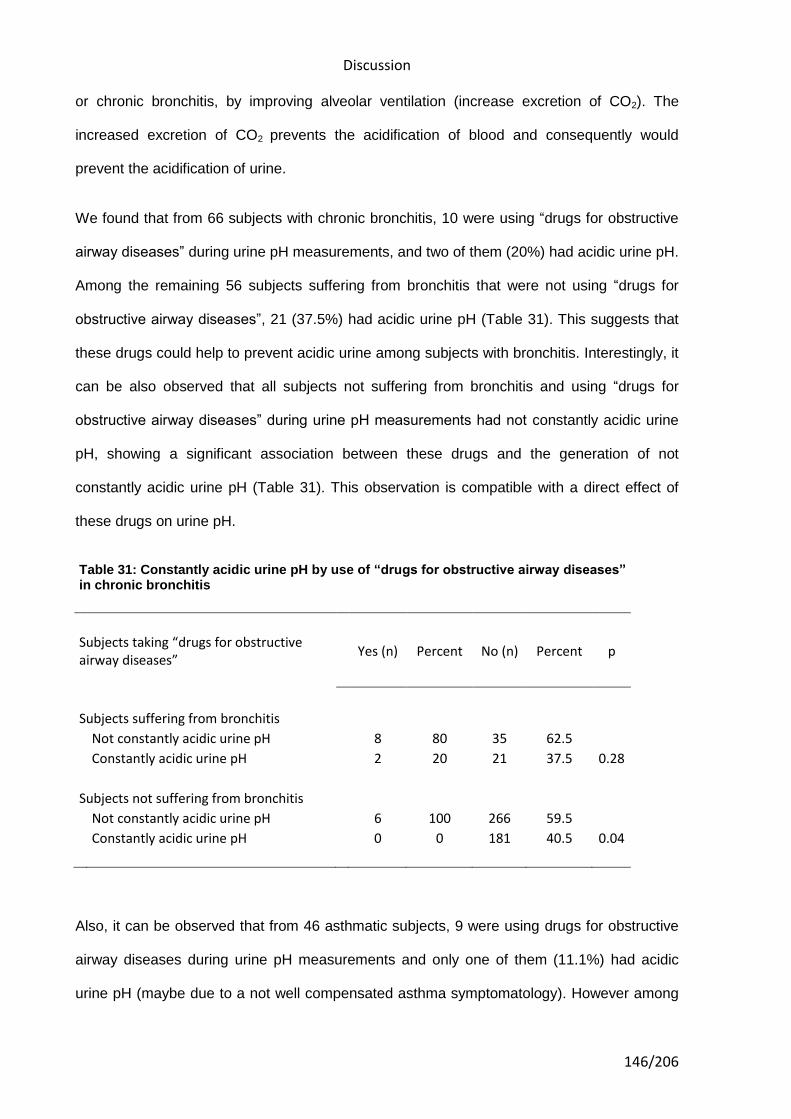
Discussion
146/206
or chronic bronchitis, by improving alveolar ventilation (increase excretion of CO2). The
increased excretion of CO2 prevents the acidification of blood and consequently would
prevent the acidification of urine.
We found that from 66 subjects with chronic bronchitis, 10 were using “drugs for obstructive
airway diseases” during urine pH measurements, and two of them (20%) had acidic urine pH.
Among the remaining 56 subjects suffering from bronchitis that were not using “drugs for
obstructive airway diseases”, 21 (37.5%) had acidic urine pH (Table 31). This suggests that
these drugs could help to prevent acidic urine among subjects with bronchitis. Interestingly, it
can be also observed that all subjects not suffering from bronchitis and using “drugs for
obstructive airway diseases” during urine pH measurements had not constantly acidic urine
pH, showing a significant association between these drugs and the generation of not
constantly acidic urine pH (Table 31). This observation is compatible with a direct effect of
these drugs on urine pH.
Table 31: Constantly acidic urine pH by use of “drugs for obstructive airway diseases” in chronic bronchitis
Subjects taking “drugs for obstructive airway diseases”
Yes (n) Percent No (n) Percent p
Subjects suffering from bronchitis
Not constantly acidic urine pH
8 80 35 62.5
Constantly acidic urine pH
2 20 21 37.5 0.28
Subjects not suffering from bronchitis
Not constantly acidic urine pH
6 100 266 59.5
Constantly acidic urine pH
0 0 181 40.5 0.04
Also, it can be observed that from 46 asthmatic subjects, 9 were using drugs for obstructive
airway diseases during urine pH measurements and only one of them (11.1%) had acidic
urine pH (maybe due to a not well compensated asthma symptomatology). However among
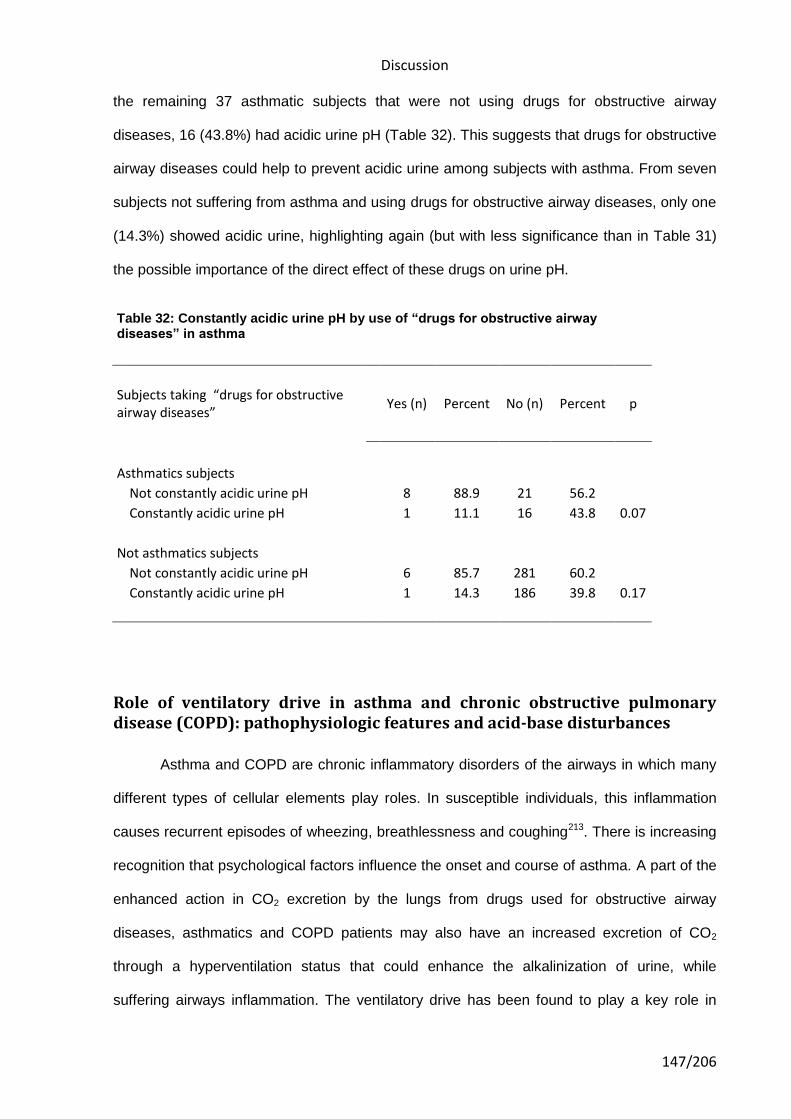
Discussion
147/206
the remaining 37 asthmatic subjects that were not using drugs for obstructive airway
diseases, 16 (43.8%) had acidic urine pH (Table 32). This suggests that drugs for obstructive
airway diseases could help to prevent acidic urine among subjects with asthma. From seven
subjects not suffering from asthma and using drugs for obstructive airway diseases, only one
(14.3%) showed acidic urine, highlighting again (but with less significance than in Table 31)
the possible importance of the direct effect of these drugs on urine pH.
Table 32: Constantly acidic urine pH by use of “drugs for obstructive airway diseases” in asthma
Subjects taking “drugs for obstructive airway diseases”
Yes (n) Percent No (n) Percent p
Asthmatics subjects
Not constantly acidic urine pH
8 88.9 21 56.2
Constantly acidic urine pH
1 11.1 16 43.8 0.07
Not asthmatics subjects
Not constantly acidic urine pH
6 85.7 281 60.2
Constantly acidic urine pH
1 14.3 186 39.8 0.17
Role of ventilatory drive in asthma and chronic obstructive pulmonary disease (COPD): pathophysiologic features and acid-base disturbances
Asthma and COPD are chronic inflammatory disorders of the airways in which many
different types of cellular elements play roles. In susceptible individuals, this inflammation
causes recurrent episodes of wheezing, breathlessness and coughing213. There is increasing
recognition that psychological factors influence the onset and course of asthma. A part of the
enhanced action in CO2 excretion by the lungs from drugs used for obstructive airway
diseases, asthmatics and COPD patients may also have an increased excretion of CO2
through a hyperventilation status that could enhance the alkalinization of urine, while
suffering airways inflammation. The ventilatory drive has been found to play a key role in
Discussion
148/206
determining the severity of asthma and COPD214. The ventilatory drive is affected by several
factors such as chemosensitivity, basal arterial oxygen or carbon dioxide tension, mechanical
impedance, and respiratory muscle dysfunction.
The response of asthmatic airways to irritant stimuli is twofold: bronchoconstriction and
airway inflammation215. The inevitable mechanical consequence of bronchoconstriction is
hyperinflation of the lungs, a phenomenon that helps to maintain airway patency at the
expense of increased respiratory muscle work. On the other hand, breathing at high lung
volumes requires marked increases in respiratory muscle work, which increases the patient's
sensation of dyspnea216. Blunted ventilatory drive or a decrease in the perception of dyspnea
in bronchial asthma and chronic obstructive pulmonary disease (COPD) could lead to a
decrease in the alarm reaction to dangerous situations such as severe airway obstruction,
severe hypoxemia, or severe hypercapnia214 (and consequently blood acidification).
Metabolic acidosis is a common finding in acute severe asthma, and suggest that the
pathogenesis of lactic acidosis is multifactorial and includes contributions from lactate
production by respiratory muscles, tissue hypoxia, and intracellular alkalosis217. The
ventilatory drive to chemical stimuli can be altered by a beta-2-agonist, oxygen
administration; and lung volume reduction and an increased dyspnea sensation may be
improved by corticosteroid, chest wall vibration, or lung volume reduction. When
hyperinflation is severe enough and persists long enough, the respiratory muscles may
fatigue. In asthma, fatigue is likely accelerated by hypercapnia (if present), hypoxemia and
reduced blood flow in muscles that are working at a mechanical disadvantage when
shortened to below their optimal length by thoracic overinflation218,219. Physical signs of
respiratory muscle fatigue are easily elicited: the respiratory rate increases, alternation
between abdominal and rib cage breathing (respiratory alternans) occurs, and paradoxical
diaphragmatic movement can be detected by palpation over the upper part of the
abdomen220. These physical signs may precede the development of overt respiratory failure
and give warning of impending respiratory arrest.
Discussion
149/206
Aside from hyperinflation, another important consequence of airway inflammation in asthma
is modification of the ventilatory drive. Patients suffering from asthma can develop different
acid base disturbances, where a low partial pressure of carbon dioxide (pCO2) is far more
common than a high pCO2, even in the presence of severe airways obstruction215,221.
A study examined the clinical features, arterial blood gases, and acid-base profile in 229
consecutive episodes of acute asthma in 170 patients who required hospitalization217. A
simple respiratory alkalosis was the most common acid-base disturbance, occurring in 48
percent of the episodes. Metabolic acidosis, either alone or as part of a mixed disturbance,
was noted in 28 percent of them. Of 60 episodes presenting with respiratory acidosis, 37 (62
percent) had a coexistent metabolic acidosis. Most episodes of asthma are characterized by
alveolar hyperventilation and intense dyspnea; hypoventilation along with hypercapnia
occurs so rarely that it is regarded by the clinician as a grave prognostic sign215.
Relationship between asthma and anxiety disorders
From our results we might elucidate that changes in the breathing patterns on
patients suffering from asthma and anxiety could be a key factor in the development of a
determinate acid base status, including the effect of medication. In our study subjects a
predominant alkaline status is associated with the use of drugs for obstructive airway
diseases and anxiolytics. The relationship between asthma and anxiety is well-established.
Symptoms, such as respiratory discomfort, are highly common in both panic disorder and in
asthma. Previous cross-sectional community-based studies have provided evidence for a
relatively specific association between the prevalence of asthma and panic disorder222,223.
Chronic hyperventilation is probably a precondition of (respiratory subtype) panic attack202.
Both anxiety and depression are known to influence the quality of life in asthmatics, and both
put stress on the health care system224. A previous longitudinal study showed that asthma
increases the risk of panic, anxiety, and depression223. More complex models have described
asthma as an organic disease that is highly vulnerable to psychological influences225,226.
Discussion
150/206
Mood disorders were identified in 53% of asthmatic patients and in 34.9% of non-
asthmatics227. There is evidence that breathing retraining improves the clinical control of
asthma symptoms, anxiety symptoms, and the health-related quality of life in asthmatics228.
Since the introduction of medical therapy for asthma the interest in non-medical treatments
has been deteriorated. Physiotherapy could have beneficial effects in asthmatics. A recent
study investigates the effectiveness of physiotherapy in the treatment of patients with
asthma229. A review was performed on the terms breathing exercises (BE), inspiratory
muscle training (IMT), physical training (PhT) and airway clearance (AC) in patients with
asthma. They concluded that BE may improve disease specific quality of life; reduce
symptoms, hyperventilation, anxiety and depression, lower respiratory rate and medication
use. IMT can improve inspiratory pressure and may reduce medication use and symptoms.
PhT can reduce symptoms, improve quality of life and improve cardiopulmonary endurance
and fitness.
Discussion
151/206
STRENGTHS
Data collection for this report has been taken from a case-control study on bladder
cancer. The association between medications with the generation of acidic or non-acidic
urine pH has been performed on control subjects of the case-control study to increase
internal and external validity. The control group is probably unbiased as the case control
study has confirmed all the associations that were expected.
To date, this is the first study on medication use and its influence on urine pH in humans.
A single pH measurement from a regular AM spot urine sample cannot be used to identify
individuals with constantly acidic pH230. In a previous study we showed that only 25% of the
subjects with an acidic AM spot urine sample from a given day had acidic levels throughout a
week, and that to capture day-to-day urine pH variability, measuring urine pH with pH strips
twice a day (first void in the morning and early in the evening) during four consecutive days
classified most people in the same way as recording measurements during six and a half
consecutive days230.
Dietary factors like vegetable and fruit intake have been shown to influence urine pH in the
literature. Some of the diseases (e.g., heart congestive disease and anxiety related
disorders) for which the drugs studied are prescribed might influence the dietary intake of the
patients. Hence, there was a potential for confounding due to dietary intake, which we have
addressed by including daily grams of vegetables, daily grams of fruits and daily grams of
meat intake in the multivariate models.
Adjustment for factors that could potentially influence urine pH, including height and
weight61,63, as well as for age, sex, study region, and vitamin C use, were taken into account
on our results.
Discussion
152/206
LIMITATIONS
However, some limitations of our study should also be mentioned. The possible
impact of changes on medications while patients were hospitalized, treatment duration or a
possible wide range of therapeutic doses used for the different patients on each medication,
and incomplete/mistaken reporting were not taken into account in our analyses.
Also, the cross-sectional nature of the analyses demands caution with respect to assign
causality to our findings. Both, pH measurements and drug intake information were recorded
at the same time.
The average age of our study population was over 60, and the educational level was low,
which may cause some errors in the pH measurements and drugs reporting. However, we
believe that such bias would be independent of having acidic urine pH, and would be non-
differential, and would tend to dilute the magnitude of the associations reported, but would
not invalidate the associations reported.
We should be cautious in the interpretation of the associations based on low number of
subjects, even if the associations were statistically significant. In these situations the
statistical power of our analysis was low. Also, a small change in the number of subjects
using a given medication might have an important impact on the risk estimators of the
statistical model.
Another limitation relates to the high number of comparisons made in our study; thus, we
cannot rule out that some of the associations were spurious or due to chance (i.e., false-
positive associations).
Discussion
153/206
IMPLICATIONS
Several biological processes developing changes in human pH homeostasis, like
increases or decreases in respiratory ventilation, can be triggered by either medications,
medical conditions the drugs are prescribed for, or/and the interaction between them in the
course of disease . If the impact of these medications on urine pH is important we would
expect to find associations between these medications and the diseases where urine pH
might play an important causal role, as bladder cancer and kidney stones. And one could
also observe confounded associations between the medical conditions the drugs are
prescribed for, and diseases where urine pH is relevant.
Reviewing the role of pCO2 in different neuropsychiatric disorders looking to better
understand the acid base balance expected on each disease, we think that the role of pCO2
could be a key factor to predict differences in acid base status of individuals suffering from
anxiety disorders, though it is an important link between psyche and corpus. Under our point
of view, current anxiety disorders treatment should add physiotherapy, education in stress
recognition and the inclusion of stress-prevention habits (daily mild exercise, control of
breathing, etc). Improving a chronic hyperventilation status may prevent or minimize the
cascades of mechanism involved in the development of either hyper- or hypoarousal
conditions and so to prevent progression of the anxiety disorder to either panic attacks or
depression (also to dysthymia), and/or psychosomatic disorders.
Phenobarbital (PB), a barbiturate, is the most widely used anticonvulsant worldwide, and the
oldest still commonly used. PB has also sedative and hypnotic properties but, as with other
barbiturates, has been superseded by the benzodiazepines for these indications. Some
studies have showed that PB was negatively associated with bladder cancer risk, proposing
that PB use protects against bladder cancer by inducing enzymes that participate in the
detoxification of human bladder carcinogens, such as the aminobiphenyls and
naphthylamines, which are found in cigarette smoke231,232. In acidic urine pH conditions liver-
Discussion
154/206
synthesized N-Glucuronides of aromatic amines from cigarette smoking excreted into the
urinary bladder are rapidly hydrolyzed leading to the formation of their corresponding
arylamines, which can then undergo further metabolism to form DNA adducts127,128. We
suggest that PB use could be associated with the generation of non acidic urine pH and that
this can be a key factor on its bladder cancer protection. Further studies should be done to
assess PB use influence on urine pH levels. We did not analyze the association between PB
and urine pH since there were too few subjects reporting PB intake among our study
population.
Some publications have assessed the association between asthma, hay fever, or other
allergy-related diseases and cancer that have reported a protective association for glioma,
colorectal cancer, cancer of the larynx, non-Hodgkin lymphoma, cancer of the esophagus,
oral cancer, pancreatic cancer, stomach cancer, and uterine body cancer; and an increased
risk for bladder cancer, lymphoma, myeloma, and prostate cancer233. The suggested
mechanisms to explain these associations are usually related to the immune system.
However, for bladder cancer, we propose that a plausible mechanism would be the
relationship between acute severe asthma exacerbation and acidic urine pH, which could be
confounded by the use of medications to relieve obstructive airway diseases.
Also, in several studies N-acetylcysteine (NAC) has been described to be a way to prevent
cystine and calcium oxalate renal stone formation (more easily formed in acidic urine) and
recurrence234, and also to be an alkaline agent used to dissolve cystine calculi235. In addition,
NAC has been described to inhibit proliferation, adhesion, migration and invasion of human
bladder cancer cells236,237. We did not analyze its association with urine pH since there were
too few subjects reporting NAC intake among our study population. However, NAC is
included in the ATC group of “cold and cough preparations”, which in our results showed a
suggested association with not developing acidic urine among our study subjects. In the
literature, we found recent studies suggesting that the protective effects of NAC (against
kidney and lung injury) were attributable to the decrease in oxidative stress238. The effect of
Discussion
155/206
NAC and other antioxidants in central carbon dioxide chemoreception, by augmenting the
tidal volume, showed an increase in the sensitivity of the ventilatory response to carbon
dioxide, either during unloaded breathing or after resistive breathing239. This improvement on
the ventilatory response to carbon dioxide could be a relevant factor in the proved protective
role of NAC in kidney stones and bladder cancer. This protection is mediated by preventing
the acidification of blood and consequently of urine in subjects suffering a hypoventilation
status (decreased excretion of CO2) from lung diseases or other causes.
Further studies are warranted for a better understanding on how medications involved in
biological processes changing pH homeostasis, and drug interaction with disease conditions,
are associated with urine pH levels. Identification of the generation of constantly acidic urine
pH in subjects taking some medications could enhance to improve treatments and
prophylaxis in patients with bladder cancer, kidney stones and other diseases, including
dietary counselling.
Future lines of research could include reproduction of our study results in another study
population to check the accordance with the associations found on our results. More specific
study designs to explore the associations between medication use and urine pH in medical
conditions as anxiety disorders, cardiac conditions or COPD (including asthma), could be
also relevant to support our findings.
It could be also interesting to explore the associations between medication use and medical
conditions/diseases where urine pH had been reported or suggested to influence on its
development (i.e., bladder cancer, kidney stones or osteoporosis); or to study the
associations between these pH influenced conditions/diseases mentioned above and anxiety
disorders, cardiac conditions or COPD (including asthma) suggested on our conclusions to
possibly influence in the generation or non-generation of constantly acidic urine pH.

156/206

157/206
7. Conclusions

158/206
Conclusions
159/206
7. CONCLUSIONS
1. The use of cardiac glycosides was found to have a significant association with
having constantly acidic urine pH in our study population.
2. The use of drugs acting on respiratory system was found to have a significant
association with not having constantly acidic urine pH in our study population.
3. The use of anxiolytics was found to have a significant association with not having
constantly acidic urine pH in our study population.
4. The association between cardiac glycosides with having constantly acidic urine pH
could be explained by both: the effect of the underlying cardiac diseases for which these
drugs are prescribed for, and by the direct effect from such drugs on urine pH.
5. The association between anxiolytics with not having constantly acidic urine pH
would most likely represents the effect of the hyperventilation generated from the
underline anxiety disorder for which these drugs are prescribed, rather than a direct effect
from such drugs on urine pH.
6. The association between drugs used in the respiratory system and not having
constantly acidic urine pH could be explained by some states of chronic airway diseases,
and by the direct effect from these drugs on urine pH.

160/206

161/206
8. Bibliography

162/206
Bibliography
163/206
8. BIBLIOGRAPHY
References
1. Koeppen, B. M.: The kidney and acid-base regulation. Adv Physiol Educ, 33: 275, 2009.
2. Solbu, T. T., Boulland, J. L., Zahid, W., Lyamouri Bredahl, M. K., Amiry-Moghaddam, M., Storm-Mathisen, J. et al.: Induction and targeting of the glutamine transporter SN1 to the basolateral membranes of cortical kidney tubule cells during chronic metabolic acidosis suggest a role in pH regulation. J Am Soc Nephrol, 16: 869, 2005.
3. Tong, J., Harrison, G., and Curthoys, N. P.: The effect of metabolic acidosis on the synthesis and turnover of rat renal phosphate-dependent glutaminase. Biochem J, 233: 139, 1986.
4. Alleyne, G. A. and Scullard, G. H.: Renal metabolic response to acid base changes. I. Enzymatic control of ammoniagenesis in the rat. J Clin Invest, 48: 364, 1969.
5. Vinay, P., Allignet, E., Pichette, C., Watford, M., Lemieux, G., and Gougoux, A.: Changes in renal metabolite profile and ammoniagenesis during acute and chronic metabolic acidosis in dog and rat. Kidney Int, 17: 312, 1980.
6. Ambuhl, P. M., Amemiya, M., Danczkay, M., Lotscher, M., Kaissling, B., Moe, O. W. et al.: Chronic metabolic acidosis increases NHE3 protein abundance in rat kidney. Am J Physiol, 271: F917, 1996.
7. Han, K. H.: Mechanisms of the effects of acidosis and hypokalemia on renal ammonia metabolism. Electrolyte Blood Press, 9: 45, 2011.
8. Attmane-Elakeb, A., Mount, D. B., Sibella, V., Vernimmen, C., Hebert, S. C., and Bichara, M.: Stimulation by in vivo and in vitro metabolic acidosis of expression of rBSC-1, the Na+-K+(NH4+)-2Cl- cotransporter of the rat medullary thick ascending limb. J Biol Chem, 273: 33681, 1998.
9. Bourgeois, S., Meer, L. V., Wootla, B., Bloch-Faure, M., Chambrey, R., Shull, G. E. et al.: NHE4 is critical for the renal handling of ammonia in rodents. J Clin Invest, 120: 1895, 2010.
10. Seshadri, R. M., Klein, J. D., Kozlowski, S., Sands, J. M., Kim, Y. H., Han, K. H. et al.: Renal expression of the ammonia transporters, Rhbg and Rhcg, in response to chronic metabolic acidosis. Am J Physiol Renal Physiol, 290: F397, 2006.
11. Seshadri, R. M., Klein, J. D., Smith, T., Sands, J. M., Handlogten, M. E., Verlander, J. W. et al.: Changes in subcellular distribution of the ammonia transporter, Rhcg, in response to chronic metabolic acidosis. Am J Physiol Renal Physiol, 290: F1443, 2006.
Bibliography
164/206
12. Biver, S., Belge, H., Bourgeois, S., Van, V. P., Nowik, M., Scohy, S. et al.: A role for Rhesus factor Rhcg in renal ammonium excretion and male fertility. Nature, 456: 339, 2008.
13. Lee, H. W., Verlander, J. W., Bishop, J. M., Igarashi, P., Handlogten, M. E., and Weiner, I. D.: Collecting duct-specific Rh C glycoprotein deletion alters basal and acidosis-stimulated renal ammonia excretion. Am J Physiol Renal Physiol, 296: F1364, 2009.
14. Abu, H. S., Chaudhry, F. A., Zahedi, K., Siddiqui, F., and Amlal, H.: Cellular and molecular basis of increased ammoniagenesis in potassium deprivation. Am J Physiol Renal Physiol, 301: F969, 2011.
15. Karet, F. E.: Mechanisms in hyperkalemic renal tubular acidosis. J Am Soc Nephrol, 20: 251, 2009.
16. Tannen, R. L.: Effect of potassium on renal acidification and acid-base homeostasis. Semin Nephrol, 7: 263, 1987.
17. Tizianello, A., Garibotto, G., Robaudo, C., Saffioti, S., Pontremoli, R., Bruzzone, M. et al.: Renal ammoniagenesis in humans with chronic potassium depletion. Kidney Int, 40: 772, 1991.
18. Elkjaer, M. L., Kwon, T. H., Wang, W., Nielsen, J., Knepper, M. A., Frokiaer, J. et al.: Altered expression of renal NHE3, TSC, BSC-1, and ENaC subunits in potassium-depleted rats. Am J Physiol Renal Physiol, 283: F1376, 2002.
19. Wang, Z., Baird, N., Shumaker, H., and Soleimani, M.: Potassium depletion and acid-base transporters in rat kidney: differential effect of hypophysectomy. Am J Physiol, 272: F736, 1997.
20. Han, K. H., Lee, H. W., Handlogten, M. E., Bishop, J. M., Levi, M., Kim, J. et al.: Effect of hypokalemia on renal expression of the ammonia transporter family members, Rh B Glycoprotein and Rh C Glycoprotein, in the rat kidney. Am J Physiol Renal Physiol, 301: F823, 2011.
21. Adrogue, H. J., Gennari, F. J., Galla, J. H., and Madias, N. E.: Assessing acid-base disorders. Kidney Int, 76: 1239, 2009.
22. Severinghaus, J. W.: More RIpH. JAMA, 267: 2035, 1992.
23. Schlichtig, R., Grogono, A. W., and Severinghaus, J. W.: Human PaCO2 and standard base excess compensation for acid-base imbalance. Crit Care Med, 26: 1173, 1998.
24. Stewart, P. A.: Modern quantitative acid-base chemistry. Can J Physiol Pharmacol, 61: 1444, 1983.
25. Kellum, J. A.: Metabolic acidosis in the critically ill: lessons from physical chemistry. Kidney Int Suppl, 66: S81, 1998.
Bibliography
165/206
26. Albert, M. S., Dell, R. B., and Winters, R. W.: Quantitative displacement of acid-base equilibrium in metabolic acidosis. Ann Intern Med, 66: 312, 1967.
27. Kellum, J. A.: Determinants of blood pH in health and disease. Crit Care, 4: 6, 2000.
28. Fencl, V., Jabor, A., Kazda, A., and Figge, J.: Diagnosis of metabolic acid-base disturbances in critically ill patients. Am J Respir Crit Care Med, 162: 2246, 2000.
29. Morgan, T. J.: The Stewart approach--one clinician's perspective. Clin Biochem Rev, 30: 41, 2009.
30. Dubin, A., Menises, M. M., Masevicius, F. D., Moseinco, M. C., Kutscherauer, D. O., Ventrice, E. et al.: Comparison of three different methods of evaluation of metabolic acid-base disorders. Crit Care Med, 35: 1264, 2007.
31. Fidkowski, C. and Helstrom, J.: Diagnosing metabolic acidosis in the critically ill: bridging the anion gap, Stewart, and base excess methods. Can J Anaesth, 56: 247, 2009.
32. Morris, C. G. and Low, J.: Metabolic acidosis in the critically ill: part 2. Causes and treatment. Anaesthesia, 63: 396, 2008.
33. Lindinger, M. I., Heigenhauser, G. J., McKelvie, R. S., and Jones, N. L.: Blood ion regulation during repeated maximal exercise and recovery in humans. Am J Physiol, 262: R126, 1992.
34. Hickling, K. G., Walsh, J., Henderson, S., and Jackson, R.: Low mortality rate in adult respiratory distress syndrome using low-volume, pressure-limited ventilation with permissive hypercapnia: a prospective study. Crit Care Med, 22: 1568, 1994.
35. Forsythe, S. M. and Schmidt, G. A.: Sodium bicarbonate for the treatment of lactic acidosis. Chest, 117: 260, 2000.
36. Kette, F., Weil, M. H., and Gazmuri, R. J.: Buffer solutions may compromise cardiac resuscitation by reducing coronary perfusion presssure. JAMA, 266: 2121, 1991.
37. Hindman, B. J.: Sodium bicarbonate in the treatment of subtypes of acute lactic acidosis: physiologic considerations. Anesthesiology, 72: 1064, 1990.
38. Bersin, R. M. and Arieff, A. I.: Improved hemodynamic function during hypoxia with Carbicarb, a new agent for the management of acidosis. Circulation, 77: 227, 1988.
39. Bleich, H. L. and Schwartz, W. B.: Tris buffer (THAM). An appraisal of its physiologic effects and clinical usefulness. N Engl J Med, 274: 782, 1966.
Bibliography
166/206
40. Narins, R. G. and Emmett, M.: Simple and mixed acid-base disorders: a practical approach. Medicine (Baltimore), 59: 161, 1980.
41. Figge, J., Mydosh, T., and Fencl, V.: Serum proteins and acid-base equilibria: a follow-up. J Lab Clin Med, 120: 713, 1992.
42. Salem, M. M. and Mujais, S. K.: Gaps in the anion gap. Arch Intern Med, 152: 1625, 1992.
43. Oster, J. R., Perez, G. O., and Materson, B. J.: Use of the anion gap in clinical medicine. South Med J, 81: 229, 1988.
44. Mizock, B. A. and Falk, J. L.: Lactic acidosis in critical illness. Crit Care Med, 20: 80, 1992.
45. Stacpoole, P. W., Wright, E. C., Baumgartner, T. G., Bersin, R. M., Buchalter, S., Curry, S. H. et al.: Natural history and course of acquired lactic acidosis in adults. DCA-Lactic Acidosis Study Group. Am J Med, 97: 47, 1994.
46. Salpeter, S. R., Greyber, E., Pasternak, G. A., and Salpeter, E. E.: Risk of fatal and nonfatal lactic acidosis with metformin use in type 2 diabetes mellitus. Cochrane Database Syst Rev, CD002967, 2010.
47. Widmer, B., Gerhardt, R. E., Harrington, J. T., and Cohen, J. J.: Serum electrolyte and acid base composition. The influence of graded degrees of chronic renal failure. Arch Intern Med, 139: 1099, 1979.
48. Abassi, Z. A., Hoffman, A., and Better, O. S.: Acute renal failure complicating muscle crush injury. Semin Nephrol, 18: 558, 1998.
49. Arieff, A. I. and Carroll, H. J.: Nonketotic hyperosmolar coma with hyperglycemia: clinical features, pathophysiology, renal function, acid-base balance, plasma-cerebrospinal fluid equilibria and the effects of therapy in 37 cases. Medicine (Baltimore), 51: 73, 1972.
50. Mecher, C., Rackow, E. C., Astiz, M. E., and Weil, M. H.: Unaccounted for anion in metabolic acidosis during severe sepsis in humans. Crit Care Med, 19: 705, 1991.
51. Gilfix, B. M., Bique, M., and Magder, S.: A physical chemical approach to the analysis of acid-base balance in the clinical setting. J Crit Care, 8: 187, 1993.
52. Kellum, J. A., Kramer, D. J., and Pinsky, M. R.: Strong ion gap: a methodology for exploring unexplained anions. J Crit Care, 10: 51, 1995.
53. Kirschbaum, B.: Increased anion gap after liver transplantation. Am J Med Sci, 313: 107, 1997.

Bibliography
167/206
54. Laing, C. M., Toye, A. M., Capasso, G., and Unwin, R. J.: Renal tubular acidosis: developments in our understanding of the molecular basis. Int J Biochem Cell Biol, 37: 1151, 2005.
55. CHEEK, D. B.: Changes in total chloride and acid-base balance in gastroenteritis following treatment with large and small loads of sodium chloride. Pediatrics, 17: 839, 1956.
56. Gilbert, E. M., Haupt, M. T., Mandanas, R. Y., Huaringa, A. J., and Carlson, R. W.: The effect of fluid loading, blood transfusion, and catecholamine infusion on oxygen delivery and consumption in patients with sepsis. Am Rev Respir Dis, 134: 873, 1986.
57. Cohen, J. J., Madias, N. E., Wolf, C. J., and Schwartz, W. B.: Regulation of acid-base equilibrium in chronic hypocapnia. Evidence that the response of the kidney is not geared to the defense of extracellular (H+). J Clin Invest, 57: 1483, 1976.
58. Sebastian, A., Frassetto, L. A., Sellmeyer, D. E., Merriam, R. L., and Morris, R. C., Jr.: Estimation of the net acid load of the diet of ancestral preagricultural Homo sapiens and their hominid ancestors. Am J Clin Nutr, 76: 1308, 2002.
59. Maurer, M., Riesen, W., Muser, J., Hulter, H. N., and Krapf, R.: Neutralization of Western diet inhibits bone resorption independently of K intake and reduces cortisol secretion in humans. Am J Physiol Renal Physiol, 284: F32, 2003.
60. Frassetto, L. A., Todd, K. M., Morris, R. C., Jr., and Sebastian, A.: Estimation of net endogenous noncarbonic acid production in humans from diet potassium and protein contents. Am J Clin Nutr, 68: 576, 1998.
61. Remer, T. and Manz, F.: Potential renal acid load of foods and its influence on urine pH. J Am Diet Assoc, 95: 791, 1995.
62. Reddy, S. T., Wang, C. Y., Sakhaee, K., Brinkley, L., and Pak, C. Y.: Effect of low-carbohydrate high-protein diets on acid-base balance, stone-forming propensity, and calcium metabolism. Am J Kidney Dis, 40: 265, 2002.
63. ELLIOT, J. S., SHARP, R. F., and LEWIS, L.: Urinary pH. J Urol, 81: 339, 1959.
64. Remer, T.: Influence of diet on acid-base balance. Semin Dial, 13: 221, 2000.
65. Murayama, T. and Taguchi, H.: The role of the diurnal variation of urinary pH in determining stone compositions. J Urol, 150: 1437, 1993.
66. Murayama, T., Sakai, N., Yamada, T., and Takano, T.: Role of the diurnal variation of urinary pH and urinary calcium in urolithiasis: a study in outpatients. Int J Urol, 8: 525, 2001.
67. FREE, A. H. and FREE, H. M.: Urinalysis, critical discipline of clinical science. CRC Crit Rev Clin Lab Sci, 3: 481, 1972.
Bibliography
168/206
68. Heuter, K. J., Buffington, C. A., and Chew, D. J.: Agreement between two methods for measuring urine pH in cats and dogs. J Am Vet Med Assoc, 213: 996, 1998.
69. Lott, J. A., Johnson, W. R., and Luke, K. E.: Evaluation of an automated urine chemistry reagent-strip analyzer. J Clin Lab Anal, 9: 212, 1995.
70. Nappert, G. and Naylor, J. M.: A comparison of pH determination methods in food animal practice. Can Vet J, 42: 364, 2001.
71. Raskin, R. E., Murray, K. A., and Levy, J. K.: Comparison of home monitoring methods for feline urine pH measurement. Vet Clin Pathol, 31: 51, 2002.
72. Tucker, K. L., Hannan, M. T., and Kiel, D. P.: The acid-base hypothesis: diet and bone in the Framingham Osteoporosis Study. Eur J Nutr, 40: 231, 2001.
73. Preminger, G. M., Harvey, J. A., and Pak, C. Y.: Comparative efficacy of "specific" potassium citrate therapy versus conservative management in nephrolithiasis of mild to moderate severity. J Urol, 134: 658, 1985.
74. Pak, C. Y., Sakhaee, K., and Fuller, C. J.: Physiological and physiochemical correction and prevention of calcium stone formation by potassium citrate therapy. Trans Assoc Am Physicians, 96: 294, 1983.
75. Simpson, G. M. and Khajawall, A. M.: Urinary acidifiers in phencyclidine detoxification. Hillside J Clin Psychiatry, 5: 161, 1983.
76. Nahata, M. C., Cummins, B. A., McLeod, D. C., Schondelmeyer, S. W., and Butler, R.: Effect of urinary acidifiers on formaldehyde concentration and efficacy with methenamine therapy. Eur J Clin Pharmacol, 22: 281, 1982.
77. Proudfoot, A. T., Krenzelok, E. P., and Vale, J. A.: Position Paper on urine alkalinization. J Toxicol Clin Toxicol, 42: 1, 2004.
78. Garrettson, L. K. and Geller, R. J.: Acid and alkaline diuresis. When are they of value in the treatment of poisoning? Drug Saf, 5: 220, 1990.
79. Blank, R. and Wolffram, S.: Alkalinization of urinary pH accelerates renal excretion of ochratoxin A in pigs. J Nutr, 134: 2355, 2004.
80. Vree, T. B., Van Ewijk-Beneken Kolmer EW, Verwey-Van Wissen, C. P., and Hekster, Y. A.: Effect of urinary pH on the pharmacokinetics of salicylic acid, with its glycine and glucuronide conjugates in human. Int J Clin Pharmacol Ther, 32: 550, 1994.
81. Proudfoot, A. T., Krenzelok, E. P., Brent, J., and Vale, J. A.: Does urine alkalinization increase salicylate elimination? If so, why? Toxicol Rev, 22: 129, 2003.
82. Nho, C. W. and Jeffery, E.: The synergistic upregulation of phase II detoxification enzymes by glucosinolate breakdown products in cruciferous vegetables. Toxicol Appl Pharmacol, 174: 146, 2001.
Bibliography
169/206
83. Steinkellner, H., Rabot, S., Freywald, C., Nobis, E., Scharf, G., Chabicovsky, M. et al.: Effects of cruciferous vegetables and their constituents on drug metabolizing enzymes involved in the bioactivation of DNA-reactive dietary carcinogens. Mutat Res, 480-481: 285, 2001.
84. Sweet, D. H. and Pritchard, J. B.: rOCT2 is a basolateral potential-driven carrier, not an organic cation/proton exchanger. Am J Physiol, 277: F890, 1999.
85. Fujita, T., Urban, T. J., Leabman, M. K., Fujita, K., and Giacomini, K. M.: Transport of drugs in the kidney by the human organic cation transporter, OCT2 and its genetic variants. J Pharm Sci, 95: 25, 2006.
86. Lemann, J., Jr., Gray, R. W., and Pleuss, J. A.: Potassium bicarbonate, but not sodium bicarbonate, reduces urinary calcium excretion and improves calcium balance in healthy men. Kidney Int, 35: 688, 1989.
87. Sakhaee, K., Nicar, M., Hill, K., and Pak, C. Y.: Contrasting effects of potassium citrate and sodium citrate therapies on urinary chemistries and crystallization of stone-forming salts. Kidney Int, 24: 348, 1983.
88. Fjellstedt, E., Denneberg, T., Jeppsson, J. O., and Tiselius, H. G.: A comparison of the effects of potassium citrate and sodium bicarbonate in the alkalinization of urine in homozygous cystinuria. Urol Res, 29: 295, 2001.
89. Marangella, M., Di, S. M., Casalis, S., Berutti, S., D'Amelio, P., and Isaia, G. C.: Effects of potassium citrate supplementation on bone metabolism. Calcif Tissue Int, 74: 330, 2004.
90. Sakhaee, K., Maalouf, N. M., Abrams, S. A., and Pak, C. Y.: Effects of potassium alkali and calcium supplementation on bone turnover in postmenopausal women. J Clin Endocrinol Metab, 90: 3528, 2005.
91. Sellmeyer, D. E., Schloetter, M., and Sebastian, A.: Potassium citrate prevents increased urine calcium excretion and bone resorption induced by a high sodium chloride diet. J Clin Endocrinol Metab, 87: 2008, 2002.
92. Jehle, S., Zanetti, A., Muser, J., Hulter, H. N., and Krapf, R.: Partial neutralization of the acidogenic Western diet with potassium citrate increases bone mass in postmenopausal women with osteopenia. J Am Soc Nephrol, 17: 3213, 2006.
93. Trivedi, B. and Tannen, R. L.: Effect of respiratory acidosis on intracellular pH of the proximal tubule. Am J Physiol, 250: F1039, 1986.
94. : Osteoporosis prevention, diagnosis, and therapy. JAMA, 285: 785, 2001.
95. Genant, H. K., Cooper, C., Poor, G., Reid, I., Ehrlich, G., Kanis, J. et al.: Interim report and recommendations of the World Health Organization Task-Force for Osteoporosis. Osteoporos Int, 10: 259, 1999.
Bibliography
170/206
96. Johnell, O., Kanis, J. A., Oden, A., Johansson, H., De, L. C., Delmas, P. et al.: Predictive value of BMD for hip and other fractures. J Bone Miner Res, 20: 1185, 2005.
97. Cauley, J. A., Thompson, D. E., Ensrud, K. C., Scott, J. C., and Black, D.: Risk of mortality following clinical fractures. Osteoporos Int, 11: 556, 2000.
98. Chrischilles, E. A., Butler, C. D., Davis, C. S., and Wallace, R. B.: A model of lifetime osteoporosis impact. Arch Intern Med, 151: 2026, 1991.
99. Adachi, J. D., Ioannidis, G., Pickard, L., Berger, C., Prior, J. C., Joseph, L. et al.: The association between osteoporotic fractures and health-related quality of life as measured by the Health Utilities Index in the Canadian Multicentre Osteoporosis Study (CaMos). Osteoporos Int, 14: 895, 2003.
100. Robbins, J. A., Biggs, M. L., and Cauley, J.: Adjusted mortality after hip fracture: From the cardiovascular health study. J Am Geriatr Soc, 54: 1885, 2006.
101. Braithwaite, R. S., Col, N. F., and Wong, J. B.: Estimating hip fracture morbidity, mortality and costs. J Am Geriatr Soc, 51: 364, 2003.
102. Wiktorowicz, M. E., Goeree, R., Papaioannou, A., Adachi, J. D., and Papadimitropoulos, E.: Economic implications of hip fracture: health service use, institutional care and cost in Canada. Osteoporos Int, 12: 271, 2001.
103. Macdonald, H. M., New, S. A., Fraser, W. D., Campbell, M. K., and Reid, D. M.: Low dietary potassium intakes and high dietary estimates of net endogenous acid production are associated with low bone mineral density in premenopausal women and increased markers of bone resorption in postmenopausal women. Am J Clin Nutr, 81: 923, 2005.
104. Sebastian, A., Harris, S. T., Ottaway, J. H., Todd, K. M., and Morris, R. C., Jr.: Improved mineral balance and skeletal metabolism in postmenopausal women treated with potassium bicarbonate. N Engl J Med, 330: 1776, 1994.
105. Green, J. and Kleeman, C. R.: Role of bone in regulation of systemic acid-base balance. Kidney Int, 39: 9, 1991.
106. Brenner, R. J., Spring, D. B., Sebastian, A., McSherry, E. M., Genant, H. K., Palubinskas, A. J. et al.: Incidence of radiographically evident bone disease, nephrocalcinosis, and nephrolithiasis in various types of renal tubular acidosis. N Engl J Med, 307: 217, 1982.
107. Tucker, K. L., Hannan, M. T., Chen, H., Cupples, L. A., Wilson, P. W., and Kiel, D. P.: Potassium, magnesium, and fruit and vegetable intakes are associated with greater bone mineral density in elderly men and women. Am J Clin Nutr, 69: 727, 1999.
108. Sellmeyer, D. E., Stone, K. L., Sebastian, A., and Cummings, S. R.: A high ratio of dietary animal to vegetable protein increases the rate of bone loss and the
Bibliography
171/206
risk of fracture in postmenopausal women. Study of Osteoporotic Fractures Research Group. Am J Clin Nutr, 73: 118, 2001.
109. Lemann, J., Jr., Pleuss, J. A., Gray, R. W., and Hoffmann, R. G.: Potassium administration reduces and potassium deprivation increases urinary calcium excretion in healthy adults [corrected]. Kidney Int, 39: 973, 1991.
110. Frassetto, L., Morris, R. C., Jr., and Sebastian, A.: Long-term persistence of the urine calcium-lowering effect of potassium bicarbonate in postmenopausal women. J Clin Endocrinol Metab, 90: 831, 2005.
111. Remer, T. and Manz, F.: Estimation of the renal net acid excretion by adults consuming diets containing variable amounts of protein. Am J Clin Nutr, 59: 1356, 1994.
112. Buclin, T., Cosma, M., Appenzeller, M., Jacquet, A. F., Decosterd, L. A., Biollaz, J. et al.: Diet acids and alkalis influence calcium retention in bone. Osteoporos Int, 12: 493, 2001.
113. Bell, J. A. and Whiting, S. J.: Effect of fruit on net acid and urinary calcium excretion in an acute feeding trial of women. Nutrition, 20: 492, 2004.
114. Macdonald, H. M., Black, A. J., Aucott, L., Duthie, G., Duthie, S., Sandison, R. et al.: Effect of potassium citrate supplementation or increased fruit and vegetable intake on bone metabolism in healthy postmenopausal women: a randomized controlled trial. Am J Clin Nutr, 88: 465, 2008.
115. Macdonald, H. M., New, S. A., Golden, M. H., Campbell, M. K., and Reid, D. M.: Nutritional associations with bone loss during the menopausal transition: evidence of a beneficial effect of calcium, alcohol, and fruit and vegetable nutrients and of a detrimental effect of fatty acids. Am J Clin Nutr, 79: 155, 2004.
116. Kaptoge, S., Welch, A., McTaggart, A., Mulligan, A., Dalzell, N., Day, N. E. et al.: Effects of dietary nutrients and food groups on bone loss from the proximal femur in men and women in the 7th and 8th decades of age. Osteoporos Int, 14: 418, 2003.
117. Whiting, S. J. and Draper, H. H.: Effect of a chronic acid load as sulfate or sulfur amino acids on bone metabolism in adult rats. J Nutr, 111: 1721, 1981.
118. Burns, L., Ashwell, M., Berry, J., Bolton-Smith, C., Cassidy, A., Dunnigan, M. et al.: UK Food Standards Agency Optimal Nutrition Status Workshop: environmental factors that affect bone health throughout life. Br J Nutr, 89: 835, 2003.
119. Roughead, Z. K., Johnson, L. K., Lykken, G. I., and Hunt, J. R.: Controlled high meat diets do not affect calcium retention or indices of bone status in healthy postmenopausal women. J Nutr, 133: 1020, 2003.
Bibliography
172/206
120. Pak, C. Y.: Pharmacotherapy of kidney stones. Expert Opin Pharmacother, 9: 1509, 2008.
121. Manthey, D. E. and Teichman, J.: Nephrolithiasis. Emerg Med Clin North Am, 19: 633, 2001.
122. Alguacil, J., Pfeiffer, R. M., Moore, L. E., del Fresno, M. R., Medina-Lopez, R., Kogevinas, M. et al.: Measurement of urine pH for epidemiological studies on bladder cancer. European Journal of Epidemiology, 22: 91, 2007.
123. Perazella, M. A.: Crystal-induced acute renal failure. Am J Med, 106: 459, 1999.
124. Kadlubar, F. F., Miller, J. A., and Miller, E. C.: Hepatic microsomal N-glucuronidation and nucleic acid binding of N-hydroxy arylamines in relation to urinary bladder carcinogenesis. Cancer Res, 37: 805, 1977.
125. Babu, S. R., Lakshmi, V. M., Hsu, F. F., Zenser, T. V., and Davis, B. B.: Glucuronidation of N-hydroxy metabolites of N-acetylbenzidine. Carcinogenesis, 16: 3069, 1995.
126. Babu, S. R., Lakshmi, V. M., Huang, G. P., Zenser, T. V., and Davis, B. B.: Glucuronide conjugates of 4-aminobiphenyl and its N-hydroxy metabolites. pH stability and synthesis by human and dog liver. Biochem Pharmacol, 51: 1679, 1996.
127. Kadlubar, F. F., Dooley, K. L., Teitel, C. H., Roberts, D. W., Benson, R. W., Butler, M. A. et al.: Frequency of urination and its effects on metabolism, pharmacokinetics, blood hemoglobin adduct formation, and liver and urinary bladder DNA adduct levels in beagle dogs given the carcinogen 4-aminobiphenyl. Cancer Res, 51: 4371, 1991.
128. Rothman, N., Talaska, G., Hayes, R. B., Bhatnagar, V. K., Bell, D. A., Lakshmi, V. M. et al.: Acidic urine pH is associated with elevated levels of free urinary benzidine and N-acetylbenzidine and urothelial cell DNA adducts in exposed workers. Cancer Epidemiol Biomarkers Prev, 6: 1039, 1997.
129. Zenser, T. V., Lakshmi, V. M., Hsu, F. F., and Davis, B. B.: Metabolism of N-acetylbenzidine and initiation of bladder cancer. Mutat Res, 506-507: 29, 2002.
130. Bois, F. Y., Krowech, G., and Zeise, L.: Modeling human interindividual variability in metabolism and risk: the example of 4-aminobiphenyl. Risk Anal, 15: 205, 1995.
131. Alguacil, J., Kogevinas, M., Silverman, D. T., Malats, N., Real, F. X., Garcia-Closas, M. et al.: Urinary pH, cigarette smoking and bladder cancer risk. Carcinogenesis, 32: 843, 2011.
132. Porta, M., Pumarega, J., Lopez, T., Jariod, M., Marco, E., and Grimalt, J. O.: Influence of tumor stage, symptoms, and time of blood draw on serum concentrations
Bibliography
173/206
of organochlorine compounds in exocrine pancreatic cancer. Cancer Causes Control, 2009.
133. Groos, E., Walker, L., and Masters, J. R. W.: Intravesical Chemotherapy - Studies on the Relationship Between Ph and Cytotoxicity. Cancer, 58: 1199, 1986.
134. : Consensus recommendations for the management of chronic heart failure. On behalf of the membership of the advisory council to improve outcomes nationwide in heart failure. Am J Cardiol, 83: 1A, 1999.
135. Gassanov, N., Biesenbach, E., Caglayan, E., Nia, A., Fuhr, U., and Er, F.: Natriuretic peptides in therapy for decompensated heart failure. Eur J Clin Pharmacol, 68: 223, 2012.
136. Bielecka-Dabrowa, A., Mikhailidis, D. P., Jones, L., Rysz, J., Aronow, W. S., and Banach, M.: The meaning of hypokalemia in heart failure. Int J Cardiol, 158: 12, 2012.
137. Kjeldsen, K.: Hypokalemia and sudden cardiac death. Exp Clin Cardiol, 15: e96, 2010.
138. Harrison, T. R., Pilcher, C., and Ewing, G.: STUDIES IN CONGESTIVE HEART FAILURE: IV. The Potassium Content of Skeletal and Cardiac Muscle. J Clin Invest, 8: 325, 1930.
139. Franse, L. V., Pahor, M., Di, B. M., Somes, G. W., Cushman, W. C., and Applegate, W. B.: Hypokalemia associated with diuretic use and cardiovascular events in the Systolic Hypertension in the Elderly Program. Hypertension, 35: 1025, 2000.
140. Friedensohn, A., Faibel, H. E., Bairey, O., Goldbourt, U., and Schlesinger, Z.: Malignant arrhythmias in relation to values of serum potassium in patients with acute myocardial infarction. Int J Cardiol, 32: 331, 1991.
141. Pitt, B., Bakris, G., Ruilope, L. M., DiCarlo, L., and Mukherjee, R.: Serum potassium and clinical outcomes in the Eplerenone Post-Acute Myocardial Infarction Heart Failure Efficacy and Survival Study (EPHESUS). Circulation, 118: 1643, 2008.
142. Ahmed, A., Zannad, F., Love, T. E., Tallaj, J., Gheorghiade, M., Ekundayo, O. J. et al.: A propensity-matched study of the association of low serum potassium levels and mortality in chronic heart failure. Eur Heart J, 28: 1334, 2007.
143. Bowling, C. B., Pitt, B., Ahmed, M. I., Aban, I. B., Sanders, P. W., Mujib, M. et al.: Hypokalemia and outcomes in patients with chronic heart failure and chronic kidney disease: findings from propensity-matched studies. Circ Heart Fail, 3: 253, 2010.
144. Gennari, F. J.: Hypokalemia. N Engl J Med, 339: 451, 1998.
145. Harrington, J. T., Isner, J. M., and Kassirer, J. P.: Our national obsession with potassium. Am J Med, 73: 155, 1982.
Bibliography
174/206
146. Alfonzo, A. V., Isles, C., Geddes, C., and Deighan, C.: Potassium disorders--clinical spectrum and emergency management. Resuscitation, 70: 10, 2006.
147. Osadchii, O. E.: Mechanisms of hypokalemia-induced ventricular arrhythmogenicity. Fundam Clin Pharmacol, 24: 547, 2010.
148. Akera, T., Baskin, S. I., Tobin, T., and Brody, T. M.: Ouabain: temporal relationship between the inotropic effect and the in vitro binding to, and dissociation from, (Na + + K + )- activated ATPase. Naunyn Schmiedebergs Arch Pharmacol, 277: 151, 1973.
149. Thames, M. D.: Acetylstrophanthidin-induced reflex inhibition of canine renal sympathetic nerve activity mediated by cardiac receptors with vagal afferents. Circ Res, 44: 8, 1979.
150. Ferguson, D. W., Berg, W. J., Sanders, J. S., Roach, P. J., Kempf, J. S., and Kienzle, M. G.: Sympathoinhibitory responses to digitalis glycosides in heart failure patients. Direct evidence from sympathetic neural recordings. Circulation, 80: 65, 1989.
151. Torretti, J., Hendler, E., Weinstein, E., Longnecker, R. E., and Epstein, F. H.: Functional significance of Na- K-ATPase in the kidney: effects of ouabain inhibition. Am J Physiol, 222: 1398, 1972.
152. Covit, A. B., Schaer, G. L., Sealey, J. E., Laragh, J. H., and Cody, R. J.: Suppression of the renin-angiotensin system by intravenous digoxin in chronic congestive heart failure. Am J Med, 75: 445, 1983.
153. Gheorghiade, M. and Ferguson, D.: Digoxin. A neurohormonal modulator in heart failure? Circulation, 84: 2181, 1991.
154. Clausen, T.: Hormonal and pharmacological modification of plasma potassium homeostasis. Fundam Clin Pharmacol, 24: 595, 2010.
155. Clausen, T.: Clinical and therapeutic significance of the Na+,K+ pump*. Clin Sci (Lond), 95: 3, 1998.
156. McKenna, M. J., Schmidt, T. A., Hargreaves, M., Cameron, L., Skinner, S. L., and Kjeldsen, K.: Sprint training increases human skeletal muscle Na(+)-K(+)-ATPase concentration and improves K+ regulation. J Appl Physiol, 75: 173, 1993.
157. Clausen, T.: Regulation of active Na+-K+ transport in skeletal muscle. Physiol Rev, 66: 542, 1986.
158. Clausen, T.: Na+-K+ pump regulation and skeletal muscle contractility. Physiol Rev, 83: 1269, 2003.
159. Surawicz, B.: Factors affecting tolerance to digitalis. J Am Coll Cardiol, 5: 69A, 1985.
Bibliography
175/206
160. Clausen, T., Hansen, O., Kjeldsen, K., and Norgaard, A.: Effect of age, potassium depletion and denervation on specific displaceable [3H]ouabain binding in rat skeletal muscle in vivo. J Physiol, 333: 367, 1982.
161. Woolf, A. D., Wenger, T., Smith, T. W., and Lovejoy, F. H., Jr.: The use of digoxin-specific Fab fragments for severe digitalis intoxication in children. N Engl J Med, 326: 1739, 1992.
162. Bismuth, C., Gaultier, M., Conso, F., and Efthymiou, M. L.: Hyperkalemia in acute digitalis poisoning: prognostic significance and therapeutic implications. Clin Toxicol, 6: 153, 1973.
163. Kuwahara, T. and Kawai, C.: [Acid-base disturbances in heart failure]. Nihon Rinsho, 50: 2173, 1992.
164. Sue, D. Y.: Excess ventilation during exercise and prognosis in chronic heart failure. Am J Respir Crit Care Med, 183: 1302, 2011.
165. Ingle, L., Sloan, R., Carroll, S., Goode, K., Cleland, J. G., and Clark, A. L.: Abnormalities of the ventilatory equivalent for carbon dioxide in patients with chronic heart failure. Pulm Med, 2012: 589164, 2012.
166. Hunt, S. A., Abraham, W. T., Chin, M. H., Feldman, A. M., Francis, G. S., Ganiats, T. G. et al.: ACC/AHA 2005 Guideline Update for the Diagnosis and Management of Chronic Heart Failure in the Adult: a report of the American College of Cardiology/American Heart Association Task Force on Practice Guidelines (Writing Committee to Update the 2001 Guidelines for the Evaluation and Management of Heart Failure): developed in collaboration with the American College of Chest Physicians and the International Society for Heart and Lung Transplantation: endorsed by the Heart Rhythm Society. Circulation, 112: e154, 2005.
167. Kato, M., Stevenson, L. W., Palardy, M., Campbell, P. M., May, C. W., Lakdawala, N. K. et al.: The worst symptom as defined by patients during heart failure hospitalization: implications for response to therapy. J Card Fail, 18: 524, 2012.
168. Torres, M. and Moayedi, S.: Evaluation of the acutely dyspneic elderly patient. Clin Geriatr Med, 23: 307, 2007.
169. Ballard, R. D.: Sleep and medical disorders. Prim Care, 32: 511, 2005.
170. Chen, Y., Chen, P., Hanaoka, M., Huang, X., Droma, Y., and Kubo, K.: Mechanical ventilation in patients with hypoxemia due to refractory heart failure. Intern Med, 47: 367, 2008.
171. Hu, F. B., Rimm, E. B., Stampfer, M. J., Ascherio, A., Spiegelman, D., and Willett, W. C.: Prospective study of major dietary patterns and risk of coronary heart disease in men. Am J Clin Nutr, 72: 912, 2000.
Bibliography
176/206
172. Radvila, A.: [The hyperventilation syndrome]. Schweiz Med Wochenschr, 114: 562, 1984.
173. Hyneck, M. L.: Simple acid-base disorders. Am J Hosp Pharm, 42: 1992, 1985.
174. Radvila, A.: [The hyperventilation syndrome]. Schweiz Med Wochenschr, 114: 562, 1984.
175. Dratcu, L.: Panic, hyperventilation and perpetuation of anxiety. Prog Neuropsychopharmacol Biol Psychiatry, 24: 1069, 2000.
176. Hegel, M. T. and Ferguson, R. J.: Psychophysiological assessment of respiratory function in panic disorder: evidence for a hyperventilation subtype. Psychosom Med, 59: 224, 1997.
177. Ley, R.: Panic disorder and agoraphobia: fear of fear or fear of the symptoms produced by hyperventilation? J Behav Ther Exp Psychiatry, 18: 305, 1987.
178. Gorman, J. M., Fyer, M. R., Goetz, R., Askanazi, J., Liebowitz, M. R., Fyer, A. J. et al.: Ventilatory physiology of patients with panic disorder. Arch Gen Psychiatry, 45: 31, 1988.
179. Bass, C. and Gardner, W. N.: Respiratory and psychiatric abnormalities in chronic symptomatic hyperventilation. Br Med J (Clin Res Ed), 290: 1387, 1985.
180. Bass, C., Lelliott, P., and Marks, I.: Fear talk versus voluntary hyperventilation in agoraphobics and normals: a controlled study. Psychol Med, 19: 669, 1989.
181. Gorman, J. M., Liebowitz, M. R., Fyer, A. J., Fyer, M. R., and Klein, D. F.: Possible respiratory abnormalities in panic disorder. Psychopharmacol Bull, 22: 797, 1986.
182. Carr, R. E., Lehrer, P. M., Hochron, S. M., and Jackson, A.: Effect of psychological stress on airway impedance in individuals with asthma and panic disorder. J Abnorm Psychol, 105: 137, 1996.
183. Suess, W. M., Alexander, A. B., Smith, D. D., Sweeney, H. W., and Marion, R. J.: The effects of psychological stress on respiration: a preliminary study of anxiety and hyperventilation. Psychophysiology, 17: 535, 1980.
184. de, R. C., Garssen, B., Rijken, H., and Kraaimaat, F.: The hyperventilation syndrome in panic disorder, agoraphobia and generalized anxiety disorder. Behav Res Ther, 27: 447, 1989.
185. Holt, P. E. and Andrews, G.: Hyperventilation and anxiety in panic disorder, social phobia, GAD and normal controls. Behav Res Ther, 27: 453, 1989.
186. Freire, R. C., Perna, G., and Nardi, A. E.: Panic disorder respiratory subtype: psychopathology, laboratory challenge tests, and response to treatment. Harv Rev Psychiatry, 18: 220, 2010.
Bibliography
177/206
187. van den Hout, M. A., Hoekstra, R., Arntz, A., Christiaanse, M., Ranschaert, W., and Schouten, E.: Hyperventilation is not diagnostically specific to panic patients. Psychosom Med, 54: 182, 1992.
188. Klein, D. F.: False suffocation alarms, spontaneous panics, and related conditions. An integrative hypothesis. Arch Gen Psychiatry, 50: 306, 1993.
189. Donnell, C. D. and McNally, R. J.: Anxiety sensitivity and history of panic as predictors of response to hyperventilation. Behav Res Ther, 27: 325, 1989.
190. Rapee, R. M.: Distinctions between panic disorder and generalised anxiety disorder: clinical presentation. Aust N Z J Psychiatry, 19: 227, 1985.
191. Tombaugh, G. C. and Somjen, G. G.: Differential sensitivity to intracellular pH among high- and low-threshold Ca2+ currents in isolated rat CA1 neurons. J Neurophysiol, 77: 639, 1997.
192. Harvey, B. J., Thomas, S. R., and Ehrenfeld, J.: Intracellular pH controls cell membrane Na+ and K+ conductances and transport in frog skin epithelium. J Gen Physiol, 92: 767, 1988.
193. Laffey, J. G. and Kavanagh, B. P.: Hypocapnia. N Engl J Med, 347: 43, 2002.
194. Stenkamp, K., Palva, J. M., Uusisaari, M., Schuchmann, S., Schmitz, D., Heinemann, U. et al.: Enhanced temporal stability of cholinergic hippocampal gamma oscillations following respiratory alkalosis in vitro. J Neurophysiol, 85: 2063, 2001.
195. Gennari, F. J., Goldstein, M. B., and Schwartz, W. B.: The nature of the renal adaptation to chronic hypocapnia. J Clin Invest, 51: 1722, 1972.
196. Dodge, F. A., Jr. and Rahamimoff, R.: Co-operative action a calcium ions in transmitter release at the neuromuscular junction. J Physiol, 193: 419, 1967.
197. SELYE, H.: The general adaptation syndrome and the diseases of adaptation. J Allergy, 17: 231, 1946.
198. Schleifer, L. M., Ley, R., and Spalding, T. W.: A hyperventilation theory of job stress and musculoskeletal disorders. Am J Ind Med, 41: 420, 2002.
199. TENNEY, S. M.: The effect of carbon dioxide on neurohumoral and endocrine mechanisms. Anesthesiology, 21: 674, 1960.
200. Sikter, A., Frecska, E., Braun, I. M., Gonda, X., and Rihmer, Z.: The role of hyperventilation: hypocapnia in the pathomechanism of panic disorder. Rev Bras Psiquiatr, 29: 375, 2007.
201. Smith, G. A., Brett, C. L., and Church, J.: Effects of noradrenaline on intracellular pH in acutely dissociated adult rat hippocampal CA1 neurones. J Physiol, 512 ( Pt 2): 487, 1998.
Bibliography
178/206
202. Sikter, A., Faludi, G., and Rihmer, Z.: The role of carbon dioxide (and intracellular pH) in the pathomechanism of several mental disorders. Are the diseases of civilization caused by learnt behaviour, not the stress itself? Neuropsychopharmacol Hung, 11: 161, 2009.
203. Cooke, J. D., Okamoto, K., and Quastel, D. M.: The role of calcium in depolarization-secretion coupling at the motor nerve terminal. J Physiol, 228: 459, 1973.
204. Filosa, J. A., Dean, J. B., and Putnam, R. W.: Role of intracellular and extracellular pH in the chemosensitive response of rat locus coeruleus neurones. J Physiol, 541: 493, 2002.
205. Gardner, W. N.: The pathophysiology of hyperventilation disorders. Chest, 109: 516, 1996.
206. Wilhelm, F. H., Trabert, W., and Roth, W. T.: Physiologic instability in panic disorder and generalized anxiety disorder. Biol Psychiatry, 49: 596, 2001.
207. Pini, S., Cassano, G. B., Simonini, E., Savino, M., Russo, A., and Montgomery, S. A.: Prevalence of anxiety disorders comorbidity in bipolar depression, unipolar depression and dysthymia. J Affect Disord, 42: 145, 1997.
208. Rapoport, D. M., Greenberg, H. E., and Goldring, R. M.: Differing effects of the anxiolytic agents buspirone and diazepam on control of breathing. Clin Pharmacol Ther, 49: 394, 1991.
209. Garner, S. J., Eldridge, F. L., Wagner, P. G., and Dowell, R. T.: Buspirone, an anxiolytic drug that stimulates respiration. Am Rev Respir Dis, 139: 946, 1989.
210. Berggren, L., Eriksson, I., Mollenholt, P., and Sunzel, M.: Changes in respiratory pattern after repeated doses of diazepam and midazolam in healthy subjects. Acta Anaesthesiol Scand, 31: 667, 1987.
211. Shiber, J. R. and Santana, J.: Dyspnea. Med Clin North Am, 90: 453, 2006.
212. Miller, R. L. and Ho, S. M.: Environmental epigenetics and asthma: current concepts and call for studies. Am J Respir Crit Care Med, 177: 567, 2008.
213. Upton, M. N., Ferrell, C., Bidwell, C., McConnachie, A., Goodfellow, J., Davey, S. G. et al.: Improving the quality of spirometry in an epidemiological study: The Renfrew-Paisley (Midspan) family study. Public Health, 114: 353, 2000.
214. Hida, W.: Role of ventilatory drive in asthma and chronic obstructive pulmonary disease. Curr Opin Pulm Med, 5: 339, 1999.
215. Rebuck, A. S. and Chapman, K. R.: Asthma: 1. Pathophysiologic features and evaluation of severity. CMAJ, 136: 351, 1987.
216. Macklem, P. T.: Hyperinflation. Am Rev Respir Dis, 129: 1, 1984.
Bibliography
179/206
217. Mountain, R. D., Heffner, J. E., Brackett, N. C., Jr., and Sahn, S. A.: Acid-base disturbances in acute asthma. Chest, 98: 651, 1990.
218. Jardim, J., Farkas, G., Prefaut, C., Thomas, D., Macklem, P. T., and Roussos, C.: The failing inspiratory muscles under normoxic and hypoxic conditions. Am Rev Respir Dis, 124: 274, 1981.
219. Schnader, J. Y., Juan, G., Howell, S., Fitzgerald, R., and Roussos, C.: Arterial CO2 partial pressure affects diaphragmatic function. J Appl Physiol, 58: 823, 1985.
220. Marazzini, L. and Rizzato, G.: Rib cage and abdomen-diaphragm in bronchial asthma: relative contributions to air displacement. Am Rev Respir Dis, 103: 285, 1971.
221. McFadden, E. R., Jr. and Lyons, H. A.: Arterial-blood gas tension in asthma. N Engl J Med, 278: 1027, 1968.
222. Goodwin, R. D. and Pine, D. S.: Respiratory disease and panic attacks among adults in the United States. Chest, 122: 645, 2002.
223. Goodwin, R. D. and Eaton, W. W.: Asthma and the risk of panic attacks among adults in the community. Psychol Med, 33: 879, 2003.
224. Kullowatz, A., Kanniess, F., Dahme, B., Magnussen, H., and Ritz, T.: Association of depression and anxiety with health care use and quality of life in asthma patients. Respir Med, 101: 638, 2007.
225. Wright, R. J., Rodriguez, M., and Cohen, S.: Review of psychosocial stress and asthma: an integrated biopsychosocial approach. Thorax, 53: 1066, 1998.
226. Opolski, M. and Wilson, I.: Asthma and depression: a pragmatic review of the literature and recommendations for future research. Clin Pract Epidemiol Ment Health, 1: 18, 2005.
227. Yilmaz, A., Cumurcu, B. E., Tasliyurt, T., Sahan, A. G., Ustun, Y., and Etikan, I.: Role of psychiatric disorders and irritable bowel syndrome in asthma patients. Clinics (Sao Paulo), 66: 591, 2011.
228. Laurino, R. A., Barnabe, V., Saraiva-Romanholo, B. M., Stelmach, R., Cukier, A., and Nunes, M. P.: Respiratory rehabilitation: a physiotherapy approach to the control of asthma symptoms and anxiety. Clinics (Sao Paulo), 67: 1291, 2012.
229. Bruurs, M. L., van der Giessen, L. J., and Moed, H.: The effectiveness of physiotherapy in patients with asthma: A systematic review of the literature. Respir Med, 2013.
230. Alguacil, J., Pfeiffer, R. M., Moore, L. E., del Fresno, M. R., Medina-Lopez, R., Kogevinas, M. et al.: Measurement of urine pH for epidemiological studies on bladder cancer. Eur J Epidemiol, 22: 91, 2007.
Bibliography
180/206
231. Olsen, J. H., Wallin, H., Boice, J. D., Jr., Rask, K., Schulgen, G., and Fraumeni, J. F., Jr.: Phenobarbital, drug metabolism, and human cancer. Cancer Epidemiol Biomarkers Prev, 2: 449, 1993.
232. Habel, L. A., Bull, S. A., and Friedman, G. D.: Barbiturates, smoking, and bladder cancer risk. Cancer Epidemiol Biomarkers Prev, 7: 1049, 1998.
233. Merrill, R. M., Isakson, R. T., and Beck, R. E.: The association between allergies and cancer: what is currently known? Ann Allergy Asthma Immunol, 99: 102, 2007.
234. Fan, J. and Shen, S. J.: The role of Tamm-Horsfall mucoprotein in calcium oxalate crystallization. N-acetylcysteine--a new therapy for calcium oxalate urolithiasis. Br J Urol, 74: 288, 1994.
235. Pfister, R. C. and Dretler, S. P.: Percutaneous chemolysis of renal calculi. Urol Radiol, 6: 138, 1984.
236. Supabphol, A., Muangman, V., Chavasiri, W., Supabphol, R., and Gritsanapan, W.: N-acetylcysteine inhibits proliferation, adhesion, migration and invasion of human bladder cancer cells. J Med Assoc Thai, 92: 1171, 2009.
237. Bhattacharya, A., Li, Y., Geng, F., Munday, R., and Zhang, Y.: The principal urinary metabolite of allyl isothiocyanate, N-acetyl-S-(N-allylthiocarbamoyl)cysteine, inhibits the growth and muscle invasion of bladder cancer. Carcinogenesis, 33: 394, 2012.
238. Campos, R., Shimizu, M. H., Volpini, R. A., de Braganca, A. C., Andrade, L., Lopes, F. D. et al.: N-acetylcysteine prevents pulmonary edema and acute kidney injury in rats with sepsis submitted to mechanical ventilation. Am J Physiol Lung Cell Mol Physiol, 302: L640, 2012.
239. Zakynthinos, S., Katsaounou, P., Karatza, M. H., Roussos, C., and Vassilakopoulos, T.: Antioxidants increase the ventilatory response to hyperoxic hypercapnia. Am J Respir Crit Care Med, 175: 62, 2007.

181/206
9. Appendix

182/206
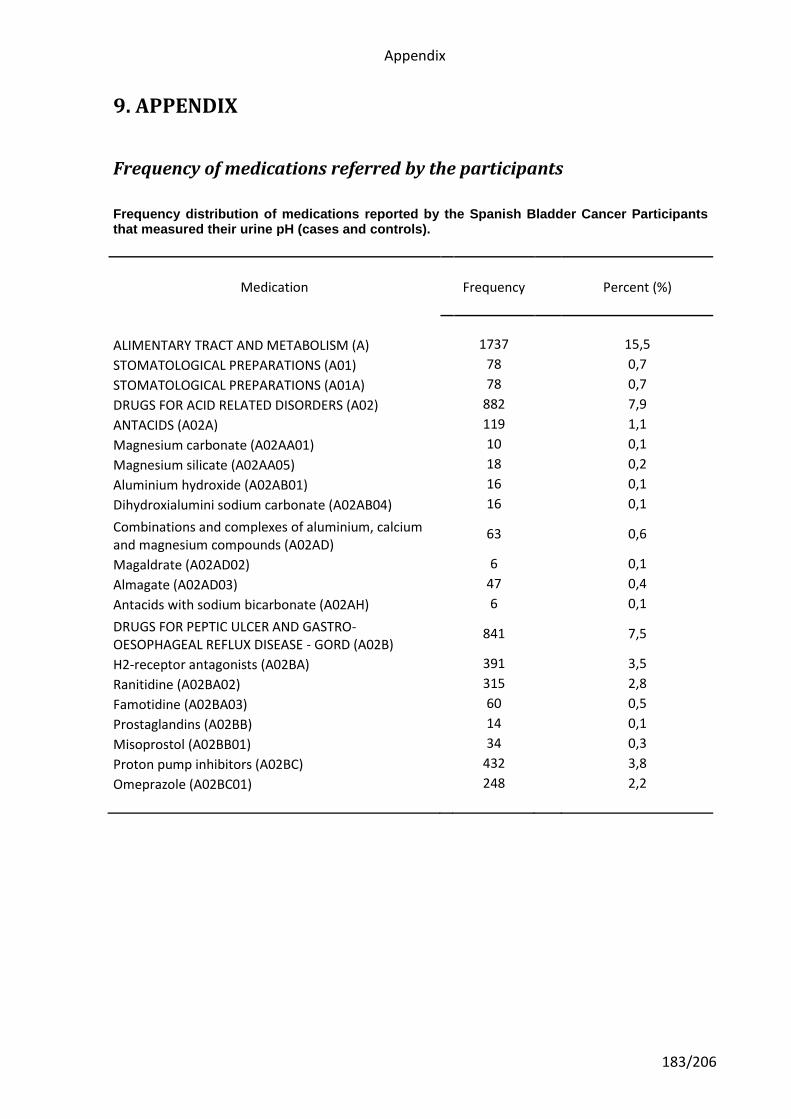
Appendix
183/206
9. APPENDIX
Frequency of medications referred by the participants
Frequency distribution of medications reported by the Spanish Bladder Cancer Participants that measured their urine pH (cases and controls).
Medication Frequency Percent (%)
ALIMENTARY TRACT AND METABOLISM (A) 1737 15,5
STOMATOLOGICAL PREPARATIONS (A01) 78 0,7
STOMATOLOGICAL PREPARATIONS (A01A) 78 0,7
DRUGS FOR ACID RELATED DISORDERS (A02) 882 7,9
ANTACIDS (A02A) 119 1,1
Magnesium carbonate (A02AA01) 10 0,1
Magnesium silicate (A02AA05) 18 0,2
Aluminium hydroxide (A02AB01) 16 0,1
Dihydroxialumini sodium carbonate (A02AB04) 16 0,1
Combinations and complexes of aluminium, calcium and magnesium compounds (A02AD)
63
0,6
Magaldrate (A02AD02) 6 0,1
Almagate (A02AD03) 47 0,4
Antacids with sodium bicarbonate (A02AH) 6 0,1
DRUGS FOR PEPTIC ULCER AND GASTRO-OESOPHAGEAL REFLUX DISEASE - GORD (A02B)
841
7,5
H2-receptor antagonists (A02BA) 391 3,5
Ranitidine (A02BA02) 315 2,8
Famotidine (A02BA03) 60 0,5
Prostaglandins (A02BB) 14 0,1
Misoprostol (A02BB01) 34 0,3
Proton pump inhibitors (A02BC) 432 3,8
Omeprazole (A02BC01) 248 2,2
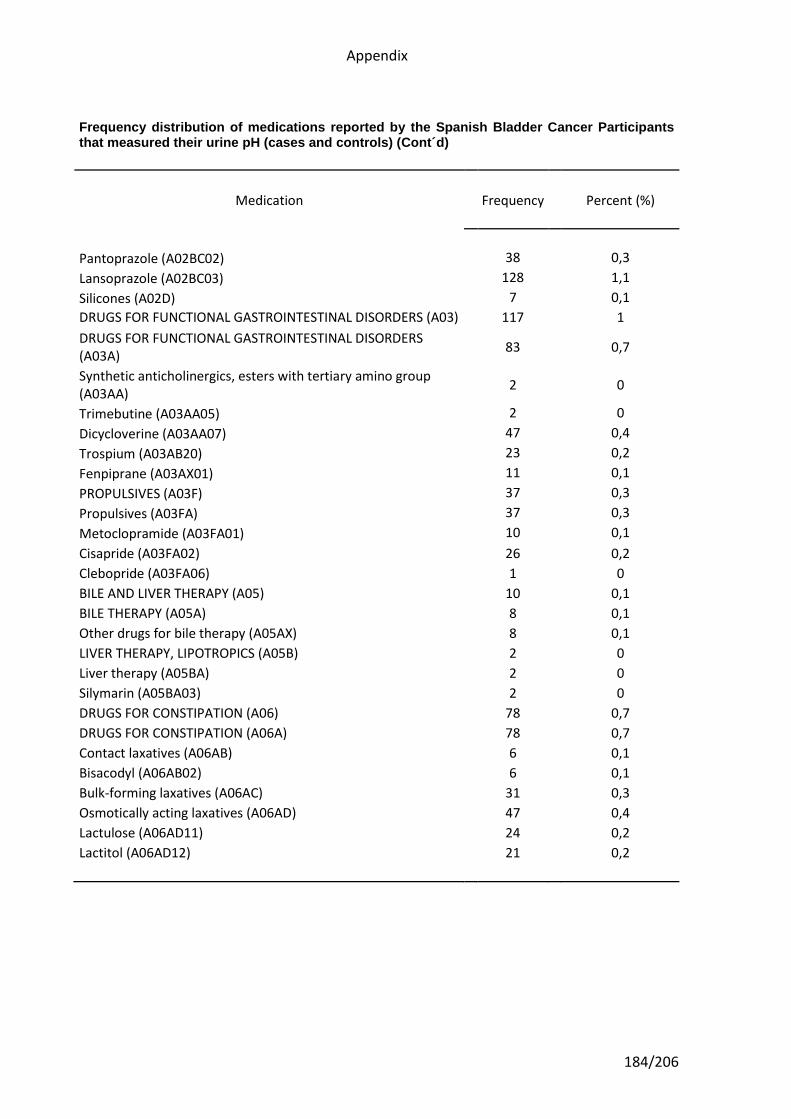
Appendix
184/206
Frequency distribution of medications reported by the Spanish Bladder Cancer Participants that measured their urine pH (cases and controls) (Cont´d)
Medication Frequency Percent (%)
Pantoprazole (A02BC02) 38 0,3
Lansoprazole (A02BC03) 128 1,1
Silicones (A02D) 7 0,1
DRUGS FOR FUNCTIONAL GASTROINTESTINAL DISORDERS (A03) 117 1
DRUGS FOR FUNCTIONAL GASTROINTESTINAL DISORDERS (A03A)
83 0,7
Synthetic anticholinergics, esters with tertiary amino group (A03AA)
2
0
Trimebutine (A03AA05) 2 0
Dicycloverine (A03AA07) 47 0,4
Trospium (A03AB20) 23 0,2
Fenpiprane (A03AX01) 11 0,1
PROPULSIVES (A03F) 37 0,3
Propulsives (A03FA) 37 0,3
Metoclopramide (A03FA01) 10 0,1
Cisapride (A03FA02) 26 0,2
Clebopride (A03FA06) 1 0
BILE AND LIVER THERAPY (A05) 10 0,1
BILE THERAPY (A05A) 8 0,1
Other drugs for bile therapy (A05AX) 8 0,1
LIVER THERAPY, LIPOTROPICS (A05B) 2 0
Liver therapy (A05BA) 2 0
Silymarin (A05BA03) 2 0
DRUGS FOR CONSTIPATION (A06) 78 0,7
DRUGS FOR CONSTIPATION (A06A) 78 0,7
Contact laxatives (A06AB) 6 0,1
Bisacodyl (A06AB02) 6 0,1
Bulk-forming laxatives (A06AC) 31 0,3
Osmotically acting laxatives (A06AD) 47 0,4
Lactulose (A06AD11) 24 0,2
Lactitol (A06AD12) 21 0,2
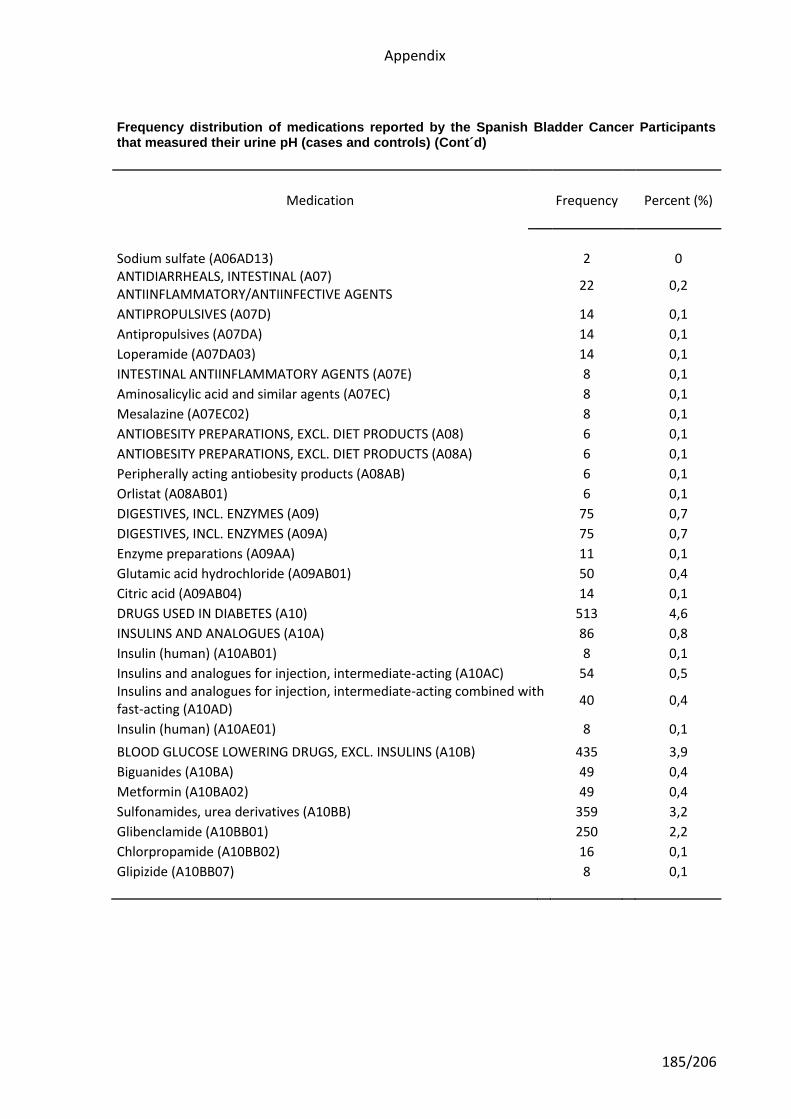
Appendix
185/206
Frequency distribution of medications reported by the Spanish Bladder Cancer Participants that measured their urine pH (cases and controls) (Cont´d)
Medication Frequency Percent (%)
Sodium sulfate (A06AD13) 2 0 ANTIDIARRHEALS, INTESTINAL (A07) ANTIINFLAMMATORY/ANTIINFECTIVE AGENTS
22 0,2
ANTIPROPULSIVES (A07D) 14 0,1
Antipropulsives (A07DA) 14 0,1
Loperamide (A07DA03) 14 0,1
INTESTINAL ANTIINFLAMMATORY AGENTS (A07E) 8 0,1
Aminosalicylic acid and similar agents (A07EC) 8 0,1
Mesalazine (A07EC02) 8 0,1
ANTIOBESITY PREPARATIONS, EXCL. DIET PRODUCTS (A08) 6 0,1
ANTIOBESITY PREPARATIONS, EXCL. DIET PRODUCTS (A08A) 6 0,1
Peripherally acting antiobesity products (A08AB) 6 0,1
Orlistat (A08AB01) 6 0,1
DIGESTIVES, INCL. ENZYMES (A09) 75 0,7
DIGESTIVES, INCL. ENZYMES (A09A) 75 0,7
Enzyme preparations (A09AA) 11 0,1
Glutamic acid hydrochloride (A09AB01) 50 0,4
Citric acid (A09AB04) 14 0,1
DRUGS USED IN DIABETES (A10) 513 4,6
INSULINS AND ANALOGUES (A10A) 86 0,8
Insulin (human) (A10AB01) 8 0,1
Insulins and analogues for injection, intermediate-acting (A10AC) 54 0,5 Insulins and analogues for injection, intermediate-acting combined with fast-acting (A10AD)
40 0,4
Insulin (human) (A10AE01) 8 0,1
BLOOD GLUCOSE LOWERING DRUGS, EXCL. INSULINS (A10B) 435 3,9
Biguanides (A10BA) 49 0,4
Metformin (A10BA02) 49 0,4
Sulfonamides, urea derivatives (A10BB) 359 3,2
Glibenclamide (A10BB01) 250 2,2
Chlorpropamide (A10BB02) 16 0,1
Glipizide (A10BB07) 8 0,1
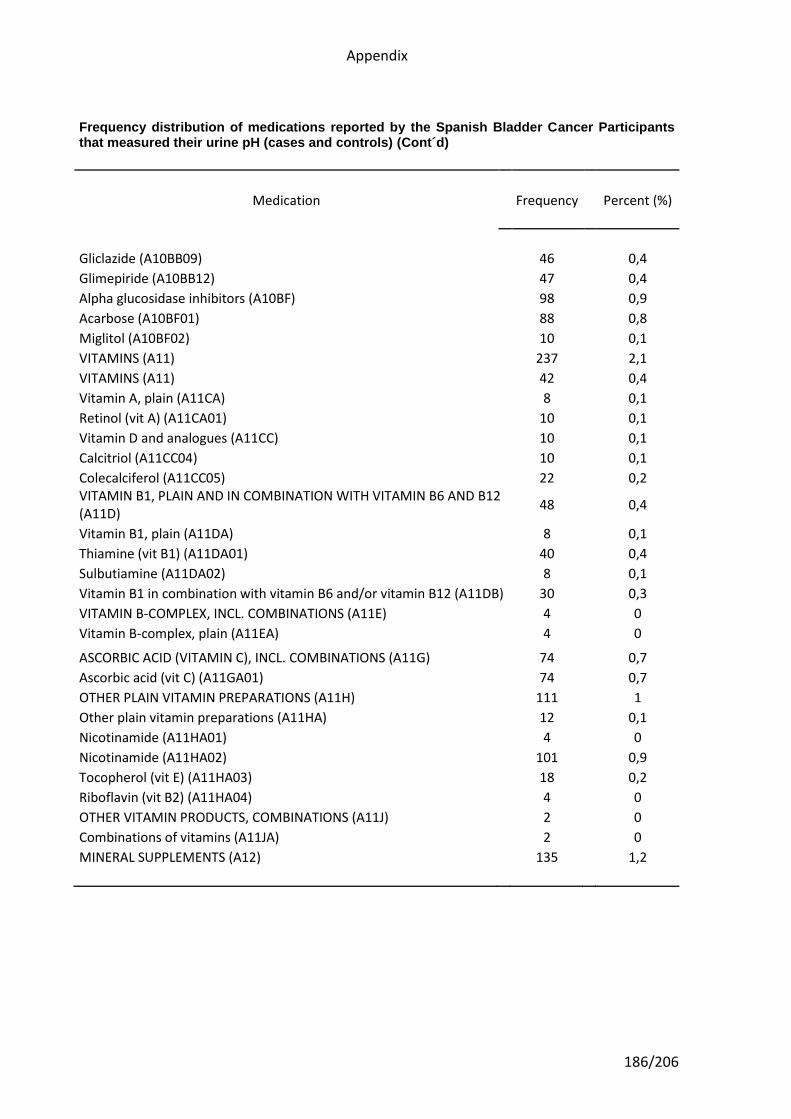
Appendix
186/206
Frequency distribution of medications reported by the Spanish Bladder Cancer Participants that measured their urine pH (cases and controls) (Cont´d)
Medication Frequency Percent (%)
Gliclazide (A10BB09) 46 0,4
Glimepiride (A10BB12) 47 0,4
Alpha glucosidase inhibitors (A10BF) 98 0,9
Acarbose (A10BF01) 88 0,8
Miglitol (A10BF02) 10 0,1
VITAMINS (A11) 237 2,1
VITAMINS (A11) 42 0,4
Vitamin A, plain (A11CA) 8 0,1
Retinol (vit A) (A11CA01) 10 0,1
Vitamin D and analogues (A11CC) 10 0,1
Calcitriol (A11CC04) 10 0,1
Colecalciferol (A11CC05) 22 0,2 VITAMIN B1, PLAIN AND IN COMBINATION WITH VITAMIN B6 AND B12 (A11D)
48 0,4
Vitamin B1, plain (A11DA) 8 0,1
Thiamine (vit B1) (A11DA01) 40 0,4
Sulbutiamine (A11DA02) 8 0,1
Vitamin B1 in combination with vitamin B6 and/or vitamin B12 (A11DB) 30 0,3
VITAMIN B-COMPLEX, INCL. COMBINATIONS (A11E) 4 0
Vitamin B-complex, plain (A11EA) 4 0
ASCORBIC ACID (VITAMIN C), INCL. COMBINATIONS (A11G) 74 0,7
Ascorbic acid (vit C) (A11GA01) 74 0,7
OTHER PLAIN VITAMIN PREPARATIONS (A11H) 111 1
Other plain vitamin preparations (A11HA) 12 0,1
Nicotinamide (A11HA01) 4 0
Nicotinamide (A11HA02) 101 0,9
Tocopherol (vit E) (A11HA03) 18 0,2
Riboflavin (vit B2) (A11HA04) 4 0
OTHER VITAMIN PRODUCTS, COMBINATIONS (A11J) 2 0
Combinations of vitamins (A11JA) 2 0
MINERAL SUPPLEMENTS (A12) 135 1,2
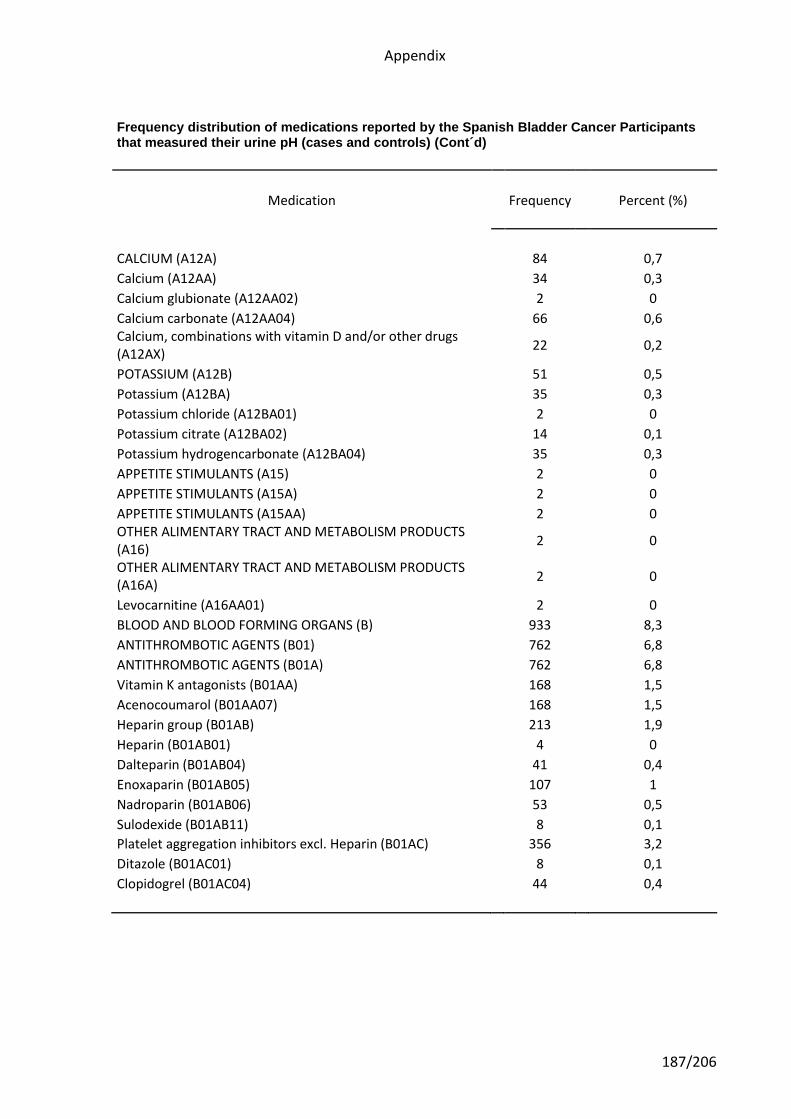
Appendix
187/206
Frequency distribution of medications reported by the Spanish Bladder Cancer Participants that measured their urine pH (cases and controls) (Cont´d)
Medication Frequency Percent (%)
CALCIUM (A12A) 84 0,7
Calcium (A12AA) 34 0,3
Calcium glubionate (A12AA02) 2 0
Calcium carbonate (A12AA04) 66 0,6 Calcium, combinations with vitamin D and/or other drugs (A12AX)
22 0,2
POTASSIUM (A12B) 51 0,5
Potassium (A12BA) 35 0,3
Potassium chloride (A12BA01) 2 0
Potassium citrate (A12BA02) 14 0,1
Potassium hydrogencarbonate (A12BA04) 35 0,3
APPETITE STIMULANTS (A15) 2 0
APPETITE STIMULANTS (A15A) 2 0
APPETITE STIMULANTS (A15AA) 2 0 OTHER ALIMENTARY TRACT AND METABOLISM PRODUCTS (A16)
2 0
OTHER ALIMENTARY TRACT AND METABOLISM PRODUCTS (A16A)
2 0
Levocarnitine (A16AA01) 2 0
BLOOD AND BLOOD FORMING ORGANS (B) 933 8,3
ANTITHROMBOTIC AGENTS (B01) 762 6,8
ANTITHROMBOTIC AGENTS (B01A) 762 6,8
Vitamin K antagonists (B01AA) 168 1,5
Acenocoumarol (B01AA07) 168 1,5
Heparin group (B01AB) 213 1,9
Heparin (B01AB01) 4 0
Dalteparin (B01AB04) 41 0,4
Enoxaparin (B01AB05) 107 1
Nadroparin (B01AB06) 53 0,5
Sulodexide (B01AB11) 8 0,1
Platelet aggregation inhibitors excl. Heparin (B01AC) 356 3,2
Ditazole (B01AC01) 8 0,1
Clopidogrel (B01AC04) 44 0,4
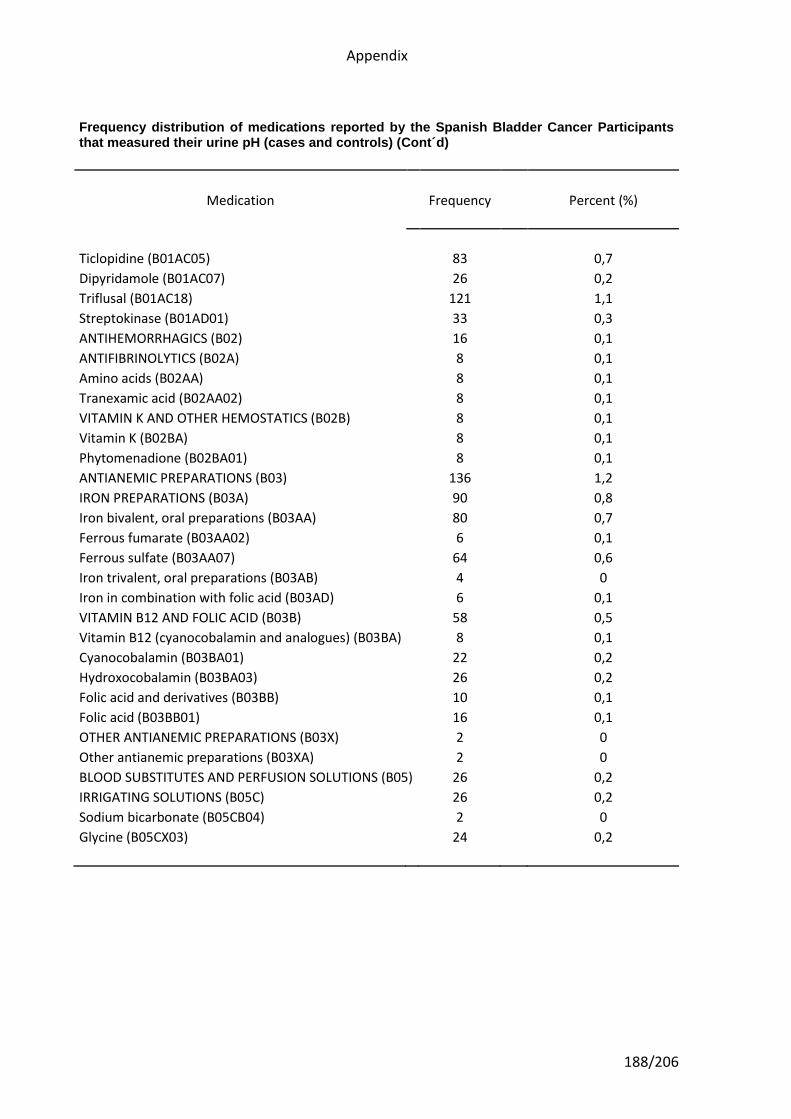
Appendix
188/206
Frequency distribution of medications reported by the Spanish Bladder Cancer Participants that measured their urine pH (cases and controls) (Cont´d)
Medication Frequency Percent (%)
Ticlopidine (B01AC05) 83 0,7
Dipyridamole (B01AC07) 26 0,2
Triflusal (B01AC18) 121 1,1
Streptokinase (B01AD01) 33 0,3
ANTIHEMORRHAGICS (B02) 16 0,1
ANTIFIBRINOLYTICS (B02A) 8 0,1
Amino acids (B02AA) 8 0,1
Tranexamic acid (B02AA02) 8 0,1
VITAMIN K AND OTHER HEMOSTATICS (B02B) 8 0,1
Vitamin K (B02BA) 8 0,1
Phytomenadione (B02BA01) 8 0,1
ANTIANEMIC PREPARATIONS (B03) 136 1,2
IRON PREPARATIONS (B03A) 90 0,8
Iron bivalent, oral preparations (B03AA) 80 0,7
Ferrous fumarate (B03AA02) 6 0,1
Ferrous sulfate (B03AA07) 64 0,6
Iron trivalent, oral preparations (B03AB) 4 0
Iron in combination with folic acid (B03AD) 6 0,1
VITAMIN B12 AND FOLIC ACID (B03B) 58 0,5
Vitamin B12 (cyanocobalamin and analogues) (B03BA) 8 0,1
Cyanocobalamin (B03BA01) 22 0,2
Hydroxocobalamin (B03BA03) 26 0,2
Folic acid and derivatives (B03BB) 10 0,1
Folic acid (B03BB01) 16 0,1
OTHER ANTIANEMIC PREPARATIONS (B03X) 2 0
Other antianemic preparations (B03XA) 2 0
BLOOD SUBSTITUTES AND PERFUSION SOLUTIONS (B05) 26 0,2
IRRIGATING SOLUTIONS (B05C) 26 0,2
Sodium bicarbonate (B05CB04) 2 0
Glycine (B05CX03) 24 0,2
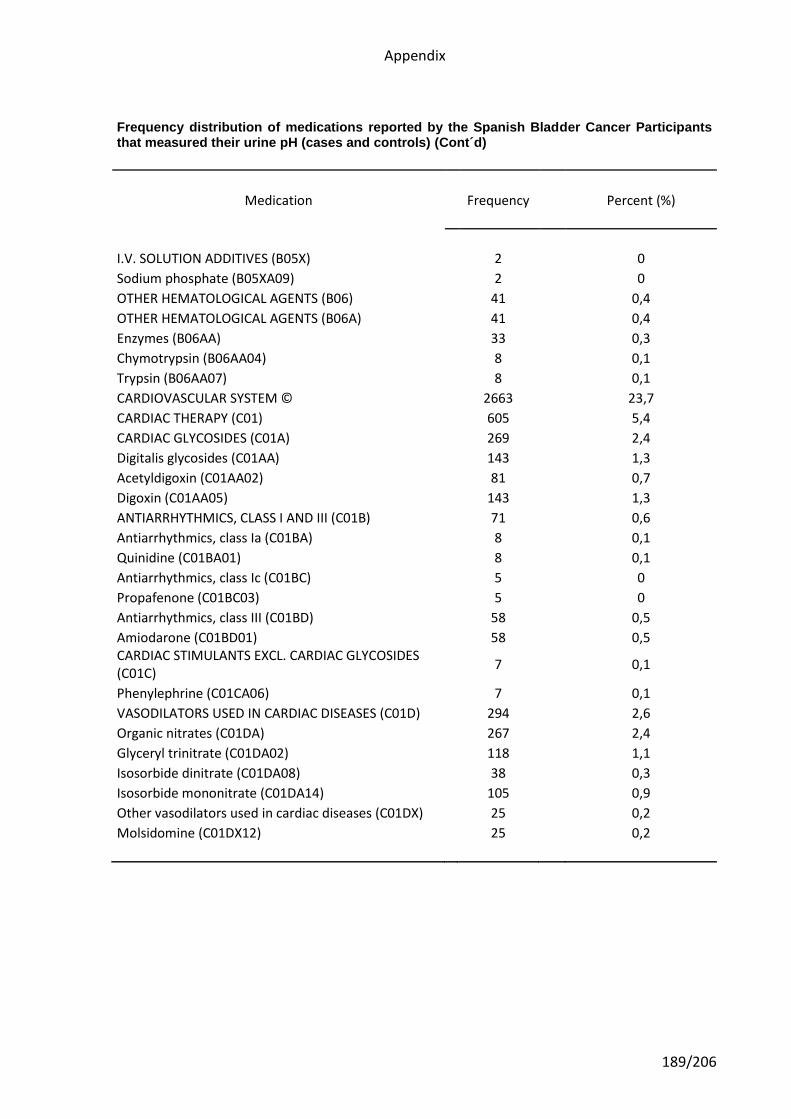
Appendix
189/206
Frequency distribution of medications reported by the Spanish Bladder Cancer Participants that measured their urine pH (cases and controls) (Cont´d)
Medication Frequency Percent (%)
I.V. SOLUTION ADDITIVES (B05X) 2 0
Sodium phosphate (B05XA09) 2 0
OTHER HEMATOLOGICAL AGENTS (B06) 41 0,4
OTHER HEMATOLOGICAL AGENTS (B06A) 41 0,4
Enzymes (B06AA) 33 0,3
Chymotrypsin (B06AA04) 8 0,1
Trypsin (B06AA07) 8 0,1
CARDIOVASCULAR SYSTEM © 2663 23,7
CARDIAC THERAPY (C01) 605 5,4
CARDIAC GLYCOSIDES (C01A) 269 2,4
Digitalis glycosides (C01AA) 143 1,3
Acetyldigoxin (C01AA02) 81 0,7
Digoxin (C01AA05) 143 1,3
ANTIARRHYTHMICS, CLASS I AND III (C01B) 71 0,6
Antiarrhythmics, class Ia (C01BA) 8 0,1
Quinidine (C01BA01) 8 0,1
Antiarrhythmics, class Ic (C01BC) 5 0
Propafenone (C01BC03) 5 0
Antiarrhythmics, class III (C01BD) 58 0,5
Amiodarone (C01BD01) 58 0,5 CARDIAC STIMULANTS EXCL. CARDIAC GLYCOSIDES (C01C)
7 0,1
Phenylephrine (C01CA06) 7 0,1
VASODILATORS USED IN CARDIAC DISEASES (C01D) 294 2,6
Organic nitrates (C01DA) 267 2,4
Glyceryl trinitrate (C01DA02) 118 1,1
Isosorbide dinitrate (C01DA08) 38 0,3
Isosorbide mononitrate (C01DA14) 105 0,9
Other vasodilators used in cardiac diseases (C01DX) 25 0,2
Molsidomine (C01DX12) 25 0,2
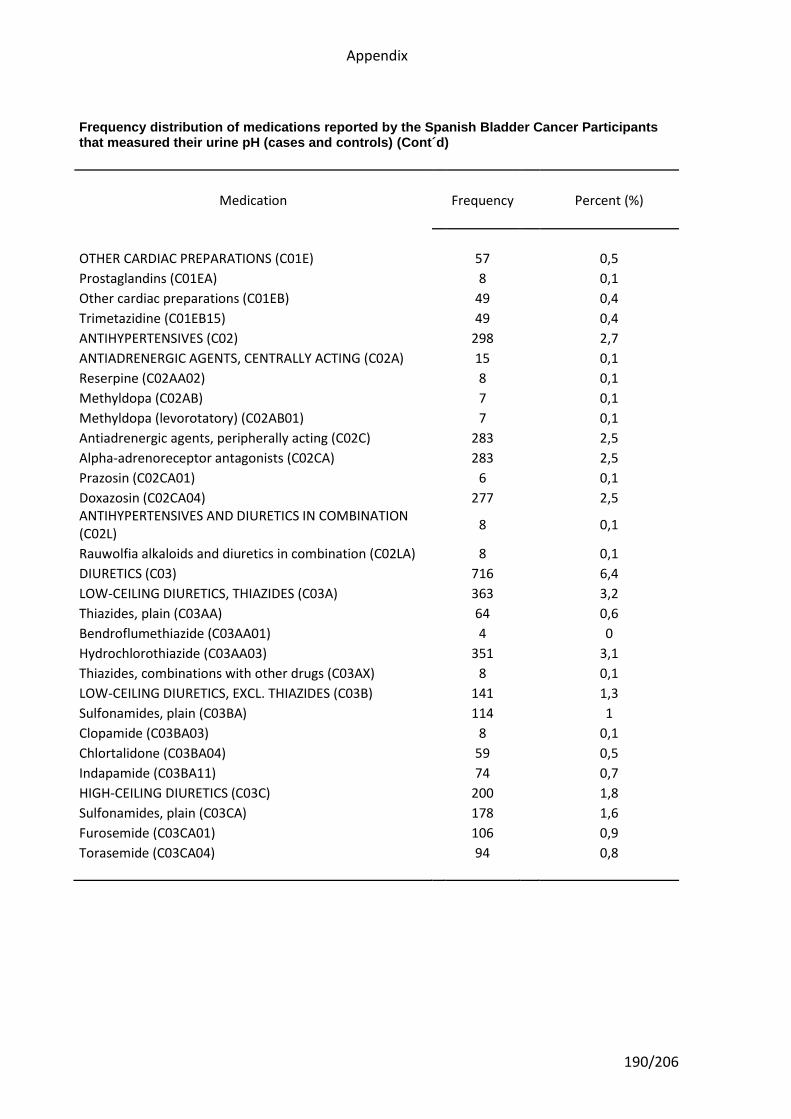
Appendix
190/206
Frequency distribution of medications reported by the Spanish Bladder Cancer Participants that measured their urine pH (cases and controls) (Cont´d)
Medication Frequency Percent (%)
OTHER CARDIAC PREPARATIONS (C01E) 57 0,5
Prostaglandins (C01EA) 8 0,1
Other cardiac preparations (C01EB) 49 0,4
Trimetazidine (C01EB15) 49 0,4
ANTIHYPERTENSIVES (C02) 298 2,7
ANTIADRENERGIC AGENTS, CENTRALLY ACTING (C02A) 15 0,1
Reserpine (C02AA02) 8 0,1
Methyldopa (C02AB) 7 0,1
Methyldopa (levorotatory) (C02AB01) 7 0,1
Antiadrenergic agents, peripherally acting (C02C) 283 2,5
Alpha-adrenoreceptor antagonists (C02CA) 283 2,5
Prazosin (C02CA01) 6 0,1
Doxazosin (C02CA04) 277 2,5 ANTIHYPERTENSIVES AND DIURETICS IN COMBINATION (C02L)
8 0,1
Rauwolfia alkaloids and diuretics in combination (C02LA) 8 0,1
DIURETICS (C03) 716 6,4
LOW-CEILING DIURETICS, THIAZIDES (C03A) 363 3,2
Thiazides, plain (C03AA) 64 0,6
Bendroflumethiazide (C03AA01) 4 0
Hydrochlorothiazide (C03AA03) 351 3,1
Thiazides, combinations with other drugs (C03AX) 8 0,1
LOW-CEILING DIURETICS, EXCL. THIAZIDES (C03B) 141 1,3
Sulfonamides, plain (C03BA) 114 1
Clopamide (C03BA03) 8 0,1
Chlortalidone (C03BA04) 59 0,5
Indapamide (C03BA11) 74 0,7
HIGH-CEILING DIURETICS (C03C) 200 1,8
Sulfonamides, plain (C03CA) 178 1,6
Furosemide (C03CA01) 106 0,9
Torasemide (C03CA04) 94 0,8
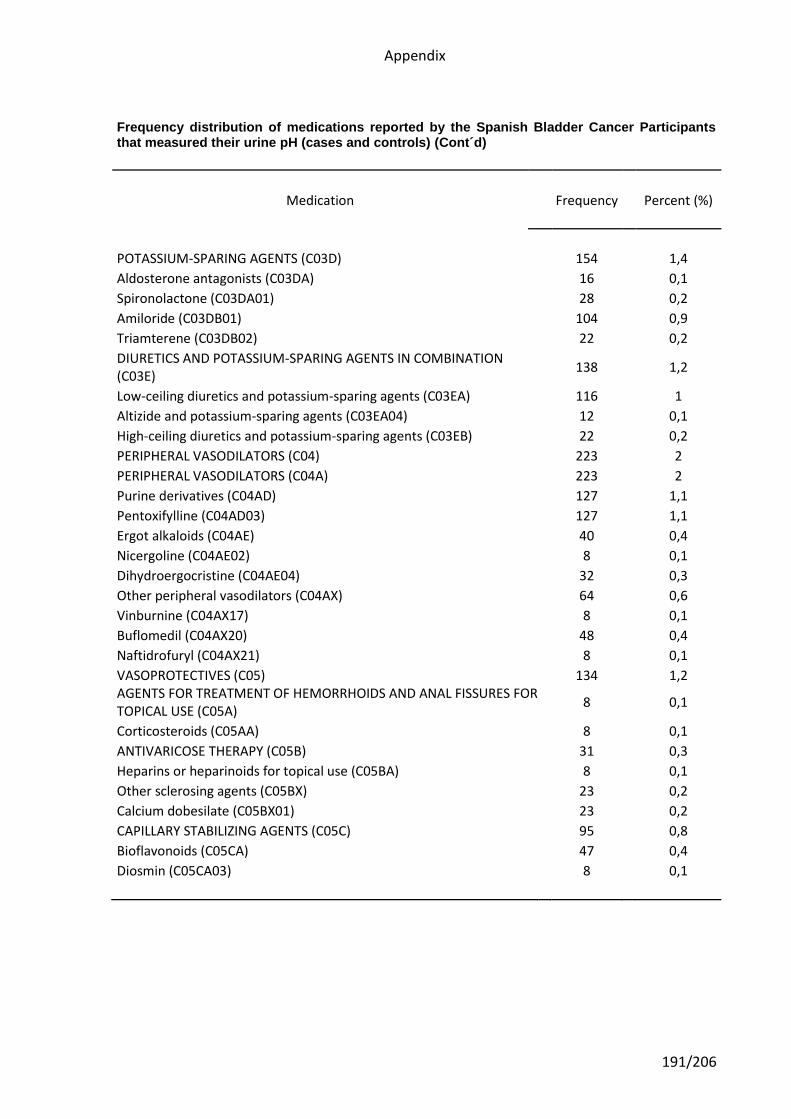
Appendix
191/206
Frequency distribution of medications reported by the Spanish Bladder Cancer Participants that measured their urine pH (cases and controls) (Cont´d)
Medication Frequency Percent (%)
POTASSIUM-SPARING AGENTS (C03D) 154 1,4
Aldosterone antagonists (C03DA) 16 0,1
Spironolactone (C03DA01) 28 0,2
Amiloride (C03DB01) 104 0,9
Triamterene (C03DB02) 22 0,2
DIURETICS AND POTASSIUM-SPARING AGENTS IN COMBINATION (C03E)
138 1,2
Low-ceiling diuretics and potassium-sparing agents (C03EA) 116 1
Altizide and potassium-sparing agents (C03EA04) 12 0,1
High-ceiling diuretics and potassium-sparing agents (C03EB) 22 0,2
PERIPHERAL VASODILATORS (C04) 223 2
PERIPHERAL VASODILATORS (C04A) 223 2
Purine derivatives (C04AD) 127 1,1
Pentoxifylline (C04AD03) 127 1,1
Ergot alkaloids (C04AE) 40 0,4
Nicergoline (C04AE02) 8 0,1
Dihydroergocristine (C04AE04) 32 0,3
Other peripheral vasodilators (C04AX) 64 0,6
Vinburnine (C04AX17) 8 0,1
Buflomedil (C04AX20) 48 0,4
Naftidrofuryl (C04AX21) 8 0,1
VASOPROTECTIVES (C05) 134 1,2 AGENTS FOR TREATMENT OF HEMORRHOIDS AND ANAL FISSURES FOR TOPICAL USE (C05A)
8 0,1
Corticosteroids (C05AA) 8 0,1
ANTIVARICOSE THERAPY (C05B) 31 0,3
Heparins or heparinoids for topical use (C05BA) 8 0,1
Other sclerosing agents (C05BX) 23 0,2
Calcium dobesilate (C05BX01) 23 0,2
CAPILLARY STABILIZING AGENTS (C05C) 95 0,8
Bioflavonoids (C05CA) 47 0,4
Diosmin (C05CA03) 8 0,1
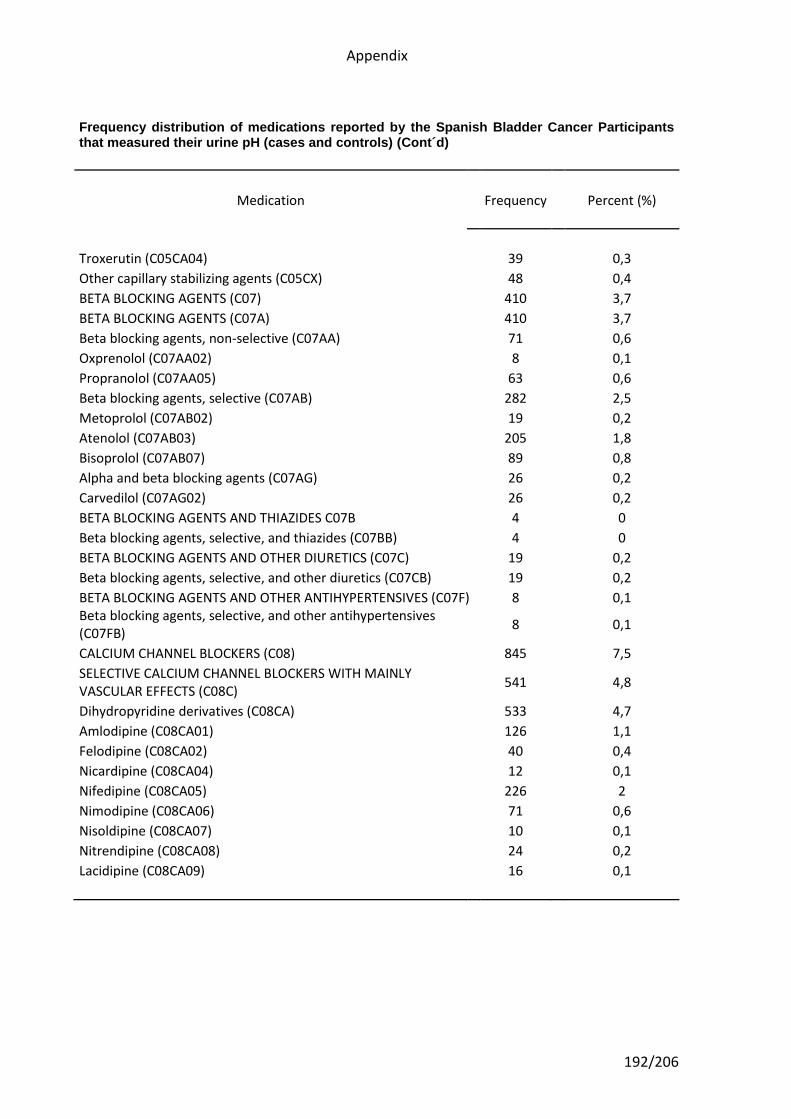
Appendix
192/206
Frequency distribution of medications reported by the Spanish Bladder Cancer Participants that measured their urine pH (cases and controls) (Cont´d)
Medication Frequency Percent (%)
Troxerutin (C05CA04) 39 0,3
Other capillary stabilizing agents (C05CX) 48 0,4
BETA BLOCKING AGENTS (C07) 410 3,7
BETA BLOCKING AGENTS (C07A) 410 3,7
Beta blocking agents, non-selective (C07AA) 71 0,6
Oxprenolol (C07AA02) 8 0,1
Propranolol (C07AA05) 63 0,6
Beta blocking agents, selective (C07AB) 282 2,5
Metoprolol (C07AB02) 19 0,2
Atenolol (C07AB03) 205 1,8
Bisoprolol (C07AB07) 89 0,8
Alpha and beta blocking agents (C07AG) 26 0,2
Carvedilol (C07AG02) 26 0,2
BETA BLOCKING AGENTS AND THIAZIDES C07B 4 0
Beta blocking agents, selective, and thiazides (C07BB) 4 0
BETA BLOCKING AGENTS AND OTHER DIURETICS (C07C) 19 0,2
Beta blocking agents, selective, and other diuretics (C07CB) 19 0,2
BETA BLOCKING AGENTS AND OTHER ANTIHYPERTENSIVES (C07F) 8 0,1 Beta blocking agents, selective, and other antihypertensives (C07FB)
8 0,1
CALCIUM CHANNEL BLOCKERS (C08) 845 7,5
SELECTIVE CALCIUM CHANNEL BLOCKERS WITH MAINLY VASCULAR EFFECTS (C08C)
541 4,8
Dihydropyridine derivatives (C08CA) 533 4,7
Amlodipine (C08CA01) 126 1,1
Felodipine (C08CA02) 40 0,4
Nicardipine (C08CA04) 12 0,1
Nifedipine (C08CA05) 226 2
Nimodipine (C08CA06) 71 0,6
Nisoldipine (C08CA07) 10 0,1
Nitrendipine (C08CA08) 24 0,2
Lacidipine (C08CA09) 16 0,1
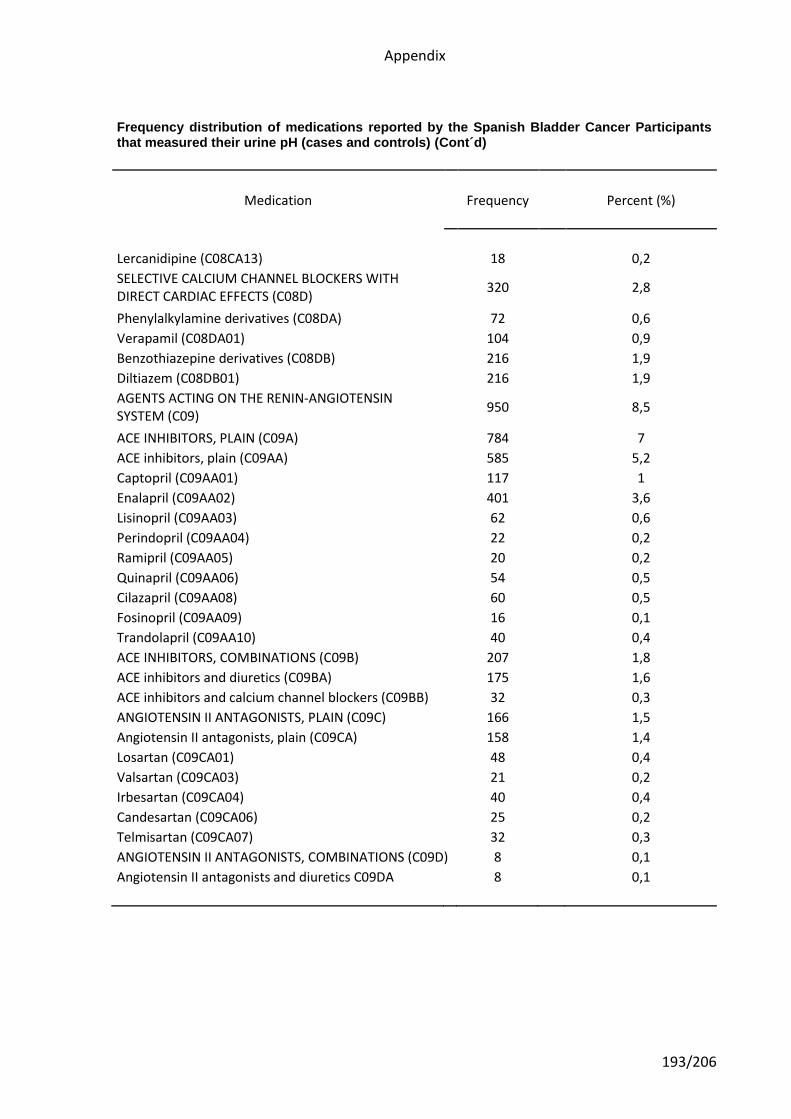
Appendix
193/206
Frequency distribution of medications reported by the Spanish Bladder Cancer Participants that measured their urine pH (cases and controls) (Cont´d)
Medication Frequency Percent (%)
Lercanidipine (C08CA13) 18 0,2
SELECTIVE CALCIUM CHANNEL BLOCKERS WITH DIRECT CARDIAC EFFECTS (C08D)
320 2,8
Phenylalkylamine derivatives (C08DA) 72 0,6
Verapamil (C08DA01) 104 0,9
Benzothiazepine derivatives (C08DB) 216 1,9
Diltiazem (C08DB01) 216 1,9
AGENTS ACTING ON THE RENIN-ANGIOTENSIN SYSTEM (C09)
950 8,5
ACE INHIBITORS, PLAIN (C09A) 784 7
ACE inhibitors, plain (C09AA) 585 5,2
Captopril (C09AA01) 117 1
Enalapril (C09AA02) 401 3,6
Lisinopril (C09AA03) 62 0,6
Perindopril (C09AA04) 22 0,2
Ramipril (C09AA05) 20 0,2
Quinapril (C09AA06) 54 0,5
Cilazapril (C09AA08) 60 0,5
Fosinopril (C09AA09) 16 0,1
Trandolapril (C09AA10) 40 0,4
ACE INHIBITORS, COMBINATIONS (C09B) 207 1,8
ACE inhibitors and diuretics (C09BA) 175 1,6
ACE inhibitors and calcium channel blockers (C09BB) 32 0,3
ANGIOTENSIN II ANTAGONISTS, PLAIN (C09C) 166 1,5
Angiotensin II antagonists, plain (C09CA) 158 1,4
Losartan (C09CA01) 48 0,4
Valsartan (C09CA03) 21 0,2
Irbesartan (C09CA04) 40 0,4
Candesartan (C09CA06) 25 0,2
Telmisartan (C09CA07) 32 0,3
ANGIOTENSIN II ANTAGONISTS, COMBINATIONS (C09D) 8 0,1
Angiotensin II antagonists and diuretics C09DA 8 0,1
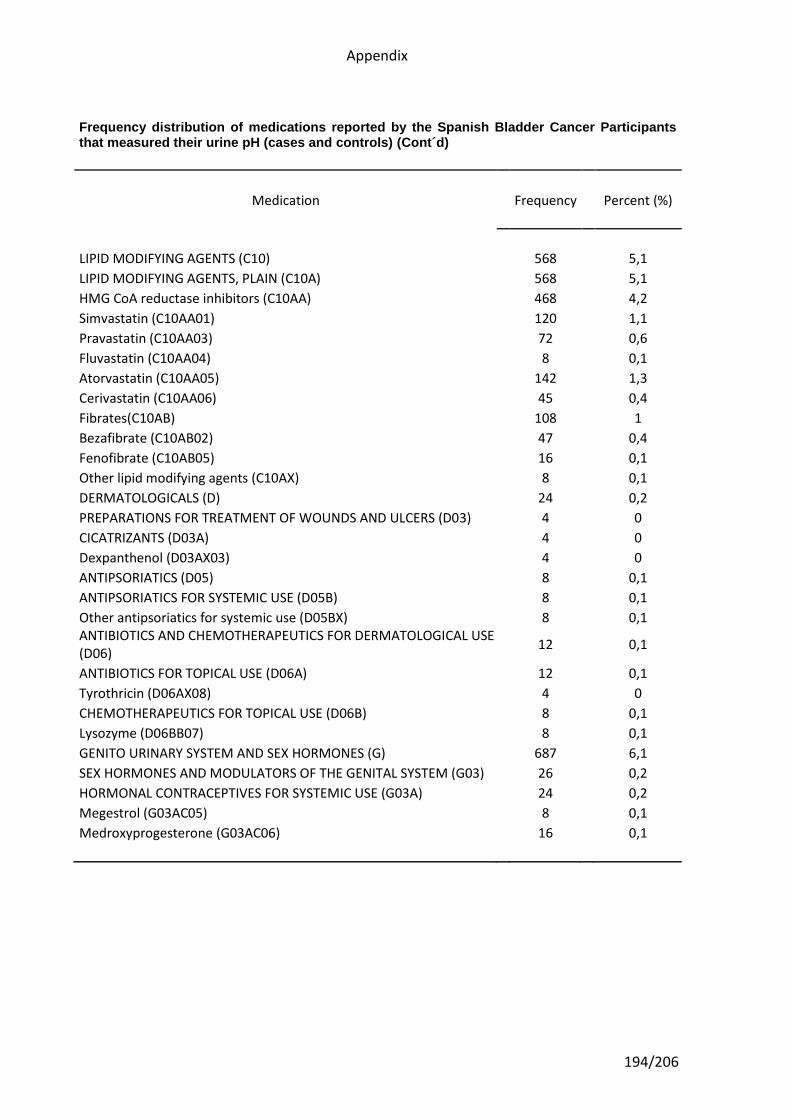
Appendix
194/206
Frequency distribution of medications reported by the Spanish Bladder Cancer Participants that measured their urine pH (cases and controls) (Cont´d)
Medication Frequency Percent (%)
LIPID MODIFYING AGENTS (C10) 568 5,1
LIPID MODIFYING AGENTS, PLAIN (C10A) 568 5,1
HMG CoA reductase inhibitors (C10AA) 468 4,2
Simvastatin (C10AA01) 120 1,1
Pravastatin (C10AA03) 72 0,6
Fluvastatin (C10AA04) 8 0,1
Atorvastatin (C10AA05) 142 1,3
Cerivastatin (C10AA06) 45 0,4
Fibrates(C10AB) 108 1
Bezafibrate (C10AB02) 47 0,4
Fenofibrate (C10AB05) 16 0,1
Other lipid modifying agents (C10AX) 8 0,1
DERMATOLOGICALS (D) 24 0,2
PREPARATIONS FOR TREATMENT OF WOUNDS AND ULCERS (D03) 4 0
CICATRIZANTS (D03A) 4 0
Dexpanthenol (D03AX03) 4 0
ANTIPSORIATICS (D05) 8 0,1
ANTIPSORIATICS FOR SYSTEMIC USE (D05B) 8 0,1
Other antipsoriatics for systemic use (D05BX) 8 0,1 ANTIBIOTICS AND CHEMOTHERAPEUTICS FOR DERMATOLOGICAL USE (D06)
12 0,1
ANTIBIOTICS FOR TOPICAL USE (D06A) 12 0,1
Tyrothricin (D06AX08) 4 0
CHEMOTHERAPEUTICS FOR TOPICAL USE (D06B) 8 0,1
Lysozyme (D06BB07) 8 0,1
GENITO URINARY SYSTEM AND SEX HORMONES (G) 687 6,1
SEX HORMONES AND MODULATORS OF THE GENITAL SYSTEM (G03) 26 0,2
HORMONAL CONTRACEPTIVES FOR SYSTEMIC USE (G03A) 24 0,2
Megestrol (G03AC05) 8 0,1
Medroxyprogesterone (G03AC06) 16 0,1
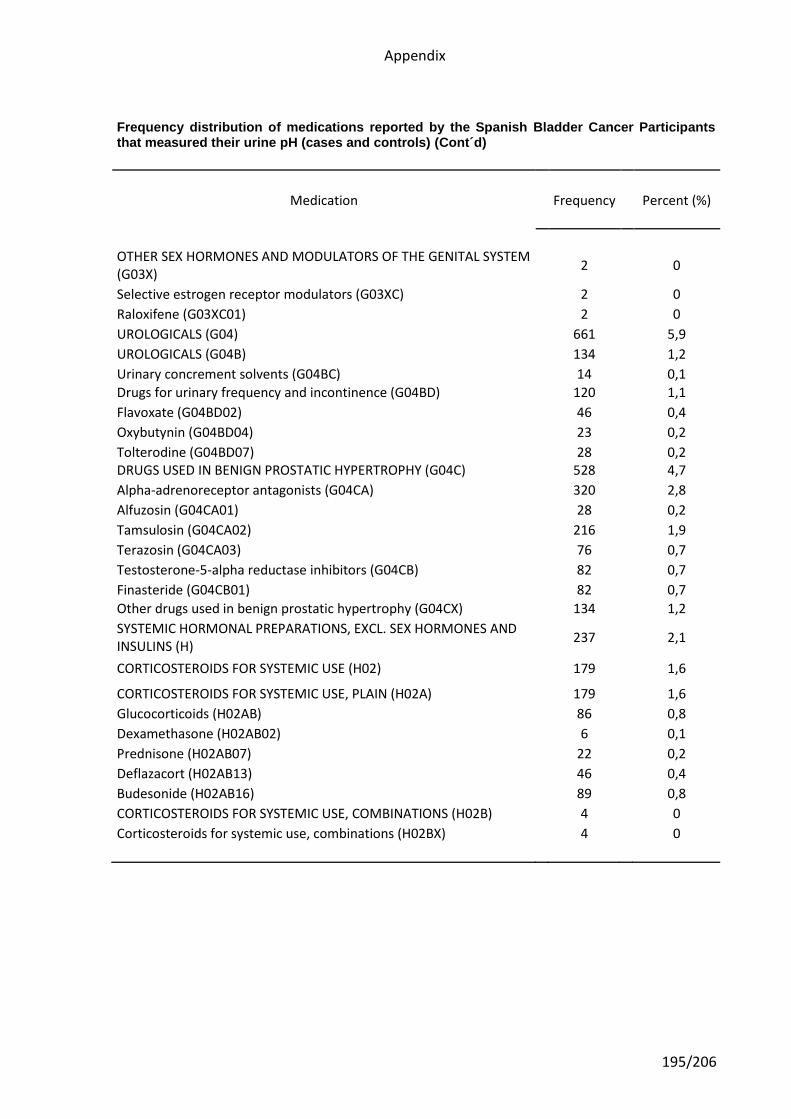
Appendix
195/206
Frequency distribution of medications reported by the Spanish Bladder Cancer Participants that measured their urine pH (cases and controls) (Cont´d)
Medication Frequency Percent (%)
OTHER SEX HORMONES AND MODULATORS OF THE GENITAL SYSTEM (G03X)
2 0
Selective estrogen receptor modulators (G03XC) 2 0
Raloxifene (G03XC01) 2 0
UROLOGICALS (G04) 661 5,9
UROLOGICALS (G04B) 134 1,2
Urinary concrement solvents (G04BC) 14 0,1 Drugs for urinary frequency and incontinence (G04BD) 120 1,1
Flavoxate (G04BD02) 46 0,4
Oxybutynin (G04BD04) 23 0,2
Tolterodine (G04BD07) 28 0,2 DRUGS USED IN BENIGN PROSTATIC HYPERTROPHY (G04C) 528 4,7
Alpha-adrenoreceptor antagonists (G04CA) 320 2,8
Alfuzosin (G04CA01) 28 0,2
Tamsulosin (G04CA02) 216 1,9
Terazosin (G04CA03) 76 0,7
Testosterone-5-alpha reductase inhibitors (G04CB) 82 0,7
Finasteride (G04CB01) 82 0,7
Other drugs used in benign prostatic hypertrophy (G04CX) 134 1,2
SYSTEMIC HORMONAL PREPARATIONS, EXCL. SEX HORMONES AND INSULINS (H)
237 2,1
CORTICOSTEROIDS FOR SYSTEMIC USE (H02) 179 1,6
CORTICOSTEROIDS FOR SYSTEMIC USE, PLAIN (H02A) 179 1,6
Glucocorticoids (H02AB) 86 0,8
Dexamethasone (H02AB02) 6 0,1
Prednisone (H02AB07) 22 0,2
Deflazacort (H02AB13) 46 0,4
Budesonide (H02AB16) 89 0,8
CORTICOSTEROIDS FOR SYSTEMIC USE, COMBINATIONS (H02B) 4 0
Corticosteroids for systemic use, combinations (H02BX) 4 0
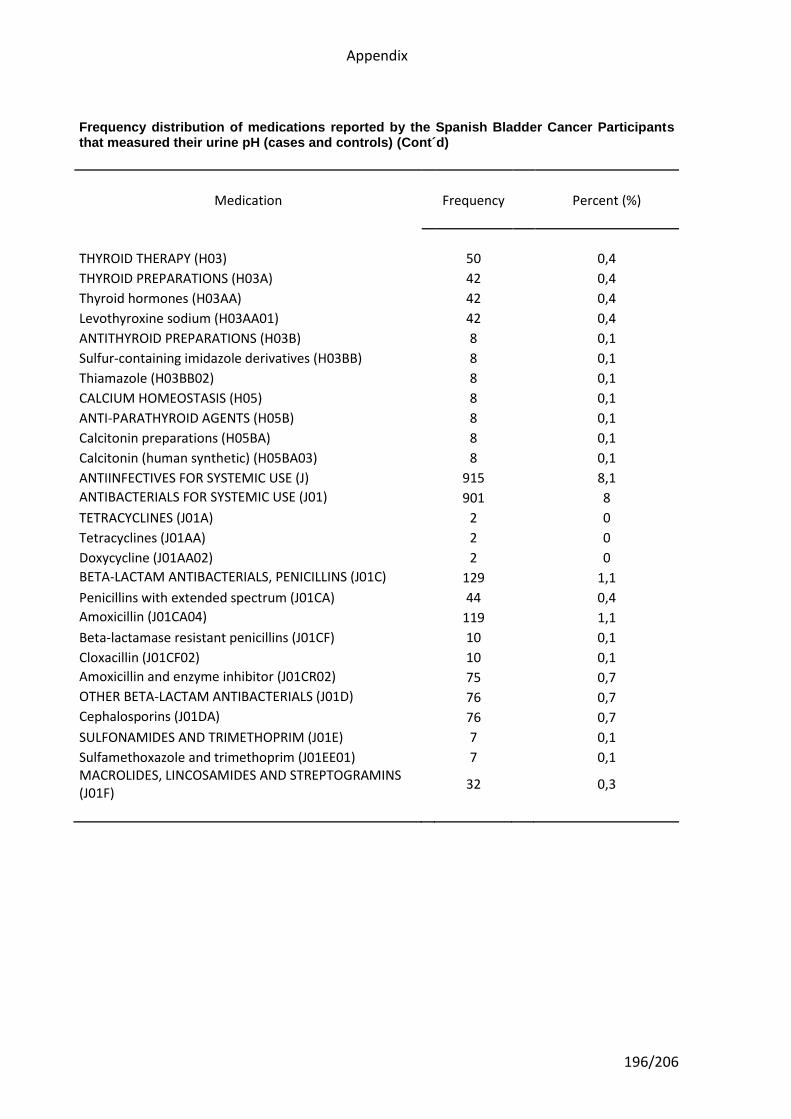
Appendix
196/206
Frequency distribution of medications reported by the Spanish Bladder Cancer Participants that measured their urine pH (cases and controls) (Cont´d)
Medication Frequency Percent (%)
THYROID THERAPY (H03) 50 0,4
THYROID PREPARATIONS (H03A) 42 0,4
Thyroid hormones (H03AA) 42 0,4
Levothyroxine sodium (H03AA01) 42 0,4
ANTITHYROID PREPARATIONS (H03B) 8 0,1
Sulfur-containing imidazole derivatives (H03BB) 8 0,1
Thiamazole (H03BB02) 8 0,1
CALCIUM HOMEOSTASIS (H05) 8 0,1
ANTI-PARATHYROID AGENTS (H05B) 8 0,1
Calcitonin preparations (H05BA) 8 0,1
Calcitonin (human synthetic) (H05BA03) 8 0,1
ANTIINFECTIVES FOR SYSTEMIC USE (J) 915 8,1
ANTIBACTERIALS FOR SYSTEMIC USE (J01) 901 8
TETRACYCLINES (J01A) 2 0
Tetracyclines (J01AA) 2 0
Doxycycline (J01AA02) 2 0
BETA-LACTAM ANTIBACTERIALS, PENICILLINS (J01C) 129 1,1
Penicillins with extended spectrum (J01CA) 44 0,4
Amoxicillin (J01CA04) 119 1,1
Beta-lactamase resistant penicillins (J01CF) 10 0,1
Cloxacillin (J01CF02) 10 0,1
Amoxicillin and enzyme inhibitor (J01CR02) 75 0,7
OTHER BETA-LACTAM ANTIBACTERIALS (J01D) 76 0,7
Cephalosporins (J01DA) 76 0,7
SULFONAMIDES AND TRIMETHOPRIM (J01E) 7 0,1
Sulfamethoxazole and trimethoprim (J01EE01) 7 0,1 MACROLIDES, LINCOSAMIDES AND STREPTOGRAMINS (J01F)
32 0,3
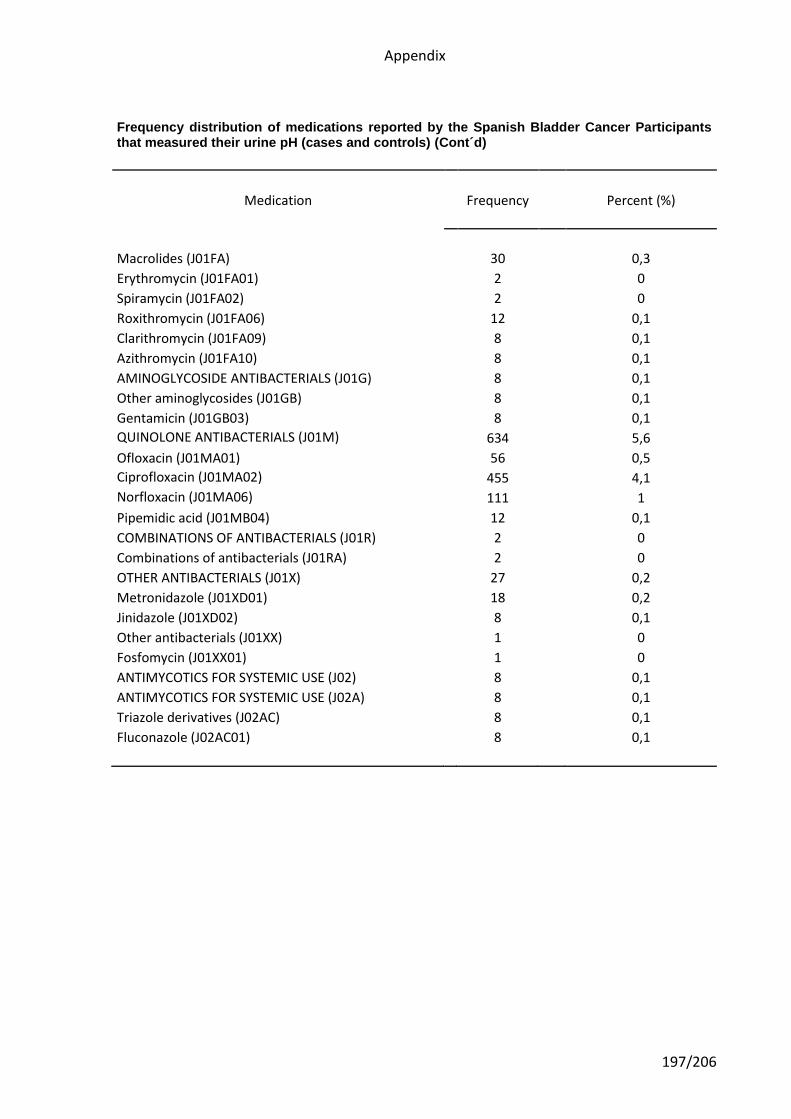
Appendix
197/206
Frequency distribution of medications reported by the Spanish Bladder Cancer Participants that measured their urine pH (cases and controls) (Cont´d)
Medication Frequency Percent (%)
Macrolides (J01FA) 30 0,3
Erythromycin (J01FA01) 2 0
Spiramycin (J01FA02) 2 0
Roxithromycin (J01FA06) 12 0,1
Clarithromycin (J01FA09) 8 0,1
Azithromycin (J01FA10) 8 0,1
AMINOGLYCOSIDE ANTIBACTERIALS (J01G) 8 0,1
Other aminoglycosides (J01GB) 8 0,1
Gentamicin (J01GB03) 8 0,1
QUINOLONE ANTIBACTERIALS (J01M) 634 5,6
Ofloxacin (J01MA01) 56 0,5
Ciprofloxacin (J01MA02) 455 4,1
Norfloxacin (J01MA06) 111 1
Pipemidic acid (J01MB04) 12 0,1
COMBINATIONS OF ANTIBACTERIALS (J01R) 2 0
Combinations of antibacterials (J01RA) 2 0
OTHER ANTIBACTERIALS (J01X) 27 0,2
Metronidazole (J01XD01) 18 0,2
Jinidazole (J01XD02) 8 0,1
Other antibacterials (J01XX) 1 0
Fosfomycin (J01XX01) 1 0
ANTIMYCOTICS FOR SYSTEMIC USE (J02) 8 0,1
ANTIMYCOTICS FOR SYSTEMIC USE (J02A) 8 0,1
Triazole derivatives (J02AC) 8 0,1
Fluconazole (J02AC01) 8 0,1
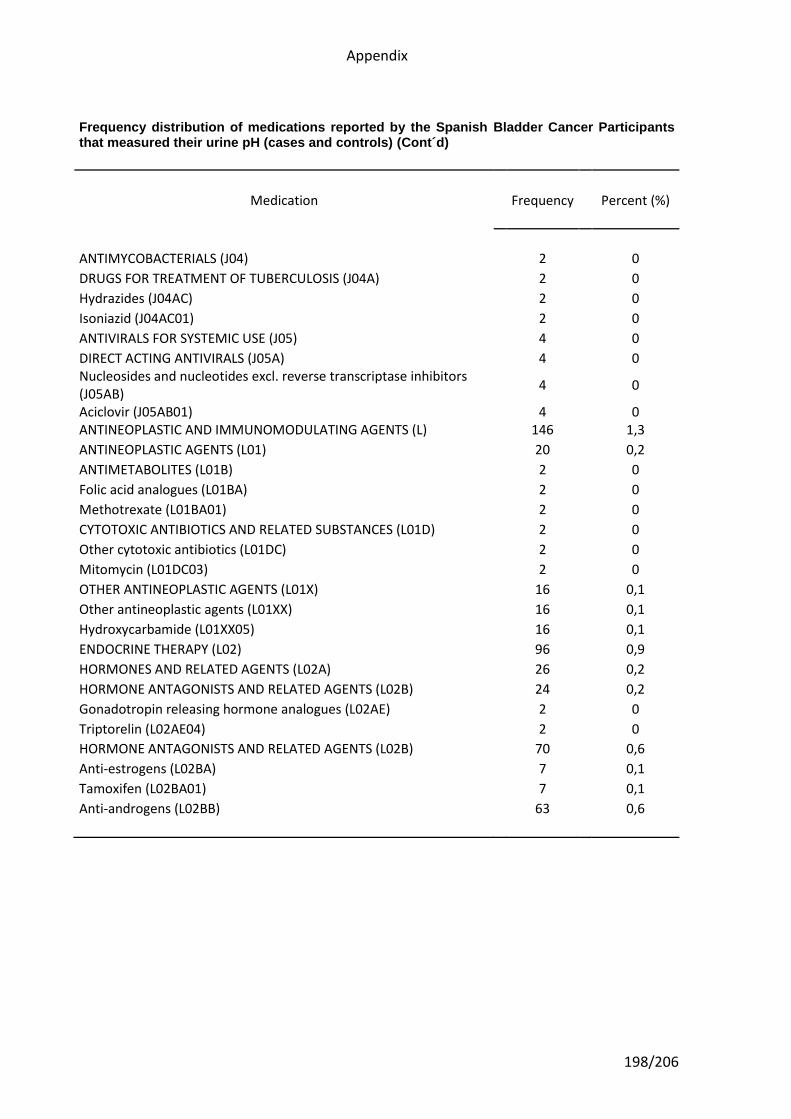
Appendix
198/206
Frequency distribution of medications reported by the Spanish Bladder Cancer Participants that measured their urine pH (cases and controls) (Cont´d)
Medication Frequency Percent (%)
ANTIMYCOBACTERIALS (J04) 2 0
DRUGS FOR TREATMENT OF TUBERCULOSIS (J04A) 2 0
Hydrazides (J04AC) 2 0
Isoniazid (J04AC01) 2 0
ANTIVIRALS FOR SYSTEMIC USE (J05) 4 0
DIRECT ACTING ANTIVIRALS (J05A) 4 0 Nucleosides and nucleotides excl. reverse transcriptase inhibitors (J05AB)
4 0
Aciclovir (J05AB01) 4 0 ANTINEOPLASTIC AND IMMUNOMODULATING AGENTS (L) 146 1,3
ANTINEOPLASTIC AGENTS (L01) 20 0,2
ANTIMETABOLITES (L01B) 2 0
Folic acid analogues (L01BA) 2 0
Methotrexate (L01BA01) 2 0
CYTOTOXIC ANTIBIOTICS AND RELATED SUBSTANCES (L01D) 2 0
Other cytotoxic antibiotics (L01DC) 2 0
Mitomycin (L01DC03) 2 0
OTHER ANTINEOPLASTIC AGENTS (L01X) 16 0,1
Other antineoplastic agents (L01XX) 16 0,1
Hydroxycarbamide (L01XX05) 16 0,1
ENDOCRINE THERAPY (L02) 96 0,9
HORMONES AND RELATED AGENTS (L02A) 26 0,2
HORMONE ANTAGONISTS AND RELATED AGENTS (L02B) 24 0,2
Gonadotropin releasing hormone analogues (L02AE) 2 0
Triptorelin (L02AE04) 2 0
HORMONE ANTAGONISTS AND RELATED AGENTS (L02B) 70 0,6
Anti-estrogens (L02BA) 7 0,1
Tamoxifen (L02BA01) 7 0,1
Anti-androgens (L02BB) 63 0,6
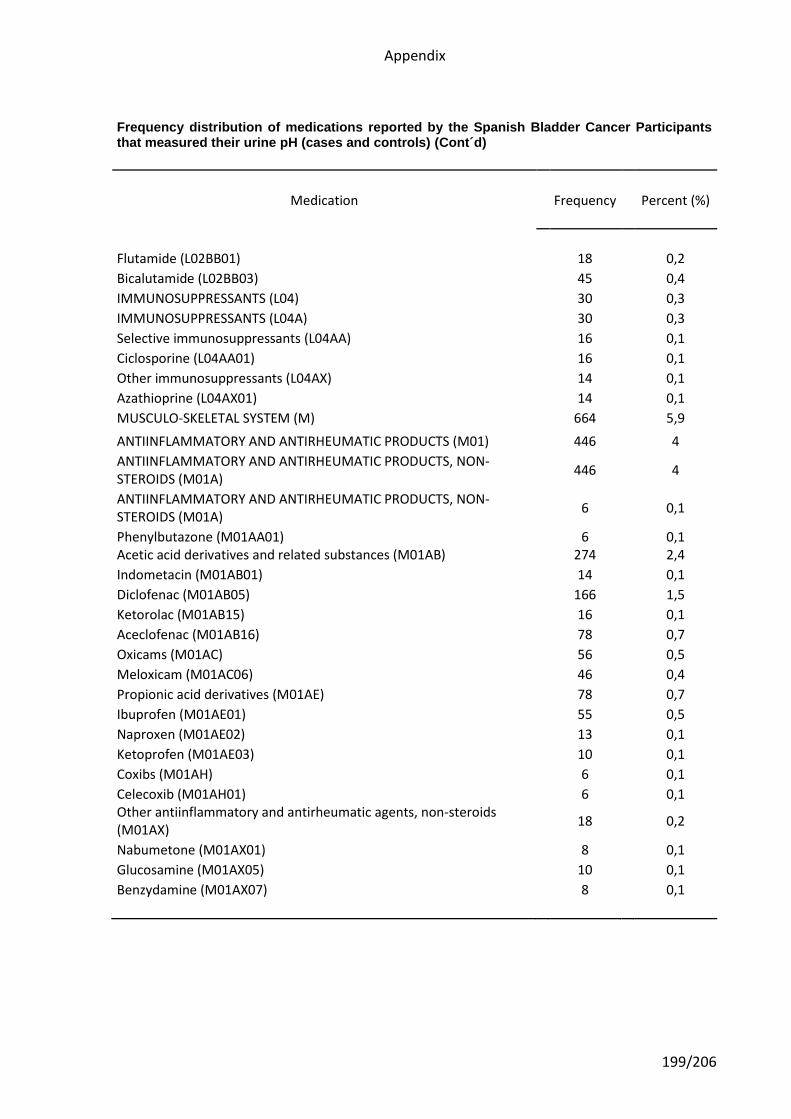
Appendix
199/206
Frequency distribution of medications reported by the Spanish Bladder Cancer Participants that measured their urine pH (cases and controls) (Cont´d)
Medication Frequency Percent (%)
Flutamide (L02BB01) 18 0,2
Bicalutamide (L02BB03) 45 0,4
IMMUNOSUPPRESSANTS (L04) 30 0,3
IMMUNOSUPPRESSANTS (L04A) 30 0,3
Selective immunosuppressants (L04AA) 16 0,1
Ciclosporine (L04AA01) 16 0,1
Other immunosuppressants (L04AX) 14 0,1
Azathioprine (L04AX01) 14 0,1
MUSCULO-SKELETAL SYSTEM (M) 664 5,9
ANTIINFLAMMATORY AND ANTIRHEUMATIC PRODUCTS (M01) 446 4
ANTIINFLAMMATORY AND ANTIRHEUMATIC PRODUCTS, NON-STEROIDS (M01A)
446 4
ANTIINFLAMMATORY AND ANTIRHEUMATIC PRODUCTS, NON-STEROIDS (M01A)
6 0,1
Phenylbutazone (M01AA01) 6 0,1 Acetic acid derivatives and related substances (M01AB) 274 2,4
Indometacin (M01AB01) 14 0,1
Diclofenac (M01AB05) 166 1,5
Ketorolac (M01AB15) 16 0,1
Aceclofenac (M01AB16) 78 0,7
Oxicams (M01AC) 56 0,5
Meloxicam (M01AC06) 46 0,4
Propionic acid derivatives (M01AE) 78 0,7
Ibuprofen (M01AE01) 55 0,5
Naproxen (M01AE02) 13 0,1
Ketoprofen (M01AE03) 10 0,1
Coxibs (M01AH) 6 0,1
Celecoxib (M01AH01) 6 0,1 Other antiinflammatory and antirheumatic agents, non-steroids (M01AX)
18 0,2
Nabumetone (M01AX01) 8 0,1
Glucosamine (M01AX05) 10 0,1
Benzydamine (M01AX07) 8 0,1
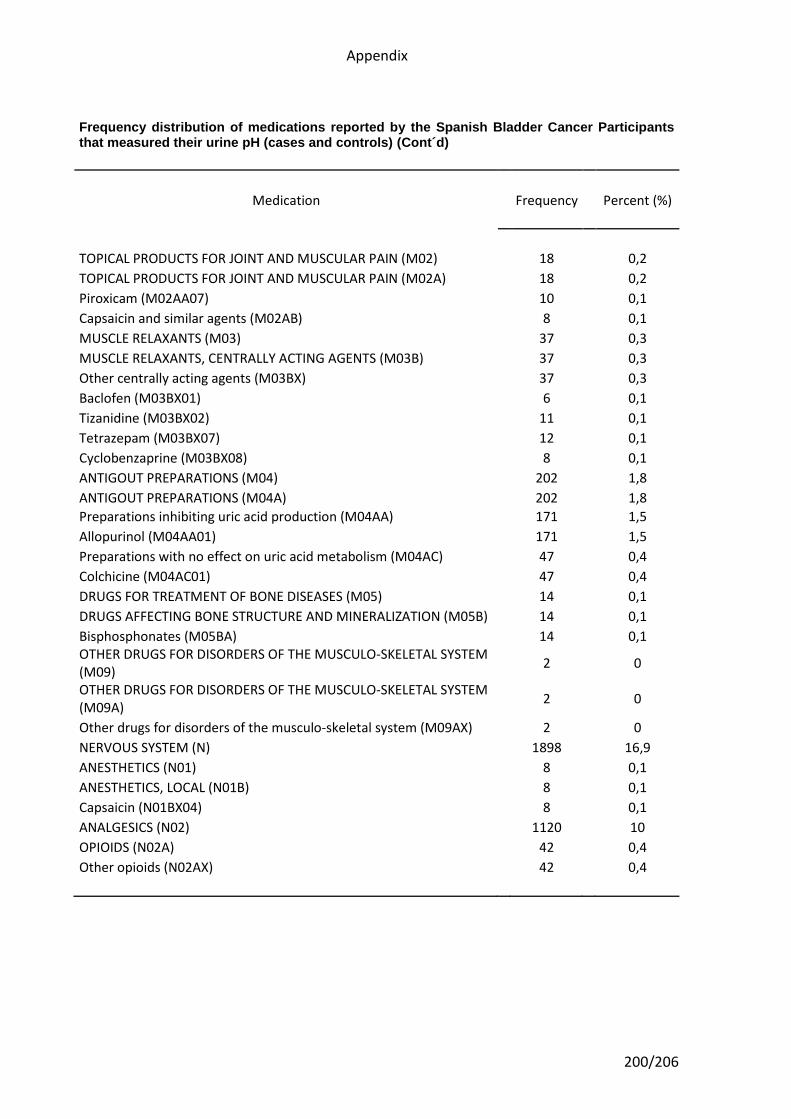
Appendix
200/206
Frequency distribution of medications reported by the Spanish Bladder Cancer Participants that measured their urine pH (cases and controls) (Cont´d)
Medication Frequency Percent (%)
TOPICAL PRODUCTS FOR JOINT AND MUSCULAR PAIN (M02) 18 0,2
TOPICAL PRODUCTS FOR JOINT AND MUSCULAR PAIN (M02A) 18 0,2
Piroxicam (M02AA07) 10 0,1
Capsaicin and similar agents (M02AB) 8 0,1
MUSCLE RELAXANTS (M03) 37 0,3
MUSCLE RELAXANTS, CENTRALLY ACTING AGENTS (M03B) 37 0,3
Other centrally acting agents (M03BX) 37 0,3
Baclofen (M03BX01) 6 0,1
Tizanidine (M03BX02) 11 0,1
Tetrazepam (M03BX07) 12 0,1
Cyclobenzaprine (M03BX08) 8 0,1
ANTIGOUT PREPARATIONS (M04) 202 1,8
ANTIGOUT PREPARATIONS (M04A) 202 1,8
Preparations inhibiting uric acid production (M04AA) 171 1,5
Allopurinol (M04AA01) 171 1,5
Preparations with no effect on uric acid metabolism (M04AC) 47 0,4
Colchicine (M04AC01) 47 0,4
DRUGS FOR TREATMENT OF BONE DISEASES (M05) 14 0,1
DRUGS AFFECTING BONE STRUCTURE AND MINERALIZATION (M05B) 14 0,1
Bisphosphonates (M05BA) 14 0,1 OTHER DRUGS FOR DISORDERS OF THE MUSCULO-SKELETAL SYSTEM (M09)
2 0
OTHER DRUGS FOR DISORDERS OF THE MUSCULO-SKELETAL SYSTEM (M09A)
2 0
Other drugs for disorders of the musculo-skeletal system (M09AX) 2 0
NERVOUS SYSTEM (N) 1898 16,9
ANESTHETICS (N01) 8 0,1
ANESTHETICS, LOCAL (N01B) 8 0,1
Capsaicin (N01BX04) 8 0,1
ANALGESICS (N02) 1120 10
OPIOIDS (N02A) 42 0,4
Other opioids (N02AX) 42 0,4
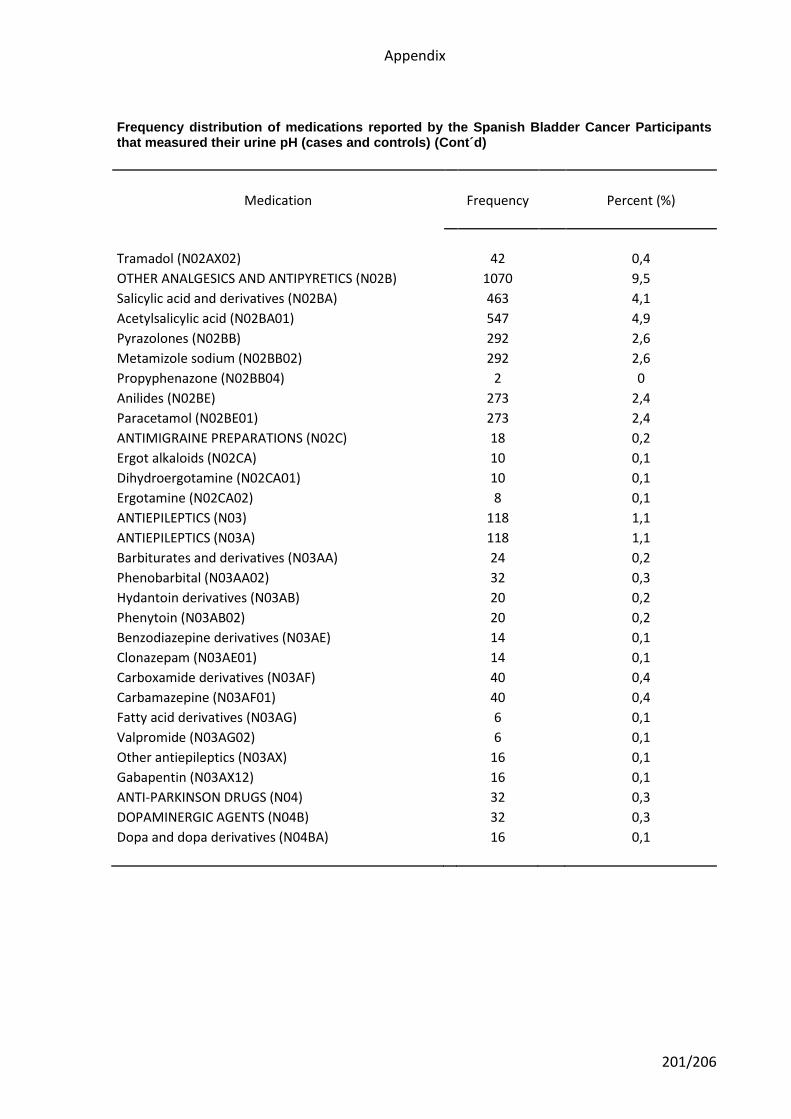
Appendix
201/206
Frequency distribution of medications reported by the Spanish Bladder Cancer Participants that measured their urine pH (cases and controls) (Cont´d)
Medication Frequency Percent (%)
Tramadol (N02AX02) 42 0,4
OTHER ANALGESICS AND ANTIPYRETICS (N02B) 1070 9,5
Salicylic acid and derivatives (N02BA) 463 4,1
Acetylsalicylic acid (N02BA01) 547 4,9
Pyrazolones (N02BB) 292 2,6
Metamizole sodium (N02BB02) 292 2,6
Propyphenazone (N02BB04) 2 0
Anilides (N02BE) 273 2,4
Paracetamol (N02BE01) 273 2,4
ANTIMIGRAINE PREPARATIONS (N02C) 18 0,2
Ergot alkaloids (N02CA) 10 0,1
Dihydroergotamine (N02CA01) 10 0,1
Ergotamine (N02CA02) 8 0,1
ANTIEPILEPTICS (N03) 118 1,1
ANTIEPILEPTICS (N03A) 118 1,1
Barbiturates and derivatives (N03AA) 24 0,2
Phenobarbital (N03AA02) 32 0,3
Hydantoin derivatives (N03AB) 20 0,2
Phenytoin (N03AB02) 20 0,2
Benzodiazepine derivatives (N03AE) 14 0,1
Clonazepam (N03AE01) 14 0,1
Carboxamide derivatives (N03AF) 40 0,4
Carbamazepine (N03AF01) 40 0,4
Fatty acid derivatives (N03AG) 6 0,1
Valpromide (N03AG02) 6 0,1
Other antiepileptics (N03AX) 16 0,1
Gabapentin (N03AX12) 16 0,1
ANTI-PARKINSON DRUGS (N04) 32 0,3
DOPAMINERGIC AGENTS (N04B) 32 0,3
Dopa and dopa derivatives (N04BA) 16 0,1
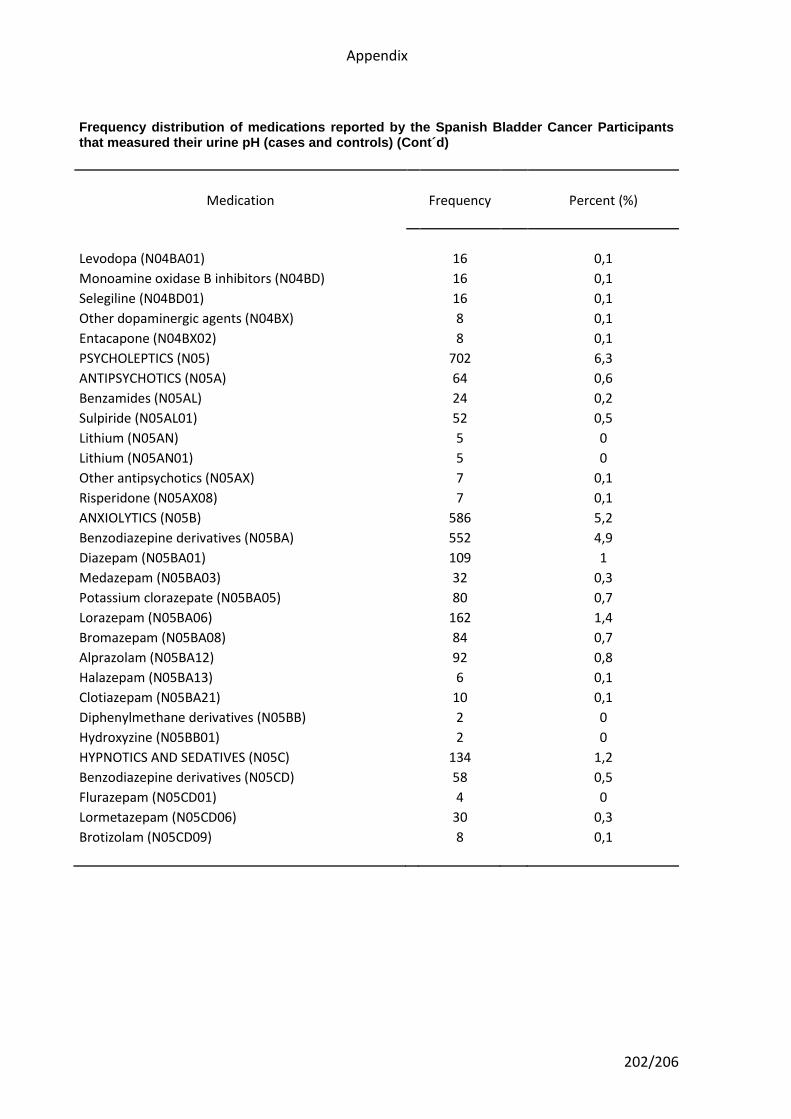
Appendix
202/206
Frequency distribution of medications reported by the Spanish Bladder Cancer Participants that measured their urine pH (cases and controls) (Cont´d)
Medication Frequency Percent (%)
Levodopa (N04BA01) 16 0,1
Monoamine oxidase B inhibitors (N04BD) 16 0,1
Selegiline (N04BD01) 16 0,1
Other dopaminergic agents (N04BX) 8 0,1
Entacapone (N04BX02) 8 0,1
PSYCHOLEPTICS (N05) 702 6,3
ANTIPSYCHOTICS (N05A) 64 0,6
Benzamides (N05AL) 24 0,2
Sulpiride (N05AL01) 52 0,5
Lithium (N05AN) 5 0
Lithium (N05AN01) 5 0
Other antipsychotics (N05AX) 7 0,1
Risperidone (N05AX08) 7 0,1
ANXIOLYTICS (N05B) 586 5,2
Benzodiazepine derivatives (N05BA) 552 4,9
Diazepam (N05BA01) 109 1
Medazepam (N05BA03) 32 0,3
Potassium clorazepate (N05BA05) 80 0,7
Lorazepam (N05BA06) 162 1,4
Bromazepam (N05BA08) 84 0,7
Alprazolam (N05BA12) 92 0,8
Halazepam (N05BA13) 6 0,1
Clotiazepam (N05BA21) 10 0,1
Diphenylmethane derivatives (N05BB) 2 0
Hydroxyzine (N05BB01) 2 0
HYPNOTICS AND SEDATIVES (N05C) 134 1,2
Benzodiazepine derivatives (N05CD) 58 0,5
Flurazepam (N05CD01) 4 0
Lormetazepam (N05CD06) 30 0,3
Brotizolam (N05CD09) 8 0,1
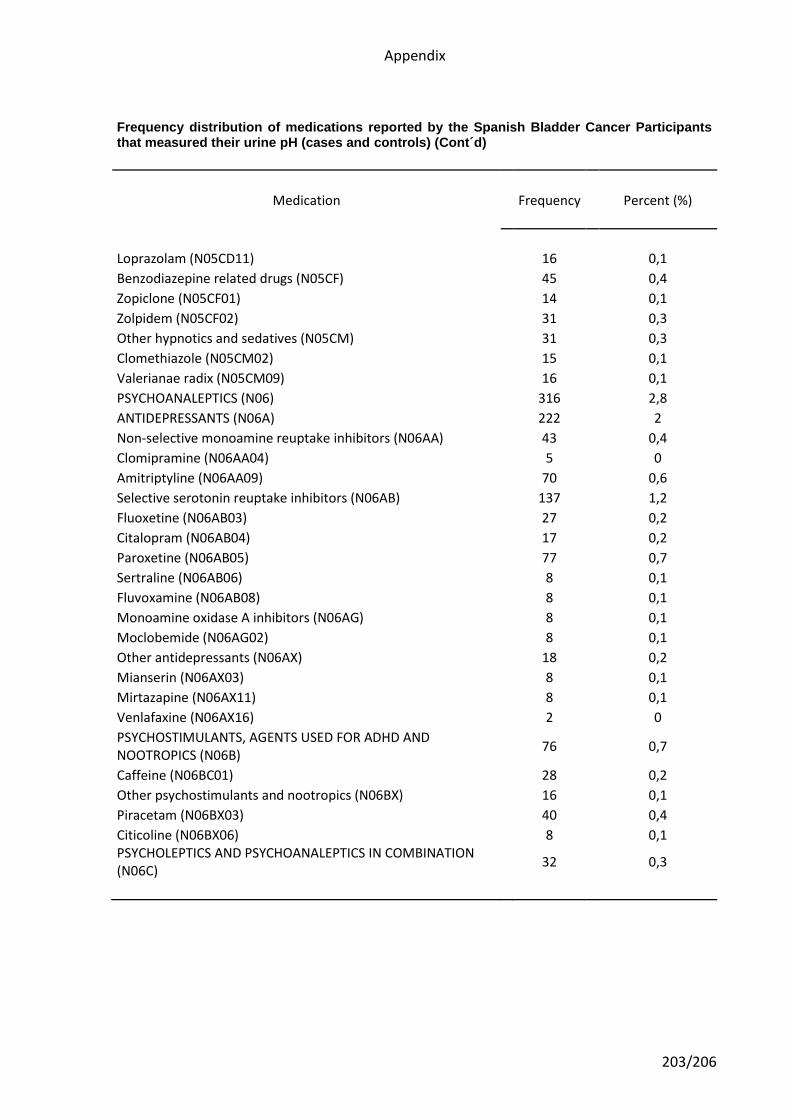
Appendix
203/206
Frequency distribution of medications reported by the Spanish Bladder Cancer Participants that measured their urine pH (cases and controls) (Cont´d)
Medication Frequency Percent (%)
Loprazolam (N05CD11) 16 0,1
Benzodiazepine related drugs (N05CF) 45 0,4
Zopiclone (N05CF01) 14 0,1
Zolpidem (N05CF02) 31 0,3
Other hypnotics and sedatives (N05CM) 31 0,3
Clomethiazole (N05CM02) 15 0,1
Valerianae radix (N05CM09) 16 0,1
PSYCHOANALEPTICS (N06) 316 2,8
ANTIDEPRESSANTS (N06A) 222 2
Non-selective monoamine reuptake inhibitors (N06AA) 43 0,4
Clomipramine (N06AA04) 5 0
Amitriptyline (N06AA09) 70 0,6
Selective serotonin reuptake inhibitors (N06AB) 137 1,2
Fluoxetine (N06AB03) 27 0,2
Citalopram (N06AB04) 17 0,2
Paroxetine (N06AB05) 77 0,7
Sertraline (N06AB06) 8 0,1
Fluvoxamine (N06AB08) 8 0,1
Monoamine oxidase A inhibitors (N06AG) 8 0,1
Moclobemide (N06AG02) 8 0,1
Other antidepressants (N06AX) 18 0,2
Mianserin (N06AX03) 8 0,1
Mirtazapine (N06AX11) 8 0,1
Venlafaxine (N06AX16) 2 0
PSYCHOSTIMULANTS, AGENTS USED FOR ADHD AND NOOTROPICS (N06B)
76 0,7
Caffeine (N06BC01) 28 0,2
Other psychostimulants and nootropics (N06BX) 16 0,1
Piracetam (N06BX03) 40 0,4
Citicoline (N06BX06) 8 0,1 PSYCHOLEPTICS AND PSYCHOANALEPTICS IN COMBINATION (N06C)
32 0,3
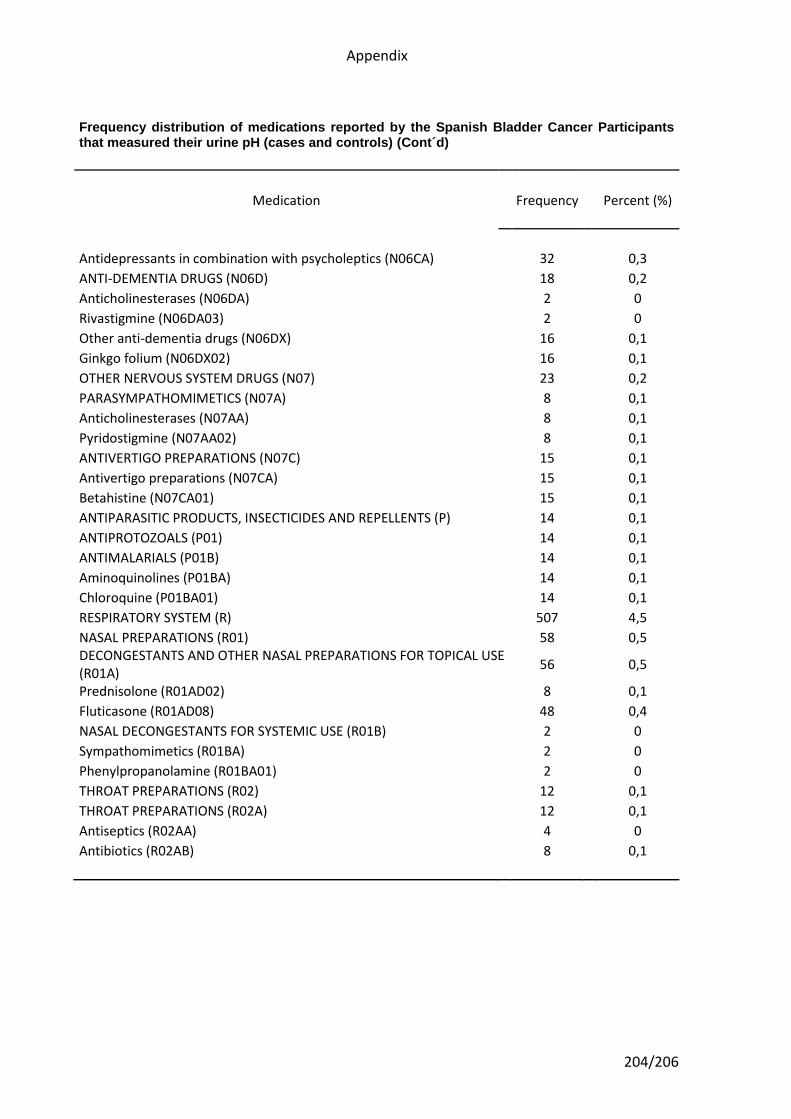
Appendix
204/206
Frequency distribution of medications reported by the Spanish Bladder Cancer Participants that measured their urine pH (cases and controls) (Cont´d)
Medication Frequency Percent (%)
Antidepressants in combination with psycholeptics (N06CA) 32 0,3
ANTI-DEMENTIA DRUGS (N06D) 18 0,2
Anticholinesterases (N06DA) 2 0
Rivastigmine (N06DA03) 2 0
Other anti-dementia drugs (N06DX) 16 0,1
Ginkgo folium (N06DX02) 16 0,1
OTHER NERVOUS SYSTEM DRUGS (N07) 23 0,2
PARASYMPATHOMIMETICS (N07A) 8 0,1
Anticholinesterases (N07AA) 8 0,1
Pyridostigmine (N07AA02) 8 0,1
ANTIVERTIGO PREPARATIONS (N07C) 15 0,1
Antivertigo preparations (N07CA) 15 0,1
Betahistine (N07CA01) 15 0,1
ANTIPARASITIC PRODUCTS, INSECTICIDES AND REPELLENTS (P) 14 0,1
ANTIPROTOZOALS (P01) 14 0,1
ANTIMALARIALS (P01B) 14 0,1
Aminoquinolines (P01BA) 14 0,1
Chloroquine (P01BA01) 14 0,1
RESPIRATORY SYSTEM (R) 507 4,5
NASAL PREPARATIONS (R01) 58 0,5 DECONGESTANTS AND OTHER NASAL PREPARATIONS FOR TOPICAL USE (R01A)
56 0,5
Prednisolone (R01AD02) 8 0,1
Fluticasone (R01AD08) 48 0,4
NASAL DECONGESTANTS FOR SYSTEMIC USE (R01B) 2 0
Sympathomimetics (R01BA) 2 0
Phenylpropanolamine (R01BA01) 2 0
THROAT PREPARATIONS (R02) 12 0,1
THROAT PREPARATIONS (R02A) 12 0,1
Antiseptics (R02AA) 4 0
Antibiotics (R02AB) 8 0,1
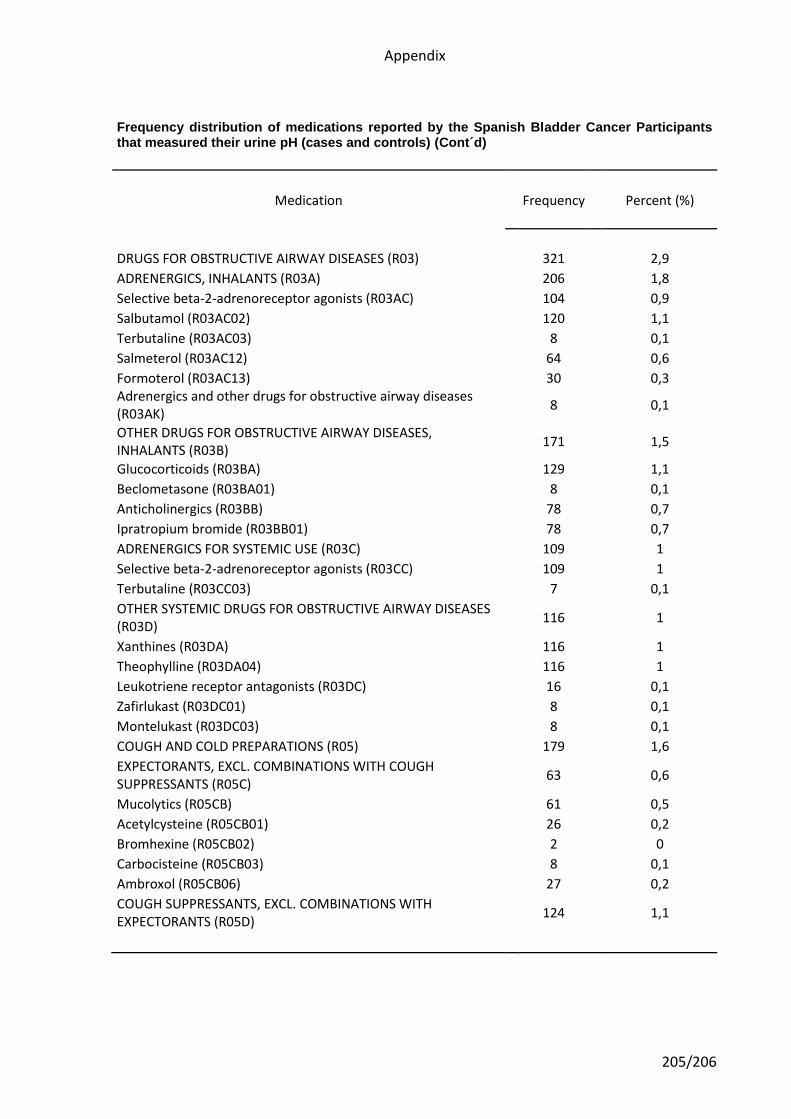
Appendix
205/206
Frequency distribution of medications reported by the Spanish Bladder Cancer Participants that measured their urine pH (cases and controls) (Cont´d)
Medication Frequency Percent (%)
DRUGS FOR OBSTRUCTIVE AIRWAY DISEASES (R03) 321 2,9
ADRENERGICS, INHALANTS (R03A) 206 1,8
Selective beta-2-adrenoreceptor agonists (R03AC) 104 0,9
Salbutamol (R03AC02) 120 1,1
Terbutaline (R03AC03) 8 0,1
Salmeterol (R03AC12) 64 0,6
Formoterol (R03AC13) 30 0,3 Adrenergics and other drugs for obstructive airway diseases (R03AK)
8 0,1
OTHER DRUGS FOR OBSTRUCTIVE AIRWAY DISEASES, INHALANTS (R03B)
171 1,5
Glucocorticoids (R03BA) 129 1,1
Beclometasone (R03BA01) 8 0,1
Anticholinergics (R03BB) 78 0,7
Ipratropium bromide (R03BB01) 78 0,7
ADRENERGICS FOR SYSTEMIC USE (R03C) 109 1
Selective beta-2-adrenoreceptor agonists (R03CC) 109 1
Terbutaline (R03CC03) 7 0,1
OTHER SYSTEMIC DRUGS FOR OBSTRUCTIVE AIRWAY DISEASES (R03D)
116 1
Xanthines (R03DA) 116 1
Theophylline (R03DA04) 116 1
Leukotriene receptor antagonists (R03DC) 16 0,1
Zafirlukast (R03DC01) 8 0,1
Montelukast (R03DC03) 8 0,1
COUGH AND COLD PREPARATIONS (R05) 179 1,6
EXPECTORANTS, EXCL. COMBINATIONS WITH COUGH SUPPRESSANTS (R05C)
63 0,6
Mucolytics (R05CB) 61 0,5
Acetylcysteine (R05CB01) 26 0,2
Bromhexine (R05CB02) 2 0
Carbocisteine (R05CB03) 8 0,1
Ambroxol (R05CB06) 27 0,2
COUGH SUPPRESSANTS, EXCL. COMBINATIONS WITH EXPECTORANTS (R05D)
124 1,1
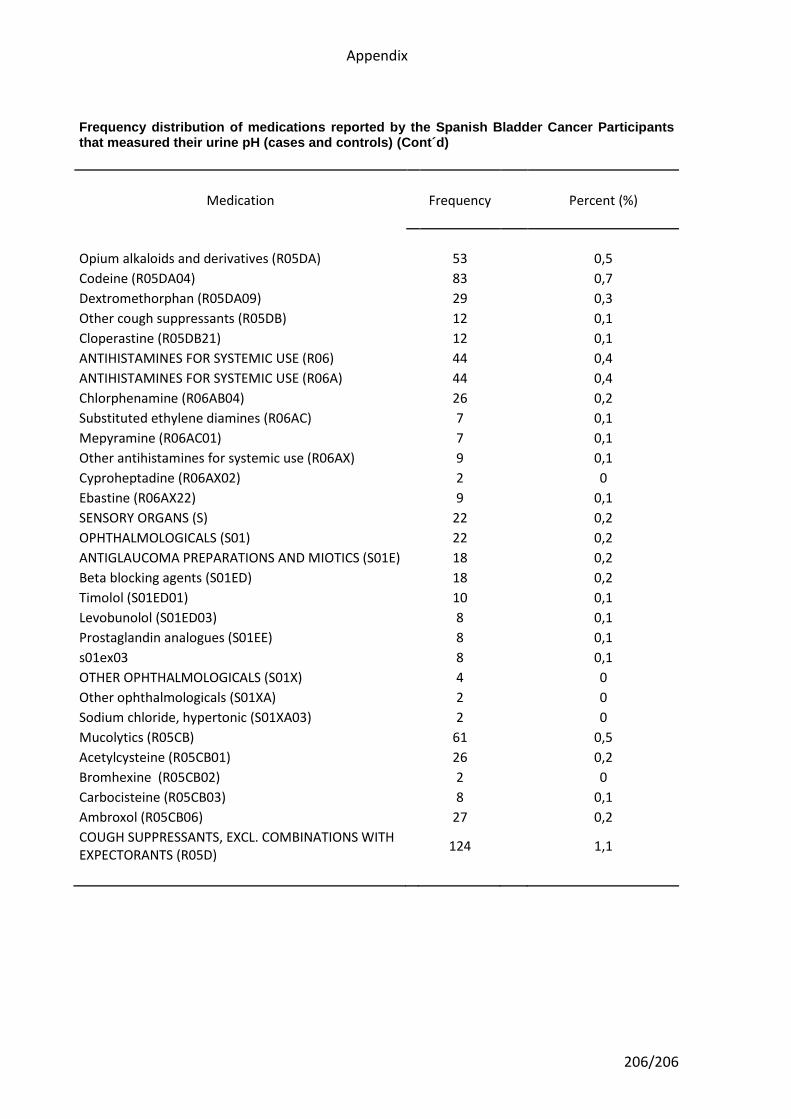
Appendix
206/206
Frequency distribution of medications reported by the Spanish Bladder Cancer Participants that measured their urine pH (cases and controls) (Cont´d)
Medication Frequency Percent (%)
Opium alkaloids and derivatives (R05DA) 53 0,5
Codeine (R05DA04) 83 0,7
Dextromethorphan (R05DA09) 29 0,3
Other cough suppressants (R05DB) 12 0,1
Cloperastine (R05DB21) 12 0,1
ANTIHISTAMINES FOR SYSTEMIC USE (R06) 44 0,4
ANTIHISTAMINES FOR SYSTEMIC USE (R06A) 44 0,4
Chlorphenamine (R06AB04) 26 0,2
Substituted ethylene diamines (R06AC) 7 0,1
Mepyramine (R06AC01) 7 0,1
Other antihistamines for systemic use (R06AX) 9 0,1
Cyproheptadine (R06AX02) 2 0
Ebastine (R06AX22) 9 0,1
SENSORY ORGANS (S) 22 0,2
OPHTHALMOLOGICALS (S01) 22 0,2
ANTIGLAUCOMA PREPARATIONS AND MIOTICS (S01E) 18 0,2
Beta blocking agents (S01ED) 18 0,2
Timolol (S01ED01) 10 0,1
Levobunolol (S01ED03) 8 0,1
Prostaglandin analogues (S01EE) 8 0,1
s01ex03 8 0,1
OTHER OPHTHALMOLOGICALS (S01X) 4 0
Other ophthalmologicals (S01XA) 2 0
Sodium chloride, hypertonic (S01XA03) 2 0
Mucolytics (R05CB) 61 0,5
Acetylcysteine (R05CB01) 26 0,2
Bromhexine (R05CB02) 2 0
Carbocisteine (R05CB03) 8 0,1
Ambroxol (R05CB06) 27 0,2
COUGH SUPPRESSANTS, EXCL. COMBINATIONS WITH EXPECTORANTS (R05D)
124 1,1
Related Documents