Unit B 1.1 Motion

Unit B 1.1 Motion Motion Motion is when an object moves a distance. Uniform Motion: describes an object that is travelling at a constant rate of motion.
Dec 19, 2015
Welcome message from author
This document is posted to help you gain knowledge. Please leave a comment to let me know what you think about it! Share it to your friends and learn new things together.
Transcript
Unit B1.1 Motion
Motion
Motion is when an object moves a distance. Uniform Motion: describes an object that is
travelling at a constant rate of motion in a straight line.– It is nearly impossible to achieve uniform motion
in our everyday lives– Even driving with cruise control on a straight
highway there are factors which slow and speed the car up... Wind resistance, friction of the tires on the road, which make the engine work harder varying the rate of motion slightly.
Speed
Average speed: uniform motion that involves travelling a distance in a specified time.
– The term average speed is used because uniform motion is hard to maintain.
Average Speed = total distance travelled total time elapsed
v = d total distance = d1 + d2
t
Speed
ExampleA person walks 10.0m away from a stop sign in 5.00s .
What is the average speed of the person?d = 10 m t = 5 s v = ?
v = d/tv = 10m/5sv = 2.00 m/s
The person walked at a speed of 2.00 m/s
Example
A huge ocean wave travels a distance of 4.0 x 10⁶ m in 3.6 x 10⁴ s. Calculate the average speed of the ocean wave?
d = 4.0 x 10⁶ m t = 3.6 x 10⁴ s v = ?
v = d/tv = 4.0 x 10⁶ m / 3.6 x 10⁴ sv = 111.11 m/s
The wave travels at 1.1 x 10² m/s
Example
A Concorde airplane could fly at an average speed of 694 m/s. Calculated how long it would have taken the Concorde to fly around the world, which is approximately 4.00 x 10⁷ m.
d = 4.00 x 10⁷ m t = ? v = 694 m/s
v = d/t694 m/s = 4.00 x 10⁷ m / tt x 694 m/s = 4.00 x 10⁷ m / t x t(t x 694 m/s) / 694m/s = 4.00 x 10⁷ m / 694 m/s5.76 x 104s = t
The time it took to fly around the world was 5.76 x 10⁴s
Example
An electric train is travelling at an average speed of 6.9m/s for 4.0s. Calculate the distance travelled by the train.
d = ? t = 4.0s v = 6.9m/s
v = d/t6.9m/s = d / 4.0s6.9 m/s (4.0s) = d27.6 m = d
The distance travelled by the train is 28m.
Distance Time Graphs
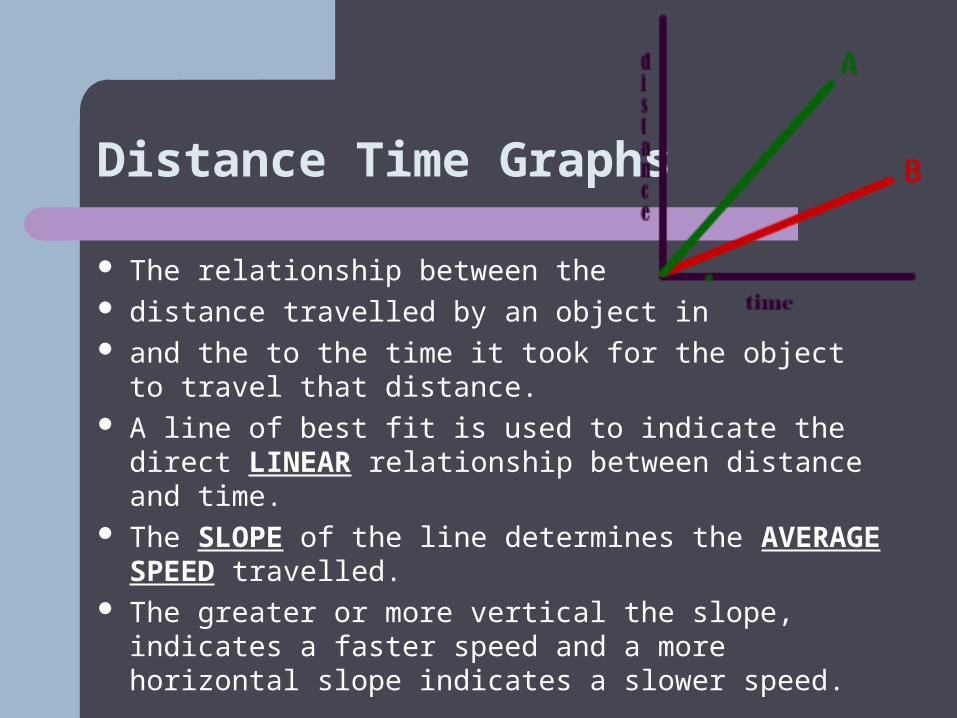
The relationship between the distance travelled by an object in and the to the time it took for the object to travel that
distance. A line of best fit is used to indicate the direct LINEAR
relationship between distance and time. The SLOPE of the line determines the AVERAGE
SPEED travelled. The greater or more vertical the slope, indicates a
faster speed and a more horizontal slope indicates a slower speed.
Plotting Distance Time Graphs
When graphing – Use a pencil – Use a ruler – Make sure your graph has a title – Equal intervals – Label the axis with units – Manipulated variable on the x-axis – Responding variable on the y-axis
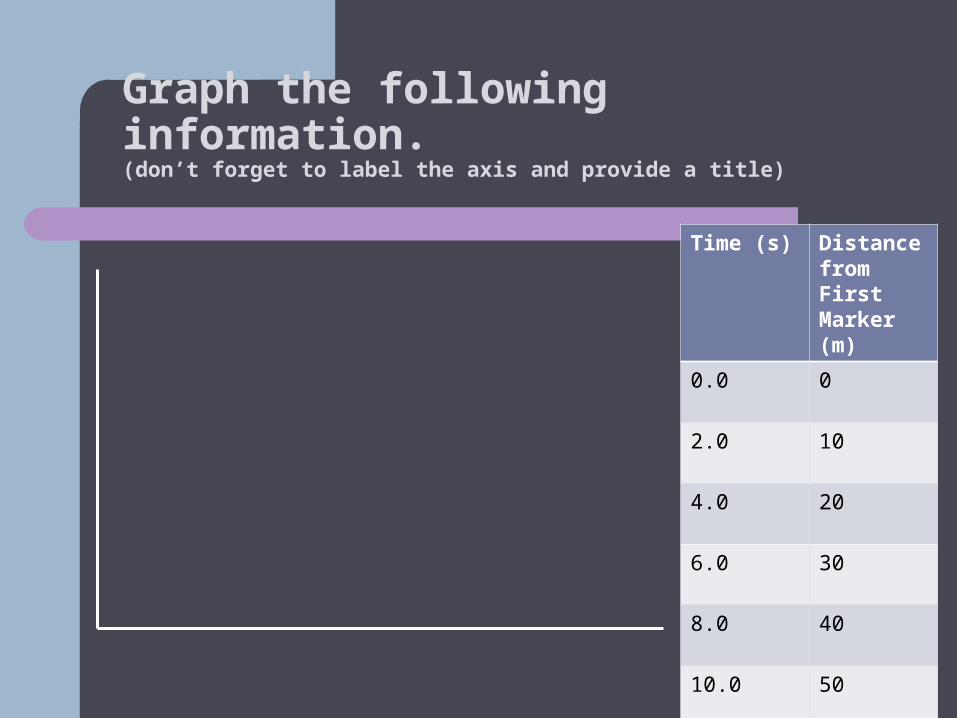
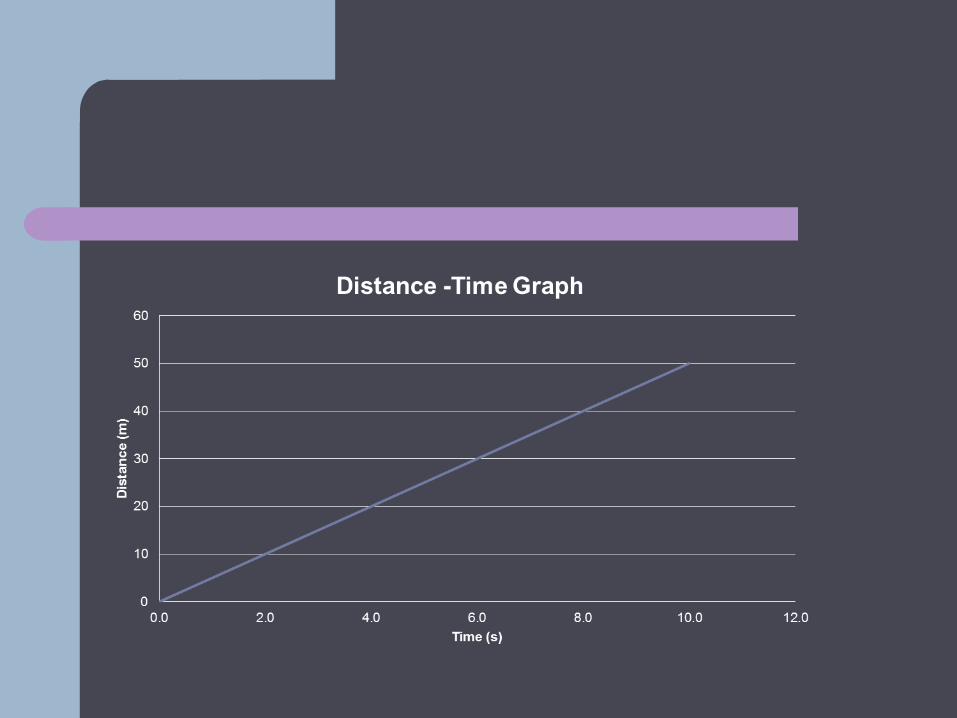
Graph the following information. (don’t forget to label the axis and provide a title)
Time (s) Distance from First Marker (m)
0.0 0
2.0 10
4.0 20
6.0 30
8.0 40
10.0 50
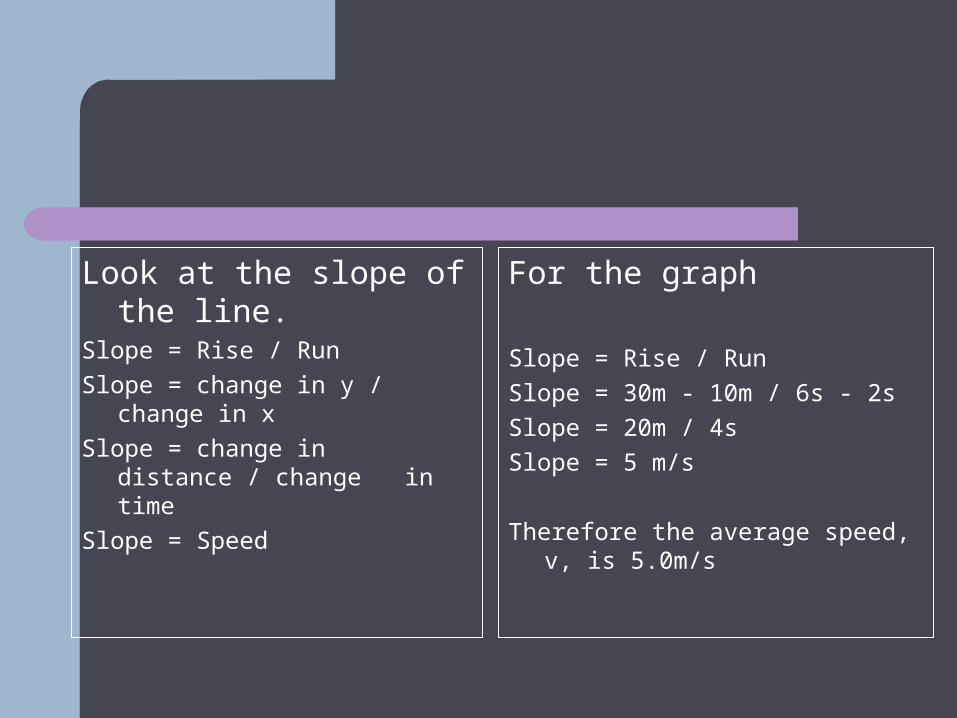
Look at the slope of the line.
Slope = Rise / Run
Slope = change in y / change in x
Slope = change in distance / change in time
Slope = Speed
For the graph
Slope = Rise / Run
Slope = 30m - 10m / 6s - 2s
Slope = 20m / 4s
Slope = 5 m/s
Therefore the average speed, v, is 5.0m/s
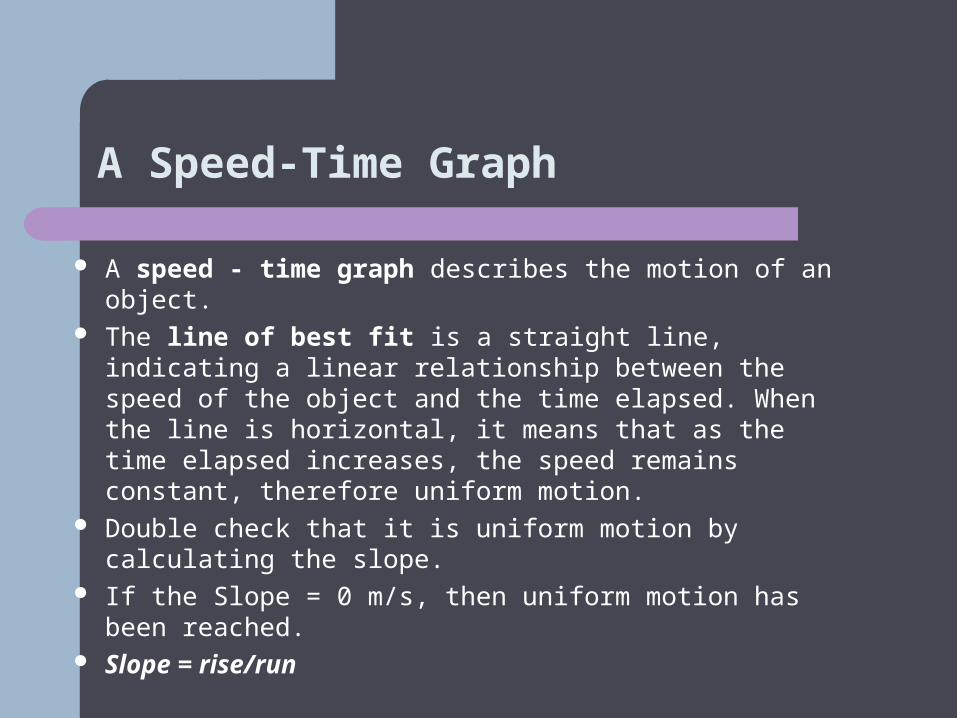
A Speed-Time Graph
A speed - time graph describes the motion of an object. The line of best fit is a straight line, indicating a linear
relationship between the speed of the object and the time elapsed. When the line is horizontal, it means that as the time elapsed increases, the speed remains constant, therefore uniform motion.
Double check that it is uniform motion by calculating the slope.
If the Slope = 0 m/s, then uniform motion has been reached.
Slope = rise/run
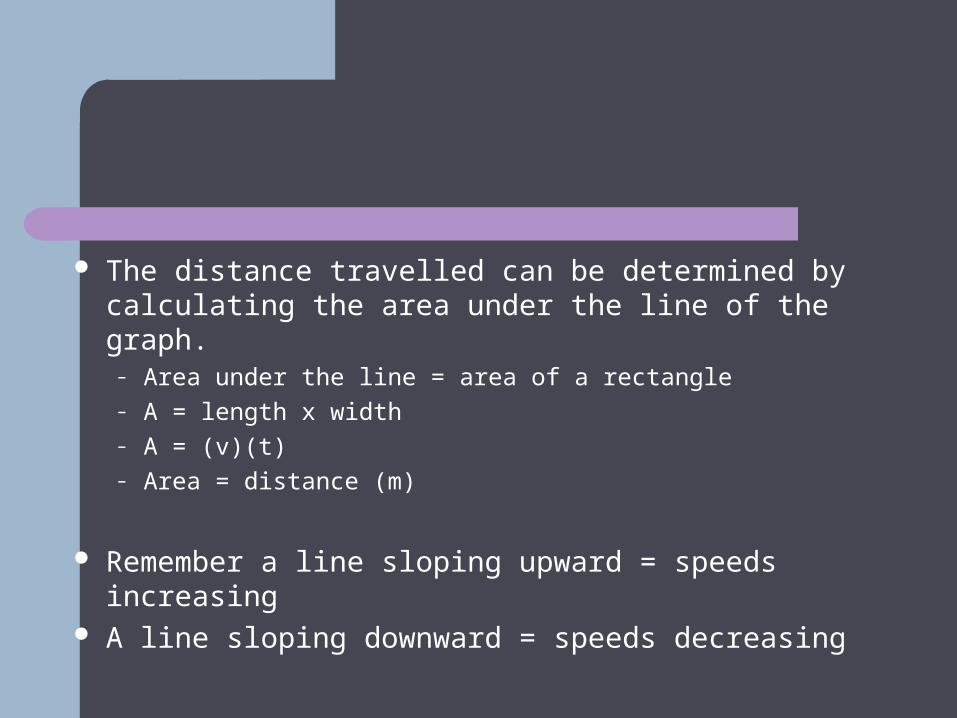
The distance travelled can be determined by calculating the area under the line of the graph.
– Area under the line = area of a rectangle– A = length x width– A = (v)(t)– Area = distance (m)
Remember a line sloping upward = speeds increasing
A line sloping downward = speeds decreasing
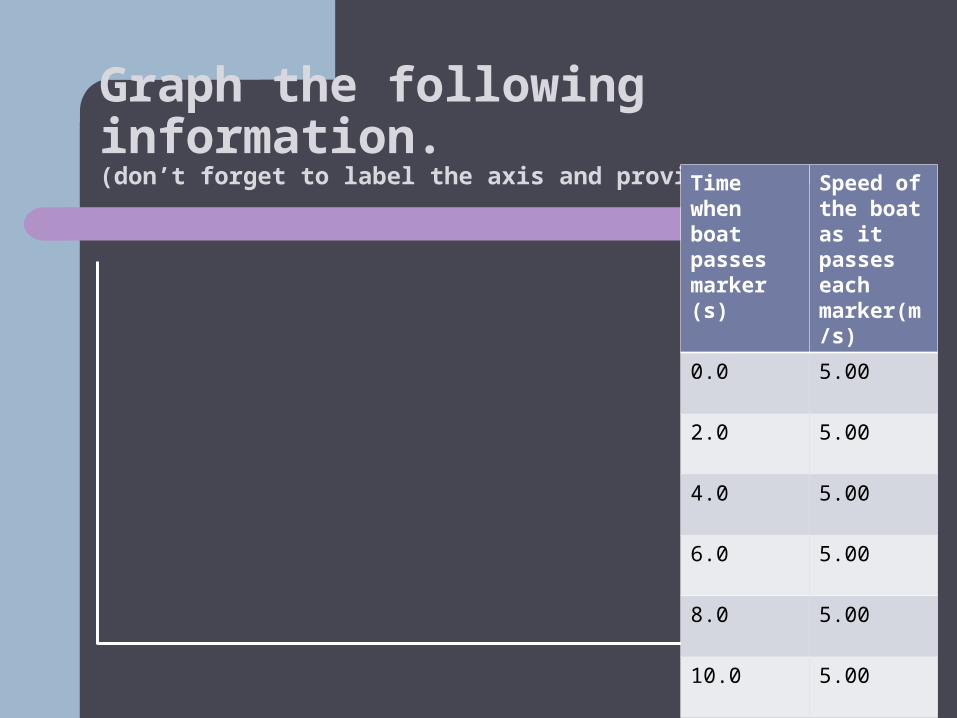
Graph the following information. (don’t forget to label the axis and provide a title) Time
when boat passes marker (s)
Speed of the boat as it passes each marker(m/s)
0.0 5.00
2.0 5.00
4.0 5.00
6.0 5.00
8.0 5.00
10.0 5.00
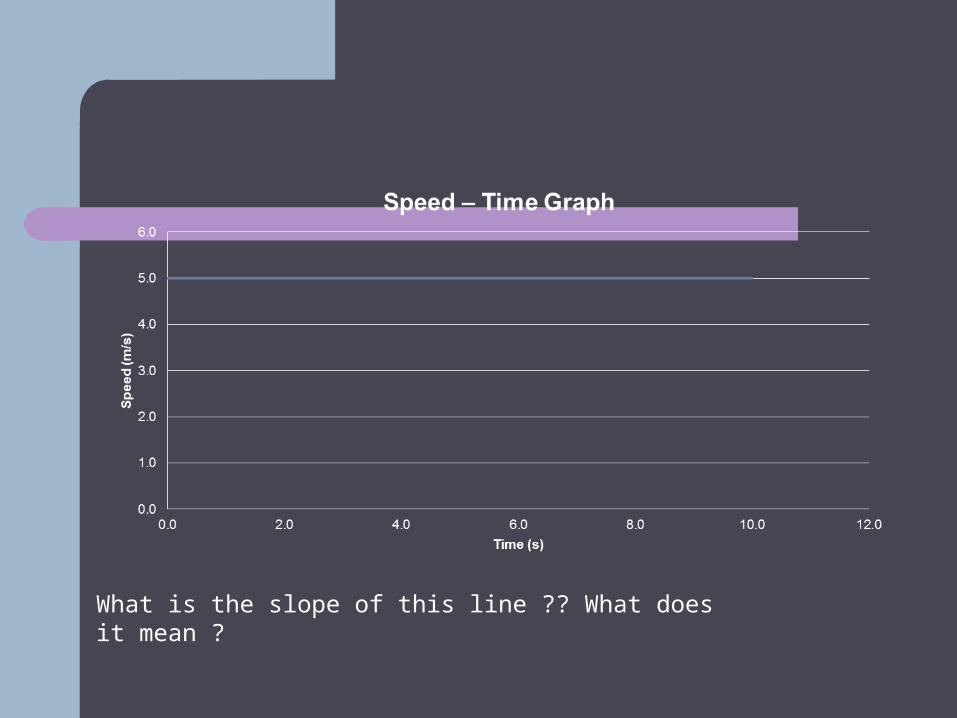
What is the slope of this line ?? What does it mean ?
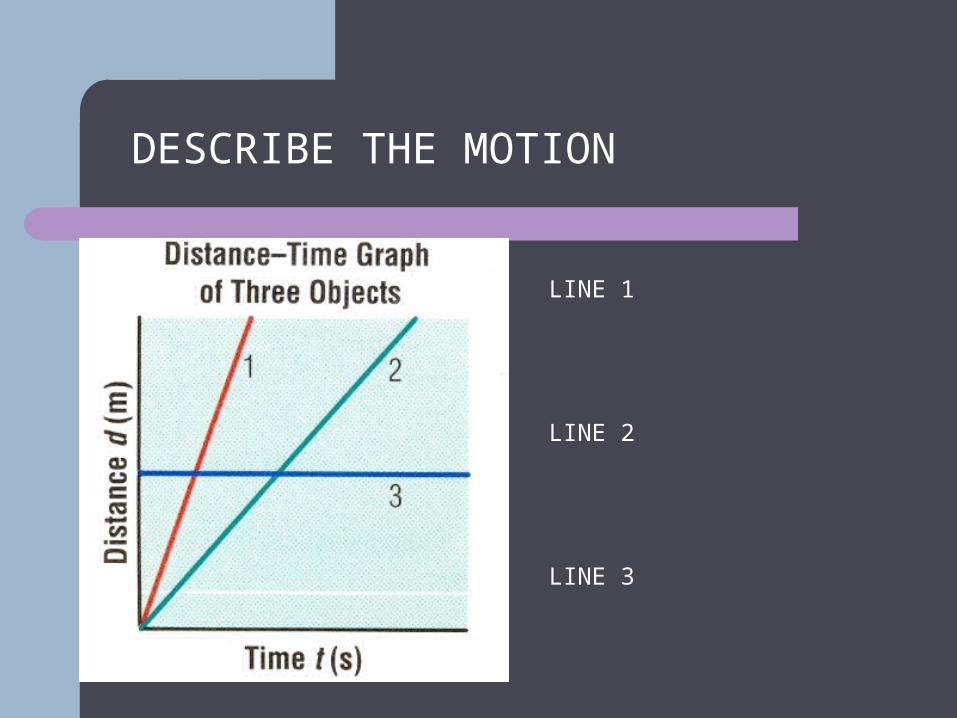
DESCRIBE THE MOTION
LINE 1
LINE 2
LINE 3
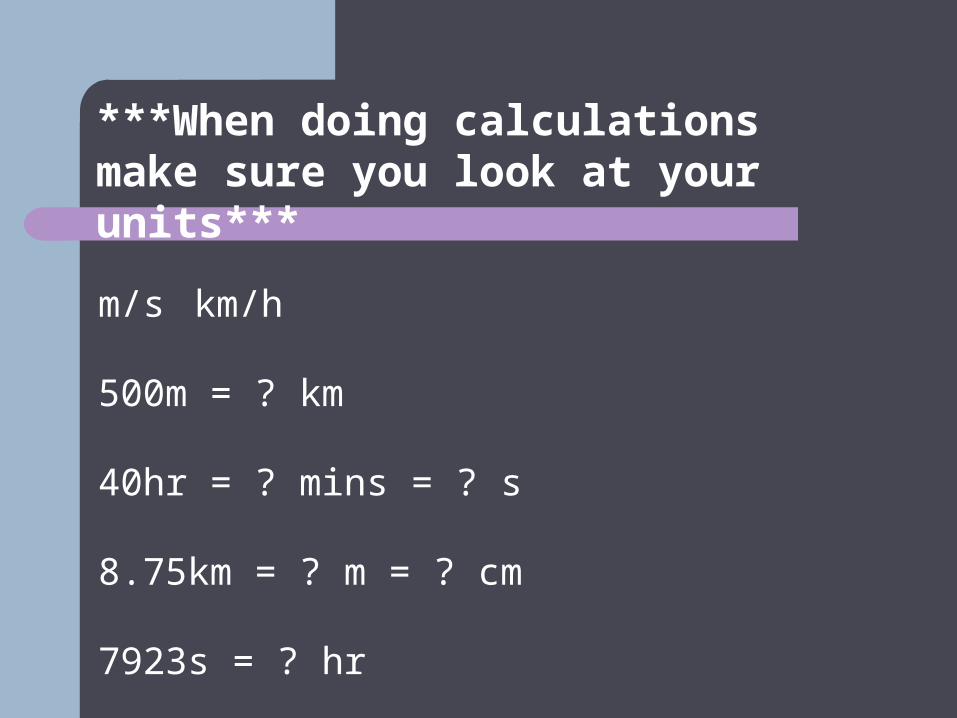
m/s km/h 500m = ? km 40hr = ? mins = ? s 8.75km = ? m = ? cm 7923s = ? hr
***When doing calculations make sure you look at your units***

Homework
Read Science 10 p. 127 – 135 Check and Reflect 1-13, 16-17, due the next day.
Related Documents