1 Uniaxial near plane strain tensile tests applied to the determination of the FLC 0 formabillity parameter Marcos Domingos Xavier 1,2,3 , Ronald Lesley Plaut 1 , Cláudio Geraldo Schön 1 , * 1 1 – Department of Metallurgical and Materials Engineering, Escola Politécnica da Universidade de São Paulo, Av. Prof. Mello Morais, 2463 – CEP 05508-900 São Paulo-SP, Brazil. 2 – Escola SENAI 'Nadir Dias de Figueiredo', Av. Ari Barroso, 305 – CEP 06216 – 901 Osasco – SP, Brazil. 3 – Faculdade de Tecnologia de São Paulo, Centro Estadual de Educação Tecnológica Paula Souza, Av. Tiradentes, 615 – CEP 01124 – 060 São Paulo-SP, Brazil. Abstract An alternative procedure for the determination of the FLC 0 value, the limit strain value corresponding to the plane strain mode of the Forming Limit Curves (FLC), a critical parameter in the sheet formability analysis, is suggested and compared with conventional Nakazima simulation tests. The procedure was tested using two different materials: interstitial-free quality steel (IF) and a spheroidized SAE 1050 steel. The intrinsic tensile test, in a near plane strain state, was performed using a small number of samples, with dimensions suggested by the literature. The results were checked against Nakazima test results using the same materials. The plane strain test was reliable in determining consistent FLC0 values and should be preferred since it is not affected by the geometric aspects and by friction, which do affect the Nakazima test. The reliability of the FLC 0 values obtained by near plane strain was also corroborated through comparison with literature data. Keywords: Deep drawing, Forming Limit Curve, Sheet metal forming, Plane strain deformation. 1 *Corresponding author: Tel.: +55-11-3091-5726; Fax: +55-11-3091-5243. E-mail addresses: [email protected] (Marcos D. Xavier), [email protected] (Ronald L. Plaut), [email protected] (Cláudio G. Schön).

Welcome message from author
This document is posted to help you gain knowledge. Please leave a comment to let me know what you think about it! Share it to your friends and learn new things together.
Transcript
1
Uniaxial near plane strain tensile tests applied to the determination of the FLC0 formabillity parameter
Marcos Domingos Xavier 1,2,3
, Ronald Lesley Plaut 1
, Cláudio Geraldo Schön 1,*1
1 – Department of Metallurgical and Materials Engineering, Escola Politécnica da Universidade
de São Paulo, Av. Prof. Mello Morais, 2463 – CEP 05508-900 São Paulo-SP, Brazil.
2 – Escola SENAI 'Nadir Dias de Figueiredo', Av. Ari Barroso, 305 – CEP 06216 – 901 Osasco –
SP, Brazil.
3 – Faculdade de Tecnologia de São Paulo, Centro Estadual de Educação Tecnológica Paula
Souza, Av. Tiradentes, 615 – CEP 01124 – 060 São Paulo-SP, Brazil.
AbstractAn alternative procedure for the determination of the FLC0 value, the limit strain value
corresponding to the plane strain mode of the Forming Limit Curves (FLC), a critical
parameter in the sheet formability analysis, is suggested and compared with conventional
Nakazima simulation tests. The procedure was tested using two different materials:
interstitial-free quality steel (IF) and a spheroidized SAE 1050 steel. The intrinsic tensile test,
in a near plane strain state, was performed using a small number of samples, with dimensions
suggested by the literature. The results were checked against Nakazima test results using the
same materials. The plane strain test was reliable in determining consistent FLC0 values and
should be preferred since it is not affected by the geometric aspects and by friction, which do
affect the Nakazima test. The reliability of the FLC0 values obtained by near plane strain was
also corroborated through comparison with literature data.
Keywords: Deep drawing, Forming Limit Curve, Sheet metal forming, Plane strain
deformation.
1 *Corresponding author: Tel.: +55-11-3091-5726; Fax: +55-11-3091-5243.
E-mail addresses: [email protected] (Marcos D. Xavier), [email protected] (Ronald L. Plaut), [email protected]
(Cláudio G. Schön).
2
1. Introduction
The last decade saw an increasing interest in the understanding of the physical
metallurgy associated with the evolution (during straining) of both microstructure (damage
accumulation / microvoids evolution) and crystallographic texture, aiming at locating the yield
point and, consequently, ductile fracture during sheet metal drawing 1,2. This interest relies on
the support of true stress - true strain curves, on using alternative flow criteria (quadratic and
non-quadratic) and on using Forming Limit Curves FLCs, i.e., on characteristics of the
material to be drawn.
These Forming Limit Curves (FLCs) were introduced by Lankford (1947), Keeler and
Backofen (1964), Goodwin (1968) 3-5 allow a comprehensive representation of sheet
formability and have been widely used as a criterion in the optimization of the drawing
process and as an aid in die designing2,5-7.
The Nakazima simulation test (1968) has been commonly applied for the evaluation of
the FLCs. This test is sensitive to the sheet thickness, surface conditions, lubricants, tool type
and geometry 2,5, besides influences inherent to the test itself, since the sample does not
remain flat, but is increasingly curved during straining (i.e. the strain path is not entirely
contained in the sheet plane)8. Further, it should be added that obtaining the FLC curves via
Nakazima is time consuming and expensive, as it requires the preparation and testing of
several samples of different geometries and dimensions. The minimum recommended
number of samples from the industrial practice is 30 samples. A typical setup consists of three
replicas of each of the following dimension, in RD-(rolling direction-mm) x TD-(transverse
direction-mm): 50 x 220; 80 x 220; 100 x 220; 110 x 220; 120 x 220; 130 x 220; 140 x 220;
160 x 220; 175 x 220; 220 x 220.2
The methodology used in determining the FLC curves is based on the analysis of the
deformation of sheet samples, which contains a circle grid printed over its surface. The
samples are deformed in different conditions, in order to simulate different strain paths to
which an actual part would be submitted during forming. The results of all sorts of tests
designed for such purpose, being either intrinsic or simulated (regardless of friction) , consists
in measuring the ellipses (i.e. the deformed circles of the printed circle grid) near the fracture
2 B. D. Chivites – personal communication – USIMINAS testing center, Cubatão, Brazil, may 2012.
3
region, calculating the largest principal strain (ε1) and smallest principal strain (ε2) in the sheet
plane5,9 - 11. A plot of these points generates V-type curves, which allow defining the boundary
of conformational limits of that sheet (ASTM E2218, ISO 12004-2:2008). This point is where
local thinning starts (reduction of resisting section) and that, at the end, culminates with
fracture (generating the fracture limit curves, FrLC).
The apparent transferability of the concept of the FLC is tempting, but it is known that
the strain path (which is not always a straight line) in formed parts influences the position of
the FLC 9,10,12,13. This path can be described by the strain ratio β = ε2/ε1. A path corresponding
to biaxial tension (stretching) occurs for β ~ 1. A path close to plane strain is associated with
ε2~0 (equivalent to β=0). A path corresponding to deep drawing situations find values in the
region -1<β<-0.5 [7]. Studies conducted in several types of automobile parts 5,13,14 show that
over 80% of formed pieces usually fail under conditions of near plane strain (β~0), which is
also the minimum of the obtained FLCs.
This propensity for failure under near plane strain conditions and the previously
mentioned disadvantages of the Nakazima test15 brought out the intrinsic tensile test under
the condition of plastic deformation near to the plane strain5,13,14 condition. In this case, the full
determination of the FLC is avoided and all analysis is based on the FLC0 point, which
corresponds to the minimum (lowest point) of the FLC curve under plane strain, i.e. , for the
condition for which the smallest principal strain in the plane of the sheet vanishes: ε2 → 0.
The objective of this work is to evaluate the possibility of replacing Nakazima tests by a
fast and safe determination of the FLC0 value through tensile tests that will lead to near plane
strain deformation, using a smaller number of samples.
2. Materials and methods
2.1 Materials
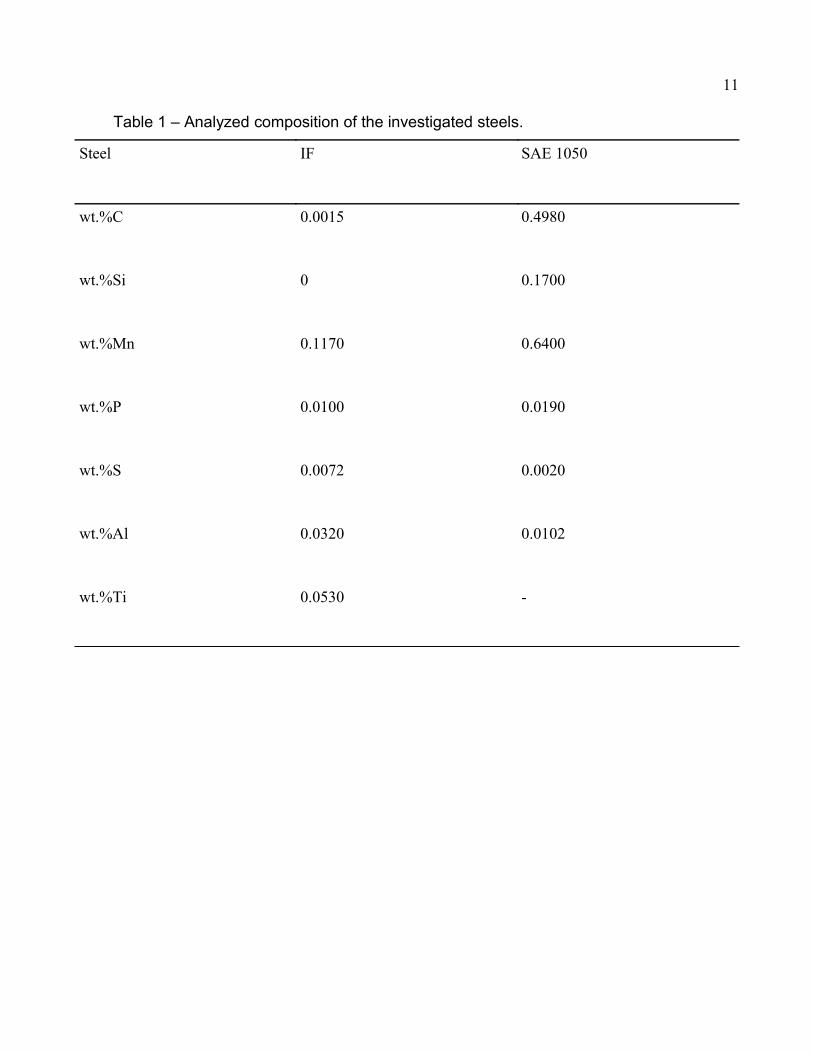
Two kinds of blanks were used in the present work: a 0.75 mm thick Interstitial Free (IF)
steel sheet and a 1.48 mm thick spheroidized SAE 1050 carbon steel sheet. Chemical
compositions, as furnished by the suppliers, and mechanical properties (according to ABNT
NBR 187; ASTM E 517) are given, respectively, in Tables 1 and 2. The first steel is ductile
and widely used in drawing industries, especially by automobile manufacturers and by home
4
appliance industries, while the latter has higher mechanical strength, which usually impairs
formability. The microstructure (ferrite matrix containing spheroidal cementite) somewhat
decreases this drawback and the steel is mainly used in applications such as toecaps for
safety boots.
[Table 1 about here]
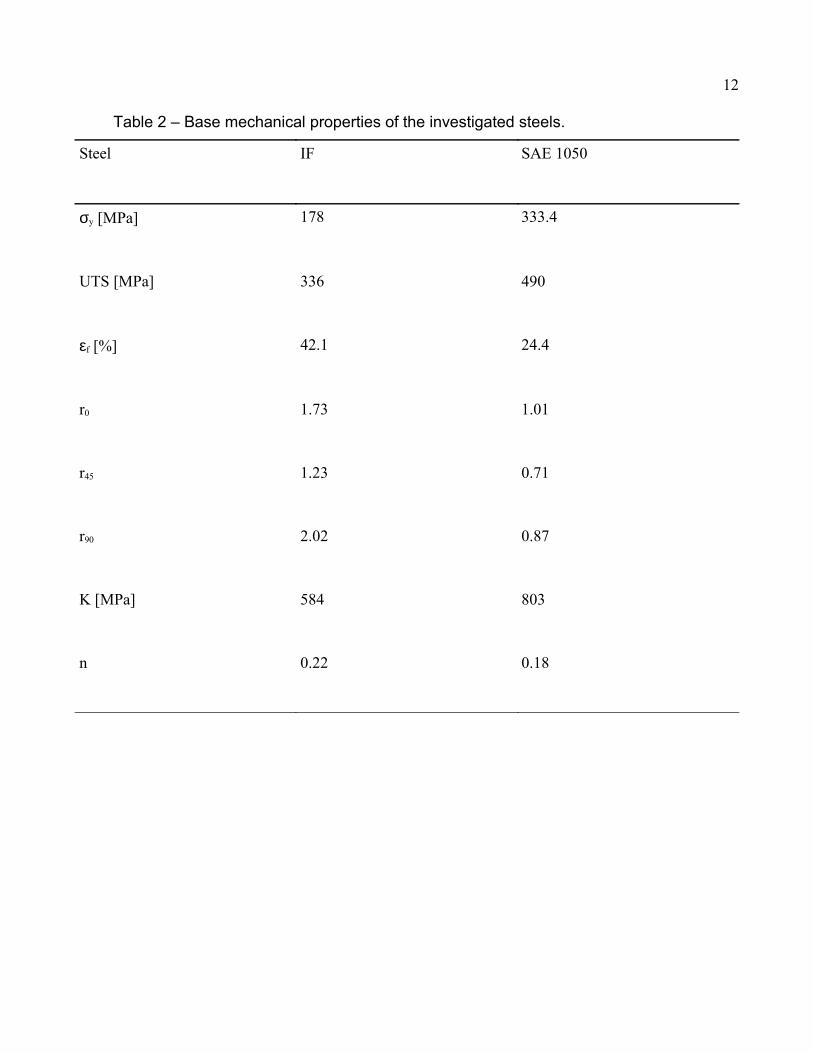
Steel formability may be evaluated by a series of mechanical properties, derived from a
conventional tensile test, these are: yield stress (σy), ultimate tensile stress (UTS), elongation
for a gauge length of 80 mm (εf), plastic anisotropy ratio (rα, where α refers to the angle
between rolling direction and tensile sample loading direction) and the parameters of
Hollomon's equation, defined by
σ=Kε n(1)
The values of these parameters for both steels, provided by the supplier, are given in
Table 2.
[Table 2 about here]
2.2 Samples and testing methods
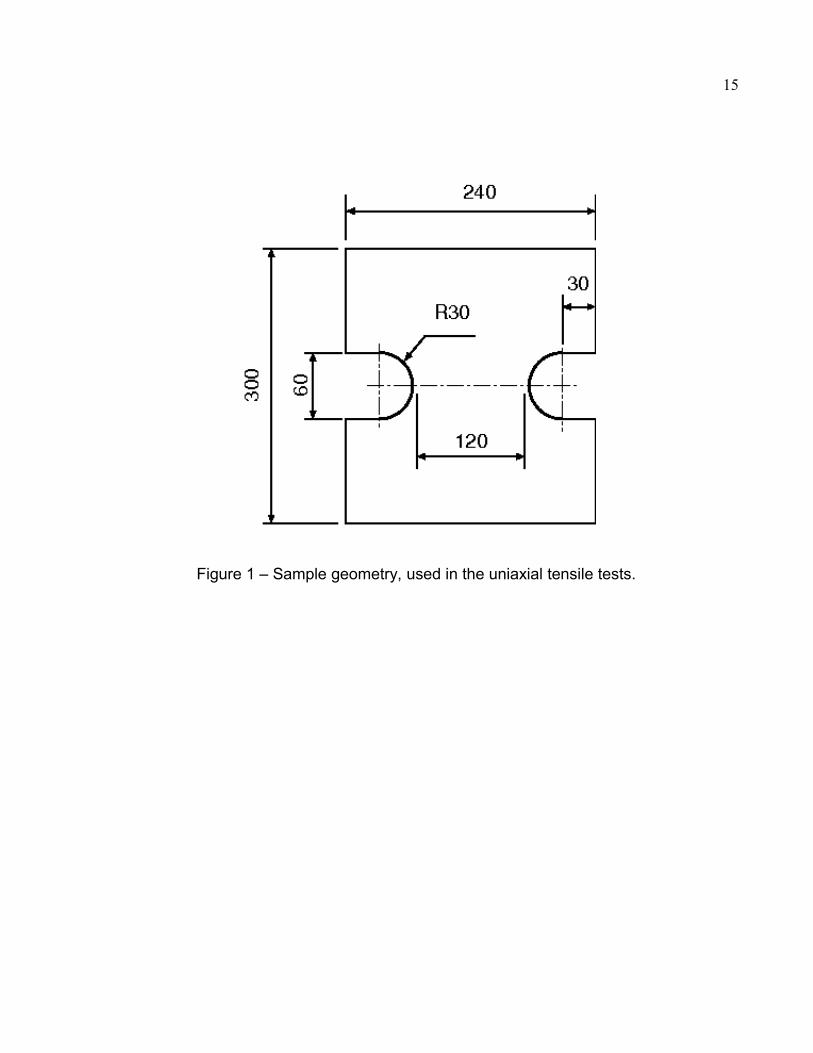
The geometries of the samples used specifically for plane strain (tensile) tests are
shown in Figure 1. The dimensions were based on Wagoner’s previous studies16.
[Figure 1 about here]
The technique called serigraphy was used for recording a set of circles on the metallic
samples. It is a simple process which provides good sharpness for measurements of the
circles. It relies on the transfer of drawings onto serigraphy chromes and from them onto the
metal sheet surfaces, via ink tanks.
The sequential steps of serigraphy refer to the production of the chrome; choice of the
serigraphy tissue; preparation of frames (degreasing, drying, emulsification, drying, additional
emulsification, drying, exposure to ultraviolet light; development; drying) and applying ink onto
the surface.
The methodology used for the tensile tests under condition of plastic near plane strain,
was the following:
1. Pre-recording of a net of circles of d0 = 2 mm on the sample surface.
5
2. Loading of the samples, leading them to necking/rupture through uniaxial tension.
Three samples were used for each condition, with the major axis parallel either to the
rolling direction (RD) of the original sheet or to the transverse (TD) direction.
3. Measurement of the ellipses along the longitudinal axis of the plastically deformed
samples, adjacent to the necking region, for the determination of the major and minor
axes, d1 and d2, respectively, using an image analysis system (CAMSYS). Six ellipses
were measured, three to the left and three to the right of the center line in the necked
region. This system allows the automated reading of major and minor axes (d1 and d2)
in the ellipses close to the thinning area. From these values, the true principal strains
are calculated through:
ε1,2= ln(d 1,2
d 0 ) (2)
The assessment of FLC0 values resulting from the unidirectional near plane strain plastic
deformation is obtained by comparing results of the same parameter arising from a full
determination of the respective FLCs using the Nakazima test, performed in the present work.
Results are reported as true (i.e., not engineering) strains, according to equation (2).
The equipment used for determining the FLC0 values in near plane strain (tensile test)
are briefly described below:
• Projector of vertical profile: Objective lenses 10, 20, 50 and 100x and digital reader
with geometric processor
• Universal Testing Machine with maximum capacity 600 kN electromechanical drive
and speed ranging from 0.01 to 300 mm / min. The tests were conducted under displacement
control.
• Wire electro-erosion machine: to obtain low roughness in the cut face, hence
preventing crack nucleation at this site during tensile testing.
The Nakazima simulation tests17 were carried out in a Erichsen press, with a 100mm-
diameter punch. Sample sizes for the IF steel were 220 X 50, 220 X 80, 220 X 100, 220 X
110, 220 X 120, 220 X 130, 220 X 140, 220 X 160, 220 X 175 and 220 X 220 mm and 0.75
mm thickness. In the case of the AISI 1050, the same sample sizes were tested, but the
samples with width smaller than 140 mm invariably broke in the blank holder, therefore results
for this steel will be limited to 220 X 140, 220 X 160, 220 X 175 and 220 X 220 mm samples,
6
with thickness 1.48 mm. Both steels were investigated in the RD configuration only.
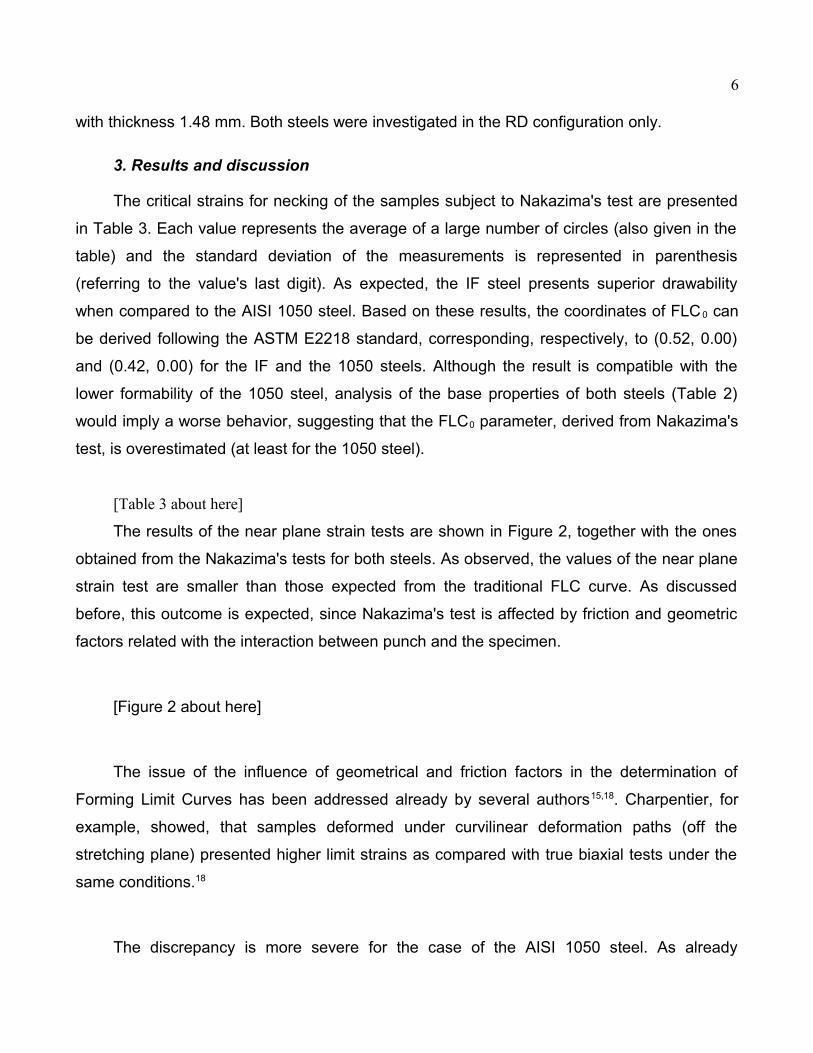
3. Results and discussion
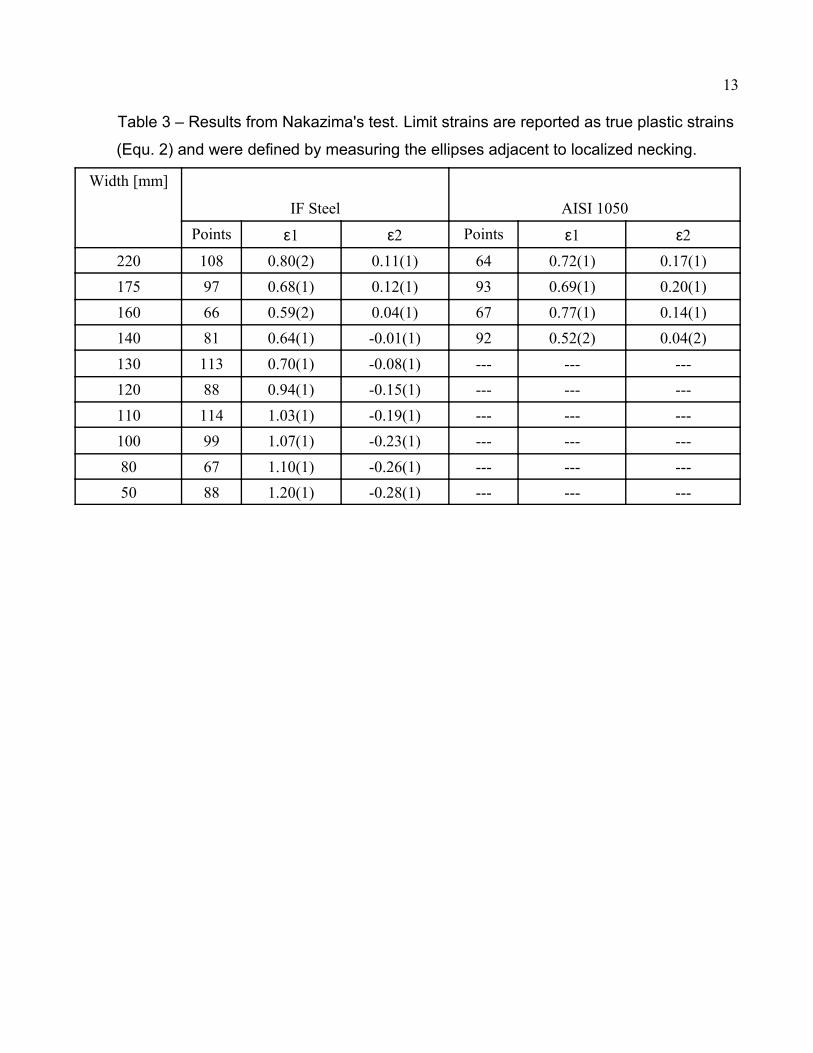
The critical strains for necking of the samples subject to Nakazima's test are presented
in Table 3. Each value represents the average of a large number of circles (also given in the
table) and the standard deviation of the measurements is represented in parenthesis
(referring to the value's last digit). As expected, the IF steel presents superior drawability
when compared to the AISI 1050 steel. Based on these results, the coordinates of FLC 0 can
be derived following the ASTM E2218 standard, corresponding, respectively, to (0.52, 0.00)
and (0.42, 0.00) for the IF and the 1050 steels. Although the result is compatible with the
lower formability of the 1050 steel, analysis of the base properties of both steels (Table 2)
would imply a worse behavior, suggesting that the FLC0 parameter, derived from Nakazima's
test, is overestimated (at least for the 1050 steel).
[Table 3 about here]
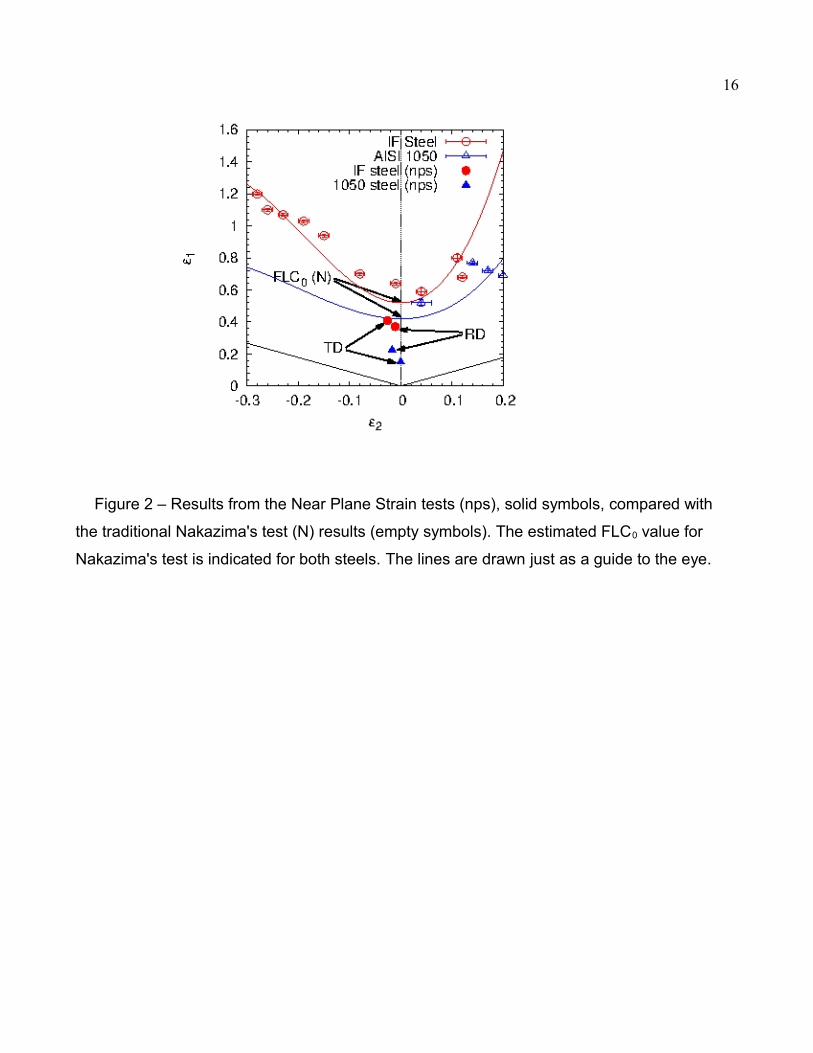
The results of the near plane strain tests are shown in Figure 2, together with the ones
obtained from the Nakazima's tests for both steels. As observed, the values of the near plane
strain test are smaller than those expected from the traditional FLC curve. As discussed
before, this outcome is expected, since Nakazima's test is affected by friction and geometric
factors related with the interaction between punch and the specimen.
[Figure 2 about here]
The issue of the influence of geometrical and friction factors in the determination of
Forming Limit Curves has been addressed already by several authors15,18. Charpentier, for
example, showed, that samples deformed under curvilinear deformation paths (off the
stretching plane) presented higher limit strains as compared with true biaxial tests under the
same conditions.18
The discrepancy is more severe for the case of the AISI 1050 steel. As already
7
discussed, the base properties of this steel suggest a poor formability, which is reproduced in
the near plane strain tests. The evaluation of the forming limit curve, however limited, points
out to a somewhat similar formability compared with the IF steel. The FLC0 parameter is
known to increase when sheet thickness increases14. Thus, in principle, the formability of the
spheroidized SAE 1050 medium carbon steel could be made similar to that of an IF steel, by
selecting the appropriate sheet thickness. In this instance, taking the larger thickness of the
AISI 1050 steel as basis, one could assume that the formability of both sheets would be
approximated, justifying the results of the Nakazima's test. The results of the near plane strain
test indicate, however, that this hypothesis is questionable.
The results for the IF steel are consistent with published data on similar steels 19. The
near plane strain data are also smaller than the FLC0 value derived from Nakazima's tests,
but in this case the difference is smaller compared with the case of the AISI 1050 steel. These
results are consistent with the ones obtained by Freitas et al.20 in a hot-dip galvanized IF
steel, which were based on the conventional FLC determination (using Marciniak's test).
These authors report a high susceptibility of the test to the lubrication conditions.
We may also compare the obtained FLC0 (as an engineering strain) values with the ones
predicted using an empirical relation derived by Keeler and Brazier 21:
FLC 0=(0 .233+0 .143t ) (n/0 .21) (3)
where t is the thickness, in mm, and n, the strain hardening exponent. Using the
previously reported values for these parameters and converting to true plastic strains, this
equation predicts FLC0 to be ε1 = 0.297 for the IF steel and 0.347 for the 1050 steel. The
results for the IF steel is consistent with the one determined in the near plane strain test (the
small difference may be a result in using different strain rates for the test), and shows, again
that the Nakazima´s test value overestimates the limit strain. In the case of the 1050 steel, the
predicted value is much higher than the one determined using the nearplane strain test,
butthis is expected, since Equ. (3) was derived for microalloyed steels. The presence of
cementite in the microstructure surely increases the propensity to necking comparedto a
single phase ferritic matrix.
Finally, the comparison between the near plane strain results obtained from samples
extracted along RD and TD show differences, but no trend can be identified, at least for these
8
two steels. These differences will be further explored in a forthcoming work.
4. Conclusions
The results obtained in the present work allow drawing the following conclusions:
1. The plane strain test showed to be suitable for determining the value of the FLC0
and it is performed with a smaller number of samples than that required by the
Nakazima method, i.e., 6 samples are required (3 samples for the RD direction
and 3 samples for the TD direction) in the plane strain test, while at least 30
samples are required in the Nakazima test for the full determination of a FLC
(from which FLC0 is derived).
2. The results obtained in the near plane strain tests are consistently smaller than
the FLC0 values derived from Nakazima’s tests, which are performed out of plane
and in contact with a punch, hence influenced by friction and by a non-plane
deformation path. Since the near plane strain tests are not influenced by these
factors, their results are believed to be more representative of the reality.
3. Anisotropy of the sheet positively influences the critical strain for necking in the
near plane strain tests, however, based only on the two steels investigated in the
present work, no trend could be identified.
Acknowledgments
The authors thank Brasmetal Waelzholz S/A for providing the investigated steel sheets;
Escola SENAI “Nadir Dias de Figueiredo” for recording the circle nets; machining of the
samples; use of the tensile machine and profile projector, and to the steelmaker "Usiminas" -
Cubatão unit, for carrying out the Nakazima tests. Usefull contributions of an anonymous
reviewer are gratefully acknowledged. Claudio G Schön also acknowledges financial support
by the Brazilian National Research Council (CNPq, Brasilia-DF, Brazil) for financial support
under grant Proc. 304445/2010-0.
9
Bibliography
1. Tasan CC, Hoefnagels JMP, ten Horn CHLJ, Geers MGD. Experimental analysis of
strain path dependent ductile damage mechanics and forming limits. Mechanics of
Materials, 2009; 41(11): 1264 – 1276.
2. Münstermann S, Lian J, Bleck W. Design of damage tolerance in high-strength steels.
International Journal of Materials Research 2012; 103(6): 755 – 764.
3. Keeler SP, Backofen WA. Plastic instability in sheet stretched over rigid punches. ASM
Transactions Quarterly 1964; 56: 25 – 48.
4. Goodwin G. Application of Strain Analysis to Sheet Metal Forming Problems in the
Press Shop. SAE Technical Paper 680093, 1968, doi:10.4271/680093.
5. Plaut RL. Estampabilidade de Chapas. In: Textura e relações de orientação:
deformação plástica, recristalização, crescimento de grãos [Chap. 15], 2nd Ed., Instituto
de Pesquisas Energéticas e Nucleares: São Paulo, Brazil, 2003 (in Portuguese), p.
265 – 285.
6. Banabic D. Forming limits of sheet metal. In: Formability of Metallic Materials: Plastic
anisotropy, formability testing, forming limit [Ch. 5], Springer Verlag: Berlin, 2000, p.
173 – 214.
7. Wagoner RH, Chenot J-L. Metal forming analysis. Cambridge (UK): Cambridge Univ.
Press, 2005.
8. Abspoel M, Scholting ME, Droog JMM. A new method for predicting Forming Limit
Curves from mechanical properties. Journal of Materials Processing Technology 2013;
213(5): 759 – 769.
9. Ghosh AK, Hecker SS. Stretching limits in sheet metals: In-plane versus out-of-plane
deformation. Metallurgical Transactions 1974; 5(10): 2161 – 2164.
10. Laukonis JV, Ghosh AK. Effect of strain path changes on the formability of sheet
metals. Metallurgical Transactions A 1978; 9(12): 1849 – 1856.
11. Nandedkar VM, Narasimhan K. Measuring of strain history during the stretching of
forming – grade steel sheets. Journal of Materials Processing Technology 1999; 89 –
10
90: 24 – 29.
12. Spur G, Stoferle Th [Eds.]. Handbuch der Fertigungstechnik, Carl Hanser Verlag:
München, 1985, Bd. 2/3, S. 1101.
13. Drewes E-J, Floßdorf F-J, Freier K. Anwendungsorientierte Werkstoffentwicklung für
Karrosseriebleche. Stahl & Eisen 1995; 115(4), 85 – 93.
14. Hosford WF, Duncan JL. Sheet metal forming: a review. JOM 1999; 51(11): 39 – 44.
15. Ozturk F, Lee D. Experimental and numerical analysis of out-of-plane formability test.
Journal of Materials Processing Technology 2005; 170: 247 – 253.
16. Wagoner RH. Measurement and analysis of plane-strain work hardening. Metallurgical
Transactions A 1980; 11(1): 165 – 175.
17. Hosford WF, Caddell RM. Metal Forming: mechanics and metallurgy, Cambridge (UK)
Cambridge University Press, 3rd ed., 2008.
18. Charpentier PL. Influence of punch curvature on the stretching limits of sheet steel.
Metallurgical Transactions A 1975; 6(8): 1665 – 1669.
19. Kaluza W, Kim WI, Bleck W. Determination of Forming Limit Stress Diagrams for the
characterization of material for sheet metal forming. Advanced Engineering Materials
2002, 4(4): 191 – 195.
20. Freitas MCS, Moreira LP, Velloso RG. Experimental analysis and theoretical
predictions of the limit strains of hot-dip galvanized interstitial-free steel sheet.
Materials Research 2013; 16(2): 351 – 366.
21.Keeler SP, Brazier WG. Relationships between laboratory material characterization
and press shop formability in: Proc. Conf. “Microalloyed Steels´75” Kochysnsky M
(Ed.), Union Carbide Co.: New York, 1977, p. 571 – 530.
11
Table 1 – Analyzed composition of the investigated steels.
Steel IF SAE 1050
wt.%C 0.0015 0.4980
wt.%Si 0 0.1700
wt.%Mn 0.1170 0.6400
wt.%P 0.0100 0.0190
wt.%S 0.0072 0.0020
wt.%Al 0.0320 0.0102
wt.%Ti 0.0530 -
12
Table 2 – Base mechanical properties of the investigated steels.
Steel IF SAE 1050
σy [MPa] 178 333.4
UTS [MPa] 336 490
εf [%] 42.1 24.4
r0 1.73 1.01
r45 1.23 0.71
r90 2.02 0.87
K [MPa] 584 803
n 0.22 0.18
13
Table 3 – Results from Nakazima's test. Limit strains are reported as true plastic strains
(Equ. 2) and were defined by measuring the ellipses adjacent to localized necking.
Width [mm]
IF Steel AISI 1050Points ε1 ε2 Points ε1 ε2
220 108 0.80(2) 0.11(1) 64 0.72(1) 0.17(1)175 97 0.68(1) 0.12(1) 93 0.69(1) 0.20(1)160 66 0.59(2) 0.04(1) 67 0.77(1) 0.14(1)140 81 0.64(1) -0.01(1) 92 0.52(2) 0.04(2)130 113 0.70(1) -0.08(1) --- --- ---120 88 0.94(1) -0.15(1) --- --- ---110 114 1.03(1) -0.19(1) --- --- ---100 99 1.07(1) -0.23(1) --- --- ---80 67 1.10(1) -0.26(1) --- --- ---50 88 1.20(1) -0.28(1) --- --- ---
14
Figure captions
Figure 1 – Sample geometry, used in the uniaxial tensile tests.
Figure 2 – Results from the Near Plane Strain tests (nps), solid symbols, compared with
the traditional Nakazima's test (N) results (empty symbols). The estimated FLC0 value for
Nakazima's test is indicated for both steels. The lines are drawn just as a guide to the eye.
15
Figure 1 – Sample geometry, used in the uniaxial tensile tests.
16
Figure 2 – Results from the Near Plane Strain tests (nps), solid symbols, compared with
the traditional Nakazima's test (N) results (empty symbols). The estimated FLC0 value for
Nakazima's test is indicated for both steels. The lines are drawn just as a guide to the eye.
Related Documents