CROP PRODUCTION UNDER CHARLAND ECO-SYSTEM UNFAVOURABLE ECO-SYSTEM: CROP PRODUCTION UNDER CHARLAND ECO-SYSTEM UNFAVOURABLE ECO-SYSTEM: CROP PRODUCTION UNDER CHARLAND ECO-SYSTEM Agronomy Division Bangladesh Agricultural Research Institute Joydebpur, Gazipur-1701 Agronomy Division Bangladesh Agricultural Research Institute www.bari.gov.bd

Welcome message from author
This document is posted to help you gain knowledge. Please leave a comment to let me know what you think about it! Share it to your friends and learn new things together.
Transcript

CR
OP
PR
OD
UC
TIO
N U
ND
ER
CH
AR
LA
ND
EC
O-S
YS
TE
M
UNFAVOURABLE ECO-SYSTEM: CROP PRODUCTION UNDER
CHARLAND ECO-SYSTEM
UNFAVOURABLE ECO-SYSTEM: CROP PRODUCTION UNDER
CHARLAND ECO-SYSTEM
Agronomy DivisionBangladesh Agricultural Research Institute
Joydebpur, Gazipur-1701
Agronomy DivisionBangladesh Agricultural Research Institute
www.bari.gov.bd


Unfavourable Eco-System:Crop Production Under Charland Eco-System
Edited byDr. Md. Abdul AzizDr. Md. Rafiqul Islam MondalMd. Hasan Hafizur Rahman
Compiled by
Dr. Md. Abdul AzizDr. Md. Shamsul AlomDr. Md. Abul Khayer MianDr. Jasmine Ara ChowdhuryDr. Anjuman Ara BegumDr. Md. Shawquat Ali KhanDr. Sarker Saifun KakonMd. Zabied Ali MontuShamima AkterSantosh Kumar Paul
Agronomy DivisionBangladesh Agricultural Research Institute
Joydebpur, Gazipur-1701.

Published by Agronomy DivisionBangladesh Agricultural Research InstituteJoydebpur, Gazipur-1701
August-2016
200 Copies
Unfavorable Eco-system Publication No. 4
All Rights Reseverd byBangladesh Agricultural Research Institute
Printed byBengal Com-Print68/5, Green Road, Dhaka-1205Mobile : 01713009365
01822828869

Charland in Bangadesh are landmasses formed through the sedimentation of huge amount of sand, silt and clay over time carried by the Padma, the Meghna, the Jamuna and the Brahmapurtra with their numerous tributaries. Bangladesh has about 0.83 million hectares charland of which about 0.52 - 0.79 million hectares are cultivable. Generally chaland farmers cultivate local variety of different crops following indigenous crop production practices. As a result crop yield in charland areas is low. Increase in crop yield as well as production in mainland is somewhat difficult due to higher cost of inputs and shrinkage of land resource. But we have great opportunity to enhance crop yield as well as production in charland areas through the replacement of local varieties by modern varieties as well as adoption of suitable management practices including intercropping systems. Scientists of Agronomy Division, BARI are engaged in introducing modern variety of different crops along with suitable management practices for improving livelihood of the resource poor farmers of charland areas. The results and the findings of those research works are published sporadically in different journals, proceedings and annual reports.
I am very glad to know that Agronomy Division, Bangladesh Agricultural Research Institute (BARI) is going to publish a compiled research report entitled "Unfavorable Eco-system: Crop Production under Charland Eco-system" carried out during the period from 2007to 2015.This report is very much relevant to the context of sustainable crop production in the charland areas as well as to the national food security. I firmly believe that this publication will be very useful to the researchers and academicians in developing effective research programme on charland eco-system. Similarly, it will also be very important to the extension personnel and NGOs for the dissemination of technologies among the charland farmers. I express my heartfelt thanks to the scientists of Agronomy Division, BARI for their sincere efforts for this publication.
Director GeneralBangladesh Agricultural Research InstituteJoydebpur, Gazipur
Dr. Md. Rafiqul Islam Mondal
Foreword


The diversified ecosystems of Bangladesh are prone to various environmental hazards. Climate change is added threat to the Bangladesh agriculture and vulnerable to ecosystem. Moreover, cultivable land of Bangladesh is deceasing by 1% in every year but population is increasing at an alarming rate. So, to feed the ever increasing population, crop production measures in unfavourable eco-systems like charland areas under the context of changing climate should be strengthened for ensuring food security. Based on location charland are of two types-island chars and attached chars. Island chars are distributed sporadically in the main channel of the rivers and attached chars which eventually become an integral part of the mainland. Cultivated soils of chars are mostly sandy loam to silty loam with slightly acidic to slightly alkaline in reaction and deficient in plant nutrients as well as organic matter content. Generally farmers in char lands cultivate local variety of different crops. Moreover, they follow their own crop production techniques which are the main causes of low yield in char areas.
It is a great pleasure for me that Agronomy Division, BARI is going to publish a compiled report entitled "Unfavourable Eco-system : Crop Production under charland Eco-system" carried out during the period from 2007 to 2015. Scientists of Agronomy Division are engaged in developing packages of technologies under different environmental conditions for the benefit of the farmers and the nation. The results of those research works are published sporadically elsewhere which necessitates to compile those results in systematic way. This report will be helpful to the scientists in reviewing the past research results for preparing effective future research programmes on charland eco-system. It will also be helpful to the researcher, extension personnel, students of higher studies, GO, NGO personnel, other agriculture related stakeholder and national planners. I am very much grateful to the scientists of Agronomy Division for compiling the results of important charland stress research. If this publication helps to any body in any way, then the efforts would be meaningful.
Chief Scientific OfficerBangladesh Agricultural Research InstituteJoydebpur, Gazipur
Dr. Md. Abdul Aziz
Preface


CONTENT Sl
No. Title of the Experiment Page
No. 01. Varietal trial of HYV mustard at newly developed charland
M.N. Islam, F. Ahmed, M.S.A. Khan and Wahida Sultana 01
02. Varietal trial of HYV mustard at newly developed charland M.N. Islam, F. Ahmed, M.S.A. Khan and W. Sultana
03
03. Performance of hybrid maize varieties in charland areas S. Begum, M. N. Islam, S. S. Kakon and Wahida Sultana
05
04. Performance of field pea varieties in charland areas S.S. Kakon, I.M. Ahmed, W. Sultana, S.M. Raquibullah and M. Biswas
07
05. Performance of different chickpea varieties in the charland area I. M. Ahmed, M.N. Islam, M.T. Rahman, S.S. Kakon and S.M.S. Haider
09
06. Performance of soybean varieties in the char land area S. S. Kakon, S. Begum, J.A. Chodhury, S. M. Raquibullah and M. Biswas
11
07. Performance of mungbean varieties in the char land area M. A. Aziz, S. Begum, A. Akter and J. Haider
13
08. Performance of sesame varieties in the char land area M. A. Aziz, J. A. Chowdhuary, M. Biswas, A. Akter and J. Haider
15
09. Fertilizer management of BARI Sarisha-11 in charland M.A.K. Mian, M.R. Islam and M.N. Islam
18
10. Establishment of mini fruit orchard in homesteads in char land area M. Abdul Aziz, J.H. Prodhan and A. Akhter
20
11. Validation and dissemination of intercropping technologies at farm levels in the charland area M. Abdul Aziz, J.H. Prodhan and A. Akhter
22
12. Performance of different kaon varieties in char land area M. Biswas, A. H. M. M. Rahman and N. Islam
25
13. Performance of soybean varieties in the char land area M Biswas, A. H. M. M. Rhaman and S. Begum
27
14. Performance of groundnut varieties in char land areas AHM M Rahman, M. Biswas and N. Islam
29
15. Performance of lentil varieties in charland areas M. N. Islam, M. Akhteruzzaman and S. Rahman
31
16. Performance of hybrid maize varieties in charland areas S. Rahman
33
17. Fertilizer management of BARI Sarisha-11 in charland areas (AEZ 11) M. N. Islam, F. Ahmed, S. Rahman and M. A.K. Mian
35
Sl
No. Title of the Experiment Page
No. 18. Fertilizer management of BARI Sarisha-11 in charland area (AEZ-8)
M. N. Islam and M. Mohiuddin 38
19. Performance of different sesame varieties at charland area M. N. Islam, S. Rahman and M. Mohiuddin
40
20. Performance of groundnut varieties at charland area M. N. Islam, S. Rahman and M. Biswas
42
21. Performance of different sesame varieties at charland area M.N. Islam, M.S. Rahman and M. A. Hossain
45
22. Fertilizer management of HYV mustard in charland areas M. N. Islam, M. S. Rahman, M.A.K. Mian, M.R. Islam, M. Mohiuddin and M.A. Hossain
47
23. Performance of groundnut varieties at charland area M.N Islam, M. S. Rahman M Biswas, AHMM Rahman Talukder and M. A. Hossain
51
24. Adaptation of BARI released crop varieties in charland M. A. K. Main, M. R. Islam and J. Hossain
54
25. A survey on crops and cropping of char areas in bangladesh M.N. Islam, M.A. Hossain, M. Mohiuddin, M.A.K Mian and M.Biswas
55
26. Fertilizer management of HYV sesame at charland areas (AEZ- 8) M.N. Islam and M.M. Rahman
69
27. Fertilizer management of HYV sesame at charland areas (AEZ-11) M. N. Islam, M. S. Rahman and M. A. Hossain
72
28. Fertilizer management of HYV mustard at charland areas (AEZ- 8) M.N. Islam and M.M. Rahman
74
29. Fertilizer management of HYV mustard at charland areas (AEZ-11) M. N. Islam, M. S. Rahman and M. A. Hossain
76
30. Adaptation of BARI released crop varieties in charland M. A. K. Main, M. R. Islam and J. Hossain
78
31. Effect of planting technique on tuber yield of potato at charland eco-system M.N. Islam, M.S. Rahman and Sheikh Ishtiaque
80
32. Adaptive trails with BARI hybrid maize varieties in charlands M.N. Islam, M. S. Rahman and Sheikh Ishtiaque
83
33. Fertilizer management of groundnut at charland eco-system in tangail M.N. Islam and M.Z. Ali
85
34. Performance of HYV potato in char land eco-system M.N. Islam and S. Rahman
88

Sl
No. Title of the Experiment Page
No. 35. Adaptation of BARI released crop varieties in charland
M. A. K. Main, M. R. Islam and J. Hossain 91
36. Performance of garlic varieties at different sowing time in char area of northern region M. A. I. Sarker and M. A. Mannaf
93
37. Fertilizer management of hybrid maize at char land eco-system M. A. I. Sarker, M.N. Islam and.M. A. Mannaf
96
38. Performance of different bush bean varieties in charland area S.S.Kakon, M.N.Islam, M.A.Aziz and M.A.Rahman
98
39. Effect of planting technique on tuber yield of potato at charland eco-system M.S. Rahman, M. N. Islam and Torikul Islam
100
40. Performance of lentil varieties in the charland area M. Z. Ali, M. A. Aziz and M. A. Rahaman
102
41. Fertilizer management of groundnut at charland eco-system M. N. Islam, M. Z. Ali and M. A. Rahaman
105
42. Fertilizer management of hybrid maize at charland eco-system M. A. I. Sarker, M.N. Islam, S.M.A.H.M. Kamal, M.K. Islam and.M. A. Mannaf
108
43. Performance of garlic varieties at different sowing date in charland area of northern region M. A. I. Sarker, S.M.A.H.M. Kamal, M.K. Islam and M.A. Mannaf
111
44. Performance of lentil varieties in char land area
M. Z. Ali, M. A. Aziz, M. A. Rahaman, M. H. Shamim and M. N. Islam 115
45. Performance of different french bean varieties in charland area S.S.Kakon, M.N. Islam, M. A. Rahman and M. A. Aziz
118
46. Performance of garlic varieties at different sowing date in char area of northern region M. A. I. Sarker, S.M.A.H.M. Kamal, M.K. Islam and M.A. Mannaf
120
47. Fertilizer management of hybrid maize at char land Eco-system M. A. I. Sarker, M.N. Islam, S.M.A.H.M. Kamal, M.K. Islam and M. A. Mannaf
125
48. Adaptation of BARI released crop varieties in charland M. A. K. Main, M. R. Islam and J. Hossain
128
49. Adaptation of newly released HYV oil seeds (Mustard, Groundnut, Soybean and Sesame) in charland of Padma M.A.K. Mian, M.S. Alom, M.S. Rahman and F. Nahar
130

Research Highlights BARI Sarisha-11 would be suitable for cultivation in charland of Padma River under AEZ-11.
Alternately, BARI Sarisha-14 and BARI Sarisha-9 may be grown if it needs the land free before mid-February.
BARI Hybrid maize-7 showed better performance than other varieties in char areas. Hence the farmers of charland of Padma river under Daulatpur Upzilla of Kustia (AEZ-11) district may be suggested to cultivate BARI Hybrid maize-7 for getting higher yield.
BARI Matorshuti-2 perfored better compared to other varieties in charland of Jamalpur district. BARI Matorshuti-3 harvested (green pod) about 15-20 days earlier compared to other varieties.
BARI Chhola-4 performed better and would be suitable for cultivation in the charland of Kushtia.
BARI Soybean-5 performed better and would be suitable for cultivation in the charland areas.
BARI Mung-6 and BARI Mung-5 could be suitable for cultivation in the Sariakandi, Charland area of Bogra.
BARI released variety of sesame performed better then the Local variety. Aatshira (BARI Til-4) followed by BARI Til-2 and BARI Til-3 may be suitable for cultivation in the Charland area.
BARI Sarisha-11 required high nutrient level at charland under rainfed condition. Yield performance was similar under ORC recommendation of nutrient and AEZ-11 based recommendation but AEZ-11 based recommendation was more preferable in respect of economic point of view.
The plant growth of all fruits species in charland was medium to very good. However, final conclusion will be made after thorough evaluation of yield and yield contributing characteristics of the fruit plants of 5-6 years.
Hybrid maize paired row + 8 rows spinach, hybrid maize paired row + 4 rows bush bean , hybrid maize paired row + 8 rows red amaranth, hybrid maize paired row + 2 rows cabbage and hybrid maize paired row + 8 rows coriander would be economically profitable for charland areas.
BARI Kaon-1 and BARI Kaon-2 performed better and would be suitable for cultivation in the charland areas.
Farmers’ chose BARI Cheenabadam-8 because of higher selling price of it’s nut and short field duration. Hence, BARI Cheenabadam-8 may be selected for extensive cultivation in the charland areas of Jamalpur region.
BARI Masur-3 and BARI Masur-6 would be suitable for charland of Padma River under Daulatpur Upazilla of Kushtia (AEZ-11) district for getting higher yield.
AEZ based fertilizer dose may be economically profitable for BARI Sarisha-11 cultivation in charland of Padma River under Daulatpur Upazilla of Kushtia district (AEZ-11).

Soil test based fertilizer dose may be economically profitable suitable for BARI Sarisha-11
cultivation in Bhuapur charland of Jamuna River under Tangail district (AEZ-8).
BARI Til varieties were superior to local one at Kushtia and Tangail char. It might be concluded that BARI Til-4 performed better and would be suitable for cultivation in the charland areas.
BARI Chenabadam was profitable to the farmers of charland. The yield of BARI Chenabadam was higher than that of Dhaka 1 at Jamalpur and Kustia charland areas.
The results of three locations indicated that soil test based fertilizer dose gave the highest yield in Kustia, Pabna and Tangail charland areas and may be recommended for large scale production in the char areas and other extrapolation areas.
BARI Cheenabadam-7 and BARI Cheenabadam-8 at Kushtia and BARI Cheenabadam-8 at Jamalpur might be recommended for extensive cultivation in the charland areas of these regions because of their short field duration and high selling price.
Majority of char farmers have literacy up to primary level. They are not acquainted with modern varieties of different crops along with improved management practices. Moreover, different problems are associated with lower crop yields at char areas. Natural hazard specially drought, scarcity of irrigation facility, cumbersome procedure of getting loan, shortage of agricultural labour, unavailability of fertilizers and field machinery, high price of quality seeds, and transportation problems were the major hindrance to crop production at char areas. Introduction of new crops like soybean may be done at char areas. Selection of short duration, drought tolerant modern varieties of different crops along with improved management practices and different intercropping systems should be the potential for future researchable issues.
N55-P10-K14-S7 kg/ha would be the optimum fertilizer dose of sesame for getting highest BCR in the charland of Bhuapur, Tangail (AEZ- 8).
AEZ-11 based fertilizer dose (54-9-11-5 kg/ha NPKSZnB) might be
suitable for HYV sesame cultivation at Golapnagar char under Kushtia district for getting maximum profit.
60-16-24-13-0-1 kg/ha NPKSZnB would be the optimum fertilizer dose of mustard for getting the highest gross margin in the charland of Bhuapur, Tangail (AEZ- 8).
AEZ 11 based fertilizer dose (84-18-33-10-0.5-1 kg/ha NPKSZnB) might be economically profitable for mustard cultivation at Golapnagar char under Kushtia district for getting maximum profit.
BARI released mustard varieties of BARI Sarisha-11, BARI Sarisha-15 and wheat varieties of Prodip, BARI Gom-26 and BARI Gom-25 showed better performance and cultivation might be profitable at charland of Padma and Jamuna.
Potato cultivation under single eye double row zig zag system with10 cm/30 cm x 10 cm spacing was more profitable compared to other planting systems in charland eco-system.

Cultivation of BARI Hybrid maize-9 was more profitable than all other maize hybrids in
charland areas.
BARI Cheeenabadam-8 along with 47-38-25-15-0.5 kg ha-1 N-P-K-S-B (Based on soil test) may be optimum for large scale production in the char land area of Bhuapur, Tangail (AEZ- 8) and other extrapolation areas.
BARI Alu-7 followed by BARI Alu-8 would be recommended for cultivation in char land eco-systems under climate change situation.
BARI released mustard varieties of BARI Sarisha-11 and wheat varieties of Prodip showed better performance at charland of Padma but BARI Gom-26 showed better performance at charland of Jamuna. Overall yield performance of all wheat varieties was good in both charland areas.
BARI Roshun-1 was the maximum bulb yielder than other varieties at char area of northern region. 30 October was the best planting time for all the garlic varieties with the flexibility for BARI Roshun-1 up to 15 November.
Soil test based fertilizers dose of 189-30-79-46-1.5 kg/ha of NPKSZn for BARI Hybrid maize-9 would be optimum for getting maximum economic return in the charland of Rangpur.
BARI Jharsheem-2 and BARI Jharsheem-1 would be suitable for cultivation in the charland area of Tangail.
Potato cultivation under half cut tuber system (45 cm × 15 cm) was more profitable compared to other treatments in charland eco-system of Kustia.
BARI Cheenabadam-8 along with 47-38-25-15-0.5 kg ha-1 N-P-K-S-B (soil test based) may be recommended for large scale production in the char land area of Bhuapur, Tangail (AEZ- 8) and other extrapolation areas.
BARI Masur-6 and BARI Masur-5 were suitable for char land of Jamuna river under Bhuapur Upazilla, Tangail (AEZ-8) higher yield.
BARI Jharsheem-3 showed better yield performance compared to other varieties in char land of Tangail. BARI Jharsheem-2 harvested (green pod) about 3 to 8 days earlier compared to other varieties.
BARI Sarisha-11 gave the highest seed yield (1778 kg/ha). Wheat varieties of BARI Gom-27 and BARI Gom-28 showed higher grain yield (3450-3708 kg/ha) at Padma and Jamuna charland areas. BARI Mosur-7 gave higher seed yield of 1950 kg/ha. Farmers are interested to cultivate these HYVs.

Charland Eco-system
VARIETAL TRIAL OF HYV MUSTARD AT NEWLY DEVELOPMED CHARLAND
M.N. Islam, F. Ahmed, M.S.A. Khan and Wahida Sultana
Abstract The experiment was carried out at the charland of the Padma River under Daulatpur upazila of Kustia district (AEZ-11) during rabi season of 2007-08 to evaluate the yield performance of BARI developed mustard varieties against local variety at charland. Four mustard varieties, viz. BARI Sarisha-9, BARI Sarisha-11, BARI Sarisha-14 and BARI Sarisha-15 were compared with improved Tori-7. BARI Sarisha-11 was the highest yielder (2.5 t/ha) and it produced 49% higher yield than improved Tori-7. The results revealed that BARI Sarisha-11 is suitable for cultivation in charland of AEZ-11. Alternately, BARI Sarisha-14 may be grown as short duration (75-80 days) variety.
Introduction
Mustard is an important oilseed crop in Bangladesh. It ranks first in respect of acreage and production occupying about 60% area of oilseed crop in the country. Mustard oil has been using as a medium of cooking from the time immemorial. The shortage of edible oil in the country is acute and it has to import huge amount of edible oil to meet up the requirement of the people. The shortage of edible oil may be minimized either by increasing area under mustard cultivation or by increasing yield per unit area. Possibility of increasing area under mustard cultivation is meagre because most of the farmers are interested in growing high yielding rice instead of mustard. Increasing yield of mustard per unit area is the only way to increase the production of edible oil. However, there exists enough scope of growing mustard in charland areas after receding flood water. Generally, farmers of charland area cultivate local variety of mustard due to lack of availability of high yielding varieties (HYV). The yield level of local variety is very low. It is possible to uplift yield level of mustard through introducing HYV in those areas. Therefore, the experiment was carried out to evaluate the yield performance of BARI developed mustard varieties against local variety at charland under AEZ-11.
Materials and Methods
The experiment was conducted at the charland of the Padma River under Daulatpur Upazila of Kushtia district during rabi season of 2007-08. The soil of the experimental field was silty loam in texture with pH 7.3 belonging to Calcareous Dark Grey Floodplain soil type (AEZ-11). Four HYV mustard varieties viz., BARI Sarisha-9, BARI Sarisha-11, BARI Sarisha-14 and BARI Sarisha-15 were tested against improved Tori-7 (local variety). The experiment was laid out in a RCB design with 4 replications. The unit plot size was 4m x 5m. Improved Tori-7 and BARI Sarisha-9 were grown with 100-32-80-20-3 kg/ha NPKSZn while BARI Sarisha-11, BARI Sarisha-14 and BARI Sarisha-15 were grown with 160-46-120-36-4 kg/ha NPKSZn. Fertilizer rate was selected on the basis of Fertilizer Recommendation Guide -2005, BARC. One half of nitrogen and full quantity of PKSZn were applied as basal in the form of urea, triple super phosphate, muriate of potash, gypsum and zinc sulphate, respectively. Seeds of each variety were broadcast on November 07, 2007. Remaining half nitrogen was applied at the time of flower initiation (20-25 days after seeding) as top dressing. Three irrigations were given at 12 days after sowing (DAS), after top

Charland Eco-System
2
dressing and at 50 DAS. The crop was kept weed free up to 20 DAS by two hand weedings at 10 and 20 DAS. Plant population/m2 at harvest was taken from randomly selected 3 places. Other yield components like number of siliqua/plant, seeds/ pod and 1000-seeds weight were taken from randomly selected 10 plants from each plot. Except BARI Sarisha-11, other varieties were harvested on January 31, 2008. BARI Sarisha-11 was harvested on February 27, 2008. Seed yields were taken from whole plot. Data on yield and yield components were analyzed statistically and the means were adjudged using LSD test at 5% level of significance.
Results and Discussion
Yield and yield components of different mustard varieties is presented in Table 1. Number of siliqua/plant varied significantly in different mustard varieties. The highest number of siliqua/plant was recorded in BARI Sarisha-11 (153) which was followed by improved Tori-7 (118). BARI Sarisha-14 produced the lowest number of siliqua/plant (86). The highest number of siliqua/plant of BARI Sarisha-11 seemed to be related to the tall statured and more branched canopy. Significant variation in number of seeds/siliqua was observed in different mustard varieties. BARI Sarisha-14 (22.5) produced the maximum number of seeds/siliqua followed by BARI Sarisha-15 (20.1). On the other hand, the minimum number of seeds/siliqua was recorded in BARI Sarisha-11. Thousand seeds weight (seeds size) is a genetically controlled trait. The largest seeds were found in BARI Sarisha-11 (3.3 g/1000 seeds) which was followed by BARI Sarisha-14 (2.9 g/1000 seeds). Contrarily, seeds size of other varieties was statistically identical (2.3 to 2.5 g/1000 seeds).
Seed yield also differed significantly among mustard varieties (Table 1). Seed yield of mustard is a function of plant population, siliqua/plant, seeds/siliqua and 1000-seeds weight. BARI Sarisha-11 produced the height seed yield (2.5 t/ha) which was 49% higher than improved Tori-7. The heighest seed yield of BARI Sarisha-11 might be due to cumulative effect of siliqua/plant and 1000-seeds weight. The yield level of other varieties was also higher (8 to 21%) than that of Tori -7.
Table 1. Yield and yield components of mustard varieties in charland of Kushtia district Varieties Plants/m2
(no.) Siliqua/plant
(no.) Seeds/siliqua
(no.) 1000-seed weight
(g) Yield (t/ha)
BARI Sarisha-9 76 103 16.2 2.4 1.38 BARI Sarisha-11 75 153 12.4 3.3 2.50 BARI Sarisha-14 73 86 22.5 2.9 1.61 BARI Sarisha-15 70 104 20.1 2.5 1.49 Improved Tori-7 (checked variety)
72 118 14.1 2.3 1.27
LSD (0.05) NS 13 1.6 0.2 0.27 CV(%) 13 8 6 5 12
Conclusion
From the study it may be concluded that BARI Sarisha-11 is suitable for cultivation in charland of Padma River under AEZ-11. Alternately, BARI Sarisha-14 may be grown if it needs the land free before mid-February.

Charland Eco-System
3
VARIETAL TRIAL OF HYV MUSTARD AT NEWLY DEVELOPED CHARLAND
M.N. Islam, F. Ahmed, M.S.A. Khan and W. Sultana
Abstract The experiment was carried out at the charland of the Padma River under Daulatpur upazila of Kustia district (AEZ-11) during rabi season of 2008-09 to evaluate the yield performance of BARI developed mustard varieties against local variety at charland. Four mustard varieties, viz. BARI Sarisha-9, BARI Sarisha-11, BARI Sarisha-14 and BARI Sarisha-15 were compared with improved Tori -7. BARI Sarisha-11 was the highest yielder (1491kg/ha) and it produced 66% higher yield than improved Tori -7. The results revealed that BARI Sarisha-11 is suitable for cultivation in charland of AEZ -11. Alternately, BARI Sarisha-9 may be grown as short duration (80-85 days) variety.
Introduction
Mustard is an important oilseed crop in Bangladesh. It ranks first in respect of acreage and production occupying about 60% area of oilseed crop in the country. Mustard oil has been using as a medium of cooking from the time immemorial. The shortage of edible oil in the country is acute and it has to import huge amount of edible oil to meet up the requirement of the people. The shortage of edible oil may be minimized either by increasing area under mustard cultivation or by increasing yield per unit area. Possibility of increasing area under mustard cultivation is meager because most of the farmers are interested in growing high yielding rice instead of mustard. Increasing yield of mustard per unit area is the only way to increase the production of edible oil. However, there exists enough scope of growing mustard in charland areas after receding flood water. Generally, farmers of charland area cultivate local variety of mustard due to lack of availability of high yielding varieties (HYV). The yield level of local variety is very low. It is possible to uplift yield level of mustard through introducing HYV in those areas. Therefore, the experiment was carried out to evaluate the yield performance of BARI developed mustard varieties against local variety at charland under AEZ-11.
Materials and Methods
The experiment was conducted at the charland of the Padma River under Daulatpur Upazila of Kushtia district during rabi season of 2008-09. The soil of the experimental field was silty loam in texture with pH 7.3 belonging to Calcareous Dark Grey Floodplain soil type (AEZ-11). Four HYV mustard varieties viz., BARI Sarisha-9, BARI Sarisha-11, BARI Sarisha-14 and BARI Sarisha-15 were tested against improved Tori-7 (local variety). The experiment was laid out in a RCB design with 4 replications. The unit plot size was 4m x 5m. Improved Tori-7 and BARI Sarisha-9 were grown with 100-32-80-20-3 kg/ha NPKSZn while BARI Sarisha-11, BARI Sarisha-14 and BARI Sarisha-15 were grown with 160-46-120-36-4 kg/ha NPKSZn. Fertilizer rate was selected on the basis of Fertilizer Recommendation Guide -2005, BARC. One half of nitrogen and full quantity of PKSZn were applied as basal in the form of urea, triple super phosphate, muriate of potash, gypsum and zinc sulphate, respectively. Seeds of each variety were broadcast on November 07, 2008. Remaining half nitrogen was applied at the time of flower initiation (20-25 days after seeding) as top dressing. Three irrigations were given at 12 days after sowing (DAS), after top dressing and at 50 DAS. The crop was kept weed free up to 20 DAS by two hand weedings at 10 and 20 DAS.

Charland Eco-System
4
Plant population/m2 at harvest was taken from randomly selected 3 places. Other yield components like number of siliqua/plant, seeds/ pod and 1000-seeds weight were taken from randomly selected 10 plants from each plot. Except BARI Sarisha-11, other varieties were harvested on January 31, 2009. BARI Sarisha-11 was harvested on February 27, 2009. Seed yields were taken from whole plot. Data on yield and yield components were analyzed statistically and the means were adjudged using LSD test at 5% level of significance.
Results and Discussion
Yield and yield components of different mustard varieties is presented in Table 1. Number of siliqua/plant varied significantly in different mustard varieties. The highest number of siliqua/plant was recorded in BARI Sarisha-11 (207) which was followed by improved Tori-7 (173). BARI Sarisha-14 produced the lowest number of siliqua/plant (92). The highest number of siliqua/plant of BARI Sarisha-11 seemed to be related to the tall statured and more branched canopy. Significant variation in number of seeds/siliqua was observed in different mustard varieties. BARI Sarisha-14 produced the maximum number of seeds/siliqua (32.2) followed by BARI Sarisha-15 (21.0). On the other hand, the minimum number of seeds/siliqua was recorded in BARI Sarisha-11 (11.7). Thousand seeds weight (seeds size) is a genetically controlled trait. The largest seeds were found in BARI Sarisha-11 (3.2 g/1000 seeds) which was followed by BARI Sarisha-14 (2.8 g/1000 seeds). Contrarily, seeds size of other varieties was statistically identical (2.2 to 2.4 g/1000 seeds).
Seed yield also differed significantly among mustard varieties (Table 1). Seed yield of mustard is a function of plant population, siliqua/plant, seeds/siliqua and 1000-seeds weight. BARI Sarisha-11 produced the highest seed yield (1491kg/ha) which was 66% higher than improved Tori-7. The heighest seed yield of BARI Sarisha-11 might be due to cumulative effect of siliqua/plant and 1000-seeds weight. BARI Sarisha-9 was second yielder (1158 kg/ha). The yield level of other varieties was also higher (8 to 42%) than that of Tori -7.
Table1. Yield and yield components of mustard varieties in charland of Kushtia district during 2008-09 Varieties Plants/m2
(no.) Siliqua/
plant (no.) Seeds/
siliqua (no.) 1000-seed weight (g)
Yield (kg/ha)
BARI Sarisha-9 46.0 149 14.5 2.3 1158 BARI Sarisha-11 41.0 207 11.7 3.2 1491 BARI Sarisha-14 40.5 92 32.2 2.8 556 BARI Sarisha-15 50.5 124 21.0 2.4 883 Improved Tori 7 (checked variety)
47.5 173 15.6 2.2 514
LSD (0.05) NS 18 2.1 0.2 170 CV (%) 15 8 7 5 12
NS= Not significant
Conclusion
From the study it may be concluded that BARI Sarisha-11 is suitable for cultivation in charland of Padma River under AEZ-11. Alternately, BARI Sarisha-9 may be grown if it needs the land free before mid-February.
Charland Eco-System
5
PERFORMANCE OF HYBRID MAIZE VARIETIES IN CHARLAND AREAS
S. Begum, M. N. Islam, S. S. Kakon and Wahida Sultana
Abstract An experiment was conducted at the charland of Padma River under Daulatpur Upazilla of Kustia district (AEZ-11) during rabi season of 2008-2009 to evaluate the yield performance of BARI developed Hybrid maize varieties viz. BARI Hybrid maize-3, BARI Hybrid maize-5, BARI Hybrid maize-7 against Pacific-11 in charland. BARI Hybrid maize-7 produced the highest seed yield (7.37 t/ha). The second highest seed yield (6.86 t/ha) was obtained from Pacific-11. The lowest yield (4.44 t/ha) was obtained from BARI Hybrid maize-3.
Introduction
Maize is one of the important cereal crops in our country. It can be grown throughout the year because of its photo-insensitiveness. Hybrid maize has been introduced in our country due to its higher yield potentiality. The maize area and production is increasing gradually and the crop is being popular among the farmers. The farmers cultivate locally available varieties of maize. As a result, they get lower yield and if those varieties are replaced by BARI developed Hybrid maize, the farmers as well as the country will be benefited. Therefore the experiment was conducted to select Hybrid maize varieties suitable for charland area of Bangladesh.
Materials and Methods
The experiment was conducted at the charland of the Padma River under Daulatpur Upazilla of Kustia district during rabi season of 2008-2009. The soil of the experimental field was silty loam in texture with pH 7.3 belonging to calcareous Dark Grey Foodplain soil (AEZ-11). Four Hybrid maize varieties viz. BARI-Hybrid maize-3, BARI Hybrid maize-5, BARI Hybrid maize-7 and pacific-11 were used in this experiment. The experiment was laid out in randomized complete block with 3 three replications. The unit plot size was 4m x 5m. Seeds were sown on 27 November, 2008 at a spacing of 75 cm x 25 cm. The plots were fertilized with 250-55-110-50-5 kg/ha NPKSZn. One third N and full amount of other fertilizers were applied at the time of final land preparation. Rest amount of N were applied in two equal splits at 30 and 60 DAE. Irrigations were given when necessary. Other intercultural operations were done as and when necessary. Data on yield attributing characters were recorded from 10 randomly selected plants from each plot. Yield was calculated from whole plot basis. Collected data were analyzed statistically and the means were adjudged using LSD test at 5% level of significance.
Results and Discussion
Yield and yield components of different Hybrid maize varieties are presented in Table-1. Pacific-11 produced the highest number of grains /cob (588) which was identical to BARI Hybrid maize 7 and BARI Hybrid maize-5. The lowest number of grain/cob (432) was obtained from BARI Hybrid maize-3. Thousand seed weight was significantly the highest (296.4 gm) in BARI Hybrid maize-7 due to bolder seed. Other varieties produced significantly lower 1000 seed weight. The variety BARI Hybrid maize-7 produced significantly the highest seed yield (7.37 t/ha) which was attributed by cumulative effect number of grains /cob and 1000 seed weight. The second highest seed yield was obtained from pacific-11 (6.86 t/ha) and the lowest (4.44 t/ha) from BARI Hybrid

Charland Eco-System
6
maize-3.
Table 3. Performance of maize varieties in char land area of Kustia Treatments Cobs/m2 (no.) Grains/cob
(no.) 1000 seed weight
(gm) Grain yield (t/ha)
BARI Hybrid maize-5 5.20 460 250.2 5.21 BARI Hybrid maize 3 5.22 432 234.4 4.44 BARI Hybrid maize 7 5.24 462 296.4 7.37 Pacific 11 5.23 588 246.9 6.86 LSD (0.05) 0.42 40.55 10.6 0.45 CV (%) 6.67 6.79 3.38 6.17
Conclusion
BARI Hybrid maize-7 showed better performance than other varieties in char areas. Hence the farmers of char Land of Padma river under Daulatpur Upzilla of Kustia (AEZ-11) district may be suggested to cultivate BARI Hybrid maize-7 for getting higher yield.
Charland Eco-System
7
PERFORMANCE OF FIELD PEA VARIETIES IN CHARLAND AREAS
S.S. Kakon, I.M. Ahmed, W. Sultana, S.M. Raquibullah and M. Biswas
Abstract An experiment was conducted at the charland of the chandra village under Jamalpur district during rabi season 2008-09 to evaluate the performance of three field pea varieties (BARI Matorshuti-1, BARI Matorshuti-2, BARI Matorshuti-3). Yield and yield attributes of fieldpea varieties significantly differed in charland. The highest pod yield (10.85 t/ha) was obtained from BARI Matorshuti-2 with higher number of pods plant-1 and single pod weight. The second highest pod yield (9.32 t/ha) was obtained from BARI Matorshuti-1, while the lowest from BARI Matorshuti-3 due to lowest number of pods/plant, seeds/pod. The results revealed that BARI Matorshuti-2 would be suitable for cultivation in charlad of Jamalpur.
Introduction
Field pea is popular as vegetable. It is grown mainly for young pod to get tender green seeds as vegetable. The matured seeds can be used for preparing dal or chatpati. The crop has gained popularity for its short durability, high nutritive value and good quality. Green pods are rich in vitamins and minerals. Some farmers of charland area grow local variety of field pea in broadcast method with low yield potential. The existing residual soil moisture retaining in the soil could also be enough for growth and production of field pea. In this context BARI developed HYV field pea varieties which can be introduced at charland to maximize farmer’s income. Therefore, the experiment was conducted to select suitable HYV field pea for charland area.
Materials and Methods
The experiment was conducted at the charland of the village Hat Chandra of sadar upazila of Jamalpur district during rabi season 2008-09. Three BARI developed field pea varieties viz., BARI Matorshuti-1, BARI Matorshuti-2 and BARI Matorshuti-3 were evaluated. The experiment was laid out in a randomized complete block design with 6 replications. Seeds were sown on 15 November 2008 with 30X10 spacing at Jamalpur district. The unit plot size was 4.5 m x 3m. The crops were fertilized with N60P28K40S12 kg/ha. All the fertilizers were applied as basal (Based on FRG 2005). Irrigation and weeding were done as and when necessary. Data on yield contributing characters were recorded from 10 randomly selected plants from each plot. Yield was calculated from whole plot. Collected data were analyzed statistically and means were compared using LSD test at 5% level of significance.
Results and Discussion
Yield and yield attributes of different field pea varieties is presented in Table 1. Different varieties had significant effect on yield and yield contributing characters of field pea. Number of pods plant-1 varied significantly in different field pea varieties. The highest number of pods plant-
1 was recorded in BARI Matorshuti-2 (16.85) which was followed by BARI Matorshuti-1 (13.25). BARI Matorshuti-3 produced the lowest number of pods plant-1 (5.9). Significant variation in number of seeds pod-1 was observed in different field pea varieties. BARI Matorshuti-2 (5.65) produced the maximum number of seed pod-1 and minimum number of seed pod-1 was recorded in BARI Matorshuti-3 (4.01). Significantly the highest weight of single pod (19g) was recorded in BARI Matorshuti-2 which was followed by BARI Matorshuti-1. The

Charland Eco-System
8
variety BARI Matorshuti-2 produced significantly the highest pod yield (10.85 t/ha) which was attributed by the highest number of pods plant-1 and single pod weight and the second highest pod yield (9.32 t/ha) was obtained from BARI Matorshuti-1, while the lowest from Matorshuti-3 due to lowest number of pods/plant and seeds/pod.
Conclusion
From the results it may be concluded that BARI Matorshuti-2 perfored better compared to other varieties in charland of Jamalpur district. BARI Matorshuti-3 harvested (green pod) about 15-20 days earlier compared to other varieties.
Table 1 Yield and yield attributes of fieldpea varieties in the charland fo Chandra, Jamalpur Sadar during Rabi, 2008
Treatment Plant/m2
(no.) Pods/plant
(no.) Single pod wt
(g) Seed/pod
(no.) Days to harvest
Yield (t/ha)
BARI Matorshuti-1
30.52 13.25 16 5.35 85 9.32
BARI Matorshuti-2
25.25 16.85 19 5.98 80 10.85
BARI Matorshuti-3
24.2 5.9 12 4.21 65 5.22
CV(%) 12 8 6 6 - 12 LSD(0.05) 4.1152 0.6844 1.2086 0.5719 - 1.3058

Charland Eco-System
9
PERFORMANCE OF DIFFERENT CHICKPEA VARIETIES IN THE CHARLAND AREA
I. M. Ahmed, M.N. Islam, M.T. Rahman, S.S. Kakon and S.M.S. Haider
Abstract The experiment was conducted at the charland of the Padma River under Daulatpur upazila of Kushtia district during rabi season of 2008-09 to evaluate the performance of six chickpea varieties (BARI Chhola-3, BARI Chhola-4, BARI Chhola-5, BARI Chhola-6, BARI Chhola-7 and BARI Chhola-8). Yield and yield attributes of Chhola varieties significantly differed in the charland. The highest seed yield was obtained from BARI Chhola-4 (2.77 t ha-1) with higher number of pods plant-1 while the lowest was from BARI Chhola -4 (1.33 t ha-1).
Introduction
Chickpea is an important pulse crop in Bangladesh. A large portion of demand for pulse in Bangladesh is fulfilled by chickpea. Nowadays, its area and production drastically decreasing due to competition with other crops. The area under charland is increasing day by day in Bangladesh. Many of newly developed charlands have been brought under cultivation by settlers. However, these settlers/farmers of charland area are cultivating local variety of chickpea due to lack of availability of high yielding varieties (HYV). The yield level of local variety is very low. In this situation it is urgent to uplift yield level of chickpea through introducing BARI developed HYV in those areas to maximize farmers income. Therefore, the experiment was carried out to evaluate the yield performance of BARI developed chickpea varieties.
Materials and Methods
The experiment was conducted at the charland of the Padma River under Daulatpur upazila of Kushtia district during rabi season of 2008-09. The soil of the experimental field was silty loam in texture with pH 7.3 belonging to Calcareous Dark Grey Floodplain soil type (AEZ-11). Six BARI developed Chhola varieties viz., BARI Chhola -3, BARI Chhola-4, BARI Chhola-5, BARI Chhola-6, BARI Chhola-7 and BARI Chhola-8 were evaluated. The experiment was laid out in randomized complete block design with 3 replications. Seeds were sown with spacing 30 cm ×10 cm on November 17, 2008 at Kushita districts. The unit plot size was 5 m x 4 m. The crops were fertilized with N15P20K15S10 Zn5 kg/ha (Based on FRG 2005) in the form of Urea, TSP, MoP, Gypsum and Zinc Sulphate. The crop was grown in rainfed condition. Weeding was done as and when necessary. The crop was infested with ‘pod borer’ at pod development stage and insecticide ‘diazinone’ was applied to control the pest. Data on yield attributing characters were recorded from 10 randomly selected plants from each plot. Yield was calculated from the crop harvested from whole plot. Collected data were analyzed statistically with the help of a computer package program MSTATC and mean separation was done using LSD test at 5% level of significance.
Results and Discussion
Yield and yield components of different chickpea varieties is presented in Table 1. Significantly maximum number of pods plant-1 was obtained from BARI Chhola-4 (116.4). The minimum number of pods plant-1 (31.4) was found in BARI Chhola-6 and it was also statistically similar to BARI Chhola-8. The highest number of seeds pod-1 was obtained from BARI Chhola-6 and

Charland Eco-System
10
BARI Chhola-7 (1.4). While the other varieties produced more or less same number of pods. Significantly highest thousand seed weight (242.90 g) was recorded in BARI Chhola-8. On the contrary, BARI chhola-5 produced lowest 1000-seed weight. The variety BARI Chhola-4 produced significantly highest seed yield (2.77 t ha-1) which was attributed by the highest number of pods plant-1. The second highest seed yield was obtained from BARI Chhola-3 (2.11 t ha-1) while the lowest from BARI Chhola-5 (1.33 t ha-1).
Table 1. Yield and yield attributes of different Chhola varieties in the charland of Kushtia district during Rabi season, 2008
Varieties Number of pod plant-
1 Number of seed pod-
1 1000-seed weight (g) Seed yield
(t ha-1) BARI Chhola-3 46.4 1.2 153.70 2.11 BARI Chhola-4 116.4 1.3 153.30 2.77 BARI Chhola-5 74.0 1.2 138.20 2.13 BARI Chhola-6 31.4 1.4 154.80 1.33 BARI Chhola-7 45.8 1.4 148.50 2.00 BARI Chhola-8 34.2 1.3 242.90 1.60 LSD (0.05) 12.35 0.12 17.97 0.42 CV(%) 11.70 5.09 5.98 11.68
Conclusion
From the results it may be concluded that BARI Chhola-4 would be suitable for the charland of Kushtia district.

Charland Eco-System
11
PERFORMANCE OF SOYBEAN VARIETIES IN THE CHAR LAND AREA
S. S. Kakon, S. Begum, J.A. Chodhury, S. M. Raquibullah and M. Biswas
Abstract An experiment was conducted at charland of Hut Chandra village under Jamalpur district and Charland of Jutashi village uner Kushtia district during the period from January to May 2009 to evaluate the performance of three Soybean varieties (BARI Soybean 5, Shohag, Bangladesh Soybean 4). Yield and yield attributes of Soybean varieties significantly differed in both Charlands. The highest seed yield (1576 kg/ha) was obtained from Shohag at Jamalpur and Kushita (1786 kg) from BARI Soybean-5 with higher number of pods plant and 1000-seed weight, while the lowest from Bangladesh Soybean 4 (1665 kg/ha) at Jamalpur and Shohag (1200 kg/ha) at Kushita
Introduction
The area of charland is estimated to be 0.82 m ha in Bangladesh (MPO, 1986 & SRDI). Farmers of char area grow Soybean after receeding flood water. Soybean (Glycine max L.) is one of the important oil crop in world and new prospective crop of Bangladesh. Soybean seeds contain 42-45% edible oil (Mondol et al., 2002). Farmers get low yield from Soybean cultivation as they use low yield potential variety. If we can introduce BARI developed HYV, the farmers as well as the country will be benefited. Therefore, the experiment was conducted to select suitable HYV Soybean for charland area.
Materials and Methods
The trial was conducted at the char land of the village Hat Chandra of Sadar Upazila, Jamalpur, Bangladesh during the period from January to May 2009 to evaluate the performance of Soybean varieties in the char land area. There were three varieties of Soybean viz. Bangladesh Soybean-4 (V1), BARI Soybean-5 (V2) and Shohag (V3) in the trial. The experiment was laid out in RCB design with 4 replications. Seeds were sown with spacing 30 cm ×5 cm on Jan 17 and Jan 22, at Jamalpur and Kushita districts, respectively. Plot size was 9m x 7m for each variety. Plots were fertilized with N28P35K60S20 kg ha-1
as urea, TSP, MP and gypsum, respectively. All fertilizers were applied during final land preparation as basal. The crop was grown under irrigated condition. Irrigation was applied at 30 and 60 days after sowing. Weeding was done as and when necessary. The crop was infested with hairy catterpilar at pod filling stage of the crop. ‘Vitashield (Chloropyriphos) was applied to control the insect pest. Data on yield attributing characters were recorded from 10 randomly selected plants from the whole plot. Seed yield data was collected from the crop harvested from whole plot and plot yield data was converted to kg ha-1. Collected data were analyzed statistically with the help of a computer package program MSTATC was done using LSD test at 5% level of significance.
Results and Discussion
Different varieties had significant effect on yield and yield contributing characters of Soybean (Table 1). Variety Bangladesh Soybean-4 had the taller plant compared to the other two varieties BARI Soybean-5 and Shohag. Significantly maximum number of pods plant-1 was obtained from Shohag at Jamalpur (45.7) and BARI Soybean-5 at Kushitia (48). The minimum number of pods plant (28.6 at Jamalpur and 25.5 at Kushita) was found in Bangladesh Soybean 4. Significantly maximum number of seeds pod-1 was obtained from Bangladesh Soybean 4 at

Charland Eco-System
12
Jamalpur (2.6) and Kushita (2.9). While the minimum from Shohag 1.4 at Jamalpur and 2.3 at Kushita. Significantly the highest thousand seed weight (8.38 at Jamalpur 8.05 at Kushita) was in shohag which was followed by BARI Soybean-5. Significantly the highest seed yield (1576kg/ha) was obtained Shohag at Jamalpur and BARI Soybean-5 at kushtia (1786 kg/ha) with highest number of pods plant-1 and 1000 seed weight. Seed size was smaller in Bangladesh Soybean-4 about half of the other varieties.
Table 1. Yield and yield attributes of different Soybean varieties in the charland of Jamalpur and Kushtia district during Kahrif-I, 2009 Varieties Plant height
(cm) Number of pods
plant-1 Seed pod-1
(no.) 1000-seed weight (g)
Seed yield (kg ha-1)
Days to maturity
Jam. Kus. Jam. Kus. Jam. Kus. Jam. Kus. Jam. Kus. Jam. V1 63.1 60.5 28.6 25.5 2.6 2.9 4.75 5.16 1365 1595 113 V2 53.6 45.5 43.7 48 2.0 2.6 8.02 7.56 1502 1786 109 V3 54.8 50.5 45.7 40.5 1.4 2.3 8.38 8.05 1576 1200 113 LSD(0.05) 6.39 5.1 NS NS 1.30 NS 0.49 1.3 66.20 168 CV(%) 11.70 4 6.76 8.76 7.76 4 7.98 2 4.63 9
V1 = Bangladesh Soybean-4; V2 = BARI Soybean-5; V3 = Shohag
Farmer’s reaction
Usually the farmers of this region don’t grow Soybean. At this moment, they want better marketing system to ensure high selling price of the produce. Among the varieties the farmer’s showed their eager for cultivation of the variety BARI Soybean-5 because of earliness and higher yield potential.
Conclusion
It might be concluded that BARI Soybean-5 would be suitable for cultivation in the charland areas.

Charland Eco-System
13
PERFORMANCE OF MUNGBEAN VARIETIES IN THE CHAR LAND AREA
M. A. Aziz, S. Begum, A. Akter and J. Haider
Abstract A field experiment was conducted in the char land area of Sariakandi, Bogra during the Kharif-I season of 2009 to observe the performance of Mungbean varieties in the Charland. Six Mungbean varieties viz. BARI Mung-1, BARI Mung-2, BARI Mung-3, BARI Mung-4, BARI Mung-5, and BARI Mung-6 were tested in the experiment. BARI Mung-6 produced the highest yield (1.14 t/ha) which was identical with BARI Mung-5 (1.13 t/ha). The study indicated that BARI Mung-6 and/or BARI Mung-5 could be grown in the Sariakandi, Charland area.
Introduction
Mungbean (Vigna radiata L. Wilczek) belongs to the family leguminosae is one of the important pulse crop in Bangladesh. It is a rich source of protein and several essential micronutrients. It contains 24.5% protein and 59.9% carbohydrate. It also contains 75 mg calcium, 8.5 mg iron and 49 mg B-carotine per 100g of split daul (Bakr et al. 2004).The foliage and stem are also a good source of fodder for live stock as well as a green manure. Like other leguminous crop, the crop can fix atmospheric nitrogen and improves soil fertility and fits well in many cropping system because of its short maturity duration. In Bangladesh Mungbean is grown on area of 22.4 thousand ha with total production of 16.9 thousand tons making an average of 750 kg per ha (Handbook of Agricultural Statistics 2007). But the production is extremely insufficient compared to its requirement. To fulfill the demand of the country, the area and production of the crop needs to be expanded. The crop can be cultivated extensively in the charland areas where organic matter and water holding capacity is very low. The area under char land is estimated to be 44491 ha in Bogra district (Khan et al., 2008). In this context the experiment was conducted to select BARI developed suitable HYV Mungbean variety for the Charland area of Bogra.
Materials and Methods
The experiment was conducted in the char land areas of Sariakandi, Bogra during the period from March to May 2009. Six varieties of Mungbean viz. BARI Mung-1, BARI Mung-2, BARI Mung-3, BARI Mung-4, BARI Mung-5 and BARI Mung-6 were tested. The experiment was laid out in RCB design with three replications having plot size 5 m × 4 m with an inter plot distance of 0.75 m and inter block distance of 1.0 m. Seeds were sown on March 13, 2009. Spacing of row to row and seed to seed was 30 cm and 10 cm, respectively. Soil was fertilized with urea, triple super phosphate, muriate of potash and gypsum, respectively, at the rate of 43, 130, 34 and 56 kg/ha. Plant protection measures and all other intercultural operations were done as and when necessary. The pods were collected by hand plucking from the plants of the individual plots and kept separately with proper tagging. After proper sun drying, the seeds were separated from the pods and further the seeds were dried maintaining about 8-10% moisture level. Data on different plant characters such as plant height, number of pods per plant were recorded carefully from 10 randomly selected plants of each plot. The yield per plot was recorded and converted into yield per hectare. Data were analyzed statistically and the treatment means were separated by Duncan’s Multiple Range Test (DMRT) according to Gomez and Gomez (1984).

Charland Eco-System
14
Results and Discussion
The performance of Mungbean varieties has been summarized in Table 1. Significant variation was found among the varieties in case of plant height, no of pod/plant and grain yield, whereas other characters were insignificant. The tallest plant was produced by the variety BARI Mung-4 (65.0 cm) which was identical with BARI Mung-3 (63.33 cm), BARI Mung-2 (64.00 cm) and BARI Mung-1 (61.67 cm). BARI Mung-5 was significantly the shortest plant (52.33 cm) which was identical with BARI Mung-6 (52.66 cm). The number of pods/plant varied significantly among the varieties. Significantly the maximum number of pods/plant was recorded from BARI Mung-6 (18.67) which was identical with BARI Mung-5 (18.66). BARI Mung-1 gave the lowest number of pods/plant (14.80). The number of seeds/pod was insignificant among the varieties however, BARI Mung-6, BARI Mung-5 and BARI Mung-4 gave the maximum number of seeds/pod. Significantly the highest individual grain weight was obtained from BARI Mung-6 (34.60 g/1000 seed) which was identical with BARI Mung-5 (33.40 g/1000 seed) and BARI Mung-4 (32.30 g/1000 seed). BARI Mung-3, BARI Mung-2 and BARI Mung-1 gave the lowest individual seed weight. Significantly the highest grain yield was recorded from BARI Mung-6 (1.14 t/ha) which was identical with BARI Mung-5 (1.13 t/ha). BARI Mung-1 gave the lowest grain yield (0.85 t/ha).
Table 1. Performance of different varieties of Mungbean at char land areas of Sariakandi, Bogra during 2008-09 Treatments Plant popln.
/m2 Plant height
(cm) Pods/
plant (no.) Seeds /pod
(no.) 1000 seed weight (g)
Grain yield (t/ha)
Straw yield (t/ha)
BARI Mung-1 28.33 61.67 a 14.80 c 8.77 21.43 b 0.85 b 4.33 BARI Mung-2 28.00 64.00 a 15.37 bc 8.80 21.50 b 0.91 b 4.41 BARI Mung-3 29.00 63.33 a 16.40 abc 8.87 21.20 b 0.95 b 4.36 BARI Mung-4 28.33 65.00 a 17.30 ab 9.17 32.30 a 0.91 b 4.46 BARI Mung-5 28.00 52.33 b 18.66 a 9.27 33.40 a 1.13 a 4.35 BARI Mung-6 28.33 52.66 b 18.67 a 9.60 34.60 a 1.14 a 4.29 CV (%) 3.35 4.4 7.35 9.56 2.69 6.70 6.38
Means is a column having same letter(s) did not differ significantly
Farmer’s reaction 01. Mungbean is a new crop to the farmers of Sariakandi, Charland. 02. Farmers are interested to grow Mungbean. 03. Farmers are satisfied with the yield obtained in the experiment.
Conclusion
The results revealed from the study that BARI Mung-6 and BARI Mung-5 could be suitable for cultivation in the Sariakandi, Charland area of Bogra.
References Bakr, M. A., M. A. Afzal, A. Hamid, M. M. Haque and M. S. Aktar. 2004. Blackgram in Bangladesh. Lentil Blackgram
and Mungbean Development Pilot Project, Publication No.25, Pulses Research Centre, BARI, Gazipur, 60 p.
Handbook of Agricultural Statistics. 2007. Ministry of Agriculture. Government of the Peoples Republic of Bangladesh (http//www.moa.gov.bd/statistics/ statistics.htm).
Khan et al., 2008. Research Experiences with Problem Soils of Bangladesh, Soil Science Division, Bangladesh Agricultural Research Institute (BARI) Joydebpur, Gazipur- 1701.
Gomez, K.A and Gomez, A.A. 1984. Statistical procedures for Agricultural Research, Int. Rice Res. Inst. John Willy and Sons, New York, Chickester, Brisbane, Torento, Singapore, p. 643.

Charland Eco-System
15
PERFORMANCE OF SESAME VARIETIES IN THE CHAR LAND AREA
M. A. Aziz, J. A. Chowdhuary, M. Biswas, A. Akter and J. Haider
Abstract An experiment was conducted in the char land area of Sariakandi, Bogra and Hat Chandra, Jamalpur during the Kharif-I season of 2009 to evaluate the performance of BARI released sesame varieties. Five sesame varieties viz. BARI Til-2, BARI Til-3, T-6, Aatshira and Local were tested at a Jamalpur where as at Jamalpur SES-70-7 and JP -83-3 were included instatead of T6 and local variety. It was found that BARI released variety of sesame performed better then the Local variety. Aatshira followed by BARI Til-2 and BARI Til-3 may be suitable for cultivation at the Charland of Bogra. Where as at the charland of Jamalpur BARI till-3 and SES-70-7 gave the maximum yield and JP-83-3 gave the minimum yield.
Introduction
Sesame (Sesamum indicum L.) is one of the important oil crops in Bangladesh. It contains 5.3% water, 5.2% minerals, 2.9% frbre, 18.3% protein, 43.3% fat and 25% carbohydrate per 100g edible portion. In Bangladesh sesame is grown in an area of 30.7 thousand ha with total production of 39.2 thousand tons making an average of 1.28 ton per ha (Handbook of Agricultural Statistics 2007). This yield is much lower than most of sesame growing countries of the world. Farmers of char land areas grow local variety of sesame with traditional management practices resulting in very low yield compared to HYV. In this context BARI developed HYV sesame varieties can be introduced at Charland areas to maximize farmer’s production as well as income. Therefore, the experiment was conducted to select suitable HYV sesame variety for Charland area.
Materials and Methods
The experiment was conducted in the char land area of Sariakandi, Bogra and Hat Chandra, Jamalpur during the period from March to June 2009. Five varieties of sesame viz. BARI Til-2, BARI Til-3, T-6, Atshira and Local were tested at Bogra and BARI till -2 BARI till -3, Atshira, SES-70-7 and JP- 83-3 were tested at Jamalpur. The experiment was laid out in RCB design with three replications. The unit plot size was 5 m × 4 m with an inter plot distance of 0.75 m and inter block distance of 1.0 m. Seeds were sown on March 13 and 14 2009 at Bogra and Jamalpur, respectively. Spacing of row to row and seed to seed was 30 cm and 10 cm, respectively. Soil was fertilized with urea, triple super phosphate, muriate of potash, gypsum and zinc sulphate respectively, at the rate of 126, 150, 50, 111 and 5 kg/ha. Plant protection measures and all other intercultural operations were done as and when necessary. Sesame was harvested on 03 to 07 June, 2009. After harvest the plants were collected and kept separately with proper tagging. Sun drying was done and the seeds were separated from the pods. Data on different plant characters such as plant height, number of branches per plant, number of pods per plant were recorded carefully from the 10 randomly selected plants from each plot. The yield per plot was recorded and converted into yield per hectare. Data were analyzed statistically and the treatment means were separated by Duncan’s Multiple Range Test (DMRT) according to Gomez and Gomez (1984).

Charland Eco-System
16
Results and Discussion
Charland of Bogra
The yield and other characters of sesame which were tested at charland of Bogra are presented in Table 1. Significant variation was found among the varieties for plant height, number of pods/plant, grain yield and straw yield. All though insignificant maximum number of population per unit area was observed in Aatshira (29.67) and minimum number of population per unit area was found in Local (27.67). Significantly the highest plant height was recorded in Aatshira (94.00 cm) followed by BARI Til-3 (90.00 cm). Local variety gave the lowest plant height (80.66 cm) followed by T-6 (82.33 cm). The number of branches/plant varied insignificantly among the varieties. Significantly maximum number of pods/plant was obtained from Aatshira (52.40) which was identical with BARI Til-2 (51.13) and BARI Til-3 (50.43). Local variety gave the minimum number pods/plant (41.43) which was identical with T-6 (44.33). The number of seeds/pod and individual seed weight were insignificant among the varieties. The highest grain yield was obtained from Aatshira (1.22 t/ha) which was identical with BARI Til-2 (1.21 t/ha), BARI Til-3 (1.19 t/ha) and T-6 (1.08 t/ha). Local variety gave significantly the lowest yield (0.90 t/ha). Straw yield followed the same trend as grain yield.
Table 1. Performance of different varieties of sesame at char land areas of Sariakandi, Bogra during 2008-09 Treatments Plant
populn/m2
(no.)
Plant height (cm)
Branches/ plant (no.)
Pods/ plant (no.)
Seeds/ pod (no.)
1000 seed weight(g)
Grain yield (t/ha)
Straw yield (t/ha)
BARI Til-2 28.00 87.67 bc 4.13 51.13 a 42.66 2.41 1.21 a 1.81 a BARI Til-3 28.00 90.00 ab 4.43 50.43 a 41.36 2.40 1.19 a 1.79 a T-6 28.67 82.33 cd 4.10 44.33 b 40.33 3.39 1.08 a 1.63 a Aatshira 29.67 94.00 a 4.33 52.40 a 42.83 2.41 1.22 a 1.82 a Local 27.67 80.66 d 4.10 41.43 b 38.33 2.38 0.90 b 1.36 b CV (%) 4.79 3.66 3.51 6.30 4.68 0.64 6.27 6.26
Charland of Jamalpur
Yield and yield components of sesame varieties which were tested at chaarland of Jamalpur are presented in Table 2. The tallest plant was found in BARI Til-2 while the shortest plant was found in JP-83-3. Other three varieties had the moderate plant stature. BARI Til-2 also had the maximum number of pod plant-1 and the advanced line JP-83-3 had the minimum number of pod plant-1. Advanced line Atshira produced the maximum number of seed pod-1 having the minimum 1000-seed weight. Seed yield ranged from 694-838 kg ha-1. BARI Til-3 and SES-70-7 gave the maximum seed yield and the advanced line JP-83-3 gave the minimum. Days to maturity ranged from 78 to 86 days. BARI Til-2 took minimum days to maturity while Atshira and BARI Til-3 took the maximum.
Table 2. Yield and yield attributes of sesame varieties/lines in the charland of Jamalpur during Kharif-I 2009 Variety/line
(s) Plant density
/m2 (no.) Plant
height (cm) Pods plant-1
(no.) Seeds pod-1
(no.) 1000-seed
weight Seed yield (kg ha-1)
Days to maturity
Atshira 10.2 103.2 31.8 48.3 1.3 765 86 BARI Til-3 9.4 100.0 29.4 35.6 1.7 833 86 SES-70-7 11.3 100.0 27.2 42.0 1.6 838 81 JP-83-3 10.2 87.6 26.2 38.6 1.4 694 80 BARI Til-2 9.2 119.4 33.6 35.6 1.5 736 78

Charland Eco-System
17
Farmer’s reaction 01. Farmers are interested to grow BARI released variety of sesame. 02. Farmers of Sariakandi, Bogra preferred Aatshira variety because of larger pot size and bold seeded. 03. Farmers of Hat Chandra, Jamalpur preferred varieties BARI Till-2 and SES – 70-7 because of their earliness and higher yield.
Conclusion
It revealed from the study that BARI released variety of sesame performed better then the Local variety. Aatshira followed by BARI Til-2 and BARI Til-3 may be suitable for cultivation in the Charland area.
References Handbook of Agricultural Statistics. 2007. Ministry of Agriculture. Government of the Peoples Republic of
Bangladesh (http//www.moa.gov.bd/statistics/ statistics.htm).
Gomez, K.A and Gomez, A.A. 1984. Statistical procedures for Agricultural Research, Int. Rice Res. Inst. John Willy and Sons, New York, Chickester, Brisbane, Torento, Singapore, p. 643.

Charland Eco-System
18
FERTILIZER MANAGEMENT OF BARI Sarisha-11 IN CHARLAND
M.A.K. Mian, M.R. Islam and M.N. Islam
Abstract ORC recommendation and AEZ-11 based recommendation of fertilizer for BARI Sarisha-11 produced higher seed yield (1183-1280 kg/ha) at charland but AEZ-11 based recommendation is more preferable in respect of economic point of view (gross margin of Tk. 35763.00/ha and BCR of 2.53).
Introduction
Mustard is one of the major oil seed crops that occupy 78% of the area and contribute nearly 62% of the total oilseed production in Bangladesh (BBS, 2007). Although yield potential of BARI Sarisa 11 is higher than other varieties, its long growth duration (105-110 days) is the major constrain to fit it in boro based cropping pattern. Farmers generally grow Mungbean /sesame/ groundnut in charland areas in middle of March. So they can easily grow and harvest BARI Sarisal-11 before thosecrop. In our previous study BARI Sarisa 11 performed better in charland without hampering next crop. Now, it is essential to find out optimum/economic dose of fertilizer for better yield of BARI Sarisa 11 in charland areas. Therefore, the experiment was conducted to find out the economic fertilizer dose for BARI Sarisa 11.
Materials and Methods
The selected area of charland was Koikunda, Lokhikunda union of Ishurdi, Pabna. It is the developed charland of the river of Padma. The experiment was set at the selected farmer’s filed of Abul Kalam Azad. The experiment was laid out in a RCB design with three replications. The treatments were viz. N1=115-33-43-27-2-2 kg/ha of N-P-K-S-Zn-B (ORC recommendation), N2=84-18-33-10-1-1 kg/ha of N-P-K-S-Zn-B (AEZ-11 based recommendation), N3=66-25-20-6-1-0.7 kg/ha of N-P-K-S-Zn-B (Soil test based for MYG), N4=20-5-10-0-0-0 kg/ha of N-P-K-S-Zn-B (Farmers’ practice) and N5=control. Unit plot size was 8.0 m × 4.8 m. BARI Sarisha-11 was sown on 9 November 2009 and harvested on 19 February 2010. Fertilizers were applied as basal as per speciation of the treatments. Crops were grown in residual soil moisture and no irrigation is applied (rainfed condition). Yield contributing characters and yields of the crop were collected and analyzed. Means were separated through LSD at 0.05 level of probability.
Results and Discussion
All the studied characters varied significantly among the nutrient levels (Table 1). Plant population was similar among the treatments except N5. Minimum population in N5 (control) at harvesting time was occurred possibly due to stress of nutrients. Plant height and branches/plant were the highest in N1 and N2 while produced the lowest in N5. Siliqua/plant, length of siliqua and 1000-seed weight were the highest in N1 followed by N2 but the lowest in N5. Seeds/siliqua (10.20-10.22) and seed yield (1183-1280 kg/ha) were found the highest in N1 and N2 followed by N3 while the lowest in N5. The higher seed yield in higher nutrient level was attributed by the higher yield contributing characters. Economic performance of mustard under variable nutrient level has been given in Table 2. The highest gross return was calculated in N1 (Tk.64000.00/ha) followed by N2 (Tk.59150.00/ha) with the lowest in N5. The gross margin (Tk.35763.00/ha) and

Charland Eco-System
19
BCR (2.52) was the highest in N2 but the lowest in N5. The N1 failed to exhibit higher gross margin and BCR although the highest gross return was observed in N1. This was happened due to higher cost involvement for high fertilizer dose in N1.
Table 1.Yield contributing characters of BARI Sarisha-11 under different nutrient levels at charland Nutrient level Population/m2
(no.) Plant height
(cm) Branches/plant
(no.) Siliqua/plant
(no.) N1 53 125 3.40 137 N2 55 112 3.20 99 N3 50 73 2.40 46 N4 42 70 2.00 28 N5 31 46 1.10 12
LSD(0.05) 13 19 0.20 20 CV (%) 15.47 12.09 4.39 16.67
Table 2.Yield contributing characters and yield of BARI Sarisha-11 under different nutrient levels at charland Nutrient
level Length of Siliqua
(cm) Seeds/ Siliqua
(no.) 1000- seed weight (g)
Seed yield (kg/ha)
N1 5.11 10.22 3.52 1280 N2 4.17 10.20 2.08 1183 N3 3.72 7.83 1.92 1047 N4 2.97 5.65 1.65 651 N5 2.01 4.53 1.44 432
LSD(0.05) 0.92 2.51 0.59 141 CV (%) 13.52 17.31 14.89 8.11
N1=115-33-43-27-2-2 kg/ha of N-P-K-S-Zn-B, N2=84-18-33-10-1-1 kg/ha of N-P-K-S-Zn-B, N3=66-25-20-6-1-0.7 kg/ha of N-P-K-S-Zn-B, N4=20-5-10-0-0-0 kg/ha of N-P-K-S-Zn-B, N5=Control
Conclusion BARI Sarisha-11 required high nutrient level at charland under rainfed condition. Yield performance is similar under ORC recommendation of nutrient and AEZ-11 based recommendation but AEZ-11 based recommendation is more preferable in respect of economic point of view.
Table 2. Economic performance of mustard under variable nutrient level at charland Nutrient level Total variable cost (Tk./ha) Gross return (Tk./ha) Gross margin (Tk./ha) BCR
N1 28499.00 64000.00 35501.00 2.25 N2 23387.00 59150.00 35763.00 2.53 N3 22710.00 52350.00 29640.00 2.30 N4 17196.00 32550.00 15354.00 1.89 N5 14250.00 21600.00 7350.00 1.51
N1=115-33-43-27-2-2 kg/ha of N-P-K-S-Zn-B, N2=84-18-33-10-1-1 kg/ha of N-P-K-S-Zn-B N3=66-25-20-6-1-0.7 kg/ha of N-P-K-S-Zn-B, N4=20-5-10-0-0-0 kg/ha of N-P-K-S-Zn-B, N5=Control
Market price Land preparation: Tk.3000.00/ha Urea: Tk.12.00/kg Mustard seed: Tk. 60.00/kg TSP: Tk.25.00/kg Mustard non seed: Tk. 50.00/kg MP: Tk.27.00/kg Houma hours:Tk.150.00/day Gypsum: Tk.6.00/kg ZnSO4 : Tk.180.00/kg Boric acid: Tk.140.00/kg

Charland Eco-System
20
ESTABLISHMENT OF MINI FRUIT ORCHARD IN HOMESTEADS IN CHAR LAND AREA
M. Abdul Aziz, J.H. Prodhan and A. Akhter
Abstract The experiment was established at Sariakindi Charland, Bogra during 2009 to observe the performance of different fruit trees in homestead of charland farmersand to increase income and employment opportunity of the poor and marginal farmers. Fifteen fruit species namely mango, jujube, guava, lemon, hog plum, indian olive, jamun, litchi, bullocks heart, jack fruit, wax jumbu, sapota, pomegranate, carambola and pummelo were included in the study. Eighty farmers were selected in the study area with the help of Gram Bikash Sangstha (GBS), Sariakindi, Bogra. Each farmer was received 15 fruits species. The highest survival percentage was found in jujube (92%) and lowest was observed in litchi (20%). The growth status of mango, jujube, guava, leman, litchi, bullocks heart, jack fruit, wax jambu were very good and the growth of indian olive, jaman, sapota, pomegranate, carambola were good.
Introduction
The importance of fruit is beyond explanation. Fruits are called the protective foods, rich in vitamins and minerals and are essential for maintenance of human health. The minimum recommended dietary allowance of fruits per capita per day is 85g. But the present availability is only 35g. Evidently; the present production of fruits in our country is far below than the requirements. Nevertheless, the production and consumption status of fruits in the char land area of the country is remarkably low. But there remains a scope to increase the production of fruits through establishing fruit orchard of high yielding varieties as well as taking proper management practices of trees in the charland areas. An effort of fruit tree plantation in homesteads can also play an important role in this regard. Therefore, an attempt has been made to grow some high yielding quality fruits in the farmer’s homesteads in the charland area to investigate the growth, yield and quality of fruit and to increase income and employment opportunity of the poor and marginal farmers..
Materials and Methods
The program was carried out at Sariakindi Charland, Bogra during 2009 with the help of Gram Bikash Sangstha (GBS) Sariakindi, Bogra. A total of 15 fruit species were included in the study. The graftings/seedlings were collected from the reliable Shikha nursery. A total 80 farmers were included in the study. All of the fruit species were given to each farmer. The fruit seedlings were planted on July to August, 2009. Data in respect to plant height, spreading and growth status was recorded.
Results and Discussion
The over all performance of all the fruit species has been presented in Table 1. All the species of fruits were found good to very good except pummelo. The highest survival percentage was found in jujube (92%) and it was followed by mango (90%). The lowest survival percentage was in litchi (20%). The growth status of mango, jujube, guava, lemon, litchi, bullocks heart, jackfruit and wax jambu were very good and the growth status of indian olive, jamun, sapota, pomegranate and carambola were good. No bearing was observed in any fruit of the trees in the

Charland Eco-System
21
current year. All the trees were at vegetative stage.
Table 1. Survival percentage, plant height, spreading and growth status of different fruit species of trees at Sariakandi Charland, Bogra
Sl. No
Name of fruit Survival Percentage Plant height (cm) Spreading (m-N ×S)
Growth status
1 Mango 90 65 70 very good 2 Jujube (Apple cool) 92 62 40 very good 3 Guava 80 115 55 very good 4 Lemon 60 70 40 very good 5 Hog plum 50 60 40 very good 6 Indian olive 45 60 15 good 7 Jaman 50 175 75 good 8 Litchi 20 105 70 very good 9 Bullock’s heart 50 125 50 very good
10 Jack fruit 70 135 25 very good 11 Wax jambu 50 50 25 very good 12 Sapota 55 75 30 good 13 Pomegranate (Dalim) 45 60 25 good 14 Carambola 50 65 20 good 15 Pummelo 50 35 20 medium
Conclusion
The plant growth of all fruits species was medium to very good. However, final conclusion will be made after thorough evaluation of yield and yield contributing characteristics of the fruit plants of 5-6 years.

Charland Eco-System
22
VALIDATION AND DISSEMINATION OF INTERCROPPING TECHNOLOGIES AT FARM LEVELS IN THE CHAR LAND AREA
M. Abdul Aziz, J.H. Prodhan and A. Akhter
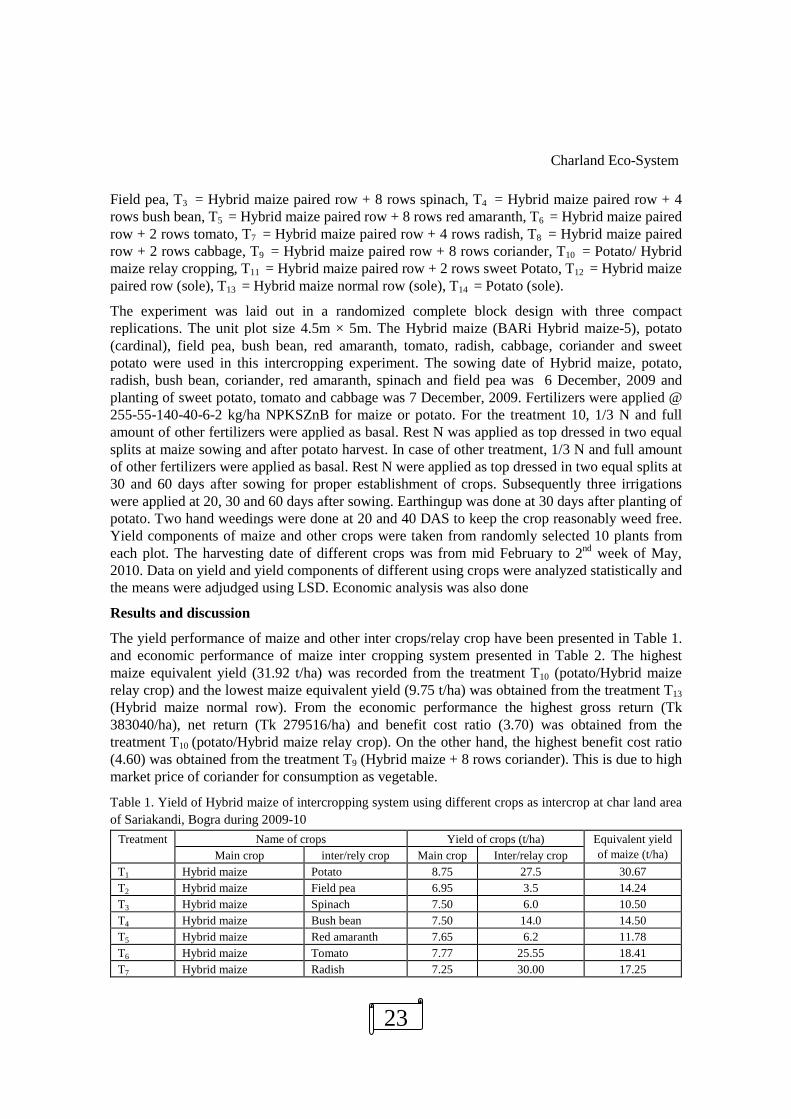
Abstract A field experiment on maize based intercropping system using different crops was carried out at Tangrakora charland, Sariakandi, Bogra during 2009-10 to familiarize and disseminate the intercropping technologies and to improve the knowledge of the stakeholder about the technologies in the charland areas. Fourteen treatments were evaluated in the study. The highest maize equivalent yield (31.92 t/ha) was recorded from the treatment T10 (Potato/Hybrid maize relay crop) and the lowest maize equivalent yield (9.75 t/ha) was obtained from the treatment T13 (Hybrid maize normal row). From the economic analysis, the highest gross return (Tk 3,83,040/ha) and net return (Tk 2,79,516/ha) was obtained from the treatment T10 (Potato/Hybrid maize relay crop). On the other hand, the highest benefit cost ratio (4.60) was obtained from the treatment T9 (Hybrid maize + 8 rows coriander)
Introduction
The area under char land is estimated to be about 0.83 m ha in Bangladesh. Char lands situated in the up-stream of the river system are non-saline and most of the chars in the down stream influenced by tidal flooding are saline. Non-saline char lands occur along the rivers and rivulets of Tista, Brahmaputra, Jamuna, Ganges, Dhaleshwari and other major rivers. The soil of char land is structure less with poor fertility. Farmers use mostly the local varieties of all crops including boro rice and grow them under low management conditions. Research in this environmental stress needs to be strengthened.
Intercropping is widely practiced in tropical and subtropical regions. It has many advantages (Wahus, 1985; Shivay et al., 1999; Santalla et al., 2001). It increases total productivity of unit area through maximum utilization of land, labor and growth resources (Quayyum et al., 1999; Craufard, 2000; Faruque et al., 2000). Usually plants differing in growth duration, plant height, rooting systems and nutrient requirements are considered to grow together in intercropping systems to minimize intercrop competition (Reddy and Willey, 1981; Marshal and Willey, 1983). Combined leaf canopy may make better spatial use of light, or combined root systems may make better spatial use of nutrients and water. Variation in rooting systems of the component crops can exploit different soil layer for nutrient. In cereal-legume intercropping, legume component is capable of fixing atmospheric nitrogen the can reduce the competition for N with the cereal component (Trenbath, 1986). However, farmers can choose cereal/legume or cereal/non-legume combination according to their demand. They can manipulate plant population and planting geometry to reduce the competition between component crops for growth resources. Hence, the present experiment was conducted to familiarize the recent developed profitable intercropping technologies and to disseminate these technologies in the charland areas.
Materials and Methods
The experiment was conducted at Tangrakora charland, Sariakandi, Bogra during 2009-10 with the help of Gram Bikash Sangshta (GBS). Fourteen treatment combinations were evaluated as follows:T1 = Hybrid maize paired row + 2 rows Potato, T2 = Hybrid maize paired row + 4 rows
Charland Eco-System
23
Field pea, T3 = Hybrid maize paired row + 8 rows spinach, T4 = Hybrid maize paired row + 4 rows bush bean, T5 = Hybrid maize paired row + 8 rows red amaranth, T6 = Hybrid maize paired row + 2 rows tomato, T7 = Hybrid maize paired row + 4 rows radish, T8 = Hybrid maize paired row + 2 rows cabbage, T9 = Hybrid maize paired row + 8 rows coriander, T10 = Potato/ Hybrid maize relay cropping, T11 = Hybrid maize paired row + 2 rows sweet Potato, T12 = Hybrid maize paired row (sole), T13 = Hybrid maize normal row (sole), T14 = Potato (sole).
The experiment was laid out in a randomized complete block design with three compact replications. The unit plot size 4.5m × 5m. The Hybrid maize (BARi Hybrid maize-5), potato (cardinal), field pea, bush bean, red amaranth, tomato, radish, cabbage, coriander and sweet potato were used in this intercropping experiment. The sowing date of Hybrid maize, potato, radish, bush bean, coriander, red amaranth, spinach and field pea was 6 December, 2009 and planting of sweet potato, tomato and cabbage was 7 December, 2009. Fertilizers were applied @ 255-55-140-40-6-2 kg/ha NPKSZnB for maize or potato. For the treatment 10, 1/3 N and full amount of other fertilizers were applied as basal. Rest N was applied as top dressed in two equal splits at maize sowing and after potato harvest. In case of other treatment, 1/3 N and full amount of other fertilizers were applied as basal. Rest N were applied as top dressed in two equal splits at 30 and 60 days after sowing for proper establishment of crops. Subsequently three irrigations were applied at 20, 30 and 60 days after sowing. Earthingup was done at 30 days after planting of potato. Two hand weedings were done at 20 and 40 DAS to keep the crop reasonably weed free. Yield components of maize and other crops were taken from randomly selected 10 plants from each plot. The harvesting date of different crops was from mid February to 2nd week of May, 2010. Data on yield and yield components of different using crops were analyzed statistically and the means were adjudged using LSD. Economic analysis was also done
Results and discussion
The yield performance of maize and other inter crops/relay crop have been presented in Table 1. and economic performance of maize inter cropping system presented in Table 2. The highest maize equivalent yield (31.92 t/ha) was recorded from the treatment T10 (potato/Hybrid maize relay crop) and the lowest maize equivalent yield (9.75 t/ha) was obtained from the treatment T13 (Hybrid maize normal row). From the economic performance the highest gross return (Tk 383040/ha), net return (Tk 279516/ha) and benefit cost ratio (3.70) was obtained from the treatment T10 (potato/Hybrid maize relay crop). On the other hand, the highest benefit cost ratio (4.60) was obtained from the treatment T9 (Hybrid maize + 8 rows coriander). This is due to high market price of coriander for consumption as vegetable.
Table 1. Yield of Hybrid maize of intercropping system using different crops as intercrop at char land area of Sariakandi, Bogra during 2009-10
Treatment Name of crops Yield of crops (t/ha) Equivalent yield of maize (t/ha) Main crop inter/rely crop Main crop Inter/relay crop
T1 Hybrid maize Potato 8.75 27.5 30.67 T2 Hybrid maize Field pea 6.95 3.5 14.24 T3 Hybrid maize Spinach 7.50 6.0 10.50 T4 Hybrid maize Bush bean 7.50 14.0 14.50 T5 Hybrid maize Red amaranth 7.65 6.2 11.78 T6 Hybrid maize Tomato 7.77 25.55 18.41 T7 Hybrid maize Radish 7.25 30.00 17.25

Charland Eco-System
24
Treatment Name of crops Yield of crops (t/ha) Equivalent yield of maize (t/ha) Main crop inter/rely crop Main crop Inter/relay crop
T8 Hybrid maize Cabbage 7.15 25.00 17.56 T9 Hybrid maize Coriander 7.35 2.50 14.64 T10 Potato Hybrid maize 28.40 8.25 31.92 T11 Hybrid maize Sweet potato 8.30 10.00 11.63 T12 Hybrid maize sole - 10.50 - 10.50 T13 Hybrid maize sole - 9.75 - 9.75 T14 Potato sole - 32.40 - 27.00
Table 2. Economic performance of maize intercropping system using different crop as intercrop at char land area of Sariakandi, Bogra during 2009-10
Treatment Maize equivalent yield (t/ha)
Gross return (Tk/ha)
Total cost of production (Tk/ha)
Net income (Tk/ha)
BCR
T1= Hybrid maize paired row + 2 rows Potato
30.67 368040 10000 268040 3.68
T2 = Hybrid maize paired row + 4 rows Field pea
14.24 170880 44384 126496 3.85
T3 = Hybrid maize paired row + 8 rows spinach
10.50 126000 30000 96000 4.20
T4 = Hybrid maize paired row + 4 rows bush bean
14.50 174000 435000 130500 4.00
T5 = Hybrid maize paired row + 8 rows red amaranth
11.78 141360 31413 109947 4.50
T6 = Hybrid maize paired row + 2 rows tomato
18.41 220920 61367 159553 3.60
T7 = Hybrid maize paired row + 4 rows radish
17.25 207000 52405 154595 3.95
T8 = Hybrid maize paired row + 2 rows cabbage
17.56 210720 52680 158040 4.00
T9 = Hybrid maize paired row + 8 rows coriander
14.64 175680 38191 137489 4.60
T10 = Potato/ Hybrid maize relay cropping
31.92 383040 103524 279516 3.70
T11 = Hybrid maize paired row + 2 rows sweet Potato
11.63 139560 38766 100794 3.60
T12 = Hybrid maize paired row (sole)
10.50 126000 47547 78453 2.65
T13 = Hybrid maize normal row (sole)
9.75 117000 45000 72000 2.60
T14 = Potato (sole) 27.00 324000 99692 224308 3.25
Note: Maize @ 12 Tk/kg; Potato @ 10 Tk/kg; Field pea @ 25 Tk/kg; Spinach @ 6 k/kg; Bush bean @ 6 Tk/kg; Red amaranth @ 8 Tk/kg; Tomato @ 5 Tk/kg; Radish @ 4, Tk/kg; Cabbage @ 5 Tk/kg; Coriander @ 35 Tk/kg; Sweet potato @ 4 Tk/kg
Conclusion
The results revealed that Hybrid maize paired row + 8 rows spinach, Hybrid maize paired row + 4 rows bush bean , Hybrid maize paired row + 8 rows red amaranth, Hybrid maize paired row + 2 rows cabbage and Hybrid maize paired row + 8 rows coriander would be economically profitable for charland areas.

Charland Eco-System
25
PERFORMANCE OF DIFFERENT KAON VARIETIES IN CHAR LAND AREA
M Biswas, AHM M Rahman and N Islam1
Abstract An experiment was conducted to evaluate the performance of BARI developed kaon varieties in a char land, Jamalpur, Bangladesh. The results revealed that BARI Kaon-1 (Titas) gave the highest seed yield (2.05 t ha-1) while local variety produced the lowest (1.38 t ha-1). The other two varieties produced statistically similar seed yield to that of BARI Kaon-1. BARI Kaon-1 also matured 3-4 days earlier than all other varieties. The highest gross margin (Tk 10745 ha-1) and BCR (1.35) were obtained from BARI Kaon-1.
Introduction
Chars are newly developed lands in different rivers beds and basins that comprise the area of approx. 1.82 million ha in Bangladesh (Khan et al., 2008). Flood, flooding depth and period mainly governed selection of crop and crop duration. In char land duration of flood, flooding depth etc are the determinants of crops. At present, some char lands are used for cultivation of cereals, pulses and oilseed crops. Among cereals kaon is one of the minor crops with high potentiality in char land areas because of its drought nature and can be cultivated in unfertile land even with any chemical fertilizers. It is called the cereal of poor in crisis moment. But farmers cultivate locally popular variety of kaon in broadcast method. The yield level of this variety is very low. If we can introduce BARI developed HYV’s then the production as well as yield will be increased. Hence the experiment was undertaken to evaluate yield performance of BARI released kaon varieties in char land areas.
Materials and Methods
The experiment was conducted at the char land, Jamalpur during the period from February to May 2010. The treatment in the experiment comprised four varieties of kaon viz. BARI kaon-1, BARI kaon-2, BARI kaon-3 and local. Design of the experiment was RCB having four replications. Unit plot size was 4m x 3m. Seeds were sown on 22 February 2010 @ 8 kg ha-1 through broadcast method. Fertilizer was applied @ 46-15-20 NPK through urea, TSP and MOP, respectively. All fertilizers were applied as basal during final land preparation. One hand weeding was done at 20 DAS and irrigation was applied once at 25 DAS. Data regarding yield attributes were collected from 10 randomly selected plants from each plot at maturity. Yield data was recorded after harvest of the crop on whole plot basis. Crops were harvested at different dates depending on their maturity. Data collected on yield and yield attributes were analysed with the help of a computer based program MSTAT-C and mean separation was done at 5% level of significance following LSD test.
Results and Discussion
The results presented in Table 1 indicated that plant height differed significantly among the kaon varieties. The local variety produced the tallest plant while BARI kaon-3 had the shortest plant. Other two varieties also produced significantly short plant stature than the local variety. The highest number of panicle m-2 was obtained from both the varieties BARI Kaon-1 and BARI Kaon-2 followed by BARI Kaon-3. The local variety produced the lowest number of panicle m-2. Number of grain panicle-

Charland Eco-System
26
1 did not differ significantly among the varieties but BARI Kaon-1 had the maximum. Thousand grain weight differed significantly among the varieties and the two varieties BARI Kaon-2 and BARI Kaon-3 produced the highest 1000-grain weight. Local variety produced the lowest 1000-grain weight which was at par with BARI Kaon-1. Grain yield also differed significantly among the varieties. Both the varieties BARI Kaon-1 and BARI Kaon-2 produced the highest grain yield. BARI Kaon-3 also produced statistically similar grain yield to both BARI Kaon-1 and BARI Kaon-2. Local variety produced the lowest grain yield. Higher grain yield in the high yielding varieties was mainly ascribed to higher number of panicle m-2, grain panicle-1 and 1000-grain weight.
Table 1. Yield and yield attributes of kaon varieties during February to May 2010
Variety Plant height (cm)
Length of panicle (cm)
Panicle m-2 (no.)
Grain panicle-1 (no.)
1000 grain weight (g)
Grain yield (kg ha-1)
Days to maturity
BARI Kaon-1 102.7b 14.8 93.6 2364 1.66 2.05 72.8 BARI Kaon-2 93.4c 13.2 93.9 2246 1.89 2.04 76.8 BARI Kaon-3 64.5d 15.1 88.7 2021 1.90 1.82 77.0 Local 113.6a 14.5 79.5 2136 1.61 1.38 75.8 CV(%) 4.86 11.45 6.25 8.65 4.05 7.82 - LSD0.05 7.27 - 8.891 - 0.113 0.226 - LS ** NS * NS ** ** -
Note: LS = Level of significance
Table 2. Partial budget analysis on the performance of kaon varieties in the char land areas during February to May 2010
Varieties Grain yield (t ha-1) Cost of cultivation (Tk ha-1)
Gross return (Tk ha-1)
Gross margin (Tk ha-1) BCR
BARI Kaon-1 2.05 30,255 41000 10745 1.35 BARI Kaon-2 2.04 30,255 40800 10545 1.34 BARI Kaon-3 1.82 30.,255 36400 6145 1.20 Local 1.38 30,255 27600 (-)2655 -
Selling price: Kaon- Tk 20/- kg-1
Economic performance
Cost of cultivation was Tk 30,255 ha-1 for all varieties while maximum gross return Tk 41,000 ha-1 was obtained from BARI Kaon-1 followed BARI Kaon-2 (Tk 40,800 ha-1) (Table 2). Minimum gross return Tk 27,600 ha-1 was obtained from local varieties. Similar trend was found in terms of gross margin. Hence, cultivation of local varieties following well management practices was non-profitable. The highest BCR was recorded in both the varieties BARI Kaon-1 and BARI Kaon-2.
Farmer’s reaction
Farmers’ preferred high yielding varieties of BARI Kaon-1 and BARI Kaon-2 because of their high yield potential and short stature. Besides they opined that seeds of high yielding varieties have high selling price in the market due to it’s attractive colour. Seeds of local cultivars are black and it has fewer prices in the market. Farmers demanded seeds of these two varieties for cultivation in the next year.
Conclusion
It might be conclude3d that BARI Kaon-1 and BARI Kaon-2 would be suitable for cultivation in the charland areas.

Charland Eco-System
27
PERFORMANCE OF SOYBEAN VARIETIES IN THE CHAR LAND AREA
M Biswas, A. H. M. M. Rhaman and S. Begum
Abstract A trial was conducted at the char land, Jamalpur, Bangladesh during the period from January to May 2009 and December 2009 to April 2010 to evaluate the performance of Soybean varieties. Soybean varieties like Bangladesh Soybean-4, BARI Soybean-5 and Shohag was included in the trial. It was found that seed yield ranged from 1365 kg to 1576 kg ha-1 in the first year while 1536 kg to 1748 kg ha-1 in the second year. Variety Shohag produced the maximum seed yield (1576 kg ha-1) follwed by BARI Soybean-5 (1502 kg ha-1 in the first year and BARI Soybean-5 (1748 kg ha-
1) followed by Shohag (1682 kg ha-1) in the second year. Variety Bangladesh Soybean-4 gave the minimum seed yields (1365 & 1536 kg ha-1, 2008-09 & 2009-10, respectively) during both years.
Introduction
The area of char land is estimated to be 1.82 m ha in Bangladesh (MPO, 1986). Farmers of char area grow Soybean after receding flood water. Soybean (Glycine max L.) is one of the important oil crops in the world and new prospective crop of Bangladesh. Soybean seeds contain 42-45% edible oil (Mondol et al., 2002). Farmers get low yield from Soybean cultivation as they use low yield potential variety. If we can introduce BARI developed HYV, the farmers as well as the country will be benefited. Therefore, the experiment was conducted to select suitable HYV Soybean for char land area.
Materials and Methods
The trial was conducted at the char land of Sadar Upazila, Jamalpur, Bangladesh during the period from January to May 2009 and December 2009 to March 2010 to evaluate the performance of Soybean varieties in the char land area. There were three varieties of Soybean viz. Bangladesh Soybean-4 (V1), BARI Soybean-5 (V2) and Shohag (V3) in the trial. Seeds were sown on 16 January 2009 and 17 December 2009 at a spacing 30cm × 10cm in non-replicated plot. Plot size was 9m × 7m for each variety in each year. Plots were fertilized with N28P35K60S20 kg ha-1
through urea, TSP, MP and gypsum, respectively. All fertilizers were applied during final land preparation as basal. The crop was grown under irrigated condition. Irrigation was applied at 30 and 60 days after sowing. Weeding was done as and when necessary. The crop was infested with hairy caterpillar at pod filling stage. ‘Vitashield/Darsban’ (Chloropyriphos) was applied to control the insect hairy caterpillar. Data on yield attributing characters were recorded from 10 randomly selected plants from the whole plot. Seed yield data was collected from the crop harvested from whole plot and plot yield data was converted to kg ha-1.
Results and Discussion
Crop variety Bangladesh Soybean-4 had the taller plant compared to the other two varieties BARI Soybean-5 and Shohag in the first year while BARI Soybean-5 had the taller plant in the second year (Table 1). Shohag produced maximum number of pod plant-1 in the first year while BARI Soybean-5 had the maximum in the second year. Bangladesh Soybean-4 produced minimum number of pod plant-1 during both years. Number of seed pod-1 was found maximum in the variety Bangladesh Soybean-4 in the first year and in BARI Soybean-5 in the second year. Variety Shohag had the minimum number of seed during both years. Seed size was smaller in

Charland Eco-System
28
Bangladesh Soybean-4. Variety Shohag produced the maximum seed yield in the first year and BARI Soybean-5 in the second year. Bangladesh Soybean-4 produced minimum seed yield during both years. Number of pod plant-1, seed pod-1 and 1000 seed weight were higher in the second year resulting higher seed yield compared to first year. All varieties took about 7-8 days more for maturity in the second year.
Table 1. Mean performances of yield and yield attributes of Soybean in the char land of Jamalpur during rabi 2008-2009 and 2009-2010
Variety Plant height (cm)
Pods plant-1 (no.)
Seed pod-1 (no.)
1000-seed weight (g)
Seed yield (kg ha-1)
Days to maturity
Y1 Y2 Y1 Y2 Y1 Y2 Y1 Y2 Y1 Y2 Y1 Y2 V1 63.1 58.0 28.6 30.8 2.6 2.6 47.5 82.9 1365 1536 113 120 V2 53.6 65.8 43.7 50.0 2.0 3.0 80.2 94.5 1502 1748 109 116 V3 54.8 58.8 45.7 41.8 1.4 2.4 83.8 93.7 1576 1682 113 121
Note: Y1 = 2008-2009, Y2 = 2009-2010; V1 = Bangladesh Soybean-4; V2 = BARI Soybean-5; V3 = Shohag
Farmer’s reaction
Usually the farmers of optimum region don’t grow Soybean. At this moment, they want better marketing system to ensure high selling price of the produce. Among the varieties the farmer’s showed their eager for cultivation of the variety BARI Soybean-5 because of its earliness and higher yield potential.
Conclusion
It might be concluded that BARI Soybean-5 would be suitable for cultivation in the charland areas.

Charland Eco-System
29
PERFORMANCE OF GROUNDNUT VARIETIES IN CHAR LAND AREAS
A.H.M. M. Rahman, M. Biswas and N. Islam
Abstract An Experiment was conducted to evaluate the performance of BARI developed high yielding varieties of groundnut at Hatchandra, sadar Upzila Jamalpur. The results revealed that the significantly highest pod yield (2.53 t ha-1) of groundnut was produced by the variety BARI Cheenabadam-7. BARI Cheenabadam-6 and BARI Cheenabadm-8 also produced statistically similar pod yields (2.31 & 2.48 t ha-1) to that of BARI Cheenabadm-7. The local variety Dhaka-1 produced the lowest pod yield (1.35 t ha-1).
Introduction
Groundnut (Arachis hypogaea) is an important oilseed crop. Farmers of different char land areas of Bangladesh grow groundnut after receding of flood water. They cultivate their local variety, as a result, they get lower yield. If we can replace their variety by BARI developed HYV, the farmers as well as the country will be benefited .Therefore, the experiment was conducted to select groundnut varieties suitable for Char land areas in Bangladesh.
Materials and Methods
The experiment was conducted at Hatchandra char, sadar Upzila Jamalpur rabi, 2009-2010.The treatment in the experiment comprised Five Varieties of groundnuts Viz. BARI Cheenabadam-6 , BARI Cheenabadam-7, BARI Cheenabadam-8 and Dhaka-1.Design of experiment was RCB having three replications. Unit of plot size was 3.6m × 4.5 m with 30 cm × 15 cm spacing. Seeds were sown on 03 December, 2008. Fertilizer was applied @ 60-50-100-40-3-1.5 N-P-K-S-Zn-B, through Urea, TSP, MP, Gypsum, Zinc sulphate and Boric acid, respectively (Based on FRG 2005). Half-N and full quantity of other fertilizers were applied as basal during final land preparation. Remaining fertilizers were top dressed at flowering stage after irrigation. Data regarding yield attributes were collected from 10 randomly selected plants from each plot at maturity. Yield data was recorded after harvest of crop on whole plot basis. Crops were harvested at different dates depending on the maturity. Data collected on yield and yield attributes were analyzed with the help of a computer based program MSTAT-C and mean separation was done at 5% level of significance by LSD test.
Results and Discussion
The result presented in Table 1 indicated that 100 seed weight differed significantly among the groundnut varieties. The variety BARI Cheenabadam-6 produced the highest 100-seed weight which was significantly different from the others. Dhaka-1 (Local) variety produced the lowest 100-weight. Second highest 100-seed weight was produced by the variety BARI Cheenabadam-8. Shelling percentage among different groundnut varieties also differed significantly and two varieties BARI Cheenabadam-7 and local had the highest shelling percentage. The lowest shelling percentage was obtained from the variety BARI Cheenabadam-6. All HYV’s produced statistically similar having the highest nut yields in BARI Cheenabadam-7. Local variety produced the lowest nut yield. Higher nut yield in the high yielding varieties was mainly ascribed to higher 100-seed

Charland Eco-System
30
weight, shelling percent and number of seed pod-1. Local variety took 158 days to mature which was very close to BARI Cheenabadam-8. Both the varieties BARI Cheenabadam-6 and BARI Cheenabadam-7 took 10-11 days more than the local variety for maturity.
Table 1. Yield and yield attributes of groundnut varieties during December 2009 to May 2010 Variety Plant
height (cm)
Branch plant-1
(no.)
Filled pod plant-1 (no.)
Unfilled pod plant-1 (no.)
100-seed weight (g)
Shelling (%)
Seed pod-1 (no.)
Nut yield (t ha-1)
Days to mature
V1 48.0 8.26 19.40 6.4 50.16 62.90 2.0 2.31 168 V2 45.06 8.53 14.87 5.9 39.60 71.43 2.03 2.53 169 V3 50.26 8.00 17.87 4.0 42.93 65.16 2.03 2.48 161 V4 45.46 6.26 21.13 4.4 33.10 74.76 1.76 1.35 158 CV(%) 5.94 10.66 15.38 24.17 3.27 2.68 5.65 5.57 - LSD0.05 - - - - 2.709 3.673 - 0.2447 - LS NS NS NS NS ** ** NS ** -
Note: LS = Level of significance; V1 = BARI Cheenabadam-6, V2 = BARI Cheenabadam-7, V3 = BARI Cheenabadam-8, V4 =Local.
Table 2. Partial budget analysis of the performances of groundnut varieties in the char land areas during December 2009 to May 2010
Variety Nut yield (t ha-1)
Cost of cultivation (Tk ha-1)
Gross return (Tk ha-1)
Gross margin (Tk ha-1)
BCR
V1 2.31 43,460 92400 48940 2.13 V2 2.53 43,460 101200 57740 2.33 V3 2.48 43,460 109120 65660 2.51 V4 1.35 43,460 59400 15940 1.37
Selling price of nut: BARI Cheenabadam-8 & local: 44 Tk kg-1; BARI Cheenabadam-6 and BARI Cheenabadam-7: 40 Tk kg-1.
Economic performance
Cost of cultivation was TK 43,460 ha-1 for all varieties while maximum gross return Tk 1,09,120 ha-1 was obtained from BARI Cheenabadam-8 followed by BARI Cheenabadam-7 (Tk 1,01,200 ha-1) (Table 2). Minimum gross return Tk 59,400 ha-1 was obtained from local variety. Similar trend was found in respect of gross margin. Hence, cultivation of local varieties following well management practices was less profitable. Maximum BCR (2.51) was recorded in BARI Cheenabadam-8 also followed by BARI Cheenabadam-7 (2.33). Minimum BCR was obtained from the local variety (1.37).
Conclusion
Farmers’ chose BARI Cheenabadam-8 because of higher selling price of it’s nut and short field duration. Hence, BARI Cheenabadam-8 may be selected for extensive cultivation in the char land areas of this region.

Charland Eco-System
31
PERFORMANCE OF LENTIL VARIETIES IN CHARLAND AREAS
M. N. Islam, M. Akhteruzzaman and S. Rahman
Abstract An experiment was conducted at the charland of Padma River under Daulatpur Upazilla of Kushtia district (AEZ-11) during rabi season of 2009-2010 to evaluate the yield performance of BARI developed lentil varieties viz. BARI Masur-3, BARI Masur-4, BARI Masur-5, BARI Masur-6 against local variety of lentil. All BARI developed lentil varieties were superior to local variety of lentil. Among these, BARI Masur-3 (1042 kg/ha) produced the highest yield followed by BARI Masur-6 (1000 kg/ha). The results revealed that BARI Masur-3 and BARI Masur-6 are suitable for charland of Padma River under Daulatpur Upazilla of Kushtia (AEZ-11) district for getting higher yield.
Introduction
Chars are newly developed lands in different river beds and basins that comprise the area of apporx. 0.82 million ha in 5 AEZs. In char land, duration of flood, flooding depth etc. are the determinants of crops. At present some char lands are used for cultivation of pulse, sweet potato, and oilseeds crops. Among pulses, lentil is the most important pulse crop. Generally farmers cultivate locally popular variety of lentil in broadcast method. The yield level of this variety is very low. If we can introduce BARI developed improved varieties of lentil then the production as well as yield per unit area will be increased. Hence, the experiment was undertaken to select suitable high yielding variety of lentil for char land area of Padma river under Dulatpur Upazilla of Kushtia.
Materials and Methods
The experiment was conducted at the charland of the Padma River under Daulatpur Upazilla of Kushtia district during rabi season of 2009-2010. The soil of the experimental field was silty loam in texture with pH 7.3 belonging to calcareous Dark Grey Foodplain soil (AEZ-11). The crop received total rainfall of 31 mm during growing period. The monthly mean maximum and minimum air temperature were 21.0 oC and 14.1 oC, respectively. Initial nutrients status of the soil of experimental field is presented in Table 1.
Table 1. Physical and chemical properties of soil of experimental field Location AEZ pH OM
(%) Total N
(%) Available P
(µg/ml) Exchange able K
(meg/100g) Available S (µg/ml)
Available B (µg/ml)
Kushtia charland
11 7.3 0.73 0.039 VL
5.66 VL
0.163 L
5.10 VL
0.289 L
Critical levels - - - 14 0.20 14 0.2
Four high yielding lentil varieties viz. BARI masur 3, BARI masur 4, BARI masur 5 and BARI masur 6 were tested against local variety. The experiment was laid out in randomized complete block design with five replications. The unit plot size was 4m x 5m. Seeds of lentil were sown in 30 cm apart solid line on 12 November, 2009. The crop was grown with fertilizer @ 20-36-25 kg/ha NPK. All the fertilizers were applied at the time of final land preparation. Intercultural operations were done when necessary. The crop was harvested at maturity stage on March 04, 2010 (112 DAS). Data on yield contributing characters were recorded from 10 randomly selected

Charland Eco-System
32
plants from each plot. Yield was calculated from whole plot. Collected data were analyzed statistically and the means were adjudged using LSD test at 5% level of significance.
Results and Discussion
Yield and yield components of different lentil varieties are presented in Table 2. Number of pods/plant, seeds/pod, 1000-seed weight and seed yield differed significantly in different lentil varieties. Number of pods/plant was more in all BARI developed lentil varieties over local variety. Higher number of pods/plant was recorded in BARI Masur-3 (105) followed by BARI Masur-6 (100) and BARI Masur-5 (97). Number of seeds/pod was the highest in BARI Masur-4, which was at par with BARI Masur-3 (1.8) and BARI Masur-5 (1.8). The heaviest seed (1000 seed weight) was found in BARI Masur-3 (24.8 g/1000 seed) which were identical with BARI Masur-6 (23.7 g/1000 seed). The lowest 1000-seed weight (19.2 g) was obtained from local variety. BARI developed lentil varieties under study were high yielder (32 – 46%) over local variety. Among these, BARI Masur-3 produced the highest seed yield (1042 kg/ha), which was statistically similar to BARI Masur-6 (1000 kg/ha).
Conclusion
The results revealed that BARI Masur-3 and BARI Masur-6 would be suitable for charland of Padma River under Daulatpur Upazilla of Kushtia (AEZ-11) district for getting higher yield.
Table 2. Yield and yield components of lentil varieties in charland area of Kushtia district during 2009-2010 Varieties Plants/m2
(no.) Pods/plant
(no.) Seeds/pod
(no.) 1000 seed wt.
(g) Seed yield
(kg/ha) BARI Masur-3 80 105 1.8 24.8 1042 BARI Masur-4 81 88 1.9 23.5 938 BARI Masur-5 86 97 1.8 22.9 944 BARI Masur-6 83 100 1.6 23.7 1000 Local 87 70 1.5 19.2 712 LSD (0.05) NS 12.8 0.1 1.1 42.9 CV (%) 13 9 5 3 11
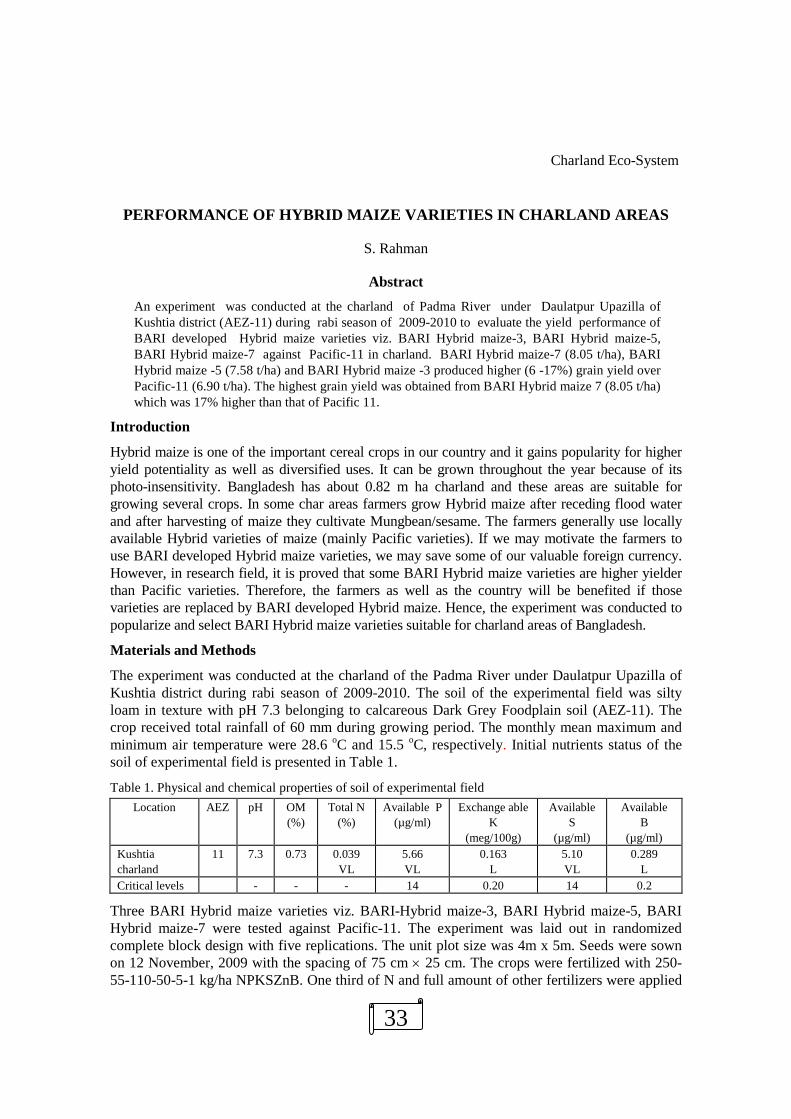
Charland Eco-System
33
PERFORMANCE OF HYBRID MAIZE VARIETIES IN CHARLAND AREAS
S. Rahman
Abstract An experiment was conducted at the charland of Padma River under Daulatpur Upazilla of Kushtia district (AEZ-11) during rabi season of 2009-2010 to evaluate the yield performance of BARI developed Hybrid maize varieties viz. BARI Hybrid maize-3, BARI Hybrid maize-5, BARI Hybrid maize-7 against Pacific-11 in charland. BARI Hybrid maize-7 (8.05 t/ha), BARI Hybrid maize -5 (7.58 t/ha) and BARI Hybrid maize -3 produced higher (6 -17%) grain yield over Pacific-11 (6.90 t/ha). The highest grain yield was obtained from BARI Hybrid maize 7 (8.05 t/ha) which was 17% higher than that of Pacific 11.
Introduction
Hybrid maize is one of the important cereal crops in our country and it gains popularity for higher yield potentiality as well as diversified uses. It can be grown throughout the year because of its photo-insensitivity. Bangladesh has about 0.82 m ha charland and these areas are suitable for growing several crops. In some char areas farmers grow Hybrid maize after receding flood water and after harvesting of maize they cultivate Mungbean/sesame. The farmers generally use locally available Hybrid varieties of maize (mainly Pacific varieties). If we may motivate the farmers to use BARI developed Hybrid maize varieties, we may save some of our valuable foreign currency. However, in research field, it is proved that some BARI Hybrid maize varieties are higher yielder than Pacific varieties. Therefore, the farmers as well as the country will be benefited if those varieties are replaced by BARI developed Hybrid maize. Hence, the experiment was conducted to popularize and select BARI Hybrid maize varieties suitable for charland areas of Bangladesh.
Materials and Methods
The experiment was conducted at the charland of the Padma River under Daulatpur Upazilla of Kushtia district during rabi season of 2009-2010. The soil of the experimental field was silty loam in texture with pH 7.3 belonging to calcareous Dark Grey Foodplain soil (AEZ-11). The crop received total rainfall of 60 mm during growing period. The monthly mean maximum and minimum air temperature were 28.6 oC and 15.5 oC, respectively. Initial nutrients status of the soil of experimental field is presented in Table 1.
Table 1. Physical and chemical properties of soil of experimental field Location AEZ pH OM
(%)
Total N (%)
Available P (µg/ml)
Exchange able K
(meg/100g)
Available S
(µg/ml)
Available B
(µg/ml) Kushtia charland
11 7.3 0.73 0.039 VL
5.66 VL
0.163 L
5.10 VL
0.289 L
Critical levels - - - 14 0.20 14 0.2
Three BARI Hybrid maize varieties viz. BARI-Hybrid maize-3, BARI Hybrid maize-5, BARI Hybrid maize-7 were tested against Pacific-11. The experiment was laid out in randomized complete block design with five replications. The unit plot size was 4m x 5m. Seeds were sown on 12 November, 2009 with the spacing of 75 cm × 25 cm. The crops were fertilized with 250-55-110-50-5-1 kg/ha NPKSZnB. One third of N and full amount of other fertilizers were applied

Charland Eco-System
34
at the time of final land preparation. Rest amount of N were applied in two equal splits at 30 and 60 DAS. Irrigations were given when necessary. Other intercultural operations were done when necessary. The crop was harvested at maturity stage on April 06 (145 DAS). Data on yield contributing characters were recorded from 10 randomly selected plants from each plot. Yield was calculated from whole plot. Collected data were analyzed statistically and the means were adjudged using LSD test at 5% level of significance.
Results and Discussion
Yield and yield components of different Hybrid maize varieties are presented in Table 2. Number of grains/cob and 1000–grain weight of BARI Hybrid maize varieties (grains/cob: 452-486, 1000–grain weight: 313.2-352.7g) were significantly more than those of Pacific-11 (grains/cob: 406, 1000–grain weight: 283.3g). Among BARI Hybrid maize varieties, number of grains/cob was the highest in BARI Hybrid maize-7 followed by BARI Hybrid maize-5 and BARI Hybrid maize-3. But 1000–grain weight was maximum in BARI Hybrid maize-5 followed by BARI Hybrid maize-3 and BARI Hybrid maize-7. All BARI Hybrid maize varieties also produced significantly higher grain yield (7.36 – 8.05 t/ha) over Pacific 11 (6.90 t/ha) which was attributed to the cumulative effect of number of grains /cob and 1000 grain weight. The highest grain yield was obtained from BARI Hybrid maize-7 (8.05 t/ha) which was 17% higher than that of Pacific 11.
Conclusion
The farmers of charland of Padma river under Daulatpur Upazilla of Kushtia (AEZ-11) district may be suggested to cultivate BARI Hybrid maize-7 for getting higher yield.
Table 2. Yield and yield components of Hybrid maize varieties in charland area of Kushtia district during 2009-2010
Treatments Cobs/m2 (no.) Grains/cob (no.) 1000 seed weight (g) Grain yield (t/ha)
BARI Hybrid maize-3 5.22 452 331.4 7.36 BARI Hybrid maize-5 5.20 477 352.7 7.58 BARI Hybrid maize-7 5.24 486 313.2 8.05 Pacific 11 5.23 406 283.3 6.90 LSD (0.05) NS 43.9 13.2 1.13 CV (%) 8 7 3 11

Charland Eco-System
35
FERTILIZER MANAGEMENT OF BARI Sarisha-11 IN CHARLAND AREAS (AEZ 11)
M. N. Islam, F. Ahmed, S. Rahman and M. A.K. Mian
Abstract The experiment was conducted at the charland of Padma River under Daulatpur Upazilla of Kushtia district (AEZ-11) during rabi season of 2009-2010 to find out economic fertilizer dose for BARI Sarisha-11. Four fertilizer doses viz., A:115-33-43-27-2-2 (ORC based); B:84-18-33-10-1-1 (AEZ based); C:66-25-20-10-1-.07 (Soil test based); D:20-5-10-0-0-0 kg/ha NPKSZnB (Farmers dose) and E: 0-0-0-0-0-0 (Control) were tested on BARI Sarisha-11. BARI Sarisha-11 produced the highest seed yield (1500 kg/ha) with ORC fertilizer dose followed by AEZ based fertilizer dose (1458 kg/ha) and soil test based fertilizer dose (1285 kg/ha). The higher gross return were obtained from ORC based fertilizer dose (Tk 37500/ha), AEZ based dose (Tk 36450/ha) and soil test based dose (Tk 32125/ha). But the highest gross margin was found from AEZ based fertilizer dose (Tk 20700/ha). The results revealed that AEZ based fertilizer dose may be economically suitable for BARI Sarisha-11 in charland of Padma River under Daulatpur Upazilla of Kushtia district (AEZ-11).
Introduction
Mustard is one of the major oilseed crops that occupy 78% of oilseed area and contribute nearly 62% of the total oilseed production in Bangladesh (BBS, 2007). Although yield potential of BARI Sarisha-11 is higher than other varieties, its long growth duration (105-110 days) is the major constrain to fit it in boro rice based cropping pattern. Farmers generally grow Mungbean/sesame/ groundnut in charland areas in middle of March. So, they can easily grow and harvest BARI Sarisha-11 before those crops. In our previous study BARI Sarisha-11 performed better in charland without hampering next crop. Now it is essential to find out optimum/ economic dose of fertilizer for better yield of Sarisha-11 in charland areas. Therefore, the experiment was conducted to find out economic fertilizer dose for BARI Sarisha-11.
Materials and Methods
The experiment was conducted at the charland of the Padma River under Daulatpur Upazila of Kushtia district during rabi season of 2009-10. The soil of the experimental field was silty loam in texture with pH 7.3 belonging to Calcareous Dark Grey Floodplain soil type (AEZ-11). The crop received total rainfall of 31 mm during growing period. The monthly mean maximum and minimum air temperature were 21.0 oC and 14.1 oC, respectively. Initial nutrients status of the soil of experimental field is presented in Table 1.
Table 1. Physical and chemical properties of soil of experimental field Location AEZ pH OM
(%)
Total N (%)
Available P
(µg/ml)
Exchange able K
(meg/100g)
Available S
(µg/ml)
Available B
(µg/ml) Kushtia charland 11 7.3 0.73 0.039 VL 5.66
VL 0.163
L 5.10 VL
0.289 L
Critical levels - - - 14 0.20 14 0.2

Charland Eco-System
36
Four fertilizer doses viz., A:115-33-43-27-2-2 (ORC based); B:84-18-33-10-1-1 (AEZ based); C:66-25-20-10-1-.07 (Soil test based); D:20-5-10-0-0-0 kg/ha NPKSZnB (Farmers dose) and E: 0-0-0-0-0-0 (Control) were tested on BARI Sarisha-11. The experiment was laid out in a RCB design with 4 replications. The unit plot size was 4m × 5m. Fertilizers were applied as per treatments. One half of nitrogen and full quantity of PKSZnB were applied as basal in the form of urea, triple super phosphate, muriate of potash, gypsum, zinc sulphate and boric acid, respectively. Seeds of BARI Sarisha-11 were sown in 30 cm apart solid line on November 12, 2009. Remaining half of nitrogen was top dressed at flower initiation stage (25 days after seeding). Three irrigations were given at 12 days after sowing (DAS), after top dressing and at 50 DAS. The crop was kept weed free up to 25 DAS by two hand weedings at 10 and 20 DAS. Plant population/m2 at harvest was taken from randomly selected 3 places. Other yield components like number of siliqua/plant, seeds/ pod and 1000-seeds weight were taken from randomly selected 10 plants from each plot. The crop was harvested on March 07, 2010 (113 DAS). Seed yields were taken from whole plot. Data on yield and yield components were analyzed statistically and the means were adjudged using LSD test at 5% level of significance.
Results and Discussion
Yield and yield components of BARI Sarisha-11 under different fertilizers management differed significantly (Table 2). Plant populations at harvest in fertilizer used plots were similar (65-76 plants/m2) but it differed from that in without fertilized plot (55 plants/m2). The minimum plant population in without fertilized plot might be attributed to the mortality of plants due to scarcity of nutrients. The highest number of siliqua/plant (190) and seeds/siliqua (13) were recorded from ORC based fertilizer dose which was followed by AEZ based and soil test based fertilizer dose. The minimum number of siliqua/plant (95) and seeds/siliqua (9) were obtained from without fertilizer used crop. Mustard grown without applying fertilizer produced weaker and stunted plant with less leaves which synthesized minimum carbohydrate for producing siliqua as well as seeds per plant.
Seed yield of BARI Sarisha-11 under different fertilizers management also differed significantly (Table 2). Seed yield of mustard is a function of plant population, siliqua/plant, seeds/siliqua and 1000-seeds weight. BARI Sarisha-11 produced the highest seed yield (1500 kg/ha) with ORC fertilizer dose which was identical with AEZ based fertilizer dose (1458 kg/ha) and soil test based fertilizer dose (1285 kg/ha). The highest seed yield of BARI Sarisha-11 in these treatments might be due to cumulative effect of siliqua/plant and 1000-seeds weight. BARI Sarisha-11 grown without fertilizer yielded the lowest (847 kg/ha) might be owing to the lowest yield components. Benefit cost analysis is shown in Table 3. The highest gross return (Tk 37500/ha) was obtained from ORC based fertilizer dose which was close to that from AEZ based dose (Tk 36450/ha) and soil test based dose (Tk 32125/ha). Gross returns were lower in other fertilizer doses. Cost of production increased mainly due to increase in fertilizer cost. The highest gross margin was found from AEZ based fertilizer dose (Tk 20700/ha). Although gross return was higher in ORC based fertilizer dose, yet gross margin was more in AEZ based fertilizer dose due to lower cost of production.
Conclusion
The results revealed that AEZ based fertilizer dose may be economically suitable for BARI Sarisha-11 in charland of Padma River under Daulatpur Upazilla of Kushtia district (AEZ-11).
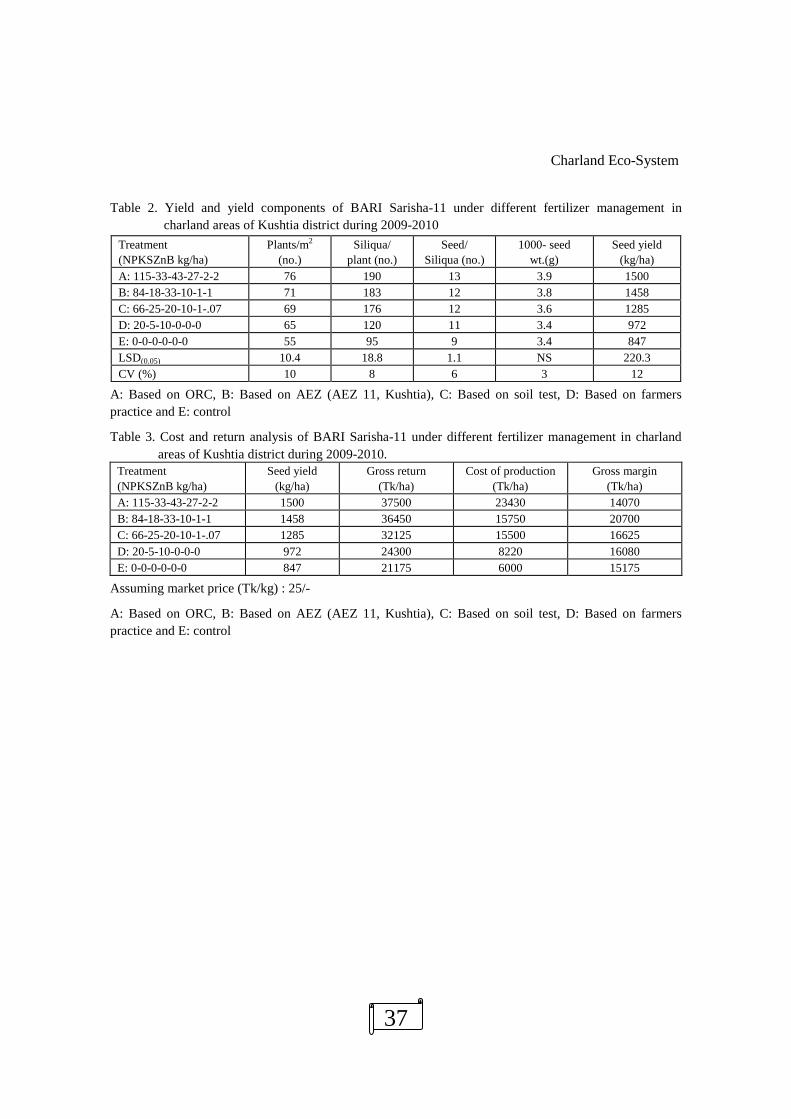
Charland Eco-System
37
Table 2. Yield and yield components of BARI Sarisha-11 under different fertilizer management in charland areas of Kushtia district during 2009-2010
Treatment (NPKSZnB kg/ha)
Plants/m2 (no.)
Siliqua/ plant (no.)
Seed/ Siliqua (no.)
1000- seed wt.(g)
Seed yield (kg/ha)
A: 115-33-43-27-2-2 76 190 13 3.9 1500 B: 84-18-33-10-1-1 71 183 12 3.8 1458 C: 66-25-20-10-1-.07 69 176 12 3.6 1285 D: 20-5-10-0-0-0 65 120 11 3.4 972 E: 0-0-0-0-0-0 55 95 9 3.4 847 LSD(0.05) 10.4 18.8 1.1 NS 220.3 CV (%) 10 8 6 3 12
A: Based on ORC, B: Based on AEZ (AEZ 11, Kushtia), C: Based on soil test, D: Based on farmers practice and E: control
Table 3. Cost and return analysis of BARI Sarisha-11 under different fertilizer management in charland areas of Kushtia district during 2009-2010.
Treatment (NPKSZnB kg/ha)
Seed yield (kg/ha)
Gross return (Tk/ha)
Cost of production (Tk/ha)
Gross margin (Tk/ha)
A: 115-33-43-27-2-2 1500 37500 23430 14070 B: 84-18-33-10-1-1 1458 36450 15750 20700 C: 66-25-20-10-1-.07 1285 32125 15500 16625 D: 20-5-10-0-0-0 972 24300 8220 16080 E: 0-0-0-0-0-0 847 21175 6000 15175
Assuming market price (Tk/kg) : 25/-
A: Based on ORC, B: Based on AEZ (AEZ 11, Kushtia), C: Based on soil test, D: Based on farmers practice and E: control

Charland Eco-System
38
FERTILIZER MANAGEMENT OF BARI Sarisha-11 IN CHARLAND AREA (AEZ-8)
M. N. Islam and M. Mohiuddin
Abstract An experiment was conducted at Bhuapur charland of Jamuna River in Tangail district (AEZ-8) during rabi season of 2009-10 to find out the economic fertilizer dose for BARI Sarisha-11. Five fertilizer doses viz., A: 115-33-43-27-2-2 (ORC based), B: 54-17-23-12-1-0.5 (based on AEZ-8), C: 91-20-44-14-2-0.5 (Soil test based), D 35-22-38-0-0-0 kg/ha NPKSZnB (Farmers’ dose) and E: 0-0-0-0-0-0 (control) were tested on BARI Sarisha-11. The highest seed yield (2.52 t/ha) was obtained with soil test based fertilizer (A: 115-33-43-27-2-2 kg/ha NPKSZnB). The results revealed that soil test based fertilizer dose may be suitable for higher yield of BARI Sarisha-11 in Bhuapur charland of Jamuna River in Tangail district (AEZ-8).
Introduction
Mustard is one of the major oilseed crops that occupy 78% of the oilseed area and contributes nearly 62% of the total oilseed production in Bangladesh (BBS, 2007). Although yield potential of BARI Sarisha-11 is higher than other varieties, its long growth duration (105-110) days is the major constraint to fit it in boro based cropping pattern. Farmers generally grow Mungbean/sesame/groundnut in charland areas in middle of March. So, they can easily grow and harvest BARI Sarisha-11 before those crops. Now, it is essential to find out optimum and economic fertilizer dose for better yield of BARI Sarisha-11 in charland areas. Therefore, the experiment was conducted to find out economic fertilizer dose of BARI Sarisha-11 for AEZ-8.
Materials and Methods
The trial was conducted at Bhuapur char of Jamuna River in Tangail district (AEZ-8) during rabi season of 2009-10. Five fertilizer doses viz., A: 115-33-43-27-2-2 (ORC based), B: 54-17-23-12-1-0.5 (based on AEZ-8), C: 91-20-44-14-2-0.5 (Soil test based), D 35-22-38-0-0-0 kg/ha NPKSZnB (Farmers’ dose) and E: 0-0-0-0-0-0 (control) were tested on BARI Sarisha-11. The experiment was laid out in RCB design with three replications. Unit plot size was 6m× 5m. Fertilizers were applied as per treatments. One half of nitrogen and full quantity of PKSZnB were applied as basal in the form of urea, triple super phosphate, muriate of potash, gypsum, zinc sulphate and boric acid, respectively. Seeds were sown on November 09, 2009. Remaining half of nitrogen was top dressed at flower initiation stage (25 days after seeding) followed by irrigation. Irrigation and intercultural operations were recorded from randomly selected 10 plants in each plot. Yield was taken from whole plot. Data were analyzed statistically using CropStat Package.
Results and Discussion
Number of siliqua/plant, seed/siliqua, 1000- seed weight and yield of BARI Sarisha-11under different fertilizers management differe3d significantly (Table 1). The highest number of siliqua/plant (90) was obtained with soil test based fertilizer dose which was at par with ORC based fertilizer dose. The lowest number of siliqua/plant (53) was recorded from without fertilized plot (E). Similarly, the highest 1000 seed wt (3.6 g) was obtained with soil test based fertilizer dose which was followed by ORC based fertilizer dose (3.5 g). The highest seed yield (2.52 t/ha) was recorded from soil test based fertilizer dose (C: 91-20-44-14-2-0.5 kg/ha

Charland Eco-System
39
NPKSZnB) which was identical with ORC based fertilizer dose (2.33 t/ha). The lowest seed yield (1.20 t/ha) was obtained from without fertilized plot (E).
Table 1. Yield and yield components of BARI Sarisha-11 under different fertilizer management in charland of Bhuapur, Tangail (AEZ-8) during rabi 2009-2010.
Treatment (NPKSZnB kg/ha)
Plant/m2
(no.) Siliquae/plant
(no.) Seeds/ siliquae
(no.) 1000-seed wt.
(g) Seed yield
(t/ha) A:115-33-43-27-2-2 68 81 12 3.5 2.33 B: 54-17-23-12-1-0.5 67 65 11 3.1 1.35 C: 91-20-44-14-2-0.5 65 90 12 3.6 2.52 D: 35-22-38-0-0-0 67 74 11 3.3 1.63 E: 0-0-0-0-0-0 70 53 9 2.8 1.20 LSD (0.005) NS 10 1 0.2 0.37 CV (%) 4.8 7.3 5.3 2.5 10.9
A: Based on ORC, B: Based on AEZ-8 (Bhuapur char, Tangail), C: Based on soil test, D: Based on farmers practice and E: control
Farmer’s opinion
Farmers opined that BARI Sarisha-11 required higher fertilizer dose for higher yield achievement.
Conclusion
The results revealed that soil test based fertilizer dose may be suitable for higher yield of BARI Sarisha-11 in Bhuapur charland of Jamuna River under Tangail district (AEZ-8).
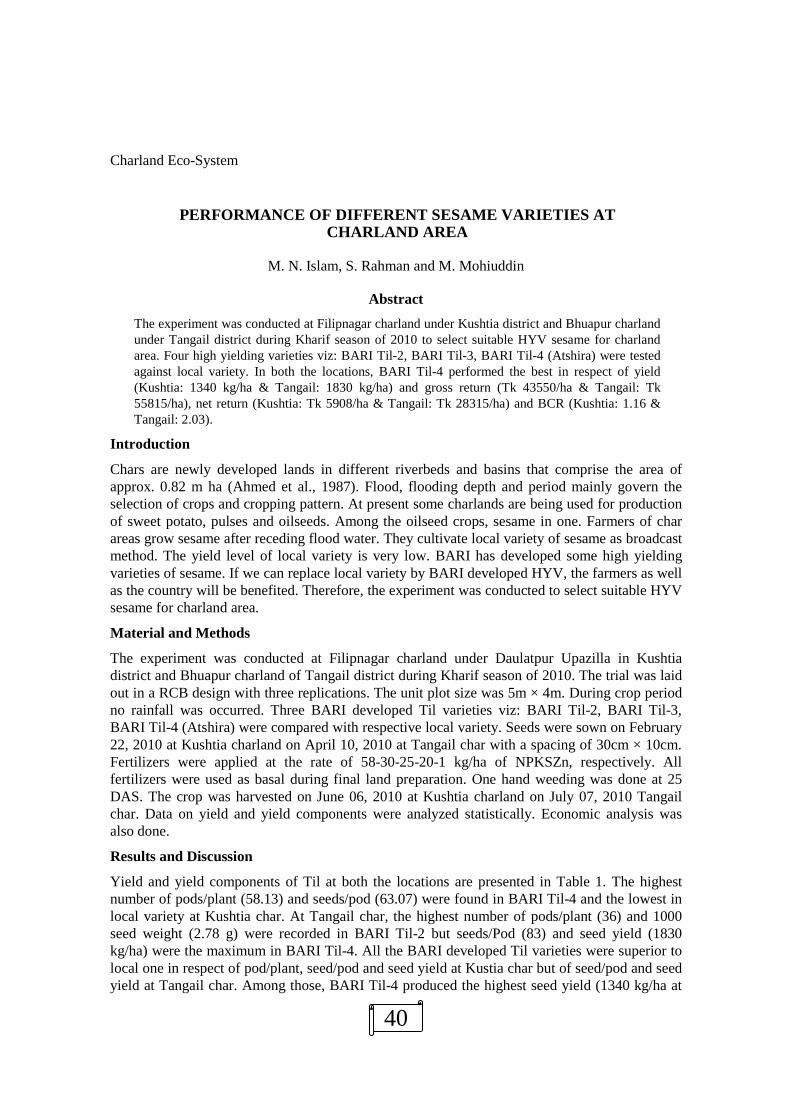
Charland Eco-System
40
PERFORMANCE OF DIFFERENT SESAME VARIETIES AT CHARLAND AREA
M. N. Islam, S. Rahman and M. Mohiuddin
Abstract The experiment was conducted at Filipnagar charland under Kushtia district and Bhuapur charland under Tangail district during Kharif season of 2010 to select suitable HYV sesame for charland area. Four high yielding varieties viz: BARI Til-2, BARI Til-3, BARI Til-4 (Atshira) were tested against local variety. In both the locations, BARI Til-4 performed the best in respect of yield (Kushtia: 1340 kg/ha & Tangail: 1830 kg/ha) and gross return (Tk 43550/ha & Tangail: Tk 55815/ha), net return (Kushtia: Tk 5908/ha & Tangail: Tk 28315/ha) and BCR (Kushtia: 1.16 & Tangail: 2.03).
Introduction
Chars are newly developed lands in different riverbeds and basins that comprise the area of approx. 0.82 m ha (Ahmed et al., 1987). Flood, flooding depth and period mainly govern the selection of crops and cropping pattern. At present some charlands are being used for production of sweet potato, pulses and oilseeds. Among the oilseed crops, sesame in one. Farmers of char areas grow sesame after receding flood water. They cultivate local variety of sesame as broadcast method. The yield level of local variety is very low. BARI has developed some high yielding varieties of sesame. If we can replace local variety by BARI developed HYV, the farmers as well as the country will be benefited. Therefore, the experiment was conducted to select suitable HYV sesame for charland area.
Material and Methods
The experiment was conducted at Filipnagar charland under Daulatpur Upazilla in Kushtia district and Bhuapur charland of Tangail district during Kharif season of 2010. The trial was laid out in a RCB design with three replications. The unit plot size was 5m × 4m. During crop period no rainfall was occurred. Three BARI developed Til varieties viz: BARI Til-2, BARI Til-3, BARI Til-4 (Atshira) were compared with respective local variety. Seeds were sown on February 22, 2010 at Kushtia charland on April 10, 2010 at Tangail char with a spacing of 30cm × 10cm. Fertilizers were applied at the rate of 58-30-25-20-1 kg/ha of NPKSZn, respectively. All fertilizers were used as basal during final land preparation. One hand weeding was done at 25 DAS. The crop was harvested on June 06, 2010 at Kushtia charland on July 07, 2010 Tangail char. Data on yield and yield components were analyzed statistically. Economic analysis was also done.
Results and Discussion
Yield and yield components of Til at both the locations are presented in Table 1. The highest number of pods/plant (58.13) and seeds/pod (63.07) were found in BARI Til-4 and the lowest in local variety at Kushtia char. At Tangail char, the highest number of pods/plant (36) and 1000 seed weight (2.78 g) were recorded in BARI Til-2 but seeds/Pod (83) and seed yield (1830 kg/ha) were the maximum in BARI Til-4. All the BARI developed Til varieties were superior to local one in respect of pod/plant, seed/pod and seed yield at Kustia char but of seed/pod and seed yield at Tangail char. Among those, BARI Til-4 produced the highest seed yield (1340 kg/ha at

Charland Eco-System
41
Kushtia and 1830 kg/ha Tangail char) Which was 21% and 35% higher than local variety, respectively. The maximum gross return (Tk 43550/ha at Kushtia and Tk 55815/ha at Tangail char), net return (Tk 5908/ha and Tk 28315/ha at Tangail char) and benefit cost ratio (1.16 and 2.03) were found to be highest in BARI Til 4 (Table 2).
Table 1.Yield and yield components of Til at Kushtia and Tangail char during kharif season of 2010.
Kushtia char Treatment
Plant population/m2
(no.)
Pod/plant (no.)
Seed/ pod (no.)
1000-seed wt. (g)
Seed yield (kg/ha)
Yield increased over local (%)
BARI Til-2 43.60 54.53 46.33 2.73 1180 7 BARI Til-3 45.00 56.47 47.47 2.73 1253 13 BARI Til-4 44.80 58.13 63.07 2.63 1340 21 Local 46.20 47.93 45.13 2.67 1107 - LSD (0.005) 3.02 3.87 1.85 0.13 261 CV (%) 3.37 3.57 1.83 2.40 10.7
Tangail char BARI Til-2 38 36 55 2.78 1610 18 BARI Til-4 40 29 83 2.42 1830 35 Local 38 31 55 2.67 1360 - LSD (0.005) 4.40 4.66 9.09 0.15 CV (%) 5.5 6.5 6.3 2.5 9.8
Table 2. Benefit and cost analysis of different Til varieties at Kushtia and Tangail char during Kharif season of 2010
Kushtia Treatment Gross return (Tk/ha) Total cost of production (Tk/ha) Net return (Tk/ha) BCR BARI Til-2 38350 37643 708 1.02 BARI Til-3 40733 37643 3091 1.08 BARI Til-4 43550 37643 5908 1.16 Local 35967 37643 (-) 1676 0.96
Tangail BARI Til-2 49105 27500 21605 1.79 BARI Til-4 55815 27500 28315 2.03 Local 41480 27500 13980 1.51
Farmers’ reaction
Farmers reacted positively to see the higher yield of BARI Til-4.
Conclusion
BARI Til varieties were superior to local one at Kushtia and Tangail char. It might be concluded that BARI Til-4 would be suitable for cultivation in the charland areas.

Charland Eco-System
42
PERFORMANCE OF GROUNDNUT VARIETIES AT CHARLAND AREA
M. N. Islam, S. Rahman and M. Biswas
Abstract The experiment was conducted at Filipnagar charland under Daulatpur Upazilla in Kushtia district and Hatchandra charland under sadar upazilla in Jamalpur district during Kharif season of 2010 to select suitable HYV groundnut for charland areas. Four BARI developed groundnut varieties viz: BARI Cheenabadam-5, BARI Cheenabadam-6, BARI Cheenabadam-7, BARI Cheenabadam-8 were compared with local variety (Dhaka 1). All BARI developed Cheenabadam varieties performed better than local variety. Among those, BARI Cheenabadam-6 (2580 kg/ha) in Kushtia char and BARI Cheenabadam-7 (2530 kg/ha) in Jamalpur char produced the highest yield. The highest gross return (Kushtia: Tk 96750/ha and Jamalpur: Tk 101200/ha), net return (Kushtia: Tk 37710/ha and Jamalpur: Tk 57740/ha) and BCR (Kshtia: 1.64 and Jamalpur: 2.33) were obtained from BARI Cheenabadam 6 and BARI Cheenabadam 7, respectively.
Introduction
Groundnut (Arachis hypogaea) is an important oilseed crops. Farmers of different charland of Bangladesh grow groundnut after receding of flood water. They cultivate their local variety, as a result, they get lower yield. BARI has developed some high yielding varieties of groundnut. So, if the local variety can be replaced by BARI developed HYV, The farmers and the country will be benefited. Therefore the experiment was conducted to select suitable HYV groundnut for charland areas of Bangladesh.
Materials and Methods
The experiment was conducted at Filipnagar charland area under Daulatpur Upazilla in Kushtia district and Hatchandra charland under sadar upazilla in Jamalpur district during kharif season of 2010. The trial was laid out in a RCB design with three replications. The unit plot size was 3.6 m × 4.5 m. Four BARI developed groundnut varieties viz: BARI Cheenabadam-5, BARI Cheenabadam-6, BARI Cheenabadam-7, BARI Cheenabadam-8 were compared with Dhaka 1. Seeds were sown on 03 February, 2010 (Kushtia) and on 03 December, 2009 (Jamalpur) with a spacing of 30 cm × 15 cm. Fertilizers were applied at the rate of 60-50-100-40-3-1.5 kg/ha of NPKSZnB, respectively. Half of N and full quantity of other fertilizers were applied as basal at final land preparation. Remaining N were top dressed at flowering stage and covered with soil followed by irrigation. One weeding was done at 60 DAS followed by irrigation (Kushtia). Crops were sprayed two times by Baviston to protect root rot disease. The crop was harvested on 7 July, 2010 (Kushtia). Data on yield and yield components were analyzed statistically. Economic analysis was also done.
Results and Discussion
Kushtia char
Yield and yield components of groundnut varieties differed significantly (Table 1). The highest number of pods/plant was recorded in BARI Cheenabadam-5 (30.87) but seeds/pod in Cheenabadam-6 (1.93). The highest 100-seed weight was found in BARI Cheenabadam-7 (73.50 g) and the lowest in BARI Cheenabadam-5 (42.50 g). The maximum pod yield was observed in
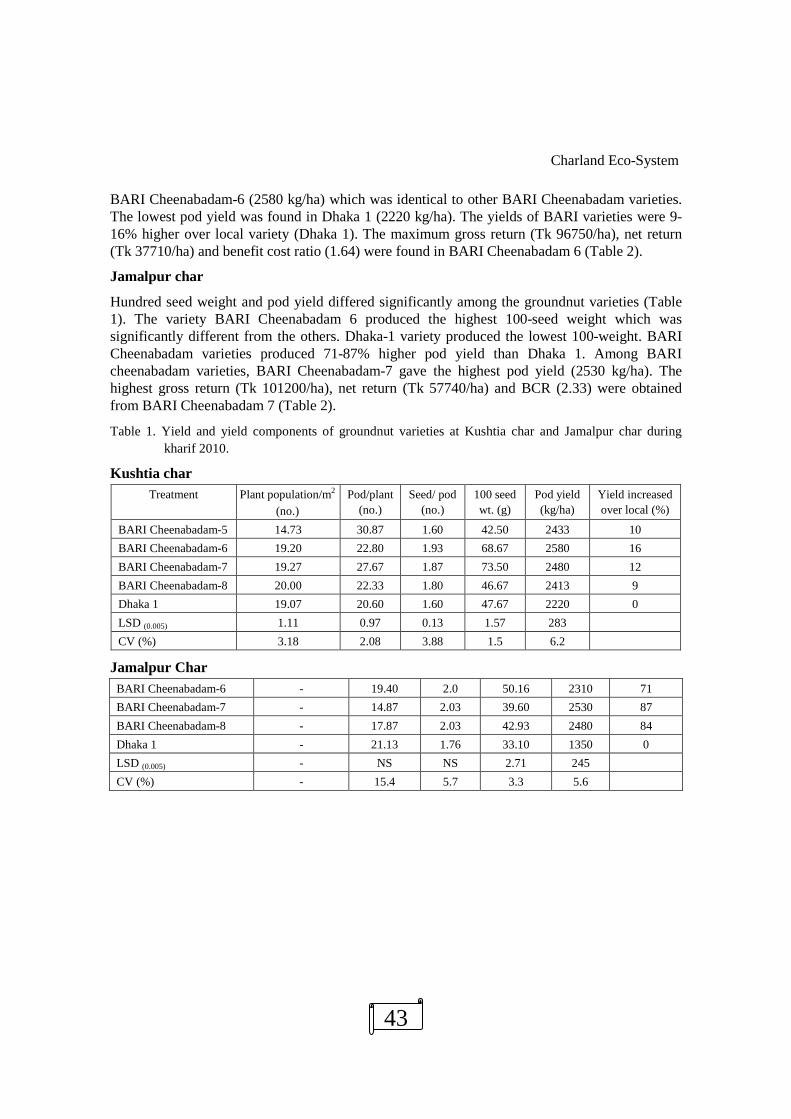
Charland Eco-System
43
BARI Cheenabadam-6 (2580 kg/ha) which was identical to other BARI Cheenabadam varieties. The lowest pod yield was found in Dhaka 1 (2220 kg/ha). The yields of BARI varieties were 9-16% higher over local variety (Dhaka 1). The maximum gross return (Tk 96750/ha), net return (Tk 37710/ha) and benefit cost ratio (1.64) were found in BARI Cheenabadam 6 (Table 2).
Jamalpur char
Hundred seed weight and pod yield differed significantly among the groundnut varieties (Table 1). The variety BARI Cheenabadam 6 produced the highest 100-seed weight which was significantly different from the others. Dhaka-1 variety produced the lowest 100-weight. BARI Cheenabadam varieties produced 71-87% higher pod yield than Dhaka 1. Among BARI cheenabadam varieties, BARI Cheenabadam-7 gave the highest pod yield (2530 kg/ha). The highest gross return (Tk 101200/ha), net return (Tk 57740/ha) and BCR (2.33) were obtained from BARI Cheenabadam 7 (Table 2).
Table 1. Yield and yield components of groundnut varieties at Kushtia char and Jamalpur char during kharif 2010.
Kushtia char Treatment
Plant population/m2
(no.) Pod/plant
(no.) Seed/ pod
(no.) 100 seed wt. (g)
Pod yield (kg/ha)
Yield increased over local (%)
BARI Cheenabadam-5 14.73 30.87 1.60 42.50 2433 10 BARI Cheenabadam-6 19.20 22.80 1.93 68.67 2580 16 BARI Cheenabadam-7 19.27 27.67 1.87 73.50 2480 12 BARI Cheenabadam-8 20.00 22.33 1.80 46.67 2413 9 Dhaka 1 19.07 20.60 1.60 47.67 2220 0 LSD (0.005) 1.11 0.97 0.13 1.57 283 CV (%) 3.18 2.08 3.88 1.5 6.2
Jamalpur Char BARI Cheenabadam-6 - 19.40 2.0 50.16 2310 71 BARI Cheenabadam-7 - 14.87 2.03 39.60 2530 87 BARI Cheenabadam-8 - 17.87 2.03 42.93 2480 84 Dhaka 1 - 21.13 1.76 33.10 1350 0 LSD (0.005) - NS NS 2.71 245 CV (%) - 15.4 5.7 3.3 5.6
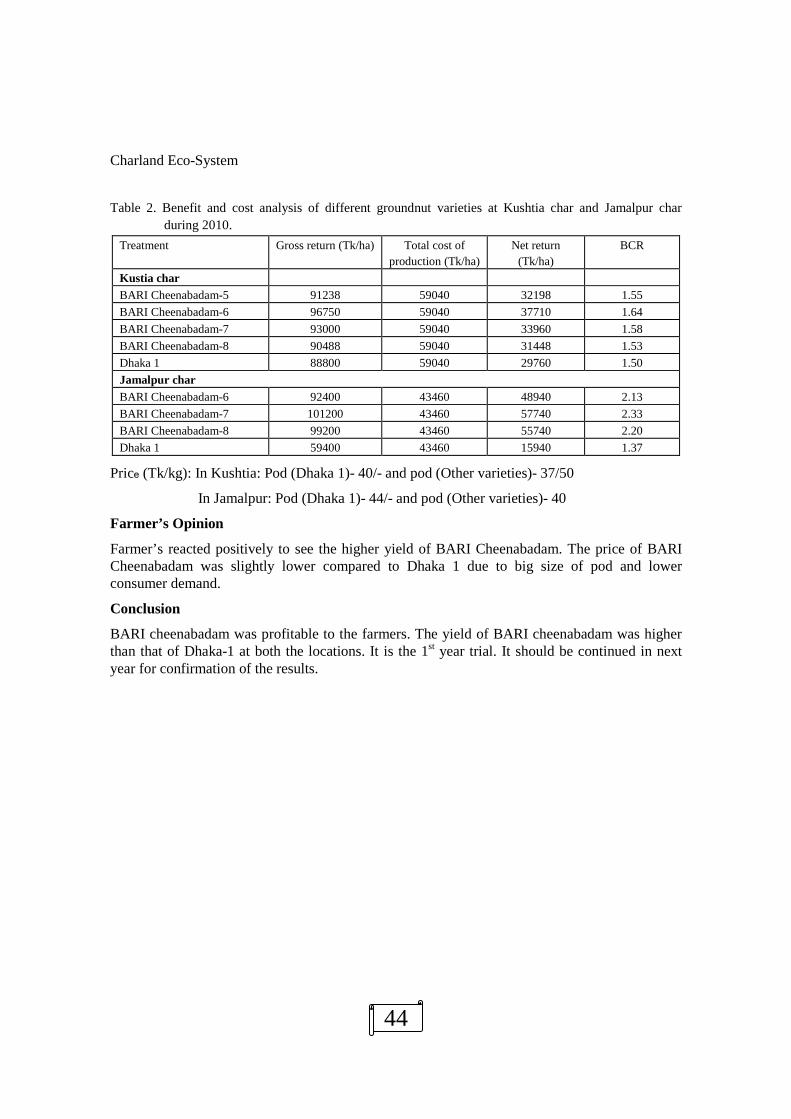
Charland Eco-System
44
Table 2. Benefit and cost analysis of different groundnut varieties at Kushtia char and Jamalpur char during 2010.
Treatment
Gross return (Tk/ha) Total cost of production (Tk/ha)
Net return (Tk/ha)
BCR
Kustia char BARI Cheenabadam-5 91238 59040 32198 1.55 BARI Cheenabadam-6 96750 59040 37710 1.64 BARI Cheenabadam-7 93000 59040 33960 1.58 BARI Cheenabadam-8 90488 59040 31448 1.53 Dhaka 1 88800 59040 29760 1.50 Jamalpur char BARI Cheenabadam-6 92400 43460 48940 2.13 BARI Cheenabadam-7 101200 43460 57740 2.33 BARI Cheenabadam-8 99200 43460 55740 2.20 Dhaka 1 59400 43460 15940 1.37
Price (Tk/kg): In Kushtia: Pod (Dhaka 1)- 40/- and pod (Other varieties)- 37/50
In Jamalpur: Pod (Dhaka 1)- 44/- and pod (Other varieties)- 40
Farmer’s Opinion
Farmer’s reacted positively to see the higher yield of BARI Cheenabadam. The price of BARI Cheenabadam was slightly lower compared to Dhaka 1 due to big size of pod and lower consumer demand.
Conclusion
BARI cheenabadam was profitable to the farmers. The yield of BARI cheenabadam was higher than that of Dhaka-1 at both the locations. It is the 1st year trial. It should be continued in next year for confirmation of the results.

Charland Eco-System
45
PERFORMANCE OF DIFFERENT SESAME VARIETIES AT CHARLAND AREA
M.N. Islam, M.S. Rahman and M. A. Hossain
Abstract The experiment was conducted at Filipnagar charland area under Daulatpur Upazilla in Kushtia district during Kharif-I season of 2011 to select suitable HYV sesame variety for charland area. Three BARI developed sesame varieties viz., BARI Til- 2, BARI Til- 3, BARI Til- 4 (Atshira) were compared with local variety. Varieties showed significant variations on the yield contributing characters and yield except seeds/pod. BARI Til- 4 showed the highest yield (1650 kg/ha) and gross return (Tk 67666/ha), net return (Tk 24391/ha) and BCR (1.48) among the varieties.
Introduction
Char are newly developed lands in different riverbeds and basins that comprise the area of approx. 0.83 million hectare. Flood, flooding depth and period of flooding mainly govern the selection of crops and crop duration. At present some charlands are being used for production of sweet potato, pulses and oilseeds. Among the oilseed crops, sesame is one of them. Farmers of char areas grow sesame after receding of flood water. They cultivate local variety of sesame as broadcast method. The yield level of local variety is very low. BARI has developed some high yielding varieties of sesame. If we can replace farmers local variety by BARI developed HYV, the farmers as well as the country will be benefited. Therefore, the experiment was conducted to select suitable HYV sesame variety for charland area.
Materials and Methods
The experiment was conducted at Filipnagar charland area under Daulatpur Upazilla in Kushtia district during Kharif-I season of 2011. The trial was laid out in a RCB design with three replications. Three HYV sesame viz., BARI Til- 2, BARI Til- 3, and BARI Til- 4 (Atshira) were tested against local variety. The experiment was laid out in a RCB design with 3 replications. The unit plot size was 5m x 4m. Seeds were sown on February 14, 2011. Fertilizers were applied at the rate of 58-30-25-20-1.8 kg/ha of NPKSZn, respectively. All fertilizers were used as basal at the time of final land preparation. One weeding was done on March 07, 2011. The crop was harvested during 15-22 May, 2011. Data on yield and yield components were analyzed statistically and the means were adjudged by LSD test. Benefit cost analysis was also done.
Results and Discussion
Yield and yield components of sesame varieties are presented in Table 1. Among the varieties, BARI Til-3 was the earliest in maturity taking 91 days. BARI Til-2, BARI Til-4 and local took 96-98 days. Maximum plants/m2 was recorded in local variety and the minimum from BARI Til-2. The highest pods/plant (43.93) was found in BARI Til- 4 and the lowest in BARI Til- 2 (32.4). The highest seeds/pod (52.86) was found in BARI Til- 3 and the lowest in local sesame (51.26). The highest seed yield was recorded from BARI Til- 4 (1650 kg/ha) followed by BARI Til- 3 (1560 kg/ha) and local variety get the lowest (1390 kg/ha). The higher seed yield/ha was recorded in BARI Til-4 might be due to higher pods/plant. The maximum gross return (Tk 67666

Charland Eco-System
46
/ha), net return (Tk 24391 /ha) and benefit cost ratio (1.56) were found in BARI Til- 4 (Table 2). Similar trend was found in 2010.
Table 1. Yield and yield components of different sesame varieties Treatment Plant
population /m2
Pod / plant (No.)
Seed /pod (No.)
1000 Seed
wt. (g)
Days to maturity
Seed yield (kg/ha) 2011
Stover yield (t/ha)
Seed yield (kg/ha) 2010
BARI Til- 2 66.53 32.4 50.46 2.86 96 1400 2.00 1180 BARI Til- 3 66.93 32.93 52.86 2.76 91 1560 2.23 1253 BARI Til- 4 68.46 43.93 50.06 2.73 98 1650 2.27 1340 Local sesame 71.93 34.2 51.26 2.76 98 1390 2.00 1107 LSD (0.05) 4.67 2.25 ns 0.06 0.019 51.15 137.3 18.84 CV (%) 3.42 3.14 2.97 1.04 0.00 1.71 3.23 0.77
Table 2. Cost and return analysis of different sesame varieties Treatment Gross return (Tk/ha) Total cost
(Tk/ha) Net return (Tk/ha) BCR
BARI Til 2 57500 43275 14225 1.32 BARI Til 3 64075 43275 20800 1.48 BARI Til 4 67666 43275 24391 1.56 Local sesame 57008 43275 13733 1.31
Market price (Tk/kg): sesame: 37.50
Farmers’ opinion
Farmers reacted positively to see the higher yield of BARI developed sesame varieties. They wished to cultivate BARI Til- 4 at charland.
Conclusion
BARI Til-4 performed better and might be the suitable sesame variety in charland of Kushtia district.

Charland Eco-System
47
FERTILIZER MANAGEMENT OF HYV MUSTARD IN CHARLAND AREAS
M. N. Islam, M. S. Rahman, M.A.K. Mian, M.R. Islam, M. Mohiuddin and M.A. Hossain
Abstract The experiment was conducted at the charland of Bheramara, Kushtia, Koikunda, Lokhikunda, Ishurdi, Pabna and Bhuapur, Tangail during rabi 2010-11 to find out the economic fertilizer dose for BARI Sharisha-11 under farmers’ field condition. Fertilizer doses were: T1= ORC based; T2= based on AEZ-11, Kushtia, and Ishurdi; AEZ 8, Tangail, T3= Soil test based, Kushtia, Ishurdi and Tangail, T4= Farmers practice and T5= Native fertilizer were tested on BARI Sarisha-11. Yield and yield attributes of mustard varied significantly due to variation of fertilizer levels. At Kushita, soil test based fertilizer dose gave the highest seed yield (2153 kg/ha) and the lowest (940 kg/ha) from control plot. ORC recommended fertilizer and AEZ 11 based fertilizer produced higher seed yield of mustard at Ishurdi charland. AEZ based fertilizer also showed higher gross return (Tk 85860/ha) and BCR (3.67). At Tangail, soil test based fertilizer gave the highest seed yield/ha, gross margin (Tk. 45180/ha) and BCR (2.37) followed by ORC recommendation.
Introduction
Mustard is one of the major oilseeds crops that occupies 78% of the area and contributes nearly 62% of the total oilseed production in Bangladesh (BBS, 2007). Although yield potential of BARI Sarisha- 11 is higher than other varieties, its long growth duration (105- 110 days) is the major constrain to fit in boro based cropping pattern. Farmers generally grow Mungbean/sesame/groundnut in charland areas in middle of March. So, they can easily grow and harvest BARI Sarisha--11 before those crops. In our previous study BARI Sarisha--11 performed better in charland without hampering next crop. Now it is essential to find out optimum and economic dose of fertilizer for better yield of BARI Sarisha--11 in charland areas. Therefore, the experiment was conducted to find out the economic fertilizer dose for BARI Sarisha--11.
Materials & Methods
The trial was conducted at farmers’ field in charland area at the MLT site, Bheramara, Kushtia, Koikunda, Lokhikunda, Ishurdi, Pabna and Bhuapur, Tangail during season of 2010-2011. Five fertilizer doses viz., T1= ORC based; T2= based on AEZ-11, Kushtia, and Ishurdi; AEZ 8, Tangail, T3= Soil test based, Kushtia, Ishurdi and Tangail, T4= Farmers practice and T5= Native fertilizer were tested on BARI Sarisha-11. The experiment was laid out in RCB design with three replications. Unit plot size was 5m × 4m. Half of N and full quantity of other fertilizers were applied as basal at the time of final land preparation. Seeds were sown on 08 November, at Kushtia, 25 November at Ishurdi and 10 November at Tangail in 2010. Weeding and thinning was done at 20 DAS and irrigation was given 22 DAS. The remaining N was top dressed at 24 DAS. The crop was harvested on 24 February, 2011 in all the locations. Data on different yield components and seed yield were analyzed statistically and the means were adjudged by LSD test.
Results and Discussion
Kshutia
Yield and yield components of BARI Sarisha-11 varied significantly due to fertilizer doses (Table 1). The highest plant height (159.93 cm) was obtained from T3 which was at par with T2.

Charland Eco-System
48
The lowest plant height (135 cm) was recorded from native fertility treatment. The highest number of siliqua plant-1 (181.73) was obtained from T3 which was at par with T1 (174.86) but the lowest from control plot. Number of seeds siliqua-1 and 1000-seed weight followed the trend of siliqua plant-1. The maximum seed yield (2553 kg/ha) was recorded from T3 whereas the lowest from control plot (T5). The highest seed yield in T3 was attributed to the cumulative effect of siliqua plant-1, seeds siliqua-1 and 1000-seed weight.
Table 1. Yield and yield components HYV mustard under different fertilizer doses in charland areas (Kushtia)
Treatment Days to maturity
Plant Popn/m2 (no.)
Plant height (cm)
Siliqua/ plant (no.)
Seeds/ siliqua (no)
1000 seed wt. (g)
Seed yield (kg/ha)
T1 107.6 64.93 150.86 174.86 10.40 3.70 1940 T2 105.6 65.53 152.66 162.20 10.33 3.66 1986 T3 107.6 61.66 159.93 181.73 10.86 3.83 2153 T4 106.3 63.33 148.20 155.28 9.98 3.65 1454 T5 104.0 64.73 135.00 70.13 9.73 3.30 940 LSD(0.05) 0.57 ns 8.55 27.62 0.56 0.08 0.08 CV(%) 10.27 13.61 8.86 9.39 5.86 3.30 12.58
T1= 115-33-43-27-2-2 (ORC based); T2= 84-18-33-10-.5-1 (AEZ-11 based); T3= 127-39-62-28-1.18-0.86 (Soil test based) kg/ha NPKSZnB; T4=70-15-38-20-0-0 (Farmers practice) and T5 =0-0-0-0-0-0 (Native fertility)
Ishurdi
All the studied characters varied significantly among the nutrient levels (Table 2). Plant population was similar among the treatments except N5 treatment. Minimum population in N5 treatment (control) at harvesting time was occurred possibly due to stress of nutrients. Plant height and branches/plant were the highest in N1 and N2 treatments while N5 treatment produced the lowest. Siliqua/plant, length of siliqua and 1000-seed weight were highest in N1 treatment followed by N2 treatment and but the lowest in N5 treatment. The highest number of seeds/siliqua (17.22) and seed yield (1582 kg/ha) were obtained from N1 treatment and N5 gave the lowest. The higher seed yield in higher nutrient level was attributed by the higher yield contributing characters. The highest gross return was obtained from N1 (Tk.94920/ha) followed by N2 treatment (Tk.85860/ha) and the lowest in N5 treatment (Table 3). The gross margin was also the highest in N1 treatment (Tk.66421/ha) followed by N2 (Tk. 62473/ha) treatment but the BCR was the highest in N2 (3.67) treatment followed by N1 (3.33) treatment. The N1 treatment failed to exhibit higher gross margin and BCR although the highest gross return was observed in N1 treatment. This was happened due to higher cost involvement for high fertilizer dose in N1 treatment.
Table 2. Yield contributing characters and yield of BARI Sarisha-11 under different nutrient levels at charland (Ishurdi)
Nutrient level
Population/m2 (no.)
Plant height (cm)
Branches/plant (no.)
Siliqua/plant (no.)
Length of siliqua (cm)
Seeds/ Siliqua (no.)
1000- seed
weight (g)
Seed yield
(kg/ha) N1 57 145 3.44 147 6.11 17.22 3.52 1582 N2 55 142 3.34 109 5.17 16.20 2.08 1431 N3 53 103 2.85 76 4.72 11.83 1.92 1055 N4 46 70 2.10 38 3.17 8.65 1.65 746

Charland Eco-System
49
Nutrient level
Population/m2 (no.)
Plant height (cm)
Branches/plant (no.)
Siliqua/plant (no.)
Length of siliqua (cm)
Seeds/ Siliqua (no.)
1000- seed
weight (g)
Seed yield
(kg/ha) N5 33 46 1.10 13 2.11 5.53 1.44 438 LSD(0.05) 14 21 0.22 21 0.97 2.55 0.62 149 CV (%) 17.17 13.15 4.48 15.68 12.92 16.39 13.88 8.22
N1=115-33-43-27-2-2 kg/ha of N-P-K-S-Zn-B (ORC recommendation), N2=84-18-33-10-1-1 kg/ha of N-P-K-S-Zn-B (AEZ 11 based recomendation ), N3=66-25-20-6-1-0.7 kg/ha of N-P-K-S-Zn-B (Soil test based for MYG), N4=20-5-10-0-0-0 kg/ha of N-P-K-S-Zn-B (Farmers practice), N5=Control
Table 3. Economic performance of mustard under variable nutrient level at charland (Ishurdi) Nutrient level Total variable cost
(Tk./ha) Gross return
(Tk./ha) Gross margin (Tk./ha) BCR
N1 28499 94920 66421 3.33 N2 23387 85860 62473 3.67 N3 22710 63300 40590 2.78 N4 17196 44640 27444 2.59 N5 14250 26280 12030 1.84
Tangail
All the characters of BARI Sarisha-11 varied significantly due to different fertilizer doses (Table 4). The plants flowered earlier (46 days) in T3 (Based on Soil test, MYG, Tangail) and later where fertilizers were not used (51 days). The crop matured earlier in control plot (102 days) and farmers’ practice plot (103 days) in comparison to other treatments. The highest plant height (145.8 cm) was obtained from T3: 119-38-86-16-2-0.87 kg/ha N-P-K-S-Zn-B (based on soil test, MYG for Tangail) which was at par with other three treatments except the control plot. The lowest plant height (108 cm) was recorded from control treatment (T5). The highest number of pods per plant was obtained from T1 (81) treatment which was at par with T3 (78) treatment. The lowest number of pods per plant (49) was recorded from T5 (control plot). The highest 1000- seed wt (3.48g) was obtained from T2 treatment, followed by T3 (3.44g) and T2 (3.43g). The highest seed yield (1965 kg/ha) was recorded from plants treated with T3: 119-38-86-16-2-0.87 kg/ha N-P-K-S-Zn-B (based on soil test, MYG for Tangail) which was at par with T1: 115-33-43-27-2-2 kg/ha N-P-K-S-Zn-B (based on ORC) (1775 kg/ha). The lowest yield (725 kg/ha) was obtained from T5: treatment (control). The highest gross return (Tk. 78088/ha), gross margin (Tk. 45180/ha) and BCR (2.37) were recorded in 119-38-86-16-2-0.87 kg/ha N-P-K-S-Zn-B (based on soil test, MYG for Tangail), while the lowest gross return (Tk. 29738/ha), gross margin (Tk. 8982/ha) and BCR (1.43) were found from the control plot (Table 5).
Table 4. Yield and yield components of BARI Sarisha-11 in char land of Bhuapur under different fertilizer management during 2010-11 (Tangail)
Treatment
Days to flower
Plant /m2
(no.)
Days to maturity
Plant height (cm)
Pods/plant (no.)
Seeds/pod (no.)
1000 seed
wt. (g)
Seed yield
(kg/ha)
Straw yield (t/ha)
T1 47 65 105 138.2 81 11 3.43 1775 4.25 T2 50 63 104 140.5 67 11 3.48 1480 3.95

Charland Eco-System
50
Treatment
Days to flower
Plant /m2
(no.)
Days to maturity
Plant height (cm)
Pods/plant (no.)
Seeds/pod (no.)
1000 seed
wt. (g)
Seed yield
(kg/ha)
Straw yield (t/ha)
T3 46 66 106 145.4 78 12 3.44 1965 4.40 T4 49 65 103 130.1 59 8 3.36 925 3.15 T5 51 68 102 108.0 49 7 3.21 725 2.55 LSD (0.05) 0.00 6.98 0.00 24.25 6.85 1.19 0.42 199.68 0.29 CV (%) 0.0 3.9 0.0 6.6 3.7 4.4 4.4 5.2 2.9
Fertilizer doses/rates: Treatments (Fertilizer dose in kg/ha) N P K S Zn B T1(Based on ORC) 115 33 43 27 2 2 T2 (Based on AEZ- 8, Tangail) 54 17 23 12 1 0.5 T3(Based on Soil test, MYG, Tangail) 119 38 86 16 2 0.87 T4(Farmer practice, Tangail) 52 15 28 0 0 0 T5 (No fertilizer, control) 0 0 0 0 0 0
Table 5. Cost and return analysis of BARI Sarisha-1 as influenced by different fertilizer management in char land of Bhuapur during 2010-11 (Tangail)
Treatment Seed yield (kg/ha)
Straw yield (kg/ha) Gross return (Tk/ha)
Variable cost (Tk/ha)
Gross Margin (Tk/ha)
BCR
T1 1775 4250 70813 32548 38265 2.18
T2 1480 3950 59450 26146 33304 2.27
T3 1965 4400 78088 32908 45180 2.37
T4 925 3150 37838 24599 13239 1.54
T5 725 2550 29738 20756 8982 1.43
Market price (Tk/kg): Grain = 37.5 and Straw = 1.0
Farmers’ opinion
Farmers opined that they would grow BARI Sarisha-11 along with recommended fertilizer for getting higher yield.
Conclusion
The results of three locations indicated that soil test based fertilizer dose gave the highest yield in Kustia, Pabna and Tangail charland areas and may be recommended for large scale production in the charland areas and other extrapolation areas.
Charland Eco-System
51
PERFORMANCE OF GROUNDNUT VARIETIES AT CHARLAND AREA
M.N Islam, M. S. Rahman M Biswas, A.H.M.M. Rahman Talukder and M. A. Hossain
Abstract The experiment was conducted at Filipnagar charland area under Daulatpur Upazilla in Kushtia district in kharif season of 2011 and Hatchandra char, Sadar Jamalpur during rabi season of 2010-11 to select suitable HYV groundnut varietiues for charland areas of Bangladesh. Three HYV groundnut varieties viz., BARI Cheenabadam-6, BARI Cheenabadam -7 and BARI Cheenabadam- 8 were tested against locally popular variety (Patnai) at Kushtia. Five groundnut varieties viz. BARI Cheenabadam-5, BARI Cheenabadam-6, BARI Cheenabadam -7, BARI Cheenabadam- 8 and Dhaka-1 were tested at Jamalpur. Marked variation in plants/m2, plant height, pods/plant, 100-seed weight and pod yield/ha was observed among the varieties. BARI Cheenabadam -7 gave highest pod yield (2907 kg/ha), gross return (Tk 123548/ha), net return (Tk 66848/ha) and BCR (2.18) followed by BARI Cheenabadam -8. The results revealed that BARI Cheenabadam-7 and BARI Cheenabadam-8 might be better in respect of pod yield for char land area of Kushtia district. At Jamalpur, yield and yield attributes of groundnut varied significantly due to variation of varieties. Varieties differed in maturity, which ranged between 156 and 170 days. BARI Cheenabadam-8 gave the highest nut yield (3.24 t/ha) and Dhaka-1 gave the lowest (1.70 t/ha). Maximum gross margin (Tk 103160/ha) and BCR (3.42) were also obtained from BARI Cheenabadam-8 variety. Shelling percent varied from 61.7 to 83.8, the lowest being recorded from BARI Cheenabadam-5.
Introduction
Groundnut (Arachis hypogaea) is an important oilseed crops. Farmers of different charland area of Bangladesh grow groundnut after receding of flood water. They cultivate their local variety, as a result, they get lower yield. BARI has developed a number of high yielding varieties of groundnut. But, it is not tested in farmers’ field. Therefore, the experiment was conducted to select suitable HYV groundnut for charland areas of Bangladesh.
Materials and Methods
The experiment was conducted at Filipnagar charland area under Daulatpur Upazilla in Kushtia district in Kharif I season of 2011 and Hatchandra char, Sadar Jamalpur during rabi season of 2010-11. The trial was laid out in a RCB design with three replications. The unit plot size was 3.6 m x 4.5 m. Three HYV groundnut varieties viz., BARI Cheenabadam-6, BARI Cheenabadam -7 and BARI Cheenabadam- 8 were tested against locally popular variety (Patnai) at Kushtia. Five groundnut varieties viz. BARI Cheenabadam-5, BARI Cheenabadam-6, BARI Cheenabadam -7, BARI Cheenabadam- 8 and Dhaka-1 were tested at Jamalpur. Seeds were sown on 15 February, 2011 at Kushtia and 19 November 2010 at Jamalpur with a spacing of 30cm Х10cm. Fertilizers were applied at the rate of 60-50-100-40-3-1.5 kg/ha of NPKSZnB, respectively. Half of N and full quantity of other fertilizers were applied as basal at final land preparation. Remaining N were top dressed at flowering stage. One weeding was done at 32 DAS. The crop was harvested at 129 DAS at Kushtia and 156-170 DAS at Jamalpur. Data on yield and yield components were analyzed statistically. Benefit cost analysis was also done.

Charland Eco-System
52
Results and Discussion Kushtia Yield and yield components of groundnut varieties are presented in Table 1. Days to maturity of BARI Cheenabadam varieties were longer (139 to 142 days) than locally popular variety (129 days). Tallest plant was recorded in BARI Cheenabadam- 7 (82.13 cm) while the shortest in locally popular variety (63.13 cm). Significantly the highest number of pod per plant was found in BARI Cheenabadam-6 (26.0) and the lowest in BARI Cheenabadam-7 (19.8 no.). Pod number in other varieties was intermediate. The number of seeds per pod in all varieties was identical and it varied from 1.16 to 1.66. Hundred seed weight was the highest in BARI Cheenabadam-7 (62.16 g) followed by BARI Cheenabadam- 6 (61.33 g) while the lowest was found in locally popular variety (Patnai) (38.0 g). The highest pod yield/ha was observed in BARI Cheenabadam-7 (2907 kg/ha) which was statistically similar with BARI Cheenabadam -8 (2889 kg/ha) and locally popular variety (2770 kg/ha). The lowest pod yield was found in BARI Cheenabadam- 6 (2100 kg/ha). The highest gross return (Tk 123548/ha), net return (Tk 66848/ha) and benefit cost ratio (2.18) were found from BARI Cheenabadam- 7 which was very close to BARI Cheenabadam-8 (Table 2). The lowest economic performance was observed in BARI Cheenabadam-6.
Table 1. Yield and yield components of groundnut varieties at charland area of Kushtia Treatments Plants
/m2 (no)
Days to maturity
Plant height (cm)
Pods/ plant (no.)
Seeds/ pod (no.)
100- seed wt
(g)
Pod yield (kg/ha)
BARI Cheenabadam- 6 29.80 139 69.46 26.00 1.16 61.33 2100
BARI Cheenabadam- 7 43.53 142 82.13 19.80 1.60 62.16 2907 BARI Cheenabadam- 8 43.26 140 68.26 20.06 1.66 50.5 2889 Locally popular (Patnai) 44.46 129 63.13 20.33 1.66 38.0 2770 LSD (0.05) 3.20 NS 0.05 2.84 NS 2.30 140
CV (%) 3.98 4.22 0.37 6.59 6.06 2.17 2.60
Table 2. Benefit and cost analysis of different groundnut varieties at charland area of Kushtia Treatment Gross return
(Tk/ha) Cost of production
(Tk/ha) Net return (Tk/ha) BCR
BARI Cheenabadam- 6 89250 56700 32550 1.57 BARI Cheenabadam- 7 123548 56700 66848 2.18 BARI Cheenabadam- 8 122783 56700 66083 2.17 Locally popular (Patnai) 120495 56700 63795 2.13
Market price (Tk./kg): BARI Cheenabadam pod- 42.50 and local (Patnai) pod - 43.50.
Jamalpur
Yield and yield components of groundnut varied significantly due to variation of varieties except number of seed pod-1 (Table 3). Variety BARI Cheenabadam-5 produced the tallest plant while the Dhaka-1 produced the shortest. Variety Dhaka-1 produced the highest number of filled pod plant-1 which was statistically similar to the BARI Cheenabadam-7 & BARI Cheenabadam-8. Variety BARI Cheenabadam-6 produced the second highest number of filled pod plant-1 and it was statistically similar to the BARI Cheenabadam-7 & BARI Cheenabadam-8. The lowest number of filled pod was produced by the BARI Cheenabadam-5. Variety Dhaka-1 had the highest shelling

Charland Eco-System
53
percent. BARI Cheenabadam-7 and BARI Cheenabadam-8 gave statistically similar shelling percent and significantly different from the other varieties. Variety BARI Cheenabadam-5 gave the lowest shelling percent similar to BARI Cheenabadam-6. The variety BARI Cheenabadam-7 produced the highest 100- seed weight while the Dhaka -1 gave the lowest. The variety BARI Cheenabadam-8 gave the highest nut yield followed by the BARI Cheenabadam-7. Higher number of pod plant-1 and bolder seed size was ascribed to the higher nut yield in BARI Cheenabadm-7 and BARI Cheenabadam-8. However, BARI Cheeabadam-6 and BARI Cheenabadam-5 produced the second highest nut yield and these were significantly different from other varieties. Dhaka-1 gave the lowest nut yield possibly due to its smallest seed size. Table 3. Yield and yield attributes of groundnut during rabi 2010-2011 at the char areas of Jamalpur district
Treatments Plant height (cm)
Number of branch plant-1
Number of filled pod
plant-1
Shelling (%)
Number of seed pod-1
100- seed wt (gm)
Yield (Kg ha-1)
Field duration (days)
V1 43.9 8.53 15.4 61.7 1.70 42.54 1.99 166 V2 37.8 7.33 17.7 63.3 1.70 39.00 2.21 169 V3 35.0 4.60 20.3 69.5 1.70 53.43 3.10 170 V4 36.3 11.7 20.2 72.8 1.77 49.83 3.24 160 V5 29.9 7.13 21.4 83.8 1.67 32.80 1.70 156 CV(%) 6.05 16.47 8.24 3.24 7.41 3.98 5.10 - F-test ** ** ** ** NS ** ** - LSD0.05 4.17 2.44 2.95 4.28 - 3.26 0.231 -
V1 = BARI Cheenabadam-5, V2 = BARI Cheenabadam-6, V3 = BARI Cheenabadam-7, V4 = BARI Cheenabadam-8, V5 = Local (Dhaka-1)
Table 4. Economic performance of groundnut varieties in the char land areas during rabi 2010- 2011at Jamalpur Variety Nut yield
( t ha-1) Cost of cultivation
(Tk ha-1) Gross return
(Tk ha-1) Gross margin
(Tk ha-1) BCR
V1 1.99 42,640 89,550 46,910 2.10 V2 2.21 42,640 88,400 45,760 2.07 V3 3.10 42,640 1,24,000 81,360 2.91 V4 3.24 42,640 1,45,800 1,03,160 3.42 V5 1.70 42,640 76,500 33,860 1.80
Selling price of nut: BARI Cheenabadam-5, BARI Cheenabadam-8 & Local 45 Tk kg-1, BARI Cheenabadam-6 & BARI Cheenabadam-7: 40 Tk kg-1
Economic evaluation
Cost of cultivation was Tk. 42,460 ha-1 for all varieties while maximum gross return was obtained from the variety BARI Cheenabadam-8 (Tk 1,45,800 ha-1) followed by BARI Cheenabadam-7 (Tk 1,24,000 ha-1) (Table 4). Minimum gross return (Tk 76,500 ha-1) was obtained from the Dhaka-1. Similar trend was found in case of gross margin. Maximum BCR (3.42) was recorded in BARI Cheenabadam-8 and minimum BCR (1.80) was found from the Dhaka-1 (Table 4).
Conclusion
Results revealed that BARI Cheenabadam-7 and BARI Cheenabadam-8 at Kushtia and BARI Cheenabadam-8 at Jamalpur might be recommended for extensive cultivation in the char land areas of these regions because of their short field duration and high selling price.

Charland Eco-System
54
ADAPTATION OF BARI RELEASED CROP VARIETIES IN CHARLAND
M. A. K. Main, M. R. Islam and J. Hossain
Introduction
Due to environmental changes crop production techniques should be adapted to overcome the stress condition. Charland crop production mainly depends on rainfed cultivation. The crop suffered from available soil moisture and get stress. Suitable crop varieties which are tolerant to some moisture stress are needed to be studied. Charland is an important area where remains possibility to improve cropping system. Although the farmers’ of charland grow some crops like groundnut and some minor cereals like millets but have greater scope of adaptation of BARI released crop varieties. Full package of important crop varieties are needed to adapt at charland for higher productivity and validation of approved technologies.
Methodology
The selected area of charland was Koikunda, Lokhikunda union of Ishurdi, Pabna. It is the developed charland of the river of Padma. The names of selected farmers are Abul Kalam Azad, Abdul Mannan and Allauddin Bisswas. Four mustard varieties- BARI Sarisha-11, BARI-Sarisha-14, BARI-Sarisha-15, BARI-Sarisha-16 and one lentil variety BARI Mosur-6 and three wheat varieties, Prodip, Bijoy and Sufi were grown in one bigha (33 decimal) of land. All the crop varieties were sown on 9 November 2009. Crops were grown in residual soil moisture and no irrigation is applied (rainfed condition). Fertilizers were applied as per recommendation for the crops (FRG 2005) and all fertilizers were applied as basal. Yields of different crop varieties were collected.
Results Yields of different crop varieties have been presented in Table 1. BARI Sarisha-11, BARI Sarisha-14 and BARI Sarisha-15 and BARI Sarisha-16 produced substantial yield of 1578, 1314 and 1360 and 1546 kg/ha respectively. BARI Sarisha-11 and BARI Sarisha-16 were comparatively better than BARI Sarisha-14 and BARI Sarisha-15. BARI Mosur 6 gave the yield of 1358 kg/ha. Grain yield of wheat was 3052, 2965 and 2889 kg/ha respectively in Prodip, Bijoy and Sufi varieties.
Table 1. Yield performance of mustard, lentil and wheat varieties under rainfed condition at charland (Koikunda, Lokhikunda union of Ishurdi).
Crops Variety Sowing time Harvesting time Yield (kg/ha) Mustard BARI Sarisha-11 25.11.10 25.2.11 1578 BARI Sarisha-14 25.11.10 16.2.11 1314 BARI Sarisha-15 25.11.10 15.2.11 1360 BARI Sarisha-16 25.11.10 19.2.11 1546 Lentil BARI Mosur 6 26.11.10 26.2.11 1358 Wheat Prodip 26.11.10 2.4.11 3052 Bijoy 26.11.10 2.4.11 2965 Sufi 26.11.10 2.4.11 2889

Charland Eco-System
55
A SURVEY ON CROPS AND CROPPING OF CHAR AREAS IN BANGLADESH
M.N. Islam, M.A. Hossain, M. Mohiuddin, M.A.K Mian and M.Biswas
Abstract This study was carried out during 2011 at four char upazillas namely Ishurdi, Bhuapur, Melando and Ulipur under Pabna, Tangail, Jamalpur and Kurigram districts in Bangladesh to know the socio economic profiles of the farmers, their land utilization pattern, existing cropping patterns, crops and crop production practices followed by the farmers in study areas. Averaged over locations, maximum respondents were under the age group of 31-45 years and engaged mainly in agriculture. Maximum respondent farmers were found to be literate up to primary level and have medium sized family (3-5 members) with maximum agricultural land of 2.0 acre. Maximum land of study areas are high, medium high and medium with sandy loam soil having only 21% irrigation facility. A large number of Cropping Patterns (CP) is practiced by the farmers in the study areas and CP is different at different areas. Sampled farmers of Ishurdi area practiced 36 CP and that of Ulipur area 35 CP, Bhuapur area 30 CP as well as Melando area 16 CP. Aus rice, wheat and lentil were the main crops at Ishurdi area. Majority of the farmers at char areas of Ishurdi upazilla practiced Wheat- Mungbean- Fallow (36%) followed by LenTil- Aus- Fallow (34%) cropping patterns. Jute, Hybrid maize, mustard and T. aman rice (HYV) are major crops at Bhuapur area and Wheat- Jute - T.aman (43%) CP was followed by the majority sampled farmers. Mustard, boro rice (HYV) and jute are main crops at Melando area and maximum respondent farmers practiced Mustard - Boro – Jute (70%) CP. Onion, jute and T. aman rice (HYV) are predominant crops at Ulipur area. Fallow -Boro-T. aman (53%) and Onoin-Jute-T. aman (42%) CP was practiced by the majority sampled farmers there. Major crops of the study areas are different and their agronomic profiles are also different. According to farmers’ opinion, natural hazard specially drought, scarcity of irrigation facility, cumbersome procedure of getting loan, shortage of agricultural labour, unavailability of fertilizers and field machinery, high price of quality seeds, and transportation problems of farm products were the major hindrance to crop production at char areas. Introduction of new crops like Soybean may be done at char areas. Selection of short duration, drought tolerant modern varieties of different crops along with improved management practices and different intercropping systems should be the potential for future researchable issues.
Introduction
Chars are the lands that emerge as islands within the river channel or as attached land to the riverbanks as a result of the dynamics of erosion and accretion in the rivers of Bangladesh. The active floodplain and non saline char land soils occur mainly in Kurigram, Lalmonirhat, Sirajgonj, Pabna, Rajshahi, Jamalpur, Manikgonj, Faridpur, Kushtia, Shariatpur, Madaripur and Chandpur (Sattar and Islam, 2010). Char land areas are estimated to be 0.72 million hectares in Bangladesh which is about 5% of the country area and about 6.5 million people (5% of the country’s population) live there (EGIS, 2000). About 64 to 97% of the char areas are cultivable. The chars are home of some of the poorest and most vulnerable people in Bangladesh. These areas are particularly prone to the effects of frequent climate shocks (floods, drought and cyclones) which increases the precariousness of poor people’s lives by wiping out their assets and pushing them deeper into the poverty. The Char dwellers mainly depend on agriculture and agriculture related activities. Opportunities for off farm activities are marginal there.

Charland Eco-System
56
Present government puts emphasis on increasing cropping intensity and crop productivity in stress prone areas like charland to feed the increased population of the country. Generally farmers in char lands cultivate local variety of different crops. They mainly grow potato, Hybrid maize, sweet potato, mustard, lentil, khesari, field pea, blackgram, chili, cheena, muskmelon, bitter gourd, sweet gourd, groundnut, sugarcane etc. in rabi season and aus rice, jute, kaon, sesame and dhaincha etc. in kharif season. Moreover, they follow their own crop production techniques which are the main causes of low yield in char areas. Now, Hybrid maize becomes popular in some chars as monoculture during rabi season due to its diversified uses and higher productivity but this practice may deteriorate the soil fertility. In such case, intercropping of Hybrid maize with legume crops or other compatible crops may maintain soil fertility status and increase total productivity per unit area through better utilization of growth recourses.
Introduction of new crops suitable for drought, flood and nutrient deficit soil; replacement of local varieties through modern varieties (MV) along with appropriate agronomic management practices including intercropping systems would boost up the farm productivity that will reduce the poverty level of resource poor farmers. For improvement of crop productivity and livelihood pattern as well as enhancement of food security of all char land people in Bangladesh, firstly a survey on crops and cropping along with farmers existing practices should be known. But very limited literature is available on this regards. Therefore, an attempt was made for delineating existing scenario of farmers at char areas of Ishurdi (Pabna), Bhuapur (Tangail), Melando (Jamalpur) and Ulipur (Kurigram) with the objectives to know the socio economic profiles of the farmers, their land utilization pattern, existing crops and cropping practices, and to find out existing cropping patterns at the char areas in Bangladesh.
Methodology
This study was carried out during 2011. A multi-stage sampling technique was followed to select district, upazilla, village and households for this study. In the first stage of sampling, four districts namely Pabna, Tangail, Jamalpur and Kurigram were purposively selected for having man power to collect necessary information from char land farmers. Secondly, one upazilla from each district, i.e., Ishurdi from Pabna, Bhuapur from Tangail, Melando from Jamalpur and Ulipur from Kurigram were selected. Thirdly, two char villages under each upazilla were selected as study area for collecting necessary data and information. A comprehensive list of fifty households was made and finally, twenty five households were selected randomly from the list of each village. Thus, data collection was done from fifty respondents using pre tested questionnaire from each district. Descriptive statistics were mostly used in this study to analyze the collected data.
Results and Discussion
Socio-economic profiles of the respondent
Farmers’ age: Age of the respondent farmers varied from 15 to more than 60 years (Table 1). Maximum respondent farmers at Ishurdi upazilla (59.2%) were belonged to the age group of 15-30 years but it was 48.0% at Bhuapur under age group of 31-45 years. On the contrary, majority of the respondent farmers were belonged to the age group of 46-60 years at Melando (48.0%) and at Ulipur (43.9%). Averaged over locations, the highest number of the respondent farmers (35.7%) was under the age group of 31-45 years follower by the age group of 46-60 years (34.8%). The minimum number of the respondent farmers (9.7%) was more than 60 years old.

Charland Eco-System
57
Occupation: It was observed from Table 1 that the respondent farmers were engaged in four different occupations. Averaged over locations, majority of the sampled farmers were engaged in agriculture (76.8%). Another important occupation was agriculture along with business (21.3%). No sampled farmer of Bhuapur, Melando and Ulipur was engaged in Agriculture+Van puller but only 2% of sampled farmer at Ishurdi were involved in this occupation. Table 1. Socio-economic profiles of the farmers in char areas of Bangladesh
Characteristics Categories Ishurdi Bhuapur Melando Ulipur All areas Famers age 15-30 59.2% 10.0% 4.0% 8.8% 19.8%
31-45 28.6% 48.0% 28.0% 36.8 % 35.7% 46-60 10.2% 36.0% 48.0% 43.9% 34.8% > 60 2.0% 6.0% 20.0% 10.5% 9.7%
Occupation
Agriculture 82.0% 77.4% 64.7% 78.9% 76.8% Agriculture+Business 12.0& 18.9% 31.4% 21.1% 21.3%
Agriculture+Van puller 2.0% - - - 0.5% Agriculture+service 4.0% 3.7% 3.9% 0.0% 1.4%
Education level
Illiterate 20.0% 19.6% 4.0% 54.4% 25.6% Primary 40.0% 80.4% 94.0% 29.8% 60.5%
upto class viii 30.0% - 2.0% 14.0% 11.0% SSC 2.0% - - 1.8% 0.9%
Above SSC 8.0% - - - 2.0%
Education: Averaged over locations, only 25.6% of the sampled farmers were illiterate, i.e. 74.4% was literate whereas national literacy is 51% (BBS, 2008). Maximum number of respondent farmers was found to be literate up to primary level (60.5%) followed by illiteracy (25.6%). It was surprising that number of sampled farmers with literacy above SSC level (2.0%) was more than SSC level (0.9%). Among locations, majority of the farmers of Ishurdi (40.0%), Bhuapur (80.4%) and Melando (94.0%) had literacy up to primary level while at Ulipur, maximum sampled farmers (54.4%) were illiterate (Table 1).
Family size: Number of members of family in the study areas is shown in Table 2. Majority sampled farmers had medium sized family (3-5 members) whereas only few respondents had small sized family (1-2 members) at all study areas. Averaged over locations, 84.1% respondent farmers had medium sized family.
Table 2. Information regarding family size of the study areas (no. family members) Family size No. of members Ishurdi Bhuapur Melando Ulipur All areas
Small 1-2 6.0% 2.0% 4.0% 0.0% 2.9% Medium 3-5 84.0% 86.3% 88.0% 78.9% 84.1% Large > 6 10.0% 11.7% 8.0% 21.1% 13.0%
Land holdings: It was observed from Table 3 that on an average each respondent farmer possessed 0.72 acre own land for cultivation, 0.02 acre orchard and 0.09 acre homestead area. Each farmer had also few fallow lands (0.18 acre) and the reasons of fallow may be shortage of inputs or land under water. The farmers of char areas also practiced ranted in (0.09 acre) or ranted out (0.13 acre), lease in (0.07 acre) or lease out (0.03 acre). Among locations, farmers of Ishurdi had more own land (1.03 acre) while those of Melando and Ulipur had fewer (0.58 acre).

Charland Eco-System
58
Table 3. Average land ownership pattern (in acre) in selected char areas of Bangladesh Ishurdi Bhuapur Melando Ulipur Average Own land 1.03 0.67 0.58 0.58 0.72 Ranted in 0.17 - 0.09 0.09 0.09 Ranted out 0.28 0.13 0.05 0.05 0.13 Lease in 0.13 - 0.07 0.07 0.07 Lease out 0.04 - 0.03 0.03 0.03 Orchard 0.05 - 0.01 0.01 0.02 Fallow 0.02 0.27 0.21 0.21 0.18 Homestead 0.12 0.09 0.07 0.07 0.09
Farm size: Averaged over locations, 78.8% sampled farmers occupied up to 2.0 acre of land (Table 4). Only 0.5% respondent farmers owned more than 6.0 acre of land. Majority of the sampled farmers of all locations occupied up to 2.0 acre of land. At Ishurdi, 42.0% sampled farmers had land holding of 2.01- 4.0 acre and 2.0 % farmers possessed more than 6.0 acre of land but no farmers owned such at other locations. Table 4. Farm size (acre) of sample farmers at different char areas
Fram size (acre) Ishurdi Bhuapur Melando Ulipur All areas Up to 2.00 44.0% 92.2% 94.0% 84.2% 78.8% 2.01-4.00 42.0% 7.8% 4.0% 12.3% 16.4% 4.01-6.00 12.0% - 2.0% 3.5% 4.3% 6.01-8.00 2.0% - - - 0.5%
Cropping patterns in study areas: A large number of Cropping Patterns (CP) is practiced by the farmers in the study areas and CP is different at different areas (Table 5). Sampled farmers of Ishurdi area practiced 36 CP and that of Ulipur area 35 CP, Bhuapur area 30 CP as well as Melando area 16 CP. Aus rice, wheat and lentil were the main crops at Ishurdi area. In different CP farmers grow aus rice, wheat and lentil. Majority of the farmers at char areas of Ishurdi upazilla practiced Wheat- Mungbean- Fallow (36%) followed by LenTil- Aus- Fallow (34%) cropping patterns. Jute, Hybrid maize, mustard and T. aman rice (HYV) are major crops at Bhuapur area and Wheat- Jute- T.aman (43%) CP was followed by the majority sampled farmers. Mustard, boro rice (HYV) and jute are main crops at Melando area and maximum respondent farmers practiced Mustard-Boro–Jute (70%) CP. Onion, jute and T. aman rice (HYV) are predominant crops at Ulipur area. Fallow -Boro-T. aman (53%) and Onoin-Jute-T. aman (42%) CP was practiced by the majority sampled farmers there.
Table 5. Major Croppin g patterns practiced in different char areas Ishurdi Bhuapur Melando Ulipur
Wheat- Mungbean- Fallow (36%)
Wheat - Jute - T.aman (43%)
Mustard - Boro – Jute (70%)
Fallow -Boro-T. aman (53%)
LenTil- Aus- Fallow (34%)
Wheat- Aus- Blackgram (24 %)
Chili- Boro - Jute (26%)
Onoin-Jute-T. aman (42%)
Wheat – Aus- Fallow (28%)
Maize - Jute - T.aman ( 22%)
Wheat - Jute - T.aman (16%)
Onoin + Chili -T. aman (21%)
Mustard – Aus- Fallow (22%)
Mustard -Boro -T.aman (20%)
Lentil - Jute- T. aman (14%)
Cheena-Jute-T.aman (19%)
Sugarcane (22%)
Maize – Sesame - T.aman (10%)
Radish - Boro – Jute (6%)
Fallow-Jute-T.aman (14%)

Charland Eco-System
59
Ishurdi Bhuapur Melando Ulipur Lentil – Sesame- Fallow
(18%) Maize –Aus- Blackgram
(10%) Brinjal- Boro- Jute
(4%) Potato-Onion+Jute-T.
aman (9%) 30-others
(60%) 24-others
(47%) 10-others
(20%) 29- Others
(51%)
Land type: Char land consists of high, medium high, medium, medium low and low land (Table 6). Averaged over locations, 42% land was high and 24% was medium high, which was suitable for maximum crops. Ten percent area was medium low land and it was flooded earlier. Seven percent land was low where boro rice (local) may be grown. Among locations, at Ishurdi maximum land was under high land (62%) category but at Melando had (42%) high land. On the other hand, Bhuapur had no high land and Ulipur had only 1% high land.
Table 6. Land type distribution in study char areas Land type Ishurdi Bhuapur Melando Ulipur All areas
High 62% - 42% 1% 42% Medium high 9% 78% 58% 26% 24% Medium 14% 15% - 32% 16% Medium Low 5% 4% - 37% 10% Low 10% 3% - 4% 7%
Irrigation: Averaged over four char areas, 21% area enjoyed irrigation facility (Table 7). Irrigation facility was more at Ulipur (29%) which was closer to Melando (23%) and less at Ishurdi (15%).
Table 7. Distribution of irrigated and non irrigated land in study char areas Irrigation Ishurdi Bhuapur Melando Ulipur All areas Irrigated 15% 17% 23% 29% 21.0% Non irrigated 85% 83% 77% 71% 79%
Soil Texture: Based on respondent farmers, char land soil of the study area was loamy, sandy loam and sandy in texture (Table 8). Majority of the soil was sandy loam in texture and only 0.4% soil was sandy. Ishurdi and Bhuapur areas have no loamy soil. Most of the soils were sandy loam at all the locations.
Table 8. Soil texture in study char areas Soil texture Ishurdi Bhuapur Melando Ulipur All areas Loamy - - 2.0% 3.5% 1.4% Sandy loam 100% 100% 98% 94.7% 98.2% Sandy - - - 1.8% 0.4%
Crop Management
Aus rice, wheat and lentil were the main crops at Ishurdi area; jute, Hybrid maize, mustard and T. aman rice (HYV) at Bhuapur area; mustard, boro rice (HYV) and jute at Melando area, and onion, jute and T. aman rice (HYV) at Ulipur area.
Agronomic management of wheat: Wheat is grown in Ishurdi, Bhuapur and Ulipur chars and cent percent sampled farmers used BARI developed wheat varieties, mostly Shatabdi (Table 9). Wheat cultivation at Melando was found negligible. Farmers prepared their land for wheat cultivation through 3-5 ploughing and 2-5 laddering. Majority of the farmers ploughed 4 times at Bhuapur and Ulipur followed by 2 and 3 laddering, respectively. On the contrary, maximum

Charland Eco-System
60
respondent farmers of Ishurdi ploughed 4-5 times followed by 4 laddering. Most of the farmers of all locations sow wheat seeds in broadcast method in the month of November. Maximum farmers of Ishurdi and Bhuapur used their own seeds but 71% respondent farmers of Ulipur used purchased seeds. Majority of the farmers at Ishurdi areas grow wheat with 2 irrigations, without weeding and without pesticide spray but at Bhuapur with one weeding, without pesticide spray under rainfed condition. Maximum farmers of Ulipur cultivate wheat with 2 irrigations, 2 weeding and one pesticide spray. Most of the farmers of all locations harvest their crop in March.
Table 9. Agronomic profiles of wheat in Ishurdi, Bhuapur, Melando and Ulipur chars Agronomic profiles Ishurdi Bhuapur Melando Ulipur Variety Local - - Not available -
MV 100% 100% 100% No. of ploughing 3 - 44% 29%
4 50% 50% 43% 5 50% 6% 28%
No. of laddering 2 - 88% 29% 3 33% 12% 57% 4 50% - - 5 17% - 14%
Time of sowing October - 37% 28% November 100% 50% 43% December - 13% 29%
Sowing method Line - - - Broadcast 100% 100% 100%
Source of seed Own 83% 69% 29% Purchase 17% 31% 71%
No. of weeding 0 100% 12% 29% 1 - 88% 14% 2 - - 57%
No. of Irrigation 0 25% 94% - 1 - 6% - 2 75% - 100%
No. of pesticides spray
0 100% 100% 43% 1 - - 57% 2 - - - 3 - - -
Date of harvesting February - 37% 13% March 100% 63% 87%
Agronomic management of jute: Modern variety jute is grown mainly in Bhuapur, Melando and Ulipur areas but at Ishurdi jute is found very few (Table 10). Majority of the farmers at Bhuapur prepared land for jute by 4 ploughing followed by 3 laddering; at Melando by 3 ploughing followed by 2 laddering and at Ulipur by 4 ploughing followed by 2 laddering. Most of respondent farmers of Bhuapur and Melando sow jute seeds in broadcast method in April, but at Ulipur in March. Maximum farmers of all the locations did not keep jute seeds for own use or sale, so they have to purchase jute seeds for cultivation. Majority of the farmers at Bhuapur cultivate jute with 2 weedings but at Melando and Ulipur with 3 weedings. Maximum farmers of all locations did not provide irrigation or pesticide spray. Most of the farmers of Bhuapur and Melando harvest jute in month of August, while at Ulipur in July.

Charland Eco-System
61
Table 10. Agronomic profiles of Jute in Ishurdi, Tangail, Jamalpur and Ulipur chars Agronomic profiles Ishurdi Bhuapur Melando Ulipur Variety Local Not available - - -
MV 100% 100% 100% No. of ploughing 2 - 20.0% 21.4%
3 6.2% 70.0% 35.7% 4 93.8% 10.0% 39.3% 5 - - 3.6%
No. of laddering 2 18.8% 65.0% 46.4% 3 50.0% 35.0% 39.3% 4 31.2% - 14.3%
Time of sowing February - 3.6% March - 25.0% 60.7% April 100% 75.0% 35.7%
Sowing method Line - - - Broadcast 100% 100% 100%
Source of seed Own 43.8% - 7.1% Purchase 56.2% 100% 92.9%
No. of weeding 0 6.3% - - 1 6.3% - 3.6% 2 75.0% 30.0% 35.7% 3 12.4% 70.0% 60.7%
No. of Irrigation 0 100% 95.0% 50.0% 1 - 5.0% 42.9% 2 - - 7.1%
No. of pesticides spray
0 100% 55.0% 64.3% 1 - 45.0% 32.1% 2 - - 3.6%
Date of harvesting
July - 19.9% 65.4% August 100% 80.1% 34.6%
Agronomic management of lentil: Lentil is mostly grown at Ishurdi and Bhuapur char (Table 11). Most of the farmers used local variety of lentil. It is grown with 0-5 times ploughing followed by 0-5 times laddering. At Ishurdi, higher percentage of farmers grow lentil with 5 ploughing followed 4 laddering but at Bhuapur, with 3 ploughing followed 3 laddering. Most of the farmers of Ishurdi sow lentil in November following broadcast method but at Bhuapur in October with same method. All the farmers use their own lentil seeds at both the locations. They grow lentil without weeding, irrigation and pesticide use. Majority of the farmers harvest it in February.
Table 11. Agronomic profiles of Lentil in Ishurdi, Bhuapur, Melando and Ulipur chars Agronomic profiles Ishurdi Bhuapur Melando Ulipur Variety Local 94.7% 100% Not available Not available
MV 5.3% - No. of ploughing 0 - 28.6%
1 - - 2 - 28.5% 3 10.5% 42.9% 4 42.1% - 5 47.4% -

Charland Eco-System
62
Agronomic profiles Ishurdi Bhuapur Melando Ulipur No. of laddering 0 - 28.6%
1 - - 2 5.3% 28.5% 3 5.3% 42.9% 4 57.9% - 5 31.5% -
Time of sowing October 10.5% 100% November 89.5% -
Sowing method Line - - Broadcast 100% 100%
Source of seed Own 100% 100% Purchase - -
No. of weeding 0 100% 100% 1 - -
No. of Irrigation 0 100% 100% 1 - -
No. of pesticides spray
0 100% 100% 1 - -
Date of harvesting February 83.4% 90.2% March 16.6% 9.8%
Agronomic management of T. aman: T. aman is mostly grown in Bhuapur, Melando and Ulipur char areas (Table 12). At Bhuapur and Ulipur, maximum respondents grow modern variety whereas majority of the farmers of Melando cultivate local variety. Majority of Bhuapur farmers prepared T. aman field by 2 ploughing followed by 2 laddering whereas that of Melando and Ulipur puddle land by 4 ploughing followed by 2 laddering. Maximum farmers of Bhuapur produce seedlings from own seed but those of Melando and Ulipur from purchased seeds. Majority of Bhuapur and Ulipur farmers transplant seedlings in July while that of Melando in August. At Bhuapur, maximum farmers grow T. aman rice with 1 weeding, no irrigation and no pesticide spray, and harvest in November but farmers at Melando with 2 weeding, 1 irrigation and 1-2 pesticide spray, and harvest in December. On the other hand, majority of Ulipur farmers grow T. aman with 2 wedding, no irrigation and 1 pesticide spray, and harvest in November.
Table 12. Agronomic profiles of T.aman in Ishurdi, Bhuapur, Melando and Ulipur chars Agronomic profiles Ishurdi Bhuapur Melando Ulipur Variety Local Not available 50% 80.0% 19.2%
MV 50% 20.0% 80.8% No. of ploughing 2 62.5% - 7.7%
3 37.5% 40.0% 23.1% 4 - 60.0% 69.2%
No. of laddering 1 12.5% - - 2 87.5% 60.0% 53.8% 3 - 40.0% 30.8% 4 - - 15.4%
Time of transplanting June 12.5% - 7.7% July 75.0% - 69.2%
August 12.5% 100.0% 23.1% Transplanting method Line 100% 100.0% 100%
Broadcast - - -

Charland Eco-System
63
Agronomic profiles Ishurdi Bhuapur Melando Ulipur Source of seed Own 62.5% - 11.5%
Purchase 37.5% 100.0% 88.5% No. of weeding 0 12.5% - -
1 75.0% 20.0% 19.2% 2 12.5% 60.0% 65.4% 3 - 20.0% 15.4%
No. of Irrigation 0 87.5% - 84.6% 1 12.5% 60.0% 11.5% 2 - 40.0% 3.9%
No. of pesticides spray 0 87.5% 20.0% 34.6% 1 12.5% 40.0% 42.3% 2 - 40.0% 19.3% 3 - - 3.8%
Date of harvesting November 82% - 79% December 18% 100% 21%
Agronomic profiles of mustard: Mustard is mainly grown in Ishurdi, Bhuapur and Melando areas but very negligible amount at Ulipur areas (Table 13). At Ishurdi, majority of farmers grow local variety of mustard (Tori-7) whereas at Bhuapur, 85.7% respondent farmers grow high yielding mustard, mainly BARI Sarisha-11. Cent percent sampled farmers grow local variety of mustard (Tori-7) at Melando areas. Farmers of the study areas grow mustard with 2-5 ploughing followed by 2-5 laddering. Maximum farmers cultivate mustard with 5 ploughing followed by 5 laddering at Ishurdi areas. But at Bhuapur, maximum farmers grow mustard by 3 ploughing followed by 2 laddering and at Melando by 3 ploughing followed by 3 laddering. All respondent farmers of Ishurdi sow mustard in November in broadcast method but at Bhuapur and Melando in October. Majority of the farmers of Ishurdi and Bhuapur used own seed but farmers of Melando used purchased seeds. All the sampled farmers of Ishurdi and Bhuapur grow mustard without weeding, irrigation and pesticide spray. Sixty percent farmers at Melando provided only one spray to mustard. All the farmers of the study areas harvest mustard in February.
Table 13. Agronomic profiles of Mustard in Ishurdi, Bhuapur, Melando and Ulipur chars Agronomic profiles Ishurdi Bhuapur Melando Ulipur Variety Local 75% 14.3 100% Not available
MV 25% 85.7% - No. of ploughing 2 - 28.6% 10.0%
3 - 57.1% 50.0% 4 25% 14.3% 40.0% 5 75% - -
No. of laddering 2 - 57.1% - 3 - - 60.0% 4 25% 28.6% 40.0% 5 75% 14.3% -
Time of sowing October - 100% 100% November 100% - - December - - -
Sowing method Line - - - Broadcast 100% 100% 100%
Source of seed Own 75% 57.1% -

Charland Eco-System
64
Agronomic profiles Ishurdi Bhuapur Melando Ulipur Purchase 25% 42.9% 100%
No. of weeding 0 100% 100% 100% 1 -
No. of Irrigation 0 100% 100% 100% 1 - - -
No. of pesticides spray
0 100% 100% 40.0% 1 - - 60.0%
Date of harvesting February 100% 100% 100% March - - -
Agronomic profiles of Hybrid maize: Hybrid maize is mainly grown at Melando areas and very few farmers of other study areas grow it (Table 14). Farmers grow BARI Hybrid maize-5 or other foreign maize Hybrids. Majority of the farmers prepared their land for Hybrid maize by 3 ploughing followed 2 laddering and sow purchased seeds in line in the month of October. They grow Hybrid maize with 2 weedings, 2-3 irrigation and without pesticide spray. Majority of the farmers harvest the crop in March.
Table 14. Agronomic profiles of Hybrid maize in Ishurdi, Bhuapur, Melando and Ulipur chars Agronomic profiles Ishurdi Bhuapur Melando Ulipur Variety Local Not available - Not available Not available
MV 100% No. of ploughing 3 63.6%
4 36.4% 5 -
No. of laddering 2 81.8% 3 18.2% 4 -
Time of sowing October 63.6% November 36.4% December -
Sowing method Line 100% Broadcast -
Source of seed Own - Purchase 100%
No. of weeding 0 9.1% 1 9.1% 2 81.8%
No. of Irrigation 0 9.1% 1 - 2 45.5% 3 45.4%
No. of pesticides spray
0 100% 1 -
Date of harvesting March 63.6% April 36.4%
Agronomic profiles of onion: Onion is mainly found to grow at Ishurdi and Ulipur areas but very few at Bhuapur and Melando areas (Table 15). All the respondent farmers of both the locations grow local variety of onion. Cent percent farmers of Ishurdi grow onion with 6

Charland Eco-System
65
ploughing followed by 6 laddering but majority farmers of Ulipur prepared their onion field by 4 ploughing followed by 3-4 laddering. Cent percent respondents of Ishurdi plant onion in October in line. Farmers of Ulipur plant onion during October to January in line. Among them, 52.9% farmers plant it in December. Farmers of Ishurdi do not keep onion seed for future cultivation, so, 100% farmers purchase their seeds. On the other hand 94% farmers of Ulipur purchase seeds and the rest use own seeds. Onion farmers of Ishurdi grow it with 1-3 weeding, 0-3 irrigation and 0-3 pesticide spray. Among them, majority of the farmers weeded onion field by 1 times, provide irrigation 3 times and spray pesticide by 1 times. Ulipur farmers do weeding 0-3 times, give irrigation 2-3 times and spray pesticide 0-3 times. Among them, maximum farmers weed their onion field by 3 times, provide irrigation 2 times and spray pesticide 1 time. Majority of onion farmers of Ishurdi harvest their crop in March while at Ulipur in April.
Table 15. Agronomic profiles of onion in Ishurdi, Bhuapur, Melando and Ulipur chars Agronomic profiles Ishurdi Bhuapur Melando Ulipur Variety Local 100% Not available Not available 100%
MV - - No. of ploughing 3 - 5.9%
4 - 52.9% 5 - 35.3% 6 100% 5.9%
No. of laddering 2 - 23.5% 3 - 29.5% 4 - 29.4% 5 - 17.6% 6 100% -
Time of sowing October 100% 5.9% November - 17.6% December - 52.9%
January - 23.6% Sowing method Line 100% 52.9%
Broadcast - 47.1% Source of seed Own - 5.9%
Purchase 100% 94.1% No. of weeding 0 - 5.9%
1 75.0% - 2 - 29.4% 3 25.0% 64.7%
No. of Irrigation 0 25.0% - 1 - - 2 - 58.8% 3 75.0% 41.2%
No. of pesticides spray
0 25.0% 35.2% 1 40% 41.2% 2 30% 11.8% 3 5.0% 11.7%
Date of harvesting March 100% 24% April - 76%

Charland Eco-System
66
Agronomic profiles of boro rice: Boro rice is mostly grown at Bhuapur, Melando and Ulipur areas and 100% farmers used modern variety (Table 16). For cultivating boro rice, the farmers of Bhuapur prepare their land by 2-4 ploughing followed by 2 laddering. But at Melando and Ulipur, farmers puddle their land by 3-4 times ploughing follower by 2-4 times laddering. The highest proportion of Bhuapur farmers puddle the land by 3 ploughing followed by 2 laddering. On the other hand, 61.5% farmers at Melando ploughed 4 times followed 3 laddering, while at Ulipur, majority farmers prepared their boro field by 4 ploughing with 2 laddering. Majority of the farmers of Bhuapur and Ulipur transplant boro seedings in January but of Melando in February. Maximum farmers of all the locations use purchased seeds. Majority farmers of Bhuapur cultivate boro rice with 2 weeding, 6 irrigations and no pesticide spray. At Bhuapur and Ulipur all boro rice is harvested in April but at Melando, harvesting starts in April and continues up to June. Majority of the farmers at Melando harvest boro rice in May.
Table 16. Agronomic profiles of boro rice in Ishurdi, Bhuapur, Melando and Ulipur chars Agronomic profiles Ishurdi Bhuapur Melando Ulipur Variety Local Not available - - -
MV 100.0% 100.0% 100.0% No. of ploughing 2 25.0% - -
3 50.0% 38.5% 14.3% 4 25.0% 61.5% 85.7% 5 - - -
No. of laddering 2 100.0% 15.4% 71.4% 3 - 61.5% 14.3% 4 - 23.1% 14.3% 5 - - -
Time of sowing December - - 14.3% January 100.0% 30.8% 85.7%
February - 61.5% - March - 7.7% -
Sowing method Line 100.0% 100% 100.% Broadcast - - -
Source of seed Own - 15.4% 28.6% Purchase 100.0% 84.6% 71.4%
No. of weeding 1 - - - 2 100.0% 38.5% 71.4% 3 - 61.5% 82.6%
No. of Irrigation 2 - - 14.3% 3 - 69.2% 42.9% 4 - - - 5 - 30.8% 14.3% 6 100.0% - 28.5%
No. of pesticides spray
0 75.0% 23.0% 28.6% 1 25.0% 15.4% - 2 - 38.5% 42.9% 3 - 23.1% 28.5%
Date of harvesting April 100% 40% 100% May - 55% - June - 5% -

Charland Eco-System
67
Agronomic profiles of aus rice: Local variety of aus rice is mainly grown at Ishurdi and Bhuapur areas (Table 17). Farmers of Ishurdi prepared land of aus rice by 4-5 ploughing followed 4-5 laddering and sow own seeds in April to May in broadcast methods. The crop is grown with 0-2 times weeding, on irrigation and pesticide spray and the crop is harvested in July to August at Ishurdi area. On the other hand, farmers of Bhuapur prepared the land by 2-4 ploughing followed by 1-3 laddering and sow own seeds in April. Majority of the farmers use own seeds but few farmers used purchased seeds Most of the farmers grow aus rice with 1 weeding, no irrigation and no pesticide spray. But few farmers weed their crop 2 times. The crop is harvested in July.
Table 17. Agronomic profiles of aus rice in Ishurdi, Tangail, Jamalpur and Ulipur chars gronomic profiles Ishurdi Bhuapur Melando Ulipur Variety Local 100.0% 100% Not available Not available
MV - - No. of ploughing 2 - 53.3%
3 - 33.3% 4 12.5% 13.4% 5 87.5% -
No. of laddering 1 - 46.7% 2 - 46.7% 3 - 6.6% 4 12.5% - 5 87.5% -
Time of sowing April 68.8% 100% May 31.2% -
Sowing method Line - - Broadcast 100% 100%
Source of seed Own 100% 93.3% Purchase - 6.7%
No. of weeding 0 6.3% - 1 81.2% 93.3% 2 12.5% 6.7%
No. of Irrigation 0 100.0% 100.0% 1 - -
No. of pesticides spray
0 100.0% 100.0% 1 - -
Date of harvesting July 68% 100% August 32% -
Constraints to crop production: The farm level constraints as observed and mentioned by the sampled farmers are presented in Table 18. The most important constraints in the char areas are natural hazard like drought and it was cited by majority of sampled farmers at all the locations. Irrigation regulates crop yield in every where. Maximum respondent farmers at all locations opined that irrigation facility is not available at char areas that caused lower crop yield. Farmers of char areas are poor and they require credit for crop production. Majority of the farmers of all locations reported that due to cumbersome procedure of getting credit they did not enjoy it. Availability of agricultural labour is necessary for proper intercultural operations as well as harvesting. Most of the farmers (55-65%) opined that shortage of hired labour is also an important constraint in crop production. Fertilizer is also a vital input in crop production. No fertilizer dealer at char areas, consequently, the farmers have to collect fertilizer from main land.
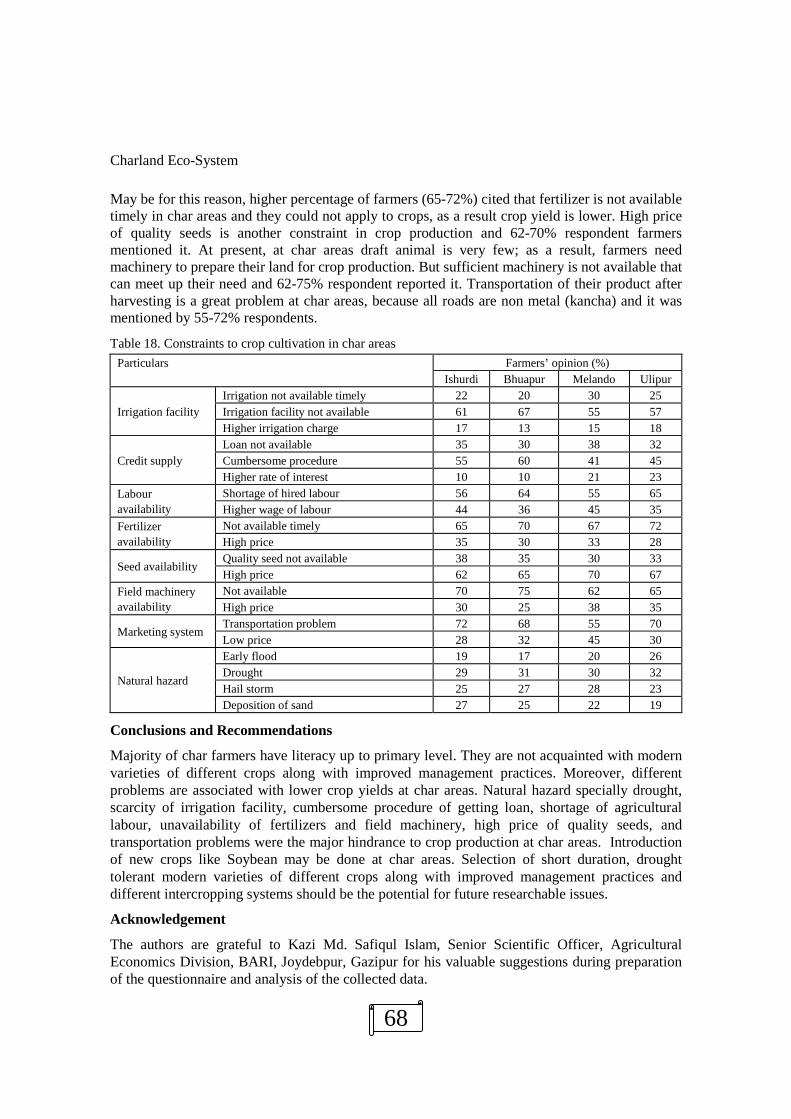
Charland Eco-System
68
May be for this reason, higher percentage of farmers (65-72%) cited that fertilizer is not available timely in char areas and they could not apply to crops, as a result crop yield is lower. High price of quality seeds is another constraint in crop production and 62-70% respondent farmers mentioned it. At present, at char areas draft animal is very few; as a result, farmers need machinery to prepare their land for crop production. But sufficient machinery is not available that can meet up their need and 62-75% respondent reported it. Transportation of their product after harvesting is a great problem at char areas, because all roads are non metal (kancha) and it was mentioned by 55-72% respondents.
Table 18. Constraints to crop cultivation in char areas Particulars Farmers’ opinion (%)
Ishurdi Bhuapur Melando Ulipur
Irrigation facility Irrigation not available timely 22 20 30 25 Irrigation facility not available 61 67 55 57 Higher irrigation charge 17 13 15 18
Credit supply Loan not available 35 30 38 32 Cumbersome procedure 55 60 41 45 Higher rate of interest 10 10 21 23
Labour availability
Shortage of hired labour 56 64 55 65 Higher wage of labour 44 36 45 35
Fertilizer availability
Not available timely 65 70 67 72 High price 35 30 33 28
Seed availability Quality seed not available 38 35 30 33 High price 62 65 70 67
Field machinery availability
Not available 70 75 62 65 High price 30 25 38 35
Marketing system Transportation problem 72 68 55 70 Low price 28 32 45 30
Natural hazard
Early flood 19 17 20 26 Drought 29 31 30 32 Hail storm 25 27 28 23 Deposition of sand 27 25 22 19
Conclusions and Recommendations
Majority of char farmers have literacy up to primary level. They are not acquainted with modern varieties of different crops along with improved management practices. Moreover, different problems are associated with lower crop yields at char areas. Natural hazard specially drought, scarcity of irrigation facility, cumbersome procedure of getting loan, shortage of agricultural labour, unavailability of fertilizers and field machinery, high price of quality seeds, and transportation problems were the major hindrance to crop production at char areas. Introduction of new crops like Soybean may be done at char areas. Selection of short duration, drought tolerant modern varieties of different crops along with improved management practices and different intercropping systems should be the potential for future researchable issues.
Acknowledgement
The authors are grateful to Kazi Md. Safiqul Islam, Senior Scientific Officer, Agricultural Economics Division, BARI, Joydebpur, Gazipur for his valuable suggestions during preparation of the questionnaire and analysis of the collected data.

Charland Eco-System
69
FERTILIZER MANAGEMENT OF HYV SESAME AT CHARLAND AREAS (AEZ- 8)
M.N. Islam and M.M. Rahman
Abstract
An experiment was conducted at the MLT site, Bhuapur, Tangail during Kharif 2012 to find out the economic fertilizer dose of sesame under char land situation. Six fertilizer doses viz. T1: 92-32-57-25-3-0.8 kg/ha NPKSZnB (based on HYG, BARC), T2: 52-28-23-19-1.5-1 (based on BARI), T3: 55-10-14-7-0-0 (based on AEZ-8), T4: 107-39-32-17-3.6-0.6 (Based on Soil Test), T5: 17.2-8-18-0-0-0 (Farmer’s practice) and T6: native fertility were tested on BARI Til-4. Among the treatments, T1 gave the highest seed yield (1.58 t/ha) which was at par with T4 treatments. The highest gross return (Tk. 59250/ha) and gross margin (Tk. 19393/ha was recorded in T1 which was very close to T4. But the highest BCR was obtained from T3 (1.58) due lower cost of production. The results revealed that 55-10-14-7 kg/ha NPKS would be the optimum fertilizer dose of sesame for getting the highest BCR in the charland of Bhuapur, Tangail (AEZ- 8).
Introduction
Sesame (Sesamum indicum L.) is the second important edible oil in Bangladesh. It is one of the important oilseed crops at charland areas. It contains 42-45% oil and 20% protein. Sesame is highly sensitive to excess moisture or water logging. Generally, water logging or high moisture stress is not observed at charland soil. Farmers generally grow Mungbean or sesame after rabi crops at charland areas. Sesame is traditionally cultivated in Bangladesh in early kharif season but agronomic management practices is lacking. Farmers are generally using the traditional varieties along with poor management practices which results in low yield around 899 kg/ha (BBS, 2010). Yield potentiality of BARI Til-4 is higher than locally available varieties. In our previous study, BARI Til-4 showed better performance at charland area without hampering the next crop. Therefore, the experiment was conducted to find out economic fertilizer dose of sesame under char land situation.
Materials and Methods
The trial was conducted at the MLT site, Bhuapur, Tangail (AEZ- 8) during Kharif 2012. The soil was collected at a depth of 0-20 cm and the chemical properties are presented in Table 1.
Table 1.Chemical properties of the experimental soil (initial soil) of Bhuapur char land pH OM (%) N (%) P (µg/g) K(meq/100g) S (µg/g) Zn (µg/g) B (µg/g) 6.97 1.48 0.067 4.39 0.181 15.46 0.49 0.248
The experiment was laid out in RCB design with three replications. Unit plot size was 8m x 5m. Six fertilizer doses viz. T1: 92-32-57-25-3-0.8 kg/ha NPKSZnB (based on HYG, BARC), T2: 52-28-23-19-1.5-1 (based on BARI), T3: 55-10-14-7-0-0 (based on AEZ), T4: 107-39-32-17-3.6-0.6 (Based on Soil Test), T5: 17.2-8-18-0-0-0 (Farmer’s practice) and T6: native fertility were tested on BARI Til-4. Half of nitrogen and full quantity of other fertilizers were applied at the time of final land preparation in the form of urea, triple super phosphate, muriate of potash, gypsum, zinc sulphate and boric acid, respectively. Rest of nitrogen was applied as top dressing at flower initiation stage (25 days after seeding). Seeds were sown with 30 cm a part

Charland Eco-System
70
line on 13 April, 2012. Pests and other crop management practices were done as and when necessary. The crop was harvested during 05 to 10 July, 2012. Data on different plant characters, yield components and seed yield were recorded from randomly selected 10 plants from each plot. Collected data were analyzed statistically and means were compared by LSD test at 5% level of significance.
Results and Discussion
Plant population/m2, Plant height, effective siliqua/plant, seeds/siliqua, 1000-seed weight, seed yield and straw yield of sesame under different fertilizer management differed significantly (Table 2). The highest plant population/m2 (37) was recorded in T3, T4 and T6 treatment which was statistically identical with T1 and T5 (36). The lowest plant population/m2 (35) was obtained from T2 treatment. The highest plant height was obtained from T4 (144.2 cm) treatment which was statistically identical with T3 (141.6 cm), T1 (136.7 cm) and T2 treatment (133.7 cm). The lowest plant height was recorded in T6 (120.3 cm) which was at par with T5 treatment (122.6 cm). The highest number of effective siliqua/plant was obtained from T1 (27) treatment followed by T2 (26), T4 (26) and T3 treatment (24). The lowest number of effective siliqua/plant was recorded from T6 (16) treatment. Significantly highest number of seeds/siliqua was recorded in T4 (79) treatment which was at par with T1 (76), T2 (75), T3 (75) and T5 treatment (71). Significantly the lowest number of seeds /siliqua was recorded in T6 (65) treatment (control). The highest 1000-gain weight was obtained from T1 (2.69g) treatment, followed by T2 (2.68 g) and T4 (2.56g) treatments. The lowest 1000-grain weight was obtained from T6 (2.10 g) treatment (control). Among different fertilizer managements, significantly the highest seed yield was recorded from T1 (1.58 t/ha) which was 135.82% higher over control and it was statistically identical with T4 (1.56 t/ha), T2 (1.45 t/ha) and T3 (1.33 t/ha) treatment. The lowest seed yield was obtained from T6 (0.67 t/ha) treatment. But the highest stover yield was recorded from T1 (3.53 t/ha) which was statistically identical with T2 (3.50 t/ha), T4 (3.40 t/ha) and T3 (3.27 t/ha) treatments. The lowest stover yield was obtained from T6 (2.33 t/ha) treatment. Cost and benefit analysis is presented in Table 1.The highest gross return and gross margin was recorded in T1 (gross return: Tk. 59250/ha and gross margin: Tk. 19393/ha) which was very close to T4 (gross return: Tk. 58500/ha and gross margin: Tk. 18850/ha). But the highest BCR was obtained from T3 (1.58) due lower cost of production. The lowest gross return (Tk.25125/ha), gross margin (Tk.2196/ha) and BCR (0.92) were found from T6.
Table 2. Yield and yield components of BARI Til-4 under different fertilizer managements in char land of Bhuapur
Treatment Plant/ m2 (no.)
Plant height (cm)
Siliqua/ plant (no.)
Seed/ siliqua (no.)
1000 seed weight (g)
Seed yield (t/ha)
Stover yield (t/ ha)
T1 36 136.7 27 76 2.69 1.58 3.53 T2 35 133.7 26 75 2.68 1.45 3.50 T3 37 141.6 24 75 2.48 1.33 3.27 T4 37 144.2 26 79 2.56 1.56 3.40 T5 36 122.6 20 71 2.38 1.05 3.00 T6 37 120.3 16 65 2.10 0.67 2.33 LSD (0.05) 1.81 11.46 2.55 5.53 0.11 0.14 0.27 CV (%) 2.8 4.7 6.1 4.1 2.4 6.0 4.6

Charland Eco-System
71
T1: 92-32-57-25-3-0.8 kg/ha NPKSZnB (Based on HYG, BARC), T2: 52-28-23-19-1.5-1 kg/ha NPKSZnB (Based on BARI), T3: 55-10-14-7-0-0 kg/ha NPKSZnB (Based on AEZ-8), T4: 107-39-32-17-3.6-0.6 kg/ha NPKSZnB (Based on Soil Test), T5: 17.2-8-18-0-0-0 kg/ha NPKSZnB (Farmer’s practice) and T6: native fertility
Table 3. Cost and return analysis of BARI Til-4 under different fertilizer managements at char land of Bhuapur
Treatment Gross return (Tk/ha)
Cost of cultivation (Tk/ha)
Gross margin (Tk/ha)
BCR
T1 59250 39857 19393 1.49 T2 54375 37912 16463 1.43 T3 49875 31618 18257 1.58 T4 58500 39650 18850 1.48 T5 39375 29505 9870 1.33 T6 25125 27321 -2196 0.92
Farmers’ opinion
Farmers opined that they would grow BARI Til-4 along with 55-10-14-7 kg/ha NPKS in the next year for getting highest BCR.
Conclusion
From the results, it may be concluded that 55-10-14-7 kg/ha NPKS (T3) would be the optimum fertilizer dose of sesame for getting highest BCR in the charland of Bhuapur, Tangail (AEZ- 8).

Charland Eco-System
72
FERTILIZER MANAGEMENT OF HYV SESAME AT CHARLAND AREAS (AEZ-11)
M. N. Islam, M. S. Rahman and M. A. Hossain
Abstract The experiment was conducted at Golapnagar char of Bheramara upazilla under Kushtia district during kharif season of 2012 to find out the economic fertilizer dose for HYV sesame. Four fertilizer doses viz. T1: 54-9-11-5 (AEZ-11 based), T2: 71-27-42-19 (Soil test based), T3:35-23-19-13 (Farmer practice) and T4: 0-0-0-0 (native fertility) kg/ha NPKS were tested on BARI Til-4. Among the treatments, soil test based fertilizer dose (T2) gave the highest seed yield (920 kg/ha) and gross return (Tk 40520/ha). But AEZ 11 based fertilizer dose (T1) produced second highest seed yield (833 kg/ha), highest gross margin (Tk 4118/ha) and BCR (1.13). The results revealed that AEZ-11 based fertilizer dose (54-9-11-5 kg/ha NPKS) might be suitable for sesame cultivation at Golapnagar char under Kushtia district for getting maximum profit.
Introduction
Sesame (Sesamum indicum L.) is the second important edible oil in Bangladesh. It is one of the important oilseed crops at charland areas. It contains 42-45% oil and 20% protein. Sesame is highly sensitive to excess moisture or water logging. Generally, water logging or high moisture stress is not observed at charland soil. Farmers generally grow Mungbean or sesame after rabi crops at charland areas. Sesame is traditionally cultivated in Bangladesh in early kharif season but agronomic management practices is lacking. Farmers are generally using the traditional varieties along with poor management practices which results in low yield around 899 kg/ha (BBS, 2010). Yield potentiality of BARI Til-4 is higher than locally available varieties. In our previous study, BARI Til-4 showed better performance at charland area without hampering the next crop. Therefore, the experiment was conducted to find out economic fertilizer dose of sesame under char land situation.
Materials and Methods
The trial was conducted at Golapnagar char of Bheramara upazilla under Kushtia district during kharif season of 2012. Initial soil sample was analyzed and the results are presented in Table 1.
Table 1. Chemical properties of the experimental soil (initial soil) of Golapnagar char of Bheramara upazilla under Kushtia district
pH OM (%) N (%) P (µg/g) K(meq/100g) S (µg/g) Zn (µg/g) B (µg/g) 7.8 1.60 0.08 5.5 0.23 16.8 0.97 0.29
Four fertilizer doses viz. T1: 54-9-11-5 (AEZ-11 based), T2: 71-27-42-19 (Soil test based), T3:35-23-19-13 (Farmer practice) and T4: 0-0-0-0 (native fertility) kg/ha NPKS were tested on BARI Til-4. The trial was laid out in RCB design with three replications. Unit plot size was 5m × 4m. Half of N and full quantity of other fertilizers were applied as basal at the time of final land preparation. Seeds were sown on 25 March, 2012. Weeding and thinning was done at 20 DAS. The remaining urea was top dressed at 21 DAS followed by irrigation. Other irrigation was given at 42 DAS. The crop was harvested on 27 June, 2012. Data on different yield components and seed yield were analyzed statistically and the means were adjusted by LSD test.

Charland Eco-System
73
Results and Discussion
Yield and yield components of BARI Til-4 varied significantly due to fertilizer doses (Table 2). The maximum seed yield (920 kg/ha) was recorded from T2 due to highest population and 1000-seed weight, whereas the lowest form T4. Gross return was found to be the highest (Tk 40520/ha) in T2 followed by T1 (Table 3). But gross margin (Tk 4118/ha) and BCR (1.13) were the highest in T1 due to lower cost of production.
Table 2. Yield and yield components of BARI Til-4 under different fertilizer management at Golapnagar char Kushtia district
Treatment Days to maturity
Plant Popn/m2
(no.) Plant height
(cm) Capsules/ plant (no.)
Seeds/ capsule (no.)
1000-seed wt. (g)
Seed yield (kg/ha)
T1 93 76.7 72.3 15.5 69.5 2.1 833 T2 94 78.9 71.7 18.2 69.7 2.2 920 T3 94 78.3 77.2 17.4 69.1 2.1 618 T4 93 75.7 57.9 9.3 55.0 2.0 413 LSD (0.05) NS NS 12.4 1.9 4.1 0.14 175 CV(%) 3.5 10.2 8.9 6.4 3.1 3.4 12.6
T1: 54-9-11-5 (AEZ 11 based), T2: 71-27-42-19 (Soil test based), T3:35-23-19-13 (Farmer practice) and T4: 0-0-0-0 kg/ha NPKS (Control)
Table 3. Benefit-Cost analysis of BARI Til-4 under different fertilizer management at Golapnagar char Kushtia district
Treatment Gross Return (Tk/ha)
Cost of production
(Tk/ha)
Gross margin (Tk/ha)
BCR
T1 36920 32802 4118 1.13 T2 40520 37498 3022 1.08 T3 27652 34350 -6698 0.81 T4 18640 28725 -10085 0.65
T1: 54-9-11-5 (AEZ 11 based), T2: 71-27-42-19 (Soil test based), T3:35-23-19-13 (Farmer practice) and T4: 0-0-0-0 kg/ha NPKSZnB (native fertility)
Farmers’ reaction
Farmers were not interested to grow sesame in Golapnagar char area because the crop is not sustained due to heavy drought.
Conclusion
The results revealed that AEZ-11 based fertilizer dose (54-9-11-5 kg/ha NPKSZnB) might be suitable for HYV sesame cultivation at Golapnagar char under Kushtia district for getting maximum profit.

Charland Eco-System
74
FERTILIZER MANAGEMENT OF HYV MUSTARD AT CHARLAND AREAS (AEZ- 8)
M.N. Islam and M.M. Rahman
Abstract The experiment was conducted at the MLT site, Bhuapur, Tangail during rabi 2011-12 to find out the economic fertilizer dose of HYV mustard under char land situation. Four fertilizer doses viz. T1: 60-16-24-13-0-1 kg/ha NPKSZnB (based on ORC, BARI) T2: 140-30-60-20-4-1 (Based on Soil test). T3: 57-15-38-0-0-0 (Farmer’s practice) and T4: native fertility were tested on BARI Sarisha-11. Among the treatments, T2 gave the highest seed yield (1830 kg/ha) which was at par with T1. The highest gross return (Tk. 96533/ha) was recorded in T2 but the highest gross margin (Tk. 61287/ha) was found from T1 treatment. The results revealed that 60-16-24-13-0-1 kg/ha NPKSZnB would be the optimum fertilizer dose of mustard for getting the highest gross margin in the charland of Bhuapur, Tangail (AEZ- 8).
Introduction
Mustard is an important oilseed crops that occupy 78% of the area and contribute nearly 62% of the total oilseed production in Bangladesh. It ranks first in respect of acreage and production. The shortage of edible oil in the country is acute and it has to import huge amount of edible oil to meet up the requirement of the people. The shortage of edible oil may be minimized by increasing yield per unit area. Yield per unit area depends on several factors. Among them, high yielding variety and fertilizer dose play an important role. Although yield potential of BARI Sarisha-11 is higher than other varieties, its long growth duration (105-110 days) is the major constraint to fit it in boro based cropping pattern. Farmers generally grow Mung bean/sesame/groundnut in char land areas in middle of March. So, they can easily grow and harvest BARI Sarisha-11 before those crops. In our previous study, BARI Sarisha-11 showed better performance in char land without hampering next crop. Now it is essential to find out optimum and economic dose of fertilizer for better yield of BARI Sarisha-11 in char land areas. Therefore, the experiment was conducted to find out economic fertilizer dose of HYV mustard under char land situation.
Materials and Methods
The trial was conducted at the MLT site, Bhuapur, Tangail district (AEZ- 8) during robi season of 2011-12. Four fertilizer doses viz. T1: 60-16-24-13-0-1 kg/ha NPKSZnB (based on AEZ-8), T2: 140-30-60-20-4-1 (based on STB), T3: 57-15-38-0-0-0 (Farmer’s practice) and T4: native fertility were tested on BARI Sarisha-11. The experiment was laid out in RCB design with three replications. Unit plot size was 8m x 5m. Fertilizers were applied as per treatments. Half of nitrogen and full quantity of PKSZnB were applied at the time of final land preparation in the form of urea, triple super phosphate, muriate of potash, gypsum, zinc sulphate and boric acid, respectively. Rest of nitrogen was applied as top dressing at flower initiation stage (25 days after seeding). Seeds were sown with 30 cm a part line on 15 November, 2011. Irrigation and other crop management practices were done when rquired. The crop was harvested during 25 February to 01 March, 2012. Data on different plant characters, yield components and seed yield were recorded from randomly selected 10 plants from each plot. Collected data were analyzed statistically and means were compared by LSD test at 5% level of significance.

Charland Eco-System
75
Results and Discussion Yield and yield components of mustard are presented in Table 1. Days to maturity ranged from 100-105days but this variation was not significant. The highest plant height (139.9 cm) was obtained from T2 which was statistically similar with T1 (138.2 cm) treatment. The lowest plant height (86.9 cm) was recorded in T4 treatment. The highest number of effective siliqua per plant was obtained from T2 (83) treatment followed by T1 treatment (75). The lowest number of effective siliqua per plant (38) was recorded from T4 treatment. Significantly the highest number of seeds per siliqua was recorded in T1 (13) treatment which was at par with T2 treatment (12). The lowest number of seeds per siliqua (8) was recorded in T4 treatment. The highest 1000-seed weight was obtained from T2 (3.61g) treatment followed by T1 (3.48g) and T3 (3.25g) treatment. The lowest 1000-seed weight (2.56g) was obtained from T4 treatment. Among the different fertilizer doses, significantly the highest seed yield was recorded from T2 (1830 kg/ha) treatment which was statistically identical with T1 (1716 kg/ ha) treatment. The lowest seed yield (430 kg/ha) was obtained from T4 treatment. Cost and benefit analysis is presented in Table 2. The highest gross return (Tk. 96533/ha) was recorded in T2 but the highest gross margin (Tk. 61287/ha) was found from T1 treatment. Although gross return was higher in T2 treatment but gross margin was higher T1 treatment due to lower total variable cost.
Table 1. Yield and yield components of BARI Sarisha-11 under different fertilizer managements in char land of Bhuapur
Treatment Days to maturity
Plant height (cm)
Effective siliqua/ plant (no.)
Seeds/siliqua (no.)
1000-seed wt. (g)
Seed yield (kg/ha)
Straw yield (kg/ha)
T1 103 138.2 75 13 3.48 1716 3967 T2 105 139.9 83 12 3.61 1830 5033 T3 103 116.2 60 10 3.25 1116 3267 T4 100 86.9 38 8 2.56 430 1334 LSD (0.05) NS 6.68 6.83 1.49 0.15 163 383 CV (%) 1.5 2.8 5.4 7.0 2.3 6.4 5.7
T1 = 60-16-24-13-0-1 kg/ha NPKSZnB (based on AEZ-8), T2 = 140-30-60-20-4-1 kg/ha kg/ha NPKSZnB (Based on Soil test), T3= 57-15-38-0-0-0 kg/ha NPKSZnB (Farmer practice), T4 = Native fertility
Table 2. Cost and return analysis of BARI Sarisha-11 under different fertilizer managements at char land of Bhuapur
Treatment Gross return (Tk/ha) Total variable cost (Tk/ha) Gross Margin (Tk/ha) T1 89801 28514 61287 T2 96533 36688 59845 T3 59101 25159 33942 T4 22834 21797 1037
Market price (Tk/kg): Seed 50/- and Straw 1/-
Farmers’ opinion Farmers opined that they would grow BARI Sarisha-11 along with 60-16-24-13-0-1 kg/ha NPKSZnB in the next year for getting higher gross margin.
Conclusion From the results, it may be concluded that 60-16-24-13-0-1 kg/ha NPKSZnB (T1) would be the optimum fertilizer dose of mustard for getting the highest gross margin in the charland of Bhuapur, Tangail (AEZ- 8).

Charland Eco-System
76
FERTILIZER MANAGEMENT OF HYV MUSTARD AT CHARLAND AREAS (AEZ-11)
M. N. Islam, M. S. Rahman and M. A. Hossain
Abstract The experiment was conducted at Golapnagar char of Bheramara upazilla under Kushtia district during 2011-12 to find out the economic fertilizer dose for BARI Sarisha-11. Four fertilizer doses viz., T1: 84-18-33-10-0.5-1 (AEZ 11 based), T2: 127-39-62-28-1.18-0.86 (Soil test based), T3:70-15-38-20-0-0 (Farmer practice) and T4: 0-0-0-0-0-0 (control) kg/ha NPKSZnB. Among the treatments, soil test based fertilizer dose (T2) gave the highest seed yield (1.97 t/ha) and gross return (Tk 98333/ha). But AEZ 11 based fertilizer dose (T1) produced second highest seed yield (1.85 t/ha), highest gross margin (Tk 51768/ha) and BCR (2.28). The results revealed that AEZ-11 based fertilizer dose (84-18-33-10-0.5-1 kg/ha NPKSZnB) might be suitable for mustard cultivation at Golapnagar char under Kushtia district for getting maximum profit
Introduction
Mustard is one of the major oilseeds crops that occupy 78% of the area and contribute nearly 62% of the total oilseed production in Bangladesh (BBS, 2007). Yield potential of BARISarisha-11 is higher than other varieties. But its long growth duration (105-110 days) is the major constraint to fit into boro based cropping pattern. Farmers generally grow Mungbean/sesame/groundnut in char land areas in middle of March. So they can easily grow and harvest BARI Sarisha-11 before those crops. In our previous study, BARISarisha-11 performed better in char land without hampering next crop. Now it is essential to find out optimum and economic dose of fertilizer for better yield of BARISarisha-11 at char land areas. Therefore, the experiment was conducted to find out the economic fertilizer dose for BARISarisha-11.
Materials and Methods
The trial was conducted at Golapnagar char of Bheramara upazilla under Kushtia district during rabi season of 2011-2012. Initial soil sample was analyzed and the results are presented in Table 1.
Table 1. Chemical properties of the experimental soil (initial soil) of Golapnagar char of Bheramara upazilla under Kushtia district
pH OM (%) N (%) P (µg/g) K(meq/100g) S (µg/g) Zn (µg/g) B (µg/g) 7.8 1.60 0.08 5.5 0.23 16.8 0.97 0.29
Four treatments viz T1: 84-18-33-10-0.5-1 (AEZ 11 based), T2: 127-39-62-28-1.18-0.86 (Soil test based), T3:70-15-38-20-0-0 (Farmer practice) and T4: 0-0-0-0-0-0 (control) kg/ha NPKSZnB were tested on BARISarisha-11. The trial was laid out in RCB design with three replications. Unit plot size was 5m × 4m. Half of N and full quantity of other fertilizers were applied as basal at the time of final land preparation. Seeds were sown on 02 November, 2011. Weeding and thinning was done at 16 DAS. The remaining urea was top dressed at 22 DAS followed by irrigation. The crop was harvested on 8-11 February, 2012. Data on different yield components and seed yield were analyzed statistically and the means were adjusted by LSD test.
Results and Discussion
Yield and yield components of BARI Sarisha-11 varied significantly due to fertilizer doses (Table 2). The maximum seed yield (1.97 t/ha) was recorded from T2 due to highest population

Charland Eco-System
77
and 1000-seed weight, whereas the lowest form T4. Gross return was found to be the highest (Tk 98333/ha) in T2 followed by T1 (Table 3). But gross margin (Tk 51768/ha) and BCR (2.28) were the highest in T1 due to lower cost of production.
Table 2. Yield and yield components of BARI Sarisha-11 at Golapnagar char under Kushtia district Treatment Days to
maturity Plant Popn/m2
(no.) Plant height
(cm) Siliqua/
plant (no.) Seeds/
siliqua (no) 1000 -seed wt. (gm)
Seed Yield (t/ha)
T1 101 90 130.67 141.40 12.67 3.53 1.85 T2 102 92 142.20 130.93 11.67 3.67 1.97 T3 101 84 131.27 129.47 11.53 3.50 1.68 T4 99 80 115.20 82.47 10.00 3.23 1.05 LSD (0.05) 0.018 NS 8.75 13.80 1.36 0.08 0.08 CV(%) 0.001 7.76 3.51 5.63 6.14 1.22 2.82
T1: 84-18-33-10-0.5-1 (AEZ 11 based), T2: 127-39-62-28-1.18-0.86 (Soil test based), T3:70-15-38-20-0-0 (Farmer practice) and T4: 0-0-0-0-0-0 kg/ha NPKSZnB (Control)
Table 3. Benefit-Cost analysis of BARI Sarisha-11 at Golapnagar char under Kushtia district Treatment Gross Return
(Tk/ha) Cost of production
(Tk/ha) Gross margin
(Tk/ha) BCR
T1 92333 40565 51768 2.28 T2 98333 47016 51317 2.09 T3 84000 41733 42267 2.01 T4 52333 31725 20608 1.65
Farmers’ reaction
Farmers opined that they would grow mustard variety BARISarisha-11 with fertilizer dose of 84-18-33-10-0.5-1 kg/ha NPKSZnB at Golapnagar char under Kushtia district for getting maximum profit.
Conclusion
The results revealed that AEZ 11 based fertilizer dose (84-18-33-10-0.5-1 kg/ha NPKSZnB) might be suitable for mustard cultivation at Golapnagar char under Kushtia district for getting maximum profit.
Charland Eco-System
78
ADAPTATION OF BARI RELEASED CROP VARIETIES IN CHARLAND
M. A. K. Main, M. R. Islam and J. Hossain
Abstract The adaptive trial was conducted at Koikunda of Lokhikunda union under Ishurdi upazilla of Pabna dristrict. It was the developed charland of the river Pandma and Jamuna. Four mustard varieties viz. BARI Sarisha-9, BARI Sarisha-11, BARI Sarisha-14, BARI Sarisha-15, One lentil variety viz. BARI mosur-6 and three wheat varieties normally prodip, BARI Gom-25 and BARI Gom-26 were tested in padma char. On the country, wheat variety prodip and BARI Gom-26 were tested Jmuna char. Results indicated that all mustard varieties produced substantial yield (1065-1482 kg/ha) except BARI Sarisha-9. BARI Mosur 6 also showed batter yield performance. All the wheat varieties gave good yield (2611-3379 kg/ha) in both charlands.
Introduction
Horigental expansion of crop production in normal plain land is stagnant in Bangladesh. But there is a great possibility of growing crops in adverse ecosystem lila charland. Estimated charland is about 0.82 million hectores in Bangladesh (Ahmed et.al. 1987). Due to environmental changes crop production techniques should be adapted to overcome the stress condition. Charland crop production mainly depends on rainfed cultivation. The crop suffered from available soil moisture and get stress. Suitable crop varieties which are tolerant to some moisture stress are needed to be studied. Charland is an important area where remains possibility to improve cropping system. Although the farmers’ of charland grow some crops like ground nut and some minor cereals like millets. BARI has released a good number of HYV mustard, lentil and wheat varieties. Now, there is a greater possibility of improving cropping system at charland thought adaptation of improved crop varieties along there production packages. Hence, the study was undertaken for higher productivity and validation of improved technologies at charland.
Materials and Methods
The adaptive trial was conducted at two locations of charland. One location was the charland of Koikunda of Lokhikunda union of Ishurdi, Pabna. It was the developed charland of the river of Padma. Another location was Pina (Near Kashinathpur) of Bera upa zilla of Pabna. It was the charland of river Jamuna. The names of selected farmers were Abul Kalam Azad, Abdul mannan and Allauddin Bisswas of Koikunda. Md. Rajob Ali and Md. Jahangir Hossain were the farmers of Pina. Three mustard varieties viz. BARI Sarisha-9, BARI Sarisha-11, BARI Sarisha-14 and BARI Sarisha-15; one lentil variety (BARI Mosur 6) and three wheat varieties viz. Prodip, BARI Gom-25 and BARI Gom-26 were tested in the selected farmer fields of Koikunda. Each variety mustard was grown in two bigha (66 decimal) of land. Lentil was demonstrated in eight bigha and wheat was grown in one bigha per variety. All the crop varieties were sown on 23-25 November 2011 at Koikunda. Two varieties of wheat (Prodip and BARI Gom 26) were sown on 22 November 2011 at Pina covering one bigha per farmer. The crops were grown under rainfed condition. Fertilizers were applied as basal with recommended dose of crops. Crops were harvested at the maturity. Data on yield of different crops varieties were collected.

Charland Eco-System
79
Results and Discussion
Charland of Padama (Koikunda location): Yields of different crop varieties are presented in Table 1. All mustard varieties produced the highest seed yield (1065-1482 kg/ha) except BARI Sarisha-9. Averaged yield was also higher in BARI Sarisha-11 (1482 kg/ha), BARI Sarisha-15 (1219 kg/ha) and BARI Sarisha-14 (1065 kg/ha) as compared of BARI Sarisha-9 (833 kg/ha). BARI Mosur-6 gave the yield of 1029 kg/ha. Grain yield of wheat ranged 2611-3109 kg/ha among the varieties while Prodip showed the highest grain yield of 3109 kg/ha.
Charland of Jamuna (Pila location): Two wheat varieties gave good yield (Table 2) while Prodip showed the highest yield grown yield 3379 kg/ha. Prodip produced 11% higher grown yield at charland of Jamuna.
Table 1. Yield performance of mustard, lentil and wheat varieties under rainfed condition at charland of Padma.
Crop Variety Yield (kg/ha) Mustard BARI Sarisha-9 833 BARI Sarisha-11 1482 BARI Sarisha-14 1065 BARI Sarisha-15 1219 Lentil BARI Mosur-6 1029 Wheat Prodip 3109 BARI Gom-25 2611 BARI Gom-26 2805
Table 2. Yield performance of wheat varieties under rainfed condition at Charland of Jamuna. Crop Variety Yield (kg/ha)
Wheat Prodip 3379 BARI Gom-26 3032
Conclusion
BARI released mustard varieties of BARI Sarisha-11, BARI Sarisha-15 and wheat varieties of Prodip, BARI Gom-26 and BARI Gom-25 showed better performance and cultivation might be profitable at charland of Padma and Jamuna.

Charland Eco-System
80
EFFECT OF PLANTING TECHNIQUE ON TUBER YIELD OF POTATO AT CHARLAND ECO-SYSTEM
M.N. Islam, M.S. Rahman and Sheikh Ishtiaque
Abstract The experiment was conducted at the farmers’ field of Golapnagar char under Bheramara MLT site in Kushtia district during Rabi season of 2012-13 to find out appropriate potato seed (cut or whole tuber) and spacing for higher potato production in char land eco-system. Three planting systems viz. T2 : Single eye planting (30 cm x 10 cm), T3 : Single eye double row zig zag system (10 cm/30 cm x 10 cm) and T4 : half cut tuber (30 cm x 10 cm) were compared with T1 : Recommended system of planting (60 cm x 30 cm). The highest tuber yield (30.28 t/ha), gross return (Tk 272478 /ha) and gross margin (Tk 143947/ha) were obtained from treatment T3 (single eye double row zig zag system (10 cm/30 cm x 10cm) among other treatments. The results revealed that single eye double row zig zag system with 10 cm/30 cm x 10cm spacing is better for getting higher potato yield and return than recommended planting system in char land ecosystem
Introduction
Potato (Solamun tuberosum) is the most widely grown tuber crop in Bangladesh. Farmers’ of all parts of the country grow potato. But method of potato cultivation varies from one location to other depending on yield. Particularly size and type of seed tuber is one of the major reasons for yield variation. In some areas farmers use whole tuber while in other areas they use cut tubers. Single eye planting with closer spacing of potato is a common practice of growing of potato in char areas of Kushtia district. Chars are the lands that emerge as island within the river channel or as attached land to the riverbanks as a result of dynamics of erosion and accretion in the rivers of Bangladesh. Char land areas are estimated to be 0.72 million hectares, which is about 5% of the country areas and about 6.5 million people live there (EGIS, 200). About 64 to 97% of the char areas are cultivable. Introduction of suitable HYV of different crops along with appropriate agronomic management practices would boost up the productivity of char areas. Question was whether this practice is better than recommended practice or not. With this view in mind, the experiment was conducted to find out appropriate potato seed (cut or whole tuber) and spacing for higher potato production in char land eco-system.
Materials and Methods
The experiment was conducted at farmers’ field of Golapnagar char under Bheramara MLT site in Kushtia district in Rabi season 2012-2013. The trial was laid out in RCB design with three replications. The variety was Diamant and the unit plot size was 3m x 3m. Three planting systems viz. T2 : Single eye planting (30 cm x 10 cm), T3 : Single eye double row zig zag system (10 cm/30 cm x 10 cm) and T4 : half cut tuber (30 cm x 10 cm) were compared with T1 : Recommended system of planting (60 cm x 30 cm). Chemical fertilizers were applied at the rate of 198-44-194-24-6-1.2 kg/ha of NPKSZn and B, respectively. Half of N and full dose of other fertilizers were applied as basal. The potato tuber was planted on 23 November 2012. Rest of N was top dressed at 42 days after planting (DAP) followed by irrigation. One weeding was done at 52 DAP. Another irrigation was provided at 59 DAP. Fungicide (Ridomil gold) was sprayed

Charland Eco-System
81
three times at 35, 52 and 79 DAP to prevent late blight disease. The crop was harvested on 2 to 5 March, 2013. Data on yield and yield components were recorded and analyzed statistically and the means were adjudged using LSD test. Economic analysis was also done.
Results and Discussion
Tuber yield and yield components of potato varied significantly under different planting systems (Table 1). Plant population/m2 was higher in T2, T3 and T4 over recommended planting system (T1).The highest plant population/m2 (35.55) was recorded in T3 while the lowest in T1 (6.66). But the maximum number of tuber/plant was observed in T1 (recommended planting system) compared to other treatments indicating that whole tuber seed produce more new tuber/plant. It was also found that half cut tuber seed produced more new tuber/plant than single eye seed. Tuber weight/m2 (3.03 kg) was the highest in T3 whereas the lowest tuber weight/m2 (1.87 kg) was found from T1. Inversely large size tuber (no. of tuber/kg = 21.33) was obtained from T1 and small size tuber (no. of tuber/kg = 24.33) was recorded in T3 treatment. In all the treatments, tuber size was larger than that in T1 treatment. Tuber yield was more in cut tuber seed compared to whole tuber seed. The highest tuber yield (30.28 t/ha) was recorded in treatment T3 (Single eye double row zig zag system: 10 cm/30 cm x 10cm) and the lowest in T1 (18.75 t/ha). As a result, maximum gross return (Tk 272478/ha) and gross margin (Tk 143947/ha) were found in treatment T3 which was close to T2 (Table 2). The results revealed that single eye double row zig zag system with 10 cm/30 cm x 10cm spacing is better for getting higher potato yield and return than recommended planting system in char land ecosystem.
Table 1. Yield and yield components of potato at char land eco-system Treatments Plant population/
m2 No. of Tuber/
plant Tuber
wt/m2 (kg) No. of
Tuber /kg Yield (t/ha)
T1 =Recommended system of planting (60 cm x 30 cm)
6.66 7.20 1.87 21.33 18.75
T2=Single eye planting (30 cm x 10 cm)
24.16 4.80 2.69 21.67 26.94
T3=Single eye double row zig zag system (10 cm/30 cm x 10cm)
35.55 3.67 3.03 24.33 30.28
T4=Half cut tuber (30 cm x 10 cm) 10.74 6.00 2.20 22.33 22.00 LSD (0.05) 1.16 0.92 0.15 1.91 1.59 CV (%) 3.02 8.46 3.27 4.27 3.27
Table 2. Economic performance of potato at char land eco-system Treatments Gross return (Tk/ha) Total Variable cost
(Tk/ha) Gross margin
(Tk/ha) T1 =Recommended system of planting (60 cm x 30 cm)
1,68,720 1,24,388 44,333
T2=Single eye planting (30 cm x 10 cm)
2,42,460 1,24,785 1,17,675
T3=Single eye double row zig zag system (10 cm/30 cm x 10cm)
2,72,478 1,28,531 1,43,947
T4=Half cut tuber (30 cm x 10 cm) 1,98,000 1,24,388 73,613
Market price (Tk/kg): Potato : 9/-

Charland Eco-System
82
Farmers’ reaction
Farmers in char land area choose single eye double row zig zag system with10 cm/30 cm x 10 cm spacing than other planting systems due to its higher yield and return.
Conclusion
Potato cultivation under single eye double row zig zag system with10 cm/30 cm × 10 cm spacing was more profitable compared to other planting systems in char land eco-system. This is a first year experiment. It should be repeated for confirmation the results.

Charland Eco-System
83
A DA PT I V E T R A I L S W I T H B A R I H Y B R I D M A I Z E V A R I E T I E S I N C H A R L A NDS
M.N. Islam, M. S. Rahman and Sheikh Ishtiaque
Abstract The experiment was carried out at the farmers’ field of Golapnagar char at MLT site of Bheramara under Kushtia district during Rabi season of 2012-13 to evaluate the field performance of different BARI Hybrid maize varieties and to popularize BARI Hybrids to farmers’ field under charland condition. BARI Hybrid maize-5, BARI Hybrid maize-7, BARI Hybrid maize-9 and Pacific 11 were tested at farmers’ field. Results indicated that BARI Hybrid maize-9 performed better and produced the highest grain yield (7.53 t/ha) among the varieties. This variety also gave the highest returns (Gross return: Tk 129340 /ha) and gross margin (Tk 42190 /ha).
Introduction
BARI Hybrid maize can play a vital role for increasing maize area and production in the country by using normal plain lands as well as unexploited charlands. Farmers get locally produced Hybrid maize seed in due time with low price compared to imported one(s). This will ultimately save a lot of foreign currency of the country. Therefore, as much as possible number of adaptive trails with BARI Hybrid maize varieties needs to be evaluated in farmer’s field under charland condition. So that, they can cultivate, choose and acquaint with BARI Hybrid maize. This will ultimately help the poor farmers. Besides, actual potentiality and performance of BARI Hybrids could be observed in farmer’s field under charland condition. With this view in mind, the experiment was undertaken to evaluate the field performance of different BARI Hybrid maize varieties and to popularize BARI Hybrids to farmers’ field under charland condition.
Materials and Methods
The experiment was conducted at farmers’ field of Golapnagar char under Bheramara upazilla in Kushtia district during Rabi season of 2012-13. Three BARI Hybrid maize (BARI Hybrid maize-5, BARI Hybrid maize-7, BARI Hybrid maize-9) were evaluated against imported Hybrids (Pacific 11). The experiment was laid out in RCB design with three replications. Unit plot size was 6m × 5m. Fertilizer was applied @ 250, 50, 120, 40, 5 and 1 kg/ha of NPKSZn and B, respectively. One third of urea was applied as basal dose The seeds were sown on 16 November, 2012 with spacing of 60cm × 20cm. The rest of urea were applied in two equal splits at knee height stage (41 DAT) and before flowering stage (71 DAT). Weeding was done one time at 32 DAT. The crop was irrigated 5 times at 40, 70, 91,115 and 130 DAT. The crop was harvested at 13-14 April, 2013. Data on yield and yield contributing characters were analyzed statistically and the means were adjudged using LSD test. Economic analysis was also done.
Results and Discussion
Yield and yield components of Hybrid maize varieties are shown in Table 1. Plant population/m2 of different maize Hybrids varied significantly and the lowest population (7.87) was observed in BARI Hybrid maize-5 due to some seedling mortality. But in other maize Hybrids population was identical ((8.15-8.24). Plant height also differed significantly. The tallest plant was observed in BARI Hybrid maize-9 (204.53 cm) and shortest in Pacific 11 (162.27 cm). In BARI Hybrid maize-

Charland Eco-System
84
5 and BARI Hybrid maize-7, plant height was similar. Number of grains/cob was the highest in BARI Hybrid maize-9 (476.0) while the lowest in pacific 11 (387.93) but in BARI Hybrid maize-5 and BARI Hybrid maize-7, number of grains/cob was at par. Grain size of all study maize Hybrids was identical. Grain yield differed significantly. BHM 9 produced the highest grain yield (7.53 t/ha) which was at par with Pacific 11 (7.39 t/ha). The lowest yield was found in BARI Hybrid maize-5 (6.50 t/ha). Based on economic analysis, gross return (Tk 129340/ha) and gross margin (Tk 42190/ha) were the highest in BHM 9 among all maize Hybrids (Table 2).
Table 1.Yield and yield components of different maize varieties at farmers’ field of char area Treatment Days to
maturity Plant
population / m2
Plant height (cm)
No. of grain/ cob
100 Grain wt (gm)
Grain yield t/ha
Stover yield/ t/ha
BARI Hybrid maize-5 149 7.87 181.73 411.73 29.33 6.50 8.14 BARI Hybrid maize-7 149 8.15 180.80 400.00 29.00 6.67 8.15 BARI Hybrid maize-9 150 8.24 204.53 476.00 29.67 7.53 8.19 Pacific 11 150 8.24 162.27 387.93 30.67 7.39 8.13 LSD (0.05) NS 0.28 4.06 25.12 NS 0.326 0.06 CV (%) 0.29 2.04 1.12 3.00 3.03 2.34 0.28
Table 2. Economic performance of maize Hybrids at char land eco-system Treatment Gross return (Tk/ha) Total variable cost (Tk/ha) Gross margin (Tk/ha)
BARI Hybrid maize-5 113748 87150 26598
BARI Hybrid maize-7 116287 87150 29137
BARI Hybrid maize-9 129340 87150 42190
Pacific 11 127118 88275 38843
Farmers’ reaction
Farmers’ reactions were positive for BARI Hybrid maize-9 due to its higher yield. Seed germination rate was good. Market price of BARI Hybrid seed was low compared to imported one. They are interested to cultivate BARI Hybrid maize-9 in next time. But seed was not available in the local market.
Conclusion
BARI Hybrid maize-9 was more profitable than all other maize Hybrids.

Charland Eco-System
85
FERTILIZER MANAGEMENT OF GROUNDNUT AT CHARLAND ECO-SYSTEM IN TANGAIL
M.N. Islam and M.Z. Ali
Abstract An experiment was conducted at farmers’ field of Bhuapur char under MLT site, Tangail during Rabi 2012-13 to find out optimum fertilizer dose of groundnut. Four fertilizer packages viz T1: 12-32-43-54-2 kg ha-1 N-P-K-S-B (based on BARI), T2: 47-38-25-15-0.5 kg ha-1 N-P-K-S-B (based on soil test), T3: 7-1-2-0-0-0 kg ha-1 N-P-K-S-B (Farmers’ practice) and T4: Native fertility (control) were tested on BARI Cheeenabadam-8. Among fertilizer packages, T2: 47-38-25-15-0.5 kg ha-1 N-P-K-S-B (based on soil test) gave the highest seed yield (2.59 t ha-1) which was 135.45% over control. The highest gross return (Tk. 77,700 ha-1) and gross margin (Tk. 43,892 ha-1) were also obtained from T2: 47-38-25-15-0.5 kg ha-1 N-P-K-S-B (based on soil test). The results revealed that soil test based fertilizer dose i.e. 47-38-25-15-0.5 kg ha-1 N-P-K-S-B is optimum for growing BARI Cheeenabadam-8 at charland of Bhuapur, Tangail.
Introduction
Groundnut (Arachis hupogaea L.) is one of the important oilseed crops in Bangladesh. It ranks first in case of yield and third in case of area and production among the edible oilseed crops. It contributes about 9% of total oilseed production. It can fix atmospheric nitrogen and improve soil health by adding it. Chars are the lands that emerge as island within the river channel or as attached land to the riverbanks as a result of dynamics of erosion and accretion in the rivers of Bangladesh. Char land areas are estimated to be 0.72 million hectares, which is about 5% of the country area and about 6.5 million people live there (EGIS, 2000). About 64 to 97% of the char areas are cultivable. Farmers of char land generally cultivate their local variety of wheat, maize, lentil, grass pea, sesame, Mungbean, groundnut, tobacco etc. As a result, they get low yield. BARI has developed some high yielding varieties of groundnut. So, introduction of suitable HYV groundnut along with appropriate agronomic practices would boost up the productivity of char areas and the country will be benefited. Char land soil is deficient in plant nutrients. Moreover, calcium is essential for pegging of groundnut. Generally farmers grow groundnut with little or without fertilizers. Moreover, they do not use any calcium containing fertilizer. Hence, the experiment was conducted to find out optimum fertilizer packages for groundnut at char land eco-system of AEZ 8.
Materials and Methods
The trial was conducted at farmers’ field of Bhuapur char under MLT site, Tangail (AEZ- 8) during the Rabi 2012-13. The soil of the experimental field was silty loam in texture with pH 6.97 belonging to Grey Floodplain soil (AEZ- 8). Soil samples from experimental plots were collected and analyzed. The physical and chemical properties of soil of experimental field are presented in Table 1.
Table 1. Physical and chemical properties of soil of experimental field (Bhuapur char, Tangail) Location AEZ pH OM
(%) Total N (%)
Available P(µg/ml)
Exchaneable K (meq/100g soil)
Available S (µg/ml)
Available B(µg/ml)
Bhuapur char land
8 6.97 1.48 VL
0.067 VL
4.39 VL
0.181 M
15.46 M
0.248 M

Charland Eco-System
86
Location AEZ pH OM (%)
Total N (%)
Available P(µg/ml)
Exchaneable K (meq/100g soil)
Available S (µg/ml)
Available B(µg/ml)
Critical levels - - - 14 0.20 14 0.20
The trial was laid out in RCB design with three disperse replications. Unit plot size was 3 m x 4 m. Four fertilizer packages viz., T1: 12-32-43-54-2 kg ha-1 N-P-K-S-B (based on BARI), T2: 47-38-25-15-0.5 kg ha-1 N-P-K-S-B (based on soil test). T3: 7-1-2-0-0-0 kg ha-1 N-P-K-S-B (Farmers’ practice) and T4: Native fertility (control) was tested on BARI Cheeenabadam-8. Fertilizers were applied as per treatments. Half of nitrogen and full quantity of P K S B were applied at the time of final land preparation in the form of urea, triple super phosphate, muriate of potash, gypsum and boric acid, respectively. Remaining N were top dressed at flowering stage and covered with soil followed by irrigation. The seeds were sown on 11 November 2012 in line with 30 cm x 15 cm spacing (seed rate 100 kg ha-1). Irrigation, pests and other crop management practices were done as and when necessary. The crop was harvested on 22 April 2013. The data on different plant characters and yield components were taken from randomly selected 10 plants from each plot. Seed yield were recorded from 2 m2 central area from each plot. Collected data were analyzed statistically and means were adjudged by LSD test at 5% level of significance. Economic analysis was also done.
Results and Discussion
Plant population m-2, effective pods plant-1, seeds pod-1, 1000- seed weight and seed yield of groundnut under different fertilizer management differed significantly (Table 2). The highest plant population m-2 (23.89) was recorded in T2 treatment which was identical with T1
(22.89) and T3 (20.55). The lowest plant population m-2 (18.89) was obtained from T4
treatment. The highest number of effective pods plant-1 (19.43) was obtained from T2 treatment which was statistically identical with T1 treatment (17.33) (based on BARI). The lowest number of effective pods plant-1 (10.37) was recorded from T4 treatment (Control) which was at par with T3 treatment i.e. farmers’ practice (12.70). The highest number of seeds pod-1 (1.85) was recorded in T2 treatment which was at par with T1 treatment (1.72) and T3 treatment (1.48). The lowest number of seeds pod-1 (1.25) was recorded in T4 treatment (Control). The highest 1000 seed weight (566.33g) was obtained from T2 treatment which was statistically similar with T1 treatment (563.33 g). The lowest 1000 seed weight was obtained from T4 treatment (515.0 g). Among the different fertilizer managements, the highest nut yield (2.59 t ha-1) was recorded from T2 treatment (based on soil test basis) which was 135.45% higher over control. The lowest nut yield (1.10 t ha-1) was obtained from T4 treatment (native fertility).
Cost and return
Gross return (Tk.77, 700ha-1) and gross margin (Tk. 43,892 ha-1) were higher in soil test based fertilizer packages (47-38-25-15-0.5 kg ha-1 N-P-K-S-B). The lowest gross return (Tk. 33,000 ha-1) and gross margin (Tk 9,875 ha-1) were found from the control plot (native fertility).

Charland Eco-System
87
Table 2. Yield and yield components of BARI Chinabadam-8 under different fertilizer management at char land of Bhuapur
Treatment Plant m-2 (no.)
Pods plant-1 (no.)
Seeds pod-1 (no.)
1000 seed wt. (g)
Nut yield (t ha-1)
Yield incrase over control (%)
T1 22.89 17.33 1.72 563.33 2.15 95.45 T2 23.89 19.43 1.85 566.33 2.59 135.45 T3 20.55 12.70 1.48 537.00 1.29 17.27 T4 18.89 10.37 1.25 515.00 1.10 - LSD (0.05) 2.51 2.49 0.09 10.19 0.24 - CV (%) 5.84 8.32 3.10 0.94 6.75 -
Table 3. Cost and return analysis of BARI Chinabadam-8 at char land of Bhuapur, Tangail Treatment Nut yield
(Kg ha-1) Gross return
(Tk. ha-1) Cost of production (Tk. ha-1) Gross margin
(Tk. ha-1) T1 2150 64,500 31,505 32,995 T2 2590 77,700 33,808 43,892 T3 1290 38,700 23,580 15,120 T4 1100 33,000 23,125 9,875
Market price (Tk kg-1): Groundnut= 30/-
T1: 12-32-43-54-2 kg ha-1 N-P-K-S-B (based on AEZ), T2: 47-38-25-15-0.5 kg ha-1 N-P-K-S-B (based on soil test), T3: 7-1-2-0-0-0 kg ha-1 N-P-K-S-B (Farmers’ practice) and T4: Native fertility (control).
Farmers’ opinion
Farmers opined that they would grow BARI Cheeenabadam-8 along with 47-38-25-15-0.5 kg ha-1 N-P-K-S-B (Based on soil test) in the next year for getting higher yield.
Conclusion
The results indicated that BARI Cheeenabadam-8 along with 47-38-25-15-0.5 kg ha-1 N-P-K-S-B (Based on soil test) may be optimum for large scale production in the char land area of Bhuapur, Tangail (AEZ- 8) and other extrapolation areas.

Charland Eco-System
88
PERFORMANCE OF HYV POTATO IN CHAR LAND ECO-SYSTEM
M.N. Islam and S. Rahman
Abstract
The experiment was conducted at Golapnagar char of the Padma River under Bheramara Upazilla in Kushtia district (AEZ-11) during rabi season of 2012-13 to find out suitable and adaptable modern potato varieties in charland areas under climate change situation. Three BARI developed potato varieties viz: BARI Alu-7 (Diamant), BARI Alu-8 (Cardinal) and BARI Alu-31 (Sagita) and Belgium (farmers practicing variety) were studied in this trial. BARI Alu-7 (Diamant), produced the highest tuber yield (27.82 t/ha) which was identical with BARI Alu-8 (Cardinal). These two varieties produced 21.2 to 33.9% higher tuber yield over Belgium (farmers practicing variety). The results revealed that BARI Alu-7 (Diamant) and/or BARI Alu-8 (Cardinal) could be grown in char land areas under climate change situation.
Introduction
Potato (Solanum tuberosum L.) is one of the important vegetables in Bangladesh which can be used throughout the year. It is cultivated almost all parts of the country and plays an important role in human diet. Bangladesh has 0.82 million ha of char land and most of the cultivable land of char areas are suitable for potato cultivation. In char areas, farmers grow locally available potato varieties which are low yielded than BARI developed varieties. As a result, farmers realize low yield and become loser. BARI has developed a large number of modern potato varieties and these are need to be tested whether those varieties are adaptable or not in char areas under climate change situation. Hence, this experiment was conducted to find out suitable and adaptable modern potato varieties in charland areas under climate change situation.
Materials and Methods
The experiment was conducted at Golapnagar char of the Padma River under Bheramara Upazilla in Kushtia district (AEZ-11) during rabi season of 2012-13. The soil of the experimental field was silty loam in texture with pH 7.04 belonging to Calcareous Dark Grey Floodplain soil (AEZ-11). Soil samples from experimental plots of Golapnagar char were collected from 0-20 cm depth prior to fertilization and analyzed in the laboratory. Chemical properties of soil of experimental field are presented in Table 1.
Table 1. Physical and chemical properties of soil of experimental field (Golapnagar char) Location pH OM
(%)
Total N (%)
Available P
(µg/ml)
Exchange- able K
(meg/100g)
Available S
(µg/ml)
Available B
(µg/ml) Golapnagar char 7.04 1.34 0.070 5.66 0.188 5.64 0.377 Critical levels - - - 14 0.20 14 0.2
The trial was laid out in a RCB design with five disperse replications. The unit plot size was 8 m x 10 m. Three BARI developed potato varieties viz. BARI Alu-7 (Diamant), BARI Alu-8 (Cardinal) and BARI Alu-31 (Sagita) were evaluated for their adaptability and compared with Belgium (farmers practicing variety) in char land under climate change situation. Potato tubers were planted on 20 November, 2012 with 60 cm x 25 cm spacing. The crop was fertilized with

Charland Eco-System
89
Fig 1. Relationship between tubers/plant and tuber yield of potato varieties
y = 2.0867x + 7.2475R2 = 0.97
15
20
25
30
5 6 7 8 9 10
Number of tubers/plant
Tube
r yie
ld (t
/ha)
Fig 2. Relationship between tuber wt/plant and tuber yield of potato varieties
y = 0.0534x - 0.054R2 = 1
15
20
25
30
350 400 450 500 550 600
Tubers weight/plant (g)
Tube
r yie
ld (t
/ha)
198-44-194-24-6-1.2 kg/ha NPKSZnB. Half of N and full dose of other fertilizers were applied as basal in the form of urea, triple super phosphate, muriate of potash, gypsum, zinc sulphate and boric acid, respectively. The remaining N was top dressed at 30 days after potato planting followed by irrigation. Earthing up of potato and other intercultural operations were done as and when required. The crop was harvested on 25 February, 2013. Yield components of potato were taken from randomly selected 5 plants from each plot. Yield was taken from whole plot. Data on yield and yield components was analyzed statistically and the means were adjudged using LSD test at 5% level of significance.
Results and Discussion
Number of tubers/plant, tuber weight/plant, single tuber weight and tuber yield/ha of potato varieties differed significantly (Table 2). Tuber producing capacity of potato varieties is different. BARI developed potato varieties were superior to Belgium (farmers practicing variety) in respect of tubers/plant. The maximum number of tubers/plant (9.6) was recorded in BARI Alu-7 which was identical with BARI Alu-8 (8.9). On the other hand, the minimum number of tubers/plant (6.4) was found from Belgium. A strong linear relationship was existed between number of tubers/plant and yield and 97% of the total variation in yield could be explained by the differences in number of tubers/plant (Fig 1). Tuber weight/plant of BARI potato varieties was more than Belgium variety. The highest tuber weight/plant (522g) was found from BARI Alu-7. Tuber weight/plant of BARI Alu-8 (473g) and BARI Alu-31 (460 g) was at par while the lowest in Belgium (390 g).
Tuber weight/plant directly contributed to the variation in yield of potato varieties. It was estimated that 100% of the total variation in yield could be explained by the differences in tuber weight/plant (Fig 2). Single tuber weight indicates the tuber size of potato varieties. The largest size tuber (60.9 g) was obtained from Belgium potato variety. On the contrary, tuber size of BARI potato varieties (53.1-55.4 g) was identical and significantly lower than Belgium potato variety.

Charland Eco-System
90
Table 2. Yield and yield contributing characters of potato varieties at char land eco-systems under climate change situation.
Varieties Plant/m2 (no.)
Tuber/plant (no.)
Tuber wt /plant
(g)
Single tuber wt
(no.)
Tuber yield (t/ha)
Yield increase over local
(%) BARI Alu-7 (Diamant) 6.66 9.6 522 54.4 27.82 33.9 BARI Alu-8 (Cardinal) 6.66 8.9 473 53.1 25.18 21.2 BARI Alu-31 (Sagita) 6.66 8.3 460 55.4 24.50 18.0 Local (Belgium) 6.66 6.4 390 60.9 20.77 - LSD (0.05) - 0.7 33 3.8 3.11 - CV (%) - 6.5 5.2 4.9 9.2 -
Tuber yield of potato varieties varied significantly and the highest tuber yield (27.82 t/ha) was realized from BARI Alu-7 which was at par with BARI Alu-8 (25.18 t/ha). The higher tuber yield in the aforesaid variety was occurred due to higher yield components (Abdullah et al., 2009). Belgium potato variety produced the lowest tuber yield (20.77 t/ha). Tuber yield of BARI potato varieties was 18.0-33.9% higher than Belgium potato variety. The results revealed that BARI Alu-7 exhibited the best performance in char land eco-systems under climate change situation. Alternately, BARI Alu-8 might be grown in char land areas.
Conclusion
It might be concluded that BARI Alu-7 followed by BARI Alu-8 would be recommended for cultivation in char land eco-systems under climate change situation.

Charland Eco-System
91
ADAPTATION OF BARI RELEASED CROP VARIETIES IN CHARLAND
M. A. K. Main, M. R. Islam and J. Hossain
Abstract The adaptive trial was conducted at two locations of charland of the river Pandma and Jamuna. Among the three mustard varieties, BARI Sarisha-11 gave the highest yield (1252kg/ha). Wheat varieties of Prodip, BARI Gom-25 and BARI Gom-26 showed better performance at charland of Padma (3861-4220 kg/ha) and Jamuna (3583-4182 kg/ha).
Introduction
Due to environmental changes crop production techniques should be adapted to overcome the stress condition. Charland crop production mainly depends on rainfed cultivation. The crop suffered from available soil moisture and get stress. Suitable crop varieties which are tolerant to some moisture stress are needed to be studied. Charland is an important area and have possibility to improve cropping system. Although the farmers’ of charland grow some crops like ground nut and some minor cereals like millets but have greater scope of adaptation of BARI released crop varieties. Full package of important crop varieties are needed to adapt at charland for higher productivity and validation of approved technologies. Henceforth the study was undertaken.
Materials and Methods
The adaptive trial was conducted at two locations of charland. One location was the charland of Koikunda, Lokhikunda union of Ishurdi, Pabna. It was the developed charland of the river of Padma. Another location was Pina (Near Kashinathpur) of Bera upa zilla of Pabna. It was the charland of river Jamuna. The names of selected farmers were Abul Kalam Azad and Md. Sultan of Koikunda. Abdul Mozid and Md. Jamsed Ali were the farmers of Pina. Three mustard varieties like BARI Sarisha-9, BARI Sarisha-11 and BARI Sarisha-16 and three wheat varieties viz. Prodip, BARI Gom-25 and BARI Gom-26 were grown among the selected farmer fields of Koikunda. Each variety of mustard was grown in three bigha of land and wheat was grown in four bigha per variety. All the crop varieties were sown on 24-25 November 2012 at Koikunda. Three varieties of wheat (Prodip, BARI Gom-25 and BARI Gom-26) were sown on 20 November 2012 at Pina covering four bigha per farmer. Crops were sown under residual soil moisture. Two irrigations were applied (25 and 50 DAS) in wheat and no irrigation was applied in mustard. Fertilizers were applied as per recommendation for the crops. All fertilizers were applied as basal. Only half N was top dressed in wheat just after first irrigation. Yields of different crop varieties were collected.
Results and Discussion
Charland of Padama (Koikunda location)
Yields of different mustard and wheat varieties have been presented in Table 1. BARI Sarisha-11 produced the highest yield (1252 kg/ha) and other two varieties gave lower yield (782-987 kg/ha) under rainfed condition. Grain yield of wheat was 4220, 3861 and 3942 kg/ha, respectively in Prodip, BARI Gom-25 and BARI gom-26 varieties in irrigated condition. Prodip showed better performance as compared to BARI Gom-25 and BARI Gom-26.
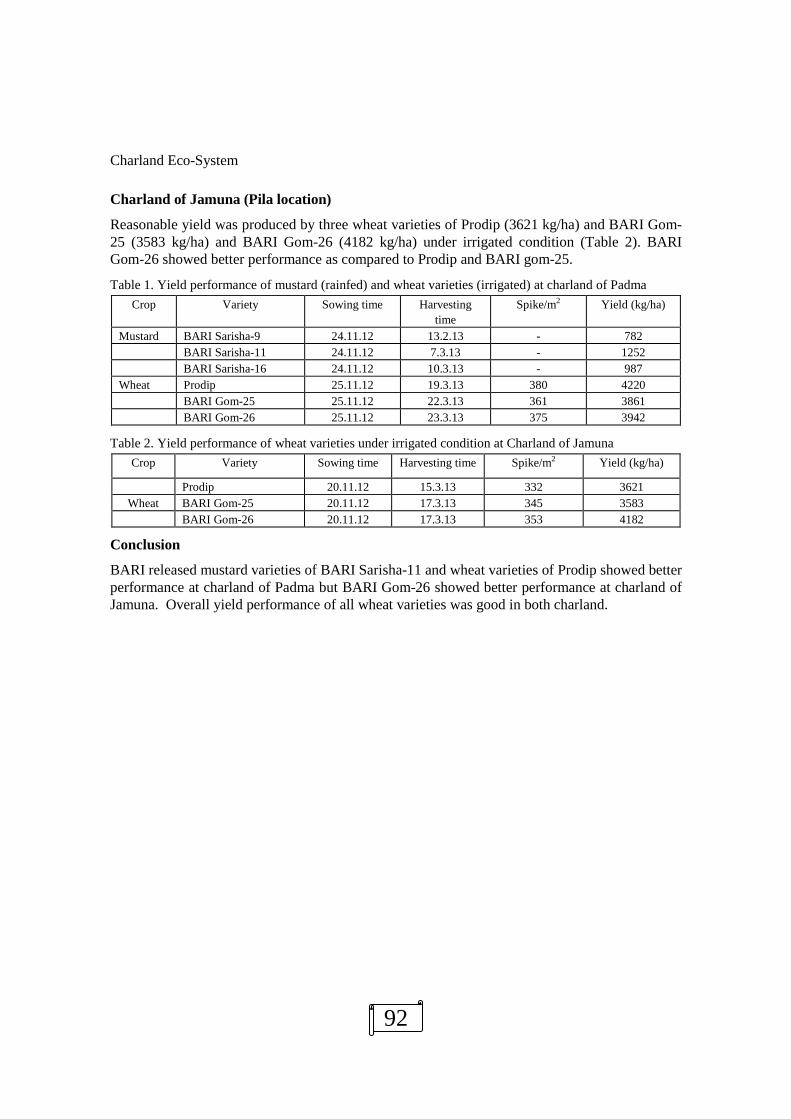
Charland Eco-System
92
Charland of Jamuna (Pila location)
Reasonable yield was produced by three wheat varieties of Prodip (3621 kg/ha) and BARI Gom-25 (3583 kg/ha) and BARI Gom-26 (4182 kg/ha) under irrigated condition (Table 2). BARI Gom-26 showed better performance as compared to Prodip and BARI gom-25.
Table 1. Yield performance of mustard (rainfed) and wheat varieties (irrigated) at charland of Padma Crop Variety Sowing time Harvesting
time Spike/m2 Yield (kg/ha)
Mustard BARI Sarisha-9 24.11.12 13.2.13 - 782 BARI Sarisha-11 24.11.12 7.3.13 - 1252 BARI Sarisha-16 24.11.12 10.3.13 - 987 Wheat Prodip 25.11.12 19.3.13 380 4220 BARI Gom-25 25.11.12 22.3.13 361 3861 BARI Gom-26 25.11.12 23.3.13 375 3942
Table 2. Yield performance of wheat varieties under irrigated condition at Charland of Jamuna Crop Variety Sowing time Harvesting time Spike/m2 Yield (kg/ha)
Prodip 20.11.12 15.3.13 332 3621 Wheat BARI Gom-25 20.11.12 17.3.13 345 3583
BARI Gom-26 20.11.12 17.3.13 353 4182
Conclusion
BARI released mustard varieties of BARI Sarisha-11 and wheat varieties of Prodip showed better performance at charland of Padma but BARI Gom-26 showed better performance at charland of Jamuna. Overall yield performance of all wheat varieties was good in both charland.
Charland Eco-System
93
PERFORMANCE OF GARLIC VARIETIES AT DIFFERENT SOWING TIME IN CHAR AREA OF NORTHERN REGION
M. A. I. Sarker and M. A. Mannaf
Abstract A field experiment was conducted at the char area of Mornea, Gangachara, Rangpur under ARS, Burirhat, Rangpur during rabi season 2012-13. The objective of the work was to observe the yield performance of different varieties of garlic in different planting dates at char areas of northern region. The experiment was carried out in split plot design with three replications. Five sowing dates viz. 30 October, 15 November, 30 November, 15 December and 30 December were assigned in main plot and three varieties viz. V1: BARI Roshun-1; V2: BARI Roshun-2 and V3: local were in sub plots. The highest (5.53 t/ha) yield was recorded from BARI Roshun-1 which was statistically similar with local variety and the lowest (4.76 t/ha) from BARI Roshun-2.With the delay in planting time from Oct.30 yield was decreased. The highest (5.53) bulb yield was recorded when planting was done on Oct.30 and the lowest (3.22 t/ha) was obtained from Dec.30.All the garlic varieties performed better in October 30 planting. BARI Roshun-1 also performed better in Nov 15 planting.
Introduction
Garlic (Alium sativum) is one of the important spices in Bangladesh, it is important both for its culinary and medicinal uses. The total annual production of garlic in the country is very low due to use of low yielding varities with poor management practices. However, a vast area of Rangpur district is under char land. Char are newly developed lands in different riverbeds and basins that comprise the area of approx. 0.83 million hectare. Flood, flooding depth and period of flooding mainly govern the selection of crops and crop duration. Farmers of char areas grow crops after receding of flood water. Farmers of this area are cultivating local varieties of Garlic which is poor yielder and susceptible to pest and disease. Recently, BARI has developed high yielding varieties of garlic. Introduction of these varieties in the char land may increase the yield and income of the farmers. Hence, the performances of these varieties need to be evaluated in the char areas of northern region.
Materials and Methods
The experiment was conducted at the char area of Mornea, Gangachara, Rangpur under ARS, Burirhat, Rangpur during rabi season 2012-13. The experiment was carried out in split plot design with three replications. Five sowing dates viz. 30 October, 15 November, 30 November, 15 December and 30 December were assigned in main plot and three varieties viz. BARI Roshun-1; BARI Roshun-2 and local were in sub plots. The fertilizers were applied at the rate of 120-60-160-40-4 kg/ha of N P K S and Zn. Half of urea and all other fertilizers were applied as basal during final land preparation. Remaining urea were applied as top-dress in two equal splits at 25 and 50 days after sowing. Size of the plots was 4m x 3m and spacing was 20cm x 10cm. Intercultural operations were done as per needed. Daily maximum and minimum temperatures were recorded from October 2012 to May 2013. The average temperature of the growth period (sowing to physical maturity) of the tested crop have been calculated (Table 1). Data on yield and yield attributes were recorded.

Charland Eco-System
94
Results and Discussion
Effect of variety
Different varieties of garlic showed significant variations in plant height, single bulb weight, number of cloves/bulb and yield (Table2). The tallest plant (49.79cm) was obtained in BARI Roshun-1 and the shortest (43.68) was in local variety. Significantly the highest bulb weight (15.95g) and number of cloves were recorded in BARI Roshun-1. The highest (5.53 t/ha) bulb yield was found in BARI Roshun-1 which was statistically similar with local variety and the lowest (4.76 t/ha) from BARI Roshun-2.
Effect of sowing time
Plant height, number of leaves/plant, single Bulb weight, number of cloves/bulb and yield were differed significantly by sowing time (Table 3). 15 October planting showed significantly the highest value of plant height (57.36 cm), number of leaves/plant (8.12), single bulb weight (18.77), number of cloves/bulb (21.92) and yield (6.80 t/ha). In early planting, plants attained higher vegetative growth which possibly led to the development of larger bulb and higher yield. In 30 December planting, produced smaller bulbs that resulted in lower yield (3.22 t/ha).
Effect of Interaction
Interaction effect of varieties and sowing times showed significant variations on single bulb weight, number of cloves/bulb and yield (Table 4). The heavier bulb was recorded in BARI Roshun-1 in Oct 30 planting which was identical with all varieties at the same planting. The maximum number of cloves/bulb was recorded in BARI Roshun-2 in 30 October planting which was followed by BARI Roshun-1 and Local at the same date of planting. The highest bulb yield (6.95 t/ha) was obtained from BARI Roshun-1 in 30 October planting which was identical with BARI Roshun-2 and Local variety at the same planting date, and BARI Roshun-1 in 15 November planting. The lowest bulb yield (2.85 t/ha) was obtained from BARI Roshun-2 at 30 December planting. The mean temperature was maximum (21.9°C) in 30 December planting (Table 1). The reduction in bulb yield in late sowing might be due to prevailing high temperature.
Conclusion
From the above findings it may be concluded that BARI Roshun -1 is the higher bulb yielder than others for char area of northern region. 30 October was the best planting time for all the garlic varieties with the flexibility for BARI Roshun-1 up to 15 November. The results need further trial for confirmation. Table1. Average temperature (0C) of growth period of the tested crop under different planting dates in
2012-13 Planting dates Minimum Maximum Mean 30 October 14.2 26.3 20.3 15 November 14.6 26.4 20.5 30 November 15.2 27.2 21.2 15 December 15.6 27.4 21.5 30 December 15.8 28.0 21.9

Charland Eco-System
95
Table 2. Effect of variety on yield and yield contributing characters of garlic varieties at char area, Mornea, Gangachara, Rangpur under ARS, Burirhat, Rangpur during rabi season 2012-13.
Treatment Plant height (cm)
Leaves/plant (no.)
Single Bulb wt. (g)
Cloves/bulb (no.)
Yield (t/ha)
V1= BARI Roshun-1 49.79 6.71 15.95 20.05 5.53 V2= BARI Roshun-2 49.25 7.04 14.46 19.32 4.76 Local 43.68 6.60 14.62 19.94 5.30 LSD (0.05) 3.03 NS 0.76 0.48 0.36 CV (%) 4.26 8.82 6.24 2.37 5.24
Table 3. Effect of sowing time on yield and yield contributing characters of garlic varieties at char area, Mornea, Gangachara, Rangpur under ARS, Burirhat, Rangpur during rabi season 2012-13.
Treatment Plant height (cm)
Leaves/plant (no.)
Single Bulb wt. (g)
Cloves/bulb (no.)
Yield (t/ha)
S1= October 30 57.36 8.12 18.77 21.92 6.80 S2 = November 15 52.73 7.71 16.77 20.89 6.38 S3 =November 30 48.14 6.97 14.84 20.76 5.36 S4 =December 15 42.08 5.86 13.25 18.28 4.21 S5 =December 30 37.56 5.26 11.42 16.99 3.22 LSD (0.05) 1.97 0.65 0.91 0.46 0.27 CV (%) 4.26 8.82 6.24 2.37 5.24
Table 4. Interaction effect of varieties and sowing times on yield and yield contributing characters of garlic varieties at char area of Mornea, Gangachara, Rangpur under ARS, Burirhat, Rangpur during rabi season 2012-13.
Treatment Plant height (cm)
Leaves/plant (no.)
Single Bulb wt. (g)
Cloves/bulb (no.)
Yield (t/ha)
S1 X V1 60.53 7.98 19.54 21.90 6.95 S1 X V2 61.13 8.63 18.53 22.40 6.56 S1X V3 56.43 7.74 18.23 21.47 6.89 S2 X V1 56.00 7.53 18.26 21.47 6.65 S2 X V2 52.73 8.15 15.87 20.57 6.16 S2 X V3 49.47 7.45 14.87 20.63 6.04 S3 X V1 51.03 6.47 15.96 19.87 5.94 S3 X V2 48.37 7.33 14.70 21.00 4.55 S3 X V3 45.03 7.10 15.17 21.42 5.90 S4 X V1 42.17 6.21 14.16 19.30 4.54 S4 X V2 42.67 5.90 13.17 16.50 3.67 S4 X V3 35.39 5.48 13.43 19.03 4.43 S5 X V1 39.20 5.35 11.83 17.70 3.59 S5 X V2 41.37 5.21 10.05 16.15 2.85 S5 X V3 32.10 5.23 11.47 17.13 4.23 LSD (0.05) NS NS 0.48 0.36 0.47 CV (%) 4.26 8.82 6.24 2.37 5.24

Charland Eco-System
96
FERTILIZER MANAGEMENT OF HYBRID MAIZE AT CHAR LAND ECO-SYSTEM
M. A. I. Sarker, M.N. Islam and.M. A. Mannaf
Abstract The experiment was conducted at char area of Mornea, Gongachara, Rangpur under ARS, BARI, Burirhat during rabi season 2012-13. Four fertilizer managements viz. T1 : Recommended dose (250-55-110-40-4-2 kg/ha of NPKSZnB), T2 : AEZ based (196-36-75-30-2-1 kg/ha of NPKSZnB), T3 : Soil test based (189-30-79-46-1.5 kg/ha of NPKSZn) T4 : Farmer’s practicing dose(171-23-56-10-8-3 kg/ha of NPKSZnB) for Hybrid maize were tested in RCB design with 3 replications. The results revealed that the recommended fertilizer dose performed better yield of maze which was statistically similar with soil test based fertilizer dose. The highest gross return of TK 111000/ha observed in recommended fertilizer dose. But the highest gross margin (Tk 50168/ha) as well as BCR (1.89) obtained from soil test based fertilizer management (189-30-79-46-1.5 kg/ha of NPKSZn).
Introduction Chars are the lands that emerged as island with in the river channel or as attached land to the river banks as a result of dynamics of erosion and accretion in the rivers of Bangladesh. Char land areas are estimated to be 0.72 million hectares, which is about 5% of the total country area and about 6.5 million peoples are living there (EGIS, 2000). Introduction of suitable HYV of different crops along with appropriate agronomic management practices would boost up the productivity of char areas. Char land soil is deficient in plant nutrients. Moreover, BARI Hybrid maize-9 is found to be suitable for growing at char areas of Kushtia district. Hence, this experiment was conducted to find out optimum fertilizer dose of Hybrid maize for char land eco-system.
Materials and Methods The experiment was conducted at char area of Mornea, Gongachara, Rangpur under ARS, BARI, Burirhat during rabi season 2012-13. The soil of the experimental plot was sandy loam in texture under the AEZ # 3. The initial soil of the experimental field was chemically analyzed in the SRDI laboratory, Dinajpur. The chemical properties of initial soil sample are presented in the Table 1.
Table1. Nutrient status of initial soil sample of the experimental field pH Organic
Matter (%) K Total N
(%) P S B Zn
meq/100g soil Micro gram/g soil 5.78 1.93 0.11 0.10 13.75 1.03 0.79 1.19
Acidic Low Low Low Medium Very low High Medium
Four fertilizer managements viz. T1 : Recommended dose (250-55-110-40-4-2 kg/ha of NPKSZnB), T2 : AEZ based (196-36-75-30-2-1 kg/ha of NPKSZnB), T3 : Soil test based (189-30-79-46-1.5 kg/ha of NPKSZn) T4 : Farmer’s practicing dose(171-23-56-10-8-3 kg/ha of NPKSZnB) for Hybrid maize were tested in RCB design with three replications. The spacing maintained for Maize was 60 cm X 20 m. The size of the unit plot was 4m X 3m. The tested variety was BARI Hybrid maize 9. Seeds were sown on December 6, 2012. Half of N and full dose of other fertilizers were applied as basal. Rest N was applied as top dress in two equal splits at 40 and 60 days after sowing. Irrigation, other management and plant protection measures were done as required. Maize was harvested at May 15, 2013. Data on yield and yield contributing characters were recorded and analyzed.
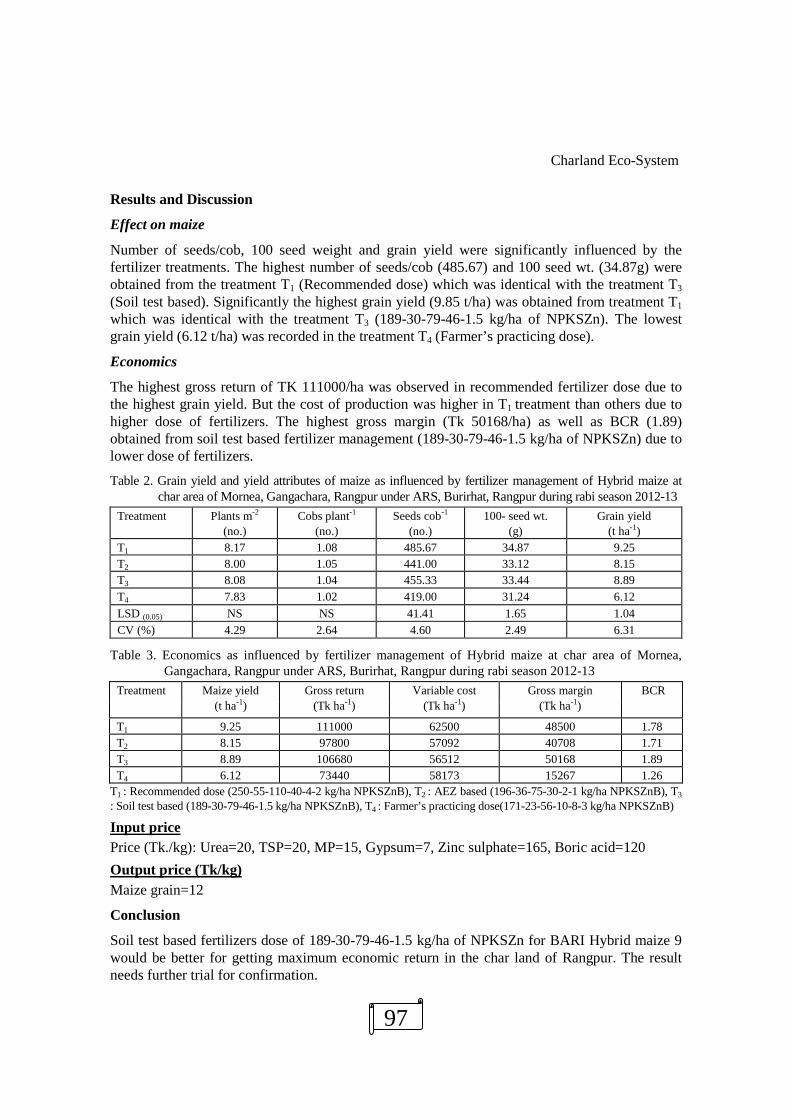
Charland Eco-System
97
Results and Discussion
Effect on maize
Number of seeds/cob, 100 seed weight and grain yield were significantly influenced by the fertilizer treatments. The highest number of seeds/cob (485.67) and 100 seed wt. (34.87g) were obtained from the treatment T1 (Recommended dose) which was identical with the treatment T3
(Soil test based). Significantly the highest grain yield (9.85 t/ha) was obtained from treatment T1 which was identical with the treatment T3 (189-30-79-46-1.5 kg/ha of NPKSZn). The lowest grain yield (6.12 t/ha) was recorded in the treatment T4 (Farmer’s practicing dose).
Economics
The highest gross return of TK 111000/ha was observed in recommended fertilizer dose due to the highest grain yield. But the cost of production was higher in T1 treatment than others due to higher dose of fertilizers. The highest gross margin (Tk 50168/ha) as well as BCR (1.89) obtained from soil test based fertilizer management (189-30-79-46-1.5 kg/ha of NPKSZn) due to lower dose of fertilizers.
Table 2. Grain yield and yield attributes of maize as influenced by fertilizer management of Hybrid maize at char area of Mornea, Gangachara, Rangpur under ARS, Burirhat, Rangpur during rabi season 2012-13
Treatment Plants m-2 (no.)
Cobs plant-1 (no.)
Seeds cob-1 (no.)
100- seed wt. (g)
Grain yield (t ha-1)
T1 8.17 1.08 485.67 34.87 9.25 T2 8.00 1.05 441.00 33.12 8.15 T3 8.08 1.04 455.33 33.44 8.89 T4 7.83 1.02 419.00 31.24 6.12 LSD (0.05) NS NS 41.41 1.65 1.04 CV (%) 4.29 2.64 4.60 2.49 6.31
Table 3. Economics as influenced by fertilizer management of Hybrid maize at char area of Mornea, Gangachara, Rangpur under ARS, Burirhat, Rangpur during rabi season 2012-13
Treatment Maize yield (t ha-1)
Gross return (Tk ha-1)
Variable cost (Tk ha-1)
Gross margin (Tk ha-1)
BCR
T1 9.25 111000 62500 48500 1.78 T2 8.15 97800 57092 40708 1.71 T3 8.89 106680 56512 50168 1.89 T4 6.12 73440 58173 15267 1.26
T1 : Recommended dose (250-55-110-40-4-2 kg/ha NPKSZnB), T2 : AEZ based (196-36-75-30-2-1 kg/ha NPKSZnB), T3 : Soil test based (189-30-79-46-1.5 kg/ha NPKSZnB), T4 : Farmer’s practicing dose(171-23-56-10-8-3 kg/ha NPKSZnB)
Input price Price (Tk./kg): Urea=20, TSP=20, MP=15, Gypsum=7, Zinc sulphate=165, Boric acid=120 Output price (Tk/kg) Maize grain=12
Conclusion
Soil test based fertilizers dose of 189-30-79-46-1.5 kg/ha of NPKSZn for BARI Hybrid maize 9 would be better for getting maximum economic return in the char land of Rangpur. The result needs further trial for confirmation.

Charland Eco-System
98
PERFORMANCE OF DIFFERENT BUSH BEAN VARIETIES IN CHARLAND AREA
S.S.Kakon, M.N.Islam, M.A.Aziz and M.A.Rahman
Abstract An experiment was conducted at the charland of the Bhuapur under Tangail district during rabi season 2013-14 to evaluate the performance of three bush bean varieties (BARI Jharsheem-1, BARI Jharsheem -2, BARI Jharsheem -3). Yield and yield attributes of bush bean varieties significantly differed in charland. The highest pod yield (13.03 t ha-1) was obtained from BARI Jharsheem-2 with higher number of pods plant-1 (16.48). The lowest pod yield was obtained from BARI Jharsheem-3. The results revealed that BARI Jharsheem-2 and BARI Jharsheem-1 would be suitable for cultivation in charlad of Bhuapur under Tangail district.
Introduction
Bush bean (Phaseolus vulgaris L.) is a newly introduced high yielding legume crop and can be used as pulse and vegetable. It is also known as bush bean, kidney bean, snap bean, pinto bean, green bean, raj bean, common bean, basic bean, haricot bean, navy bean, pole bean, wax bean, string bean and bonchi in different parts of the world (Duke, 1983; Salunkhe et al., 1987; Tindall, 1988). In Bangladesh, it is known as Farashi Sheem (Rashid, 1993). Foliage of the crop may also provide hay, silage and green manures. After harvest, plants can be fed to cattle, sheep and horses. The matured seeds can be used for preparing dal or chatpati. The crop has gained popularity for its short durability, high nutritive value and good quality. Green pods are rich in vitamins and minerals. Some farmers of charland area grow local variety of bush bean in broadcast method with low yield potential. The existing residual soil moisture retaining in the soil could also be enough for growth and production of bush bean. In this context BARI developed HYV bush bean varieties which can be introduced at charland to maximize farmer’s income. Therefore, the experiment was conducted to select suitable HYV bush bean for charland area.
Materials and Methods
The experiment was conducted at the charland of the village Hat Chandra of sadar upazila of Tangail district during rabi season 2013-14. Three BARI developed bush bean varieties viz., BARI Jharsheem -1, BARI Jharsheem-2 and BARI Jharsheem -3 were evaluated. The experiment was laid out in a randomized complete block design with 6 dispersed replications. Seeds were sown on 02 December 2013 with 30 cm X 10 cm spacing. The unit plot size was 4.5 m x 3m. The crop was fertilized with 120-40-60 -12-3 N-P2O5-K2O-S-Zn ha-1, respectively (FRG, 2012). Half of N and full doses of other fertilizers were applied at the time of final land preparation and the rest urea was top dressed 35 days after sowing (DAS). Seeds was treated with vitavax @. Two hand weeding was done at 25 and 40 days after sowing (DAS). Pre sowing irrigation was given to the crop for uniform emergence. The crop was attacked by cutworm (Agrotis ipsilon) and hairy caterpillar (Spilarctia obliqua) at early growth (vegetative) stage. The cutworm was controlled through hand picking Perfecthion 40EC @ 2.0 ml L-1 of water was sprayed at an interval of 7-10 days for 3 times to control hairy caterpillar. The crop was harvested during 3 February, 2014 to 12 March, 2014. Data on yield contributing characters were recorded from 10 randomly selected plants

Charland Eco-System
99
from each plot. Yield was calculated from whole plot. Collected data were analyzed statistically and means were compared using LSD test at 1% level of significance.
Results and Discussion
Plant height and yield and yield attributes of different bush bean varieties is presented in Table 1. Different varieties had significant effect on yield and yield contributing characters of bush bean. Variety BARI Jharsheem -3 had the taller plant (35.33 cm) compared to the other two varieties BARI Jharsheem -1 (30.47 cm) and BARI Jharsheem -2 (28.93 cm). Significantly the highest pod length (12.73 cm) was recorded in BARI Jharsheem-1. Number of pods plant-1 varied significantly in different bush bean varieties. The maximum number of pods plant-1 was recorded in BARI Jharsheem-2 (16.48) which was followed by BARI Jharsheem -1 (13.27). BARI Jharsheem -3 produced the lowest number of pods plant-1 (11.37). Significant variation in number of seeds pod-
1was also observed in different bush bean varieties. BARI Jharsheem -1 produced the maximum number of seeds pod-1 (5.53) and minimum number of seeds pod-1 was recorded in BARI Jharsheem -3 (3.63). BARI Jharsheem -3 harvested (green pod) about 3-8 days earlier compared to other varieties. The variety BARI Jharsheem -2 produced significantly the highest pod yield (13.03 t ha -1) which was attributed by the highest number of pods plant-1. The lowest pod yield was obtained from BARI Jharsheem -3 due to lowest number of pods plant -1.
Table 1. Yield and yield attributes of bush bean varieties in the charland of MLT site Bhuapur, Tangail during Rabi, 2013-14
Treatment Days to harvest
Plant height
(cm) Pod length
(cm) Pods plant-1
(no.) Seeds pod-1
(no.) Yield
(t ha -1)
BARI Jharsheem -1 62.33 30.47b 12.73 13.27 5.53 12.20 BARI Jharsheem- 2 67.33 28.93b 10.03 16.48 4.27 13.03 BARI Jharsheem -3 59.00 35.33a 12.46 11.37 3.63 10.50 CV (%) 5.462 3.62 3.14 5.53 9.28 5.48 LSD(0.05) 2.31 4.299 1.386 2.85 1.564 2.451
Farmers’ reaction
Farmers in char land area showed their interest to grow BARI Jharsheem varieties due to its early maturing higher yield.
Conclusion
From the results it might be concluded that BARI Jharsheem-2 and BARI Jharsheem-1 would be suitable for cultivation in the charland area.
References Duke J.A. 1983. Hand book of Legumes of World Economic Importance 2nd Edn., Plenum Press, New York. p. 341.
Rashid M. M. 1993. Sabji Biggan. In Bangla. 1st Ed., Bangla Academy Rashid Publishing House, Dhaka. pp. 387-390.
Salunkhe D.K., B.B. Desai, N.R. Bhat 1987. (Leguminous Vegetable and Beans). In Vegetable and Flower Seed Production, Agricole Publ. Acad. New Delhi. pp. 265-302.
Tindall H.D. 1988. Vegetables in the Tropics. McMillan Education Ltd., 527p.

Charland Eco-System
100
EFFECT OF PLANTING TECHNIQUE ON TUBER YIELD OF POTATO AT CHARLAND ECO-SYSTEM
M.S. Rahman, M. N. Islam and Torikul Islam
Abstract The experiment was conducted at farmers’ field of Golapnagar char at MLT sites of Bheramara under Kushtia district during Rabi season, 2013-14 to find out the tuber state (cut or non cut) along with spacing for higher yield of potato at charland eco-system and to compare farmers practice with recommended one. The highest tuber yield (30.55 t/ha) and gross return (Tk 168025 /ha) as well as gross margin (Tk 49637/ha) were obtained from treatment T4 (Half cut tuber: 45 cm x 15 cm) among other treatments.
Introduction
Potato (Solamun tuberosum) is the most widely grown tuber crop in Bangladesh. Farmer’s of all parts of the country grown potato. But method of potato cultivation varies from one location to other according to yield. Particularly size and type of seed tuber is one of the major reasons for yield variation. In some areas farmers use whole tuber while cut tuber uses in some areas. Single eye planting with closer spacing of potato is a common practice of growing potato at char areas of Kushtia district. Chars are the lands that emerge as island within the river channel or as attached land to the riverbanks as a result of dynamics of erosion and accretion in the rivers of Bangladesh. Char land areas are estimated to be 0.72 million hectares, which is about 5% of the country areas and about 6.5 million people live there (EGIS, 200). About 64 to 97% of the char areas are cultivable. Introduction of suitable HYV of different crops along with appropriate agronomic management practices would boost up the productivity of char areas. Question was whether this practice is better than recommended practice or not. With this view in mind, the experiment was conducted to find out the tuber state (cut or non cut) along with spacing for higher yield of potato at charland eco-system and to compare farmers practice with recommended one.
Materials and Methods
The experiment was conducted at Golapnagar char under Bheramara MLT site in Kushtia district in Rabi season of 2013-2014. The trial was laid out in RCB design with three replications. The variety was BARI Alu 7 (Diamant) and the unit plot size was 3m x 3m. Recommended system of planting (60 cm x 30 cm), Single eye planting (30 cm x 10 cm), Single eye double row zig zag system (10 cm/30 cm x 10 cm) and half cut tuber (45 cm x 15 cm) was followed in the experiment. Chemical fertilizers were applied at the rate of 198-44-194-24-6-1.2 kg/ha of NPKSZn and B, respectively for T1 and T4 treatments. On the other hand, it was 210-50-150-20-4-1.27 kg/ha of NPKSZn and B, respectively for T2 treatment and 220-60-160-30-5-2 kg/ha of NPKSZn and B, respectively for T3 treatment. Half of N and full dose of other fertilizer were applied as basal. The rest of N was top dressed at 33-35 days after planting. The potato tuber was planted on 29 November, 2013. One weeding was done during 30 days after planting. The crop was irrigated in two times during 30 and 55 days after planting. It was sprayed four times by applying Ridomil gold, Dithane M-45, Acrobat MZ and Secure during 38, 48, 68 and 75 days after planting. The crop was harvested on 8 to 11 March, 2014. Data on yield and yield components were recorded and analyzed statistically.

Charland Eco-System
101
Results and Discussion
Yield and yield components of potato did not differ significantly and are presented in Table 1. The numerically highest tuber yield (30.55 t/ha) was recorded in treatment T4 (Half cut tuber: 45 cm x 15 cm) and it was followed by treatment T3 (Single eye double row zig zag system: 10 cm/30 cm x 10cm), T1 (Recommended system of planting: 60 cm x 30 cm) and T2 (Single eye planting: 30 cm x 10 cm) in 2013-14. But in case of 2012-13, the yield was significantly the highest in T3. Gross return (Tk 168025/ha), gross margin (Tk 49637/ha) and BCR (1.42) were found the highest in treatment T4 (half cut tuber: 45 cm x 15 cm) and it was followed by T3, T1 and T2 in the year 2013-14 (Table 2).
Table 1. Yield and yield components of potato at char land eco-system Treatments Plant population
m-2 Plant height
(cm) No. of Tuber
Plant-1 No. of Tuber
kg-1 Yield tha-1
2013-14 2012-13 T1 11.00 28.80 4.20 19.67 23.89 18.75 T2 23.66 26.33 2.93 22.67 23.33 26.94 T3 20.00 24.13 3.33 21.33 25.33 30.28 T4 13.33 25.13 3.73 19.33 30.55 22.00 CV (%) 28.99 4.94 22.48 5.96 13.40 3.27 LSD (0.05) NS 2.58 NS NS NS 1.59
T1 =Recommended system of planting (60 cm × 30 cm), T2=Single eye planting (30 cm × 10 cm), T3=Single eye double row zig zag system (10 cm/30 cm × 10cm), T4=Half cut tuber (45 cm × 15 cm)
Table 2. Cost and return of potato at char land eco-system Treatments Gross return
(Tkha-1) Total Variable cost
(Tkha-1) Gross margin (Tkha-1) BCR (Tk/Tk)
T1 131395 118388 13007 1.11
T2 128315 116038 12277 1.11
T3 139315 119958 19357 1.16
T4 168025 118388 49637 1.42
Market price: Potato = 5.50 Tk/kg
Farmers’ reaction
Farmers in char land area have chosen half cut tuber system (45 cm × 15 cm) than other treatments due to its higher yield and return in this year.
Conclusion
Potato cultivation under half cut tuber system (45 cm × 15 cm) was more profitable compared to other treatments in char land eco-system.
Charland Eco-System
102
PERFORMANCE OF LENTIL VARIETIES IN THE CHARLAND AREA
M. Z. Ali, M. A. Aziz and M. A. Rahaman
Abstract An experiment was conducted at the charland of Jamuna river under Bhuapur upazilla of Tangail district (AEZ-8) during rabi season of 2013-2014 to find out suitable BARI developed Lentil variety for char land area of Tangail and ultimately increase total production as well as improve farmer’s economic return. Four high yielding lentil varieties viz. BARI Masur - 3, BARI Masur - 4, BARI Masur - 5, BARI Masur - 6 were tested against local variety. All BARI released lentil varieties were superior to local variety of lentil. Among these varieties, BARI Masur - 6 produced the highest seed yield 1.52 t ha-1 (83.13% higher yield over local variety) followed by BARI Masur - 5 (1.24 t ha-1, 49.40% higher yield over local variety), BARI Masur - 3 (1.18 t ha-1, 42.17% higher yield over local variety) and BARI masur - 4 (1.03 t ha-1, 24.10% higher yield over local variety). The results revealed that BARI Masur - 6, BARI Masur - 5 and BARI Masur - 3 might be suitable for charland of Jamuna River under Bhuapur Upazilla of Tangail (AEZ-8) district for getting higher yield.
Introduction Bangladesh rank in 3rd among the lentil growing countries of the Asia pacific region. In case of area and production lentil is the second most important pulse crop but stands first in case of consumer’s preference in the country. Lentil contains carbohydrates, mainly starches (55-65%), proteins including essential amino acids (24-28%) and fat (1-4%) (Mehta et. al. 2005). In addition to their food value lentil also plays an important role in cropping systems because of its ability to fix nitrogen (101 kg/ha/annum) and thereby enrich the soil (Yadav et al., 1994). It is grown on about 1,54,000 ha, producing 1,16,000 tones of grain, with the average yield of 752 kg ha-1 , and contributes about 33% of the total pulses production (BBS, 2002). Domestic pulses production satisfies less then half of country’s needs. The rest, some 1,40,000 tons is imported at a cost of about US$ 32.2 million per annum (MOA, 2002). Trend of area, production and yield of lentil in Bangladesh decline during 1976 to 2001 (Islam and Ali, 2002). Chars are newly developed lands in different river beds and basin. The area under charland is estimated to be 0.82 m ha in Bangladesh (MPO, 1986 and SRDI). Main constrain of char lands are uncertain flood, duration of flood and flood depth. At present some char lands are used for cultivation of tobacco, pulse crops and wheat. Among pulse crops, lentil is the most important pulse crop. Some farmers of char area grow local variety of lentil in broadcast method with low yield potential. The existing residual soil moisture retaining in the soil could also be enough for growth and production of lentil. In this context BARI developed HYV lentil varieties can be introduced at char land to maximize farmers income. Therefore, the experiment was conducted to select suitable HYV lentil variety for charland area of Tangail.
Materials and Methods The trial was conducted at the charland of the Jamuna river under MLT site, Bhuapur, Tangail district (AEZ- 8) during rabi season of 2013-14. The soil of the experimental field was silty loam in texture with pH 6.97 belonging to Grey Floodplain soil (AEZ- 8). Soil samples from experimental plots were collected and analyzed. The physical and chemical properties of soil of experimental field are presented in Table 1.

Charland Eco-System
103
Table 1. Physical and chemical properties of experimental field (Bhuapur char) Location AE
Z pH OM
(%) Total N (%)
Available P
(µg/ml)
Exchaneable K
(meg/100g)
Available S
(µg/ml)
Available B (µg/ml)
Bhuapur char land
8 6.97 1.48 VL
0.067 VL
4.39 VL
0.181 M
15.46 M
0.248 M
Critical levels - - - 14 0.20 14 0.20 M= Medium, VL= Very low
Four high yielding lentil varieties viz. BARI Masur - 3, BARI Masur - 4, BARI Masur - 5, BARI Masur - 6 were tested against local variety. The experiment was laid out in RCB design 6 dispersed replications. The unit plot size was 4m X 6m. The plots were fertilized with 24-32-40-24 and 1.5 kg ha-1 N P K S and B, respectively. All the fertilizers were applied at the time of final land preparation in the form of urea, triple super phosphate, muriate of potash, gypsum and boric acid respectively. The seeds were sown on 10 November 2013 in line with seed rate of 40 kg ha-
1. Seeds of lentil were sown in 30 cm apart solid line. Two hand weeding was done at 25 and 45 DAS. The crop was harvested on 27 February to 3 March, 2014. The data on different plant characters, yield components and seed yield were recorded having from 10 plants randomly selected in each plot. Yield was calculated from whole plot basis. Collected data were analyzed statistically and means were adjusted by LSD test at 5% level of significance.
Results and Discussion
Plant population m-2, effective pods plant-1, seeds pod-1, 1000-seed weight and seed yield significantly varied among the lentil varieties (Table 2). Significantly the highest plant population m-2 (60.67 plant m-2) was recorded in BARI Masur - 6 which was statistically identical to BARI Masur- 5, local variety and BARI Masur - 3 (57.33, 57.00 and 57.00 plant m-2) and the lowest plant population m-2 (54.67 plant m-2) was recorded in BARI Masur- 4. Significantly the highest number of effective pods plant-1 (71.07) was obtained from BARI Masur– 6. The lowest number of effective pods plant-1 (56.17) was recorded from local variety (control) followed by BARI Masur- 4 (59.77) and BARI masur - 3 (59.30). Significantly the highest number of seeds pod-1 (2.11) was recorded in BARI masur - 5 which was at par with that of BARI Masur - 3 (2.00) and BARI Masur- 6 (1.95). The lowest number of seeds pod-1 (1.77) was recorded in BARI Masur - 4 which was statistically identical to local variety (1.93). The maximum 1000 seed weight (19.57g) was obtained from BARI masur - 6 which was statistically similar with BARI Masur- 3 (19.28g) and BARI Masur - 5 (18.23g). The lowest 1000 seed weight (16.22g) was obtained from local variety (control) which was statistically similar to BARI Masur - 4 (17.42g). Among the different lentil varieties, the highest seed yield (1.52 t ha-1) (83.13% higher over local variety) was recorded from BARI Masur - 6 followed by BARI Masur - 5 (1.24 t ha-1) (49.40% higher over local variety), BARI Masur - 3 (1.18 t ha-1) (42.17% higher over local variety) and BARI Masur - 4 (1.03 t ha-1) (24.10% higher over local variety). The lowest seed yield 0.83 t ha-1 was obtained from local variety. The highest seed yield recorded in BARI Masur- 6, BARI masur - 5 and BARI Masur - 3 due to higher number of plants m-2, pods plant-1 and 1000 seed weight. Similar results were also obtained by Islam et al., (2009) in Mustard varieties, Begum et al., (2009) in Mungbean varieties, Kakon et al., (2009) in field pea varieties, Ahmed et at., (2009) in chickpea varieties, Islam et al., (2009) in lentil varieties who found that BARI released HYV variety gave higher seed yield over local variety and ultimately increased the total production and greater resource utilization.
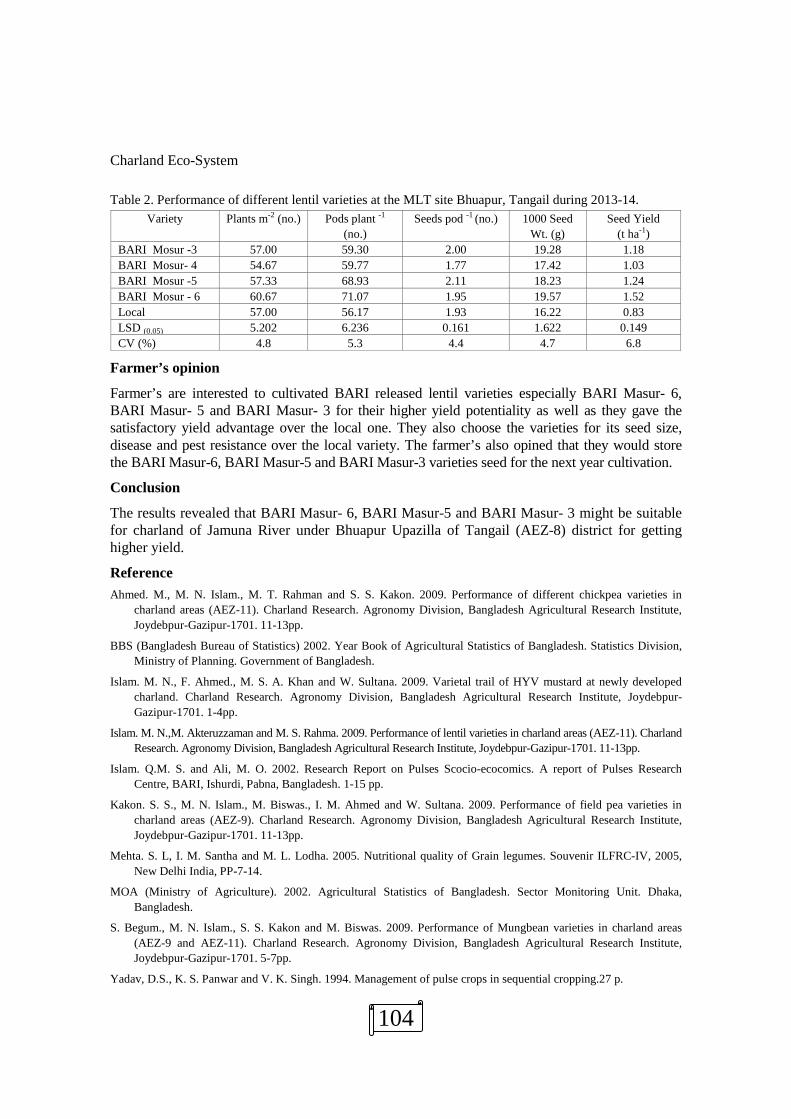
Charland Eco-System
104
Table 2. Performance of different lentil varieties at the MLT site Bhuapur, Tangail during 2013-14. Variety Plants m-2 (no.) Pods plant -1
(no.) Seeds pod -1 (no.) 1000 Seed
Wt. (g) Seed Yield
(t ha-1) BARI Mosur -3 57.00 59.30 2.00 19.28 1.18 BARI Mosur- 4 54.67 59.77 1.77 17.42 1.03 BARI Mosur -5 57.33 68.93 2.11 18.23 1.24 BARI Mosur - 6 60.67 71.07 1.95 19.57 1.52 Local 57.00 56.17 1.93 16.22 0.83 LSD (0.05) 5.202 6.236 0.161 1.622 0.149 CV (%) 4.8 5.3 4.4 4.7 6.8
Farmer’s opinion
Farmer’s are interested to cultivated BARI released lentil varieties especially BARI Masur- 6, BARI Masur- 5 and BARI Masur- 3 for their higher yield potentiality as well as they gave the satisfactory yield advantage over the local one. They also choose the varieties for its seed size, disease and pest resistance over the local variety. The farmer’s also opined that they would store the BARI Masur-6, BARI Masur-5 and BARI Masur-3 varieties seed for the next year cultivation.
Conclusion
The results revealed that BARI Masur- 6, BARI Masur-5 and BARI Masur- 3 might be suitable for charland of Jamuna River under Bhuapur Upazilla of Tangail (AEZ-8) district for getting higher yield.
Reference Ahmed. M., M. N. Islam., M. T. Rahman and S. S. Kakon. 2009. Performance of different chickpea varieties in
charland areas (AEZ-11). Charland Research. Agronomy Division, Bangladesh Agricultural Research Institute, Joydebpur-Gazipur-1701. 11-13pp.
BBS (Bangladesh Bureau of Statistics) 2002. Year Book of Agricultural Statistics of Bangladesh. Statistics Division, Ministry of Planning. Government of Bangladesh.
Islam. M. N., F. Ahmed., M. S. A. Khan and W. Sultana. 2009. Varietal trail of HYV mustard at newly developed charland. Charland Research. Agronomy Division, Bangladesh Agricultural Research Institute, Joydebpur-Gazipur-1701. 1-4pp.
Islam. M. N.,M. Akteruzzaman and M. S. Rahma. 2009. Performance of lentil varieties in charland areas (AEZ-11). Charland Research. Agronomy Division, Bangladesh Agricultural Research Institute, Joydebpur-Gazipur-1701. 11-13pp.
Islam. Q.M. S. and Ali, M. O. 2002. Research Report on Pulses Scocio-ecocomics. A report of Pulses Research Centre, BARI, Ishurdi, Pabna, Bangladesh. 1-15 pp.
Kakon. S. S., M. N. Islam., M. Biswas., I. M. Ahmed and W. Sultana. 2009. Performance of field pea varieties in charland areas (AEZ-9). Charland Research. Agronomy Division, Bangladesh Agricultural Research Institute, Joydebpur-Gazipur-1701. 11-13pp.
Mehta. S. L, I. M. Santha and M. L. Lodha. 2005. Nutritional quality of Grain legumes. Souvenir ILFRC-IV, 2005, New Delhi India, PP-7-14.
MOA (Ministry of Agriculture). 2002. Agricultural Statistics of Bangladesh. Sector Monitoring Unit. Dhaka, Bangladesh.
S. Begum., M. N. Islam., S. S. Kakon and M. Biswas. 2009. Performance of Mungbean varieties in charland areas (AEZ-9 and AEZ-11). Charland Research. Agronomy Division, Bangladesh Agricultural Research Institute, Joydebpur-Gazipur-1701. 5-7pp.
Yadav, D.S., K. S. Panwar and V. K. Singh. 1994. Management of pulse crops in sequential cropping.27 p.

Charland Eco-System
105
FERTILIZER MANAGEMENT OF GROUNDNUT AT CHARLAND ECO-SYSTEM
M. N. Islam, M. Z. Ali and M. A. Rahaman
Abstract
An experiment was conducted under char land situation at the MLT site, Bhuapur, Tangail during Rabi 2013-14 to find out optimum fertilizer dose for BARI Chinabadam-8 under farmers’ field condition. Four fertilizer packages viz T1: 12-32-43-54-2 kg ha-1 N-P-K-S-B (recommended fertilizer dose based on AEZ), T2: 47-38-25-15-0.5 kg ha-1 N-P-K-S-B (based on soil test). T3: 7-1-2-0-0-0 kg ha-1 N-P-K-S-B (farmer’s practice) and T4: Native (control) was considered as treatments. Among the treatments, T2: 47-38-25-15-0.5 kg ha-1 N-P-K-S-B gave the highest seed yield (1.83 t ha-1) followed by T1: 12-32-43-54-2 kg ha-1 N-P-K-S-B (1.38 t ha-1), T3: 7-1-2-0-0-0 kg ha-1 N-P-K-S-B (1.15 t ha-1) and lowest seed yield (0.90 t ha-1) was obtained from T4 treatment. The highest gross return (Tk. 58,560 ha-1) , gross margin (Tk. 29,055 ha-1) and BCR (1.98) were recorded in soil test basis fertilizer dose (47-38-25-15-0.5 kg ha-1 N-P-K-S-B) . The lowest gross return (Tk. 28,800 ha-1), gross margin (Tk. 7675 ha-1) and BCR (1.36) were found in the control plot. BARI Chinabadam-8 along with 47-38-25-15-0.5 kg ha-1 N-P-K-S-B (soil test based) may be recommended for large scale production in the char land area of Bhuapur, Tangail (AEZ- 8).
Introduction
Groundnut (Arachis hupogaea L.) is one of the important oilseed crop in Bangladesh. It is first in per hector yield and third incase of area and production among the edible oilseed crops. It contributes around 9% of total oilseed production. It can fix atmospheric nitrogen and improve the soil health by adding nitrogen. Chars are the lands that emerge as island with in the river channel or as attached land to the riverbanks as a result of dynamics of erosion and accretion in the rivers of Bangladesh. Char land areas are estimated to be 0.82 million hectares, which is about 5% of the country area and about 6.5 million people live there (EGIS, 2000). About 64 to 97% of the char areas are cultivable. Farmers of char land generally cultivate their local variety of wheat, maize, lentil, grass pea, sesame, Mungbean, groundnut, tobacco etc as a result they get lower yields. BARI has developed some high yielding varieties of groundnut. So, introduction of suitable HYV groundnut along with appropriate agronomic practices would boost up the productivity of char areas and the country will be benefited. Char land soil is deficient in plant nutrients. Moreover, calcium is essential for pegging of groundnut. Generally farmers grow groundnut with little or without fertilizers. They do not use any calcium containing fertilizer. Hence, the experiment was conducted to find out optimum fertilizer dose of groundnut for char land eco-system under AEZ 8.
Materials and Methods
The trial was conducted at the MLT site, Bhuapur, Tangail (AEZ- 8) during the rabi 2013-14. The soil of the experimental field was silty loam in texture with pH 6.97 belonging to Grey Floodplain soil (AEZ- 8). Soil samples from experimental plots were collected and analyzed. The physical and chemical properties of soil of experimental field are presented in Table 1.

Charland Eco-System
106
Table-1.Physical and chemical properties of experimental field (Bhuapur char, Tangail) Location AEZ pH OM
% Total N
(%) Available P
(µg/ml) Exchangeable K (meg/100g)
Available S (µg/ml)
Available B (µg/ml)
Bhuapur char land
8 6.97 1.48 VL
0.067 VL
4.39 VL
0.181 M
15.46 M
0.248 M
Critical levels
- - - 14 0.20 14 0.20
The trial was laid out in RCB design with 3 dispersed replications. Unit plot size was 4 m x 3 m. Four fertilizer doses viz., T1: 12-32-43-54-2 kg ha-1 N-P-K-S-B (recommended fertilizer dose based on BARI), T2: 47-38-25-15-0.5 kg ha-1 N-P-K-S-B (based on soil test). T3: 7-1-2-0-0-0 kg ha-1 N-P-K-S-B (farmer’s practice) and T4: Native Fertilizer dose (control) was tested on BARI Chinabadam-8. Fertilizers were applied as per treatments. Half of nitrogen and full quantity of P K S B were applied at the time of final land preparation in the form of urea, triple super phosphate, muriate of potash, gypsum and boric acid, respectively. Remaining N were top dressed at flowering stage and covered with soil followed by irrigation. The seeds were sown on 26 November, 2013 in line with seed rate 100 kg ha-1. The plant spacing was 30 cm x 15 cm. Irrigation, pests and other crop management practices were done as and when necessary. The crop was harvested on 3 May, 2014. The data on different plant characters, yield components and seed yield were recorded having 2 m2 from each plot and from 10 plants randomly selected in each plot. Collected data were analyzed statistically and means were adjudged by LSD test at 5% level of significance using Crop Stat package. Economic analysis was also done considering local market price of goundnut.
Results and Discussion
Plant population m-2, effective pods plant-1, seeds pod-1, 1000- seed weight and seed yield of groundnut under different fertilizer management differed significantly (Table 2). Plant population m-2 differed significantly due to different fertilizer managements. The highest plant population at harvesting time (26.00 plant m-2) was recorded in T2 treatment which was statistically identical to T1 (24.33 plant m-2) and T3 (22.67 plant m-2) treatments and the lowest plant population (22.33 plant m-2) was obtained from T4 treatment due to stress of nutrients. Significantly the highest number of effective pods plant-1 (19.13) was obtained from T2 treatment (based on soil test) which was statistically identical with T1 treatment (recommended fertilizer dose based on BARI). The lowest number of effective pods plant-1 (12.20) was recorded from T4 treatment (control) which was at par with T3 treatment (13.47). Significantly the highest number of seeds pod-1 (1.62) was recorded in T2 treatment which was at par with T1 treatment (1.58) and T3 treatment (1.31). The lowest number of seeds pod-1 (1.19) was recorded in T4 treatment (control). Significantly the highest 1000 seed weight (566.33g) was obtained from T2 treatment which was statistically similar with T1 (475.00 g) treatment and that of the lowest weight (428.00 g) was obtained from T4 treatment. The highest seed yield (1.83 t ha-1) (103.33% higher over control) was recorded in T2 treatment (based on soil test basis) followed by T1 treatment (1.38 t ha-1) (53.33 % higher over control) and T3 treatment (1.15 t ha-1) (27.78 % higher over control). The higher seed yield in higher nutrient level was attributed by the higher yield contributing characters. The lowest seed yield (0.90 t ha-1) was obtained from T4 treatment (control).

Charland Eco-System
107
Cost and return
Gross return (Tk. 58,560 ha-1) gross margin (Tk. 29,055 ha-1) and BCR (1.98) were higher in soil test based fertilizer dose (47-38-25-15-0.5 kg ha-1 N-P-K-S-B). The T4 treatment (native fertility) failed to exhibit higher gross return (Tk. 28,800 ha-1), gross margin (Tk. 7675 ha-1) and BCR (1.36) although the highest gross return was observed in T2 treatment. This was happened due to higher cost involvement for high fertilizer dose in T2 treatment (Table-3).
Table 2. Effect of fertilizer management on the performance of BARI Chinabadam- 8 in char land of Bhuapur during 2013-14
Treatment Plant m-2 Pods plant-1 (no.)
Seeds pod-1 (no.)
1000 seed wt. (g)
Seed yield (t ha-1)
Yield incrase over control (%)
T1 24.33 15.57 1.58 451.67 1.38 53.33 T2 26.00 19.13 1.62 475.00 1.83 103.33 T3 22.67 13.47 1.31 442.67 1.15 27.78 T4 22.33 12.20 1.19 428.00 0.90 -
LSD (0.05) 1.37 1.33 0.19 11.56 0.23 - CV (%) 2.9 4.4 6.6 1.3 8.8 -
T1=12-32-43-54-2 kg ha-1 N-P-K-S-B (Recommended fertilizer dose based on BARI), T2=47-38-25-15-0.5 kg ha-1 N-P-K-S-B (soil test based, T3: 7-1-2-0-0-0 kg ha-1 N-P-K-S-B (Farmer’s practice) and T4=Native Fertilizer dose (control)
Table-3. Cost and return analysis of BARI Chinabadam- 8 at char land of Bhuapur during 2013-14 Treatment Groundnut seed yield
(Kg /ha) Gross return
(Tk. /ha) TVC
(Tk. /ha) Gross margin
(Tk/ha) BCR
T1 1380 44160 31808 12352 1.39 T2 1830 58560 29505 29055 1.98 T3 1150 36800 21580 15220 1.70 T4 900 28800 21125 7675 1.36
Price (Tk kg-1): Groundnut= 32/-
Farmers’ opinion
Farmers opined that they would grow BARI Chinabadam-8 along with 47-38-25-15-0.5 kg ha-1 N-P-K-S-B (based on soil test) in the next year for higher yield achievement.
Conclusion
The results indicated that BARI Chinabadam- 8 along with 47-38-25-15-0.5 kg ha-1 N-P-K-S-B (soil test based) may be recommended for large scale production in the char land area of Bhuapur, Tangail (AEZ- 8) and other extrapolation areas.

Charland Eco-System
108
FERTILIZER MANAGEMENT OF HYBRID MAIZE AT CHARLAND ECO-SYSTEM
M. A. I. Sarker, M.N. Islam, S.M.A.H.M. Kamal, M.K. Islam and.M. A. Mannaf
Abstract The experiment was conducted at char area, Mornea, Gongachara, Rangpur under ARS, BARI, Burirhat during rabi 2012-13 and 2013-14. Four fertilizer managements viz. T1 : Recommended dose (250-55-110-40-4-2 kg/ha NPKSZnB), T2 : AEZ based (196-36-75-30-2-1 kg/ha NPKSZnB), T3 : Soil test based (189-30-79-46-1.5 kg/ha NPKSZn in 2012-13 and 188-45-107-27-4-1 kg/ha NPKSZnB in 2013-14) T4 : Farmer’s practicing dose(171-23-56-10-8-3 kg/ha NPKSZnB) were tested in RCB design with 3 replications. From the two years result revealed that the recommended fertilizer dose gave better yield of maze which was statistically similar with soil test based fertilizer dose but the highest economic performance was observed in soil test based fertilizer management. The highest Gross return (Tk. 1,11,000/ha and Tk.1,17,720/ha in 2012-13 and 2013-14 respectively) obtained from recommended fertilizer dose (T1) but highest gross margin (Tk. 50,168/h in 2012-13 and Tk. 57,728/ha in 2013-14) along with the highest BCR (1.89 in 2012-13 and 2.02 in 2013-14) was obtained in soil test based fertilizer management (T1).
Introduction
Chars are the lands that emerge as island with in the river channel or as attached land to the riverbanks as a result of dynamics of erosion and accretion in the rivers of Bangladesh. Char land areas are estimated to be 0.72 million hectares, which is about 5% of the country area and about 6.5 million people love there (EGIS, 2000). About 64 to 97% lands of the char are cultivable. Introduction of suitable HYV of different crops along with appropriate agronomic management practices would boost up the productivity of char areas. Char land soil is deficient in plant nutrients. Moreover, BARI Hybrid maize-9 is found to be suitable for growing at char areas of Kushtia district. Therefore, this experiment was conducted to find out optimum fertilizer dose of Hybrid maize for char land eco-system.
Materials and Methods
The experiment was conducted at char area, Mornea, Gongachara, Rangpur under ARS, BARI, Burirhat during rabi 2012-13 and 2013-14. The soil of the experimental plot was sandy loam in texture under the AEZ # 3. Before conducting the experiment, the initial soil samples were collected from the experimental field and chemically analyzed in the SRDI laboratory, Dinajpur. The chemical properties of initial soil sample presented in the following table.
Table1. Nutrient status of initial soil sample of the experimental field pH Organic
Matter (%) K Total N
(%) P S B Zn
meq/100g soil Micro gram/g soil 1st year : 2012-13
5.78 1.93 0.11 0.10 13.75 1.03 0.79 1.19 Acidic Low Low Low Medium Very low High Medium
2nd year : 2013-14 5.68 1.80 0.10 0.10 11.00 13.24 0.19 0.85
Acidic Low Low Low Medium Low Low Low

Charland Eco-System
109
Four fertilizer doses viz. T1 : Recommended dose (250-55-110-40-4-2 kg/ha NPKSZnB), T2 : AEZ based (196-36-75-30-2-1 kg/ha NPKSZnB), T3 : Soil test based (189-30-79-46-1.5 kg/ha NPKSZn in 2012-13 and 188-45-107-27-4-1 kg/ha NPKSZnB in 2013-14) and T4 : Farmer’s practicing dose(171-23-56-10-8-1.5 kg/ha NPKSZnB) were tested on BHM-9. The experiment was laid out in RCB design with three replications. The spacing maintained for Maize was 60 cm × 20 m. The size of the unit plot was 4m × 3m. Seeds of Hybrid maize (BHM-9) were sown on December 6, 2012 and December 13, 2013. Half of N and full dose of other fertilizer was applied as basal. Rest N was applied as top dress in two equal splits at 40 and 60 days after sowing. Irrigation, other management and plant protection measures were done as required. Maize was harvested at 15 May on 2013 and 28 May on 2014. Yield was taken from whole plot. Collected data were analyzed statistically and means were adjusted by LSD test at 5% level of significance.
Results and Discussion
Effect on maize
Number of seeds/cob, 1000 seed weight and yield were significantly influenced by the fertilizer treatments in both the year. The highest number of seeds/cob (485.67 in 2012-13 and 568.20 in 2013-14) and 1000 seed wt. (348.70g in 2012-13 year and 463.67 in 2013-14) were counted from the T1 (Recommended dose) treatment which was statistically at par with T3 treatment (Soil test based). Significantly the highest yield (9.25 t/ha in 2012-13 and 9.81 t/ha in 2013-14) was obtained from T1 treatment that was statistically identical with T3 treatment. The lowest yield (6.12 t/ha in 2012-13 year and 6.79 t/ha in 2013-14) was observed in T4 treatment (Farmer’s practice fertilizer dose).
Economics
The highest gross return (Tk. 1,11,000/ha in 2012-13 and Tk. 1,17,720/ha in 2013-14 respectively) was obtained from T1 due to the highest maize yield. In both the year, cost of production was also highest in T1 treatment than the other treatments due to involvement of more fertilizer cost. The highest gross margin (Tk. 50,168/ha in 2012-13 and Tk. 57,728/ha in 2013-14) and BCR (1.89 in 2012-13 and 2.02 in 2013-14) was recorded in T3 treatment due to the lowest fertilizer cost.
Table 2. Grain yield and yield attributes of maize as influenced by fertilizer management of Hybrid maize at char area, Mornea, Gangachara, Rangpur under ARS, Burirhat, Rangpur during rabi season 2012-13 and 2013-14
Treatment Plants m-2 Cobs plant-1 (no.) Seeds cob-1 (no.) 1000-seeds wt. (g) Grain yield (t ha-1
2012-13 2013-14 2012-13 2013-14 2012-13 2013-14 2012-13 2013-14 2012-13 2013-14
T1 8.17 8.16 1.08 1.20 485.67 568.20 348.70 463.67 9.25 9.81a
T2 8.00 8.02 1.05 1.07 441.00 521.33 331.20 441.33 8.15 8.42b
T3 8.08 8.13 1.04 1.13 455.33 545.60 334.42 451.67 8.89 9.52ab
T4 7.83 7.97 1.02 1.03 419.00 501.00 312.35 409.33 6.12 6.79c
LSD (0.05) NS NS NS NS 41.41 30.83 16.48 21.00 1.04 1.22
CV (%) 4.29 6.74 2.64 8.11 4.60 2.89 2.49 2.38 6.31 7.08

Charland Eco-System
110
Table 3. Economics as influenced by fertilizer management of Hybrid maize at char area, Mornea, Gangachara, Rangpur under ARS, Burirhat, Rangpur during rabi season 2012-13 and 2013-14
Treatment Maize yield
(t ha-1) GR (Tk. ha-1) VC (Tk. ha-1) GM (Tk. ha-1) BCR
2012-13 2013-14 2012-13 2013-14 2012-13 2013-14 2012-13 2013-14 2012-13 2013-14 T1 9.25 9.81 111000 117720 62500 62500 48500 55220 1.78 1.88 T2 8.15 8.42 97800 101040 57092 57092 40708 43948 1.71 1.77 T3 8.89 9.52 106680 114240 56512 56512 50168 57728 1.89 2.02 T4 6.12 6.79 73440 81480 58173 58173 15267 23307 1.26 1.40
T1 : Recommended dose (250-55-110-40-4-2 kg/ha NPKSZnB), T2 : AEZ based (196-36-75-30-2-1 kg/ha NPKSZnB), T3 : Soil test based (189-30-79-46-1.5 kg/ha NPKSZnB in 2012-13 and 188-45-107-27-4-1 kg/ha NPKSZnB in 2013-14), T4 : Farmer’s practicing dose(171-23-56-10-8-3 kg/ha NPKSZnB)
Conclusion
From the above study, in both the year soil test based fertilizer management (T3 treatment) for Hybrid maize showed better economic performance in char area.

Charland Eco-System
111
PERFORMANCE OF GARLIC VARIETIES AT DIFFERENT SOWING DATE IN CHARLAND AREA OF NORTHERN REGION
M. A. I. Sarker, S.M.A.H.M. Kamal, M.K. Islam and M.A. Mannaf
Abstract An experiment was conducted at char area, Mornea, Gangachara, Rangpur under ARS, Burirhat, Rangpur during rabi season 2012-13 and 2013-14 to find out the performance of different garlic varieties with different dates of planting for higher yield of garlic to farmers of the northern char areas region. The experiment was carried out in split plot design with three replications. Five sowing dates in main plot viz. S1:30 Oct, S2:15 Nov, S3:30 Nov, S4:15 Dec and S5:30 Dec and three varieties in sub plot viz. V1: BARI Roshun-1; V2: BARI Roshun-2 and V3: local were accommodated in the experiment. The highest bulb yield (5.53 t/ha) was obtained from BARI Roshun-1 which was statistically similar with local variety and the lowest bulb yield (4.76 t/ha) was recorded from BARI Roshun-2 at 2012-13 while in 2013-14, BARI Roshun-1 produced significantly the highest bulb yield (5.20 t/ha) than BARI Roshun-2 and local one. In both the year, with the delay in planting time from 30 October yield was reduced gradually. The highest bulb yield (6.80 and 6.39 t/ha, 2012-13 and 2013-14 respectively) was recorded when planting was done on 30 October. The lowest bulb yield (3.22 t/ha and 2.99 t/ha, 2012-13 and 2013-14 respectively) was obtained from 30 December planting. 30 October was the best planting time for all the garlic varieties in 2012-13 and 2013-14 respectively. Early planting up to 15 November with BARI Roshun-1 might be considered for better yield of garlic in char area of northern region.
Introduction
Garlic (Alium sativum) is one of the important spices in Bangladesh, it is important both for its culinary and medicinal uses. The total annual production of garlic in the country is very low due to use of low yielding varities with poor management practices. However, a vast area of Rangpur district is under char land. Char are newly developed lands in different riverbeds and basins that comprise the area of approx. 0.83 million hector. Flood, flooding depth and period of flooding mainly govern the selection of crops and crop duration. Farmers of char areas grow crops after receding of flood water. Farmers of this area are cultivating local varieties of Garlic which is poor yielder and susceptible to pest and disease. Recently, BARI has developed high yielding varieties of garlic. Introduction of these varieties in char land may increase the yield and income of the farmers. Hence, the performances of these varieties need to be evaluated in char area of northern region.
Materials and Methods
The experiment was conducted at char area, Mornea, Gangachara, Rangpur under ARS, Burirhat, Rangpur during rabi season 2012-13 and 2013-14. The experiment was carried out in split plot design with three replications. Five sowing dates in main plot viz. S1:30 Oct, S2:15 Nov, S3: 30 Nov, S4: 15 Dec and S5:30 Dec and three varieties in sub plot viz. V1: BARI Roshun-1; V2: BARI Roshun-2 and V3: local were accommodated in the experiment in both the year. The fertilizers were applied at the rate of 120-60-160-40-4 kg/ha N P K S and Zn. Half of urea and all other fertilizer were applied as basal during final land preparation. Remaining urea were applied as top-dress in two equal splits at 25 and 50 days after sowing. Size of the plots was 4m x 3m and plant spacing was 20cm x 10cm in 1st year. In 2nd year plot size was 3m x 2m and plant spacing

Charland Eco-System
112
was same. Intercultural operations were done as and when required. Daily maximum and minimum temperature were recorded from October 2012 to May 2013 and the average temperature of growth period (sowing to physical maturity) of the tested crop under each planting dates have been shown in table 1. Yield component data were collected from 10 randomly selected plants prior to harvest from each plot. At harvest, the yield data was recorded plot wise. Collected data were analyzed statistically and means were adjudged by LSD test at 5% level of significance using MSTAT-C package.
Results and Discussion
Effect of sowing date
Plant height, number of leaves/plant, single Bulb weight, number of cloves/bulb and yield differed significantly by sowing time in the both year (Table2). Earliest planting gave the significantly highest value in plant height, number of leaves/plant, Single Bulb weight, number of cloves/bulb and yield in the both year. The highest yield 6.80 t/ha and 6.39 t/ha was obtained from 30 October (2012-13 and 2013-14 respectively) planting and the lowest yield 3.22 t/ha and 2.99 t/ha was recorded in 30 December (2012-13 and 2013-14 respectively) planting. In early planting, plants attained higher vegetative growth which possibly led to the development of larger bulb and higher yield. Late planting produced smaller bulbs and lower yield which may be explained in a way that the plants did not get a long cool growing period which was essential for proper development of vegetative growth for garlic.
Effect of variety
Different variety showed significantly variations on their effect on plant height, number of leaves/plant, single bulb weight, number of cloves/bulb and yield in the both year (Table3). The highest plant height 49.79cm at 2012-13 and 50.35cm at 2013-14 was obtained from BARI Roshun-1 and the lowest 43.68cm and 45.55 cm (2012-13 and 2013-14 respectively) was found in local variety. Significantly the highest bulb weight 15.95g and 15.41g (2012-13 and 2013-14 respectively) was recorded from BARI Roshun-1 which were higher than the other variety. The highest number of cloves/bulb 20.05 and 19.4 was recorded from BARI Roshun-1 (2012-13 and 2013-14 respectively) which was statistically similar with local variety (19.94) during 2012-13 but significantly differed with local variety (17.8) during 2013-14. Significantly the highest bulb yield 5.53 t/ha was obtained from BARI Roshun-1 which was statistically similar with local variety and lowest bulb yield 4.76 t/ha was recorded in BARI Roshun-2 during 2012-13. In 2013-14, significantly the highest bulb yield 5.20 t/ha was obtained from BARI Roshun-1 and the lowest bulb yield 4.77 t/ha was recorded in local variety.
Effect of Interaction
In both the year, interaction effect of varieties and sowing times showed significant effect on single bulb weight, number of cloves/bulb and yield (Table 4). In 2012-13, the highest bulb yield was recorded from BARI Roshun-1 in 30 October planting which was statistically similar with S1V3 (local variety and 30 October planting), S2V1 (15 November planting with BARI Roshun-1) and S1V2 (30 October planting with BARI Roshun-2) treatments combination and the lowest bulb yield was recorded in S5V2 (30 December planting with BARI Roshun-2) but in 2013-14, significantly the highest bulb yield was recorded in S1V1 (30 October planting with BARI roshun-1) which was statistically higher than the other variety and the lowest bulb yield was obtained from S5V2 (30 December planting with BARI Roshun-2).

Charland Eco-System
113
Table1. Average temperature (0C) of growth period of the tested crop under different planting dates in 2012-13 and 2013-14.
Planting dates Minimum Maximum Mean 20012-13 2013-14 20012-13 2013-14 20012-13 2013-14
30 October 14.2 14.5 26.3 26.1 20.3 20.3 15 November 14.6 14.6 26.4 26.2 20.5 20.4 30 November 15.2 14.9 27.2 26.4 21.2 20.7 15 December 15.6 15.1 27.4 26.5 21.5 20.8 30 December 15.8 15.8 28.0 27.7 21.9 21.8
Table 2. Effect of sowing date on yield and yield contributing characters of garlic varieties at charland of Rangpur during rabi season 2012-13 and 2013-14.
Treatment Plant height (cm) Single Bulb wt. (g) Cloves/bulb (no.) Yield (t/ha) 2012-13 2013-14 2012-13 2013-14 2012-13 2013-14 2012-13 2013-14
S1= 30 October 57.36 59.70 18.77 17.91 21.9 22.0 6.80 6.39 S2 = 15 November 52.73 53.59 16.77 16.61 20.9 20.9 6.38 5.92 S3 = 30 November 48.14 49.30 14.84 15.08 20.8 19.1 5.36 5.14 S4 = 15 December 42.08 39.56 13.25 13.05 18.3 17.1 4.21 4.14 S5 = 30 December 37.56 36.66 11.42 10.99 17.0 12.7 3.22 2.99 LSD (0.05) 1.97 3.23 0.91 0.52 0.46 1.04 0.27 0.25 CV% 4.26 5.80 6.24 2.62 2.37 3.51 5.24 3.34
Table 3. Effect of variety on yield and yield contributing characters of garlic at charland Rangpur during rabi season 2012-13 and 2013-14.
Treatment Plant height (cm) Leaves/plant (no.) Single Bulb wt. (g)
Cloves/bulb(no.) Yield (t/ha)
2012-13 2013-14 2012-13 2013-14 2012-13 2013-14 2012-13 2013-14 2012-13 2013-14 V1= BARI roshun-1
49.79 50.35 6.7 7.2 15.95 15.41 20.05 19.4 5.53 5.20
V2= BARI roshun-2
49.25 47.38 7.0 6.8 14.46 14.58 19.32 17.9 4.76 4.78
Local 43.68 45.55 6.6 6.6 14.62 14.20 19.94 17.8 5.30 4.77
LSD (0.05) 3.03 2.11 NS 0.45 0.76 0.29 0.48 0.49 0.36 0.13
CV% 4.26 5.80 8.82 8.59 6.24 2.62 2.37 3.51 5.24 3.34
Main plot
S5 :30 December
Sub plot S1:30 October V1: BARI Roshun-1 S2:15 November V2: BARI Roshun-2 S3: 30 November V3: local S4: 15 December
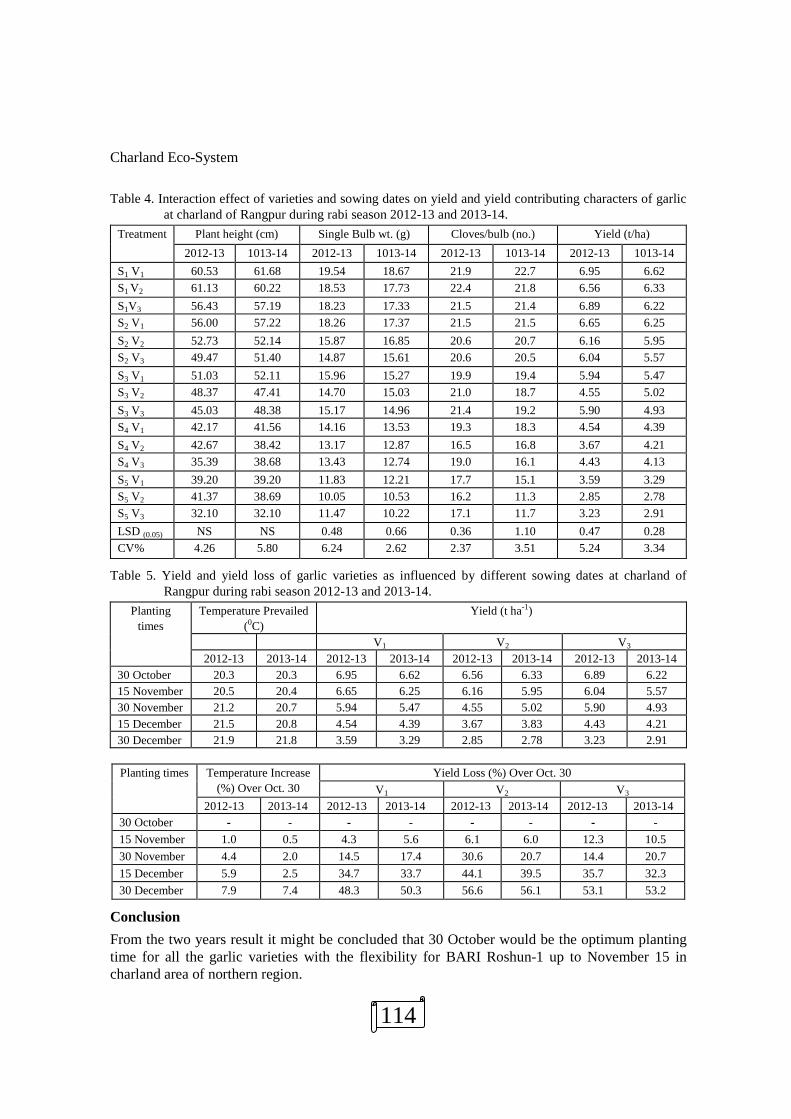
Charland Eco-System
114
Table 4. Interaction effect of varieties and sowing dates on yield and yield contributing characters of garlic at charland of Rangpur during rabi season 2012-13 and 2013-14.
Treatment Plant height (cm) Single Bulb wt. (g) Cloves/bulb (no.) Yield (t/ha) 2012-13 1013-14 2012-13 1013-14 2012-13 1013-14 2012-13 1013-14
S1 V1 60.53 61.68 19.54 18.67 21.9 22.7 6.95 6.62 S1 V2 61.13 60.22 18.53 17.73 22.4 21.8 6.56 6.33 S1V3 56.43 57.19 18.23 17.33 21.5 21.4 6.89 6.22 S2 V1 56.00 57.22 18.26 17.37 21.5 21.5 6.65 6.25 S2 V2 52.73 52.14 15.87 16.85 20.6 20.7 6.16 5.95 S2 V3 49.47 51.40 14.87 15.61 20.6 20.5 6.04 5.57 S3 V1 51.03 52.11 15.96 15.27 19.9 19.4 5.94 5.47 S3 V2 48.37 47.41 14.70 15.03 21.0 18.7 4.55 5.02 S3 V3 45.03 48.38 15.17 14.96 21.4 19.2 5.90 4.93 S4 V1 42.17 41.56 14.16 13.53 19.3 18.3 4.54 4.39 S4 V2 42.67 38.42 13.17 12.87 16.5 16.8 3.67 4.21 S4 V3 35.39 38.68 13.43 12.74 19.0 16.1 4.43 4.13 S5 V1 39.20 39.20 11.83 12.21 17.7 15.1 3.59 3.29 S5 V2 41.37 38.69 10.05 10.53 16.2 11.3 2.85 2.78 S5 V3 32.10 32.10 11.47 10.22 17.1 11.7 3.23 2.91 LSD (0.05) NS NS 0.48 0.66 0.36 1.10 0.47 0.28 CV% 4.26 5.80 6.24 2.62 2.37 3.51 5.24 3.34
Table 5. Yield and yield loss of garlic varieties as influenced by different sowing dates at charland of Rangpur during rabi season 2012-13 and 2013-14.
Planting times
Temperature Prevailed (0C)
Yield (t ha-1)
V1 V2 V3 2012-13 2013-14 2012-13 2013-14 2012-13 2013-14 2012-13 2013-14
30 October 20.3 20.3 6.95 6.62 6.56 6.33 6.89 6.22 15 November 20.5 20.4 6.65 6.25 6.16 5.95 6.04 5.57 30 November 21.2 20.7 5.94 5.47 4.55 5.02 5.90 4.93 15 December 21.5 20.8 4.54 4.39 3.67 3.83 4.43 4.21 30 December 21.9 21.8 3.59 3.29 2.85 2.78 3.23 2.91
Planting times Temperature Increase
(%) Over Oct. 30 Yield Loss (%) Over Oct. 30
V1 V2 V3 2012-13 2013-14 2012-13 2013-14 2012-13 2013-14 2012-13 2013-14
30 October - - - - - - - - 15 November 1.0 0.5 4.3 5.6 6.1 6.0 12.3 10.5 30 November 4.4 2.0 14.5 17.4 30.6 20.7 14.4 20.7 15 December 5.9 2.5 34.7 33.7 44.1 39.5 35.7 32.3 30 December 7.9 7.4 48.3 50.3 56.6 56.1 53.1 53.2
Conclusion From the two years result it might be concluded that 30 October would be the optimum planting time for all the garlic varieties with the flexibility for BARI Roshun-1 up to November 15 in charland area of northern region.

Charland Eco-System
115
PERFORMANCE OF LENTIL VARIETIES IN CHAR LAND AREA
M. Z. Ali, M. A. Aziz, M. A. Rahaman, M. H. Shamim and M. N. Islam
Abstract An experiment was conducted at the char land of Jamuna river under Bhuapur Upazilla Tangail (AEZ-8) during the rabi 2014-2015 to find out suitable lentil varieties for char land area of Tangail and to increase production. Four modern lentil varieties viz. BARI Masur-3, BARI Masur-4, BARI Masur-5 and BARI Masur-6 were tested against a local check. All BARI released lentil varieties proved superior over local one. Among these varieties, BARI Masur-6 produced the highest seed yield of 1.73 t ha-1 (92.22% higher yield over local variety) followed by BARI Masur-5 (1.46 t ha-1, 62.22% higher yield over local variety), BARI Masur-3 (1.21 t ha-1, 34.44% higher yield over local variety) and BARI Masur-4 (1.05 t ha-1, 16.67% higher yield over local variety). The results revealed that BARI Masur-6 and BARI Masur-5 are suitable for cultivation in charland of Jamuna river under Bhuapur, Tangail (AEZ-8).
Introduction
Bangladesh rank 3rd in terms of area and production among the lentil growing countries of the Asia pacific region. In case of area and production lentil is the second most important pulse crop but stands first in case of consumers’ preference in the country. Lentil contains carbohydrates, mainly starches (55-65%), proteins including essential amino acids (24-28%) and fat (1-4%) (Mehta et. al. 2005). In addition to their food value lentil also plays an important role in cropping systems because of its ability to fix nitrogen (101 kg/ha/annum) and thereby enrich the soil (Yadav et al., 1994). It is grown on about 82,996 ha, producing 80,000 tons of grain, with the average yield of 964 kg ha-1, and contributes about 35% of the total pulses production (BBS, 2011). Domestic pulses production satisfies less than half of country’s need. The rest, some 1,40,000 tons is imported at a cost of about US$ 32.2 million per annum. Trend of area, production and yield of lentil in Bangladesh decline during 1976 to 2001 (Islam and Ali, 2002). Chars are newly developed lands in different river beds and basin. The area under char land is estimated to be 0.82 m ha in Bangladesh. Main constraints of char lands are uncertain flood, duration of flood and flood depth. At present some char lands are used for cultivation of tobacco, pulse crops and wheat. Among pulse crops lentil is the most important. Some farmers of char area grow local variety of lentil in broadcast method with low yield potentiality. The existing residual soil moisture retaining in the soil could also be enough for growth and production of lentil. In this context, a trial was conducted at the char lands with BARI developed HYV lentil varieties to icrease yields and maximize farmers’ income.
Materials and Methods
The trial was conducted at the charland of the Jamuna river at the MLT site, Bhuapur, Tangail (AEZ- 8) during the rabi 2014-15 to find out lentil variety for charland area of Tangail and increase production and economic return of farmers. The soil of the experimental field was silty loam in texture with pH 6.97 belonging to Grey Floodplain soil (AEZ-8). Soil samples from experimental plots were collected and analyzed. The physical and chemical properties of soil of experimental field are presented in Table 1.

Charland Eco-System
116
Table 1. Physical and chemical properties of experimental field (Bhuapur char) Location AEZ PH OM (%) Total
N (%) Available P (µg/ml)
Exchangeable K (meg/100g)
Available S (µg/ml)
Available B (µg/ml)
Bhuapur charland 8 6.97 1.48VL 0.067 VL
4.39 VL
0.181 M
15.46 M
0.248 M
Critical levels - - - 14 0.20 14 0.20
M= Medium, VL= Very low
Four high yielding lentil varieties viz. BARI Masur-3, BARI Masur-4, BARI Masur-5 and BARI Masur-6 were tested against a local cultivar. The experiment was laid out in RCB design in three farmers’ field considering as three replications. The unit plot size was 8m × 5m. The plots were fertilized with 21-36-25-10 and 0.4 kg ha-1 N P K S and B respectively. All the fertilizer was applied at the time of final land preparation in the form of urea, triple super phosphate, muriate of potash, gypsum and boric acid respectively. The seeds were sown on 11-16 November 2014 maintaining 30 cm line to line distance with seed rate of 35 kg ha-1. Two weeding were done at 25 and 45 DAS. Other necessary managements were done as and when necessary. The crop was harvested on 04-09 March 2015. The data on different plant characters, yield components and seed yield were recorded having from 10 plants randomly selected in each plot. Yield was calculated from whole plot basis. Collected data were analyzed statistically and means were adjusted using LSD Test at 5% level of significance using Crop Stat package and presented in Table 2.
Results and Discussion
Plant population m-2, effective pods plant-1, seeds pod-1, 1000-seed weight and seed yield differed significantly in different lentil varieties (Table 2). Significantly the highest plant population m-2 (66.33) was recorded in BARI Masur-6 which was statistically identical with BARI Masur-5, BARI Masur-3 and local variety (65.33, 59.00 and 58.00) and the lowest plant population m-2 (56.00) was obtained from in BARI Masur-4. The highest number of effective pods plant-1 (76.83) was obtained from in BARI Masur-6 which was statistically identical with in BARI Masur-5 (69.63). The lowest number of pods plant-1 (57.50) was recorded from local variety (control) which was at par with BARI Masur-3 and in BARI Masur-4 (62.77 and 60.17). Significantly the highest number of seeds pod-1 (2.22) was recorded in BARI Masur-5 which was at par with BARI Masur-3 (2.13) and BARI Masur-6 (2.10). Significantly the lowest number of seeds pod-1 (1.92) was recorded in BARI Masur-4 which was statistically identical with local variety (2.00). The highest 1000 seed weight (19.67 g) was obtained from BARI Masur-6 which was statistically similar with BARI Masur-3 (18.33 g) and in BARI Masur-4 (17.27 g). The lowest 1000 seed weight (13.83 g) was obtained from local variety (Control) which was statistically similar with BARI Masur-5 (16.83 g). Among the different lentil varieties, significantly the highest seed yield (1.73 t ha-1) (92.22% higher over local variety) was recorded from BARI Masur-6 followed by BARI Masur-5 (1.46 t ha-1) (62.22% higher over local variety), BARI Masur-3 (1.21 t ha-1) (34.44% higher over local variety) and BARI Masur-4 (1.05 t ha-1) (16.67% higher over local variety). The lowest seed yield 0.90 t ha-1 was obtained from local variety. The highest plant m-2, pods plant-1 and 1000 seed weight obtained from BARI Masur-6 and BARI Masur-5 that might contributed the highest seed yield.

Charland Eco-System
117
References Ahmed. M., M. N. Islam., M. T. Rahman and S. S. Kakon. 2009. Performance of different chickpea varieties in
charland areas (AEZ-11). Charland Research. Agronomy Division, Bangladesh Agricultural Research Institute, Joydebpur-Gazipur-1701. 11-13pp.
BBS (Bangladesh Bureau of Statistics) 2011. Year Book of Agricultural Statistics of Bangladesh. Statistics Division, Ministry of Planning. Government of Bangladesh.
Islam. M. N., F. Ahmed., M. S. A. Khan and W. Sultana. 2009. Varietal trail of HYV mustard at newly developed charland. Charland Research. Agronomy Division, Bangladesh Agricultural Research Institute, Joydebpur-Gazipur-1701. 1-4pp.
Islam. M. N.,M. Akteruzzaman and M. S. Rahma. 2009. Performance of lentil varieties in charland areas (AEZ-11). Charland Research. Agronomy Division, Bangladesh Agricultural Research Institute, Joydebpur-Gazipur-1701. 11-13pp.
Islam. Q.M. S. and Ali, M. O. 2002. Research Report on Pulses Scocio-ecocomics. A report of Pulses Research Centre, BARI, Ishurdi, Pabna, Bangladesh. 1-15 pp.
Kakon. S. S., M. N. Islam., M. Biswas., I. M. Ahmed and W. Sultana. 2009. Performance of field pea varieties in charland areas (AEZ-9). Charland Research. Agronomy Division, Bangladesh Agricultural Research Institute, Joydebpur-Gazipur-1701. 11-13pp.
Mehta. S. L, I. M. Santha and M. L. Lodha. 2005. Nutritional quality of Grain legumes. Souvenir ILFRC-IV, 2005, New Delhi India, PP-7-14.
S. Begum., M. N. Islam., S. S. Kakon and M. Biswas. 2009. Performance of Mungbean varieties in charland areas (AEZ-9 and AEZ-11). Charland Research. Agronomy Division, Bangladesh Agricultural Research Institute, Joydebpur-Gazipur-1701. 5-7pp.
Yadav, D. S., K. S. Panwar and V. K. Singh. 1994. Management of pulse crops in sequential cropping. 27 p.
Table 2. Performance of different lentil varieties at the MLT site Bhuapur, Tangail during 2014-15 Variety Plants m-2
(no.) Pods plant-1
(no.) Seeds pod-1
(no.) 1000 Seed
Wt.(g) Seed Yield (t ha-1)
2013-14 2014-15 BARI Mosur-3 59.00 62.77 2.13 18.13 1.18 1.21 BARI Mosur-4 56.00 60.17 1.92 17.27 1.03 1.05 BARI Mosur-5 65.33 69.63 2.22 16.83 1.24 1.46 BARI Mosur-6 66.33 76.83 2.10 19.67 1.52 1.73 Local 58.00 57.50 2.00 13.83 0.83 0.90 LSD(0.05) 7.72 6.18 0.11 1.02 0.14 0.21 CV(%) 6.70 5.00 2.90 3.20 6.80 8.90
Farmers’ opinion
Farmers are interested to cultivate BARI released lentil varieties especially BARI Masur-6 and BARI Masur-5 for their satisfactory higher yield over local one. They also choose the varieties for its seed size, disease and pest resistance over the local variety. The farmers also opined that they would store the BARI Masur-6 and BARI Masur-5 seeds for the next year cultivation.
Conclusion
The results revealed that BARI Masur-6 and BARI Masur-5 are suitable for char land of Jamuna river under Bhuapur Upazilla, Tangail (AEZ-8) higher yield.

Charland Eco-System
118
PERFORMANCE OF DIFFERENT FRENCH BEAN VARIETIES IN CHARLAND AREA
S.S.Kakon, M.N. Islam, M. A. Rahman and M. A. Aziz
Abstract An experiment was conducted at the char land of Bhuapur, Tangail during the rabi 2014-15 to evaluate the performance of three french bean varieties (BARI Jharsheem-1, BARI Jharsheem-2, BARI Jharsheem-3). Yield and yield attributes of bush bean varieties significantly differed in charland. The highest pod yield (17.63 t ha-1) was obtained from BARI Jharsheem-3. The second highest pod yield (16.94 t ha-1) was obtained from BARI Jharsheem-1, while the lowest from BARI Jharsheem-2. The results revealed that BARI Jharsheem-3 would be suitable for cultivation at charlad of Bhuapur, Tangail.
Introduction
French bean (Phaseolus vulgaris L.) is a newly introduced high yielding legume crop and can be used as both pulse and vegetable. It is also known as bush bean, kidney bean, snap bean, pinto bean, green bean, raj bean, common bean, basic bean, haricot bean, navy bean, pole bean, wax bean, string bean and bonchi in different parts of the world (Duke, 1983; Salunkhe et al., 1987; Tindall, 1988). In Bangladesh, it is known as Farashi Sheem (Rashid, 1993). The crop is used as green vegetable, shelled green bean, dry bean and pulse. Foliage of the crop may also provide hay, silage and green manures. After harvest, plants can be fed to cattle, sheep and horses. The matured seeds can be used for preparing dal or chatpati. The crop has gained popularity for its short growing duration, high nutritive value and good quality. Green pods are rich in vitamins and minerals. Some farmers of char land area grow local variety of bush bean in broadcast method with low yield potentiality. The existing residual soil moisture retaining in the soil could also be enough for growth and production of bush bean. In this context BARI developed HYV bush bean varieties can be introduced at char land to increase yield and economic return of farmer. Therefore, the experiment was conducted to select suitable HYV bush bean for char land area.
Materials and Methods
The experiment was conducted at the MLT site, Bhuapur, Tangail district during the rabi 2014-15. Three BARI developed bush bean varieties viz., BARI Jharsheem-1, BARI Jharsheem-2 and BARI Jharsheem-3 were evaluated. The experiment was laid out in a randomized complete block design with 3 replications. Seeds were sown on 23-25 November, 2014 with 30 cm × 15 cm spacing. The unit plot size was 8m × 5m. Each unit plot was uniformly fertilized during final land preparation @ 150, 100, 110, 40, 4 kg ha-1 N, P, K, S and Zn, respectively (Based on FRG 2012). The total amount TSP, gypsum, zinc sulphate and 50% of urea were mixed with the soil during final land preparation and the rest urea was top dressed 35 days after sowing (DAS). Irrigation and weeding were done as and when necessary. The crop was harvested during 28 January, 2015 to 12 February, 2015. Data on yield contributing characters were recorded from 10 randomly selected plants from each plot. Yield was calculated from whole plot. Collected data were analyzed statistically and means were compared using Crop Stat package and presented in table 1.

Charland Eco-System
119
Results and Discussion
Yield and yield attributes of different french bean varieties are presented in Table 1. Different varieties had significant effect on yield and yield contributing characters. The highest pod length (13.27 cm) was recorded in BARI Jharsheem-1 followed by BARI Jharsheem-2 (13.17 cm). The highest number of pods plant-1 was recorded in BARI Jharsheem-1 (19.00), followed by BARI Jharsheem-2 (15.67). BARI Jharsheem-3 produced the lowest number of pods plant-1 (12.33). BARI Jharsheem-2 harvested (green pod) about 3 to 8 days earlier compared to other varieties. The variety BARI Jharsheem-3 produced significantly the highest pod yield (17.63 t ha-1) and the second highest pod yield (16.94 t ha-1) was obtained from BARI Jharsheem-1, while the lowest from BARI Jharsheem-2 (14.51 t ha-1). Table 1.Yield and yield attributes of bush bean varieties at the charland of MLT site Bhuapur, Tangail
during rabi, 2014-15 Treatment Plant height
(cm) Pod length
(cm) Pods plant-1
(no.) Pod weight plant-1 (g)
Individual Pod Weight (g)
Yield (t ha-1)
BARI Jharsheem-1 29.47 13.27 19.00 80.77 4.25 16.94 BARI Jharsheem-2 27.90 13.17 15.67 66.83 4.30 14.51 BARI Jharsheem-3 27.87 10.70 12.33 83.87 6.87 17.63 LSD0.05 NS 2.55 1.85 17.02 0.66 2.79 CV (%) 5.60 9.10 5.20 9.90 5.70 7.50
Farmers’ opinion
Farmers are not so interested to cultivate bush bean because they are not habituated to consume this crop. In the local market this crop is not so popular.
Conclusion
From the results it may be concluded that BARI Jharsheem-3 showed better yield performance compared to other varieties in char land of Tangail. BARI Jharsheem-2 harvested (green pod) about 3 to 8 days earlier compared to other varieties. As it is a short duration crop and can consumed as pod vegetables, the farmers of char land area may be benefited through cultivation of BARI Jharsheem-3.
Charland Eco-System
120
PERFORMANCE OF GARLIC VARIETIES AT DIFFERENT SOWING DATE IN CHAR AREA OF NORTHERN REGION
M. A. I. Sarker, S.M.A.H.M. Kamal, M.K. Islam and M.A. Mannaf
Abstract
An experiment was conducted at char area, Mornea, Gangachara, Rangpur under ARS, Burirhat, Rangpur during rabi season 2012-13 and 2013-14. The objective of the trial was to observe the performance of different variety of garlic in different dates of sowing and to get maximum yield of garlic at farmers char areas of northern region. The experiment was carried out in split plot design with three replications. Five sowing dates in main plot viz. S1:30 October, S2:15 November, S3:30 November, S4:15 December and S5:30 December and three varieties in sub plot viz. V1: BARI Roshun-1; V2: BARI Roshun-2 and V3: local were accommodated in the experiment. The highest (5.53 t/ha) yield was observed from BARI Roshun-1 which was statistically similar with local variety and lowest (4.76 t/ha) from BARI Roshun-2 in 1st year while in 2nd year BARI Roshun-1 produced significantly the highest yield (5.20 t/ha) than BARI Roshun-2 and local. In both the year, with the delay in sowing dates from October 30 yield was reduced. The highest (6.80 and 6.39 respectively 2012-13 and 2013-14) bulb yield was recorded when sowing was done on October 30. The lowest (3.22 t/ha in 2012-13 and 2.99 t/ha in 2013-14) yield was obtained from 30 December sowing was 30 October is the best planting time for all the garlic varieties in 1st and 2nd year. Early planting up to 15 November with BARI Roshun-1 may also be considered for better yield of garlic in char area of northern region.
Introduction
Garlic (Alium sativum) is one of the important spices in Bangladesh, it is important both for its culinary and medicinal uses. The total annual production of garlic in the country is very low due to use of low yielding varities with poor management practices. However, a vast area of Rangpur district is under char land. Char are newly developed lands in different riverbeds and basins that comprise the area of approx. 0.83 million hector. Flood, flooding depth and period of flooding mainly govern the selection of crops and crop duration. Farmers of char areas grow crops after receding of flood water. Farmers of this area are cultivating local varieties of Garlic which is poor yielder and susceptible to pest and disease. Recently, BARI has developed high yielding varieties of garlic. Introduction of these varieties in char land may increase the yield and income of the farmers. Hence, the performances of these varieties need to be evaluated in char area of northern region.
Materials and methods
The experiment was conducted at char area, Mornea, Gangachara, Rangpur under ARS, Burirhat, Rangpur during rabi season 2012-13 and 2013-14. The experiment was carried out in split design with three replications. Five sowing dates in main plot viz. S1:30 October, S2:15 November, S3: 30 November, S4: 15 December and S5:30 December and three varieties in sub plot viz. V1: BARI Roshun-1; V2: BARI Roshun-2 and V3: local were accommodated in the experiment in both the year. The fertilizers were applied at the rate of 120-60-160-40-4 kg/ha N P K S and Zn in the format urea, TSP, MoP, Gypsum, and Zinc sulphate. Half of urea
Charland Eco-System
121
and all other fertilizer were applied as basal during final land preparation. Remaining were applied as top-dress in two equal splits at 25 and 50 days after sowing. Size of the plots was 4m x 3m and plant spacing was 20cm × 10cm in 1st year. In 2nd year plot size was 3m x 2m and plant spacing was same. Intercultural operations were done as per needed. Daily maximum and minimum temperature were recorded from October 2012 to May 2013 and the average temperature of growth period (sowing to physical maturity) of the tested crop under each planting dates have been shown in table 1. Data on yield and yield attributes were collected and analyzed statistically.
Results and discussion
Effect of sowing time
Plant height, number of leaves/plant, single Bulb weight, number of cloves/bulb and yield differed significantly by time of sowing in both the year (Table2). Earliest planting gave significantly the highest value in plant height, number of leaves/plant, single bulb weight, number of cloves/bulb and yield in both the years. The highest yield (6.80 t/ha in 1st year and 6.39 t/ha in 2nd year) was obtained from 30 October planting and the lowest (3.22 t/ha in 2012-13 and 2.99 t/ha in 2013-14) was Dec.30 planting. In early sowing, plants attained higher vegetative growth which possibly led to the development of larger bulb and higher yield. Late sowing produced smaller bulbs and lower yield which may be explained in a way that the plants did not get a long cool growing period which was essential for proper development of vegetative growth for garlic.
Effect of variety
Different variety showed significant variations on their effect on plant height, number of leaves/plant, single bulb weight, number of cloves/bulb and yield in both the year (Table3). The highest plant height (49.79cm in 2012-13 and 50.35cm in 2013-14) was obtained from BARI Roshun-1 and the lowest (43.68 and 45.55 cm in 2012-13 and 2013-14 respectively) was found in local variety. Significantly the highest bulb weight (15.95g and 15.41g in 2012-13 and 2013-14 respectively) was recorded from BARI Roshun-1 than the other variety. The highest number of cloves/bulb was recorded in BARI Roshun-1 which was statistically similar with local variety in 1st year. Significantly the highest (5.53 t/ha) yield was observed from BARI Roshun-1 which was statistically similar with local variety and lowest (4.76 t/ha) from BARI Roshun-2 in 1st year. In 2nd year, significantly the highest number of cloves/bulb (19.37) and yield (5.20 t/ha) was obtained from BARI Roshun-1 than the other variety.
Effect of Interaction
In both the year, interaction effect of varieties and sowing dates showed significant effect on single bulb weight, number of cloves/bulb and yield (Table 4). In 1st year, the highest yield was recorded from BARI roshun-1 in 30 October sowing which was statistically similar with 15 November sowing (S2 × V1), (S1 × V2) and (S1 × V3) treatment combination but in 2nd year, significantly the highest yield was observed in 30 October sowing with BARI roshun-1 than the other variety.

Charland Eco-System
122
Table 1. Average temperature (0C) of growth period of the tested crop under different sowing dates in 2012-13 and 2013-14.
Sowing dates Minimum Maximum Mean 1st Year : 2012-13
30 October 14.2 26.3 20.3 15 November 14.6 26.4 20.5 30 November 15.2 27.2 21.2 15 December 15.6 27.4 21.5 30 December 15.8 28.0 21.9
2nd Year : 2013-14 30 October 14.5 26.1 20.3 15 November 14.6 26.2 20.4 30 November 14.9 26.4 20.7 15 December 15.1 26.5 20.8 30 December 15.8 27.7 21.8
Table 2. Effect of sowing time on yield and yield contributing characters of garlic varieties at char area, Mornea, Gangachara, Rangpur under ARS, Burirhat, Rangpur during rabi season 2012-13 and 2013-14.
Treatment Plant height (cm)
Leaves/plant (no.)
Single Bulb wt. (g)
Cloves/bulb (no.)
Yield (t/ha)
1st Year : 2012-13 30 October 57.36 8.1 18.77 21.9 6.80 15 November 52.73 7.7 16.77 20.9 6.38 30 November 48.14 7.0 14.84 20.8 5.36 15 December 42.08 5.9 13.25 18.3 4.21 30 December 37.56 5.3 11.42 17.0 3.22 LSD (0.05) 1.97 0.65 0.91 0.46 0.27 CV% 4.26 8.82 6.24 2.37 5.24
2nd Year : 2013-14 30 October 59.70 8.5 17.91 22.0 6.39 15 November 53.59 7.9 16.61 20.9 5.92 30 November 49.30 7.1 15.08 19.1 5.14 15 December 39.56 5.9 13.05 17.1 4.14 30 December 36.66 5.2 10.99 12.7 2.99 LSD (0.05) 3.23 0.97 0.52 1.04 0.25 CV% 5.80 8.59 2.62 3.51 3.34
Table 3. Effect of variety on yield and yield contributing characters of garlic varieties at char area, Mornea, Gangachara, Rangpur under ARS, Burirhat, Rangpur during rabi season 2012-13 and 2013-14.
Treatment Plant height (cm)
Leaves/plant (no.)
Single Bulb wt. (g)
Cloves/bulb (no.)
Yield (t/ha)
1st Year : 2012-13 BARI Roshun-1 49.79 6.7 15.95 20.05 5.53 BARI Roshun-2 49.25 7.0 14.46 19.32 4.76 Local 43.68 6.6 14.62 19.94 5.30 LSD (0.05) 3.03 NS 0.76 0.48 0.36 CV% 4.26 8.82 6.24 2.37 5.24

Charland Eco-System
123
2nd Year : 2013-14 BARI Roshun-1 50.35 7.2 15.41 19.4 5.20 BARI Roshun-2 47.38 6.8 14.58 17.9 4.78 Local 45.55 6.6 14.20 17.8 4.77 LSD (0.05) 2.11 0.45 0.29 0.49 0.13 CV% 5.80 8.59 2.62 3.51 3.34
Table 4. Interaction effect of varieties and sowing times on yield and yield contributing characters of garlic varieties at char area, Mornea, Gangachara, Rangpur under ARS, Burirhat, Rangpur during rabi season 2012-13 and 2013-14.
Treatment Plant height (cm)
Leaves/plant (no.)
Single Bulb wt. (g)
Cloves/bulb (no.)
Yield (t/ha)
1st Year : 2012-13
S1 × V1 60.53 8.0 19.54 21.9 6.95
S1 × V2 61.13 8.6 18.53 22.4 6.56
S1× V3 56.43 7.7 18.23 21.5 6.89
S2 × V1 56.00 7.5 18.26 21.5 6.65
S2 × V2 52.73 8.2 15.87 20.6 6.16
S2 × V3 49.47 7.5 14.87 20.6 6.04
S3 × V1 51.03 6.5 15.96 19.9 5.94
S3 × V2 48.37 7.3 14.70 21.0 4.55
S3 × V3 45.03 7.1 15.17 21.4 5.90
S4 × V1 42.17 6.2 14.16 19.3 4.54
S4 × V2 42.67 5.9 13.17 16.5 3.67
S4 × V3 35.39 5.5 13.43 19.0 4.43
S5 × V1 39.20 5.4 11.83 17.7 3.59
S5 × V2 41.37 5.2 10.05 16.2 2.85
S5 × V3 32.10 5.2 11.47 17.1 3.23
LSD (0.05) NS NS 0.48 0.36 0.47
CV(%) 4.26 8.82 6.24 2.37 5.24
2nd Year : 2013-14
S1 × V1 61.68 9.1 18.67 22.7 6.62
S1 × V2 60.22 8.3 17.73 21.8 6.33
S1× V3 57.19 8.0 17.33 21.4 6.22
S2 × V1 57.22 8.0 17.37 21.5 6.25
S2 × V2 52.14 8.1 16.85 20.7 5.95
S2 × V3 51.40 7.5 15.61 20.5 5.57
S3 × V1 52.11 7.4 15.27 19.4 5.47
S3 × V2 47.41 6.7 15.03 18.7 5.02
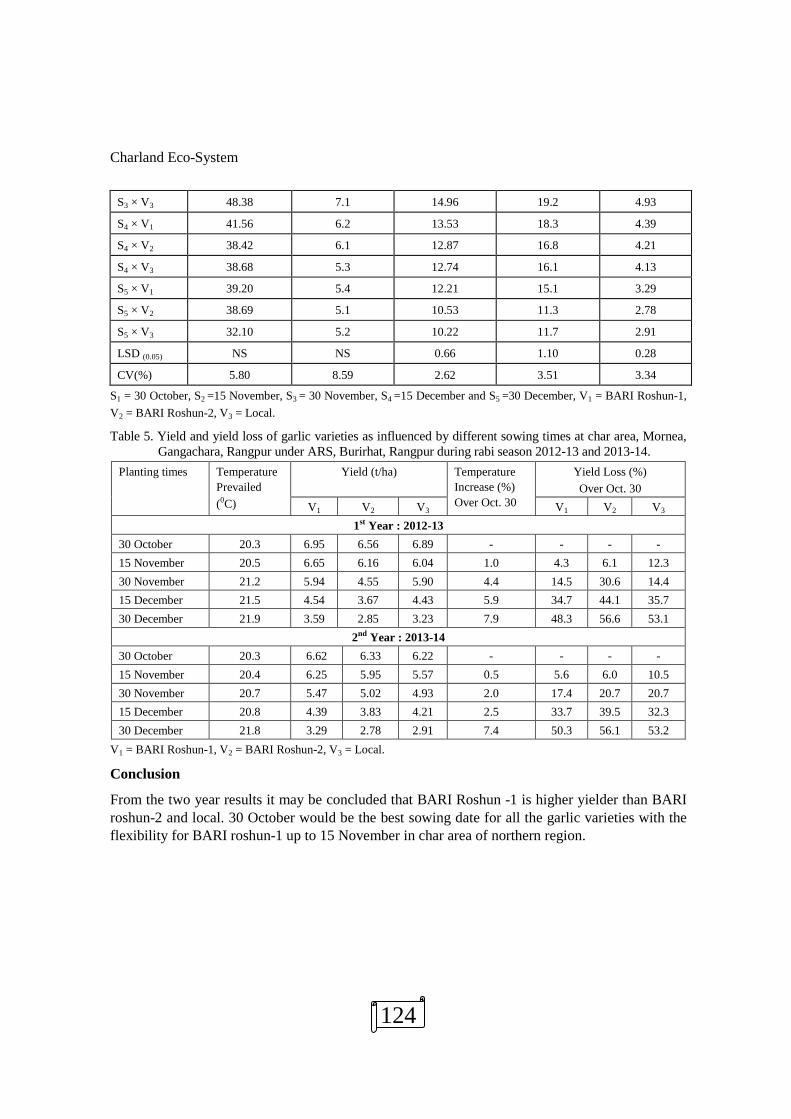
Charland Eco-System
124
S3 × V3 48.38 7.1 14.96 19.2 4.93
S4 × V1 41.56 6.2 13.53 18.3 4.39
S4 × V2 38.42 6.1 12.87 16.8 4.21
S4 × V3 38.68 5.3 12.74 16.1 4.13
S5 × V1 39.20 5.4 12.21 15.1 3.29
S5 × V2 38.69 5.1 10.53 11.3 2.78
S5 × V3 32.10 5.2 10.22 11.7 2.91
LSD (0.05) NS NS 0.66 1.10 0.28
CV(%) 5.80 8.59 2.62 3.51 3.34
S1 = 30 October, S2 =15 November, S3 = 30 November, S4 =15 December and S5 =30 December, V1 = BARI Roshun-1, V2 = BARI Roshun-2, V3 = Local.
Table 5. Yield and yield loss of garlic varieties as influenced by different sowing times at char area, Mornea, Gangachara, Rangpur under ARS, Burirhat, Rangpur during rabi season 2012-13 and 2013-14.
Planting times Temperature Prevailed (0C)
Yield (t/ha) Temperature Increase (%) Over Oct. 30
Yield Loss (%) Over Oct. 30
V1 V2 V3 V1 V2 V3 1st Year : 2012-13
30 October 20.3 6.95 6.56 6.89 - - - - 15 November 20.5 6.65 6.16 6.04 1.0 4.3 6.1 12.3 30 November 21.2 5.94 4.55 5.90 4.4 14.5 30.6 14.4 15 December 21.5 4.54 3.67 4.43 5.9 34.7 44.1 35.7 30 December 21.9 3.59 2.85 3.23 7.9 48.3 56.6 53.1
2nd Year : 2013-14 30 October 20.3 6.62 6.33 6.22 - - - - 15 November 20.4 6.25 5.95 5.57 0.5 5.6 6.0 10.5 30 November 20.7 5.47 5.02 4.93 2.0 17.4 20.7 20.7 15 December 20.8 4.39 3.83 4.21 2.5 33.7 39.5 32.3 30 December 21.8 3.29 2.78 2.91 7.4 50.3 56.1 53.2
V1 = BARI Roshun-1, V2 = BARI Roshun-2, V3 = Local.
Conclusion
From the two year results it may be concluded that BARI Roshun -1 is higher yielder than BARI roshun-2 and local. 30 October would be the best sowing date for all the garlic varieties with the flexibility for BARI roshun-1 up to 15 November in char area of northern region.
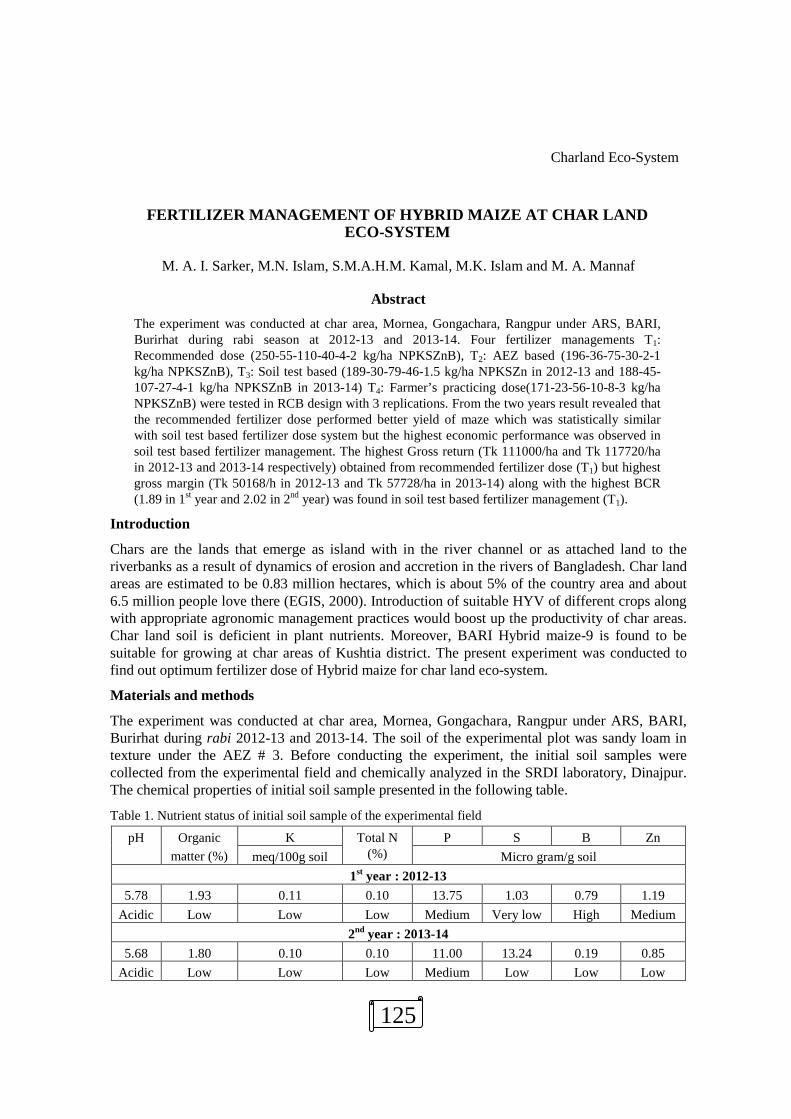
Charland Eco-System
125
FERTILIZER MANAGEMENT OF HYBRID MAIZE AT CHAR LAND ECO-SYSTEM
M. A. I. Sarker, M.N. Islam, S.M.A.H.M. Kamal, M.K. Islam and M. A. Mannaf
Abstract The experiment was conducted at char area, Mornea, Gongachara, Rangpur under ARS, BARI, Burirhat during rabi season at 2012-13 and 2013-14. Four fertilizer managements T1: Recommended dose (250-55-110-40-4-2 kg/ha NPKSZnB), T2: AEZ based (196-36-75-30-2-1 kg/ha NPKSZnB), T3: Soil test based (189-30-79-46-1.5 kg/ha NPKSZn in 2012-13 and 188-45-107-27-4-1 kg/ha NPKSZnB in 2013-14) T4: Farmer’s practicing dose(171-23-56-10-8-3 kg/ha NPKSZnB) were tested in RCB design with 3 replications. From the two years result revealed that the recommended fertilizer dose performed better yield of maze which was statistically similar with soil test based fertilizer dose system but the highest economic performance was observed in soil test based fertilizer management. The highest Gross return (Tk 111000/ha and Tk 117720/ha in 2012-13 and 2013-14 respectively) obtained from recommended fertilizer dose (T1) but highest gross margin (Tk 50168/h in 2012-13 and Tk 57728/ha in 2013-14) along with the highest BCR (1.89 in 1st year and 2.02 in 2nd year) was found in soil test based fertilizer management (T1).
Introduction
Chars are the lands that emerge as island with in the river channel or as attached land to the riverbanks as a result of dynamics of erosion and accretion in the rivers of Bangladesh. Char land areas are estimated to be 0.83 million hectares, which is about 5% of the country area and about 6.5 million people love there (EGIS, 2000). Introduction of suitable HYV of different crops along with appropriate agronomic management practices would boost up the productivity of char areas. Char land soil is deficient in plant nutrients. Moreover, BARI Hybrid maize-9 is found to be suitable for growing at char areas of Kushtia district. The present experiment was conducted to find out optimum fertilizer dose of Hybrid maize for char land eco-system.
Materials and methods
The experiment was conducted at char area, Mornea, Gongachara, Rangpur under ARS, BARI, Burirhat during rabi 2012-13 and 2013-14. The soil of the experimental plot was sandy loam in texture under the AEZ # 3. Before conducting the experiment, the initial soil samples were collected from the experimental field and chemically analyzed in the SRDI laboratory, Dinajpur. The chemical properties of initial soil sample presented in the following table.
Table 1. Nutrient status of initial soil sample of the experimental field
pH Organic matter (%)
K Total N (%)
P S B Zn meq/100g soil Micro gram/g soil
1st year : 2012-13 5.78 1.93 0.11 0.10 13.75 1.03 0.79 1.19
Acidic Low Low Low Medium Very low High Medium 2nd year : 2013-14
5.68 1.80 0.10 0.10 11.00 13.24 0.19 0.85 Acidic Low Low Low Medium Low Low Low

Charland Eco-System
126
Four fertilizer management treatments were tested in RCB design with 3 replications viz., T1 : Recommended dose (250-55-110-40-4-2 kg/ha NPKSZnB), T2 : AEZ based (196-36-75-30-2-1 kg/ha NPKSZnB), T3: Soil test based (189-30-79-46-1.5 kg/ha NPKSZn in 2012-13 and 188-45-107-27-4-1 kg/ha NPKSZnB in 2013-14), T4 : Farmer’s practicing dose(171-23-56-10-8-1.5 kg/ha NPKSZnB). The spacing maintained for Maize was 60 cm × 20 cm. The size of the unit plot was 4m × 3m. Seeds of BARI Hybrid maize-9 were sown on 6 December, 2012 and 13 December, 2013. Half of N and full dose of other fertilizer was applied as basal. Rest N was applied as top dress in two equal splits at 40 and 60 days after sowing. Irrigation, other management and plant protection measures were done as required. Maize was harvested at 15 May on 2013 and 28 May on 2014. Necessary data were recorded and analyzed and presented in the tables.
Results and discussion
Effect on maize
Number of seeds/cob, 1000 seed weight and yield were significantly influenced by the fertilizer treatments in both the year. The highest number of seeds/cob (485.67 in 2012-13 and 568.20 in 2013-14) and 1000 seed wt. (348.70g in 1st year and 463.67 in 2nd year) were counted from the T1 (Recommended dose) treatment which was statistically at par with the treatment T3 (Soil test based). Significantly the highest yield (9.25 t/ha in 2012-13 and 9.81 t/ha in 2013-14) was obtained from T1 treatment that was statistically identical to T3 treatment. The lowest yield (6.12 t/ha in 1st year and 6.79 t/ha in 2nd year) was observed in T4 (Farmer’s practicing dose) treatment.
Economics
The highest gross return (Tk 111000/ha and Tk 117720/ha in 2012-13 and 2013-14 respectively) was obtained from T1 due to the highest maize yield. In both the year, cost of production was also highest in T1 treatment than the other treatments due to involvement of more fertilizer cost. The highest gross margin (Tk 50168/ha in 2012-13 and Tk 57728/ha in 2013-14) and BCR (1.89 in 1st year and 2.02 in 2nd year) was recorded in T3 treatment due to the lowest fertilizer cost.
Table 2. Grain yield and yield attributes of maize as influenced by fertilizer management of Hybrid maize at char area, Mornea, Gangachara, Rangpur under ARS, Burirhat, Rangpur during rabi season 2012-13 and 2013-14
Treatment Plants/m2 (no.)
Cobs/plant (no.)
Seeds/cob (no.)
1000- seeds wt. (g)
Grain yield (t/ha)
1st year : 2012-13 T1 8.17 1.08 485.67 348.70 9.25 T2 8.00 1.05 441.00 331.20 8.15 T3 8.08 1.04 455.33 334.42 8.89 T4 7.83 1.02 419.00 312.35 6.12 LSD (0.05) NS NS 41.41 16.48 1.04 CV (%) 4.29 2.64 4.60 2.49 6.31
2nd year : 2013-14 T1 8.17 1.20 568.20 463.67 9.81 T2 8.00 1.07 521.33 441.33 8.42 T3 8.08 1.13 545.60 451.67 9.52 T4 7.83 1.03 501.00 409.33 6.79 LSD (0.05) NS NS 30.83 21.00 1.22 CV (%) 6.74 8.11 2.89 2.38 7.08

Charland Eco-System
127
Table 3. Economics as influenced by fertilizer management of Hybrid maize at char area, Mornea, Gangachara, Rangpur under ARS, Burirhat, Rangpur during rabi season 2012-13 and 2013-14
Treatment Maize yield (t/ha)
GR (Tk/ha)
VC (Tk/ha)
GM (Tk/ha)
BCR
1st year : 2012-13 T1 9.25 111000 62500 48500 1.78 T2 8.15 97800 57092 40708 1.71 T3 8.89 106680 56512 50168 1.89 T4 6.12 73440 58173 15267 1.26
2nd year : 2013-14 T1 9.81 117720 62500 55220 1.88 T2 8.42 101040 57092 43948 1.77 T3 9.52 114240 56512 57728 2.02 T4 6.79 81480 58173 23307 1.40
T1 : Recommended dose (250-55-110-40-4-2 kg/ha NPKSZnB), T2 : AEZ based (196-36-75-30-2-1 kg/ha NPKSZnB), T3 : Soil test based (189-30-79-46-1.5 kg/ha NPKSZnB in 2012-13 and 188-45-107-27-4-1 kg/ha NPKSZnB in 2013-14), T4 : Farmer’s practicing dose(171-23-56-10-8-3 kg/ha NPKSZnB)
Input price
Price (Tk./kg): Urea=20, TSP=20, MP=15, Gypsum=7, Zinc sulphate=165, Boric acid=120
Output price (Tk./kg)
Maize grain=12
Conclusion
From years results it might be concluded that soil test based fertilizer management (T3 treatment) for Hybrid maize would be better for char area.

Charland Eco-System
128
ADAPTATION OF BARI RELEASED CROP VARIETIES IN CHARLAND
M. A. K. Main, M. R. Islam and J. Hossain
Abstract
The adaptive trial was conducted at two locations of charland of Pandma and Jamuna during 2014-2015. Among the four mustard varieties, BARI Sarisha-11 gave the highest seed yield (1778 kg/ha). Wheat varieties of BARI Gom-27 and BARI Gom-28 showed higher grain yield (2662-2918 kg/ha) as compared to BARI Gom-26 at both the locations. BARI Mosur-7 gave higher seed yield of 1950 kg/ha.
Introduction
Due to environmental changes crop production techniques should be adapted to overcome the stress condition. Charland is an adverse agro-ecosystem. Crop production at Charland mainly depends on rainfed cultivation. The crop suffered from available soil moisture and get stress. Suitable crop varieties which are tolerant to some moisture stress are needed to be identified. Charland is an important area where remains possibility to improve cropping system. Although the farmers’ of charland grow some crops like groundnut and some minor cereals like millets but have greater scope of adaptation of BARI released crop varieties. Full package of important HYV crop varieties are needed to adapt at charland for higher productivity and validation of approved technologies. Hence the study was undertaken.
Methodology
The adaptive trial was conducted at two locations of charland during 2014-2015. One location was at the charland of Koikunda, Lokhikunda union of Ishurdi, Pabna. It was the developed charland of the river of Padma. Another location was at Pina (Near Kashinathpur) of Bera upazilla of Pabna. It was the charland of river Jamuna. The names of selected farmers were Abul Kalam, Azad, Sultan, Abdul Malek and Md. Rubel of Koikunda. Abdul Mozid, Md.Bilayed and Md. Jamsed Ali were the farmers of Pina. Four mustard varieties like BARI Sarisha-11, BARI Sarisha-14 and BARI Sarisha-15 and BARI Sarisha-16 and three wheat varieties viz. BARI Gom-26, BARI Gom-27 and BARI Gom-28 were grown among the selected farmer fields of Koikunda. Each variety of mustard was grown in two bigha of land and wheat was grown in two bigha per variety. BARI Motorshuti-2 was broadcast on 11 November 2014 after recession of flood water. BARI Mosur-6 and BARI Mosur-7 were in two bigha per variety at Koikunda. All the mustard and lentil varieties were sown on 12-13 November 2014 at Koikunda. Wheat varieties were sown on 18 November 2014. Three varieties of wheat (BARI Gom-26, BARI Gom-27 and BARI Gom-28) were sown on 20 November 2014 at Pina covering two bigha per farmer. Lentil and pea were sown in residual soil moisture but other crops were grown in irrigated condition. Two irrigations were applied (25 and 55 DAS) in wheat and two irrigations were applied in mustard (20 and 40 DAE). Fertilizers were applied as per recommendation for the crops. All fertilizers were applied as basal. Only half N was top dressed in wheat and mustard just after first irrigation. Yields of different crop varieties were collected. Farmer’s reactions were also evaluated.
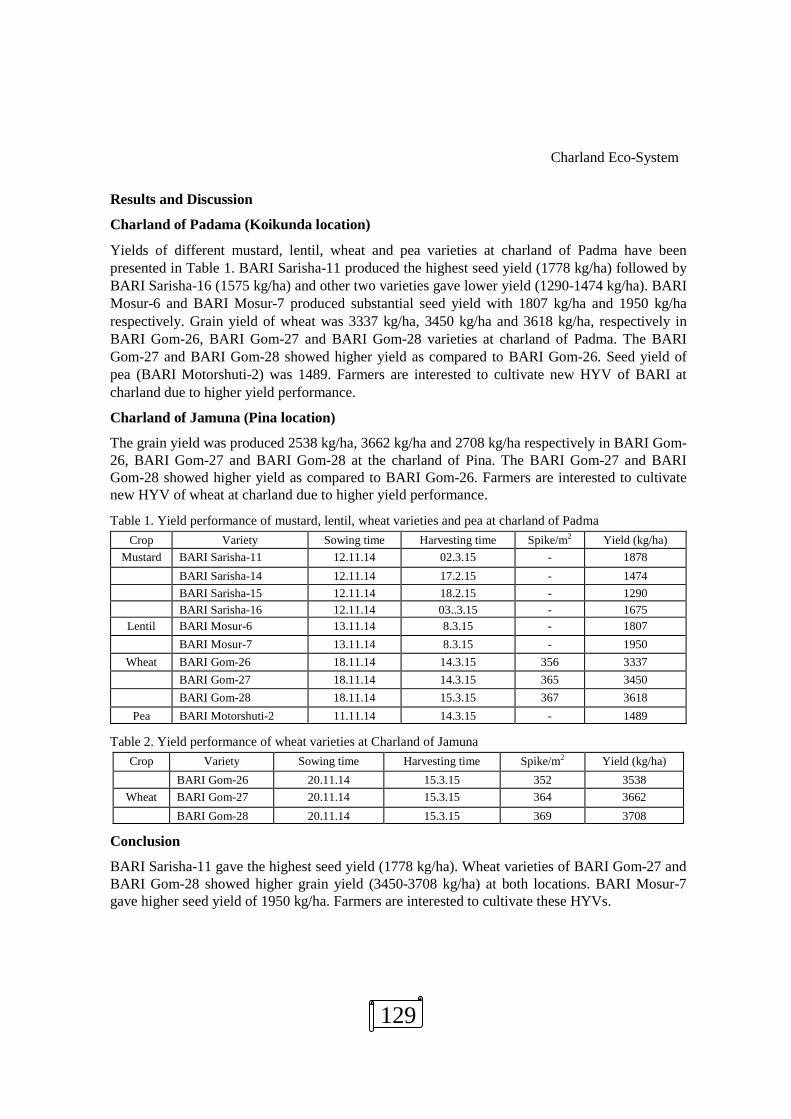
Charland Eco-System
129
Results and Discussion
Charland of Padama (Koikunda location)
Yields of different mustard, lentil, wheat and pea varieties at charland of Padma have been presented in Table 1. BARI Sarisha-11 produced the highest seed yield (1778 kg/ha) followed by BARI Sarisha-16 (1575 kg/ha) and other two varieties gave lower yield (1290-1474 kg/ha). BARI Mosur-6 and BARI Mosur-7 produced substantial seed yield with 1807 kg/ha and 1950 kg/ha respectively. Grain yield of wheat was 3337 kg/ha, 3450 kg/ha and 3618 kg/ha, respectively in BARI Gom-26, BARI Gom-27 and BARI Gom-28 varieties at charland of Padma. The BARI Gom-27 and BARI Gom-28 showed higher yield as compared to BARI Gom-26. Seed yield of pea (BARI Motorshuti-2) was 1489. Farmers are interested to cultivate new HYV of BARI at charland due to higher yield performance.
Charland of Jamuna (Pina location)
The grain yield was produced 2538 kg/ha, 3662 kg/ha and 2708 kg/ha respectively in BARI Gom-26, BARI Gom-27 and BARI Gom-28 at the charland of Pina. The BARI Gom-27 and BARI Gom-28 showed higher yield as compared to BARI Gom-26. Farmers are interested to cultivate new HYV of wheat at charland due to higher yield performance.
Table 1. Yield performance of mustard, lentil, wheat varieties and pea at charland of Padma Crop Variety Sowing time Harvesting time Spike/m2 Yield (kg/ha)
Mustard BARI Sarisha-11 12.11.14 02.3.15 - 1878 BARI Sarisha-14 12.11.14 17.2.15 - 1474 BARI Sarisha-15 12.11.14 18.2.15 - 1290 BARI Sarisha-16 12.11.14 03..3.15 - 1675
Lentil BARI Mosur-6 13.11.14 8.3.15 - 1807 BARI Mosur-7 13.11.14 8.3.15 - 1950
Wheat BARI Gom-26 18.11.14 14.3.15 356 3337 BARI Gom-27 18.11.14 14.3.15 365 3450 BARI Gom-28 18.11.14 15.3.15 367 3618
Pea BARI Motorshuti-2 11.11.14 14.3.15 - 1489
Table 2. Yield performance of wheat varieties at Charland of Jamuna Crop Variety Sowing time Harvesting time Spike/m2 Yield (kg/ha)
BARI Gom-26 20.11.14 15.3.15 352 3538 Wheat BARI Gom-27 20.11.14 15.3.15 364 3662
BARI Gom-28 20.11.14 15.3.15 369 3708
Conclusion
BARI Sarisha-11 gave the highest seed yield (1778 kg/ha). Wheat varieties of BARI Gom-27 and BARI Gom-28 showed higher grain yield (3450-3708 kg/ha) at both locations. BARI Mosur-7 gave higher seed yield of 1950 kg/ha. Farmers are interested to cultivate these HYVs.

Charland Eco-System
130
ADAPTATION OF NEWLY RELEASED HYV OIL SEEDS (MUSTARD, GROUNDNUT, SOYBEAN AND SESAME) IN CHARLAND OF PADMA
M.A.K. Mian, M.S. Alom, M.S. Rahman and F. Nahar
Abstract Adaptive trials were conducted in farmers’ field at four locations (Lokhikunda and BBC bazar of Ishudi in Pabna, and Golapnagar of vheramara and Philipnagar of Daulatpur in Kushtia) of charland of Padma (consecutive two years of 2013-2014 and 2014-2015). Mustard varieties viz. BARI Sharisha-11(1602 kg/ha) and BINA Sarisha-8 (1522 kg/ha); Soybean varieties named BARI Soybean-5 (1708 kg/ha) and BINA Soybean-1 (1488 kg/ha); sesame variety named BARI Till-4 (1334 kg/ha); groundnut variety BARI Badam-8 (2298 kg/ha) exhibited better performance in respect of yield and economic returns (Gross return and BCR) at four locations (2013-2014 and 2014-2015). Average seed yield was 1671 kg/ha in BARI Sarisha-11 and 1615 kg/ha in BINA Sarisha-8 in large block demonstration at four locations (2015-2016). Farmers are interested to cultivate this HYV mustard, sesame and groundnut varieties but they are not interested to cultivate Soybean due to marketing problem.
Introduction
Charland of river system is an unfavourable ecosystem covering an area of 0.82 million hectares in Bangladesh. Generally charland is less productive and ever remains fallow in most of the part of the year. But there is a grater possibility of growing crops in this adverse ecosystem of charland. HYV oilseeds can be introduced in charland for improving crop productivity. Crop production techniques in charland are different from plain land. Crop production at charland mainly depends on rainfed and residual soil moisture. Charland is also nutrient deficit area. So, suitable crop varieties which are tolerant to moisture stress are to be screened out. Although the farmers’ of charland grow some crops but they do not use improve crop varieties and production technologies. Generally, the farmers’ of charland cultivate local variety of different crops and follow their local crop production practices. These are the main causes of low yield of crops in charland. Therefore, it is essential to improve crop productivity in charland through adaptation of new HYVs of oil seed crops along with their improved production technologies.
Objective(s): 1. To select HYV oil seed crop varieties suitable for growing in charland of Padma. 2. To scale-up the best oil seed crop varieties with best management practices in the charland of padma. 3. To improve knowledge and skill of the farmers of the project area on production technology of selected oilseed crop varieties.
Approaches and Methodologies:
Approaches
Adaptive trials were conducted in farmers’ field at four locations (Lokhikunda and BBC Bazar of Ishudi in Pabna, and Golapnagar of vheramara and Philipnagar of Daulatpur in Kushtia) of Charland of Padma (consecutive two years of 2013-2014 and 2014-2015). On the basis of two years results suitable varieties were selected for large plot demonstration. Then large block

Charland Eco-System
131
demonstration was executed with best management practices (2015-2016). Common Interest Group (CIG) farmers were selected in this purpose. Training, demonstration and field days, workshop were the means of adoption of newly released HYV mustard, groundnut, Soybean and sesame in the charland. Training was arranged for the capacity building of field assistants and the selected farmers. Inputs supports (seed, fertilizer pesticides etc.) were provided to the farmers. Bangladesh Agricultural Research Institute (Agronomy, RARS, Ishwardi) was the leading organization. OFRD, BARI, Kushtia and NGO-Voluntary Rural Development Society (VRDS) were other two implementing units of the project. Project completion workshop was organized with the personnel of agricultural extension department, OFRD, NGO and other relevant stakeholders for informing the findings of the project.
Methodologies
Adaptive trials were conducted with newly developed HYV mustard, groundnut, Soybean and sesame at four locations of charland of Padma to fulfill the objectives of the project. From the previous experience, suitable oil seeds varieties of BARI and BINA were chosen for this purpose. Mustard varieties were viz. BARI Sarisha-11, BARI Sarisha-14, BARI Sarisha-15, BARI Sarisha-16, BINA Sarisha-4, BARI Sarisha-8 and local. Groundnut varieties were as Dhaka 1, BARI badam 8, BARI badam 9, BINA badam 4 and local. Soybean varieties were like Sohag, Bangladesh Soybean 4, BARI Soybean 5, BINA Soybean 1 and local. Sesame varieties were named BARI till 3, BARI till 4, BINA till 1, BINA till 2 and local. These varieties were screened in farmers’ fields for selection of better perfuming ones (First year of 2013-2014 and second year of 2014-2015). Trials were conducted in RCB design with five dispersed replications. Crop management was done as per recommendation of BARI and BINA. Key data was collected and analyzed. Means were separated by LSD(0.05) and economic parameters were calculated. Farmer’s reactions about technology were evaluated. Better performing varieties (BARI Sarisha-11, BINA Sarisha-8, BARI Badam 8 and BARI Till 4) were demonstrated in large block (Third year of 2015-2016). Four blocks demonstration were conducted at each location. Total eighty farmers were involved in large block demonstration of mustard, groundnut and sesame. Key data was recorded and reported. Key management options of the best performing varieties are given in Table 1 and Table 2. Soil characteristic has been given in Appendix-C.
Table 1. Use of best management options of selected oil seed crop varieties in charland Crop Sowing time Weeding time
(DAS) Irrigation time
(DAS) Harvesting time
(DAS) Mustard 15 Nov.-30 Nov. 15-20 20-25 95-110 Groundnut 15 Dec.-5 Jan. 20-30 50-55 138-145 Sesame 15 March-5 April 20-25 20-25 90-100 Soybean 1 Nov.-30 Nov. 15-20 25-30 110-110
Table 2. Use of fertilizer dose of selected oil seed crop varieties in charland
Crop Urea (kg/ha)
TSP (Kg/ha)
MOP (Kg/ha)
Gypsum (Kg/ha)
Zinc Sulphate (kg/ha)
Boric Acid (kg/ha)
Mustard 250-300 170-180 85-100 150-180 5-7 10-15 Groundnut 30-50 150-170 80-90 160-180 4-5 10 Sesame 100-125 130-150 40-50 100-110 4-5 8-10 Soybean 50-60 150-175 100-120 80-115 1-2 8-10

Charland Eco-System
132
Summary results/outputs: Mustard varieties viz. BARI Sharisha-11(1602 kg/ha) and BINA Sarisha-8 (1522 kg/ha); Soybean varieties named BARI Soybean-5 (1708 kg/ha) and BINA Soybean-1 (1488 kg/ha); sesame variety named BARI Till-4 (1334 kg/ha); groundnut variety BARI Badam-8 (2298 kg/ha) exhibited better performance in respect of yield and economic returns (Gross return and BCR) at four locations (2013-2014 and 2014-2015) (Table 3). Farmers are interested to cultivate this HYV mustard, sesame and groundnut varieties but they are not interested to cultivate Soybean due to marketing problem. Details results and discussion have been given in Appendix-A and Appendix-B). Average seed yield was 1671 kg/ha in BARI Sarisha-11 and 1615 kg/ha in BINA Sarisha-8 in large block demonstration at four locations (2015-2016) (Table 33). Table 3. Summary of yield and economic returns of the best performing oil seed varieties in charland
(Average of 3 years over 4 locations) Crop variety Yield Range
(kg/ha) Average yield
(kg/ha) Gross return
(Tk./ha) Gross margin
(Tk./ha) BCR
BARI Sarisha-11 1267-1917 1602 80100 41289 2.06 BINA Sarisha-8 1235-1818 1522 76100 37289 1.96 BARI Badam 8 1938-2433 2298 183850 123622 3.05 BARI Till 4 1298-1407 1334 66681 34811 2.09 BARI Soybean 5 1093-2380 1708 68320 30590 1.81 BINA Soybean 1 1132-1807 1488 59520 21790 1.58

Charland Eco-System
133
Appendix-A
Agro-economic performance of mustard, Soybean, sesame and groundnut at four locations
Mustard
BARI Sarisha-11 and BINA Sarisha-8 showed better performance in respect of yield and economic parameters (Table 1, Table 2, Table 3, Table 4, Table 5, Table 6, Table 7 and Table 8) at four locations. Average seed yield ranged 1539-1653 kg/ha in BARI Sarisha-11and 1440-1578 kg/ha in BINA Sarisha-8 (Table 1, Table 2, Table 3 and Table 4) at four locations. Average gross return ranged Tk. 83078-89314/ha and BCR ranged 1.85-1.99 in BARI Sarisha-11 while gross return ranged Tk. 77713-85726/ha and BCR ranged 1.74-1.91 in BINA Sarisha-8 (Table 5, Table 6 and Table 7 Table 8). Farmers are interested to cultivate BARI Sarisha-11 and BINA Sarisha-8.
Table 1. Seed yield of mustard varieties at Lokhikunda (2013-2014 and 2014-2015)
Variety Seed yield (kg/ha)
2013-2014 2014-2015 Average
BARI Sarisha-11 1536 1713 1625
BARI Sarisha-14 1207 1376 1292
BARI Sarisha-15 1225 1212 1219
BARI Sarisha-16 1385 1464 1425
BINA Sarisha-4 1617 1394 1506
BINA Sarisha-8 1380 1708 1544
Local Sarisha 889 1135 1012
LSD(0.05) 204 208 -
CV(%) 11.35 10.13 -
Table 2. Seed yield of mustard varieties at BBC bazar (2013-2014 and 2014-2015)
Variety Seed yield (kg/ha)
2013-2014 2014-2015 Average
BARI Sarisha-11 1518 1788 1653
BARI Sarisha-14 1142 1367 1255
BARI Sarisha-15 1225 1162 1194
BARI Sarisha-16 1367 1510 1439
BINA Sarisha-4 1554 1573 1564
BINA Sarisha-8 1350 1805 1578
Local Sarisha 833 981 907
LSD(0.05) 204 211 -
CV (%) 12.11 10.57 -

Charland Eco-System
134
Table 3. Seed yield of mustard varieties at Golapnagar (2013-2014 and 2014-2015)
Variety Seed yield (kg/ha)
2013-2014 2014-2015 Average
BARI Sarisha-11 1412 1665 1539
BARI Sarisha-14 1104 1255 1180
BARI Sarisha-15 1128 1156 1142
BARI Sarisha-16 1365 1476 1421
BINA Sarisha-4 1548 1320 1434
BINA Sarisha-8 1394 1486 1440
Local Sarisha 1412 1665 1539
LSD(0.05) 213 231 -
CV(%) 13.34 11.05 -
Table 4. Seed yield of mustard varieties at Philipnagar (2013-2014 and 2014-2015)
Variety Seed yield (kg/ha)
2013-2014 2014-2015 Average
BARI Sarisha-11 1267 1917 1592
BARI Sarisha-14 842 1245 1044
BARI Sarisha-15 897 1423 1160
BARI Sarisha-16 1112 1661 1387
BINA Sarisha-4 1203 1235 1219
BINA Sarisha-8 1235 1818 1527
Local Sarisha 652 695 674
LSD(0.05) 114 143 -
CV(%) 8.51 9.58 -
Table 5. Gross return and BCR of mustard varieties at Lokhikunda (2013-2014 and 2014-2015)
Variety Gross return (Tk.) BCR
2013-2014 2014-2015 Average 2013-2014 2014-2015 Average
BARI Sarisha-11 78984 96529 87757 1.76 2.15 1.96
BARI Sarisha-14 61792 77201 69497 1.38 1.72 1.55
BARI Sarisha-15 62784 68524 65654 1.4 1.53 1.47
BARI Sarisha-16 71570 82882 77226 1.6 1.85 1.73
BINA Sarisha-4 82859 78717 80788 1.85 1.75 1.80
BINA Sarisha-8 71092 96203 83648 1.58 2.14 1.86
Local Sarisha 45284 63308 54296 1.01 1.41 1.21
Market price: Tk. 55/kg of mustard seed, Tk. 0.50/kg of mustard straw

Charland Eco-System
135
Table 6. Gross return and BCR of mustard varieties at BBC bazar (2013-2014 and 2014-2015)
Variety Gross return (Tk.) BCR
2013-2014 2014-2015 Average 2013-2014 2014-2015 Average
BARI Sarisha-11 77984 100644 89314 1.74 2.24 1.99
BARI Sarisha-14 58542 76977 67759.5 1.3 1.72 1.51
BARI Sarisha-15 62635 65367 64001 1.4 1.46 1.43
BARI Sarisha-16 70551 85550 78050.5 1.57 1.91 1.74
BINA Sarisha-4 79591 88499 84045 1.77 1.97 1.87
BINA Sarisha-8 69755 101696 85726 1.55 2.27 1.91
Local Sarisha 42600 54914 48757 0.95 1.22 1.09
Market price: Tk. 55/kg of mustard seed, Tk. 0.50/kg of mustard straw
Table 7. Gross return and BCR of mustard varieties at Golapnagar (2013-2014 and 2014-2015)
Variety Gross return (Tk.) BCR
2013-2014 2014-2015 Average 2013-2014 2014-2015 Average
BARI Sarisha-11 72631 93524 83078 1.62 2.08 1.85
BARI Sarisha-14 56761 70531 63646 1.27 1.57 1.42
BARI Sarisha-15 57905 65181 61543 1.29 1.45 1.37
BARI Sarisha-16 70508 83238 76873 1.57 1.86 1.72
BINA Sarisha-4 79352 74578 76965 1.77 1.66 1.72
BINA Sarisha-8 71751 83674 77713 1.6 1.87 1.74
Local Sarisha 40496 66581 53539 0.9 1.48 1.19
Market price: Tk. 55/kg of mustard seed, Tk. 0.50/kg of mustard straw
Table 8. Gross return and BCR of mustard varieties at Philipnagar (2013-2014 and 2014-2015)
Variety Gross return (Tk.) BCR
2013-2014 2014-2015 Average 2013-2014 2014-2015 Average
BARI Sarisha-11 65364 107553 86459 1.68 2.40 2.04
BARI Sarisha-14 43569 69990 56780 1.12 1.56 1.34
BARI Sarisha-15 46135 80222 63179 1.19 1.79 1.49
BARI Sarisha-16 57677 93531 75604 1.49 2.08 1.79
BINA Sarisha-4 63441 69858 66650 1.63 1.56 1.60
BINA Sarisha-8 62216 102070 82143 1.6 2.28 1.94
Local Sarisha 35550 39006 37278 0.92 1.01 0.97
Market price: Tk. 55/kg of mustard seed, Tk. 0.50/kg of mustard straw

Charland Eco-System
136
Soybean
BARI Soybean-5 and BINA Soybean-1 were higher yielder with better economic parameters (Table 9, Table 10, Table 11, Table 12, Table 13, Table 14, Table 15 and Table 16) at four locations. Average seed yield ranged 1411-1850 kg/ha in BARI Soybean-5 and 1346-1780 kg/ha in BINA Soybean-1 (Table 9, Table 10, Table 11 and Table 12). Average gross return ranged Tk. 77325-103010/ha with BCR of 2.05-2.73 in BARI Soybean-5 but average gross return ranged Tk. 73840-98957/ha with BCR of 1.96-2.62 in BINA Soybean-1 (Table 13, Table 14 and Table 15 and Table 16). Farmers are not interested to cultivate Soybean due to marketing problem.
Table 9. Seed yield of Soybean varieties at Lokhikunda (2013-2014 and 2014-2015) Variety Seed yield (kg/ha)
2013-2014 2014-2015 Average
Shohag 841 1807 1324
BARI Soybean-5 978 2353 1666
BARI Soybean-6 718 2034 1376
BINA Soybean-1 904 2301 1603
Local 482 1006 744
LSD(0.05) 54 89 -
CV(%) 6.88 6.94 -
Table 10. Seed yield of Soybean varieties at BBC bazar (2013-2014 and 2014-2015)
Variety Seed yield (kg/ha)
2013-2014 2014-2015 Average
Shohag 899 1783 1341
BARI Soybean-5 1122 2380 1751
BARI Soybean-6 892 2100 1496
BINA Soybean-1 1003 2293 1648
Local 679 1066 873
LSD(0.05) 102 135 -
CV(%) 6.33 6.49 -
Table 11. Seed yield of Soybean varieties at Golapnagar (2013-2014 and 2014-2015)
Variety Seed yield (kg/ha)
2013-2014 2014-2015 Average
Shohag 1484 1619 1552
BARI Soybean-5 1802 1898 1850
BARI Soybean-6 1680 1797 1739
BINA Soybean-1 1706 1853 1780
Local 1370 1123 1247
LSD(0.05) 104 117 -
CV(%) 7.11 8.03 -

Charland Eco-System
137
Table 12. Seed yield of Soybean varieties at Philipnagar (2013-2014 and 2014-2015)
Variety Seed yield (kg/ha)
2013-2014 2014-2015 Average
Shohag 892 1122 1007
BARI Soybean-5 1132 1689 1411
BARI Soybean-6 989 1324 1157
BINA Soybean-1 1093 1598 1346
Local 578 909 744
LSD(0.05) 59 108 -
CV(%) 7.97 6.38 -
Table 13. Gross return and BCR of Soybean varieties at Lokhikunda (2013-2014 and 2014-2015)
Variety Gross return (Tk.) BCR
2013-2014 2014-2015 Average 2013-2014 2014-2015 Average
Shohag 51006 92132 71569 1.35 2.44 1.90
BARI Soybean-5 59329 119980 89655 1.57 3.18 2.38
BARI Soybean-6 43615 103714 73665 1.16 2.75 1.96
BINA Soybean-1 54842 117327 86085 1.45 3.11 2.28
Local 29315 51297 40306 0.78 1.36 1.07
Market price: Tk. 50/kg of Soybean seed, Tk. 0.50/kg of Soybean straw
Table 14. Gross return and BCR of Soybean varieties at BBC bazar (2013-2014 and 2014-2015)
Variety Gross return (Tk.) BCR
2013-2014 2014-2015 Average 2013-2014 2014-2015 Average
Shohag 54485 90836 72661 1.44 2.41 1.93
BARI Soybean-5 67991 121249 94620 1.8 3.21 2.51
BARI Soybean-6 54107 106985 80546 1.43 2.84 2.14
BINA Soybean-1 60797 116817 88807 1.61 3.1 2.36
Local 41168 54308 47738 1.09 1.44 1.27
Market price: Tk. 50/kg of Soybean seed, Tk. 0.50/kg of Soybean straw
Table 15. Gross return and BCR of Soybean varieties at Golapnagar (2013-2014 and 2014-2015) Variety Gross return (Tk.) BCR
2013-2014 2014-2015 Average 2013-2014 2014-2015 Average
Shohag 89993 82502 86248 2.39 2.19 2.29
BARI Soybean-5 109290 96729 103010 2.9 2.56 2.73
BARI Soybean-6 101881 91528 96705 2.7 2.43 2.57
BINA Soybean-1 103478 94435 98957 2.74 2.5 2.62
Local 83192 57052 70122 2.2 1.51 1.86
Market price: Tk. 50/kg of Soybean seed, Tk. 0.50/kg of Soybean straw

Charland Eco-System
138
Table 16. Gross return and BCR of Soybean varieties at Philipnaga (2013-2014 and 2014-2015) Variety Gross return (Tk.) BCR
2013-2014 2014-2015 Average 2013-2014 2014-2015 Average
Shohag 59872 57204 58538 1.59 1.52 1.56
BARI Soybean-5 68449 86200 77325 1.81 2.28 2.05
BARI Soybean-6 54007 67594 60801 1.43 1.79 1.61
BINA Soybean-1 66078 81601 73840 1.75 2.16 1.96
Local 35075 46360 40718 0.93 1.23 1.08
Market price: Tk. 50/kg of Soybean seed, Tk. 0.50/kg of Soybean straw
Sesame BARI Till-4 produced the highest average seed yield (1030-1383 kg/ha) with substantial gross return (Tk. 50080-55320/ha) and BCR (1.58-1.74) (Table 17, Table 18, Table 19, Table 20, Table 21 and Table 22, Table 13 and Table 24) at four locations. BARI Till-3 also gave better yield performance. Farmers are interested to cultivate BARI Till-4. The crop is drought tolerant and can grow in rainfed condition.
Table 17. Seed yield of
Variety Seed yield (kg/ha)
2013-2014 2014-2015 Average
BARI Till-3 1111 1108 1110
BARI Till-4 1298 1291 1295
BINA Till-1 1022 892 957
BINA Till-2 1093 909 1001
Local 618 558 588
LSD(0.05) 111 102 -
CV(%) 8.22 8.07 -
sesame varieties at Lokhikunda (2013-2014 and 2014-2015)
Table 18. Seed yield of sesame varieties at BBC bazar (2013-2014 and 2014-2015)
Variety Seed yield (kg/ha)
2013-2014 2014-2015 Average
BARI Till-3 1124 1259 1192
BARI Till-4 1376 1334 1355
BINA Till-1 1045 1001 1023
BINA Till-2 1102 1111 1107
Local 502 502 502
LSD(0.05) 105 97 -
CV(%) 7.63 6.51 -

Charland Eco-System
139
Table 19. Seed yield of sesame varieties at Golapnagar (2013-2014 and 2014-2015) Variety Seed yield (kg/ha)
2013-2014 2014-2015 Average
BARI Till-3 1265 1208 1237
BARI Till-4 1407 1359 1383
BINA Till-1 1152 1011 1082
BINA Till-2 1246 1183 1215
Local 845 869 857
LSD(0.05) 146 137 -
CV(%) 9.18 8.23 -
Table 20. Seed yield of sesame varieties at Philipnagar (2013-2014 and 2014-2015)
Variety Seed yield (kg/ha)
2013-2014 2014-2015 Average
BARI Till-3 1245 1083 1164
BARI Till-4 1363 1241 1302
BINA Till-1 1110 950 1030
BINA Till-2 1229 893 1061
Local 879 533 706
LSD(0.05) 138 112 -
CV(%) 9.33 8.05 -
Table 21. Gross return and BCR of sesame varieties at Lokhikunda (2013-2014 and 2014-2015)
Variety Gross return (Tk.) BCR
2013-2014 2014-2015 Average 2013-2014 2014-2015 Average
BARI Till-3 44440 44320 44380 1.39 1.39 1.39
BARI Till-4 51920 51640 51780 1.63 1.62 1.63
BINA Till-1 40880 35680 38280 1.28 1.12 1.20
BINA Till-2 43720 36360 40040 1.37 1.14 1.26
Local 24720 22320 23520 0.78 0.7 0.74 Sesame: Tk.40/kg
Table 22. Gross return and BCR of sesame varieties at BBC bazar (2013-2014 and 2014-2015) Variety Gross return (Tk.) BCR
2013-2014 2014-2015 Average 2013-2014 2014-2015 Average BARI Till-3 44960 50360 47660 1.41 1.58 1.50 BARI Till-4 55040 53360 54200 1.73 1.67 1.70 BINA Till-1 41800 40040 40920 1.31 1.26 1.29 BINA Till-2 44080 44440 44260 1.38 1.39 1.39 Local 20080 20080 20080 0.63 0.63 0.63
Sesame: Tk.40/kg

Charland Eco-System
140
Table 23. Gross return and BCR of sesame varieties at Golapnagar (2013-2014 and 2014-2015)
Variety Gross return (Tk.) BCR
2013-2014 2014-2015 Average 2013-2014 2014-2015 Average
BARI Till-3 50600 48320 49460 1.59 1.52 1.56
BARI Till-4 56280 54360 55320 1.77 1.71 1.74
BINA Till-1 46080 40440 43260 1.45 1.27 1.36
BINA Till-2 49840 47320 48580 1.56 1.48 1.52
Local 33800 34760 34280 1.06 1.09 1.08
Sesame: Tk.40/kg
Table 24. Gross return and BCR of sesame varieties at Philipnagar (2013-2014 and 2014-2015) Variety Gross return (Tk.) BCR
2013-2014 2014-2015 Average 2013-2014 2014-2015 Average
BARI Till-3 45800 43320 44560 1.44 1.36 1.40
BARI Till-4 50520 49640 50080 1.59 1.56 1.58
BINA Till-1 44400 38000 41200 1.39 1.19 1.29
BINA Till-2 45160 35720 40440 1.42 1.12 1.27
Local 35160 21320 28240 1.1 0.67 0.89
Market price of sesame: Tk.40/kg
Groundnut
BARI Badam 8 produced better nut yield (2379-2566 kg/ha) with higher gross return (Tk. 190280-197240/ha) and BCR (3.18-3.28) (Table 25, Table 26, Table 27, Table 28, Table 29, Table 30, Table 31 and Table 32). Dhaka-1 and Jhingha badam also showed good performance. Groundnut requires higher field duration than other oilseed. Groundnut cultivation is more profitable than other oilseed crops in charland. Farmers are interested to cultivate BARI badam-8.
Table 25. Nut yield of groundnut varieties at Lokhikunda (2013-2014 and 2014-2015)
Variety Nut yield (kg/ha)
2013-2014 2014-2015 Average
Dhaka-1 2475 2175 2375
Jhingha Badam 2375 2519 2375
BARI Badam-8 2566 2365 2566
BINA Badam-4 1983 2251 1983
Local 2386 2009 2386
LSD (0.05) 286 258 -
CV (%) 8.41 7.66 -

Charland Eco-System
141
Table 26. Nut yield of groundnut varieties at BBC bazar (2013-2014 and 2014-2015) Variety Nut yield (kg/ha)
2013-2014 2014-2015 Average Dhaka-1 2333 2234 2284 Jhingha Badam 2281 2408 2345 BARI Badam-8 2406 2351 2379 BINA Badam-4 2041 2273 2157 Local 2271 1937 2104 LSD (0.05) 261 274 - CV (%) 7.69 7.67 -
Table 27. Nut yield of groundnut varieties at Golapnagar (2013-2014 and 2014-2015) Variety Nut yield (kg/ha)
2013-2014 2014-2015 Average Dhaka-1 1763 2362 2063 Jhingha Badam 1938 2433 2186 BARI Badam-8 2117 2673 2395 BINA Badam-4 1580 2264 1922 Local 1790 2298 2044 LSD (0.05) 116 197 - CV (%) 6.48 5.89 -
Table 28. Nut yield of groundnut varieties at Philipnagar (2013-2014 and 2014-2015) Variety Nut yield (kg/ha)
2013-2014 2014-2015 Average Dhaka-1 2169 2057 2190 Jhingha Badam 2174 2216 2195 BARI Badam-8 2322 2457 2390 BINA Badam-4 1958 1937 1948 Local 1996 1875 1936 LSD (0.05) 266 245 - CV (%) 9.35 8.67 -
Table 29. Gross return and BCR of groundnut varieties at Lokhikunda (2013-2014 and 2014-2015) Variety Gross return (Tk.) BCR
2013-2014 2014-2015 Average 2013-2014 2014-2015 Average Dhaka-1 206000 174000 190000 3.42 2.89 3.16 Jhingha Badam 190000 201520 195760 3.15 3.35 3.25 BARI Badam-8 205280 189200 197240 3.41 3.14 3.28 BINA Badam-4 158640 180080 169360 2.63 2.99 2.81 Local 190880 160720 175800 3.17 2.67 2.92
Groundnut: Tk.80/kg

Charland Eco-System
142
Table 30. Gross return and BCR of groundnut varieties at BBC bazar (2013-2014 and 2014-2015) Variety Gross return (Tk.) BCR
2013-2014 2014-2015 Average 2013-2014 2014-2015 Average Dhaka-1 186640 178720 182680 3.1 2.97 3.04 Jhingha Badam 182480 200640 18756 3.20 3.12 3.16 BARI Badam-8 192480 188080 190280 3.03 3.33 3.18 BINA Badam-4 163280 181840 172560 2.71 3.02 2.87 Local 181680 154960 168320 3.02 2.57 2.80
Groundnut: Tk.80/kg
Table 31. Gross return and BCR of groundnut varieties at Golapnagar (2013-2014 and 2014-2015) Variety Gross return (Tk.) BCR
2013-2014 2014-2015 Average 2013-2014 2014-2015 Average Dhaka-1 141040 188960 165000 2.34 3.14 2.74 Jhingha Badam 155040 194640 174840 2.57 3.23 2.90 BARI Badam-8 169360 213840 191600 2.88 3.55 3.22 BINA Badam-4 126400 181120 153760 2.1 3.00 2.55 Local 143200 183840 163520 2.38 3.05 2.72
Groundnut: Tk.80/kg
Table 32. Gross return and BCR of groundnut varieties at Philipnagar (2013-2014 and 2014-2015) Variety Gross return (Tk.) BCR
2013-2014 2014-2015 Average 2013-2014 2014-2015 Average Dhaka-1 173520 164560 175160 2.88 2.73 2.91 Jhingha Badam 173920 177280 175600 2.89 2.95 2.92 BARI Badam-8 172560 185760 173040 2.86 3.08 2.97 BINA Badam-4 156640 154960 155800 2.6 2.57 2.59 Local 159680 150000 154840 2.65 2.49 2.57
Market price of groundnut: Tk.80/kg
Seed yield mustard in large block demonstration at four locations (2015-2016)
Seed yield ranged 1582-1829 kg/ha of BARI Sarisha-11 and 1522-1712 kg/ha of BINA Sarisha-8 in large block demonstration at four locations (Table 33). Average seed yield was 1671 kg/ha in BARI Sarisha-11 and 1615 kg/ha in BINA Sarisha-8 in large block demonstration at four locations (Table 33). Farmers are interested to cultivate these varieties.
Table 33. Seed yield of mustard in large block at four locations (2015-2016) Variety Seed yield (kg/ha)
Lokhikunda BBC bazar Golapnagar Philipnagar Average BARI Sarisha-11 1655 1616 1829 1582 1671 BINA Sarisha-8 1624 1601 1712 1522 1615

Charland Eco-System
143
Appendix-B
Interpretation of soil analysis
Analytical results of soil sample of four locations have been given in Table 1. Soil pH ranged from 6.85 to 7.63. Organic matter was very low (0.81-1.00). Nitrogen was very low but P was high in all locations. K was low to medium but Zn was medium to optimum at all locations.
Table 1. Nutrient status of soil at different experimental locations Location pH OM (%) N(%) P (ppm) K(meq/100 g ) S (ppm) Lokhikunda 6.85 0.81 0.050 88.00 0.190 22.0 BBC Bazar 6.95 1.00 0.045 83.00 0.130 18.0 Golapnagar 7.35 0.87 0.060 81.00 0.166 25.0 Philipnagar 7.63 0.86 0.067 53.00 0.154 18.0 Interpretation of soil test value
<7=Acidic >7=Alkaline
Very low Very low
Very high
0.091-0.18= low 0.181-0.27= Medium
15.1-2.5= Medium 22.51-30.0= Optimum
Conclusion
Mustard varieties viz. BARI Sharisha-11(1602 kg/ha) and BINA Sarisha-8 (1522 kg/ha); sesame variety named BARI Till-4 (1334 kg/ha); groundnut variety BARI Badam-8 (2298 kg/ha) could be cultivated at charland of Padma for incrising crop productivity and utilization of fallow land.
Acknowledgement
Acknowledge to KGF authority and their associates. Also acknowledge to BARI authority and my colleagues for their help. Moreover, acknowledge to worker of the project and associated farmers of the project.
Related Documents