WOUTER SCHAKEL UNDERSTANDING ENVIRONMENTAL TRADE-OFFS OF CARBON CAPTURE, UTILIZATION AND STORAGE

Welcome message from author
This document is posted to help you gain knowledge. Please leave a comment to let me know what you think about it! Share it to your friends and learn new things together.
Transcript
W O U T E R S C H A K E L
UITNODIGINGvoor het bijwonen van de
openbare verdediging van mijn proefschrift
UNDERSTANDING ENVIRONMENTAL
TRADE-OFFS OF CARBON CAPTURE,
UTILIZATION AND STORAGE
Woensdag 6 december 201710:30 uur
Academiegebouw (Senaatszaal)Domplein 29, Utrecht
Aansluitend is er een receptiein hetzelfde gebouw
WOUTER [email protected]
+316 33928733
PARANIMFENHarm de Boo
Henno van Eckeveld
UNDERSTANDING ENVIRONMENTAL TRADE-OFFS OF CARBON CAPTURE,
UTILIZATION AND STORAGE
UN
DER
STAN
DIN
G EN
VIR
ON
MEN
TAL TR
AD
E-OFFS O
F CA
RBO
N C
AP
TUR
E, UTILIZ
ATIO
N A
ND
STOR
AG
E W
OU
TER S
CHA
KEL
15014-schakel-cover.indd 1 17/10/2017 10:29


Understanding environmental trade-offs of carbon capture, utilization and storage

Understanding environmental trade-offs of carbon capture, utilization and storage
Wouter Schakel, Utrecht University, Faculty of Geosciences, Department of Innovation, Environmental and Energy Sciences, Copernicus Institute of Sustainable Development, Group Energy & Resources. ISBN: 978-90-8672-078-1 Print: Ridderprint BV Cover design: Design Your Thesis, www.designyourthesis.com Copyright: © 2017, Wouter Schakel
Understanding environmental trade-offs of carbon capture, utilization and storage
Inzichten in de milieugevolgen van CO2 afvang, gebruik en opslag
(met een samenvatting in het Nederlands)
Proefschrift
ter verkrijging van de graad van doctor aan de Universiteit Utrecht op gezag van de rector magnificus, prof. dr. G.J. van der Zwaan,
ingevolge het besluit van het college voor promoties in het openbaar te verdedigen op
woensdag 6 december 2017 des ochtends te 10.30 uur
door
Wouter Bastiaan Schakel geboren op 9 december 1987 te Zeist

Promotoren: Prof. dr. E. Worrell
Prof. dr. C.A. Ramírez Ramírez

5
Table of contents
TABLE OF CONTENTS ....................................................................................................... 5
UNITS AND ABBREVIATIONS ........................................................................................... 7
INTRODUCTION ...................................................................................................... 11 1.
CLIMATE CHANGE ....................................................................................................................... 11 1.1. CARBON CAPTURE AND STORAGE .............................................................................................. 13 1.2. CARBON CAPTURE AND UTILIZATION ......................................................................................... 14 1.3. ENVIRONMENTAL PERFORMANCE AND KNOWLEDGE GAPS ....................................................... 16 1.4. OBJECTIVES AND OUTLINE OF THESIS ......................................................................................... 21 1.5.
EXPLORING THE POTENTIAL IMPACT OF IMPLEMENTING CARBON CAPTURE 2.TECHNOLOGIES IN FOSSIL FUEL POWER PLANTS ON REGIONAL EUROPEAN WATER STRESS INDEX LEVELS .................................................................................................... 25
INTRODUCTION ........................................................................................................................... 26 2.1. METHODOLOGY .......................................................................................................................... 28 2.2. RESULTS ...................................................................................................................................... 39 2.3. DISCUSSION ................................................................................................................................ 46 2.4. CONCLUSION .............................................................................................................................. 51 2.5.
APPENDIX I: CURRENT WSI LEVELS............................................................................................................ 54
COMPARATIVE LIFE CYCLE ASSESSMENT OF BIOMASS CO-FIRING PLANTS 3.WITH CARBON CAPTURE AND STORAGE ..................................................................... 55
INTRODUCTION ........................................................................................................................... 56 3.1. METHODOLOGY .......................................................................................................................... 61 3.2. LIFE CYCLE INVENTORY ............................................................................................................... 63 3.3. RESULTS ...................................................................................................................................... 84 3.4. DISCUSSION ................................................................................................................................ 98 3.5. CONCLUSION ........................................................................................................................... 110 3.6.
APPENDIX I: LCI DATA ............................................................................................................................. 113
IMPACT OF FUEL SELECTION ON THE ENVIRONMENTAL PERFORMANCE OF 4.POST-COMBUSTION CALCIUM LOOPING APPLIED TO A CEMENT PLANT ............... 117
INTRODUCTION ........................................................................................................................ 118 4.1. METHODOLOGY ....................................................................................................................... 120 4.2. RESULTS ................................................................................................................................... 131 4.3. DISCUSSION AND CONCLUSION .............................................................................................. 143 4.4.

6
ASSESSING THE TECHNO-ENVIRONMENTAL PERFORMANCE OF CO2 5.UTILIZATION VIA DRY REFORMING OF METHANE FOR THE PRODUCTION OF DIMETHYL ETHER ......................................................................................................... 149
INTRODUCTION ........................................................................................................................ 150 5.1. METHODOLOGY ....................................................................................................................... 153 5.2. RESULTS ................................................................................................................................... 163 5.3. DISCUSSION AND CONCLUSION .............................................................................................. 173 5.4.
APPENDIX I: SCHEMATICS OF PROCESSES INCLUDED IN THE DIFFERENT VALUE CHAINS ....................... 177 APPENDIX II: HYBRID LCI ........................................................................................................................ 180 APPENDIX III: LIFE CYCLE ASSESSMENT MODELLING .............................................................................. 182 APPENDIX IV: ENVIRONMENTAL ASSESSMENT RESULTS ......................................................................... 189
NEW INDICATOR FOR COMPARING THE ENERGY PERFORMANCE OF CO2 6.UTILIZATION CONCEPTS .............................................................................................. 191
INTRODUCTION ........................................................................................................................ 192 6.1. METHODOLOGY ....................................................................................................................... 195 6.2. APPLICATION ........................................................................................................................... 202 6.3. DISCUSSION ............................................................................................................................. 211 6.4. CONCLUSION ........................................................................................................................... 215 6.5.
SUMMARY, CONCLUSION AND RECOMMENDATIONS ..................................... 219 7.
BACKGROUND .......................................................................................................................... 219 7.1. OBJECTIVE AND RESEARCH QUESTIONS ................................................................................... 221 7.2. MAIN FINDINGS AND CONCLUSIONS ....................................................................................... 222 7.3. RECOMMENDATIONS ............................................................................................................... 235 7.4.
SAMENVATTING, CONCLUSIE EN AANBEVELINGEN ......................................... 239 8.
ACHTERGROND ........................................................................................................................ 239 8.1. DOELSTELLING EN ONDERZOEKSVRAGEN................................................................................ 241 8.2. BELANGRIJKSTE RESULTATEN EN CONCLUSIES ........................................................................ 242 8.3. AANBEVELINGEN ...................................................................................................................... 256 8.4.
REFERENCES .................................................................................................................. 259
DANKWOORD ............................................................................................................... 272
ABOUT THE AUTHOR .................................................................................................... 274
7
Units and Abbreviations
2DS 2°C temperature increase scenario %pt percentage point a.r. as received ALOP Agricultural Land Occupation Potential AGR Acid Gas Removal Al2O3 Aluminium oxide ASU Air Separation Unit BECCS Bio-energy with CCS BIGCC Biomass Integrated Gasification Combined Cycle BIOCCS Combination of biomass use and CCS Br Bromine CaCO3 Calcium carbonate CaO Calcium oxide CAPEX Capital Expenditures CaSO4 Calcium sulphate CCP Climate Change Potential CCS Carbon Capture and Storage CCU Carbon Capture and Utilization CED Cumulative Energy Demand CFB Circulating Fluidized Bed CH4 Methane CHP Combined Heat and Power Cl Chlorine CO Carbon monoxide CO2 Carbon dioxide CO2 eq. Carbon dioxide equivalent CU Carbon Utilization d.a.f. dry, ash free DALY Disability Adjusted Life Years DME Dimethyl ether EOR Enhanced Oil Recovery eq. equation EU European Union F Fluor FDP Fossil Depletion Potential FEP Freshwater Eutrophication Potential FETP Freshwater Eco-Toxicity Potential
8
FGD Flue Gas Desulphurization GHG Greenhouse Gas GIS Geographical Information System GJ Gigajoule (1 GJ = 109 Joule) GT Gigatonne (1 GT = 109 tonne) GW Gigawatt GWh Gigawatt hour GWP Global Warming Potential H2 hydrogen HCl Hydrogen chloride HF Hydrogen fluoride Hg Mercury HHV Higher Heating Value HSS Heat Stable Salts HTP Human Toxicity Potential IEA International Energy Agency IEAGHG International Energy Agency Greenhouse Gas R&D Programme IGCC Integrated Gasification Combined Cycle IPCC Intergovernmental Panel on Climate Change IRP Ionising Radiation Potential (IRP) Km kilometre kt kilotonne (1 kt = 103 tonne) kW kilowatt kWh kilowatt hour L Litre LCA Life Cycle Assessment LCI Life Cycle Inventory LHV Lower Heating Value MDEA Methyl Di-Ethanolamine MDP Metal Depletion Potential MEA Monoethanol amine MEP Marine Eutrophication Potential METP Marine Eco-Toxicity Potential MJ Megajoule (1 MJ = 106 Joule) Mt Megatonne (1 Mt = 106 tonne) MW Megawatt MWh Megawatt hour N2 Nitrogen N2O Dinitrogen monoxide NaOH Sodium Hydroxide

9
NG Natural Gas NH3 Ammonia Ni Nickel NO Nitrogen oxide NO2 Nitrogen dioxide NOx Nitrogen oxides (both NO and NO2) NGCC Natural Gas Combined Cycle O2 Oxygen ODP Ozone Depletion Potential PC Pulverized Coal Pd Palladium PM Particulate matter PMFP Particulate Matter Formation Potential POFP Photochemical oxidant formation potential Ppm(v) parts per million (by volume) PSA Pressure Swing Absorption PV Photovoltaics RDF Refuse Derived Fuel Rh Rhodium RWGS Reverse Water Gas Shift S Sulphur Se Selenium SO2 Sulphur dioxide SPECFER Specific Primary Energy Consumption per unit of Fossil
Feedstock Replaced t metric tonne TAP Terrestrial Acidification Potential TETP Terrestrial Eco-Toxicity Potential TiO2 Titanium oxide tkm tonne kilometre U.S. United States ULOP Urban Land Occupation Potential USPC Ultra Supercritical Pulverized Coal WDP Water Depletion Potential WGS Water Gas Shift WSI Water Stress Index wt% weight percentage yr year ZnO Zinc oxide

10

Introduction
11
Introduction 1.
Climate change 1.1.
The rise of anthropogenic greenhouse gas (GHG) emissions have led to an unequivocal temperature increase in our global climate system (IPCC, 2014). Climate change associated with global warming can severely impact the worldwide climate, and can eventually lead to irreversible impacts on society and ecosystems (IPCC, 2014). To keep these impacts within acceptable limits, the average global temperature rise should be limited to approximately 2°C compared to pre-industrial levels (IPCC, 2014). Mitigation scenarios in which it is likely that the temperature increase will be limited to 2°C predict that the atmospheric CO2 concentration level should not exceed 450 ppm(v) (IPCC, 2014). A reduction of the global anthropogenic GHG emissions of at least 40-70% (depending on scenario assumptions) by 2050 and 100% or more by 2100, compared to 2010, is considered necessary to stay below this level (IEA, 2015b; IPCC, 2014).
The most important driver of climate change is CO2 emissions originating from human activities, such as electricity and heat generation, agriculture, industry, and transport. Various options are available to limit CO2 emissions, such as renewable energy sources, biomass, energy efficiency improvements, replacing carbon intensive fuels with less intensive ones (e.g. coal with natural gas or nuclear), and applying carbon capture and storage (CCS). CCS aims to reduce CO2 emissions to the atmosphere by capturing CO2 from energy-related and industrial sources, transporting it to (underground) storage sites where the CO2 is injected and stored long-term. CCS can realize deep CO2 emission reductions within carbon intensive industries, such as refining, cement and steel production (IEA, 2015b; ZEP, 2015). Besides, it can be a valuable technology as it can reduce CO2 emissions while preserving the value of fossil fuel reserves and existing infrastructure, avoiding so-called stranded assets (Caldecott, et al., 2015; IEAGHG, 2016).
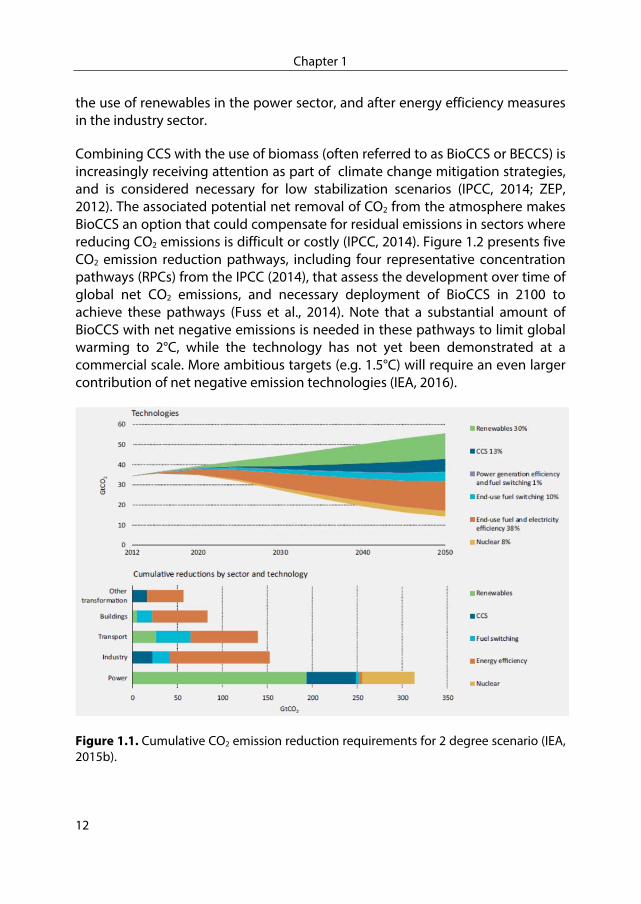
Most modelling studies agree that a portfolio of CO2 mitigation options including CCS is needed to reach the required CO2 emission reduction (GEA, 2012; IEA, 2015b, 2016; IPCC, 2014; Riahi et al., 2015). Figure 1.1 presents a pathway from the IEA to limit global warming by 2°C in which CCS accounts for 13% CO2 emission reduction (IEA, 2015b). The role of CCS is pivotal in both the power and industrial sector, as CCS is the second most important strategy after
Chapter 1
12
the use of renewables in the power sector, and after energy efficiency measures in the industry sector.
Combining CCS with the use of biomass (often referred to as BioCCS or BECCS) is increasingly receiving attention as part of climate change mitigation strategies, and is considered necessary for low stabilization scenarios (IPCC, 2014; ZEP, 2012). The associated potential net removal of CO2 from the atmosphere makes BioCCS an option that could compensate for residual emissions in sectors where reducing CO2 emissions is difficult or costly (IPCC, 2014). Figure 1.2 presents five CO2 emission reduction pathways, including four representative concentration pathways (RPCs) from the IPCC (2014), that assess the development over time of global net CO2 emissions, and necessary deployment of BioCCS in 2100 to achieve these pathways (Fuss et al., 2014). Note that a substantial amount of BioCCS with net negative emissions is needed in these pathways to limit global warming to 2°C, while the technology has not yet been demonstrated at a commercial scale. More ambitious targets (e.g. 1.5°C) will require an even larger contribution of net negative emission technologies (IEA, 2016).
Figure 1.1. Cumulative CO2 emission reduction requirements for 2 degree scenario (IEA, 2015b).

Introduction
13
Figure 1.2. Representative concentration pathways (RPCs) of the IPCC (a), and the extent of net negative emissions and bioenergy with carbon capture and storage (BECCS) in 2100 (b) (Fuss et al., 2014).
Removing CCS from the mitigation portfolio has severe impacts on the challenge of climate change mitigation. CCS has been identified as the single CO2 abatement strategy that is most costly to replace by alternative technologies (e.g. IPCC, 2014; Riahi et al., 2015). When CCS is not available, the costs of stabilizing the atmospheric concentration at 450 ppm(v) in the year 2100 are in most models estimated to increase by 138% (IPCC, 2014). Furthermore, global CO2 emissions in the industrial sector are projected to be reduced by 15% in 2050, compared to 2010, when CCS is excluded, compared to an expected reduction of 40% when CCS is included (IEA, 2014b).
Carbon capture and storage 1.2.
CCS is a generic term for technologies that decrease CO2 emissions from power or industrial plants by capturing and storing the CO2 emissions from the according processes. CCS includes the capture, transport and storage of CO2. Three main categories are used to group the numerous existing capture technologies exist: post-combustion, oxy-fuel combustion and pre-combustion. Post-combustion technologies capture the CO2 from flue gas produced by the combustion of carbonaceous fuel. Chemical absorption with a solvent is typically used to capture the CO2 due to the low partial pressure of the CO2 in the flue gas. A temperature swing is then needed to liberate the absorbed CO2 from the solvent and regenerate the solvent. As steam is normally used, this process is energy-intensive. A key advantage of post-combustion CO2 capture is that it can be used to retrofit existing plants, and the plant’s product and
Chapter 1
14
reliability are potentially unaffected. Oxy-fuel combustion technologies use oxygen instead of air to combust carbonaceous fuel to generate a flue gas comprising mainly CO2 and steam. The CO2 only needs to be separated from the steam and further purification is often unnecessary. Pre-combustion technologies capture the CO2 before combusting the fuel by using air or oxygen to convert the fuel into syngas, i.e. a mixture of carbon monoxide (CO) carbon dioxide (CO2), water (H2O) and hydrogen (H2). A water-gas shift reaction is then applied to convert the CO to CO2 while producing additional H2. The CO2 in the syngas has a high partial pressure making its capture with a physical solvent possible. CO2 can be separated from physical solvents using a pressure swing that consumes less energy than temperature swing adsorption.
The captured CO2 can be transported by pipeline or ship to its storage location. In both options, the CO2 needs to be compressed before transportation. CO2 can be stored in depleted oil and gas reservoirs, deep saline aquifers and coal seams. The CO2 is physically and/or geochemically trapped underground. Physical trapping implies that the CO2 is kept in place by caprocks, faults, geological layers and/or pore spaces. Geochemical trapping involves dissolution of CO2 in fluids, the reaction of CO2 with minerals to form carbonates and adsorption on mineral surface.
Carbon capture and utilization 1.3.
The use of CO2 as feedstock, so-called carbon utilization (CU), is increasingly being researched as a technology alternatively or complementary to CCS. Carbon capture and utilization (CCU) aims to use CO2 as alternative feedstock in the production of goods. CCU includes the direct use of CO2 or its conversion into chemicals or materials. One of the most acknowledged examples of direct use of CO2 is enhanced oil recovery (EOR). CO2-EOR revolves around injecting CO2 in an almost depleted oil reservoir to increase the amount of oil that can be extracted. CO2-EOR can lead to the permanent storage of a substantial amount of CO2 (in the order of million tonnes) (e.g. Dai et al., 2014), and this amount could potentially be increased if CO2 injection is continued after the reservoir is fully depleted. CO2 can also be used in the production of products such as carbonates, chemicals, fuels and materials such as plastics (Huang et al., 2014; NETL, 2015). An overview of CO2 utilization products is presented in Figure 1.3.

Introduction
15
Figure 1.3. Overview of various CO2 utilization products (NETL, 2016).
There are several arguments reported for pursuing CCU, e.g.:
to generate revenues that (partially) offset the cost of CCS (DOE, 2014a; Huang et al., 2014; IEA, 2014a; SCOT, 2016).
to introduce CO2 and green energy (by using H2 produced from renewable energy) in the fuel and chemical production chain (Ampelli et al., 2015; Aresta et al., 2013; Perathoner et al., 2014; SCOT, 2016), which can help to stabilize electricity grids when considering a growing share of fluctuating renewable energy (Mennicken et al., 2016).
to cover the lack of geological storage potential for CCS in specific areas (Hendriks et al., 2013).
to minimize public concerns regarding the safety and viability of CO2 storage in some jurisdictions (Hendriks et al., 2013).
Chapter 1
16
Environmental performance and knowledge gaps 1.4.
Carbon capture and storage, and potentially carbon utilization, are considered effective climate change mitigation technologies, but are also associated with adverse impacts that affect the environmental performance of the technologies. The large energy required by the CO2 capture unit is one of the main drawbacks of the technology, because it lowers the efficiency (of a power plant) or increases the primary fuel consumption per unit of output (in an industrial process). Furthermore, the CO2 capture process increases the cooling demand, electricity consumption (for CO2 compression), and the use of chemicals and/or solvents. Finally, CCS requires additional infrastructure for the capture facility and the CO2 transport and storage network. These drawbacks lead to an increase of direct non-CO2 emissions at the power plant or industrial process, as well as a rise in indirect CO2 and other emissions caused by, for example, the additional production of fuels and chemicals.
A well-established method, that systematically assesses the impact of both direct and in-direct emissions on the environmental performance of a technology, is life cycle assessment (LCA). LCA covers the environmental impact of all stages of a product’s life (from cradle to grave) by quantifying all inputs and outputs of materials and energy. LCA has been used to evaluate the environmental performance of CCS by comparing the life cycle impact of a product or system with and without CCS (e.g., Corsten et al., 2013; Gibon et al., 2017; Kuckshinrichs et al., 2015). The functional unit (measure of the function (primary product) of the studied system) of LCA studies on CCS is a kWh of electricity or a kg of product, dependent on whether CCS is assessed in the power or industrial sector, respectively.
LCA studies on CCS have shown that the large reduction of direct CO2 emissions substantially lowers climate change potential. However, the decrease in output or increase in fuel demand caused by the energy required for CO2 capture partly offsets the CO2 emission reduction on site. This is especially noticeable when coal is used in a power plant or industrial process due to the impact of fugitive GHG emissions during coal production and transport: i.e. 90% capture of CO2 on site reduces total life cycle GHG emissions typically by 70% (Corsten et al., 2013). The increased fuel consumption per unit of output also leads to an increase in other life cycle impact categories, such as toxicity and eutrophication (e.g., Gibon et al., 2017; Zapp et al., 2012). As a result, trade-offs arise between climate change mitigation and other increasing other environmental impacts when applying CCS. Most LCAs have focused on the assessment of post-combustion
Introduction
17
CO2 capture using mono ethanolamine (MEA), while other concepts have been less examined (Corsten et al., 2013).
This thesis focusses on environmental impacts that are increasingly gaining attention but are to a limited extent addressed in environmental assessment studies. The three key aspects of this thesis are: increased water use of CCS, environmental impacts of CCS combined with bioenergy, and environmental impacts of CO2 utilization.
1.4.1. Increased water use of CCS
Water is an important resource for the production of energy. Water use is often divided into consumptive use and water withdrawal (water that is returned to the surface water source after use). Within the power sector, thermal power plants are the main source of water demand due to the significant amounts of water withdrawn for cooling processes of the plants. In Europe, thermal power plants account for 40% of the total freshwater withdrawn (Rübbelke et al., 2011).
The expected increase in water and energy demand will provide challenges in both the water and energy sector, often referred to as the water-energy nexus (e.g. DOE, 2014b; Halstead et al., 2014; IEA, 2016; Mouratiadou et al., 2016). The extent of these challenges is very regional specific, as they are strongly affected by the availability of water. The increase in thermal power production is expected to increase pressure on freshwater resources (Mouratiadou et al., 2016), and the electricity supply has been shown to be vulnerable to (future) water scarcity in Europe and the United States (e.g. Murrant et al., 2015; van Vliet et al., 2012).
The deployment of CO2 capture in thermoelectric power plants leads to a significant increase in cooling water use. For power plants, the total water use can increase by up to 90%, depending on the electricity generation technology and used fuel type (EPRI, 2011; IEAGHG, 2011; Macknick et al., 2011; NETL, 2012a, 2012b). Including CCS in the portfolio of climate change mitigation strategies to limit global warming by 2°C in 2100 could increase freshwater withdrawal by approximately 60%, compared to when CCS is not considered (Fricko et al., 2016). The potential impact of large scale deployment of CCS at thermal power plants on the global water consumption is very uncertain, as it strongly depends on the types of fuel and cooling methods used (Kyle et al., 2013). The increased electricity demand and the addition of CCS is expected to lead to a rise in the water use per unit of energy in the 450 ppm(v) scenario, and to an increase in
Chapter 1
18
the water stress in regions with low water availability, such as the middle East and dry parts of Europe and the United States (IEA, 2016).
Different methods exist that can assess the impact of water use. In LCA, the environmental indicator “water depletion potential” (WDP) measures the amount of water removed from freshwater resources. This indicator is suitable to assess total freshwater consumption of a single production chain, and to identify the key water consuming process within the chain. However, the WDP does not take into account regional differences in water availability, and excludes the effect of water withdrawal on the water footprint. Therefore, water footprint is not yet sufficiently tackled in LCA, and a discussion how water footprint can be included is on ongoing (e.g. Boulay et al., 2013; Hoekstra, 2016; Pfister et al., 2017). There are methods that aim to address the impact of water use on the water availability, such as “economic water stress” (Schornagel et al., 2012) and regional water stress (Pfister et al., 2009), but these methods have so far not been used to assess the impact of large scale CCS deployment. This thesis will address this gap by using water stress methodology to assess the impact of CCS on regional European freshwater availabilities. Besides, this thesis will assess life cycle WDP for different individual CCS cases (both power plant and industry), to improve the understanding of the impact of CCS on water consumption.
1.4.2. CCS combined with bioenergy
Combining CCS with use of biomass (BioCCS) is considered a promising climate mitigation option due to the potential net removal of CO2 from the atmosphere. Several LCA studies have been conducted on BioCCS in recent years (e.g. Gładysz e al., 2016; Oreggioni et al., 2017; Pang et al., 2017). The focus point in research regarding BioCCS is often the GHG emission reduction potential. However, the adverse impacts of CCS caused by increased fuel production also apply to BioCCS. These impacts strongly depend on case specific indicators, such as the type of fuel that is replaced by the biomass, what type of biomass is used, and how that biomass is produced. Therefore, LCAs that address various biomass types and include impacts other than climate change mitigation are valuable to identify environmental trade-offs of BioCCS.
The climate mitigation potential of BioCCS depends on whether the biomass is considered carbon neutral, i.e. CO2 emissions from biomass are not accounted because this CO2 is assumed to be removed from the atmosphere during the growth of the biomass. The majority of LCA studies on BioCCS assume carbon neutrality of biomass, and report remarkable GHG emission reduction potentials
Introduction
19
of BioCCS. For example, net negative CO2 emissions exceeding the original life cycle CO2 emissions are reported for an integrated oxy-fuel power plant when replacing coal by biomass and adding CCS (Gładysz et al., 2016). However, the temporal mismatch between carbon uptake in the biomass and its emission, and land use change are increasingly used as arguments against biomass neutrality (Bentsen, 2017; Cherubini et al., 2016; Johnson, 2009; Lamers et al., 2013). When accounting for this temporal difference, lower GHG emission mitigation potentials, yet still over 100%, are reported (e.g. Oreggioni et al., 2017). The assumption whether biomass is carbon neutral or not can have severe consequences for the GHG emission reduction potential of BioCCS. Therefore, additional LCAs that do not consider biomass to be carbon neutral are needed to improve the understanding of the environmental and climate impacts of BioCCS as climate change mitigation option.
This thesis will address these knowledge gaps by carrying LCAs for different processes (power and industry), varying the types of biomass (such as wood residues, straw and biogenic waste) and the extent to which the biomass is considered carbon neutral.
1.4.3. CO2 utilization
The environmental performance of CCU can be considerably different than CCS. The GHG emission reduction potential of CCU strongly depends on what CO2 utilization option is considered, but is generally lower than that of CCS (Cuéllar-Franca et al., 2015), as the CO2 is often not permanently stored and fossil based energy is often used for the conversion of CO2. On the other hand, LCA of CCU options show co-benefits in other environmental categories, particularly when the CO2 utilization process replaces a polluting conventional process (Cuéllar-Franca et al., 2015). Therefore, the environmental trade-offs of CCU are more complex than those of CCS, as CCS often increases the life cycle impacts in all environmental categories except climate change mitigation.
Contrary to CCS, climate change mitigation is not the only driver for CCU, as CCU can also be driven by economic or societal incentives (see section 1.3). The significance of the climate change mitigation potential of CCU is increasingly being debated. While some sources claim that CCU can be an effective climate change mitigation strategy complementary to CCS (e.g. Styring et al., 2011), CO2 reduction potentials are also considered limited due to the scale of CO2 utilization compared to the required large CO2 emission reductions needed to reach the agreed climate policy targets (Mac Dowell et al., 2017). As a result,

Chapter 1
20
expectations regarding the extent to which CCU can contribute to the required GHG emission reduction vary widely: for example, the potential contribution of CCU via chemical conversion is considered particularly limited (1%) (Mac Dowell et al., 2017) but also very promising (7% or more) (Styring et al., 2011). The CO2 emission reduction potential is subject to the product that CCU displaces and the time the CO2 is “stored” in the product, which can vary from days (e.g. fuels) to years (e.g. plastics and carbonates).
The assessment of the environmental performance of CCU is also more challenging than the assessment of CCS. The additions of new products to the system, often with different functionality (such as fuels and plastics), add complexity to the selection of system boundaries and reference cases in LCA of CCU. The determination of system boundaries, correct approach of accounting for the CO2 source and capture process, and consistent comparison of processes or products are identified as key challenges of LCA applied to CCU (von der Assen et al., 2014). Therefore, LCAs of CCU that use a consistent approach are needed to address these challenges and improve the understanding of environmental trade-offs of CCU.
Indicators that are often used to assess the performance of CCU, such as CO2 conversion efficiency and energy use, provide an incomplete perspective on the environmental performance of CCU. On the other hand, although LCA is useful to assess the GHG emission reduction potential of individual CCU options, comparing LCA results provides a limited perspective due to the different functionalities of CCU options. The existing performance indicators fail to directly assess the efficiency or effectiveness of CO2 conversion, and therefore there is a need for additional methods that allow the comparison of CCU options with different functionalities.
This thesis will address the knowledge gaps by performing an LCA on a novel CO2 utilization option based on chemical conversion, with special attention on the selection of system boundaries and reference cases. Furthermore, a new performance indicator will be introduced that can be used to compare the performance of CCU options with different functionality.

Introduction
21
Objectives and outline of thesis 1.5.
In the context of the identified knowledge gaps in existing literature, the objective of this thesis is to improve the understanding of environmental trade-offs of carbon capture, utilization and storage. This is done by applying, adapt and develop environmental assessments methods suitable for evaluating CCS and CCU technologies to a diverse selection of case studies. The following research questions are formulated:
I. How significant are the impacts of deploying carbon capture and storage on water availability, both at process and system level?
II. How does integrating the use of biomass affect the environmental trade-offs of carbon capture and storage?
III. What are the differences in environmental trade-offs between CO2 utilization and CO2 storage, and how can the understanding and comparison of environmental trade-offs be improved?
Table 1.1 provides an overview of the chapters and the research questions they address.
Table 1.1. Overview matrix of the chapters and addressed research questions. Chapter Title Research question
I II III 2 Exploring the potential impact of implementing
carbon capture technologies in fossil fuel power plants on regional European water stress index levels
x
3 Comparative life cycle assessment of biomass co-firing plants with carbon capture and storage x x
4 Impact of fuel selection on techno-environmental performance of tail-end calcium looping process applied to a cement plant
x x
5 Assessing the techno-environmental performance of CO2 utilization via dry reforming of methane for the production of dimethyl ether
x
6 New indicator for comparing the performance of CO2
utilization technologies x

Chapter 1
22
Chapter 2 addresses research question I by exploring the potential impact of large scale deployment of CO2 capture scenarios to European power plants on regional water stress levels. The increase in cooling water demand can be one of the drawbacks of CO2 capture and the corresponding increase in water depletion is not covered in traditional LCA. A database containing the European largest power plants with data on their size, geographical location, technology, age, fuel type and cooling method is developed. Next, different scenarios regarding type and penetration levels of carbon capture technologies are developed for 2030 and 2050. A geographic information system (GIS) based water stress model is then used to identify and quantify potential future regional water stress concerns for large-scale deployment of CCS.
Chapter 3 addresses research questions I and II by presenting a life cycle assessment of biomass co-firing power plants with CCS. Co-firing up to 30% wood pellets and straw pellets is assessed for two types of technologies: a coal-fired supercritical pulverised coal power plant and a coal-fired integrated gasification combined cycle plant. The effect of co-firing biomass and CCS is assessed on a process level by detailed mass balance calculations of the power plants, and on a system level by a comparative life cycle assessment.
Chapter 4 addresses research question I and II by conducting a techno-environmental assessment of calcium looping CO2 capture at a cement plant. Different fuels, among which biomass, are considered to drive the calcium looping process. A technical process model is developed to generate the mass and energy balance of the calcium looping CO2 capture process required for conducting the environmental life cycle assessment. The effect of using different fuels on the calcium looping system and life cycle performance is analysed and compared with a reference case without CCS. Furthermore, the chapter also analyses the effect of different means of assigning climate change reduction to stored biogenic CO2 on the performance of BioCCS.
Chapter 5 expands the focus to CO2 utilization and addresses research question III by conducting a comparative techno-environmental assessment of a utilization case study and a reference case study with and without CCS. In the utilization case study, CO2 is captured from a refinery and converted into syngas trough dry reforming of methane, after which the syngas is used for the production of dimethyl ether (DME). A technical process model is developed to produce the mass and energy balances required for the life cycle assessment. The performance of the utilization route is then compared with a reference case

Introduction
23
without CO2 capture and a CCS case and provides insights into the differences in environmental trade-offs between CCS and CO2 utilization.
Chapter 6 addresses research question III by introducing a new performance indicator to assess the performance of CO2 utilization options. The indicator measures the relates the energy use of CO2 conversion processes to the replacement of fossil feedstock from conventional processes and allows comparing the performance of CO2 utilization options with different functionality. The indicator is tested in three utilization case studies, among which the case study presented in chapter 5. The techno-environmental performance of the case studies is assessed and compared using conventional performance indicators (such as life cycle GHG emissions) and the newly developed indicator. Finally, the additional insights that the new indicator provides are highlighted and discussed.
Chapter 7 summarizes the objectives, approaches and key findings of chapters 2 to 6. Besides, it provides answers to the research questions, recommendations for policy makers and suggestions for further research.

24

25
Exploring the Potential impact of 2.Implementing Carbon Capture Technologies in Fossil Fuel Power Plants on Regional European Water Stress Index Levels
Wouter Schakel, Stephan Pfister, Andrea Ramírez
Published in: International Journal of Greenhouse Gas Control 39 (2015), pp. 318-328
Abstract
Equipping power plants with carbon capture technology can affect cooling demand and water use. This study has explored the potential impact of large scale deployment of power plants with carbon capture technologies on future regional water stress in Europe. A database including 458 of European largest power plants with data on location, technology, age, fuel type, amount of electricity generation and cooling method has been developed. This data has been combined with literature data on water use rates and developed scenarios to calculate corresponding water use of these European power plants for 2030 and 2050 under different conditions, such as the penetration level of carbon capture technologies and installed technologies. Water stress methodology based on water withdrawal has been used to explore the impact of carbon capture and storage on future water stress levels. Our findings indicate that by 2030, no considerable increase in water stress is expected due to the instalment of carbon capture technologies. However, when assuming a high penetration level of carbon capture technologies, water stress in 2050 might substantially increase in many regions in Europe. The extent of the increase in water stress strongly depends on penetration level of carbon capture, installed power plant and cooling technologies and applied water stress methodology. When using water consumption to estimate water stress, the results do not indicate significant changes in water stress for the scenarios with carbon capture. Nevertheless, as water stress based on water withdrawal is currently the common method, the results of this study provide reasons for concern regarding the potential impact of carbon capture on future European water stress levels and indicate the need for future research to monitor and possibly prevent potential water stress increases from the instalment of carbon capture technologies.

Chapter 2
26
Introduction 2.1.
Decreasing greenhouse gas emissions (GHG) from energy production while maintaining or increasing energy security will become an enormous challenge in upcoming years. Carbon capture and storage (CCS) offers a potentially low-cost pathway to energy production with low CO2 emissions (GEA, 2012). The International Energy Agency (IEA) indicates that CCS will be a critical component of energy portfolios with low CO2 emissions if ambitious measures are undertaken to combat climate change (IEA, 2013). In the 2°C scenario of the IEA, CCS technology will account for 14% of the CO2 emissions reductions by 2050 (IEA, 2014b). The importance of CCS in future energy systems is also highlighted in other studies (GEA, 2012; IEA, 2012a; IPCC, 2012).
Thermoelectric power plants require water, for generating steam to drive turbines, for cooling exhaust steam and for other operations including ash disposal, emissions control and potable use (IEAGHG, 2011a). Total freshwater withdrawal of about 224 km3/yr in North America and 121 km3/yr in Europe is required for cooling thermoelectric power plants (van Vliet et al., 2012), accounting for about 40% (King, e al., 2008) and 43% (Rübbelke et al., 2011) of total surface water withdrawals, respectively. Water is a limited natural resource and its use reduces availability and results in water scarcity impacts. Generally, water use is differentiated into water withdrawal (which includes water that is released back after use to the water source) and water consumption (water that is evaporated or integrated into products) (IEAGHG, 2011a). The effect of water consumption depends on the water availability and current water scarcity level.
Applying CO2 capture technology in a power plant can further increase water withdrawal and consumption due to additional fuel use to compensate the efficiency decrease induced by CO2 capture and due to the water demanded by the CO2 capture process itself. When CCS technology is added to a coal fired power plant, the total water use (consumption and withdrawal) is expected to increase by 33 to 90% (EPRI, 2011), depending on the energy conversion technology. Applying CCS in power plants equipped with conventional conversion technologies (such as subcritical pulverised coal) leads to relatively larger water use increases than when CCS is applied in power plants equipped with modern technologies (e.g. ultrasupercritical pulverised coal, IGCC). The range of water consumption increase is also confirmed by other studies (Feeley et al., 2008; Fthenakis et al., 2010; IEAGHG, 2011a; Macknick et al., 2011; NETL, 2012a, 2012b) and could become a potential bottleneck in applying CCS technology, especially in water stressed areas (EPRI, 2011).
Exploring the Potential impact of Implementing Carbon Capture Technologies in Fossil Fuel Power Plants on Regional European Water Stress Index Levels
27
The importance of water demand and water availability in thermoelectric power production is well documented (Feeley et al., 2008; Koch et al., 2009). Furthermore, it has been shown that both the electricity supply of Europe and the US could be vulnerable to future water scarcity (van Vliet et al., 2012). However, only few studies have assessed the potential impact of applying CCS to power plants to the water availability at the regional or global level. In the United States, the water demand of the future electricity system has been linked to the water availability (Averyt et al., 2011; NETL, 2010c; Sovacool et al., 2009), identifying potential challenges and water trade-offs of thermoelectric electricity production. Besides, future water withdrawal and consumption of the power sector has modelled for different scenarios (Liu et al., 2014). Furthermore, the potential impact of CO2 storage in aquifers in the United States has also been investigated (Davidson et al., 2009). A study assessing the future potential impact of CCS on the average global water consumption (Dooley et al., 2013) showed that applying CCS can significantly increase global water consumption. However, this study also concludes that CCS and water availability are not necessarily in conflict as it is expected that future deployment of advanced CCS power plants, such as IGCC-based units and oxy-fired systems, would lead to lower water consumption rates than the water consumption rates of current power plants (Dooley et al., 2013). In Europe, a pilot project assessing the cooling water use of the electricity and industry sector has recently been finished (Ecofys et al., 2014), but research on the impact on freshwater availability is not yet included. Future pathways with high level of penetration of CCS have been identified to increase water consumption in the UK and to intensify risks to the aquatic environment, especially if electricity generation with CCS is clustered (Byers et al., 2014).
To date, no studies are available in the open literature that assess the potential impact of applying carbon capture to power plants on the water availability and water stress in Europe. Such assessment should take into account whether, where and under what circumstances power plants equipped with carbon capture technology could contribute to increases in regional water scarcity. The goal of this study is to explore the potential impact of applying carbon capture on European water stress levels. To achieve this goal, water usage of the 458 major thermoelectric power plants in Europe is spatially matched with water availabilities per watershed. By using prospective scenarios (for 2030 and 2050), varying the amount of CCS installed, power plant technologies, carbon capture technologies and cooling methods, potential bottlenecks of applying CCS on Europe’s regional water scarcity levels are explored and discussed.

Chapter 2
28
Methodology 2.2.
This study uses a bottom up approach to regionally relate water demand and availability to assess the impact of implementing carbon capture in fossil fuel power plants on regional water scarcity. Typically, water scarcity is measured based on a ratio between water use and water availability (Kounina et al., 2012). In this study, a water stress index (WSI) developed by Pfister et al. (2009) is used (see section 2.2.4).
Figure 2.1. Schematic overview of the applied methodology.
Figure 2.1 schematically depicts the methodology with the corresponding data flows. Inventory data comprises power plant data (section 2.2.1) and water use factors (section 2.2.2). Prospective scenarios are developed for 2030 and 2050 which include assumptions on the level of penetration of CCS, CO2 capture technologies and corresponding changes in the water use of the power plants (section 2.2.2). Current regional water stress index figures are used to determine the current water stress. The impact assessment (section 2.2.4) consists of a spatial match of water withdrawal levels of the power plants with regional water

Exploring the Potential impact of Implementing Carbon Capture Technologies in Fossil Fuel Power Plants on Regional European Water Stress Index Levels
29
availability levels to explore the potential impact of the assessed power plants on the water stress index in European watersheds for each scenario. Then, the water stress index levels of the different scenarios are compared to the current situation (base case scenario), which enables exploring the impact of CCS on water stress levels, potential bottleneck areas and the water footprint of electricity production in Europe.
2.2.1. Power plant database
In this study, a database was developed which includes 458 of the largest power plants (> 200MW) in Europe (including Turkey, excluding Russia). The location of the included power plants is geographically presented in Appendix I, and the database is made available as supplementary data in the online published version of this chapter (Schakel et al., 2015). The database covers 72% of the EU’s electricity generation in 20091 and the major power plants (> 200MW) of non-EU European countries2. The data was gathered by combining and harmonizing data from several public sources (Carma, 2013; Davis et al., 2013; Industry About, 2013). The initial database, with the names, size, primary fuel type and location of all power plants was obtained from Davis et a al., (2013). Missing data on age, cooling method and technology of the power plants has been added using information from Carma (2013) and Industry About (2013). An overview of the type of power plant data that is comprised in the database is presented in Table 2.1.
1 2.3 TWh included in the database out of a total generation of 3.2 TWh (IEA, 2012a). 2 Andorra, Belarus, Macedonia, Moldova, Montenegro, Serbia, Switzerland, Turkey and
Ukraine.

Chapter 2
30
Table 2.1. Power plant data comprised in the database (458 power plants). Indicator Unit Range/PossibilitiesPlant Name -Country - All countries within Europe (including
Turkey, excluding Russia) Primary Fuel - Coal/Natural Gas/Oil/Uranium Technology - Conventional, pulverised coal, IGCC,
CHP, NGCC Latitude °N -15.4-39.3Longitude °E 27.8-65.7Commission Year - 1900-2014Cooling method - Direct cooling/cooling tower/cooling
pond/air cooled Cooled by sea water - Yes/noElectricity Generation 2007 MWh 0-40,000,000Expected Electricity Generation 2020
MWh 0-40,000,000
The database includes the primary fuel type, combustion technology and cooling method of the power plants. Primary fuel types that are considered are coal (no distinction between black and brown coal), natural gas, oil and uranium (nuclear power plants). Co-firing biomass and hydro power plants were not taken into account for simplification reasons. Coal-fired power plants are categorized by their combustion technology into subcritical (conventional), supercritical, gasification (IGCC) and combined heat and power (CHP). Gas-fired power plants are either conventional or combined cycle plants (NGCC). Oil and nuclear power plants are not categorized per technology. Power plants are also categorized by their cooling method into direct/once-trough cooling, cooling ponds3, wet cooling towers and air cooling. The type of cooling method of some of the power plants were not provided by the sources, and have therefore been estimated using google maps to check for the presence of cooling towers and proximity of fresh or sea water. In all cases, either cooling towers were present (assumed method: cooling towers) or the plant was located next to fresh or sea water (assumed method: direct cooling). Hybrid cooling methods, e.g. the combination of direct cooling and cooling towers to enable power plants to flexibly handle varieties in freshwater availability and water use restrictions,
3 Cooling pond: Artificial body of water formed for cooling purposes. Sometimes used as
alternative for cooling towers or once-trough cooling systems if sufficient land is available.

Exploring the Potential impact of Implementing Carbon Capture Technologies in Fossil Fuel Power Plants on Regional European Water Stress Index Levels
31
were not considered. Out of the 458 power plants in the database, 112 are directly cooled by sea water and 4 power plants are air cooled. Both sea water cooled and air cooled power plants are assumed to have no impact on the regional water stress index, which addresses freshwater resources only, and have therefore been left out of further analyses.
2.2.2. Water use factors
There is no open information available on the amount of water use (withdrawal and consumption) of the power plants. To include this information in the database, the total water use (including cooling water, water for steam cycle and flue gas cleaning) of the power plants is estimated using general water use rates based on a literature review. Table 2.2 presents water withdrawal and consumption ranges per technology and cooling method available in literature as well as the selected value used for each configuration in this study. Most values are selected from the study of Dooley et al. (2013), which provides water use data of the majority of configurations and is the most up to date study available with similar system boundaries as used in our study. When needed, remaining gaps are filled with data from Macknick et al. (2011) and IEAGHG (2011). Water use rates for ultrasupercritical coal-fired, oxyfuel coal fired, and conventional oil/gas fired power plants cooled by pond were not presented in these studies and are taken from (IEAGHG, 2011a), (Ikeda et al., 2006) and (Fthenakis et al., 2010), respectively. The final gaps are filled by estimating the water use rates assuming similar conversion factors for different configurations (see Table 2.2).
Some power plants in the database are identified as Combined Heat and Power plants (CHPs). CHPs use part of their excess heat for district heating and require less water for cooling, but also require more make-up water as additional steam has to be produced to distribute the heat. However, the potential change in water use has not been included in this study for two reasons: Firstly, because it is not known for all power plants in the database whether they function as a CHP (due to lack of data) and secondly, because the amount of heat used for district heating is case-specific and might vary seasonally (depending on e.g., location, size, outside temperature), which also makes the amount of water that needs to be allocated to district heating case-specific.

Chapter 2
32
Table 2.2. Overview of water use rates reported in literature and of values selected in this study. Fuel type
Combustion technology
Cooling method
Water withdrawal (L/kWh)
Water consumption (L/kWh)
Literature1)
Value selected
Literature 1)
Value selected
Coal
Generic/ sub-critical
Once-trough
102.5-158.0 158.02) 0.4-1.0 1.02)
Cooling pond
46.3-67.9 53.22) 2.1-3.0 2.12)
Cooling tower
2.0-4.4 3.82) 1.7-4.4 2.62)
Sub-critical + CCS
Once-trough
241.0 241.02) 1.3 1.32)
Cooling tower
4.2-5.6 4.82) 3.2-5.0 3.62)
Supercritical Once-trough
85.5 85.53) 0.1-0.5 0.43)
Cooling pond
57.0 57.03) 0.2 0.23)
Cooling tower
2.3-3.9 2.33) 1.9-3.9 1.93)
Supercritical + CCS
Once-trough
212.14) 1.14)
Cooling tower
4.3-4.9 4.33) 3.2-4.4 3.23)
Ultrasuper-critical
Once-trough
139.9 139.95) 0.1 0.15)
Cooling tower
2.56) 1.8-2.0 2.05)
Ultrasuper-critical + CCS
Once-trough
240.5 240.55) 0.4 0.45)
Cooling tower
4.67) 3.47)
IGCC Once-trough
147.0 147.02) 0.1 0.12)
Cooling tower
0.9-3.1 1.52) 0.7-3.1 1.42)
IGCC + CCS Once-trough
185.2-186.0 186.02) 0.4 0.42)
Cooling tower
2.2-2.6 2.22) 1.8-2.1 2.02)
Oxyfuel + CCS Once-trough
226.1 226.15) 0.3 0.35)

Exploring the Potential impact of Implementing Carbon Capture Technologies in Fossil Fuel Power Plants on Regional European Water Stress Index Levels
33
Fuel type
Combustion technology
Cooling method
Water withdrawal (L/kWh)
Water consumption (L/kWh)
Literature 1)
Value selected
Literature 1)
Value selected
Coal Oxyfuel + CCS Cooling tower
no data available
4.98) 3.7 3.79)
Oil/ Gas
Conventional Once-trough
85.9-152.0 152.02) 0.3-0.9 0.92)
Cooling pond
4.6-29.9 29.910) 0.4-3.1 0.410)
Cooling tower
0.9-4.6 4.62) 0.6-3.1 3.12)
Gas NGCC Once-trough
34.1-76.0 49.52) 0.0-0.4 0.42)
Cooling pond
22.5-25.9 25.92) 0.9 0.92)
Cooling tower
0.6-1.0 1.02) 0.5-1.0 0.82)
NGCC + CCS Once-trough
62.5 62.52) 0.7 0.72)
Cooling tower
1.9-2.1 1.92) 1.4-1.9 1.42)
Nuclear Conventional Once-trough
95.0-230.0 193.02) 0.5-3.4 1.02)
Cooling pond
1.9-30.7 30.72) 1.7-3.4 2.32)
Cooling tower
3.0-4.2 4.22) 2.3-3.4 2.52)
1) Range of values reported in literature (Dooley et al., 2013; Feeley et al., 2008; Fthenakis et al., 2010; IEAGHG, 2011; Ikeda et al., 2006; Macknick et al., 2012; Macknick et al., 2011; NETL, 2012a, 2012b; Yu et al., 2011).
2) Dooley et al., 2013. 3) Macknick et al., 2011. 4) Value is calculated by multiplying the water used by the cooling tower with a conversion
factor equal to the ratio between once-trough water use and cooling tower water use of subcritical + CCS.
5) IEAGHG, 2011. 6) Value is calculated by multiplying the water consumption with a conversion factor equal to
the ratio between water consumption and water withdrawal of cooling tower supercritical. 7) Value is calculated by multiplying the water use rates of ultra supercritical without CCS with a
conversion factor equal to the ratio between water use of supercritical with and without CCS. 8) Value is calculated by multiplying the water consumption with a conversion factor equal to
the ratio between water consumption and water withdrawal of cooling tower supercritical + CCS.
9) Ikeda et al., 2006. 10) Fthenakis et al., 2010.

Chapter 2
34
No direct improvement in water use per technology is assumed when assessing the water use rates for 2030 and 2050. However, for the prospective scenarios technology development has been taken into account by upgrading the energy conversion technologies of the power plants to state of the art technologies (see section 2.2.3). As these upgraded energy conversion technologies have higher energy conversion efficiency with lower cooling demand, they use less water, and water use is reduced in the prospective scenarios.
2.2.3. Scenario development
The configuration of future electricity generation is highly uncertain as is shown by the vast amount of different prospective scenarios available (e.g., ERA, 2009; GEO, 2012; IEA, 2012; IPCC, 2012). Consequently, there is a wide range of possibilities regarding the used conversion technologies and the penetration of CCS in the future electricity generation system. In this study, seven different scenarios have been constructed to explore the impact of CCS in the future configuration of electricity generation under different circumstances. The reference (base case) scenario (A0) represents the current situation and water use rates of the power plants. Three prospective scenarios with increased power production are included for 2030: A reference scenario without penetration of carbon capture technologies (B0), one in which all modern (built after 2000) fossil-fuelled power plants are assumed to be retrofitted with carbon capture technology with improved technologies for coal and gas fired power plants (B1) and one with the same amount of retrofitted CCS but without technology improvement for coal fired power plants (B2). For 2050, three scenarios are included: A reference scenario without CCS penetration (C0) and two scenarios in which CCS penetration levels are assumed to match the 2DS base 2050 scenario from the IEA’s roadmap (IEA, 2012a). The applied scenarios are presented in Table 2.3.
Note that the goal of the scenarios is to explore the potential impact of CCS penetration on water use by power plants. Therefore, the aim is to produce conservative and optimistic scenarios to assess a widespread range in future electricity production and not to accurately predict the future electricity production configuration in Europe. Assumptions are included to reduce complexity and to deal with data unavailability. In general, no switching between fuel types is considered between the scenarios. Power plants maintain their current fuel type in every prospective scenario. The type of cooling technology is assumed to be constant as well: Power plants maintain their current cooling technology in all prospective scenarios, except power plants

Exploring the Potential impact of Implementing Carbon Capture Technologies in Fossil Fuel Power Plants on Regional European Water Stress Index Levels
35
equipped with cooling ponds which are assumed to be replaced with power plants with cooling towers in the 2050 scenarios. Increases in efficiency and reductions in water use per individual technology are not considered. Instead, technological development is taken into account in the scenarios, to some extent, by changing the conversion technologies of the power plants into more modern technologies in future scenarios (for example USPC and oxyfuel). These more modern technologies increase efficiency and generally require less cooling water. As a result, overall water consumption per kWh produced decreases.
For the 2030 scenarios, the expected electricity generation figures of the power plants for 2020 (Davis et al., 2013) are used as a proxy, because these figures distinguish between individual power plants (e.g., planned added capacity, planned shutdown). For 2050, an average relative increase in electricity generation is assumed for each power plant site following the “2DS base 2050” IEA roadmap scenario (IEA, 2012a). For the 2050 CCS scenarios (C1 and C2), no distinction between CCS penetration rates between countries is considered, as no country specific data is available. For each country, coal and gas fired power plants are replaced with power plants with CCS starting from the newest to the oldest, because the oldest power plants are expected to be replaced the soonest and are not likely to be carbon capture ready. This is done, up until the point the penetration rate is reached. In scenario C2, half of the coal fired power plants that are replaced by power plants with CCS are assumed to be IGCCs and half are assumed to be oxyfuel stations. In the database, random sampling is applied to select which power plants in each country are replaced by IGCCs and oxyfuel stations, respectively.

Chapter 2
36
Table 2.3. Key characteristics of the assessed scenarios. Scenario Year CCS
deployed CCS penetration
Carbon capture technology
Technologies power plants without CCS
A0 2010 No No - Technologies in 2010 B0 2030 No No - Technology
improvement for coal and gas fired power plants1)
B1 2030 Coal and gas power plants built after 20002)
19% (89 out of 458 power plants)
Retrofitted with post-combustion capture
Technology improvement for coal and gas fired power plants1)
B2 2030 Coal and gas power plants built after 2000
19% (89 out of 458 power plants)
Retrofitted with post-combustion capture
No technology improvement for pulverised coal fired power plants
C0 2050 No No - Replaces: - Coal-fired power plants with USPC - Gas-fired power plants with NGCC - Nuclear/Oil power plants with same type of technology as defined in database
C1 2050 Coal and gas fired power plants3)
87% of coal-fired power plants and 33% of gas-fired power plants4)
Replaces: - Coal-fired power plants with USPC with post-combustion capture - Gas-fired power plants with NGCC with post-combustion capture
Replaces: - Coal-fired power plants with USPC - Gas-fired power plants with NGCC - Nuclear/Oil power plants with same type of technology as defined in database
C2 2050 Coal and gas fired power plants3)
87% of coal-fired power plants and 33% of gas-fired power plants4)
Replaces: - Coal-fired power plants with IGCC with pre-combustion capture and oxyfuel (50%/50%) - Gas-fired power plants with NGCC with post-combustion capture
Replaces: - Coal-fired power plants with USPC - Gas-fired power plants with NGCC - Nuclear/Oil power plants with same type of technology as defined in database
1) Subcritical pulverised coal plants are assumed to be upgraded to supercritical pulverised coal plants. Cooling water rates of NGCCs are used instead of conventional gas fired power plants.
2) All power plants with building year 2000 or later are assumed to be retrofitted with carbon capture technology.
3) Power plants are assumed to be replaced with power plants with CCS starting from the newest to the oldest, as the oldest power plants are replaced the soonest and are not likely to be capture ready, until penetration rates are reached.
4) 2DS base 2050 scenario from IEA roadmap (IEA, 2012a).

Exploring the Potential impact of Implementing Carbon Capture Technologies in Fossil Fuel Power Plants on Regional European Water Stress Index Levels
37
2.2.4. Impact on water scarcity (water stress index)
Water stress is commonly defined by the ratio of total annual freshwater withdrawals (WU) to hydrological availability (WA), as is described by the withdrawal-to-availability ratio (WTA) in eq. 2.1 (Alcamo et al., 2003).
(eq. 2.1)
This concept is enhanced by temporal variation and storage of water availability (VF) to calculate a water stress index (WSI) that accounts for seasonality, ranging from 0 to 1 (Pfister et al., 2009). The WSI serves as one option for a characterization factor of the suggested midpoint category “water deprivation” in Life Cycle Impact Assessment (Kounina et al., 2012). Moderate and severe water stress is expected above a threshold of 20 and 40% WTA, respectively. These figures are expert judgments and thresholds for severe water stress might vary from 20 to 60%. In the WSI method, the WTA thresholds of 20, 40 and 60% are translated into WSI of 0.09, 05 and 0.91. The WTA of current state is taken from the WaterGAP2 global model (Alcamo et al., 2003), which models global water use and availability for over 10,000 individual watersheds.
In this research, the changed water use rates of the power plants in each scenario (k) are spatially matched with the watersheds i for which the water stress index (WSI) is defined. Consequently, the WTAi is recalculated for each scenario k:
,∑ , (eq. 2.2)
In which WTAi,k is the ratio of annual freshwater withdrawal to hydrological availability, WU0i the current annual freshwater withdrawal for watershed i, dWUk,I the change in water withdrawal in scenario k for watershed i and WAi the hydrological availability. The updated WTA values are consequently used to recalculate WSI and the difference of WSI (dWSI) based on Pfister et al., (2009):
∗ . ∗ ∗ (eq. 2.3)
As WSI is scaled to represent the impact, the value of dWSI can directly be compared among watersheds and regions to determine the level of additional or decreased water stress caused by the change in the power production system. Additionally, the water stress index levels of the different scenarios can

Chapter 2
38
be compared to the current situation (reference scenario), which enables exploring the impact of CCS on water stress levels and potential bottleneck areas.
The original WSI accounts for water stress in a watershed as a function of the withdrawal-to-availability ratio and therefore also indirectly accounts for water stress caused by changed water quality and competition for withdrawals. Consequently, the WSI might overestimate the effect of once-through cooling systems. Other indicators focus on consumption-to-availability (CTA) ratios that only account for water scarcity caused by consumptive water use (Kounina et al., 2012) and therefore underestimate total water stress. This issue is addressed by adjusting the WSI to a CTA based indicator as suggested by (Gomez et al., 2012). This adjustment of the constant in the exponent from -6.4 to -17.4 is based on the approach described by Pfister et al. (2014):
∗ . ∗ ∗ (eq. 2.4)
The CTA for each scenario are calculated in the same availability data as WTA. For the current water consumption apart from power production, the results of the WATCH project (Flörke et al., 2011) are used to which the modelled water consumption of power production in each scenario is added.
While globally, a comparison of the power plant’s impact on water scarcity (dWSI) is of most interest, the contribution of the power sector to total water use is interesting from a more local perspective, as even if the water stress level is low, the relative impact compared to the other users might be relevant. Therefore, the share of power production of the total water withdrawals and consumption in each watershed is also analysed, which indicates to what share the water scarcity is caused by the power sector.

Exploring the Potential impact of Implementing Carbon Capture Technologies in Fossil Fuel Power Plants on Regional European Water Stress Index Levels
39
Results 2.3.
2.3.1. Current water stress
Figure 2.2 illustrates the current water stress index following the reference (base case) scenario (A0) based on water withdrawal methodology and based on water consumption methodology. Water stress indexes are relatively low in the majority of Europe. However, several regions in Southern Europe, Eastern Europe, Belgium and the London area already have high withdrawal based water stress index levels. WSI based on water consumption is much lower throughout Europe and only high in small areas in southern Europe. In general, consumption based WSI is much lower than withdrawal based WSI in Europe, which implies that absolute changes in water consumption have to be much higher to significantly affect the WSI. A map with the WSI and the locations of the assessed power plants is presented in Appendix I and the end of this chapter.
2.3.2. Contribution of power sector
The share of water use in the power sector over total water use depends to a large extent on the geographical location and can provide a first indication of the local contribution of the power sector to water stress. Figure 2.3 presents the relative share of water withdrawal (a) and water consumption (b) of the power sector over the total water withdrawal and contribution for all European watersheds.
The share of the power sector of water consumption is much lower than the share of water withdrawal due to the extremely high withdrawal rates for once-trough cooling systems. As a result, much more water is withdrawn than consumed in the power sector, and because this difference is lower in other sectors (e.g. agricultural, industrial) the water withdrawal share of the power sector is much larger than the water consumption share. Nevertheless, the share of water consumption of the power sector is already significant (> 30%) in some areas in Europe, such as the area surrounding London, the area surrounding the river Rhine and small areas in Spain and Greece.

Chapter 2
40
Figure 2.2. Withdrawal and consumption based current water stress index levels in Europe (reference scenario A0).

Exploring the Potential impact of Implementing Carbon Capture Technologies in Fossil Fuel Power Plants on Regional European Water Stress Index Levels
41
Figure 2.3. Relative share of water use in the power sector over total water use including all sectors for water withdrawal (a) and water consumption (b).

Chapter 2
42
2.3.3. Water stress in 2030 scenarios
Figure 2.4 presents absolute changes in withdrawal based WSI compared to the reference scenario A0 for scenarios B0, B1 and B2. Overall, there are only minor changes in WSI levels. On European average, the WSI levels even decrease by 0,024, 0,009 and 0.007 points in scenario B0, B1 and B2 respectively. In the scenario without CCS (B0), WSI is slightly reduced in parts of the Benelux, France, Eastern Europe, Bulgaria and Turkey. This reduction is the result of a decrease in water use by coal and gas-fired power plants (due to the assumed upgrade in energy conversion technology). Overall, this decrease in water use compensates the increase in water use due to the growth in electricity production in 2030. Only in central Spain and Portugal water stress increases, as in this area the increase in water use due to additional electricity production is not compensated by technology upgrade (no technology upgrades are considered in 2030 as relative modern power plants (NGCC and SCPC) are already in place).
When penetration of carbon capture technologies is added (scenario B1), the rise in water use due to CCS only significantly increases the water stress in Spain and south-east UK. In these areas, multiple power plants are retrofitted with CCS following the B1 scenario boundaries, which increases the water withdrawal and the water stress. For the rest of Europe, the CCS penetration rate (19%) appears to be too low to compensate the decrease in water use due to the upgrade in energy conversion technologies and subsequently, to increase the WSI.
In scenario B2, equal CCS penetration to scenario B1 is assumed but no technology improvement for coal-fired power plants is included. Only small differences can be observed compared to scenario B1: WSI only slightly increases in Spain and central Europe (Rhine area).
While in general the presented WSI reduction in 2030 strongly depends on the type of technologies installed in 2030, the impact of CCS seems limited. The CCS penetration level of 19% for the B1 and B2 scenario appears too low to significantly increase withdrawal based water stress in the majority of Europe.
Exploring the Potential impact of Implementing Carbon Capture Technologies in Fossil Fuel Power Plants on Regional European Water Stress Index Levels
43
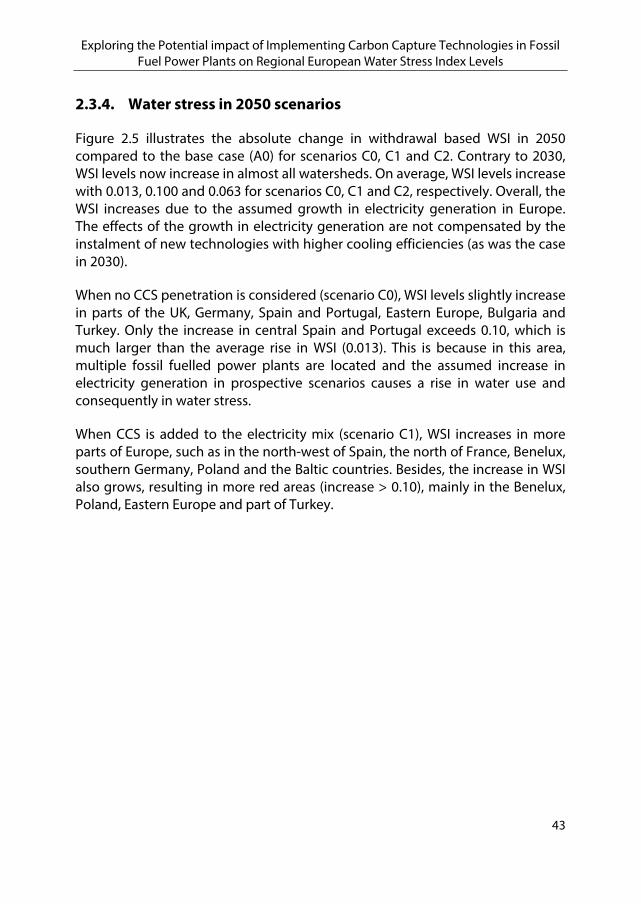
2.3.4. Water stress in 2050 scenarios
Figure 2.5 illustrates the absolute change in withdrawal based WSI in 2050 compared to the base case (A0) for scenarios C0, C1 and C2. Contrary to 2030, WSI levels now increase in almost all watersheds. On average, WSI levels increase with 0.013, 0.100 and 0.063 for scenarios C0, C1 and C2, respectively. Overall, the WSI increases due to the assumed growth in electricity generation in Europe. The effects of the growth in electricity generation are not compensated by the instalment of new technologies with higher cooling efficiencies (as was the case in 2030).
When no CCS penetration is considered (scenario C0), WSI levels slightly increase in parts of the UK, Germany, Spain and Portugal, Eastern Europe, Bulgaria and Turkey. Only the increase in central Spain and Portugal exceeds 0.10, which is much larger than the average rise in WSI (0.013). This is because in this area, multiple fossil fuelled power plants are located and the assumed increase in electricity generation in prospective scenarios causes a rise in water use and consequently in water stress.
When CCS is added to the electricity mix (scenario C1), WSI increases in more parts of Europe, such as in the north-west of Spain, the north of France, Benelux, southern Germany, Poland and the Baltic countries. Besides, the increase in WSI also grows, resulting in more red areas (increase > 0.10), mainly in the Benelux, Poland, Eastern Europe and part of Turkey.

Chapter 2
44
Figure 2.4. Absolute change of withdrawal based water stress index levels (Δ WSI) of 2030 scenarios B0 (no CCS), B1 (with CCS) and B2 (with CCS without technology improvement for coal fired power plants), compared to base reference scenario (A0).

Exploring the Potential impact of Implementing Carbon Capture Technologies in Fossil Fuel Power Plants on Regional European Water Stress Index Levels
45
Figure 2.5. Absolute change of withdrawal based water stress index levels (Δ WSI) in 2050 for scenarios C0 (no CCS), C1 (CCS with USCPC) and C2 (CCS with oxyfuel and IGCC) compared to base case scenario (A0).
Chapter 2
46
In scenario C2, WSI also increases compared to C0, but to a lesser extent than in scenario C1. In regions such as the north-west of Spain, the north of France, Poland, Eastern Europe and the Baltic countries the increase in WSI levels is less dramatic. On average, the WSI increase compared to the base case (A0) is 0.064, approximately 36% less than in scenario C1. Scenario C2 lowers the increase in WSI compared to scenario C1 because in C2 carbon capture coal-fired power plants are assumed to be oxyfuel and IGCC plants, whereas in C1 ultrasupercritical pulverised coal power plants (USCPC) with post combustion capture are considered. With current water use rates, oxyfuel and especially IGCC plants are more efficient than USCPC (Table 2.2), resulting in lower water use of these power plants and less contribution to WSI in scenario C2.
Discussion 2.4.
2.4.1. Total water use power plants
The first step in our methodology was to estimate the water use of the power plants in Europe. In total, 109 km3/year fresh water is withdrawn and 3.7 km3/year fresh water is consumed by the power plants included in the database in the reference scenario (the database is provided in the supplementary data in the online published version of this chapter (Schakel et al., 2015)). These figures are slightly below the reported fresh water withdrawal and consumption figures of the entire electricity sector in Europe in 2005 of 120 km3/year (56-152.6 km3/year) and 6.0 km3/year (4.5-8.3 km3/year), respectively (Davies et al., 2013). Only 72% of Europe’s electricity production is included in the database which explains why the total water use figures in the database are lower. Nevertheless, the bottom up calculated total water withdrawal and consumption rates of the reference scenario in this study seem to be fairly in range with the values reported in the study of Davies et al. (2013).
2.4.2. Water stress methodology
The use of water stress index is a methodology that is still under development. To date, no common agreement among scientists exists on which available method would be best suited for assessing water stress (Mertens, et al., 2014). Mertens et al. (2014) compared water stress results using different methods, among others the method used in this study, and showed that the chosen method can have a large impact on the final result. It is therefore important to further discuss the advantages and drawbacks of the methodology used in this study.

Exploring the Potential impact of Implementing Carbon Capture Technologies in Fossil Fuel Power Plants on Regional European Water Stress Index Levels
47
2.4.3. Withdrawal versus consumption
The WSI results in this paper are based on water withdrawal WSI methodology. This methodology is originally based on water withdrawal and does not specifically target water consumption. As a result, power plants using direct cooling systems (very high withdrawal rates with low consumption rates) affect the WSI to a larger extent than power plants with cooling towers (medium withdrawal and consumption rates). It can be argued that water consumption has a higher impact on water stress than water withdrawal, as the used water is not returned to its source. This would imply that power plants with cooling towers should impact the WSI more than plants with direct cooling systems. On the other hand, water scarcity is also affected by overall withdrawals, as the power plants need the cooling water, even if they do not consume it, and therefore other users are limited in their consumptive use.
The contribution to WSI of water withdrawal compared to water consumption is still debated in literature (Kounina et al., 2012) and not all effects contributing to water stress are yet included. For instance, once-through cooling systems are thermally polluting the water to a high level and therefore add by quality-degradation to water stress. As thermal pollution is not yet taken into account in LCA methodologies, taking this effect into WSI is an option to indicate overall water stress by water use of cooling systems. Based on the results published by Verones et al. (2010), heat releases of once-through cooling systems are of similar importance for freshwater ecosystem quality concern as water consumption in areas with low water scarcity, such as many regions in Europe.
2.4.4. Consumption based WSI
Due to the issues regarding consumption based water stress (section 2.4.3) and comparability to previous publications, this study focused on the analysis of withdrawal based water stress. Nevertheless, a consumption based analysis of the water stress has been carried out for comparison purposes. Figure 2.6 shows the change in consumption based water stress in the most intensive water use scenario C1 (2050, high penetration of CCS with USPC coal power plants) compared to the reference scenario A0 (current water stress). Surprisingly, there are no significant changes in the consumption based WSI in Europe, which is opposite to the findings from water withdrawal based WSI change in the same scenario (Figure 2.5, section 2.3.4). The most important reason for this difference is the large amount of water withdrawal rates for once-trough cooling systems (in the order of 100 L/kWh) compared to the water consumption rates,
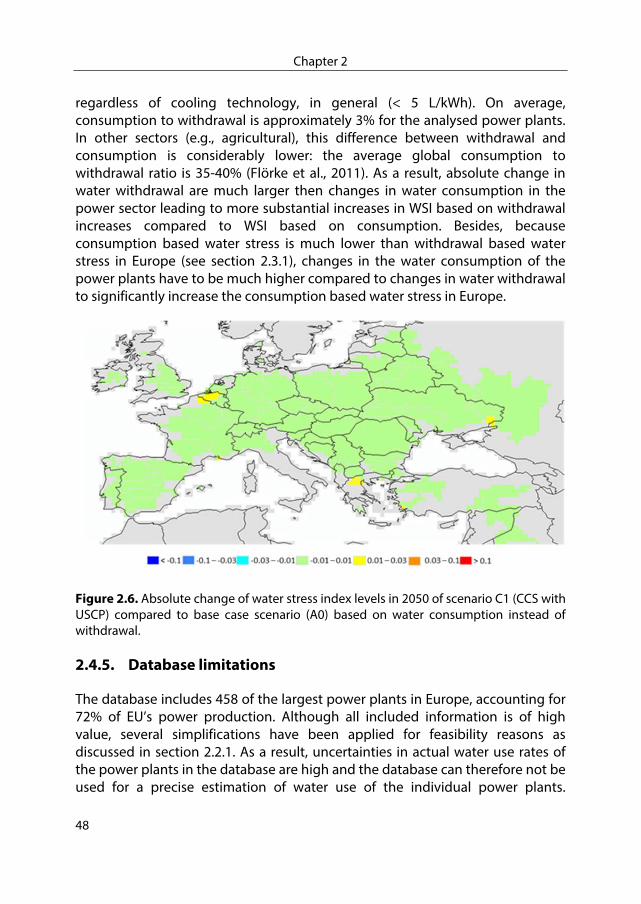
Chapter 2
48
regardless of cooling technology, in general (< 5 L/kWh). On average, consumption to withdrawal is approximately 3% for the analysed power plants. In other sectors (e.g., agricultural), this difference between withdrawal and consumption is considerably lower: the average global consumption to withdrawal ratio is 35-40% (Flörke et al., 2011). As a result, absolute change in water withdrawal are much larger then changes in water consumption in the power sector leading to more substantial increases in WSI based on withdrawal increases compared to WSI based on consumption. Besides, because consumption based water stress is much lower than withdrawal based water stress in Europe (see section 2.3.1), changes in the water consumption of the power plants have to be much higher compared to changes in water withdrawal to significantly increase the consumption based water stress in Europe.
Figure 2.6. Absolute change of water stress index levels in 2050 of scenario C1 (CCS with USCP) compared to base case scenario (A0) based on water consumption instead of withdrawal.
2.4.5. Database limitations
The database includes 458 of the largest power plants in Europe, accounting for 72% of EU’s power production. Although all included information is of high value, several simplifications have been applied for feasibility reasons as discussed in section 2.2.1. As a result, uncertainties in actual water use rates of the power plants in the database are high and the database can therefore not be used for a precise estimation of water use of the individual power plants.
Exploring the Potential impact of Implementing Carbon Capture Technologies in Fossil Fuel Power Plants on Regional European Water Stress Index Levels
49
However, it provides a good estimate of the water use of the power sector in the assessed areas (watersheds). The aim of this study is to explore potential future water stress issues when applying CCS on a large scale, and not to predict future water use of the power sector with a high level of detail. It is therefore concluded that the data in the database is considered to be of sufficient quality for the purpose of this study.
2.4.6. Cooling methods/water use factors
In this study, water use factors obtained from literature were used to calculate the water use of the power plants. As it was difficult to find data distinguishing between plant technology and cooling method, as much data as possible was taken from the most recent study to ensure a harmonised dataset for all power plant technologies and cooling method configurations. However, the selected water use factors were generally at the higher side of the literature ranges, and therefore, total water use and consequently the impact on water stress of the power plants might have been overestimated, both in the base case and in the scenarios. Together with the conservative approach used for the development of 2050 scenarios, the results might represent a worst-case estimate for the impact of CCS on future water stress levels in Europe, which falls well within the goal of this study to explore the impact of CCS on water stress under different conditions.
Some assumptions had to be made to use general figures for all power plants. For instance, hybrid cooling is not considered in this study. In reality, some power plants are equipped with both a direct cooling system and a cooling tower (Ecofys et al., 2014), enabling to shift between the cooling systems depending on varieties in freshwater availability throughout the year. In this study, power plants equipped with a cooling tower are assumed to always use the tower for cooling.
Air cooled power plant have also not been included. When sea water is not available, air cooling or dry cooling is the best performing cooling technology to avoid fresh water withdrawal and consumption, (IEAGHG, 2011a). Air cooled power plants would drastically decrease the impact on water stress of these plants, regardless of whether carbon capture is included. This method has not been considered in this study as no scenario analysis is needed to deduce that implementation of air cooled power plants, especially in regions with high water stress, will improve the water stress index. Although the potential benefits of air cooling in dry regions are evident, adverse consequences exist for the technical

Chapter 2
50
and economic performance of the power plant, such as a decrease in energy efficiency, and consequently an increase in life cycle CO2 emissions as well as power plant costs (IEAGHG, 2011a). The consideration whether the decrease in water stress outweighs these adverse impacts is power plant specific, and falls beyond the scope of this study.
Finally, future improvements in cooling efficiency are not included. Current cooling rates for all technologies have also been used in the future scenarios. Although some learning in cooling methods could be expected, data on the prospected learning is not available in literature.
2.4.7. Scenarios
The scenarios in this study were developed to create a comparison of scenarios with deployment of CCS and base case, or business as usual, scenarios in which no CCS is deployed. For 2030, intermediate scenarios have been developed to explore whether a small penetration of CCS already impacts the WSI. The results indicate that this small penetration does not significantly affect WSI levels throughout Europe. In fact, WSI levels even decrease compared to the base case (current) situation. However, the latter result might be too optimistic for two reasons: firstly, because expected electricity generation figures for 2020 are used (while figures for 2030 might be significantly higher) and secondly, the assumption that all old subcritical coal-fired power plants and conventional gas-fired power plants are replaced with newer technologies might not be valid for all power plants. Although the effect of technology upgrade for coal-fired power plants is explored using scenario B2 (in which no technology improvement is considered), this has not been done for gas fired power plants as much less data on cooling demand of gas fired power plants per technology is available. The assumed reduction of the large water withdrawal rates of direct cooled conventional power plants in 2030 might therefore be argued together with the presented reduction of WSI. However, regardless of assumed technology improvement, the potential expected increase in WSI due to installed CCS in 2030 can still be considered relatively low.
The goal of the 2050 + CCS scenarios was to explore the potential impact of applying CCS with a conservative approach. To do so, the “2DS base 2050” scenario from IEA roadmap (IEA, 2012a), in which a high penetration level of CCS is assumed, has been used for constructing these scenarios. Under this conservative approach, results indicate concerns that large scale deployment of CCS will substantially increase WSI levels in large parts of Europe. However, the

Exploring the Potential impact of Implementing Carbon Capture Technologies in Fossil Fuel Power Plants on Regional European Water Stress Index Levels
51
applied scenarios are very static with little flexibility towards e.g. fuel types, locations and cooling methods and adding more flexible scenarios might improve the results.
2.4.8. Impact of climate change on water stress
This study has not included the potential effect of the rising CO2 concentration in the atmosphere on the water availability in the future. The rising CO2 levels increase the earth’s temperature and are expected to increase water stress in the future (Murray, et al., 2012; Schewe et al., 2014). Although this could also potentially change the impact of applying CCS on the water stress, this paper aimed to explore the potential impact of CCS on water stress levels in Europe and not to provide an accurate prediction of future water stress levels by including future changes in all the numerous contributions to water stress.
Conclusion 2.5.
Applying carbon capture on power plants can increase the total water withdrawal and consumption of the power plants. This study aimed to explore the potential impact of future deployment of carbon capture technologies on the water stress in Europe. A database which includes existing power plants has been developed to assess water use of these power plants. The water use of these power plants has been varied using different scenarios for 2030 and 2050 varying the electricity generation and CCS penetration in Europe. Using a water stress method based on water withdrawal rates, the effect of the water demand of the assessed power plants (with and without carbon capture technology) on the water stress in Europe in 2030 and 2050 is explored.
The analyses show that water stress can be an issue of concern in certain European areas. By 2030, applying carbon capture technologies in power plants is not expected to significantly increase water stress in Europe, because the expected penetration of CCS in 2030 is relatively low and the increase in water demand due to more electricity consumption is likely to be compensated by a reduction in water demand of the power plants due to instalment of improved technologies which require less cooling water. However, in 2050, large scale penetration of CCS showed substantial increases in local water stress levels in Europe, especially by once through cooling systems. The combination of an increase in electricity production and installed carbon capture technologies give reasons for concern regarding the water stress in many areas in Europe, including the UK, Spain and central and Eastern Europe. The increase in water

Chapter 2
52
stress can significantly be lowered when more IGCC and oxyfuel coal-fired power plants are installed instead of ultra supercritical pulverised power plants.
When water stress is estimated using water consumption, the impact of CCS is not significant and almost no increase in water stress can be observed for 2030 and 2050. However, as water stress depends on both water withdrawal and water consumption, the insignificant impact of CCS on consumption based water stress does not provide sufficient substantiation to ignore or underestimate future water stress in Europe, as water stress depends on both water withdrawal and water consumption.
As this study has only provided an exploration of the potential impact of CCS on the water stress in Europe, associated uncertainties are relatively high. Recommended steps to improve this research are:
Improvement of WSI methodology, taking both water withdrawal and consumption as well as thermal pollution into account.
Potential future changes in water availability (due to e.g. climate change).
Changes in water use of other sectors than the electricity sector. Improvement of power plant data. Expansion and Improvement of scenarios by including:
o shift in cooling methods o shift in fuel types o shift in power plant locations o more country specific data (CCS penetration, nuclear policy) o cooling efficiency improvement
Take into account different policies and priorities regarding electricity production throughout Europe.
More focus on smaller areas (country, region or individual power plant) for more accurate assessment of the impact of carbon capture on water stress.
Several measures are available that could substantially reduce the impact of CCS on the water stress in the future. Measures such as installing more sea water cooled power plants, consider the use of dry cooling in areas with high water stress and integrate and optimise the different water streams in the power plant (e.g. recycle cooling water for flue gas flue gas treatment or carbon capture) have not been taken into account in this study but could reduce future fresh water use of power plants with and without carbon capture.

Exploring the Potential impact of Implementing Carbon Capture Technologies in Fossil Fuel Power Plants on Regional European Water Stress Index Levels
53
Finally, it is important to continue to assess the potential impact of CCS on the future water availability in Europe and other regions, as this can help to explore, identify and prevent potential areas with high water stress. Besides, additional research is required to further investigate possibilities to optimise water use of power plants with carbon capture by recycling water and to facilitate discussion on how to sustainable, in terms of water stress, include carbon capture in the European power sector.
Acknowledgements
This research has been carried out as part of the FP7 PROSUITE project.
PROSUITE (2009-2013) was a European project on sustainability assessment methodology of prospective technologies. The project was funded by the European Commission under the 7th Framework Programme.

Chapter 2
54
Appendix I: Current WSI levels
Figure 2.7. Current WSI based on water withdrawal and power plant locations (represented by the stars).
55
Comparative Life Cycle Assessment of Biomass 3.Co-firing Plants with Carbon Capture and Storage
Wouter Schakel, Hans Meerman, Alireza Talaei, Andrea Ramírez, André Faaij Published in: Applied Energy 13 (2014), pp. 441-467
Abstract
Combining co-firing biomass and carbon capture and storage (CCS) in power plants offers attractive potential for net removal of carbon dioxide (CO2) from the atmosphere. In this study, the impact of co-firing biomass (wood pellets and straw pellets) on the emission profile of power plants with carbon capture and storage has been assessed for two types of coal-fired power plants: a supercritical pulverised coal power plant (SCPC) and an integrated gasification combined cycle plant (IGCC). Besides, comparative life cycle assessments have been performed to examine the environmental impacts of the combination of co-firing biomass and CCS. Detailed calculations on mass balances of the inputs and outputs of the power plants illustrate the effect of the different content of pollutants in biomass on the capture unit. Life cycle assessment results reveal that 30% co-firing biomass and applying CCS net negative CO2 emissions in the order of 67-85 g/kWh are obtained. The impact in all other environmental categories is increased by 20-200%. However, aggregation into endpoint levels shows that the decrease in CO2 emissions more than offsets the increase in the other categories. Sensitivity analyses illustrate that results are most sensitive to parameters that affect the amount of fuel required, such as the efficiency of the power plant and assumptions regarding the supply chains of coal and biomass. Especially, assumptions regarding land use allocation and carbon debt of biomass significantly influence the environmental performance of BioCCS.
Chapter 3
56
Introduction 3.1.
Carbon Capture and Storage (CCS) is increasingly gaining attention as a strategy for the abatement of greenhouse gas (GHG) emissions. The 2°C scenario in the Energy Technology Perspective Report (IEA, 2012b) predicts that CCS will play a vital role in mitigating the anthropogenic CO2 emissions with a share of 20% of the total global emissions reduction by 2050. It is predicted that given the technical limitations, around 30-60% of the CO2 emissions from electricity generation and 30-40% of those from industry (in total accounting for 20-40% of global fossil fuel CO2 emissions) are expected to be mitigated by CCS in the time period between 2010 and 2050 (Metz, et al., 2005). To reach the 2°C scenario, 63% of coal-fired electricity generation (630 GW) needs to be equipped with CCS by 2050 (IEA, 2012b). The importance of CCS in the future of the energy system and the potential for CCS deployment have been widely highlighted in literature (Dahowski et al., 2011; Edenhofer et al., 2011; Odenberger et al., 2009; van den Broek et al., 2010; Wildenborg et al., 2009; Yu et al., 2011).
Although CCS is often associated with the use of fossil fuels, it can also be combined with the use of biomass, often referred to as BioCCS or BECCS (Azar et al., 2010; Metz et al., 2005). The share of biomass use in the energy system can exceed 27% in 2050 (Edenhofer et al., 2011). In the shorter term, Panoutsou et al., (2009) and Hoefnagels et al., (2011) estimated the potential share of biomass in Europe’s energy system in 2020 to increase to 10.6% and 14.0%, respectively. Considering this expected increasing share of biomass in the future energy system, BioCCS offers an attractive potential for a net removal of carbon dioxide from the atmosphere, as is already highlighted by many studies (Azar et al., 2010; Cough et al., 2012; IEAGHG, 2011; Obersteiner, 2001; Rhodes et al., 2005; ZEP, 2012). Moreover, BioCCS development could help to avoid the risk of reinforced fossil fuel lock-in which is associated with the implementation of CCS in conventional fossil fuel power plants (Vergragt et al., 2011).
The concept of BioCCS is not restricted to production of electricity or heat but can also be integrated to, for instance, biofuel production units such as biogas plants (Wang et al., 2013), hydrogen production plants and industrial processes. Different biomass based conversion options with CCS are presented in Figure 3.1.

Comparative Life Cycle Assessment of Biomass Co-firing Plants with Carbon Capture and Storage
57
Figure 3.1. Biomass use with CO2 capture (BioCCS) integration options (ZEP, 2012).

Chapter 3
58
IEAGHG (2012) identified and evaluated the technical potential of six of the most promising BioCCS options namely; Pulverized Coal power plant with biomass co-firing (PC-CCS co-firing); Circulating fluidized bed combustion power plant, with a 100% biomass share (CFB-CCS dedicated); Integrated gasification combined cycle with co-firing of biomass (IGCC-CCS co-firing); Biomass integrated gasification combined cycle (BIGCC-CCS dedicated); Bio ethanol advanced generation and Biodiesel based on gasification and Fischer Tropsch-synthesis. Results of their analysis suggest that the potential for negative emissions are the largest for the dedicated biomass electricity generation routes with CCS with a net GHGs mitigation potential of -10.4 Gt/yr., followed by PC-CCS co-firing with CCS and IGCC-CCS both with -9.9 Gt/yr. emission reduction potential in 2050. The potential for negative emissions for biofuels production with CCS were the lowest, ranging between -1.1 and -6 Gt/yr. By conducting a techno-economic analysis, Klein et al., (2011) concluded that BIGCC with CCS could serve as the main bioenergy conversion technology in the long-term, representing 33% of the global mitigation by 2100.
Among other BioCCS options, integrating CCS to a co-firing power plant is an attractive option because it is a well-established technology that allows current plants to be modified with fairly low investment cost. The fast growth of biomass co-firing plants, from 152 in 2007 to 241 in 2012 (IEABCC, 2012), is the result of the moderate investment needed for co-firing biomass in traditional coal fired boilers (Al-Mansour et al., 2010) and environmental benefits of the technology such as reduction of CO2, SO2 and, for some biomass types, also NOx (van Loo et al., 2008). The Commission of European Commodities (CEC, 2005) suggested biomass co-firing as one of the most promising options for renewable energy based electricity generation and evaluated the technology as a near-term, low-risk and low cost GHG emission mitigation option.
Life cycle environmental performance of coal and gas power plants with CCS has been assessed extensively in literature. Corsten et al., (2013) provide an overview of LCAs in the literature, indicating that integrating CCS to conventional coal/natural gas power plants decreases the global warming potential (GWP) by 65-75% from the life cycle perspective. Nevertheless, adverse impacts on other environmental themes due to the capture plant are reported, such as increased SOx and NOx emissions due to the efficiency penalty at the power plant when applying CO2 capture (see also Fostås et al., 2011; Koornneef et al., 2008; Marx et al., 2011; Singh, et al., 2011).
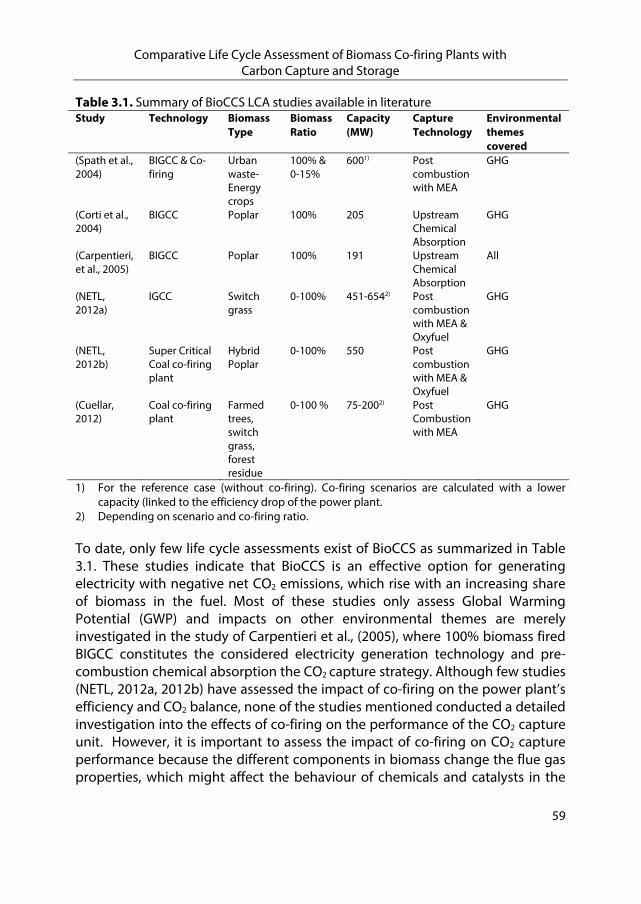
Comparative Life Cycle Assessment of Biomass Co-firing Plants with Carbon Capture and Storage
59
Table 3.1. Summary of BioCCS LCA studies available in literature Study Technology Biomass
Type Biomass Ratio
Capacity (MW)
Capture Technology
Environmental themes covered
(Spath et al., 2004)
BIGCC & Co-firing
Urban waste-Energy crops
100% & 0-15%
6001) Post combustion with MEA
GHG
(Corti et al., 2004)
BIGCC Poplar 100% 205 Upstream Chemical Absorption
GHG
(Carpentieri, et al., 2005)
BIGCC Poplar 100% 191 Upstream Chemical Absorption
All
(NETL, 2012a)
IGCC Switch grass
0-100% 451-6542) Post combustion with MEA & Oxyfuel
GHG
(NETL, 2012b)
Super Critical Coal co-firing plant
Hybrid Poplar
0-100% 550 Post combustion with MEA & Oxyfuel
GHG
(Cuellar, 2012)
Coal co-firing plant
Farmed trees, switch grass, forest residue
0-100 % 75-2002) Post Combustion with MEA
GHG
1) For the reference case (without co-firing). Co-firing scenarios are calculated with a lower capacity (linked to the efficiency drop of the power plant.
2) Depending on scenario and co-firing ratio.
To date, only few life cycle assessments exist of BioCCS as summarized in Table 3.1. These studies indicate that BioCCS is an effective option for generating electricity with negative net CO2 emissions, which rise with an increasing share of biomass in the fuel. Most of these studies only assess Global Warming Potential (GWP) and impacts on other environmental themes are merely investigated in the study of Carpentieri et al., (2005), where 100% biomass fired BIGCC constitutes the considered electricity generation technology and pre-combustion chemical absorption the CO2 capture strategy. Although few studies (NETL, 2012a, 2012b) have assessed the impact of co-firing on the power plant’s efficiency and CO2 balance, none of the studies mentioned conducted a detailed investigation into the effects of co-firing on the performance of the CO2 capture unit. However, it is important to assess the impact of co-firing on CO2 capture performance because the different components in biomass change the flue gas properties, which might affect the behaviour of chemicals and catalysts in the
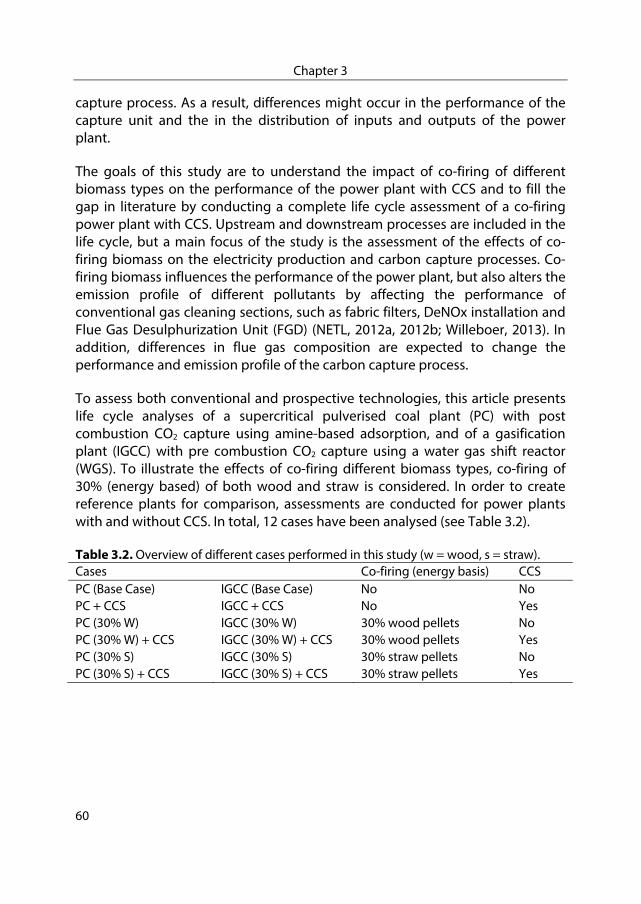
Chapter 3
60
capture process. As a result, differences might occur in the performance of the capture unit and the in the distribution of inputs and outputs of the power plant.
The goals of this study are to understand the impact of co-firing of different biomass types on the performance of the power plant with CCS and to fill the gap in literature by conducting a complete life cycle assessment of a co-firing power plant with CCS. Upstream and downstream processes are included in the life cycle, but a main focus of the study is the assessment of the effects of co-firing biomass on the electricity production and carbon capture processes. Co-firing biomass influences the performance of the power plant, but also alters the emission profile of different pollutants by affecting the performance of conventional gas cleaning sections, such as fabric filters, DeNOx installation and Flue Gas Desulphurization Unit (FGD) (NETL, 2012a, 2012b; Willeboer, 2013). In addition, differences in flue gas composition are expected to change the performance and emission profile of the carbon capture process.
To assess both conventional and prospective technologies, this article presents life cycle analyses of a supercritical pulverised coal plant (PC) with post combustion CO2 capture using amine-based adsorption, and of a gasification plant (IGCC) with pre combustion CO2 capture using a water gas shift reactor (WGS). To illustrate the effects of co-firing different biomass types, co-firing of 30% (energy based) of both wood and straw is considered. In order to create reference plants for comparison, assessments are conducted for power plants with and without CCS. In total, 12 cases have been analysed (see Table 3.2).
Table 3.2. Overview of different cases performed in this study (w = wood, s = straw). Cases Co-firing (energy basis) CCS PC (Base Case) IGCC (Base Case) No No PC + CCS IGCC + CCS No Yes PC (30% W) IGCC (30% W) 30% wood pellets No PC (30% W) + CCS IGCC (30% W) + CCS 30% wood pellets Yes PC (30% S) IGCC (30% S) 30% straw pellets No PC (30% S) + CCS IGCC (30% S) + CCS 30% straw pellets Yes
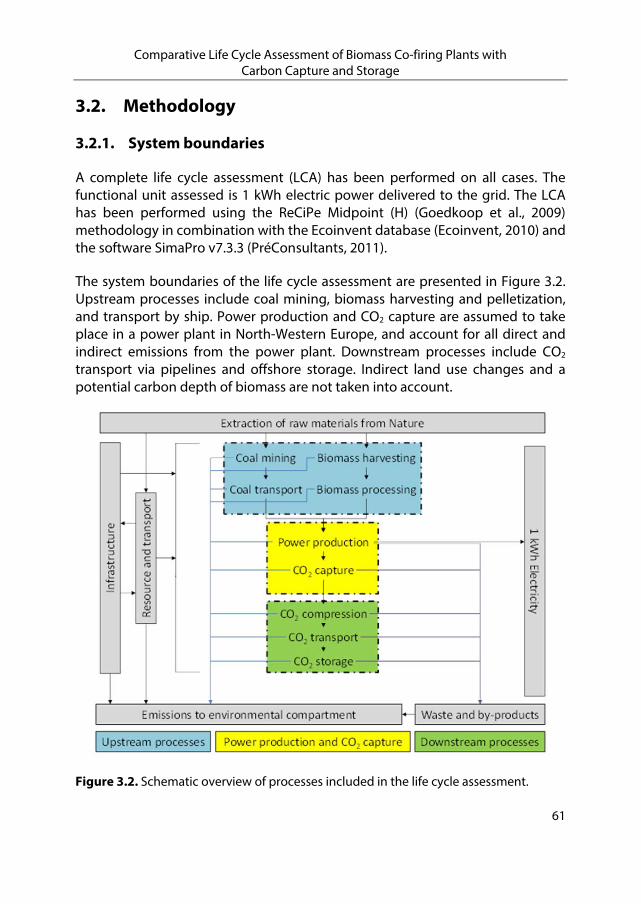
Comparative Life Cycle Assessment of Biomass Co-firing Plants with Carbon Capture and Storage
61
Methodology 3.2.
3.2.1. System boundaries
A complete life cycle assessment (LCA) has been performed on all cases. The functional unit assessed is 1 kWh electric power delivered to the grid. The LCA has been performed using the ReCiPe Midpoint (H) (Goedkoop et al., 2009) methodology in combination with the Ecoinvent database (Ecoinvent, 2010) and the software SimaPro v7.3.3 (PréConsultants, 2011).
The system boundaries of the life cycle assessment are presented in Figure 3.2. Upstream processes include coal mining, biomass harvesting and pelletization, and transport by ship. Power production and CO2 capture are assumed to take place in a power plant in North-Western Europe, and account for all direct and indirect emissions from the power plant. Downstream processes include CO2 transport via pipelines and offshore storage. Indirect land use changes and a potential carbon depth of biomass are not taken into account.
Figure 3.2. Schematic overview of processes included in the life cycle assessment.
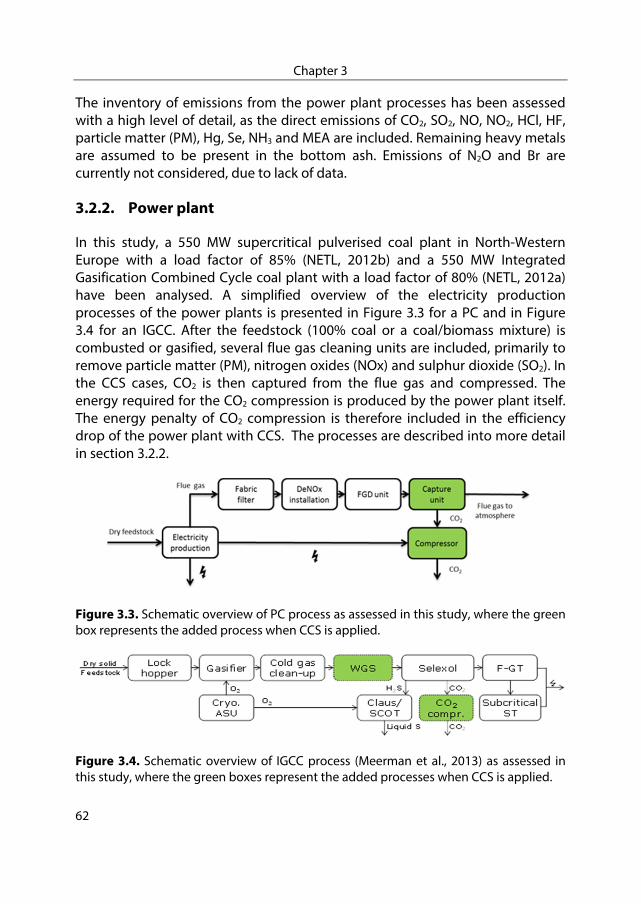
Chapter 3
62
The inventory of emissions from the power plant processes has been assessed with a high level of detail, as the direct emissions of CO2, SO2, NO, NO2, HCl, HF, particle matter (PM), Hg, Se, NH3 and MEA are included. Remaining heavy metals are assumed to be present in the bottom ash. Emissions of N2O and Br are currently not considered, due to lack of data.
3.2.2. Power plant
In this study, a 550 MW supercritical pulverised coal plant in North-Western Europe with a load factor of 85% (NETL, 2012b) and a 550 MW Integrated Gasification Combined Cycle coal plant with a load factor of 80% (NETL, 2012a) have been analysed. A simplified overview of the electricity production processes of the power plants is presented in Figure 3.3 for a PC and in Figure 3.4 for an IGCC. After the feedstock (100% coal or a coal/biomass mixture) is combusted or gasified, several flue gas cleaning units are included, primarily to remove particle matter (PM), nitrogen oxides (NOx) and sulphur dioxide (SO2). In the CCS cases, CO2 is then captured from the flue gas and compressed. The energy required for the CO2 compression is produced by the power plant itself. The energy penalty of CO2 compression is therefore included in the efficiency drop of the power plant with CCS. The processes are described into more detail in section 3.2.2.
Figure 3.3. Schematic overview of PC process as assessed in this study, where the green box represents the added process when CCS is applied.
Figure 3.4. Schematic overview of IGCC process (Meerman et al., 2013) as assessed in this study, where the green boxes represent the added processes when CCS is applied.

Comparative Life Cycle Assessment of Biomass Co-firing Plants with Carbon Capture and Storage
63
Life cycle inventory 3.3.
3.3.1. Upstream
Electricity production by combustion/gasification of coal and co-firing (wood pellets and straw pellets) is considered. The properties of coal that has been assessed are assumed to match the properties of Illinois#6 coal, assuring a conservative estimation regarding the sulphur content of the coal, which is relatively high (3.2%) for Illinois#6 (see Table 3.3). As the power plants are assumed to be located in North-Western Europe, the coal production chain is assumed to be represented by the average Dutch coal import statistics (Smekens et al., 2013). A share of 84 % of this coal mix is produced from open cast mining and 16 % is produced from underground mining (Ecoinvent, 2010). All local coal production and transportation data are included (Ecoinvent, 2010). Transoceanic transport is assumed to occur using transoceanic freight ships (Ecoinvent, 2010). On average, transoceanic transport of 11.6 tkm per kg coal is required. All details regarding the coal production data are presented in Appendix I and the end of this chapter.
Wood (forest residues) and straw (agricultural residues) pellets are assumed to be produced from residues from North-Eastern America (see Appendix I), and the fuel properties are derived from ECN (2013). Key characteristics of the coal and biomass types used are presented in Table 3.3, along with typical ranges for comparable fuel types. A pelletization step is included (Ecoinvent, 2010), assuming 164 kWh electricity4 requirement per m3 pellets produced (complete overview of assumptions regarding pelletization is presented in Appendix I). For the production of straw pellets, the same pelletization step is assumed, although it is adjusted for the different calorific value and density of straw. Equal transoceanic transport compared to coal is considered (11.6 tkm/kg pellets).
4 As pellets from North-Eastern America are considered, the electricity mix of the USA has been extracted from the Ecoinvent database (2010).
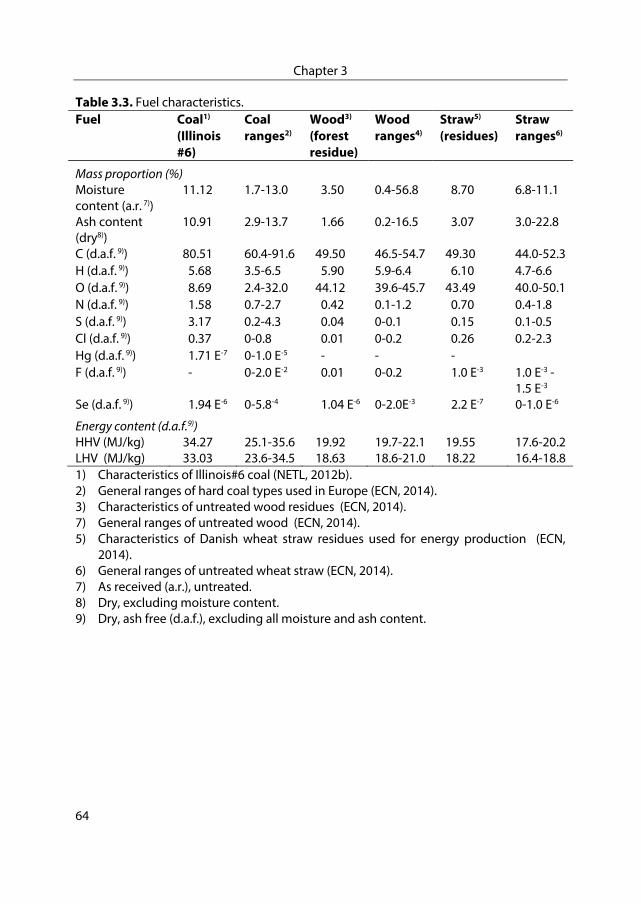
Chapter 3
64
Table 3.3. Fuel characteristics. Fuel Coal1)
(Illinois #6)
Coal ranges2)
Wood3)
(forest residue)
Wood ranges4)
Straw5)
(residues) Straw ranges6)
Mass proportion (%) Moisture content (a.r. 7))
11.12 1.7-13.0 3.50 0.4-56.8 8.70 6.8-11.1
Ash content (dry8))
10.91 2.9-13.7 1.66 0.2-16.5 3.07 3.0-22.8
C (d.a.f. 9)) 80.51 60.4-91.6 49.50 46.5-54.7 49.30 44.0-52.3 H (d.a.f. 9)) 5.68 3.5-6.5 5.90 5.9-6.4 6.10 4.7-6.6 O (d.a.f. 9)) 8.69 2.4-32.0 44.12 39.6-45.7 43.49 40.0-50.1 N (d.a.f. 9)) 1.58 0.7-2.7 0.42 0.1-1.2 0.70 0.4-1.8 S (d.a.f. 9)) 3.17 0.2-4.3 0.04 0-0.1 0.15 0.1-0.5 Cl (d.a.f. 9)) 0.37 0-0.8 0.01 0-0.2 0.26 0.2-2.3 Hg (d.a.f. 9)) 1.71 E-7 0-1.0 E-5 - - - F (d.a.f. 9)) - 0-2.0 E-2 0.01 0-0.2 1.0 E-3 1.0 E-3 -
1.5 E-3
Se (d.a.f. 9)) 1.94 E-6 0-5.8-4 1.04 E-6 0-2.0E-3 2.2 E-7 0-1.0 E-6
Energy content (d.a.f.9)) HHV (MJ/kg) 34.27 25.1-35.6 19.92 19.7-22.1 19.55 17.6-20.2 LHV (MJ/kg) 33.03 23.6-34.5 18.63 18.6-21.0 18.22 16.4-18.8 1) Characteristics of Illinois#6 coal (NETL, 2012b). 2) General ranges of hard coal types used in Europe (ECN, 2014). 3) Characteristics of untreated wood residues (ECN, 2014). 7) General ranges of untreated wood (ECN, 2014). 5) Characteristics of Danish wheat straw residues used for energy production (ECN,
2014). 6) General ranges of untreated wheat straw (ECN, 2014). 7) As received (a.r.), untreated. 8) Dry, excluding moisture content. 9) Dry, ash free (d.a.f.), excluding all moisture and ash content.
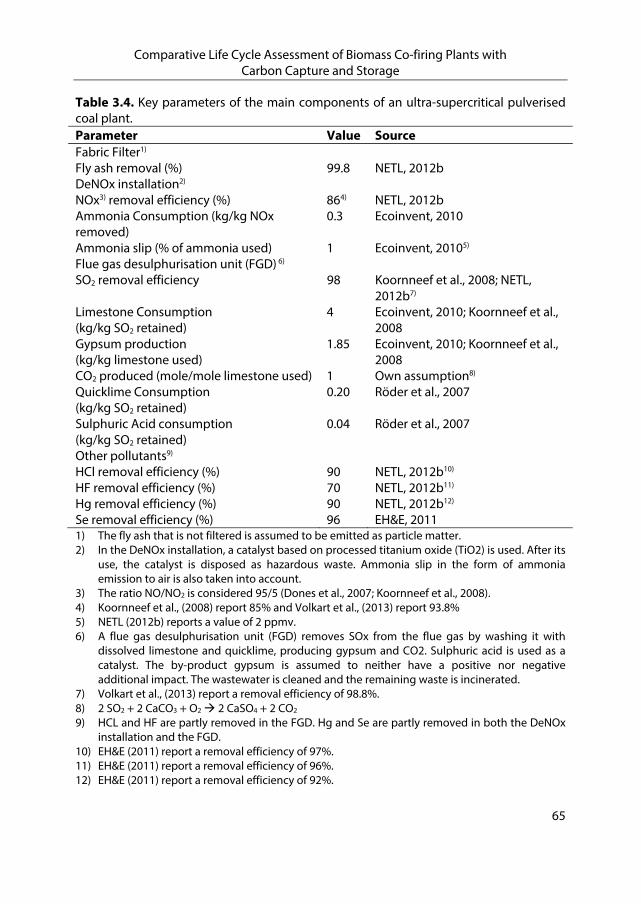
Comparative Life Cycle Assessment of Biomass Co-firing Plants with Carbon Capture and Storage
65
Table 3.4. Key parameters of the main components of an ultra-supercritical pulverised coal plant. Parameter Value SourceFabric Filter1) Fly ash removal (%) 99.8 NETL, 2012bDeNOx installation2)
NOx3) removal efficiency (%) 864) NETL, 2012bAmmonia Consumption (kg/kg NOx removed)
0.3 Ecoinvent, 2010
Ammonia slip (% of ammonia used) 1 Ecoinvent, 20105)
Flue gas desulphurisation unit (FGD) 6)
SO2 removal efficiency 98 Koornneef et al., 2008; NETL, 2012b7)
Limestone Consumption (kg/kg SO2 retained)
4 Ecoinvent, 2010; Koornneef et al., 2008
Gypsum production(kg/kg limestone used)
1.85 Ecoinvent, 2010; Koornneef et al., 2008
CO2 produced (mole/mole limestone used) 1 Own assumption8)
Quicklime Consumption (kg/kg SO2 retained)
0.20 Röder et al., 2007
Sulphuric Acid consumption (kg/kg SO2 retained)
0.04 Röder et al., 2007
Other pollutants9)
HCl removal efficiency (%) 90 NETL, 2012b10)
HF removal efficiency (%) 70 NETL, 2012b11)
Hg removal efficiency (%) 90 NETL, 2012b12)
Se removal efficiency (%) 96 EH&E, 20111) The fly ash that is not filtered is assumed to be emitted as particle matter. 2) In the DeNOx installation, a catalyst based on processed titanium oxide (TiO2) is used. After its
use, the catalyst is disposed as hazardous waste. Ammonia slip in the form of ammonia emission to air is also taken into account.
3) The ratio NO/NO2 is considered 95/5 (Dones et al., 2007; Koornneef et al., 2008). 4) Koornneef et al., (2008) report 85% and Volkart et al., (2013) report 93.8% 5) NETL (2012b) reports a value of 2 ppmv. 6) A flue gas desulphurisation unit (FGD) removes SOx from the flue gas by washing it with
dissolved limestone and quicklime, producing gypsum and CO2. Sulphuric acid is used as a catalyst. The by-product gypsum is assumed to neither have a positive nor negative additional impact. The wastewater is cleaned and the remaining waste is incinerated.
7) Volkart et al., (2013) report a removal efficiency of 98.8%. 8) 2 SO2 + 2 CaCO3 + O2 2 CaSO4 + 2 CO2 9) HCL and HF are partly removed in the FGD. Hg and Se are partly removed in both the DeNOx
installation and the FGD. 10) EH&E (2011) report a removal efficiency of 97%. 11) EH&E (2011) report a removal efficiency of 96%. 12) EH&E (2011) report a removal efficiency of 92%.
Chapter 3
66
3.3.2. Pulverised coal plant
The life cycle inventory (LCI) of the pulverised power plant comprises the required infrastructure and the amount and type inputs (e.g. fuel and chemicals) and outputs (e.g. waste and emissions). Power plant infrastructure (construction and dismantling) data is obtained from Bauer (2008), as this was power plant infrastructure data with the highest level of detail available in literature. Table 3.4 presents the key parameters for the main components of the power plant, namely the fabric filter, DeNOx installation and the flue gas desulphurization unit (FGD). These parameters are used for composing the LCI of the inputs and outputs of the power plant.
3.3.2.1. Co-firing
When considering co-firing biomass, the efficiency of the power plant is expected to decrease due to the lower calorific value of biomass compared to coal (NETL, 2012b; van Loo et al., 2015; Willeboer, 2013). Consequently, the water consumption rises, due to an increased cooling demand (NETL, 2012b; Willeboer, 2013). In this study, the efficiencies of the co-firing scenarios for a pulverised coal plant are based on data for different co-firing ratios from NETL (2012b). These data have been modified after contacting NETL (T. Skone, 2013; Turner, 2013) and interpolated to calculate the efficiency corresponding 30% co-firing on energy basis (Figure 3.5). Both wood and straw pellets are assumed to be pelletized, resulting in a similar moisture content. No distinction has been made between the effect co-firing wood and straw on the efficiency and on the water consumption5.
5 Power plants are considered to be equipped with wet cooling towers (NETL, 2012a,
2012b).
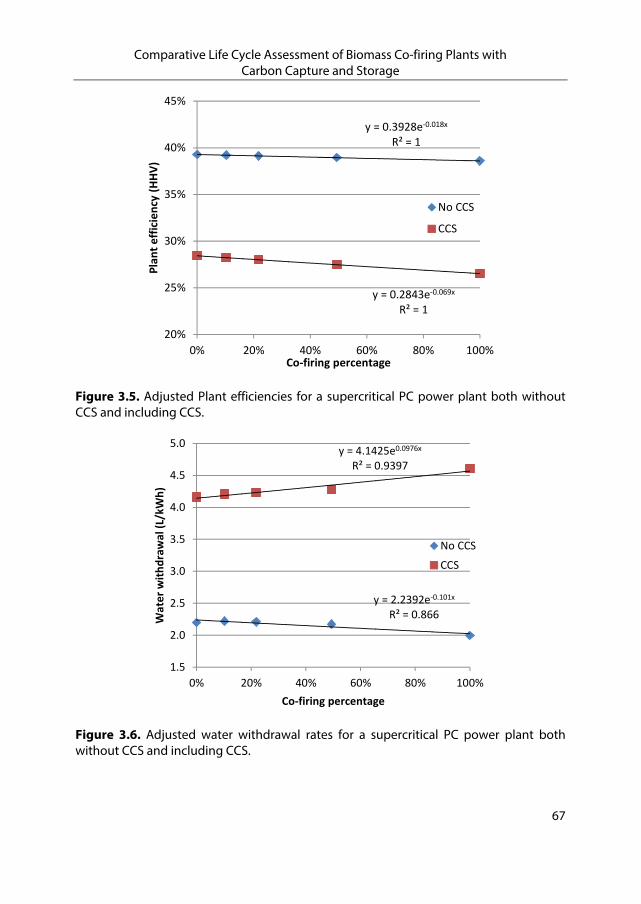
Comparative Life Cycle Assessment of Biomass Co-firing Plants with Carbon Capture and Storage
67
Figure 3.5. Adjusted Plant efficiencies for a supercritical PC power plant both without CCS and including CCS.
Figure 3.6. Adjusted water withdrawal rates for a supercritical PC power plant both without CCS and including CCS.
y = 0.3928e‐0.018x
R² = 1
y = 0.2843e‐0.069x
R² = 1
20%
25%
30%
35%
40%
45%
0% 20% 40% 60% 80% 100%
Plant efficiency (HHV)
Co‐firing percentage
No CCS
CCS
y = 2.2392e‐0.101x
R² = 0.866
y = 4.1425e0.0976x
R² = 0.9397
1.5
2.0
2.5
3.0
3.5
4.0
4.5
5.0
0% 20% 40% 60% 80% 100%
Water withdrawal (L/kW
h)
Co‐firing percentage
No CCS
CCS
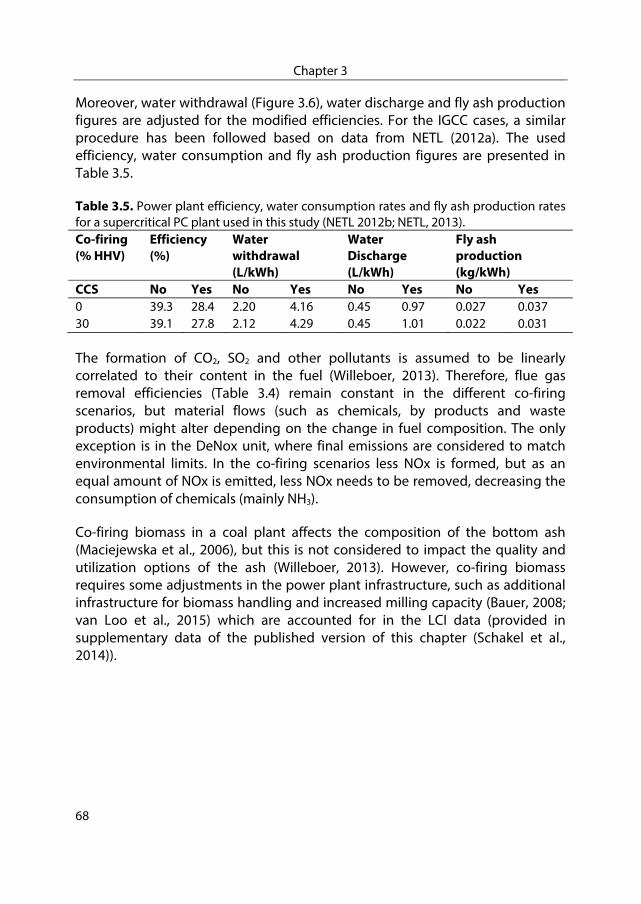
Chapter 3
68
Moreover, water withdrawal (Figure 3.6), water discharge and fly ash production figures are adjusted for the modified efficiencies. For the IGCC cases, a similar procedure has been followed based on data from NETL (2012a). The used efficiency, water consumption and fly ash production figures are presented in Table 3.5.
Table 3.5. Power plant efficiency, water consumption rates and fly ash production rates for a supercritical PC plant used in this study (NETL 2012b; NETL, 2013). Co-firing (% HHV)
Efficiency (%)
Water withdrawal (L/kWh)
Water Discharge (L/kWh)
Fly ash production (kg/kWh)
CCS No Yes No Yes No Yes No Yes 0 39.3 28.4 2.20 4.16 0.45 0.97 0.027 0.037 30 39.1 27.8 2.12 4.29 0.45 1.01 0.022 0.031
The formation of CO2, SO2 and other pollutants is assumed to be linearly correlated to their content in the fuel (Willeboer, 2013). Therefore, flue gas removal efficiencies (Table 3.4) remain constant in the different co-firing scenarios, but material flows (such as chemicals, by products and waste products) might alter depending on the change in fuel composition. The only exception is in the DeNox unit, where final emissions are considered to match environmental limits. In the co-firing scenarios less NOx is formed, but as an equal amount of NOx is emitted, less NOx needs to be removed, decreasing the consumption of chemicals (mainly NH3).
Co-firing biomass in a coal plant affects the composition of the bottom ash (Maciejewska et al., 2006), but this is not considered to impact the quality and utilization options of the ash (Willeboer, 2013). However, co-firing biomass requires some adjustments in the power plant infrastructure, such as additional infrastructure for biomass handling and increased milling capacity (Bauer, 2008; van Loo et al., 2015) which are accounted for in the LCI data (provided in supplementary data of the published version of this chapter (Schakel et al., 2014)).
Comparative Life Cycle Assessment of Biomass Co-firing Plants with Carbon Capture and Storage
69
3.3.2.2. CO2 capture
CO2 is assumed to be captured by an absorption process using the solvent Monoethanolamine (MEA) as is described in IEAGHG (2006). MEA is well suited for post-combustion CO2 capture, as it is a relatively cheap reagent showing a high heat of adsorption, a high capacity and fast reaction kinetics (Rochedo et al., 2013). The solvent MEA also reacts with substances other than CO2, inhibiting part of the MEA from capturing CO2. This process is referred to as MEA degradation and can occur following multiple pathways: MEA oxidation, reaction with acid gases (SO2, NO2, HCl and HF) and polymerisation.
Oxidative degradation is the reaction of MEA with oxygen (O2), forming products such as formate6 and acetate7, while releasing ammonia. The degradation rate of MEA oxidation is assumed to be 0.46 kg/t CO2 (IEAGHG, 2012)8. Calculations using equation 3.1 (Rao et al., 2004) reveal that 0.13 kg ammonia per tonne CO2 captured is produced.
. ∙
(eq. 3.1)
Where:
Ammonia emission to air (kg/t CO2 captured) . MEA loss due to oxidation (kg/t CO2 captured)
Molar mass ammonium (g/mole) Molar mass MEA (g/mole)
MEA losses due to the reaction with acid gases are calculated using equation 3.2 (IEAGHG, 2012a; Rao et al., 2004). The amount of MEA that is lost to polymerisation is considered to be 1.5 times the MEA losses to acid gases (IEAGHG, 2012a).
6 MEA + O2 2 HCOOH + NH3 (IEAGHG, 2012). 7 MEA + O2 CH3COOH + NH3 (IEAGHG, 2012). 8 This degradation rate depends on the portion of oxygen in the flue gas. However, due
to limitations of this study, variations in the oxygen load have not been taken into account. Other studies (Koorneef et al., 2008; Rao et al., 2004) report a degradation rate of 0.75 kg/t CO2.
Chapter 3
70
∙ ∙ ∙
(eq. 3.2)
Where:
MEA lost (Moles/kg coal input) Emission factor of acid gas (g/kg coal input)
Total removal efficiency of acid gas in upstream technologies (%)
Removal efficiency in MEA capture process Moles of MEA lost per mole of acid gas captured
(SO2 = 2, NO2 = 2, HCl = 2, HF = 1) Molar mass of acid gas (g/mole)
The MEA that is oxidised (formate and acetate) and the MEA lost to acid gases form heat stable salts (HSS). The amount of HSS formed by oxidised MEA9 is calculated by equation 3.3. The quantity of HSS formed by the reaction with acid gases is calculated by adding the amount of MEA lost to that of acid gases removed.
. ∙ (eq. 3.3)
Where:
. Heat stable salts formation due to MEA oxidation (kg/tonne CO2)
Specific oxidation degradation rate (kg/tonne CO2)
Molar mass formate (g/mole) Molar mass acetate (g/mole)
Molar mass oxygen (g/mole)
9 HCOOH + MEA [MEAH+][HCOO-] and CH3COOH + MEA [MEAH+] [CH3COOH-]
(IEAGHG, 2012).

Comparative Life Cycle Assessment of Biomass Co-firing Plants with Carbon Capture and Storage
71
Besides MEA losses due to MEA degradation, a MEA slip of 0.014 kg/t CO2 (Rao et al., 2004; Koornneef et al., 2008) in the form of emissions into the air has been taken into account. Nevertheless, part of the MEA losses are reclaimed: for every tonne CO2 captured, 0.20 kg of MEA can be reclaimed using 0.13 kg NaOH and 0.075 kg activated carbon10 (Rao et al., 2004; Koornneef et al., 2008).
In Table 3.6, the total MEA balance for all cases is presented. The specific oxidation rate (0.46 kg/t CO2) is assumed to remain unchanged when co-firing biomass, because the effect of a different flue gas composition (oxygen amount and concentration) has been considered negligible11. Less MEA is lost to acid gases when co-firing is applied, due to the lower content of acids in biomass (mainly sulphur). As a direct result, also less HSS are formed.
Table 3.6. Chemical consumption of CO2 capture process. Flow (kg/t CO2) 30%
Wood 100% Coal
30% Straw
Source(s)
MEA consumptionOxidation 0.46 0.46 0.46 IEAGHG, 2012 (Koornneef et al., 2008:
0,75) Acid gases 0.52 0.69 0.62 Calculated (equation 3.2) Polymerisation 0.69 0.69 0.69 IEAGHG, 2012Emission 0.0140 0.014 .014 Rao et al., 2004; Koornneef et al.,
2008 Reclaimed 0.20 0.20 0.20 Rao et al., 2004; Koornneef et al.,
2008 Total 1.49 1.65 1.63NaOH consumption
0.13 0.13 0.13 Rao et al., 2004; Koornneef et al., 2008
Activated Carbon consumption
0.075 0.075 0.075 Rao et al., 2004; Koornneef et al., 2008
Ammonia production
0.13 0.13 0.13 Calculated (equation 3.1)
HSS formation 1.78 2.02 1.97 Calculated (equation 3.3)
10 In the LCI, charcoal is used as a proxy for activated carbon (Koornneef et al., 2008). 11 When co-firing biomass, less O2 is needed during the combustion process, implying
that the O2 concentration in the flue gas increases. However, less oxidised gases (e.g. CO2, SO2, NOx) are consequently formed during the process. This has been assumed to compensate the lower O2 quantity in the flue gas and the overall change in O2 concentration when co-firing biomass has therefore been considered negligible.

Chapter 3
72
3.3.2.3. Life Cycle Inventory overview
This section provides an overview of all the life cycle inventory data of the SCPC. Table 3.7 presents the power plant parameters (capacity and efficiency), flue gas removal efficiencies and chemical consumption rates of flue gas cleaning processes for the 100% coal-fired case (both without and with CCS). Flue gas removal efficiencies include the removal (co-capturing) of flue gas components in the capture unit. Co-firing scenarios have been omitted from Table 3.7 because co-firing does not affect flue gas removal efficiencies, except the one of NOx removal12.
Table 3.8 provides a complete overview of power plant parameters, inputs (fuel, water and chemicals) and outputs (by-products, wastes and emissions) for all the PC cases. As a result of the efficiency decrease of co-firing and applying CCS, the consumption of fuel and chemicals and the production of waste and by-products increase. The consumption of water increases, partly due to the decrease in efficiency and partly due to the additional water demand of the carbon capture process. The consumption of TiO2, MEA, NaOH and activated carbon and the production of reclaimer waste only occur in the CCS cases as these consumptions and the waste are a direct consequence of adding the CO2 capture process. The use of additional fuel causes a rise in the emission of NOx, Hg and Se. The SO2, HCl, HF and PM emissions however decrease due to the high co-capture rate of the CO2 capture process. The total NH3 emissions substantially rise because of the additional NH3 formed during the CO2 capture process.
12 NOx (NO and NO2) emissions for the co-firing cases are assumed to be equal to the
base cases (sole coal combustion), because there is no need for extra reduction. This implies that the efficiency of the DeNOx installation in the co-firing cases is lower (as less NOx needs to be removed from the flue gas).

Comparative Life Cycle Assessment of Biomass Co-firing Plants with Carbon Capture and Storage
73
Table 3.7. General parameters for 100% coal-fired PC with and without CO2 capture technology. Parameter No-CCS CCS Source(s)Plant Capacity (MWe) 550 550 NETL, 2012bCapacity Factor (%) 85 85 NETL, 2012bEfficiency HHV (%) 1) 39.3 28.4 NETL, 2012bFlue gas SO2 removal (%)2) 98 99.95 NETL, 2012b; Koornneef et al., 2008; NOx removal (%) 3) 86 87.8 4) NETL, 2012b; Koornneef et al., 2008; PM removal (%) 99.8 5) 99.9 6) NETL, 2012b; Koornneef et al., 2008; HCl removal (%) 90 99.5 7) NETL, 2012b; Koornneef et al., 2008; HF removal (%) 70 97 8) NETL, 2012b; Koornneef et al., 2008 Hg removal (%) 90 91.5 9) NETL, 2012b; Cui et al., 2010 Se removal (%) 96 96 EH&E, 2011CO2 removal (%) 0 90DeNOx unit Ammonia consumption 0.3 0.3 Koornneef et al., 2008; Ecoinvent, 2010 Ammonia emissions 0.003 0.003 Ecoinvent, 2010TiO2 consumption 0.025 0.025 Ecoinvent, 2010Flue gas desulphurization unit (FGD)Limestone consumption 4 4 Koornneef et al., 2008; Ecoinvent, 2010 Quicklime consumption 0.20 0.20 Röder et al., 2007Sulphuric acid 0.08 0.08 Röder et al., 2007Gypsum production 1.85 1.85 Koornneef et al., 2008; Ecoinvent, 2010 1) Efficiency of the power plant solely combusting coal. In the co-firing case, the efficiency will drop with
approximately a half %-point (NETL, 2012a, 2012b; Skone, 2013; Turner, 2013; Willeboer, 2013). 2) Efficiency of the flue gas desulphurization (FGD) unit (NETL, 2012b). When applying CCS, an extra
desulphurization unit is implemented to further decrease the SO2 content of the flue gas. This unit removes 75% of the SO2 that has passed the FGD. On top of that, 90% co-capture of SO2 during the CO2 capture phase is assumed (Koornneef et al., 2008).
3) NOx (NO and NO2) emissions for the co-firing cases are assumed to be equal to the base cases (sole coal combustion), because there is no need for extra reduction. This implies that the efficiency of the DeNOx installation in the co-firing cases is lower (as less NOx needs to be removed from the flue gas).
4) Of the NOx that is formed, 95% is assumed to be NO and 5% is assumed to be NO2 (Dones et al., 2007; EPA, 2010; Koornneef et al., 2008; Robbins et al., 2000). 25% of NO2 is assumed to be removed during the CO2 capture process (Koornneef et al., 2008).
5) The following size distribution of the particle matter is assumed: 5% > 10 μm, 10% 2.5-10 μm and 85% < 2.5 μm (Ecoinvent, 2010).
6) 50% of the particulate matter is assumed to be removed during the CO2 capture process (Koornneef et al., 2008). The PM size of the PM remained is assumed to be < 10μm (Koornneef et al., 2008).
7) 95% of HCl is assumed to be removed during the CO2 capture process (Koornneef et al., 2008; Rao et al., 2004).
8) 90% of HF is assumed to be removed during the CO2 capture process (Koornneef et al., 2008). 9) Mercury in the flue gas can occur in both elementary form (Hg0) and oxidised form (Hg2+). Only a minor
part of Hg0 can be removed in the carbon capture process, contrary to a large part of Hg2+ that can be removed (Cui et al., 2010). The removal efficiency of the capture unit therefore depends on the composition of mercury in the flue gas. Total removal is estimated to be 25%, which is a conservative estimate within the range of 23-31% (Corsten et al., 2013).
10) TiO2 is a catalyst for removing NOx. The TiO2 spent is assumed to be landfilled. (Ecoinvent, 2010).

Chapter 3
74
Table 3.8. Mass balance pulverised coal plant. Unit Wood pellets +
Coal Coal Straw pellets +
Coal Co-firing ratio %energy 30% 0% 30%
CCS - No Yes No Yes No Yes
General Efficiency 1) % 39.1% 27.8% 39.3% 28.4% 39.1% 27.8% Coal 2) kg
a.r./kWh 0.238 0.334 0.338 0.467 0.238 0.334
Wood 2) kg a.r./kWh
0.146 0.205 - - - -
Straw 2) kg a.r./kWh
- - - - 0.160 0.224
CO2 balance Total CO2 formation g/kWh 828 1162 818 1131 832 1168 CO2 from biomass3) g/kWh 252 353 0 0 255 358 CO2 captured4) g/kWh - 1046 - 1018 - 1051 CO2 emissions g/kWh 828 116 818 113 832 117 Net CO2 emissions5) g/kWh 576 -237 818 113 577 -242 Water balance6) Raw water withdrawal L/kWh 2.12 4.29 2.20 4.16 2.12 4.29 Process water discharge
L/kWh 0.45 1.01 0.45 0.97 0.45 1.01
Raw water consumption
L/kWh 1.67 3.28 1.75 3.19 1.67 3.28
Chemical consumption Limestone g/kWh 47.16 67.20 66.41 93.15 48.39 68.94 Quicklime g/kWh 2.36 3.36 3.32 4.66 2.42 3.45 Sulphuric acid g/kWh 0.94 1.34 1.33 1.86 0.97 1.38 Ammonia 7) g/kWh 0.51 0.72 0.51 0.70 0.51 0.72 TiO2 8) g/kWh 0.17 0.24 0.04 0.06 0.17 0.24 MEA 9) g/kWh - 1.50 - 1.64 - 1.66 NaOH g/kWh - 0.14 - 0.13 - 0.14 Activated carbon 10) g/kWh - 0.08 - 0.08 - 0.08 By-products Fly ash 11) g/kWh 21.87 30.55 26.57 37.35 21.87 30.55 Bottom ash 11) g/kWh 3.52 5.08 6.19 7.91 5.66 8.08 Gypsum g/kWh 87.25 124.31 122.95 172.33 89.52 127.55 Waste (FGD) 12) g/kWh 0.66 0.93 0.91 1.25 0.98 1.37 Catalytic disposal (TiO2) 13)
g/kWh 0.17 0.24 0.04 0.06 0.17 0.24
Reclaimer waste 14) g/kWh - 1.88 - 2.07 - 2.08
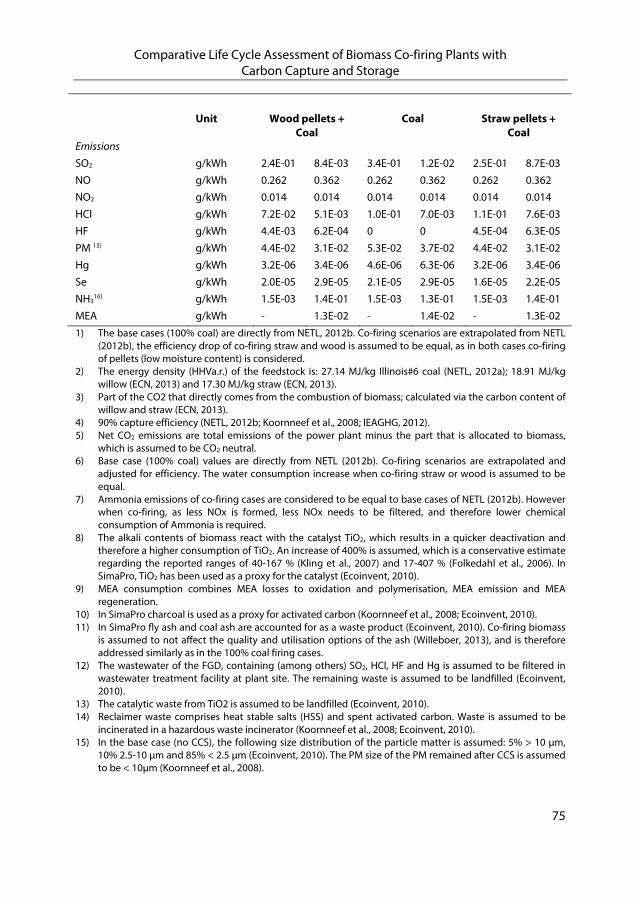
Comparative Life Cycle Assessment of Biomass Co-firing Plants with Carbon Capture and Storage
75
Unit Wood pellets +
Coal Coal Straw pellets +
Coal Emissions SO2 g/kWh 2.4E-01 8.4E-03 3.4E-01 1.2E-02 2.5E-01 8.7E-03 NO g/kWh 0.262 0.362 0.262 0.362 0.262 0.362 NO2 g/kWh 0.014 0.014 0.014 0.014 0.014 0.014 HCl g/kWh 7.2E-02 5.1E-03 1.0E-01 7.0E-03 1.1E-01 7.6E-03 HF g/kWh 4.4E-03 6.2E-04 0 0 4.5E-04 6.3E-05 PM 15) g/kWh 4.4E-02 3.1E-02 5.3E-02 3.7E-02 4.4E-02 3.1E-02 Hg g/kWh 3.2E-06 3.4E-06 4.6E-06 6.3E-06 3.2E-06 3.4E-06 Se g/kWh 2.0E-05 2.9E-05 2.1E-05 2.9E-05 1.6E-05 2.2E-05 NH3
16) g/kWh 1.5E-03 1.4E-01 1.5E-03 1.3E-01 1.5E-03 1.4E-01 MEA g/kWh - 1.3E-02 - 1.4E-02 - 1.3E-02 1) The base cases (100% coal) are directly from NETL, 2012b. Co-firing scenarios are extrapolated from NETL
(2012b), the efficiency drop of co-firing straw and wood is assumed to be equal, as in both cases co-firing of pellets (low moisture content) is considered.
2) The energy density (HHVa.r.) of the feedstock is: 27.14 MJ/kg Illinois#6 coal (NETL, 2012a); 18.91 MJ/kg willow (ECN, 2013) and 17.30 MJ/kg straw (ECN, 2013).
3) Part of the CO2 that directly comes from the combustion of biomass; calculated via the carbon content of willow and straw (ECN, 2013).
4) 90% capture efficiency (NETL, 2012b; Koornneef et al., 2008; IEAGHG, 2012). 5) Net CO2 emissions are total emissions of the power plant minus the part that is allocated to biomass,
which is assumed to be CO2 neutral. 6) Base case (100% coal) values are directly from NETL (2012b). Co-firing scenarios are extrapolated and
adjusted for efficiency. The water consumption increase when co-firing straw or wood is assumed to be equal.
7) Ammonia emissions of co-firing cases are considered to be equal to base cases of NETL (2012b). However when co-firing, as less NOx is formed, less NOx needs to be filtered, and therefore lower chemical consumption of Ammonia is required.
8) The alkali contents of biomass react with the catalyst TiO2, which results in a quicker deactivation and therefore a higher consumption of TiO2. An increase of 400% is assumed, which is a conservative estimate regarding the reported ranges of 40-167 % (Kling et al., 2007) and 17-407 % (Folkedahl et al., 2006). In SimaPro, TiO2 has been used as a proxy for the catalyst (Ecoinvent, 2010).
9) MEA consumption combines MEA losses to oxidation and polymerisation, MEA emission and MEA regeneration.
10) In SimaPro charcoal is used as a proxy for activated carbon (Koornneef et al., 2008; Ecoinvent, 2010). 11) In SimaPro fly ash and coal ash are accounted for as a waste product (Ecoinvent, 2010). Co-firing biomass
is assumed to not affect the quality and utilisation options of the ash (Willeboer, 2013), and is therefore addressed similarly as in the 100% coal firing cases.
12) The wastewater of the FGD, containing (among others) SO2, HCl, HF and Hg is assumed to be filtered in wastewater treatment facility at plant site. The remaining waste is assumed to be landfilled (Ecoinvent, 2010).
13) The catalytic waste from TiO2 is assumed to be landfilled (Ecoinvent, 2010). 14) Reclaimer waste comprises heat stable salts (HSS) and spent activated carbon. Waste is assumed to be
incinerated in a hazardous waste incinerator (Koornneef et al., 2008; Ecoinvent, 2010). 15) In the base case (no CCS), the following size distribution of the particle matter is assumed: 5% > 10 μm,
10% 2.5-10 μm and 85% < 2.5 μm (Ecoinvent, 2010). The PM size of the PM remained after CCS is assumed to be < 10μm (Koornneef et al., 2008).

Chapter 3
76
16) Presented NH3 emissions are a combination of emissions from the DeNOx process and the carbon capture process.
In the co-firing biomass cases, more CO2 per kWh is produced and subsequently captured, as a result of the lower heating value of the biomass compared to coal. The impact of co-firing on the water consumption is minimal. The consumption of chemicals and amount of residues for the FGD and DeNOx unit decrease, due to the lower sulphur and nitrogen content of the biomass. The consumption of the catalyst TiO2 however increases, because the alkali contents of the biomass tend to react with this catalyst (Folkedahl et al., 2006; Kling et al., 2007). The MEA consumption decreases when co-firing wood, mainly due to the low chlorine content of wood. As the chlorine content of straw is comparable to the chlorine content of coal, a slight increase in the MEA consumption is noticeable when co-firing straw pellets. All emissions decrease when co-firing biomass, except HCL (when co-firing straw pellets), NOx (fixed at environmental limit) and HF (as coal does not contain F).
3.3.3. Integrated Gasification Combined Cycle plant
The LCI of the IGCC is a combination of the required infrastructure and the amount and type inputs (e.g. fuel and chemicals) and outputs (e.g. waste and emissions). As data for IGCC infrastructure with the same level of detail as for PC were unavailable, LCI data on construction and dismantling of the IGCC is assumed to be equal to the LCI data of the PC power plant (Bauer, 2008). The input and outputs are depending on the performance of the different components of an IGCC13. The selected IGCC in this study comprises a gasifier, PM filters, wet scrubber, a hydrolysis reactor or a water gas shift reactor (when CCS is applied), acid gas removal and offgas treatment.
In this gasifier, coal or biomass is heated above 1500°C in an oxygen-deprived atmosphere. This converts the feedstock into syngas, a mixture containing mainly CO, CO2, H2 and H2O. Most of the heavy metals in the feedstock melt and are collected in the form of slag at the bottom of the gasifier. To prevent contaminating the syngas with N2 and to improve overall energetic efficiency, oxygen instead of air is used as oxidant in the gasifier.
13 For a more detailed description of the technical performance of the IGCC, see NETL
(2012a), Meerman (2013) and Meerman (2011).

Comparative Life Cycle Assessment of Biomass Co-firing Plants with Carbon Capture and Storage
77
PM is removed from the syngas using filters. The combined PM removal efficiency of filters and scrubbers exceeds 99.8% (Schoenmakers, 2013). However, because no data was found on the amount of PM formed in the process, the PM emissions have been set equal to the emissions reported in NETL (2012a). Halogen compounds (CL and F) are removed using a wet scrubber and are also partly removed in the acid gas removal (AGR). Combined, the wet scrubber and AGR remove 90% of the halogen compounds (NETL, 2012b; Schoenmakers, 2013), with the remaining 10% emitted with the flue gas. Ammonia is assumed to be completely removed by the scrubbers.
The last process in the gas cleaning section is the carbon oxide sulphide (COS) hydrolysis reactor. In this reactor, COS is converted into H2S14, which is subsequently removed from the syngas in the Selexol-based AGR. When CO2 capture is applied, the COS hydrolysis is replaced by a water gas shift (WGS) reactor, which converts CO and H2O are into CO2 and H2.
The acid gas removal is Selexol-based and is designed either for mainly sulphur removal (single stage) or for both sulphur and CO2 removal (dual stage). In both cases, at least 99.5% of the sulphur is removed from the syngas (Schoenmakers, 2013). A SO2 removal efficiency of 99.90% in the base case and 99.98% in the CCS case is assumed (NETL, 2010a, 2010b). When applying CCS, 90% of the total carbon intake is removed in the form of CO2. Any ammonia remaining in the syngas is dissolved in the Selexol.
The removed sulphur compounds consist mainly of H2S and SO2. These components are converted into elemental sulphur in the Claus process. As a part of the captured sulphur is not converted, this is extracted from the offgas and recycled back to Claus process using the Shell Claus Offgas Treatment Formation of NOx is reduced by adding steam or N2 to the syngas prior to combustion in the gas turbine. Total Hg and Se removal efficiencies over the entire process are assumed to be 99.34%15 and 99.7% respectively (Schoenmakers, 2013).
14 COS + H2O CO2 + H2S 15 NETL (2012a) reports a removal efficiency for Hg of 95%.
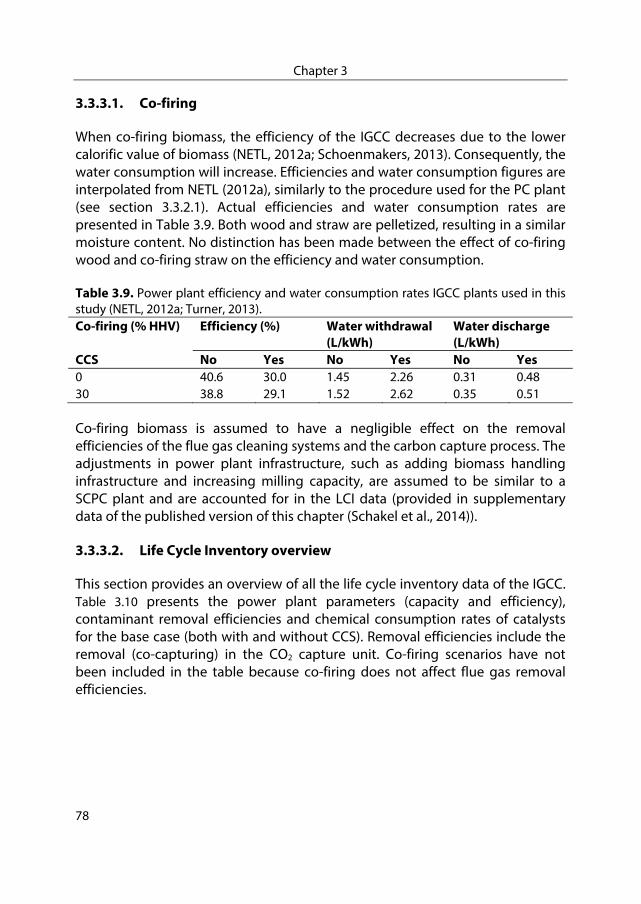
Chapter 3
78
3.3.3.1. Co-firing
When co-firing biomass, the efficiency of the IGCC decreases due to the lower calorific value of biomass (NETL, 2012a; Schoenmakers, 2013). Consequently, the water consumption will increase. Efficiencies and water consumption figures are interpolated from NETL (2012a), similarly to the procedure used for the PC plant (see section 3.3.2.1). Actual efficiencies and water consumption rates are presented in Table 3.9. Both wood and straw are pelletized, resulting in a similar moisture content. No distinction has been made between the effect of co-firing wood and co-firing straw on the efficiency and water consumption.
Table 3.9. Power plant efficiency and water consumption rates IGCC plants used in this study (NETL, 2012a; Turner, 2013). Co-firing (% HHV) Efficiency (%) Water withdrawal
(L/kWh) Water discharge (L/kWh)
CCS No Yes No Yes No Yes 0 40.6 30.0 1.45 2.26 0.31 0.48 30 38.8 29.1 1.52 2.62 0.35 0.51
Co-firing biomass is assumed to have a negligible effect on the removal efficiencies of the flue gas cleaning systems and the carbon capture process. The adjustments in power plant infrastructure, such as adding biomass handling infrastructure and increasing milling capacity, are assumed to be similar to a SCPC plant and are accounted for in the LCI data (provided in supplementary data of the published version of this chapter (Schakel et al., 2014)).
3.3.3.2. Life Cycle Inventory overview
This section provides an overview of all the life cycle inventory data of the IGCC. Table 3.10 presents the power plant parameters (capacity and efficiency), contaminant removal efficiencies and chemical consumption rates of catalysts for the base case (both with and without CCS). Removal efficiencies include the removal (co-capturing) in the CO2 capture unit. Co-firing scenarios have not been included in the table because co-firing does not affect flue gas removal efficiencies.
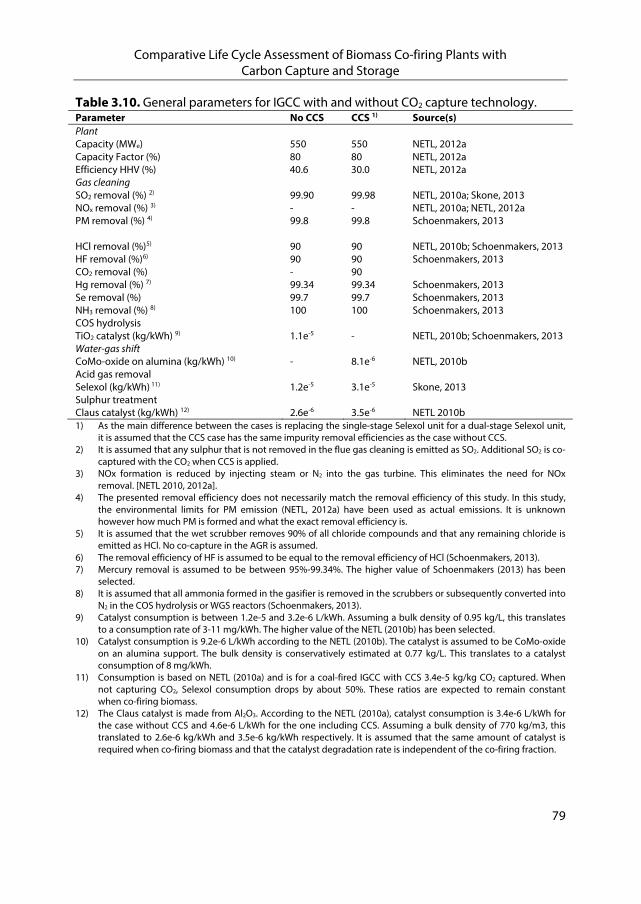
Comparative Life Cycle Assessment of Biomass Co-firing Plants with Carbon Capture and Storage
79
Table 3.10. General parameters for IGCC with and without CO2 capture technology. Parameter No CCS CCS 1) Source(s) Plant Capacity (MWe) 550 550 NETL, 2012aCapacity Factor (%) 80 80 NETL, 2012aEfficiency HHV (%) 40.6 30.0 NETL, 2012aGas cleaning SO2 removal (%) 2) 99.90 99.98 NETL, 2010a; Skone, 2013 NOx removal (%) 3) - - NETL, 2010a; NETL, 2012a PM removal (%) 4) 99.8
99.8 Schoenmakers, 2013
HCl removal (%)5) 90 90 NETL, 2010b; Schoenmakers, 2013 HF removal (%)6) 90 90 Schoenmakers, 2013 CO2 removal (%) - 90 Hg removal (%) 7) 99.34 99.34 Schoenmakers, 2013 Se removal (%) 99.7 99.7 Schoenmakers, 2013 NH3 removal (%) 8) 100 100 Schoenmakers, 2013 COS hydrolysis TiO2 catalyst (kg/kWh) 9) 1.1e-5 - NETL, 2010b; Schoenmakers, 2013 Water-gas shift CoMo-oxide on alumina (kg/kWh) 10) - 8.1e-6 NETL, 2010bAcid gas removal Selexol (kg/kWh) 11) 1.2e-5 3.1e-5 Skone, 2013Sulphur treatment Claus catalyst (kg/kWh) 12) 2.6e-6 3.5e-6 NETL 2010b1) As the main difference between the cases is replacing the single-stage Selexol unit for a dual-stage Selexol unit,
it is assumed that the CCS case has the same impurity removal efficiencies as the case without CCS. 2) It is assumed that any sulphur that is not removed in the flue gas cleaning is emitted as SO2. Additional SO2 is co-
captured with the CO2 when CCS is applied. 3) NOx formation is reduced by injecting steam or N2 into the gas turbine. This eliminates the need for NOx
removal. [NETL 2010, 2012a]. 4) The presented removal efficiency does not necessarily match the removal efficiency of this study. In this study,
the environmental limits for PM emission (NETL, 2012a) have been used as actual emissions. It is unknown however how much PM is formed and what the exact removal efficiency is.
5) It is assumed that the wet scrubber removes 90% of all chloride compounds and that any remaining chloride is emitted as HCl. No co-capture in the AGR is assumed.
6) The removal efficiency of HF is assumed to be equal to the removal efficiency of HCl (Schoenmakers, 2013). 7) Mercury removal is assumed to be between 95%-99.34%. The higher value of Schoenmakers (2013) has been
selected. 8) It is assumed that all ammonia formed in the gasifier is removed in the scrubbers or subsequently converted into
N2 in the COS hydrolysis or WGS reactors (Schoenmakers, 2013). 9) Catalyst consumption is between 1.2e-5 and 3.2e-6 L/kWh. Assuming a bulk density of 0.95 kg/L, this translates
to a consumption rate of 3-11 mg/kWh. The higher value of the NETL (2010b) has been selected. 10) Catalyst consumption is 9.2e-6 L/kWh according to the NETL (2010b). The catalyst is assumed to be CoMo-oxide
on an alumina support. The bulk density is conservatively estimated at 0.77 kg/L. This translates to a catalyst consumption of 8 mg/kWh.
11) Consumption is based on NETL (2010a) and is for a coal-fired IGCC with CCS 3.4e-5 kg/kg CO2 captured. When not capturing CO2, Selexol consumption drops by about 50%. These ratios are expected to remain constant when co-firing biomass.
12) The Claus catalyst is made from Al2O3. According to the NETL (2010a), catalyst consumption is 3.4e-6 L/kWh for the case without CCS and 4.6e-6 L/kWh for the one including CCS. Assuming a bulk density of 770 kg/m3, this translated to 2.6e-6 kg/kWh and 3.5e-6 kg/kWh respectively. It is assumed that the same amount of catalyst is required when co-firing biomass and that the catalyst degradation rate is independent of the co-firing fraction.

Chapter 3
80
Table 3.11. Mass balance IGCC. Feedstock Wood pellets +
Coal Coal Straw pellets +
Coal Co-firing ratio %energy 30% 0 30% CCS - No Yes No Yes No Yes
General Efficiency 1) % 38.8% 29.1% 40.6% 30.0% 38.8% 29.1% Coal 2) kg
a.r./kWh 0.239 0.319 0.327 0.442 0.239 0.319
Wood 2) kg a.r./kWh
0.147 0.196 - - - -
Straw 2) kg a.r./kWh
- - - - 0.161 0.215
CO2 balance Total CO2 formation g/kWh 812 1083 763 1033 816 1089 CO2 from biomass g/kWh 253 338 - - 257 343 CO2 captured g/kWh - 975 - 930 - 980 CO2 emissions g/kWh 812 108 763 103 816 109 Net CO2 emissions g/kWh 559 -230 763 103 559 -234 Water balance Raw Water withdrawal 3)
L/kWh 1.52 2.62 1.45 2.56 1.52 2.62
Process Water discharge 3)
L/kWh 0.35 0.51 0.31 0.48 0.35 0.51
Raw Water consumption 3)
L/kWh 1.18 2.11 1.14 2.08 1.18 2.11
Chemical consumption COS Hydrolysis catalyst 4)
g/kWh 1.2E-02 - 1.1E-02 - 1.2E-02 -
Water-gas shift catalyst 5)
g/kWh - 8.4E-03 - 8.1E-03 - 8.4E-03
Claus catalyst 6) g/kWh 2.0E-03 2.6E-03 2.7E-03 3.6E-03 2.0E-03 2.7E-03 Selexol 7) g/kWh 1.1E-02 3.0E-02 1.0E-02 2.8E-02 1.1E-02 3.0E-02 - of which due to CCS g/kWh - 1.48E-
02 - 1.41E-
02 - 1.48E-
02 By-products Slag 8) kg/kWh 9.4 12.5 9.5 12.8 23.1 30.8 Elemental sulphur kg/kWh 6.1 8.1 8.2 11.1 6.2 8.3

Comparative Life Cycle Assessment of Biomass Co-firing Plants with Carbon Capture and Storage
81
Feedstock Wood pellets + Coal
Coal Straw pellets + Coal
Emissions SO2 g/kWh 1.2E-02 3.5E-03 1.6E-02 4.8E-03 1.2E-02 3.6E-03 NO9) g/kWh 2.1E-01 2.4E-01 2.1E-01 2.4E-01 2.1E-01 2.4E-01 NO2
9) g/kWh 1.1E-02 1.3E-02 1.1E-02 1.3E-02 1.1E-02 1.3E-02 HCl g/kWh 7.3E-02 9.7E-02 9.7E-02 1.3E-01 1.1E-01 1.5E-01 HF g/kWh 1.5E-03 2.0E-03 0 0 1.5E-04 2.0E-04 PM g/kWh 2.8E-02 3.8E-02 2.7E-02 3.7E-02 2.8E-02 3.8E-02 Hg g/kWh 1.6E-06 2.2E-06 2.2E-06 3.0E-06 1.6E-06 2.2E-06 Se g/kWh 1.5E-06 2.0E-06 1.5E-06 2.0E-06 1.2E-06 1.6E-06 1) The efficiencies are extrapolated from the NETL 2012a report, NETL 2013, according to Efficiency
(%) =40.6-5.9x for no-CCS and 30.0-3x for CCS, where x is the co-firing fraction (%energy). 2) The energy density (HHVa.r.) of the feedstock is: 27.14 MJ/kg Illinois#6 coal (NETL, 2012a); 18.91
MJ/kg willow (ECN, 2013) and 17.30 MJ/kg straw (ECN, 2013). 3) The water withdrawal, consumption and discharge rates are based on the values reported by NETL
(NETL, 2012a; Turner, 2013), but adjusted for the new efficiencies. 4) The COS hydrolysis catalyst is made of TiO2. Consumption data range from 3.2e-6 L/kWh from
operational data from an IGCC to 12e-6 - 19e-6 L/kWh from the NETL (2010a). The conservative value from the NETL (2010a) with the number corresponding to the Shell gasifier was selected. Assuming 30% porosity, this translates to a catalyst consumption of 3.5e-5 kg/kWh. It is assumed that the same amount of catalyst is required when co-firing biomass and that the catalyst degradation rate is independent of the co-firing fraction. If CCS is applied, a separate COS hydrolysis catalyst is not necessary as the WGS catalyst already has COS hydrolysis activity.
5) The water-gas shift catalyst is only required if CO2 is captured. The catalyst is assumed to be CoMo-oxides on an alumina support. The composition is assumed to be 3.5%w CoO, 14%w MoO3 with the remainder being Al2O3 (SÜD-Chemie, 2007).. Catalyst consumption is based on NETL (2010b) and is 1.1e-5 L/kWh. Assuming a bulk density of 770 kg/m3, this translates to a catalyst consumption of 8.1e-6 kg/kWh. It is assumed that the same amount of catalyst is required when co-firing biomass and that the catalyst degradation rate is independent of the co-firing fraction.
6) The Claus catalyst is made from Al2O3. According to the NETL 2010, catalyst consumption is 3.4e-6 L/kWh for the cases without CCS and 4.6e-6 L/kWh for the ones including CCS. Assuming a bulk density of 770 kg/m3, this translated to 2.6e-6 kg/kWh and 3.5e-6 kg/kWh respectively. It is assumed that the same amount of catalyst is required when co-firing biomass as catalyst replacement is dependent on increasing pressure drop in the reactor bed and not on the reduction in activity of the catalyst.
7) Consumption is based on NETL (2010) and is for a coal-fired IGCC with CCS 3.4e-5 kg/kg CO2 captured. When not capturing CO2, Selexol consumption drops by about 50%. These ratios are expected to remain constant when co-firing biomass.
8) The amount of slag produced is 1.035 times the amount of ash in the fuel, based on NETL 2012a, NETL 2013
9) Specific NOx emissions are taken from NETL 2012a and are assumed to remain constant regardless of co-firing. It is assumed that 95% of NOx emissions are NO and the remaining 5% is NO2 (Dones et al., 2007; EPA, 2010; Koornneef et al., 2008; Robbins et al., 2000).

Chapter 3
82
Table 3.11 provides a complete overview of power plant parameters, inputs (fuel, water and chemicals) and outputs (by-products, waste and emissions) for all the IGCC cases. As a result of the efficiency decrease of co-firing and applying CCS, the consumption of fuel and the production of by-products increase. Water consumption increases partly due to the decrease in efficiency and partly due to the additional water demand of the carbon capture process. The consumption of COS hydrolysis catalyst is replaced by the consumption of WGS-catalyst when applying CCS, while the consumption of Claus catalyst and selexol increases for CCS due to efficiency drop and the introduction of a second selexol stage. The use of additional fuel causes a rise in the emissions NOx, HCl, HF, PM, Hg and Se. However, SO2 emissions decrease due to the co-capture of SO2 in the AGR.
In the co-firing biomass cases, more CO2 per kWh is produced and subsequently captured, as a result of the lower heating value of the biomass compared to coal. The impact of co-firing on the water consumption is minimal: 30% co-firing increases the water consumption by less than 5%. The consumption of COS hydrolysis catalyst (no-CCS cases) and water-gas shift catalyst (CCS cases) slightly increase when co-firing biomass, due to the efficiency drop when including carbon capture. The effect of a different flue gas composition on the consumption of these catalysts is relatively small (Meerman et al., 2011), and has therefore not been taken into account. The consumption of Claus catalyst decreases when co-firing, due to the lower sulphur content of the biomass. The amount of selexol consumption increases due to the drop in efficiency as well. All emissions decrease when co-firing biomass, except HCL (when co-firing straw pellets), NOx (fixed at environmental limit) and HF (as F is not present in coal).
3.3.4. Downstream
3.3.4.1. CO2 compression
In both power plants, the captured CO2 stream is dehydrated and compressed to 15.3 MPa using an integrally geared compressor (NETL, 2012a; NETL, 2012b), resulting in a supercritical CO2 stream containing over 99% CO2 (NETL, 2012a; NETL, 2012b). The required energy for this compression is generated by the power plant itself and is already accounted for in the presented efficiency drop of the cases including CCS. LCI data for the compressor infrastructure is obtained from Koornneef (2008) and is presented in Appendix I and the end of this chapter.

Comparative Life Cycle Assessment of Biomass Co-firing Plants with Carbon Capture and Storage
83
3.3.4.2. CO2 transport
Total CO2 production varies among the different cases between 4.0-4.5 Mt/year. CO2 transport of 100 km by pipeline to two different aquifers is assumed, with an inlet pressure of 15.3 MPa and capacity factor of 85% (NETL, 2012a; NETL, 2012b). For this configuration, no booster stations are required and a pipeline made from typical carbon steel with a diameter of 0.41 m is considered sufficient (Knoope et al., 2013).
Transporting CO2 trough pipelines is very similar to transporting natural gas. However, the size (diameter) of a gas transporting pipeline is much larger than the size requirements for CO2 transporting pipelines. Therefore, the LCI data for offshore pipelines (Ecoinvent, 2010) are multiplied by scaling factors of 0.17 for CO2 from SCPC and 0.15 for CO2 from IGCC (Hertwich et al., 2016) (Hertwich et al., 2016). These scaling factors are determined by comparing the diameters of natural gas transporting pipelines with calculated diameters of the required pipelines (Hertwich et al., 2016). The difference between the scaling factors for SCPC and IGCC are the results of the slightly higher CO2 density of the CO2 stream from IGCC. CO2 leakage of 3.5 kt (Koornneef et al., 2008) over the total lifetime of the pipeline of 30 years is assumed.
3.3.4.3. CO2 storage
For the offshore storage of CO2 (4.0-4.5 Mt/year), five wells (assuming capacity of
1Mt/year per well (van den Broek et al., 2010) with a depth of 3000 meter are considered (Koornneef et al., 2008). LCI data for offshore well exploration and production have been obtained from the Ecoinvent database (2010). Possible leakage of CO2 from the storage location has not been taken into account.
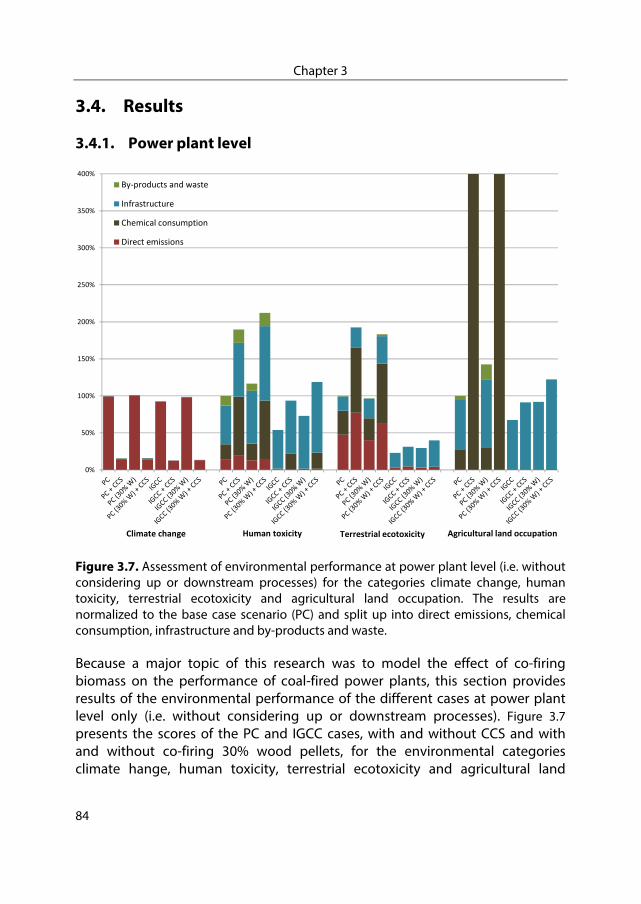
Chapter 3
84
Results 3.4.
3.4.1. Power plant level
Figure 3.7. Assessment of environmental performance at power plant level (i.e. without considering up or downstream processes) for the categories climate change, human toxicity, terrestrial ecotoxicity and agricultural land occupation. The results are normalized to the base case scenario (PC) and split up into direct emissions, chemical consumption, infrastructure and by-products and waste.
Because a major topic of this research was to model the effect of co-firing biomass on the performance of coal-fired power plants, this section provides results of the environmental performance of the different cases at power plant level only (i.e. without considering up or downstream processes). Figure 3.7 presents the scores of the PC and IGCC cases, with and without CCS and with and without co-firing 30% wood pellets, for the environmental categories climate hange, human toxicity, terrestrial ecotoxicity and agricultural land
0%
50%
100%
150%
200%
250%
300%
350%
400%
By‐products and waste
Infrastructure
Chemical consumption
Direct emissions
Climate change Human toxicity Terrestrial ecotoxicity Agricultural land occupation

Comparative Life Cycle Assessment of Biomass Co-firing Plants with Carbon Capture and Storage
85
occupation. The results of these categories show the most interesting differences between the cases.
The impact on climate change is dominated by the CO2 emissions at the power plant, which is why the impact is reduced by almost 90%, the CO2 capture rate, when applying CCS. Co-firing wood pellets slightly increases the impact on climate change due to the efficiency drop of the power plant. The lower impact shown in the IGCC cases is a direct result of the larger efficiency of the IGCC compared to the PC.
The largest contribution to human toxicity is the infrastructure of the power plant. As equal assumptions are applied for the PC and IGCC plant infrastructure, there is no difference in the size of these bars for both plants. However, the PC plant has a higher impact on human toxicity from direct emissions, chemical consumption and by-products and waste compared to the IGCC. The difference in impact on human toxicity from direct emissions between the PC and IGCC is caused by the much higher removal efficiency of Hg and Se in the IGCC. The effect of chemical consumption on human toxicity is more noticeable in the PC cases because a larger amount of chemicals are used in the PC. Chemicals that contribute mostly to the impact on human toxicity are NaOH and MEA in the PC cases and WGS catalyst in the IGCC cases, which also explains the difference between the cases with and without CCS. The disposal of the waste streams from the FGD, the used TiO2 and the reclaimer waste of the capture unit also contribute to the impact on human toxicity. As the by-products of the IGCC are considered to be utilized, no impact on the environment is allocated to these products, resulting in a negligible contribution from by-products and waste in the IGCC cases. The effect of increased infrastructure demand when co-firing results in higher impacts on human toxicity in the co-firing cases, compensating the slight decrease in the impact from direct emissions and waste in the PC. Similar differences are found for the categories ozone depletion, ionising radiation, water depletion and fossil depletion (though with a lower share of direct emissions and a higher share of chemical consumption) and in the categories freshwater eutrophication, freshwater ecotoxicity, marine ecotoxicity and metal depletion (though with a lower share of direct emissions and a higher share of infrastructure).
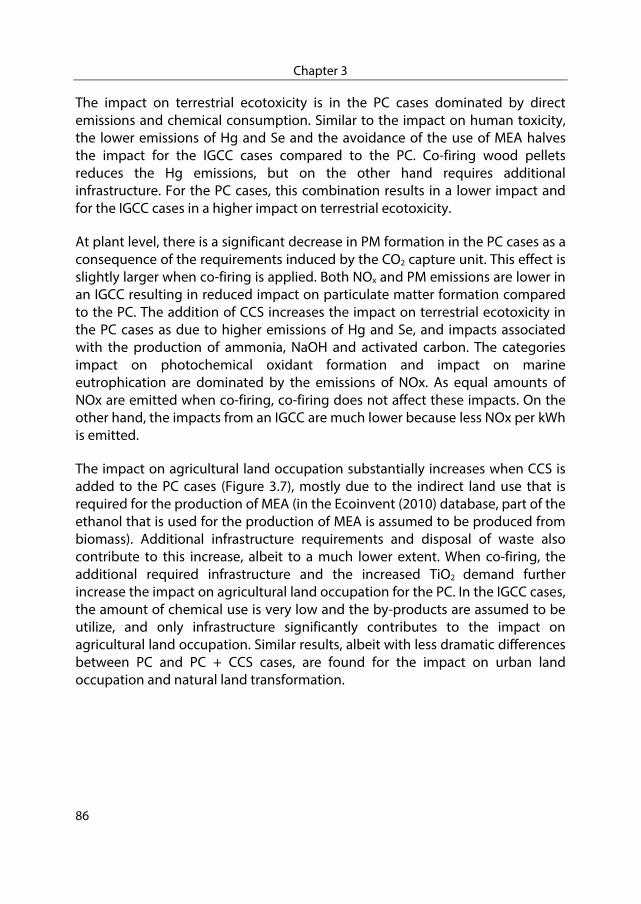
Chapter 3
86
The impact on terrestrial ecotoxicity is in the PC cases dominated by direct emissions and chemical consumption. Similar to the impact on human toxicity, the lower emissions of Hg and Se and the avoidance of the use of MEA halves the impact for the IGCC cases compared to the PC. Co-firing wood pellets reduces the Hg emissions, but on the other hand requires additional infrastructure. For the PC cases, this combination results in a lower impact and for the IGCC cases in a higher impact on terrestrial ecotoxicity.
At plant level, there is a significant decrease in PM formation in the PC cases as a consequence of the requirements induced by the CO2 capture unit. This effect is slightly larger when co-firing is applied. Both NOx and PM emissions are lower in an IGCC resulting in reduced impact on particulate matter formation compared to the PC. The addition of CCS increases the impact on terrestrial ecotoxicity in the PC cases as due to higher emissions of Hg and Se, and impacts associated with the production of ammonia, NaOH and activated carbon. The categories impact on photochemical oxidant formation and impact on marine eutrophication are dominated by the emissions of NOx. As equal amounts of NOx are emitted when co-firing, co-firing does not affect these impacts. On the other hand, the impacts from an IGCC are much lower because less NOx per kWh is emitted.
The impact on agricultural land occupation substantially increases when CCS is added to the PC cases (Figure 3.7), mostly due to the indirect land use that is required for the production of MEA (in the Ecoinvent (2010) database, part of the ethanol that is used for the production of MEA is assumed to be produced from biomass). Additional infrastructure requirements and disposal of waste also contribute to this increase, albeit to a much lower extent. When co-firing, the additional required infrastructure and the increased TiO2 demand further increase the impact on agricultural land occupation for the PC. In the IGCC cases, the amount of chemical use is very low and the by-products are assumed to be utilize, and only infrastructure significantly contributes to the impact on agricultural land occupation. Similar results, albeit with less dramatic differences between PC and PC + CCS cases, are found for the impact on urban land occupation and natural land transformation.

Comparative Life Cycle Assessment of Biomass Co-firing Plants with Carbon Capture and Storage
87
3.4.2. Life Cycle Assessment
3.4.2.1. CO2 balance
The main purpose of applying BioCCS is to reduce CO2 emissions. Figure 3.8 presents the CO2 emissions per kWh electricity delivered to the grid for all cases through their life cycle, divided in contributions to coal mining and transport, pellet production and transport, direct emissions at power plant, indirect emissions and processes and CO2 transport and storage. The decrease of direct CO2 emissions at the power plant when applying CSS (almost 90%) is partly offset by the increase in CO2 emissions from coal mining and the additional emissions from the CO2 transport and storage process due to the lower efficiency of the power plant. In the cases without co-firing, applying CCS reduces CO2 emissions by 74% (from 903 g/kWh to 238 g/kWh) in the PC case and by 75% (from 840 kWh to 208 g/kWh) in the IGCC case. The slightly higher decrease in the IGCC case is caused by less indirect CO2 emissions from the production of chemicals compared to the PC.
Figure 3.8. CO2 emissions (g CO2 eq. per kWh) for pulverised coal (PC) plant and gasification plant (IGCC) cases with and without 30% co-firing wood pellets (W) or straw pellets (S) with and without carbon capture and storage. “Net CO2 emissions” are total emissions minus emissions from co-firing biomass.
‐600
‐400
‐200
0
200
400
600
800
1000
1200
CO
2em
issions (g/kWh)
Coal mining and transport Pellet production and transport Direct emissions at power plant Indirect emissions and processes
CO2 transport and storage CO2 from biomass Net CO2 emissions

Chapter 3
88
Co-firing biomass further reduces the net CO2 emissions because the carbon stored in the biomass is accounted as negative CO2 emissions16. Co-firing 30% wood or straw pellets reduces CO2 emissions by 23-24% (from 903 g/kWh to 689 g/kWh and 695 g/kWh, respectively) in a PC and by 26% (from 840 g/kWh to 667 g/kWh and 673 g/kWh, respectively) in an IGCC. When adding CCS, net negative emissions are reached: co-firing 30% wood pellets decreases CO2 emissions, compared to the base case PC without CCS, by 108% (from 903 g/kWh to -72 g/kWh) for a PC and 109% (from 840 g/kWh to -85 g/kWh) for IGCC. The slightly larger decrease in the IGCC case is again mainly caused by the indirect CO2 emissions of the production of chemicals used in the PC. The difference between co-firing wood and straw pellets is very small, which is due to similar assumptions being applied in the upstream processes. In these processes, CO2 emissions are dominated by emissions from electricity use of the pelletization process and transportation.
The CO2 balance is strongly dominated by the direct CO2 emissions at the power plant, but upstream emissions from production of coal and biomass also contribute significantly. The negative emissions assigned to the biomass underlie the reduction of net CO2 emissions and enable net negative emissions in the BioCCS cases. The validation of contributing negative emissions to the biomass is discussed in detail in section 3.5.2.
3.4.2.2. Environmental impact categories
The results of all environmental impact categories (Recipe H, midpoint method) except climate change are presented in Figure 3.9a and b for the PC cases and in Figure 3.10a and b for the IGCC cases. In the PC cases, applying CCS increases the environmental impact for all categories, almost exclusively caused by the additional fuel required for CO2 capture. Besides, the impact of direct emissions increases in the categories photochemical oxidant formation, particulate matter formation, terrestrial acidification and marine eutrophication. The emissions responsible for the increases are NOx and NH3, which added impacts are not compensated by reductions of SO2, HCl and PM emissions. The effect of the increase in chemical use (such as MEA) in the CCS cases appears negligible in all
16 Assuming that all carbon stored in the biomass is taken from CO2 from the
atmosphereand equals the CO2 release (net total effect).

Comparative Life Cycle Assessment of Biomass Co-firing Plants with Carbon Capture and Storage
89
categories compared to the impacts of coal and biomass pellet production and transport. However, the additional infrastructure required when capturing CO2 increases the impact on metal depletion by 30%. CO2 transport and storage only significantly contributes to the impact on natural land transformation, mainly due to the land required for the CO2 injection facilities.
Co-firing wood pellets, regardless whether CCS is applied, decreases the impact on human toxicity, freshwater eutrophication, freshwater ecotoxicity and marine ecotoxicity because the toxic processes linked to coal mining are partly avoided. However, the impact on the categories ozone depletion, photochemical oxidant formation, ionising radiation, terrestrial acidification and terrestrial ecotoxicity increase when co-firing wood pellets because, for these categories, the impact from pellet production and transport are larger than the impacts from coal mining. This is mainly due to the electricity required for the pelletization process. This effect is most substantial illustrated in the category ionising radiation, due to the share of nuclear energy17 in the electricity mix. The impact of the drop in direct emissions of SO2, HCl, PM and Hg is insignificant compared to the effect of the upstream processes. This also holds for the indirect emissions and processes, which increase when co-firing wood pellets due to the efficiency drop, and the large increase in TiO2 consumption (due to the alkali components in biomass). The upgraded infrastructure of the power plant only significantly affects the score on metal depletion.
The impact on agricultural land occupation decreases when co-firing, because less (indirect) agricultural land is used for the production of biomass pellets compared to the production of coal, as no land allocation to biomass residues is assumed. The impact on urban land occupation and natural land transformation slightly increases due to additional infrastructure (predominately roads) requirements for the gathering of residues. The upstream processes of pellet production and transport also lead to a minor increase in water depletion. On the other hand, co-firing biomass substantially decreases the impact on fossil depletion, as less coal is required.
17 As the electricity mix of the USA is used for the electricity consumption of the
pelletization process, the share of nuclear energy is relatively high.
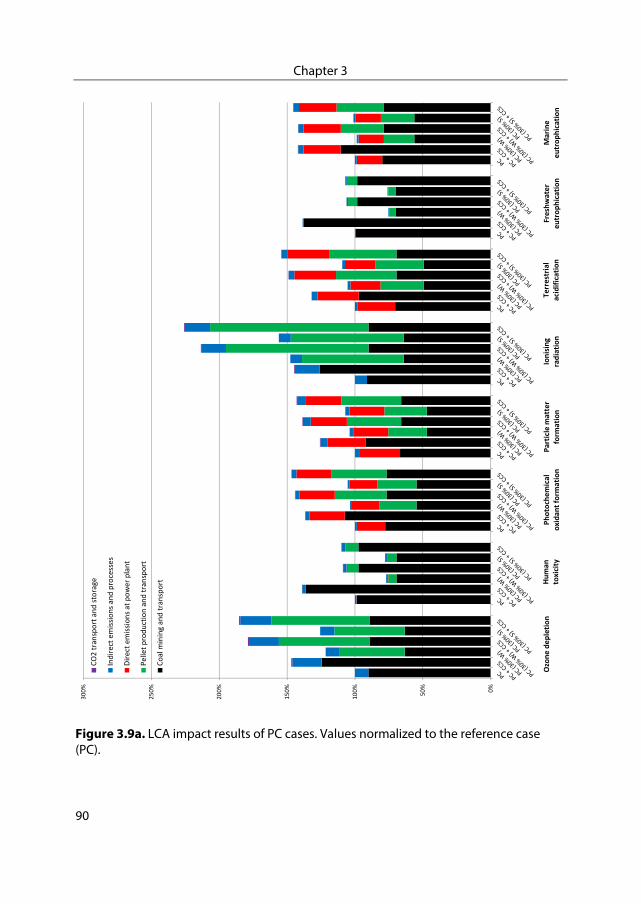
Chapter 3
90
Figure 3.9a. LCA impact results of PC cases. Values normalized to the reference case (PC).
0%
50%
100%
150%
200%
250%
300%
CO2 tran
sport and storage
Indirect emissions an
d processes
Direct emissions at power plant
Pellet production and transport
Coal m
ining an
d transport
Ozone dep
letion
Human
toxicity
Photochemical
oxidan
tform
ation
Particle matter
form
ation
Ionising
radiation
Terrestrial
acidification
Freshwater
eutrophication
Marine
eutrophication
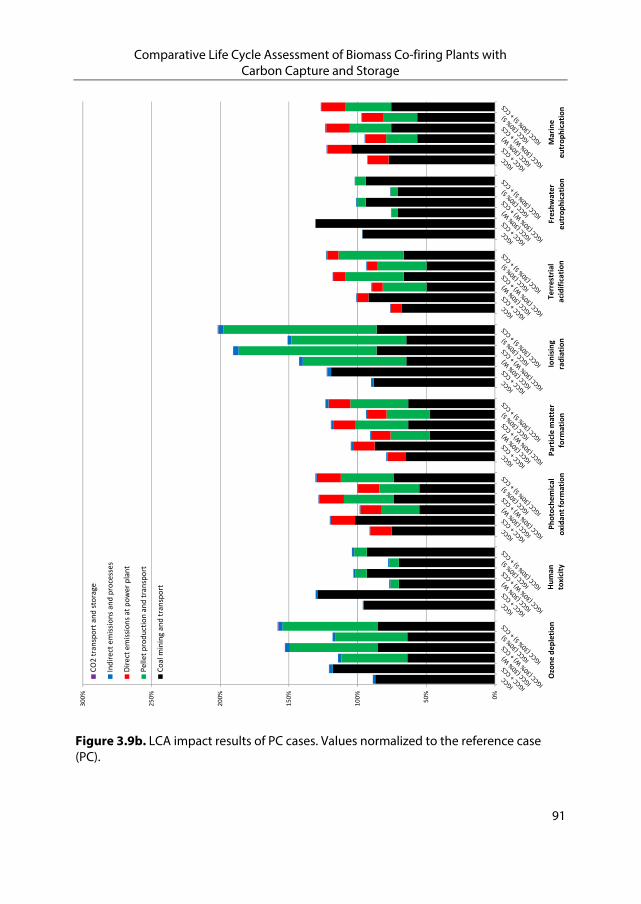
Comparative Life Cycle Assessment of Biomass Co-firing Plants with Carbon Capture and Storage
91
Figure 3.9b. LCA impact results of PC cases. Values normalized to the reference case (PC).
0%
50%
100%
150%
200%
250%
300%
CO2 transport and storage
Indirect emissions an
d processes
Direct emissions at power plant
Pellet production and transport
Coal m
ining an
d transport
Ozone depletion
Human
toxicity
Photochemical
oxidan
tform
ation
Particle m
atter
form
ation
Ionising
radiation
Terrestrial
acidification
Freshwater
eutrophication
Marine
eutrophication

Chapter 3
92
Figure 3.10a. LCA impact results of IGCC cases. Values normalized to the reference case (PC).
0%
50%
100%
150%
200%
250%
300%
CO2 transport and storage
Indirect em
issions an
d processes
Direct emissions at power plant
Pellet production and transport
Coal m
ining an
d transport
Terrestrial
ecotoxicity
Freshwater
ecotoxicity
Marine
ecotoxicity
Agriculturallan
d
occupation
Urban
land
occupation
Natural lan
d
tran
sform
ation
Water dep
letion
Metal dep
letion
Fossil dep
letion

Comparative Life Cycle Assessment of Biomass Co-firing Plants with Carbon Capture and Storage
93
Figure 3.10b. LCA impact results of IGCC cases. Values normalized to the reference case (PC).
0%
50%
100%
150%
200%
250%
300%
CO2 tran
sport and storage
Indirect emissions an
d processes
Direct em
issions at power plant
Pellet production and transport
Coal m
ining an
d transport
Terrestrial
ecotoxicity
Freshwater
ecotoxicity
Marine
ecotoxicity
Agriculturallan
d
occupation
Urban
land
occupation
Natural lan
d
tran
sform
ation
Water dep
letion
Metal d
epletion
Fossil dep
letion
Chapter 3
94
Only minor differences between co-firing wood and co-firing straw can be noticed in the majority of the categories, as the impact from pelletizing (electricity use) and transportation, which are in both cases based on the same assumptions, dominate the total impact in these categories. Therefore, the observed differences are mainly the effect of the difference in calorific value and density between wood and straw pellets, which affect the amount of pellets needed to be produced and transported. Exceptions are the categories regarding land use and land change: agricultural land occupation, urban land occupation and natural land transformation. The impact on these categories is impacted by local parameters regarding (indirect) land occupation and transformation. In this study, less land occupation and transformation is needed for the production of pellets from straw residues compared to wood residues, based on the assumption that additional infrastructure needs to be constructed to gather forest residues, which is not the case for agricultural residues.
All IGCC cases perform better on all impact categories compared to their corresponding PC cases. This is mainly the result of the higher efficiency assumed for an IGCC compared to a PC, but also due to lower direct emissions of pollutants (such as NOx, SO2, PM, Hg and NH3) and lower indirect emissions from chemical use.
3.4.3. End point environmental categories
The results in the previous sections illustrate that applying CCS in a coal fired power plant reduces GHG emissions, but increases the impact of all other environmental indicators. On top of that, co-firing biomass pellets further decreases GHG emissions but at the same time also increases the impact of half of the other indicators (mainly due to the electricity use in the pelletization process). Therefore, the question remains whether the reduction in impact on climate change is worth the increase in impact in the other environmental categories.
To compare different environmental indicators with one and other, aggregation into endpoints is applied using the Recipe Endpoint H method (Goedkoop et al., 2009). Figure 3.11 presents midpoints aggregated into one score for human
Comparative Life Cycle Assessment of Biomass Co-firing Plants with Carbon Capture and Storage
95
health (expressed in DALY18 per kWh) and Figure 3.12 presents midpoints aggregated into one score for ecosystems (expressed in species.yr19 per kWh). These figures point out the relative importance of climate change mitigation compared to other impact categories. For instance, for the impact on human health (Figure 3.11), the cases with CCS show a significant better performance. Comparing the co-firing 30% wood pellet + CCS cases with their corresponding reference cases indicate that the BioCCS cases reduce the impact on human health by 82% and 84% for the PC and IGCC, respectively. The effect of substantially decreasing CO2 emissions compensates the effect of an increased impact in human toxicity and particulate matter formation, while the other midpoint indicators (ozone depletion, photochemical oxidant formation and ionising radiation) do not significantly contribute to the total endpoint score on human health.
For the impact on ecosystems (Figure 3.12), the relative importance of the CO2 reduction is even more visible than for the impact on human health (Figure 3.11). Comparing the co-firing 30% wood pellet + CCS cases with their corresponding reference cases (no co-firing, no CCS) indicate that the BioCCS cases reduce the impact on ecosystems by 103% and 104% for the PC and IGCC, respectively. The effect of the impact on climate changes dominates all the other midpoints related to ecosystems and therefore, the BioCCS scenarios show a net positive impact on ecosystems.
18 DALY, Disability Adjusted Life Years: indicates the number of healthy life years that are
lost due to sickness or disability and premature death. This concept combines information on the quality of life and life expectancy in one indicator.
19 Species.yr: expresses the potential number of species disappearing over time. The index can be interpreted as the number of species that have a high probability of no occurrence in a region integrated over time.

Chapter 3
96
Figure 3.11. Endpoint indicator “Human Health” scores for all cases divided in contributions to the midpoints: climate change, ozone depletion, human toxicity, photochemical oxidant formation, particulate matter formation and ionising radiation.
‐4.E‐07
‐2.E‐07
0.E+00
2.E‐07
4.E‐07
6.E‐07
8.E‐07
1.E‐06
1.E‐06
1.E‐06
2.E‐06
2.E‐06
Human
Health (DALY)
Climate change Ozone depletion Human toxicity
Photochemical oxidant formation Particulate matter formation Ionising radiation

Comparative Life Cycle Assessment of Biomass Co-firing Plants with Carbon Capture and Storage
97
Figure 3.12. Endpoint indicator “Ecosystems” scores for all cases divided in contributions to the midpoints: climate change, terrestrial acidification, freshwater eutrophication, terrestrial ecotoxicity, freshwater ecotoxicity, marine ecotoxicity, agricultural land occupation, urban land occupation and natural land transformation.
‐2.E‐09
‐1.E‐09
0.E+00
1.E‐09
2.E‐09
3.E‐09
4.E‐09
5.E‐09
6.E‐09
7.E‐09
8.E‐09
Ecosystem
s (species.yr)
Climate change Terrestrial acidification Freshwater eutrophication
Terrestrial ecotoxicity Freshwater ecotoxicity Marine ecotoxicity
Agricultural land occupation Urban land occupation Natural land transformation
Chapter 3
98
Discussion 3.5.
3.5.1. Literature comparison
The results in this study have shown that impacts from upstream processes and emissions dominate all environmental impact categories except climate change to a larger extent than has been reported in previous LCAs on CCS, as is summarized in the literature review of Corsten et al., (2013). In these reviewed studies, emissions at the power plant contributed the most to the environmental impacts, especially in cases without CCS. However, these studies have used older LCA methods in which environmental impacts of coal production were underestimated. Since then, the LCA method ReCiPe (Goedkoop et al., 2008) and Ecoinvent database (Ecoinvent, 2010) have been updated, which explains the different findings in this study.
Key results in this study are the CO2 balances presented for the different cases, especially for the BioCCS ones. It is interesting to compare the life cycle CO2 emissions with other BioCCS LCA studies. The results of this comparison are presented in Table 3.12.
Of these assessed studies, only Spath et al., (2004) and NETL (2012b) reported positive net life cycle emissions. Spath et al., (2004) assessed 15% co-firing with CCS, which is too low to reach negative emissions. NETL (2012b) used hybrid poplar, a short rotation crop, which includes higher upstream CO2 emissions compared to biomass residues. The studies of Corti et al., (2004) and Carpentieri et al., (2005) assessed 100% biomass fired power plants, which is why they report much larger amounts of net life cycle CO2 emissions. NETL (2012a) reports two values of net negative CO2 emissions originating from two different scenarios. The IGCC results of this study, with a similar co-firing ratio, fall well within this range. Cuellar (2012) also assess co-firing forest residues, albeit with a lower co-firing ratio. Nevertheless, he reports much higher net negative CO2 emissions compared to this study. As Cuellar (2012) does not provide a detailed CO2 balance, it is difficult to explain this difference. However, the differences most likely are the results of different assumptions regarding biomass characteristics and production/processing processes. Because the LCA results strongly depend on the assumptions regarding biomass, these are discussed with more detail in section 3.5.2.

Comparative Life Cycle Assessment of Biomass Co-firing Plants with Carbon Capture and Storage
99
Table 3.12. Comparison of CO2 emissions of other literature studies compared to this study. Study Technology Biomass Type Co-firing
Ratio (%) Capacity (MW)
Life Cycle CO2 emissions (g/kWh)
Net life cycle CO2 emissions (g/kWh)
Spath et al., 2004
Co-firing Urban waste-Energy crops
15 600 270 43
Corti et al., 2004
BIGCC Poplar 100 205 70 – 130 -410
Carpentieri et al., 2005
BIGCC Poplar 100 191 227 -594
NETL, 2012a
IGCC Switch grass 30 451-654 Not reported
-6 – -105
NETL, 2012b
SC Coal co-firing plant
Hybrid Poplar 30 550 Not reported
38
Cuellar, 2012
Coal co-firing plant
Forrest residues 20 141.5 Not reported
-129.5
This study PC Wood pellets/straw pellets (residues)
30 550 281 – 291 -67 – -72
This study IGCC Wood pellets/straw pellets (residues)
30 550 253 – 262 -81 – -85
Carpentieri et al., (2005) is the only study which also reports other LCA impact category results. However, the methods, databases and characterization factors used for LCA have been updated since then. Therefore, it is not useful to compare the results for impact categories other than climate change of Carpentieri et al., (2005) with this study.

Chapter 3
100
3.5.2. Upstream processes and emissions
Figure 3.13. Sensitivity of land use allocation to the production of wood pellets on the impact on ecosystems, divided in contributions from the different midpoints.
In this study, no land use is allocated to the residues used for the production of wood and straw pellets, as it is assumed that the residues represent a waste stream. However, other land use allocation procedures, using for instance the economic value of the products, could be preferred in the future to assess land use allocation of biomass residues. As it is very difficult to estimate the economic value of biomass residues, and this is beyond the scope of this study, no land was allocated to the biomass residues. A sensitivity analysis has been performed on the effect of land allocation on the total impact on Ecosystems, by running
‐2.0E‐09
‐1.0E‐09
0.0E+00
1.0E‐09
2.0E‐09
3.0E‐09
4.0E‐09
5.0E‐09
6.0E‐09
7.0E‐09
8.0E‐09
9.0E‐09
Ecosystems (species.yr)
Climate change Terrestrial acidification Freshwater eutrophication
Terrestrial ecotoxicity Freshwater ecotoxicity Marine ecotoxicity
Agricultural land occupation Urban land occupation Natural land transformation
Comparative Life Cycle Assessment of Biomass Co-firing Plants with Carbon Capture and Storage
101
additional cases in which land use is allocated (based on the mass ratio of residues and commercially used wood) to the wood residues. The results of this analysis are presented in Figure 3.13, and indicate that allocating a large amount of land use dramatically increases the impact on agricultural land occupation. Figure 3.13 represents the “worst case” scenario on the ecosystems’ sustainability allocated to BioCCS when biomass residues become a commodity or commercial biomass is used for the production of wood pellets. However, when land use is allocated to the wood residues, an equal amount of less land use is allocated to the production of the other (commercially) wood types. In total, the amount of land use allocated to the forest does not change. Therefore, while Figure 3.13 might suggest a dramatic increase in the impact on ecosystems, it only represents a shift in allocation from other wood production processes to wood pellets production for BioCCS.
The decrease in climate change potential of BioCCS strongly depends on the key assumption that biomass is CO2 neutral, i.e., CO2 emissions from biomass are not accounted for because in growing the biomass an equal amount of CO2 is extracted from the atmosphere. However, there is a large time lag between this growing process and the emission of CO2, creating a carbon debt. If this aspect is accounted for, a payback time in the order of several years is required to offset this carbon debt (Jonker et al., 2013; Lamers et al., 2014). This could substantially increase the climate change potential of BioCCS. However, the approach of accounting for carbon debt is case specific, affected by forest management and beyond the scope of this study, and therefore requires further research.
3.5.3. Fuel characteristics
In Table 3.3 in section 3.3.1, the characteristics of the coal and biomass types used in this study were presented, along with typical ranges for comparable coal and biomass types. Especially interesting to discuss are the wide ranges of the energy content of the different fuel types. The energy content of the fuel affects all impact categories, as the energy content determines the amount of fuel consumption. The used HHV calorific value of coal of 34.27 MJ/kg is relatively high (range is 25.1-35.6 MJ/kg) and so is the used HHV calorific value of straw of 19.55 MJ/kg (range is 17.6-20.2 MJ/kg). Contrary, the used HHV calorific value of wood of 19.92 MJ/kg is relatively low (range 19.7-22.1 MJ/kg). Therefore, the LCA results of BioCCS could improve (depending on the impact category and the size of shift in the calorific value) when woody biomass with a higher energy content is used and/or the biomass replaces coal with a lower energy content.
Chapter 3
102
Wide ranges also exist in the moisture content and ash content of the different fuel types. As all biomass is pelletized before co-firing, the moisture content only affects the pelletization process (a larger moisture content requires more energy consumption) but will not affect the performance at the power plant. The ash content will affect the amount of ash produced at the power plant, but as ash is considered to be utilized a change in the produced amount of ash will not affect the LCA results. However, if ash utilization is not possible, and the produced ash is treated as waste this could significantly influence the results (see sensitivity analysis in section 3.5.6).
3.5.4. Methodological limitations
Methodological limitations mainly occur in the characterisation factors of the emissions HCL, HF and MEA. The characterisation factors present the impact of the emissions on the different environmental categories. The emission of MEA only affects ecotoxicity, HF only human toxicity and HCl does not affect any category at all. These characterization factors give a limited view of the reality, as both HF and HCl are expected to contribute to acidification, human toxicity and ecotoxicity (Huijbregts, 2013). However, due to the large uncertainty in the characterization factors, these have not yet been included in ReCiPe (2008). A similar case is the impact of water use. Although the water balance of the power plants is included in the mass balances, no environmental impact is assigned to the cooling water obtained from natural sources in ReCiPe (2008). The effect of water pollution is characterized, but not the effect of water consumption or thermal pollution of water.
3.5.5. Power plant
3.5.5.1. Power plant efficiency
A parameter which influences all aspects of the LCA is the efficiency of the power plant. Especially, the efficiency drop of the power plant when co-firing and/or capturing CCS is a major factor in the environmental performance of BioCCS. The used efficiency drop of 0.21%pt (Turner, 2013) of co-firing 30% biomass in a PC is relatively low compared to other studies, which report the plant efficiency to decrease by 0.4-1%pt with every 10% increase in biomass co-firing ratio (e.g. Sebastián, et al., 2011). This would imply that 30% co-firing would decrease the efficiency by 1-3%pt.

Comparative Life Cycle Assessment of Biomass Co-firing Plants with Carbon Capture and Storage
103
Figure 3.14. Sensitivity of the effect of the efficiency drop when 30% co-firing wood pellets on the amount of CO2 emissions. Calculated emissions in this study equal 689 g/kWh for PC 30% W without CCS and -72 g/kWh for PC 30% W with CCS.
Figure 3.14 presents a sensitivity analysis of the efficiency drop of the 30% co-firing wood pellets in a PC case on the change in CO2 emissions. The CO2 emissions in the case without CCS increase by 12 g/kWh per 1%pt efficiency drop, which is a relatively small increase compared to the total life cycle CO2 emissions of 689 g/kWh. For the BioCCS case, the combination of a larger efficiency drop, 30% co-firing and 90% CO2 capture rate decreases the net specific CO2 emissions, because more biomass is used and therefore more climate neutral carbon is stored per kWh output. Nevertheless, this decrease of < 3 g/kWh per 1%pt efficiency drop would not lead to significantly improvements of the CO2 balance of BioCCS when lower efficiencies are used. The efficiency drop of the power plant when applying BioCCS plays a minor role in the decrease in climate change potential of BioCCS compared to 100% coal fired power plants. However, the remaining impact categories significantly increase with a larger co-firing efficiency drop, as the upstream effects of increased fuel production offset the minor changes in emissions and chemical use at the power plant.
‐10
‐5
0
5
10
15
20
25
30
35
0.0% 0.5% 1.0% 1.5% 2.0%Chan
ge in
CO
2emissions (g/kWh)
Efficiency drop (compared to corresponding scenario without co‐firing)
PC 30% W no CCS case PC 30% W CCS case
Sensitivity no CCS Sensitivity CCS

Chapter 3
104
3.5.5.2. Co-firing ratio
Co-firing biomass affects the performance of the power plant, as it reduces the efficiency and changes the flue gas properties. The extent of these effects is determined by the amount of co-firing. Therefore, a sensitivity analysis has been performed on the co-firing ratio. Co-firing ratios of 0, 15, 30 and 50% wood pellets in both the PC and IGCC cases are considered. A linear correlation between the co-firing ratio and the performance of the power plant is assumed (NETL, 2012a; NETL, 2012b). However, this might be a simplified representation as co-firing large amounts of biomass, > 30%, might require additional power plant adjustments (van Loo et al., 2008). Therefore, the 50% co-firing scenarios are a simplified representation of power plants co-firing 50% biomass.
Figure 3.15 shows the sensitivity of co-firing wood pellets on the total impact on climate change for both the PC and IGCC cases. Regardless whether CCS is included, the impact on climate change is lower for the IGCC. However, when the co-firing ratio increases, the difference between the PC and IGCC reduces up until the point where the impact on climate change is almost equal, at a co-firing ratio of 50%.
Figure 3.15. Sensitivity of the wood pellets co-firing ratio on the impact on climate change over the entire life cycle.
‐400
‐200
0
200
400
600
800
1,000
0% 5% 10% 15% 20% 25% 30% 35% 40% 45% 50%
Impact on clim
ate chan
ge (g CO
2emisssions/kW
h)
Wood pellets co‐firing ratio
PC no CCS PC CCS IGCC no CCS IGCC CCS
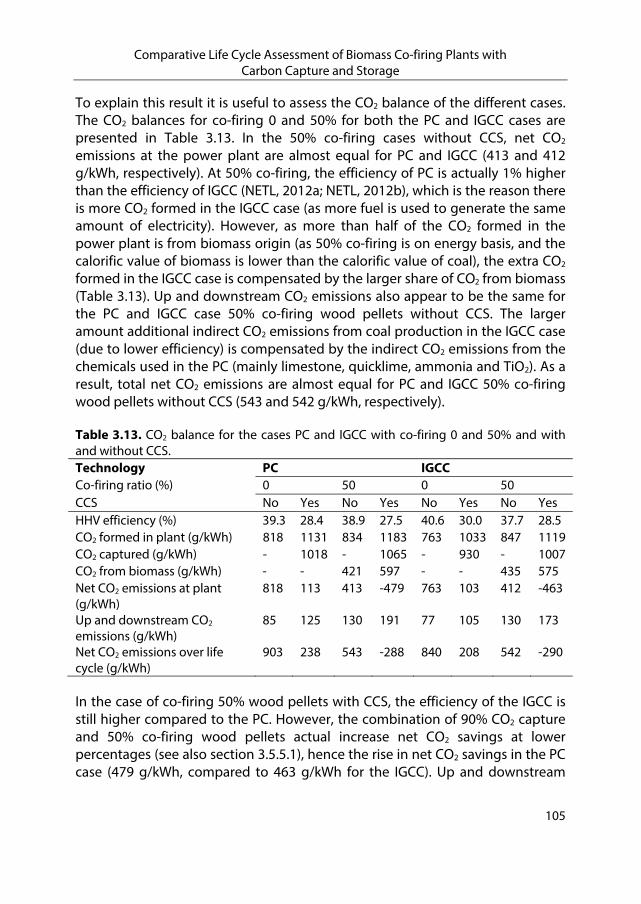
Comparative Life Cycle Assessment of Biomass Co-firing Plants with Carbon Capture and Storage
105
To explain this result it is useful to assess the CO2 balance of the different cases. The CO2 balances for co-firing 0 and 50% for both the PC and IGCC cases are presented in Table 3.13. In the 50% co-firing cases without CCS, net CO2 emissions at the power plant are almost equal for PC and IGCC (413 and 412 g/kWh, respectively). At 50% co-firing, the efficiency of PC is actually 1% higher than the efficiency of IGCC (NETL, 2012a; NETL, 2012b), which is the reason there is more CO2 formed in the IGCC case (as more fuel is used to generate the same amount of electricity). However, as more than half of the CO2 formed in the power plant is from biomass origin (as 50% co-firing is on energy basis, and the calorific value of biomass is lower than the calorific value of coal), the extra CO2 formed in the IGCC case is compensated by the larger share of CO2 from biomass (Table 3.13). Up and downstream CO2 emissions also appear to be the same for the PC and IGCC case 50% co-firing wood pellets without CCS. The larger amount additional indirect CO2 emissions from coal production in the IGCC case (due to lower efficiency) is compensated by the indirect CO2 emissions from the chemicals used in the PC (mainly limestone, quicklime, ammonia and TiO2). As a result, total net CO2 emissions are almost equal for PC and IGCC 50% co-firing wood pellets without CCS (543 and 542 g/kWh, respectively).
Table 3.13. CO2 balance for the cases PC and IGCC with co-firing 0 and 50% and with and without CCS. Technology PC IGCCCo-firing ratio (%) 0 50 0 50 CCS No Yes No Yes No Yes No Yes HHV efficiency (%) 39.3 28.4 38.9 27.5 40.6 30.0 37.7 28.5 CO2 formed in plant (g/kWh) 818 1131 834 1183 763 1033 847 1119 CO2 captured (g/kWh) - 1018 - 1065 - 930 - 1007 CO2 from biomass (g/kWh) - - 421 597 - - 435 575 Net CO2 emissions at plant (g/kWh)
818 113 413 -479 763 103 412 -463
Up and downstream CO2
emissions (g/kWh) 85 125 130 191 77 105 130 173
Net CO2 emissions over life cycle (g/kWh)
903 238 543 -288 840 208 542 -290
In the case of co-firing 50% wood pellets with CCS, the efficiency of the IGCC is still higher compared to the PC. However, the combination of 90% CO2 capture and 50% co-firing wood pellets actual increase net CO2 savings at lower percentages (see also section 3.5.5.1), hence the rise in net CO2 savings in the PC case (479 g/kWh, compared to 463 g/kWh for the IGCC). Up and downstream

Chapter 3
106
emissions are higher in the PC case, because the indirect emissions from the production of chemicals (mostly MEA) exceed the difference in indirect emissions from coal and biomass production. In total, net CO2 savings over the entire life cycle turn out to be almost equal for PC and IGCC (288 and 290 g/kWh, respectively).
Figure 3.16 presents the sensitivity of the wood pellets co-firing ratio on the most important (significant) impact categories besides climate change: human toxicity, particulate matter formation, terrestrial ecotoxicity and agricultural land occupation. The sensitivity of the co-firing ratio on human toxicity is approximately similar for the PC and IGCC, as the impact on human toxicity is dominated by the upstream emissions from coal production. Because the efficiency drop due to co-firing is comparable for the PC and IGCC cases including CCS, the change in fuel demand per kWh is equal. Consequently, the sensitivity of human toxicity to the co-firing ratio is almost identical for the PC and IGCC cases. Increasing the co-firing ratio reduces the amount of coal consumption, which is the reason for the decrease in the total impact on human toxicity.
Figure 3.16. Sensitivity of the wood pellets co-firing ratio on the impact categories human toxicity, terrestrial ecotoxicity, particulate matter formation and agricultural land occupation over the entire life cycle of the cases including CCS.
50%
70%
90%
110%
130%
150%
170%
190%
0% 5% 10% 15% 20% 25% 30% 35% 40% 45% 50%
Relative
change
in im
pact catego
ry
Wood pellets co‐firing ratio
Human toxicity (PC) Human toxicity (IGCC) Particulate matter formation (PC)Particulate matter formation (IGCC) Terrestrial ecotoxicity (PC) Terrestrial ecotoxicity (IGCC)Agricultural land occupation (PC) Agricultural land occupation (IGCC)

Comparative Life Cycle Assessment of Biomass Co-firing Plants with Carbon Capture and Storage
107
The other impact categories (particulate matter formation, terrestrial ecotoxicity and agricultural land occupation) are more sensitive to the co-firing ratio in the IGCC case. Regarding particulate matter formation, direct emissions of particulate matter, NH3 and NOx significantly contribute to the total impact. NOx emissions are assumed to be equal regardless of the co-firing ratio (to match the environmental limit). More particulate matter is formed in the PC case and an increased share of biomass decreases the amount of particulate matter emissions. Although this effect is not large enough to compensate the increase in particulate matter formation due to a larger fuel demand, it explains why the impact on particulate matter formation less rapidly increases in the PC case.
The difference in sensitivity is most visible in the category terrestrial ecotoxicity. The processes, apart from coal and wood pellets production, that significantly contribute to this category are the direct emissions of NH3 and MEA and the production of chemicals (mainly MEA), which all exclusively occur in the PC case. A higher co-firing ratio reduces the MEA consumption and MEA emissions and therefore decreases the impact on terrestrial ecotoxicity. In total, the impact on terrestrial ecotoxicity still increases with a higher share of biomass, due to the upstream processes and emissions of the production of wood pellets, but relatively much less rapidly compared to the IGCC case. The impact on agricultural land occupation is reduced when increasing the co-firing ratio, almost equally fast for the PC and IGCC cases. The slight difference is the result of the production processes of the chemicals (mainly NH3 and TiO2) which are used in the PC.
3.5.5.3. Capacity
In this paper, a net electrical output capacity of 550 MW is assumed for both power plants in all cases. This implies that when an efficiency drop is considered (due to co-firing, applying CCS or both) additional fuel is required to deliver this 550 MW. In reality, it is more likely that the fuel input of power plants is kept constant and the electrical output is decreased when co-firing and/or applying CCS. This simplification of keeping the output capacity constant is also used in other studies (Spath et al., 2004), but does not take into account issues regarding scale size increases. However, as results are presented per kWh electrical output, and infrastructure requirements for co-firing and CCS are accounted for, the effect of this assumption is assumed negligible.

Chapter 3
108
Another point which has not been assessed in this study is the potential impact of the capacity size on the performance of co-firing power plants. Co-firing biomass in large scale power plants could provide additional technological challenges (van Loo et al., 2008), e.g. drop in capacity factor (Basu et al., 2011; Dai et al., 2008). Besides, the size of the power plant influences the economic performance (Basu et al., 2011; Gan et al., 2011) and the biomass feedstock supply (Gan et al., 2011).
3.5.6. Waste allocation
In both the PC and IGCC cases, certain by-products (such as gypsum and ash in PC cases and sulphur and slag in IGCC cases) are considered to be utilized and, therefore, no waste treatment is allocated to these by-products. Besides, the increased infrastructure demanded by the more complex design of the IGCC is not accounted for due to data unavailability. Therefore, a sensitivity analysis has been performed on the allocation of waste and the infrastructure demand by creating two alternative scenarios for both the PC and IGCC are analysed (Table 3.14).
Table 3.14. Scenarios sensitivity analysis on waste allocation. Scenario Waste
landfilled Hazardous waste
Infrastructure
PC - FGD, TiO2, Reclaimer waste
Basic
PC no waste allocation - - Basic PC including by-products disposal Gypsum, ash FGD, TiO2,
Reclaimer waste Basic
IGCC - - Basic IGCC including by-products disposal
Slag1) - Basic
IGCC including by-products disposal and double infrastructure
Slag1) - Doubled
1) As a proxy, coal ash has been used in SimaPro to calculate this effect.
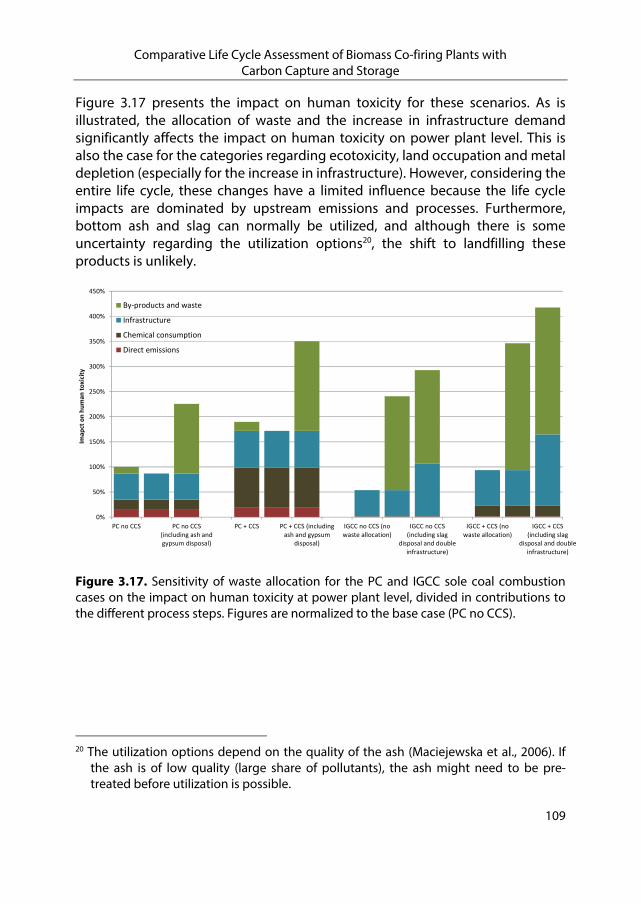
Comparative Life Cycle Assessment of Biomass Co-firing Plants with Carbon Capture and Storage
109
Figure 3.17 presents the impact on human toxicity for these scenarios. As is illustrated, the allocation of waste and the increase in infrastructure demand significantly affects the impact on human toxicity on power plant level. This is also the case for the categories regarding ecotoxicity, land occupation and metal depletion (especially for the increase in infrastructure). However, considering the entire life cycle, these changes have a limited influence because the life cycle impacts are dominated by upstream emissions and processes. Furthermore, bottom ash and slag can normally be utilized, and although there is some uncertainty regarding the utilization options20, the shift to landfilling these products is unlikely.
Figure 3.17. Sensitivity of waste allocation for the PC and IGCC sole coal combustion cases on the impact on human toxicity at power plant level, divided in contributions to the different process steps. Figures are normalized to the base case (PC no CCS).
20 The utilization options depend on the quality of the ash (Maciejewska et al., 2006). If
the ash is of low quality (large share of pollutants), the ash might need to be pre-treated before utilization is possible.
0%
50%
100%
150%
200%
250%
300%
350%
400%
450%
PC no CCS PC no CCS(including ash andgypsum disposal)
PC + CCS PC + CCS (includingash and gypsum
disposal)
IGCC no CCS (nowaste allocation)
IGCC no CCS(including slag
disposal and doubleinfrastructure)
IGCC + CCS (nowaste allocation)
IGCC + CCS(including slag
disposal and doubleinfrastructure)
Imap
ct on human
toxicity
By‐products and waste
Infrastructure
Chemical consumption
Direct emissions

Chapter 3
110
3.5.7. CO2 leakage
CO2 leakage from the reservoir has not been considered in this study. If it is assumed that a project spans over 30 years and leakage time spans 100 years, a reservoir leakage of 0.10% CO2 per year would increase the negative net emissions to zero for the case PC co-firing 30% wood with CCS. At a leakage rate of 1.23-1.28% CO2 per year the impact on climate change of PC and IGCC with CCS would be identical to their corresponding references cases without CCS.
Conclusion 3.6.
The goal of this study was two-fold. Firstly, to increase the understanding of the potential impacts of co-firing biomass on the environmental performance of CO2 capture in a coal-fired power plant, and, secondly, to assess the impacts over the life cycle of the power plant with CCS. In this study, co-firing 30%, on energy basis, wood and straw pellets has been assessed. For assessing the impact of co-firing biomass on CO2 capture performance, detailed mass balances of the most important inputs and outputs have been constructed for both a supercritical pulverized power plant (PC) and an integrated combined cycle gasification plant (IGCC).
At power plant level, co-firing biomass affects the performance of carbon capture in the PC. Positive impacts are the result of reduction of polluting emissions (SO2, Hg, and PM), reduction of chemical use (e.g. limestone and MEA) and reduction of by-products and waste streams (ash, FGD waste and reclaimer waste). Negative contributions are the result of the drop in efficiency, increased infrastructure requirements, emissions of HF and additional use of the catalyst TiO2. For the IGCC, the effects of co-firing are minimal, because the amount of emissions and chemical use of an IGCC is much smaller compared to a PC. Therefore, positive impacts from the reduction of emissions (SO2 and Hg), the amount of chemicals used and formed by-products (slag and elemental sulphur) are offset by the effect of the increased infrastructure demand and efficiency drop when applying BioCCS in the IGCC.
Life Cycle Assessment (LCA) results indicate that BioCCS considerably reduces CO2 emissions. In fact, co-firing 30% biomass combined with 90% CO2 capture results in negative net CO2 emission in the order of 67-85 g/kWh. However, while the reduction of climate change potential is substantial, BioCCS increases the environmental impact in other categories. These increases vary from 10-20% in

Comparative Life Cycle Assessment of Biomass Co-firing Plants with Carbon Capture and Storage
111
categories for which the production of biomass pellets is less harmful than the production of coal (such as human toxicity, freshwater eutrophication, water ecotoxicity and fossil depletion) up to over 200% in the categories ionising radiation and terrestrial ecotoxicity (mainly due to the electricity use of the pelletization process) and metal depletion (due to additional infrastructure demands when applying BioCCS).
A comparison at endpoint level shows that the decrease in climate change compensates the increase in other categories to such an extent, that BioCCS reduces the impact on human health by more than 80%. For the endpoint impact on ecosystems the effect is even larger, as the decrease in climate change offsets the increase in all other categories, reducing the impact on ecosystems by more than 100%. As a result, BioCCS improves the environmental performance of coal-fired power plants.
This study has also stressed limitations in data availability and uncertainties that could affect the environmental performance of BioCCS. The main limitations and uncertainties comprise:
Experimental data on the effect of co-firing biomass on the CO2 capture process.
Detailed LCI data on the construction and dismantling of an IGCC and on the use or treatment processes of by-products and waste streams.
Possible CO2 leakage from reservoir. In this study, no leakage of CO2 is assumed, and albeit this study indicated that a small amount of CO2 leakage from the reservoir has only a limited impact on the overall environmental performance of (Bio)CCS, further research is required to validate this assumption.
Land use allocation biomass residues. Currently, no land use is allocated to biomass residues. However, if land use would be allocated this could significantly impact the environmental performance allocated to co-firing biomass pellets produced from residues.
Carbon debt of biomass. The possible carbon debt that occurs from the time span between biomass production and biomass usage not taken into account in this study.
These topics contribute to the related uncertainties of the environmental performance of BioCCS. Therefore, further research on these topics is desirable as it is important to assess the sustainability of BioCCS with a high level of detail.
Chapter 3
112
Acknowledgements
This research has been carried out as part of the CATO-2-program and the FP7 PROSUITE project. CATO-2 was the Dutch national research program on CO2 Capture and Storage technology (CCS). The program was financially supported by the Dutch government (Ministry of Economic Affairs) and the CATO-2 consortium parties.
PROSUITE (2009-2013) was a European project on sustainability assessment methodology of prospective technologies. The project was funded by the European Commission under the 7th Framework Programme.
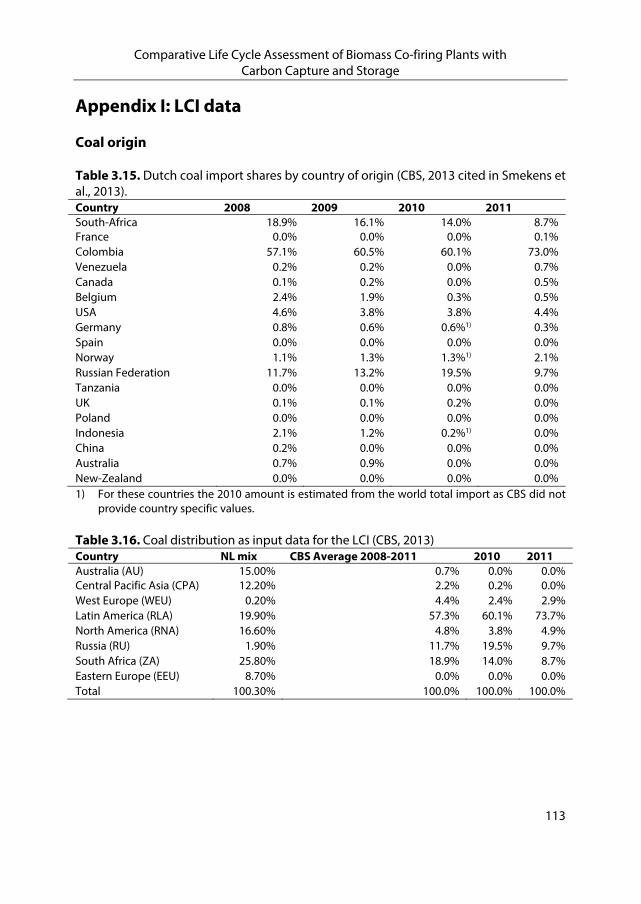
Comparative Life Cycle Assessment of Biomass Co-firing Plants with Carbon Capture and Storage
113
Appendix I: LCI data
Coal origin
Table 3.15. Dutch coal import shares by country of origin (CBS, 2013 cited in Smekens et al., 2013). Country 2008 2009 2010 2011 South-Africa 18.9% 16.1% 14.0% 8.7% France 0.0% 0.0% 0.0% 0.1% Colombia 57.1% 60.5% 60.1% 73.0% Venezuela 0.2% 0.2% 0.0% 0.7% Canada 0.1% 0.2% 0.0% 0.5% Belgium 2.4% 1.9% 0.3% 0.5% USA 4.6% 3.8% 3.8% 4.4% Germany 0.8% 0.6% 0.6%1) 0.3% Spain 0.0% 0.0% 0.0% 0.0% Norway 1.1% 1.3% 1.3%1) 2.1% Russian Federation 11.7% 13.2% 19.5% 9.7% Tanzania 0.0% 0.0% 0.0% 0.0% UK 0.1% 0.1% 0.2% 0.0% Poland 0.0% 0.0% 0.0% 0.0% Indonesia 2.1% 1.2% 0.2%1) 0.0% China 0.2% 0.0% 0.0% 0.0% Australia 0.7% 0.9% 0.0% 0.0% New-Zealand 0.0% 0.0% 0.0% 0.0% 1) For these countries the 2010 amount is estimated from the world total import as CBS did not
provide country specific values.
Table 3.16. Coal distribution as input data for the LCI (CBS, 2013) Country NL mix CBS Average 2008-2011 2010 2011 Australia (AU) 15.00% 0.7% 0.0% 0.0% Central Pacific Asia (CPA) 12.20% 2.2% 0.2% 0.0% West Europe (WEU) 0.20% 4.4% 2.4% 2.9% Latin America (RLA) 19.90% 57.3% 60.1% 73.7% North America (RNA) 16.60% 4.8% 3.8% 4.9% Russia (RU) 1.90% 11.7% 19.5% 9.7% South Africa (ZA) 25.80% 18.9% 14.0% 8.7% Eastern Europe (EEU) 8.70% 0.0% 0.0% 0.0% Total 100.30% 100.0% 100.0% 100.0%

Chapter 3
114
Table 3.17. Share open cast mining and underground mining Dutch coal mix in 2011 (Ecoinvent, 2010). Country Share 2011 (CBS, 2013) Open Cast Mining Underground Mining Latin America (RLA) 73.7 % 100 % 0 % Russia (RU) 9.7 % 33 % 67 % South Africa (ZA) 8.7 % 50 % 50 % North America (RNA) 4.9 % 58 % 42 % West Europe (WEU) 2.9 % 0 % 100 % Total 100.0 % 84 % 16 %
Biomass production
Table 3.18. LCI data for residual hard wood (Ecoinvent, 2010). LCI data for 1 m3 residual hard wood, under bark, at forest road
Inputs from technology Diesel, burned in building machine (MJ) 17.35 Hardwood, stand establishment/tending/site development, under bark (m3)
0.382
Hardwood, standing, under bark, in forest 0.382 Power sawing, without catalytic converter (hr.) 0.05656 Hardwood, allocation correction, 1 (m3) 0.694
Trailer, production (kg) 0.8765
Table 3.19. LCI data for wood pellets delivered at power plant (Ecoinvent, 2010). LCI data for 1 m3 wood pellets
Inputs from technology Electricity, medium voltage, production UCTE, at grid (kWh) 164 Residual Hardwood (m3) (see Table 3.18) 1.285 Transport, freight, rail (tkm) 71.5 Transport, lorry > 1t, fleet average (tkm) 35.8 Wood pellet manufacturing, infrastructure (p) 1 E-8
Transport, transoceanic freight ship (tkm) 7.2 E3
Emissions to air
Heat, waste (MJ) 591

Comparative Life Cycle Assessment of Biomass Co-firing Plants with Carbon Capture and Storage
115
Table 3.20. LCI data for straw pellets delivered at power plant (Ecoinvent, 2010; Hamelin et al., 2012). LCI data for 1 m3 straw pellets
Inputs from nature Occupation, arable (ha a) 0.015
Inputs from technology
Electricity, medium voltage, production UCTE, at grid (kWh) 164 Combine harvesting/CH (ha) 0.015 Baling/CH (p) 0.094875 Loading bales/CH (p) 0.4125 Transport, freight, rail (tkm) 71.5 Transport, lorry > 1t, fleet average (tkm) 35.8 Wood pellet manufacturing, infrastructure (p) 1 E-8
Transport, transoceanic freight ship (tkm) 7.2 E3
Emissions to air
Heat, waste (MJ) 591
Carbon Capture
Table 3.21. LCI data for CO2 capture infrastructure (Koornneef et al., 2008). Material/Process AmountSteel (absorber + stripper) (t) 235 Steel (piping and small equipment) (t) 82 Concrete (m3) 1 Transport (kt km) 9.5 Lifetime (yr.) 30 Total CO2 captured over lifetime (Mt) 94
Table 3.22. LCI data for production of Selexol. Selexol production Value Source
Inputs from nature
Water, cooling, unspecified natural origin (m3) 0.025 Own estimation
Inputs from technology
Ethylene oxide, at plant/RER (kg) 0.75 IEAGHG, 2006 Methanol, at plant/GLO (kg) 0.20 IEAGHG, 2006 Water, decarbonised, at plant/RER (kg) 0.05 IEAGHG, 2006 Natural gas, at long-distance pipeline/RER (m3) 0.05 IEAGHG, 2006 Steam, for chemical processes, at plant/RER (kg) 0.5 Own estimation Electricity mix/NL (kWh) 0.3 IEAGHG, 2006
Emissions to air
Ethylene oxide (kg) 1.0 E-4 IEAGHG, 2006 Methanol (kg) 1.0 E-4 IEAGHG, 2006

Chapter 3
116
Table 3.23. LCI data for production of monoethanolamine (Ecoinvent, 2010). LCI data for 1 kg MEA production
Inputs from nature
Water, cooling, unspecified natural origin (m3) 0.024 Water, unspecified natural origin (m3) 0.00082
Inputs from technology
Ammonia, liquid, at regional storehouse/RER (kg) 0.788 Electricity, medium voltage, production UCTE, at grid/UCTE (kWh) 0.333 Heat, natural gas, at industrial furnace > 100kW/Rer (MJ) 2 Chemical plant, organics/RER/I (p) 4 E-10
Transport, freight, rail/RER (tkm) 0.963 Transport, lorry > 16t, fleet average/RER U (tkm) 0.16 Ethylene oxide, at plant/RER U (kg) 0.7344
Emissions to air
Heat, waste (MJ) 1.2 Carbon dioxide, fossil (kg) 0.0265 Ethylene oxide (kg) 0.00163 Ammonia (kg) 0.00158
Emissions to water
BOD5, Biological Oxygen Demand (kg) 0.0213 COD, Chemical Oxygen Demand (kg) 0.0213 DOC, Dissolved Organic Carbon (kg) 0.00802 TOC, Total Organic Carbon (kg) 0.00802 Ethylene oxide (kg) 0.00147 Ammonium, ion 0.00304 Nitrate (kg) 0.00697

117
Impact of fuel selection on the environmental 4.performance of post-combustion calcium looping applied to a cement plant
Wouter Schakel, Christine Hung, Lars-Andre Tokheim, Anders Strømman, Ernst
Worrell, Andrea Ramírez Submitted for publication: Applied Energy (2017)
Abstract
Calcium looping CO2 capture is a promising technology to reduce CO2 emissions from cement production. Coal has been seen as a logical choice of fuel to drive the calcium looping process as coal is already the primary fuel used to produce cement. This study assesses the impact of using different fuels, namely coal, natural gas, woody biomass and a fuel mix (50% coal, 25% biomass and 25% animal meal), on the environmental performance of tail-end calcium looping applied to the clinker production at a cement plant in North-western Europe. Process modelling was applied to determine the impact of the different fuels on the mass and energy balance of the process which were subsequently used to carry out a life cycle assessment to evaluate the environmental performance of the different systems. Using natural gas, biomass or a fuel mix instead of coal in a tail-end calcium looping process can improve the efficiency of the process, as it decreases fuel, limestone and electricity consumption. Consequently, while coal-fired calcium looping can reduce the global warming potential (life cycle CO2 emissions) of clinker production by 75%, the use of natural gas further decreases these emissions (reduction of 86%) and biomass use could results in an almost carbon neutral (reduction of 95% in the fuel mix case) or net negative process (-104% reduction in the biomass case). Furthermore, replacing coal with natural gas or biomass reduces most other environmental impact categories as well, mostly due to avoided impacts from coal production. The level of improvement strongly depends on whether spent sorbent can be utilized in clinker production, and to what extent sequestered biogenic CO2 can reduce global warming potential. Overall, the results illustrate the potential of using alternative fuels to improve the environmental performance of tail-end calcium looping in the cement industry.
Chapter 4
118
Introduction 4.1.
Carbon capture and storage (CCS) is an important technology to reduce greenhouse gas (GHG) emissions and mitigate climate change, and is considered essential in limiting the global temperature increase to 2 °C (European Commission, 2016; Global CCS Institute, 2015; IEA, 2015b; IPCC, 2014). Although CCS is often associated with power plants, CCS is essential to achieve deep CO2 emission reductions in industry as the effects of alternative climate change mitigation options (e.g. energy efficiency improvement and the use of renewable fuels) are limited (IEA, 2015a; ZEP, 2015).
Global cement production accounts for about 1.4 Gt of CO2 emissions per year (Zhu, 2011), corresponding to roughly 5.8 % of global anthropogenic emissions (Boden, et al., 2017). Established measures, such as improving energy efficiency, using alternative raw materials and/or fuels, and reducing the clinker to cement ratio, are increasingly being used to lower CO2 emissions from cement production (Tokheim et al., 2007). However, these measures are expected to reduce the CO2 emissions of cement production by only 20-25% by 2050 (Hills et al., 2016). Deployment of CCS is thus necessary to achieve deeper emission reductions in the cement industry (IEAGHG, 2013). The main component of cement is clinker (usually over 90%), and clinker production is also the most energy- and CO2 intensive process in cement manufacturing. Therefore, capturing the CO2 emissions from clinker production is generally the point of focus when considering CCS in the cement industry.
Post-combustion CO2 capture and oxy-fuel combustion are the preferred technologies for CO2 capture in clinker production, as pre-combustion capture cannot capture the CO2 from the calcination process (IEAGHG, 2013). Calcium looping is considered an especially favourable CO2 capture technology for the cement industry, as cement plants already have experience with solids handling, have limestone handling infrastructure in place, and can potentially utilize the resulting spent solids in the cement production process (Arias et al., 2017; Martínez et al., 2016; Romano et al., 2013; Telesca et al., 2015). Calcium looping CO2 capture can be applied at the tail-end of the clinker production process (post-combustion capture) or integrated with the calcination process. Integration of the calcium looping process with clinker production has been shown to be more efficient (Ozcan et al., 2013; Perejón et al., 2016). However, tail-end calcium looping can still be a valid retrofitting option for existing plants (Atsonios et al., 2015).

Impact of fuel selection on the environmental performance of post-combustion calcium looping applied to a cement plant
119
Traditionally, coal is used in the production of cement due to its high heating value, homogeneous composition, favourable radiative heat transfer characteristics, and relatively low costs. Although an increasing amount of cement plants has started to co-fire less carbon intensive fuels, such as waste streams and biomass to reduce CO2 emissions, coal is still the most dominant fuel used in cement production (IEAGHG, 2013). Consequently, coal is generally selected as the fuel to also cover the heat demand of the calcium looping CO2 capture processes. However, additional coal consumption can have significant repercussions for the environmental footprint of a cement plant as emissions associated with coal production and transport are reported to dominate the life cycle impact of calcium looping (Hurst et al., 2012).
Other fuels than coal, e.g., natural gas or biomass, could also be used to deliver the heat demand of calcium looping. The performance of using natural gas for calcium looping has been studied for natural gas fired power plants (Berstad et al., 2012; Cormos, 2015) and natural gas fired industrial processes (Connell et al., 2013; Martinez et al., 2014). Besides, the feasibility to apply calcium looping to biomass fired power plants has been analysed (Diego et al., 2016). To date, no publicly available literature addresses the environmental performance of other fuels driving the calcium looping CO2 capture process at a cement plant. The required additional fuel input to drive tail-end calcium looping is in the same order of magnitude as the required fuel input for clinker production. Therefore, additional investments will be needed in clinker plants to increase fuel handling capacity, regardless of the type of fuel that is considered, and coal does not need to be selected as the fuel driving the calcium looping in the decision making process.
The possibility of using alternative fuels than coal for calcium looping can be interesting as environmental repercussions associated with coal production can be avoided. The goal of this study is to investigate whether, and if so by how much, using fuels with low carbon intensity might provide a low-hanging fruit to improve the environmental performance of calcium looping in cement plants.

Chapter 4
120
Methodology 4.2.
4.2.1. General approach
The environmental performance of tail-end calcium looping applied to a cement plant was studied by conducting a life cycle assessment (LCA). A technical assessment (see Section 4.2.3) was carried out by developing a preliminary process model for a tail-end calcium looping process for the different fuels under study. The mass and energy balance results from the process modeling together with input data of up- and downstream processes (e.g., fuel production and transport and CO2 transport and storage) were the main basis to carry out the LCA to assess the environmental performance of the different cases (see Section 4.2.4), see Figure 4.1.
Figure 4.1. Schematic overview of general approach.
4.2.2. System Boundaries
The clinker production characteristics used in this study were based on a clinker production process at a real cement plant located in North-western Europe, producing 1 million tonnes of clinker. Due to data confidentiality, the used clinker production characteristics are presented as a generic case. The clinker production process uses a mixture of ground limestone and additives (e.g. as quartzite, iron ore and bauxite), which is dried, ground and fed into a kiln to decarbonize the limestone in this mixture (CaCO3 CaO + CO2). The energy required for this endothermic process is provided by burning a fuel mixture containing coal and various types of (biogenic) waste. The fuel mixture used in the clinker production process is presented in Table 4.1. The major fuel input is
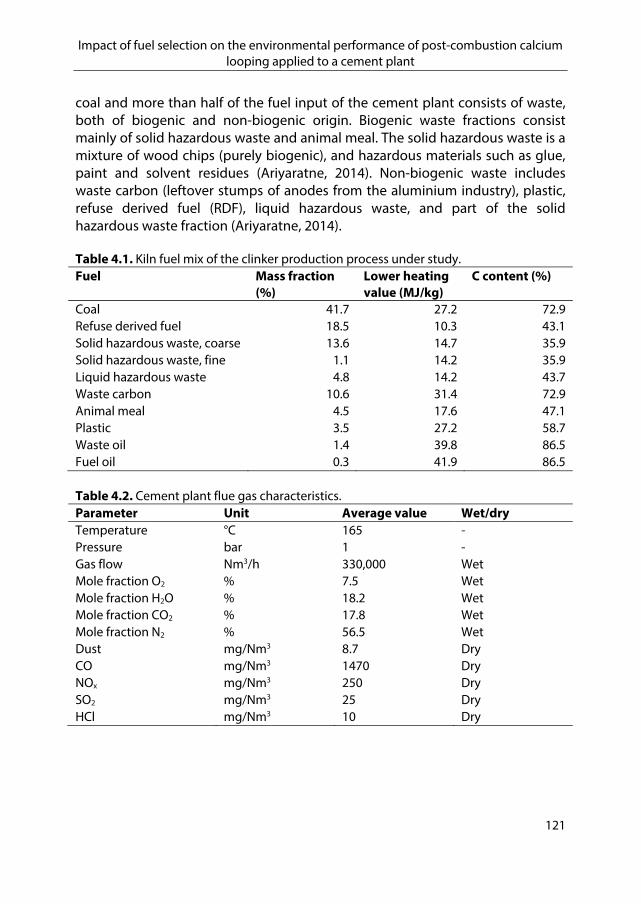
Impact of fuel selection on the environmental performance of post-combustion calcium looping applied to a cement plant
121
coal and more than half of the fuel input of the cement plant consists of waste, both of biogenic and non-biogenic origin. Biogenic waste fractions consist mainly of solid hazardous waste and animal meal. The solid hazardous waste is a mixture of wood chips (purely biogenic), and hazardous materials such as glue, paint and solvent residues (Ariyaratne, 2014). Non-biogenic waste includes waste carbon (leftover stumps of anodes from the aluminium industry), plastic, refuse derived fuel (RDF), liquid hazardous waste, and part of the solid hazardous waste fraction (Ariyaratne, 2014).
Table 4.1. Kiln fuel mix of the clinker production process under study. Fuel Mass fraction
(%) Lower heating value (MJ/kg)
C content (%)
Coal 41.7 27.2 72.9 Refuse derived fuel 18.5 10.3 43.1 Solid hazardous waste, coarse 13.6 14.7 35.9 Solid hazardous waste, fine 1.1 14.2 35.9 Liquid hazardous waste 4.8 14.2 43.7 Waste carbon 10.6 31.4 72.9 Animal meal 4.5 17.6 47.1 Plastic 3.5 27.2 58.7 Waste oil 1.4 39.8 86.5 Fuel oil 0.3 41.9 86.5
Table 4.2. Cement plant flue gas characteristics. Parameter Unit Average value Wet/dry Temperature °C 165 -Pressure bar 1 -Gas flow Nm3/h 330,000 WetMole fraction O2 % 7.5 WetMole fraction H2O % 18.2 WetMole fraction CO2 % 17.8 WetMole fraction N2 % 56.5 WetDust mg/Nm3 8.7 DryCO mg/Nm3 1470 DryNOx mg/Nm3 250 DrySO2 mg/Nm3 25 DryHCl mg/Nm3 10 Dry

Chapter 4
122
During clinker production, a total of 850,000 tonnes CO2 are emitted per year. These emissions include CO2 formed from calcination of the limestone, and CO2 formed from fuel combustion. Key characteristics of the flue gas of the cement plant are presented in Table 4.2. Tail-end calcium looping CO2 capture is applied to reduce CO2 emissions from the clinker production by 85%.
Figure 4.2 schematically presents the process diagram used in this study. The coloured area represents the CO2 capture processes that are targeted in the technical process modelling. The flue gas from the clinker production is fed into a calcium looping consisting of a carbonator and a calciner. Fuel is burned in the calciner to produce the heat needed for decarbonizing the limestone via oxyfuel combustion, to generate a high-purity CO2 stream. The required oxygen for this process is produced by an air separation unit. The captured CO2 is compressed before transport and storage. The CaO reacts with the CO2 in the flue gas in the carbonator, and the produced CaCO3 is recycled back to the calciner. A small purge containing (spent) sorbents is extracted from the calciner to ensure continuous operation. The large amount of available waste heat is utilized for power production via a steam cycle. The design specifications and assumptions of the technical process modelling are presented in section 4.2.3.
Figure 4.2. Simplified flowsheet of the different systems assessed within the boundaries of this study. The coloured area represents the CO2 capture processes which are included in the technical assessment.
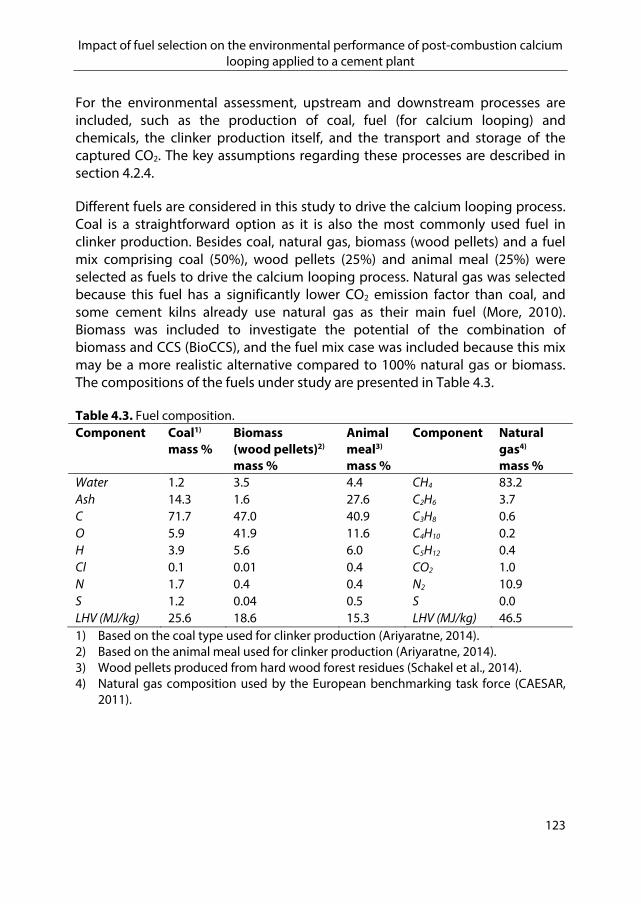
Impact of fuel selection on the environmental performance of post-combustion calcium looping applied to a cement plant
123
For the environmental assessment, upstream and downstream processes are included, such as the production of coal, fuel (for calcium looping) and chemicals, the clinker production itself, and the transport and storage of the captured CO2. The key assumptions regarding these processes are described in section 4.2.4.
Different fuels are considered in this study to drive the calcium looping process. Coal is a straightforward option as it is also the most commonly used fuel in clinker production. Besides coal, natural gas, biomass (wood pellets) and a fuel mix comprising coal (50%), wood pellets (25%) and animal meal (25%) were selected as fuels to drive the calcium looping process. Natural gas was selected because this fuel has a significantly lower CO2 emission factor than coal, and some cement kilns already use natural gas as their main fuel (More, 2010). Biomass was included to investigate the potential of the combination of biomass and CCS (BioCCS), and the fuel mix case was included because this mix may be a more realistic alternative compared to 100% natural gas or biomass. The compositions of the fuels under study are presented in Table 4.3.
Table 4.3. Fuel composition. Component Coal1)
mass % Biomass (wood pellets)2) mass %
Animal meal3)
mass %
Component Natural gas4)
mass % Water 1.2 3.5 4.4 CH4 83.2 Ash 14.3 1.6 27.6 C2H6 3.7 C 71.7 47.0 40.9 C3H8 0.6 O 5.9 41.9 11.6 C4H10 0.2 H 3.9 5.6 6.0 C5H12 0.4 Cl 0.1 0.01 0.4 CO2 1.0 N 1.7 0.4 0.4 N2 10.9 S 1.2 0.04 0.5 S 0.0 LHV (MJ/kg) 25.6 18.6 15.3 LHV (MJ/kg) 46.5 1) Based on the coal type used for clinker production (Ariyaratne, 2014). 2) Based on the animal meal used for clinker production (Ariyaratne, 2014). 3) Wood pellets produced from hard wood forest residues (Schakel et al., 2014). 4) Natural gas composition used by the European benchmarking task force (CAESAR,
2011).

Chapter 4
124
4.2.3. Technical assessment
4.2.3.1. Method selection
The purpose of the technical assessment was to generate the mass and energy balances required for carrying out the environmental assessment and not to build a detailed process model taking into account all the complexities of the process. Therefore, a process model with low degree of resolution was considered sufficient for carrying out this study. As a result, the calcium looping process was not optimised or integrated with the cement plant providing a conservative scenario. Aspen Plus software (Aspentech, 2016) was used to carry out the technical modelling. The Peng-Robinson equation of state was selected as the thermodynamic model.
4.2.3.2. Process conditions
Figure 4.3 presents a simplified flow diagram of the processes included in the technical modelling: an air separation unit, calcium looping, electricity production and CO2 compression. The air separation was not modelled in Aspen Plus, but state of the art specifications obtained from literature were used, i.e., a specific energy demand of 180 kWh/t O2 and an O2 purity of 95% (Dickmeis et al., 2014; Van der Spek et al., 2017).
Figure 4.3. Simplified process flow diagram of the calcium looping process.
CarbonatorCalciner
Fuel
O2
CaCO3
Flue gas
Flue gas
Limestone
CO2 rich gas
CaOCaO
Purge (spent sorbent)
Electricity production
via steam cycle
CO2 purification and compression
Q1
Q2Q3
CO2
Electricity
Air Seperation Unit (ASU)
Air
N2
CO2 transport and storage
Clinker production
Fuel
Limestone
Electricity

Impact of fuel selection on the environmental performance of post-combustion calcium looping applied to a cement plant
125
The calcium looping process includes a carbonator and a calciner. In the calciner, the fuel is burned with oxygen, and the limestone (CaCO3) is calcined into CaO. The CaO is used to capture the CO2 from the flue gas of the cement plant in the carbonator. The selected process conditions for the technical modelling are presented in Table 4.4. The calciner and carbonator were modelled using a Gibbs free energy reactor in Aspen Plus. The maximum conversion of limestone into CaO in the calciner was set at 100%, as the high operating temperature makes complete calcination feasible. The maximum conversion of CaO to CaCO3 in the carbonator was set at 20%. This value is in line with values reported by experimental tests (Arias et al., 2017; Charitos et al., 2011; Duelli Varela et al., 2015), although reported conversion rates of modelling studies are typically higher (Ozcan et al., 2013).
Table 4.4. Selected process conditions of the calcium looping process. Parameter Range in
literature Value in this study
Calciner operating temperature (°C) 800-930 °C1)2)3)4) 900 °C1)
Carbonator operating temperature (°C)
620-725 °C1)2)3)4) 650 °C1)
Carbonator capture efficiency5) 90%1)2) 85%Carbonator sorbent conversion6) 9-57%1)2) 4) 20%7)
Purge ratio8) 0.5-2% 9)
2.5% for coal and fuel mix cases 1% for biomass case and 0.5 % for natural gas case
1) (Atsonios et al., 2015). 5) (Ozcan et al., 2013). 3) (Arias et al., 2017). 4) (Duelli Varela et al., 2015). 5) The percentage of CO2 captured from the flue gas in the carbonator. Net amount of
captured CO2 is higher as this includes the CO2 formed during fuel combustion. 6) Maximum conversion of CaO into CaCO3 in carbonator. 7) This value is set for all cases as a conservative estimate within the range reported in
literature (Atsonios et al., 2015; Duelli Varela et al., 2015; Ozcan et al., 2013). 8) The amount of sorbent purged from the system per cycle. 9) Reported ranges of coal based calcium looping processes (Atsonios et al., 2015).
The limestone sorbent activity degrades over time as repeated cycles cause sintering and thermal deactivation, and pollute the sorbent with e.g. ash and CaSO4 (Diego et al., 2013; Erans et al., 2016; Telesca et al., 2015). The degradation caused by the formation of CaSO4 (CaO sulphation) is considered to be a key aspect in the sorbent deactivation (Blamey et al., 2010; Coppola et al., 2012;

Chapter 4
126
Cordero et al., 2015). A periodic replacement is required to compensate the sorbent deactivation. This was modelled using a simple approach in which a purge extracting a small amount of the (spent) sorbent in every cycle is applied.
Sorbent deactivation is especially present in the cases that use coal, due to the CaO sulphation resulting from the high sulphur content of the coal. Therefore, the purge ratio for the coal and fuel mix cases was set to 2.5%, which is a conservative estimate compared to values reported in similar modelling studies (Atsonios et al., 2015). The need for purging in the natural gas and biomass cases can be decreased, as levels of sulphur and ash are much lower compared to the coal-fired cases. The purge ratio for the natural gas case was set to 0.5%. The use of biomass can lead to additional sorbent deactivation due to the reaction with alkali components of the biomass (e.g. Zhao et al., 2017). The levels of alkali components are, however, much lower than the levels of sulphur and ash. The additional sorbent deactivation is therefore considered to be minor compared to the sorbent deactivation caused by CaO sulphation. The purge level of the biomass case was assumed to be 1.0%, which is higher than the natural gas case but lower than the coal and fuel mix cases due to the substantially lower amounts of ash and sulphur content.
The limestone sorbent activity degrades over time as repeated cycles cause sintering and thermal deactivation, and pollute the sorbent with e.g. ash and CaSO4
21 (Diego et al., 2013; Erans et al., 2016; Telesca et al., 2015). The degradation caused by the formation of CaSO4 (CaO sulphation) is considered to be a key aspect in the sorbent deactivation (Blamey et al., 2010; Coppola et al., 2012; Cordero et al., 2015). A periodic replacement is required to compensate the sorbent deactivation. This was modelled using a simple approach in which a purge extracting a small amount of the (spent) sorbent in every cycle is applied. Sorbent deactivation is especially present in the cases that use coal, due to the CaO sulphation resulting from the high sulphur content of the coal. Therefore, the purge ratio for the coal and fuel mix cases was set to 2.5%, which is a conservative estimate compared to values reported in similar modelling studies (Atsonios et al., 2015). The need for purging in the natural gas and biomass cases can be decreased, as levels of sulphur and ash are much lower compared to the coal-fired cases. The purge ratio for the natural gas case was set to 0.5%. The use of biomass can lead to additional sorbent deactivation due to the reaction with alkali components of the biomass (e.g. Zhao et al., 2017). The levels of alkali
21 CaO easily reacts with sulphur components (sulphation) to form CaSO4.

Impact of fuel selection on the environmental performance of post-combustion calcium looping applied to a cement plant
127
components are, however, much lower than the levels of sulphur and ash. The additional sorbent deactivation is therefore considered to be minor compared to the sorbent deactivation caused by CaO sulphation. The purge level of the biomass case was assumed to be 1.0%, which is higher than the natural gas case but lower than the coal and fuel mix cases due to the substantially lower amounts of ash and sulphur content.
Because both the calciner and carbonator operate at high temperatures, a substantial amount of waste heat is available from the carbonator (exothermic process) and the streams exiting the reactors (CO2 and flue gas). This heat is utilized in a subcritical steam cycle for electricity production. The remaining (low temperature) waste heat is not utilized. The captured CO2 compressed to 110 bar to match conditions suitable for transport and storage. The compression train consists of five compressor steps to increase the pressure to 85 bar and a pump for the final compression step to 110 bar. Between every compression step, the CO2 is cooled down and water is removed in knock-out vessels.
4.2.4. Environmental assessment
4.2.4.1. Life cycle assessment
A life cycle assessment (LCA) was performed for a reference case without CO2 capture and for the four tail-end calcium looping CO2 capture cases: coal, natural gas, biomass and mix. The life cycle inventory (LCI) included the outputs of the technical simulation and data from the ecoinvent 3.2 database (Wernet et al., 2016). The functional unit used in this study is the production of 1 kg clinker.
The full inventory, including input and emission factors and detailed assumptions, is provided in supplementary data of the published version of this chapter (to be published). This section contains a brief description of the LCI modelling of the system. The clinker production facility was assumed to have a 25 year lifetime and operation of 7000 hours per year. The fuel mix used in the clinker production (see Table 4.1) comprised coal, fuel oil and waste (both biogenic and non-biogenic). The coal and fuel oil were modelled using ecoinvent processes. The fuel fractions derived from waste products (i.e., RDF, hazardous waste, animal meal and plastic) are assumed to be “free” of upstream environmental impacts following existing LCA guidelines on waste use. Transport of these fuels to the cement plant, however, was included and

Chapter 4
128
estimated to be 10 km22, which is the average transport distance for municipal solid waste in ecoinvent. Animal meal was considered to be 100% biogenic while 50% of the solid hazardous waste fraction was assumed to comprise of wood chips. The upstream impacts of biomass residues (wood chips) include impacts from harvesting and collection processes.
The energy requirements for clinker production23 were estimated from a technology description in IEA (IEA, 2010). The raw meal was assumed to consist of limestone (84.9 wt%), quartzite (11.2 wt%), bauxite (1.3 wt%) and iron ore (2.6 wt%). Further raw meal additives were not modelled. In addition, ammonia was used in selective non-catalytic reduction of NOx emissions and lime slurry used in a gas suspension absorber technology applied for SOx control.
The results from the technical simulation used for the LCI comprise details of the mass and energy balance of the calcium looping process for the different cases. These outputs include fuel and limestone consumption, direct emissions, electricity balance including both production and consumption, cooling water consumption, and the amount of wastewater and purge of spent sorbent. The coal and natural gas fuels used in the calcium looping process were modelled using the Western European market mixes, as described in ecoinvent. The hardwood pellets were modelled using the ecoinvent process for wood pellets, modified to receive only hardwood chips as the biomass input. The animal meal used in the fuel mix case was modelled similar to the waste products used in the clinker production kiln fuel mix (considered “free” of upstream environmental impacts, only transport was accounted for). The fly ash produced during the calcium looping process was assumed to be recycled in cement production, and potential environmental impacts for fly ash treatment or utilization were not included. Produced electricity was consumed to replace grid electricity (see also section 4.2.4.4). The ecoinvent medium voltage Dutch market electricity, (i.e., the Dutch consumption mix) was selected as proxy for North-western European electricity for both the electricity consumption and production of the process. The compressed CO2 (110 bar) is transported via pipeline and stored 95 km offshore in a 1000 m deep offshore well. Fugitive emissions during transport are assumed to be 0.6 wt% of the total gas transported.
22 Based on the average transport distance for municipal solid waste in the Netherlands
in ecoinvent (2016). 23 These include raw material grinding, homogenization, extraction and blending,
conveying, packing and loading, and clinker production itself.

Impact of fuel selection on the environmental performance of post-combustion calcium looping applied to a cement plant
129
Environmental impacts over eight impact categories24 were evaluated using the ReCiPe 1.11 impact characterization method (ReCiPe, 2012). These impact categories were selected given their relevance to the system, and the quality of the characterization method (Hauschild et al., 2013; Van Den Heede et al., 2012).
4.2.4.2. Biogenic CO2
In the majority of published carbon footprints and life cycle assessments that include biomass, the biomass is considered to be carbon neutral, and therefore the CO2 emissions from biomass combustion do not contribute to climate change. However, it is increasingly recognized that this assumption may be incorrect due to the temporal mismatch between carbon uptake in biomass and its emission, as well as other climate-related effects arising from biomass harvesting (Bentsen, 2017; Cherubini et al., 2016; Johnson, 2009; Lamers et al., 2013). The mismatch between carbon uptake and its emission, the so-called carbon debt, strongly depends on the type and amount of biomass harvested, and whether land-use change is accounted for (Lamers et al., 2013). Generally, the use of short-rotation biomass (fast growing crops) is accompanied by a lower carbon debt than the use of long-rotation biomass (forest biomass). For forest biomass, carbon payback times up to 200 years have been reported (Bentsen, 2017; Lamers et al., 2013).
In this study, the wood pellets used in the biomass and fuel mix cases are considered to be produced from forest residues (Schakel et al., 2014). The relatively long rotation period of this biomass requires accounting for the carbon debt in the global warming potential (GWP) of the CO2 that is formed by biomass combustion. Guest et al., (2013) report GWP characterization factors of 0.44-0.61 kg CO2 eq./kg CO2 emitted for Norwegian long-rotation woody biomass assuming a 100 year time horizon, depending on whether changes in albedo are accounted for. In this study, the average global CO2 GWP factor for biomass from forest residues of 0.49 kg CO2 eq./kg CO2 emitted was used, assuming a 100 year time horizon and 50% residue extraction (Cherubini et al., 2016). For sequestered CO2, the corresponding GWP factor used was -0.51 kg CO2 eq./kg CO2 sequestered.
24 Global warming potential (GWP), water depletion potential (WDP), fossil depletion potential (FDP), freshwater eutrophication potential (FEP), human toxicity potential (HTP), particulate matter formation (PMF), photochemical oxidant formation (POF), and terrestrial acidification potential (TAP).

Chapter 4
130
For biomass with a rotation period of about one year, GWP characterization factors of 0 kg CO2 eq./kg CO2 emitted and -1 kg CO2 eq./kg CO2 sequestered are reported when a 100 year time horizon is assumed (Guest et al., 2013). Therefore, these values have been adopted for the CO2 originating from the short-rotation biomass (i.e., animal meal) used for clinker. A sensitivity analysis on the GWP characterization factors was performed to assess the impact of the assumptions (see section 4.3.3).
4.2.4.3. Purge of spent sorbent
The spent sorbent (purge) of the calcium looping system could potentially be utilized to replace limestone in the clinker production process (Telesca et al., 2015). The feasibility of using the spent sorbent in clinker production mainly depends on the composition of the purge, especially the sulphur (CaSO4) content. The amount of sulphur that can be added to the clinker production is restricted, as high levels of sulphur compromise clinker quality. Therefore, the potential of utilizing a purge with high sulphur content is limited. In this study, the potential gains of using the purge to replace limestone in the cement production process are not included, thus providing a conservative estimate. Therefore, a sensitivity analysis is performed to determine how potential utilization of the purge stream in clinker production can affect the results (section 4.3.4).
4.2.4.4. Co-production of electricity
The waste heat of the calcium looping process was utilized for the production of electricity. As a result, electricity is added as a co-product of the cement plant. There are several approaches to deal with the multi-functionality of systems in LCA, namely, allocation by partitioning, “classic” system expansion, “alternate activity” substitution and “product” substitution (Majeau-Bettez et al., 2017).
In this study, the alternate activity substitution approach is adopted, where the complete amount of produced electricity in the calcium looping process was assumed to substitute electricity from the grid. The emissions and impacts associated with this electricity were assumed to be avoided and deducted from the total emissions and impacts in the calcium looping cases. By doing so, contributions from the different processes within the calcium looping process are clearly distinguished.

Impact of fuel selection on the environmental performance of post-combustion calcium looping applied to a cement plant
131
Results 4.3.
A technical assessment and LCA was carried out to assess the environmental performance of tail-end calcium looping. The main objective of the technical assessment was to provide input to the life cycle assessment inventory for the environmental assessment. Nevertheless, the technical performance results also provide insights in the effect of fuel changes in the tail-end calcium looping process. Both the technical and environmental performance results are presented and discussed in this section.
Table 4.5 presents the main performance indicators of the tail-end calcium looping process modelling for the different cases. The circulating lime molar ratio Fr/FCO2 (kmol CaO in circulating solids/kmol CO2 in flue gas) is equal in all cases, as the maximum carbonator efficiency was kept constant for all cases. The fresh lime ratio F0/FCO2 (kmol CaCO3 in fresh limestone make up/kmol CO2 in flue gas) and consequently the fresh limestone consumption are, however, substantially reduced in the natural gas and biomass cases due to the lower purge ratio. The oxygen consumption is also reduced, especially in the biomass case, as the biomass selected in this study has a relatively high oxygen content compared to the other fuels (see Table 4.3). The reduction in oxygen consumption lowers the calciner duty, and consequently the fuel use (MJ/kg clinker) is reduced in the biomass case by 15% compared to coal. Fly ash is produced in the calciner in the coal case and in the fuel mix case due to the ash content of coal and animal meal. Replacing coal with the fuel mix does not substantially improve the calcium looping performance, firstly because the biomass used in the fuel mix (animal meal) has a lower heating value compared to the wood pellets used in the biomass case, and secondy because the purge ratio is equal to the coal case. However, the use of fuel mix instead of coal does reduce the CaSO4 content of the spent sorbent.
The tail-end calcium looping process captures CO2 from the flue gas from clinker production, but also co-captures all CO2 formed in the calciner by fuel combustion and limestone calcination. As the CO2 reduction target was set at 85%, the CO2 captured from the flue gas is equal in all cases (0.74 kg/kg clinker). Note that the amount of co-captured CO2 is substantial, almost approaching the amount of CO2 from the flue gas of clinker production in the coal case (0.69 kg/kg clinker) and the fuel mix case (0.65 kg/kg clinker). In the natural gas and biomass cases, the reduced limestone consumption lowers the CO2 formed by the limestone calcination, and less CO2 is formed by fuel combustion due to reduced fuel consumption and lower carbon intensity of the fuels (compared to

Chapter 4
132
coal). As a result, the amount of co-captured CO2 is substantially lower in the natural gas case and biomass cases, namely 0.34 kg/kg clinker and 0.49 kg/kg clinker, respectively. Overall, replacing coal with natural gas, biomass or the fuel mix decreases the total amount of CO2 captured by 25%, 14% and 3%, respectively.
Table 4.5. Mass and energy balance of tail-end calcium looping process. Coal Natural
gas Biomass Fuel
mix
Calcium looping performance F0/FCO2
1) 0.11 0.02 0.04 0.11 Fr/FCO2
2) 4.25 4.25 4.25 4.25 Fuel consumption (MJ/kg clinker) 5.82 5.69 4.95 5.60 Limestone consumption (kg/kg clinker) 0.22 0.04 0.09 0.22 Oxygen consumption (kg/kg clinker) 0.49 0.43 0.34 0.46 Fly ash production (g/kg clinker) 27 0 4 31 Purge (CaO and CaSO4) (kg/kg clinker) 0.13 0.02 0.05 0.13 CaSO4 ratio in purge 8.1% 0.0% 0.9% 5.6% Ash ratio in purge 2.5% 0.0% 0.4% 3.0%
CO2 balance CO2 captured from flue gas (kg/kg clinker) 0.74 0.74 0.74 0.74 CO2 captured from fuel combustion (kg/kg clinker)
0.59 0.32 0.45 0.55
CO2 captured from limestone (kg/kg clinker)
0.10 0.02 0.04 0.10
Total CO2 captured (kg/kg clinker) 1.43 1.07 1.23 1.38 CO2 purity (mole based) 97.1% 97.0% 97.8% 96.7% Nominal CO2 capture ratio (by default) 85.0% 85.0% 85.0% 85.0% Real CO2 capture ratio 91.7% 89.2% 90.4% 91.4%
Electricity Balance Gross electricity production (MW) 0.40 0.38 0.38 0.40 Electricity consumption Ca-looping (MW) 0.01 0.01 0.01 0.01 Electricity consumption CO2 compression (MW)
0.15 0.11 0.13 0.15
Electricity consumption O2 production (MW)
0.09 0.08 0.06 0.08
Net surplus electricity production (MW) 0.16 0.19 0.19 0.17 1) Fresh limestone molar ratio (kmol CaCO3 in limestone make up/kmol CO2 in flue gas). 2) Circulating lime molar ratio (kmol CaO in circulating solids/kmol CO2 in flue gas).

Impact of fuel selection on the environmental performance of post-combustion calcium looping applied to a cement plant
133
The electricity balance shows that less electricity is produced in the natural gas and biomass cases compared to the coal and fuel mix cases, as less waste heat is available in these cases due to reduced fuel consumption. On the other hand, less electricity is consumed by the calcium looping process, the compression of CO2 and the production of O2 in these cases. The electricity consumption of the calcium looping process includes the parasitic load of the process and is slightly lower in the natural gas and biomass cases, as lower volume of materials are circulated. The electricity consumption of the CO2 compression process is directly related to the total amount of CO2 captured in the different cases. As less CO2 is captured in the cases where coal is replaced, the electricity consumption of CO2 compression is reduced by 25%, 14% and 3% in the natural gas, biomass and fuel mix cases, respectively. The lower consumption of oxygen consequently decreases the electricity consumption of oxygen production by 13%, 32% and 8% in the natural gas, biomass and fuel mix cases, respectively, compared to the coal case. In total, the electricity production covers the electricity consumption in all cases and using natural gas, biomass or the fuel mix instead of coal increases the net electricity produced by 29%, 31% and 11%, respectively. The net amount of produced electricity also more than covers the electricity consumption of clinker production (0.07 kWh/kg clinker (IEA, 2010)) in all cases.
4.3.1. Global warming potential
Figure 4.4 presents the GWP for the reference case and the different calcium looping cases. The addition of CO2 capture reduces the net global warming potential by 76% and 84% for coal fired and natural gas fired calcium looping, respectively. The increased amount of biogenic CO2 captured further reduces the total net GWP by 95% in the fuel mix case and leads to a negative total net GWP (reduction of 107%) in the biomass case.
The calcium looping process reduces the direct CO2 emissions from clinker production by 85% in all cases, as 85% was the CO2 capture target. A small part of the captured CO2 originated from biogenic (waste) fuel components (wood chips and animal meal) of the clinker kiln fuel mix, and was therefore included in the biogenic CO2 captured. The electricity produced from the waste heat of the calcium looping process was assumed to displace grid electricity, and the GWP associated with this product substitution is thus avoided and included as a negative contribution. The production and transport of the different fuels used for the calcium looping process, the combustion of additional fuel, impacts associated with the production of oxygen, and downstream emissions and

Chapter 4
134
processes during CO2 compression, transport and storage contribute to global warming potential. The GHG emissions associated with these processes partly offset the global warming potential reduction from CO2 capture and electricity substitution.
Figure 4.4. Global warming potential results of the calcium looping cases compared to the reference case without CO2 capture. Results are divided into contributions from the production of fuel for clinker production, the clinker production process, production of fuel for the calcium looping process, the calcium looping process, production of oxygen, substitution of grid electricity, CO2 compression, transport and storage and biogenic CO2 sequestered. The total net global warming potential values are represented by the black circles.
The replacement of coal with natural gas further reduces GWP mainly due to the avoided upstream emissions (CO2 and methane) from coal mining. Besides, the reduction in electricity consumption of CO2 compression and oxygen production also contributes to some extent to the lower GWP of natural gas fired looping compared with coal fired looping. In the biomass and mix cases, the stored CO2 captured from the wood pellets and animal meal used to drive the calcium looping process was included in the biogenic CO2 sequestered, and further reduces the GWP of these cases compared to the coal or natural gas cases. Although twice as much biomass was used in the biomass case (100% wood pellets) than in the fuel mix case (25% wood pellets, 25% animal meal), the GWP reduction from biogenic CO2 captured is only slightly higher, because sequestered CO2 from animal meal was assigned a GWP factor of -1.00 (animal meal was considered short-rotation biomass), compared to -0.51 for wood pellets. The impact of the GWP factor of sequestered biogenic CO2 is discussed
‐0.6
‐0.4
‐0.2
0
0.2
0.4
0.6
0.8
1
Reference Coal NG Biomass Mix
Global warming potential
(kg CO
2‐eq/kg clinker)
Fuel mix for clinker production Clinker prodution Fuel mix for calcium looping
Calcium looping materials Oxygen production CO2 compression, transport and storage
Displaced electricity Biogenic CO2 captured Net

Impact of fuel selection on the environmental performance of post-combustion calcium looping applied to a cement plant
135
further in section 4.3.3. In general, the increased amount of biogenic CO2 captured and avoided upstream emissions from coal mining and lower electricity consumption due to reduced oxygen consumption resulted in a lower GWP for the biomass case than for the fuel mix case (-0.06 kg CO2 eq./kg clinker versus 0.05 kg CO2 eq./kg clinker).
4.3.2. Other environmental impacts
Figure 4.5. Results of the calcium looping cases relative to the reference case without CO2 capture for the other environmental impacts categories: water depletion potential (WDP), fossil depletion potential (FDP), freshwater eutrophication potential (FEP), human toxicity potential (HTP), particulate matter formation (PMF), photochemical oxidant formation (POF), and terrestrial acidification potential (TAP).
Figure 4.5 presents the results of the six other environmental performance indicators for the different calcium looping cases relative to the reference case. Results are divided into contributions from the production of fuel for the clinker production, the clinker production process, production of fuel for calcium looping process, the calcium looping process, production of oxygen, substitution of grid electricity and CO2 compression, transport and storage. The total net impacts are represented by the black circles.
‐400%
‐300%
‐200%
‐100%
0%
100%
200%
300%
400%
Ref
Coal
Natural gas
Biomass
Mix
Ref
Coal
Natural gas
Biomass
Mix
Ref
Coal
Natural gas
Biomass
Mix
Ref
Coal
Natural gas
Biomass
Mix
Ref
Coal
Natural gas
Biomass
Mix
Ref
Coal
Natural gas
Biomass
Mix
Ref
Coal
Natural gas
Biomass
Mix
WDP FDP FEP HTP PMFP POFP TAP
Fuel mix for clinker production Clinker prodution Fuel mix for calcium looping Calcium looping process
Oxygen production CO2 compression, transport and storage Displaced electricity Net

Chapter 4
136
The main drivers for water depletion potential (WDP) in the value chain are the (cooling) water consumption of thermoelectric power plants and the water use during limestone mining. The avoided use of grid electricity due to the net electricity production in the calcium looping cases results in a net negative WDP in these cases. WDP is reduced by 108%, 145%, 119% and 116% in the coal, natural gas, biomass and fuel mix cases, respectively. The additional decrease in the natural gas case is mainly caused by reduced electricity consumption of CO2 compression. Although more water is consumed during biomass production than during coal mining, the WDP is lower in the biomass and fuel mix cases than in the coal case, due to a reduction in water and electricity consumption for O2 production, and lower CO2 compression duty.
Fossil fuel depletion (FDP) measures the amount of fossil feedstock that is required over the total life cycle. The use of fossil fuel to (partly) drive the calcium looping process in the coal, natural gas and fuel mix cases, increases the FDP by 178%, 148% and 89%, respectively. These increases are solely caused by an increased use of fossil fuels, and are only partly compensated by the net production of electricity that displaces grid electricity. There is a lower increase in FDP when natural gas is used instead of coal, as a result of the lower calciner duty and carbon intensity of natural gas. In the fuel mix case, the FDP increase is approximately halved compared to the coal case as 50% of the coal is replaced by biomass (25% animal meal, 25% wood pellets). In the biomass case, the FDP caused by the use of fossil-based energy during biomass production and transport, oxygen production and CO2 compression, transport and storage is more than compensated by the FDP of the displaced electricity. As a result, driving the calcium looping process with 100% biomass actually reduces the fossil fuel depletion by 27% compared to the reference case. The FDP reduction is essentially the effect of using part of the biomass to generate electricity, which replaces electricity partially produced by fossil fuelled power plants.
The use of coal for tail-end calcium looping increases the freshwater eutrophication potential (FEP) in the coal and fuel mix case compared to the reference case by 111% and 44%, respectively. Eutrophication is mainly caused by sulfidic tailings from the mining and waste disposal of coal production. The total net production of electricity positively contributes to FEP due to the displacement of grid electricity. As no FEP is associated with the production of natural gas, the FEP in the natural case is reduced by 54% compared to the reference case. The production of wood pellets requires electricity, which is partially supplied from coal powered plants accompanied by sulfuric tailings. Nevertheless, due to the avoided coal use, the FEP of the biomass case is

Impact of fuel selection on the environmental performance of post-combustion calcium looping applied to a cement plant
137
substantially lower than that of the coal and fuel mix case, and it is reduced by 37% compared to the reference case.
Human toxicity potential (HTP) is mainly caused by toxic emissions to air and toxic leakages to groundwater. The toxic leakages (e.g., arsenic, barium and selenium) and emissions during coal production lead to an increase in the HTP in the coal and fuel mix case of 82% and 40%, respectively. Negligible toxic emissions and leakages are associated with natural gas production, and the avoided emissions from displaced electricity results in a decrease on the HTP of natural gas fired calcium looping by 23% compared to the reference case. The toxic leakages to water during wood pellet production are considerably less severe than those of the coal value chain. As a result, the HTP for biomass is considerably lower compared to the coal and fuel mix case and even 10% lower than to the reference case, due to the avoided toxic emissions associated with electricity production.
Particulate matter formation (PMF) is dominated by direct NOx and particulate matter emissions from clinker production. As the NOx emissions unaffected by the calcium looping capture process, changes in the PMF are only minor for all cases. A minor increase is noticed in the coal and fuel mix cases compared to the reference case, as a result of emissions of particulates from increased demand of limestone quarrying. As significantly less limestone is used in the natural gas and biomass case, the majority of particulate emissions are avoided in these cases. Therefore, the PMF of the natural gas case is on par with the reference case. In the biomass case, the PMF marginally increased by 3% compared to the reference case, mainly due to NOx emission from diesel during wood harvesting and pellet production.
Photochemical oxidant formation (POFP) and terrestrial acidification potential (TAP) are dominated by direct NOx and SOx (only for TAP) emissions of clinker production. The addition of tail-end calcium looping insignificantly affects the TAP in all cases. The NOx and SOx emissions during upstream processes (from e.g. diesel burning and electricity use) are compensated by the avoided emissions of grid electricity production.

Chapter 4
138
4.3.3. Biogenic CO2
Table 4.6. GWP characterization factors for emitted and sequestered CO2 from biogenic origin used in sensitivity analysis. GWP characterization factor Base case Worst case
scenario Best case scenario
Emitted CO2 from wood pellets (kg CO2 eq./kg CO2,bio)
0.491) 0.762) 0.023)
Sequestered CO2 from wood pellets (kg CO2 eq./kg CO2,bio,sequestered)
- 0.511) -0.242) -0.983)
Characterization factor emitted CO2 from animal meal (kg CO2 eq./kg CO2,bio)
0.004) 0.165) 0.004)
Sequestered CO2 from animal meal (kg CO2 eq./kg CO2,bio,sequestered)
-1.004) -0.845) -1.004)
1) Based on the global average GWP factor for woody biomass assuming 50% residue extraction and a time horizon of 100 years (Cherubini et al., 2016).
2) Based on woody biomass assuming a time horizon of 20 years (Guest et al., 2013). 3) Based on woody biomass assuming a time horizon of 500 years (Guest et al., 2013). 4) Assuming CO2 neutrality of short-rotation biomass. 5) Based on short-rotation biomass (6 years) assuming a time horizon of 20 years
(Guest et al., 2013).
A key aspect in the climate change reduction potential of BioCCS is the GWP characterization factor of sequestered biogenic CO2. The assumption that biomass is carbon neutral and that sequestered biogenic CO2 “removes” an equal amount of CO2 from the atmosphere has increasingly been debated, especially for long-rotation biomass (Bentsen, 2017; Cherubini et al., 2016; Johnson, 2009; Lamers et al., 2013). The extent to which sequestered biogenic CO2 actually removes CO2 from the atmosphere depends on many factors, such as the type of biomass, rotation period, time horizon, land use change and albedo change.
The selected GWP characterization factors for the long-rotation woody biomass used in the biomass and fuel mix cases were based on global average values for a time horizon of 100 years (Cherubini et al., 2016). However, wide ranges have been reported in literature for different types of biomass or time horizons. Therefore, a sensitivity analysis was performed in which these GWP characterization factors were varied (see Table 4.6). The worst case scenario assumed factors based on a 20 year time horizon, in which only a small part of biogenic CO2 can contribute to climate change mitigation. In the best case scenario, biogenic CO2 is considered almost climate neutral as a result of
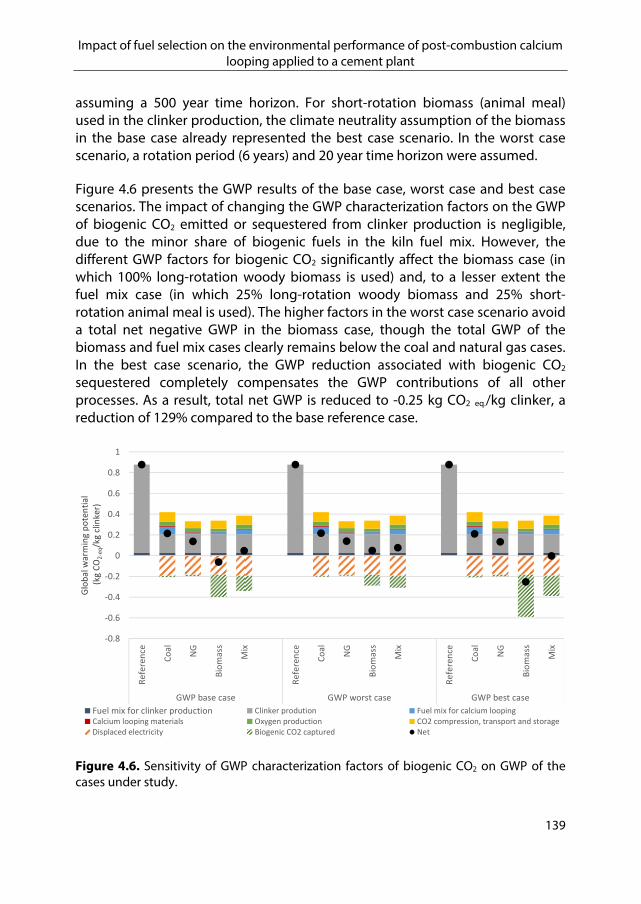
Impact of fuel selection on the environmental performance of post-combustion calcium looping applied to a cement plant
139
assuming a 500 year time horizon. For short-rotation biomass (animal meal) used in the clinker production, the climate neutrality assumption of the biomass in the base case already represented the best case scenario. In the worst case scenario, a rotation period (6 years) and 20 year time horizon were assumed.
Figure 4.6 presents the GWP results of the base case, worst case and best case scenarios. The impact of changing the GWP characterization factors on the GWP of biogenic CO2 emitted or sequestered from clinker production is negligible, due to the minor share of biogenic fuels in the kiln fuel mix. However, the different GWP factors for biogenic CO2 significantly affect the biomass case (in which 100% long-rotation woody biomass is used) and, to a lesser extent the fuel mix case (in which 25% long-rotation woody biomass and 25% short-rotation animal meal is used). The higher factors in the worst case scenario avoid a total net negative GWP in the biomass case, though the total GWP of the biomass and fuel mix cases clearly remains below the coal and natural gas cases. In the best case scenario, the GWP reduction associated with biogenic CO2 sequestered completely compensates the GWP contributions of all other processes. As a result, total net GWP is reduced to -0.25 kg CO2 eq./kg clinker, a reduction of 129% compared to the base reference case.
Figure 4.6. Sensitivity of GWP characterization factors of biogenic CO2 on GWP of the cases under study.
‐0.8
‐0.6
‐0.4
‐0.2
0
0.2
0.4
0.6
0.8
1
Reference
Coal
NG
Biomass
Mix
Reference
Coal
NG
Biomass
Mix
Reference
Coal
NG
Biomass
Mix
GWP base case GWP worst case GWP best case
Global warming potential
(kg CO2‐eq/kg clinker)
Fuel mix for clinker production Clinker prodution Fuel mix for calcium loopingCalcium looping materials Oxygen production CO2 compression, transport and storageDisplaced electricity Biogenic CO2 captured Net

Chapter 4
140
4.3.4. Utilization of spent sorbent
In the environmental assessment, utilization of the spent sorbent (purge) of the calcium looping process in the clinker production was not considered providing a conservative estimate of the environmental impacts of tail-end calcium looping. However, the possibility to utilize the spent sorbent in clinker production is one of the arguments that supports the feasibility of tail-end calcium looping (Telesca et al., 2015). Therefore, the effect of utilizing the spent sorbent on the environmental performance is explored in this section.
The utilization of spent sorbent can lead to a decrease in limestone and fuel consumption in the clinker production process. The CaO content of the spent sorbent reduces the consumption of limestone, and lowers the duty of the calcination process as less limestone needs to be calcined. Furthermore, CO2 emissions from fuel combustion and limestone are also reduced. Finally, if the sensible heat of the spent sorbent (900 °C) can effectively be utilized, further energy savings could be possible.
A sensitivity analysis was performed on the life cycle GWP to assess the effect of utilizing the spent sorbent in all calcium looping cases. In this analysis, the spent sorbent was completely utilized in clinker production in all cases. The spent sorbent could be added to the raw mill department or directly to the kiln system. The latter option allows utilization of the sensible heat of the spent sorbent. However, feeding the spent sorbent directly into the kiln system is considered infeasible, firstly because the particle size of the spent sorbent is probably too large, secondly because homogenization of the raw meal is required, and thirdly because careful control of the raw material rates is needed to ensure the right chemical composition of the raw meal. Consequently, the spent sorbent was assumed to be added to the raw meal before milling, and the potential energy savings from the heat content was not taken into account.
Table 4.7 presents the effect of utilizing the spent sorbent on the mass and energy balance of the clinker production. The larger amount of spent sorbent in the coal and fuel mix cases, due to the higher purging, provides substantially more limestone replacement, energy savings and CO2 formation reduction compared to the natural gas and biomass case. The utilization of spent sorbent in clinker production could lower CO2 emissions and consequently the amount of CO2 that needs to be captured in the tail-end calcium looping process. Ideally, an integrated model of clinker production and calcium looping would allow optimizing the size of both processes. However, as the focus of this study was on

Impact of fuel selection on the environmental performance of post-combustion calcium looping applied to a cement plant
141
the tail-end calcium looping process, the clinker production unit was not modelled. The effects of utilizing the spent sorbent on the life cycle CO2 emissions and other impacts are therefore not quantified.
Nevertheless, the changes in CO2 emissions shown in Table 4.7 indicate that utilization of the spent sorbent could drastically improve the performance of the high purge cases (coal and fuel mix). The potential CO2 emission reduction achieved when utilizing the complete amount of spent sorbent in these cases (ca. 0.11 kg/kg clinker) exceeds the GWP difference between these cases and the natural gas case (0.08 kg/kg clinker). Consequently, the possibility of utilizing the spent sorbent in clinker production might nullify the relative advantage of the natural gas case over the coal and the fuel mix cases. Yet, high levels of CaSO4 in the spent sorbent can lead to an excessive amount of sulphur in the kiln system, causing operational problems (Tokheim, 1999) and compromising the quality of the produced clinker (Alsop, 2007). Therefore, the amount of spent sorbent that can be utilized in clinker production is limited, and utilization of the complete amount of spent sorbent in the coal and fuel mix cases might be infeasible.
Table 4.7. Effects of utilization of spent sorbent in all the calcium looping cases on the mass and energy balance of clinker production. Coal case NG case Biomass
case Fuel mix case
Spent sorbent (kg/kg clinker) 0.13 0.02 0.05 0.13 CaO in spent sorbent (kg/kg clinker)
0.12 0.02 0.05 0.12
Limestone replacement (kg/kg clinker) 1)
0.22 0.04 0.08 0.22
Primary energy savings calcination process (MJ/kg clinker) 2)
0.37 0.07 0.14 0.37
Less CO2 formed by calcination (kg/kg clinker)
0.09 0.02 0.04 0.09
Less CO2 formed by fuel combustion (kg/kg clinker)3)
0.02 0.00 0.01 0.02
1) Assuming that one mole CaO in spent sorbent can replace one mole CaCO3 in clinker production.
2) Based on calcination reaction enthalpy of 1.7 MJ/kg CaCO3 3) Calculation based on the kiln fuel mix LHV of 21.8 MJ/kg and the CO2 intensity factor
of 1.40 kg CO2/kg fuel.

Chapter 4
142
4.3.5. Fly ash disposal
Figure 4.7. Sensitivity of disposal of fly ash instead of utilization of the ash on the human toxicity potential (HTP) of the calcium looping cases.
The fly ash that is produced during the calcium looping process was assumed to be utilized in cement production. However, if utilization of the fly ash would not be possible, the ash might need to be disposed through landfilling. The fly ash landfilling, especially ash from coal, can result in severe toxicity impacts due to the leaching of heavy metals (Doka, 2003; Haynes, 2009). Figure 4.7 shows the effect in the environmental assessment when the ash is landfilled instead of utilized. Evidently, the potential leakage of toxic materials to groundwater of the disposed ash massively increases the life cycle HTP of the calcium looping cases that produce fly ash. For the coal and fuel mix cases, total HTP rises by a factor of seven compared to the reference case, whereas the increase in the biomass case is less severe due to the lower ash content of the biomass. The natural gas case remains unaffected because no ash is produced when combusting natural gas. Although the need to dispose (all of) the produced fly ash is considered unrealistic, the sensitivity analysis shows that the utilization of fly ash is vital to minimize HTP impacts of tail-end calcium looping.
‐200%
‐100%
0%
100%
200%
300%
400%
500%
600%
700%
800%
Ref
Coal
Natural gas
Biomass
Mix
Ref
Coal
Natural gas
Biomass
Mix
HTP ‐ base case HTP ‐ including ash landfilling
Fuel mix for clinker production Clinker prodution Fuel mix for calcium looping
Calcium looping process Oxygen production CO2 compression, transport and storage
Displaced electricity Net

Impact of fuel selection on the environmental performance of post-combustion calcium looping applied to a cement plant
143
Discussion and conclusion 4.4.
4.4.1. Technical assessment
The main objective of the technical assessment was to calculate the mass and energy balances required to conduct the life cycle assessment of the various calcium looping cases. A technical model with a relatively low degree of resolution was developed as this was considered sufficiently fit for purpose. Consequently, the calcium looping model did not include the full kinetics of the calciner and carbonator and simplifying assumptions were used for these two processes. To avoid overestimating the technical performance of the process, conservative estimates regarding the CaO conversion in the carbonator and purge ratio were applied. Besides, process optimization or heat integration with the clinker production process was not considered in this study. Potential integration advantages were therefore not taken into account, and the development of an optimized integrated model of the calcium looping process and clinker production process is recommended if a more detailed analysis on the technical performance of calcium looping is desired.
A key assumption in the technical modelling was the purge ratio. Purging of sorbent is applied to the calcium looping process to maintain low levels of impurities of mainly CaSO4 and ash. The assumed purge ratio directly affects the technical performance of the calcium looping process, as lower purging decreases limestone consumption, fuel consumption and CO2 formation (amount of CO2 captured). For the cases in which the used fuel has a relatively high sulphur and/or ash content (the coal and fuel mix case), a considerably higher purge ratio (2.5%) was applied than for the natural gas case (0.5%) and biomass case (1.0%). The lower purge ratio of the natural gas and biomass cases substantially contributes to the observed technical performance advantages over the coal and fuel mix cases. The purge ratio for the coal and fuel mix case was set at 2.5% as a conservative estimate to keep CaSO4 and ash levels low in the circulating sorbent. When a lower purge ratio (<2%) was used in the model, the concentration of inert substances accumulated, decreasing the capture efficiency of the process. For the natural gas and biomass case, such challenges were not observed due to the lower sulphur and ash content of these fuels. The effect of sorbent deactivation as a result of reactions with alkali components of the biomass was not accounted for in the model. However, the alkali content is much lower than the ash and sulphur content of biomass and the sorbent deactivation is expected to be minor compared to the sorbent deactivation caused by CaO sulphation. Nevertheless, the sorbent deactivation could be

Chapter 4
144
higher than considered in the biomass case studies and the applied purge ratios might therefore underestimate the purge requirement in these cases. The technical performance of the case studies that use biomass could be negatively affected when sorbent deactivation as a result of alkali components is taken into account. As the purge ratio is identified as a key parameter in the model, a more elaborate approach would be recommended if the technical performance of the system needs to be analysed with a greater detail and accuracy.
The technical assessment showed that using natural gas or (co-)firing biomass instead of coal significantly improves the performance of tail-end calcium looping. The lower sulphur and ash content of biomass, and especially natural gas, increases the efficiency of the looping process. As a result, fuel and limestone consumption are reduced. The reduction in fuel consumption in combination with a lower carbon intensity of natural gas and biomass compared to coal, decreases the total amount of captured CO2 while still avoiding 85% of the CO2 emissions from clinker production. The corresponding electricity consumption of CO2 compression is therefore also lowered and total net electricity generation increases. The illustrated technical improvements provide incentive to further investigate the technical feasibility of using alternative fuels in tail-end calcium looping processes.
4.4.2. Environmental assessment
A life cycle assessment (LCA) was conducted to compare the environmental performance of tail-end calcium looping of the different fuels under study. The LCA results showed that he global warming potential (GWP) is substantially reduced by the calcium looping process compared to the reference process for all fuels. The use of natural gas or biomass instead of coal further reduces GWP, mainly driven by avoided upstream GHG emissions from coal mining and reduced electricity consumption for oxygen consumption and CO2 compression. The sequestered biogenic CO2 in the biomass and mix cases was assumed to be (partly) removed from the atmosphere, leading to an additional decrease in the total net GWP, namely almost zero total life cycle GHG emissions in the fuel mix case and slightly negative life cycle GHG emissions in the biomass case.
The extent to which the use of biomass lowers the GWP depends on how the sequestered biogenic CO2 contributes to climate change reduction. Sequestering CO2 from long-rotation biomass is considered to limitedly contribute to climate change reduction due to the temporal difference between CO2 uptake in the biomass and emission or storage of that CO2 (carbon debt).

Impact of fuel selection on the environmental performance of post-combustion calcium looping applied to a cement plant
145
Carbon debt strongly depends on the type of biomass and time horizon considered, and consensus on appropriate methodologies is limited (Bentsen, 2017). The sensitivity analysis performed in section 4.3.3 showed that the GWP characterization factors applied in this study can significantly affect the GWP of the cases that use biomass, especially long-rotation biomass, for the calcium looping process. Long-rotation biomass is used to drive the calcium looping process in the biomass case (100%) and in the fuel mix case (25%). When a pessimistic scenario is considered, the total GWP of the biomass case is positive, although still considerably lower than the coal and natural gas case. On the other hand, a best case scenario further reduces the GWP substantially. The effect of alternative GWP characterization factors for the short term biomass used in this study (biogenic waste used in the clinker production and animal meal used in the fuel mix case) is less substantial. The results of the sensitivity analysis align with reported conclusions that the carbon debt associated with the use of long-rotation biomass, such as forest residues, requires methodology improvements and improved consensus in scientific literature to support GWP calculations and policy decisions (Bentsen, 2017; Lamers et al., 2013).
Replacing coal with natural gas or biomass to drive tail-end calcium looping reduces the freshwater eutrophication potential and human toxicity potential of the system, mainly due to avoided toxic emissions and sulfidic tailings from coal mining. The fossil fuel depletion is only slightly reduced when coal is replaced with natural gas, but substantially reduced when biomass is considered. The effect of replacing coal with natural gas or biomass on particulate matter formation, photochemical oxidant formation and terrestrial acidification is insignificant as these environmental impact categories are dominated by direct NOx and SOx emissions from the clinker production process.
Utilization of the spent sorbent of the calcium looping process in the clinker production was not considered in this study. However, when all of the spent sorbent purged from the calcium looping system is used in the clinker production process, limestone consumption, fuel consumption and the corresponding CO2 emissions are considerably lowered (see section 4.3.4). As more spent sorbent is available in the coal and fuel mix case due to the higher purge ratio selected, potential gains when utilizing the spent sorbent are most prevalent in these cases. Using the spent sorbent could compensate part of the observed advantages of replacing coal with natural gas or biomass, especially for the GWP as direct CO2 emissions are considerably lowered.

Chapter 4
146
The produced fly ash during the calcium looping process is considered to be used in cement production and potential environmental impacts are not accounted for. However, the performed sensitivity analysis in section 4.3.5 showed the importance of this assumption with respect to the human toxicity potential (HTP) results. When the fly ash cannot be used, and needs to be disposed of instead, the HTP of the ash producing cases (coal and fuel mix) substantially increases, mainly due to toxic leakages that accompany ash landfilling. Although the utilization of fly ash in cement production is considered realistic and feasible (e.g. Ahmaruzzaman, 2010), significant effects on HTP arise if utilization is not possible; accounting for these effects is important when evaluating the environmental performance of the tail-end calcium looping system.
4.4.2.1. Impact of fuel selection on calcium looping performance
The results of this study illustrated considerable advantages of using natural gas or biomass instead of coal to drive the tail-end calcium looping process. The use of natural gas or biomass improves the technical performance of the looping system, as lower sulphur and ash levels reduce the need to purge and as a result decrease the limestone and fuel consumption. The LCA results indicated that these improvements positively affect the environmental performance as well. Coal-fired calcium looping already substantially reduces GWP, but the GWP is further lowered when using natural gas or especially biomass, as the captured biogenic CO2 accounts for additional removal of CO2 from the atmosphere. The impact of other environmental categories, e.g., freshwater eutrophication potential and human toxicity potential, is also lowered when using natural gas or biomass instead of coal, mainly due to avoided emissions from coal production.
Impact of fuel selection on the environmental performance of post-combustion calcium looping applied to a cement plant
147
This study also explored the sensitivity of assumptions and model simplifications. To improve the reliability and robustness of the results, the following recommendations are proposed:
Develop an integrated model of clinker production and calcium looping that would allow the investigation of potential heat integration and spent sorbent utilization options.
Include kinetics when an integrated model is used for process optimization
Develop a more comprehensive method that would allow consistent assessment of the climate change mitigation potential of sequestration of biogenic CO2.
The goal of this study was to explore whether replacing coal with natural gas or biomass provides low-hanging fruit for improving the environmental performance of tail-end calcium looping. Even when taking uncertainties into account, the results of this study showed that replacing coal with natural gas or biomass to drive tail-end calcium looping can provide interesting benefits to the environmental performance of the system. It is therefore worthwhile and recommended to consider the use of alternative fuels when pursuing tail-end calcium looping deployment in the cement industry.
Acknowledgements
This research has been carried out as part the EDDiCCUT project (www.eddiccut.com). EDDiCCUT was a 4 year research project (2012-2016) assessessing the environmental performance of carbon capture and utilization technologies. The project was led by the Industrial Ecology Programme at Norwegian University of Science and Technology in collaboration with the Copernicus institute at Utrecht University and Tel‐Tek in Porsgrunn. The project was supported by Gassnova and industrial partners (Bharat Petroleum, Norske Shell and Uniper).
We also like to thank Gabriel Orreggioni for his contributions during the early stage of the assessment conducted in this paper.

148

149
Assessing the techno-environmental 5.performance of CO2 utilization via dry reforming of methane for the production of dimethyl ether
Wouter Schakel, Gabriel Oreggioni, Bhawna Singh, Anders Strømman, Andrea Ramírez
Published in: Journal of CO2 Utilization (2016), pp. 138-149
Abstract
CO2 utilization is gaining attention as a greenhouse gas abatement strategy complementary to CO2 storage. This study explores the techno-environmental performance of CO2 utilization trough dry reforming of methane into syngas for the production of dimethyl ether (DME). The CO2 source is a hydrogen production unit at a refinery, where solvent based CO2 capture is applied. Aspen Plus modelling and hybrid life cycle assessment (LCA) is used to assess the techno-environmental performance of this utilization option compared to a reference case without CO2 capture and a case with CO2 capture and storage. Results of the technical assessment show that although 94% of the captured CO2 can be utilized for DME production, only 9% of CO2 is avoided in the entire process as a result of direct CO2 formation during DME synthesis and the combustion of syngas to provide the heat demanded by the dry reforming process. Besides, a substantial amount of electricity is required for syngas compression. Consequently, the LCA results indicate that climate change potential (CCP) is reduced by 8% while it is 37% higher than CCP when CO2 is stored and DME is produced conventionally. Sensitivity analyses are performed on various process conditions. Overall, this study indicates that this utilization route lowers the CCP although the reduction is limited compared to CCS. While the techno-environmental analysis is a useful tool to gain better insights in the performance of CO2 utilization options, the complex environmental trade-offs make it difficult to draw robust conclusions on the performance.

Chapter 5
150
Introduction 5.1.
CO2 capture and storage (CCS) is an essential technology to reduce the amount of greenhouse gas (GHG) emissions and mitigate climate change in the future (IEA, 2014b; IPCC, 2014). CCS can be an attractive addition to other GHG reducing technologies as it can reduce GHG emissions without replacing fossil fuels, it can achieve net negative GHG emissions when combined with sustainable biomass and, it can be applied to industrial processes as well as to the power sector. Initially, CO2 capture research has mostly focused on long term CO2 storage, but CO2 utilization options are gaining attention as alternative for CO2 storage especially in scenarios where CO2 storage is not feasible or economic incentives for CO2 utilization are available. Potential CO2 utilization options include enhanced oil recovery (EOR), biological conversion, mineralisation and chemical conversion into chemicals, fuels or materials such as plastics (NETL, 2015; Quadrelli et al., 2011).
Converting CO2 into fuels or fuel additives is an interesting CO2 utilization option as the transport sector has become a large contributor to GHG emissions. However, reforming CO2 requires a large amount of additional energy due to the chemically non-reactive nature of CO2. The potential of reforming CO2 into fuels is considered limited, as the amount of energy required for the production of fuel can exceed the amount of energy that can be recovered, making it only a viable option when excess (renewable) energy is available (Styring et al., 2011). CO2 utilization into fuels is thus often referred to as an option to convert excess (renewable) energy into useable fuels (Olah et al., 2009; Quadrelli et al., 2011; Styring et al., 2011).
Figure 5.1 depicts the most common chemical conversion routes of CO2 into fuels and fuel additives. Hydrogenation of CO2 is extensively researched in literature (Arena et al., 2014; Quadrelli et al., 2011) as it provides a direct route to methanol, a very useful chemical feedstock which can directly be used as a fuel (additive) or as an intermediate to produce more advanced fuels (Arena et al., 2014; Olah et al., 2009; Quadrelli et al., 2011). Other conversion routes, such as reversed water gas shift or dry reforming of methane can be used for the production of syngas (Quadrelli et al., 2011).

Assessing the techno-environmental performance of CO2 utilization via dry reforming of methane for the production of dimethyl ether
151
Figure 5.1. Schematic representation of main production routes of CO2 utilization into fuel.
Dry reforming of methane is a highly endothermic reaction of CO2 and methane producing syngas:
CO2 + CH4 2 CO + 2 H2 ΔH298K= + 247 kJ/mol (eq. 4.1)
Dry reforming of methane is a well-studied process (e.g. Al-Ali et al., 2014; Gangadharan et al., 2012; Guo et al., 2004; Pakhare et al., 2014; Treacy et al., 2004) and is often seen as an alternative for steam reforming of methane (Gangadharan et al., 2012; Ginsburg et al., 2005; Nikoo et al., 2011; Pakhare et al., 2014). Combining dry reforming with steam reforming decreases the amount of steam required per unit of syngas produced and can potentially reduce the carbon footprint of syngas production (Gangadharan et al., 2012). Dry reforming of methane could also be a potential alternative for CO2 hydrogenation if the produced syngas can be converted into a fuel, preferably methanol or dimethyl ether (DME), as these are best suited for the replacement of conventional fuels (Lebarbier et al., 2012; Olah et al., 2009).
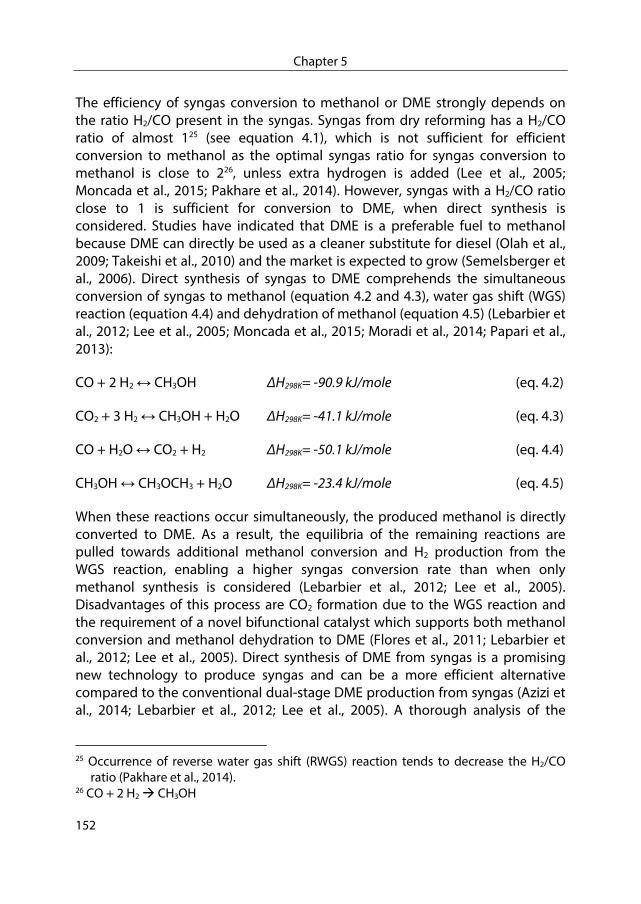
Chapter 5
152
The efficiency of syngas conversion to methanol or DME strongly depends on the ratio H2/CO present in the syngas. Syngas from dry reforming has a H2/CO ratio of almost 125 (see equation 4.1), which is not sufficient for efficient conversion to methanol as the optimal syngas ratio for syngas conversion to methanol is close to 226, unless extra hydrogen is added (Lee et al., 2005; Moncada et al., 2015; Pakhare et al., 2014). However, syngas with a H2/CO ratio close to 1 is sufficient for conversion to DME, when direct synthesis is considered. Studies have indicated that DME is a preferable fuel to methanol because DME can directly be used as a cleaner substitute for diesel (Olah et al., 2009; Takeishi et al., 2010) and the market is expected to grow (Semelsberger et al., 2006). Direct synthesis of syngas to DME comprehends the simultaneous conversion of syngas to methanol (equation 4.2 and 4.3), water gas shift (WGS) reaction (equation 4.4) and dehydration of methanol (equation 4.5) (Lebarbier et al., 2012; Lee et al., 2005; Moncada et al., 2015; Moradi et al., 2014; Papari et al., 2013):
CO + 2 H2 ↔ CH3OH ΔH298K= -90.9 kJ/mole (eq. 4.2)
CO2 + 3 H2 ↔ CH3OH + H2O ΔH298K= -41.1 kJ/mole (eq. 4.3)
CO + H2O ↔ CO2 + H2 ΔH298K= -50.1 kJ/mole (eq. 4.4)
CH3OH ↔ CH3OCH3 + H2O ΔH298K= -23.4 kJ/mole (eq. 4.5)
When these reactions occur simultaneously, the produced methanol is directly converted to DME. As a result, the equilibria of the remaining reactions are pulled towards additional methanol conversion and H2 production from the WGS reaction, enabling a higher syngas conversion rate than when only methanol synthesis is considered (Lebarbier et al., 2012; Lee et al., 2005). Disadvantages of this process are CO2 formation due to the WGS reaction and the requirement of a novel bifunctional catalyst which supports both methanol conversion and methanol dehydration to DME (Flores et al., 2011; Lebarbier et al., 2012; Lee et al., 2005). Direct synthesis of DME from syngas is a promising new technology to produce syngas and can be a more efficient alternative compared to the conventional dual-stage DME production from syngas (Azizi et al., 2014; Lebarbier et al., 2012; Lee et al., 2005). A thorough analysis of the
25 Occurrence of reverse water gas shift (RWGS) reaction tends to decrease the H2/CO
ratio (Pakhare et al., 2014). 26 CO + 2 H2 CH3OH
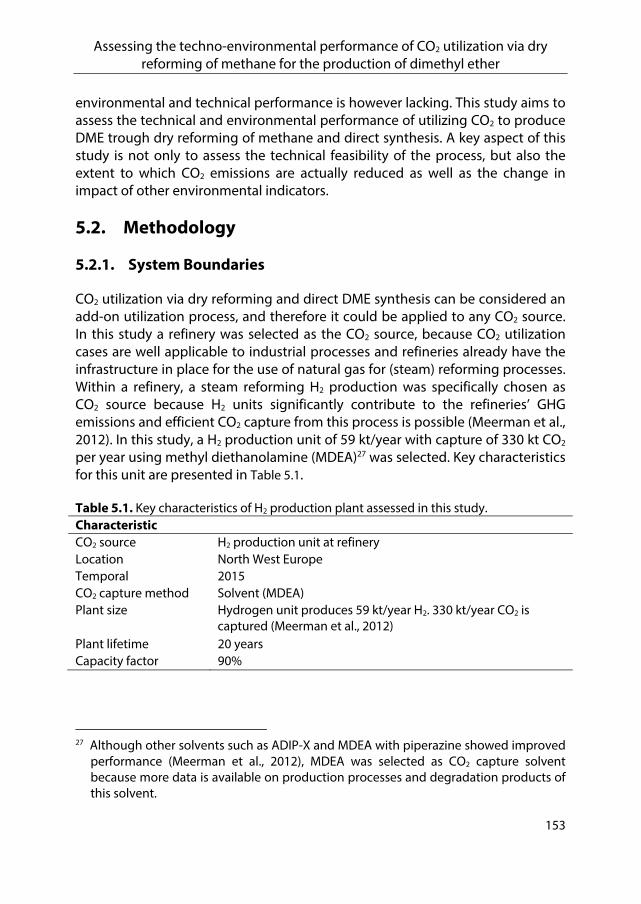
Assessing the techno-environmental performance of CO2 utilization via dry reforming of methane for the production of dimethyl ether
153
environmental and technical performance is however lacking. This study aims to assess the technical and environmental performance of utilizing CO2 to produce DME trough dry reforming of methane and direct synthesis. A key aspect of this study is not only to assess the technical feasibility of the process, but also the extent to which CO2 emissions are actually reduced as well as the change in impact of other environmental indicators.
Methodology 5.2.
5.2.1. System Boundaries
CO2 utilization via dry reforming and direct DME synthesis can be considered an add-on utilization process, and therefore it could be applied to any CO2 source. In this study a refinery was selected as the CO2 source, because CO2 utilization cases are well applicable to industrial processes and refineries already have the infrastructure in place for the use of natural gas for (steam) reforming processes. Within a refinery, a steam reforming H2 production was specifically chosen as CO2 source because H2 units significantly contribute to the refineries’ GHG emissions and efficient CO2 capture from this process is possible (Meerman et al., 2012). In this study, a H2 production unit of 59 kt/year with capture of 330 kt CO2 per year using methyl diethanolamine (MDEA)27 was selected. Key characteristics for this unit are presented in Table 5.1.
Table 5.1. Key characteristics of H2 production plant assessed in this study. Characteristic CO2 source H2 production unit at refineryLocation North West EuropeTemporal 2015CO2 capture method Solvent (MDEA)Plant size Hydrogen unit produces 59 kt/year H2. 330 kt/year CO2 is
captured (Meerman et al., 2012) Plant lifetime 20 yearsCapacity factor 90%
27 Although other solvents such as ADIP-X and MDEA with piperazine showed improved
performance (Meerman et al., 2012), MDEA was selected as CO2 capture solvent because more data is available on production processes and degradation products of this solvent.

Chapter 5
154
Figure 5.2. Simplified process layout of the production of DME via dry reforming of methane. The coloured area represents the CO2 utilization route which is the specific area of interest in this study.
Figure 5.2 schematically depicts the processes included in this study. The coloured area represents the proposed CO2 utilization route, which is specifically targeted in the technical process modelling. Other processes assessed in the environmental analysis comprise natural gas production and transport and the H2 production unit including CO2 capture. H2 is produced in the considered process via steam reforming of methane and water gas shift reaction and is separated via pressure swing absorption. CO2 capture is applied between the water gas shift (WGS) reactor and the pressure swing absorption (PSA) unit as it has been shown this is the most efficient location for CO2 capture for this configuration (Meerman et al., 2012).
The captured CO2 is preheated before entering the dry reforming reactor, which requires a continuous supply of heat due to the endothermic nature of the process. The produced syngas is compressed to enable direct synthesis of DME. After this synthesis step, a mixture of DME, methanol, CO2 and remaining syngas is formed. Two distillation steps are applied to separate the components: in the first step, the mixture of DME and methanol are separated from the syngas and CO2 and, in the second step the ultimate product DME is purified by separating it from the methanol. Heat required for the dry reforming process is produced by a furnace via combustion of remaining syngas, methanol and, if required, natural gas. Electricity required for the compression of syngas is assumed to be delivered by the grid.
The dry reforming case is compared with two other cases, namely a reference case (REF) and a CO2 storage (CCS) case (see Table 5.2). In the reference case, no
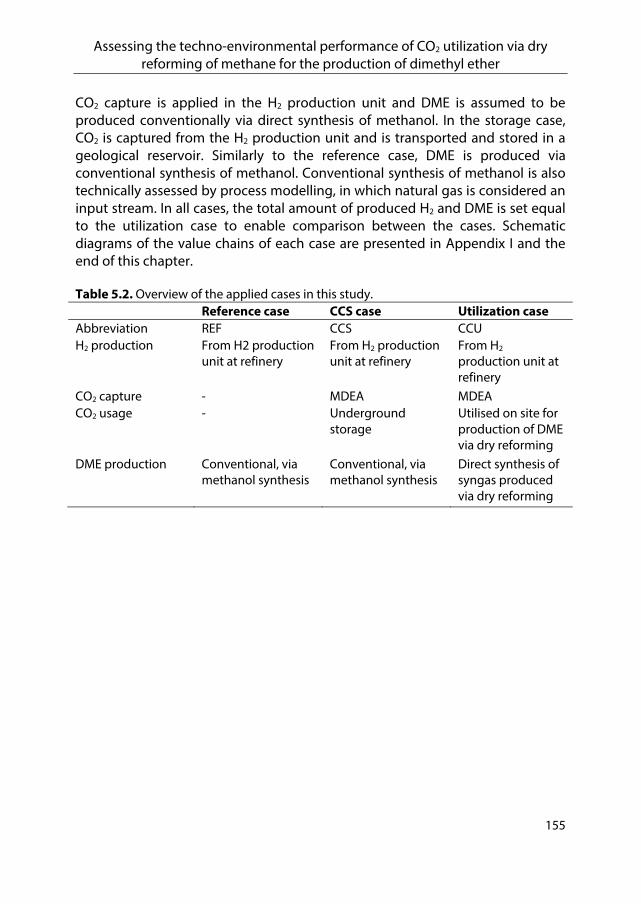
Assessing the techno-environmental performance of CO2 utilization via dry reforming of methane for the production of dimethyl ether
155
CO2 capture is applied in the H2 production unit and DME is assumed to be produced conventionally via direct synthesis of methanol. In the storage case, CO2 is captured from the H2 production unit and is transported and stored in a geological reservoir. Similarly to the reference case, DME is produced via conventional synthesis of methanol. Conventional synthesis of methanol is also technically assessed by process modelling, in which natural gas is considered an input stream. In all cases, the total amount of produced H2 and DME is set equal to the utilization case to enable comparison between the cases. Schematic diagrams of the value chains of each case are presented in Appendix I and the end of this chapter.
Table 5.2. Overview of the applied cases in this study. Reference case CCS case Utilization case Abbreviation REF CCS CCUH2 production From H2 production
unit at refinery From H2 production unit at refinery
From H2 production unit at refinery
CO2 capture - MDEA MDEA CO2 usage - Underground
storage Utilised on site for production of DME via dry reforming
DME production Conventional, via methanol synthesis
Conventional, via methanol synthesis
Direct synthesis of syngas produced via dry reforming

Chapter 5
156
5.2.2. General approach
Figure 5.3. Schematic overview of general approach.
The general approach applied in this study is presented in Figure 5.3. The technical assessment (see section 5.2.3) was carried out by developing a process model for which process conditions of the dry reforming process and direct DME synthesis and input streams for these processes served as input data. The technical performance together with input data of up- and downstream processes (e.g. natural gas production and H2 production) was used to carry out a life cycle assessment (LCA) to determine the environmental performance of the full chain (see section 5.2.4).
5.2.3. Technical Assessment
5.2.3.1. Method selection
The main goal of the technical modelling was to explore the performance of this utilization route and to provide input in the form of mass and energy balances for the environmental assessment. In order to provide a conservative scenario, the dry reforming process and DME synthesis have not been optimised or integrated with other refinery processes. Aspen Plus software was selected for the modelling and the Peng-Robinson equation of state was selected as thermodynamic model, as it is well-known to be suitable for hydrocarbon systems.

Assessing the techno-environmental performance of CO2 utilization via dry reforming of methane for the production of dimethyl ether
157
5.2.3.2. Process conditions
Table 5.3 presents the key assumptions regarding the process conditions for the dry reforming process and direct DME synthesis. Both dry reforming and direct DME synthesis were modelled using a Gibbs free energy reactor in Aspen Plus. Catalysts and corresponding process conditions were selected from literature (Table 5.3). Carbon deposition reactions28 were also included in the dry reforming reactor.
Table 5.3. Overview of key assumptions dry reforming and direct DME synthesis processes. Process Dry reforming DME synthesisSelected catalyst Ni/Rh/Al2O3
4) Pd/ZnO/Al2O35)
Temperature 800 0C6) 250 0C7)
Pressure 1 bar8) 79 bar9)
Stream input 330 kt CO2/year10)
120 kt CH4/year11) Syngas produced in dry reforming process
4) Selected because this catalyst showed promising results at selected process conditions (Gangadharan et al., 2012).
5) Based on Lebarbier et al. (2012). 6) Typically, values between 600 and 1000 0C are reported (Gangadharan et al., 2012;
Oyama et al., 2012; Pakhare et al., 2014; Rahemi et al., 2013). The selected temperature of 800 0C is high enough to enable a high CO2 conversion rate (Gangadharan et al., 2012) but low enough to limit carbon deposition (Pakhare et al., 2014).
7) Shown to give the highest syngas conversion in the reported temperature range 250-380 0C for the selected catalyst (Lebarbier et al., 2012).
8) Assumed to be optimal pressure for this process (Gangadharan et al., 2012; Oyama et al., 2012; Pakhare et al., 2014), as at higher pressure the RWGS reaction starts to dominate which decreases the CO2 conversion rate (Oyama et al., 2012).
9) Pressure at which selected catalyst showed optimal syngas conversion rates (Lebarbier et al., 2012).
10) Matching the amount of CO2 assumed to be captured in H2 production unit. 11) Assuming a CH4:CO2 ratio of 1:1 (CH4 + CO2 ↔ 2 CO + 2 H2).
28 Most prevalent: CH4 ↔ C(s) + 2 H2, ΔH298K = + 75 kJ/mole and 2CO ↔ C(s) + CO2,
ΔH298K = - 171 kJ/mole.

Chapter 5
158
Conventional DME production via methanol dehydration was also modelled using a Gibbs free energy reactor in Aspen Plus to support a fair comparison with the novel DME production route. Methanol dehydration can be performed at relatively low temperature and pressure (Jun et al., 2011). An inlet temperature29 of 160 0C and pressure of 15 bars were selected after some model test runs. The selected catalyst for this process was γ-Al2O3 as this is the most commonly used catalyst for conventional DME production (Akarmazyan, et al., 2014; Zhang et al., 2011).
Distillation columns were required in the novel process as well as the conventional process to purify the DME. Aspen Plus 2 phase rigorous fractionation single columns were used to model the distillation steps and a minimum purity of DME of 99.5 % was set as distillation target. In the dry reforming case, the first distillation column separates the methanol, DME and water mixture form the remaining syngas and CO2, with DME as the heavy key component (boiling point of -23 °C) and CO2 as the light key component (boiling point of -57°C). The second distillation column purifies the DME by separating it from the remaining water, with methanol as the heavy key component and DME as the light key component. In the reference cases, in the first distillation column the DME is separated from the methanol and water and in the second column the methanol is separated from the remaining water before being recycled to the DME synthesis process. Cooling water inlet temperature was set at 12 0C (average North Sea water temperature).
5.2.3.3. Process line-ups
Figure 5.4 presents the Aspen Plus process line-up for the novel CO2 utilization route via dry reforming and direct DME synthesis. Complete details of all flows can be found in the supplementary data of the online version of the published article (Schakel et al., 2016). CO2 (S1) and methane (S2) are mixed (B1) and fed into pre-heating station (H1) where the mix is heated to 800 0C. After preheating, the CO2 and methane (S4) enters the dry reforming reactor (DRYREF) where at constant temperature of 800 0C the mix is reformed into syngas (S5).
29 Due to the exothermic nature of methanol dehydration, actual reaction and outlet temperature are higher.

Assessing the techno-environmental performance of CO2 utilization via dry reforming of methane for the production of dimethyl ether
159
The syngas is cooled down (H2) before three-stage compression (COMP1, COMP2 and COMP3) with intermediate cooling (H3 and H4) and water knock-out vessels (DRUM1 and DRUM2) is applied to increase the pressure to the required pressure of 79 bar. Water knocked out of the mix is discharged to the environment (W1 and W2). Cooling water (C1) is used for cooling the syngas between compression steps and is discharged into the environment after use (W3). After the final compression step, the temperature of the syngas is 250 0C and therefore suitable for direct DME synthesis. In the direct DME synthesis reactor (DMESYN), the syngas is converted to DME without additional heat supply. Because the outlet stream of this reactor (S14) also contains methanol, syngas, water, CO2 and methane further steps to purify the DME are necessary.
The DME mix (S14) is first depressurized (B3) and cooled down (H5) before the mix (S16) is fed into the first distillation column (DIS1). In this column, the lighter components (CO2, CH4, CO and H2) are separated from the heavier components (DME, methanol and water) at a pressure of 10 bars. Because the boiling point of the key heavy component DME is very low, -23 0C, the condenser at the top of the column is operated at very low temperature. A refrigerator cycle is required to enable this condenser to work at this temperature. Calculations for this refrigerator cycle are done apart from the Plus model assuming an ideal Carnot-cycle. Refrigerant consumption is calculated combining the cooling demand of the Carnot cycle with an assumed cycle time of 100 seconds (Adler, 2007) and a lifetime of 20 years. The selected refrigerant for this cycle is Freon-22, which characteristics, e.g. boiling point = -40.8 0C (DuPont, 2015), are well suited for this purpose. The DME mixed with methanol and water (S17) leaves the column at the bottom and enters the second distillation column (DIS2), where the DME is separated from the methanol and water. DME with high purity (> 99.5%) leaves the column at the top (S22).
The gas mix containing syngas, methane and CO2 that exits the first distillation column (DIS1) at the top, is depressurized (B7) and heated (B6) before the stream (S20) is mixed (B2) with the methanol and water mixture (S21) exiting at the bottom the second distillation column (DIS2) and an inlet air stream (S23), before the mixture (S24) is fed into the furnace (FURNACE). In the furnace, the mixture is burnt completely, producing hot (>1500 0C) exhaust gasses (S25) which are used for pre-heating the CO2-methane mix (H1) and providing the heat required for the dry reforming reaction. In this configuration, recycling the syngas, methane and the produced methanol provide sufficient heat for the dry reforming reaction and burning of additional natural gas was not required. Flue gasses from the furnace (S27) are emitted into the atmosphere.

Chapter 5
160
B1
H1
DRY
REF
CO
MP
1
CO
MP
2
DRU
M1
DRU
M2
CO
MP
3
B2
FUR
NAC
E
DM
ES
YN
H2
H3
H4
B3
H5
DIS
1
DIS
2
B4
B6
B7
S1-
CO
2
S2-
CH
4
S3
S23
-AIR
S25
S26
S4
S5
S6
S7
S8
S10
S9
W1
S11
S12
W2
S13
S24
S14
C1
C2
C3
C4
S15
S16
W3
S17
S20
S22
-DM
E
S21
Q1
Q
S27
-FG
S18
S19
Figu
re 5
.4. P
roce
ss fl
owsh
eet
of C
O2
utili
zatio
n vi
a dr
y re
form
ing
and
dire
ct D
ME
synt
hesi
s. Ch
arac
teris
tics
of e
ach
flow
can
be
foun
d ca
n be
foun
d in
the
supp
lem
enta
ry d
ata
of th
e on
line
vers
ion
of th
e pu
blis
hed
artic
le (S
chak
el e
t al
., 20
16).

Assessing the techno-environmental performance of CO2 utilization via dry reforming of methane for the production of dimethyl ether
161
Figure 5.5 presents the Aspen Plus process line-up for conventional DME production via methanol dehydration. Complete details of all flows can be found in the supplementary data of the online version of the published article (Schakel et al., 2016). Liquid methanol (S1) is pumped (P1) up to 15 bar and mixed (B1) with a methanol recycle stream (S14) before it (S3) is preheated (H1) and fed into (S4) the DME synthesis reactor (DMESYN). In this reactor, the methanol is dehydrated into DME and a mix of DME, methanol and water leaves the reactor (S5). This mixture is then slightly depressurised (B2) and cooled down (H2) before entering the first distillation column (DIS1). In this column, DME is separated from methanol and water and leaves the top of the column at high purity (> 99.5%). The remaining water and methanol (S9) exits the column at the bottom and is slightly depressurised (B3) and fed into the second distillation column (S2). In the second column, the remaining methanol and water are separated. The water (S11) exits the column at the bottom and the methanol (S12) leaves at the top and is liquefied (H3) and pumped (P2) and mixed (B1) with the input methanol stream (S1).
Figure 5.5. Process flowsheet conventional DME production via methanol dehydration. Characteristics of each flow can be found in the supplementary data of the online version of the published article (Schakel et al., 2016).
5.2.4. Environmental Assessment
A hybrid life cycle assessment (LCA) was performed for the three cases: REF, CCU and CCS (description of the cases is presented in section 5.2.1). Hybrid life cycle approach combines economic and process data to develop inventories with good detail and completeness and can improve LCA modelling as conventional LCA comprises a high resolution in foreground processes but suffer from incomplete system boundaries. For a more detailed description of hybrid LCA

Chapter 5
162
see Hendrickson et al., (2006). Outputs of the technical simulation and data from the Ecoinvent v 2.2 database (Ecoinvent, 2010) were used for completing the life cycle inventory (LCI) for the operation, background and transport phases of the different processes in all three cases. Impacts from infrastructure of the H2 and carbon capture unit and novel (utilization) and conventional DME route were quantified by carrying out a hybrid LCI using cost data estimation which was performed using the results of the technical modelling (key assumptions and methodology are explained in Appendix II and the end of this chapter). The functional unit in this study is 1 MJ LHV of net energy (energy content of H2 and DME) produced.
Technical performance values used for the LCI of the CCU case comprised the amount of natural gas consumption, direct CO2 emissions from combustion of syngas, direct CO2 emissions from DME conversion, catalyst use, refrigerant consumption (for low temperature cooling during distillation) electricity consumption and water consumption. Technical performance values used for the LCI of the REF case and CCS case comprised methanol consumption, catalyst use, electricity consumption and water consumption. The LCI for methanol production was obtained from the inventory for chemical industries (Althaus et al., 2007) within the Ecoinvent database v2.2 (Ecoinvent, 2010) for natural gas based methanol plants.
Results from process simulations (Molburg et al., 2003) were used to quantify material (natural gas, ZnO adsorbent for desulphurization, water) and energy (electricity) inputs for H2 production. Catalyst consumption (for SMR and water gas shift reactor) was obtained from (Strømman et al., 2004) and the amount of adsorbent for the PSA unit was calculated using the adsorbent bed productivity reported by (Delgado et al., 2014). Life cycle inventory for catalyst and separation agents were modelled using the information for manufacturing of chemicals (Althaus et al., 2007) in Ecoinvent v 2.2 database (Ecoinvent, 2010). The lifetime of all catalysts was assumed to be 5 years as catalysts can be operated up to 5 years in a conventional H2 production unit (Wagner et al., 2003). 95% CO2 capture from the CO2 produced in the SMR was assumed (Meerman et al., 2012). Emissions associated with solvent degradation in the carbon capture unit were accounted based on MDEA degradation for post-combustion application (CSIRO, 2012).
The LCI for natural gas production and transport processes was based on the Dutch natural gas basket with 75.5% of the natural gas produced domestically and the rest being imported mainly from Norway, Russia and UK (EIA, 2015;

Assessing the techno-environmental performance of CO2 utilization via dry reforming of methane for the production of dimethyl ether
163
Eurogas, 2013). Inventories for country specific natural gas production processes (Dones et al., 2007) were obtained from Ecoinvent v.2.2 (Ecoinvent, 2010) with estimated transport distances to the case refinery location (assumed to be Rotterdam).
Inventories for the required on-site infrastructure (SMR unit, CO2 capture, CO2 compression train, chemical reactors etc.) were modelled using the hybrid approach. Capital cost for the plant islands were allocated to different economy sectors of the multiregional sectorial cash flow EXIOBASE 2 database (Tukker et al., 2013); the methodology for the applied capital cost assessment is described in Appendix II. CO2 transport and injection infrastructure was modelled by adapting the inventory reported for natural gas pipeline and well infrastructure (Dones et al., 2007) in the Ecoinvent v2.2 database (Ecoinvent, 2010) based on volume of CO2 being transported. Complete details on the LCI modelling are provided in Appendix III and the end of this chapter.
Environmental impacts over 18 different impact categories were evaluated per functional unit using the ReCiPe impact characterization method (ReCiPe, 2012). Human toxicity potential for MDEA was estimated using the characterisation factors employed for MEA reported by Veltman et al. (2010) as characterization factors for MEA emissions are not included in the ReciPe database.
Results 5.3.
Table 5.4 shows the main performance indicators (mass and energy balances) of the technical assessment of conventional DME production and CO2 utilization by dry reforming and DME synthesis. The dry reforming route requires 0.64 kg methane/kg DME, whereas 1.40 kg methanol/kg DME is used for conventional DME production. As 0.86 kg methane is required for the conventional production of 1.40 kg methanol (Ecoinvent, 2010), total chemical feedstock consumption is slightly reduced in the dry reforming route compared to the conventional production. Besides, there is a potential energy efficiency benefit as the production of methanol, which is more energy intensive than the production of methane, is also avoided in the dry reforming route.
The CO2 balance of the dry reforming route shows that the CO2 emitted in the process approaches the CO2 initially utilised. CO2 emitted in the process includes CO2 emissions from heat production for dry reforming (33%), CO2 directly formed during DME synthesis (61%) and unconverted CO2 (6%). In addition to

Chapter 5
164
the direct CO2 emissions from the process, also a large amount of electricity is required, predominately for the compression of the syngas.
The results also indicate that a larger amount of cooling water is required in the dry reforming case, mainly due to the cooling steps required between the compression stages of the syngas. Catalyst consumption is also larger, mainly due to a larger volume of the reactors compared to conventional production of DME. Refrigerant is consumed in the novel process for low temperature cooling during the distillation step for separating remaining syngas and CO2 from methanol and DME.
Table 5.4. Performance indicators technical assessment. Performance indicators (per kg DME produced)
Conventional DME production (REF and CCS case)
Dry reforming + direct DME synthesis (CCU case)
CO2 emitted (kg) - 1.60CO2 utilised (kg) - 1.76CO2 avoided (kg) - 0.15Methanol consumption (kg) 1.40 -Methane consumption (kg) - 0.64Total methane consumption (kg) 1) 0.862) 0.64Electricity consumption (kWh) 1.3E-03 0.81Cooling water requirement (kg) 23.9 77.2Catalyst consumption, γ/Al2O3 (mg) 0.79 -Catalyst consumption, Ni/Rh/Al2O3
(mg) - 4.29
Catalyst consumption, Pd/ZnO/Al2O3
(mg) - 3.70
Refrigerant (Freon-22) consumption (mg)
- 0.08
1) The total methane consumption is not a direct performance indicator, but is included in this table to compare the overall feedstock consumption of both production routes.
2) Methanol consumption is translated into methane consumption assuming 0.61 kg methane is used for the production of 1 kg methanol (Ecoinvent, 2010).

Assessing the techno-environmental performance of CO2 utilization via dry reforming of methane for the production of dimethyl ether
165
The technical performance indicators are used as key process data for the life cycle inventory to assess the environmental performance of the different cases over the entire life cycle. Figure 5.6 presents the life cycle environmental impacts for the storage (CCS) and utilization (CCU) cases relative to the reference case (REF) and the process contribution analysis for the three value chains (absolute values are provided in Appendix IV at the end of this chapter).
5.3.1. Climate Change Potential (CCP)
Climate change potential (CCP) is slightly decreased by approximately 8% for the CCU case compared to the reference case. CCP of the CCU case is 37% higher than the CCP of the CCS case. The relatively low net CCP avoidance in the CCU case is the consequence of the direct CO2 emissions from syngas combustion for the dry reforming process (9.7E-3 kg CO2eq/MJ), indirect emissions from electricity consumption required for syngas compression for DME conversion and direct emissions from DME conversion (2.4E-2 kg CO2eq/MJ) and indirect emissions from the supply of additional natural gas (2.1E-3 kg CO2eq/MJ). These emissions almost completely compensate the CCP reduction related to the captured CO2 emissions in the SMR (2.5E-2 kg CO2eq/MJ) and to the substitution of methanol (1.5E-2 kg CO2eq/MJ).
The CCP in the CCU case mostly originates from CO2 formation during DME conversion (39%), emissions from the furnace for H2 production (33%) and emissions from the furnace for dry reforming (16%). The CCP of the DME conversion process is driven by direct CO2 formation (64%) and background impacts from electricity generation required for syngas compression. The CCP associated with the dry reforming process comprises CO2 emissions from syngas combustion in the furnace and unconverted CO2. The CCP of H2 production is caused by CO2 emissions from the furnace (92%) and uncaptured CO2 from the SMR (7%). Natural gas transport processes account for 57% of the CCP of the natural gas supply chain (mainly due to CO2 and CH4 combustion emissions in gas turbines to provide electricity in compression station).
The CCP in the REF case is dominated by H2 production (70%) which is mainly attributed to CO2 emissions from the SMR (60%) and furnace (40%). The CCP of H2 production is halved in the CCS and CCU case as 90% of the CO2 is captured from the SMR in these cases. The CCP associated to methanol production contributes significantly (24% in REF and 34% in CCS), while the CCP related to CO2 transport and storage only contributes marginally (< 4%) to the total CCP in the REF case.
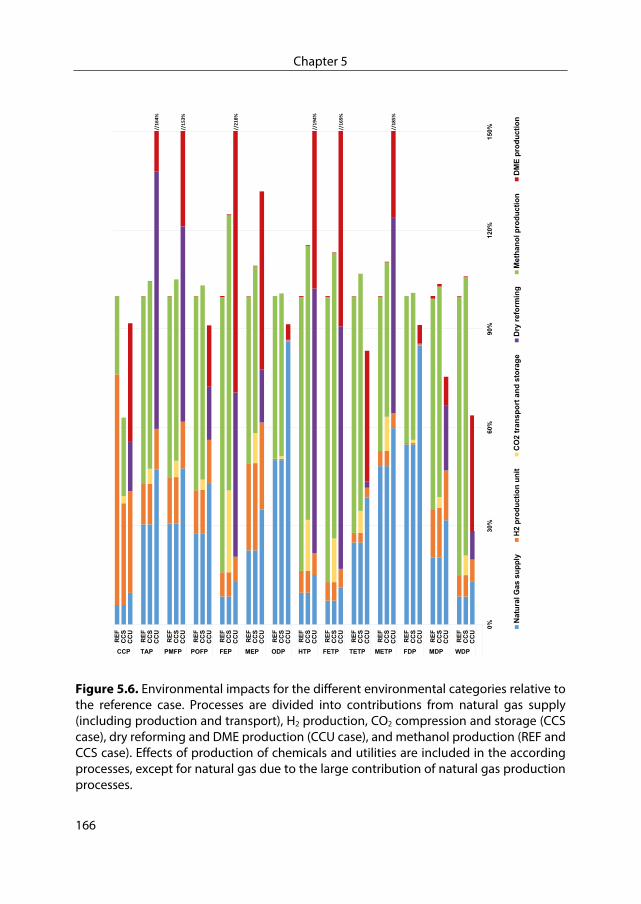
Chapter 5
166
Figure 5.6. Environmental impacts for the different environmental categories relative to the reference case. Processes are divided into contributions from natural gas supply (including production and transport), H2 production, CO2 compression and storage (CCS case), dry reforming and DME production (CCU case), and methanol production (REF and CCS case). Effects of production of chemicals and utilities are included in the according processes, except for natural gas due to the large contribution of natural gas production processes.
0%
30%
60%
90%
120
%15
0%
CC
UC
CS
RE
F
CC
UC
CS
RE
F
CC
UC
CS
RE
F
CC
UC
CS
RE
F
CC
UC
CS
RE
F
CC
UC
CS
RE
F
CC
UC
CS
RE
F
CC
UC
CS
RE
F
CC
UC
CS
RE
F
CC
UC
CS
RE
F
CC
UC
CS
RE
F
CC
UC
CS
RE
F
CC
UC
CS
RE
F
CC
UC
CS
RE
F
WDPMDPFDPMETPTETPFETPHTPODPMEPFEPPOFPPMFPTAPCCP
Nat
ura
l Gas
sup
ply
H2
pro
du
ctio
nu
nit
CO
2tr
ansp
ort
and
sto
rag
eD
ryre
form
ing
Met
han
olp
rod
uct
ion
DM
Ep
rod
uc
tio
n
//185%
//169%
//194%
//218%
//164%
//153%
Assessing the techno-environmental performance of CO2 utilization via dry reforming of methane for the production of dimethyl ether
167
5.3.2. Other environmental impacts
The CCS case increases the impact of all other environmental indicators except climate change potential (CCP), because CO2 is captured, transported and stored at the cost of additional utilities (mostly electricity for compression) and chemicals (mostly solvent for capture), while the reduction of CO2 emissions only improves the CCP performance. The CCU case provides a more diverse picture, as the impact of some indicators is actually reduced compared to the CCS case while some other indicators show an increase in the impact.
The environmental impact is reduced in the CCU case compared to the REF and CCS cases for indicators where impacts of conventional methanol production in the REF and CCS cases are larger than the impacts associated with additional supply of natural gas, the dry reforming process and the DME production process in the CCU case. The CCU case shows lower impacts in the categories:
Photochemical oxidant formation potential (POFP). POFP is reduced by 9% and 11% compared to the Ref and CCS cases, respectively. Almost half (47%) of the total POFP originates from natural gas production and transport, mainly caused by the combustion related emissions (NOx, CO and CH4) in the production plant and compression stations. The large impact of methanol production in the REF case (55%) and CCS case (53%) associated with combustion emissions from methanol production and the natural gas value chain more than compensate POFP impacts related to fossil based electricity generation in the CCU case.
Ozone depletion potential (ODP). ODP is 9% lower than both the REF case and
CCS case. 94% of the ODP occurs in the natural gas value chain as a result of emissions of compounds such as chlorodifluoromethane and halon related to natural gas transport. Similar impacts of background natural gas transport processes in the methanol value chain in the REF and CCS case offset the additional natural gas required in the CCU case.
Terrestrial eco-toxicity potential (TETP). TETP is reduced by 16% and 22%
compared to the Ref case and CCS case, respectively. The TETP is driven by the DME production process (48%), mainly caused by disposal of wood ash for bio-fuelled power plants, and the disposal of waste in natural gas value chain (46%). In the REF and CCS case, methanol production is the largest contributor (72% in REF and 67% in CCS) attributed to the liquid effluents

Chapter 5
168
from the methanol plant and to waste disposal during the natural gas consumption along the methanol value chain.
Fossil depletion potential (FDP), metal depletion potential (MDP) and water
depletion potential (WDP). FDP, MDP and WDP are reduced by 10%, 32%% and 37%, respectively, compared to the REF case and by 9%, 27% and 40%, respectively, compared to the CCS case. FDP is dominated by the natural gas value chain (93%) and the decrease is the result of reduced natural gas consumption in the CCU case. The main contributor to MDP is the infrastructure development of the natural gas value chain (42%) followed by the impacts associated with Rh mining for the synthesis of the dry reforming process (26%). Reduced natural gas consumption and avoided methanol production infrastructure leads to lower MDP in the CCU case. WDP is mainly attributed to the novel DME production process (55%) caused by cooling water demand of the process and the indirect cooling water use of electricity production. WDP associated with methanol production is considerably higher (85% of REF, 80% of CCS) resulting in reduced WDP in CCU.
The impact of catalyst use (mainly Rhodium) in the dry reforming process and electricity demand of the syngas conversion for the DME production leads to an increase in environmental impact for the indicators:
Terrestrial acidification potential (TAP). TAP is increased by 65% and 52% compared to the REF case and CCS case, respectively. This increase is mainly driven by the impacts from the dry reforming process accounting for 47% of the life cycle value for this indicator, consequence of NOx and SOx emissions during Rhodium refining. The large contribution of methanol production in the REF case and CCS case (67% and 64% respectively) is the result of emissions from the combustion of natural gas in the furnace of the methanol plant and from the distillation towers.
Particulate matter formation potential (PMFP). PMFP is increased by 50% and
43% compared to the REF case and CCS case, respectively. This increase is mainly caused by the impacts from the dry reforming process, the supply of extra natural gas and the DME novel process that are responsible of 40%, 30% and 20% of the life cycle value for this indicator in the CCU case. PMFP from the dry reforming value chain is mainly caused by the emission of NOx, SOx and particulates in the Rhodium mining process. Combustion emissions at the natural gas plant facilities are the main contributor to PMFP for the

Assessing the techno-environmental performance of CO2 utilization via dry reforming of methane for the production of dimethyl ether
169
natural gas supply and fossil based power generation required for compressing the syngas is the main contributing process associated with DME production.
Freshwater eutrophication (FEP) and marine eutrophication (MEP) potential.
FEP increases by 118% and 73% compared to the CCU case and CCS case, respectively, and MEP by 31% and 20%, respectively. FEP and MEP are mainly driven by the impacts from the DME novel process (67% and 41%) due to the impacts of fossil fuelled electricity production (mainly related to the disposal of coal mining waste). Disposal of sulfidic tailings associated to rhodium mining is the second largest contributor (23%) for FEP. In the REF and CCS case, methanol production contributes mostly to FEP (84% and 67%, respectively) primarily caused by coal mining disposals in the underlying electricity production processes, and to MEP (51% and 46%, respectively) due to combustion emission at methanol production site.
Human toxicity potential (HTP). HTP increases by 94% and 68% compared to
the REF case and CCS case, respectively. The largest contributors are the DME process (47%), mainly due to coal mining disposal from electricity production (47%), and dry reforming process (41%), caused by sulfidic tailings and liquid effluents from the rhodium mining. In the REF case and CCS case, the methanol value chain is the main contributor (83% and 72%, respectively) as a result of disposal of the liquid effluents from the methanol plant (containing formaldehyde and phenols).
Freshwater eco-toxicity potential (FETP) and marine eco-toxicity potential
(METP). FETP and METP are increased by 69% and 78%, respectively, compared to the REF case and by 62% and 43%, respectively, to the CCS case. The DME production process is the major contributor (46% for FETP, 34% for METP), largely attributed to the disposal of coal mining tailings in coal production for electricity generation, followed by the dry reforming process (43% for FETP, 32% for METP) as a consequence of rhodium mining disposals. FETP from methanol production is mainly attributed to the liquid effluents from the plant and METP originates from background electricity generation for the power consumed in the methanol production plant.
The indicators Ionising radiation potential (IRP), Agricultural land occupation potential (ALOP) and Urban land occupation (ULOP) are increased in the CCU case compared to the REF and CCS case, predominately due to the electricity consumption required for syngas compression for the DME production process.
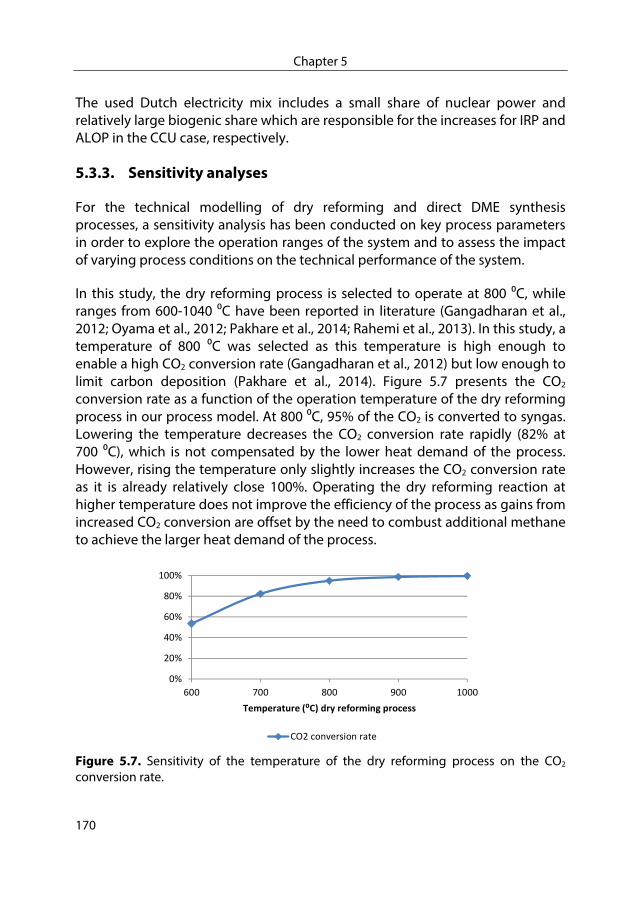
Chapter 5
170
The used Dutch electricity mix includes a small share of nuclear power and relatively large biogenic share which are responsible for the increases for IRP and ALOP in the CCU case, respectively.
5.3.3. Sensitivity analyses
For the technical modelling of dry reforming and direct DME synthesis processes, a sensitivity analysis has been conducted on key process parameters in order to explore the operation ranges of the system and to assess the impact of varying process conditions on the technical performance of the system.
In this study, the dry reforming process is selected to operate at 800 0C, while ranges from 600-1040 0C have been reported in literature (Gangadharan et al., 2012; Oyama et al., 2012; Pakhare et al., 2014; Rahemi et al., 2013). In this study, a temperature of 800 0C was selected as this temperature is high enough to enable a high CO2 conversion rate (Gangadharan et al., 2012) but low enough to limit carbon deposition (Pakhare et al., 2014). Figure 5.7 presents the CO2 conversion rate as a function of the operation temperature of the dry reforming process in our process model. At 800 0C, 95% of the CO2 is converted to syngas. Lowering the temperature decreases the CO2 conversion rate rapidly (82% at 700 0C), which is not compensated by the lower heat demand of the process. However, rising the temperature only slightly increases the CO2 conversion rate as it is already relatively close 100%. Operating the dry reforming reaction at higher temperature does not improve the efficiency of the process as gains from increased CO2 conversion are offset by the need to combust additional methane to achieve the larger heat demand of the process.
Figure 5.7. Sensitivity of the temperature of the dry reforming process on the CO2 conversion rate.
0%
20%
40%
60%
80%
100%
600 700 800 900 1000
Temperature (⁰C) dry reforming process
CO2 conversion rate

Assessing the techno-environmental performance of CO2 utilization via dry reforming of methane for the production of dimethyl ether
171
Direct DME synthesis with a Pd/ZnO/Al2O3 catalyst is reported to operate well within a temperature range of 250-380 0C and a pressure of 79 bar (Lebarbier et al., 2012). Figure 5.8 shows the impact of the temperature of the direct DME synthesis process on the syngas reforming ratio and amount of methanol and DME produced for the process model used in this study. At lower temperatures, direct DME synthesis is more efficient and is also accompanied by less co-production of methanol (from <400 kg/hr at 250 0C to >800 kg/hr at 340 0C). These findings are in agreement with the results produced by Lebarbier et al. (2012).
Figure 5.8. Sensitivity of the temperature of direct DME synthesis on the syngas reforming ratio, methanol production and DME production.
Figure 5.9 presents the impact of the pressure of the DME synthesis on the on the syngas reforming ratio and amount of methanol and DME produced for the process model used in this study. The decrease in syngas reforming ratio and DME production is only limited when lowering the pressure in the range of 40-90bar but becomes more substantial once pressures below 20 bars are considered. No significant impact is observed on the amount of methanol co-produced at different pressure rates. As the difference between the syngas reforming ratio at the selected pressure of 79 bar (91%) and at 40 bar (86%), is relatively small, and the electricity requirement of compression the syngas significantly contributes to the environmental performance of the technology, it is interesting to investigate to what extent the environmental performance would improve if direct synthesis could be operated at 40 bar instead of 79 bar.
0
5000
10000
15000
20000
25000
30000
0%
20%
40%
60%
80%
100%
120%
200 220 240 260 280 300 320 340 360 380 400
Productio
n (kg/h
r)
Temperature (⁰C) direct DME synthesis
Syngas reformed (%) Methanol produced (kg/hr) DME produced (kg/hr)

Chapter 5
172
Figure 5.9. Sensitivity of the pressure of direct DME synthesis on the syngas reforming ratio, methanol production and DME production.
Figure 5.10. Life cycle CO2 equivalent emissions in g per MJ H2 and DME produced for the reference case (REF) and the CO2 utilization case (CCU) for different applied DME synthesis process pressures divided in contributions from natural gas production, H2 production, dry reforming process, DME synthesis, methanol production and CO2 transport and storage.
0
5000
10000
15000
20000
25000
30000
0%
20%
40%
60%
80%
100%
0 10 20 30 40 50 60 70 80 90 100
Productio
n (kg/h
r)
Pressure (bar) direct DME synthesis
Syngas reformed (%) DME produced (kg/hr) Methanol produced (kg/hr)
0
0.01
0.02
0.03
0.04
0.05
0.06
0.07
REF 40 bar 60 bar 80 bar
CCP (kg CO2eq/M
J)
Nat Gas supply H2 production unit CO2 compression and storage Dry reforming MetOH production DME production

Assessing the techno-environmental performance of CO2 utilization via dry reforming of methane for the production of dimethyl ether
173
Figure 5.10 presents the life cycle GHG emissions for the CCU case with DME synthesis pressures of 40 bar, 60 bar and 79 bar (original CCU case). Although lower pressures decrease the electricity consumption, this decrease is not sufficient to compensate the lower syngas conversion to DME rates. Therefore, even if the DME synthesis process could operate at lower pressures, no significant CCP reduction is expected to be obtained when modifying the operating pressures.
Discussion and Conclusion 5.4.
5.4.1. Technical Assessment
The technical modelling conducted in this study served as the basis for exploring the techno-environmental performance of CO2 utilization by dry reforming of natural gas for the production of dimethyl ether (DME). As the goal of the study was to explore the performance of this utilization route, a relative low modelling resolution was selected for the process. Process optimization and heat integration with other refinery processes have not been considered. In the process model, the heat required for the dry reforming process is generated by combustion of excess syngas, and waste heat streams, such as the flue gas from the furnace, are not utilised. If excess heat would be available at the refinery, this could be used to (pre)heat the CO2 and methane. Less syngas would then be required for heat generation and the amount of methane used for the dry reforming process could be reduced, potentially improving the technical and environmental performance of the technology. However, this improvement would be limited to the portion of syngas that can be converted to DME. If there is a large amount of waste heat available, one might consider recycling the syngas into the DME reactor to increase the syngas conversion rate and DME production and therefore improve the performance of the production process.
The catalysts for the dry reforming process and DME synthesis were selected based on their promising performance reported in literature. The process conditions applied in the process model are considered the optimum conditions for the selected catalysts (Gangadharan et al., 2012; Lebarbier et al., 2012). Nevertheless, there is a wider range of conditions in which the dry reforming process and DME synthesis can be operated. The sensitivity analysis performed on the process conditions (section 5.3.3) showed that altering these conditions only has a limited effect on the performance of the technology. Further improving the catalysts, enabling higher CO2 conversion rates at lower temperatures during the dry reforming reaction and higher syngas conversion

Chapter 5
174
rates at lower pressure during the DME synthesis, could potentially reduce the amount of heat and electricity required during the process. However, potential gains are expected to be limited as this study already assessed novel catalysts and selected process conditions, especially for the dry reforming reaction, are already close to the thermodynamic minimum.
The results of the technical assessment show that the CO2 almost all CO2 that is utilised in the process is emitted again during the process (1.60 kg CO2 is emitted per 1.76 kg CO2 utilised for the production of 1 kg DME). The majority, over 60%, of the CO2 emitted in the process is formed during the syngas conversion into DME and cannot be avoided or reduced. Even though the remaining CO2 emissions (from heat production and unreacted CO2) could be reduced by further process optimization or improvement, the CO2 avoidance potential of this CO2 utilization route will always remain confined by the CO2 formation during the DME synthesis.
5.4.2. Environmental Assessment
A hybrid life cycle assessment (LCA) was conducted to compare the environmental performance of the CO2 utilization via dry reforming for the production of DME (CCU) with a storage case (CCS) and a reference case (REF). The CCU case slightly reduces climate change potential (CCP) compared to the REF case, despite the large amount of CO2 emissions from DME synthesis and background processes of production of electricity required for the syngas compression. These CO2 emissions are compensated by the background life cycle GHG emissions of methanol production and the non-captured CO2 emissions in the H2 production unit in the refinery. However, although the reduction on the CCP is lower in the CCU than in the CCS case, the CCU case performs slightly better for some categories while the performance of some other indicators is drastically reduced. The environmental trade-offs of CCU appear more complex than those of CCS, and strongly depend on the value of decreasing CCP at the cost of increasing impacts in other indicators.
In this study, a comparative life cycle assessment is performed by system expansion: the utilization case is compared to a reference case in which an equal amount of products, H2 and DME, are delivered to the system. When using system expansion, the choice of reference system might be the most important assumption affecting the comparative LCA results for CO2 utilization (Skone et al., 2015). This is underlined in this study, as the conventional DME production, especially the background processes for methanol production, largely

Assessing the techno-environmental performance of CO2 utilization via dry reforming of methane for the production of dimethyl ether
175
contributes to the LCA results of the reference case. In the reference case, DME is considered to be produced by direct synthesis of methanol (methanol dehydration), and the production process for the required methanol for this process is assumed to be equal to the average global methanol production as included in the Ecoinvent database (Ecoinvent, 2010). Direct synthesis of DME from methanol is considered the most common method to produce DME (Azizi et al., 2014). Methanol is mostly produced from natural gas, but can also be produced form a wide variety of different feedstocks, including biomass and waste (Riaz et al., 2013). However, applying a different reference system, in which a lower environmental footprint of the production methods of methanol and/or electricity is considered, might strongly affect the reported differences in the LCA results between utilization case and reference case.
5.4.3. Performance CCU
The performance results of the CO2 utilization case illustrate that the CO2 reduction potential is limited compared to that of CCS case. The climate change potential (CCP) over the life cycle is 37% higher in the utilization case compared to CCS case while still 8% lower compared to the REF case. CO2 utilization options generally have a significant lesser GHG emission reduction potential compared to CCS (Cuéllar-Franca et al., 2015). Comparing the CCP of CO2 utilization with CO2 storage is therefore not sufficient to fully understand the performance of CO2 utilization. CCP reduction of CO2 utilization technologies is reported in the range of 4-48% (Cuéllar-Franca et al., 2015). The CCP reduction of dry reforming for the production of DME is at the lower end of this range.
CCS increases the impact of all other environmental indicators except CCP while the direction of the impact of CO2 utilization in these indicators is not consistent. The environmental picture for CO2 utilization options is still under development contrary to that of CCS (Corsten et al., 2013). Some studies assessed in Cuéllar et al. (2015) are reported to have lower impacts in other environmental categories than CCS. While this holds in this study for some of the indicators (such as ozone depletion potential and fossil, metal and water depletion), concerns arise due to the substantial increase in some of the environmental indicators, such as freshwater eutrophication potential, human toxicity potential and agricultural land occupation.
Therefore, it remains difficult to draw robust conclusions on the total environmental performance of CO2. However, if avoiding climate change is considered the key driver for CCU, the potential GHG reduction of the utilization
Chapter 5
176
case is low compared to CCS and the potential environmental benefits of this CO2 utilization option seem limited. This study points out the importance of carrying out integrated technical assessment and LCA to gain better insights in the performance of CCU options.
Acknowledgements
This research has been carried out as part the EDDiCCUT project (www.eddiccut.com). EDDiCCUT was a 4 year research project (2012-2016) assessing the environmental performance of carbon capture and utilization technologies. The project was led by the Industrial Ecology Programme at Norwegian University of Science and Technology in collaboration with the Copernicus Institute at Utrecht University and Tel‐Tek in Porsgrunn. The project was supported by Gassnova and industrial partners (Bharat Petroleum, Norske Shell and Uniper).

Assessing the techno-environmental performance of CO2 utilization via dry reforming of methane for the production of dimethyl ether
177
Appendix I: Schematics of processes included in the different value chains
The schematics presented in this appendix display the three value chains under study, their main foreground processes, and inputs from the background and system boundaries.
Reference case (REF): includes the H2 production unit of a refinery (steam methane reforming process) and conventional DME synthesis by dehydrogenation of methanol. Natural gas supply chain is also considered (production and transport). Electricity and chemical production processes (catalyst, solvents and sorbents) are part of the background processes.
Figure 5.11. Value chain reference case (REF).
Natural gas supply H2 production at refinery without CO2
capture
WGSSyngas
PSA
SMR
Furnace
Flue Gas
Onshore production
Offshore production
TransportPre‐
treatment
Steam
PSA offgas (steam, CO2, traces of methane, CO and H2)
Conventional DME production
DistillationDME
Methanol dehydration
H2Electricity
Methanol Synthesis processes catalyst
catalyst
adsorbent
Methanol productioncatalyst
catalyst
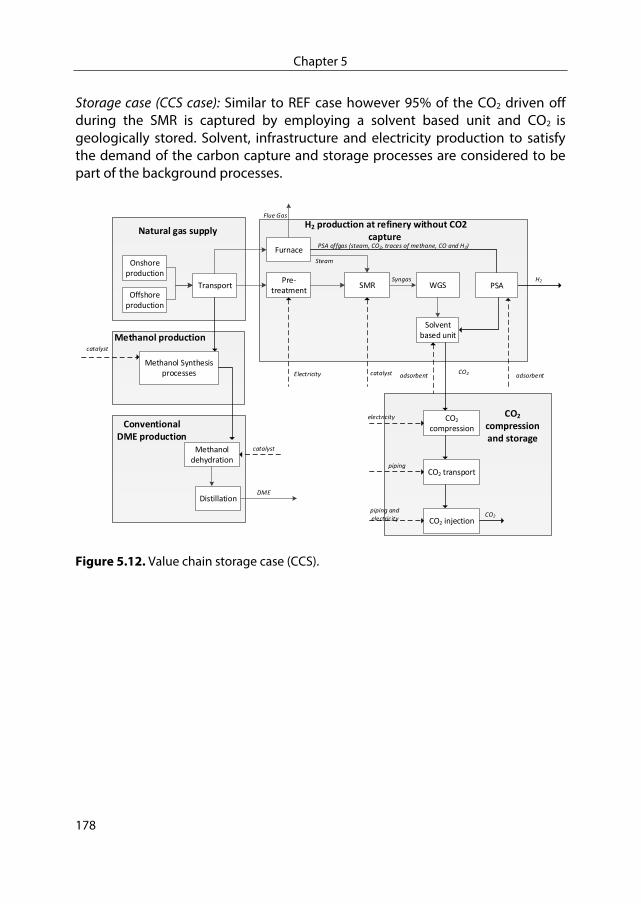
Chapter 5
178
Storage case (CCS case): Similar to REF case however 95% of the CO2 driven off during the SMR is captured by employing a solvent based unit and CO2 is geologically stored. Solvent, infrastructure and electricity production to satisfy the demand of the carbon capture and storage processes are considered to be part of the background processes.
Figure 5.12. Value chain storage case (CCS).
Natural gas supply H2 production at refinery without CO2
capture
WGSSyngas
Solvent based unit
SMR
Furnace
Flue Gas
Onshore production
Offshore production
TransportPre‐
treatment
Steam
PSA offgas (steam, CO2, traces of methane, CO and H2)
Conventional DME production
DistillationDME
Methanol dehydration
H2
Electricity
Methanol Synthesis processes catalyst adsorbentadsorbent
Methanol productioncatalyst
catalyst
PSA
CO2
CO2
compression
CO2 transport
CO2 injection
CO2 compression and storage
CO2
electricity
piping
piping and electricity

Assessing the techno-environmental performance of CO2 utilization via dry reforming of methane for the production of dimethyl ether
179
Utilization case (CCU case): 95% of the CO2 driven off during the SMR is captured by employing a solvent based unit and it reacts with natural gas (dry reforming process) to obtain syngas and synthetize DME. Production routes for chemicals (catalysts and sorbents) and for consumed power are part of the background processes.
Figure 5.13. Value chain utilization case (CCU).
Natural gas supply H2 production at refinery with CO2 capture
Dry reforming
WGSSyngas
Solvent seperation
PSA
CO2
SMR
Furnace
Flue Gas
Onshore production
Offshore production
TransportPre‐
treatment
Steam
PSA offgas (steam, traces of methane, CO, CO2 and H2)
Heat
Pre‐treatment
Dry reforming
DME production
DME synthesis
Syngas(CO + H2)
Distillation
DME
Furnace
Compression
Heat
H2
Flue gas
solvent
sorbent
catalyst
catalyst
catalystelectricity
Chapter 5
180
Appendix II: Hybrid LCI
A hybrid LCI was composed for the infrastructure processes related to the H2 production unit, the solvent based CO2 capture unit, the CO2 compression train, the dry reforming process and the DME synthesis. This appendix presents the capital cost estimation methodology and the key assumptions concerning the allocation of CAPEX into different economic sectors of multiregional sectorial cash flow EXIOBASE 2 database (Tukker et al., 2013).
CAPEX estimation
The detail factor method was used to estimate the capital cost for the hybrid LCI. The detail factor method is a valid method in early phase cost estimation similar to the simple factor method, but accounts for separate costs items following equation 4.6 (Towler et al., 2013).
∑ ⋯ (eq 4.6)
In which ECi is the equipment cost of equipment I in carbon steel and Fa, Fb, and Fz are factors for separate cost items (Towler et al., 2013). The equipment costs are derived from the following (priority list):
Quoted offer Budget prices In house data from technology providers Cost databases (Icarus and others) Books (for example: A Guide to Capital Cost Estimating and others) Designing equipment with unit prices (USD/kg, USD/m2, USD/m3 …..)
The factors for separate costs items account for erection cost, piping, electro, instrument, ground work, steel and concrete insulation engineering, administration, commission and contingency. The factors do not include land purchase and preparation, long pipelines or belt conveyors, workshops, ware house or office buildings.
Table 5.5 presents the total cost estimation for the processes assessed in the hybrid LCI. Most cost data is derived from the “Aspen In plant cost estimator” database. The data is converted from EUR 2010 to EUR 2014 by exponential methods and price indexes from Eurostat (European statistic database). The

Assessing the techno-environmental performance of CO2 utilization via dry reforming of methane for the production of dimethyl ether
181
accuracy of the cost estimation is assumed to be about +/- 40 % (80 % confidence interval) for all equipment included.
Table 5.5. Total CAPEX estimation for the different processes addressed in the hybrid LCI. Process Total CAPEX (MEU 2014)H2 production 114.8CO2 capture 3.8CO2 compression 12.4Dry reforming 5.4Direct DME synthesis 50.5Conventional DME production 7.1
Hybrid LCI modelling
The Economic Input-Output Life Cycle Assessment (EIO-LCA) method estimates the materials and energy resources required for, and the environmental emissions resulting from, activities in the economy. The method uses information about industry transactions, purchases of materials by one industry from other industries and direct environmental emissions of industries, to estimate the total emissions throughout the supply chain (Hendrickson et al., 2006).
The economic inputs for the EXIOBASE v2.2 database were estimated using the CAPEX for the different plant processes presented in Table 5.5. The CAPEX was allocated to different economy sectors of the input/output database, taking into account the cost distribution that EIA (EIA, 2013) presents for integrated gasification plants (since an IGCC and a SMR unit present analogous plant islands). The fractions of the CAPEX components were allocated to the most similar EXIOBASE sectors. The used shares and corresponding sectors are presented in Table 5.6.
Table 5.6. Shares of different economy sectors in infrastructure investment. Capex Distribution Components (EIA, 2013)
Share (EIA, 2013)
Corresponding EXIOBASE Sectors
Mechanical components of the equipment and piping
0.78 Manufacture of machinery and equipment
Electrical component and instrumentation
0.15 Manufacture of electrical machinery and apparatus
Civil and structural costs 0.07 Construction

Chapter 5
182
Appendix III: Life cycle assessment modelling
The following tables display the material and energy inputs and the emission factors associated with the main processes in the value chain on a per functional unit basis. As explained in the main text of the article, results from detailed process simulation works are employed for the modelling of the H2 production unit, carbon capture and utilization processes. Data for background processes are based on the information provided by Ecoinvent v.2.2 as presented in Table 5.7 to Table 5.14.
Table 5.7. Ecoinvent v.2.2. data for natural gas production. Natural gas production and transport 1 kg of NG Natural gas, at production offshore/ NL/ Nm3 2.61E-11) Natural gas, at production onshore/ NL/ Nm3 7.87E-1 Natural gas, at production offshore/ NO/ Nm3 1.78E-1 Natural gas, at production offshore/ GB/ Nm3 9.34E-2 Natural gas, at production onshore/ DK/ Nm3 1.24E-2 Natural gas, at production onshore/ DE/ Nm3 1.07E-2 Natural gas, at production onshore/ RU/ Nm3 5.34E-2 Transport, natural gas, offshore pipeline, long distance/ NO/ tkm 3.47E-22)3) Transport, natural gas, pipeline, long distance/ DE/ tkm 2.76E-3 Transport, natural gas, pipeline, long distance/ RU/ tkm 2.34E-1 Transport, natural gas, pipeline, long distance/ NL/ tkm 4.52E-1 1) Based on the information for the natural gas production and imports for the
Netherlands in 2012 (EIA, 2015; Eurogas, 2013). 2) Distances are calculated considering the largest production gas fields from the
importing countries connected to international pipeline systems. Transport from Den Helder distribution hub to Rotterdam is also taken into account.
3) LCI for transport data for natural gas transport in Norway was used due to the absence of data for UK and Denmark and considering that the gas fields for the UK and Denmark are also located in the North Sea similar to the Norwegian ones.

Assessing the techno-environmental performance of CO2 utilization via dry reforming of methane for the production of dimethyl ether
183
Table 5.8. Ecoinvent v.2.2. data for CO2 capture solvent production. Solvent 1 kg Techno sphere Methylamine, at plant/ RER/ kgEthylene oxide, at plant/ RER/ kg Electricity, medium voltage, production UCTE, at grid/ UCTE/ kWh Heat, natural gas, at industrial furnace >100kW/ RER/ MJ Transport, lorry >16t, fleet average/ RER/ tkm Transport, freight, rail/ RER/ tkm
4.13E-14) 5.86E-15) 3.33E-16) 2.00E+0 1.60E-1 9.63E-1
Chemical plant, organics/ RER/ unit 4.00E-10
Emissions Nitrate, water, river, kg 6.97E-3 Ammonium, ion, water, river, kg 3.04E-3 water, lake, resource, in water, m3 2.4E-2 water, river, resource, in water, m3 8.2E-4 carbon dioxide, fossil, air, high population density, kg 2.65E-2 ethylene oxide, air, high population density, kg 1.63E-3 ethylene oxide, water, river, kg 1.47E-3 ammonia, air, high population density, kg 1.58E-3 toc, total organic carbon, water, river, kg 8.02E-3 heat, waste, air, high population density, MJ 1.20E+0 cod, chemical oxygen demand, water, river, kg 2.13E-2 bod5, biological oxygen demand, water, river, kg 2.13E-2 doc, dissolved organic carbon, water, river, kg 8.02E-3 4) Despite that the solvent is a mixture of MDEA and PZ, the LCI for the separation
agent is modelled just considering the MDEA value chain since the ratio PZ/MDEA is 1/9 (Meerman et al., 2013)
5) Data from environmental assessment of CCS applied solvent production (IEAGHG, 2006).
6) Assuming equal requirements and emissions to MEA production.
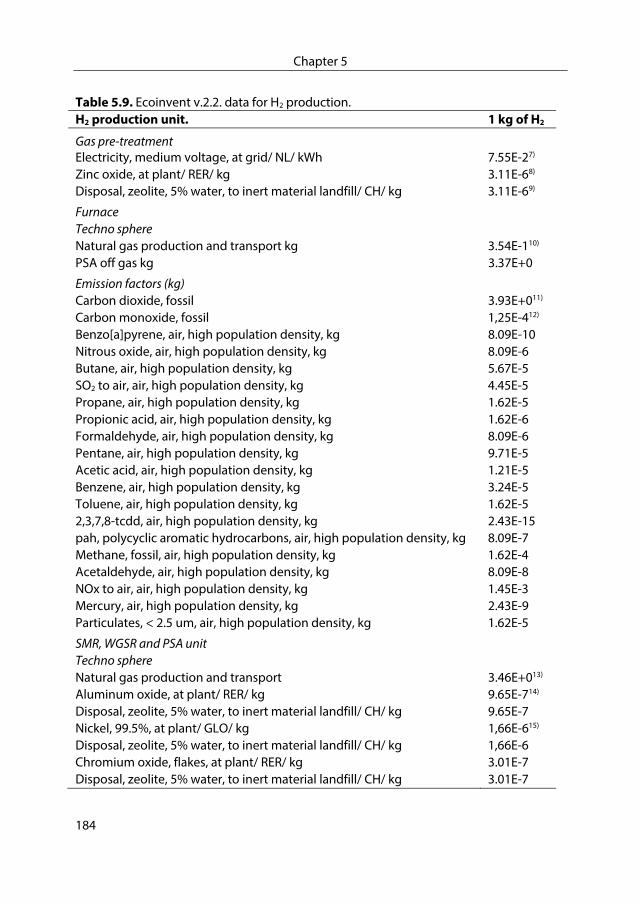
Chapter 5
184
Table 5.9. Ecoinvent v.2.2. data for H2 production. H2 production unit. 1 kg of H2
Gas pre-treatment Electricity, medium voltage, at grid/ NL/ kWh 7.55E-27) Zinc oxide, at plant/ RER/ kg 3.11E-68) Disposal, zeolite, 5% water, to inert material landfill/ CH/ kg 3.11E-69)
Furnace Techno sphere Natural gas production and transport kg 3.54E-110) PSA off gas kg 3.37E+0
Emission factors (kg)Carbon dioxide, fossil 3.93E+011)
Carbon monoxide, fossil 1,25E-412)
Benzo[a]pyrene, air, high population density, kg 8.09E-10 Nitrous oxide, air, high population density, kg 8.09E-6 Butane, air, high population density, kg 5.67E-5 SO2 to air, air, high population density, kg 4.45E-5 Propane, air, high population density, kg 1.62E-5 Propionic acid, air, high population density, kg 1.62E-6 Formaldehyde, air, high population density, kg 8.09E-6 Pentane, air, high population density, kg 9.71E-5 Acetic acid, air, high population density, kg 1.21E-5 Benzene, air, high population density, kg 3.24E-5 Toluene, air, high population density, kg 1.62E-5 2,3,7,8-tcdd, air, high population density, kg 2.43E-15 pah, polycyclic aromatic hydrocarbons, air, high population density, kg 8.09E-7 Methane, fossil, air, high population density, kg 1.62E-4 Acetaldehyde, air, high population density, kg 8.09E-8 NOx to air, air, high population density, kg 1.45E-3 Mercury, air, high population density, kg 2.43E-9 Particulates, < 2.5 um, air, high population density, kg 1.62E-5
SMR, WGSR and PSA unitTechno sphere Natural gas production and transport 3.46E+013) Aluminum oxide, at plant/ RER/ kg 9.65E-714) Disposal, zeolite, 5% water, to inert material landfill/ CH/ kg 9.65E-7 Nickel, 99.5%, at plant/ GLO/ kg 1,66E-615) Disposal, zeolite, 5% water, to inert material landfill/ CH/ kg 1,66E-6 Chromium oxide, flakes, at plant/ RER/ kg 3.01E-7 Disposal, zeolite, 5% water, to inert material landfill/ CH/ kg 3.01E-7

Assessing the techno-environmental performance of CO2 utilization via dry reforming of methane for the production of dimethyl ether
185
H2 production unit. 1 kg of H2 Calcium chloride, CaCl2, at plant/ RER/ kg 4.02E-7 Disposal, zeolite, 5% water, to inert material landfill/ CH/ kg 4.02E-7 Copper oxide, at plant/ RER/ kg 3.03E-6 Disposal, zeolite, 5% water, to inert material landfill/ CH/ kg 3.03E-6 Water, completely softened, at plant/ RER/ kg 1.07E+1 Water, decarbonised, at plant/ RER/ kg 1.07E+1 Zeolite, powder, at plant/ RER/ kg 1.32E-816) Disposal, zeolite, 5% water, to inert material landfill/ CH/ kg 1.32E-8
Emissions Carbon dioxide, fossil kg 5.94E+017) 7) Electricity consumption based on H2 production unit simulation (Molburg et al.,
2003). 8) (Molburg et al., 2003) 9) ZnS is assumed to be disposed as spent zeolite since both are absorbent inert
material. 10) The steam for the carbon capture unit is sourced by the cooling down of the
effluents from the water gas shift reactor. No production target for the SMR has been assumed.
11) Including the emissions from natural gas combustion and unconverted CO from the PSA off stream in the furnace.
12) For non CO2 and trace air pollutants, emissions factors for natural gas combustion reported by Ecoinvent v.2.2 (Ecoinvent, 2010).
13) Data based on SMR simulation (Molburg et al., 2003). 14) Amount of SMR and WGSR catalysts from LCA study for H2 production via SMR
(Strømman et al., 2004). 15) Catalyst disposal is modelled as zeolite disposal (inert material in landfill). 16) Deployed for bed productivity for zeolite adsorption bed for H2 production (Delgado
et al., 2014). 17) CO2 emissions estimated using the stream composition for the DOE SMR unit.

Chapter 5
186
Table 5.10. Ecoinvent v.2.2. data for CO2 capture process. Solvent based CO2 capture 1 kg CO2
Technosphere Solvent at plant/ RER/ kg 2.15E-318)
Water, completely softened, at plant/ RER/ kg 1.40E-2Water, decarbonised, at plant/ RER/ kg 1.40E-2
Emissions Carbon dioxide, fossil,kg -9,50E-1Formic acid, air, unspecified, kg 1.33E-819)
Acetic acid, air, unspecified, kg 1.74E-8Oxalic acid, air, unspecified, kg 3.65E-8Formamide, air, unspecified, kg 2.61E-8N-nitrosodiethanolamine, air, unspecified, kg 1.30E-8Triethanolamine, air, unspecified, kg 8.64E-8Ammonia, air, unspecified, kg 8.70E-7Formaldehyde, air, unspecified, kg 1.16E-8Acetaldehyde, air, unspecified, kg 3.83E-8Dimethylamine, air, unspecified, kg 2.17E-10Ethylamine, air, unspecified, kg 1.52E-9Diethylamine, air, unspecified, kg 4.94E-9N-nitrosodimethylamine, air, unspecified, kg 7.15E-84-nitroso-morpholine, air, unspecified, kg 4.48E-9Dimethylnitramine, air, unspecified, kg 7.15E-91,4 Dimethylpiperazine, air, unspecified, kg 4.41E-8MDEA, air, unspecified, kg 2.39E-6PZ, air, unspecified, kg 3.22E-618) (Meerman et al., 2012) 19) Data for post combustion units for MDEA degradation (CSIRO, 2012).

Assessing the techno-environmental performance of CO2 utilization via dry reforming of methane for the production of dimethyl ether
187
Table 5.11. Ecoinvent v.2.2. data for conventional DME production. DME conventional production 1 kg DME Methanol, at plant/ GLO/ kg 1.40E+020) Electricity, medium voltage, at grid/ NL/ kWh 1.30E-3 Aluminium oxide, at plant/ RER/ kg 7.93E-721) Disposal, zeolite, 5% water, to inert material landfill/ CH/ kg 7.93E-7 Water, completely softened, at plant/ RER/ kg 2.39E1 Water, decarbonised, at plant/ RER/ kg 2.39E1 20) Technical Process simulation output. 21) Technical Process simulation output, assuming equal mass distribution for the
catalyst.
Table 5.12. Ecoinvent v.2.2. data for dry reforming process. Dry Reforming 1 kg syngas
Technosphere Natural Gas Production and Transport 2.70E-122) CO2 to be utilized 1.37E 022)
Ni/Rh/Al2O3 catalyst 1.79E-623) Disposal, zeolite, 5% water, to inert material landfill/ CH/ kg 1.79E-6 CH4 burned /modelled as natural gas/natural gas burned in industrial furnace DME burned/modelled as diesel burned in gas turbine
2.51E-224) 9.45E-3
Emissions Carbon dioxide, fossil 2.60E-1 22) Technical Process simulation output. 23) Catalyst consumption based on technical assessment result. It has been assumed
that 15% of the catalyst is made up by Rh meanwhile the rest has been distributed equally to the other components.
24) The fuel employed in the furnace is constituted by several fuels such as methane, H2, CO, CO2 and DME from the condenser venting streams of the distillation train. Given the lack of data for DME combustion in stationary combustion sources, it has been decided to model DME combustion based on diesel oil data in gas turbines. CO2 emissions are based on technical assessment results.
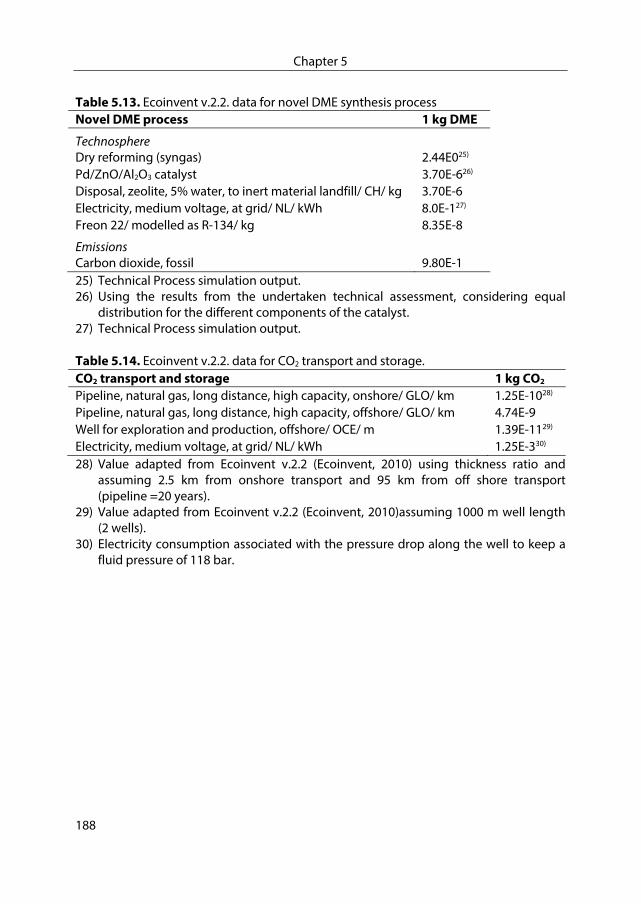
Chapter 5
188
Table 5.13. Ecoinvent v.2.2. data for novel DME synthesis process Novel DME process 1 kg DME
Technosphere
Dry reforming (syngas) 2.44E025)
Pd/ZnO/Al2O3 catalyst 3.70E-626)
Disposal, zeolite, 5% water, to inert material landfill/ CH/ kg 3.70E-6Electricity, medium voltage, at grid/ NL/ kWh 8.0E-127)
Freon 22/ modelled as R-134/ kg 8.35E-8
Emissions Carbon dioxide, fossil 9.80E-125) Technical Process simulation output. 26) Using the results from the undertaken technical assessment, considering equal
distribution for the different components of the catalyst. 27) Technical Process simulation output.
Table 5.14. Ecoinvent v.2.2. data for CO2 transport and storage.
28) Value adapted from Ecoinvent v.2.2 (Ecoinvent, 2010) using thickness ratio and assuming 2.5 km from onshore transport and 95 km from off shore transport (pipeline =20 years).
29) Value adapted from Ecoinvent v.2.2 (Ecoinvent, 2010)assuming 1000 m well length (2 wells).
30) Electricity consumption associated with the pressure drop along the well to keep a fluid pressure of 118 bar.
CO2 transport and storage 1 kg CO2 Pipeline, natural gas, long distance, high capacity, onshore/ GLO/ km 1.25E-1028) Pipeline, natural gas, long distance, high capacity, offshore/ GLO/ km 4.74E-9 Well for exploration and production, offshore/ OCE/ m 1.39E-1129) Electricity, medium voltage, at grid/ NL/ kWh 1.25E-330)

Assessing the techno-environmental performance of CO2 utilization via dry reforming of methane for the production of dimethyl ether
189
Appendix IV: Environmental assessment results
Table 5.15. Absolute values for environmental impacts for the three considered system in this study.
Impact Unit REF CCS CCU CCP kg CO2eq 6.5E-2 4.1E-2 6.0E-2 TAP kg SO2eq 4.3E-5 4.5E-5 7.1E-5 PMFP kg PM10eq 1.5E-5 1.6E-5 2.3E-5 POFP Kg NMVOC 6.5E-5 6.9E-5 5.9E-5 FEP kg Peq 2.2E-6 2.8E-6 4.9E-6 MEP kg Neq 2.1E-6 2.4E-6 2.8E-6 ODP kg CFC-11eq 7.0E-9 7.0E-9 6.5E-9 IRP kg U235eq 1.2E-3 1.5E-3 1.7E-3 HTP kg 1,4- DBeq 2.4E-3 2.7E-3 4.6E-3 FETP kg 1,4- DBeq 6.6E-5 7.5E-5 1.1E-4 TETP kg 1,4- DBeq 2.0E-6 2.1E-6 1.6E-6 METP kg 1,4- DBeq 8.5E-5 9.4E-5 1.5E-4 FDP kg oileq 4.5E-2 4.6E-2 4.1E-2 MDP kg Feeq 5.1E-4 5.3E-4 3.9E-4 WDP m3 1.4E-2 1.5E-2 8.8E-3 NLTP m2 2.8E-5 2.8E-5 2.9E-5 ALOP m2
a 3.9E-5 5.9E-5 1.5E-4 ULOP m2
a 5.9E-5 6.3E-5 7.3E-5
CCP: Climate change potential, TAP: Terrestrial acidification potential, PMFP: Particulate matter formation potential, POFP: Photochemical oxidant formation potential, FEP: Freshwater eutrophication potential, MEP: Marine eutrophication potential, ODP: Ozone depletion potential, IRP: Ionising radiation potential, HTP: Human toxicity potential, FETP: Freshwater ecotoxicity potential, TETP: Terrestrial ecotoxicity potential, METP: Marine ecotoxicity potential, FDP: Fossil depletion potential, MDP: Metal depletion potential, WDP: Water depletion potential, NLTP: Natural land transformation potential, ALOP: Agriculture land occupation potential, ULOP: Urban land occupation potential. REF: H2 production unit and DME conventional production process, CCS: H2 production unit with CCS and DME conventional production process, CCU: H2 production unit and DME production with captured CO2.

190
191
New indicator for comparing the energy 6.performance of CO2 utilization concepts
Wouter Schakel, Cora Fernández-Dacosta, Mijndert van der Spek, Andrea Ramírez
Accepted for publication: Journal of CO2 Utilization (2017)
Abstract
CO2 utilization is increasingly considered a greenhouse gas abatement strategy alternatively to CO2 storage. Existing indicators that assess the performance of CO2 utilization options often provide an incomplete perspective and are unsuitable to compare different utilization options with different functionality (e.g. plastics and fuels). This study introduces a new performance indicator for CO2 utilization options: Specific Primary Energy Consumption per unit of Fossil feedstock Replaced (SPECFER). This indicator, expressed in MJ/MJ, provides a proxy for the energy efficiency of which CO2 conversion options can replace fossil feedstock required in conventional processes. Three CO2 utilization case studies (CO2 based methanol, polyols and dimethyl ether) are used to show the application and effectiveness of the SPECFER indicator. Among the case studies, only CO2 conversion into polyol appears particularly efficient (SPECFER of 0.05 MJ/MJ), while the other options are not (SPECFER of > 1 MJ/MJ). The paper shows that the SPECFER indicator adds key insights compared to conventional indicators to the effectiveness of CO2 utilization options and is a promising indicator complementary to CO2 emissions reduction or life cycle greenhouse gas reduction potential). The SPECFER thus improves the understanding of the performance of CO2 utilization and enables the possibility to distinctly compare different CO2 converting utilization technologies.
Chapter 6
192
Introduction 6.1.
CO2 capture and storage (CCS) is an important technology to effectively decrease greenhouse gas (GHG) emissions and mitigate climate change (European Commission, 2016; IEA, 2015b; IPCC, 2014). CO2 capture and utilization (CCU) provides an additional option to CO2 storage by aiming to use the captured CO2 as feedstock in the production of goods (material and fuels). CCU options revolve around the direct use of CO2 or its conversion into chemicals or materials. Examples of direct use of CO2 include enhanced oil recovery (EOR) and direct application in e.g. the food industry (Huang et al., 2014). CO2 utilization options via conversion include biological conversion, mineralization and chemical conversion into chemicals, fuels or materials such as plastics (NETL, 2015; Quadrelli et al., 2011). Conversion of CO2 requires a considerable amount of energy, due to the low thermodynamic (inert) level of the molecule. An overview of various CO2 utilization options is presented in Figure 6.1.
Figure 6.1. Overview of various CO2 utilization products (NETL, 2016).
The concept of CO2 utilization has been around for almost 30 years and was initially viewed upon as a promising technology alternatively to CCS (e.g.
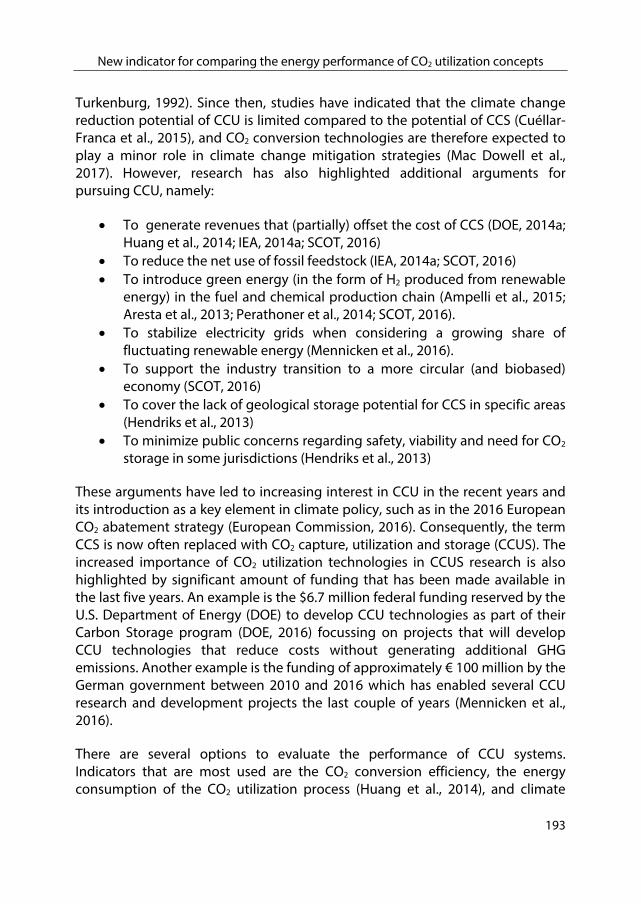
New indicator for comparing the energy performance of CO2 utilization concepts
193
Turkenburg, 1992). Since then, studies have indicated that the climate change reduction potential of CCU is limited compared to the potential of CCS (Cuéllar-Franca et al., 2015), and CO2 conversion technologies are therefore expected to play a minor role in climate change mitigation strategies (Mac Dowell et al., 2017). However, research has also highlighted additional arguments for pursuing CCU, namely:
To generate revenues that (partially) offset the cost of CCS (DOE, 2014a; Huang et al., 2014; IEA, 2014a; SCOT, 2016)
To reduce the net use of fossil feedstock (IEA, 2014a; SCOT, 2016) To introduce green energy (in the form of H2 produced from renewable
energy) in the fuel and chemical production chain (Ampelli et al., 2015; Aresta et al., 2013; Perathoner et al., 2014; SCOT, 2016).
To stabilize electricity grids when considering a growing share of fluctuating renewable energy (Mennicken et al., 2016).
To support the industry transition to a more circular (and biobased) economy (SCOT, 2016)
To cover the lack of geological storage potential for CCS in specific areas (Hendriks et al., 2013)
To minimize public concerns regarding safety, viability and need for CO2 storage in some jurisdictions (Hendriks et al., 2013)
These arguments have led to increasing interest in CCU in the recent years and its introduction as a key element in climate policy, such as in the 2016 European CO2 abatement strategy (European Commission, 2016). Consequently, the term CCS is now often replaced with CO2 capture, utilization and storage (CCUS). The increased importance of CO2 utilization technologies in CCUS research is also highlighted by significant amount of funding that has been made available in the last five years. An example is the $6.7 million federal funding reserved by the U.S. Department of Energy (DOE) to develop CCU technologies as part of their Carbon Storage program (DOE, 2016) focussing on projects that will develop CCU technologies that reduce costs without generating additional GHG emissions. Another example is the funding of approximately € 100 million by the German government between 2010 and 2016 which has enabled several CCU research and development projects the last couple of years (Mennicken et al., 2016).
There are several options to evaluate the performance of CCU systems. Indicators that are most used are the CO2 conversion efficiency, the energy consumption of the CO2 utilization process (Huang et al., 2014), and climate
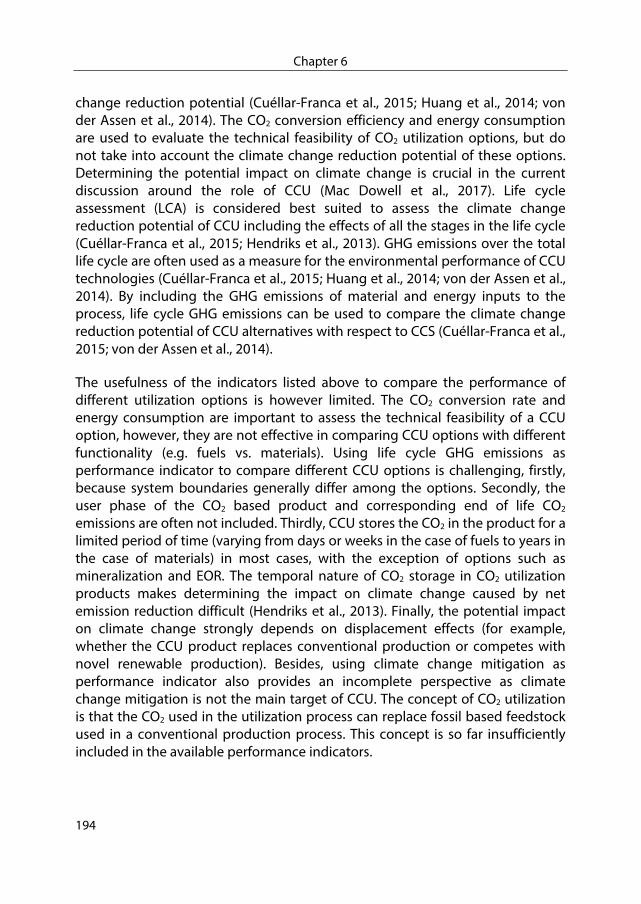
Chapter 6
194
change reduction potential (Cuéllar-Franca et al., 2015; Huang et al., 2014; von der Assen et al., 2014). The CO2 conversion efficiency and energy consumption are used to evaluate the technical feasibility of CO2 utilization options, but do not take into account the climate change reduction potential of these options. Determining the potential impact on climate change is crucial in the current discussion around the role of CCU (Mac Dowell et al., 2017). Life cycle assessment (LCA) is considered best suited to assess the climate change reduction potential of CCU including the effects of all the stages in the life cycle (Cuéllar-Franca et al., 2015; Hendriks et al., 2013). GHG emissions over the total life cycle are often used as a measure for the environmental performance of CCU technologies (Cuéllar-Franca et al., 2015; Huang et al., 2014; von der Assen et al., 2014). By including the GHG emissions of material and energy inputs to the process, life cycle GHG emissions can be used to compare the climate change reduction potential of CCU alternatives with respect to CCS (Cuéllar-Franca et al., 2015; von der Assen et al., 2014).
The usefulness of the indicators listed above to compare the performance of different utilization options is however limited. The CO2 conversion rate and energy consumption are important to assess the technical feasibility of a CCU option, however, they are not effective in comparing CCU options with different functionality (e.g. fuels vs. materials). Using life cycle GHG emissions as performance indicator to compare different CCU options is challenging, firstly, because system boundaries generally differ among the options. Secondly, the user phase of the CO2 based product and corresponding end of life CO2 emissions are often not included. Thirdly, CCU stores the CO2 in the product for a limited period of time (varying from days or weeks in the case of fuels to years in the case of materials) in most cases, with the exception of options such as mineralization and EOR. The temporal nature of CO2 storage in CO2 utilization products makes determining the impact on climate change caused by net emission reduction difficult (Hendriks et al., 2013). Finally, the potential impact on climate change strongly depends on displacement effects (for example, whether the CCU product replaces conventional production or competes with novel renewable production). Besides, using climate change mitigation as performance indicator also provides an incomplete perspective as climate change mitigation is not the main target of CCU. The concept of CO2 utilization is that the CO2 used in the utilization process can replace fossil based feedstock used in a conventional production process. This concept is so far insufficiently included in the available performance indicators.
New indicator for comparing the energy performance of CO2 utilization concepts
195
The above discussion implies there is a need for a CO2 utilization performance indicator that provides better understanding of, and allows comparison of, the performance CO2 utilization options. Such an indicator should:
Relate the effectiveness of replacing fossil feedstock with the energy consumption of converting the CO2
Be applicable independent of the CO2 based end product Add additional insight into the performance of CO2 utilization compared
to indicators currently used in literature, such as CO2 conversion efficiency and life cycle GHG emissions
Allow a comprehensive comparison of different CO2 conversion options that produce different end-products
This paper aims to introduce a new performance indicator for CCU technologies that meets the requirements previously listed and allows a comprehensive assessment and comparison of the vast range of CO2 conversion options. The applicability of the indicator is showcased by applying it to three different CO2 utilization case studies.
Methodology 6.2.
6.2.1. Scope and definitions
Two quantities that can enable a comparison of CO2 utilization options are the energy required to convert the CO2 into the product and the fossil feedstock that is actually replaced by the CO2. To allow comparison of different types of energy and forms of fossil feedstock, primary energy and primary fossil feedstock are a suitable starting point. Primary energy is the energy found in its original or natural form that has not been subjugated to any conversion process (Blok, 2007). Primary fossil feedstock is defined as fossil feedstock in its original form found on earth, such as crude oil, natural gas or coal, that are contained in the earth’s subsurface.

Chapter 6
196
6.2.2. SPECFER indicator
The Specific Primary Energy Consumption per unit of Fossil feedstock Replaced (SPECFER) indicator combines information on the additional energy use of CO2 utilization with the fossil feedstock that is replaced. The SPECFER indicator quantifies the efficiency of a CO2 converting utilization process by relating the amount of primary energy that the process requires to replace a given amount of fossil based feedstock, following eq. 6.1.
Figure 6.2. Schematic overview of CO2 utilization system (bottom) and a reference system (top) producing the same product. The fossil feedstock production chain is vastly simplified in the figure: in reality the fossil feedstock production chain consists of multiple fossil feedstocks, energy inputs and feedstock processing steps, depending on the actual feedstock used in the process.
Conventional
process
Final product
Reference case
Emissions
Fossil based feedstock
Primary Fossil
Feedstock
Energy
Emissions
Other feedstocks
Feedstock extraction, processing
and transport
Energy
CO2 utilization
process
CO2 capture
process
CO2 source
CO2
Fossil based feedstock
Feedstock extraction,
processing and transport
Primary Fossil
Feedstock
EnergyFossil Feedstock production chain
CO2 utilization case
EmissionsEmissions
Other feedstocks
Represents the additional energy consumption for CO2 capture and utilization
Final product
Energy
Represents the part of the fossil based feedstock that is replaced by the utilization of CO2

New indicator for comparing the energy performance of CO2 utilization concepts
197
To calculate the fossil feedstock replaced, the utilization process needs to be compared with a reference process that produces an equal amount of the final product. This is schematically presented in Figure 6.2, where (part of) the carbon content of CO2 is utilized to manufacture the final product, thereby reducing the amount of fossil feedstock required, while additional energy input is needed for the CO2 capture and conversion processes. The additional energy consumption and feedstock replaced can therefore be expressed as the difference between the utilization case and a reference case (eq. 6.1):
∆
∆
∑ ∑
∑ ∑ (eq. 6.1)
Primary energy and primary fossil feedstock are used in the SPECFER calculation to enable comparison of several processes with different energy and fossil feedstock inputs. The method used to convert energy inputs into primary energy is presented in section 6.2.3. The primary fossil feedstock needed for the fossil based feedstock used in a process includes all fossil inputs during the extraction, processing and transport of the feedstock. The fossil based feedstock is the form in which the feedstock is eventually used in the process under study. The method used to calculate the total primary fossil feedstock replaced is explained in section 6.2.4.
6.2.3. Primary Energy
Energy carriers, such as heat, electricity and fuels, are converted to their primary energy equivalents. This allows comparison between, and summation of, different energy carriers. In the SPECFER (see eq. 6.1), the total additional primary energy required, ∆ , is calculated using eq. 6.2:
∆ ∑ ∑
∑ ∗ ∑ ∗ (eq. 6.2)
in which, is energy input i (MJ) in the utilization case, the primary energy conversion factor of energy input i, is energy input j (MJ) in the reference case and the primary energy conversion factor of energy input j.

Chapter 6
198
Fossil fuels can be used for energy generation and for non-energy purposes. Non-energy use includes the consumption of fossil fuels as feedstock in the chemical industry (e.g. the use of naphtha for olefin production) and the consumption of refinery products, coke oven products and other solid carbon for non-energy purposes (e.g. the use of lubricants for transportation) (Weiss et al., 2009). When fossil fuels are converted into a different product, it depends on the use of the final product whether the fossil fuels are used for energy or non-energy purposes. Converting fossil fuels into other fuels is an example of energy use of fossil fuels (IEA, 2017). The primary energy use in the SPECFER indicator only includes energy use of energy carriers.
There are two methods that can be used to calculate the primary energy equivalent of energy carriers: the partial substitution method and the physical energy content method. In the partial substitution method, the primary energy equivalent of electricity is represented by the energy amount that would be consumed to generate an equal amount of electricity in a conventional thermal power plant30. The physical energy content method calculates the physical energy content of the primary energy source of the energy carrier (retracing what type of primary energy was used to produce the energy carrier). The physical energy content method is considered to be the more appropriate method and is used in most international organisations (Adam, 2013; OECD, 2017) and is therefore recommended to use for SPECFER calculations. The primary energy conversion factors in eq. 6.2 can be obtained from system analysis or extracted from literature sources.
6.2.4. Primary Fossil Feedstock Replaced
The primary fossil feedstock replaced is the difference between the total primary fossil feedstock used in the reference case and the total primary fossil feedstock used in the utilization case (Eq. 2). The type of fossil based feedstock can differ between the utilization case and the reference case and between different utilization cases. The total primary fossil feedstock definition includes all the fossil fuel used for energy and feedstock during the processing of the fossil based feedstock up to the system boundary of the process under study (see Figure 6.2). As such, the primary fossil feedstock replaced includes both energy and non-energy use. The total primary feedstock replaced does not depend on
30 This is generally applied to electricity generated by non-combustible energy
resources, i.e. nuclear and non-bio renewables.

New indicator for comparing the energy performance of CO2 utilization concepts
199
the use of the final product, enabling the comparison of the performance of CCU options with different functionalities (e.g. fuels vs. plastics).
The primary fossil feedstock can be calculated using the mass and energy balance of the feedstock production chain by summing the fossil based feedstock and fuel inputs of all the processing steps. In this study, the primary fossil feedstock replaced, ∆ , is calculated by converting all the fossil based inputs of the utilization case and reference case into their primary fossil feedstock equivalents (in MJprimary), following eq. 6.3:
∆
∑ ∗ ∑ ∗ (eq. 6.3)
in which is the amount of feedstock j (kg) in the reference case, is the primary fossil feedstock required for the production of feedstock j (MJ/kg), is the amount of feedstock i (kg) in the utilization case and is the primary fossil feedstock required for the production of feedstock i (MJ/kg).
The amount of primary fossil feedstock required for the production of fossil based feedstocks (for example, the amount of crude needed to produce an amount of gasoline) strongly depends on the feedstock production process parameters, such as the scale of the process, the production method and the efficiency of the process. Theoretically, if such process conditions are known, the required primary fossil feedstock can be calculated for all fossil based materials. However, including all underlying processes is a time consuming exercise and potential data gaps or uncertainties can make these calculations challenging. Alternatively, other sources can be consulted to estimate the amount of primary fossil feedstock embedded in the fossil based process input materials.
An indicative way to convert fossil based feedstocks into their primary fossil feedstock equivalents is to extract cumulative energy demand (CED) values for fossil based materials from life cycle databases, such as the CED contained in the Ecoinvent database (Ecoinvent, 2010). The CED measures the primary energy use throughout the life cycle of a good or a service (Frischknecht et al., 2007). It accounts for all primary energy withdrawn from nature, including direct energy use, indirect energy use and the energy content of feedstocks (Arvesen et al., 2015; Huijbregts et al., 2010). As such, the CED is a good proxy for the primary
Chapter 6
200
fossil feedstock use of (fossil based) materials. The large amount of available processes in the Ecoinvent database makes it easy to obtain CED values for almost any fossil based material and ensures that data for different materials can be obtained consistently. Using the CED for primary fossil feedstock consumption allows the SPECFER to be used as efficiency indicator, as the SPECFER is then expressed in MJ/MJ: values > 1 indicate an inefficient conversion route while values < 1 can be considered promising.
Alternatively to the CED, fossil feedstock depletion values, based on ReCiPe midpoint methodology (ReCiPe, 2012), could be used to convert the fossil based feedstocks to primary fossil feedstock equivalents. The ReCiPe fossil depletion value is the amount of fossil fuel extracted, based on the CED and lower heating value (Goedkoop et al., 2009; PRéConsultants, 2016). As fossil depletion value is expressed in kg oil eq., the SPECFER would then get the unit MJ/kg oil eq. Although both methods (CED and fossil fuel depletion) are suitable for SPECFER calculations, the CED is used in this study as expressing the SPECFER in MJ/MJ enables the direct use of the SPECFER as efficiency indicator.

New indicator for comparing the energy performance of CO2 utilization concepts
201
6.2.5. Energy required for CO2 capture
In most utilization cases, CO2 is not available and some CO2 capture, transport and/or compression processes are required. The energy required for these processes can be included as additional primary energy demand when calculating the SPECFER. Whether it should be included depends on how the CO2 capture energy demand is allocated. Three different options of CO2 capture energy allocation can be distinguished:
1. CO2 is captured independently whether the captured CO2 is stored or utilized. The CO2 is seen as a waste product and considered to be free of environmental impacts from life cycle perspective. The required energy for the capture of CO2 is fully allocated to the process where the CO2 emissions are produced (e.g. power production, steel plant).
2. CO2 is captured to drive the CO2 utilization process and/or the CO2 is considered a valuable product. The amount of CO2 capture unit is determined by the market potential of the CO2. The CO2 is therefore not a waste but a (sub) product and is considered to have an environmental footprint. The energy required for its capture and purification is fully allocated to the CO2 utilization process.
3. A hybrid option in which only part of the captured CO2 is utilized, while the rest is for instance stored. In this case, one can follow a multi-product allocation where a fraction of the energy used for the CO2 capture is allocated to the CO2 flow used for utilization and the rest to the main process (e.g., the power production, steel plant). The part of the CO2 that is utilized is then considered to be a (sub) product with an environmental product whereas the part of the CO2 that is stored is again seen as a waste product free of environmental impacts.
It is important to be consistent in the SPECFER calculation, especially if different CO2 utilization options are compared. If different options are assumed to utilize an equal amount of CO2 from the same source, the relative SPECFER of the options are not influenced by how the capture energy is allocated. However, if CCU options of different sizes and/or with different CO2 sources are considered, allocating the CO2 capture energy to the utilization processes is recommended to ensure a fair comparison. When only part of the captured CO2 is used for utilization, allocating a proportioned part of the CO2 capture energy to the utilization process is recommended.
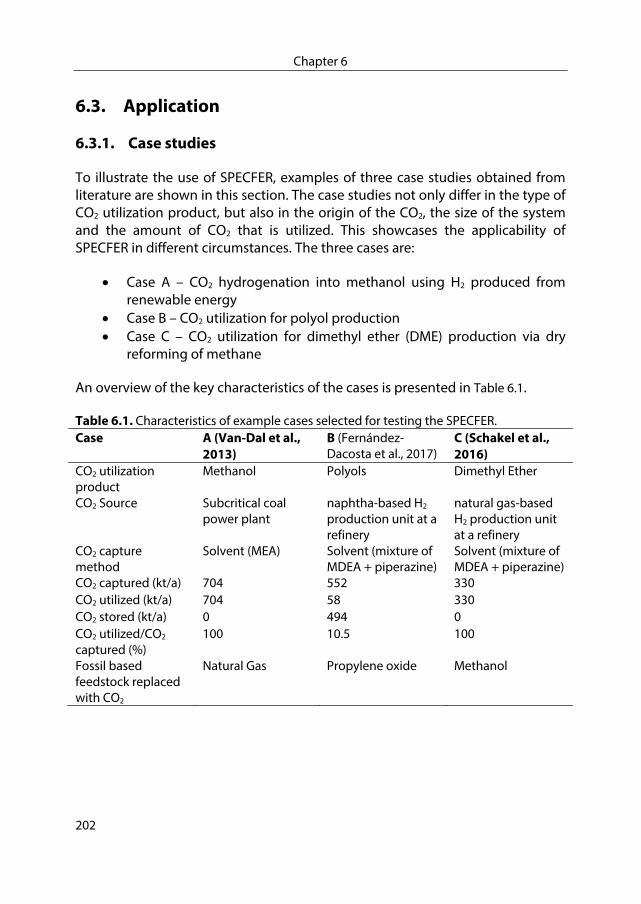
Chapter 6
202
Application 6.3.
6.3.1. Case studies
To illustrate the use of SPECFER, examples of three case studies obtained from literature are shown in this section. The case studies not only differ in the type of CO2 utilization product, but also in the origin of the CO2, the size of the system and the amount of CO2 that is utilized. This showcases the applicability of SPECFER in different circumstances. The three cases are:
Case A – CO2 hydrogenation into methanol using H2 produced from renewable energy
Case B – CO2 utilization for polyol production Case C – CO2 utilization for dimethyl ether (DME) production via dry
reforming of methane
An overview of the key characteristics of the cases is presented in Table 6.1.
Table 6.1. Characteristics of example cases selected for testing the SPECFER. Case A (Van-Dal et al.,
2013) B (Fernández-Dacosta et al., 2017)
C (Schakel et al., 2016)
CO2 utilization product
Methanol Polyols Dimethyl Ether
CO2 Source Subcritical coal power plant
naphtha-based H2
production unit at a refinery
natural gas-based H2 production unit at a refinery
CO2 capture method
Solvent (MEA) Solvent (mixture of MDEA + piperazine)
Solvent (mixture of MDEA + piperazine)
CO2 captured (kt/a) 704 552 330CO2 utilized (kt/a) 704 58 330CO2 stored (kt/a) 0 494 0CO2 utilized/CO2
captured (%) 100 10.5 100
Fossil based feedstock replaced with CO2
Natural Gas Propylene oxide Methanol
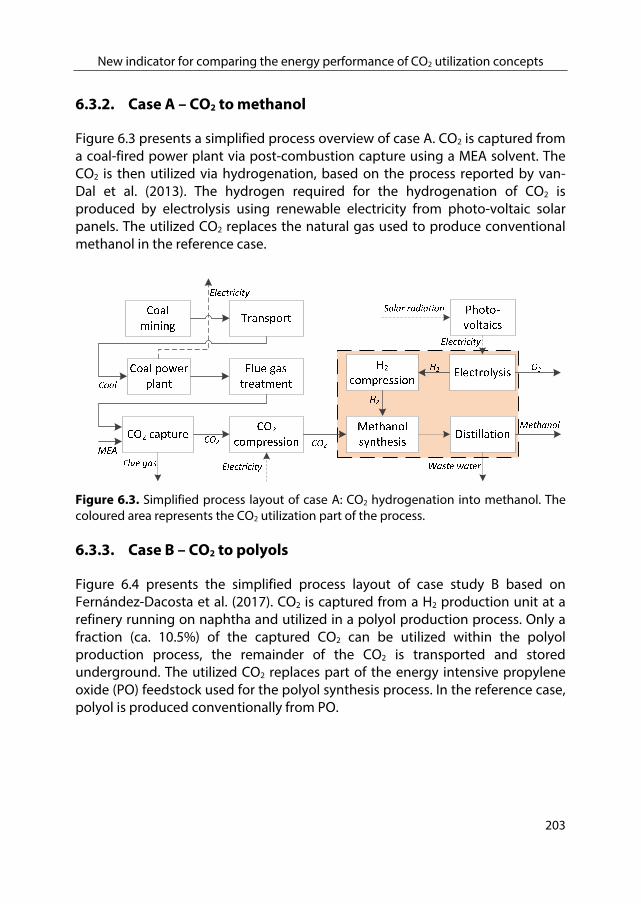
New indicator for comparing the energy performance of CO2 utilization concepts
203
6.3.2. Case A – CO2 to methanol
Figure 6.3 presents a simplified process overview of case A. CO2 is captured from a coal-fired power plant via post-combustion capture using a MEA solvent. The CO2 is then utilized via hydrogenation, based on the process reported by van-Dal et al. (2013). The hydrogen required for the hydrogenation of CO2 is produced by electrolysis using renewable electricity from photo-voltaic solar panels. The utilized CO2 replaces the natural gas used to produce conventional methanol in the reference case.
Figure 6.3. Simplified process layout of case A: CO2 hydrogenation into methanol. The coloured area represents the CO2 utilization part of the process.
6.3.3. Case B – CO2 to polyols
Figure 6.4 presents the simplified process layout of case study B based on Fernández-Dacosta et al. (2017). CO2 is captured from a H2 production unit at a refinery running on naphtha and utilized in a polyol production process. Only a fraction (ca. 10.5%) of the captured CO2 can be utilized within the polyol production process, the remainder of the CO2 is transported and stored underground. The utilized CO2 replaces part of the energy intensive propylene oxide (PO) feedstock used for the polyol synthesis process. In the reference case, polyol is produced conventionally from PO.

Chapter 6
204
Figure 6.4. Simplified process layout of case B: CO2 utilization for polyol production. The coloured area represents the CO2 utilization part of the process.
6.3.4. Case C – CO2 to dimethyl ether
Figure 6.5 presents the simplified process layout of case C based on Schakel et al. (2016). CO2 is captured from a hydrogen production unit at a refinery, and used for dry reforming of methane for the production of syngas. The syngas is then converted into dimethyl ether (DME) by direct synthesis. The utilized CO2 replaces the methanol used for conventional production of DME in the reference case.
Figure 6.5. Simplified process layout of case C: the production of DME via dry reforming of methane (Schakel et al., 2016). The coloured area represents the CO2 utilization part of the process.
CO2
Polyol synthesis
Naphthaproduction
Transport
Water Gas Shift
CO2
Capture
Naphtha Steam Reforming
H2
Syngas
Naphtha
Pressure Swing Adsorbtion
CO2 transport and storage
CO2
Polyol
Propylene oxide

New indicator for comparing the energy performance of CO2 utilization concepts
205
6.3.5. Primary Energy input
The energy inputs for the CO2 utilization processes were converted to primary energy inputs with the use of primary energy factors (see section 6.2.3). The primary energy factors for the energy inputs used in the three cases are based on the physical energy content and are presented in Table 6.2. The primary energy conversion factors used in this study were obtained from the primary energy embedded values from Ecoinvent processes (Ecoinvent, 2010), except for the conversion value for electricity from PV. When electricity from PV is considered to be completely renewable, primary energy conversion factors of 1 or close to 1 are reported (Molenbroek et al., 2011). When building PV systems and infrastructure is accounted for, the primary energy conversion factor of PV is considered 1.25 (Fritsche et al., 2015). In this study, the value of 1.25 was selected as primary energy factor for PV to ensure a conservative estimation of the primary energy consumption of electricity from PV.
Table 6.2. Overview of primary energy conversion factors for various energy carriers. Energy inputs Primary energy
conversion factors reported in literature
Selected primary energy conversion factor in this study
Natural Gas 1.02-1.251)2)3) 1.042)
Naphtha 1.08-1.241)2) 1.082)
Electricity (generic, Europe) 2.49-2.922)3)4) 2.552)
Electricity from Photovoltaics (PV) 1.00-1.253)4) 1.254)
Steam 1.132) 1.132)
1) Blok et al., 2017 2) Primary Energy embedded (MJ/MJ) (Ecoinvent, 2010) 3) Molenbroek et al., 2011 4) Fritsche et al., 2015
In this study, the CO2 capture energy of the CO2 entering the utilization process was included in all cases to ensure a fair comparison. In case B, in which only a fraction of the captured CO2 is utilized, mass based allocation was applied to calculate the CO2 capture energy assigned to the amount of CO2 utilized.
Table 6.3 presents an overview of the energy inputs of the CO2 utilization process and the reference case and the corresponding total primary energy of the selected case studies. The total primary energy (both including and excluding the CO2 capture energy) was calculated using the primary energy conversion factors (Table 6.2).

Chapter 6
206
Table 6.3. Energy inputs of the selected cases. Energy inputs CO2 utilization Reference case
Case A. CO2 to methanol Steam CO2 capture (MJ/kg CO2)
3.191)
-
Electricity CO2 capture (MJ/kg CO2)
0.161) -
Electricity methanol production (kWh/kg methanol)
0.361) 0.0742)
PV electricity H2 production (kWh/kg methanol) 10.881) -Natural gas methanol production (kg/kg methanol)
- 0.142)
Total primary energy excluding CO2 capture (MJ/kg methanol)
52.28 8.20
Total primary energy including CO2 capture (MJ/kg methanol)
58.24 8.20
Case B. CO2 to polyolsSteam CO2 capture(MJ/kg CO2)
1.923)
-
Electricity CO2 capture (MJ/kg CO2)
0.383) -
Electricity polyol production (kWh/kg polyol) 0.0143) 0.0103) Steam polyol production (MJ/kg polyol) 0.143) 0.053) Total primary energy excluding CO2 capture (MJ/kg polyol)
0.27 0.14
Total primary energy including CO2 capture (MJ/kg polyol)
0.99 0.14
Case C. CO2 to DMESteam CO2 capture (MJ/kg CO2)
2.193)
-
Electricity CO2 capture (MJ/kg CO2)
0.054)
Natural gas DME production (kg/kg DME) 0.213) -Electricity DME production (MWh/kg DME) 0.815) 1.13*10-3 5)
Total primary energy excluding CO2 capture (MJ/kg DME)
18.9 0.01
Total primary energy including CO2 capture (MJ/kg DME)
23.5 0.01
1) Van-Dal et al., 2013. 2) Based on global average methanol production process (Ecoinvent, 2010). 3) Fernández- Dacosta et al., 2017. 4) Meerman et al., 2012. 5) Schakel et al., 2016.
New indicator for comparing the energy performance of CO2 utilization concepts
207
In case A, CO2 is converted into methanol using H2 produced from PV electricity31. The CO2 capture energy includes the consumption of steam and electricity. Energy inputs for the CO2 utilization process comprise electricity consumption during the process itself (mainly for H2 compression), and PV electricity consumption for the production of H2. The latter one is the most dominant energy input, accounting for 84% of the total primary energy consumption of the process, including CO2 capture, of the utilization case. Energy inputs of conventional production of methanol comprise electricity and natural gas. In total, the CO2 utilization process consumes 6.4 times more primary energy (7.1 if CO2 capture energy is included) than the reference process.
In case B, the use of CO2 instead of propylene oxide slightly increases the electricity and steam demand of the polyol production process. These additional energy inputs are however minor compared to the energy required for CO2 capture of 3.18 MJ/kg CO2 (0.74 MJ/kg polyol produced). In total, the CO2 utilization process increases the primary energy demand with a factor of 1.9 (7.1 if CO2 capture energy is included).
In case C, CO2 is converted into DME via dry reforming of natural gas. Electricity is required predominately for the compression of syngas after the reforming step and natural gas is used to provide the heat for the dry reforming reaction. A small amount of electricity and some natural gas are energy inputs in the conventional DME production process. As such, the primary energy consumption of the utilization process is substantively exceeding the consumption of the reference process.
6.3.6. Primary Fossil Feedstock Replaced
The primary fossil feedstock required for the fossil inputs in the various cases was calculated with the use of cumulative energy demand (CED) values obtained from the Ecoinvent database (Ecoinvent, 2010). The CED values for the fossil feedstocks applicable to the cases in this study are presented in Table 6.4. The CED of methanol is smaller than that of natural gas, even though methanol is (conventionally) produced from natural gas, because the molar weight of methanol (32.0 g/mole) is larger than that of methane (16.0 g/mole): 1 mole of methane produces approximately 1 mole of methanol, so 1 kg of methane
31 It is not considered whether sufficient PV is available for the production of H2.

Chapter 6
208
converts into approximately 2 kg of methanol. The rather high CED of propylene oxide is the result of the energy intensity of the feedstock.
Table 6.4. Cumulative energy demand for the fossil feedstocks considered in this study (Ecoinvent, 2010). Feedstock Cumulative energy demand (MJ/kg)Natural gas 59.5 Methanol 36.1Propylene oxide 114.0
Table 6.5 presents the fossil based feedstock and the corresponding total primary fossil feedstock of the CO2 utilization process and reference case of the selected case studies. The total primary fossil feedstock was calculated using the CED values of the fossil based feedstocks (Table 6.4).
Table 6.5. Fossil feedstock inputs of the selected cases. Fossil based feedstock CO2 utilization Reference case
Case A. CO2 to methanol Natural gas methanol production (kg/kg methanol)
- 0.501)
Total primary fossil feedstock (MJ/kg methanol) - 33.3
Case B. CO2 to polyolsPropylene oxide (kg/kg polyol)
0.812) 0.972)
Total primary fossil feedstock (MJ/kg polyol) 92.3 110.6
Case C. CO2 to DMENatural gas (kg/kg DME) 0.433) -Methanol (kg/kg DME) - 1.403) Total primary fossil feedstock (MJ/kg DME) 28.6 50.5 1) Based on global average methanol production process (Ecoinvent, 2010). 2) Fernández -Dacosta et al., 2017. 3) Schakel et al., 2016.
In case A, no fossil based feedstock is used in the utilization process. The reference case considers conventional production of methanol in which natural gas is used both as energy input and as fossil feedstock. All the fossil feedstock in the reference case is thus considered to be replaced in the utilization case. The captured CO2 from the refinery in case B reduces the propylene oxide demand for the polyol production by 17%. In case C, conventional production of DME occurs via methanol dehydration, and methanol is considered the fossil

New indicator for comparing the energy performance of CO2 utilization concepts
209
feedstock replaced by the utilization case. The utilization process however uses natural gas as feedstock. In total, primary fossil feedstock consumption is reduced by 43%.
6.3.7. SPECFER
The change in primary energy consumption and the change in primary fossil feedstock consumption presented in the previous sections were used to calculate the SPECFER. Table 6.6 presents conventional performance indicators such as the CO2 balance, CO2 conversion rate and life cycle GHG emissions reduction, together with the total Δ Primary Energy, the primary fossil feedstock replaced and the calculated SPECFER values for all the cases considered in this study. Additional SPECFER values excluding the CO2 capture energy and varying some of the key conversion factors are included to show the sensitivity to these parameters.
Table 6.6. CO2 balance and SPECFER values for all cases under study. Case A
(methanol) Case B (polyol)
Case C (DME)
CO2 used in utilization process (kg CO2 /kg product)
1.48 0.23 1.76
Net CO2 conversion (%) 93.4 100 9.1 Net CO2 utilized (kg CO2 /kg product) 1.381) 0.23 0.16 Δ Life cycle GHG emissions reduction (%) Not
reported 232) 83)
Δ Primary Energy (MJ/kg product) 57.6 0.85 24.4 Primary Fossil feedstock replaced(MJ/kg product)
33.3 18.2 21.9
SPECFER (MJ/MJ)including CO2 capture energy
1.50 0.05 1.07
SPECFER (MJ/MJ)excluding CO2 capture energy
1.32 0.01 0.86
1) Only the carbon content of the CO2 is contained in the end-product (the oxygen is converted into water). As such, more than 1 kg of CO2 is utilized for the production of 1 kg of methanol.
2) Life cycle GHG emissions reduction of the entire system which includes the storage of 90% of the captured CO2. However, slightly higher GHG emission reduction is reported for the part of the CO2 that is utilized due to the replacing of propylene oxide (which has a very energy intensive production process) (Fernández-Dacosta et al., 2017)
3) Schakel et al., 2016
Chapter 6
210
In Case A, the largest amount of CO2 is utilized out of all the cases, mainly because there are no direct CO2 emissions during the utilization process. On the other hand, the extensive energy inputs lead to the highest SPECFER in this case, indicating that this CO2 conversion route is inefficient in terms of the amount of energy input needed to replace a unit of fossil feedstock. Approximately 50% more primary energy is used in this process than the avoided cumulative energy demand of the fossil feedstock that is replaced. Even when the CO2 capture energy is not included, the SPECFER still clearly shows the energy inefficiency of this proposed utilization route. The high SPECFER value is dominated by the electricity consumption of the H2 production. Although this electricity is produced from renewable PV, the selected primary energy factor of PV of 1.25 MJprimary/MJ is still considerable despite being significantly lower than the selected primary energy factor of regular electricity (2.55 MJprimary/MJ).
Case B clearly shows the lowest SPECFER value of 0.05 MJ/MJ of the options assessed in this study for two reasons: Firstly, the energy requirements of the utilization process are very low compared to the other cases and compared to the CO2 capture energy requirement. Secondly, the CED of the propylene oxide (114.0 MJ/kg) that is replaced is considerably higher than CEDs of the replaced fossil feedstocks in the other cases (i.e. 66.7 MJ/kg for natural gas and 36.1MJ/kg for methanol). When the energy consumption of CO2 capture is excluded, the SPECFER value would even be substantially lower (0.01 MJ/MJ).
In Case C the SPECFER is in between the values of case A and C, and the value of 1.07 MJ/MJ indicates that slightly more primary energy is used than CED avoided by the fossil feedstock replaced. The most important energy input in this case is the electricity used for the compression of syngas required for the direct DME synthesis. Grid electricity is assumed to be used in this process and a cleaner electricity production method with a lower corresponding primary energy factor could significantly lower the SPECFER value, similarly to case A. The CO2 conversion and the amount of CO2 utilized in the product are relatively small in this case, as a result of direct CO2 formation (and emission) during the DME synthesis process. When CO2 capture energy is excluded from this case, the SPECFER value would drop below 1 (0.86) MJ/MJ.
The results in Table 6.6 show that the SPECFER indicator complements conventional performance indicators regarding the effectiveness of a CO2 utilization process: when only looking at the amount of CO2 utilized and the CO2 conversion efficiency, case A (CO2 conversion into methanol) seems to be the most favourable of the investigated case studies. The application of the SPECFER
New indicator for comparing the energy performance of CO2 utilization concepts
211
however, shows that a case such as case A, in which a substantial amount of energy is required, is infeasible from the perspective of energy efficiency. Of the cases under study, only case B (CO2 conversion into polyol) stands out as an effective CO2 conversion and fossil feedstock replacement route.
Discussion 6.4.
The Specific Primary Energy Consumption per unit of Fossil feedstock Replaced (SPECFER) was proposed as a new indicator to assess and compare the performance of CO2 utilization options, and its application and usefulness using three examples was showcased. The indicator was set up to be comprehensive and easily applicable, but as a result also faces some limitations due to simplifications. Besides, the methods used in the indicator are subject to certain uncertainties that might affect the accuracy and reliability of the indicator. In this section, the most important limitations and uncertainties will be identified and discussed.
The selection of system boundaries plays an important role in the application of the SPECFER. Within the system boundaries (process under study), the use of fossil based material as feedstock and as energy input is clearly distinguished. The conversion of fossil based feedstock to primary fossil feedstock uses data regarding the fossil feedstock production chain, outside the system boundaries. In this chain, the use of intermediate fossil fuels (energy vs. non-energy) is not specified and all the fossil fuels used contribute to the total primary fossil feedstock consumption, regardless of their use. Therefore, it is important to select the system boundaries so that all energy inputs and fossil feedstock inputs of the processes under study are included and consistently identified.
The SPECFER indicator is an energy efficiency indicator not related to CO2 emissions. As such, expected environmental performance (in terms of greenhouse gas reduction) improvement of using renewable forms of energy for the conversion of CO2 are not addressed and the use of renewable forms of energy also contributes to the SPECFER. This is exemplified in case A (CO2 into methanol), where the consumption of electricity from PV lead to the highest SPECFER value of the addressed case studies. One could argue that the use of renewable energy should not be taken into account as environmental consequences are limited compared to use of conventional forms of energy. However, as a society we need to decide how to use the available renewable energy most efficiently. Therefore, it is important to select processes which can improve energy efficiency, regardless of the source of energy, which is
Chapter 6
212
specifically what the SPECFER indicator does. Nevertheless, to generate a complete perspective of the performance of the CO2 utilization process, it is recommended to always assess the SPECFER in combination with environmental performance indicators, such as climate change reduction potential.
A limitation of the SPECFER indicator is that only direct energy and fossil feedstock inputs are included. Non-fossil based materials, such as catalysts, solvents and chemicals are excluded from the definition, and as such also their indirect energy consumption and/or fossil based feedstock use. As a result, the SPECFER of utilization cases that increase the use of non-fossil based materials compared to the reference cases might be optimistic with respect to the actual performance of these processes.
6.4.1. Uncertainty analysis
Uncertainties in SPECFER are directly associated with uncertainties in input parameters, the selection of reference cases and system boundaries. Performing an uncertainty analysis should therefore be part of the analysis to ensure a sound interpretation, communication, and use of SPECFER results. Aspects that play a key role in the SPECFER calculation and affect the uncertainty of the results are:
Allocation of CO2 capture energy to the utilization process Mass and energy balance of the CO2 utilization process Mass and energy balance of the reference process Primary energy conversion factors CED factors of fossil based feedstocks
With respect to allocation, the SPECFER results in Table 6.6 already showed that allocating (all or part of the) the CO2 capture energy to the utilization process has a significant impact on the results. Including the CO2 capture energy is recommended to ensure a fair comparison of different CO2 utilization options. In cases were only part of the captured CO2 is utilized, allocation based on the mass fraction (CO2 utilized/CO2 captured) is proposed.
The mass and energy balances of the CO2 utilization and reference processes also play a large role, because they determine the amount of energy and fossil based feedstock that is used for the calculation of the SPECFER. The uncertainties associated with these values depend on the quality of the process model or literature data used to obtain these values. Those can be assessed

New indicator for comparing the energy performance of CO2 utilization concepts
213
using methods such as sensitivity analysis, but also using qualitative uncertainty assessment to cover weaknesses in e.g. data sources or methodologies (a good example is the use of pedigree analysis (see e.g. Singh et al., 2014; van der Spek et al., 2015)).
Figure 6.6. Sensitivity analyses for the different cases. Tornado diagrams are shown for each case with the basic SPECFER value (y-axis) and the effect of modifying key parameters on the SPECFER values.
0.00 0.50 1.00 1.50 2.00 2.50
Energy consumption REF +/‐ 25%
Primary energy factor solar energy 1.00/1.25
Fossil feedstock consumption REF +/‐ 25%
CED natural gas +/‐ 25%
Energy consumption CCU +/‐ 25%
Case A (CO2 into methanol)
0.00 0.50 1.00 1.50 2.00 2.50
Energy consumption REF +/‐ 25%
Energy consumption CCU +/‐ 25%
Fossil feedstock consumption REF +/‐ 25%
CED polyol +/‐ 25%
Allocating CO2 capture energy all/none
Case B (CO2 into polyol)
0.00 0.50 1.00 1.50 2.00 2.50
Energy consumption REF +/‐ 25%
Primary energy factor natural gas 1.02/1.25
Energy consumption CCU +/‐ 25%
Fossil feedstock consumption CCU +/‐ 25%
CED natural gas +/‐ 25%
Fossil feedstock consumption REF +/‐ 25%
CED methanol +/‐ 25%
Case C (CO2 into dimehtyl ether)
High value Low value
0.00 0.10 0.20 0.30 0.40

Chapter 6
214
Variability in the applied primary energy and CED factors can also cause uncertainty in the SPECFER values. Although primary energy factors are extensively documented and narrow ranges are reported Table 6.2, values can strongly depend on the geographical location and temporal scope and be, in practice, located outside the reported ranges. The conversion of fossil based feedstock to primary fossil feedstock was done using cumulative energy demand values associated to the feedstocks used in this study. These values were taken from corresponding processes in the Ecoinvent life cycle database (Ecoinvent, 2010). Although values were selected for the best matching processes, CED factors can easily change by up to 25% if alternative processes are selected.
A sensitivity analysis was performed to show the effect of variances in the above-listed aspects on the SPECFER results of the case studies. Variances of ±25% were considered for the mass and energy inputs and the CED factors. The primary energy factors were varied according to the ranges reported in literature (Table 6.2). For case B, the sensitivity analysis included the effect of allocating the complete amount of the CO2 capture energy to the utilization process, instead of the 10.5% of the capture energy that was originally included.
Figure 6.6 presents the results of the sensitivity analysis using tornado diagrams, where the range in the SPECFER values is shown for each of the parameters varied. Note that for all cases, as expected, increasing the parameters that affect the primary energy or fossil feedstock consumption of the utilization process causes a rise in the SPECFER values, while increasing the parameters that affect the consumption of the reference case lowers the SPECFER values.
In case A, the SPECFER value is most sensitive to the energy consumption of the utilization process and the parameters that affect the primary fossil feedstock consumption of the reference case (fossil feedstock consumption REF and CED natural gas). Changes in these parameters do not lead to a SPECFER value lower than 1 MJ/MJ. On the other hand, SPECFER values of up to 2 MJ/MJ are reached when the primary fossil feedstock consumption of the reference case is reduced. The energy consumption of the reference case has limited effect on the SPECFER value, as the energy consumption of conventional methanol production is very low compared to the energy consumption of the utilization process.
In case B, the SPECFER value changes by up to 32% with a 25% variance in the energy or fossil feedstock consumption. The energy consumption of both the utilization process and the reference process is marginal compared to the CO2
New indicator for comparing the energy performance of CO2 utilization concepts
215
capture energy, which dominates the SPECFER result. This is also highlighted in Figure 6.6: if 100% of the CO2 capture energy (instead of 10.5%) is allocated to the utilization process, the SPECFER increases from 0.05 to 0.38. However, even then, Case B remains the most efficient process route of the three assessed cases.
The largest effect when varying the input parameters on the SPECFER, is shown in case C. The SPECFER is most sensitive to parameters that affect the fossil based feedstock consumption. A substantial amount of fossil feedstock (natural gas) is used in this CO2 conversion process. Consequently, a 25% variation in fossil feedstock consumption in either the utilization case or reference case changes the amount of primary fossil feedstock replaced by more than 25%. A decrease in fossil feedstock consumption in the utilization process or an increase in the reference process could therefore lower the SPECFER to below 1 MJ/MJ. On the other hand, the SPECFER can be significantly increased to values exceeding 2.5 MJ/MJ as a result of lower fossil feedstock consumption in the reference case. Because the ranges of the SPECFER values of case C show overlap with the SPECFER ranges of case A, it is not possible to conclude whether case C performs better than case A, despite the significant difference in the base value. However, the sensitivity analysis supports the conclusion that case B is the most efficient utilization process among the three cases.
The sensitivity analysis was performed by making changes as one-at–the time and did not consider simultaneous changes in multiple parameters, which could result in a propagation of uncertainties in the SPECFER values and thereby lead to values that exceed the SPECFER ranges presented. Furthermore, the sensitivity analysis did not stress the importance of selecting and assessing the reference system. The selection of a proper reference system can be challenging, especially when it is not straightforward which products or processes are replaced by the CO2 utilization option.
Conclusion 6.5.
The assessment and comparison of the performance of CO2 utilization technologies is a complex exercise due to the different system boundaries and functionality of the final CO2-based products. Indicators that ore often used to assess the performance, such as the CO2 conversion efficiency and reduction of greenhouse gas emissions, provide useful but limited insights and are ineffective in providing a comprehensive comparison of the performance of different utilization options.
Chapter 6
216
In this paper, a new indicator, the Specific Primary Energy Consumption per unit of Fossil feedstock Replaced (SPECFER) was introduced to assess and compare the performance of CO2 conversion options. This indicator relates the additional energy consumption of CO2 conversion processes with the amount of fossil feedstock that is avoided due to the use of CO2, and can be used as a proxy for the efficiency of a CO2 conversion technology. The key advantage of the SPECFER indicator is that it can be applied independently of the final CO2-based product, and therefore can be used to compare the performance of utilization technologies with different end-products. These characteristics make the SPECFER a useful alternative to existing technical indicators such as CO2 conversion efficiency.
The application of the SPECFER indicator was tested by examples of three different utilization cases. Results show that the indicator added the following insights to the performance of CO2 utilization systems:
A high CO2 conversion efficiency does not necessarily improve the performance of a system. When a substantial additional energy amount is required to convert the CO2, this is not always compensated by associated fossil feedstock savings.
Examples of the selected cases show that only the performance of the small-scale application of CO2 conversion into polyols was efficient. The energy inputs required to drive large-scale utilization processes converting CO2 into dimethyl ether and methanol appear too significant compared to the actual fossil feedstock savings of these cases.
The use of renewable energy, even though accompanied by much lower primary energy factors than fossil energy, can significantly contribute to the SPECFER and make a CO2 conversion process inefficient. As energy efficiency indicator, the SPECFER can therefore help to identify what utilization processes are best suited to effectively use (intermittent) renewable energy.
The reliability of applying the SPECFER indicator, especially if different CO2 utilization options are compared, strongly depends on how consistently the methodology is applied. It is particularly important to:

New indicator for comparing the energy performance of CO2 utilization concepts
217
Select correct reference systems Apply system boundaries consistently Include all energy and fossil based inputs Correctly distinguish energy and fossil feedstock inputs and avoid
double counting Consistently allocate the energy required for the capture of CO2 to the
utilization process
Even when the methodology is correctly and consistently applied, uncertainties in the SPECFER results still exist. The conversion of energy inputs to primary energy consumption and fossil feedstock to primary fossil feedstock depend on the used primary energy factors and cumulative energy demand values. The associated uncertainties in these values can be significant, as in many cases average values, simplifications and/or proxies are used to calculate these figures. Therefore, it is recommended to include uncertainty assessment when conducting a comparative assessment following the SPECFER methodology.
The SPECFER indicator gains adds key insights into the energy efficiency of CO2 utilization options that convert the CO2 to products, but does not assess the effectiveness to abate greenhouse gas emissions of that option. Therefore, it is recommended to use the SPECFER in combination with a GHG reduction or climate change mitigation measure to assess the complete perspective of the performance of CO2 utilization. The application of SPECFER can then improve the understanding of CO2 conversion technologies and help to successfully compare technologies with different end-product functionality.
Acknowledgements
This research has been carried out as part the EDDiCCUT project (www.eddiccut.com). EDDiCCUT was a 4 year research project (2012-2016) assessing the environmental performance of carbon capture and utilization technologies. The project was led by the Industrial Ecology Programme at Norwegian University of Science and Technology in collaboration with the Copernicus Institute at Utrecht University and Tel‐Tek in Porsgrunn. The project was supported by Gassnova and industrial partners (Bharat Petroleum, Norske Shell and Uniper).
We would like to thank Dr. Anders Arvesen from NTNU for his review and suggestions during the final phase of preparing this paper.

218
Summary, conclusion and recommendations
219
Summary, conclusion and recommendations 7.
Background 7.1.
Global warming caused by the rise of anthropogenic greenhouse gas (GHG) emissions can severely impact the worldwide climate, and can eventually lead to irreversible impacts on ecosystems (IPCC, 2014). To keep these impacts within acceptable limits, the average global temperature rise should be limited to approximately 2°C compared to pre-industrial levels (IPCC, 2014). Different options are available to limit CO2 emissions, such as renewable energy sources, biomass, energy efficiency improvements, replacing carbon intensive fuels with less intensive ones (e.g. coal with natural gas or nuclear), and applying carbon capture and storage (CCS). CCS aims to reduce CO2 emissions to the atmosphere by capturing CO2 from energy-related and industrial sources and transporting it to (underground) storage sites where the CO2 is injected and long-term stored.
Most modelling studies agree that a portfolio of CO2 mitigation options including CCS is needed to reach the required CO2 emission reduction (GEA, 2012; IEA, 2015b, 2016; IPCC, 2014; Riahi et al., 2015). Moreover, integrating CCS with the use of renewable biomass (often referred to as BioCCS or BECCS) is considered a necessary option for low-stabilization scenarios (IPCC, 2014; ZEP, 2012). Removing CCS from the portfolio has severe impacts on addressing the challenge of climate change mitigation, because the 2°C temperature increase scenario becomes more difficult and costly to achieve without CCS (IEA, 2014b; IPCC, 2014; Riahi et al., 2015).
Besides its storage, using CO2 as a feedstock, so-called carbon utilization (CCU), is increasingly being researched. CCU includes the direct use of CO2 or its conversion into chemicals or materials. There are several arguments to pursue CCU, including the potential generation of revenues and the introduction of green energy (via H2 produced from renewable energy) in the fuel and chemical production chain (SCOT, 2016).
Carbon capture and storage, and potentially carbon utilization, are considered effective climate change mitigation technologies, but are also associated with adverse impacts that affect the environmental performance of the technologies. The energy required for capturing CO2 is one of the main drawbacks of the technology, because it increases the primary fuel consumption per unit of output, resulting for example in a decline in efficiency of power and industrial
Chapter 7
220
plants. Besides, the CO2 capture process increases the cooling demand, electricity consumption (for CO2 compression) and the use of chemicals and/or solvents. Finally, CCS requires additional infrastructure for the capture facility and CO2 transport and storage network. From an environmental point of view, these drawbacks can increase the direct emission of pollutants at the power plant or industrial process and capture facility (although some emissions, such as NOx and SOx, can be reduced due to co-capture), as well as indirect emissions caused by, for example, the production and transport of fuels and chemicals.
Life cycle assessment (LCA) is a well-established method that systematically assesses the impact of both direct and in-direct emissions on the environmental performance of a technology. It enables to combine all emissions over the total life cycle of a product or system and convert these emissions into environmental impact categories, such as climate change, toxicity and eutrophication. Besides, the use of natural resources is also accounted for in indicators such as water depletion, fossil fuel depletion and natural land occupation. LCA studies on CCS have shown that the large reduction of direct CO2 emissions resulting from CCS substantially lowers the impact on climate change. The net impact is, however, lower than the CO2 capture rate, because the increase in fuel demand caused by the energy required for capture partly offsets the emission reduction on site (Corsten et al., 2013). Increased fuel consumption per unit of output also leads to an increase in other life cycle impact categories, such as toxicity and eutrophication (Gibon et al., 2017). As a result, trade-offs arise between climate change mitigation and increasing other environmental impacts. To date most LCAs have focused on the assessment of post-combustion CO2 capture using mono ethanolamine (MEA) as this is considered the most mature technology while other concepts have been less examined (Corsten et al., 2013).
This thesis focussed on three areas that are increasingly gaining attention but have been to a limited extent addressed in environmental assessment studies (see chapter 1), i.e.: the impact of CCS on water availability, the effect of different types of biomass on the environmental trade-offs of BioCCS, and environmental impacts of CO2 utilization.

Summary, conclusion and recommendations
221
Objective and research questions 7.2.
The objective of this thesis was to improve the understanding of environmental trade-offs of carbon capture, utilization and storage. This was done by applying, adapting and developing environmental assessments methods suitable for evaluating CCS and CCU technologies to a diverse selection of case studies. The following research questions were formulated:
I. How significant are the impacts of deploying carbon capture and storage on water availability, both at process and system level?
II. How does integrating the use of biomass affect the environmental trade-offs of carbon capture and storage?
III. What are the differences in environmental trade-offs between CO2 utilization and CO2 capture and storage, and how can the understanding and comparison of environmental trade-offs be improved?
Table 7.1 presents an overview of which research questions were addressed in which chapters of this thesis.
Table 7.1: Overview matrix of the chapters and addressed research questions. Chapter Title Research question
I II III 2 Exploring the potential impact of implementing
carbon capture technologies in fossil fuel power plants on regional European water stress index levels
x
3 Comparative life cycle assessment of biomass co-firing plants with carbon capture and storage x x
4 Impact of fuel selection on techno-environmental performance of tail-end calcium looping process applied to a cement plant
x x
5 Assessing the techno-environmental performance of CO2 utilization via dry reforming of methane for the production of dimethyl ether
x
6 New indicator for comparing the performance of CO2
utilization technologies x

Chapter 7
222
Main findings and conclusions 7.3.
In this section, a summary of the main findings and conclusions of this thesis are presented for each research question.
Research question I: How significant are the impacts of deploying carbon capture and storage on water availability, both at process and system level?
The deployment of CO2 capture technologies in power and industrial processes leads to an increase in water use. Water use includes water withdrawal (water taken from the source and discharged to the same source) and water consumption (loss of water that is not returned to the source, e.g. as a consequence of evaporation). CCS can increase both, mainly due to a rise in cooling water demand and additional water consumption during the CO2 capture process). For instance, coal fired power plants with post-combustion capture (MEA) have large cooling water make up requirements, while increased water demand in IGCCs with pre-combustion capture is mainly driven by an increased cooling load required to further cool the syngas and steam for the water gas shift reactor, and the increased auxiliary load. For thermal power plants, the total water use can increase by up to 90%, depending on electricity generation technology and fuel type (EPRI, 2011; IEAGHG, 2011). The future increase in energy production is expected to already significantly reduce freshwater availability, even when CCS deployment is not considered (e.g. DOE, 2014b; Halstead et al., 2014; IEA, 2016; Mouratiadou et al., 2016). As CCS can potentially further reduce freshwater availability, it is essential to monitor and evaluate the effect of CCS deployment on freshwater availability.
The potential impact of CCS on freshwater availability can be assessed on a process level, evaluating the impact of deployment of CCS on the total water use along a production chain, and on a system level, assessing the impact of (large-scale) deployment of CCS on the water availability of the larger system, e.g., Europe. It is important to evaluate the impact on both levels to fully understand how CCS can influence freshwater availability. In this thesis, the impact of deploying CCS on water use at process level was evaluated by conducting a life cycle assessment for a power plant and an industrial process: post combustion CO2 capture at coal-fired power plants (chapter 3) and tail-end calcium looping CO2 capture applied to clinker production at a cement plant (chapter 4). The impact of deployment of CCS on a system level was assessed by evaluating the impact of future large scale CCS deployment scenarios in the power sector (i.e. adding CO2 capture technologies to the majority of thermal power plants) on

Summary, conclusion and recommendations
223
European regional water stress levels, defined as the water use to availability ratio (chapter 2).
Key results
LCA results of chapter 3 showed that adding CO2 capture to a coal-fired PC or IGCC power plant increases the total water consumption in life cycle chain by 30-40%, mainly due to the increased consumption of coal per kWh electricity as a result of the efficiency drop at the power plant. This increase is much lower than the increase in water consumption at the power plant, which is almost doubled due to additional water use of the capture process and increased cooling water consumption, because the water use of the power plant is limited compared to the water consumption during coal production. In chapter 4, adding CO2 capture to clinker production at a cement plant does not increase the water consumption on site because the calcium looping process does not require the use of water, contrary to post-combustion capture using a solvent. As the water use of the clinker production is also minimal, life cycle water depletion potential (WDP) results are dominated by up- and downstream processes, mainly by the production of electricity. The addition of CO2 capture to clinker production at a cement plant enables co-production of electricity by utilizing waste heat of the calcium looping process. The amount of electricity that can be produced covers the electricity consumption of the clinker production, CO2 capture and compression processes. The net produced electricity was assumed to displace grid electricity, which has a high share of thermoelectric power plants consuming large amounts of freshwater. Due to this displacement effect, the production of electricity can reduce the WDP of CCS systems. For instance, the WDP was reduced in the calcium looping CO2 capture process by more than 100% compared to the clinker production process without CO2 capture.
In chapter 2, the impact of increased cooling water use on European freshwater availability due to large scale deployment of CCS in European power plants was assessed. A database that includes the location and cooling water use of 458 European largest power plants was developed. This was combined with a GIS-based water stress methodology that relates freshwater withdrawal with availability. The combination of water demand in specific locations and the corresponding water indexes in the region allowed to assess the impacts of the water footprint at the regional level. To understand the impacts under different conditions, three scenarios varying the penetration level of CCS, and the type of CO2 capture technologies for 2030 and 2050 were developed to explore the
Chapter 7
224
potential impact of the deployment of CCS on future European water stress levels. Results showed that retrofitting power plants built in the year 2000 or later (19% of the power plants in the database) with post-combustion CO2 capture will not significantly affect European water stress levels by 2030. However, deployment of CCS in 87% of the coal-fired power plants and in 33% of the natural gas fired power plants by 2050 (following the IEA 2DS base 2050 scenario (IEA, 2012b)) can increase water stress levels in several regions across Europe, such as the UK, Spain and central and Eastern Europe. A sensitivity analysis revealed that freshwater withdrawal contributes to a larger extent to water stress than freshwater consumption: When the water stress was calculated based on the water consumption rates of the power plants instead of water withdrawal rates, no significant rise in water stress due to the deployment of CCS is observed by 2030 or 2050.
There are several measures available that can counteract or reduce fresh-water availability impact of CCS, such as:
Integrating and optimising water use of power plant and CO2 capture processes.
Relocation of future power plants. Power plants that are at the end of their life time and need to be replaced could be rebuilt in regions with lower water stress or coastal areas (enabling the use of sea water for cooling). Note that the extent to which this measure can be applied is limited, as power plants often need to remain in industrial or highly populated areas because they are embedded in a power infrastructure that effectively covers the electricity demand in these areas.
Changing the fuel type and/or cooling method of power plants. The type of cooling method especially affects the water use of a power plant, as direct cooling requires substantial water withdrawal, but negligible water consumption, while more water is consumed when cooling towers are used with a lower amount of water withdrawal. For drastic water use reduction, the use of dry (air) cooling systems could be considered, although these systems are expensive and will further decrease power plant efficiency (e.g. IEAGHG, 2011; Zhai et al., 2010).

Summary, conclusion and recommendations
225
Methodological insights
The assessment of freshwater consumption in LCA is in continuous development. For example, the water depletion characterization of cooling water consumption has changed over time. The LCA characterization method ReCiPe 2008 (Goedkoop et al., 2009), which was used in chapter 3, did not account any WDP of water consumption from an unspecified origin. As a result, the presented life cycle WDP results in chapter 3 only represent the water use increase of upstream processes (coal production). The effect of including the cooling water consumption of the power plants on the total water depletion potential would however be limited, as the life cycle water consumption is dominated by water use during upstream processes (mainly production of coal). In chapter 4, a newer version of Recipe (ReCiPe, 2012) was used in which water depletion caused by cooling water consumption from an unspecified origin is accounted for.
Although the WDP is an effective indicator to measure total life cycle water consumption, it does not (yet) account for the following aspects that can affect freshwater availability:
The impact of water withdrawal. In open cooling systems, e.g. direct cooling, water is circulated back to the freshwater reservoir after its use. As this water is not consumed it does therefore not contribute to water depletion. However, the water that is continuously withdrawn from the reservoir is not available anymore for other purposes, and as such does reduce water availability.
Regional differences in water availability. Water depletion in LCA is currently a global impact category and variances in water availability are not accounted for, despite the larger impact of water use on water availability in regions where freshwater is already scarce. This shortcoming of LCA is widely recognized, and ongoing research is carried out with the aim to spatially differentiate LCA indicators, including the WDP (e.g. LC-IMPACT, 2017).
Chapter 7
226
The water stress methodology applied in chapter 2 covers these two aspects to some extent, as water withdrawal is directly related to regional water availability. However, the assessment also revealed some methodological limitations, and could be improved by:
Including the effect of both water withdrawal and water consumption on water stress levels. Although the effect of water withdrawal on water availability showed to be the most significant, water consumption also contributes to water stress. A method that could combine the effect of both water withdrawal and consumption simultaneously would provide a more complete assessment of the effect of water use on water availability.
Assessing the effect of thermal pollution on water quality. Thermal pollution, caused by discharging the cooling water back to the reservoir at higher temperature, was not included. Even though the discharge temperature of cooling water in e.g. Europe is closely regulated, the discharge of cooling water does lead to significant temperature increases in water sources (Raptis et al., 2016). This temperature increase could degrade water quality and affect ecosystems, and therefore it is recommended to account the effects of thermal pollution in LCA research (see e.g. Raptis et al., 2017; Verones et al., 2010).
Taking into account the development of water use in other sectors. The assessment only considered the increase in water use of the power sector. However, the water use in other sectors, such as agriculture and industry, is also likely to increase in the future. This could lead to higher general water stress levels, which would make water stress levels more sensitive to developments in the power sector, e.g. the deployment of CCS, as well.
Assessing the potential impact of climate change on water stress levels. The effects of climate change, e.g. an increase in temperature increase and change in precipitation quantities, could impact future water stress levels.
Overall, evaluating the complete perspective of the impact of CCS on water availability remains challenging, due to the different aspects that contribute to freshwater availability, such as water withdrawal, water consumption, thermal pollution, and the regional differences in water availability. To improve the evaluation of the impact of CCS on water availability, it is necessary to further develop water availability assessment methods that include all aspects contributing to water availability, and to apply these methods to continue
Summary, conclusion and recommendations
227
assessing the impact of CCS on water availability, both at a process and system level.
Research question II: How does integrating the use of biomass affect the environmental trade-offs of carbon capture and storage?
The potential net negative GHG emissions that can be the result of integrating biomass use to CCS (BioCCS) make BioCCS an interesting climate change mitigation option. The deployment of BioCCS in both the power and industry sector is necessary to achieve low CO2 stabilization scenarios that limit global warming by 2°C (IPCC, 2014; ZEP, 2012). The impacts of combining biomass and CCS on the environmental trade-offs of CCS depend on the type of biomass used, the type of fuel that is replaced and how the biomass is produced. Furthermore, the climate change mitigation potential of BioCCS is strongly influenced by the extent to which biomass can be considered “carbon neutral”. Carbon neutrality implies that the CO2 emissions from the combustion of biomass do not contribute to climate change because this CO2 is assumed to be removed from the atmosphere during the growth of the biomass. The time difference between the carbon uptake during the growth of the biomass and the CO2 emissions, the so-called carbon debt, is then not taken into account.
There is a large variety in proposed BioCCS concepts as there are many different types of biomass and CO2 capture technologies that can be considered. It is therefore important to evaluate the environmental performance of different options to assess the effect of variations in the type of biomass and the CO2 capture system. In this thesis, the environmental impact of BioCCS was analysed for two BioCCS case studies in chapters 3 and 4. In chapter 3, a LCA was performed on co-firing wood and straw pellets in a pulverized coal power plant and an integrated gasification combined cycle. In chapter 4, a life cycle assessment was conducted to evaluate the environmental performance of using biomass, in the form of wood pellets and animal meal, as fuel to drive a tail-end calcium looping CO2 capture process applied to a clinker production process.
Key results
The environmental performance of BioCCS was assessed at both process and life cycle level. The process level assessment addressed the impacts of (co-)firing biomass and CO2 capture on the direct emissions, use of chemicals, the use of utilities and waste streams on site. Important emissions to the environment were included, e.g. CO2, NOx, SOx, particulate matter, chlorine and fluoride. In

Chapter 7
228
the studied cases, the CO2 capture rate was set equal for the BioCCS and the fossil based cases. The integration of biomass use to CCS can only further reduce CO2 emissions when coal is replaced by the biomass. Replacing coal by biomass can significantly reduce other on-site emissions, such as SOx (reduction of ca. 30%) and particulate matter (reduction of ca. 15%), due to the lower sulphur and ash content of biomass compared to coal. On the other hand, the use of biomass increases chlorides and fluorides emissions, and the alkali components of biomass negatively affect the performance of catalysts, increasing the consumption of catalysts by up to 400%.
LCA results indicated that combining CCS with biomass further increases the climate change mitigation potential of CCS, as the CO2 removed from the atmosphere during biomass growth is sequestrated. In total, net negative life cycle CO2 emissions were observed (CO2 emission reductions of 100-135% compared to fossil-fuel based CCS) for the different BioCCS options. The extent to which BioCCS offers a net removal of CO2 from the atmosphere strongly depends on the type of biomass used and whether the biomass is considered to be carbon neutral. When taking the temporal mismatch between the carbon uptake and its emission/storage, the so-called carbon debt, into account, the climate change mitigation potential of biogenic carbon depends on the rotation period (time between growth of the biomass and its harvest/use) (e.g., Cherubini et al., 2016; Guest et al., 2013). For long rotation biomass, such as wood residues, the climate change potential is therefore limited. In chapter 3, the biomass was considered carbon neutral and consequently, LCA results revealed that net negative life cycle CO2 emissions can already be achieved with a biomass co-firing ratio of 30%. In chapter 4, in which carbon debt was taken into account by adjusting the climate change reduction factor of biogenic CO2 stored, results indicated that co-firing ratios close to 100% are needed to achieve net negative life cycle CO2 emissions.
Results showed that the deployment of CCS increases the environmental impact in all categories other than climate change potential due to increased fuel consumption per unit of output, which is in accordance with trends observed in literature (e.g., Gibon et al., 2017; Zapp et al., 2012). When comparing BioCCS with a reference case without CCS and biomass use, the LCA results on BioCCS also showed an increase in all categories other than climate change potential, with the exception of the environmental impact category fossil depletion potential (FDP). The FDP can actually be up to 30% lower than the reference case without CCS, if a large amount of fossil fuel is replaced by biomass.

Summary, conclusion and recommendations
229
When comparing BioCCS to fossil-fuel based CCS, the effect on the environmental trade-offs between the different impact categories depends on the fuel type that is replaced by the biomass. When biomass is considered to replace coal, results indicated that impacts on human toxicity, water toxicity and freshwater eutrophication are significantly reduced as a result of avoided impacts related to coal production. On the other hand, impacts in some LCA categories, such as ozone depletion and terrestrial ecotoxicity are higher for BioCCS than coal based CCS, mainly due to the impacts associated with the production of fossil fuels and electricity used for biomass harvesting and processing. Surprisingly, LCA results for water depletion and land use of BioCCS were on par with coal-based CCS. The biomass used in the LCAs in this thesis mostly comprised biomass residues, and land and water use during the growth of this biomass was not allocated to these residues. A sensitivity analysis was performed in chapter 3 to assess the potential impact of allocating land use to the used biomass on the environmental performance of BioCCS. The results of this analysis showed that when land use was included, the total life cycle agricultural land use was increased by several orders of magnitude. The use of other types of biomass, e.g. dedicated crops, instead of residues could lead to substantial higher life cycle land use and water use values than presented in this thesis.
An interesting insight into the environmental trade-offs of (Bio)CCS was provided by the use of life cycle endpoint indicators in chapter 3 (based on ReCiPe Endpoint characterization factors (Goedkoop et al., 2009)). End-point indicators combine several environmental impact categories by applying weighting factors and assess the “total” environmental impact on categories such as the impact on human health and loss of ecosystems. The endpoint indicators results indicated that reduction of climate change potential compensates the increase in other impact categories, as total impacts on human health and ecosystems significantly decrease when CCS is applied. When BioCCS is considered, the endpoint impacts are even further reduced due to the increased climate change mitigation potential. The endpoint indicators could indicate that the environmental trade-offs of (Bio)CCS are in favour of deploying the technology.
Overall, the integration of biomass use to CCS does not change the trend of the environmental trade-offs of CCS, as BioCCS also increases the impact in all other environmental impact categories except climate change reduction and fossil depletion, compared to a reference scenario without CCS and biomass use. Nevertheless, the use of biomass further increases the climate change mitigation

Chapter 7
230
potential of CCS. Changes in impacts in other categories are limited, and replacing coal by biomass leads to a reduction in categories such as toxicity and eutrophication. Therefore, the integration of biomass use to CCS can improve the environmental trade-offs between mitigating climate change and increasing other environmental impacts, especially when the biomass is considered to replace coal.
Methodological insights
LCA is a well-established methodology to evaluate the environmental performance of systems and products. Three key aspects that could significantly affect the perspective on the environmental performance of BioCCS are: water use, land use and carbon neutrality of biomass.
A limitation of the conducted research in this thesis was that the assessments on BioCCS only considered the use of biomass residues, but not the use of other types of biomass, e.g. dedicated crops. The use of dedicated crops besides biomass residues is, however, needed when large-scale deployment of BioCCS is considered. The use of dedicated crops instead of biomass residues would substantially increase the water consumption associated with the biomass production, due to the allocation of water consumption during the growth of the crops. Water consumption during biomass growth can be distinguished between water uptake from freshwater reservoirs and from soil moisture. In LCA, only water consumption from freshwater is accounted for. However, water taken from the soil can also contribute to water stress and its impacts are recommend to be included in LCA research (see e.g. Kounina et al., 2012; Pacetti, et al., 2015). It is especially important to further investigate the challenges of water use impacts of biomass production, as the increased water demand could potentially have a large effect on the environmental trade-offs of BioCCS.
The use dedicated crops instead of biomass residues would also increase the land use (change) associated with biomass production. The results of the sensitivity analysis in chapter 3 indicate that the allocation of land use can be a critical factor in determining the environmental trade-offs of BioCCS. The impacts on biodiversity caused by the land use (change) of biomass production for energy are indicated to be potentially concerning (e.g. Immerzeel et al., 2014). Therefore, it is important to continue assessing to what extent the trade-offs of BioCCS can be affected by the land use change of the use of dedicated crops. Translating the land use indicators in LCA into biodiversity impacts is challenging. Land use and land use change are dynamic issues, and research is
Summary, conclusion and recommendations
231
ongoing to include this impact adequately in LCA (Teixeira et al., 2016). The use of a land stress indicator (see e.g. LC-IMPACT, 2017; Pfister et al., 2011), similarly to the water stress indicator, might be better equipped to cover land use impacts in LCA.
As summarized in the key results, the climate change mitigation potential of BioCCS depends on the extent to which the used biomass is considered carbon neutral. The different factors that were used for biogenic CO2 sequestrated in chapter 4 highlighted the sensitivity of the climate change mitigation to these factors. As there is no common method in LCA that adequately addresses the carbon debt of biogenic CO2, the climate change potential of biogenic CO2 needs to be manually included to cover the (variations in) carbon debt of different biomass types. Assumptions regarding the biomass growth time and timespan between the biomass production and biomass use are needed to estimate the climate change potential of biogenic CO2. These assumptions strongly affect and increase the uncertainties surrounding the climate change mitigation potential of BioCCS.
The use of endpoint indicators in LCA appears to simplify the environmental trade-offs of (Bio)CCS, as these indicators combine multiple midpoint impact categories into single categories. However, the use of endpoint indicators in LCA is not widely supported, because it loses insights into individual impact categories, the methods that can be used to convert different categories into one are questionable and the weighting factors that can be used are considered subjective. Therefore, it is not sufficient to only use endpoint indicators to conclude that the environmental trade-offs favour the deployment of (Bio)CCS.
Research question III: What are the differences in environmental trade-offs between CO2 utilization and CO2 storage, and how can the understanding and comparison of environmental trade-offs of CO2 utilization be improved?
The environmental performance of CCU can be considerably different than CCS. The GHG emission reduction potential of CCU strongly depends on what CO2 utilization option is considered, but is generally lower than that of CCS (Cuéllar-Franca et al., 2015), as the CO2 is often not permanently stored and fossil energy is often considered to be used for the conversion of CO2. On the other hand, LCA of CCU options show co-benefits in other environmental categories, particularly when the CO2 utilization process replaces a polluting conventional process and when renewable energy is used instead of fossil fuel (Cuéllar-Franca et al., 2015).

Chapter 7
232
Assessments are needed to improve the understanding of the environmental impact of CCU. It is important to evaluate and compare the environmental performance of different CCU options to support the selection of CCU options that are worthwhile to pursue from an environmental point of view. A life cycle assessment was performed to evaluate the environmental performance of a specific CO2 utilization option in chapter 5. In this option, CO2 captured from a H2 production unit at a natural gas-fired refinery was captured and utilized via dry reforming of methane for the production of dimethyl ether (DME), which can be used as a replacement for diesel. In chapter 6, a new performance indicator was introduced that allows the comparison of the performance of CCU options with different functionality.
Key results
LCA results on the CO2 utilization into DME case study (chapter 5) showed that although a substantial amount of the captured CO2 was used in the process, this is to a large extent compensated by direct formation of CO2 during the DME production process. As a result, only 9% of the CO2 that is utilized is avoided. Consequently, the life cycle climate change potential of this utilization route is only reduced by 8% compared to the reference case, which is five times lower than the climate change reduction of CCS. Besides, the DME production process requires the use of novel catalysts and a considerable amount of electricity (0.81 kWh/kg DME). The processes related to the production of catalysts and electricity (when a conventional mix including fossil based electricity was considered) almost doubled the impact in a few impact categories, such as freshwater eutrophication and ecotoxicity. On the other hand, the impacts in some other environmental categories were reduced, contrary to CCS where the impact in all other categories increases. For example, the utilization process was found to be more resource efficient: the use of fossil feedstock was reduced by 25%, which lowered the depletion of fossil fuels, water and metals compared to conventional DME production. The LCA results of the case study confirm that environmental trade-offs of CCU differ considerably from the environmental trade-offs of CCS. The variation in increases and decreases of different environmental categories provide a more complex trend of the environmental trade-offs than for CCS, where the trade-off is always between climate change mitigation reduction and an increase in all other environmental impacts.

Summary, conclusion and recommendations
233
Methodological insights
The assessment of the environmental performance of CCU is more complex than the assessment of CCS due to additional challenges, such as:
Selection of system boundaries of CCU systems. The selection of system boundaries plays a key role in LCA, even more for CCU, as the selection of system boundaries is not always straightforward for CCU. Multiple choices are possible regarding impacts allocated to the CO2 flow, ranging from upstream processes (CO2 formation and capture) to the end-use phase.
The need for system expansion due to multiple products in the system, often with different functionality (for example fuels, H2, electricity and the final CO2 utilization product). Besides the CCU product(s), the product(s) and processes associated with the original process from which the CO2 is captured also need to be considered. The measurement of the output of the system, the functional unit, needs to include all outputs of a system. System expansion is often required to include all products and match the functional unit between utilization cases and reference cases.
Selection of reference systems. Similar to the selection of system boundaries, proper selection of reference systems is vital in LCA. While the selection of a reference system is straightforward for CCS, namely the same process without CO2 capture, the reference system for CCU needs to include conventional production of the CCU product(s). The selection of the reference system can be challenging, as different options are often available for conventional production processes.
The varying trend in environmental trade-offs and the additional complexity of performing LCAs make the comprehensive understanding of the environmental performance of CCU difficult. This becomes especially apparent when trying to compare the performance of CO2 utilization options with different product functionality, as the different functionality causes variances in applied functional units and system boundaries. Existing metrics, such as the CO2 conversion rate and the life cycle CO2 emissions, are useful to assess an aspect of the environmental performance of CO2 utilization, but provide limited insight into the energy efficiency performance of CO2 conversion processes.
A new performance indicator was introduced in chapter 6, namely the Specific Primary Energy Consumption per unit of Fossil Feedstock Replaced (SPECFER),

Chapter 7
234
that allows the comparison of different CCU concepts and can help improve the understanding of environmental trade-offs of CCU. This indicator relates the energy required for CO2 capture and conversion to the amount of fossil feedstock that is replaced by the carbon content of CO2 in the utilization process. The indicator, expressed in MJ/MJ, can be used as a proxy for the energy efficiency of CO2 conversion and can be used to compare CO2 utilization products with different functionality.
The use of the SPECFER was exemplified by three case studies in chapter 6 (including CO2 conversion into DME, which was assessed in chapter 5. Results of this comparison illustrate that the use of the SPECFER indicator can provide additional perspectives on the performance of CCU concepts to existing performance indicators. For example, CO2 options with a high CO2 conversion efficiency can be very energy inefficient, especially when large scale CO2 conversion is considered, even when renewable energy is used for the conversion process. On the other hand, energy efficient CO2 conversion routes can offer limited CO2 reduction potentials.
The SPECFER allows the comparison of the performance of CO2 utilization options with different end-product functionality, but does not assess the climate change mitigation potential of the CO2 utilization option. Combining the use of the SPECFER indicator with life cycle CO2 emissions enables to assess the complete environmental perspective of CCU. Uncertainties in the SPECFER calculation can be significant, and can be caused by uncertainties in input parameters and inconsistencies in applying the methodology. It is important to address these uncertainties, especially in a comparative assessment, by performing an uncertainty assessment and by verifying that a consistent approach is undertaken in the selection of system boundaries, selection of reference systems and allocation of energy and material use of products. When the uncertainties are taken into account, the SPECFER can help to improve the understanding of the environmental performance of CO2 utilization and can assist in selecting promising CO2 utilization options.
Summary, conclusion and recommendations
235
Recommendations 7.4.
Based on the results presented in this thesis, the following recommendations for policy makers and further research are identified.
7.4.1. Policy
The assessment of the environmental performance of CCUS should not only address the climate change reduction potential, but also other environmental aspects, such as the fresh water availability and the toxicity potential, as these can have a large impact on the environmental perspective of a technology, both on a process and a system level. The CO2 emission reduction impact does not guaranty CCUS options to have a positive environmental impact.
The impact of CCS on fresh water availability needs to be monitored when deployment of CCS is considered. An early stage screening of the water footprint of individual plants is recommended as well as system wide assessment to explore the impact on water availability of large scale deployment of CCS. In regions with lower water availability, fresh-water saving measures, such as the use of sea water or alternative cooling methods, can be considered to counter potential water availability concerns.
The combination of biomass and CCS (BioCCS) offers attractive climate change mitigation potentials. However, the environmental performance of BioCCS is strongly affected by the type of biomass used, how the biomass is produced and what type of fuel the biomass replaces. The largest climate change mitigation potential is offered by replacing coal by biomass with a fast rotation. Sustainable production of biomass is vital, as the use of dedicated crops could have adverse environmental impacts due to the use of land, water and chemicals (such as fertilizers).
The assessment of the performance of CO2 utilization is increasingly becoming important as new CO2 utilization concepts are continuously being introduced due to the rise in interest in CO2 utilization. New concepts can appear promising (for example due to a high CO2 conversion rate or the use of renewable energy), but can at the same time provide limited environmental benefits. It is therefore important to use the life cycle climate change mitigation potential to assess the complete perspective on the environmental performance. The SPECFER

Chapter 7
236
indicator can be used to evaluate the energy efficiency of a CO2 conversion technology and can be helpful to screen CCU concepts in an early-stage of development and to guide decision making processes regarding promising CO2 utilization options.
7.4.2. Further research
Additional work is needed to further complete the perspective on the impact of the deployment of CCS on fresh-water resources. The following methodology improvements on water availability assessments are recommended:
o Include the combined impact of water withdrawal and water consumption on fresh water stress in a single assessment
o Include the effects of thermal pollution (discharging cooling water back to the reservoir at a higher temperature) on water quality.
o Continue the work on water depletion in LCA. Currently, the water depletion method in LCA is not related to water availability and does not distinguish regional differences. Although the methodology has already been substantially improved during recent years, further development is necessary to progress the insights into water availability concerns in LCA.
o The assessment of the impact of deploying CCS on water availability can be improved by integrating the potential impact of large scale deployment of CCS with the prospected increase of water use in other sectors, such as agriculture. An integrated assessment would allow exploring more realistic scenarios and would be useful to improve the identification of bottlenecks in water availability.
Challenges remain present to further understand the environmental trade-offs of CCS, as it is difficult to determine to what extent the mitigation of climate change is nullified by the increase in other environmental impact categories. The use of end-point indicators in LCA aims to combine different environmental indicators and could be helpful to decrease the complexity of the environmental trade-offs for policy makers. However, as the use of end-point indicators is currently not sufficiently supported in the scientific community, additional work is needed to improve end-point methodology in LCA.
The environmental performance of BioCCS strongly depends on the extent to which carbon debt of the biomass is accounted for. In LCA,

Summary, conclusion and recommendations
237
there is currently no common method available that accounts for the carbon debt when characterizing biogenic CO2 emitted or sequestrated. It is important to develop a common methodology to avoid unrealistic predictions of the climate change mitigation potential of BioCCS. It is also important to assess the impacts on water use and land use when the use of dedicated crops needed for large scale-deployment of BioCCS is considered.
Development of methods to improve the assessment and comparison of the environmental performance of CO2 utilization options needs to be continued. The new SPECFER indicator is a first step towards the possibility to effectively compare the performance of different CCU concepts, and can provide a good perspective of the environmental performance of CCU when used in combination with life cycle CO2 emissions. Further development and testing of this indicator is needed to support the use of this indicator as a common method to assess the performance of CCU.

238

Samenvatting, conclusie en aanbevelingen
239
Samenvatting, conclusie en aanbevelingen 8.
Achtergrond 8.1.
De opwarming van de aarde die wordt veroorzaakt door een stijging van de uitstoot van antropogene broeikasgassen kan ernstige gevolgen hebben voor het wereldwijde klimaat, en kan uiteindelijk leiden tot onomkeerbare gevolgen voor ecosystemen (IPCC, 2014). De gemiddelde globale temperatuurstijging moet beperkt worden tot ongeveer 2°C ten opzichte van pre-industriële niveaus om de gevolgen van de opwarming binnen acceptabele limieten te houden (IPCC, 2014). Er zijn verschillende mogelijkheden beschikbaar om CO2 emissies terug te dringen, zoals hernieuwbare energiebronnen, biomassa, energie efficiëntie verbeteringen, het vervangen van koolstof intensieve brandstoffen door minder intensieve alternatieven (bijvoorbeeld kolen vervangen door aardgas of nucleaire brandstof) en het toepassen van CO2 afvang en opslag (CCS). CCS heeft als doel CO2 emissies te reduceren door de CO2 te filteren uit energie gerelateerde en industriële processen, om dit vervolgens te transporteren naar (ondergrondse) opslaglocaties waar de CO2 wordt geïnjecteerd en voor lange termijn wordt opgeslagen.
De meeste modellen stellen vast dat een combinatie van verschillende maatregelen, inclusief CCS, nodig is om de uitstoot van CO2 voldoende te verminderen (GEA, 2012; IEA, 2015b, 2016; IPCC, 2014; Riahi et al., 2015). Het integreren van CCS met het gebruik van biomassa (BioCCS) wordt tevens als noodzakelijk gezien om lage stabilisatie scenario’s te bereiken (IPCC, 2014; ZEP, 2012). Zonder CCS wordt de uitdaging om klimaatverandering tegen te gaan groter en zal het beperken van de temperatuurstijging tot 2°C moeilijker en duurder zijn (IEA, 2014b; IPCC, 2014; Riahi et al., 2015).
Naast het opslaan van CO2 wordt er steeds meer onderzoek gedaan naar het gebruik van CO2 als grondstof, oftewel CO2 utilisatie (CCU). CCU omvat direct gebruik van CO2 of conversie van CO2 naar chemicaliën of materialen. Er zijn verschillende argumenten om CCU na te streven, zoals het genereren van potentiele inkomsten en het introduceren van groene energie in de productieketen van brandstof en chemicaliën (via het gebruik van waterstof geproduceerd met hernieuwbare energie) (SCOT, 2016).
Chapter 8
240
CO2 afvang en opslag, en in potentie CO2 gebruik, worden beschouwd als effectieve technologieën om klimaatverandering tegen te gaan, maar worden ook geassocieerd met nadelige gevolgen voor het milieu. Een van de belangrijkste nadelen is dat er energie nodig is om CO2 af te vangen, wat het gebruik van voornamelijk fossiele brandstof per productie-eenheid vergroot en de efficiëntie van energiecentrales en fabrieken verlaagt. Het CO2 afvangproces vergroot daarnaast de vraag naar koelwater, het gebruik van elektriciteit (voor CO2 compressie) en het gebruik van chemicaliën. Tot slot heeft CCS extra infrastructuur nodig in de vorm van CO2 afvang faciliteiten en een CO2 transport en opslag netwerk. Vanuit milieu oogpunt kunnen deze nadelen leiden tot een stijging van vervuilende emissies aan de schoorsteen van energiecentrales, fabrieken en CO2 afvang faciliteiten (hoewel de emissie van sommige stoffen, zoals NOx en SOx, gereduceerd wordt omdat deze ook worden afgevangen in het CO2 afvang proces). Ook indirecte vervuilende emissies als gevolg van bijvoorbeeld de productie en transport van brandstoffen en chemicaliën kunnen toenemen.
Levenscyclusanalyse (LCA) is een gevestigde methode dat systematisch de gevolgen van zowel directe en indirecte emissies op het milieu evalueert. Deze methode maakt het mogelijk om alle emissies gedurende de hele levenscyclus te combineren en deze om te zetten naar milieu-impactcategorieën, zoals klimaatverandering. Daarnaast wordt ook het gebruik van natuurlijke bronnen geëvalueerd in categorieën zoals uitputting van waterbronnen, uitputting van fossiele reserves en landgebruik. Levenscyclusanalyses toegepast op CCS hebben aangetoond dat de grote afname van directe CO2 uitstoot, als gevolg van CO2 afvang, positief bijdraagt aan het tegengaan van potentiele klimaatverandering. Het netto effect is echter lager dan de hoeveelheid CO2 die afgevangen wordt, omdat de brandstoftoename, die veroorzaakt wordt door de energie die nodig is voor het afvangproces, de directe uitstootvermindering gedeeltelijk compenseert (Corsten et al., 2013). Een hoger brandstofgebruik per productie-eenheid leidt ook tot een toename in andere milieu-impactcategorieën, zoals toxiciteit en eutrofiering (Gibon et al., 2017). Er ontstaat zo een afweging tussen het terugdringen van potentiele klimaatverandering ten koste van een stijging van gevolgen in overige milieu-impactcategorieën. De meeste levenscyclusanalyses hebben zich tot dusver geconcentreerd op de evaluatie van post-verbranding CO2 afvang met mono ethanolamine (MEA), omdat dit beschouwd wordt als de meest volwassen technologie, en zijn andere concepten minder vaak onderzocht (Corsten et al., 2013).

Samenvatting, conclusie en aanbevelingen
241
Dit proefschrift richt zich op drie gebieden die beperkt zijn geëvalueerd in milieueffectstudies, hoewel ze in toenemende mate aandacht krijgen (zie hoofdstuk 1): de gevolgen van CCS op de beschikbaarheid van water, het effect van het gebruik van verschillende soorten biomassa op de milieugevolgen van BioCCS, en de milieueffecten van CO2 voor de productie van chemische producten.
Doelstelling en onderzoeksvragen 8.2.
Het doel van dit proefschrift is om meer inzicht te krijgen in de milieugevolgen van CO2 afvang, gebruik en opslag. Dit is gedaan door milieubeoordelingsmethoden geschikt voor de evaluatie van CCS en CCU te ontwikkelen, aan te passen en toe te passen. De volgende onderzoeksvragen zijn geformuleerd:
I. Hoe belangrijk zijn de gevolgen van het inzetten van CO2 afvang en opslag op de waterbeschikbaarheid, zowel op proces- als systeemniveau?
II. Hoe beïnvloedt de integratie van het gebruik van biomassa met CO2 afvang en opslag de milieugevolgen?
III. Wat zijn de verschillen in de milieugevolgen tussen CO2 gebruik en CO2 opslag, en hoe kunnen we de milieugevolgen van beide opties beter begrijpen en vergelijken?

Chapter 8
242
Tabel 8.1 geeft een overzicht van welke onderzoeksvragen in welke hoofdstukken zijn behandeld.
Tabel 8.1. Overzicht van de hoofdstukken en de daarin geadresseerde onderzoeksvragen. Hoofdstuk Titel Onderzoeksvraag
I II III 2 Verkenning van het potentiele effect van het
inzetten van CO2 afvangtechnologieën in fossiele elektriciteitscentrales op regionale Europese water stress niveaus
x
3 Vergelijkende levenscyclusanalyse van het bijstoken van biomassa in centrales met CO2 afvang en opslag
x x
4 Het effect van brandstofkeuze op de technologische en milieuprestatie van het toevoegen van een calciumcirculatie aan een cementfabriek
x x
5 Het beoordelen van de technologische en milieuprestatie van het gebruik van CO2 via hervorming van methaan voor de productie van dimethyl ether
x
6 Een nieuwe indicator voor het vergelijken van de prestatie van CO2-gebruikstechnologieën x
Belangrijkste resultaten en conclusies 8.3.
Deze sectie bevat een samenvatting van de voornaamste resultaten en conclusies voor elke onderzoeksvraag.
Onderzoeksvraag I: Hoe belangrijk zijn de gevolgen van het inzetten van CO2 afvang en opslag op de waterbeschikbaarheid, zowel op proces- als systeemniveau?
Het inzetten van CO2 afvang technologieën in energiecentrales en industriële processen leidt tot een stijging van het watergebruik. Watergebruik omvat wateronttrekking (water dat na gebruik teruggevoerd wordt naar de bron) en water verbruik (water dat niet teruggevoerd wordt naar de bron en dus verloren gaat, bijvoorbeeld als gevolg van verdamping). CCS kan beide doen toenemen, voornamelijk door een stijging van de vraag naar koelwater en extra watergebruik tijdens het CO2 afvang proces. Kolencentrales uitgerust met CO2 afvang na het verbrandingsproces (MEA) vereisen bijvoorbeeld grote
Samenvatting, conclusie en aanbevelingen
243
hoeveelheden koelwater. De grotere vraag naar water in kolenvergassingscentrales (IGCC) met CO2 afvang wordt vooral veroorzaakt door een verhoogde koelbelasting voor het afkoelen van synthetisch gas en stoom. De stijging in het totale watergebruik van warmtekrachtcentrales kan oplopen tot 90%, afhankelijk van de opwekkingstechnologie en het brandstoftype (EPRI, 2011; IEAGHG, 2011). De toekomstige toename van energieproductie zal naar verwachting de beschikbaarheid van zoetwater aanzienlijk verminderen, zelfs wanneer implementatie van CCS niet wordt overwogen (e.g. DOE, 2014b; Halstead et al., 2014; IEA, 2016; Mouratiadou et al., 2016). Aangezien het inzetten van CCS de beschikbaarheid van zoetwater mogelijk verder kan verminderen, is het essentieel om het effect van de implementatie van CCS op de beschikbaarheid van zoetwater te monitoren en evalueren.
Het mogelijke effect van CCS op de beschikbaarheid van zoetwater kan worden beoordeeld op procesniveau, door de gevolgen van het inzetten van CCS op het totale watergebruik van een productieketen te evalueren, en op systeemniveaudoor de gevolgen van (grootschalige) implementatie van CCS te evalueren voor de waterhuishouding van een groter systeem, bijvoorbeeld Europa. Het is belangrijk de potentiele gevolgen op beide niveaus te evalueren om het effect van CCS op de beschikbaarheid van zoetwater volledig te begrijpen. In dit proefschrift is het gevolg van het implementeren van CCS op het watergebruik op procesniveau geëvalueerd door middel van een levenscyclusanalyse van een elektriciteitscentrale en een industrieel proces: post-verbranding CO2 afvang in kolencentrales (hoofdstuk 3) en CO2 afvang middels calciumcirculatie toegepast op klinkerproductie in een cementfabriek (hoofdstuk 4). Het effect van het inzetten van CCS op systeemniveau is geëvalueerd door het gevolg van toekomstige scenario’s van grootschalige inzet van CCS in de energiesector (d.w.z. het toevoegen van CO2 afvangtechnologieën aan de meerderheid van de warmtekrachtcentrales) op Europese regionale water stress niveaus (gedefinieerd als de verhouding van watergebruik tot waterbeschikbaarheid) in kaart te brengen (hoofdstuk 2).
Resultaten
LCA resultaten van hoofdstuk 3 laten zien dat het toevoegen van CO2 afvang aan een kolencentrale (PC of IGCC) het totale watergebruik met 30-40% verhoogt, voornamelijk door de toename in het gebruik van kolen per kWh elektriciteit als gevolg van de verminderde efficiëntie. Deze toename is veel lager dan de stijging van het watergebruik in de centrale, die bijna verdubbeld wordt door extra watergebruik van het CO2 afvang proces en verhoogde vraag naar

Chapter 8
244
koelwater, omdat het watergebruik van de centrale beperkt is in vergelijking met het watergebruik tijdens de productie van kolen. In hoofdstuk 4 wordt aangetoond dat het toevoegen van CO2 afvang aan klinkerproductie in een cementfabriek het totale watergebruik ter plaatse niet verhoogt, omdat er geen water nodig is voor het calciumcirculatie afvang proces, in tegenstelling tot post-verbranding afvang met behulp van een oplosmiddel. Aangezien het watergebruik van klinkerproductie ook minimaal is, wordt de potentiele uitputting van water (WDP) over de levenscyclus gedomineerd door up- en downstream processen, voornamelijk door de productie van elektriciteit. De toevoeging van CO2-afvang aan klinker productie in een cementfabriek maakt de coproductie van elektriciteit mogelijk door gebruik te maken van de restwarmtes van het calciumcirculatie proces. Op deze manier kan meer elektriciteit opgewekt worden dan verbruikt wordt tijdens de klinkerproductie, CO2 afvang en compressie processen. Aangenomen is dat de netto hoeveelheid geproduceerde elektriciteit geleverd wordt aan het net, en zodoende andere geproduceerde elektriciteit vervangt. De vervangen hoeveelheid elektriciteit wordt voor een deel geproduceerd in warmtekrachtcentrales waarbij veel zoetwater wordt gebruikt, waardoor het vervangen van deze elektriciteit het WDP van CCS systemen kan verminderen. Het toevoegen van het calciumcirculatie CO2 afvang proces vermindert bijvoorbeeld het WDP met meer dan 100% in vergelijking met het klinkerproces zonder CO2 afvang.
In hoofdstuk 2 is het gevolg van het toenemend gebruik van koelwater als gevolg van grootschalige inzet van CCS op de Europese zoetwater beschikbaarheid geëvalueerd. Allereerst is een database met de locatie en koelwatergebruik gegevens van 458 van de grootste Europese energiecentrales samengesteld. Deze gegevens zijn gecombineerd met een op GIS-gebaseerde water stress methodologie die de onttrekking van zoetwater relateert aan de zoetwater beschikbaarheid. De combinatie van de locatie-specifieke vraag naar water en de bijbehorende waterbeschikbaarheidsindexen maakt het mogelijk de gevolgen van de watervoetafdruk op regionaal niveau in kaart te brengen. Drie scenario’s met variaties in het penetratieniveau van CCS en het type CO2 afvang technologieën voor 2030 en 2050 zijn ontwikkeld om de potentiele gevolgen van het inzetten van CCS op toekomstige Europese water stress niveaus in kaart te brengen. Uit de resultaten blijkt dat bestaande energiecentrales gebouwd na het jaar 2000 (19% van de energiecentrales in de database) kunnen worden voorzien met post-verbranding CO2 afvang zonder dat dit een significant effect heeft op Europese water stress niveaus in 2030. Het inzetten van CCS in 87% van de kolencentrales en in 33% van de aardgascentrales in 2050 (gebaseerd op het IEA 2DS base 2050 scenario (IEA,
Samenvatting, conclusie en aanbevelingen
245
2012b)) kan echter leiden tot een water stress stijging in verscheidende regio’s in Europa, zoals het Verenigd Koninkrijk, Spanje en Midden- en Oost-Europa. Een gevoeligheidsanalyse laat zien dat zoetwateronttrekking meer bijdraagt aan waterstress dan zoetwater verbruik: Wanneer de water stress berekend wordt met behulp van het verbruik van water in plaats van de onttrekking van water, wordt er geen significante stijging van water stress als gevolg van de implementatie van CCS waargenomen in 2030 of 2050.
Er zijn verschillende maatregelen beschikbaar die de gevolgen van CCS op de water beschikbaarheid kunnen tegengaan of verminderen, zoals:
Het watergebruik van energiecentrales en CO2 afvang processen integreren en optimaliseren.
Energiecentrales bij herbouw te verplaatsen. Energiecentrales die aan het einde van hun levensduur zijn en vervangen moeten worden kunnen worden herbouwd in gebieden met lagere water stress of in kustgebieden (waardoor zeewater gebruikt kan worden voor koeling). Wees echter bewust dat de mate waarin deze maatregel toegepast kan worden beperkt is, aangezien energiecentrales vaak gebonden zijn aan industriële of dichtbevolkte gebieden en ingebed zijn in een elektriciteitsinfrastructuur die effectief voorziet in de elektriciteitsbehoefte in deze gebieden.
Het type brandstof en/of koelmethode van energiecentrales wijzigen. De koelmethode beïnvloedt voornamelijk het watergebruik van een energiecentrale, omdat directe koeling substantiële hoeveelheid wateronttrekking vereist, maar het water verbruik verwaarloosbaar is, terwijl meer water verbruikt wordt maar minder water onttrokken wordt wanneer koeltorens gebruikt worden. Het implementeren van luchtgekoelde systemen kan worden overwogen om het water gebruik te verminderen, hoewel deze systemen duur zijn en de efficiëntie van energiecentrales verder verlagen.
Methodologische inzichten
De analyse van zoetwater verbruik in LCA is in voortdurende ontwikkeling. De analyse van wateruitputting is in de loop van de tijd veranderd. De LCA methode ReCiPe 2008 (Goedkoop et al., 2009), die is toegepast in hoofdstuk 3, kent geen wateruitputting toe aan waterverbruik uit ongespecificeerde bronnen. Als gevolg daarvan is enkel de stijging in het waterverbruik van upstream processen vertegenwoordigd in de WDP resultaten in hoofdstuk 3.
Chapter 8
246
Het effect van het meenemen van koelwater verbruik van de energiecentrales op de potentiele uitputting van water is echter beperkt, omdat het watergebruik in de levenscyclus gedomineerd wordt door waterverbruik van upstream processen (voornamelijk de productie van kolen). In hoofdstuk 4 is een nieuwere versie van ReCiPe toegepast (ReCiPe, 2012), waarin de potentiele wateruitputting veroorzaakt door (koel)water gebruik uit ongespecificeerde bronnen is meegenomen.
Hoewel het WDP een effectieve indicator is om het totale watergebruik in de levenscyclus te meten, worden de volgende aspecten die de beschikbaarheid van zoetwater kunnen beïnvloeden (nog) niet voldoende meegenomen:
De gevolgen van wateronttrekking. In open koelsystemen, zoals directe koeling, wordt het water na gebruik teruggebracht naar het zoetwater reservoir. Dit water draagt dus niet bij aan de uitputting van water aangezien dit water niet verbruikt wordt. Water dat continu uit een reservoir wordt onttrokken is echter niet meer beschikbaar voor andere doeleinden, en vermindert daarom weldegelijk de beschikbaarheid van water.
Regionale verschillen in de beschikbaarheid van water. Wateruitputting in LCA is momenteel een wereldwijde indicator waarin geen rekening gehouden wordt met variaties in de beschikbaarheid, ondanks dat het gevolg van watergebruik op water beschikbaarheid juist groter is in regio’s waarin water al schaars is. Deze beperking in LCA wordt algemeen erkend, en onderzoek is gaande met als doel LCA indicatoren, waaronder de WDP, regio specifiek te maken (e.g. LC-IMPACT, 2017).
De water stress methode toegepast in hoofdstuk 2 bestrijkt deze twee aspecten tot op zekere hoogte, aangezien deze methode wateronttrekking direct relateert aan de regionale beschikbaarheid van water. De analyse heeft echter een aantal methodologische beperkingen aan het licht gebracht die kunnen worden verbeterd door:
De gevolgen van zowel wateronttrekking als waterverbruik op water stress niveaus mee te nemen. Hoewel het effect van wateronttrekking op water beschikbaarheid het belangrijkste is, draagt waterverbruik ook bij aan water stress. Een methode die tegelijkertijd het effect van zowel onttrekking als verbruik zou kunnen combineren zou een volledigere beoordeling van het effect van water gebruik mogelijk maken.

Samenvatting, conclusie en aanbevelingen
247
De gevolgen van thermische vervuiling op de water kwaliteit te beoordelen. Thermische vervuiling, veroorzaakt door het lozen van koelwater met hogere temperatuur in de waterbron, was niet beschouwd. Ondanks dat de afvoertemperaturen van koelwater in e.g. Europa scherp zijn gereguleerd kan het lozen van koelwater leiden tot significante temperatuurstijgingen in waterbronnen (Raptis et al., 2016). Deze stijging kan de waterkwaliteit verminderen en ecosystemen in gevaar brengen, en het wordt daarom aanbevolen de effecten van thermische vervuiling mee te nemen in LCA onderzoek (see e.g. Raptis et al., 2017; Verones et al., 2010).
Rekening te houden met de ontwikkeling van watergebruik in andere sectoren. De analyse heeft enkel de stijging van watergebruik in de energiesector meegenomen. Het watergebruik in andere sectoren, zoals landbouw en industrie, zal waarschijnlijk ook in de toekomst toenemen. Dit kan leiden tot hogere algemene water stress niveaus, waardoor deze niveaus ook gevoeliger zijn voor ontwikkelingen in de energiesector, bijvoorbeeld de inzet van CCS.
Het beoordelen van de mogelijke gevolgen van klimaatverandering op water stress niveaus. De gevolgen van klimaatverandering, bijvoorbeeld een temperatuurstijging en de verandering van neerslaghoeveelheden, kunnen invloed hebben op toekomstige water stress niveaus.
Het blijft een uitdaging om het volledige perspectief van het effect van CCS op de beschikbaarheid van water te evalueren, vanwege de verschillende aspecten die bijdragen aan de beschikbaarheid van zoetwater, zoals wateronttrekking, water verbruik, thermische vervuiling en de regionale verschillen in waterbeschikbaarheid. Om de evaluatie van de gevolgen van CCS op water beschikbaarheid te verbeteren is het nodig om methodes die alle aspecten die bijdragen aan water beschikbaarheid verder te ontwikkelen, en deze toe te passen op de wisselwerking tussen CCS en waterbeschikbaarheid, zowel op proces- en systeemniveau.
Onderzoeksvraag II: Hoe beïnvloedt de integratie van het gebruik van biomassa met CO2 afvang en opslag de milieugevolgen?
De potentiele net-negatieve uitstoot van broeikasgassen die het gevolg zijn van het integreren van biomassa-gebruik met CCS (BioCCS) maken BioCCS een interessante optie om klimaatverandering tegen te gaan. Het is nodig om BioCCS te implementeren in zowel de energiesector als de industrie om CO2-stabilizatie scenario’s te bereiken die de opwarming van de aarde beperken tot

Chapter 8
248
2°C (IPCC, 2014; ZEP, 2012). De gevolgen van het combineren van biomassa en CCS voor het milieu hangen af van welke type biomassa gebruikt wordt, welk type brandstof vervangen wordt en hoe de biomassa wordt geproduceerd. Verder wordt de potentiele inperking van klimaatverandering sterk beïnvloed door de mate waarin de biomassa als “koolstofneutraal” beschouwd kan worden. Koolstofneutraliteit houdt in dat de CO2 uitstoot als gevolg van de verbranding van biomassa niet bijdraagt aan klimaatverandering, omdat deze CO2 tijdens de groei van de biomassa uit de atmosfeer is verwijderd. Het tijdsverschil tussen de koolstofopname en de CO2 uitstoot, de zogenaamde koolstofschuld, wordt dan niet in aanmerking genomen.
Er is een grote verscheidenheid aan voorgestelde BioCCS-concepten, aangezien er verschillende soorten biomassa en CO2 afvang technologieën zijn die overwogen kunnen worden. Het is daarom belangrijk om de milieugevolgen van verschillende opties te evalueren om inzicht te krijgen in het effect van variaties in biomassatypes en CO2 afvang technologieën. In dit proefschrift zijn de milieugevolgen van BioCCS geanalyseerd voor twee BioCCS opties in hoofdstukken 3 en 4. In hoofdstuk 3 is een LCA uitgevoerd voor het bijstoken van hout- en stro korrels in twee types kolencentrales: een centrale op basis van verbranding van verpulverde kolen en een geïntegreerde vergassingcentrale met een gecombineerde cyclus. In hoofdstuk 4 is een LCA uitgevoerd om de milieuprestatie van het gebruik van biomassa, in de vorm van houtkorrels en gemalen dierlijke resten, als brandstof voor een CO2 afvang proces op basis van calciumcirculatie in het klinker productieproces te evalueren.
Resultaten
De milieugevolgen van BioCCS zijn geanalyseerd op zowel proces- als levenscyclusniveau. De analyse op procesniveau bevat de gevolgen van het (bij)stoken van biomassa en het toepassen van CO2 afvang op emissies, het gebruik van chemicaliën, het gebruik van nutsvoorzieningen en afvalstromen. Belangrijke emissies zijn meegenomen, zoals CO2, NOx, SOx, fijnstof, chloor en fluoride. Het CO2 afvang percentage was identiek voor BioCCS en CCS. De integratie van het gebruik van biomassa met CCS kan enkel de CO2 uitstoot verder verminderen wanneer kolen vervangen worden door biomassa. Daarnaast leidt het vervangen van kolen door biomassa ook tot een afname in de uitstoot van overige stoffen, zoals SOx (afname van ca. 30%) en fijnstof (afname van ca. 15%), als gevolg van het lagere zwavel- en as-gehalte van biomassa vergeleken met kolen. Anderzijds verhoogt het gebruik van biomassa chloride- en fluoride emissies, en kunnen de alkalische componenten van

Samenvatting, conclusie en aanbevelingen
249
biomassa de prestaties van katalysatoren negatief beïnvloeden, waardoor het verbruik van katalysatoren tot 400% kan toenemen.
LCA resultaten wijzen erop dat het combineren van CCS met biomassa de potentiele beperking van klimaatverandering verder kan vergroten, aangezien de CO2 die uit de atmosfeer wordt verwijderd tijdens de groei van de biomassa ondergronds wordt opgeslagen. Netto negatieve CO2 emissies over de totale levenscyclus zijn berekend (CO2 uitstoot reductie van 100-135% vergeleken met fossiele CCS) voor de verschillende BioCCS opties. De mate waarin BioCCS kan leiden tot een netto verwijdering van CO2 uit de atmosfeer hangt sterk af van het type biomassa dat gebruikt wordt en of de biomassa als koolstofneutraal beschouwd kan worden. Als het tijdsverschil tussen de koolstofopname en de uitstoot/opslag van CO2 (de zogenaamde koolstofschuld) meegenomen wordt, heeft als gevolg dat de potentiele inperking van klimaatverandering afhangt van de rotatieperiode (tijd tussen groei en de oogst van de biomassa). Voor biomassa met een lange rotatieperiode, zoals houtresiduen, is het mitigatiepotentieel voor klimaatverandering daarom beperkt. In hoofdstuk 3 is de biomassa als klimaatneutraal beschouwd en bleek uit de LCA resultaten dat een netto negatieve CO2 uitstoot over de levenscyclus al bereikt kan worden met een biomassa bijstook percentage van 30%. De koolstofschuld is meegenomen in de analyse in hoofdstuk 4 door de klimaatverandering reductiefactor van opgeslagen CO2 van biogene oorsprong aan te passen, en resultaten tonen aan dat in dat geval bijstook percentages van bijna 100% nodig zijn om netto negatieve CO2 uitstoot over de levenscyclus mogelijk te maken.
Uit de resultaten blijkt dat de inzet van CCS leidt tot een stijging van de milieugevolgen in alle categorieën uitgezonderd klimaatverandering, als gevolg van het verhoogde brandstofgebruik per productie-eenheid, wat in overeenstemming is met trends die in de literatuur worden waargenomen (e.g., Gibon et al., 2017; Zapp et al., 2012). De LCA resultaten van BioCCS laten ook een stijging zien in alle andere categorieën dan klimaatverandering ten opzichte van een referentiescenario zonder CCS en biomassagebruik, met uitzondering van de uitputting van fossiele brandstoffen (FDP). De totale FDP kan 30% lager zijn dan in het referentiescenario, wanneer een grote hoeveelheid fossiele brandstof wordt vervangen door biomassa.
Wanneer BioCCS vergeleken wordt met fossiele CCS blijkt dat het effect op de milieugevolgen sterk afhangt van het brandstoftype dat vervangen wordt door de biomassa. Het gebruik van biomassa in plaats van kolen leidt tot een sterke afname in toxiciteit en zoetwater eutrofiëring omdat effecten van

Chapter 8
250
kolenproductie vermeden worden. Anderzijds worden de gevolgen in sommige categorieën, zoals afbraak van de ozonlaag en bodemverontreiniging vergroot, hoofdzakelijk als gevolg van de effecten gerelateerd aan de productie van de fossiele brandstoffen en elektriciteit die gebruikt worden voor het oogsten en verwerken van de biomassa. De LCA resultaten voor wateruitputting en landgebruik waren verrassenderwijs gelijk voor BioCCS en kolen-CCS. Het type biomassa dat in de LCA’s in dit proefschrift is geanalyseerd bestond voor het grootste gedeelte uit residuen, en het gebruik van land en water gedurende de groei van de biomassa is niet toegewezen aan deze residuen. Een gevoeligheidsanalyse is uitgevoerd in hoofdstuk 3 om de potentiele gevolgen van de toewijzing van grondgebruik aan de gebruikte biomassa voor de milieuprestatie van BioCCS te beoordelen. De resultaten van deze analyse laten zien dat het toewijzen van grondgebruik leidt tot een verhoging van het totale landgebruik met een aantal grootteordes. Het gebruik van andere types biomassa in plaats van residuen, zoals speciaal voor energie geteelde gewassen, kan leiden tot aanzienlijk hoger land- en watergebruik dan de waardes gepresenteerd in dit proefschrift.
Het gebruik van eindpunt-indicatoren in hoofdstuk 3 (gebaseerd op ReCiPe eindpunt-karakteriseringfactoren(Goedkoop et al., 2009)) verschaft een interessant inzicht in de milieugevolgen van (Bio)CCS. Eindpunt-indicatoren combineren diverse milieu-impactcategorieën door het toepassen van wegingsfactoren en beoordelen op deze manier de “totale” gevolgen voor het milieu in categorieën zoals het effect op de menselijke gezondheid en het verlies van ecosystemen. De eindpunt-indicator resultaten wijzen erop dat de inperking van klimaatverandering de stijging van andere milieugevolgen compenseert, aangezien het totale effect op menselijke gezondheid en het verlies van ecosystemen aanzienlijk afneemt wanneer CCS wordt toegepast. Het verhoogde klimaatverandering mitigatiepotentieel resulteert in een verdere afname van de eindpunt-indicatoren wanneer de implementatie van BioCCS wordt overwogen. De eindpunt-indicatoren lijken aan te geven dat het implementeren van (Bio)CCS positieve gevolgen heeft voor het milieu.
Over het algemeen verandert de integratie van het gebruik van biomassa met CCS de trend van de milieugevolgen niet, aangezien BioCCS ook leidt tot een toename in alle milieu-impactcategorieën, met uitzondering van klimaatverandering en uitputting van fossiele brandstoffen, in vergelijking met een referentiescenario zonder CCS en biomassa gebruik. Niettemin verhoogt het gebruik van biomassa het klimaatverandering mitigatiepotentieel van CCS. Veranderingen in de effecten in andere milieu categorieën zijn beperkt, en
Samenvatting, conclusie en aanbevelingen
251
vervanging van kolen door biomassa leidt tot kleinere gevolgen voor bijvoorbeeld toxiciteit en eutrofiering. De integratie van biomassa gebruik met CCS kan daarom de milieugevolgen verbeteren, vooral wanneer de biomassa kan fungeren als vervanging voor kolen.
Methodologische inzichten
LCA is een gevestigde methodologie om de milieuprestaties van systemen en producten te evalueren. Drie belangrijke aspecten die het perspectief op de milieuprestaties van BioCCS aanzienlijk kunnen beïnvloeden zijn: watergebruik, landgebruik en koolstofneutraliteit van biomassa. Een beperking van het uitgevoerde onderzoek in dit proefschrift was dat in de studies naar BioCCS enkel het gebruik van biomassa residuen is overwogen, maar niet het gebruik van andere soorten biomassa, bijvoorbeeld speciaal voor energie geteelde gewassen. Het gebruik van zulke gewassen is echter nodig bij grootschalige inzet van BioCCS, en zou het waterverbruik geassocieerd met biomassa productie aanzienlijk kunnen verhogen. Waterverbruik tijdens de groei van biomassa kan worden onderscheiden in onttrekking uit zoetwaterreservoirs en in opname van bodemvocht. In LCA wordt alleen het waterverbruik uit zoet water meegenomen. Het onttrekken van bodemvocht kan echter ook bijdragen aan water stress en het wordt aangeraden om de gevolgen hiervan mee te nemen in LCA onderzoek (see e.g. Kounina et al., 2012; Pacetti, et al., 2015). Het is vooral van belang om verder onderzoek te doen naar de uitdagingen die gepaard gaan met het watergebruik tijdens biomassa productie, aangezien een toenemende vraag naar water mogelijk een groot effect kan uitoefenen op de gevolgen van BioCCS op het milieu.
Het gebruik van gewassen die speciaal voor energie geteeld worden in plaats van biomassa residuen kan ook leiden tot een stijging van (verandering in) het landgebruik voor biomassa productie. De resultaten van de gevoeligheidsanalyse in hoofdstuk 3 geven aan dat het toewijzen van landgebruik een cruciale factor kan zijn in het bepalen van de gevolgen van BioCCS voor het milieu. De gevolgen van (verandering in) landgebruik voor biomassa productie voor energie kunnen alarmerende gevolgen hebben voor de biodiversiteit (e.g. Immerzeel et al., 2014). Het is daarom belangrijk om de mate waarin de milieugevolgen beïnvloed kunnen worden door verandering in landgebruik door het gebruik van gewassen verder te evalueren. Het vertalen van landgebruik indicatoren in LCA naar de gevolgen voor biodiversiteit is een uitdaging. Landgebruik en een verandering in landgebruik zijn dynamische

Chapter 8
252
problemen en er wordt onderzoek gedaan om deze gevolgen adequaat mee te kunnen nemen in LCA (Teixeira et al., 2016). Het gebruik van een landstress indicator (see e.g. LC-IMPACT, 2017; Pfister et al., 2011), vergelijkbaar met de water stress indicator, zou wellicht meer geschikt zijn om de gevolgen van landgebruik in LCA te analyseren.
Het klimaatsverandering mitigatiepotentieel van BioCCS hangt af van de mate waarin de gebruikte biomassa als klimaatneutraal beschouwd wordt. De verschillende factoren die gebruikt zijn voor opgeslagen CO2 van biogene herkomst benadrukken de gevoeligheid van klimaatverandering mitigatie met betrekking tot deze factoren. Omdat er geen gebruikelijke methode is in LCA die adequaat de koolstofschuld van biogene CO2 beschouwt, moet het klimaatsverandering mitigatiepotentieel van biogene CO2 handmatig worden toegevoegd om de (variaties in) koolstofschuld van verschillende types biomassa te analyseren. Aannames over de groei van biomassa en de tijd tussen de productie en gebruik van biomassa zijn nodig de potentiele klimaatsverandering van biogene CO2 in te schatten. Deze aannames hebben een grote invloed op en verhogen de onzekerheden rondom het klimaatverandering mitigatiepotentieel van BioCCS.
Het gebruik van eindpunt indicatoren in LCA lijkt de analyse van de milieugevolgen van (Bio)CCS te vereenvoudigen doordat meerdere categorieën worden gecombineerd in enkele indicators. De toepassing van eindpunt indicatoren in LCA is wordt echter niet algemeen ondersteund, omdat inzichten in individuele categorieën verloren gaan, de methodes om verschillende categorieën te combineren betwist worden en de wegingsfactoren die kunnen worden gebruikt beschouwd worden als subjectief. Het is daarom niet voldoende om op basis van alleen eindpunt indicatoren te concluderen het inzetten van (Bio)CCS een positief effect heeft op de afweging tussen verschillende milieugevolgen.
Onderzoeksvraag III: Wat zijn de verschillen in de gevolgen voor het milieu tussen CO2 gebruik en CO2 opslag, en hoe kunnen we de milieugevolgen beter begrijpen en vergelijken?
De milieuprestatie van CCU kan aanzienlijk verschillend zijn dan die van CCS. De potentiele mitigatie van de uitstoot van CO2 van CCU hangt sterk af van de CO2-gebruiksoptie, maar is over het algemeen lager dan dat van CCS (Cuéllar-Franca et al., 2015), omdat de CO2 niet permanent wordt opgeslagen en vaak wordt aangenomen dat fossiele energie gebruikt wordt voor het omvormen van

Samenvatting, conclusie en aanbevelingen
253
CO2. Aan de andere kant tonen LCA studies van CCU-opties aan dat er naast het tegengaan van klimaatverandering positieve effecten kunnen optreden in andere milieu-impactcategorieën, voornamelijk wanneer het proces dat CO2 gebruikt een vervuilend conventioneel proces vervangt en wanneer hernieuwbare energie gebruikt wordt in plaats van fossiele brandstoffen (Cuéllar-Franca et al., 2015).
Analyses zijn nodig om de inzichten in de milieugevolgen van CCU te verbeteren. Het is belangrijk om de milieuprestaties van verschillende CCU-opties te evalueren en te vergelijken om de selectie van milieuvriendelijke CCU-opties te ondersteunen. Een LCA is uitgevoerd om de milieuprestatie van een specifieke CO2-gebruiksoptie te evalueren in hoofdstuk 5. In deze optie wordt de CO2 afgevangen van een H2 productie-eenheid in een aardgasgestookte raffinaderij, en vervolgens gebruikt voor het hervormen van methaan voor de productie van dimethylether (DME), wat als vervanging kan dienen voor diesel. In hoofdstuk 6 is een nieuwe prestatie-indicator geïntroduceerd die de vergelijking van de prestaties van CCU-opties met verschillende functionaliteiten mogelijk maakt.
Resultaten
De LCA resultaten in hoofdstuk 5 laten zien dat een aanzienlijke hoeveelheid van de afgevangen CO2 gebruikt wordt voor de productie van DME, maar dat dit in grote mate gecompenseerd wordt door directe formatie van CO2 tijdens het DME productieproces. In totaal wordt hierdoor de uitstoot van slechts 9% van de gebruikte CO2 vermeden. Het klimaatverandering mitigatiepotentieel over de levenscyclus van dit proces is als gevolg hiervan slechts 8% lager dan het referentiescenario, en vijf keer hoger het klimaatverandering mitigatiepotentieel van het CCS scenario. Voor het produceren van DME zijn daarnaast katalysatoren en een aanzienlijke hoeveelheid elektriciteit (0.81 kWh/kg DME) nodig. De productie van katalysatoren en elektriciteit (wanneer een conventionele elektriciteitsmix gebaseerd op fossiele energie wordt overwogen) leidt tot bijna een verdubbeling van de gevolgen in een aantal milieu-impactcategorieën, waaronder zoetwater eutrofiering en eco-toxiciteit. Anderzijds worden de effecten in sommige categorieën verminderd, in tegenstelling tot CCS waar de impact in alle andere categorieën toeneemt. Zo blijkt het CO2-gebruiksproces bijvoorbeeld minder grondstoffen te verbruiken: het gebruik van fossiele grondstoffen wordt verminderd met 25%, wat leidt tot minder uitputting van fossiele brandstoffen, water en metalen in vergelijking met conventionele productie van DME. De LCA resultaten bevestigen dat de milieugevolgen van

Chapter 8
254
CCU verschillen van de gevolgen van CCS. De variatie in toenames en afnames in verschillende milieu-impactcategorieën maakt de trend in de milieugevolgen complexer dan de trend van CCS, waar de mitigatie van klimaatverandering altijd gepaard gaat met een stijging in de gevolgen in alle overige milieu-impactcategorieën.
Methodologische inzichten
Extra uitdagingen spelen een rol in het beoordelen van de milieuprestatie van CCU, zoals:
De selectie van de systeemgrenzen van CCU systemen. Deze selectie speelt een sleutelrol in LCA, en in het bijzonder voor CCU omdat de selectie niet altijd eenvoudig is voor CCU. Meerdere keuzes zijn mogelijk met betrekking tot de impacts die aan de CO2-stroom kunnen worden toegewezen, variërend van upstream processen (CO2 formatie en afvang) tot de eindgebruiksfase.
De noodzaak van systeemuitbreiding door de aanwezigheid van meerdere producten in het systeem, met vaak verschillende functionaliteit (bijvoorbeeld brandstoffen, H2, elektriciteit en het uiteindelijke product). Naast de CCU-product(en) moet ook rekening gehouden worden met de producten en processen gerelateerd aan het originele proces waarin de CO2 wordt afgevangen. De meeteenheid van de output van het systeem, de functionele eenheid, moet alle outputs van het systeem bevatten. Systeemuitbreiding is vaak vereist om alle producten mee te nemen en een gelijke functionele eenheid te creëren voor CO2-gebruik scenario’s en referentie scenario’s.
De selectie van referentiesystemen. Net als bij de selectie van systeemgrenzen is de juiste selectie van referentiesystemen van vitaal belang in LCA. Het kiezen van een referentiesysteem is eenvoudig voor CCS, namelijk hetzelfde proces zonder CO2 afvang. Het referentiesysteem voor CCU moet echter de conventionele productie van de CCU-product(en) omvatten. Het selecteren van het juiste referentiesysteem kan uitdagend zijn, aangezien verschillende opties vaak beschikbaar zijn voor de conventionele productieprocessen.
De uiteenlopende tendens in milieugevolgen en de extra complexiteit van het uitvoeren van LCA’s maken het moeilijk een compleet inzicht te verwerven in de milieuprestatie van CCU. Dit wordt vooral duidelijk wanneer er geprobeerd wordt de prestaties van CO2-gebruiksopties met verschillende functionaliteiten

Samenvatting, conclusie en aanbevelingen
255
met elkaar te vergelijken, omdat de verschillende functionaliteiten leiden tot de toepassing van uiteenlopende functionele eenheden en systeemgrenzen. Bestaande prestatie-indicatoren, zoals de CO2-omzettings ratio en de uitstoot van CO2 over de gehele levenscyclus, zijn nuttig om een enkel aspect van de milieuprestatie van CO2-gebruik te beoordelen, maar leveren beperkte inzichten in de efficiëntie en effectiviteit van CO2-omzettingsprocessen.
Een nieuwe prestatie-indicator is geïntroduceerd in hoofdstuk 6, namelijk het specifieke primaire energieverbruik per eenheid vervangen fossiele grondstof (SPECFER), die het mogelijk maakt om verschillende CCU concepten te vergelijken en helpt inzichten in de milieugevolgen van CCU te verbeteren. Deze indicator relateert de energie die nodig is voor het afvangen en omzetten van CO2 naar de hoeveelheid fossiele grondstof die wordt vervangen door het koolstofgehalte van CO2 in het gebruiksproces. De indicator, uitgedrukt in MJ/MJ, kan gebruikt worden als proxy voor de energie-efficiëntie van het omzetten van CO2 en om CO2-gebruiksproducten met verschillende functionaliteit te vergelijken.
Het gebruik van de SPECFER is geïllustreerd in hoofdstuk 6 door deze toe te passen op drie voorbeelden van CCU concepten (inclusief het concept om CO2 te gebruiken voor de productie van DME, wat is bestudeerd in hoofdstuk 5). Resultaten van deze vergelijking laten zien dat het gebruik van de SPECFER indicator nieuwe perspectieven toevoegt aan de prestatie van CCU vergeleken met bestaande prestatie-indicatoren. Een voorbeeld hiervan is dat CO2 opties met een hoge CO2 omzetting-efficiëntie zeer energie-inefficiënt kunnen zijn, vooral wanneer het omzetten van CO2 op grote schaal wordt overwogen, en zelfs wanneer hernieuwbare energie gebruikt wordt voor het omzettingsproces. Anderzijds kunnen energie-efficiënte CO2 conversie routes beperkte mogelijkheden bieden voor het reduceren van de uitstoot van CO2.
De SPECFER maakt het mogelijk om de prestaties van CO2-gebruiksopties met verschillende eindproductfuncties te vergelijken, maar omvat niet klimaatverandering mitigatiepotentieel. Het volledige milieueffect van CCU kan beoordeeld worden door het gebruik van de SPECFER te combineren met CO2 emissies over de levenscyclus. Onzekerheden in de SPECFER-berekening kunnen significant zijn en kunnen worden veroorzaakt door onzekerheden in invoerparameters en inconsistenties bij het toepassen van de methodologie. Het is belangrijk om deze onzekerheden te evalueren, vooral wanneer de SPECFER gebruikt wordt om de prestaties van verschillende concepten te vergelijken, door een onzekerheidsbeoordeling uit te voeren en te verifiëren dat

Chapter 8
256
een consistente aanpak is toegepast bij de selectie van systeemgrenzen, selectie van referentiesystemen en de toewijzing van het gebruik van energie en materialen aan producten. Als de onzekerheden in aanmerking worden genomen kan de SPECFER het begrip van de milieuprestaties van CO2-gebruik verbeteren en helpen bij het identificeren van veelbelovende CO2-gebruiksopties.
Aanbevelingen 8.4.
De volgende aanbevelingen voor beleidsmakers en toekomstig onderzoek zijn geïdentificeerd op basis van de resultaten van dit proefschrift:
8.4.1. Beleid
Een goede beoordeling van de milieuprestaties van CCS en CCU omvat niet alleen het klimaatverandering mitigatiepotentieel, maar ook andere milieuaspecten, zoals de beschikbaarheid van zoetwater en toxiciteit, aangezien deze aspecten een groot effect kunnen hebben op het milieu-perspectief van een technologie, zowel op proces- als op systeemniveau. Een vermindering van CO2-uitstoot geeft daarnaast geen garantie dat CCS- en CCU-opties een positief effect hebben op de milieugevolgen.
De gevolgen van het toepassen van CCS op de beschikbaarheid van zoetwater moeten in de gaten gehouden worden wanneer implementatie van CCS overwogen wordt. Een screening in een vroeg stadium van de water voetafdruk van individuele energiecentrales wordt aanbevolen, evenals systeem brede studies om het effect van het toepassen van CCS op grote schaal op de water beschikbaarheid te onderzoeken. In gebieden met beperkte beschikbaarheid van water kunnen eventueel waterbesparende maatregelen, zoals het gebruik van zeewater of alternatieve koelmethodes, overwogen worden om potentiele problemen m.b.t. de beschikbaarheid van water tegen te gaan.
Het combineren van biomassa en CCS (BioCCS) biedt aantrekkelijke mogelijkheden voor de mitigatie van klimaatverandering. De milieuprestaties van BioCCS worden echter sterk beïnvloed door het gebruikte type biomassa, de manier waarop de biomassa wordt geproduceerd en welk type brandstof door de biomassa vervangen wordt. Het grootste klimaatverandering mitigatiepotentieel kan worden

Samenvatting, conclusie en aanbevelingen
257
gerealiseerd door kolen te vervangen met biomassa met een korte rotatie periode. Duurzame productie van biomassa is essentieel, aangezien het gebruik van speciaal voor energiedoeleinden geproduceerde gewassen negatieve milieugevolgen kan hebben door het gebruik van grond, water en chemicaliën (zoals kunstmest).
De beoordeling van de prestatie van CO2 gebruik wordt steeds belangrijker, omdat nieuwe CO2-gebruik concepten voortdurend worden geïntroduceerd door de toenemende belangstelling in het gebruik van CO2. Nieuwe concepten kunnen veelbelovend lijken (bijvoorbeeld door een hoge CO2-conversie ratio of het gebruik van hernieuwbare energie), maar de voordelen voor het milieu kunnen tegelijkertijd beperkt zijn. Het is daarom belangrijk om het klimaatverandering mitigatiepotentieel van CCU te beoordelen over de hele levenscyclus. De SPECFER indicator kan gebruikt worden om de energie-efficiëntie van een CO2-conversietechnologie te berekenen, om het potentieel van CCU-concepten in een vroeg stadium van ontwikkeling te screenen en om veelbelovende CO2-gebruik concepten te identificeren.
8.4.2. Toekomstig onderzoek
Extra onderzoek is nodig om de inzichten in het effect van de inzet van CCS op zoetwaterbronnen te verbeteren. De volgende methodologische verbeteringen op het gebied van onderzoek naar water-beschikbaarheid worden aanbevolen:
o Het effect van wateronttrekking en waterverbruik op water stress niveaus gelijktijdig te bestuderen.
o De effecten van thermische vervuiling (veroorzaakt door het terugbrengen van koelwater met hogere temperatuur naar het reservoir) op waterkwaliteit mee te nemen.
o Het werk m.b.t. het evalueren van wateruitputting in LCA voort te zetten. Momenteel is de wateruitputting-methode in LCA niet gerelateerd aan water beschikbaarheid en wordt er geen rekening gehouden met regionale verschillen. Hoewel de methode in de afgelopen jaren al aanzienlijk is verbeterd is verdere ontwikkeling nodig om de inzichten in waterbeschikbaarheid in LCA te verbeteren.
o De beoordeling van de gevolgen van de inzet van CCS op de water beschikbaarheid kan verbeterd worden door de potentiele impact van grootschalige implementatie van CCS te integreren

Chapter 8
258
met de verwachte stijging in watergebruik in andere sectoren, zoals landbouw. Een geïntegreerde studie zou het onderzoeken van meer realistische scenario’s mogelijk maken en zou nuttig zijn om knelpunten in de beschikbaarheid van water te identificeren.
Uitdagingen blijven aanwezig in het begrijpen van de gevolgen van het toepassen van CCS op het milieu, omdat het moeilijk is te bepalen in hoeverre het mitigeren van klimaatverandering opweegt tegen een toename van overige gevolgen voor het milieu. Het gebruik van eindpuntindicatoren in LCA heeft als doel verschillende milieu-impactcategorieën te combineren en de milieuprestatie te vereenvoudigen voor bijvoorbeeld beleidsmakers. Er is meer werk nodig om de eindpuntmethode in LCA te verbeteren, omdat het gebruik van de huidige eindpuntindicatoren momenteel onvoldoende wordt ondersteund door de wetenschappelijke gemeenschap.
De milieuprestatie van BioCCS hangt sterk af van de mate waarin de koolstofschuld van de biomassa wordt meegenomen. Er is momenteel geen algemene methode beschikbaar die rekening houdt met de koolstofschuld bij het karakteriseren van uitstoot of opslag van CO2 van biogene oorsprong. Het is belangrijk een gemeenschappelijke methode te ontwikkelen om onrealistische voorspellingen van het klimaatverandering mitigatiepotentieel van BioCCS te voorkomen. Het is ook belangrijk om de effecten van water- en landgebruik mee te nemen wanneer het gebruik van gewassen speciaal geteeld voor energie geacht worden nodig te zijn voor het inzetten van BioCCS op grote schaal.
De ontwikkeling van methodes ter verbetering van de beoordeling en vergelijking van de milieuprestatie van CO2-gebruik opties moet worden voortgezet. De nieuwe SPECFER indicator is een eerste stap naar het mogelijk maken van het effectief vergelijken van de prestatie van verschillende CCU concepten en kan een duidelijk perspectief geven van de milieuprestatie van CCU wanneer deze wordt gecombineerd met de CO2-uitstoot (afname) over de hele levenscyclus. Verdere ontwikkeling en toetsing van deze indicator is nodig om het gebruik hiervan als een gemeenschappelijke methode om de prestatie van CCU te beoordelen te ondersteunen.

References
259
References Adam, Z. (2013). Energy balances overview. Energy Statistics Training, Paris. Retrieved from
http://www.iea.org/media/training/presentations/statisticsmarch/balances_overview.pdf Adler, W. D. (2007). Transfair Engineering: Thermoforming in the Household Refrigerator Industries today.
Retrieved from http://www.xproindia.com/images/Transfair Tfg Rfgr indy.pdf Ahmaruzzaman, M. (2010). A review on the utilization of fly ash. Progress in Energy and Combustion Science,
36(3), 327–363. http://doi.org/10.1016/j.pecs.2009.11.003 Akarmazyan, S. S., Panagiotopoulou, P., Kambolis, A., Papadopoulou, C., & Kondarides, D. I. (2014). Methanol
dehydration to dimethylether over Al2O3 catalysts. Applied Catalysis B: Environmental, 145, 136–148. http://doi.org/10.1016/j.apcatb.2012.11.043
Al-Ali, K., Kodama, S., & Sekiguchi, H. (2014). Modeling and simulation of methane dry reforming in direct-contact bubble reactor. Solar Energy, 102, 45–55. http://doi.org/10.1016/j.solener.2014.01.010
Al-Mansour, F., & Zuwala, J. (2010). An evaluation of biomass co-firing in Europe. Biomass and Bioenergy, 34(5), 620–629. http://doi.org/10.1016/j.biombioe.2010.01.004
Alcamo, J., Döll, P., Henrichs, T., Kaspar, F., Lehner, B., Rösch, T., & Siebert, S. (2003). Development and testing of the WaterGAP 2 global model of water use and availability. Hydrological Sciences Journal, 48(3), 317–337. http://doi.org/10.1623/hysj.48.3.317.45290
Alsop, P. A. (2007). The Cement Plant Operations Handbook. Tradeschip Publications, Ltd. Althaus, H., Chudacoff, M., Hischier, R., Jungbluth, N., Osses, M., Primas, A., & Hellweg, S. (2007). Life cycle
inventories of chemicals. ecoinvent report No.8, v2.0. Final Report Ecoinvent Data …, (8), 1–957. Retrieved from http://scholar.google.com/scholar?hl=en&btnG=Search&q=intitle:Life+Cycle+Inventories+of+Chemicals#0
Ampelli, C., Perathoner, S., & Centi, G. (2015). Co2 utilization: An enabling element to move to a resource-and energy-efficient chemical and fuel production. Philosophical Transactions of the Royal Society A: Mathematical, Physical and Engineering Sciences, 373(2037). http://doi.org/10.1098/rsta.2014.0177
Arena, F., Mezzatesta, G., Spadaro, L., & Trunfio, G. (2014). Latest Advances in the Catalytic Hydrogenation of Carbon Dioxide to Methanol/Dimethylether. In B. M. Bhanage & M. Arai (Eds.), Transformation and Utilization of Carbon Dioxide, Green Chemistry and Sustainable Technology (pp. 303–334). http://doi.org/10.1007/978-3-642-44988-8
Aresta, M., Dibenedetto, A., & Angelini, A. (2013). The changing paradigm in CO2 utilization. Journal of CO2 Utilization, 3–4, 65–73. http://doi.org/10.1016/j.jcou.2013.08.001
Arias, B., Alonso, M., & Abanades, C. (2017). CO 2 Capture by Calcium Looping at Relevant Conditions for Cement Plants: Experimental Testing in a 30 kW th Pilot Plant. Industrial & Engineering Chemistry Research, acs.iecr.6b04617. http://doi.org/10.1021/acs.iecr.6b04617
Ariyaratne, W. K. H. (2014). Utilization of wase-derived biofuels and partly CO2-neutral fuels in cement kilns. PhD dissertation: Telmark University College.
Arvesen, A., & Hertwich, E. G. (2015). More caution is needed when using life cycle assessment to determine energy return on investment (EROI). Energy Policy, 76(7491), 1–6. http://doi.org/10.1016/j.enpol.2014.11.025
Aspentech. (2016). Aspen Plus Version 8.4. Atsonios, K., Grammelis, P., Antiohos, S. K., Nikolopoulos, N., & Kakaras, E. (2015). Integration of calcium looping
technology in existing cement plant for CO2 capture: Process modeling and technical considerations. Fuel, 153, 210–223. http://doi.org/10.1016/j.fuel.2015.02.084
Averyt, K., Fisher, J., Huber-Lee, A., Lewis, J., Macknick, N., Madden, J., … Tellinghuisen, S. (2011). Freshwater Use by U . S . Power Plants: Electricity’s thirst for a precious resource.
Azar, C., Lindgren, K., Obersteiner, M., Riahi, K., van Vuuren, D. P., den Elzen, K. M. G. J., … Larson, E. D. (2010). The feasibility of low CO2 concentration targets and the role of bio-energy with carbon capture and storage (BECCS). Climatic Change, 100(1), 195–202. http://doi.org/10.1007/s10584-010-9832-7
Azizi, Z., Rezaeimanesh, M., Tohidian, T., & Rahimpour, M. R. (2014). Dimethyl ether: A review of technologies and production challenges. Chemical Engineering and Processing: Process Intensification, 82, 150–172. http://doi.org/10.1016/j.cep.2014.06.007

References
260
Basu, P., Butler, J., & Leon, M. A. (2011). Biomass co-firing options on the emission reduction and electricity generation costs in coal-fired power plants. Renewable Energy, 36(1), 282–288. http://doi.org/10.1016/j.renene.2010.06.039
Bauer, C. (2008). Life Cycle Assessment of Fossil and Biomass Power Generation Chains. Retrieved from http://ventderaison.eu/documents/PSI-Bericht_2008-05.pdf
Bentsen, N. S. (2017). Carbon debt and payback time - Lost in the forest? Renewable and Sustainable Energy Reviews, 73(February), 1211–1217. http://doi.org/10.1016/j.rser.2017.02.004
Berstad, D., Anantharaman, R., & Jordal, K. (2012). Post-combustion CO2 capture from a natural gas combined cycle by CaO/CaCO3 looping. International Journal of Greenhouse Gas Control, 11, 25–33. http://doi.org/10.1016/j.ijggc.2012.07.021
Blamey, J., Anthony, E. J., Wang, J., & Fennell, P. S. (2010). The calcium looping cycle for large-scale CO2 capture. Progress in Energy and Combustion Science, 36(2), 260–279. http://doi.org/10.1016/j.pecs.2009.10.001
Blok, K. (2007). Introduction to Energy Analysis. Amsterdam: Techne Press. Blok, K., & Nieuwlaar, E. (2017). Introduction to Energy Analysis (2nd ed.). Boden, T. A., Marland, G., & Andres, R. J. (2017). Global, Regional, and National Fossil-Fuel CO2 Emissions. Carbon
Dioxide Information Analysis Center. Retrieved from http://cdiac.ornl.gov/trends/emis/tre_glob_2014.html
Boulay, A.-M., Hoekstra, A. Y., & Vionnet, S. (2013). Complementarities of Water-Focused Life Cycle Assessment and Water Footprint Assessment. Environmental Science & Technology, 47(21), 11926–11927. http://doi.org/10.1021/es403928f
Byers, E. a., Hall, J. W., & Amezaga, J. M. (2014). Electricity generation and cooling water use: UK pathways to 2050. Global Environmental Change, 25, 16–30. http://doi.org/10.1016/j.gloenvcha.2014.01.005
CAESAR. (2011). European best practice guidelines for assessment of CO2 capture technologies. Retrieved from http://caesar.ecn.nl/fileadmin/caesar/user/documents/D_4.9_best_practice_guide.pdf
Caldecott, B., Lomax, G., & Workman, M. (2015). Stranded carbon assets and negative emissions technologies. Smith School of Enterprise and the Environment, University of Oxford. Stranded Assets Programme. Retrieved from http://www.ilcambiamento.it/files/Carbon_oxford.pdf
Carma. (2013). Carbon Monitoring for Action. Center for Global Development. Retrieved from www.carma.org Carpentieri, M., Corti, A., & Lombardi, L. (2005). Life cycle assessment (LCA) of an integrated biomass
gasification combined cycle (IBGCC) with CO2 removal. Energy Conversion and Management, 46(11–12), 1790–1808. http://doi.org/10.1016/j.enconman.2004.08.010
CBS. (2013). Invoerhoeveelheid steenkool. Retrieved March 1, 2013, from http://statline.cbs.nl/Statweb/search/?Q=27011900&LA=NL
CEC. (2005). COMMUNICATION FROM THE COMMISSION Biomass action plan. Commission of European Comodities. Retrieved from http://eur-lex.europa.eu/legal-content/EN/TXT/PDF/?uri=CELEX:52005DC0628&from=EN
Charitos, A., Rodriguez, N., Hawthorne, C., Alonso, M., Zieba, M., Arias, B., … Abanades, J. C. (2011). Experimental Validation of the Calcium Looping CO 2 Capture Process with Two Circulating Fluidized Bed Carbonator Reactors. Industrial & Engineering Chemistry Research, 50(16), 9685–9695. http://doi.org/10.1021/ie200579f
Cherubini, F., Huijbregts, M. A. J., Kindermann, G., Van Zelm, R., Van Der Velde, M., Stadler, K., & Strømman, A. H. (2016). Global spatially explicit CO2 emission metrics for forest bioenergy. Scientific Reports, 6(20186), 1–12. http://doi.org/10.1038/srep20186
Connell, D. P., Lewandowski, D. a., Ramkumar, S., Phalak, N., Statnick, R. M., & Fan, L. S. (2013). Process simulation and economic analysis of the Calcium Looping Process (CLP) for hydrogen and electricity production from coal and natural gas. Fuel, 105, 383–396. http://doi.org/10.1016/j.fuel.2012.07.006
Coppola, A., Montagnaro, F., Salatino, P., & Scala, F. (2012). Fluidized bed calcium looping: The effect of SO 2 on sorbent attrition and CO 2 capture capacity. Chemical Engineering Journal, 207–208, 445–449. http://doi.org/10.1016/j.cej.2012.06.149
Cordero, J. M., & Alonso, M. (2015). Modelling of the kinetics of sulphation of CaO particles under CaL reactor conditions. Fuel, 150, 501–515. http://doi.org/10.1016/j.fuel.2015.02.075
Cormos, C. C. (2015). Assessment of chemical absorption/adsorption for post-combustion CO2 capture from Natural Gas Combined Cycle (NGCC) power plants. Applied Thermal Engineering, 82, 120–128. http://doi.org/10.1016/j.applthermaleng.2015.02.054
Corsten, M., Ramírez, A., Shen, L., Koornneef, J., & Faaij, A. (2013). Environmental impact assessment of CCS

References
261
chains – Lessons learned and limitations from LCA literature. International Journal of Greenhouse Gas Control, (13), 59–71.
Corti, A., & Lombardi, L. (2004). Biomass integrated gasification combined cycle with reduced CO2 emissions: Performance analysis and life cycle assessment (LCA). Energy, 29(12–15 SPEC. ISS.), 2109–2124. http://doi.org/10.1016/j.energy.2004.03.015
Cough, C., & Upham, P. (2012). Biomass energy with carbon capture and storage (BECCS or Bio-CCS). Greenhouse Gases: Science and Technology, 2(6), 408–418. http://doi.org/10.1002/ghg.34
CSIRO. (2012). Process Modelling for Amine-based Post-Combustion Capture Plant. Csiro. Retrieved from www.csiro.au
Cuéllar-Franca, R. M., & Azapagic, A. (2015). Carbon capture, storage and utilisation technologies: A critical analysis and comparison of their life cycle environmental impacts. Journal of CO2 Utilization, 9, 82–102. http://doi.org/10.1016/j.jcou.2014.12.001
Cuellar, A. (2012). Plant Power : The Cost of Using Biomass for Power Generation and Potential for Decreased Greenhouse Gas Emissions, 94.
Cui, Z., Aroonwilas, A., & Veawab, A. (2010). Simultaneous Capture of Mercury and CO 2 in Amine-Based CO 2 Absorption Process. Industrial & Engineering Chemistry Research, (49), 12576–12586.
Dahowski, R. T., Davidson, C. L., & Dooley, J. J. (2011). Comparing large scale CCS deployment potential in the USA and China: A detailed analysis based on country-specific CO2 transport & storage cost curves. Energy Procedia, 4, 2732–2739. http://doi.org/10.1016/j.egypro.2011.02.175
Dai, J., Sokhansanj, S., Grace, J. R., Bi, X., Lim, C. J., & Melin, S. (2008). Overview and some issues related to co-firing biomass and coal. Canadian Journal of Chemical Engineering, 86(3), 367–386. http://doi.org/10.1002/cjce.20052
Dai, Z., Middleton, R., Viswanathan, H., Fessenden-Rahn, J., Bauman, J., Pawar, R., … McPherson, B. (2014). An Integrated Framework for Optimizing CO 2 Sequestration and Enhanced Oil Recovery. Environmental Science & Technology Letters, 1(1), 49–54. http://doi.org/10.1021/ez4001033
Davidson, C. L., Dooley, J. J., & Dahowski, R. T. (2009). Assessing the impacts of future demand for saline groundwater on commercial deployment of CCS in the United States. Energy Procedia, 1(1), 1949–1956. http://doi.org/10.1016/j.egypro.2009.01.254
Davies, E. G. R., Kyle, P., & Edmonds, J. a. (2013). An integrated assessment of global and regional water demands for electricity generation to 2095. Advances in Water Resources, 52, 296–313. http://doi.org/10.1016/j.advwatres.2012.11.020
Davis, C. B., Chmieliauskas, A., & Nikolic, G. P. J. (2013). Enipedia. Energy & Industry group. Faculty of Technology, Policy and Management, TU Delft, The Netherlands. Retrieved from http://enipedia.tudelft.nl
Delgado, J. a., Águeda, V. I., Uguina, M. a., Sotelo, J. L., Brea, P., & Grande, C. a. (2014). Adsorption and Diffusion of H 2 , CO, CH 4 , and CO 2 in BPL Activated Carbon and 13X Zeolite: Evaluation of Performance in Pressure Swing Adsorption Hydrogen Purification by Simulation. Industrial & Engineering Chemistry Research, 53(40), 15414–15426. http://doi.org/10.1021/ie403744u
Dickmeis, J., & Kather, A. (2014). The coal-fired Oxyfuel-process with additional gas treatment of the ventgas for increased capture rates. Energy Procedia, 63, 332–341. http://doi.org/10.1016/j.egypro.2014.11.036
Diego, M. E., & Alonso, M. (2016). Operational feasibility of biomass combustion with in situ CO2 capture by CaO during 360h in a 300kWth calcium looping facility. Fuel, 181, 325–329. http://doi.org/10.1016/j.fuel.2016.04.128
Diego, M. E., Arias, B., Alonso, M., & Abanades, J. C. (2013). The impact of calcium sulfate and inert solids accumulation in post-combustion calcium looping systems. Fuel, 109, 184–190. http://doi.org/10.1016/j.fuel.2012.11.062
DOE. (2014a). Carbon Storage - Technology Program Plan. United States Department of Energy, Office of Fossil Energy.
DOE. (2014b). The Water-Energy Nexus: Challenges and Opportunities. U.S. Department of Energy. Retrieved from https://www.energy.gov/sites/prod/files/2014/07/f17/Water Energy Nexus Full Report July 2014.pdf
DOE. (2016). DOE Seeks Projects to Advance Carbon Dioxide Utilization from Coal-Fired Power Plants. Retrieved October 1, 2016, from http://energy.gov/fe/articles/doe-seeks-projects-advance-carbon-dioxide-utilization-coal-fired-power-plants
Doka, G. (2003). Life Cycle Inventories of Waste Treatment Services (Vol. 0). Ecoinvent report No. 13. Retrieved from http://www.doka.ch/13_I_WasteTreatmentGeneral.pdf

References
262
Dones, R., Bauer, C., Bolliger, R., Roberto Dones, Christian Bauer, Rita Bolliger, … Matthias Tuchschmid. (2007). Life cycle inventories of energy systems: results for current systems in Switzerland and other UCTE countries. Ecoinvent Report, (5), 185. Retrieved from http://ukshedstores.com/documents/documents_in_english/Life-cycle-analysis-PSI-05.pdf%5Cnhttps://www.ecolo.org/documents/documents_in_english/Life-cycle-analysis-PSI-05.pdf
Dooley, J. J., Kyle, P., & Davies, E. G. R. (2013). Climate Mitigation’s Impact On Global and Regional Electric Power Sector Water Use in the 21st Century. Energy Procedia, 37, 2470–2478. http://doi.org/10.1016/j.egypro.2013.06.128
Duelli Varela, G., Charitos, A., Diego, M. E., Stavroulakis, E., Dieter, H., & Scheffknecht, G. (2015). Investigations at a 10kWth calcium looping dual fluidized bed facility: Limestone calcination and CO2 capture under high CO2 and water vapor atmosphere. International Journal of Greenhouse Gas Control, 33, 103–112. http://doi.org/10.1016/j.ijggc.2014.12.006
DuPont. (2015). Thermodynamic Properties of DuPont Freon® 22 (R-22) Refrigerant. Retrieved from http://www2.dupont.com/Refrigerants/en_US/assets/downloads/k05736_Freon22_thermo_prop.pdf
ECN. (2014). Phyllis database. Retrieved March 1, 2014, from https://www.ecn.nl/phyllis2/ Ecofys, TNO, & Deltares. (2014). Pilot project on availability, use and sustainability of water production of nuclear
and fossil energy – Geo-localised inventory of water use in cooling processes, assessment of vulnerability and of water use management measures. Utrecht. Retrieved from http://ec.europa.eu/environment/archives/water/adaptation/pdf/InventoryCoolingWaterUse.pdf
Ecoinvent. (2010). Ecoinvent data v2.2. Retrieved from www.ecoinvent.ch Edenhofer, O., Pichs-Madruga, R., Sokona, Y., Seyboth, K., Eickemeier, P., Matschoss, P., … Stechow, C. Von.
(2011). IPCC, 2011: Summary for Policymakers. In: IPCC Special Report on Renewable Energy Sources and Climate Change Mitigation. Cambridge University Press. http://doi.org/10.5860/CHOICE.49-6309
EH&E. (2011). Emissions of Hazardous Air Pollutants from Coal-fired Power Plants. American Lung Association. Environmental Health & Engineering. Retrieved from http://www.lung.org/assets/documents/healthy-air/coal-fired-plant-hazards.pdf
EIA. (2013). Updated Capital Cost Estimates for Utility Scale Electricity Generating Plants. Retrieved from http://www.eia.gov/forecasts/capitalcost/pdf/updated_capcost.pdf
EIA. (2015). International Energy Statistics. Retrieved January 1, 2015, from http://www.eia.gov/cfapps/ipdbproject/IEDIndex3.cfm?tid=3&pid=26&aid=3
EPA. (2010). Fuel Oil Comubstion. Emission Factors & AP-42, (4). Retrieved from https://www3.epa.gov/ttn/chief/ap42/ch01/final/c01s03.pdf
EPRI. (2011). Cooling Requirements and Water Use Impacts of Advanced Coal-fired Power Plants with CO2 Capture and Storage. Retrieved from http://www.epri.com/abstracts/Pages/ProductAbstract.aspx?ProductId=000000000001024495
ERA. (2009). The impact of fossil fuels. Greenhouse gas emissions, environmental consequences and socio-economic effects.
Erans, M., Manovic, V., & Anthony, E. J. (2016). Calcium looping sorbents for CO2 capture. Applied Energy, 180, 722–742. http://doi.org/10.1016/j.apenergy.2016.07.074
Eurogas. (2013). Statistical Report (Vol. 13). Retrieved from http://www.eurogas.org/uploads/media/Eurogas_Statistical_Report_2013.pdf
European Commission. (2016). Carbon Capture Utilisation and Storage. SETIS Magazine, (11). Retrieved from https://setis.ec.europa.eu/system/files/setis-magazine_11_ccus_final.pdf
Feeley, T. J., Skone, T. J., Stiegel, G. J., McNemar, A., Nemeth, M., Schimmoller, B., … Manfredo, L. (2008). Water: A critical resource in the thermoelectric power industry. Energy, 33(1), 1–11. http://doi.org/10.1016/j.energy.2007.08.007
Fernández-Dacosta, C., van der Spek, M., Hung, C., Oreggionni, G. D., Skagestad, R., Parihar, P., … Strømman, A. H. (2017). Prospective techno-economic and environmental assessment of carbon capture at a refinery and utilisation in polyol synthesis. Journal of CO2 Utilization, 21C, 405–422.
Flores, J. H., Peixoto, D. P. B., Appel, L. G., de Avillez, R. R., & Silva, M. I. P. Da. (2011). The influence of different methanol synthesis catalysts on direct synthesis of DME from syngas. Catalysis Today, 172(1), 218–225. http://doi.org/10.1016/j.cattod.2011.02.063
Flörke, M., & Eisner, S. (2011). The Development of Global Spatially Detailed Estimates of Sectoral Water Requirements, Past, Present and Future, Including Discussion of the Main Uncertainties, Risks and Vulnerabilities of Human Water Demand.

References
263
Folkedahl, B. C., Zygarlicke, C. J., Strege, J. R., McCollor, D. P., Laumb, J. D., & Kong, L. (2006). EFFECTS OF BIOMASS COMBUSTION ON SCR CATALYST.
Fostås, B., Gangstad, A., Nenseter, B., Pedersen, S., Sjøvoll, M., & Sørensen, A. L. (2011). Effects of NOx in the flue gas degradation of MEA. Energy Procedia, 4, 1566–1573. http://doi.org/10.1016/j.egypro.2011.02.026
Fricko, O., Parkinson, S. C., Johnson, N., Strubegger, M., van Vliet, M. T. H., & Riahi, K. (2016). Energy sector water use implications of a 2°C climate policy. Environmental Research Letters, 11(12), 124001. http://doi.org/10.1088/1748-9326/11/12/124001
Frischknecht, R., Editors, N. J., Althaus, H., Bauer, C., Doka, G., Dones, R., … Margni, M. (2007). Implementation of Life Cycle Impact Assessment Methods. Ecoinvent report No. 3 (Vol. 150). Ecoinvent Centre. Retrieved from http://www.ecoinvent.org/fileadmin/documents/en/03_LCIA-Implementation.pdf
Fritsche, U. R., & Greß, H.-W. (2015). Development of the Primary Energy Factor of Electricity Generation in the EU-28 from 2010-2013. Retrieved from http://www.iinas.org/tl_files/iinas/downloads/GEMIS/2015_PEF_EU-28_Electricity_2010-2013.pdf
Fthenakis, V., & Kim, H. C. (2010). Life-cycle uses of water in U.S. electricity generation. Renewable and Sustainable Energy Reviews, 14(7), 2039–2048. http://doi.org/10.1016/j.rser.2010.03.008
Fuss, S., Canadell, J. G., Peters, G. P., Tavoni, M., Andrew, R. M., Ciais, P., … Yamagata, Y. (2014). Betting on negative emissions. Nature Climate Change, 4(10), 850–853. http://doi.org/10.1038/nclimate2392
Gan, J., & Smith, C. T. (2011). Optimal plant size and feedstock supply radius: A modeling approach to minimize bioenergy production costs. Biomass and Bioenergy, 35(8), 3350–3359. http://doi.org/10.1016/j.biombioe.2010.08.062
Gangadharan, P., Kanchi, K. C., & Lou, H. H. (2012). Evaluation of the economic and environmental impact of combining dry reforming with steam reforming of methane. Chemical Engineering Research and Design, 90(11), 1956–1968. http://doi.org/10.1016/j.cherd.2012.04.008
GEA. (2012). Global Energy Assessment - Toward a Sustainable Future. Cambride University Press, Cambridge UK and New York, NY, USA and the International Insitute for Applied Systems Analysis, Laxenburg Austria.
GEO. (2012). Global Energy Assessment Toward a Sustainable Future. Cambridge University Press, Cambridge UK and New York, NY, USA and the International Institute for Applied Systems Analysis, Laxenburg, Austria.
Gibon, T., Arvesen, A., & Hertwich, E. G. (2017). Life cycle assessment demonstrates environmental co-benefits and trade-offs of low-carbon electricity supply options. Renewable and Sustainable Energy Reviews, 76(November 2016), 1283–1290. http://doi.org/10.1016/j.rser.2017.03.078
Ginsburg, J. M., Pin, J., Solh, T. El, & Lasa, H. I. De. (2005). Coke Formation over a Nickel Catalyst under Methane Dry Reforming Conditions : Thermodynamic and Kinetic Models, 4846–4854.
Gładysz, P., & Ziebik, A. (2016). Environmental analysis of bio-CCS in an integrated oxy-fuel combustion power plant with CO2 transport and storage. Biomass and Bioenergy, 85, 109–118. http://doi.org/10.1016/j.biombioe.2015.12.008
Global CCS Institute. (2015). The Global Status of CCS: 2014 Summary Report. Retrieved from https://hub.globalccsinstitute.com/sites/default/files/publications/196843/global-status-ccs-2015-summary.pdf
Goedkoop, M., Heijungs, R., Huijbregts, M., Schryver, A. De, Struijs, J., & Zelm, R. Van. (2009). ReCiPe 2008. Potentials. Retrieved from http://www.pre-sustainability.com/download/misc/ReCiPe_main_report_final_27-02-2009_web.pdf
Gomez, M., & Pfister, S. (2012). VEOLIA-ETH collaboration on improving Water Stress Index (WSI): Final report of phase 1. Retrieved from http://www.ifu.ethz.ch/ESD/downloads/reports/wsi_veolia_eth.pdf
Guest, G., Bright, R. M., Cherubini, F., & Strømman, A. H. (2013). Consistent quantification of climate impacts due to biogenic carbon storage across a range of bio-product systems. Environmental Impact Assessment Review, 43, 21–30. http://doi.org/10.1016/j.eiar.2013.05.002
Guo, J., Lou, H., Zhao, H., Chai, D., & Zheng, X. (2004). Dry reforming of methane over nickel catalysts supported on magnesium aluminate spinels. Applied Catalysis A: General, 273(1–2), 75–82. http://doi.org/10.1016/j.apcata.2004.06.014
Halstead, M., Kober, T., & Zwaan, B. C. C. (2014). Understanding the energy-water nexus. ECN. Retrieved from http://www.medspring.eu/sites/default/files/Understanding-the-energy-water-nexus.pdf
Hamelin, L., Jørgensen, U., Petersen, B. M., Olesen, J. E., & Wenzel, H. (2012). Modelling the carbon and nitrogen balances of direct land use changes from energy crops in Denmark: a consequential life cycle inventory. GCB Bioenergy, 4(6), 889–907. http://doi.org/10.1111/j.1757-1707.2012.01174.x
Hauschild, M. Z., Goedkoop, M., Guinée, J., Heijungs, R., Huijbregts, M., Jolliet, O., … Pant, R. (2013). Identifying

References
264
best existing practice for characterization modeling in life cycle impact assessment. International Journal of Life Cycle Assessment, 18(3), 683–697. http://doi.org/10.1007/s11367-012-0489-5
Haynes, R. J. (2009). Reclamation and revegetation of fly ash disposal sites - Challenges and research needs. Journal of Environmental Management, 90(1), 43–53. http://doi.org/10.1016/j.jenvman.2008.07.003
Hendrickson, C. T., Lave, L. B., & Matthews, H. S. (2006). Assessment of Goods and Services: An Input-Output Approach. Washington, USA: Resources for the Future.
Hendriks, C., Noothout, P., Zakkour, P., & Cook, G. (2013). Implications of the Reuse of Captured CO2 for European Climate Action Policies. Ecofys, Utrecht, the Netherlands.
Hertwich, E. G., de Larderel, J. A., Arvesten, A., Bayer, P., Bergesen, J., Bouman, E., … Heath, G. (2016). Green Energy Choices: The benefits, risks, and trade-offs of low-carbon technologies for electricity production. Report of the International Resource Panel, United Nations Environment Program (UNEP), Paris , Paris. Retrieved from http://pure.iiasa.ac.at/13277/
Hills, T., Leeson, D., Florin, N., & Fennell, P. (2016). Carbon Capture in the Cement Industry: Technologies, Progress, and Retrofitting. Environmental Science and Technology, 50(1), 368–377. http://doi.org/10.1021/acs.est.5b03508
Hoefnagels, R., Junginger, M., Resch, G., Matzenberger, J., Panzer, C., & Pelkmans, L. (2011). Development of a tool to model European biomass trade. Report for IEA Bioenergy Task 40. Universiteit Utrecht Copernicus Institute Science, Technology and Society.
Hoekstra, A. Y. (2016). A critique on the water-scarcity weighted water footprint in LCA. Ecological Indicators, 66, 564–573. http://doi.org/10.1016/j.ecolind.2016.02.026
Huang, C. H., & Tan, C. S. (2014). A review: CO2 utilization. Aerosol and Air Quality Research, 14(2), 480–499. http://doi.org/10.4209/aaqr.2013.10.0326
Huijbregts, M. A. J. (2013). Personal communication on the characterization factors of HF and HCl in Recipe 1.0. Radbout University, Nijmegen.
Huijbregts, M. A. J., Hellweg, S., Frischknecht, R., Hendriks, H. W. M., Hungehb??hler, K., & Hendriks, A. J. (2010). Cumulative energy demand as predictor for the environmental burden of commodity production. Environmental Science and Technology, 44(6), 2189–2196. http://doi.org/10.1021/es902870s
Hurst, T. F., Cockerill, T. T., & Florin, N. H. (2012). Life cycle greenhouse gas assessment of a coal-fired power station with calcium looping CO2 capture and offshore geological storage. Energy & Environmental Science, 5(5), 7132. http://doi.org/10.1039/c2ee21204h
IEA. (2010). Cement Production. Energy Technology Systems Analysis Programme (ETSAP). Retrieved from http://www.etsap.org/E-techDS/PDF/I03_cement_June 2010_GS-gct.pdf
IEA. (2012a). Energy Technology Perspectives. International Energy Agency. IEA. (2012b). Energy Technology Perspectives 2012. Energy Technology Perspectives 2012. International Energy
Agency. Retrieved from http://www.oecd-ilibrary.org/energy/energy-technology-perspectives-2012_energy_tech-2012-en
IEA. (2013). Technology Roadmap Carbon capture and storage. International Energy Agency. IEA. (2014a). CCS 2014 - What lies in store for CCS? IEA. (2014b). Energy Technology Perspectives 2014. International Energy Agency. IEA. (2015a). Carbon Capture and Storage: The solution for deep emissions reductions. Paris. Retrieved from
https://www.iea.org/publications/freepublications/publication/carbon-capture-and-storagethe-solution-for-deep-emissions-reductions.html
IEA. (2015b). Energy Technology Perspectives 2015. International Energy Agency. Retrieved from http://www.iea.org/termsandconditionsuseandcopyright/
IEA. (2016). World Energy Outlook 2016. International Energy Agency. Retrieved from www.iea.org/t&c/ IEA. (2017). Balance definitions. Retrieved February 15, 2017, from
https://www.iea.org/statistics/resources/balancedefinitions/ IEABCC. (2012). Database of Biomass Cofiring initiatives. Retrieved August 1, 2012, from
http://www.ieabcc.nl/database/cofiring.html IEAGHG. (2006). Environmental Impact of Solvent Scrubbing of CO2. (R. Van Gijlswijk, P. H. M. Feron, H. Oonk, & J.
P. Brouwer, Eds.)Energy. TNO Science and Industry. IEAGHG. (2011a). Evaluation and Analysis of Water Usage of Power Plants with CO2 Capture. International Energy
Agency. IEAGHG. (2011b). Potential for Biomass and Carbon Dioxide Capture and Storage. IEAGHG, Orchard Business
Centre, Stoke, Orchard, CHeltenham, UK. Retrieved from

References
265
http://hub.globalccsinstitute.com/sites/default/files/publications/102121/potential-biomass-carbon-dioxide-capture-storage.pdf
IEAGHG. (2012). Gaseous Emissions from Amine Based Post Combustion CO2 Capture Processes and Their Deep Removal. IEAGHG, Orchard Business Centre, Stoke, Orchard, CHeltenham, UK. Retrieved from http://hub.globalccsinstitute.com/sites/default/files/publications/104216/gaseous-emissions-amine-based-postcombustion-co2-capture-processes-methods-deep-removal.pdf
IEAGHG. (2013). Deployment of Ccs in the Cement Industry. IEAGHG. (2016). Can CO2 Capture and Storage Unlock “Unburnable Carbon”? Retrieved from
http://www.ieaghg.org/exco_docs/2016-05.pdf Ikeda, E., Lowe, A., Spero, C., & Stubington, J. F. (2006). Comparison of Technical Performance of Fossil Fuel-
based Electric Power Generation Technologies under Australian Conditions. In Australian Institute of Energy National Conference - “Energy at the Crossroads.”
Immerzeel, D. J., Verweij, P. A., van der Hilst, F., & Faaij, A. P. C. (2014). Biodiversity impacts of bioenergy crop production: A state-of-the-art review. GCB Bioenergy, 6(3), 183–209. http://doi.org/10.1111/gcbb.12067
Industry About. (2013). Search and find the world’s largest industrial facilities. Retrieved from www.industryabout.com
IPCC. (2012). Renewable energy sources and climate change mitigation: special report of the Intergovernmental Panel on Climate Change. Choice Reviews Online (Vol. 49). 32 Avenue of the Americas, New York, NY 10013-2473, USA: Cambridge University Press. http://doi.org/10.5860/CHOICE.49-6309
IPCC. (2014). Climate Change 2014: Mitigation of Climate Change. Working Group III Contribution to the Fifth Assessment Report of the Intergovernmental Panel on Climate Change. http://doi.org/10.1017/CBO9781107415416
Johnson, E. (2009). Goodbye to carbon neutral: Getting biomass footprints right. Environmental Impact Assessment Review, 29(3), 165–168. http://doi.org/10.1016/j.eiar.2008.11.002
Jun, K., Lee, H.-S., Roh, H.-S., & Park, S.-E. (2002). Catalytic Dehydration of Methanol to Dimethyl Ether (DME) over Solid-Acid Catalysts. Bull. Korean Chem. Soc., 23(6), 803–806.
King, C. W., Holman, A. S., Webber, M. E., Geology, E., & Box, X. (2008). Thirst for energy. Nature Geoscience, 1(May), 283–286.
Klein, D., Bauer, N., Bodirsky, B., Dietrich, J. P., & Popp, A. (2011). Bio-IGCC with CCS as a long-term mitigation option in a coupled energy-system and land-use model. Energy Procedia, 4, 2933–2940. http://doi.org/10.1016/j.egypro.2011.02.201
Kling, Å., Andersson, C., Myringer, Å., Eskilsson, D., & Järås, S. G. (2007). Alkali deactivation of high-dust SCR catalysts used for NOx reduction exposed to flue gas from 100 MW-scale biofuel and peat fired boilers: Influence of flue gas composition. Applied Catalysis B: Environmental, 69(3–4), 240–251. http://doi.org/10.1016/j.apcatb.2006.03.022
Knoope, M. M. J., Ramírez, A., & Faaij, A. P. C. (2013). A state-of-the-art review of techno-economic models predicting the costs of CO2 pipeline transport. International Journal of Greenhouse Gas Control, 16, 241–270. http://doi.org/10.1016/j.ijggc.2013.01.005
Koch, H., & Vögele, S. (2009). Dynamic modelling of water demand, water availability and adaptation strategies for power plants to global change. Ecological Economics, 68(7), 2031–2039. http://doi.org/10.1016/j.ecolecon.2009.02.015
Koornneef, J., van Keulen, T., Faaij, A., & Turkenburg, W. (2008). Life cycle assessment of a pulverized coal power plant with post-combustion capture, transport and storage of CO2. International Journal of Greenhouse Gas Control, 2(4), 448–467. http://doi.org/10.1016/j.ijggc.2008.06.008
Kounina, A., Margni, M., Bayart, J.-B., Boulay, A.-M., Berger, M., Bulle, C., … Humbert, S. (2012). Review of methods addressing freshwater use in life cycle inventory and impact assessment. The International Journal of Life Cycle Assessment, 18(3), 707–721. http://doi.org/10.1007/s11367-012-0519-3
Kuckshinrichs, W., & Hake, J. F. (2015). Chapter 5. Environmental Aspects of CCS. In Carbon Capture, Storage and Use: Technical, Economic, Environmental and Societal Perspectives (pp. 1–347). http://doi.org/10.1007/978-3-319-11943-4
Kyle, P., Davies, E. G. R., Dooley, J. J., Smith, S. J., Clarke, L. E., Edmonds, J. A., & Hejazi, M. (2013). Influence of climate change mitigation technology on global demands of water for electricity generation. International Journal of Greenhouse Gas Control, 13, 112–123. http://doi.org/10.1016/j.ijggc.2012.12.006
Lamers, P., & Junginger, M. (2013). The “debt” is in the detail: A synthesis of recent temporal forest carbon analyses on woody biomass for energy. Biofuels, Bioproducts and Biorefining, 7(3), 373–385.

References
266
http://doi.org/10.1002/bbb LC-IMPACT. (2017). A spatially differentiated life cycle impact assessment method. Retrieved August 27, 2017,
from http://www.lc-impact.eu Lebarbier, V. M., Dagle, R. a., Kovarik, L., Lizarazo-Adarme, J. a., King, D. L., & Palo, D. R. (2012). Synthesis of
methanol and dimethyl ether from syngas over Pd/ZnO/Al2O3 catalysts. Catalysis Science & Technology, 2(10), 2116. http://doi.org/10.1039/c2cy20315d
Lee, S., & Sardesai, A. (2005). Liquid phase methanol and dimethyl ether synthesis from syngas. Topics in Catalysis, 32(3–4), 197–207. http://doi.org/10.1007/s11244-005-2891-8
Liu, L., Hejazi, M., Patel, P., Kyle, P., Davies, E., Zhou, Y., … Edmonds, J. (2014). Water demands for electricity generation in the U.S.: Modeling different scenarios for the water–energy nexus. Technological Forecasting and Social Change. http://doi.org/10.1016/j.techfore.2014.11.004
Mac Dowell, N., Fennell, P. S., Shah, N., & Maitland, G. C. (2017). The role of CO2 capture and utilisation in mitigating climate change. Nature Climate Change, 7(4), 243–249. http://doi.org/10.1038/nclimate3231
Maciejewska, A., Veringa, H., Sanders, J., & Peteves, S. D. (2006). CO-FIRING OF BIOMASS WITH COAL: CONSTRAINTS AND ROLE OF BIOMASS PRE-TREATMENT. DG JRC Institute for Energy.
Macknick, J., Newmark, R., Heath, G., & Hallett, K. C. (2011). A Review of Operational Water Consumption and Withdrawal Factors for Electricity Generating Technologies A Review of Operational Water Consumption and Withdrawal Factors for Electricity Generating Technologies, (March).
Macknick, J., Newmark, R., Heath, G., & Hallett, K. C. (2012). Operational water consumption and withdrawal factors for electricity generating technologies: a review of existing literature. Environmental Research Letters, 7(4), 45802. http://doi.org/10.1088/1748-9326/7/4/045802
Majeau-Bettez, G., Dandres, T., Pauliuk, S., Wood, R., Hertwich, E., & Strømman, A. H. (2017). Choice of Allocations and Constructs for Attributional or Consequential Life Cycle Assessment and Input-Output Analysis. Journal of Industrial Ecology, 1–15. http://doi.org/10.1111/jiec.12604
Martínez, I., Grasa, G., Parkkinen, J., Tynjälä, T., Hyppänen, T., Murillo, R., & Romano, M. C. (2016). Review and research needs of Ca-Looping systems modelling for post-combustion CO2 capture applications. International Journal of Greenhouse Gas Control, 50, 271–304. http://doi.org/10.1016/j.ijggc.2016.04.002
Martinez, I., Romano, M. C., Fernandez, J. R., Chiesa, P., Murillo, R., & Abanades, J. C. (2014). Process design of a hydrogen production plant from natural gas with CO2 capture based on a novel Ca/Cu chemical loop. Applied Energy, 114, 192–208. http://doi.org/10.1016/j.apenergy.2013.09.026
Marx, J., Schreiber, A., Zapp, P., Haines, M., Hake, J. F., & Gale, J. (2011). Environmental evaluation of CCS using Life Cycle Assessment - A synthesis report. Energy Procedia, 4, 2448–2456. http://doi.org/10.1016/j.egypro.2011.02.139
Meerman, J. C., Hamborg, E. S., van Keulen, T., Ramírez, a., Turkenburg, W. C., & Faaij, a. P. C. (2012). Techno-economic assessment of CO2 capture at steam methane reforming facilities using commercially available technology. International Journal of Greenhouse Gas Control, 9, 160–171. http://doi.org/10.1016/j.ijggc.2012.02.018
Meerman, J. C., Knoope, M. M. J., Ramírez, a., Turkenburg, W. C., & Faaij, a. P. C. (2013). Technical and economic prospects of coal- and biomass-fired integrated gasification facilities equipped with CCS over time. International Journal of Greenhouse Gas Control, 16, 311–323. http://doi.org/10.1016/j.ijggc.2013.01.051
Meerman, J. C., Ramírez, a., Turkenburg, W. C., & Faaij, a. P. C. (2011). Performance of simulated flexible integrated gasification polygeneration facilities. Part A: A technical-energetic assessment. Renewable and Sustainable Energy Reviews, 15(6), 2563–2587. http://doi.org/10.1016/j.rser.2011.03.018
Mennicken, L., Janz, A., & Roth, S. (2016). The German R&D Program for CO2 Utilization—Innovations for a Green Economy. Environmental Science and Pollution Research, 23(11), 11386–11392. http://doi.org/10.1007/s11356-016-6641-1
Mertens, J., Prieur-Vernat, A., Corbisier, D., Favrot, E., & Boon, G. (2014). Water footprinting of electricity generated by combined cycle gas turbines using different cooling technologies: a practitioner’s experience. Journal of Cleaner Production. http://doi.org/10.1016/j.jclepro.2014.08.046
Metz, B., Davidson, O., De Coninck, H., Loos, M., & Meyer, L. (2005). Carbon Dioxide Capture and Storage. Intergovernmental Panel on Climate Change (Vol. 2).
Molburg, J. C., & Doctor, R. D. (2003). Hydrogen from Steam-Methane Reforming with CO 2 Capture. In 20th Annual International Pittsburgh Coal Conference (p. 20).
Molenbroek, M., Stricker, E., & Boermans, T. (2011). Primary energy factors for electricity in buildings. Retrieved from http://download.dalicloud.com/fis/download/66a8abe211271fa0ec3e2b07/ad5fccc2-4811-434a-

References
267
8c4f-6a2daa41ad2a/Primary_energy_factors_report_ecofys_29.09.2011.pdf Moncada, J., Posada, J. A., & Ramirez, A. (2015). Early sustainability assessment for potential confi gurations of
integrated biorefi neries. Screening of bio-based derivatives from platform chemicals. Biofuels, Bioproducts and Biorefining, 6(3), 246–256. http://doi.org/0.1002/bbb.1580
Moradi, F., Kazemeini, M., & Fattahi, M. (2014). A three dimensional CFD simulation and optimization of direct DME synthesis in a fixed bed reactor. Petroleum Science, 11(2), 323–330. http://doi.org/10.1007/s12182-014-0347-0
More, D. (2010). Cement Plants and Kilns in Britain and Ireland. Retrieved February 2, 2017, from http://www.cementkilns.co.uk/index.html
Mouratiadou, I., Biewald, A., Pehl, M., Bonsch, M., Baumstark, L., Klein, D., … Kriegler, E. (2016). The impact of climate change mitigation on water demand for energy and food: An integrated analysis based on the Shared Socioeconomic Pathways. Environmental Science and Policy, 64, 48–58. http://doi.org/10.1016/j.envsci.2016.06.007
Murrant, D., Quinn, A., & Chapman, L. (2015). The water-energy nexus: Future water resource availability and its implications on UK thermal power generation. Water and Environment Journal, 29(3), 307–319. http://doi.org/10.1111/wej.12126
Murray, S. J., Foster, P. N., & Prentice, I. C. (2012). Future global water resources with respect to climate change and water withdrawals as estimated by a dynamic global vegetation model. Journal of Hydrology, 448–449, 14–29. http://doi.org/10.1016/j.jhydrol.2012.02.044
NETL. (2010a). Life Cycle Analysis : Integrated Gasification Combined Cycle ( IGCC ) Power Plant. National Energy Technology Laboratory, U.S. Department of Energy.
NETL. (2010b). Life cycle analysis: Integrated Gasification Combined Cycle (IGCC) Power Plant. Additional information regarding Cost and Performance Baseline for Fossil Energy plants. Received from NETL, March 2013.
NETL. (2010c). Water Vulnerabilities for Existing Coal-fired Power Plants. National Energy Technology Laboratory, U.S. Department of Energy.
NETL. (2012a). Greenhouse Gas Reductions in the Power Industry Using Domestic Coal and Biomass Volume 1 : IGCC (Vol. 1). National Energy Technology Laboratory, U.S. Department of Energy.
NETL. (2012b). Greenhouse Gas Reductions in the Power Industry Using Domestic Coal and Biomass Volume 2 : Pulverized Coal Plants (Vol. 2). National Energy Technology Laboratory, U.S. Department of Energy.
NETL. (2015). CO2 Utilization Focus Area. Retrieved January 1, 2015, from http://www.netl.doe.gov/research/coal/carbon-storage/research-and-development/co2-utilization
NETL. (2016). CO2 UTILIZATION FOCUS AREA. Retrieved October 1, 2016, from https://www.netl.doe.gov/research/coal/carbon-storage/research-and-development/co2-utilization
Nikoo, M. K., & Amin, N. a. S. (2011). Thermodynamic analysis of carbon dioxide reforming of methane in view of solid carbon formation. Fuel Processing Technology, 92(3), 678–691. http://doi.org/10.1016/j.fuproc.2010.11.027
Obersteiner, M. (2001). Managing Climate Risk. Science, 294(5543), 786b–787. http://doi.org/10.1126/science.294.5543.786b
Odenberger, M., & Johnsson, F. (2009). The role of CCS in the European electricity supply system. Energy Procedia, 1(1), 4273–4280. http://doi.org/10.1016/j.egypro.2009.02.239
OECD. (2017). Primary Energy Supply (indicator). http://doi.org/10.1787/1b33c15a-en Olah, G. a, Goeppert, A., & Prakash, G. K. S. (2009). Chemical recycling of carbon dioxide to methanol and
dimethyl ether: from greenhouse gas to renewable, environmentally carbon neutral fuels and synthetic hydrocarbons. The Journal of Organic Chemistry, 74(2), 487–98. http://doi.org/10.1021/jo801260f
Oreggioni, G. D., Singh, B., Cherubini, F., Guest, G., Lausselet, C., Luberti, M., … Str??mman, A. H. (2017). Environmental assessment of biomass gasification combined heat and power plants with absorptive and adsorptive carbon capture units in Norway. International Journal of Greenhouse Gas Control, 57, 162–172. http://doi.org/10.1016/j.ijggc.2016.11.025
Oyama, S. T., Hacarlioglu, P., Gu, Y., & Lee, D. (2012). Dry reforming of methane has no future for hydrogen production: Comparison with steam reforming at high pressure in standard and membrane reactors. International Journal of Hydrogen Energy, 37(13), 10444–10450. http://doi.org/10.1016/j.ijhydene.2011.09.149
Ozcan, D. C., Ahn, H., & Brandani, S. (2013). Process integration of a Ca-looping carbon capture process in a cement plant. International Journal of Greenhouse Gas Control, 19, 530–540.
References
268
http://doi.org/10.1016/j.ijggc.2013.10.009 Pacetti, T., Lombardi, L., & Federici, G. (2015). Water-energy Nexus: A case of biogas production from energy
crops evaluated by Water Footprint and Life Cycle Assessment (LCA) methods. Journal of Cleaner Production, 101, 1–14. http://doi.org/10.1016/j.jclepro.2015.03.084
Pakhare, D., & Spivey, J. (2014). A review of dry (CO2) reforming of methane over noble metal catalysts. Chemical Society Reviews, 43(22), 7813–37. http://doi.org/10.1039/c3cs60395d
Pang, M., Zhang, L., Liang, S., Liu, G., Wang, C., Hao, Y., … Xu, M. (2017). Trade-off between carbon reduction benefits and ecological costs of biomass-based power plants with carbon capture and storage (CCS) in China. Journal of Cleaner Production, 144, 279–286. http://doi.org/10.1016/j.jclepro.2017.01.034
Panoutsou, C., Eleftheriadis, J., & Nikolaou, A. (2009). Biomass supply in EU27 from 2010 to 2030. Energy Policy, 37(12), 5675–5686. http://doi.org/10.1016/j.enpol.2009.08.032
Papari, S., Kazemeini, M., & Fattahi, M. (2013). Modelling-based optimisation of the direct synthesis of dimethyl ether from syngas in a commercial slurry reactor. Chinese Journal of Chemical Engineering, 21(6), 611–621. http://doi.org/10.1016/S1004-9541(13)60505-4
Perathoner, S., & Centi, G. (2014). CO2 recycling: A key strategy to introduce green energy in the chemical production chain. ChemSusChem, 7(5), 1274–1282. http://doi.org/10.1002/cssc.201300926
Perejón, A., Romeo, L. M., Lara, Y., Lisbona, P., Martínez, A., & Valverde, J. M. (2016). The Calcium-Looping technology for CO2 capture: On the important roles of energy integration and sorbent behavior. Applied Energy, 162, 787–807. http://doi.org/10.1016/j.apenergy.2015.10.121
Pfister, S., & Bayer, P. (2014). Monthly water stress: spatially and temporally explicit consumptive water footprint of global crop production. Journal of Cleaner Production, 73, 52–62. http://doi.org/10.1016/j.jclepro.2013.11.031
Pfister, S., Bayer, P., Koehler, A., & Hellweg, S. (2011). Environmental impacts of water use in global crop production: hotspots and trade-offs with land use. Environmental Science & Technology, 45(13), 5761–8. http://doi.org/10.1021/es1041755
Pfister, S., Boulay, A. M., Berger, M., Hadjikakou, M., Motoshita, M., Hess, T., … Henderson, A. (2017). Understanding the LCA and ISO water footprint: A response to Hoekstra (2016) “A critique on the water-scarcity weighted water footprint in LCA.” Ecological Indicators, 72, 352–359. http://doi.org/10.1016/j.ecolind.2016.07.051
Pfister, S., Koehler, A., & Hellweg, S. (2009). Assessing the environmental impacts of freshwater consumption in LCA. Environmental Science & Technology, 43(11), 4098–104. Retrieved from http://www.ncbi.nlm.nih.gov/pubmed/19569336
PréConsultants. (2011). SimaPro 7.3.3. Multi user. PRéConsultants. (2016). SimaPro Database Manual. SimaPro Database Manual. Retrieved from https://www.pre-
sustainability.com/download/DatabaseManualMethods.pdf Quadrelli, E. A., Centi, G., Duplan, J. L., & Perathoner, S. (2011). Carbon dioxide recycling: Emerging large-scale
technologies with industrial potential. ChemSusChem, 4(9), 1194–1215. http://doi.org/10.1002/cssc.201100473
Rahemi, N., Haghighi, M., Babaluo, A. A., Jafari, M. F., & Estifaee, P. (2013). CO<SUB>2</SUB> Reforming of CH<SUB>4</SUB> Over CeO<SUB>2</SUB>-Doped Ni/Al<SUB>2</SUB>O<SUB>3</SUB> Nanocatalyst Treated by Non-Thermal Plasma. Journal of Nanoscience and Nanotechnology, 13(7), 4896–4908. http://doi.org/10.1166/jnn.2013.7585
Rao, A. B., Rubin, E. S., & Berkenpas, M. B. (2004). AN INTEGRATED MODELING FRAMEWORK FOR CARBON MANAGEMENT TECHNOLOGIES (Vol. 1–Techni). Pittsburgh, United States.
Raptis, C. E., Boucher, J. M., & Pfister, S. (2017). Assessing the environmental impacts of freshwater thermal pollution from global power generation in LCA. Science of the Total Environment, 580, 1014–1026. http://doi.org/10.1016/j.scitotenv.2016.12.056
Raptis, C. E., van Vliet, M. T. H., & Pfister, S. (2016). Global thermal pollution of rivers from thermoelectric power plants. Environmental Research Letters, 11(10), 104011. http://doi.org/10.1088/1748-9326/11/10/104011
ReCiPe. (2012). Mid/Endpoint method, version 1.08. Rhodes, J. S., & Keith, D. W. (2005). Engineering economic analysis of biomass IGCC with carbon capture and
storage. Biomass and Bioenergy, 29(6), 440–450. http://doi.org/10.1016/j.biombioe.2005.06.007 Riahi, K., Kriegler, E., Johnson, N., Bertram, C., den Elzen, M., Eom, J., … Edenhofer, O. (2015). Locked into
Copenhagen pledges - Implications of short-term emission targets for the cost and feasibility of long-term climate goals. Technological Forecasting and Social Change, 90(PA), 8–23.

References
269
http://doi.org/10.1016/j.techfore.2013.09.016 Riaz, A., Zahedi, G., & Klemeš, J. J. (2013). A review of cleaner production methods for the manufacture of
methanol. Journal of Cleaner Production, 57, 19–37. http://doi.org/10.1016/j.jclepro.2013.06.017 Robbins, G. A., & Carty, R. H. (2000). Catalytic Oxidation of NO in Flue Gas for Capture in Wet Scrubbers. Retrieved
from https://www.adeq.state.ar.us/downloads/commission/p/closed permit dockets 2006-2017/08-006-p aep service corp. & swepco-sierra club & audubon(consolidated)/2008-12-01_exhibit_21.pdf
Rochedo, P. R. R., & Szklo, A. (2013). Designing learning curves for carbon capture based on chemical absorption according to the minimum work of separation. Applied Energy, 108, 383–391. http://doi.org/10.1016/j.apenergy.2013.03.007
Röder, A., Bauer, C., & Dones, R. (2007). Kohle. In: Sachbilanzen von Energiesystemen: Grundlagen für den ökologischen Vergleich von Energiesystemen und den Einbezug von Energiesystemen in Ökobilanzen für die Schweiz. Swiss Centre for Life Cycle Inventories, Dübendorf, CH.
Romano, M. C., Martínez, I., Murillo, R., Arstad, B., Blom, R., Ozcan, D. C., … Brandani, S. (2013). Process simulation of Ca-looping processes: Review and guidelines. Energy Procedia, 37(i), 142–150. http://doi.org/10.1016/j.egypro.2013.05.095
Rübbelke, D., & Vögele, S. (2011). Impacts of climate change on European critical infrastructures: The case of the power sector. Environmental Science & Policy, 14(1), 53–63. http://doi.org/10.1016/j.envsci.2010.10.007
Schakel, W., Meerman, H., Talaei, A., Ramírez, A., & Faaij, A. (2014). Comparative life cycle assessment of biomass co-firing plants with carbon capture and storage. Applied Energy, 131, 441–467. http://doi.org/10.1016/j.apenergy.2014.06.045
Schakel, W., Oreggioni, G., Singh, B., Strømman, A., & Ramírez, A. (2016). Assessing the techno-environmental performance of CO2 utilization via dry reforming of methane for the production of dimethyl ether. Journal of CO2 Utilization, 16, 138–149. http://doi.org/10.1016/j.jcou.2016.06.005
Schakel, W., Pfister, S., & Ramírez, A. (2015). Exploring the potential impact of implementing carbon capture technologies in fossil fuel power plants on regional European water stress index levels. International Journal of Greenhouse Gas Control, 39, 318–328. http://doi.org/10.1016/j.ijggc.2015.05.031
Schewe, J., Heinke, J., Gerten, D., Haddeland, I., Arnell, N. W., Clark, D. B., … Kabat, P. (2014). Multimodel assessment of water scarcity under climate change. Proceedings of the National Academy of Sciences of the United States of America, 111(9), 3245–50. http://doi.org/10.1073/pnas.1222460110
Schoenmakers, L. (2013). Personal communication on impurity removal efficiencies of IGCC. Vattenfall. Schornagel, J., Niele, F., Worrell, E., & Böggemann, M. (2012). Water accounting for (agro)industrial operations
and its application to energy pathways. Resources, Conservation and Recycling, 61, 1–15. http://doi.org/10.1016/j.resconrec.2011.12.011
SCOT. (2016). Smart CO2 Transformation. Retrieved October 1, 2016, from http://www.scotproject.org/ Sebastián, F., Royo, J., & Gómez, M. (2011). Cofiring versus biomass-fired power plants: GHG (Greenhouse
Gases) emissions savings comparison by means of LCA (Life Cycle Assessment) methodology. Energy, 36(4), 2029–2037. http://doi.org/10.1016/j.energy.2010.06.003
Semelsberger, T. a., Borup, R. L., & Greene, H. L. (2006). Dimethyl ether (DME) as an alternative fuel. Journal of Power Sources, 156(2), 497–511. http://doi.org/10.1016/j.jpowsour.2005.05.082
Singh, B., Reijers, R., Van Der Spek, M. W., Schakel, W. B., Skagestad, R., Haugen, H. A., … Strømman, A. H. (2014). Environmental Due Diligence of CO2 Capture and Utilization Technologies - Framework and application. Energy Procedia, 63(1876), 7429–7436. http://doi.org/10.1016/j.egypro.2014.11.779
Singh, B., Strømman, A. H., & Hertwich, E. (2011). Life cycle assessment of natural gas combined cycle power plant with post-combustion carbon capture, transport and storage. International Journal of Greenhouse Gas Control, 5(3), 457–466. http://doi.org/10.1016/j.ijggc.2010.03.006
Skone, T. (2013). Personal communication on LCA of coal-fired power plants. NETL. Skone, T. J., Marriott, J., & Cooney, G. (2015). A Life Cycle Analysis Perspective of CCUS – Goal and Scope Definition.
IEA, London. Retrieved from http://www.ieaghg.org/docs/General_Docs/LCA_CCUS_Workshop/2015-11-12_Session_Intro_Skone.pdf
Smekens, K. E. L., & Plomp, A. J. (2013). Note on monetary valuation of CCS emissions for CATO. ECN, Petten. Sovacool, B. K., & Sovacool, K. E. (2009). Identifying future electricity–water tradeoffs in the United States.
Energy Policy, 37(7), 2763–2773. http://doi.org/10.1016/j.enpol.2009.03.012 Spath, P. L., & Mann, M. K. (2004). Biomass Power and Conventional Fossil Systems with and without CO2
Sequestration – Comparing the Energy Balance, Greenhouse Gas Emissions and Economics, (January),

References
270
38. Retrieved from http://www.nrel.gov/docs/fy04osti/32575.pdf Strømman, A. H., & Hertwich, E. (2004). Hybrid life cycle assessment of large scale hydrogen production facilities.
Trondheim. Retrieved from http://brage.bibsys.no/xmlui/bitstream/handle/11250/242587/-1/122111_FULLTEXT01.pdf
Styring, P., Jansen, D., de Conick, H., Reith, H., & Armstrong, K. (2011). Carbon Capture and Utilisation in the green economy. Centre for Low Carbon Futures.
SÜD-Chemie. (2007). General Catalogue. Retrieved from https://www.scribd.com/doc/109713495/SC-General-Catalogue-2007-3MB
Takeishi, K., & Akaike, Y. (2010). Direct Synthesis of Dimethyl Ether ( DME ) from Syngas. RECENT ADVANCES in ENERGY & ENVIRONMENT, 408–411.
Teixeira, R. F. M., De Souza, D. M., Curran, M. P., Antón, A., Michelsen, O., & Milá I Canals, L. (2016). Towards consensus on land use impacts on biodiversity in LCA: UNEP/SETAC Life Cycle Initiative preliminary recommendations based on expert contributions. Journal of Cleaner Production, 112(2016), 4283–4287. http://doi.org/10.1016/j.jclepro.2015.07.118
Telesca, A., Marroccoli, M., Tomasulo, M., Valenti, G. L., Dieter, H., & Montagnaro, F. (2015). Calcium looping spent sorbent as a limestone replacement in the manufacture of portland and calcium sulfoaluminate cements. Environmental Science and Technology, 49(11), 6865–6871. http://doi.org/10.1021/acs.est.5b00394
Tokheim, L.-A. (1999). The impact of staged combustion on the operation of a precalciner cement kiln. Retrieved from https://brage.bibsys.no/xmlui/bitstream/handle/11250/2438583/DrGrad.pdf?sequence=1&isAllowed=y
Tokheim, L. A., & Brevik, P. (2007). Carbon Dioxide Emission Reduction By Increased Utilization of Waste-Derived Fuels in the Cement Industry, (September 2006). http://doi.org/10.1007/s13398-014-0173-7.2
Towler, G., & Sinnot, R. (2013). Capital Cost Estimating. In Chemical Engineering Design: principles, practice and economics of plant and process design (second edi). Oxford: Butterworth-Heinemann.
Treacy, D., & Ross, J. R. H. (2004). The Potential of the CO 2 reforming of CH 4 as a method of CO 2 mitigation . A thermodynamic study ., 49(9), 126–127.
Tukker, A., de Koning, A., Wood, R., Hawkins, T., Lutter, S., Acosta, J., … Kuenen, J. (2013). Exiopol – Development and Illustrative Analyses of a Detailed Global Mr Ee Sut/Iot. Economic Systems Research, 25(1), 50–70. http://doi.org/10.1080/09535314.2012.761952
Turkenburg, W. C. (1992). CO2 removal: Some conclusions. Energy Conversion and Management, 33(5), 819–823. Turner, M. (2013). Personal communication on NETL report DOE/NETL-2012/1546. NETL. Van-Dal, É. S., & Bouallou, C. (2013). Design and simulation of a methanol production plant from CO2
hydrogenation. Journal of Cleaner Production, 57(October 2013), 38–45. http://doi.org/10.1016/j.jclepro.2013.06.008
van den Broek, M., Ramírez, A., Groenenberg, H., Neele, F., Viebahn, P., Turkenburg, W., & Faaij, A. (2010). Feasibility of storing CO2 in the Utsira formation as part of a long term Dutch CCS strategy. International Journal of Greenhouse Gas Control, 4(2), 351–366. http://doi.org/10.1016/j.ijggc.2009.09.002
Van Den Heede, P., & De Belie, N. (2012). Environmental impact and life cycle assessment (LCA) of traditional and “green” concretes: Literature review and theoretical calculations. Cement and Concrete Composites, 34(4), 431–442. http://doi.org/10.1016/j.cemconcomp.2012.01.004
van der Spek, M., Eldrup, N. H., Skagestad, R., & Ramirez, A. (2017). Techno-economic performance of state-of-the-art oxyfuel technology for low-CO2 coal-fired electricity production. Energy Procedia, 0, 14–18.
van der Spek, M., Ramirez, A., & Faaij, A. (2015). Improving uncertainty evaluation of process models by using pedigree analysis. A case study on CO2 capture with Monoethanolamine. Computers & Chemical Engineering, 85(October), 1–15. http://doi.org/10.1016/j.compchemeng.2015.10.006
van Loo, S., & Koppejan, J. (2015). The Handbook of Biomass Combustion and Co - firing. In The effects of brief mindfulness intervention on acute pain experience: An examination of individual difference (Vol. 1, pp. 1689–1699). http://doi.org/10.1017/CBO9781107415324.004
van Vliet, M. T. H., Yearsley, J. R., Ludwig, F., Vögele, S., Lettenmaier, D. P., & Kabat, P. (2012). Vulnerability of US and European electricity supply to climate change. Nature Climate Change, 2(9), 676–681. http://doi.org/10.1038/nclimate1546
Veltman, K., Singh, B., & Hertwich, E. G. (2010). Human and environmental impact assessment of postcombustion CO2 capture focusing on emissions from amine-based scrubbing solvents to air. Environmental Science & Technology, 44(4), 1496–502. http://doi.org/10.1021/es902116r

References
271
Vergragt, P. J., Markusson, N., & Karlsson, H. (2011). Carbon capture and storage, bio-energy with carbon capture and storage, and the escape from the fossil-fuel lock-in. Global Environmental Change, 21(2), 282–292. http://doi.org/10.1016/j.gloenvcha.2011.01.020
Verones, F., Hanafiah, M. M., Pfister, S., Huijbregts, M. A. J., Pelletier, G. J., Koehler, A., & States, U. (2010). Characterization Factors for Thermal Pollution in Freshwater Aquatic Environments. Environmental Science Technology, 44(24), 9364–9369.
Volkart, K., Bauer, C., & Boulet, C. (2013). Life cycle assessment of carbon capture and storage in power generation and industry in Europe. International Journal of Greenhouse Gas Control, 16, 91–106. http://doi.org/10.1016/j.ijggc.2013.03.003
von der Assen, N., Voll, P., Peters, M., & Bardow, A. (2014). Life cycle assessment of CO 2 capture and utilization: a tutorial review. Chem. Soc. Rev., 43(23), 7982–7994. http://doi.org/10.1039/C3CS60373C
Wagner, A. L., Osborne, R. S., & Wagner, J. P. (2003). Prediction of Deactivation Rates and Mechanisms of Reforming Catalysts. ACS Division of Fuel Chemistry, Preprints, 48(2), 748–749.
Wang, X., Nordlander, E., Thorin, E., & Yan, J. (2013). Microalgal biomethane production integrated with an existing biogas plant: A case study in Sweden. Applied Energy, 112, 478–484. http://doi.org/10.1016/j.apenergy.2013.04.087
Weiss, M., Neelis, M., Blok, K., & Patel, M. (2009). Non-energy use of fossil fuels and resulting carbon dioxide emissions: Bottom-up estimates for the world as a whole and for major developing countries. Climatic Change, 95(3–4), 369–394. http://doi.org/10.1007/s10584-009-9562-x
Wernet, G., Bauer, C., Steubing, B., Reinhard, J., Moreno-Ruiz, E., & Weidema, B. (2016). The ecoinvent database version 3 (part I): overview and methodology. International Journal of Life Cycle Assessment, 21(9), 1218–1230. http://doi.org/10.1007/s11367-016-1087-8
Wildenborg, T., Coussy, P., Doukelis, A., Ekstr??m, C., Georgiou, G., Gkountanis, S., … Simonsson, D. (2009). Scenario for large-scale implementation of CCS in Europe. Energy Procedia, 1(1), 4265–4272. http://doi.org/10.1016/j.egypro.2009.02.238
Willeboer, W. (2013). Personal communication on the effect of co-firing biomass on technical performance of power plant, flue gas composition and flue gas treatment facilities. Essent.
Yu, F., Chen, J., Sun, F., Zeng, S., & Wang, C. (2011). Trend of technology innovation in China’s coal-fired electricity industry under resource and environmental constraints. Energy Policy, 39(3), 1586–1599. http://doi.org/10.1016/j.enpol.2010.12.034
Zapp, P., Schreiber, A., Marx, J., Haines, M., Hake, J. F., & Gale, J. (2012). Overall environmental impacts of CCS technologies-A life cycle approach. International Journal of Greenhouse Gas Control, 8, 12–21. http://doi.org/10.1016/j.ijggc.2012.01.014
ZEP. (2012). Biomass with CO2 Capture and Storage (Bio-CCS): The Way Forward For Europe. Industrial Biotechnology (Vol. 8). European Technology Platform for Zero Emission Fossil Fuel Power Plants. Retrieved from http://online.liebertpub.com/doi/abs/10.1089/ind.2012.1529
ZEP. (2015). CCS for industry. Modelling the lowest-cost route for decarbonising Europe. European Technology Platform for Zero Emission Fossil Fuel Power Plants. Retrieved from http://www.zeroemissionsplatform.eu/library/publication/258-ccsforindustry.html
Zhai, H., & Rubin, E. S. (2010). Performance and cost of wet and dry cooling systems for pulverized coal power plants with and without carbon capture and storage. Energy Policy, 38(10), 5653–5660. http://doi.org/10.1016/j.enpol.2010.05.013
Zhang, L., Zhang, H., Ying, W., & Fang, D. (2011). Intrinsic Kinetics of Methanol Dehydration over Al2O3 Catalyst, 5(11), 1538–1543.
Zhao, X., Zhou, H., Sikarwar, V. S., Zhao, M., Park, A.-H. A., Fennell, P. S., … Fan, L.-S. (2017). Biomass-based chemical looping technologies: the good, the bad and the future. Energy Environ. Sci. http://doi.org/10.1039/C6EE03718F
Zhu, Q. (2011). CO2 abatement in the cement industry. http://doi.org/978-92-9029-504-4

Dankwoord
272
Dankwoord
Het schrijven van dit proefschrift is een hele belevenis geweest. Uiteraard is het eindresultaat mede mogelijk gemaakt door de inzet, hulp en support van anderen.
Andrea, without you, nothing of this all would have been possible. From hiring me 5 years ago, convincing me that it would be a shame if I would not obtain my PhD, and guiding me towards the end of the road even when you were not employed at Utrecht University anymore. I have especially admired the way you made time for your PhD students and how you guarded the quality of their work, even in the most busiest times. Your awareness, drive and dedication have provided a great example. Thank you for everything.
Ernst, je was pas laat in het proces betrokken, maar ik heb veel gehad aan de manier waarop je het overzicht hield en vanuit een breder perspectief de zaken bekeek. De combinatie van jouw gevoel voor humor, toewijding en passie maakten het erg prettig met je samen te werken. André, onze tijd samen was helaas kort, maar bedankt voor de motivatie die ik kon ontrekken aan je aanstekelijke enthousiasme.
Graag erken ik ook de bijdrage van de overige co-auteurs van de diverse hoofdstukken: Hans, Ali, Stephan, Gabriel, Bhawna, Anders, Christine, Lars-Andre, Cora en Mijndert. Het onderzoek wat gepresenteerd is in dit proefschrift is grotendeels tijdens projecten uitgevoerd. Graag bedank ik de partners van de projecten CATO2 en PROSUITE (helaas teveel om op te noemen) voor de samenwerking, adviezen en discussies. A special word of thanks to the Eddiccut team: Anders and Andrea (I will miss your discussions in the middle of group sessions), Bhawna, Rick, Gabriel, Raquel, Christine (I don’t think I will ever forget the poster of the best case study in the world), Maren, “the other” Anders, Ragnhild, Nils (thanks again for the amazing boat trip), Hans Aksel, Cora, Mijndert and the industrial project partners, especially Lars-Andre and Eirik. Thank you for the great meetings and Norwegian hospitality. Mijndert, bedankt voor je bereidheid altijd te willen helpen of brainstormen, en de gezelligheid gedurende onze vele buitenlandse tripjes.
De (werk)sfeer in de E&R groep van het Copernicus instituut is super en zal ik zeker gaan missen. Ik wil graag de hele groep bedanken, maar wil toch een paar mensen, zonder daarbij hopelijk iemand tekort te doen, bij naam noemen. Allereerst de kamergenoten waarmee ik mijn kamer het langste gedeeld heb:

Dankwoord
273
Niels, bedankt voor alle gezelligheid en de prettige omgang (heerlijk om ook af en toe lekker over andere dingen dan werk te kunnen praten). Steven, I will miss the confidence boost I got from kicking your butt in an always timely chosen game of darts. Working late hours (due to a lack of productivity in the morning) is a form of art without which I probably would have never even published a single article, and thanks to those who often accompanied me to dinners at the UMC: Gert-Jan, Ric, Niels, Will, Akshay and Hans. Wat ook enorm geholpen heeft is een secretariaat dat alles op orde heeft en altijd voor je klaar staat: Siham en Fiona, bedankt voor alles. Aisha in het bijzonder bedankt voor je hulp en adviezen, je interesse in de voortgang en bemoedigende woorden gedurende de laatste paar maanden.
Belangrijk is ook een goede balans tussen werk en ontspanning. Ontspanning zoeken werkt het beste in gezelschap van leuke gezellige mensen. Al mijn vrienden en kennisen in Zeist hiervoor bedankt, maar in het bijzonder Evert, Jonathan, Harm, Thijs en Henno. Ik koester de kaartavondjes, grapjes wanneer ik nou toch eens een keer zou afstuderen en mooie tripjes naar het buitenland. Harm en Henno, bedankt voor het mij vrijwillig willen steunen als paranimf tijdens de laatste drie kwartier van dit traject. Ontspanning heb ik ook voor een groot deel gehaald uit volleybal, en de gezelligheid daaromheen. Leden van het Lief Selectief Collectief, ook al ben ik er helaas lang niet altijd bij, ik waardeer het enorm dat ik deel uit mag maken van deze fantastische groep.
Een prettige thuishaven kan alles zijn in het leven. Ik voel mezelf enorm gezegend met zowel een familie als schoonfamilie waarin geweldige voorbeelden gegeven worden van de omgang met elkaar, liefde en genegenheid, steun en vertrouwen. Papa en mama, ik ben enorm dankbaar voor alle kansen en mogelijkheden die jullie voor mij hebben gefaciliteerd. Bedankt voor het leggen van de basis voor de persoon die ik nu ben. Manon, woorden schieten tekort hoeveel jij voor mij betekent. Bedankt voor je geduld, steun, vertrouwen en de aansporing die ik soms (of vaak) toch ook goed kan gebruiken. Met jou is alles zoveel leuker, ik kijk uit naar onze toekomst samen.

About the author
274
About the author
Wouter Schakel was born on December 9th, 1987 in Zeist, the Netherlands. He started studying Physics at Utrecht University in 2005, and also did some additional courses on Economics and Energy analysis. After obtaining his Bachelor of Science in 2009, he enrolled in the Master’s program Energy Science, also at Utrecht University. During his Master’s he did an internship at Topell Energy BV in The Hague investigating availabilities and costs of
biomass supply chains for the torrefaction of biomass. He also wrote his Master thesis in collaboration with Topell Energy, expanding his research by studying the effect of alternative biomass types on the mass and energy balance of the torrefaction process and the lifecycle greenhouse gas emissions of the use of torrefied biomass for energy production.
In 2012, he started as junior researcher at the Copernicus Institute of Sustainable Development (Utrecht University). As junior researcher, he participated in multiple projects, namely: the Dutch national programme on CO2 Capture and Storage (CATO2), the European FP7 project PROSUITE (Sustainability Assessment for Technology) and the by the Norwegian government and industry partners founded Eddiccut project (Environmental Due Diligence of CO2 Capture and Utilization Technologies). While working on these projects, his research included a wide range of topics and applied methods. Part of the results obtained in these projects are included in this dissertation. Besides his research work, Wouter supervised two Master students and was involved in teaching in several courses of the Energy Science Masters programme.

About the author
275
Peer-reviewed papers by the author
Schakel, W., Hung, C., Tokheim, L., Strømman, A., Worrell, E. & Ramírez, A. (2017). Impact of fuel selection on the environmental performance of post-combustion calcium looping applied to a cement plant. Applied Energy (forthcoming).
Schakel, W., Fernández-Dacosta, C., van der Spek, M., Ramírez, A. (2017). New indicator for comparing the energy performance of CO2 utilization concepts. Journal of CO2 Utilization (forthcoming).
Schakel, W., Oreggioni, G., Singh, B., Strømman, A. & Ramírez, A. (2016).
Assessing the techno-environmental performance of CO2 utilization via dry reforming of methane for the production of dimethyl ether. Journal of CO2 Utilization, 16, (pp. 138-149).
Schakel, W., Pfister, S. & Ramírez, A. (2015). Exploring the potential
impact of implementing carbon capture technologies in fossil fuel power plants on regional European water stress index levels. International journal of greenhouse gas control, 39, (pp. 318–328).
Schakel, W., Meerman, H., Talaei, A., Ramírez, A. & Faaij, A.
(2014).Comparative life cycle assessment of biomass co-firing plants with carbon capture and storage. Applied Energy, 131, (pp. 441-467).
Batidzirai, B., Mignot, P., Schakel, W., Junginger, M. & Faaij, A. (2013).
Biomass torrefaction technology: Techno-economic status and future prospects. Energy, 62, (pp. 196-214).
Kappers, A. & Schakel, W. (2011). Comparison of the haptic and visual
deviations in a parallelity task. Experimental Brain Research, 208 (3), (pp. 467-473).

W O U T E R S C H A K E L
UITNODIGINGvoor het bijwonen van de
openbare verdediging van mijn proefschrift
UNDERSTANDING ENVIRONMENTAL
TRADE-OFFS OF CARBON CAPTURE,
UTILIZATION AND STORAGE
Woensdag 6 december 201710:30 uur
Academiegebouw (Senaatszaal)Domplein 29, Utrecht
Aansluitend is er een receptiein hetzelfde gebouw
WOUTER [email protected]
+316 33928733
PARANIMFENHarm de Boo
Henno van Eckeveld
UNDERSTANDING ENVIRONMENTAL TRADE-OFFS OF CARBON CAPTURE,
UTILIZATION AND STORAGE
UN
DER
STAN
DIN
G EN
VIR
ON
MEN
TAL TR
AD
E-OFFS O
F CA
RBO
N C
AP
TUR
E, UTILIZ
ATIO
N A
ND
STOR
AG
E W
OU
TER S
CHA
KEL
15014-schakel-cover.indd 1 17/10/2017 10:29
Related Documents