Underperformance of African Protected Area Networks and the Case for New Conservation Models: Insights from Zambia Peter A. Lindsey 1,2 *, Vincent R. Nyirenda 3 , Jonathan I. Barnes 4 , Matthew S. Becker 5,6 , Rachel McRobb 7 , Craig J. Tambling 8 , W. Andrew Taylor 9 , Frederick G. Watson 6,10 , Michael t’Sas-Rolfes 11 1 Panthera, New York, New York, United States of America, 2 Mammal Research Institute, Department of Zoology and Entomology, University of Pretoria, Pretoria, Gauteng, South Africa, 3 Zambia Wildlife Authority, Chilanga, Lusaka, Zambia, 4 Design & Development Services, Windhoek, Namibia, 5 Department of Ecology, Montana State University, Bozeman, Montana, United States of America, 6 Zambian Carnivore Programme, Mfuwe, Zambia, 7 South Luangwa Conservation Society, Mfuwe, Zambia, 8 Centre for African Conservation Ecology, Department of Zoology, Nelson Mandela Metropolitan University, Port Elizabeth, South Africa, 9 Centre for Veterinary Wildlife Studies, Faculty of Veterinary Science, University of Pretoria, Pretoria, South Africa, 10 Division of Science and Environmental Policy, California State University Monterey Bay, Seaside, California, United States of America, 11 Cape Town, South Africa Abstract Many African protected areas (PAs) are not functioning effectively. We reviewed the performance of Zambia’s PA network and provide insights into how their effectiveness might be improved. Zambia’s PAs are under-performing in ecological, economic and social terms. Reasons include: a) rapidly expanding human populations, poverty and open-access systems in Game Management Areas (GMAs) resulting in widespread bushmeat poaching and habitat encroachment; b) underfunding of the Zambia Wildlife Authority (ZAWA) resulting in inadequate law enforcement; c) reliance of ZAWA on extracting revenues from GMAs to cover operational costs which has prevented proper devolution of user-rights over wildlife to communities; d) on-going marginalization of communities from legal benefits from wildlife; e) under-development of the photo-tourism industry with the effect that earnings are limited to a fraction of the PA network; f) unfavourable terms and corruption which discourage good practice and adequate investment by hunting operators in GMAs; g) blurred responsibilities regarding anti-poaching in GMAs resulting in under-investment by all stakeholders. The combined effect of these challenges has been a major reduction in wildlife densities in most PAs and the loss of habitat in GMAs. Wildlife fares better in areas with investment from the private and/or NGO sector and where human settlement is absent. There is a need for: elevated government funding for ZAWA; greater international donor investment in protected area management; a shift in the role of ZAWA such that they focus primarily on national parks while facilitating the development of wildlife-based land uses by other stakeholders elsewhere; and new models for the functioning of GMAs based on joint-ventures between communities and the private and/or NGO sector. Such joint-ventures should provide defined communities with ownership of land, user-rights over wildlife and aim to attract long-term private/donor investment. These recommendations are relevant for many of the under-funded PAs occurring in other African countries. Citation: Lindsey PA, Nyirenda VR, Barnes JI, Becker MS, McRobb R, et al. (2014) Underperformance of African Protected Area Networks and the Case for New Conservation Models: Insights from Zambia. PLoS ONE 9(5): e94109. doi:10.1371/journal.pone.0094109 Editor: Danilo Russo, Universita ` degli Studi di Napoli Federico II, Italy Received October 15, 2013; Accepted March 12, 2014; Published May 21, 2014 Copyright: ß 2014 Lindsey et al. This is an open-access article distributed under the terms of the Creative Commons Attribution License, which permits unrestricted use, distribution, and reproduction in any medium, provided the original author and source are credited. Funding: The funding for this research was provided by the Wildlife Producers Association of Zambia. CJT was funded with a Claude Leon Fellowship. The funders had no role in study design, data collection and analysis, decision to publish, or preparation of the manuscript. Competing Interests: JB is employed by Design and Development Services. PL was employed as a consultant during the research which provided the data used to compile this paper. There are no patents, products in development or marketed products to declare. This does not alter the authors’ adherence to all the PLOS ONE policies on sharing data and materials. * E-mail: [email protected] Introduction Many African countries have designated generous proportions of their land surface as protected areas. Such protected areas vary greatly in their makeup, from strictly protected areas with no human settlement to areas that have resident communities where multiple uses of wildlife are permitted. African governments find it difficult to fund protected area networks adequately and are facing severe threats from poaching and human encroachment [1,2]. These problems are pronounced where human settlement is permitted or tolerated inside protected areas, as occurs in parts of Ethiopia, Mozambique, Tanzania and Zambia, for example [3,4]. Zambia has a vast wildlife estate encompassing 20 national parks (,64,000 km 2 ), 3 wildlife and bird sanctuaries (33.5 km 2 ), 36 GMAs (167,000 km 2 ) and several other protected area categories, comprising ,40% of the nation’s land area [5] (Figure 1). Human settlement is not permitted in national parks, and land use is limited primarily to photo-tourism. National parks have generally not suffered from human encroachment, but are subject to widespread poaching, regular uncontrolled burning (which sometimes emanates from areas outside of the park boundaries) and in some cases, informal mining [6]. With the exception of Lusaka and Mosi-oa-tunya national parks, no protected areas in Zambia are fenced and most are simply demarcated with cut-lines or rivers, and in some cases, beacons. PLOS ONE | www.plosone.org 1 May 2014 | Volume 9 | Issue 5 | e94109

Welcome message from author
This document is posted to help you gain knowledge. Please leave a comment to let me know what you think about it! Share it to your friends and learn new things together.
Transcript

Underperformance of African Protected Area Networksand the Case for New Conservation Models: Insightsfrom ZambiaPeter A. Lindsey1,2*, Vincent R. Nyirenda3, Jonathan I. Barnes4, Matthew S. Becker5,6, Rachel McRobb7,
Craig J. Tambling8, W. Andrew Taylor9, Frederick G. Watson6,10, Michael t’Sas-Rolfes11
1 Panthera, New York, New York, United States of America, 2Mammal Research Institute, Department of Zoology and Entomology, University of Pretoria, Pretoria,
Gauteng, South Africa, 3 Zambia Wildlife Authority, Chilanga, Lusaka, Zambia, 4Design & Development Services, Windhoek, Namibia, 5Department of Ecology, Montana
State University, Bozeman, Montana, United States of America, 6Zambian Carnivore Programme, Mfuwe, Zambia, 7 South Luangwa Conservation Society, Mfuwe, Zambia,
8Centre for African Conservation Ecology, Department of Zoology, Nelson Mandela Metropolitan University, Port Elizabeth, South Africa, 9Centre for Veterinary Wildlife
Studies, Faculty of Veterinary Science, University of Pretoria, Pretoria, South Africa, 10Division of Science and Environmental Policy, California State University Monterey
Bay, Seaside, California, United States of America, 11Cape Town, South Africa
Abstract
Many African protected areas (PAs) are not functioning effectively. We reviewed the performance of Zambia’s PA networkand provide insights into how their effectiveness might be improved. Zambia’s PAs are under-performing in ecological,economic and social terms. Reasons include: a) rapidly expanding human populations, poverty and open-access systems inGame Management Areas (GMAs) resulting in widespread bushmeat poaching and habitat encroachment; b) underfundingof the Zambia Wildlife Authority (ZAWA) resulting in inadequate law enforcement; c) reliance of ZAWA on extractingrevenues from GMAs to cover operational costs which has prevented proper devolution of user-rights over wildlife tocommunities; d) on-going marginalization of communities from legal benefits from wildlife; e) under-development of thephoto-tourism industry with the effect that earnings are limited to a fraction of the PA network; f) unfavourable terms andcorruption which discourage good practice and adequate investment by hunting operators in GMAs; g) blurredresponsibilities regarding anti-poaching in GMAs resulting in under-investment by all stakeholders. The combined effect ofthese challenges has been a major reduction in wildlife densities in most PAs and the loss of habitat in GMAs. Wildlife faresbetter in areas with investment from the private and/or NGO sector and where human settlement is absent. There is a needfor: elevated government funding for ZAWA; greater international donor investment in protected area management; a shiftin the role of ZAWA such that they focus primarily on national parks while facilitating the development of wildlife-basedland uses by other stakeholders elsewhere; and new models for the functioning of GMAs based on joint-ventures betweencommunities and the private and/or NGO sector. Such joint-ventures should provide defined communities with ownershipof land, user-rights over wildlife and aim to attract long-term private/donor investment. These recommendations arerelevant for many of the under-funded PAs occurring in other African countries.
Citation: Lindsey PA, Nyirenda VR, Barnes JI, Becker MS, McRobb R, et al. (2014) Underperformance of African Protected Area Networks and the Case for NewConservation Models: Insights from Zambia. PLoS ONE 9(5): e94109. doi:10.1371/journal.pone.0094109
Editor: Danilo Russo, Universita degli Studi di Napoli Federico II, Italy
Received October 15, 2013; Accepted March 12, 2014; Published May 21, 2014
Copyright: � 2014 Lindsey et al. This is an open-access article distributed under the terms of the Creative Commons Attribution License, which permitsunrestricted use, distribution, and reproduction in any medium, provided the original author and source are credited.
Funding: The funding for this research was provided by the Wildlife Producers Association of Zambia. CJT was funded with a Claude Leon Fellowship. Thefunders had no role in study design, data collection and analysis, decision to publish, or preparation of the manuscript.
Competing Interests: JB is employed by Design and Development Services. PL was employed as a consultant during the research which provided the data usedto compile this paper. There are no patents, products in development or marketed products to declare. This does not alter the authors’ adherence to all the PLOSONE policies on sharing data and materials.
* E-mail: [email protected]
Introduction
Many African countries have designated generous proportions
of their land surface as protected areas. Such protected areas vary
greatly in their makeup, from strictly protected areas with no
human settlement to areas that have resident communities where
multiple uses of wildlife are permitted. African governments find it
difficult to fund protected area networks adequately and are facing
severe threats from poaching and human encroachment [1,2].
These problems are pronounced where human settlement is
permitted or tolerated inside protected areas, as occurs in parts of
Ethiopia, Mozambique, Tanzania and Zambia, for example [3,4].
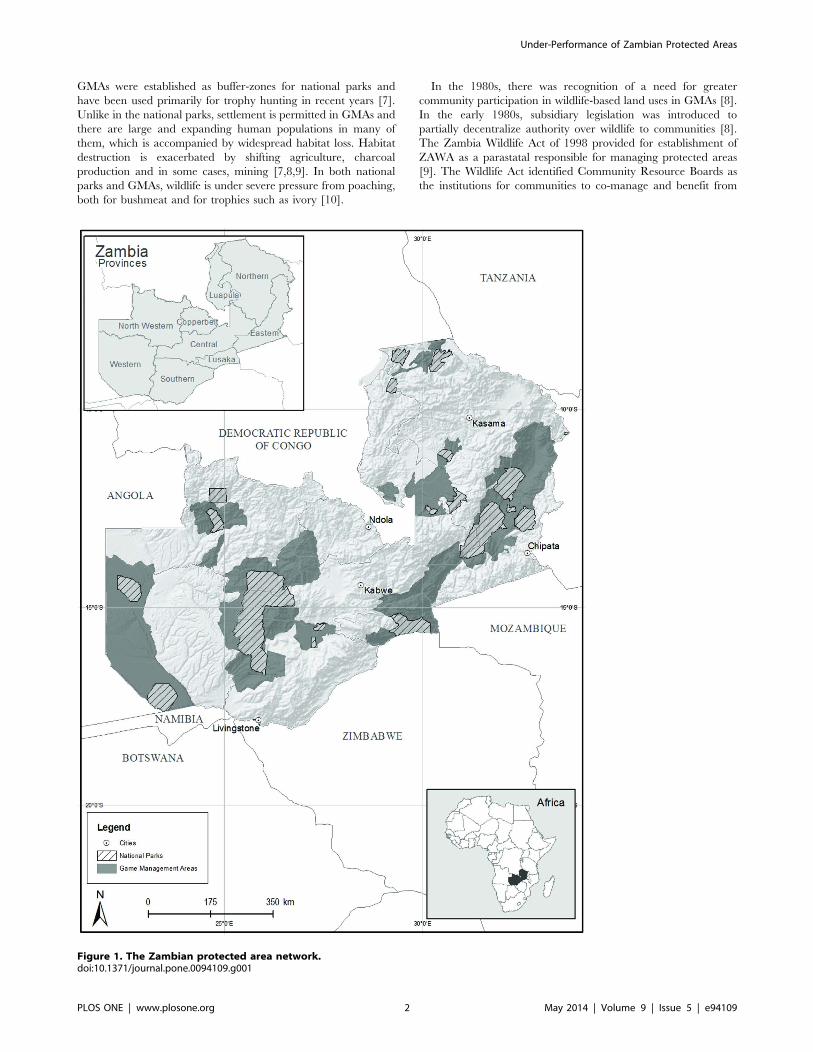
Zambia has a vast wildlife estate encompassing 20 national
parks (,64,000 km2), 3 wildlife and bird sanctuaries (33.5 km2),
36 GMAs (167,000 km2) and several other protected area
categories, comprising ,40% of the nation’s land area [5]
(Figure 1). Human settlement is not permitted in national parks,
and land use is limited primarily to photo-tourism. National parks
have generally not suffered from human encroachment, but are
subject to widespread poaching, regular uncontrolled burning
(which sometimes emanates from areas outside of the park
boundaries) and in some cases, informal mining [6]. With the
exception of Lusaka and Mosi-oa-tunya national parks, no
protected areas in Zambia are fenced and most are simply
demarcated with cut-lines or rivers, and in some cases, beacons.
PLOS ONE | www.plosone.org 1 May 2014 | Volume 9 | Issue 5 | e94109
GMAs were established as buffer-zones for national parks and
have been used primarily for trophy hunting in recent years [7].
Unlike in the national parks, settlement is permitted in GMAs and
there are large and expanding human populations in many of
them, which is accompanied by widespread habitat loss. Habitat
destruction is exacerbated by shifting agriculture, charcoal
production and in some cases, mining [7,8,9]. In both national
parks and GMAs, wildlife is under severe pressure from poaching,
both for bushmeat and for trophies such as ivory [10].
In the 1980s, there was recognition of a need for greater
community participation in wildlife-based land uses in GMAs [8].
In the early 1980s, subsidiary legislation was introduced to
partially decentralize authority over wildlife to communities [8].
The Zambia Wildlife Act of 1998 provided for establishment of
ZAWA as a parastatal responsible for managing protected areas
[9]. The Wildlife Act identified Community Resource Boards as
the institutions for communities to co-manage and benefit from
Figure 1. The Zambian protected area network.doi:10.1371/journal.pone.0094109.g001
Under-Performance of Zambian Protected Areas
PLOS ONE | www.plosone.org 2 May 2014 | Volume 9 | Issue 5 | e94109

wildlife in GMAs [9] though no mechanisms were created to
enable communities to benefit from wildlife in national parks.
Wildlife-based land uses in the PA network have potential to
improve livelihoods significantly for communities. People in
GMAs are poorer and less educated than the national average,
and GMAs have low agricultural potential and offer few
alternative livelihood opportunities [11]. Trophy hunting in the
GMAs has potential to generate significant incomes for commu-
nities if wildlife populations are allowed to recover and systems are
put in place to ensure equitable benefit sharing and best-practices
[12]. Similarly, national parks have potential to benefit rural
communities through tourism-related employment and business
opportunities. The PA network as a whole has enormous potential
to contribute to rural and national economic growth by providing
the basis for development of a major tourism industry [13].
However, wildlife populations are waning in many GMAs and
national parks, and incomes from both trophy hunting and photo-
tourism are limited to fractions of the GMAs and national parks
[7]. In addition, mechanisms to enable communities to benefit
legally from the PA area network are limited. Consequently the PA
network is under-performing in ecological, economic and social
terms.
There have been several attempts by the Zambian government
to address the underperformance of the protected area network.
For example, in 2006, the Zambian Government embarked upon
a reclassification programme for protected areas [5] and in early
2013, a moratorium was imposed on hunting in GMAs. In
addition, two protected areas have been added to the estate in
recent years: the ,50 km2 Lusaka National Park and the
5,104 km2 Mukungule GMA. However, key challenges with
regards to the functioning and effectiveness of Zambia’s PA
network remain.
In this paper we provide evidence of the under-performance of
the Zambian protected area network, give reasons for that
performance and suggest interventions needed to make the system
more effective in ecological, economic and social terms. These
recommendations have relevance for the PA networks of many
other African countries.
Results and Discussion
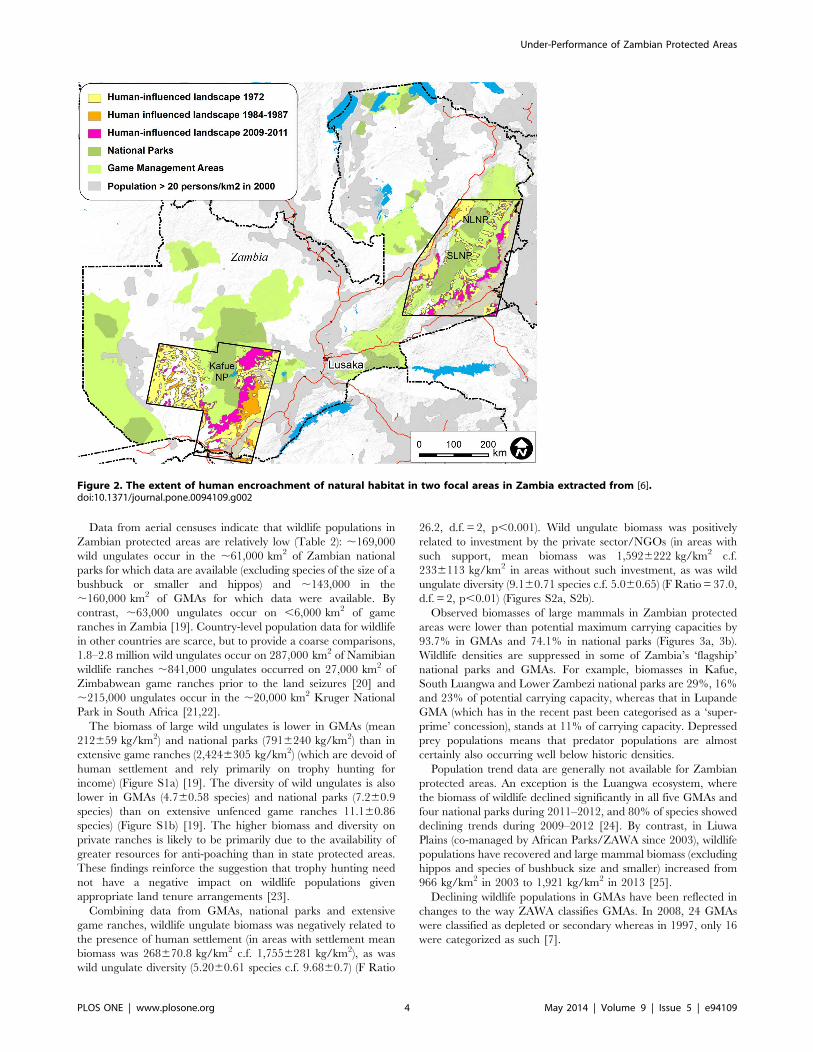
Ecological Indicators of Protected Area PerformanceHuman encroachment of protected areas in Zambia is worse
than in most other African countries [14], and ,2,500–3,000 km2
of land are deforested annually [15]. Human population growth
rates in GMAs (2.4960.18%) are higher than elsewhere
(2.3160.24%, T-test 0.577, d.f. = 70, p= 0.566) [16]. Almost
40% of the total area of GMAs is now comprised of human-
modified habitat (c.f. 71.2% outside of the protected area network)
[6]. By contrast, habitat loss in national parks is limited (2.1%)
(Table 1). The rate of habitat loss in GMAs (0.69% conversion per
year) is faster than in national parks (0.05%) or outside protected
areas (0.51%) (Table 1, Figure 2, [6]). Extrapolating from [6]’s
sample area (Table 1, Figure 2), ,82 hectares of habitat are lost
per daylight hour in GMAs on a national level. Human
encroachment in GMAs is advancing from main roads towards
national parks at a rate of up to 2 km per year ([6]). In some
protected areas, and most notably Lukusuzi National Park [17],
mining activity is evident and has potential to affect wildlife
populations adversely through habitat degradation and bushmeat
poaching [18]. In addition to habitat loss, human encroachment
undermines the buffer zone role of GMAs for national parks,
jeopardizes ecological connectivity among PAs and the concept of
transfrontier conservation areas ([6]).
Table
1.Estimatesoftheextentan
drate
ofhab
itat
conversionin
GMAs(from
naturaltohuman
-modifiedhab
itat),nationalparks
andlandoutsidetheprotectedareanetw
ork
inZam
bia
(takenfrom
dataextractedfrom
[6]).
,1970
,1985
,2010
,1970–,1985
,1980–,2010
Landtype
Totalin
studyarea
(km
2)
Areahuman
(km
2)
%human
Areahuman
(km
2)
%human
Areahuman
(km
2)
%human
Increase
per
year(km
2)
%increase
per
year
Increase
per
year(km
2)
%increase
peryear
Whole
studyarea
159805
58926
36.9%
60935
38.1%
80157
50.2%
134
0.08%
769
0.48%
NPs
27098
252
0.9%
257
1.0%
571
2.1%
00.00%
13
0.05%
GMAs
47430
9468
20.0%
10616
22.4%
18744
39.5%
77
0.16%
325
0.69%
Non-NP,Non-GMA
85277
49206
57.7%
50061
58.7%
60841
71.3%
57
0.07%
431
0.51%
Luan
gwaValleyGMAs
26502
6815
25.7%
6190
23.4%
8878
33.5%
242
20.16%
108
0.41%
Southern
KafueGMAs
20928
2652
12.7%
4427
21.2%
9866
47.1%
118
0.57%
218
1.04%
doi:10.1371/journal.pone.0094109.t001
Under-Performance of Zambian Protected Areas
PLOS ONE | www.plosone.org 3 May 2014 | Volume 9 | Issue 5 | e94109
Data from aerial censuses indicate that wildlife populations in
Zambian protected areas are relatively low (Table 2): ,169,000
wild ungulates occur in the ,61,000 km2 of Zambian national
parks for which data are available (excluding species of the size of a
bushbuck or smaller and hippos) and ,143,000 in the
,160,000 km2 of GMAs for which data were available. By
contrast, ,63,000 ungulates occur on ,6,000 km2 of game
ranches in Zambia [19]. Country-level population data for wildlife
in other countries are scarce, but to provide a coarse comparisons,
1.8–2.8 million wild ungulates occur on 287,000 km2 of Namibian
wildlife ranches ,841,000 ungulates occurred on 27,000 km2 of
Zimbabwean game ranches prior to the land seizures [20] and
,215,000 ungulates occur in the ,20,000 km2 Kruger National
Park in South Africa [21,22].
The biomass of large wild ungulates is lower in GMAs (mean
212659 kg/km2) and national parks (7916240 kg/km2) than in
extensive game ranches (2,4246305 kg/km2) (which are devoid of
human settlement and rely primarily on trophy hunting for
income) (Figure S1a) [19]. The diversity of wild ungulates is also
lower in GMAs (4.760.58 species) and national parks (7.260.9
species) than on extensive unfenced game ranches 11.160.86
species) (Figure S1b) [19]. The higher biomass and diversity on
private ranches is likely to be primarily due to the availability of
greater resources for anti-poaching than in state protected areas.
These findings reinforce the suggestion that trophy hunting need
not have a negative impact on wildlife populations given
appropriate land tenure arrangements [23].
Combining data from GMAs, national parks and extensive
game ranches, wildlife ungulate biomass was negatively related to
the presence of human settlement (in areas with settlement mean
biomass was 268670.8 kg/km2 c.f. 1,7556281 kg/km2), as was
wild ungulate diversity (5.2060.61 species c.f. 9.6860.7) (F Ratio
26.2, d.f. = 2, p,0.001). Wild ungulate biomass was positively
related to investment by the private sector/NGOs (in areas with
such support, mean biomass was 1,5926222 kg/km2 c.f.
2336113 kg/km2 in areas without such investment, as was wild
ungulate diversity (9.160.71 species c.f. 5.060.65) (F Ratio = 37.0,
d.f. = 2, p,0.01) (Figures S2a, S2b).
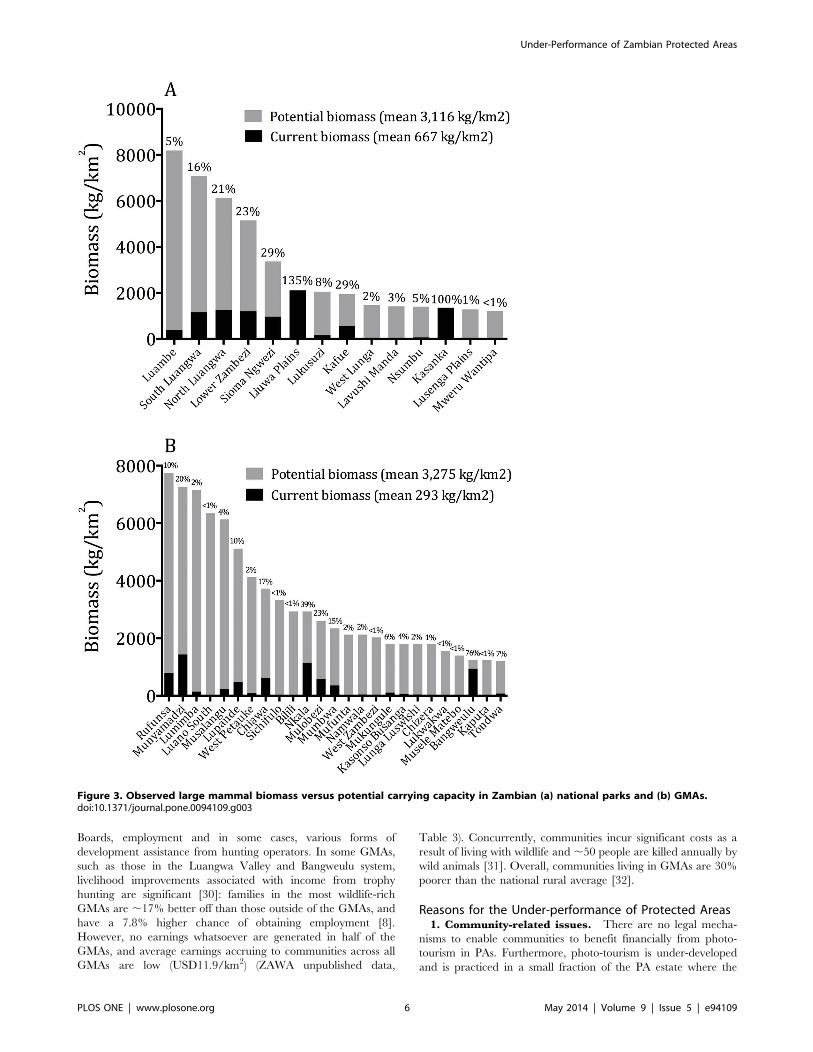
Observed biomasses of large mammals in Zambian protected
areas were lower than potential maximum carrying capacities by
93.7% in GMAs and 74.1% in national parks (Figures 3a, 3b).
Wildlife densities are suppressed in some of Zambia’s ‘flagship’
national parks and GMAs. For example, biomasses in Kafue,
South Luangwa and Lower Zambezi national parks are 29%, 16%
and 23% of potential carrying capacity, whereas that in Lupande
GMA (which has in the recent past been categorised as a ‘super-
prime’ concession), stands at 11% of carrying capacity. Depressed
prey populations means that predator populations are almost
certainly also occurring well below historic densities.
Population trend data are generally not available for Zambian
protected areas. An exception is the Luangwa ecosystem, where
the biomass of wildlife declined significantly in all five GMAs and
four national parks during 2011–2012, and 80% of species showed
declining trends during 2009–2012 [24]. By contrast, in Liuwa
Plains (co-managed by African Parks/ZAWA since 2003), wildlife
populations have recovered and large mammal biomass (excluding
hippos and species of bushbuck size and smaller) increased from
966 kg/km2 in 2003 to 1,921 kg/km2 in 2013 [25].
Declining wildlife populations in GMAs have been reflected in
changes to the way ZAWA classifies GMAs. In 2008, 24 GMAs
were classified as depleted or secondary whereas in 1997, only 16
were categorized as such [7].
Figure 2. The extent of human encroachment of natural habitat in two focal areas in Zambia extracted from [6].doi:10.1371/journal.pone.0094109.g002
Under-Performance of Zambian Protected Areas
PLOS ONE | www.plosone.org 4 May 2014 | Volume 9 | Issue 5 | e94109

Economic Indicators of Park PerformanceZambia attracts fewer tourists than other African countries
known for wildlife: South Africa (,9.2 million), Botswana (,2.3
million), Zimbabwe (,2.2 million), Kenya (,1.8 million),
Mozambique (,1.6 million), Tanzania (,1.25 Million), Namibia
(,1.1 million), Zambia (,0.9 million) (www.wttc.org, accessed
July 2013). In 2005 (when the latest data on tourist visitation to
parks were available), just 59,350 tourists visited Zambia’s national
parks and 95% of those visited just five parks (Kafue, South
Luangwa, Mosi-oa-Tunya, Lower Zambezi and Lochinvar): the
remaining 15 parks comprising ,32,000 km2 attracted just 1,384
tourists [26,27]. Most national parks thus fail to attract enough
tourists to support viable photo-tourism [27]. Earnings from
national parks and GMAs in Zambia are low. Photo-tourism
generated USD9.1 million for ZAWA in 2011 (USD142/km2) and
UDD9.4 million in 2012 (USD146/km2) (ZAWA unpublished
data). The majority of those earnings (96.9%, USD154/km2) were
from four parks (South Luangwa – 44.4%, Mosi-o-tunya – 23.7%,
Kafue – 14.7% and Lower Zambezi – 14.1%), which comprise
36,681 km2 (57.3%) of the national parks network (ZAWA
unpublished data). The remainder of the parks generated just
USD182,229 (USD6.7/km2) due to the relative (or actual) absence
of tourism operators. Photo-tourism operations exist in only 10 of
36 GMAs [7] and in a marginal capacity given they currently are
unable to bid for concessions in GMAs. Photo-tourism operations
in GMAs are generally limited to lodges on national park
boundaries with little investment or activity in the GMAs.
From trophy hunting income, ZAWA only earned concession
fees from ,51% of the GMA estate in 2012 (ZAWA unpublished
data). ZAWA earned a total of USD4.34 million from trophy
hunting and resident hunting respectively in 2012 (equating to
USD26/km2) (ZAWA unpublished data). We estimate that an
additional USD16.1 million was earned by operators from trophy
hunting in GMAs, yielding total earnings of USD97/km2
(averaged across all GMAs including those not hunted, Table 3).
Earnings per km2 from trophy hunting (when excluding hunting
areas that do not generate any income to allow for comparison
with other countries) (US$2916116/km2) are lower than most
other SADC countries: Zimbabwe – USD1,028/km2; Tanzania –
USD424/km2; Namibia – USD378/km2; Mozambique –
USD130/km2, [28] (F-Ratio 11.0, d.f. = 1, p= 0.001). Within
Zambia, gross earnings per km2 from trophy hunting in GMAs
(USD97/km2) are markedly lower than on extensive game ranches
(USD8786226) (F Ratio 15.9, d.f. = 1, p,0.001) [19]. Contrib-
uting to the low earnings from hunting in Zambia in 2012 was the
fact that 19 leases for hunting concessions ended prior to the end
of the hunting season, and resident hunting was halted by the
Zambian government (ZAWA unpublished data).
Social IndicatorsThe primary benefit to communities from national parks is
employment and the development of wildlife-based economies
around tourism hubs such as the growth point of Mfuwe, adjacent
to South Luangwa National Park. Tourism generates an estimated
19,000 jobs in Zambia [27], though the proportion derived
specifically from parks is not clear. In Mfuwe, ,900 jobs are
created and such workers receive mean salaries of US$450/
month, ,3x the minimum wage (A. Coley, pers. comm.).
Tourism-related employment is significant because it can result
in improved attitudes towards wildlife conservation [29]. Howev-
er, most parks generate virtually no employment for communities
due to the lack or small-scale of tourism operations.
In GMAs, benefits accruing to communities from trophy
hunting include income generation for Community Resource
Table 2. Estimated wildlife populations in National Parks (data available for 61,462 km2 of the ,64,000 km2), Game ManagementAreas (GMAs, data available for 159,654 km2 of the ,167,000 km2) and game ranches (5,829 km2) in Zambia (excluding species ofbushbuck size and smaller, and hippopotamuses for which count data were not available) (data taken from [19]).
Species National parks GMAs Game ranches Total
Lechwe 9,737 75,808 1,513 87,058
Impala 27,820 13,507 27,998 69,325
Wildebeest 47,815 4,069 630 52,514
Buffalo 21,301 15,938 2,107 39,346
Puku 16,838 7,529 4,904 29,271
Elephant 10,830 8,094 1,710 20,634
Sable 8,172 4,895 3,682 16,749
Zebra, plains 8,375 1,050 2,060 11,485
Waterbuck 5,254 2,333 2,987 10,574
Kudu 1,908 1,976 6,287 10,171
Hartebeest 4,429 3,952 2,051 10,432
Roan 2,384 1,632 1,647 5,663
Reedbuck 1,137 852 2,735 4,724
Eland 1,069 237 1,558 2,864
Tsessebe 990 88 410 1,488
Giraffe 579 178 321 1,078
Sitatunga 40 369 328 737
Nyala 0 0 95 95
168,678 142,507 63,023 374,208
doi:10.1371/journal.pone.0094109.t002
Under-Performance of Zambian Protected Areas
PLOS ONE | www.plosone.org 5 May 2014 | Volume 9 | Issue 5 | e94109
Boards, employment and in some cases, various forms of
development assistance from hunting operators. In some GMAs,
such as those in the Luangwa Valley and Bangweulu system,
livelihood improvements associated with income from trophy
hunting are significant [30]: families in the most wildlife-rich
GMAs are ,17% better off than those outside of the GMAs, and
have a 7.8% higher chance of obtaining employment [8].
However, no earnings whatsoever are generated in half of the
GMAs, and average earnings accruing to communities across all
GMAs are low (USD11.9/km2) (ZAWA unpublished data,
Table 3). Concurrently, communities incur significant costs as a
result of living with wildlife and ,50 people are killed annually by
wild animals [31]. Overall, communities living in GMAs are 30%
poorer than the national rural average [32].
Reasons for the Under-performance of Protected Areas1. Community-related issues. There are no legal mecha-
nisms to enable communities to benefit financially from photo-
tourism in PAs. Furthermore, photo-tourism is under-developed
and is practiced in a small fraction of the PA estate where the
Figure 3. Observed large mammal biomass versus potential carrying capacity in Zambian (a) national parks and (b) GMAs.doi:10.1371/journal.pone.0094109.g003
Under-Performance of Zambian Protected Areas
PLOS ONE | www.plosone.org 6 May 2014 | Volume 9 | Issue 5 | e94109

resource and existing conditions are suitable. For example, photo-
tourism operations exist in only 10 of the 36 GMAs [7] and the
existing legal framework does not require photo-tourism operators
to pay Community Resource Boards [9]. Consequently, commu-
nities are only able to derive legal benefits from wildlife via trophy
hunting in GMAs and through employment in national parks and
GMAs.
The Wildlife Act fails to recognize communities as the rightful
owners of the land or wildlife in GMAs (in contradiction to the
Lands Act of 1995, [33]). There are no mechanisms for specific
communities to obtain exclusive rights over land in GMAs or over
the wildlife resources therein. Consequently, mechanisms to
prevent in-migration of external communities into GMAs are
weak. Immigration is likely fuelled by the availability of bushmeat,
firewood and other natural resources, and in some cases, due to
potential employment opportunities from tourism in adjacent
national parks. Clearing of lands for settlement and shifting
agriculture and tree-cutting for charcoal production all contribute
to habitat loss in GMAs [9,15]. Uncontrolled immigration means
that land use planning is difficult to enforce [6] and creates an
open-access system whereby it pays communities to occupy land or
kill wildlife before someone else does.
ZAWA collects revenues from trophy hunting and remits 20%
of the concession fees to communities and 50% of animal license
fees for wildlife shot as trophies in GMA [8]. ZAWA thus retains
most of the income from hunting in GMAs even though the land is
under customary tenure and belongs to the community. Wildlife-
based land uses are effectively heavily taxed, whereas livestock
production, small-scale agriculture and others are not (Table 3).
Furthermore, income from wildlife is often paid late and as hand-
outs that do not create a clear link between conservation and
earnings [9,30]. Earnings for communities from trophy hunting
are lower than estimated earnings from illegal bushmeat hunting
and create weak incentives for conservation [34].
Communities living in GMAs are also marginalized from the
decision-making relating to wildlife management. The concession
agreements that are signed between ZAWA, hunting operators
and Community Resource Boards on the leasing of GMAs favour
ZAWA. ZAWA retain most of the income, delegate numerous
responsibilities to other stakeholders, allocate minimal rights, are
able to dismiss Community Resource Boards or to cancel the
leases of hunting operators, and are not obliged to make their
financial records available [11]. There is widespread resentment
towards ZAWA, hunting and tourism operators (anon survey
respondent, pers. comm.).
The make-up and functioning of Community Resource Boards
is also problematic. More affluent community members benefit
disproportionately from trophy hunting [30]. There is a lack of
appropriately educated or skilled community members to form
Community Resource Boards, which limits their ability to
negotiate effectively with ZAWA or operators [9]. Skills shortages
are exacerbated by the fact that the Community Resource Boards
are re-formed each 2–3 years [35]. Furthermore, local chiefs can
dismiss board members and ‘village scouts’ (community members
employed by the community resource boards for anti-poaching) at
their discretion, making Community Resource Boards unstable.
There are frequent financial irregularities associated with CRB
income from wildlife and funding allocated to resource protection
is inadequate [9]. The 850 village scouts employed throughout
Zambia are poorly and irregularly paid, insufficiently trained or
equipped and are too few in number to effectively patrol the vast
GMA estate [11].
2. ZAWA-related issues. When ZAWA was formed in 2000,
a key objective was to increase efficiency and financial self-
sufficiency [35]. ZAWA was meant to retain government support,
but in practise funding was reduced to just 15% of operational
budget. Including the ,USD4.6 million generated from trophy
hunting, ZAWA’s resources equate to USD20–60/km2/year,
which compares poorly with the USD358–USD455/km2 required
to manage protected areas effectively [36] ZAWA has a field staff
complement of 1,179 to protect 231,000 km2, which equates to 1/
196 km2 and compares poorly with the southern African regional
Table 3. Gross earnings in USD from trophy hunting and non-resident hunting in Game Management Areas in 2012 (excludingland under 99 year lease within or near to GMAs) (NB that operators’ net earnings are markedly lower than the gross income, dueto the costs associated with paying concession and animal license fees to ZAWA, the costs of running and marketing safaris, andthe costs of managing the concessions).
Total Operators* ZAWA*CommunityResource Boards* Chiefs*
Trophy hunting
Concession fees N/A N/A 580,572 108,857 36,286
Animal license fees N/A N/A 1,697,878 1,528,090 169,788
Operators license fees N/A N/A 80,500 0 0
PH license fees N/A N/A 65,621 0 0
Daily rates N/A 11,655,430 N/A N/A N/A
Trophy fees N/A 4,506,987 N/A N/A N/A
Sub total 16,162,417 16,162,417 2,424,571 1,636,947 206,074
Resident hunting
Total earnings 88,932 N/A 44,489 40,040 4,449
Non resident hunting earnings/km2 0.6 N/A 0.3 0.3 0.0
Total earnings 16,251,349 16,162,417 2,469,060 1,676,988 210,522
Total earnings/km2 97 N/A 14.8 10.0 1.3
*NB Operators were assumed to generate the total gross income from trophy hunting, from which the ZAWA and community income is derived. This income excludesthat generated from extensive game ranches, which are on 99 year lease.doi:10.1371/journal.pone.0094109.t003
Under-Performance of Zambian Protected Areas
PLOS ONE | www.plosone.org 7 May 2014 | Volume 9 | Issue 5 | e94109
average of 1/40 km2 [1]. As little as 8% of the ZAWA budget is
spent on GMAs even though they generate .50% of ZAWA
earnings and comprise .70% of land under their jurisdiction [7].
Furthermore, ZAWA is encumbered by large numbers of sick and
poorly trained staff, and an increasing proportion of ZAWA funds
have been accruing to head office (anonymous survey respondent
pers. comm.). Consequently, field capacity is low when the threat
to wildlife from the bushmeat trade and is unprecedented and that
from ivory poachers resurgent [2,37]. Funding shortages mean
that ZAWA’s mandate of protecting the vast wildlife estate is
impossible to achieve.
To rectify this situation, ZAWA have allocated partial
responsibility for resource protection to Community Resource
Boards and hunting operators with the effect that roles are blurred
and none of the stakeholders contribute sufficiently. This is despite
the fact that responsibility for anti-poaching falls on ZAWA
according to the Wildlife Act [11]. Technical support to
Community Resource Boards from ZAWA is inadequate and
communication between Community Resource Boards and
ZAWA is limited [9].
Forced to generate their own funding, ZAWA rely on safari
hunting in GMAs for ,45–67% of their revenue [11,35]. This
reliance means that ZAWA are sometimes forced to make
decisions to achieve financial survival at the expense of the wildlife
they are mandated to conserve. For example, in 2003, ZAWA
increased quotas and reduced the size of hunting blocks [7]. In
addition, ZAWA have imposed high ‘fixed-quotas’ (of 60–100%)
whereby operators are forced to pay for animal license fees before
commencement of hunting [7,11]. Such quotas create a perverse
incentive, forcing operators to harvest wildlife regardless of
sustainability. Due to lack of funds, there is a lack of monitoring
of wildlife populations or of trophies. Trophy quotas are
established arbitrarily, quota utilization is low (averaging 40%)
and prior to the ban trophy quality was falling, implying that
quotas were not sustainable [7]. Quotas of lions have been
particularly excessive [38,39].
The requirement for ZAWA to generate their funds means that
it is not in their best interests to devolve user-rights over wildlife to
communities in GMAs or to private landowners on extensive
wildlife ranches (who are forced to pay license fees for animals
hunted to ZAWA), as that would reduce income in the short-term
and create perceived competition [19]. A similar conflict arose
when the Zimbabwe Parks and Wildlife Management Authority
became a parastatal responsible for generating their own revenue
[40]. In Zimbabwe, that shift resulted in a gradual shift towards
centralized authority over wildlife and gradual reversal of the
devolution that made the wildlife ranching industry in that country
such a success [40].
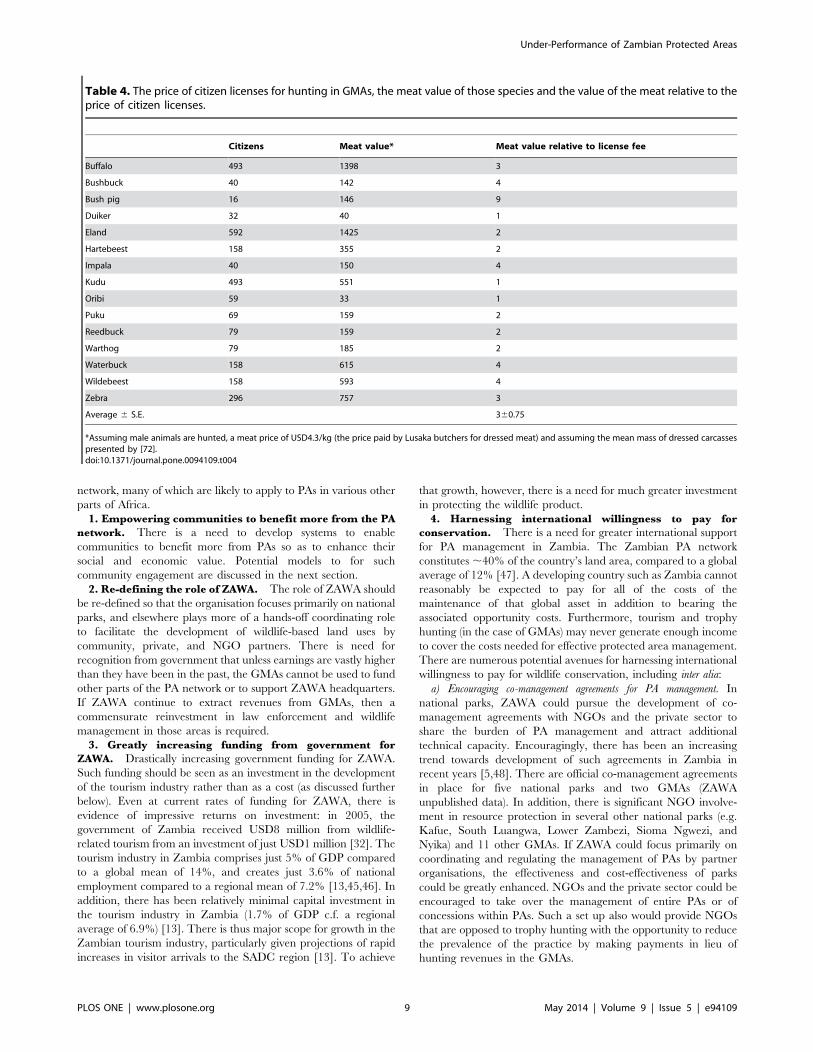
Wildlife in GMAs is affected by several other forms of legal
harvest including resident hunting conducted by Zambian citizens
and residents. Resident hunting licenses cost ,1/3 the meat value
of the animals hunted, and consequently resident hunters often
shoot wildlife specifically to obtain meat to sell, and in many cases,
quotas are exceeded (Table 4). Such abuses are made possible by
inadequate supervision of resident hunts and corruption. Prior to
the hunting ban, a varying amount of wildlife was also killed under
‘special licenses’ allocated on a discretionary basis by the Minister
of Tourism and Arts [35]. Special licenses and non-resident
hunting licenses strip the value of wildlife and create minimal
incentives for conservation by communities. The multiple forms of
legal off-take compound the effects of habitat loss, predation and
poaching and confer heavy depletion of wildlife in most GMAs
(Figure 3b).
3. Operator-related issues. In national parks, tourism
operators are not required to conduct anti-poaching and input is
generally limited to sporadic provision of support for NGOs
involved in resource protection [41]). In GMAs, the concession
allocation system created disincentives for investment and good
practice by hunting operators. Leases are granted for 10 years (or
15 for depleted blocks), which is not sufficient to encourage
adequate investment in the area or to a sense of ownership of the
areas [42]. Where wildlife populations are depressed, 15 years
does not allow for sufficient time for operators to recoup the
investments needed to allow wildlife populations to recover [43].
The hunting concession agreements (which outline commit-
ments to anti-poaching and community outreach) are not
effectively enforced [9]. Furthermore, operators typically vacate
the hunting blocks during the rainy season, leaving their areas
vulnerable to poachers. Some of the hunting blocks in GMAs are
extremely large, and several operators complained that their size
renders effective enforcement impossible. Some operators appear
to invest a significant amount in anti-poaching and others virtually
nothing. However, there is no system to link past performance of
hunting operators to the prospects of them obtaining an extension
of a lease or a new area. Consequently, responsible operators are
not adequately rewarded, and unscrupulous operators not
adequately punished, reducing incentives for good practice and
allowing abuses (including alleged over-shooting of quotas by some
operators) to continue [44]. In general, declining wildlife
populations have resulted in falling incomes [7] and thus declining
resources available protect the resource.
In early 2013, ZAWA imposed a moratorium on hunting in
GMAs in response to alleged corruption in the tender process and
due to concern over wildlife population trends. Consequently,
hunting operators have vacated the GMAs, resulting in loss of
their contribution to anti-poaching and creating a vacuum in
which illegal activities are more likely to proceed unhindered.
Evidence from Kafue National Park suggests that the simple
presence of operators has a significant deterrent effect for poachers
[41]. Furthermore, there have been extended periods in 2013
when village scouts went without pay, and many likely relied on
poaching for income (Anon survey respondent, pers. comm.).
While government has subsequently stepped in to pay the salaries
of village scouts, it is not clear as to how such payments will be
sustained in the absence of hunting income. There have been few
proposals from the photo-tourism industry to take over GMAs in
the wake of the hunting ban. The hunting moratorium is thus
likely to fuel wildlife declines by reducing: anti-poaching effort and
presence in GMAs; working capital for ZAWA; and incentives for
conservation by communities.
4. Other factors. There are multiple authorities in GMAs
with jurisdiction over the management of different resources [35].
In addition, conflicting legislation precludes effective land use
planning. For example, the wildlife act states that ZAWA is
responsible for wildlife resources in the area, and by implication
habitat, whereas the Local Government Act says that local
councils are responsible for planning and development [35].
Consequently development-related decisions are sometimes made
in GMAs with little consideration of their impacts on wildlife or
the potential for wildlife-based land uses. Furthermore, chiefs are
able to allocate land to private investors in the middle of GMAs
without consulting Community Resource Boards [9].
Changes Needed to Improve the Functioning of theProtected Area NetworkIn this section we outline a number of key steps that we consider
to be necessary to improve the functioning of the Zambian PA
Under-Performance of Zambian Protected Areas
PLOS ONE | www.plosone.org 8 May 2014 | Volume 9 | Issue 5 | e94109
network, many of which are likely to apply to PAs in various other
parts of Africa.
1. Empowering communities to benefit more from the PA
network. There is a need to develop systems to enable
communities to benefit more from PAs so as to enhance their
social and economic value. Potential models to for such
community engagement are discussed in the next section.
2. Re-defining the role of ZAWA. The role of ZAWA should
be re-defined so that the organisation focuses primarily on national
parks, and elsewhere plays more of a hands-off coordinating role
to facilitate the development of wildlife-based land uses by
community, private, and NGO partners. There is need for
recognition from government that unless earnings are vastly higher
than they have been in the past, the GMAs cannot be used to fund
other parts of the PA network or to support ZAWA headquarters.
If ZAWA continue to extract revenues from GMAs, then a
commensurate reinvestment in law enforcement and wildlife
management in those areas is required.
3. Greatly increasing funding from government for
ZAWA. Drastically increasing government funding for ZAWA.
Such funding should be seen as an investment in the development
of the tourism industry rather than as a cost (as discussed further
below). Even at current rates of funding for ZAWA, there is
evidence of impressive returns on investment: in 2005, the
government of Zambia received USD8 million from wildlife-
related tourism from an investment of just USD1 million [32]. The
tourism industry in Zambia comprises just 5% of GDP compared
to a global mean of 14%, and creates just 3.6% of national
employment compared to a regional mean of 7.2% [13,45,46]. In
addition, there has been relatively minimal capital investment in
the tourism industry in Zambia (1.7% of GDP c.f. a regional
average of 6.9%) [13]. There is thus major scope for growth in the
Zambian tourism industry, particularly given projections of rapid
increases in visitor arrivals to the SADC region [13]. To achieve
that growth, however, there is a need for much greater investment
in protecting the wildlife product.
4. Harnessing international willingness to pay for
conservation. There is a need for greater international support
for PA management in Zambia. The Zambian PA network
constitutes ,40% of the country’s land area, compared to a global
average of 12% [47]. A developing country such as Zambia cannot
reasonably be expected to pay for all of the costs of the
maintenance of that global asset in addition to bearing the
associated opportunity costs. Furthermore, tourism and trophy
hunting (in the case of GMAs) may never generate enough income
to cover the costs needed for effective protected area management.
There are numerous potential avenues for harnessing international
willingness to pay for wildlife conservation, including inter alia:
a) Encouraging co-management agreements for PA management. In
national parks, ZAWA could pursue the development of co-
management agreements with NGOs and the private sector to
share the burden of PA management and attract additional
technical capacity. Encouragingly, there has been an increasing
trend towards development of such agreements in Zambia in
recent years [5,48]. There are official co-management agreements
in place for five national parks and two GMAs (ZAWA
unpublished data). In addition, there is significant NGO involve-
ment in resource protection in several other national parks (e.g.
Kafue, South Luangwa, Lower Zambezi, Sioma Ngwezi, and
Nyika) and 11 other GMAs. If ZAWA could focus primarily on
coordinating and regulating the management of PAs by partner
organisations, the effectiveness and cost-effectiveness of parks
could be greatly enhanced. NGOs and the private sector could be
encouraged to take over the management of entire PAs or of
concessions within PAs. Such a set up also would provide NGOs
that are opposed to trophy hunting with the opportunity to reduce
the prevalence of the practice by making payments in lieu of
hunting revenues in the GMAs.
Table 4. The price of citizen licenses for hunting in GMAs, the meat value of those species and the value of the meat relative to theprice of citizen licenses.
Citizens Meat value* Meat value relative to license fee
Buffalo 493 1398 3
Bushbuck 40 142 4
Bush pig 16 146 9
Duiker 32 40 1
Eland 592 1425 2
Hartebeest 158 355 2
Impala 40 150 4
Kudu 493 551 1
Oribi 59 33 1
Puku 69 159 2
Reedbuck 79 159 2
Warthog 79 185 2
Waterbuck 158 615 4
Wildebeest 158 593 4
Zebra 296 757 3
Average 6 S.E. 360.75
*Assuming male animals are hunted, a meat price of USD4.3/kg (the price paid by Lusaka butchers for dressed meat) and assuming the mean mass of dressed carcassespresented by [72].doi:10.1371/journal.pone.0094109.t004
Under-Performance of Zambian Protected Areas
PLOS ONE | www.plosone.org 9 May 2014 | Volume 9 | Issue 5 | e94109
b) Attracting funding for the development of a national CBNRM
programme. In addition to funding ZAWA and the PA network,
there is a need for funding to allow for a national community-
based natural resource management (CBNRM) programme to
facilitate the capture of a greater proportion of benefits from the
PA network by communities. Such funding could build on the
progress made by the Administrative Management Design for
Game Management Areas (ADMADE) during the 1990s. The
successes of the Namibian community conservancy programme
and the Zimbabwean CAMPFIRE programme have been
dependent on long-term and substantial injections of technical
capacity and funding (USD173 million and USD35 million
respectively) ([49], C. Weaver pers. comm.). Likewise, the
community conservancies in the northern Kenyan rangelands
are supported by a coordinating NGO with funding of ,USD1.2
million annually [50]. A similarly well funded, supported and
coordinated national CBNRM programme is needed in Zambia.
c) Encouraging allocation of a greater portion of overseas development aid
towards PAs. There is a strong case for donors to direct a portion of
international development aid towards PA management, capital-
izing ZAWA and/or co-management agreements between ZAWA
and NGOs, and/or developing a national CBNRM programme.
Recent estimates suggest that for every 1% increase in tourism-
related investment in the SADC region, a 0.3% increase in GDP
per capita accrues [13]. An allocation of just 2–3% of the ,USD1
billion of overseas development aid that Zambia receives annually
[51] would cover the costs of managing the national parks
effectively and of protecting the main tourism asset [32]. However,
there is a need for checks and balances to ensure efficient use of
donor funds by ZAWA.
A potentially cost-effective way of using donor funds to achieve
both conservation and development objectives (ideally in the
context of a coordinated national CBNRM programme) is through
schemes that channel payments to communities living in or near
PAs for the provision of ecosystem services. For example,
communities could be paid an annual fee for desisting from
converting habitat or for protecting wildlife from poaching. In the
Maasai steppe in Tanzania for example, such an approach has
achieved notable conservation gains for a cost of just USD48/km2
[52], which compares favourably with the costs of traditional PA
management. A key potential value of PES approaches is that they
can help correct ‘market failures’ whereby wildlife that is valuable
to the nation as a whole is not valuable to the people living with it,
who thus over-exploit the resource or invest little in protecting it
[50]. PES approaches could be combined with efforts to provide
communities with stable markets and fair prices for livestock and
crops, as is being conducted in the Kenyan community
conservancies, and as part of the community markets for
conservation approach in parts of Zambia [50,53]. However, the
latter approaches are only likely to be successful if combined with
efforts to actively protect wildlife populations via anti-poaching.
d) Other options. Capturing the willingness of international
philanthropists to pay for conservation represents another
potential means of funding PAs [54]. Several precedents for such
investment exist, such as that provided in Gorongosa National
Park in Mozambique and the Grumeti Game Reserve in
Tanzania. Additionally, attracting carbon-related investment via
projects such as REDD+ could potentially generate funds for the
protection of woodlands and associated biodiversity, notwithstand-
ing the constraints currently associated with that programme [55].
Further, government could potentially generate additional revenue
by taxing stakeholders who benefit substantively from ecological
services provided by PAs, such as commercial farmers and power-
generating or mining companies.
5. Attracting significant private investment. To develop
tourism and hunting businesses in national parks and GMAs, and
to protect and manage wildlife in GMAs (assuming that ZAWA
focuses their efforts on national parks) would require substantial
private and/or donor investment. Rehabilitating a single depleted
GMA is predicted to cost millions of dollars and such investments
would likely take many years to recoup [43]. Attracting such
investment is most likely under the following circumstances: an
enabling policy environment; simple safe and standardized
processes for investing; long leases (of at least 40 years for depleted
areas [43]); attractive terms (e.g. as would be conferred if ZAWA
desisted from taxing wildlife-based land uses in GMAs); minimal
red-tape or interference from ZAWA, a functioning national
programme for the development of community wildlife conser-
vancies (see below) and knowledge that communities are
supportive of wildlife investments on their land. In GMAs,
investors and community partners should be able to choose any
forms of wildlife-based land uses and the combinations that will
yield the best returns for their particular spatial setting.
Consequently, hunting bans or bans on the hunting of high-value
species are to be avoided so long as hunting can be managed in a
manner that ensures sustainability [12]. Finally, resident hunting
should not be allowed to undermine private investments in GMAs
and should only be permitted if desired by the community and
investor partners and if priced appropriately.
6. Addressing key conservation threats decisively. For
the PA networks to function better, there is a need to decisively
address key threats such as human encroachment, bushmeat and
other forms of poaching. Human encroachment could be
addressed through linking the allocation of leases to communities
with agreed land use plans (see below). Alternatively, portions of
GMAs close to national parks could be re-gazetted as ‘buffer-
zones’ where human settlement is not permitted (though the leases
for such areas could still be leased to communities to enable them
to benefit from legal wildlife-based land uses, see below). In such
instances and at the edge of community conservancies (see below),
fencing external boundaries (if supported by communities) may
play a significant role in reducing edge-effects, reducing human-
wildlife conflict, demarcating boundaries and helping to prevent
further encroachment [58,59]. Where human settlement has
reached right up to the boundaries of national parks, the fencing of
such sections may be justified if appropriate materials are used and
if adequate funding for maintenance exists.
Addressing poaching requires elevated opportunities for com-
munities to benefit legally from wildlife, stiffer legal frameworks
relating to poaching (with penalties that reflect the value of wildlife
and the threat posed by poachers to the life of PA staff) and
improved anti-poaching are required [2]. To achieve professional,
well-funded anti-poaching requires either a much greater invest-
ment from ZAWA, and/or significant investments from the
private and/or NGO sector.
7. Prioritising conservation efforts. Zambia’s PA network
is vast and funding limited. Furthermore, some of the GMAs are
probably damaged beyond repair due to heavy human settlement
and habitat modification. Given these factors plus the high human
population growth rates, conserving the entire PA network in the
long term is unlikely. There is a case for a scientific priority setting
exercise to identify the PAs that should be the priority for
investment of available funding.
Potential Models for Achieving Elevated CommunityParticipation in the PA NetworkThe degree of involvement of communities in national parks
versus GMAs should arguably differ as people reside the latter but
Under-Performance of Zambian Protected Areas
PLOS ONE | www.plosone.org 10 May 2014 | Volume 9 | Issue 5 | e94109
generally not the former. For national parks, one option would be
to allocate ownership of PAs, shareholdings of PAs, or tourism
concessions within parks to neighbouring communities for them to
lease out to tourism operators. Precedents for such arrangements
have been established in South Africa, for example, through the
creation of contractual parks [56]. Such changes would require
clear definition on who comprises ‘the community’ as at present,
membership is poorly defined, compromising effective plan
implementations and revenue sharing.
In the GMAs, we recommend changes that empower commu-
nities and enable them to participate in and benefit from wildlife-
based land uses through the formation of Community Wildlife
Conservancies (CWCs). Precedents for such conservancies have
been developed in both Namibia and the northern rangelands of
Kenya, both of which have achieved significant conservation and
livelihood gains [50,57]. While there are many potential variants
of such models that could applied to the GMAs, there are a few
general principles that we believe should be adhered to: a)
communities should be allocated the maximum permissible degree
of ownership over land and wildlife; b) that ownership should be
structured such that it is exclusive for specific communities to
avoid perpetuation of the tragedy of the commons; c) communities
should accrue benefits from wildlife directly, and not via
remittances from ZAWA; d) communities must actively participate
in wildlife management decisions and not be passive recipients of
hand-outs; e) community structures that are used to administer
finances relating to wildlife must be democratic, transparent and
regularly audited to ensure equitable distribution of benefits and
avoid elite capture, and f) there must be mechanisms to ensure
funding for high-quality anti-poaching security given the level of
threat in GMAs. Two examples of potential models for the
establishment and functioning of CWCs in GMAs are as follows:
1. Complete devolution model. Here CWCs in the GMAs
would be established as community conservancies based on joint
ventures between communities and the private sector. ZAWA
would not extract income from the CWC and would play a purely
regulatory, facilitating and over-seeing role. ZAWA currently earn
nothing from half of the GMAs as it is and so in such areas this
kind of arrangement would not cause loss of revenue for ZAWA.
The community would create a democratic, accountable and
transparent body or trust to administer the area as a conservancy.
A long lease would then be allocated by government to that
community conservancy trust, the validity of which should be
contingent on a land use plan that ensures that a particular area is
set aside for wildlife only. Communities would then sub-lease the
land to or engage in business partnerships with private or NGO
investors, ideally for long periods to attract significant investment.
That leasing process could follow either a public auction or an
open tender process. The communities and successful bidding
investors would then form a second body or trust with the mandate
of managing wildlife in the GMA, ensuring professional anti-
poaching and effective communication and cooperation between
the community and investors. Alternatively, the investors could
gain representation on the community conservancy trust after
signing a partnership agreement, and then that body would
coordinate wildlife management. Investors would then pay: a) an
annual land rental to communities (which means they would
derive some income without waiting years for wildlife populations
to recover); b) an annual resource use fee (e.g. bed night levies or
licence fees for animals hunted) (which means that communities
would receive income proportional to their conservation ‘perfor-
mance’); and, c) an annual levy to capitalize the body with the
responsibility for managing wildlife. Investors could generate
income either by acting as their own hunting or tourism operators,
by auctioning hunting packages to the highest bidding operator, or
sub-leasing tourism concessions.
2. Partial devolution model. In this model, GMAs would be
administered as community conservancies based on tripartite
public-private-community-partnerships involving communities,
ZAWA and private investors. As in the previous model, the
communities would form a body that obtains a lease for the land,
and would sub-lease the land to investors (or engage in a long term
business partnership). A largely independent not-for-profit body
would be established with representation from ZAWA, investors/
participating NGOs and communities with the mandate of
managing the wildlife in the area. The fees that have traditionally
been paid to ZAWA by operators would be paid into that not-for-
profit body to ensure that they are reinvested in the area.
Re-designating GMAs as CWCs would confer multiple benefits:
CWCs would secure land rights for communities and protect
against the loss of land and natural resources that would arise from
the current open access system; CWCs could provide an effective
buffer role for national parks; communities would generate
significant and sustainable incomes, meat supplies and employ-
ment; if wildlife populations were successfully rehabilitated, CWCs
could generate economic outputs at least 20x greater than
currently being earned in GMAs [43]; CWCs would attract
external investment by a wide-spectrum of donors; CWCs would
create scope for communities to sell carbon and biodiversity credits
by securing land rights [15]; and ZAWA would be relieved of the
burden and costs of protecting wildlife in GMAs.
Legislative Changes Needed to Allow CWCs to HappenOwnership of wildlife in Zambia is vested in the President on
behalf of the country [19]. On private land, user-rights over
wildlife can be conferred to landowners via certificates of
ownership, but there is no such provision for communities.
Similarly, there is scope for investors, but not communities, to
alienate land [9]. New legislation is required to enable commu-
nities to obtain 99-year leases for their land in GMAs following
formation of a CWC, and to enable them to obtain full-user rights
over wildlife.
At present, fencing is a pre-requisite for obtaining ownership
over wildlife on wildlife ranches in Zambia [19]. In some contexts,
as discussed, fencing can confer clear benefits [58,59]. However,
fencing can also reduce ecological connectivity and provide
massive supplies of snare-material if inappropriate wires are used
[58,60]. Fencing should not be a pre-requisite for communities to
obtain user-rights over wildlife and should not be permitted
between adjacent CWCs or between CWCs and national parks. If
needed, fencing should also be composed of kinked wire mesh to
prevent snare construction, and should be accompanied by an
environmental impact assessment and a clear long-term mainte-
nance plan and budget.
ConclusionsWildlife populations are faring poorly in many African
protected areas [61] and many of the challenges and solutions
highlighted in this paper occur in other African countries. The
under-funding of protected area networks is a widespread problem
and parks agencies are often required to generate their own
income, which creates the kinds of conflicts of interest outlined in
this paper. There is a need for vastly elevated funding for PA
management from both African and international governments
and institutions. There is the need for improved mechanisms to
enable communities to participate in and benefit more from
wildlife in many African countries. In addition, creating frame-
works for safe and secure private and NGO investment in PA
Under-Performance of Zambian Protected Areas
PLOS ONE | www.plosone.org 11 May 2014 | Volume 9 | Issue 5 | e94109
management is an intervention with widespread applicability.
Strong measures to address unplanned human encroachment in
PA networks are also needed in many areas, as are efforts to tackle
high levels of ivory and bushmeat poaching. The net result of these
interventions is likely to be significant improvements in the
effectiveness of parks networks, substantial job creation and
economic gains due to growth in tourism industries. In the
absence of such changes, wildlife populations in protected areas in
Zambia and many other countries are likely to continue to wane
due to on-going poaching and human encroachment.
Methods
Insights into the Performance of Protected AreasWe provided insights into the performance of PAs using: a) a
literature review; b) data obtained from ZAWA and other sources;
c) and, semi-structured interviews with key stakeholders, including
the highest-ranking ZAWA officials (n = 7); representatives from
relevant NGOs (n= 14); wildlife industry experts/photo-tourism
operators (n = 11); and trophy hunting operators (n = 13). The
literature review was conducted using key words such as ‘Zambia’,
‘GMAs’, ‘wildlife policy’, ‘CBNRM’, ‘ADMADE’, ‘trophy hunt-
ing’, ‘wildlife ranching’, ‘co-management’, ‘bushmeat’, ‘and
encroachment’, etc. We included both published papers and
unpublished consultancy reports. We searched for references using
Google and Google Scholar. Selection of survey respondents was
conducted by contacting and meeting as many individuals from
each group that we could during our fieldwork period (Septem-
ber–November, 2012). Refusal rate was zero.
1. Ecological performance of protected areas. We
assessed ecological performance of protected areas by looking at
the degree of human encroachment and the size and diversity of
wildlife populations. Data on human encroachment were obtained
from [6]. The 2010 Zambian census was used to obtain district-
level estimates of human population growth rates [16].
Data on wildlife abundance in protected areas were derived
from aerial census reports [17,24,25,62–67]. The most recent
reports were used, though some abundance estimates were made
using census reports as old as 2003, and for some PAs no census
data were available at all. Census data were available for 39
Zambian PAs (14 National Parks comprising 61,812 km2 and 25
GMAs comprising 152,122 km2) (or ,93% of the national park
and GMA estate). Estimates of mammalian biomass were made by
removing species of bushbuck Tragelaphus scriptus size or smaller,
hippopotamuses Hippopotamus amphibius and predators as most
reports did not provide estimates for those species. The typical
mass of an individual in a population for each species following
[68] was multiplied by population sizes to estimate biomass.
We used rainfall, soil nutrient status and large herbivore
biomass for 28 wildlife areas in eastern and southern Africa [69] to
create five regression curves for predicting herbivore biomass for:
1) medium soil nutrient areas for moist-adapted species; 2)
medium soil nutrient areas for arid-adapted species; 3) low soil
nutrient areas for moist-adapted species; 4) low soil nutrient areas
for arid-adapted species with annual rainfall ,700 mm; 5) low soil
nutrient areas for arid-adapted species with annual rainfall .
700 mm. In each case, herbivore biomass was plotted against
rainfall using the software programme GraphPad Prism. These
five regression curves were then used to predict potential herbivore
standing crop biomasses (kg/km2) for protected areas in which
annual rainfall and soil nutrient data were available. Estimates for
annual rainfall were determined from literature and internet
sources, while soil nutrient status was determined using a
combination of two sources: 1) soil maps [70] and 2) vegetation
types identified from the literature and vegetation maps [71].
In protected areas where there was more than one soil or
vegetation type, we estimated the proportion of each type within
the area, and used these to calculate an average soil nutrient status.
In many cases, the soil nutrient status estimated from soil and
vegetation types corresponded well, but in cases when they
differed, the lower estimate was selected for the sake of
conservatism.
2. Economic performance of protected areas. Data on
earnings from photo-tourism in national parks, and from trophy
and resident hunting in GMAs were obtained from ZAWA to
assess economic performance of protected areas. Earnings of safari
operators in GMAs were estimated using trophy off-takes for 2012
obtained from ZAWA, following [28] and using the mean 2013
pricing for Zambian trophy hunts (from a survey of n=10
websites). Current per km2 earnings from trophy hunting in
Zambia were compared with regional estimates derived from [28].
Further insights into the performance of the hunting and tourism
industries were obtained from the literature.
3. Social performance. Insights into the social performance
of protected areas were obtained from the literature and through
surveys. Comprehensive community surveys in GMAs have been
completed by other authors recently (e.g. [8,9,30] and their
findings provided insights into community-related issues.
Ethics StatementThe University of Pretoria Ethics Committee approved this
research, and approved the procedure for obtaining consent for
the surveys conducted during the research. We were issued with
written consent for this study from the Wildlife Producers’
Association of Zambia. In addition Zambia Wildlife Authority
provided verbal approval and participated in the research. From
respondents we obtained verbal consent prior to conducting the
surveys. Written consent from individual respondents was not
considered practical or necessary and the requirement for written
consent was waived by the University of Pretoria. We documented
any cases where respondents did not wish to participate in order to
calculate refusal rates.
Supporting Information
Figure S1 The (a) biomass and (b) diversity of wildungulates (excluding species of bushbuck size andsmaller and hippos, for which data were unavailablefor state protected areas) in GMAs, national parks andextensive (unfenced) private game ranches [19].
(TIFF)
Figure S2 The (a) biomass and (b) diversity of wildungulates (excluding species of bushbuck size andsmaller and hippos, for which data were unavailablefor state protected areas) in protected areas andextensive game ranches with and without NGO orprivate investment in law enforcement.
(TIFF)
Acknowledgments
Thanks to ZAWA for permission to conduct the study, for participating in
surveys and for provision of information, thanks to the Wildlife Producers
Association of Zambia, Don Stacey and to the ranchers and other
respondents.
Under-Performance of Zambian Protected Areas
PLOS ONE | www.plosone.org 12 May 2014 | Volume 9 | Issue 5 | e94109
Author Contributions
Conceived and designed the experiments: PL WAT VN JB MT CT.
Performed the experiments: PL WAT VN JB MT CT. Analyzed the data:
PL WAT VN JB MT MB RM FW CT. Contributed reagents/materials/
analysis tools: PL WAT VN JB MTMB RM FW CT. Wrote the paper: PL
WAT VN JB MT MB RM FW CT.
References
1. Cumming D (2004) Performance of parks in a century of change. In: Child B,
editor. Parks in Transition: Biodiversity, Rural Development, and the BottomLine. UK: Earthscan.
2. Lindsey PA, Balme G, Becker M, Begg C, Bento C, et al. (2013) The bushmeattrade in African savannas: Impacts, drivers, and possible solutions. Biol Conserv
160: 80–96.
3. Caro TM, Pelkey N, Borner M, Campbell K, Woodworth B, et al. (1998)
Consequences of different forms of conservation for large mammals in Tanzania:Preliminary analyses. Afr J Ecol 36: 303–320.
4. Nelson F, Lindsey P, Balme G (2013) Trophy hunting and lion conservation: aquestion of governance? Oryx 47: 501–509.
5. Government of Zambia (2010) Reclassification and effective management of thenational protected areas system. Lusaka, Zambia: Ministry of Tourism,
Environment and Natural Resources.
6. Watson FGR, Becker MS, Nyirenda MA (In press) Human encroachment into
protected area networks in Zambia: Implications for large carnivore conserva-tion. Environmental Change.
7. Simasiku P, Simwanza H, Tembo G, Bandyopadhyay S, Pavy J (2008) Theimpact of wildlife management policies on communities and conservation in
game management areas in Zambia. Zambia: Natural Resources ConsultativeForum.
8. Fernandez A, Richardson RB, Tschirley DL, Tembo G (2010) Wildlifeconservation in Zambia: Impacts on rural household welfare. Michigan State
University: Food Security Collaborative Working Papers.
9. Chemonics International Inc (2011) Situational and livelihoods analysis study in
nine Game Management Areas, surrounding the Kafue National Park, Zambia.Washington DC, USA: Millenium Challenge Corporation.
10. Becker M, McRobb R, Watson F, Droge E, Kanyembo B, et al. (2013)Evaluating wire-snare poaching trends and the impacts of by-catch on elephants
and large carnivores. Biol Conserv 158: 26–36.
11. Manning I (2011) Wildlife conservation in Zambia and the Landsafe customary
commons. Natural Resources Journal 52: 195–214.
12. Lindsey P, Balme G, Funston P, Henschel P, Madzikanda H, et al. (2013) The
trophy hunting of African lions: Scale, current management practices and factorsundermining sustainability. Plos One 8(9): e73808.
13. Makochekanwa A (2013) An analysis of tourism contribution to economicgrowth in SADC countries. Botswana Journal of Economics 11(5): 42–56.
14. Pfeifer M, Burgess ND, Swetnam RD, Platts PJ, Willcock S, et al. (2012)Protected areas: Mixed success in conserving east Africa’s evergreen forests. Plos
One 7: e39337.
15. Vinya R, Syampungani S, Kasumu EC, Monde C, Kasubika R (2011)
Preliminary study on the drivers of deforestation and potential for REDD+ in
Zambia. Lusaka, Zambia: FAO/Zambian Ministry of Lands and NaturalResources.
16. Zambia Central Statistical Office (2011) 2010 census of population and housing:
Preliminary population figures. Lusaka, Zambia: Government of Zambia.
17. Simukonda C (2011) Wet season survey of the African elephant and other large
herbivores in selected areas of the Luangwa Valley. Chilanga, Zambia: Zambia
Wildlife Authority.
18. Poulsen JR, Clark CJ, Mavah G, Elkan PW (2009) Bushmeat supply and
consumption in a tropical logging concession in northern Congo. Conserv Biol23: 1597–1608.
19. Lindsey P, Barnes J, Nyirenda V, Pumfrett B, Taylor A, et al. (2013) The
Zambian wildlife ranching industry: Scale, associated benefits, and limitations
affecting its development. Plos One 8(12): e81761.
20. Bond I (2009) CBNRM as a mechanism for addressing global environmental
challenges. In: Roe D, Nelson F, Sandbrook C, editors. Communitymanagement of natural resources in Africa: impacts, experiences and future
directions. London, UK.: International Institute for Environment andDevelopment. 95–104.
21. Owen-Smith N, Ogutu J (2003) Interactions between biotic components. In: DuToit J, Rogers K, Biggs H, editors. The Kruger experience: ecology and
management of savanna heterogeneity. Washington DC: Island Press. 310–331.
22. Whyte I, van Aarde R, Pimm S (2003) Kruger’s elephant population: Its size and
consequences for ecosystem heterogeneity. In: Du Toit J, Rogers K, Biggs H,editors. The Kruger experience: ecology and management of savanna
heterogeneity. Washington DC: Island Press. 332–348.
23. Lindsey PA, Roulet PA, Romanach SS (2007) Economic and conservation
significance of the trophy hunting industry in sub-Saharan Africa. Biol Conserv
134: 455–469.
24. Frederick H (2013) Aerial survey report: Luangwa valley, 2012. Chilanga,Zambia: Zambia Wildlife Authority.
25. ZAWA (2013) Liuwa Plain National Park aerial wildlife survey results 2013.Lusaka, Zambia: ZAWA.
26. ZAWA (2013) Kafue National Park general management plan. Chilanga,Zambia: Zambia Wildlife Authority.
27. Hamilton K, Tembo G, Sinyenga G, Bandyopadhyay S, Pope A, et al. (2007)
The real economic impact of nature tourism in Zambia. Lusaka, Zambia:Natural Resources Consultative Forum.
28. Lindsey P, Balme G, Booth V, Midlane N (2012) The significance of African
lions for the financial viability of trophy hunting and the maintenance of wild
land. Plos One : e29332.
29. Snyman SL (2012) The role of tourism employment in poverty reduction andcommunity perceptions of conservation and tourism in southern Africa. Journal
of Sustainable Tourism 20: 395–416.
30. Bandyopadhyay S, Tembo G (2010) Household consumption and natural
resource management around national parks in Zambia. Journal of NaturalResources Policy Research 2: 39–55.
31. Chomba C, Senzota R, Chabwela H, Mwitwa J, Nyirenda V (2012) Patterns ofhuman–wildlife conflicts in Zambia, causes, consequences and management
responses. Journal of Ecology and the Natural Environment 4: 303–313.
32. World Bank (2007) Economic and poverty impact of nature-based tourism.
Lusaka, Zambia: World Bank.
33. Manning I (2011) Wildlife conservation in Zambia and the landsafe customarycommons. Pretoria: University of Pretoria, PhD thesis.
34. Lindsey P, Taylor A, Nyirenda V, Barnes J (2014) Through severe impacts onwildlife populations and net negative economic and food security impacts,
bushmeat poaching is a market failure. Harare, Zimbabwe: FAO/Panthera/IUCN SULi/ZSL report.
35. Sichilongo M, Mulozi P, Mbewe B, Machala C, Pavy J (2013) Zambian wildlifesector policy: Impact analysis and recommendations for the future policy.
Lusaka, Zambia: Africa Technical Environment and Natural Resources Unit,World Bank.
36. Cumming DH (2008) Large scale conservation planning and priorities for theKavango-Zambezi Transfrontier Conservation Area. Unpublished report
commissioned by Conservation International.
37. Douglas-Hamilton I (2009) The current elephant poaching trend. Pachyderm45: 154–157.
38. Yamazaki K (1996) Social variation of lions in a male-depopulated area inZambia. The Journal of Wildlife Management 60: 490–497.
39. Becker M, Watson F, Droge E, Leigh K, Carlson R, et al. (2012) Estimating pastand future male loss in three Zambian lion populations. Journal of Wildlife
Management DOI:10.1002/jwmg.446.
40. Wels H (2003) Private wildlife conservation in Zimbabwe: Joint ventures and
reciprocity. Leiden, Netherlands: Brill.
41. Lindsey P, Midlane N, Sayer E, van der Westhuizen H (2013) Kafue NationalPark resource protection strategy review. New York: Panthera/Frankfurt
Zoological Society.
42. Lindsey P, Balme G, Funston P, Henschel P, Hunter L, et al. (2013) The trophy
hunting of African lions: Scale, current management practices and factorsundermining sustainability. Plos One 8(9): e73808.
43. Lindsey P, Nyirenda V, Barnes J, Becker M, Taylor A, et al. (2013) The reasonswhy Zambian Game management areas are not functioning as ecologically or
economically productive buffer zones and what needs to change for them tofulfill that role. Lusaka, Zambia: Wildlife Producers Association of Zambia.
44. Leader-Williams N, Baldus RD, Smith RJ (2009) The influence of corruption on
the conduct of recreational hunting. In: Dickson B, Hutton J, Adams W, editors.
Recreational Hunting, Conservation and Rural Livelihoods. Oxford, UK:Wiley-Blackwell. 296–316.
45. WTTC (2013) Economic impact of travel and tourism: Mid-year update,
October 2013. London, UK: World Travel and Tourism Council.
46. WTTC (2012) Travel and tourism, economic impact 2012 Zambia. London,
UK: World Travel and Tourism Council.
47. Secretariat of the Convention on Biological Diversity (2008) Protected areas in
today’s world: Their values and benefits for the welfare of the planet. Montreal,Canada: CBD.
48. Nyirenda VR, Nkhata BA (2013) Collaborative governance and benefit sharing
in Liuwa Plain National Park, western Zambia.
49. Taylor RD (2009) Community based natural resource management in
Zimbabwe: The experience of CAMPFIRE. Biodiversity and Conservation18(10): 2563–2583.
50. Pye-Smith C (2013) The story of the northern rangelands trust. Isiolo, Kenya:Northern Rangelands Trust.
51. OECD (2013) Development aid at a glance. Paris, France: Organisation forEconomic Co-operation and Development.
52. Ingram J, Wilkie D., Clements T, McNab R, Nelson F, et al. (In press) Evidence
of payments for ecosystem services as a mechanism for supporting biodiversityconservation and rural livelihoods. Ecosystem Services.
53. Lewis D, Bell SD, Fay J, Bothi KL, Gatere L, et al. (2011) Community marketsfor conservation (COMACO) links biodiversity conservation with sustainable
improvements in livelihoods and food production. Proceedings of the NationalAcademy of Sciences 108: 13957–13962.
Under-Performance of Zambian Protected Areas
PLOS ONE | www.plosone.org 13 May 2014 | Volume 9 | Issue 5 | e94109
54. Spierenburg M, Wels H (2010) Conservative philanthropists, royalty and
business elites in nature conservation in southern Africa. Antipode 42: 647–670.55. Phelps J, Webb EL, Koh LP (2011) Risky business: An uncertain future for
biodiversity conservation finance through REDD+. Conservation Letters 4: 88–
94.56. Reid H (2001) Contractual national parks and the Makuleke community. Hum
Ecol 29: 135–155.57. Jones B, Weaver C (2008) CBNRM in Namibia: Growth, trends, lessons and
constraints. In: Suich H, Child B, Spenceley A, editors. Evolution and
innovation in wildlife conservation in southern Africa. London, UK: Earthscan.223–242.
58. Lindsey PA, Masterson CL, Beck AL, Romanach S (2012) Ecological, social andfinancial issues related to fencing as a conservation tool in Africa. In: Somers MJ,
Hayward M, editors. Fencing for Conservation.: Springer New York. 215–234.59. Packer C, Canney S, Loveridge A, Garnett S, Zander K, et al. (2013) Effective
conservation of large carnivores. Ecological Letters 16: 635–641.
60. Lindsey PA, Romanach SS, Tambling CJ, Chartier K, Groom R (2011)Ecological and financial impacts of illegal bushmeat trade in Zimbabwe. Oryx
45: 96–111.61. Craigie ID, Baillie JEM, Balmford A, Carbone C, Collen B, et al. (2010) Large
mammal population declines in Africa’s protected areas. Biol Conserv 143:
2221–2228.62. Simwanza H (2004) Aerial survey of large herbivores in West Lunga National
Park, Chizera, Musele Matebo, Lukwakwa and Chibkwika Ntambo GameManagement Areas. Chilanga, Lusaka: Zambia Wildlife Authority.
63. Simwanza H (2004) Aerial survey to establish the status of large herbivores in the
Upper Luano hunting block. Chilanga, Lusaka: Zambia Wildlife Authority.
64. Simwanza H (2005) Aerial survey of large herbivores in the Zambezi heartland,
Zambia: October 2005. Kariba, Zimbabwe: African Wildlife Foundation.
65. Simukonda C (2008) A country-wide survey of large mammals in Zambia.
Chilanga, Zambia: Zambia Wildlife Authority.
66. Frederick H (2011) Aerial survey of Kafue ecosystem 2008. Lusaka, Zambia:
Zambia Wildlife Authority.
67. Viljoen P (2013) Liuwa plain national park and adjacent Game Management
Area, Zambia: Aerial wildlife survey April 2013. Johannesburg: African parks
network report.
68. Coe M, Cumming D, Phillipson J (1976) Biomass and production of large
African herbivores in relation to rainfall and primary production. Oecologia
22(4): 341–354.
69. East R (1984) Rainfall, soil nutrients status and biomass of large African
mammals. African Journal of Ecology 22: 245–270.
70. Jones A, Breuning-Madsen H, Brossard M, Dampha A, Deckers J, et al. (2013)
Soil atlas of Africa. Luxembourg: European Commission.
71. Wild H, Fernandes A (1967). Vegetation map of the Flora Zambesiaca area.
Salisbury, Rhodesia: Collins.
72. du P Bothma J, du Toit JG (2010) Game ranch management. Pretoria, South
Africa: Van Schaik.
Under-Performance of Zambian Protected Areas
PLOS ONE | www.plosone.org 14 May 2014 | Volume 9 | Issue 5 | e94109
Related Documents