Uncovering protein structure STOLLAR, Elliott J. and SMITH, David P. <http://orcid.org/0000-0001-5177- 8574> Available from Sheffield Hallam University Research Archive (SHURA) at: http://shura.shu.ac.uk/27401/ This document is the author deposited version. You are advised to consult the publisher's version if you wish to cite from it. Published version STOLLAR, Elliott J. and SMITH, David P. (2020). Uncovering protein structure. Essays Biochem, 64 (4), 649-680. Copyright and re-use policy See http://shura.shu.ac.uk/information.html Sheffield Hallam University Research Archive http://shura.shu.ac.uk

Welcome message from author
This document is posted to help you gain knowledge. Please leave a comment to let me know what you think about it! Share it to your friends and learn new things together.
Transcript
Uncovering protein structure
STOLLAR, Elliott J. and SMITH, David P. <http://orcid.org/0000-0001-5177-8574>
Available from Sheffield Hallam University Research Archive (SHURA) at:
http://shura.shu.ac.uk/27401/
This document is the author deposited version. You are advised to consult the publisher's version if you wish to cite from it.
Published version
STOLLAR, Elliott J. and SMITH, David P. (2020). Uncovering protein structure. Essays Biochem, 64 (4), 649-680.
Copyright and re-use policy
See http://shura.shu.ac.uk/information.html
Sheffield Hallam University Research Archivehttp://shura.shu.ac.uk
Essays in Biochemistry (2020) 64 649–680https://doi.org/10.1042/EBC20190042
Received: 21 April 2020Revised: 11 August 2020Accepted: 12 August 2020
Version of Record published:25 September 2020
Review Article
Uncovering protein structureElliott J Stollar1 and David P Smith2
1School of Life Sciences, University of Liverpool, Liverpool, United Kingdom; 2Department of Bioscience and Chemistry, Sheffield Hallam University, Sheffield, United Kingdom
Correspondence: Elliott Stollar ([email protected])
Structural biology is the study of the molecular arrangement and dynamics of biologicalmacromolecules, particularly proteins. The resulting structures are then used to help explainhow proteins function. This article gives the reader an insight into protein structure and theunderlying chemistry and physics that is used to uncover protein structure. We start withthe chemistry of amino acids and how they interact within, and between proteins, we alsoexplore the four levels of protein structure and how proteins fold into discrete domains.We consider the thermodynamics of protein folding and why proteins misfold. We look atprotein dynamics and how proteins can take on a range of conformations and states. In thesecond part of this review, we describe the variety of methods biochemists use to uncoverthe structure and properties of proteins that were described in the first part. Protein structuralbiology is a relatively new and exciting field that promises to provide atomic-level detail tomore and more of the molecules that are fundamental to life processes.
IntroductionProteins are one of the most important classes of molecules for life and underpin the field of biochemistry.To fully understand their role, it is essential to explore both their structure and function and this reviewfocuses on how we uncover protein structure. To understand structure, we explore the chemical nature ofamino acids which are the building blocks of proteins. We consider how interactions between amino acidshelp proteins fold and fluctuate as they adopt a variety of structures. Furthermore, to understand howwe experimentally study protein structure, we explore fundamental concepts in physics and associatedcomputational methods. This topic is truly interdisciplinary and in addition to biochemistry, spans thefields of biophysics, structural biology and computational biology.
We start by describing the four levels of protein structure and how a variety of protein domains and ar-chitectures exist. Proteins are biological molecules produced in living cells, and we must also consider howa long chain of amino acids that are produced from the ribosome can transition to a folded structure thatis central to the protein’s function. As such, we consider protein folding thermodynamics and also whathappens when proteins misfold inside a cell. We also explore other universal properties of proteins thatinclude their ability to change their shape known as conformational change. In particular, although pro-teins usually exist in one dominant conformation, we discuss how proteins actually exist in a population(ensemble) of rapidly interconverting conformations that allow them to be flexible and adapt their shapesrequired for function. We then discuss in detail the primary techniques used to study protein structureand dynamics that have provided these insights. Given the interdisciplinary nature of this topic, along theway, we have provided some stand-alone boxes to give more details about the fundamental science behindthese concepts.
Part 1: The structural properties of proteinsProteinsProteins are one of the four major molecules that direct life that includes nucleic acids (deoxyribonu-cleic acid (DNA), RNA), lipids (fats) and polysaccharides (sugars). All of these large ‘macromolecules’ are
© 2020 The Author(s). This is an open access article published by Portland Press Limited on behalf of the Biochemical Society and distributed under the Creative Commons AttributionLicense 4.0 (CC BY-NC-ND).
649
Dow
nloaded from http://portlandpress.com
/essaysbiochem/article-pdf/64/4/649/894595/ebc-2019-0042c.pdf by U
K user on 15 October 2020
Essays in Biochemistry (2020) 64 649–680https://doi.org/10.1042/EBC20190042
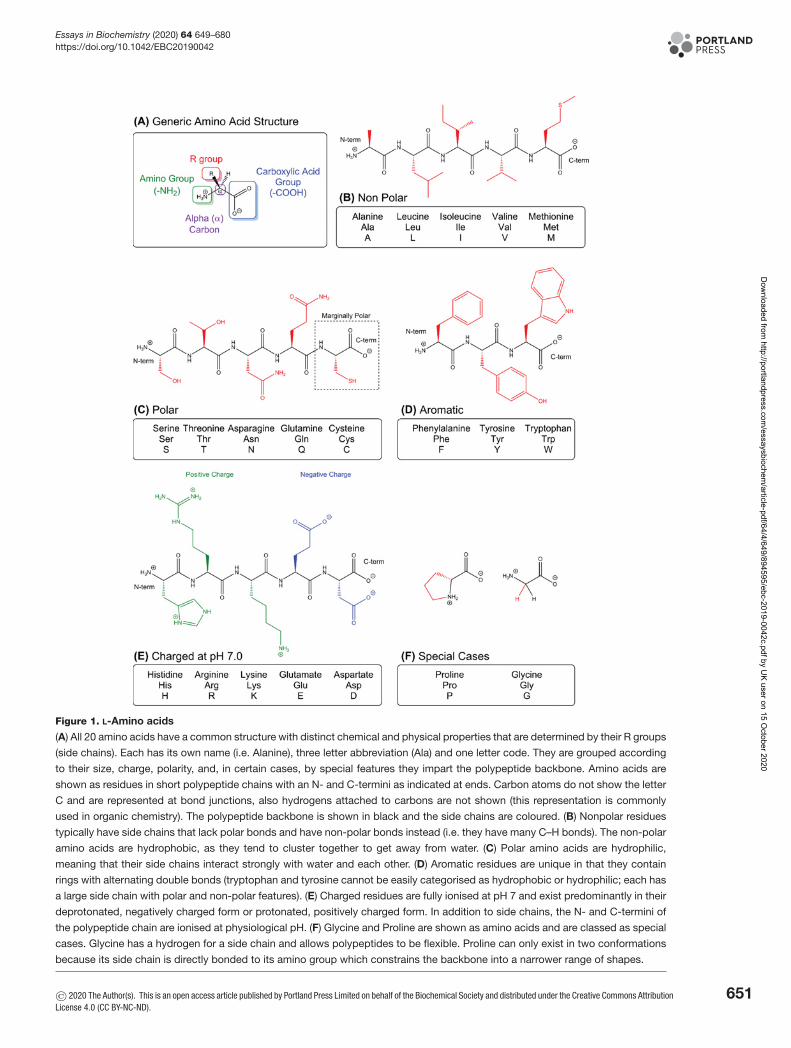
carbon-based covalent compounds that use weak reversible non-covalent interactions to fold and interact with theirtargets, giving the molecules and their complexes distinct shapes and dynamics. Proteins are polymers of typicallyhundreds of amino acids joined together by peptide bonds, whereas shorter polypeptides (less than 30 amino acids)are typically referred to as peptides. Each amino acid has a common structure containing a central α carbon atom(Cα) that is joined to an amino group (–NH2) and a carboxylic acid group (–COOH) both of which are used to formpeptide bonds. What is most interesting, is that for 19 of the 20 different amino acids, the Cα group is also bondedto a different R group, giving every amino acid its unique ‘side chain’. The side chain gives the amino acid distinctivestructural and chemical properties as side chains differ in size, shape, polarity, charge and hydrophobicity (Figure 1).Amino acids are also chiral and can be configured in two possible mirror images (stereoisomers) as the Cα group isbonded to four unique groups that form a chiral centre. As mirror images, stereoisomers cannot be superimposed, inthe same way, your hands are mirror images and cannot be rotated to match. The two stereoisomers for each of the19 chiral amino acids are denoted as d and l, however only the l-stereoisomer is used in nature to construct proteins(glycine has hydrogen for a side chain and is not chiral).
Once amino acids are linked together to form a polypeptide chain, the sidechains and backbone groups interactwith each other through many weak interactions to include van der Waals, hydrogen bonds, electrostatic interactionsas well as the hydrophobic effect to bring about a protein’s shape and target interactions (Figure 2). For example, theside chain of lysine has a long hydrocarbon chain which is non-polar, yet the end of the chain is positively chargedallowing it to interact with other molecules using any of the weak interactions described above. Glutamic acid onthe other hand is a similar size but carries a negative charge and has fewer potential ways of interacting. In additionto the sidechain interactions, the peptide bond carries a dipole due to the electronegative properties of the boundoxygen, allowing it to form hydrogen bonds with backbone and mainchain groups. Since there are 20 different aminoacids, and they can be arranged in any order, there are a vast number of possible linear combinations and organismshave evolved tens of thousands of different proteins and peptides. Proteins do not usually exist as extended chains,and through sidechain and backbone interactions they fold in on themselves, leading to a unique shape. Each shapehas a way of moving and interacting with other molecules bringing about its function. The range of shapes meansproteins are extremely versatile, sometimes acting as enzymes to catalyse chemical reactions, sometimes as a type ofmessenger that binds to a specific partner to relay a message and other times acting as a structural scaffold within thecell (Figure 3). In contrast, DNA usually adopts the classic double-helical structure regardless of its sequence, whichsuits its function to store genetic information.
Since almost every function crucial to life is mediated by proteins, any changes to their structure due to dam-age, mutation or modification explains the cause of the disease at the molecular level. The classic example is that ofhaemoglobin. When an individual inherits a variant haemoglobin gene where the glutamic acid (R group is charged)at residue position six is changed to valine (R group is hydrophobic), this leads to sickle cell disease. This one aminoacid difference changes the surface of haemoglobin by removing the negative charge and forming a hydrophobic‘sticky’ patch (in the absence of oxygen), causing deoxyhaemoglobin to clump together. Since this protein is in highconcentrations in red blood cells, it converts the cells from a standard disc into a sickled shape, which reduces celllifetimes, leading to anaemia, and can result in the blockage of capillaries leading to tissue damage.
To understand protein structures in more detail, we next explore the four levels that determine their shape.
Protein structureProtein structure is described at four different levels. The arrangement of amino acids in a polypeptide chain is re-ferred to as its primary structure. Each amino acid in a polypeptide chain is referred to as a residue and the linkedseries of carbon, nitrogen and oxygen atoms are known as the main chain or protein backbone. The first aminogroup at the start of the peptide chain is known as the N-terminus, and the end with the carboxylic acid group is theC-terminus. When we count or write the residues in a polypeptide chain, we start with the N-terminus. The locationof disulphide bonds that covalently link different parts of the polypeptide chain together are also considered part ofthe primary structure. These bonds are formed between two cysteine residues via their side chain thiol groups (–SH)and they significantly stabilise protein structures.
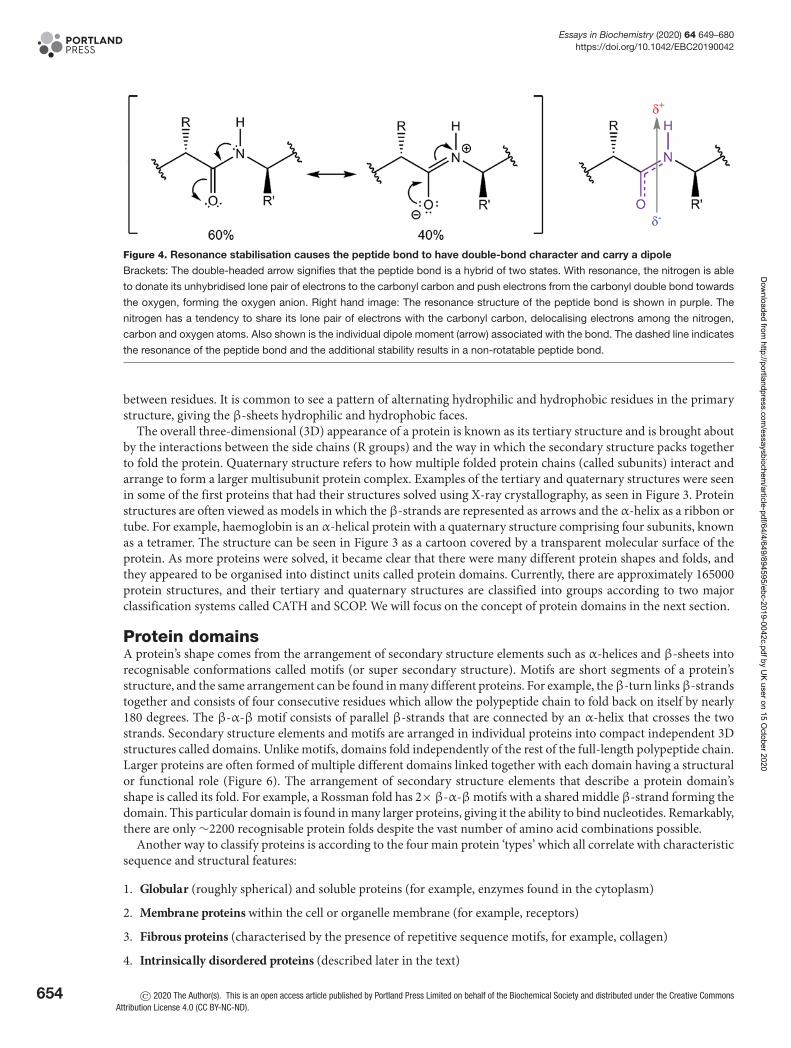
Protein secondary structure refers to the way the primary structure of a protein arranges itself as a result of regularhydrogen bonds forming between the backbone C = O and NH groups of each peptide bond. However, the peptidebond itself cannot rotate as it has double bond character due to resonance stabilisation (Figure 4), where the nitrogendonates its lone pair of electrons to the carbonyl carbon, pushing electrons towards the oxygen. This results in theelectrons being delocalised over multiple atoms, which increases bond stability and decreases rotation (Figure 5A).Therefore, rotation can only occur about the bond between the Cα and the C = O group, (the phi (φ) angle) and theCα and the NH group, (the psi (ψ) angle). In effect, the polypeptide backbone chain is composed of a repeating series
650 © 2020 The Author(s). This is an open access article published by Portland Press Limited on behalf of the Biochemical Society and distributed under the Creative CommonsAttribution License 4.0 (CC BY-NC-ND).
Dow
nloaded from http://portlandpress.com
/essaysbiochem/article-pdf/64/4/649/894595/ebc-2019-0042c.pdf by U
K user on 15 October 2020
Essays in Biochemistry (2020) 64 649–680https://doi.org/10.1042/EBC20190042
Figure 1. L-Amino acids
(A) All 20 amino acids have a common structure with distinct chemical and physical properties that are determined by their R groups
(side chains). Each has its own name (i.e. Alanine), three letter abbreviation (Ala) and one letter code. They are grouped according
to their size, charge, polarity, and, in certain cases, by special features they impart the polypeptide backbone. Amino acids are
shown as residues in short polypeptide chains with an N- and C-termini as indicated at ends. Carbon atoms do not show the letter
C and are represented at bond junctions, also hydrogens attached to carbons are not shown (this representation is commonly
used in organic chemistry). The polypeptide backbone is shown in black and the side chains are coloured. (B) Nonpolar residues
typically have side chains that lack polar bonds and have non-polar bonds instead (i.e. they have many C–H bonds). The non-polar
amino acids are hydrophobic, as they tend to cluster together to get away from water. (C) Polar amino acids are hydrophilic,
meaning that their side chains interact strongly with water and each other. (D) Aromatic residues are unique in that they contain
rings with alternating double bonds (tryptophan and tyrosine cannot be easily categorised as hydrophobic or hydrophilic; each has
a large side chain with polar and non-polar features). (E) Charged residues are fully ionised at pH 7 and exist predominantly in their
deprotonated, negatively charged form or protonated, positively charged form. In addition to side chains, the N- and C-termini of
the polypeptide chain are ionised at physiological pH. (F) Glycine and Proline are shown as amino acids and are classed as special
cases. Glycine has a hydrogen for a side chain and allows polypeptides to be flexible. Proline can only exist in two conformations
because its side chain is directly bonded to its amino group which constrains the backbone into a narrower range of shapes.
© 2020 The Author(s). This is an open access article published by Portland Press Limited on behalf of the Biochemical Society and distributed under the Creative Commons AttributionLicense 4.0 (CC BY-NC-ND).
651
Dow
nloaded from http://portlandpress.com
/essaysbiochem/article-pdf/64/4/649/894595/ebc-2019-0042c.pdf by U
K user on 15 October 2020
Essays in Biochemistry (2020) 64 649–680https://doi.org/10.1042/EBC20190042
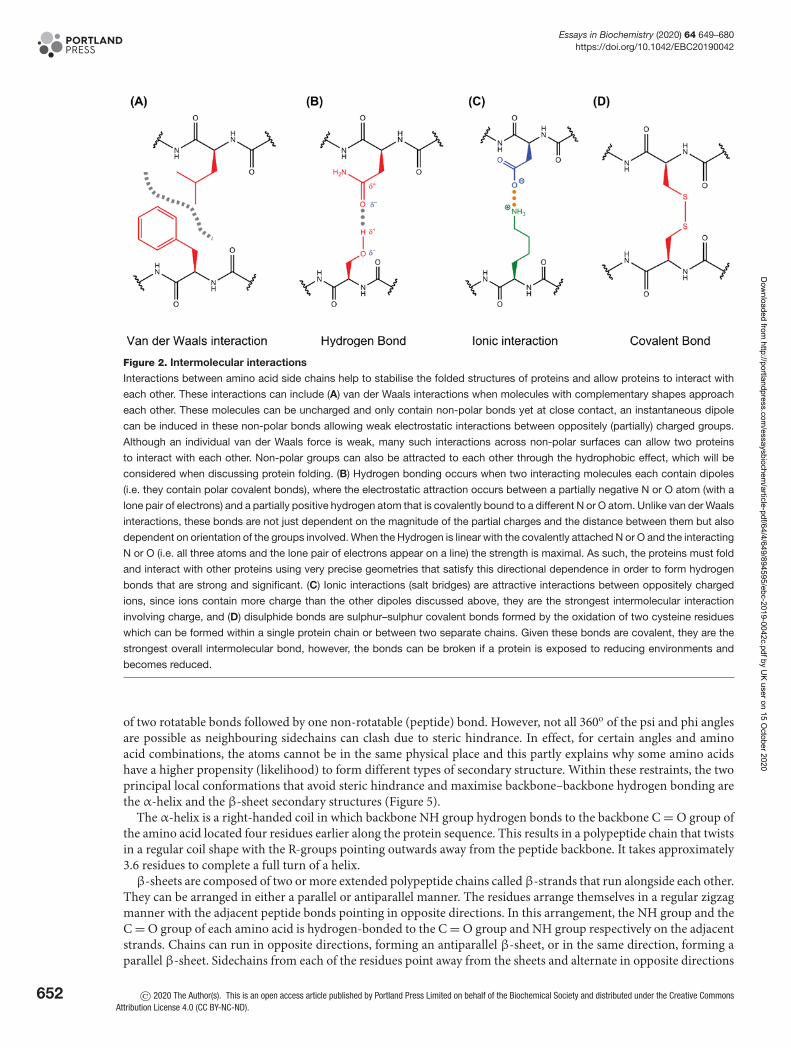
Figure 2. Intermolecular interactions
Interactions between amino acid side chains help to stabilise the folded structures of proteins and allow proteins to interact with
each other. These interactions can include (A) van der Waals interactions when molecules with complementary shapes approach
each other. These molecules can be uncharged and only contain non-polar bonds yet at close contact, an instantaneous dipole
can be induced in these non-polar bonds allowing weak electrostatic interactions between oppositely (partially) charged groups.
Although an individual van der Waals force is weak, many such interactions across non-polar surfaces can allow two proteins
to interact with each other. Non-polar groups can also be attracted to each other through the hydrophobic effect, which will be
considered when discussing protein folding. (B) Hydrogen bonding occurs when two interacting molecules each contain dipoles
(i.e. they contain polar covalent bonds), where the electrostatic attraction occurs between a partially negative N or O atom (with a
lone pair of electrons) and a partially positive hydrogen atom that is covalently bound to a different N or O atom. Unlike van der Waals
interactions, these bonds are not just dependent on the magnitude of the partial charges and the distance between them but also
dependent on orientation of the groups involved. When the Hydrogen is linear with the covalently attached N or O and the interacting
N or O (i.e. all three atoms and the lone pair of electrons appear on a line) the strength is maximal. As such, the proteins must fold
and interact with other proteins using very precise geometries that satisfy this directional dependence in order to form hydrogen
bonds that are strong and significant. (C) Ionic interactions (salt bridges) are attractive interactions between oppositely charged
ions, since ions contain more charge than the other dipoles discussed above, they are the strongest intermolecular interaction
involving charge, and (D) disulphide bonds are sulphur–sulphur covalent bonds formed by the oxidation of two cysteine residues
which can be formed within a single protein chain or between two separate chains. Given these bonds are covalent, they are the
strongest overall intermolecular bond, however, the bonds can be broken if a protein is exposed to reducing environments and
becomes reduced.
of two rotatable bonds followed by one non-rotatable (peptide) bond. However, not all 360o of the psi and phi anglesare possible as neighbouring sidechains can clash due to steric hindrance. In effect, for certain angles and aminoacid combinations, the atoms cannot be in the same physical place and this partly explains why some amino acidshave a higher propensity (likelihood) to form different types of secondary structure. Within these restraints, the twoprincipal local conformations that avoid steric hindrance and maximise backbone–backbone hydrogen bonding arethe α-helix and the β-sheet secondary structures (Figure 5).
The α-helix is a right-handed coil in which backbone NH group hydrogen bonds to the backbone C = O group ofthe amino acid located four residues earlier along the protein sequence. This results in a polypeptide chain that twistsin a regular coil shape with the R-groups pointing outwards away from the peptide backbone. It takes approximately3.6 residues to complete a full turn of a helix.β-sheets are composed of two or more extended polypeptide chains calledβ-strands that run alongside each other.
They can be arranged in either a parallel or antiparallel manner. The residues arrange themselves in a regular zigzagmanner with the adjacent peptide bonds pointing in opposite directions. In this arrangement, the NH group and theC = O group of each amino acid is hydrogen-bonded to the C = O group and NH group respectively on the adjacentstrands. Chains can run in opposite directions, forming an antiparallel β-sheet, or in the same direction, forming aparallel β-sheet. Sidechains from each of the residues point away from the sheets and alternate in opposite directions
652 © 2020 The Author(s). This is an open access article published by Portland Press Limited on behalf of the Biochemical Society and distributed under the Creative CommonsAttribution License 4.0 (CC BY-NC-ND).
Dow
nloaded from http://portlandpress.com
/essaysbiochem/article-pdf/64/4/649/894595/ebc-2019-0042c.pdf by U
K user on 15 October 2020
Essays in Biochemistry (2020) 64 649–680https://doi.org/10.1042/EBC20190042
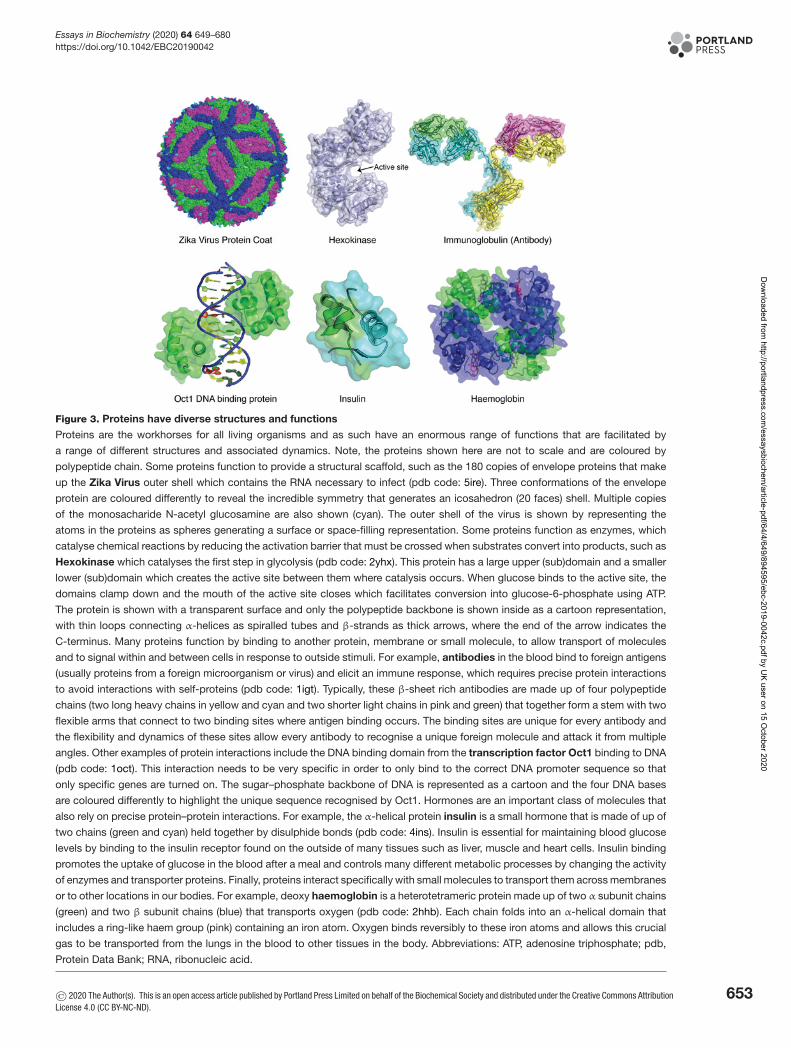
Figure 3. Proteins have diverse structures and functions
Proteins are the workhorses for all living organisms and as such have an enormous range of functions that are facilitated by
a range of different structures and associated dynamics. Note, the proteins shown here are not to scale and are coloured by
polypeptide chain. Some proteins function to provide a structural scaffold, such as the 180 copies of envelope proteins that make
up the Zika Virus outer shell which contains the RNA necessary to infect (pdb code: 5ire). Three conformations of the envelope
protein are coloured differently to reveal the incredible symmetry that generates an icosahedron (20 faces) shell. Multiple copies
of the monosacharide N-acetyl glucosamine are also shown (cyan). The outer shell of the virus is shown by representing the
atoms in the proteins as spheres generating a surface or space-filling representation. Some proteins function as enzymes, which
catalyse chemical reactions by reducing the activation barrier that must be crossed when substrates convert into products, such as
Hexokinase which catalyses the first step in glycolysis (pdb code: 2yhx). This protein has a large upper (sub)domain and a smaller
lower (sub)domain which creates the active site between them where catalysis occurs. When glucose binds to the active site, the
domains clamp down and the mouth of the active site closes which facilitates conversion into glucose-6-phosphate using ATP.
The protein is shown with a transparent surface and only the polypeptide backbone is shown inside as a cartoon representation,
with thin loops connecting α-helices as spiralled tubes and β-strands as thick arrows, where the end of the arrow indicates the
C-terminus. Many proteins function by binding to another protein, membrane or small molecule, to allow transport of molecules
and to signal within and between cells in response to outside stimuli. For example, antibodies in the blood bind to foreign antigens
(usually proteins from a foreign microorganism or virus) and elicit an immune response, which requires precise protein interactions
to avoid interactions with self-proteins (pdb code: 1igt). Typically, these β-sheet rich antibodies are made up of four polypeptide
chains (two long heavy chains in yellow and cyan and two shorter light chains in pink and green) that together form a stem with two
flexible arms that connect to two binding sites where antigen binding occurs. The binding sites are unique for every antibody and
the flexibility and dynamics of these sites allow every antibody to recognise a unique foreign molecule and attack it from multiple
angles. Other examples of protein interactions include the DNA binding domain from the transcription factor Oct1 binding to DNA
(pdb code: 1oct). This interaction needs to be very specific in order to only bind to the correct DNA promoter sequence so that
only specific genes are turned on. The sugar–phosphate backbone of DNA is represented as a cartoon and the four DNA bases
are coloured differently to highlight the unique sequence recognised by Oct1. Hormones are an important class of molecules that
also rely on precise protein–protein interactions. For example, the α-helical protein insulin is a small hormone that is made of up of
two chains (green and cyan) held together by disulphide bonds (pdb code: 4ins). Insulin is essential for maintaining blood glucose
levels by binding to the insulin receptor found on the outside of many tissues such as liver, muscle and heart cells. Insulin binding
promotes the uptake of glucose in the blood after a meal and controls many different metabolic processes by changing the activity
of enzymes and transporter proteins. Finally, proteins interact specifically with small molecules to transport them across membranes
or to other locations in our bodies. For example, deoxy haemoglobin is a heterotetrameric protein made up of two α subunit chains
(green) and two β subunit chains (blue) that transports oxygen (pdb code: 2hhb). Each chain folds into an α-helical domain that
includes a ring-like haem group (pink) containing an iron atom. Oxygen binds reversibly to these iron atoms and allows this crucial
gas to be transported from the lungs in the blood to other tissues in the body. Abbreviations: ATP, adenosine triphosphate; pdb,
Protein Data Bank; RNA, ribonucleic acid.
© 2020 The Author(s). This is an open access article published by Portland Press Limited on behalf of the Biochemical Society and distributed under the Creative Commons AttributionLicense 4.0 (CC BY-NC-ND).
653
Dow
nloaded from http://portlandpress.com
/essaysbiochem/article-pdf/64/4/649/894595/ebc-2019-0042c.pdf by U
K user on 15 October 2020
Essays in Biochemistry (2020) 64 649–680https://doi.org/10.1042/EBC20190042
Figure 4. Resonance stabilisation causes the peptide bond to have double-bond character and carry a dipole
Brackets: The double-headed arrow signifies that the peptide bond is a hybrid of two states. With resonance, the nitrogen is able
to donate its unhybridised lone pair of electrons to the carbonyl carbon and push electrons from the carbonyl double bond towards
the oxygen, forming the oxygen anion. Right hand image: The resonance structure of the peptide bond is shown in purple. The
nitrogen has a tendency to share its lone pair of electrons with the carbonyl carbon, delocalising electrons among the nitrogen,
carbon and oxygen atoms. Also shown is the individual dipole moment (arrow) associated with the bond. The dashed line indicates
the resonance of the peptide bond and the additional stability results in a non-rotatable peptide bond.
between residues. It is common to see a pattern of alternating hydrophilic and hydrophobic residues in the primarystructure, giving the β-sheets hydrophilic and hydrophobic faces.
The overall three-dimensional (3D) appearance of a protein is known as its tertiary structure and is brought aboutby the interactions between the side chains (R groups) and the way in which the secondary structure packs togetherto fold the protein. Quaternary structure refers to how multiple folded protein chains (called subunits) interact andarrange to form a larger multisubunit protein complex. Examples of the tertiary and quaternary structures were seenin some of the first proteins that had their structures solved using X-ray crystallography, as seen in Figure 3. Proteinstructures are often viewed as models in which the β-strands are represented as arrows and the α-helix as a ribbon ortube. For example, haemoglobin is an α-helical protein with a quaternary structure comprising four subunits, knownas a tetramer. The structure can be seen in Figure 3 as a cartoon covered by a transparent molecular surface of theprotein. As more proteins were solved, it became clear that there were many different protein shapes and folds, andthey appeared to be organised into distinct units called protein domains. Currently, there are approximately 165000protein structures, and their tertiary and quaternary structures are classified into groups according to two majorclassification systems called CATH and SCOP. We will focus on the concept of protein domains in the next section.
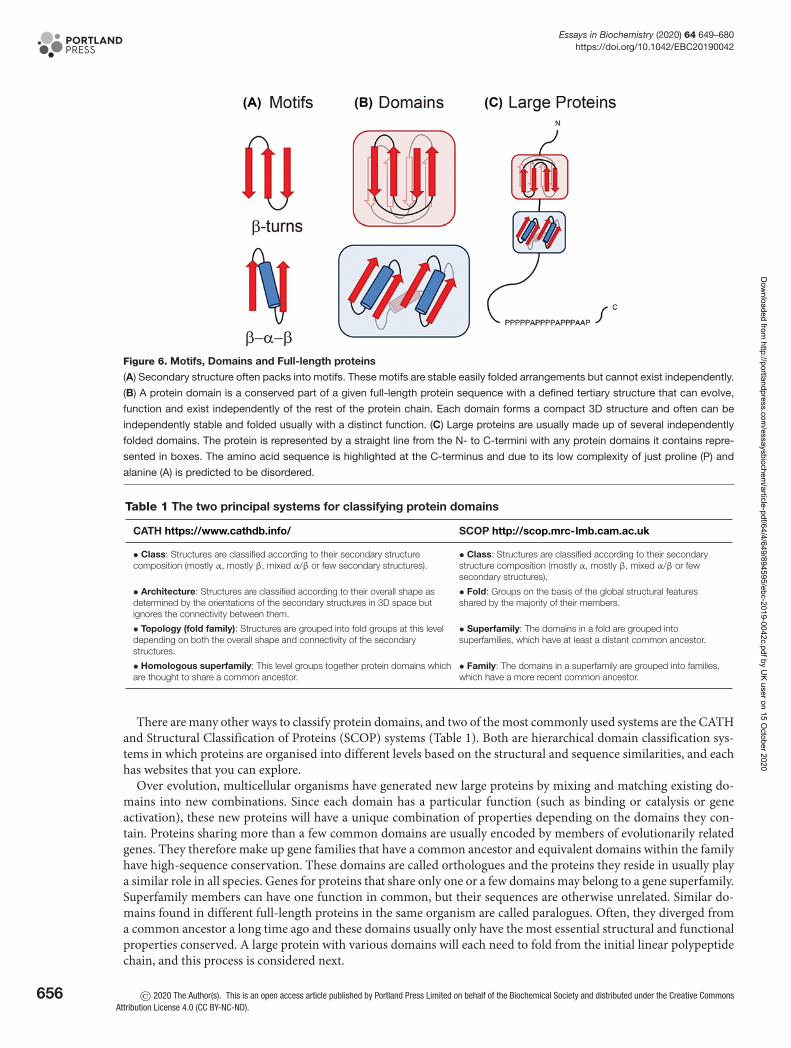
Protein domainsA protein’s shape comes from the arrangement of secondary structure elements such as α-helices and β-sheets intorecognisable conformations called motifs (or super secondary structure). Motifs are short segments of a protein’sstructure, and the same arrangement can be found in many different proteins. For example, theβ-turn linksβ-strandstogether and consists of four consecutive residues which allow the polypeptide chain to fold back on itself by nearly180 degrees. The β-α-β motif consists of parallel β-strands that are connected by an α-helix that crosses the twostrands. Secondary structure elements and motifs are arranged in individual proteins into compact independent 3Dstructures called domains. Unlike motifs, domains fold independently of the rest of the full-length polypeptide chain.Larger proteins are often formed of multiple different domains linked together with each domain having a structuralor functional role (Figure 6). The arrangement of secondary structure elements that describe a protein domain’sshape is called its fold. For example, a Rossman fold has 2×β-α-β motifs with a shared middle β-strand forming thedomain. This particular domain is found in many larger proteins, giving it the ability to bind nucleotides. Remarkably,there are only ∼2200 recognisable protein folds despite the vast number of amino acid combinations possible.
Another way to classify proteins is according to the four main protein ‘types’ which all correlate with characteristicsequence and structural features:
1. Globular (roughly spherical) and soluble proteins (for example, enzymes found in the cytoplasm)
2. Membrane proteins within the cell or organelle membrane (for example, receptors)
3. Fibrous proteins (characterised by the presence of repetitive sequence motifs, for example, collagen)
4. Intrinsically disordered proteins (described later in the text)
654 © 2020 The Author(s). This is an open access article published by Portland Press Limited on behalf of the Biochemical Society and distributed under the Creative CommonsAttribution License 4.0 (CC BY-NC-ND).
Dow
nloaded from http://portlandpress.com
/essaysbiochem/article-pdf/64/4/649/894595/ebc-2019-0042c.pdf by U
K user on 15 October 2020
Essays in Biochemistry (2020) 64 649–680https://doi.org/10.1042/EBC20190042
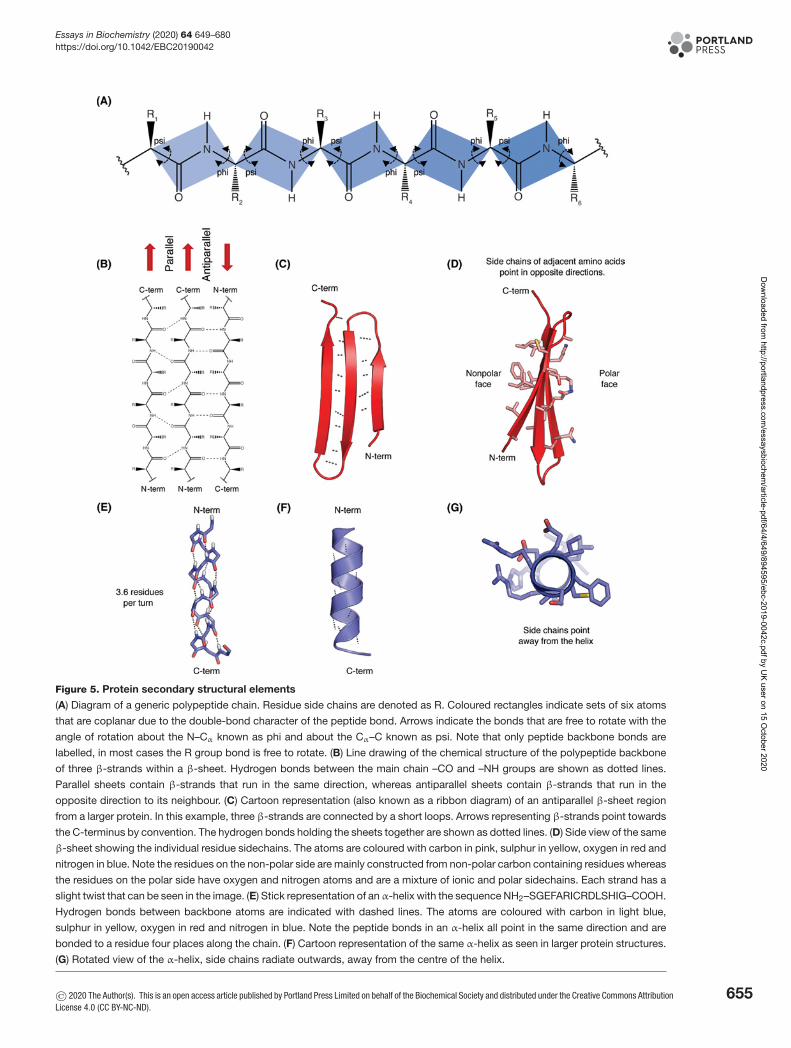
Figure 5. Protein secondary structural elements
(A) Diagram of a generic polypeptide chain. Residue side chains are denoted as R. Coloured rectangles indicate sets of six atoms
that are coplanar due to the double-bond character of the peptide bond. Arrows indicate the bonds that are free to rotate with the
angle of rotation about the N–Cα known as phi and about the Cα–C known as psi. Note that only peptide backbone bonds are
labelled, in most cases the R group bond is free to rotate. (B) Line drawing of the chemical structure of the polypeptide backbone
of three β-strands within a β-sheet. Hydrogen bonds between the main chain –CO and –NH groups are shown as dotted lines.
Parallel sheets contain β-strands that run in the same direction, whereas antiparallel sheets contain β-strands that run in the
opposite direction to its neighbour. (C) Cartoon representation (also known as a ribbon diagram) of an antiparallel β-sheet region
from a larger protein. In this example, three β-strands are connected by a short loops. Arrows representing β-strands point towards
the C-terminus by convention. The hydrogen bonds holding the sheets together are shown as dotted lines. (D) Side view of the same
β-sheet showing the individual residue sidechains. The atoms are coloured with carbon in pink, sulphur in yellow, oxygen in red and
nitrogen in blue. Note the residues on the non-polar side are mainly constructed from non-polar carbon containing residues whereas
the residues on the polar side have oxygen and nitrogen atoms and are a mixture of ionic and polar sidechains. Each strand has a
slight twist that can be seen in the image. (E) Stick representation of anα-helix with the sequence NH2–SGEFARICRDLSHIG–COOH.
Hydrogen bonds between backbone atoms are indicated with dashed lines. The atoms are coloured with carbon in light blue,
sulphur in yellow, oxygen in red and nitrogen in blue. Note the peptide bonds in an α-helix all point in the same direction and are
bonded to a residue four places along the chain. (F) Cartoon representation of the same α-helix as seen in larger protein structures.
(G) Rotated view of the α-helix, side chains radiate outwards, away from the centre of the helix.
© 2020 The Author(s). This is an open access article published by Portland Press Limited on behalf of the Biochemical Society and distributed under the Creative Commons AttributionLicense 4.0 (CC BY-NC-ND).
655
Dow
nloaded from http://portlandpress.com
/essaysbiochem/article-pdf/64/4/649/894595/ebc-2019-0042c.pdf by U
K user on 15 October 2020
Essays in Biochemistry (2020) 64 649–680https://doi.org/10.1042/EBC20190042
Figure 6. Motifs, Domains and Full-length proteins
(A) Secondary structure often packs into motifs. These motifs are stable easily folded arrangements but cannot exist independently.
(B) A protein domain is a conserved part of a given full-length protein sequence with a defined tertiary structure that can evolve,
function and exist independently of the rest of the protein chain. Each domain forms a compact 3D structure and often can be
independently stable and folded usually with a distinct function. (C) Large proteins are usually made up of several independently
folded domains. The protein is represented by a straight line from the N- to C-termini with any protein domains it contains repre-
sented in boxes. The amino acid sequence is highlighted at the C-terminus and due to its low complexity of just proline (P) and
alanine (A) is predicted to be disordered.
Table 1 The two principal systems for classifying protein domains
CATH https://www.cathdb.info/ SCOP http://scop.mrc-lmb.cam.ac.uk
• Class: Structures are classified according to their secondary structurecomposition (mostly α, mostly β, mixed α/β or few secondary structures).
• Class: Structures are classified according to their secondarystructure composition (mostly α, mostly β, mixed α/β or fewsecondary structures).
• Architecture: Structures are classified according to their overall shape asdetermined by the orientations of the secondary structures in 3D space butignores the connectivity between them.
• Fold: Groups on the basis of the global structural featuresshared by the majority of their members.
• Topology (fold family): Structures are grouped into fold groups at this leveldepending on both the overall shape and connectivity of the secondarystructures.
• Superfamily: The domains in a fold are grouped intosuperfamilies, which have at least a distant common ancestor.
• Homologous superfamily: This level groups together protein domains whichare thought to share a common ancestor.
• Family: The domains in a superfamily are grouped into families,which have a more recent common ancestor.
There are many other ways to classify protein domains, and two of the most commonly used systems are the CATHand Structural Classification of Proteins (SCOP) systems (Table 1). Both are hierarchical domain classification sys-tems in which proteins are organised into different levels based on the structural and sequence similarities, and eachhas websites that you can explore.
Over evolution, multicellular organisms have generated new large proteins by mixing and matching existing do-mains into new combinations. Since each domain has a particular function (such as binding or catalysis or geneactivation), these new proteins will have a unique combination of properties depending on the domains they con-tain. Proteins sharing more than a few common domains are usually encoded by members of evolutionarily relatedgenes. They therefore make up gene families that have a common ancestor and equivalent domains within the familyhave high-sequence conservation. These domains are called orthologues and the proteins they reside in usually playa similar role in all species. Genes for proteins that share only one or a few domains may belong to a gene superfamily.Superfamily members can have one function in common, but their sequences are otherwise unrelated. Similar do-mains found in different full-length proteins in the same organism are called paralogues. Often, they diverged froma common ancestor a long time ago and these domains usually only have the most essential structural and functionalproperties conserved. A large protein with various domains will each need to fold from the initial linear polypeptidechain, and this process is considered next.
656 © 2020 The Author(s). This is an open access article published by Portland Press Limited on behalf of the Biochemical Society and distributed under the Creative CommonsAttribution License 4.0 (CC BY-NC-ND).
Dow
nloaded from http://portlandpress.com
/essaysbiochem/article-pdf/64/4/649/894595/ebc-2019-0042c.pdf by U
K user on 15 October 2020
Essays in Biochemistry (2020) 64 649–680https://doi.org/10.1042/EBC20190042
Protein foldingA protein domain in its functional and/or assembled form is referred to as being in its native state. This state resultsfrom the amino acid side chains present on the polypeptide chain making favourable interactions with each other andstabilising the protein. However, when a protein domain is first translated by a ribosome from mRNA it exists as alinear chain of amino acids which lack structure and is referred to as being unfolded or ‘denatured’. In this state, theseinteractions are yet to form. If the unfolded protein domain were to randomly search through all possible conforma-tions it could make by testing out all the possible combinations of interactions, the process of finding the native statewould take longer than the age of the universe! However, most protein domains can fold spontaneously into their‘native state’ on the order of 10−6 to 10−1 s. The process by which the unfolded protein domain gains its compact3D native state is known as protein folding and is studied by thermodynamics and kinetics [For a reminder of thefundamentals of thermodynamics and kinetics please refer to the Essential Chemistry for Biochemists article in thisseries and the Thermodynamics Box (Box 1)].
Box 1 Thermodynamics Box
To understand why protein folding occurs, we must consider the field of thermodynamics that aimsto understand whether any chemical reaction will occur. In other words, is it favourable for a reactionto convert its reactants into products? This will involve recapping some of the basics covered in theEssential Chemistry for Biochemists review in this series. To begin with, it is important to define asystem as the reaction we are interested in (i.e. the protein folding reaction to include the unfoldedand folded proteins and any solvent or solute molecules that interact with these proteins) and thesurroundings as everything else in the universe that is outside the system. As biochemists, to makea prediction about a system reaction, we are interested in three system quantities called enthalpy,H; entropy, S and Gibbs free energy, G and the first and second laws of thermodynamics will helpus appreciate where these quantities come from.The first law of thermodynamics states that the total amount of energy in the universe is constantand that energy can neither be created nor destroyed, but it can be transformed from one formto another. From this law, we can start to keep track of energy, for example if heat energy is lostfrom a reaction as products are made then the energy of the system will go down, however theenergy of the surroundings will go up as that heat energy will just transfer over. The change in heatcontent for a reaction is defined as �H and depends on the bonds that have been broken and thenew bonds that have been formed during the reaction. In a reaction, whenever a bond is formed,heat energy is released to the surroundings and whenever a bond is broken heat energy is takenup by the system from the surroundings. Therefore, to calculate �H, one must consider the sumof the broken bond energies and the sum of the formed bond energies. If more energy has beenreleased from bond formation than the energy taken up from breaking bonds, then energy will bereleased and �H will be negative or exothermic. Conversely, if less energy has been released frombond formation than the energy taken up from breaking bonds then energy will be absorbed and �Hwill be positive or endothermic. For protein folding, the interactions involved are usually the weaknon-covalent bonds we discussed earlier involving the hydrophobic effect, hydrogen bonds, van derWaals and other electrostatic interactions. When a protein folds, most often more energy is releasedfrom forming these bonds than the energy taken up from breaking any pre-existing bonds that arepresent in the unfolded state (i.e. �H is negative). However, sometimes, proteins can fold even when�H is positive. To appreciate why this is the case, we must also take into account the second lawof thermodynamics.The second law of thermodynamics states that the entropy of the universe always increases, in otherwords, for protein folding to be favourable to occur, the entropy of the universe must increase as aresult of this process. Entropy is often described as disorder, which is a familiar term to most of us ina physical sense, for example, as we have seen in the main text, water molecules that surround andinteract with an unfolded protein are quite ordered and constrained and it is only when proteins foldand expel these water molecules that they can leave the protein surface and move around more andessentially increase their disorder. A better way to think of entropy is to do with the number of waysenergy can be distributed in a system. For example, if an object is hot, it has lots of thermal energyconcentrated in one place (in the object). However, if you place that object in some cold water, heat
© 2020 The Author(s). This is an open access article published by Portland Press Limited on behalf of the Biochemical Society and distributed under the Creative Commons AttributionLicense 4.0 (CC BY-NC-ND).
657
Dow
nloaded from http://portlandpress.com
/essaysbiochem/article-pdf/64/4/649/894595/ebc-2019-0042c.pdf by U
K user on 15 October 2020
Essays in Biochemistry (2020) 64 649–680https://doi.org/10.1042/EBC20190042
always transfers to the water and heats it up as the thermal energy is dispersed and spread awayfrom the object into the water. This happens as energy dispersal increases the number of waysthat energy can be distributed. In fact, whenever there is greater movement of bonds or atoms inmolecules there are more ways to distribute energy. In an exothermic reaction, energy is released tothe surroundings and increases the entropy of the universe as the energy has now been dispersed.Therefore, the entropy of the universe can increase in two ways, either through an increase in entropyof the system (�S > 0) or through dispersal of energy from the system to the surroundings (�H <
0). The quantity of Gibbs free energy is used to keep track of the entropy change of the universe(eqn 1).
�Suniverse = −�G/T (1)
�Suniverse, Change in entropy of the universe; �G, Change in Gibbs free energy as products aremade (i.e. unfolded to folded); T, Temperature (in Kelvin).
When �G is negative, �Suniverse is positive and the reaction will occur and vice versa. It is hard tokeep track of entropy and enthalpy changes in the whole universe and fortunately, we can simplyfocus on the entropy and enthalpy change of the protein folding reaction (system only) and ignorechanges in the surroundings because �G is also a function of the enthalpy and entropy of the systemreaction (eqn 2).
�G = �H − T�S (2)
�H, Change in enthalpy as products are made from reactants (i.e. unfolded to folded); �S, Changein entropy as products are made from reactants (i.e. unfolded to folded).
It should be noted that biochemists cannot predict �H and �S and must rely on experimentalcalorimetry measurements to determine these values. As can be seen in (eqn 2), for a protein (andits surrounding interacting water molecules) to fold spontaneously, it will have more free energy inthe unfolded state and less free energy in the folded state. To represent the change in free energy ofa protein ensemble, it is useful to show the reaction progress that is measured experimentally usinga classical energy diagram as described in the main text.
Every spontaneous (favourable) reaction in nature results in lowering its free energy as dictated by the laws of ther-modynamics. For example, the folding of protein domains is a spontaneous reaction when a negative change in Gibbsfree energy (G) occurs, and the protein domain moves to a lower energy state. Change of Gibbs free energy (�G)has two components that are influenced by temperature; change of enthalpy (H, a measure of the formed and brokenbond energies in the system) and change of entropy (S, a measure of the change of system ‘disorder’) as seen in (eqn 2)in the Thermodynamics Box (Box 1). The driving force for protein folding is a result of hydrophobic collapse, hydro-gen bond formation, electrostatic interactions and van der Waals interactions that lower the free energy. Accordingto (eqn 2), for a negative �G and for protein folding to become thermodynamically favourable, the change in theseinteractions must result in either a favourable change in system enthalpy (�H) and/or entropy (�S).
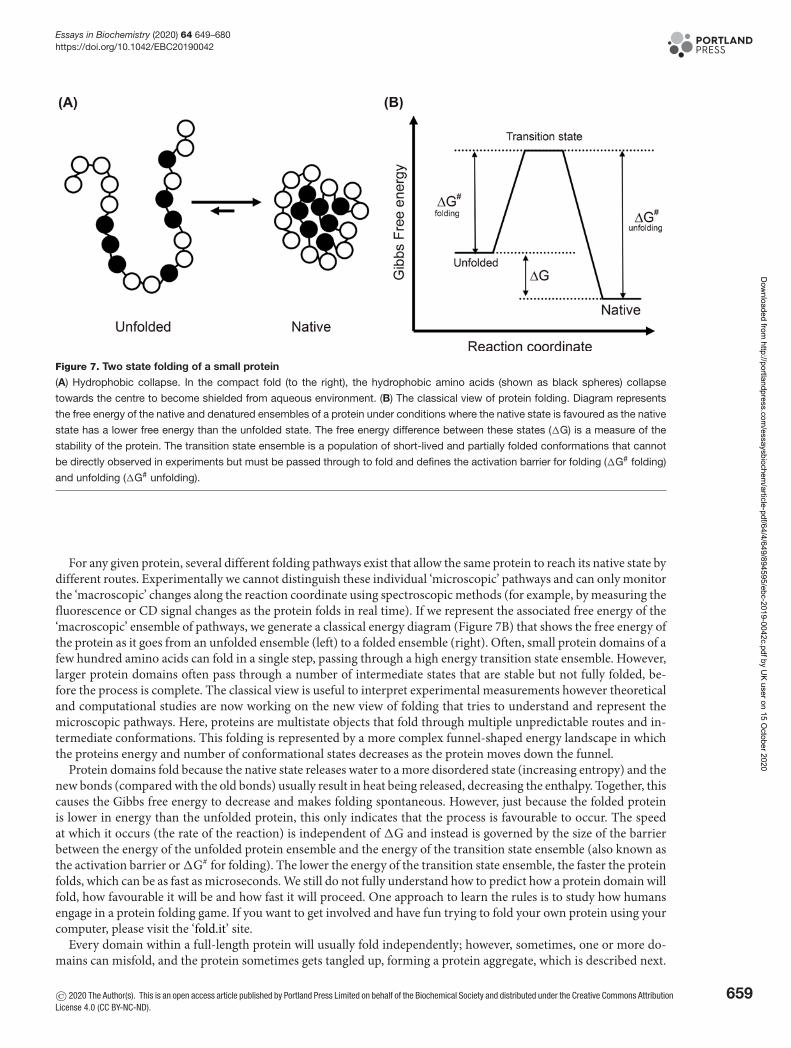
When amino acids form new hydrogen bonds, van der Waals and other electrostatic interactions it results in re-leasing heat, while breaking these bonds with water results in absorbing heat. Therefore, the relative amount of bondformation to bond breakage in the unfolded and folded states will determine �H. However, the basis of the hydropho-bic effect (collapse) is an increase in the entropy of protein-associated water and is the most important driving forcein protein folding. When a protein domain is present in its unfolded state, water molecules have to order themselvesin ice-like structures around the hydrophobic groups of the polypeptide chain which forces order on the system andso has less entropy than the free water molecules. Solvent entropy is increased by the protein domain collapsing andplacing the hydrophobic side chains into the middle of the protein (Figure 7A). As a result, the hydration shells aroundthe side chains are no longer required, and these water molecules become disordered (free to sample multiple statesand interactions), causing a positive change in entropy for the system (�S). It should be noted that as a protein do-main folds, the polypeptide chain loses entropy as it adopts a single dominant folded conformation (shape), howeverthis decrease in entropy is often offset by the hydrophobic effect described above.
658 © 2020 The Author(s). This is an open access article published by Portland Press Limited on behalf of the Biochemical Society and distributed under the Creative CommonsAttribution License 4.0 (CC BY-NC-ND).
Dow
nloaded from http://portlandpress.com
/essaysbiochem/article-pdf/64/4/649/894595/ebc-2019-0042c.pdf by U
K user on 15 October 2020
Essays in Biochemistry (2020) 64 649–680https://doi.org/10.1042/EBC20190042
Figure 7. Two state folding of a small protein
(A) Hydrophobic collapse. In the compact fold (to the right), the hydrophobic amino acids (shown as black spheres) collapse
towards the centre to become shielded from aqueous environment. (B) The classical view of protein folding. Diagram represents
the free energy of the native and denatured ensembles of a protein under conditions where the native state is favoured as the native
state has a lower free energy than the unfolded state. The free energy difference between these states (�G) is a measure of the
stability of the protein. The transition state ensemble is a population of short-lived and partially folded conformations that cannot
be directly observed in experiments but must be passed through to fold and defines the activation barrier for folding (�G# folding)
and unfolding (�G# unfolding).
For any given protein, several different folding pathways exist that allow the same protein to reach its native state bydifferent routes. Experimentally we cannot distinguish these individual ‘microscopic’ pathways and can only monitorthe ‘macroscopic’ changes along the reaction coordinate using spectroscopic methods (for example, by measuring thefluorescence or CD signal changes as the protein folds in real time). If we represent the associated free energy of the‘macroscopic’ ensemble of pathways, we generate a classical energy diagram (Figure 7B) that shows the free energy ofthe protein as it goes from an unfolded ensemble (left) to a folded ensemble (right). Often, small protein domains of afew hundred amino acids can fold in a single step, passing through a high energy transition state ensemble. However,larger protein domains often pass through a number of intermediate states that are stable but not fully folded, be-fore the process is complete. The classical view is useful to interpret experimental measurements however theoreticaland computational studies are now working on the new view of folding that tries to understand and represent themicroscopic pathways. Here, proteins are multistate objects that fold through multiple unpredictable routes and in-termediate conformations. This folding is represented by a more complex funnel-shaped energy landscape in whichthe proteins energy and number of conformational states decreases as the protein moves down the funnel.
Protein domains fold because the native state releases water to a more disordered state (increasing entropy) and thenew bonds (compared with the old bonds) usually result in heat being released, decreasing the enthalpy. Together, thiscauses the Gibbs free energy to decrease and makes folding spontaneous. However, just because the folded proteinis lower in energy than the unfolded protein, this only indicates that the process is favourable to occur. The speedat which it occurs (the rate of the reaction) is independent of �G and instead is governed by the size of the barrierbetween the energy of the unfolded protein ensemble and the energy of the transition state ensemble (also known asthe activation barrier or �G# for folding). The lower the energy of the transition state ensemble, the faster the proteinfolds, which can be as fast as microseconds. We still do not fully understand how to predict how a protein domain willfold, how favourable it will be and how fast it will proceed. One approach to learn the rules is to study how humansengage in a protein folding game. If you want to get involved and have fun trying to fold your own protein using yourcomputer, please visit the ‘fold.it’ site.
Every domain within a full-length protein will usually fold independently; however, sometimes, one or more do-mains can misfold, and the protein sometimes gets tangled up, forming a protein aggregate, which is described next.
© 2020 The Author(s). This is an open access article published by Portland Press Limited on behalf of the Biochemical Society and distributed under the Creative Commons AttributionLicense 4.0 (CC BY-NC-ND).
659
Dow
nloaded from http://portlandpress.com
/essaysbiochem/article-pdf/64/4/649/894595/ebc-2019-0042c.pdf by U
K user on 15 October 2020
Essays in Biochemistry (2020) 64 649–680https://doi.org/10.1042/EBC20190042
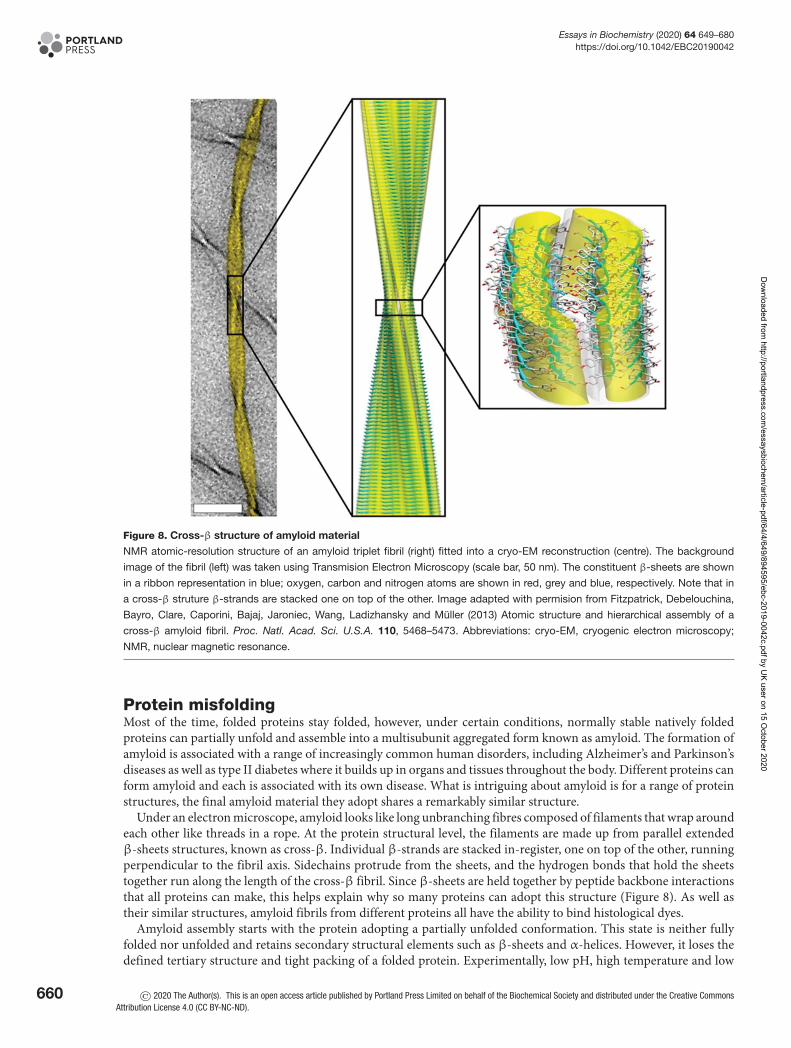
Figure 8. Cross-β structure of amyloid material
NMR atomic-resolution structure of an amyloid triplet fibril (right) fitted into a cryo-EM reconstruction (centre). The background
image of the fibril (left) was taken using Transmision Electron Microscopy (scale bar, 50 nm). The constituent β-sheets are shown
in a ribbon representation in blue; oxygen, carbon and nitrogen atoms are shown in red, grey and blue, respectively. Note that in
a cross-β struture β-strands are stacked one on top of the other. Image adapted with permision from Fitzpatrick, Debelouchina,
Bayro, Clare, Caporini, Bajaj, Jaroniec, Wang, Ladizhansky and Muller (2013) Atomic structure and hierarchical assembly of a
cross-β amyloid fibril. Proc. Natl. Acad. Sci. U.S.A. 110, 5468–5473. Abbreviations: cryo-EM, cryogenic electron microscopy;
NMR, nuclear magnetic resonance.
Protein misfoldingMost of the time, folded proteins stay folded, however, under certain conditions, normally stable natively foldedproteins can partially unfold and assemble into a multisubunit aggregated form known as amyloid. The formation ofamyloid is associated with a range of increasingly common human disorders, including Alzheimer’s and Parkinson’sdiseases as well as type II diabetes where it builds up in organs and tissues throughout the body. Different proteins canform amyloid and each is associated with its own disease. What is intriguing about amyloid is for a range of proteinstructures, the final amyloid material they adopt shares a remarkably similar structure.
Under an electron microscope, amyloid looks like long unbranching fibres composed of filaments that wrap aroundeach other like threads in a rope. At the protein structural level, the filaments are made up from parallel extendedβ-sheets structures, known as cross-β. Individual β-strands are stacked in-register, one on top of the other, runningperpendicular to the fibril axis. Sidechains protrude from the sheets, and the hydrogen bonds that hold the sheetstogether run along the length of the cross-β fibril. Since β-sheets are held together by peptide backbone interactionsthat all proteins can make, this helps explain why so many proteins can adopt this structure (Figure 8). As well astheir similar structures, amyloid fibrils from different proteins all have the ability to bind histological dyes.
Amyloid assembly starts with the protein adopting a partially unfolded conformation. This state is neither fullyfolded nor unfolded and retains secondary structural elements such as β-sheets and α-helices. However, it loses thedefined tertiary structure and tight packing of a folded protein. Experimentally, low pH, high temperature and low
660 © 2020 The Author(s). This is an open access article published by Portland Press Limited on behalf of the Biochemical Society and distributed under the Creative CommonsAttribution License 4.0 (CC BY-NC-ND).
Dow
nloaded from http://portlandpress.com
/essaysbiochem/article-pdf/64/4/649/894595/ebc-2019-0042c.pdf by U
K user on 15 October 2020
Essays in Biochemistry (2020) 64 649–680https://doi.org/10.1042/EBC20190042
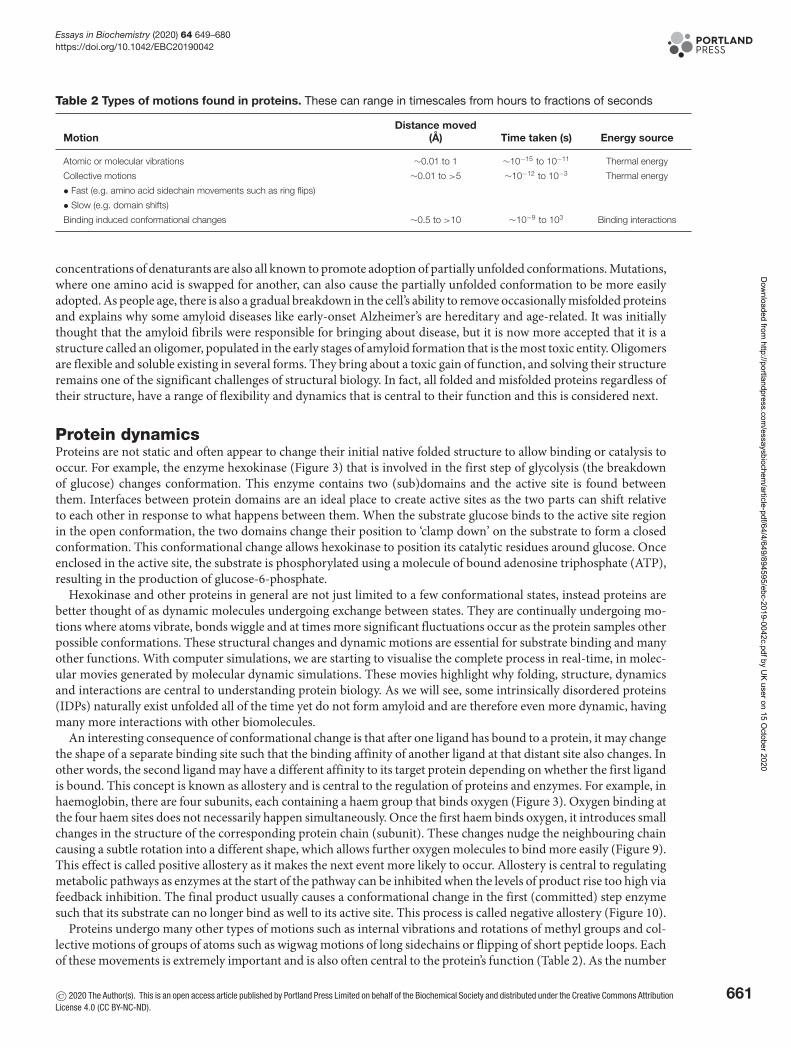
Table 2 Types of motions found in proteins. These can range in timescales from hours to fractions of seconds
MotionDistance moved
(A) Time taken (s) Energy source
Atomic or molecular vibrations ∼0.01 to 1 ∼10−15 to 10−11 Thermal energy
Collective motions ∼0.01 to >5 ∼10−12 to 10−3 Thermal energy
• Fast (e.g. amino acid sidechain movements such as ring flips)
• Slow (e.g. domain shifts)
Binding induced conformational changes ∼0.5 to >10 ∼10−9 to 103 Binding interactions
concentrations of denaturants are also all known to promote adoption of partially unfolded conformations. Mutations,where one amino acid is swapped for another, can also cause the partially unfolded conformation to be more easilyadopted. As people age, there is also a gradual breakdown in the cell’s ability to remove occasionally misfolded proteinsand explains why some amyloid diseases like early-onset Alzheimer’s are hereditary and age-related. It was initiallythought that the amyloid fibrils were responsible for bringing about disease, but it is now more accepted that it is astructure called an oligomer, populated in the early stages of amyloid formation that is the most toxic entity. Oligomersare flexible and soluble existing in several forms. They bring about a toxic gain of function, and solving their structureremains one of the significant challenges of structural biology. In fact, all folded and misfolded proteins regardless oftheir structure, have a range of flexibility and dynamics that is central to their function and this is considered next.
Protein dynamicsProteins are not static and often appear to change their initial native folded structure to allow binding or catalysis tooccur. For example, the enzyme hexokinase (Figure 3) that is involved in the first step of glycolysis (the breakdownof glucose) changes conformation. This enzyme contains two (sub)domains and the active site is found betweenthem. Interfaces between protein domains are an ideal place to create active sites as the two parts can shift relativeto each other in response to what happens between them. When the substrate glucose binds to the active site regionin the open conformation, the two domains change their position to ‘clamp down’ on the substrate to form a closedconformation. This conformational change allows hexokinase to position its catalytic residues around glucose. Onceenclosed in the active site, the substrate is phosphorylated using a molecule of bound adenosine triphosphate (ATP),resulting in the production of glucose-6-phosphate.
Hexokinase and other proteins in general are not just limited to a few conformational states, instead proteins arebetter thought of as dynamic molecules undergoing exchange between states. They are continually undergoing mo-tions where atoms vibrate, bonds wiggle and at times more significant fluctuations occur as the protein samples otherpossible conformations. These structural changes and dynamic motions are essential for substrate binding and manyother functions. With computer simulations, we are starting to visualise the complete process in real-time, in molec-ular movies generated by molecular dynamic simulations. These movies highlight why folding, structure, dynamicsand interactions are central to understanding protein biology. As we will see, some intrinsically disordered proteins(IDPs) naturally exist unfolded all of the time yet do not form amyloid and are therefore even more dynamic, havingmany more interactions with other biomolecules.
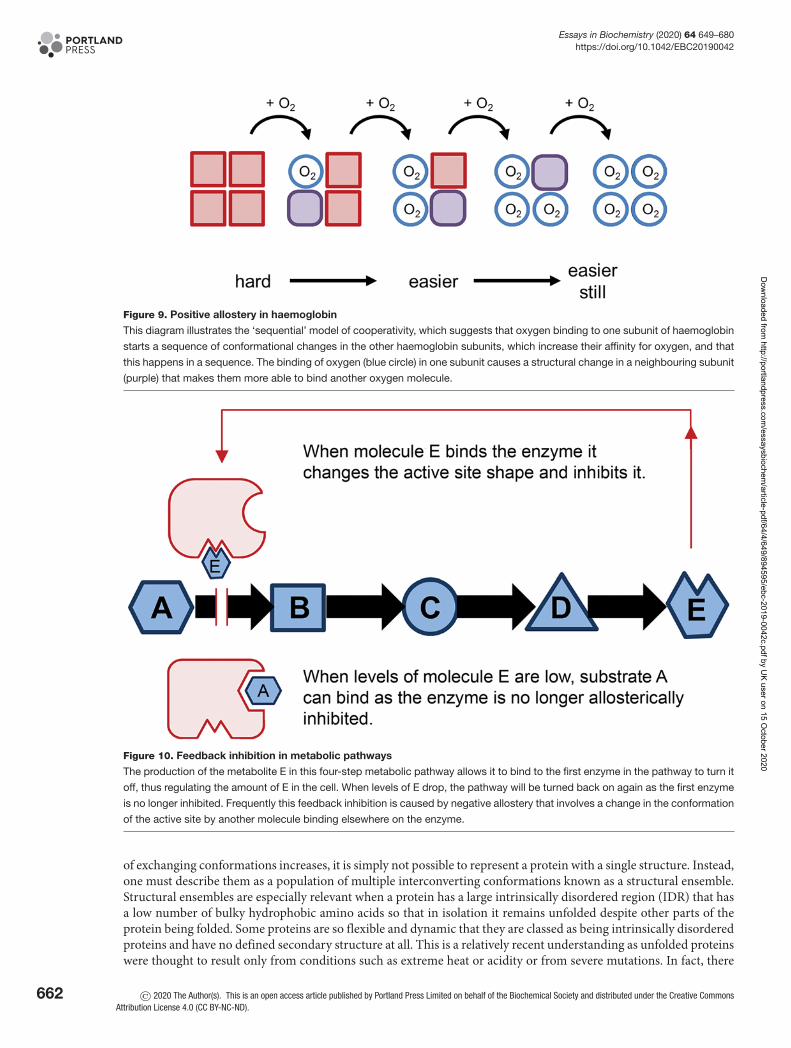
An interesting consequence of conformational change is that after one ligand has bound to a protein, it may changethe shape of a separate binding site such that the binding affinity of another ligand at that distant site also changes. Inother words, the second ligand may have a different affinity to its target protein depending on whether the first ligandis bound. This concept is known as allostery and is central to the regulation of proteins and enzymes. For example, inhaemoglobin, there are four subunits, each containing a haem group that binds oxygen (Figure 3). Oxygen binding atthe four haem sites does not necessarily happen simultaneously. Once the first haem binds oxygen, it introduces smallchanges in the structure of the corresponding protein chain (subunit). These changes nudge the neighbouring chaincausing a subtle rotation into a different shape, which allows further oxygen molecules to bind more easily (Figure 9).This effect is called positive allostery as it makes the next event more likely to occur. Allostery is central to regulatingmetabolic pathways as enzymes at the start of the pathway can be inhibited when the levels of product rise too high viafeedback inhibition. The final product usually causes a conformational change in the first (committed) step enzymesuch that its substrate can no longer bind as well to its active site. This process is called negative allostery (Figure 10).
Proteins undergo many other types of motions such as internal vibrations and rotations of methyl groups and col-lective motions of groups of atoms such as wigwag motions of long sidechains or flipping of short peptide loops. Eachof these movements is extremely important and is also often central to the protein’s function (Table 2). As the number
© 2020 The Author(s). This is an open access article published by Portland Press Limited on behalf of the Biochemical Society and distributed under the Creative Commons AttributionLicense 4.0 (CC BY-NC-ND).
661
Dow
nloaded from http://portlandpress.com
/essaysbiochem/article-pdf/64/4/649/894595/ebc-2019-0042c.pdf by U
K user on 15 October 2020
Essays in Biochemistry (2020) 64 649–680https://doi.org/10.1042/EBC20190042
Figure 9. Positive allostery in haemoglobin
This diagram illustrates the ‘sequential’ model of cooperativity, which suggests that oxygen binding to one subunit of haemoglobin
starts a sequence of conformational changes in the other haemoglobin subunits, which increase their affinity for oxygen, and that
this happens in a sequence. The binding of oxygen (blue circle) in one subunit causes a structural change in a neighbouring subunit
(purple) that makes them more able to bind another oxygen molecule.
Figure 10. Feedback inhibition in metabolic pathways
The production of the metabolite E in this four-step metabolic pathway allows it to bind to the first enzyme in the pathway to turn it
off, thus regulating the amount of E in the cell. When levels of E drop, the pathway will be turned back on again as the first enzyme
is no longer inhibited. Frequently this feedback inhibition is caused by negative allostery that involves a change in the conformation
of the active site by another molecule binding elsewhere on the enzyme.
of exchanging conformations increases, it is simply not possible to represent a protein with a single structure. Instead,one must describe them as a population of multiple interconverting conformations known as a structural ensemble.Structural ensembles are especially relevant when a protein has a large intrinsically disordered region (IDR) that hasa low number of bulky hydrophobic amino acids so that in isolation it remains unfolded despite other parts of theprotein being folded. Some proteins are so flexible and dynamic that they are classed as being intrinsically disorderedproteins and have no defined secondary structure at all. This is a relatively recent understanding as unfolded proteinswere thought to result only from conditions such as extreme heat or acidity or from severe mutations. In fact, there
662 © 2020 The Author(s). This is an open access article published by Portland Press Limited on behalf of the Biochemical Society and distributed under the Creative CommonsAttribution License 4.0 (CC BY-NC-ND).
Dow
nloaded from http://portlandpress.com
/essaysbiochem/article-pdf/64/4/649/894595/ebc-2019-0042c.pdf by U
K user on 15 October 2020
Essays in Biochemistry (2020) 64 649–680https://doi.org/10.1042/EBC20190042
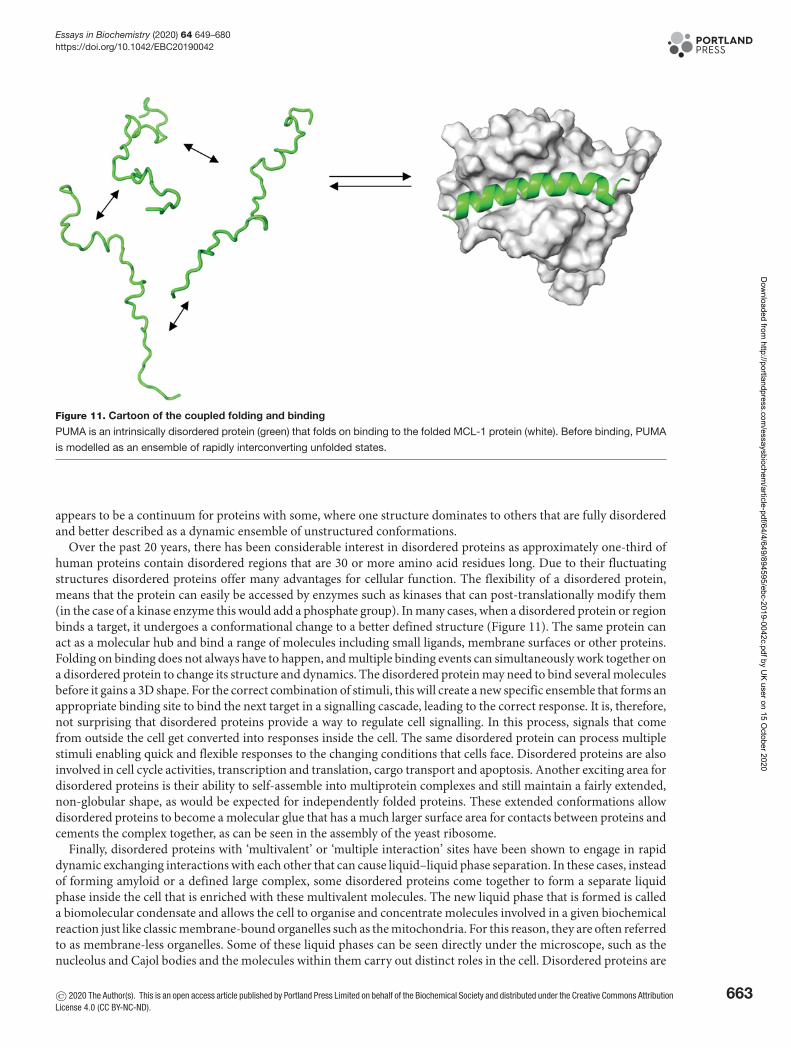
Figure 11. Cartoon of the coupled folding and binding
PUMA is an intrinsically disordered protein (green) that folds on binding to the folded MCL-1 protein (white). Before binding, PUMA
is modelled as an ensemble of rapidly interconverting unfolded states.
appears to be a continuum for proteins with some, where one structure dominates to others that are fully disorderedand better described as a dynamic ensemble of unstructured conformations.
Over the past 20 years, there has been considerable interest in disordered proteins as approximately one-third ofhuman proteins contain disordered regions that are 30 or more amino acid residues long. Due to their fluctuatingstructures disordered proteins offer many advantages for cellular function. The flexibility of a disordered protein,means that the protein can easily be accessed by enzymes such as kinases that can post-translationally modify them(in the case of a kinase enzyme this would add a phosphate group). In many cases, when a disordered protein or regionbinds a target, it undergoes a conformational change to a better defined structure (Figure 11). The same protein canact as a molecular hub and bind a range of molecules including small ligands, membrane surfaces or other proteins.Folding on binding does not always have to happen, and multiple binding events can simultaneously work together ona disordered protein to change its structure and dynamics. The disordered protein may need to bind several moleculesbefore it gains a 3D shape. For the correct combination of stimuli, this will create a new specific ensemble that forms anappropriate binding site to bind the next target in a signalling cascade, leading to the correct response. It is, therefore,not surprising that disordered proteins provide a way to regulate cell signalling. In this process, signals that comefrom outside the cell get converted into responses inside the cell. The same disordered protein can process multiplestimuli enabling quick and flexible responses to the changing conditions that cells face. Disordered proteins are alsoinvolved in cell cycle activities, transcription and translation, cargo transport and apoptosis. Another exciting area fordisordered proteins is their ability to self-assemble into multiprotein complexes and still maintain a fairly extended,non-globular shape, as would be expected for independently folded proteins. These extended conformations allowdisordered proteins to become a molecular glue that has a much larger surface area for contacts between proteins andcements the complex together, as can be seen in the assembly of the yeast ribosome.
Finally, disordered proteins with ‘multivalent’ or ‘multiple interaction’ sites have been shown to engage in rapiddynamic exchanging interactions with each other that can cause liquid–liquid phase separation. In these cases, insteadof forming amyloid or a defined large complex, some disordered proteins come together to form a separate liquidphase inside the cell that is enriched with these multivalent molecules. The new liquid phase that is formed is calleda biomolecular condensate and allows the cell to organise and concentrate molecules involved in a given biochemicalreaction just like classic membrane-bound organelles such as the mitochondria. For this reason, they are often referredto as membrane-less organelles. Some of these liquid phases can be seen directly under the microscope, such as thenucleolus and Cajol bodies and the molecules within them carry out distinct roles in the cell. Disordered proteins are
© 2020 The Author(s). This is an open access article published by Portland Press Limited on behalf of the Biochemical Society and distributed under the Creative Commons AttributionLicense 4.0 (CC BY-NC-ND).
663
Dow
nloaded from http://portlandpress.com
/essaysbiochem/article-pdf/64/4/649/894595/ebc-2019-0042c.pdf by U
K user on 15 October 2020
Essays in Biochemistry (2020) 64 649–680https://doi.org/10.1042/EBC20190042
therefore extremely important in the cell and in the future will prove central to further understanding how proteinstructure explains function.
The insights concerning protein folding, structure, dynamics and interactions have all come from using a range ofexperimental tools, which we will now explore.
Part 2: Approaches to study protein structureThere are a wide number of tools available to the structural biologist to allow protein structure and dynamics to bedetermined. Basic spectroscopic methods such as circular dichroism (CD) or fluorescence give general informationabout structure, whereas high-resolution methods such as X-ray crystallography, nuclear magnetic resonance (NMR)and cryogenic electron microscopy (cryo-EM) can provide atomic descriptions of protein structure and dynamics.Each of these tools require pure protein, usually in the form of recombinant proteins. Today a wide variety of differentbiological organisms can be genetically modified to create the required protein synthetically in large quantities, whichhas led to huge progress in methods that can study protein structure and dynamics.
Spectroscopy and lightTo study proteins, we use electromagnetic radiation (see Box 2, Properties of Light Box) to probe their structural andfunctional properties using a fundamental experimental technique called spectroscopy. Spectroscopy is the study ofthe interaction of electromagnetic radiation (light) with matter, in our case proteins. Several closely related eventscan occur depending on the amount of energy that the radiation carries. In the first example of absorption, electro-magnetic radiation is captured by a protein sample, which converts the energy of the photon into internal energy.Atoms within proteins are composed of a nucleus containing neutrons, protons and dispersed electrons. Electrons,however, are not merely floating within the atom but are instead fixed within electron orbitals. There are multiple elec-tron orbitals within an atom, and each has its an energy level associated with it. Since the energy levels of matter arequantised, only light of energy that can cause transitions from one existing energy level to another will be absorbed.The amount of energy carried by a light photon depends on wavelength. The shorter the wavelength, the higher theenergy carried by a photon; hence, ultraviolet (UV) light carries more energy than visible light. When a moleculeabsorbs a photon of the correct energy, an electron is promoted from its ground state to an excited state. This occursif the energy of the photon, corresponding to the energy gap between the ground state and an empty higher energylevel (the excited state). After absorption, the energy is then lost to the solvent as heat (thermal energy) when theelectron drops back to the ground state. An absorption spectrum measures the amount of light that passes through asample at a variety of wavelengths. The spectrum depends on the type and arrangement of atoms in the sample andcan make absorption spectra useful for identifying different molecules. In this way, absorption spectroscopy can beused to reveal some very basic information about the structure and conformational states of a protein.
Box 2 Properties of Light Box
Light is a type of energy. The nature of light is best explained based on the idea of wave-particleduality. This means that in certain experiments, light acts as a particle (photon) with discrete energy(quanta). In other experiments, light can also act as a wave that oscillates in the direction of travelcarrying electromagnetic radiation (Figure B1). Each wave is made up of an electric field and amagnetic field that oscillate perpendicular to each other and is described by a periodic function,for example a cosine operation. These oscillations consist of successive troughs and crests in theelectric and magnetic fields where the distance between two adjacent crests or troughs is calledthe wavelength (λ) which is related to the frequency of repeats within a given distance. The peaksand troughs from the electric and magnetic fields are in phase with each other and reach minima(troughs) and maxima (peaks) together. The amplitude (the height of the wave) determines how brightor dim this light is.The visible light that can be seen by the human eye is radiation within a small portion of the elec-tromagnetic spectrum. This spectrum also includes radiowaves, microwaves, infrared (IR), (visible)light, UV, X-rays and γ rays, which are named according to their wavelength. Visible light has awavelength in the 400–700 nm range (10−9 metres) whereas radio is within the metre to kilometrerange (103 metres). The wavelength is determined by the frequency of a wave or its rate of oscillation(how long it takes to complete one repeat) and is measured in Hertz where one Hertz is equal to one
664 © 2020 The Author(s). This is an open access article published by Portland Press Limited on behalf of the Biochemical Society and distributed under the Creative CommonsAttribution License 4.0 (CC BY-NC-ND).
Dow
nloaded from http://portlandpress.com
/essaysbiochem/article-pdf/64/4/649/894595/ebc-2019-0042c.pdf by U
K user on 15 October 2020
Essays in Biochemistry (2020) 64 649–680https://doi.org/10.1042/EBC20190042
oscillation per second. Shorter wavelengths have a higher Hertz and longer wavelengths have lowerHertz. The frequency of an electromagnetic wave is directly related to the energy of the photon withshorter wavelengths having higher energy, this means that an X-ray beam is higher energy than aradiowave. Frequency is converted into wavelength using (eqn 3):
f = c/λ (3)
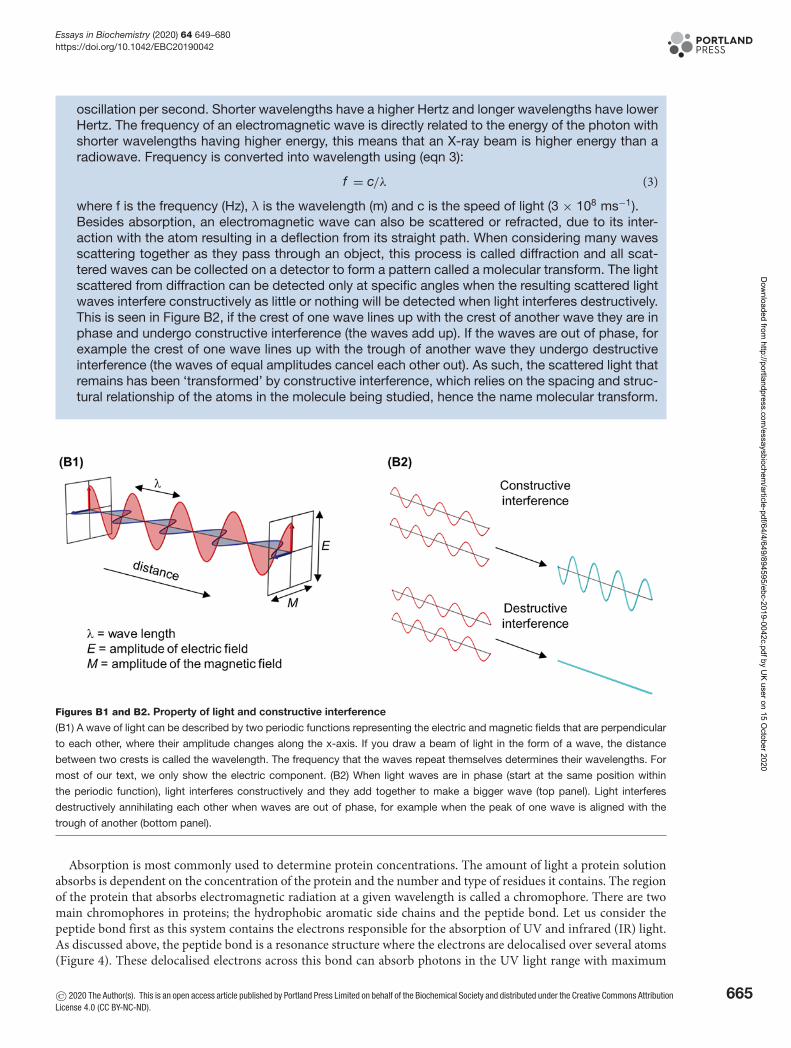
where f is the frequency (Hz), λ is the wavelength (m) and c is the speed of light (3 × 10⁸ ms−1).Besides absorption, an electromagnetic wave can also be scattered or refracted, due to its inter-action with the atom resulting in a deflection from its straight path. When considering many wavesscattering together as they pass through an object, this process is called diffraction and all scat-tered waves can be collected on a detector to form a pattern called a molecular transform. The lightscattered from diffraction can be detected only at specific angles when the resulting scattered lightwaves interfere constructively as little or nothing will be detected when light interferes destructively.This is seen in Figure B2, if the crest of one wave lines up with the crest of another wave they are inphase and undergo constructive interference (the waves add up). If the waves are out of phase, forexample the crest of one wave lines up with the trough of another wave they undergo destructiveinterference (the waves of equal amplitudes cancel each other out). As such, the scattered light thatremains has been ‘transformed’ by constructive interference, which relies on the spacing and struc-tural relationship of the atoms in the molecule being studied, hence the name molecular transform.
Figures B1 and B2. Property of light and constructive interference
(B1) A wave of light can be described by two periodic functions representing the electric and magnetic fields that are perpendicular
to each other, where their amplitude changes along the x-axis. If you draw a beam of light in the form of a wave, the distance
between two crests is called the wavelength. The frequency that the waves repeat themselves determines their wavelengths. For
most of our text, we only show the electric component. (B2) When light waves are in phase (start at the same position within
the periodic function), light interferes constructively and they add together to make a bigger wave (top panel). Light interferes
destructively annihilating each other when waves are out of phase, for example when the peak of one wave is aligned with the
trough of another (bottom panel).
Absorption is most commonly used to determine protein concentrations. The amount of light a protein solutionabsorbs is dependent on the concentration of the protein and the number and type of residues it contains. The regionof the protein that absorbs electromagnetic radiation at a given wavelength is called a chromophore. There are twomain chromophores in proteins; the hydrophobic aromatic side chains and the peptide bond. Let us consider thepeptide bond first as this system contains the electrons responsible for the absorption of UV and infrared (IR) light.As discussed above, the peptide bond is a resonance structure where the electrons are delocalised over several atoms(Figure 4). These delocalised electrons across this bond can absorb photons in the UV light range with maximum
© 2020 The Author(s). This is an open access article published by Portland Press Limited on behalf of the Biochemical Society and distributed under the Creative Commons AttributionLicense 4.0 (CC BY-NC-ND).
665
Dow
nloaded from http://portlandpress.com
/essaysbiochem/article-pdf/64/4/649/894595/ebc-2019-0042c.pdf by U
K user on 15 October 2020
Essays in Biochemistry (2020) 64 649–680https://doi.org/10.1042/EBC20190042
absorption (λmax) at ∼214 nanometres (nm). The side chains of the tryptophan, tyrosine and phenylalanine can alsoact as chromophores absorbing light in the UV region with a λmax of ∼280 nm. The amount of light absorbed (A)in a sample will increase with the cuvette pathlength (l) measured in cm and the concentration of the protein (c)measured in molarity (M). The molar extinction coefficient (ε) is a measure of how strongly a chemical species orsubstance absorbs light at a particular wavelength, and it is a constant for each protein at a set wavelength, it has theunits M−1.cm−1. These relationships define the Beer–Lambert law.
A = ε.l.c.
For a given wavelength, if the extinction coefficient (ε) is known then by measuring the amount of light that aprotein sample absorbs (A) and using the known pathlength (l), we can work out its molar concentration (c).
Circular DichroismCircular Dichroism (CD) spectroscopy is a form of UV light absorption spectroscopy that is used to determine thesecondary structure of proteins. To understand how the process works, we must investigate the properties of light.Each wavelength of light has associated time-dependent electric and magnetic fields that oscillate between peaks andtroughs in the direction of travel. The intensity of the light (amplitude) is a measure of the relative height of the wave.Wavelength is a measurement of the distance between the peaks in metres. Light waves are said to be in phase if thepeaks and troughs of the waves line up (see Box 2, Properties of Light Box). It is possible, by use of filters, to generateplane polarised light with an electric field that oscillates in just a single plane. If you are looking into the path of thislight and could see it coming towards you, vertically polarised light would oscillate up and down in a single plane.If you combine in-phase horizontally polarised light with vertically polarised light, you will generate plane polarisedlight wave that oscillates back and forth at 45 degrees (average of the two) (Figure 12A). Something exciting happenswhen you combine two perpendicular plane polarised light waves of equal amplitude, but that differ in phase by aquarter as they generate circularly polarised light. The result is an electric vector that rotates either clockwise (left)or anticlockwise (right) as it propagates. In this case, if you could see the peak of the electric field as the wave cametowards you, it would appear to rotate (Figure 12B). This circularly polarised light is shown as a spiral and referred toas left- and right-circular polarised light (LCP or RCP in Figure 12C). To view some excellent movies that illustratehow circularly polarised light is generated from combining plane polarised light, see the references in further reading.
If left- and right-circularly polarised light are superimposed, and after absorbance, the amplitudes are equal, theresult is back to generating plane polarised light (Figure 12D, left). However, if the amplitudes are unequal becauseone absorbs more than the other as the light passes through a protein sample (as seen in Figure 12C), the resultinglight is elliptically polarised light (Figure 12D, right). The angle made by the big axis of the ellipse with respect tothe original polarisation plane is measured in degrees (θ) which are the units seen on a raw CD spectrum. Since thisvalue is usually quite small, it is often quoted in millidegrees (1/1000 of a degree). Symmetrical molecules absorb left-and right-circularly polarised light equally. Non-symmetric/chiral molecules such as proteins that contain secondarystructure interact with the light and absorbed left- and right-circularly polarised components differently. Differencesin the absorption of left- and right-handed circularly polarised light by the secondary structural components of aprotein over a range of wavelengths give rise to a CD spectrum.
In practice, commercial CD instruments are based on modulation techniques. Firstly, linearly polarised light ispassed through a monochromator which selects a single wavelength. This single-wavelength light is then passedthrough a modulating device called a photoelastic modulator. The modulator produces circularly polarised light thatrapidly switches between left- and right-circularly polarised light which is projected on to the sample. The differencein absorption of each type of light is calculated by:
�A = ALCP − ARCP
Where, for a given wavelength, �A is the difference in absorption, ALCP and ARCP are the absorption of left-and right-handed circular polarised light respectively. By taking into account the pathlength of the cell (in cen-timetres) used and the concentration of the molecule (in Molarity), we can arrive at molar CD (�ε) with unitsdegrees.M−1.cm−1.
�ε = �AMolar concentration × pathlength in cm
When working with proteins, mean residue molar CD (�εMR) is used which reports the molar CD for individualprotein residues instead of the whole protein. This allows direct comparison between proteins of different sizes. To
666 © 2020 The Author(s). This is an open access article published by Portland Press Limited on behalf of the Biochemical Society and distributed under the Creative CommonsAttribution License 4.0 (CC BY-NC-ND).
Dow
nloaded from http://portlandpress.com
/essaysbiochem/article-pdf/64/4/649/894595/ebc-2019-0042c.pdf by U
K user on 15 October 2020
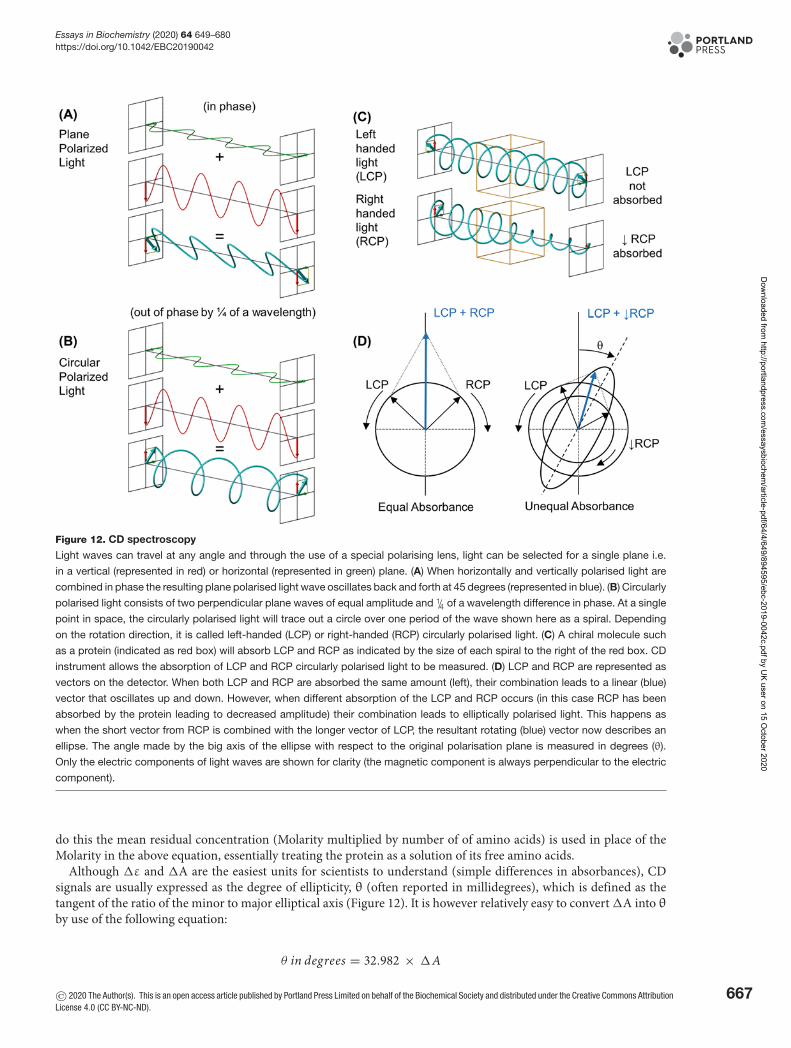
Essays in Biochemistry (2020) 64 649–680https://doi.org/10.1042/EBC20190042
Figure 12. CD spectroscopy
Light waves can travel at any angle and through the use of a special polarising lens, light can be selected for a single plane i.e.
in a vertical (represented in red) or horizontal (represented in green) plane. (A) When horizontally and vertically polarised light are
combined in phase the resulting plane polarised light wave oscillates back and forth at 45 degrees (represented in blue). (B) Circularly
polarised light consists of two perpendicular plane waves of equal amplitude and 1/4 of a wavelength difference in phase. At a single
point in space, the circularly polarised light will trace out a circle over one period of the wave shown here as a spiral. Depending
on the rotation direction, it is called left-handed (LCP) or right-handed (RCP) circularly polarised light. (C) A chiral molecule such
as a protein (indicated as red box) will absorb LCP and RCP as indicated by the size of each spiral to the right of the red box. CD
instrument allows the absorption of LCP and RCP circularly polarised light to be measured. (D) LCP and RCP are represented as
vectors on the detector. When both LCP and RCP are absorbed the same amount (left), their combination leads to a linear (blue)
vector that oscillates up and down. However, when different absorption of the LCP and RCP occurs (in this case RCP has been
absorbed by the protein leading to decreased amplitude) their combination leads to elliptically polarised light. This happens as
when the short vector from RCP is combined with the longer vector of LCP, the resultant rotating (blue) vector now describes an
ellipse. The angle made by the big axis of the ellipse with respect to the original polarisation plane is measured in degrees (θ).
Only the electric components of light waves are shown for clarity (the magnetic component is always perpendicular to the electric
component).
do this the mean residual concentration (Molarity multiplied by number of of amino acids) is used in place of theMolarity in the above equation, essentially treating the protein as a solution of its free amino acids.
Although �ε and �A are the easiest units for scientists to understand (simple differences in absorbances), CDsignals are usually expressed as the degree of ellipticity, θ (often reported in millidegrees), which is defined as thetangent of the ratio of the minor to major elliptical axis (Figure 12). It is however relatively easy to convert �A into θ
by use of the following equation:
θ in degrees = 32.982 × �A
© 2020 The Author(s). This is an open access article published by Portland Press Limited on behalf of the Biochemical Society and distributed under the Creative Commons AttributionLicense 4.0 (CC BY-NC-ND).
667
Dow
nloaded from http://portlandpress.com
/essaysbiochem/article-pdf/64/4/649/894595/ebc-2019-0042c.pdf by U
K user on 15 October 2020
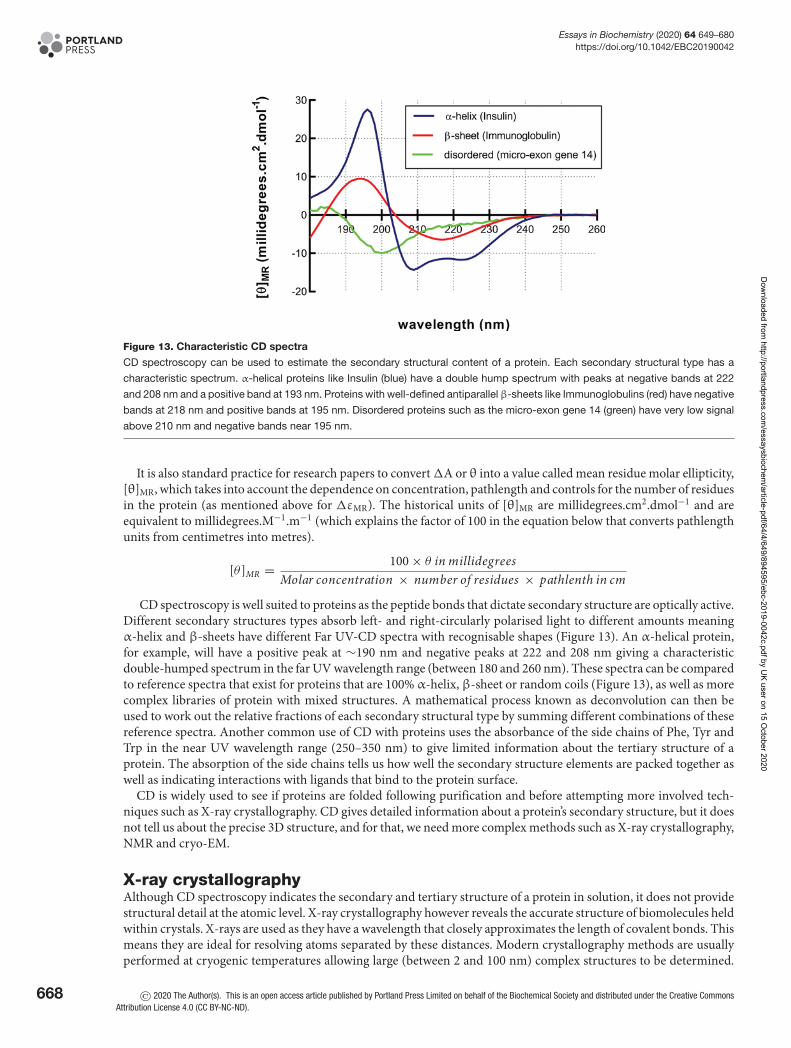
Essays in Biochemistry (2020) 64 649–680https://doi.org/10.1042/EBC20190042
Figure 13. Characteristic CD spectra
CD spectroscopy can be used to estimate the secondary structural content of a protein. Each secondary structural type has a
characteristic spectrum. α-helical proteins like Insulin (blue) have a double hump spectrum with peaks at negative bands at 222
and 208 nm and a positive band at 193 nm. Proteins with well-defined antiparallel β-sheets like Immunoglobulins (red) have negative
bands at 218 nm and positive bands at 195 nm. Disordered proteins such as the micro-exon gene 14 (green) have very low signal
above 210 nm and negative bands near 195 nm.
It is also standard practice for research papers to convert �A or θ into a value called mean residue molar ellipticity,[θ]MR, which takes into account the dependence on concentration, pathlength and controls for the number of residuesin the protein (as mentioned above for �εMR). The historical units of [θ]MR are millidegrees.cm2.dmol−1 and areequivalent to millidegrees.M−1.m−1 (which explains the factor of 100 in the equation below that converts pathlengthunits from centimetres into metres).
[θ]MR = 100 × θ in millidegreesMolar concentration × number of residues × pathlenth in cm
CD spectroscopy is well suited to proteins as the peptide bonds that dictate secondary structure are optically active.Different secondary structures types absorb left- and right-circularly polarised light to different amounts meaningα-helix and β-sheets have different Far UV-CD spectra with recognisable shapes (Figure 13). An α-helical protein,for example, will have a positive peak at ∼190 nm and negative peaks at 222 and 208 nm giving a characteristicdouble-humped spectrum in the far UV wavelength range (between 180 and 260 nm). These spectra can be comparedto reference spectra that exist for proteins that are 100% α-helix, β-sheet or random coils (Figure 13), as well as morecomplex libraries of protein with mixed structures. A mathematical process known as deconvolution can then beused to work out the relative fractions of each secondary structural type by summing different combinations of thesereference spectra. Another common use of CD with proteins uses the absorbance of the side chains of Phe, Tyr andTrp in the near UV wavelength range (250–350 nm) to give limited information about the tertiary structure of aprotein. The absorption of the side chains tells us how well the secondary structure elements are packed together aswell as indicating interactions with ligands that bind to the protein surface.
CD is widely used to see if proteins are folded following purification and before attempting more involved tech-niques such as X-ray crystallography. CD gives detailed information about a protein’s secondary structure, but it doesnot tell us about the precise 3D structure, and for that, we need more complex methods such as X-ray crystallography,NMR and cryo-EM.
X-ray crystallographyAlthough CD spectroscopy indicates the secondary and tertiary structure of a protein in solution, it does not providestructural detail at the atomic level. X-ray crystallography however reveals the accurate structure of biomolecules heldwithin crystals. X-rays are used as they have a wavelength that closely approximates the length of covalent bonds. Thismeans they are ideal for resolving atoms separated by these distances. Modern crystallography methods are usuallyperformed at cryogenic temperatures allowing large (between 2 and 100 nm) complex structures to be determined.
668 © 2020 The Author(s). This is an open access article published by Portland Press Limited on behalf of the Biochemical Society and distributed under the Creative CommonsAttribution License 4.0 (CC BY-NC-ND).
Dow
nloaded from http://portlandpress.com
/essaysbiochem/article-pdf/64/4/649/894595/ebc-2019-0042c.pdf by U
K user on 15 October 2020
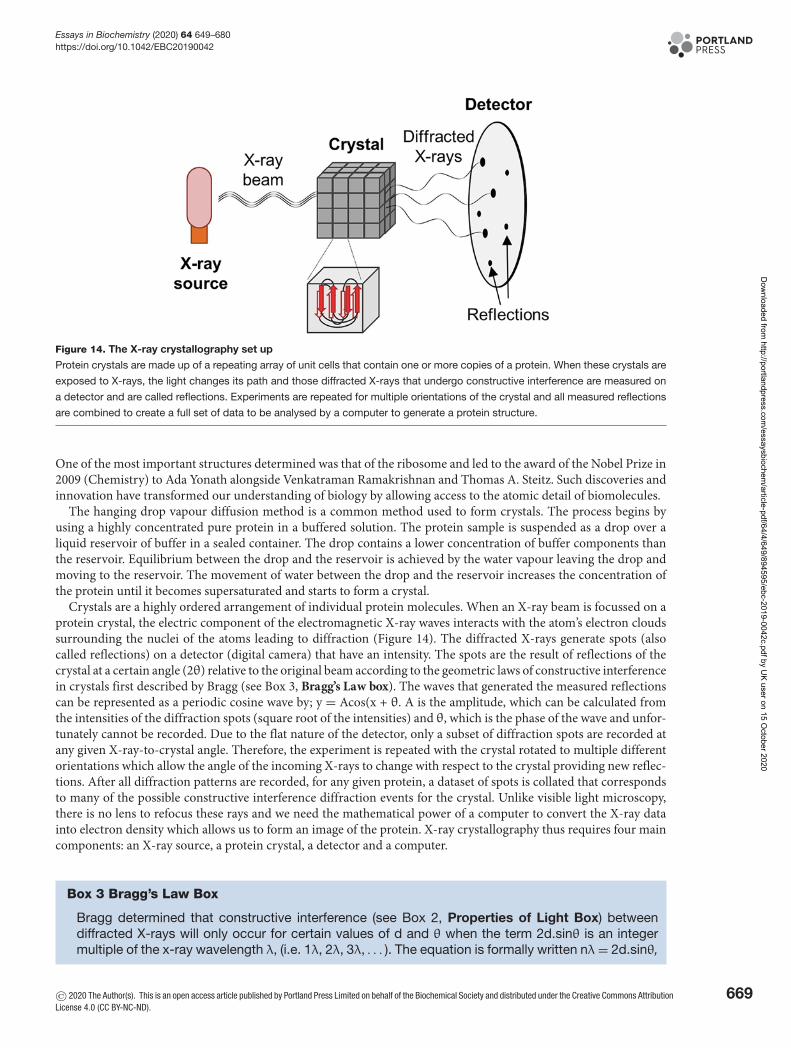
Essays in Biochemistry (2020) 64 649–680https://doi.org/10.1042/EBC20190042
Figure 14. The X-ray crystallography set up
Protein crystals are made up of a repeating array of unit cells that contain one or more copies of a protein. When these crystals are
exposed to X-rays, the light changes its path and those diffracted X-rays that undergo constructive interference are measured on
a detector and are called reflections. Experiments are repeated for multiple orientations of the crystal and all measured reflections
are combined to create a full set of data to be analysed by a computer to generate a protein structure.
One of the most important structures determined was that of the ribosome and led to the award of the Nobel Prize in2009 (Chemistry) to Ada Yonath alongside Venkatraman Ramakrishnan and Thomas A. Steitz. Such discoveries andinnovation have transformed our understanding of biology by allowing access to the atomic detail of biomolecules.
The hanging drop vapour diffusion method is a common method used to form crystals. The process begins byusing a highly concentrated pure protein in a buffered solution. The protein sample is suspended as a drop over aliquid reservoir of buffer in a sealed container. The drop contains a lower concentration of buffer components thanthe reservoir. Equilibrium between the drop and the reservoir is achieved by the water vapour leaving the drop andmoving to the reservoir. The movement of water between the drop and the reservoir increases the concentration ofthe protein until it becomes supersaturated and starts to form a crystal.
Crystals are a highly ordered arrangement of individual protein molecules. When an X-ray beam is focussed on aprotein crystal, the electric component of the electromagnetic X-ray waves interacts with the atom’s electron cloudssurrounding the nuclei of the atoms leading to diffraction (Figure 14). The diffracted X-rays generate spots (alsocalled reflections) on a detector (digital camera) that have an intensity. The spots are the result of reflections of thecrystal at a certain angle (2θ) relative to the original beam according to the geometric laws of constructive interferencein crystals first described by Bragg (see Box 3, Bragg’s Law box). The waves that generated the measured reflectionscan be represented as a periodic cosine wave by; y = Acos(x + θ. A is the amplitude, which can be calculated fromthe intensities of the diffraction spots (square root of the intensities) and θ, which is the phase of the wave and unfor-tunately cannot be recorded. Due to the flat nature of the detector, only a subset of diffraction spots are recorded atany given X-ray-to-crystal angle. Therefore, the experiment is repeated with the crystal rotated to multiple differentorientations which allow the angle of the incoming X-rays to change with respect to the crystal providing new reflec-tions. After all diffraction patterns are recorded, for any given protein, a dataset of spots is collated that correspondsto many of the possible constructive interference diffraction events for the crystal. Unlike visible light microscopy,there is no lens to refocus these rays and we need the mathematical power of a computer to convert the X-ray datainto electron density which allows us to form an image of the protein. X-ray crystallography thus requires four maincomponents: an X-ray source, a protein crystal, a detector and a computer.
Box 3 Bragg’s Law Box
Bragg determined that constructive interference (see Box 2, Properties of Light Box) betweendiffracted X-rays will only occur for certain values of d and θ when the term 2d.sinθ is an integermultiple of the x-ray wavelength λ, (i.e. 1λ, 2λ, 3λ, . . . ). The equation is formally written nλ = 2d.sinθ,
© 2020 The Author(s). This is an open access article published by Portland Press Limited on behalf of the Biochemical Society and distributed under the Creative Commons AttributionLicense 4.0 (CC BY-NC-ND).
669
Dow
nloaded from http://portlandpress.com
/essaysbiochem/article-pdf/64/4/649/894595/ebc-2019-0042c.pdf by U
K user on 15 October 2020
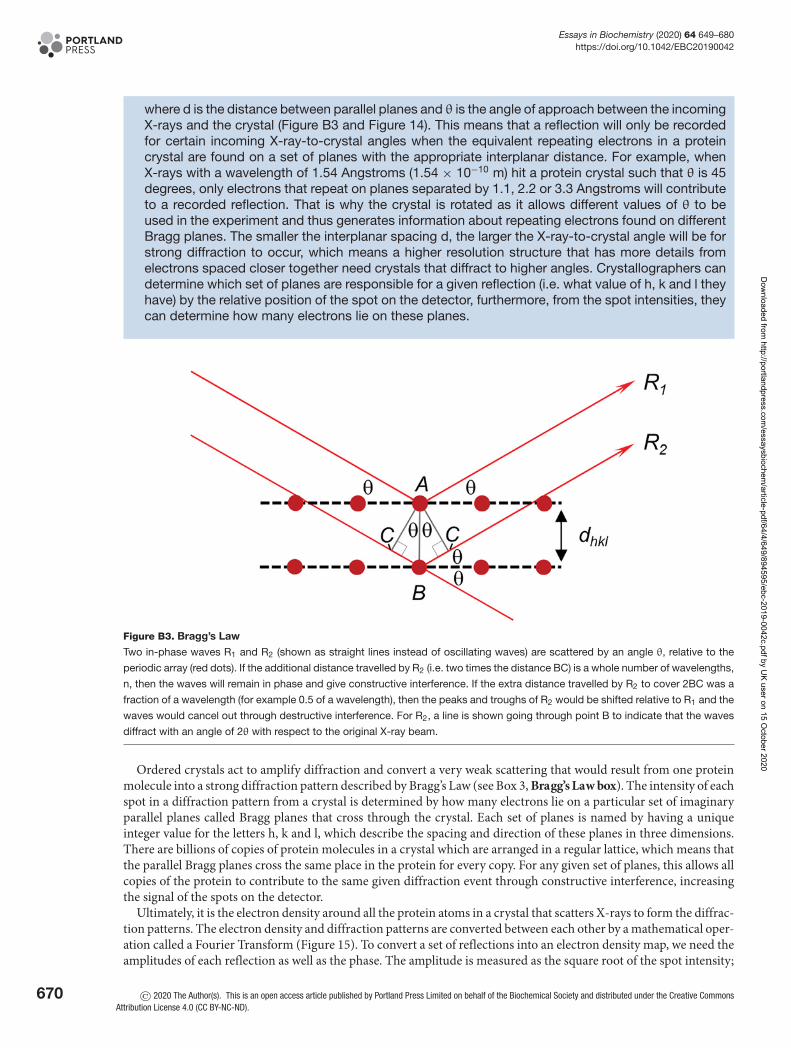
Essays in Biochemistry (2020) 64 649–680https://doi.org/10.1042/EBC20190042
where d is the distance between parallel planes and θ is the angle of approach between the incomingX-rays and the crystal (Figure B3 and Figure 14). This means that a reflection will only be recordedfor certain incoming X-ray-to-crystal angles when the equivalent repeating electrons in a proteincrystal are found on a set of planes with the appropriate interplanar distance. For example, whenX-rays with a wavelength of 1.54 Angstroms (1.54 × 10⁻¹⁰ m) hit a protein crystal such that θ is 45degrees, only electrons that repeat on planes separated by 1.1, 2.2 or 3.3 Angstroms will contributeto a recorded reflection. That is why the crystal is rotated as it allows different values of θ to beused in the experiment and thus generates information about repeating electrons found on differentBragg planes. The smaller the interplanar spacing d, the larger the X-ray-to-crystal angle will be forstrong diffraction to occur, which means a higher resolution structure that has more details fromelectrons spaced closer together need crystals that diffract to higher angles. Crystallographers candetermine which set of planes are responsible for a given reflection (i.e. what value of h, k and l theyhave) by the relative position of the spot on the detector, furthermore, from the spot intensities, theycan determine how many electrons lie on these planes.
Figure B3. Bragg’s Law
Two in-phase waves R1 and R2 (shown as straight lines instead of oscillating waves) are scattered by an angle θ, relative to the
periodic array (red dots). If the additional distance travelled by R2 (i.e. two times the distance BC) is a whole number of wavelengths,
n, then the waves will remain in phase and give constructive interference. If the extra distance travelled by R2 to cover 2BC was a
fraction of a wavelength (for example 0.5 of a wavelength), then the peaks and troughs of R2 would be shifted relative to R1 and the
waves would cancel out through destructive interference. For R2, a line is shown going through point B to indicate that the waves
diffract with an angle of 2θ with respect to the original X-ray beam.
Ordered crystals act to amplify diffraction and convert a very weak scattering that would result from one proteinmolecule into a strong diffraction pattern described by Bragg’s Law (see Box 3, Bragg’s Law box). The intensity of eachspot in a diffraction pattern from a crystal is determined by how many electrons lie on a particular set of imaginaryparallel planes called Bragg planes that cross through the crystal. Each set of planes is named by having a uniqueinteger value for the letters h, k and l, which describe the spacing and direction of these planes in three dimensions.There are billions of copies of protein molecules in a crystal which are arranged in a regular lattice, which means thatthe parallel Bragg planes cross the same place in the protein for every copy. For any given set of planes, this allows allcopies of the protein to contribute to the same given diffraction event through constructive interference, increasingthe signal of the spots on the detector.
Ultimately, it is the electron density around all the protein atoms in a crystal that scatters X-rays to form the diffrac-tion patterns. The electron density and diffraction patterns are converted between each other by a mathematical oper-ation called a Fourier Transform (Figure 15). To convert a set of reflections into an electron density map, we need theamplitudes of each reflection as well as the phase. The amplitude is measured as the square root of the spot intensity;
670 © 2020 The Author(s). This is an open access article published by Portland Press Limited on behalf of the Biochemical Society and distributed under the Creative CommonsAttribution License 4.0 (CC BY-NC-ND).
Dow
nloaded from http://portlandpress.com
/essaysbiochem/article-pdf/64/4/649/894595/ebc-2019-0042c.pdf by U
K user on 15 October 2020
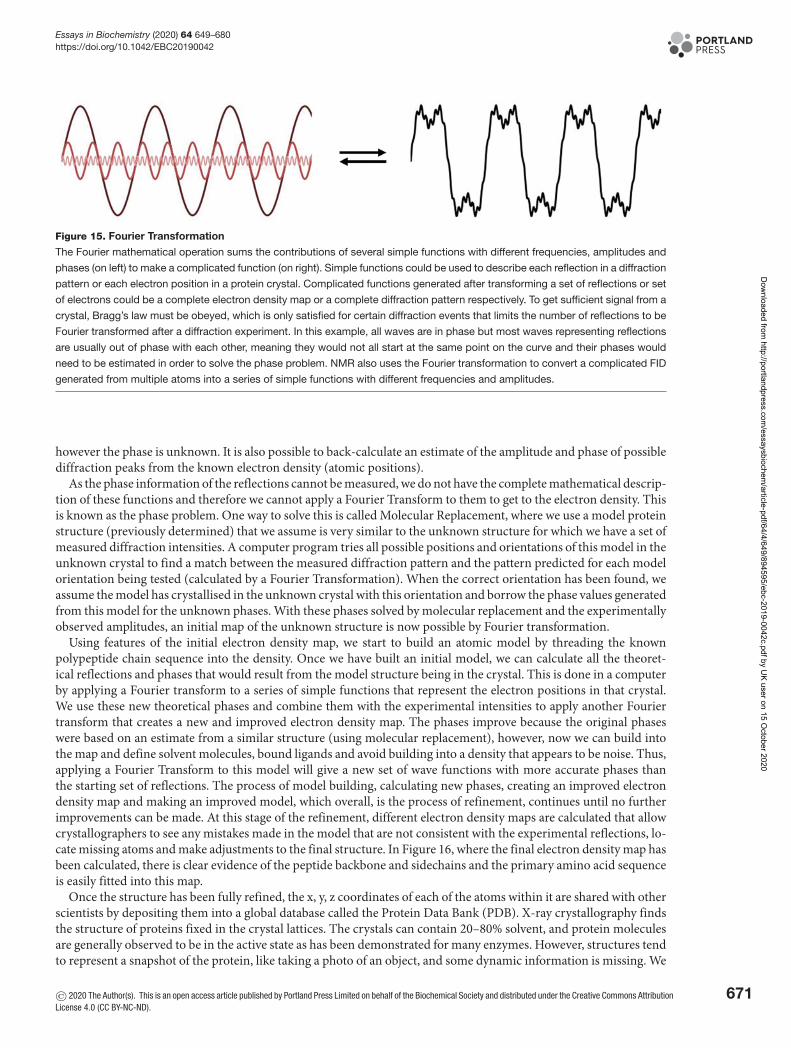
Essays in Biochemistry (2020) 64 649–680https://doi.org/10.1042/EBC20190042
Figure 15. Fourier Transformation
The Fourier mathematical operation sums the contributions of several simple functions with different frequencies, amplitudes and
phases (on left) to make a complicated function (on right). Simple functions could be used to describe each reflection in a diffraction
pattern or each electron position in a protein crystal. Complicated functions generated after transforming a set of reflections or set
of electrons could be a complete electron density map or a complete diffraction pattern respectively. To get sufficient signal from a
crystal, Bragg’s law must be obeyed, which is only satisfied for certain diffraction events that limits the number of reflections to be
Fourier transformed after a diffraction experiment. In this example, all waves are in phase but most waves representing reflections
are usually out of phase with each other, meaning they would not all start at the same point on the curve and their phases would
need to be estimated in order to solve the phase problem. NMR also uses the Fourier transformation to convert a complicated FID
generated from multiple atoms into a series of simple functions with different frequencies and amplitudes.
however the phase is unknown. It is also possible to back-calculate an estimate of the amplitude and phase of possiblediffraction peaks from the known electron density (atomic positions).
As the phase information of the reflections cannot be measured, we do not have the complete mathematical descrip-tion of these functions and therefore we cannot apply a Fourier Transform to them to get to the electron density. Thisis known as the phase problem. One way to solve this is called Molecular Replacement, where we use a model proteinstructure (previously determined) that we assume is very similar to the unknown structure for which we have a set ofmeasured diffraction intensities. A computer program tries all possible positions and orientations of this model in theunknown crystal to find a match between the measured diffraction pattern and the pattern predicted for each modelorientation being tested (calculated by a Fourier Transformation). When the correct orientation has been found, weassume the model has crystallised in the unknown crystal with this orientation and borrow the phase values generatedfrom this model for the unknown phases. With these phases solved by molecular replacement and the experimentallyobserved amplitudes, an initial map of the unknown structure is now possible by Fourier transformation.
Using features of the initial electron density map, we start to build an atomic model by threading the knownpolypeptide chain sequence into the density. Once we have built an initial model, we can calculate all the theoret-ical reflections and phases that would result from the model structure being in the crystal. This is done in a computerby applying a Fourier transform to a series of simple functions that represent the electron positions in that crystal.We use these new theoretical phases and combine them with the experimental intensities to apply another Fouriertransform that creates a new and improved electron density map. The phases improve because the original phaseswere based on an estimate from a similar structure (using molecular replacement), however, now we can build intothe map and define solvent molecules, bound ligands and avoid building into a density that appears to be noise. Thus,applying a Fourier Transform to this model will give a new set of wave functions with more accurate phases thanthe starting set of reflections. The process of model building, calculating new phases, creating an improved electrondensity map and making an improved model, which overall, is the process of refinement, continues until no furtherimprovements can be made. At this stage of the refinement, different electron density maps are calculated that allowcrystallographers to see any mistakes made in the model that are not consistent with the experimental reflections, lo-cate missing atoms and make adjustments to the final structure. In Figure 16, where the final electron density map hasbeen calculated, there is clear evidence of the peptide backbone and sidechains and the primary amino acid sequenceis easily fitted into this map.
Once the structure has been fully refined, the x, y, z coordinates of each of the atoms within it are shared with otherscientists by depositing them into a global database called the Protein Data Bank (PDB). X-ray crystallography findsthe structure of proteins fixed in the crystal lattices. The crystals can contain 20–80% solvent, and protein moleculesare generally observed to be in the active state as has been demonstrated for many enzymes. However, structures tendto represent a snapshot of the protein, like taking a photo of an object, and some dynamic information is missing. We
© 2020 The Author(s). This is an open access article published by Portland Press Limited on behalf of the Biochemical Society and distributed under the Creative Commons AttributionLicense 4.0 (CC BY-NC-ND).
671
Dow
nloaded from http://portlandpress.com
/essaysbiochem/article-pdf/64/4/649/894595/ebc-2019-0042c.pdf by U
K user on 15 October 2020
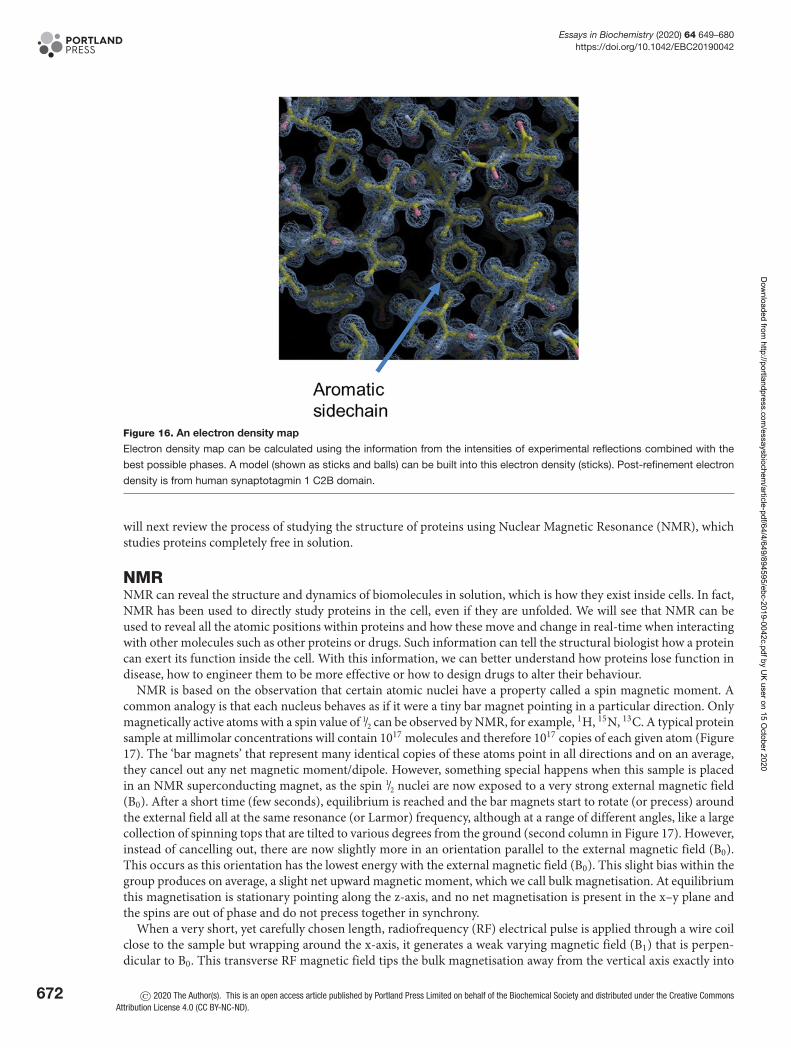
Essays in Biochemistry (2020) 64 649–680https://doi.org/10.1042/EBC20190042
Figure 16. An electron density map
Electron density map can be calculated using the information from the intensities of experimental reflections combined with the
best possible phases. A model (shown as sticks and balls) can be built into this electron density (sticks). Post-refinement electron
density is from human synaptotagmin 1 C2B domain.
will next review the process of studying the structure of proteins using Nuclear Magnetic Resonance (NMR), whichstudies proteins completely free in solution.
NMRNMR can reveal the structure and dynamics of biomolecules in solution, which is how they exist inside cells. In fact,NMR has been used to directly study proteins in the cell, even if they are unfolded. We will see that NMR can beused to reveal all the atomic positions within proteins and how these move and change in real-time when interactingwith other molecules such as other proteins or drugs. Such information can tell the structural biologist how a proteincan exert its function inside the cell. With this information, we can better understand how proteins lose function indisease, how to engineer them to be more effective or how to design drugs to alter their behaviour.
NMR is based on the observation that certain atomic nuclei have a property called a spin magnetic moment. Acommon analogy is that each nucleus behaves as if it were a tiny bar magnet pointing in a particular direction. Onlymagnetically active atoms with a spin value of 1/2 can be observed by NMR, for example, 1H, 15N, 13C. A typical proteinsample at millimolar concentrations will contain 1017 molecules and therefore 1017 copies of each given atom (Figure17). The ‘bar magnets’ that represent many identical copies of these atoms point in all directions and on an average,they cancel out any net magnetic moment/dipole. However, something special happens when this sample is placedin an NMR superconducting magnet, as the spin 1/2 nuclei are now exposed to a very strong external magnetic field(B0). After a short time (few seconds), equilibrium is reached and the bar magnets start to rotate (or precess) aroundthe external field all at the same resonance (or Larmor) frequency, although at a range of different angles, like a largecollection of spinning tops that are tilted to various degrees from the ground (second column in Figure 17). However,instead of cancelling out, there are now slightly more in an orientation parallel to the external magnetic field (B0).This occurs as this orientation has the lowest energy with the external magnetic field (B0). This slight bias within thegroup produces on average, a slight net upward magnetic moment, which we call bulk magnetisation. At equilibriumthis magnetisation is stationary pointing along the z-axis, and no net magnetisation is present in the x–y plane andthe spins are out of phase and do not precess together in synchrony.
When a very short, yet carefully chosen length, radiofrequency (RF) electrical pulse is applied through a wire coilclose to the sample but wrapping around the x-axis, it generates a weak varying magnetic field (B1) that is perpen-dicular to B0. This transverse RF magnetic field tips the bulk magnetisation away from the vertical axis exactly into
672 © 2020 The Author(s). This is an open access article published by Portland Press Limited on behalf of the Biochemical Society and distributed under the Creative CommonsAttribution License 4.0 (CC BY-NC-ND).
Dow
nloaded from http://portlandpress.com
/essaysbiochem/article-pdf/64/4/649/894595/ebc-2019-0042c.pdf by U
K user on 15 October 2020
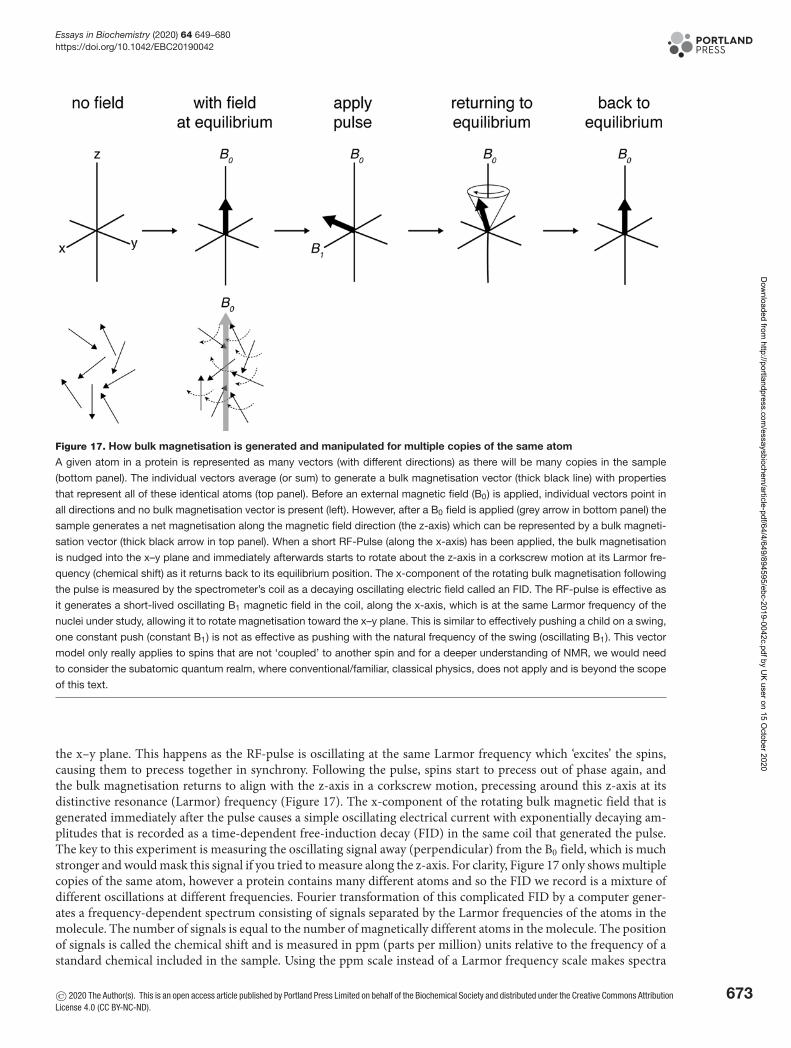
Essays in Biochemistry (2020) 64 649–680https://doi.org/10.1042/EBC20190042
Figure 17. How bulk magnetisation is generated and manipulated for multiple copies of the same atom
A given atom in a protein is represented as many vectors (with different directions) as there will be many copies in the sample
(bottom panel). The individual vectors average (or sum) to generate a bulk magnetisation vector (thick black line) with properties
that represent all of these identical atoms (top panel). Before an external magnetic field (B0) is applied, individual vectors point in
all directions and no bulk magnetisation vector is present (left). However, after a B0 field is applied (grey arrow in bottom panel) the
sample generates a net magnetisation along the magnetic field direction (the z-axis) which can be represented by a bulk magneti-
sation vector (thick black arrow in top panel). When a short RF-Pulse (along the x-axis) has been applied, the bulk magnetisation
is nudged into the x–y plane and immediately afterwards starts to rotate about the z-axis in a corkscrew motion at its Larmor fre-
quency (chemical shift) as it returns back to its equilibrium position. The x-component of the rotating bulk magnetisation following
the pulse is measured by the spectrometer’s coil as a decaying oscillating electric field called an FID. The RF-pulse is effective as
it generates a short-lived oscillating B1 magnetic field in the coil, along the x-axis, which is at the same Larmor frequency of the
nuclei under study, allowing it to rotate magnetisation toward the x–y plane. This is similar to effectively pushing a child on a swing,
one constant push (constant B1) is not as effective as pushing with the natural frequency of the swing (oscillating B1). This vector
model only really applies to spins that are not ‘coupled’ to another spin and for a deeper understanding of NMR, we would need
to consider the subatomic quantum realm, where conventional/familiar, classical physics, does not apply and is beyond the scope
of this text.
the x–y plane. This happens as the RF-pulse is oscillating at the same Larmor frequency which ‘excites’ the spins,causing them to precess together in synchrony. Following the pulse, spins start to precess out of phase again, andthe bulk magnetisation returns to align with the z-axis in a corkscrew motion, precessing around this z-axis at itsdistinctive resonance (Larmor) frequency (Figure 17). The x-component of the rotating bulk magnetic field that isgenerated immediately after the pulse causes a simple oscillating electrical current with exponentially decaying am-plitudes that is recorded as a time-dependent free-induction decay (FID) in the same coil that generated the pulse.The key to this experiment is measuring the oscillating signal away (perpendicular) from the B0 field, which is muchstronger and would mask this signal if you tried to measure along the z-axis. For clarity, Figure 17 only shows multiplecopies of the same atom, however a protein contains many different atoms and so the FID we record is a mixture ofdifferent oscillations at different frequencies. Fourier transformation of this complicated FID by a computer gener-ates a frequency-dependent spectrum consisting of signals separated by the Larmor frequencies of the atoms in themolecule. The number of signals is equal to the number of magnetically different atoms in the molecule. The positionof signals is called the chemical shift and is measured in ppm (parts per million) units relative to the frequency of astandard chemical included in the sample. Using the ppm scale instead of a Larmor frequency scale makes spectra
© 2020 The Author(s). This is an open access article published by Portland Press Limited on behalf of the Biochemical Society and distributed under the Creative Commons AttributionLicense 4.0 (CC BY-NC-ND).
673
Dow
nloaded from http://portlandpress.com
/essaysbiochem/article-pdf/64/4/649/894595/ebc-2019-0042c.pdf by U
K user on 15 October 2020
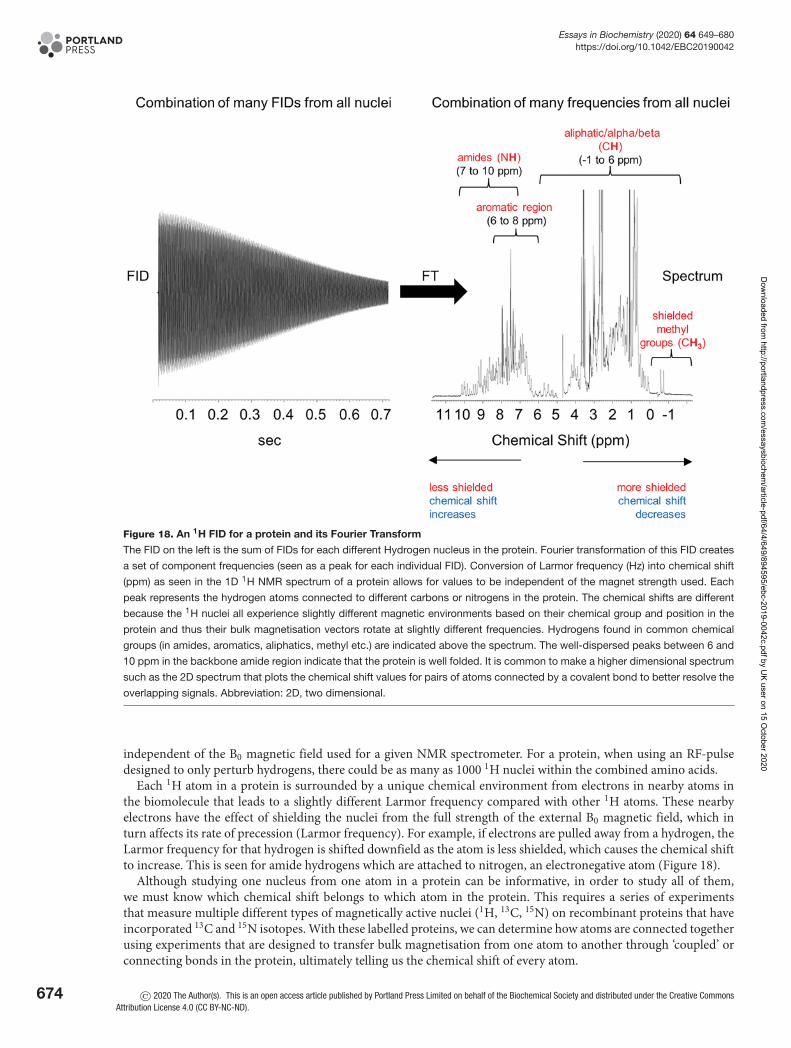
Essays in Biochemistry (2020) 64 649–680https://doi.org/10.1042/EBC20190042
Figure 18. An 1H FID for a protein and its Fourier Transform
The FID on the left is the sum of FIDs for each different Hydrogen nucleus in the protein. Fourier transformation of this FID creates
a set of component frequencies (seen as a peak for each individual FID). Conversion of Larmor frequency (Hz) into chemical shift
(ppm) as seen in the 1D 1H NMR spectrum of a protein allows for values to be independent of the magnet strength used. Each
peak represents the hydrogen atoms connected to different carbons or nitrogens in the protein. The chemical shifts are different
because the 1H nuclei all experience slightly different magnetic environments based on their chemical group and position in the
protein and thus their bulk magnetisation vectors rotate at slightly different frequencies. Hydrogens found in common chemical
groups (in amides, aromatics, aliphatics, methyl etc.) are indicated above the spectrum. The well-dispersed peaks between 6 and
10 ppm in the backbone amide region indicate that the protein is well folded. It is common to make a higher dimensional spectrum
such as the 2D spectrum that plots the chemical shift values for pairs of atoms connected by a covalent bond to better resolve the
overlapping signals. Abbreviation: 2D, two dimensional.
independent of the B0 magnetic field used for a given NMR spectrometer. For a protein, when using an RF-pulsedesigned to only perturb hydrogens, there could be as many as 1000 1H nuclei within the combined amino acids.
Each 1H atom in a protein is surrounded by a unique chemical environment from electrons in nearby atoms inthe biomolecule that leads to a slightly different Larmor frequency compared with other 1H atoms. These nearbyelectrons have the effect of shielding the nuclei from the full strength of the external B0 magnetic field, which inturn affects its rate of precession (Larmor frequency). For example, if electrons are pulled away from a hydrogen, theLarmor frequency for that hydrogen is shifted downfield as the atom is less shielded, which causes the chemical shiftto increase. This is seen for amide hydrogens which are attached to nitrogen, an electronegative atom (Figure 18).
Although studying one nucleus from one atom in a protein can be informative, in order to study all of them,we must know which chemical shift belongs to which atom in the protein. This requires a series of experimentsthat measure multiple different types of magnetically active nuclei (1H, 13C, 15N) on recombinant proteins that haveincorporated 13C and 15N isotopes. With these labelled proteins, we can determine how atoms are connected togetherusing experiments that are designed to transfer bulk magnetisation from one atom to another through ‘coupled’ orconnecting bonds in the protein, ultimately telling us the chemical shift of every atom.
674 © 2020 The Author(s). This is an open access article published by Portland Press Limited on behalf of the Biochemical Society and distributed under the Creative CommonsAttribution License 4.0 (CC BY-NC-ND).
Dow
nloaded from http://portlandpress.com
/essaysbiochem/article-pdf/64/4/649/894595/ebc-2019-0042c.pdf by U
K user on 15 October 2020
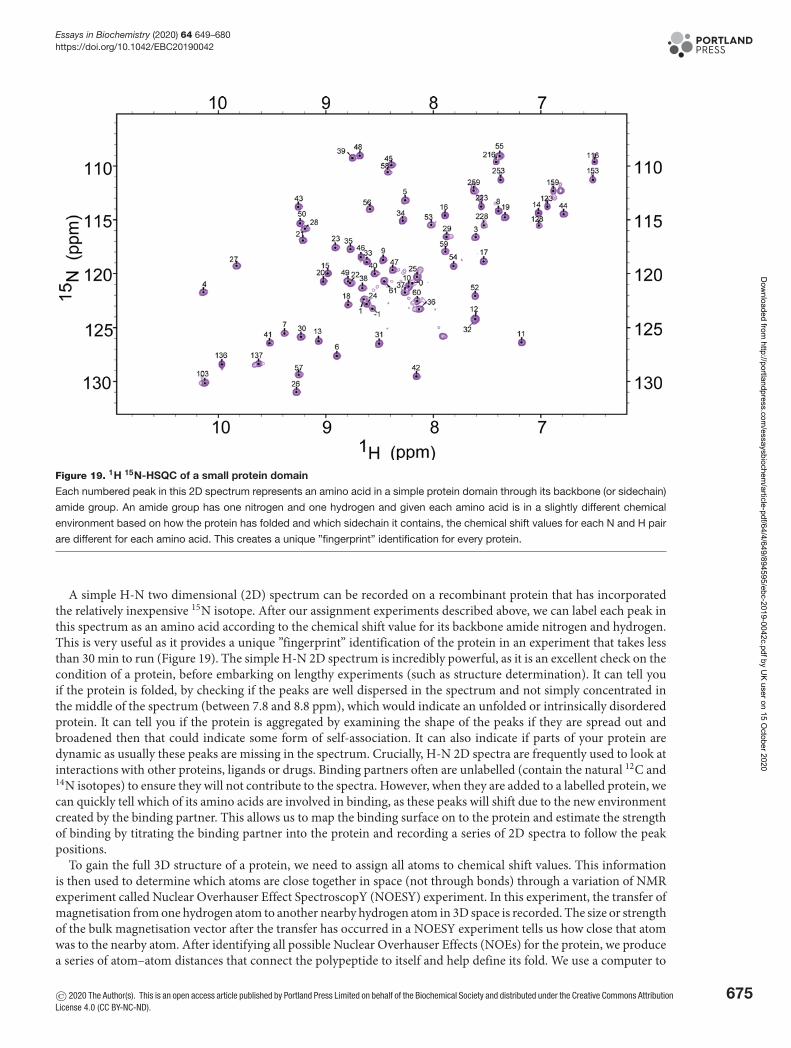
Essays in Biochemistry (2020) 64 649–680https://doi.org/10.1042/EBC20190042
Figure 19. 1H 15N-HSQC of a small protein domain
Each numbered peak in this 2D spectrum represents an amino acid in a simple protein domain through its backbone (or sidechain)
amide group. An amide group has one nitrogen and one hydrogen and given each amino acid is in a slightly different chemical
environment based on how the protein has folded and which sidechain it contains, the chemical shift values for each N and H pair
are different for each amino acid. This creates a unique ”fingerprint” identification for every protein.
A simple H-N two dimensional (2D) spectrum can be recorded on a recombinant protein that has incorporatedthe relatively inexpensive 15N isotope. After our assignment experiments described above, we can label each peak inthis spectrum as an amino acid according to the chemical shift value for its backbone amide nitrogen and hydrogen.This is very useful as it provides a unique ”fingerprint” identification of the protein in an experiment that takes lessthan 30 min to run (Figure 19). The simple H-N 2D spectrum is incredibly powerful, as it is an excellent check on thecondition of a protein, before embarking on lengthy experiments (such as structure determination). It can tell youif the protein is folded, by checking if the peaks are well dispersed in the spectrum and not simply concentrated inthe middle of the spectrum (between 7.8 and 8.8 ppm), which would indicate an unfolded or intrinsically disorderedprotein. It can tell you if the protein is aggregated by examining the shape of the peaks if they are spread out andbroadened then that could indicate some form of self-association. It can also indicate if parts of your protein aredynamic as usually these peaks are missing in the spectrum. Crucially, H-N 2D spectra are frequently used to look atinteractions with other proteins, ligands or drugs. Binding partners often are unlabelled (contain the natural 12C and14N isotopes) to ensure they will not contribute to the spectra. However, when they are added to a labelled protein, wecan quickly tell which of its amino acids are involved in binding, as these peaks will shift due to the new environmentcreated by the binding partner. This allows us to map the binding surface on to the protein and estimate the strengthof binding by titrating the binding partner into the protein and recording a series of 2D spectra to follow the peakpositions.
To gain the full 3D structure of a protein, we need to assign all atoms to chemical shift values. This informationis then used to determine which atoms are close together in space (not through bonds) through a variation of NMRexperiment called Nuclear Overhauser Effect SpectroscopY (NOESY) experiment. In this experiment, the transfer ofmagnetisation from one hydrogen atom to another nearby hydrogen atom in 3D space is recorded. The size or strengthof the bulk magnetisation vector after the transfer has occurred in a NOESY experiment tells us how close that atomwas to the nearby atom. After identifying all possible Nuclear Overhauser Effects (NOEs) for the protein, we producea series of atom–atom distances that connect the polypeptide to itself and help define its fold. We use a computer to
© 2020 The Author(s). This is an open access article published by Portland Press Limited on behalf of the Biochemical Society and distributed under the Creative Commons AttributionLicense 4.0 (CC BY-NC-ND).
675
Dow
nloaded from http://portlandpress.com
/essaysbiochem/article-pdf/64/4/649/894595/ebc-2019-0042c.pdf by U
K user on 15 October 2020
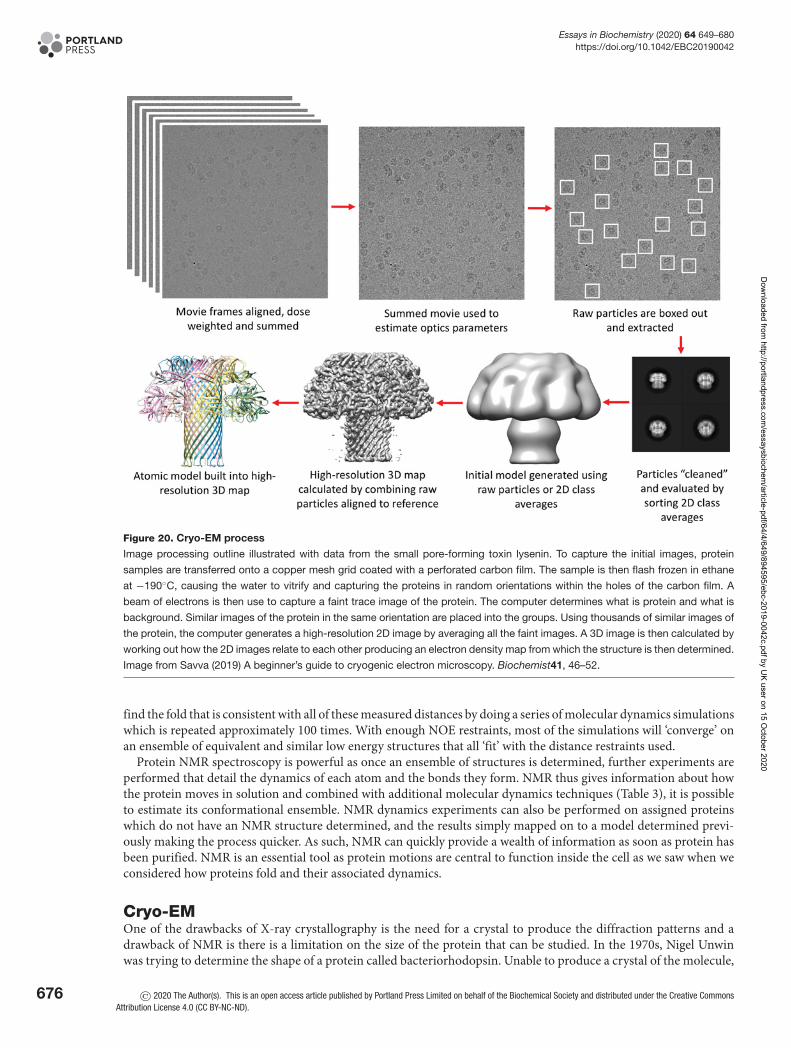
Essays in Biochemistry (2020) 64 649–680https://doi.org/10.1042/EBC20190042
Figure 20. Cryo-EM process
Image processing outline illustrated with data from the small pore-forming toxin lysenin. To capture the initial images, protein
samples are transferred onto a copper mesh grid coated with a perforated carbon film. The sample is then flash frozen in ethane
at −190◦C, causing the water to vitrify and capturing the proteins in random orientations within the holes of the carbon film. A
beam of electrons is then use to capture a faint trace image of the protein. The computer determines what is protein and what is
background. Similar images of the protein in the same orientation are placed into the groups. Using thousands of similar images of
the protein, the computer generates a high-resolution 2D image by averaging all the faint images. A 3D image is then calculated by
working out how the 2D images relate to each other producing an electron density map from which the structure is then determined.
Image from Savva (2019) A beginner’s guide to cryogenic electron microscopy. Biochemist41, 46–52.
find the fold that is consistent with all of these measured distances by doing a series of molecular dynamics simulationswhich is repeated approximately 100 times. With enough NOE restraints, most of the simulations will ‘converge’ onan ensemble of equivalent and similar low energy structures that all ‘fit’ with the distance restraints used.
Protein NMR spectroscopy is powerful as once an ensemble of structures is determined, further experiments areperformed that detail the dynamics of each atom and the bonds they form. NMR thus gives information about howthe protein moves in solution and combined with additional molecular dynamics techniques (Table 3), it is possibleto estimate its conformational ensemble. NMR dynamics experiments can also be performed on assigned proteinswhich do not have an NMR structure determined, and the results simply mapped on to a model determined previ-ously making the process quicker. As such, NMR can quickly provide a wealth of information as soon as protein hasbeen purified. NMR is an essential tool as protein motions are central to function inside the cell as we saw when weconsidered how proteins fold and their associated dynamics.
Cryo-EMOne of the drawbacks of X-ray crystallography is the need for a crystal to produce the diffraction patterns and adrawback of NMR is there is a limitation on the size of the protein that can be studied. In the 1970s, Nigel Unwinwas trying to determine the shape of a protein called bacteriorhodopsin. Unable to produce a crystal of the molecule,
676 © 2020 The Author(s). This is an open access article published by Portland Press Limited on behalf of the Biochemical Society and distributed under the Creative CommonsAttribution License 4.0 (CC BY-NC-ND).
Dow
nloaded from http://portlandpress.com
/essaysbiochem/article-pdf/64/4/649/894595/ebc-2019-0042c.pdf by U
K user on 15 October 2020

Essays in Biochemistry (2020) 64 649–680https://doi.org/10.1042/EBC20190042
Table 3 Other methods used to study protein structure and their interactions
Scientific concept What does it tell you?How long does it take and how many
samples can be analysed?
Small Angle X-Ray Scattering (SAXS)
Diffraction by non-crystalline samples that arepowders or in solution, in which all the moleculesare randomly oriented is usually called scattering.The diffraction pattern is averaged in all directions,spherically, because the X-ray beam encountersall the possible orientations of the molecules inthe sample. The diffraction pattern still containsinformation about how the electron density varieswith distance from the centre of the moleculesthat make up that sample.
Analysing the intensities at different X-ray tosample (small) angles provides a distancedistribution function which gives the frequenciesof all possible intramolecular distances in aprotein. From this you can model the overallprotein shape and generate a simple proteinenvelope. Since samples are in solution you caneasily detect dynamics, binding andconformational changes. The data also allow youto calculate a radius of gyration (the distance themass is spread).
The data can be recorded relatively quickly in 1day and only requires well matched buffersolutions to subtract any scattering contributionfrom buffer. Some facilities can now analysemultiple samples within a 96-well plate but mostcommonly only one sample can be measured at atime.
Isothermal Titration Calorimetry
Measuring heat changes when adding moleculesto protein solutions.
It tells you how well the molecule binds and theenthalpy, entropy and free energy of theinteraction.
One titration for one interaction takesapproximately 2 h.
Native Mass Spectrometry
Electrospray ionisation works by passing a currentthrough a volatile solvent. This causes proteincomplexes to become ionised and move into thegas phase. The molecular mass can becalculated by how long it takes an ion to travel aset distance. This is called time of flight (TOF).
The molecular weight of proteins and complexescan be determined in the gas phase. It can beused to tell you through changes in mass, if theprotein has bound to another molecule, forexample, a metal ion or drug.
Each spectrum can be acquired in a few secondsso many samples can be measured in a day butdata analysis can take many more hours.
General Fluorescence
Fluorescence involves using a beam of light, thatexcites the electrons in molecules of certaincompounds and causes them to emit light of alonger wavelength.
Different fluorophores absorb and emit light atdifferent wavelengths dependent on their localenvironment. For example, the molecule8-anilino-1-naphthalenesulphonic acid (ANS) is anextensively utilised fluorescent probe for thecharacterisation of proteins and binding sites as itonly fluoresces when bound to hydrophobicpatches on a protein.
The process is very rapid, occurring withinmilliseconds. By use of multiwell plate readers,many hundreds of measurements can berecorded within a few minutes.
Differential Scanning Fluorimetry
When proteins are folded they bury theirhydrophobic core and cannot bind a fluorescentdye. Using heat during a temperature ramp theprotein unfolds and binds the dye and thefluorescence of the dye increases.
It tells you the temperature at which half theprotein is unfolded, also known as the Tm. If youadd a drug molecule to the protein the Tm
increases and this can tell you how well it binds.
You can measure 96 samples in just 1 h. It is verypopular for screening many binding partners andbuffer conditions.
Intrinsic Tryptophan Fluorescence
Within proteins the amino acid side chain oftryptophan is fluorescent. The wavelength of lightemitted ranges from ∼300 nm in non-polarenvironments such as the inside of a protein to350 nm in aqueous polar environments found onthe surface.
As the peak wavelength of light emitted isdependent on the environment around the aminoacid side chain, fluorescence can be used as avery sensitive measurement of the conformationalstate of individual tryptophan residues. If theemitted light is nearer to 300 nm then theTryptophan is in a non-polar environment or if it isnearer to 350 nm, it is in an aqueous polarenvironment.
Like with general fluorescence, the process is veryrapid. Typically, emission spectra can be acquiredin less than a minute, meaning many samples canbe analysed quickly.
Chemical Denaturation followed by Intrinsic Tryptophan Fluorescence
Folded proteins usually have tryptophans buriedin the core and they fluoresce differently to whenthey become exposed on unfolding due to astrong chemical denaturant such as urea orguanidinium. These chemicals are titrated into afolded protein solution and the fluorescence ismeasured for each point.
The data are plotted and produces a denaturationcurve that tells you the concentration ofdenaturant where half of the protein is unfolded.The slope of the transition also tells you howsensitive the protein is to the denaturant. Togetherthese values allow you to calculate a free energychange for unfolding, which is an absolutemeasure of the protein’s stability. If drugs orligands are also included in a separateexperiment, then a binding constant can becalculated. Proteins can also be suddenlyinduced to fold or unfold where the change influorescence can be measured in real time tounderstand protein folding kinetics.
These assays are typically run in a 96-well plate,using small volumes and low concentrations ofproteins. A titration of a whole plate can takeapproximately 6 h and takes more data analysisthan Differential Scanning Fluorimetry but givesmore accurate and quantitative data. Proteinunfolding kinetics can also be performed in aplate but direct folding kinetics usually requires astopped-flow spectrometer and is lowerthroughput.
Continued over
© 2020 The Author(s). This is an open access article published by Portland Press Limited on behalf of the Biochemical Society and distributed under the Creative Commons AttributionLicense 4.0 (CC BY-NC-ND).
677
Dow
nloaded from http://portlandpress.com
/essaysbiochem/article-pdf/64/4/649/894595/ebc-2019-0042c.pdf by U
K user on 15 October 2020
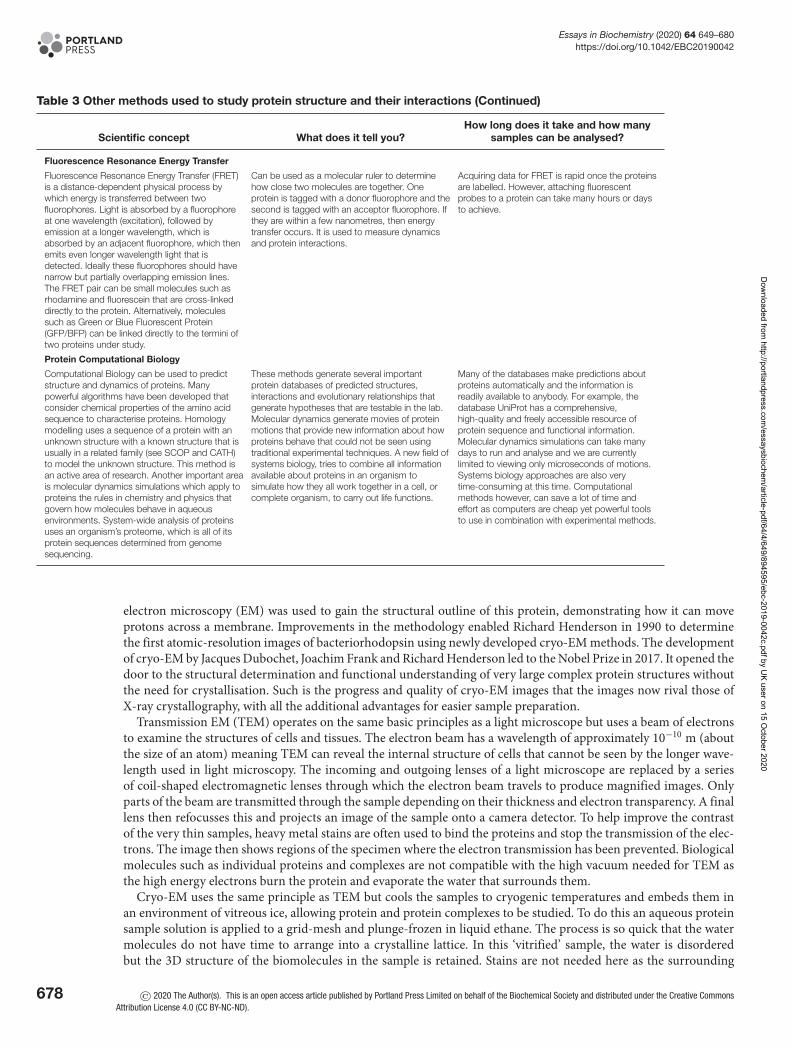
Essays in Biochemistry (2020) 64 649–680https://doi.org/10.1042/EBC20190042
Table 3 Other methods used to study protein structure and their interactions (Continued)
Scientific concept What does it tell you?How long does it take and how many
samples can be analysed?
Fluorescence Resonance Energy Transfer
Fluorescence Resonance Energy Transfer (FRET)is a distance-dependent physical process bywhich energy is transferred between twofluorophores. Light is absorbed by a fluorophoreat one wavelength (excitation), followed byemission at a longer wavelength, which isabsorbed by an adjacent fluorophore, which thenemits even longer wavelength light that isdetected. Ideally these fluorophores should havenarrow but partially overlapping emission lines.The FRET pair can be small molecules such asrhodamine and fluorescein that are cross-linkeddirectly to the protein. Alternatively, moleculessuch as Green or Blue Fluorescent Protein(GFP/BFP) can be linked directly to the termini oftwo proteins under study.
Can be used as a molecular ruler to determinehow close two molecules are together. Oneprotein is tagged with a donor fluorophore and thesecond is tagged with an acceptor fluorophore. Ifthey are within a few nanometres, then energytransfer occurs. It is used to measure dynamicsand protein interactions.
Acquiring data for FRET is rapid once the proteinsare labelled. However, attaching fluorescentprobes to a protein can take many hours or daysto achieve.
Protein Computational Biology
Computational Biology can be used to predictstructure and dynamics of proteins. Manypowerful algorithms have been developed thatconsider chemical properties of the amino acidsequence to characterise proteins. Homologymodelling uses a sequence of a protein with anunknown structure with a known structure that isusually in a related family (see SCOP and CATH)to model the unknown structure. This method isan active area of research. Another important areais molecular dynamics simulations which apply toproteins the rules in chemistry and physics thatgovern how molecules behave in aqueousenvironments. System-wide analysis of proteinsuses an organism’s proteome, which is all of itsprotein sequences determined from genomesequencing.
These methods generate several importantprotein databases of predicted structures,interactions and evolutionary relationships thatgenerate hypotheses that are testable in the lab.Molecular dynamics generate movies of proteinmotions that provide new information about howproteins behave that could not be seen usingtraditional experimental techniques. A new field ofsystems biology, tries to combine all informationavailable about proteins in an organism tosimulate how they all work together in a cell, orcomplete organism, to carry out life functions.
Many of the databases make predictions aboutproteins automatically and the information isreadily available to anybody. For example, thedatabase UniProt has a comprehensive,high-quality and freely accessible resource ofprotein sequence and functional information.Molecular dynamics simulations can take manydays to run and analyse and we are currentlylimited to viewing only microseconds of motions.Systems biology approaches are also verytime-consuming at this time. Computationalmethods however, can save a lot of time andeffort as computers are cheap yet powerful toolsto use in combination with experimental methods.
electron microscopy (EM) was used to gain the structural outline of this protein, demonstrating how it can moveprotons across a membrane. Improvements in the methodology enabled Richard Henderson in 1990 to determinethe first atomic-resolution images of bacteriorhodopsin using newly developed cryo-EM methods. The developmentof cryo-EM by Jacques Dubochet, Joachim Frank and Richard Henderson led to the Nobel Prize in 2017. It opened thedoor to the structural determination and functional understanding of very large complex protein structures withoutthe need for crystallisation. Such is the progress and quality of cryo-EM images that the images now rival those ofX-ray crystallography, with all the additional advantages for easier sample preparation.
Transmission EM (TEM) operates on the same basic principles as a light microscope but uses a beam of electronsto examine the structures of cells and tissues. The electron beam has a wavelength of approximately 10−10 m (aboutthe size of an atom) meaning TEM can reveal the internal structure of cells that cannot be seen by the longer wave-length used in light microscopy. The incoming and outgoing lenses of a light microscope are replaced by a seriesof coil-shaped electromagnetic lenses through which the electron beam travels to produce magnified images. Onlyparts of the beam are transmitted through the sample depending on their thickness and electron transparency. A finallens then refocusses this and projects an image of the sample onto a camera detector. To help improve the contrastof the very thin samples, heavy metal stains are often used to bind the proteins and stop the transmission of the elec-trons. The image then shows regions of the specimen where the electron transmission has been prevented. Biologicalmolecules such as individual proteins and complexes are not compatible with the high vacuum needed for TEM asthe high energy electrons burn the protein and evaporate the water that surrounds them.
Cryo-EM uses the same principle as TEM but cools the samples to cryogenic temperatures and embeds them inan environment of vitreous ice, allowing protein and protein complexes to be studied. To do this an aqueous proteinsample solution is applied to a grid-mesh and plunge-frozen in liquid ethane. The process is so quick that the watermolecules do not have time to arrange into a crystalline lattice. In this ‘vitrified’ sample, the water is disorderedbut the 3D structure of the biomolecules in the sample is retained. Stains are not needed here as the surrounding
678 © 2020 The Author(s). This is an open access article published by Portland Press Limited on behalf of the Biochemical Society and distributed under the Creative CommonsAttribution License 4.0 (CC BY-NC-ND).
Dow
nloaded from http://portlandpress.com
/essaysbiochem/article-pdf/64/4/649/894595/ebc-2019-0042c.pdf by U
K user on 15 October 2020

Essays in Biochemistry (2020) 64 649–680https://doi.org/10.1042/EBC20190042
buffer allows for enough contrast to observe the specimen, to improve contrast multiple images are taken instead.Randomly orientated proteins are struck by the electron beam, producing a faint image on the detector. A computerthen decides what is a faint molecular image of the proteins and what is the background. Similar images are then placed(grouped) together. Thousands of similar images are averaged by the computer to generate high signal to noise 2Dimages (Figure 20) that are used to clean-up the dataset from contamination and other junk particles. Software is thenused to calculate how all the good molecular images relate to each other and generates a high-resolution 3D imageor density map. The amino acid chain is then threaded into this map in a similar process to X-ray crystallography.Cryo-EM offers a significant advantage in that through the direct acquisition of the images, the specimen can bestatistically analysed allowing for the reconstruction of the structural information and different conformations canbe determined in the same sample. It is also possible to control the chemical environment, which in turn allowsfor effective examination of different functional states of different types of molecules. The final major advantage ofcryo-EM is that large intact complexes can be studied allowing the 3D structure of ribosomes, proteins and viruses,almost to the atomic scale.
Cryo-EM of proteins and their complexes promises to revolutionise structural biology as many life processes de-pend on large dynamic macromolecular assemblies, however like all the methods described here there are somenaunces. For example, it can be difficult to prepare a grid that has a well-represented number of orientations as some-times the proteins will preferentially align towards the hydrophobic air–water interface, on occasions the proteins willdenature, and screening multiple grids with different conditions can be expensive. Nevertheless, datasets sufficientfor high-resolution structures can be recorded in just a few hours or overnight and the amount of protein required ismuch less than X-ray crystallography or NMR, and the samples do not have to be as pure, all of which helps balancethe cost of this incredibly powerful technique.
Other methodsThere are a vast range of other methods that are also used to study protein structure and their interactions, many ofwhich can be performed in just one day and yield complementary information to the techniques mentioned above.Table 3 gives an overview of some of the more common methods and their applications.
Concluding commentsWithin this essay, we have explored proteins through the eyes of a structural biologist. We have considered the fol-lowing areas:
• The structural organisation of proteins and their range of shapes and conformations.• What influences the thermodynamics of protein folding.• How proteins’ ability to change their shape enables them to bind new partners as well potentially misfold and
aggregate, bringing about disease.• How to experimentally determine protein structures and their interactions at the molecular level.
We hope this will inspire readers to view some of the suggested resources which provide more detail on uncoveringprotein structure.
Data AvailabilityCD data for an immunoglobulin was simulated from the pdb code: 1igt using the PDB2CD [Mavridis and Janes (2017) PDB2CD:a web-based application for the generation of circular dichroism spectra from protein atomic coordinates. Bioinformatics 33,56–63]. CD Data for the soluble domain of micro-exon gene 14 protein (CD0004062000) and insulin (CD0000040000) were ex-tracted from the PCDDBID [Whitmore, Miles, Mavridis, Janes and Wallace (2017) PCDDB: new developments at the Protein Circu-lar Dichroism Data Bank. Nucleic Acids Res. 45 (D1), D303–D307] [Lopes, Orcia, Araujo, DeMarco and Wallace (2013) Biophys. J.104, 2512–2520]. CD figures were created by use of Szilagyi (2019): EMANIM: interactive visualisation of electromagnetic waves.Web application available at URL https://emanim.szialab.org. All other pdb codes for figures are indicated in their legends.
Competing InterestsThe authors declare that there are no competing interests associated with the manuscript.
Author ContributionE.J.S. and D.S., both contributed to writing the review and producing figures; however, E.J.S. took the lead in writing while D.S.took the lead in producing the figures.
© 2020 The Author(s). This is an open access article published by Portland Press Limited on behalf of the Biochemical Society and distributed under the Creative CommonsAttribution License 4.0 (CC BY-NC-ND).
679
Dow
nloaded from http://portlandpress.com
/essaysbiochem/article-pdf/64/4/649/894595/ebc-2019-0042c.pdf by U
K user on 15 October 2020
Essays in Biochemistry (2020) 64 649–680https://doi.org/10.1042/EBC20190042
AcknowledgementsWe acknowledge Marie Phelan, Igor Barsukov, Ed Yates, Lia Ball, Christos Savva, Kathryn Garner, Svetlana Antonyuk and review-ers for critical comments on this work. We also acknowledge Bryan Sutton for providing the electron density figure.
Abbreviations�, change in a system; 2D, two dimensional; 3D, three-dimensional; B0, magnetic field aligned to the z-axis; CD, circulardichroism; cryo-EM, cryogenic electron microscopy; DNA, deoxyribonucleic acid; EM, electron microscopy; FID, free-inductiondecay; G, Gibbs free energy; H, enthalpy; Hz, frequency in Hertz; IDP, intrinsically disordered protein; NMR, nuclear magneticresonance; NOE, Nuclear Overhauser Effect; NOESY, Nuclear Overhauser Effect SpectroscopY; PDB/pdb, Protein Data Bank;ppm, parts per million; S, entropy; T, temperature; TEM, transmission EM; Tm, melting temperature at which 50% of a protein isunfolded; UV, ultraviolet; λ, wavelength.
Further reading and resourcesDoucleff, M., Hatcher-Skeers, M. and Crane, N.J. (2011) Pocket Guide to Biomolecular NMR, SpringerZoran, P., David, B., Firas, K., Seth, C., Jens, M. and Scott, H. (2008) Fold your own protein. https://fold.it/Jonsson, A.L., Roberts, M.A.J., Kiappes, J.L. and Scott, K.A. (2017) Essential chemistry for biochemists. Essays Biochem. 61, 401–427,
https://doi.org/10.1042/EBC20160094Johnson, M.P. (2016) Photosynthesis. Essays Biochem. 60, 255–273, https://doi.org/10.1042/EBC20160016David, S.G., Alexander, R., Maria, V. and Rob, L. (2020) Molecular machinery: a tour of the Protein Data Bank.
https://cdn.rcsb.org/pdb101/molecular-machinery/Nicholson, L.B. (2016) The immune system. Essays Biochem. 60, 275–301, https://doi.org/10.1042/EBC20160017Berman, H.M., Westbrook, J., Feng, Z., Gilliland, G., Bhat, T.N., Weissig, H., Shindyalov, I.N., Bourne, P.E. and The Protein Data Bank (2000) Nucleic Acids
Research 28, 235–242, https://doi.org/10.1093/nar/28.1.235Reynaud, E. (2010) Protein Misfolding and Degenerative Diseases. Nature Education 3, 28Rhodes, G. (2006) Crystallography Made Crystal Clear, 3rd , ElsevierRobinson, P.K. (2015) Enzymes: principles and biotechnological applications. Essays Biochem. 59, 1–41, https://doi.org/10.1042/bse0590001Savva, C. (2019) A beginner’s guide to cryogenic electron microscopy. Biochemist 41, 46–52, https://doi.org/10.1042/BIO04102046Swanson, J. (2019) An interactive introduction to Fourier Transforms. http://www.jezzamon.com/fourier/Szilagyi, A. (2019) EMANIM: Interactive visualization of electromagnetic waves. Electromagnetic waves and circular dichroism: an animated tutorial.
https://emanim.szialab.orgWatson, H. (2015) Biological membranes. Essays Biochem. 59, 43–69, https://doi.org/10.1042/bse0590043Williamson, M. (2012) How proteins work. Garland Sci., https://doi.org/10.1201/9781136665493
680 © 2020 The Author(s). This is an open access article published by Portland Press Limited on behalf of the Biochemical Society and distributed under the Creative CommonsAttribution License 4.0 (CC BY-NC-ND).
Dow
nloaded from http://portlandpress.com
/essaysbiochem/article-pdf/64/4/649/894595/ebc-2019-0042c.pdf by U
K user on 15 October 2020
Related Documents