University of Nebraska - Lincoln DigitalCommons@University of Nebraska - Lincoln Management Department Faculty Publications Management Department 2014 Uncovering the Nuances of Referral Hiring: How Referrer Characteristics Affect Referral Hires’ Performance and Likelihood of Voluntary Turnover Jenna R. Pieper University of Nebraska-Lincoln, [email protected] Follow this and additional works at: hp://digitalcommons.unl.edu/managementfacpub Part of the Business Administration, Management, and Operations Commons , Human Resources Management Commons , Management Information Systems Commons , Management Sciences and Quantitative Methods Commons , and the Organizational Behavior and eory Commons is Article is brought to you for free and open access by the Management Department at DigitalCommons@University of Nebraska - Lincoln. It has been accepted for inclusion in Management Department Faculty Publications by an authorized administrator of DigitalCommons@University of Nebraska - Lincoln. Pieper, Jenna R., "Uncovering the Nuances of Referral Hiring: How Referrer Characteristics Affect Referral Hires’ Performance and Likelihood of Voluntary Turnover" (2014). Management Department Faculty Publications. 118. hp://digitalcommons.unl.edu/managementfacpub/118 brought to you by CORE View metadata, citation and similar papers at core.ac.uk provided by UNL | Libraries

Welcome message from author
This document is posted to help you gain knowledge. Please leave a comment to let me know what you think about it! Share it to your friends and learn new things together.
Transcript

University of Nebraska - LincolnDigitalCommons@University of Nebraska - Lincoln
Management Department Faculty Publications Management Department
2014
Uncovering the Nuances of Referral Hiring: HowReferrer Characteristics Affect Referral Hires’Performance and Likelihood of VoluntaryTurnoverJenna R. PieperUniversity of Nebraska-Lincoln, [email protected]
Follow this and additional works at: http://digitalcommons.unl.edu/managementfacpub
Part of the Business Administration, Management, and Operations Commons, HumanResources Management Commons, Management Information Systems Commons, ManagementSciences and Quantitative Methods Commons, and the Organizational Behavior and TheoryCommons
This Article is brought to you for free and open access by the Management Department at DigitalCommons@University of Nebraska - Lincoln. It hasbeen accepted for inclusion in Management Department Faculty Publications by an authorized administrator of DigitalCommons@University ofNebraska - Lincoln.
Pieper, Jenna R., "Uncovering the Nuances of Referral Hiring: How Referrer Characteristics Affect Referral Hires’ Performance andLikelihood of Voluntary Turnover" (2014). Management Department Faculty Publications. 118.http://digitalcommons.unl.edu/managementfacpub/118
brought to you by COREView metadata, citation and similar papers at core.ac.uk
provided by UNL | Libraries
This article has been accepted for publication and undergone full peer review but has not been through the copyediting,
typesetting, pagination and proofreading process, which may lead to differences between this version and the Version of
Record. Please cite this article as doi: 10.1111/peps.12097.
This article is protected by copyright. All rights reserved. 1
Uncovering the Nuances of Referral Hiring: How Referrer Characteristics Affect Referral
Hires’ Performance and Likelihood of Voluntary Turnover
Jenna R. Pieper
University of Nebraska-Lincoln
This article is protected by copyright. All rights reserved. 2
Author Note
Jenna R. Pieper, Department of Management, University of Nebraska-Lincoln.
As this paper is based on my dissertation work, I extend my thanks and appreciation
to Charlie Trevor, Barry Gerhart, Chip Hunter, and Ray Aldag for their instrumental guidance
and assistance. I would also like to express my gratitude to Chad Van Iddekinge and two
anonymous reviewers for their insightful suggestions and constructive comments on prior
versions of this manuscript. Their collective guidance helped refine my work.
Correspondence concerning this article should be addressed to Jenna R. Pieper,
Department of Management, University of Nebraska-Lincoln, P.O. Box 880405, Lincoln, NE
68588-0405. Email: [email protected].
Abstract
The literature on employee referral hiring gives little attention to referrers. Synthesizing two
theories in the literature (the better match and social enrichment accounts), through the lens
of social resources theory, I provide a conceptual and empirical breakdown of the effects of
referrer quality (referrer performance at hire and referrer tenure at hire) and post-hire
accessibility (referrer employment and referrer-referral hire job congruence) on referral hire
performance and likelihood of voluntary turnover. I tested my hypotheses with longitudinal
data from 386 referrer-referral hire pairs at the same job level in a U.S. call center over a 2-
year period. Across analyses of two performance criteria (calls/hour and quality) and
likelihood of leaving, I found a nuanced mix of benefits and liabilities that illuminate
potential boundary conditions of the revised theories. Referral hires from high-performing
referrers performed better but had higher turnover propensities than those from lower
performing referrers. Longer-tenured employees also produced better performing referral
This article is protected by copyright. All rights reserved. 3
hires, up to a point. Referral hires were less likely to leave, provided their referrer remained
employed, but they performed less effectively under this condition. Similarly, referral hires
performed worse when their job was congruent with their referrer’s job. Theoretical and
practical implications are discussed.
Keywords: employee referral, referrer, recruitment source, performance, voluntary
turnover
This article is protected by copyright. All rights reserved. 4
Uncovering the Nuances of Referral Hiring: How Referrer Characteristics Affect Referral
Hires’ Performance and Likelihood of Voluntary Turnover
Attracting, selecting, and retaining employees with the necessary human capital
(knowledge, skills, abilities, and other characteristics) significantly affect an organization’s
success (Barber, 1998; Breaugh, 1992; Ployhart, 2006; Rynes, 1991). Recruitment is a
primary human resource (HR) practice that influences human capital acquisition, and the
success of subsequent HR practices (like training and compensation) hinges, in part, on the
quality of the human capital recruited (Barber, 1998; Ployhart, 2006). Furthermore, it has
retention implications, as organizations must implement strategies to retain acquired talent
(Nyberg, 2010; Sturman, Trevor, Boudreau, & Gerhart, 2003; Trevor, Gerhart, & Boudreau,
1997).
One of the more conceptually interesting and popular recruitment sources is the
employee referral. Employee referral programs encourage employees (referrers) to refer open
positions in their organization to qualified candidates in their social networks (referral hires).
Intuitively, they make good business sense, because an employee is both motivated and
uniquely qualified to recommend good candidates and can do so at minimal cost to the
organization. This practice has been used for decades to fill 30% to 50% of job openings
(Bewley, 1999; Fernandez, Castilla, & Moore, 2000; Granovetter, 1995).
Referral hiring yields positive individual and organizational outcomes. Benefits for
job seekers include: 1) a low cost method of locating jobs (Fernandez & Fernandez-Mateo,
2006; Marsden & Gorman, 2001); 2) speed in learning about opportunities (Burt, 1992;
Granovetter, 1974); 3) higher probability of receiving an offer (Fernandez et al., 2000;
Holzer, 1988; Van Hoye, van Hooft, & Lievens, 2009); and 4) higher wages (Burt, 1992;
Granovetter, 1974; Seidel, Polzer, Stewart, 2000; Simon & Warner, 1992). For employers, it
This article is protected by copyright. All rights reserved. 5
is a cost-effective recruitment tool (Fernandez et al., 2000; Marsden & Gorman, 2001;
Morehart, 2001). For instance, Fernandez et al. (2000), using dollar costs of screening, hiring,
and training in a call center, estimated the net benefit of hiring referrals. They calculated a
savings of $416 for each new referral hire, or a 67% return on investment of the initial $250
referral bonus. Referral hires are more satisfied (Granovetter, 1974), perform at higher levels
(Blau, 1990; Castilla, 2005; Hill, 1970; Holzer, 1987; Pinkston, 2012), and stay longer
(Conrad & Ashforth, 1986; Decker & Cornelius, 1979; Holzer, 1987; Weller, Holtom,
Matiaske, & Mellewigt, 2009). Moreover, reviews of recruitment source research indirectly
support these benefits (Barber, 1998; Breaugh & Starke, 2000; Rynes, 1991; Rynes & Cable,
2003; Rynes, Heneman, & Schwab, 1980; Schwab, 1982; Taylor & Collins, 2000; Zottoli &
Wanous, 2000). On average, employees hired from inside sources (e.g., in-house job notices,
employee referrals, and rehires) have lower turnover and higher performance than those hired
from outside sources (e.g., newspaper ads and employment agencies) and walk-ins.
Although these studies have provided valuable insights into referral hiring, little work
has considered whether referral hire outcomes depend upon characteristics of the referrer.
Given that referrers naturally endow referral hires with a social connection upon employment
in the firm, and not all referrers are equal (Montgomery, 1991), certain characteristics of the
referrer likely shape referral hire outcomes. In fact, studies have shown that referral hires are
more likely to leave (Fernandez et al., 2000) or experience a decrease in performance
(Castilla, 2005, utilizing the dataset in Fernandez et al.) when their referrer leaves.
Yakubovich and Lup (2006) found that candidates referred by high performers are more
likely to receive job offers. In related work, Van Hoye and colleagues (2009) found that
referrers with better educational and occupational backgrounds enhanced the effectiveness of
a job searcher’s networking in finding employment. As a whole, this work highlights the
potential benefits of incorporating referrer characteristics in models of referral hire outcomes.
This article is protected by copyright. All rights reserved. 6
However, the literature does not propose a compelling theory that referrer characteristics are
likely to influence referral hire outcomes.
In response, I contribute a model of referrer characteristics grounded in social
resources theory (Lin, 1999, 2001; Lin, Ensel, & Vaugh, 1981) that influence referral hire
outcomes (see Figure 1). Based on this theory, the success of the referrer-referral hire
connection depends on the quality of the resources (e.g., support, advice, and
organization/job knowledge) available in this connection and factors that affect the extent to
which these resources are accessible. Using data from 386 referrer-referral hire pairs in an
entry-level job at a large U.S. call center over a 2-year period, I empirically examine the
influence of referrers’ quality (performance and tenure) and post-hire accessibility
(employment and job similarity) on referral hire performance and voluntary turnover
propensity.
My results offer some insights into the nuances of referral hiring and suggest that the
theories related to this phenomenon may be overly simplistic. Looking at referrer
characteristics through the lens of social resources theory allows for synthesis of two
dominant theories–the better match argument and social enrichment perspective–to explain
why referral hiring leads to more successful employees. This approach also generates
theoretically compelling predictions about the effectiveness of referral hires, fundamentally
advances prior work, and provides new directions for future research and practice.

This article is protected by copyright. All rights reserved. 7
Theory and Hypotheses
Why Referral Hires Are Better Employees
Economic theory proposes that referrers improve the match between candidates (i.e.,
referral hires) and the job/organization because they mitigate asymmetric information
problems associated with the labor market. Fernandez et al. (2000) termed this the “better
match account” (p. 1293). As Stigler (1962) points out, no individual can gain and maintain
complete information on all possible employers; likewise, employers cannot gain complete
information about candidates. Thus, given the labor market’s omnipresent uncertainty (Rees,
1966), referrers serve as important conduits of information between candidates and
employers. Referrers are uniquely positioned to provide candidates with realistic and
difficult-to-obtain information about the job otherwise not available (Jovanovic, 1979; Rees
& Shultz, 1970; Reid, 1972; Ullman, 1966). Moreover, because employees are often said to
put their reputations on the line when referring (Kugler, 2003; Marin, 2012; Rees, 1966;
Smith, 2005; 2007), it is in their interest to refer those who reflect positively on them. In turn,
referral hires exhibit a higher likelihood of job fit than non-referrals because they acquired
better knowledge of the job/organization, have tighter expectations, and are positioned to
make a better decision on whether to apply for the job (Weller et al., 2009). Thus, referral
hires make better matches and employees.
While the better match argument centers on social processes prior to organizational
entry, the social enrichment perspective focuses on relational processes following entry
(Castilla, 2005; Fernandez et al., 2000; Skolnick, 1987). Its central tenet is that referral hires
are endowed with a friend or acquaintance who enriches the job and nurtures their job
embeddedness. Fernandez et al. (2000) suggested that referral hires are more effective
because social relations with referrers extend beyond the recruitment stage to actual entry and
socialization into the organization. The exchange of information and support continues

This article is protected by copyright. All rights reserved. 8
throughout a referral hire’s employment. A referrer also is motivated to keep sharing
resources because of self-interest in protecting his or her reputation from a bad referral.
Referrers can help referral hires cope with and make sense of unanticipated events (Louis,
1980; Reichers, 1987; Sutton & Louis, 1987), reduce a referral hire’s role ambiguity (Chen,
Takeuchi, & Shum, 2013), and even exert some peer pressure on referral hires to perform
well and stay longer (Kugler, 2003). Such factors can boost referral hires’ socialization into
the firm (Morrison, 2002). Because coworker support generally results in positive job
attitudes and increased individual performance (see Chiaburu & Harrison, 2008, for meta-
analytic evidence), it is reasonable to conclude that the support a referrer provides to help a
referral hire adjust to the work setting can help improve performance. The socialization
literature suggests coworkers can facilitate newcomers’ entry into the job through informal
training and mentoring (Louis, 1980). Because the strength of the relationship (i.e., “the
amount of time, emotional intensity, intimacy, and reciprocal services,” Granovetter, 1973, p.
1360) between a referral hire and referrer is likely of greater magnitude than that between
other newcomers and coworkers, the socialization effect should be stronger for referral hires.
Although the better match and social enrichment perspectives differ in their
underlying explanations, both lead to congruent predictions of referral hire effectiveness.
Despite being positioned as competing theories (Castilla, 2005; Fernandez et al., 2000),
neither is necessarily wrong, and evidence in support of each has been found. In fact,
different rationales are required to explain recruitment source effects given the various stages
of recruitment and socialization (Barber, 1998). The two frameworks are complementary and
can be fused to offer a sophisticated explanation of referral hire effectiveness that suggests
both fit and socialization effects.
While prior research has compared referral hires to other recruitment sources—
finding weak to moderate positive effects for referral hires—it is still necessary to establish
This article is protected by copyright. All rights reserved. 9
the baseline effects here (for reviews of baseline effects, see Rynes & Cable, 2003; Zottoli &
Wanous, 2000). Such baselines serve to confirm (or refute) past research findings and should
be established before testing the core hypotheses about the degree to which referrer
characteristics enhance our understanding of referral hire outcomes. Therefore, I present the
following baseline predictions:
Hypothesis 1a: Referral hires will have higher performance than non-referral hires.
Hypothesis 1b: Referral hires will have lower likelihood of voluntary turnover than
non-referral hires.
A Closer Examination of Referral Hire Outcomes and Referrer Characteristics
Fundamental to advancing our knowledge of referral hiring is a better understanding
of the referrers. Neither the better match account nor the social enrichment perspective offers
direct insight into the characteristics of referrers that shape referral hire effectiveness.
Therefore, I draw on key components from social resources theory (Lin, 1999, 2001; Lin et
al., 1981) to develop a model of referrer characteristics, synthesizing rationale from both
perspectives.
Social resources theory positions social capital as the resource (i.e., valued material or
symbolic goods) embedded in the social structure and network. Lin and colleagues (1981)
argued that the advantage garnered by social capital derives not from the strength of one’s
ties (Granovetter, 1973) nor the presence of structural holes in one’s social network (Burt,
1992), but from the resources available through social ties. Thus, the significance of the
social resources will affect the outcomes of the person who has access to them (Lin, 1982;
2001). Because this theory clarifies the differential nature of social connections explicit in
both the better match and social enrichment perspectives, it elucidates how they are
interlinked.
Social resources theory proposes that accruing better social resources is associated
with enhanced occupational outcomes (e.g., getting a job or promotion and higher income;
This article is protected by copyright. All rights reserved. 10
Lin, 1999, 2001; Lin et al., 1981). Referral hires from referrers with greater resources,
particularly job and organizational knowledge, should be better employees. For that reason, I
assign to referrers differential significance, which is implied by factors that reveal the quality
of referrers’ resources. That is, one referrer may have better in-depth knowledge than another,
causing variation in the depth and quality of information exchanged with the referral hire.
High-quality referrers should lead to better referral hires because they have better resources
to match candidates and are more effective on-the-job resources (complementing the social
enrichment perspective). Social resources theory also posits that structural characteristics of
the social network (e.g., network location) challenge one’s opportunity to access social
resources, thereby influencing occupational outcomes (Lin, 1999, 2001; Lin et al., 1981). My
model accounts for two characteristics implying referrer quality—referrer performance at hire
and referrer tenure at hire—and two characteristics that influence the extent to which referral
hires have access to the referrer’s social resources—referrer employment and referrer-referral
hire job congruence.
Referrer performance at hire. Two prior studies have investigated the effect of the
referrer’s performance at the time the referral hire enters the organization, but with
conflicting results. Yakubovich and Lup (2006) found that more job offers were given to
referrals from high-performing referrers than from poor-performing referrers—suggesting
that referrer performance influences post-hire outcomes. Castilla (2005), on the other hand,
found no relationship between referrers’ performance rating and referral hire performance.
This non-significant finding may be due in part to Castilla’s use of a dichotomous
performance measure.
Despite these disparate findings, there is strong conceptual rationale for the notion
that referral hire effectiveness will differ across referrer performance levels. As performance
is a direct function of one’s tacit understanding of how to succeed in the job (Sternberg,
This article is protected by copyright. All rights reserved. 11
Wagner, Williams, & Horvath, 1995; Wagner & Sternberg, 1985), high-performing referrers
should lead to more productive referral hires, because they can give candidates more accurate
information during the referring stage, facilitating a better match (Yakubovich & Lup, 2006).
Once these referral hires are on the job, referrers should be motivated to extend their accrued
knowledge of job success (or even exert peer pressure) in order to defend their reputations as
good employees. In turn, referral hires will better understand the knowledge and expected
behaviors necessary to assume their roles, positively affecting their performance. Therefore, I
hypothesize:
Hypothesis 2a: Referrer performance at hire is positively related to referral hire
performance.
The logic underlying the case that referrer performance influences the likelihood of a
referral hire leaving is more ambiguous. One could argue that high-performing referrers are
more likely to help referral hires better understand the tacit knowledge and behaviors
required to succeed in the job, both during recruitment and on the job. The result would be
better person-job fit that can buffer against the unexpected “shocks” that may arise for
newcomers, making it less likely that they would leave voluntarily. However, there is strong
logic for an alternative prediction that referrer performance at hire will be positively related
referral hire’s likelihood of leaving. Jackofsky (1984) proposed a u-shaped relationship
between performance and turnover, such that both low and high performers have a higher
probability of leaving than do average performers. Empirical work concurs with this
proposition (Salamin & Hom, 2005; Sturman & Trevor, 2001; Trevor et al., 1997; Williams
& Livingstone, 1994). A low performer’s desire to leave may result either from pressure to
leave the organization before being formally terminated (Jackofsky, 1984) and/or from low
job satisfaction (Steers & Mowday, 1981). High performers, on the other hand, who benefit
from the availability of alternative employment opportunities due to their greater human
capital, are more prone to leave for greener pastures. Because Hypothesis 1a, supported by

This article is protected by copyright. All rights reserved. 12
existing research (Blau, 1990; Castilla, 2005; Hill, 1970; Holzer, 1987; Pinkston, 2012),
positions referral hires as better performers than non-referral hires, referral hires should be
less likely to fall into the low-performer end of the employee performance distribution. Given
this, the u-shaped relationship proposed by Jackofsky is less relevant when considering
referral hires. Rather, his prediction about greater high performer turnover is most
appropriate, particularly to the degree that referrer performance is positively related to
referral hire performance in Hypothesis 2a. I hypothesize:
Hypothesis 2b: Referrer performance at hire is positively related to the likelihood of
referral hire voluntary turnover.
Referrer tenure at hire. The second quality characteristic is referrer tenure at hire.
Because longer-tenured employees will have acquired richer work experiences and job- and
organization-related tacit and explicit knowledge (Bird, 1996; Quinones, Ford, & Teachout,
1995), they likely will offer candidates higher quality and more realistic information about
the employer—in line with the better match notion. Congruent with the social enrichment
perspective, after referred candidates are hired, longer-tenured referrers also should be more
effective sources of advice and support, nurturing positive performance in referral hires. Such
referrers should also be in a better position to help newcomers understand unanticipated
events that arise early in employment, mitigating any shocks that may cause them to leave.
These factors suggest a positive relationship between referrer tenure and referral hire
performance.
However, I argue that the relationship between referrer tenure and referral hire
performance is curvilinear, with a negative effect at high levels of referrer tenure. Despite
their advantages in experience and organizational knowledge, longer-tenured referrers may
be further removed from the challenges and ambiguities newcomers face and may possibly
have picked up “bad habits” in the course of their tenure. As a result, the information they
pass along to candidates may not be as accurate as the information shared by referrers with
This article is protected by copyright. All rights reserved. 13
less tenure. They also may not recall the strategies and coping skills that apply to newcomers,
or their advice and support may no longer apply to the referral hire’s job tasks. Further,
because longer-tenured referrers likely have proven reputations, they may be less concerned
with the effect of a referral hire’s overall performance on their reputations. In short, referrers
are better able to match candidates and serve as effective post-hire resources as they accrue
experience and knowledge across their tenure, but these may become obsolete the further
referrers are from the hiring and socialization stages. In combination, these logics suggest a
curvilinear effect of referrer tenure.
Hypothesis 3: A curvilinear relationship exists between referrer tenure at hire and
referral hire performance, such that referrer tenure at hire is positively related to
referral hire performance, but the effect is negative at high levels of referrer tenure.
The effect of referrer tenure on the likelihood of referral hire voluntary turnover is not
as clear. While longer-tenured referrers can provide better information and/or support to help
referral hires cope with unexpected shocks that might cause them to leave, this benefit tapers
off at higher levels of referrer tenure, suggesting a similar curvilinear relationship between
referrer tenure and the likelihood of referral hire voluntary turnover. However, because
longer-tenured employees generally bring in better performing referral hires, these better
performers also may be more likely to leave for reasons outlined above in Hypothesis 2b.
Given these contradicting notions, I do not hypothesize a priori an effect of referrer tenure on
referral hires’ turnover.
Referrer employment. Whether or not the referrer remains employed with the hiring
organization is related to the referrer’s accessibility to the new hire. Employee turnover itself
can be an important predictor of existing employees’ attitudes and behavior (Krackhardt &
Porter, 1985, 1986; Lee & Mitchell, 1994; Maertz & Griffeth, 2004; Mobley, 1982; Mowday,
Porter, & Steers, 1982; Staw, 1980; Steers & Mowday, 1981). Mowday et al. suggested that
“the decision by individuals to leave an organization may also have implications for those
This article is protected by copyright. All rights reserved. 14
who remain” (1982, p. 146). Similarly, Lee and Mitchell, in their unfolding model of
employee turnover, characterized a co-worker’s departure as a “shock to the system…a very
distinguishable event that jars employees toward deliberate judgments about their jobs, and,
perhaps, to voluntarily quit their job” (1994, p. 60). Others have found that co-worker
turnover significantly affects remaining employees’ job attitudes (Brockner & Kim, 1993;
Krackhardt & Porter, 1985; Krausz, Yaakobovitz, Bizman, & Caspi, 1999; Sheehan, 1991),
performance (Castilla, 2005), and subsequent turnover (Fernandez et al., 2000; Krackhardt &
Porter, 1986).
The two studies most relevant to referral hiring effects (Castilla, 2005; Fernandez et
al., 2000) provided evidence of interdependence between referrer turnover and referral hires’
performance and turnover. Fernandez et al. (2000) found that referral hires also were likely to
leave when their referrer left organization. Using Fernandez and colleague’s sample, Castilla
(2005) demonstrated that referral hires’ performance decreased after their referrers left. These
findings suggest that when a referrer leaves, the referral hire likely re-evaluates job attitudes,
finds that losing a valuable relationship reduces the quality of the work environment, or
learns about alternative job opportunities. Supporting the social enrichment notion, this work
suggests that referrers are most beneficial when they are present (accessible), improving
referral hires’ performance and making it less likely that they would voluntarily leave. I
hypothesize:
Hypothesis 4a. Referral hire performance will be higher when the referrer remains
employed than when the when the referrer terminates employment.
Hypothesis 4b. Likelihood of referral hire voluntary turnover will be lower when the
referrer remains employed than when the referrer terminates employment.
Referrer-referral hire job congruence. An additional factor that affects the
opportunity for referral hires to access their referrers is referrer-referral hire job congruence,
or the degree of correspondence in the referral hire’s and referrer’s jobs. Based on social
This article is protected by copyright. All rights reserved. 15
comparison theory (Festinger, 1954), social identity theory (Ashforth & Mael, 1989; Tajfel &
Turner, 1986), and the homophily principle (McPherson, Smith-Lovin, & Cook, 2001),
individuals are more likely to interact with similar and proximal others. Therefore, more
positive referral hire outcomes are likely if the referral hire has greater opportunity to seek
out advice and support from the referrer.
Congruence based on organizational characteristics (e.g., team and work unit) can
influence the referrer’s post-hire accessibility, and, likewise, the degree to which the two
parties potentially interact with each other—a notion supported by social resources theory
(Lin, 2001). Differences in roles, leaders, and other workplace characteristics (e.g., schedules
and office locations) affect the relevance of referrers’ views in helping referral hires interpret
organizational events. Moreover, congruent workplace characteristics can affect the
proximity of referrers to referral hires, influencing their ability to interact. Under similar
workplace conditions, referral hires will be more cognitively aware of referrers, affecting
likelihood of access to their referrer. Job congruence (in this study’s research setting, work on
the same client program) is one workplace condition where referrer accessibility is greatest.
Based on the social enrichment perspective and social resources theory, I predict the
following:
Hypothesis 5a: Referral hire performance will be higher under referrer-referral hire
job congruence than under referrer-referral hire job incongruence.
Hypothesis 5b: Likelihood of referral hire voluntary turnover will be lower under
referrer-referral hire job congruence than under referrer-referral hire job
incongruence.
Method
Research Setting
A U.S. call center provided longitudinal data for customer service representatives
(CSRs) from January 1, 2008, to December 31, 2009; this period serves as the 2-year
observation window in my study. The company also provided CSRs’ weekly performance

This article is protected by copyright. All rights reserved. 16
data. CSRs are entry-level employees paid by the hour to answer incoming customer calls
about products or services, making CSRs the core occupational and revenue-generating group
within the call center. General qualifications for CSR positions include a high school degree
or GED, some computer experience, and customer service experience (6 months preferred).
Company representatives indicated that most CSRs are high school graduates, attending
college, roughly 18-24 years old, and Caucasian. New hires receive an average of 4.6 weeks
(range = 2 to 10 weeks) of classroom training and spend an average of 3.5 weeks (range = 1
to 4 weeks) in a transitional program similar to on-the-job training. The company begins to
monitor CSRs’ performance during the transitional program.
The call center provides mainly inbound customer care services to multiple clients in
various industries, such as healthcare, telecommunications, and travel. During the 2-year
observation period, a total of 12 clients with 28 different client programs were serviced.
Teams consisting of 10 to 30 CSRs service client programs, which involve separate client
services, determined by geographic location (e.g., health insurance plans that tend to be
specific to certain locations or policy holders) and/or type of service (e.g., billing or product
information). While all CSRs respond to customer inquiries, their duties and job content vary
by the client and client program they are servicing. For instance, CSRs working with
telecommunication clients address customer questions about billing or service, whereas CSRs
working with health insurance clients address sensitive issues concerning insurance claims.
The jobs within the same client program also vary. For example, for a single health insurance
client, one CSR may work with claims made by insurance plan participants, while another
may deal directly with hospital claims. The physical structure allows for separation of CSRs
by client, client program, and team.
Although the work in the call center is individualized, highly structured, and
automated, which constrains the degree of worker interaction, this setting is still suitable for
This article is protected by copyright. All rights reserved. 17
testing my hypotheses (particularly those derived from the social enrichment and accessibility
of social resources notions). Because the call center mainly deals with inbound calls, CSRs
may have idle time waiting for the next call. The high ratio of CSRs to supervisors also
makes it more likely a CSR would seek the support of a co-worker for help addressing
customer issues and navigating the complex call center technologies (Deery, Iverson, &
Walsh, 2010; Korczynski, 2003). Finally, the built-in referrer connection is likely important,
as having a friend around makes the workplace more enjoyable (Sias & Cahill, 1998) and
compensates for the routine and emotionally laborious call center environment.
Sample
During the 2-year study window, 1,688 CSRs were hired, and 34% (N = 567)
indicated they were employee referrals. According to management, employee referrals are
strongly encouraged and employees receive a bonus if their referral is hired. Furthermore, the
referrer is not considered in hiring decisions. The majority of referral hires are typically
friends or relatives of referrers, and they frequently are seen interacting before and after work
and during breaks.
To investigate the baseline predictions in Hypotheses 1a and 1b, I used the full
sample, less 3 CSRs for whom data were missing and 3 CSRs who failed to show up on the
first day of work, for a final sample of 1,682 CSRs (566 referral hires and 1,116 non-referral
hires). Next, to study the determinants of referral hires’ outcomes as postulated in Hypotheses
2 to 5, I used data from 447 referral hires, whom I was able to match with their respective
referrers.1 I excluded 6 referrals whose referrer happened to start employment on the exact
same day, leaving 441 referral hires available for analysis. Of these, I examined only the 386
1 The number of matched referral hire-referrer pairs is lower than the number (N = 567) who indicated they were
referred at the time of application for several possible reasons: (a) some referrals did not provide the name of
their referrer, (b) the referrer may have been a former employee, or (c) they may have been referred by an
employee outside the call center function (e.g., fron an executive or support staff) for which I did not receive
data access.
This article is protected by copyright. All rights reserved. 18
who were referred by on-site CSRs; the remaining were referred by team leaders or trainers
(N = 41) and other CSRs working remotely from home (N = 14), for whom performance data
were not available.
Dependent Variables
Performance. Because the call center tracks CSRs’ weekly performance and rewards
them for their week’s performance, week is the time unit in the longitudinal analysis. I
assessed performance with two criteria—calls/hour and quality. Calls/hour, or the average
number of calls that a CSR could handle per hour in any given week, was calculated using
average handle time (AHT), the time it takes, in seconds, to complete a call, including any
hold, talk, and after-call work time necessary to address the customer’s issue. AHT is the
most important performance indicator in call centers (Lui & Batt, 2010). Not only does it
drive the staffing level calculation, but speed in processing calls is critical to reducing costs
per customer transaction (Callaghan & Thompson, 2001). AHT is calculated as a CSR’s total
call handle time in a given week divided by the total number of calls taken during that week;
higher scores indicate lower productivity. Following Castilla (2005), I converted AHT to
calls/hour so that higher scores represent better performance; I divided 3,600 (the number of
seconds per hour) by a CSR’s AHT. For instance, an AHT of 300 seconds (5 minutes)
converts to a CSR being able to handle 12 calls/hour. My results were not substantially
influenced by using calls/hour or AHT as the outcome variable.
The call center also rewards CSRs for excellence in servicing customers; thus, I
examined quality as an additional performance criterion. Supervisors or other program
managers randomly evaluate a CSR’s quality an average of 2.8 times per week on a scale of 0
to 100. Clients determine the quality metrics and the overall weight given to quality for their
programs, but, in general, CSRs are evaluated on accuracy, professionalism, and problem-
solving skills.
This article is protected by copyright. All rights reserved. 19
Some CSRs terminated employment during training before their performance could
be tracked, thus reducing the available sample for analysis. For analysis of performance–
calls/hour, the available sample for Hypothesis 1a was 1,385 CSRs (297 CSRs terminated in
training), and for Hypotheses 2a-5a, it was 329 (57 left during training). The available sample
for analysis of performance–quality was slightly lower (N = 1,274 for testing Hypothesis 1a
and N = 305 for testing Hypotheses 2a-H5a), because in some cases, a CSR may have been
out of training and handling calls, but left employment before a quality score was recorded.
Voluntary turnover. Voluntary turnover measured whether the CSR voluntarily
terminated employment in any given week during his/her tenure. Based on an extensive set of
termination descriptions, supervisors indicated whether CSRs quit voluntarily or
involuntarily. In the full sample, 51% left voluntarily and 8.8% were terminated. In the
sample of referral hires, 44% left voluntarily and 13.4% were terminated. I assigned a value
of 1 to the week a CSR left voluntarily and 0 to weeks the CSR remained employed with the
organization.
Independent Variables
Referral hire. In its online job application, the call center asks about an applicant’s
recruitment source. To test Hypotheses 1a and 1b, I created a dummy variable, referral hire,
with 1 indicating the CSR was a referral hire and 0 indicating otherwise.
Referrer performance at hire. To assess referrer performance at hire, which was
time-invariant, I included measures of a referrer’s calls/hour and quality. Referrer
performance at hire–calls/hour and referrer performance at hire–quality were averaged
across the 4 weeks prior to the referral hire’s starting week to obtain a reliable measurement.
For example, if a referral hire started the first week of July 2009 (the week of July 6), the
referrer’s average calls/hour and quality were assessed for the 4 weeks prior (weeks of June
7, 14, 21, and 28).
This article is protected by copyright. All rights reserved. 20
Referrer tenure at hire. I measured referrer tenure at hire as number of weeks the
referrer had been employed in the organization at the time the referral hire started. For
instance, if the call center hired the referrer on January 1, 2008, and his or her referral hire on
March 1, 2008, referrer tenure at hire would be 8 weeks. I used the natural logarithm of this
variable to help normalize the positively skewed distribution that resulted because the
majority of referrers were fairly new to the organization (30% of referrers were employed for
10 weeks or less).
Referrer employment. Referrer employment was coded as a time-varying dummy
variable, coded as 1 if the referrer was employed in the call center during the given referral
hire-observation week and 0 if the referrer was not employed in that week.
Referrer-referral hire job congruence. Referrer-referral hire job congruence,
treated as a time-invariant variable, was based on whether the referral hire and referrer
worked on the same client program at the start of the referral hire’s employment. Because a
CSRs’ job content varies according to the assigned client program, co-worker interaction is
most likely to occur between CSRs working in the same client program. For example, a CSR
working on a telecommunications company’s billing program would be less likely to seek
assistance from a CSR working on the client’s technical support program and more likely to
approach another CSR who also works on the billing program. Referrer-referral hire job
congruence was coded as 1 for those dyads who worked in the same client program and 0
otherwise. Only one referrer-referral hire dyad worked on the same team, so this aspect was
not available for coding.
Covariates. All analyses controlled for several variables known to correlate with
performance and likelihood of voluntary turnover. Dummy variables indicating a CSR’s team
were included in the analyses (but not reported in the tables due to space constraints) to
account for differences in management practices across supervisors (1 team assigned per
This article is protected by copyright. All rights reserved. 21
supervisor) and to capture differences across client programs and clients. Hours per week,
also time-varying, measured the number of hours a CSR worked each week and was included
to account for the high degree of emotional labor inherent in customer service jobs that may
lower performance, lead to burnout, and increase the likelihood of leaving (Cordes &
Dougherty, 1993). Because pay is often related to performance and voluntary turnover
(Gerhart & Rynes, 2003), I controlled for pay rate, a time-varying measure of a CSR’s hourly
wage rate in a given week. The call center began servicing a large client in June 2009, which
required the firm to undergo a period of significant hiring for several months, during which
hiring was 3 times greater than in the months prior. To account for any workforce conditions
unique to this time (e.g., productivity losses, relaxed hiring standards to fill seats, and lower
job satisfaction), I included the time-varying variable, new client, coded 1 for the weeks
following June 1, 2009, and 0 otherwise. This variable was significantly correlated with
performance (r = -.16, p < .001; Table 1) and voluntary turnover (r = -.36, p < .001; Table 1),
confirming its inclusion (Becker, 2005).
Analyses of performance—calls/hour and quality—also included time-varying
controls for a CSR’s tenure and call volume. I included tenure, operationalized as weeks with
the organization, as it positively influences performance (Ng & Feldman, 2010; Schmidt &
Hunter, 1998). Because I used survival analysis, tenure was not included in the voluntary
turnover analyses. Call volume, or the number of calls a CSR handled each week, was
included because it varied across client programs and could influence a CSR’s calls/hour and
quality.
Finally, the referral bonus plan for which referrers were eligible also was controlled in
analyses of referral hire outcomes (Hypotheses 2-5) to account for differential incentive
effects between the two plans used. The payout structure and amount for the bonus plan
changed in September 2008 from a payout of $100 if the referral hire remained 45 days and

This article is protected by copyright. All rights reserved. 22
another $100 if the referral hire remained 90 days, to a payout of $15 every bi-weekly pay
period if the referral hire remained past 60 days. Because the two bonus plans may motivate
different referrer behavior (e.g., under the $15 plan, referrers may be more likely to refer
people who are expected to stay longer to maximize their payout), I included a dummy
variable, $15 bonus plan, coded as 1 if the referral hire was referred under the bi-weekly
bonus plan and 0 for the prior plan.
Handling Missing Predictor Data
Because referrers could refer while in training, 32% of them did not have the full 4
weeks of performance data needed to create the referrer performance–calls/hour and
performance–quality variables. Some referrers were in training when their referral hire started
and had no prior performance data, while others had been out of training for fewer than 4
weeks (meaning only 1-3 weeks of prior performance data were available, but not a full 4
weeks). I imputed values for cases without a full 4 weeks of prior performance data.
To avoid the problems of bias and inefficiency associated with listwise and pairwise
deletion and single imputation (Allison, 2002; Newman, 2003), I employed multiple
imputation (MI) to fill in missing values for 123 cases of referrer performance at hire–quality
and 103 cases of referrer performance at hire-calls/hour, as well as missing values for 2
referrer tenure at hire cases and 1 job congruence case. In MI, multiple values (typically 5-
10) for each missing data point are imputed from relevant information about the observed
data, resulting in the creation of multiple “completed” data sets. Each of these data sets is
then analyzed, and the results are combined. I used Amelia II (Honaker, King, & Blackwell,
2006), a program for missing data that works within R, to perform the imputation step 10
times. This program uses a bootstrapping-based expectation-maximization algorithm and is
advantageous for handling missing cross-sectional time-series data like this study’s data
(Honaker & King, 2010). Because imputations of missing time-invariant variables (like
This article is protected by copyright. All rights reserved. 23
referrer performance at hire) can result in different values for each time point, I took the
mean of the imputed values within each unit (referral hire) and set each performance-week
observation to that value (Blackwell, 2010), then performed descriptive statistics,
correlations, and analyses on the 10 imputed datasets.2 To combine the results , I used
STATA’s MIRUBIN command, which applies Rubin’s (1987) MI rules.
Analytical Strategies
Performance. I used the random effects (RE) model with maximum likelihood
estimation (MLE) to analyze performance–calls/hour and quality. Because the Hausman
(1978) specification test suggested unobserved heterogeneity in analyses of calls/hour and
quality in tests of Hypothesis 1a-5a, the fixed effects (FE) model would typically be preferred
to avoid biased and inconsistent estimators (Baltagi, 2008; Halaby, 2004; Hausman & Taylor,
1981). However, even though the FE model would avoid biases from omitted variables (e.g.,
ability and education), its drawback is its inability to estimate time-invariant variables
(Baltagi, 2008; Hsiao, 2003; Wooldridge, 2002). The FE model uses only within-unit (CSR,
in this study) variance for estimation and disregards the between-unit variance, excluding
time-invariant variables. Because I was interested in the effects of time-invariant predictors,
the FE model proved unsuitable. Thus, I used the RE model, consisting of performance-week
observations nested in CSR. Using STATA’s XTMIXED command with MLE, I regressed
the longitudinal (cross-sectional time-series) performance data on the independent variables.
This model is equivalent to a 2-level random intercept model described in multilevel
modeling literature. The data were unbalanced. For the calls/hour criterion, the average
number of week-performance observations was 20.5 for the full sample of CSRs and 21.4 for
the referral hire sample. For quality, the full sample of CSRs averaged 18.8 performance-
week observations, and the referral hire sample averaged 20.
2 I ran the analyses with the complete data set without imputing missing values, and the results were similar.
This article is protected by copyright. All rights reserved. 24
In analyses of Hypotheses 2a-5a, I estimated a 3-level random intercept model
(nesting week observations in referral hires and referral hires in referrers) to account for the
fact that referral hires are clustered in referrers (referrers can recommend multiple new hires).
Ignoring this dependency could lead to downwardly biased standard errors and, consequently,
Type I errors (Bliese & Hanges, 2004; Kenny & Judd, 1986; Kenny & La Voie, 1985). I
treated the level-3 (referrer effect) and level-2 (referral hire effect) intercepts as random and
the slope coefficients of the level-1 and level-2 variables as fixed. Time-varying variables
(e.g., pay rate, hours per week, and referrer employment) were included in level-1. Measures
of referral bonus plan, referrer performance at hire, referrer tenure at hire, and referrer-
referral hire job congruence were included in level-2 (and not level-3, or the referrer level)
because they are measured specific to the referral hire’s start date and could change for a
subsequent referral hire.
Voluntary turnover likelihood. Because voluntary turnover is a binary variable, I
used survival analysis, which models the probability of an employee leaving voluntarily over
the duration of that person’s employment in the firm, based on the influence of predictors.
This method is advantageous in handling right-censored survival data (i.e., CSRs who do not
leave voluntarily, including those who are fired and those who remain at the end of the
study), because excluding right-censored data can increase the variance in estimates and lead
to biased results (Singer & Willet, 2003). For instance, CSRs terminated by the organization
are included in the survival analysis as a stayer up until they their termination date. Following
termination, they drop out of the analysis. Survival analysis also allows for a variance in the
probability of leaving voluntarily depending on a CSR’s tenure
Following prior research (i.e., Trevor, 2001), I used proportional hazards survival
analysis, or Cox regression (Cox, 1972). This approach is semi-parametric as it does not
necessitate one to specify the form of the hazard function in advance (i.e., no distributional
This article is protected by copyright. All rights reserved. 25
assumptions are imposed on the data).3 To account for time-varying variables, the data set
was configured into spells, resulting from creation of a new observation for an individual
whenever a time-dependent covariate changes value, which could occur each week in this
study. The Efron method for dealing with tied events (i.e., events that occur on the same date)
was used. Finally, in tests of Hypotheses 2b-5b, I clustered the standard errors around
referrers to obtain a robust variance estimate that accounts for within-referrer correlation
(Rogers, 1993; Wooldridge, 2002).
Results
Table 1 presents descriptive statistics and correlations for the full sample of CSRs.
Table 2 reports this information for referral hires. As shown in Table 1, CSRs had an average
tenure of 21.77 weeks, received $8.58 per hour, worked an average of 37.61 hours per week,
handled an average of 141.79 calls per week, and had an average quality rating of 90.32%.
Based on AHT, the average CSR could handle 7.41 calls per hour. Furthermore, there was a
small correlation between calls/hour and quality (r = .04), indicating that productive workers
were not necessarily high quality workers. This small association likely occurred because the
call center’s clients emphasize quality differently. During the study window, 51% of CSRs
voluntarily quit—a rate consistent for outsourced call centers (Batt, Doellgast, Kwon, &
Agrawal, 2005). These CSR characteristics did not substantially differ in the referral-hire-
only sample (Table 2). For those variables used to predict referral hire outcomes (Hypotheses
2-5), referrers’ average calls/hour was 8.84 and average quality rating was 85.5% upon their
3 The Cox model requires that the predictors be proportional to some unknown baseline hazard function across
time (Singer & Willet, 2003). Because failure to account for these time-varying interactions can lead to
attenuated results (Box-Steffensmeier & Jones, 2004), I examined this by regressing Schoenfeld residuals on
survival time. A significant correlation would suggest that the predictor violates the assumption (Harrell, 2001;
Singer & Willett, 2003). For the test of Hypothesis 1b results suggested that pay rate potentially violates the
assumption. For tests of Hypotheses 2b-5b, which use referral-only data, pay rate and hours per week were
found to violate the assumption. Because Singer and Willett’s (2003) suggest including an interaction between
the predictor(s) in question and time to deal with violations of proportionality, I examined models that included
such interaction terms. I found that these analyses did not change the results of these models, so I present the
models without these interactions in this study.
This article is protected by copyright. All rights reserved. 26
referral hire’s start date. The average referrer tenure at hire was 65 weeks, 73% of referrers
remained employed (or did not quit), and 18% of the referrer-referral hire dyads worked on
the same client program. Finally, both tables also report the predicted reliability of current
week-performance observations for the time-varying continuous variables. I calculated
reliability by first computing the mean inter-week correlation for each variable and the
average number of week-performance observations per employee, then entering these values
into the Spearman-Brown prophecy formula.
In all analyses of performance–calls/hour and quality, I used Cook’s D influence
statistic (Cook, 1977) to exclude influential cases. The results of the hypothesis tests in the
analysis of performance-calls/hour exhibited the greatest distortion and the decision to
exclude these cases tended to result in more conservative estimates. Upon further
investigation, these cases could be described as involving extremely high values of calls/hour
that were based on few calls handled (e.g., a reported calls/hour of 360 based on 1 call
handled), CSRs with only 1 week of recorded performance data (either as a result of them
leaving or the study window ending), or instances of anomalies within individuals (i.e., a
recorded calls/hour that deviated from the rest of that CSR’s weekly calls/hour). The
reduction in the number of performance-week observations across the analyses ranged from
under 1% to 6.9%, with quality week-observations being reduced the most.
Baseline Predictions
I predicted that referral hires would perform better (Hypothesis 1a) and would be less
likely to leave voluntarily (Hypothesis 1b) than non-referral hires. Table 3 reports the results
for performance–calls/hour and quality and Table 4 for voluntary turnover. As shown in
Table 3’s Model 3, the coefficient for referral hire was positive and marginally significant (b
= .21, p = .06) in the analysis of performance–calls/hour, providing marginal support for

This article is protected by copyright. All rights reserved. 27
Hypothesis 1a.4 From a practical standpoint, .1% incremental variance in performance
explained by whether an employee was referred or not may seem trivial. However,
considering the cumulative effect of this finding across time, the difference can be seen more
readily. In a typical 40-hour work week, a referral hire, on average, can handle 8.4 more calls
than a non-referral hire (40 x .21 = 8.4), which can translate into a large savings for the firm
when multiplied over a large number of weeks and employees. In terms of quality, referral
hires did not have significantly higher quality in comparison to non-referral hires (b = .58, p
= .27; Model 6 in Table 3). Finally, the results in Model 2 in Table 4 suggest that referral
hires are slightly less likely (b = -.14, p = .07) to voluntarily leave in any given week than
non-referral hires. The -.14 coefficient for referral hire in Model 2 suggests that referral hires
were 13% ([exp(-.14) – 1] * 100) less likely to leave voluntarily than non-referral hires,
providing marginal support for Hypothesis 1b.
Referrer Characteristic Effects
Tables 5, 6, and 7 present results for the effects of referrer characteristics on referral
hires’ calls/hour, quality, and propensity to leave. While results for each predictor variable
are displayed in separate models, I used an omnibus model approach for hypothesis testing.
Hypothesis 2a predicted that referral hires from high-performing referrers would be higher
performers. This hypothesis was supported for referrer performance at hire–calls/hour, but
not for referrer performance at hire–quality. The positive referrer-performance-at-hire–
calls/hour coefficient was significantly related to referral hires’ calls/hour (b = .05, p = .03;
Model 5 in Table 5), meaning that increasing a referrer’s calls/hour by 1 unit led to a .05 unit
increase in a referral hire’s calls/hour.5 Thus, referral hires from high-performing referrers
(+1 SD) can handle approximately .19 more calls/hour than referral hires from average-
4 The referral hire coefficient is significant when the 109 influential cases (.4%) are included.
5 In models with 162 influential cases (2.4%) included, the referrer performance at hire–calls/hour and quality
coefficients are larger (breferrer performance-calls/hour =1.33, p < .001 and breferrer performance-quality = 3.60, p > .05).
This article is protected by copyright. All rights reserved. 28
performing referrers. No support was found for Hypothesis 2a in the analysis of quality
(Model 5 in Table 6).
Hypothesis 2b proposed that referral hires from high performers would be more likely
to leave. As shown in Table 7’s Model 4, this hypothesis was supported for referrer
performance at hire–calls/hour (b =.06, p < .001), but not for quality (b = .003, p = .66). The
.06 referrer-performance-at-hire–calls/hour coefficient indicates that referral hires’ likelihood
of leaving increased 6.18% for each unit increase in a referrer’s calls/hour. Referral hires
from high-performers (+1 SD) were 23% more likely to leave than those from average-
performers.
In support of Hypothesis 3, which proposed a curvilinear relationship between referrer
tenure at hire and referral hire performance, the squared referrer-tenure-at-hire (logged)
coefficient was negative and significant (b = -.09, p = .02; Model 5 in Table 5) in the analysis
of calls/hour.6 The .50 logged referrer-tenure-at-hire coefficient (p =.06) represents the effect
when logged referrer tenure is 0 (1 week, unlogged). Because logged coefficients are
routinely interpreted in terms of percent change, this coefficient indicates that a 10% increase
in referrer tenure from 0 is associated with a .05 increase in calls/hour (.50 * [ln[1.1]]). The
negative .09 squared referrer-tenure-at-hire (logged) coefficient can be interpreted as a .01
reduction in calls/hour for every 10% increase in referrer tenure.7 Thus, logged referrer tenure
at hire one standard deviation above 0, or 1.39 (4 weeks, unlogged), results in a simple slope
of .25, indicating a .02 calls/hour increase with a 10% increase in referrer tenure. The positive
slope changes to negative at a logged referrer tenure of 2.77 (15 weeks, unlogged). Figure 2
graphs this relationship. Hypothesis 3 was not supported in the analysis of quality (Model 5
6 These coeficients were also affected by influential cases. The direction of the referrer-tenure-at-hire and its
squared term changed in models that included 162 influential cases. 7 To interpret regression equations containing second-order terms (i.e., referrer tenure at hire squared), I
followed Aiken and West (1991) and computed simple slopes for the curvilinear relationship (i.e., the simple
slope for Ŷ = b1X + b2X2 + b0 was computed as b1 + 2b2X, where X was logged referrer tenure logged at hire).
This article is protected by copyright. All rights reserved. 29
in Table 6); and, even though I did not predict an effect of referrer tenure on referral hires’
turnover propensity, I explored its linear effect post hoc and found no significant results
(Model 5 in Table 7).
I proposed that referrer employment would be positively related to referral hire
performance (Hypothesis 4a) and negatively related to referral hires’ propensity to leave
voluntarily (Hypothesis 4b). I did not find support for Hypothesis 4a. However, in the
calls/hour analysis, the referrer-employment coefficient was significant but negatively related
to referral hires’ calls/hour (b = -.20, p = .01; Model 8 in Table 5), indicating that the number
of calls/hour referral hires could handle was .20 units lower when the referrer remained
employed than when the referrer terminated. Hypothesis 4b was supported, as the referrer-
employment coefficient was negative and significantly associated with likelihood of
voluntary referral hire turnover (b = -.56, p = .02; Model 7 in Table 7). Referral hires were
43% less likely to quit voluntarily as long as their referrer remained employed. Integrated, the
results of Hypotheses 4a and 4b suggest that while retaining the referrer was beneficial in
terms of retaining the referral hire, the referral hire’s calls/hour was lower (but quality
unaffected) when the referrer remained employed.
Hypotheses 5a and 5b predicted that referral hires would perform better and be less
likely to voluntarily leave when their jobs were similar to those of their referrers. No support
was found for these hypotheses. However, Model 8 in Table 5 shows that job congruence was
significantly and negatively associated with referral hires’ calls/hour (b = -.45, p = .04),
indicating that when referrers’ and referral hires’ jobs were similar, the number of calls/hour
referral hires could handle was reduced by .45 units. Job congruence also had a negative and
significant effect on referral hires’ quality (b = -2.90, p = .03; Model 8 in Table 6). Finally,
referral hires’ turnover propensity was unrelated to job congruence (Model 7 in Table 7).
Supplemental Analysis

This article is protected by copyright. All rights reserved. 30
I ran an additional analysis to determine whether the type of referral bonus plan in
place explains the opposite findings regarding referrer employment and referrer-referral job
congruence. The call center had recently changed from awarding referrers larger, lump-sum
amounts after a specific period of referral hire tenure (the $100 bonus plan) to a series of
multiple, smaller payments continually awarded as long as both parties remained employed
(the $15 bonus plan). It is probable that under the latter plan, referrers have socialized more
with their referral hires in ways that undermined performance. Rather than helping the
referral hire perform better, referrers may have focused on helping referral hires enjoy the
job, hoping their referral hire will remain longer, thus increasing the amount of bonus money
they could earn. If this is true, the effects of referrer employment and referrer-referral hire job
congruence on referral hire performance and turnover propensity should differ depending on
the bonus plan in place.
The results for performance–calls/hour and quality and voluntary turnover are
presented in Tables 8 and 9. Because the interactions of interest involved two dichotomous
variables, I created 4 dummy variables for each condition. For example, to model the referrer
employment-by-bonus plan interaction, I coded each of the following dummy variables as 1
if the condition applied and 0 otherwise: referrer employed in $15 bonus plan, referrer
employed in $100 bonus plan, referrer terminated in $15 bonus plan, referrer terminated in
$100 bonus plan. Moreover, because I was interested in the mean differences between the
two bonus plans under the conditions of referrer employment and job congruence, referrer
employed in $100 bonus plan and job congruence in $100 bonus plan were the reference
categories. Under the $15 bonus plan, when the referrer remained employed, referral hires
were significantly less productive (b = -.46, p = .02; Model 1 in Table 8) and were slightly
less likely to leave (b = -.52, p = .09; Model 1 in Table 9), but they also had marginally
higher quality (b = 2.13, p = .07; Model 3 in Table 8) than when the referrer was employed

This article is protected by copyright. All rights reserved. 31
under the $100 bonus plan. The job congruence findings were similar in the analyses of
calls/hour and quality, but not significant (see Table 8). Under the $15 bonus plan, referral
hires with similar jobs as their referrer also had significantly lower turnover propensities (b =
-.93, p = .04; Model 2 in Table 9) than those under the $100 bonus plan.8
Discussion
The advantages of employee referrals are well-known in practice and have been
demonstrated in research in a number of disciplines. However, a referrer perspective has been
missing in the literature. Through a theoretical and empirical breakdown of referrer
characteristics that influence referral hire outcomes, I have taken a longitudinal approach that
endorses the benefit of referral hiring and demonstrates the accuracy of several theoretical
predictions related to the referrer’s quality (see Table 10 for a summary of the relationships
tested and their findings). Referral hires from high-performing referrers performed better but
had higher turnover propensities than those from low-performing referrers. Longer-tenured
employees also produced high-performing referral hires, but the effect was negative at high
levels of referrer tenure. I also found the effects of referrers’ accessibility to be more nuanced
than predicted, indicating that referrer accessibility may entail at cost. Referral hires were less
likely to leave as long as their referrer remained employed, but their performance was lower
under this condition. Similarly, referral hires performed at lower levels when their job was
congruent with their referrer’s job. The results of my supplemental analyses regarding the
bonus plan in place also suggest that emphasizing the context will better inform inferences.
8 One could also run the models separately by the type of bonus plan, as the Chow test (p < .001) indicated that
the difference in two subgroups’ sets of coefficients was statistically significant (Schenker & Gentleman, 2001)
in analyses of performance (calls/hour and quality) and voluntary turnover. The results (not shown here) were in
support of those presented in Table 8 and 9. They suggested that the negative effects of referrer employment (p
< .001) and job congruence (p = .04) on referral hire calls/hour were stronger under the $15 bonus plan than the
$100 bonus plan. However, in the analyses of referral hire quality, the negative effect of job congruence was
statistically stronger (p = .03) under the $100 bonus plan than the $15 bonus plan. The negative referrer
employment effect was also statistically stronger (p = .01) under the $15 bonus plan than the $100 bonus plan.
This article is protected by copyright. All rights reserved. 32
Finally, my findings and their implicationsem should be considered in relation to their small
effect sizes.
Theoretical Implications
My study has several theoretical implications. First, my work extends prior work by
providing theoretical insight into how theories from two disciplines (better match account and
social enrichment perspective) affect referral hire outcomes concurrently through a model of
referrer characteristics. By conceptualizing referrers as social resources, the findings reported
here deepen our knowledge of relevant referrer characteristics that influence referral hire
outcomes and underscore the need for integrated theoretical models of this phenomenon.
Second, my study takes a step forward in understanding referral hiring because it
illustrates nuances that highlight limitations of the revised theories. While my study provides
additional evidence (albeit of small magnitude) of the referrer performance effect on that of
the referral hire performance (which supports the better match account and extends the work
of Yukovich and Lup [2006] who found evidence of the effect during the pre-hire stage), it
suggests that referrer performance also influences referral hire turnover. My results suggest
that the effect may work to a firm’s disadvantage, as referral hires from high-performing
employees had a higher propensity to leave. This finding indicates that there may be a
tradeoff regarding the notion that high performers will refer better employees; that is, these
hires may perform better but are more likely to leave. Research is warranted to understand
when this tradeoff occurs (e.g., the labor market context may help explain this tradeoff).
My findings also point to the overly simplistic nature of the social enrichment
perspective. The assumption is that social enrichment benefits the employer, and Hypotheses
4 and 5 tested this notion. While I found partial support for this, in that referral hires were
less likely to leave as long as their referrers remained employed, my findings (albeit of small
magnitude) showed that referral hires’ performance was lower when their referrers were
This article is protected by copyright. All rights reserved. 33
employed and when they had jobs similar to those of their referrers. Thus, not all outcomes
from social enrichment may be conducive to the employer, a notion offered by Ullman
(1966), but largely ignored. Ullman noted that some firms avoid the problems of cliques by
not hiring through referrals. However, the bonus plan scheme in place (at least in the call
center under study) may potentially be driving the negative effects of greater referrer
accessibility. Referral bonus schemes paid out in smaller increments across time may
motivate referrers to socialize with their referral hires in ways detrimental to their
productivity. Future work is needed to theoretically disentangle how and why referral bonus
schemes motivate referrer behavior and when social enrichment will work in the firm’s favor
and when it will not.
Practical Implications
My results suggest that organizations should actively seek employee referrals.
Referral hires in my sample handled, on average, 2.4% more calls/hour than non-referrals,
similar to the percent advantage reported by Castilla (2005). While this effect may be small in
a single week, over time its magnitude increases (Abelson, 1985). Considering that 34% of
the workforce sampled in this study consisted of referral hires, the .21 coefficient reported in
Table 3 means referral hires are able to handle approximately 119 calls/hour more than the
same number of non-referral hires, or 4,762 calls in a 40-hour week. This can have a
substantial impact on the call center’s operation costs. Referral hires also were 13% less
likely than non-referral hires to voluntarily quit at any point in their tenure. Organizational
tactics for increasing the number of referrals include the use of referral bonuses, non-
monetary rewards (e.g., gift cards and trips), and educating employees to better recruit
individuals in their social networks.
This study also offers evidence-based guidance on ways organizations can maximize
the benefits of referral hiring. For example, when positions open up, organizations should
This article is protected by copyright. All rights reserved. 34
proactively seek referrals from their high performing employees, who are likely to refer
high-quality candidates, who in turn will produce high quality, cost-effective work. For
instance, if 10% of referral hires in the call center are from low performers (-1 SD) and the
firm instead hired the same number of referrals from high performers (+1 SD), these new
hires, collectively, could handle 18,491 more calls (based on an average tenure of 23.22
weeks and 37.72 hours/week, Table 2). Estimated savings will further increase as the costs
related to recruiting, hiring, and training employees also are considered. Organizations also
should look for referrals from longer-tenured employees, at least those not too far removed
from the entry stage of employment.
Finally, my findings caution against jumping to the conclusion that all referrals will
perform better and stay longer; they also highlight the potential costs of referral hiring.
Because referral hires from high-performing referrers also are more likely to leave
voluntarily, one way to counteract this effect would be to follow up with referrals
immediately after their referrer leaves and encourage them to stay. Another option to help
retain high performers would be to offer a performance-based bonus to employees if they
remain for a certain period of time. Because my findings indicated that referral hires perform
less effectively under conditions of greater referrer accessibility, designers and managers of
employee referral programs should consider offering supplemental rewards to referrers whose
referral hires turn out to be top performers to possibly prevent referrers from distracting the
referral hires.
Limitations and Future Research
A number of limitations should be considered. Due to access constraints placed on
available data used in the study, the models did not account for employee demographics (e.g.,

This article is protected by copyright. All rights reserved. 35
age and gender) and other human capital variables known to influence performance and
voluntary turnover. Such unobserved heterogeneity may bias the results reported here.9
Second, many of the findings in the analyses of quality were in the predicted
direction, but not significant. A number of factors may explain the lack of significant effects,
including the subjective nature of the quality ratings, the low level of monitors each week (M
= 2.8 monitors), and the differential importance of quality across clients. Also, one third of
the full sample achieved quality ratings of 100%, indicating possible rater leniency bias or
legitimately high quality scores on most calls. This skew may lead to underestimation of the
“true” relationship between referrer characteristics and referral hire quality. These factors
also may explain why the quality measure of referrer performance was unrelated to referral
hire outcomes. In addition, a significant proportion of this study’sreferrers were relatively
new hires themselves (likely with little variability in job knowledge and experience). Thus,
the results of the curvilinear referrer tenure-referral hire performance relationship may be
understated and also not generalizable to other settings where newcomers refer less
frequently.
Third, I acknowledge that referrer employment and referrer-referral hire job
congruence are coarse measures of the accessibility construct. Although management
confirmed that most employees referred friends or relatives and that social interaction most
likely occurred when referrers and referral hires worked on the same client program (due to
physical proximity and similar schedules), perceptual measures of the degree to which
referral hires actually access their referrers may provide for stronger tests. Social network
9 To alleviate this concern, I checked the robustness (in analyses not shown here) of the performance results
reported in Tables 3, 5 and 8, using fixed effects vector decomposition (FEVD; Plümper &Troeger, 2007, 2011),
a 3-stage method to estimate the effects of time-invariant variables that avoids biases due to unobserved
heterogeneity (STATA code is available at http://www.polsci.org/ pluemper/ssc.html). Due to its rarity in
management research, warnings about covariance matrix errors (Breusch, Ward, Ngyen, & Kompass, 2011;
Greene, 2011), and its inability to account for the 3-level nesting, I only used this approach to evaluate if my
results are affected. As the results using this method were relatively unchanged, unobserved heterogeneity likely
is non-problematic.
This article is protected by copyright. All rights reserved. 36
research also suggests that the strength of the relationship (Granovetter, 1973) between the
referrer and referral hire affects interaction; thus, integrating this construct would provide a
fruitful moderator of the relationship between referrer accessibility and referral hire
outcomes. In addition, as a referral hire becomes socially embedded in the workforce and
establishes additional social resources, the effects of referrer accessibility may weaken. While
not presented here, I examined whether the effects of referrer employment and job
congruence weakened across a referral hire’s tenure and found that the effect of referrer
employment did decay for calls/hour but not quality or voluntary turnover.
Fourth, my measure of job congruence is likely confounded by the proximity between
referrers and referral hires. Thus, the negative effect of job congruence may actually be a
function of the pair working more closely and distracting each other. Because CSR
workstations are physically positioned according to client programs, it was not possible to
disentangle the effect of proximity from job congruence in my sample.
Fifth, the generalizability of my findings may be limited to a narrow range of referral
hire settings and to the call center environment. For instance, I examined same position-level
referrer-referral hire dyads, but referral hire outcomes may depend on the referrer’s job level.
Because my sample did contain referral hires from team leaders and trainers, I was able to
test this notion. I found no significant differences between referral hires from CSR-referrers
and those from upper-level referrers across the three referral hire outcomes. These
insignificant results could be due in part to the low sample size of upper-level referrers and/or
to the fact that the upper-level positions examined were, in essence, only one job level higher.
More research is needed on the referrer’s job level, as this construct may serve as an
additional measure of referrer quality and offer insight into the efficacy of the revised
theory’s predictions. Additionally, future research should examine the effects of referrer
characteristics in non-low-wage/low-skill settings. For example, referrers in this setting may
This article is protected by copyright. All rights reserved. 37
not have strong self-interest in protecting their reputations and may refer someone simply for
the sake of improving the social environment. The low-wage/low-skill setting in my study
also possibly explains the finding that high-performing referrers were associated with referral
hires who performed better but were also more likely to leave. In such settings, high-
performers likely have alternative job opportunites, making it more difficult for firms to
retain them. It would also be interesting to test the generalizability of referrer characteristics
effects in a “chain” of referral hires (where employee A refers employee B, who then
referrers employee C) to see if there are lasting effects of the initial referrer.
Finally, my study does not account for referrer motivation in referring. Although two
studies (Shinnar, Young, & Meana, 2004; Van Hoye, 2013) have investigated intrinsic (e.g.,
desire to have a friend) and extrinsic (e.g., referral bonus) determinants of referring, research
has yet to consider how these, and their interaction, may uniquely predict referral hire
outcomes. For instance, high referral bonuses may motivate employees to refer anyone,
regardless of quality, to simply getting more money. On the other hand, if referrers are
motivated by the organization’s best interests, they should be likely to refer high-quality
candidates who will succeed. Research developing and testing theories about referrer
motivations will fill a large gap in the literature. My own results show that the structure of the
referral bonus plan may play a role in motivating referrer behavior. Specifically, when the
bonus amount is awarded in small increments over time and as long as the referrer and
referral hire are both still employed (the $15 bonus plan), the referral hire’s propensity for
turnover is lower but he/she also tends to perform at a lower level.
This article is protected by copyright. All rights reserved. 38
References
Abelson, R. P. (1985). A variance explanation paradox: When a little is a lot. Psychological
Bulletin, 97, 128-132. doi: 10.1037/0033-2909.97.1.129
Aiken, L. S., & West, S. G. (1991). Multiple regression: Testing and interpreting
interactions. Thousand Oaks, CA: Sage Publications.
Allison, P. D. (2002). Missing data (Sage University Paper Series on Quantitative
Applications in the Social Sciences, 07-136). Thousand Oaks, CA: Sage Publications.
Ashforth, B. E., & Mael, F. (1989). Social identity theory and the organization. Academy of
Management Review, 14, 20-39. doi: 10.5465/AMR.1989.4278999
Baltagi, B. H. (2008). Econometric analysis of panel data (4th ed.). Chichester, UK: John
Wiley & Sons.
Barber, A. E. (1998). Recruiting employees: Individual and organizational perspectives.
Thousand Oaks, CA: Sage Publications.
Batt, R., Doellgast, V., & Kwon, H. (2005). Service management and employment systems in
U.S. and Indian call centers (CAHRS Working Paper #05-12). Ithaca, NY: Cornell
University, School of Industrial and Labor Relations, Center for Advanced Human
Resource Studies. Retrieved from http://digitalcommons.ilr.cornell.edu/cahrswp/279/.
Becker, T. E. (2005). Potential problems in the statistical control of variables in
organizational research: A qualitative analysis with recommendations. Organizational
Research Methods, 8, 274-289. doi: 10.1177/1094428105278021
Bewley, T. F. (1999). Why wages don't fall during a recession. Cambridge, MA: Harvard
University Press.
Bird, A. (1996). Careers as repositories of knowledge: Considerations for boundaryless
careers. In M. B. Arthur & D. M. Rousseau (Eds.), The boundaryless career: A new
employment principle for a new organizational era (pp. 150-168). New York, NY:
Oxford University Press.
Blackwell, M. (2010, February 16). Time series with time-invariant variables. Message
posted to https://lists.gking.harvard.edu/pipermail/amelia/2010-February/000229.html
Blau, G. (1990). Exploring the mediating mechanisms affecting the relationship of
recruitment source to employee performance. Journal of Vocational Behavior, 37,
303-320. doi: 10:1016/0001-8791(90)90047-6
Bliese, P. D., & Hanges, P. J. (2004). Being both too liberal and too conservative: The perils
of treating grouped data as though they were independent. Organizational Research
Methods, 7, 400-417. doi: 10.1177/1094428104268542
This article is protected by copyright. All rights reserved. 39
Box-Steffensmeier, J. M, & Jones, B. S. (2004). Event history modeling: A guide for social
scientists. New York, NY: Cambridge University Press.
Breaugh, J. A. (1992). Recruitment: Science and practice. Belmont, CA: Wadsworth
Publishing.
Breaugh, J. A., & Starke, M. (2000). Research on employee recruitment: So many studies, so
many remaining questions. Journal of Management, 26, 405-434. doi:
10.1177/014920630002600303
Breusch, T., Ward, M. B., Nguyen, H., & Kompas, T. (2011). On the fixed-effects vector
decomposition. Political Analysis, 19, 123-134. doi: 10.1093/pan/mpq026
Brockner, J., & Kim, D. H. (1993). Factors affecting stayers’ job satisfaction in response to a
coworker who departs for a better job. Journal of Applied Social Psychology, 23,
1659-1684. doi: 10.1111/j.1559-1816.1993.tb01060.x
Burt, R. S. (1992). Structural holes: The social structure of competition. Cambridge, MA:
Harvard University Press.
Callaghan, G., & Thompson, P. (2001). Edwards revisited: Technical control and call centres.
Economic and Industrial Democracy, 22, 13-37. doi: 10.1177/0143831X01221002
Castilla, E. J. (2005). Social networks and employee performance in a call center. American
Journal of Sociology, 110, 1243-1283. doi: 10.1086/427319
Chen, Z., Takeuchi, R., & Shum, C. (2013). A social information processing perspective of
coworker influence on a focal employee. Organization Science, 24, 1618-1639. doi:
10.1287/orsc.2013.0820
Chiaburu, D. S., & Harrison, D. A. (2008). Do peers make the place? Conceptual synthesis
and meta-analysis of coworker effects of perceptions, attitudes, OCBs, and
performance. Journal of Applied Psychology, 93, 1082-1103. doi: 10.1037/0021-
9010.93.5.1082
Conrad, M. A., & Ashworth, S. D. (1986). Recruiting source effectiveness: A meta-analysis
and re-examination of two rival hypotheses. Paper presented at the First Annual
Meeting of the Society for Industrial and Organizational Psychology, Chicago, IL.
Cook, R. D. (1977). Detection of influential observations in linear regression. Technometrics,
19, 15-18. doi: 10.2307/1268249
Cordes, C. L., & Dougherty, T. W. (1993). A review and integration of research on job
burnout. Academy of Management Review, 18, 621-656. doi:
10.5465/AMR.1993.9402210153
Cox, D. R. (1972). Regression models and life tables [with discussion]. Journal of the Royal
Statistical Society, Series B, 34, 187-220. doi: 10.2307/2985181
This article is protected by copyright. All rights reserved. 40
Decker, P. J., & Cornelius, E. T. III. (1979). A note on recruiting sources and job satisfaction.
Journal of Applied Psychology, 64, 463-464. doi: 10.1037/0021-9010.64.4.463
Deery, S. J., Iverson, R. D., & Walsh, J. T. (2010). Coping strategices in call centres: Work
intensity and the role of co-workers and supervisors. British Journal of Industrial
Relations, 48, 181-200. doi: 10.1111/j.1467-8543.2009.00755.x
Fernandez, R. M., Castilla, E. J., & Moore, P. (2000). Social capital at work: Networks and
employment at a phone center. American Journal of Sociology, 105, 1288-1356. doi:
10.2307/3003768
Fernandez, R. M., & Fernandez-Mateo, I. (2006). Networks, race and hiring. American
Sociological Review, 71, 42-71. doi: 10.1177/000312240607100103
Festinger, L. (1954). A theory of social comparison processes. Human Relations, 7, 117-140.
doi: 10.1177/001872675400700202
Gerhart, B., & Rynes, S. L. (2003). Compensation: Theory, evidence, and strategic
implications Thousand Oaks, CA: Sage Publications.
Granovetter, M. (1973). The strength of weak ties. American Journal of Sociology, 78, 1360-
1380. doi: 10.2307/2776392
Granovetter, M. (1974). Getting a job: A study of contacts and careers. Chicago, IL: The
University of Chicago Press.
Granovetter, M. (1995). Getting a job: A study of contacts and careers (2nd
ed.). Chicago, IL:
The University of Chicago Press.
Greene, W. (2011). Fixed effects vector decomposition: A magical solution to the problem of
time invariant variables in fixed effects models? Political Analysis, 19, 135-146. doi:
10.1093/pan/mpq034
Halaby, C. N. (2004). Panel models in sociological research: Theory into practice. Annual
Review of Sociology, 30, 507-544. doi: 10.2307/29737704
Harrell, F. E. (2001). Regression modeling strategies with applications to linear models,
survival analysis and logistic regression. New York, NY: Springer.
Hausman, J. A. (1978). Specification tests in econometrics. Econometrica, 46, 1251-1272.
doi: 10.2307/1913827
Hausman, J. A., & Taylor, W. E. (1981). Panel data and unobservable individual effects.
Econometrica, 49, 1377-1398. doi: 10.2307/1911406
Hill, R. E. (1970). New look at employee referrals as a recruitment channel. Personnel
Journal, 49, 144-148.
This article is protected by copyright. All rights reserved. 41
Holzer, H. J. (1987). Hiring procedures in the firm: Their economic determinants and
outcomes. (NBER Working Paper 2185). National Bureau of Economic Research,
Cambridge, MA. Retrieved from http://www.nber.org/papers/w2185
Holzer, H. J. (1988). Search method use by unemployed youth. Journal of Labor Economics,
6, 1-20. doi: 10.2307/2534865
Honaker, J., & King, G. (2010). What to do about missing values in time-series cross-section
data. American Journal of Political Science, 54, 561-581. doi: 10.1111/j.1540-
5907.2010.00447.x
Honaker, J., King, G., & Blackwell, M. (2009). Amelia II: A program for missing data.
Retrieved from http://gking.harvard.edu/amelia
Hsiao, C. (2003). Analysis of panel data (2nd ed.). New York, NY: Cambridge University
Press.
Jackofsky, E. G. (1984). Turnover and job performance: An integrated process model.
Academy of Management Review, 9, 74-83. doi: 10.5465/AMR.1984.4277940
Jovanovic, B. (1979). Job matching and the theory of turnover. Journal of Political Economy,
87, 972-990. doi: 10.2307/1833078
Kenny, D. A., & Judd, C. (1986). Consequences of violating the independence assumption in
analysis of variance. Psychological Bulletin, 99, 422-431. doi: 10.1037/0033-
2909.99.3.422
Kenny, D. A., & La Voie, L. (1985). Separating individual and group effects. Journal of
Personality and Social Psychology, 48, 339-348. doi: 10.1037/0022-3514.48.2.339
Kugler, A. D. (2003). Employee referrals and efficiency wages. Labour Economics, 10, 531-
556. doi: 10.1016/S0927-5371(03)00047-2
Korczynski, M. (2003). Communities of coping: Collective emotional labour in service work.
Organization, 10, 55-79. doi: 10.1177/1350508403010001479
Krackhardt, D., & Porter, L. (1985). When friends leave: A structural analysis of the
relationship
between turnover and stayers’ attitudes. Administrative Science Quarterly, 31,
242-61. doi: 10.2307/2393107
Krackhardt, D., & Porter, L. (1986). The snowball effect: Turnover embedded in
communication networks. Journal of Applied Psychology, 71, 50-6. doi:
10.1037/0021-9010.71.1.50
Krausz, M., Yaakobovitz, N., Bizman, A., & Caspi, T. (1999). Evaluation of coworker
turnover outcomes and its impact on the intention to leave of the remaining
employees. Journal of Business and Psychology, 14, 95-107. doi:
10.1023/A:1022910601836
This article is protected by copyright. All rights reserved. 42
Lee, T. W., & Mitchell, T. R. (1994). An alternative approach: The unfolding model of
voluntary employee turnover. Academy of Management Review, 19, 51-89. doi:
10.5465/AMR.1994.9410122008
Lin, N. (1982). Social resources and instrumental action. In P.V. Marsden & N. Lin (Eds.),
Social structure and network analysis. Beverly Hills, CA: Sage Publications.
Lin, N. (1999). Social networks and status attainment. Annual Review of Sociology, 25, 467-
487. doi: 10.2307/223513
Lin, N. (2001). Social capital: A theory of social structure and action. New York, NY:
Cambridge University Press.
Lin, N., Ensel, W. M., & Vaughn, J. C. (1981). Social resources and strength of ties:
Structural factors in occupational status attainment. American Sociological Review, 4,
393-405. doi: 10.2307/2095260
Liu, X., & Batt, R. (2010). How supervisors influence performance: A multilevel study of
coaching and group management in technology-mediated services. Personnel
Psychology, 63, 265-298. doi: 10.1111/j.1744-6570.2010.01170.x
Louis, M. R. (1980). Surprise and sense making: What newcomers experience in entering
unfamiliar organizational settings. Administrative Science Quarterly, 25, 226-251.
doi: 10.2307/2392453
Maertz, C. P., Jr., & Griffeth, R. W. (2004). Eight motivational forces and voluntary
turnover: A theoretical synthesis with implications for research. Journal of
Management, 30, 667-683. doi: 10.1016/j.jm.2004.04.001
Marin, A. (2012). Don't mention it: Why people don't share job information, when they do,
and why it matters. Social Networks, 34, 181-192. doi: 10.1016/j.socnet.2011.11.002
Marsden, P. V., & Gorman, E. H. (2001). Social networks, job changes, and recruitment. In I.
Berg & A. L. Kalleberg (Eds.), Sourcebook of labor markets (pp. 467-502). New
York, NY: Kluwer Academic/Plenum Publishers.
McPherson, M., Smith-Lovin, L., & Cook, J. M. (2001). Birds of a feather: Homophily in
social networks. Annual Review of Sociology, 27, 415-444. doi: 10.2307/2678628
Mobley, W. H. (1982). Some unanswered questions in turnover and withdrawal research.
Academy of Management Review, 7, 111–16. doi: 10.5465/AMR.1982.4285493
Montgomery, J. D. (1991). Social networks and labor-market outcomes: Toward an economic
analysis. The American Economic Review, 81, 1408-1418. doi: 10.2307/2006929
Morehart, K. K. (2001). How to create an employee referral program that really works. HR
Focus, January, 3-5.
This article is protected by copyright. All rights reserved. 43
Morrison, E. W. (2002). Newcomers’ relationships: The role of social network ties during
socialization. Academy of Management Journal, 45, 1149-1160. doi:
10.2307/3069430
Mowday, R. T., Porter, L. W., & Steers, R. M. (1982). Employee-organization linkages: The
psychology of commitment, absenteeism, and turnover. New York, NY: Academic
Press.
Newman, D. A. (2003). Longitudinal modeling with randomly and systematically missing
data: A simulation of ad hoc, maximum likelihood, and multiple imputation
techniques. Organizational Research Methods, 6, 328-362. doi:
10.1177/1094428103254673
Ng, T. W. H., & Feldman, D. C. (2010). Organizational tenure and job performance. Journal
of Management, 36, 1220-1250. doi: 10.1177/0149206309359809
Nyberg, A. (2010). Retaining your high performers: Moderators of the performance-job
satisfaction-voluntary turnover relationship. Journal of Applied Psychology, 95, 440-
453. doi: 10.1037/a0018869
Pinkston, J. C. (2012). How much do employers learn from referrals? Industrial Relations,
51, 317-341. doi: 10.1111/j.1468-232X.2012.00679.x
Ployhart, R. E. (2006). Staffing in the 21st century: New challenges and strategic
opportunities. Journal of Management, 32, 868-897. doi: 10.1177/0149206306293625
Plümper, T., & Troeger, V. E. (2007). Efficient estimation of time-invariant and rarely
changing variables in finite sample panel analyses with unit fixed effects. Political
Analysis, 15, 124-139. doi: 10.1093/pan/mpm002
Plümper, T., & Troeger, V. E. (2011). Fixed effects vector decomposition: Properties,
reliability, and instruments. Political Analysis, 19, 147-164. doi: 10.1093/pan/mpr008
Quinones, M. A., Ford, J. K., & Teachout, M. S. (1995). The relationship between work
experience and job performance: A conceptual and meta-analytic review. Personnel
Psychology, 48, 887-910. doi: 10.1111/j.1744-6570.1995.tb01785.x
Rees, A. (1966). Information networks in labor markets. The American Economic Review, 56,
559-566. doi: 10.2307/1821319
Rees, A., & Shultz, G. P. (1970). Workers and wages in an urban labor market. Chicago:
University of Chicago Press.
Reichers, A. E. (1987). An interactionist perspective on newcomer socialization rates.
Academy of Management Review, 12, 278-287. doi: 10.5465/AMR.1987.4307838
Reid, G. L. (1972). Job search and the effectiveness of job-finding methods. Industrial and
Labor Relations Review, 12, 479-495. doi: 10.2307/2521880
This article is protected by copyright. All rights reserved. 44
Rogers, W. H. (1993). Regression standard errors in clustered samples. Stata Technical
Bulletin 13, 19–23. Retrieved from
http://www.stata.com/support/faqs/statistics/stb13_rogers.pdf
Rubin, D. B. (1987). Multiple imputation for nonresponse in surveys. New York, NY: Wiley.
Rynes, S. L. (1991). Recruitment, job choice, and post-hire consequences: A call for new
research directions. In M. D. Dunnette & L. M. Hough (Eds.), Handbook of industrial
and organizational psychology (Vol. 2, pp. 399-444). Palo Alto, CA: Consulting
Psychologists Press.
Rynes, S. L., & Cable, D. M. (2003). Recruitment research in the twenty-first century. In W.
Borman, D. Ilgen, & R. Klimoski (Eds.), Handbook of psychology: Vol. 12. Industrial
and organizational psychology (pp. 55-76). Tampa, FL: John Wiley.
Rynes, S. L., Heneman, H. G., III, & Schwab, D. P. (1980). Individual reactions to
organizational recruiting: A review. Personnel Psychology, 33, 529-542. doi:
10.1111/j.1744-6570.1980.tb00481.x
Salamin, A., & Hom, P. W. (2005). In search of the elusive U-shaped performance-turnover
relationhips: Are high performing swiss bankers more liable to quit? Journal of
Applied Psychology, 90, 1204-1216. doi: 10.1037/0021-9010.90.6.1204
Schmidt, F. L., & Hunter, J. E. (1998). The validity and utility of selection methods in
personnel psychology: Practical and theoretical implications of 85 years of research
findings. Psychological Bulletin, 124, 262-274. doi: 10.1037/0033-2909.124.2.262
Schwab, D. P. (1982). Recruiting and organizational participation. In K. Rowland & G. Ferris
(Eds.), Personnel management (pp. 103-128). Boston, MA: Allyn & Bacon.
Seidel, M. D. L., Polzer, J. T., & Stewart, K. J. (2000). Friends in high places: The effects of
social networks on discrimination in salary negotiations. Administrative Science
Quarterly, 45, 1-24. doi: 10.2307/2666977
Sheehan, E. P. (1991). Reasons for a colleague quitting: Their effects on those who stay.
Journal of Social Behavior and Personality, 6, 343-354. doi:
10.1080/00224545.1993.9713925
Schenker, N., & Gentleman, J. F. (2001). On judging the significance of differences by
examining the overlap between confidence intervals. The American Statistician, 55,
182-186. doi: 10.1198/000313001317097960
Shinnar, R. S., Young, C. A., & Meana, M. (2004). The motivations for and outcomes of
employee referrals. Journal of Business and Psychology, 19, 271-531. doi:
10.1007/s10869-004-0552-8
Sias, P. M., & Cahill, D. J. 1998. From coworkers to friends: The development of peer
friendships in the workplace. Western Journal of Communication, 62, 273-299. doi:
10.1080/10570319809374611
This article is protected by copyright. All rights reserved. 45
Simon, C. J., & Warner, J. T. (1992). Matchmaker, matchmaker: The effect of old boy
networks on job match quality, earnings, and tenure. Journal of Labor Economics, 10,
306-329. doi: 10.2307/2535091
Singer, J. D., & Willett, J. B. (2003). Applied longitudinal data analysis: Modeling change
and event occurrence. New York, NY: Oxford University Press.
Skolnik, Y. (1987). Recruitment source effects: A socialization approach. Unpublished
doctoral dissertation. New York, NY: New York University.
Smith, S. S. (2005). "Don't put my name on it": Social capital activation and job-finding
assistance among the black urban poor. American Journal of Sociology, 111, 1-57.
doi: 10.1086/428814
Smith, S. S. (2007). Lone pursuit: Distrust and defensive individualism among the Black
poor. New York, NY: Russell Sage Foundation Publications.
Sribney, W. (2005). Why should I not do a likelihood-ratio test after an ML estimation (e.g.,
logit, probit) with clustering or pweights? Retrieved from
http://www.stata.com/support/faqs/statistics/likelihood-ratio-test/
Staw, B. M. (1980). The consequences of turnover. Journal of Occupational Behavior, 1,
253-273.
Steers, R. M., & Mowday, R. T. (1981). Employee turnover and the post-decision
accommodation process. In L. L. Cummings & B. M. Staw (Eds.), Research in
organizational behavior (Vol. 3, pp. 235-281). Greenwich, CT: JAI.
Sternberg, R. J., Wagner, R. K., Williams, W. M., & Horvath, J. A. (1995). Testing common-
sense. American Psychologist, 50, 912-927. doi: 10.1037/0003-066X.50.11.912
Stigler, G. J. (1962). Information in the labor market. The Journal of Political Economy, 70,
95-105. doi: 10.2307/1829106
Sturman, M. C., & Trevor, C. O. (2001). The implications of linking the dynamic
performance and turnover literatures. Journal of Applied Psychology, 86, 684-696.
doi: 10.1037/0021-9010.86.4.684
Sturman, M. C., Trevor, C. O., Boudreau, J. W., & Gerhart, B. (2003). Is it worth it to win the
talent war? Evaluating the utility of performance pay. Personnel Psychology, 56, 997-
1035. doi: 10.1111/j.1744-6570.2003.tb00248.x
Sutton, R. I., & Louis, M. R. (1987). How selecting and socializing newcomers influences
insiders. Human Resource Management, 26, 347-361. doi: 10.1002/hrm.3930260304
Tajfel, H., and Turner, J. (1986). The social identity theory of intergroup behavior. In S.
Worchel & W. Austin (Eds.), Psychology of intergroup relations. Chicago, IL:
Nelson-Hall.
This article is protected by copyright. All rights reserved. 46
Taylor, M. S., & Collins, C. J. (2000). Organizational recruitment: Enhancing the intersection
of research and practice. In C. L. Cooper & E. A. Locke (Eds.), Industrial and
organizational psychology: Linking theory with practice. Oxford, UK: Blackwell
Publishers.
Trevor, C. O. (2001). Interactions among actual ease-of-movement determinants and job
satisfaction in the prediction of voluntary turnover. Academy of Management Journal,
44, 621-638. doi: 10.2307/3069407
Trevor, C. O., Gerhart, B., & Boudreau, J. W. (1997). Voluntary turnover and job
performance: Curvilinearity and the moderating influences of salary growth and
promotions. Journal of Applied Psychology, 82, 44-61. doi: 10.1037/0021-
9010.82.1.44
Ullman, J. C. (1966). Employee referrals: Prime tool for recruiting workers. Personnel, 43,
30-35.
Van Hoye, G. V. (2013). Recruiting through employee referrals: An examination of
employees’ motives. Human Performance, 26, 451-464. doi:
10.1080/08959285.2013.836199
Van Hoye, G. V., van Hooft, E. A. J., & Lievens, F. (2009). Networking as a job search
behavior: A social network perspective. Journal of Occupational and Organizational
Psychology, 82, 661-682. doi: 10.1348/096317908X360675
Wagner, R. K., & Sternberg, R. J. (1985). Practical intelligence in real-world pursuits: The
role of tacit knowledge. Journal of Personality and Social Psychology, 49, 436-458.
doi: 10.1037/0022-3514.49.2.436
Weller, I., Holtom, B. C., Matiaske, W., & Mellewigt, T. (2009). Level and time effects of
recruitment sources on early voluntary turnover. Journal of Applied Psychology, 94,
1146-1162. doi: 10.1037/a0015924
Williams, C. R., & Livingstone, L. P. (1994). Another look at the relationship between
performance and voluntary turnover. Academy of Management Journal, 37, 269-298.
doi: 10.2307/256830
Wooldridge, J. M. (2002). Econometric analysis of cross section and panel data. Cambridge,
MA: MIT Press.
Yakubovich, V., & Lup, D. (2006). Stages of the recruitment process and the referrer’s
performance effect. Organization Science, 17, 710-723. doi: 10.1287/orsc.1060.0214
Zottoli, M. A., & Wanous, J. P. (2000). Recruitment source research: Current status and
future directions. Human Resource Management Review, 10, 353-382. doi: 10.1016/S1053-
4822(00)00032-2
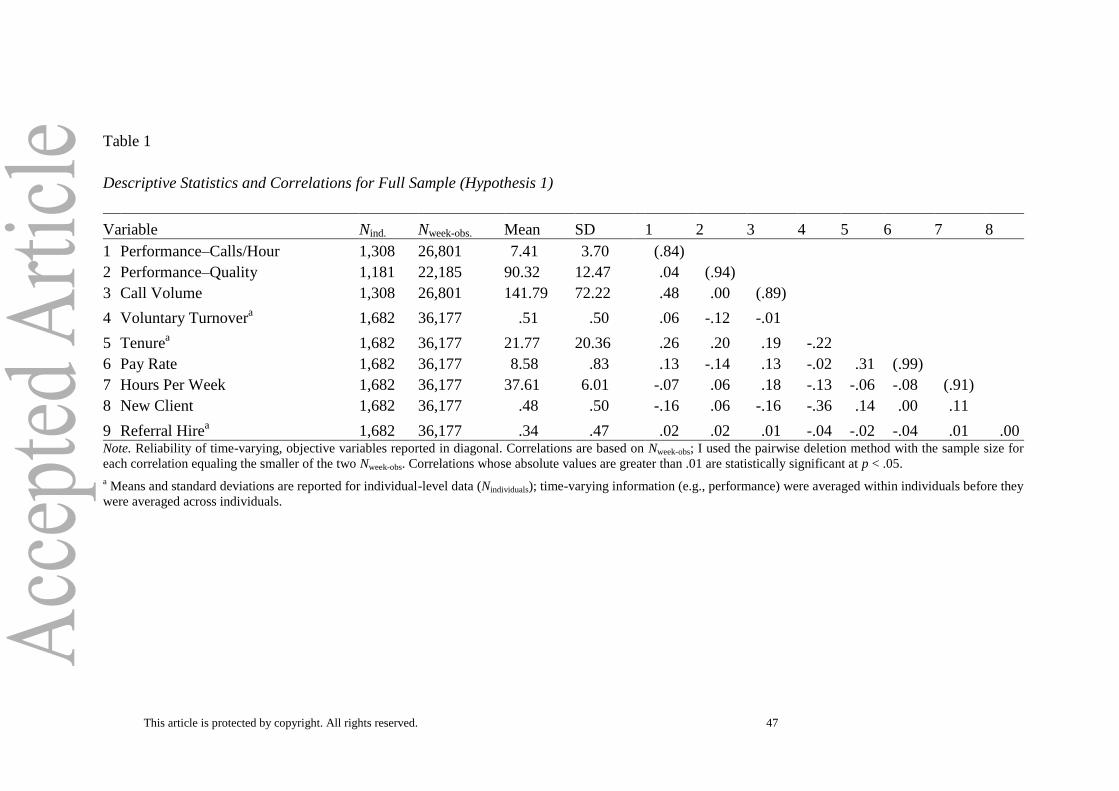
This article is protected by copyright. All rights reserved. 47
Table 1
Descriptive Statistics and Correlations for Full Sample (Hypothesis 1)
Variable Nind. Nweek-obs. Mean SD 1 2 3 4 5 6 7 8
1 Performance–Calls/Hour 1,308 26,801 7.41 3.70
(.84)
2 Performance–Quality 1,181 22,185 90.32 12.47
.04 (.94)
3 Call Volume 1,308 26,801 141.79 72.22
.48 .00 (.89)
4 Voluntary Turnovera 1,682 36,177 .51 .50
.06 -.12 -.01
5 Tenurea 1,682 36,177 21.77 20.36
.26 .20 .19 -.22
6 Pay Rate 1,682 36,177 8.58 .83
.13 -.14 .13 -.02 .31 (.99)
7 Hours Per Week 1,682 36,177 37.61 6.01
-.07 .06 .18 -.13 -.06 -.08 (.91)
8 New Client 1,682 36,177 .48 .50
-.16 .06 -.16 -.36 .14 .00 .11
9 Referral Hirea 1,682 36,177 .34 .47 .02 .02 .01 -.04 -.02 -.04 .01 .00
Note. Reliability of time-varying, objective variables reported in diagonal. Correlations are based on Nweek-obs; I used the pairwise deletion method with the sample size for
each correlation equaling the smaller of the two Nweek-obs. Correlations whose absolute values are greater than .01 are statistically significant at p < .05.
a Means and standard deviations are reported for individual-level data (Nindividuals); time-varying information (e.g., performance) were averaged within individuals before they
were averaged across individuals.
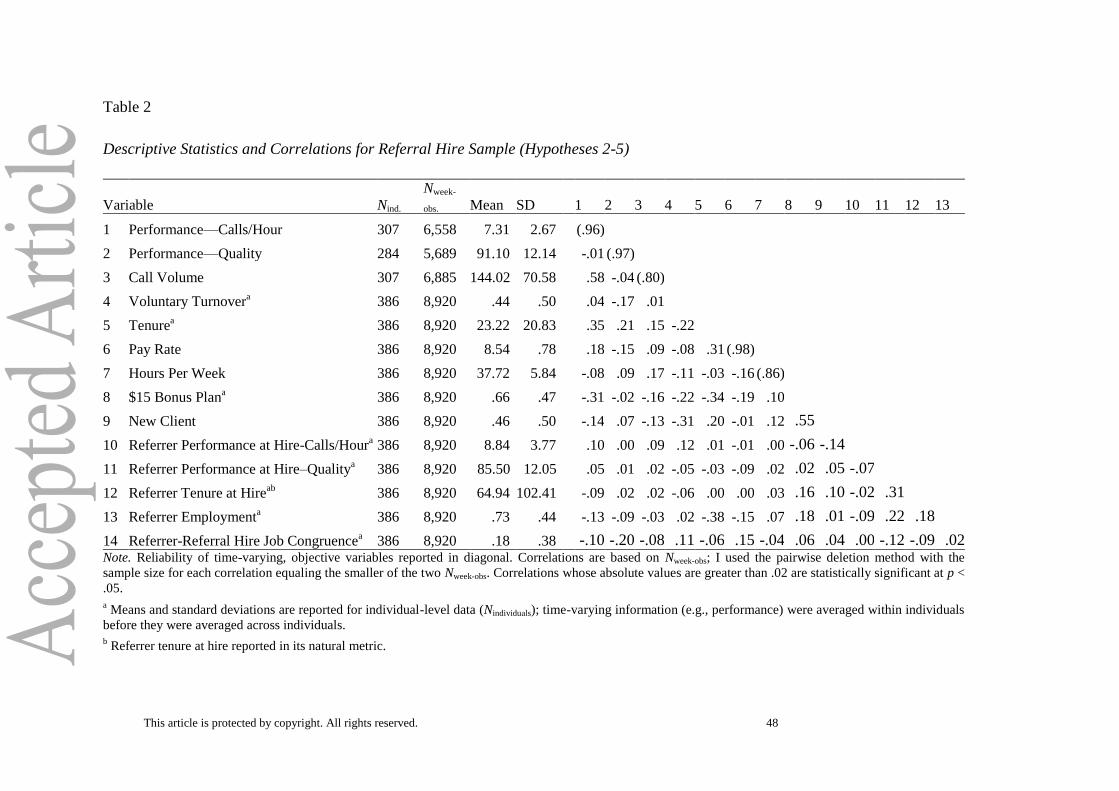
This article is protected by copyright. All rights reserved. 48
Table 2
Descriptive Statistics and Correlations for Referral Hire Sample (Hypotheses 2-5)
Variable Nind.
Nweek-
obs. Mean SD 1 2 3 4 5 6 7 8 9 10 11 12 13
1 Performance—Calls/Hour 307 6,558 7.31 2.67
(.96)
2 Performance—Quality 284 5,689 91.10 12.14
-.01 (.97)
3 Call Volume 307 6,885 144.02 70.58
.58 -.04 (.80)
4 Voluntary Turnover
a 386 8,920 .44 .50
.04 -.17 .01
5 Tenure
a 386 8,920 23.22 20.83
.35 .21 .15 -.22
6 Pay Rate 386 8,920 8.54 .78
.18 -.15 .09 -.08 .31 (.98)
7 Hours Per Week 386 8,920 37.72 5.84
-.08 .09 .17 -.11 -.03 -.16 (.86)
8 $15 Bonus Plan
a 386 8,920 .66 .47
-.31 -.02 -.16 -.22 -.34 -.19 .10
9 New Client 386 8,920 .46 .50
-.14 .07 -.13 -.31 .20 -.01 .12 .55
10 Referrer Performance at Hire-Calls/Houra 386 8,920 8.84 3.77
.10 .00 .09 .12 .01 -.01 .00 -.06 -.14
11 Referrer Performance at Hire–Qualitya 386 8,920 85.50 12.05
.05 .01 .02 -.05 -.03 -.09 .02 .02 .05 -.07
12 Referrer Tenure at Hireab
386 8,920 64.94 102.41
-.09 .02 .02 -.06 .00 .00 .03 .16 .10 -.02 .31
13 Referrer Employmenta 386 8,920 .73 .44
-.13 -.09 -.03 .02 -.38 -.15 .07 .18 .01 -.09 .22 .18
14 Referrer-Referral Hire Job Congruencea 386 8,920 .18 .38 -.10 -.20 -.08 .11 -.06 .15 -.04 .06 .04 .00 -.12 -.09 .02
Note. Reliability of time-varying, objective variables reported in diagonal. Correlations are based on Nweek-obs; I used the pairwise deletion method with the
sample size for each correlation equaling the smaller of the two Nweek-obs. Correlations whose absolute values are greater than .02 are statistically significant at p <
.05.
a Means and standard deviations are reported for individual-level data (Nindividuals); time-varying information (e.g., performance) were averaged within individuals
before they were averaged across individuals. b Referrer tenure at hire reported in its natural metric.
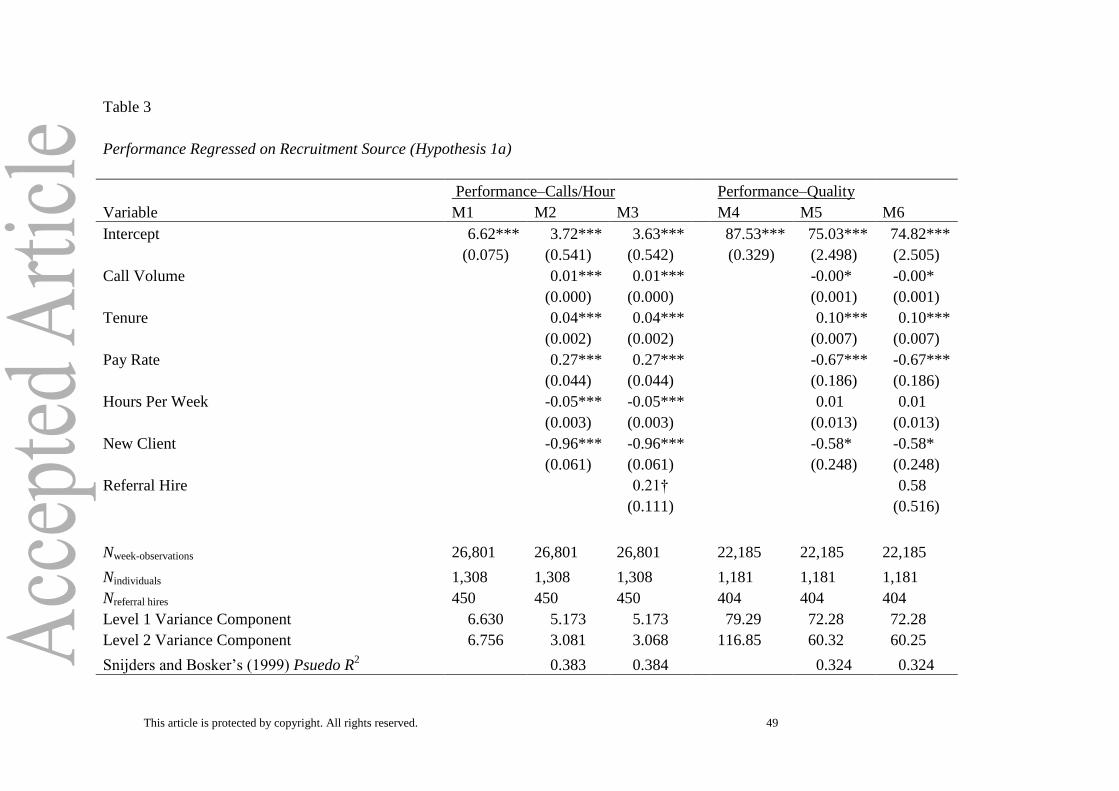
This article is protected by copyright. All rights reserved. 49
Table 3
Performance Regressed on Recruitment Source (Hypothesis 1a)
Performance–Calls/Hour Performance–Quality
Variable M1 M2 M3 M4 M5 M6
Intercept 6.62*** 3.72*** 3.63***
87.53*** 75.03*** 74.82***
(0.075) (0.541) (0.542)
(0.329) (2.498) (2.505)
Call Volume
0.01*** 0.01***
-0.00* -0.00*
(0.000) (0.000)
(0.001) (0.001)
Tenure
0.04*** 0.04***
0.10*** 0.10***
(0.002) (0.002)
(0.007) (0.007)
Pay Rate
0.27*** 0.27***
-0.67*** -0.67***
(0.044) (0.044)
(0.186) (0.186)
Hours Per Week
-0.05*** -0.05***
0.01 0.01
(0.003) (0.003)
(0.013) (0.013)
New Client
-0.96*** -0.96***
-0.58* -0.58*
(0.061) (0.061)
(0.248) (0.248)
Referral Hire
0.21†
0.58
(0.111)
(0.516)
Nweek-observations 26,801 26,801 26,801
22,185 22,185 22,185
Nindividuals 1,308 1,308 1,308
1,181 1,181 1,181
Nreferral hires 450 450 450 404 404 404
Level 1 Variance Component 6.630 5.173 5.173
79.29 72.28 72.28
Level 2 Variance Component 6.756 3.081 3.068
116.85 60.32 60.25
Snijders and Bosker’s (1999) Psuedo R2
0.383 0.384
0.324 0.324
This article is protected by copyright. All rights reserved. 50
Note. Analyses use maximum likelihood random effects estimation. Standard errors in parentheses. Models control for Team.
*p < .05; **p < .01; ***p < .001. 2-tailed tests reported.
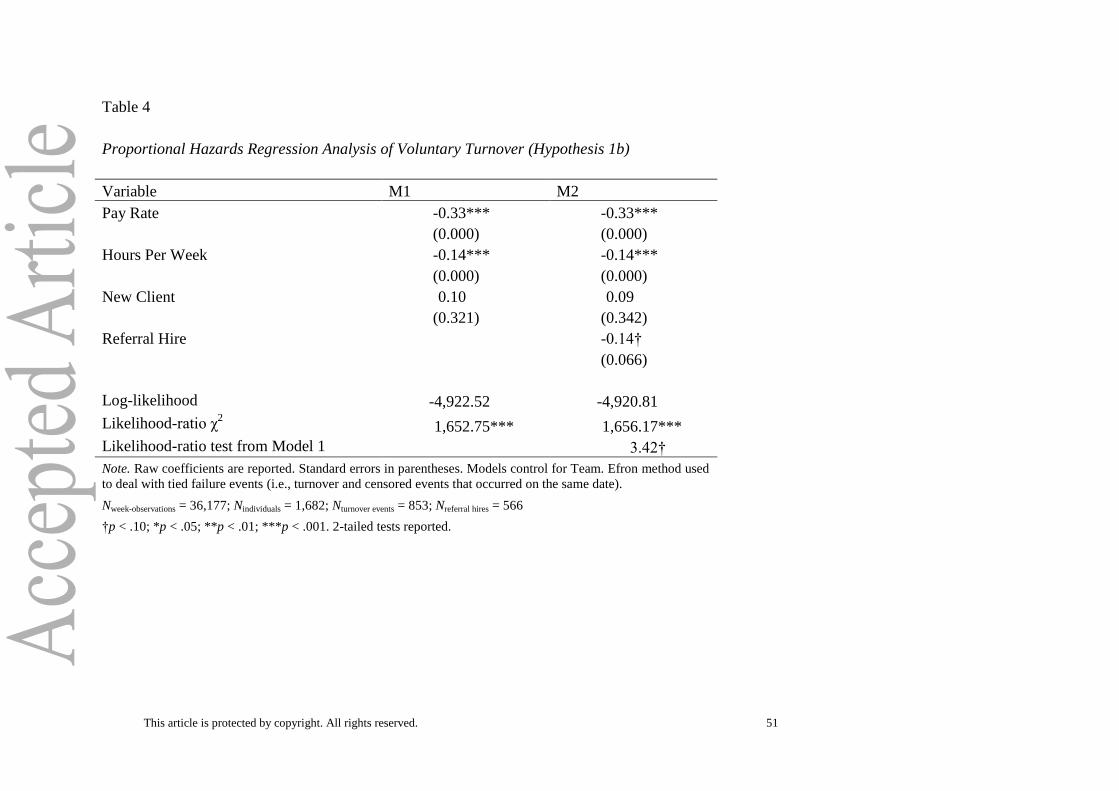
This article is protected by copyright. All rights reserved. 51
Table 4
Proportional Hazards Regression Analysis of Voluntary Turnover (Hypothesis 1b)
Variable M1 M2
Pay Rate -0.33*** -0.33***
(0.000) (0.000)
Hours Per Week -0.14*** -0.14***
(0.000) (0.000)
New Client 0.10 0.09
(0.321) (0.342)
Referral Hire
-0.14†
(0.066)
Log-likelihood -4,922.52 -4,920.81
Likelihood-ratio χ2 1,652.75*** 1,656.17***
Likelihood-ratio test from Model 1
3.42†
Note. Raw coefficients are reported. Standard errors in parentheses. Models control for Team. Efron method used
to deal with tied failure events (i.e., turnover and censored events that occurred on the same date).
Nweek-observations = 36,177; Nindividuals = 1,682; Nturnover events = 853; Nreferral hires = 566
†p < .10; *p < .05; **p < .01; ***p < .001. 2-tailed tests reported.
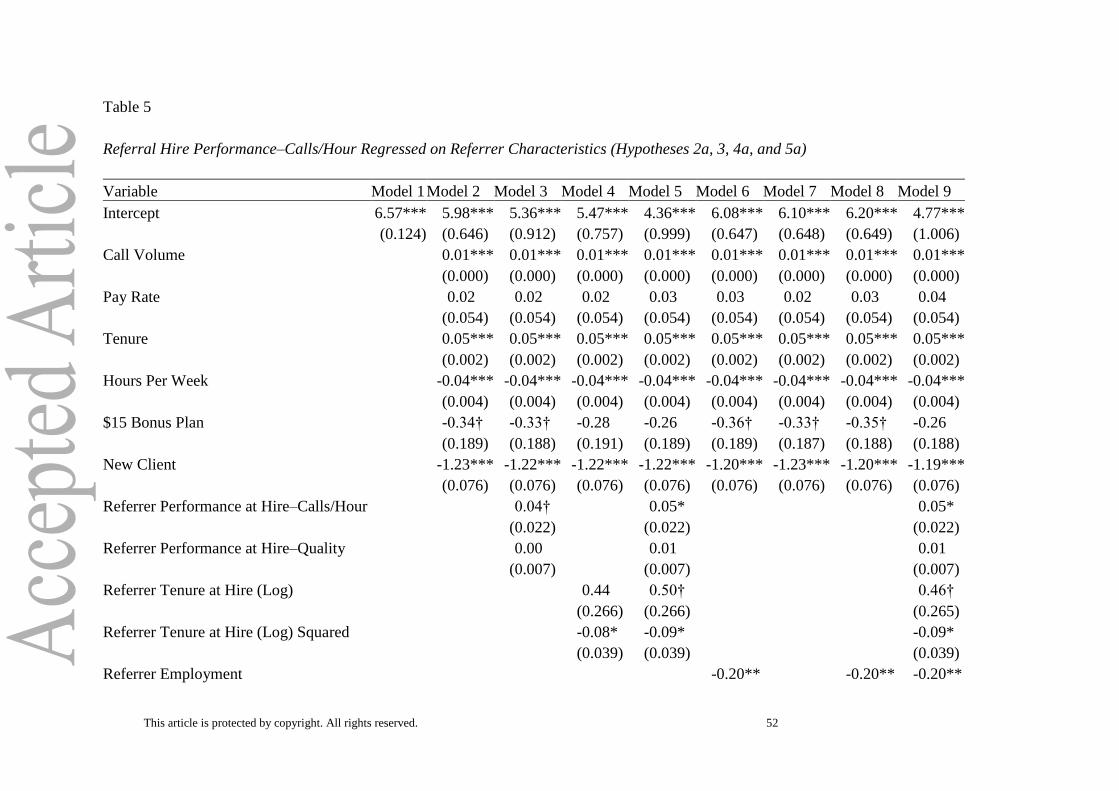
This article is protected by copyright. All rights reserved. 52
Table 5
Referral Hire Performance–Calls/Hour Regressed on Referrer Characteristics (Hypotheses 2a, 3, 4a, and 5a)
Variable Model 1 Model 2 Model 3 Model 4 Model 5 Model 6 Model 7 Model 8 Model 9
Intercept 6.57*** 5.98*** 5.36*** 5.47*** 4.36*** 6.08*** 6.10*** 6.20*** 4.77***
(0.124) (0.646) (0.912) (0.757) (0.999) (0.647) (0.648) (0.649) (1.006)
Call Volume
0.01*** 0.01*** 0.01*** 0.01*** 0.01*** 0.01*** 0.01*** 0.01***
(0.000) (0.000) (0.000) (0.000) (0.000) (0.000) (0.000) (0.000)
Pay Rate
0.02 0.02 0.02 0.03 0.03 0.02 0.03 0.04
(0.054) (0.054) (0.054) (0.054) (0.054) (0.054) (0.054) (0.054)
Tenure
0.05*** 0.05*** 0.05*** 0.05*** 0.05*** 0.05*** 0.05*** 0.05***
(0.002) (0.002) (0.002) (0.002) (0.002) (0.002) (0.002) (0.002)
Hours Per Week
-0.04*** -0.04*** -0.04*** -0.04*** -0.04*** -0.04*** -0.04*** -0.04***
(0.004) (0.004) (0.004) (0.004) (0.004) (0.004) (0.004) (0.004)
$15 Bonus Plan
-0.34† -0.33† -0.28 -0.26 -0.36† -0.33† -0.35† -0.26
(0.189) (0.188) (0.191) (0.189) (0.189) (0.187) (0.188) (0.188)
New Client
-1.23*** -1.22*** -1.22*** -1.22*** -1.20*** -1.23*** -1.20*** -1.19***
(0.076) (0.076) (0.076) (0.076) (0.076) (0.076) (0.076) (0.076)
Referrer Performance at Hire–Calls/Hour
0.04†
0.05*
0.05*
(0.022)
(0.022)
(0.022)
Referrer Performance at Hire–Quality
0.00
0.01
0.01
(0.007)
(0.007)
(0.007)
Referrer Tenure at Hire (Log)
0.44 0.50†
0.46†
(0.266) (0.266)
(0.265)
Referrer Tenure at Hire (Log) Squared
-0.08* -0.09*
-0.09*
(0.039) (0.039)
(0.039)
Referrer Employment
-0.20**
-0.20** -0.20**
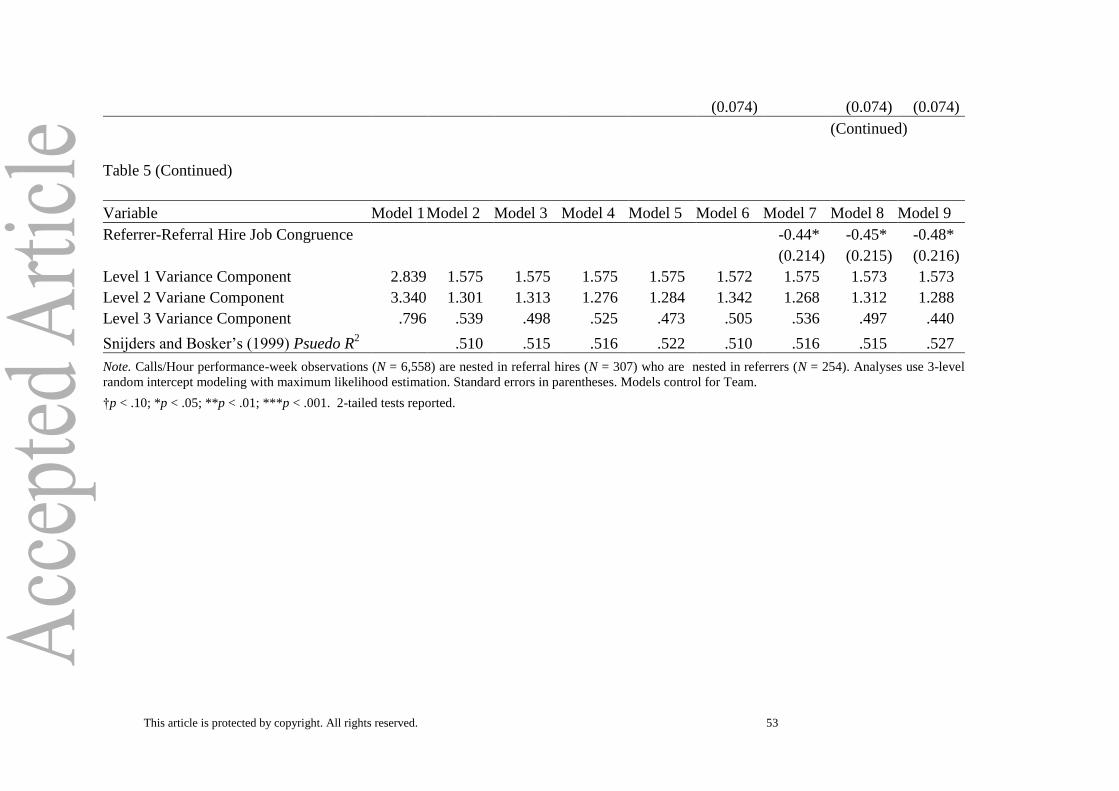
This article is protected by copyright. All rights reserved. 53
(0.074)
(0.074) (0.074)
(Continued)
Table 5 (Continued)
Variable Model 1 Model 2 Model 3 Model 4 Model 5 Model 6 Model 7 Model 8 Model 9
Referrer-Referral Hire Job Congruence
-0.44* -0.45* -0.48*
(0.214) (0.215) (0.216)
Level 1 Variance Component 2.839 1.575 1.575 1.575 1.575 1.572 1.575 1.573 1.573
Level 2 Variane Component 3.340 1.301 1.313 1.276 1.284 1.342 1.268 1.312 1.288
Level 3 Variance Component .796 .539 .498 .525 .473 .505 .536 .497 .440
Snijders and Bosker’s (1999) Psuedo R2 .510 .515 .516 .522 .510 .516 .515 .527
Note. Calls/Hour performance-week observations (N = 6,558) are nested in referral hires (N = 307) who are nested in referrers (N = 254). Analyses use 3-level
random intercept modeling with maximum likelihood estimation. Standard errors in parentheses. Models control for Team.
†p < .10; *p < .05; **p < .01; ***p < .001. 2-tailed tests reported.
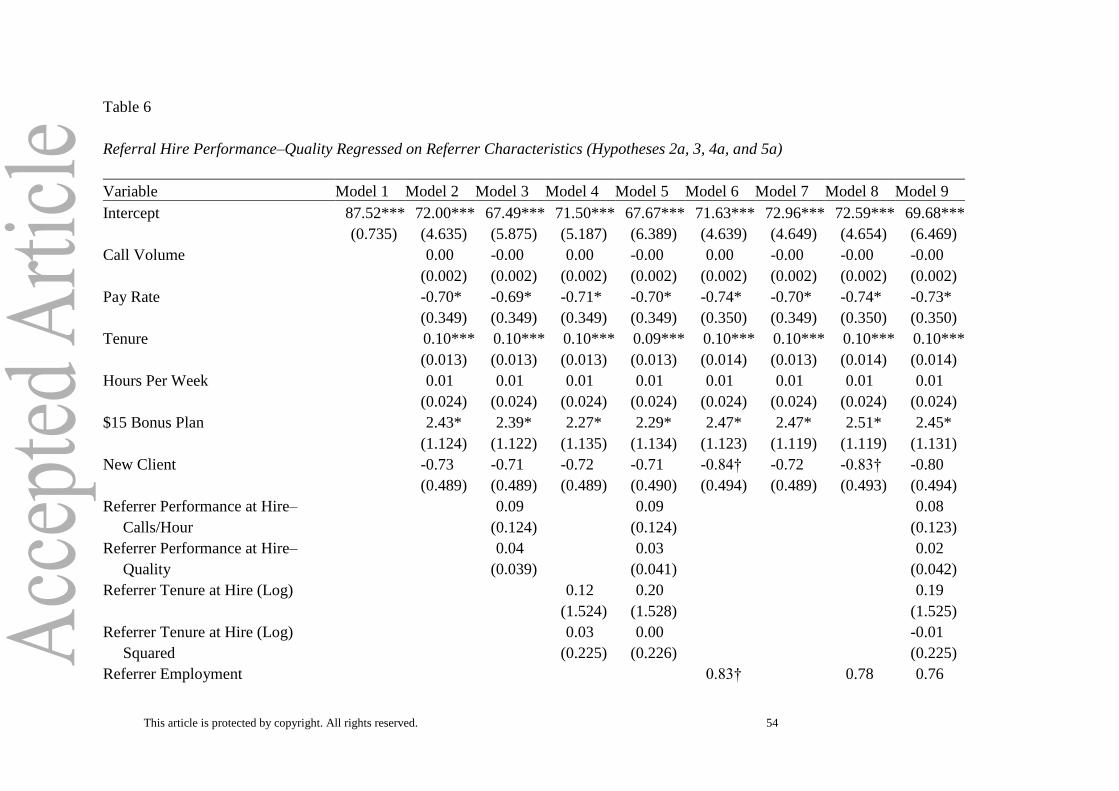
This article is protected by copyright. All rights reserved. 54
Table 6
Referral Hire Performance–Quality Regressed on Referrer Characteristics (Hypotheses 2a, 3, 4a, and 5a)
Variable Model 1 Model 2 Model 3 Model 4 Model 5 Model 6 Model 7 Model 8 Model 9
Intercept 87.52*** 72.00*** 67.49*** 71.50*** 67.67*** 71.63*** 72.96*** 72.59*** 69.68***
(0.735) (4.635) (5.875) (5.187) (6.389) (4.639) (4.649) (4.654) (6.469)
Call Volume
0.00 -0.00 0.00 -0.00 0.00 -0.00 -0.00 -0.00
(0.002) (0.002) (0.002) (0.002) (0.002) (0.002) (0.002) (0.002)
Pay Rate
-0.70* -0.69* -0.71* -0.70* -0.74* -0.70* -0.74* -0.73*
(0.349) (0.349) (0.349) (0.349) (0.350) (0.349) (0.350) (0.350)
Tenure
0.10*** 0.10*** 0.10*** 0.09*** 0.10*** 0.10*** 0.10*** 0.10***
(0.013) (0.013) (0.013) (0.013) (0.014) (0.013) (0.014) (0.014)
Hours Per Week
0.01 0.01 0.01 0.01 0.01 0.01 0.01 0.01
(0.024) (0.024) (0.024) (0.024) (0.024) (0.024) (0.024) (0.024)
$15 Bonus Plan
2.43* 2.39* 2.27* 2.29* 2.47* 2.47* 2.51* 2.45*
(1.124) (1.122) (1.135) (1.134) (1.123) (1.119) (1.119) (1.131)
New Client
-0.73 -0.71 -0.72 -0.71 -0.84† -0.72 -0.83† -0.80
(0.489) (0.489) (0.489) (0.490) (0.494) (0.489) (0.493) (0.494)
Referrer Performance at Hire–
0.09
0.09
0.08
Calls/Hour
(0.124)
(0.124)
(0.123)
Referrer Performance at Hire–
0.04
0.03
0.02
Quality
(0.039)
(0.041)
(0.042)
Referrer Tenure at Hire (Log)
0.12 0.20
0.19
(1.524) (1.528)
(1.525)
Referrer Tenure at Hire (Log)
0.03 0.00
-0.01
Squared
(0.225) (0.226)
(0.225)
Referrer Employment
0.83†
0.78 0.76
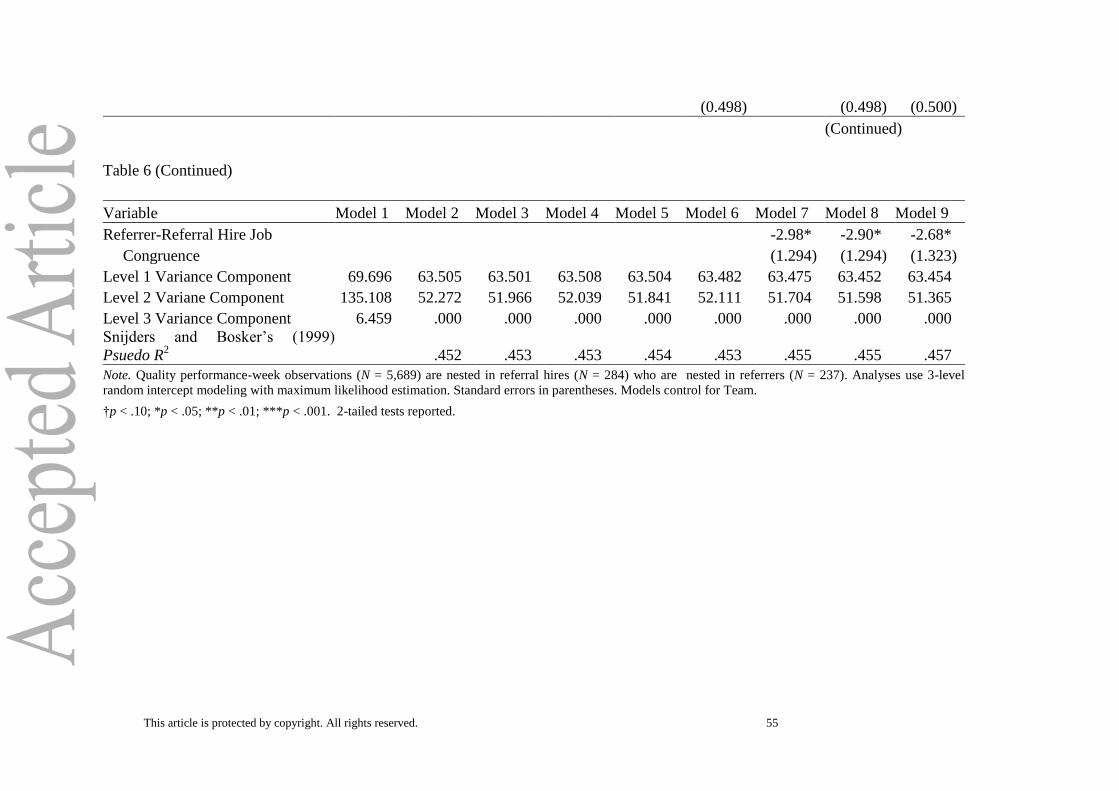
This article is protected by copyright. All rights reserved. 55
(0.498)
(0.498) (0.500)
(Continued)
Table 6 (Continued)
Variable Model 1 Model 2 Model 3 Model 4 Model 5 Model 6 Model 7 Model 8 Model 9
Referrer-Referral Hire Job
-2.98* -2.90* -2.68*
Congruence
(1.294) (1.294) (1.323)
Level 1 Variance Component 69.696 63.505 63.501 63.508 63.504 63.482 63.475 63.452 63.454
Level 2 Variane Component 135.108 52.272 51.966 52.039 51.841 52.111 51.704 51.598 51.365
Level 3 Variance Component 6.459 .000 .000 .000 .000 .000 .000 .000 .000
Snijders and Bosker’s (1999)
Psuedo R2 .452 .453 .453 .454 .453 .455 .455 .457
Note. Quality performance-week observations (N = 5,689) are nested in referral hires (N = 284) who are nested in referrers (N = 237). Analyses use 3-level
random intercept modeling with maximum likelihood estimation. Standard errors in parentheses. Models control for Team.
†p < .10; *p < .05; **p < .01; ***p < .001. 2-tailed tests reported.
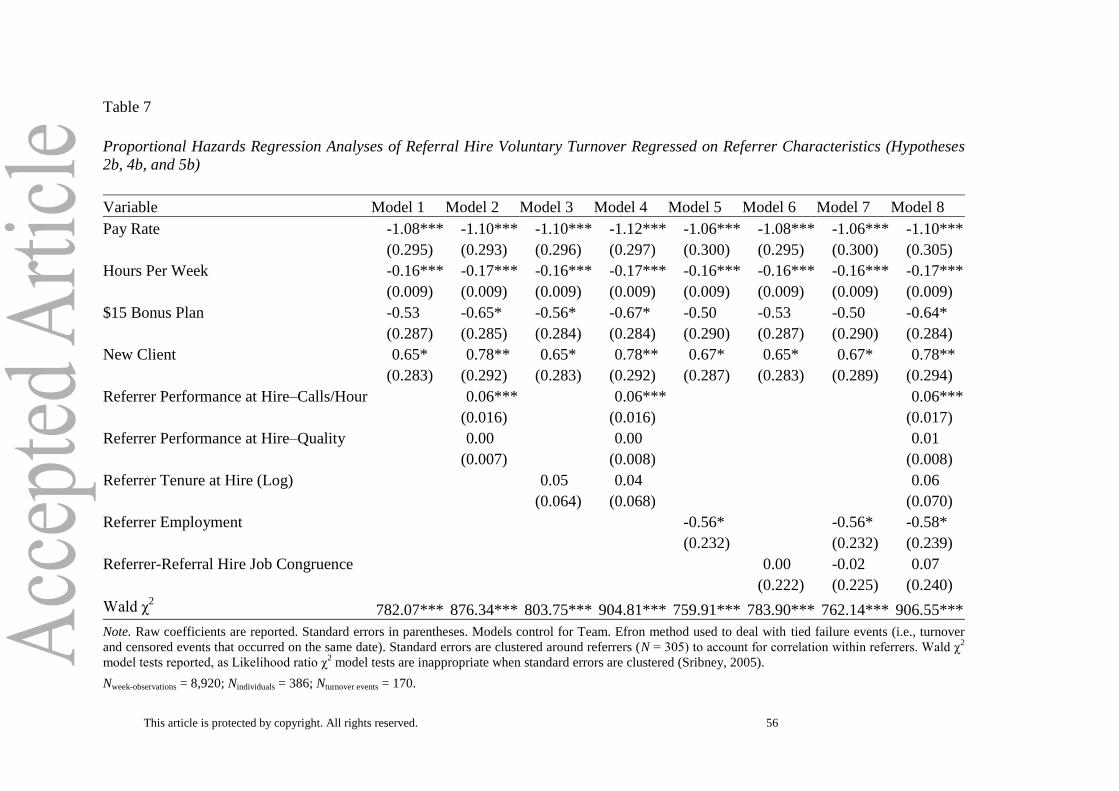
This article is protected by copyright. All rights reserved. 56
Table 7
Proportional Hazards Regression Analyses of Referral Hire Voluntary Turnover Regressed on Referrer Characteristics (Hypotheses
2b, 4b, and 5b)
Variable Model 1 Model 2 Model 3 Model 4 Model 5 Model 6 Model 7 Model 8
Pay Rate -1.08*** -1.10*** -1.10*** -1.12*** -1.06*** -1.08*** -1.06*** -1.10***
(0.295) (0.293) (0.296) (0.297) (0.300) (0.295) (0.300) (0.305)
Hours Per Week -0.16*** -0.17*** -0.16*** -0.17*** -0.16*** -0.16*** -0.16*** -0.17***
(0.009) (0.009) (0.009) (0.009) (0.009) (0.009) (0.009) (0.009)
$15 Bonus Plan -0.53 -0.65* -0.56* -0.67* -0.50 -0.53 -0.50 -0.64*
(0.287) (0.285) (0.284) (0.284) (0.290) (0.287) (0.290) (0.284)
New Client 0.65* 0.78** 0.65* 0.78** 0.67* 0.65* 0.67* 0.78**
(0.283) (0.292) (0.283) (0.292) (0.287) (0.283) (0.289) (0.294)
Referrer Performance at Hire–Calls/Hour
0.06***
0.06***
0.06***
(0.016)
(0.016)
(0.017)
Referrer Performance at Hire–Quality
0.00
0.00
0.01
(0.007)
(0.008)
(0.008)
Referrer Tenure at Hire (Log)
0.05 0.04
0.06
(0.064) (0.068)
(0.070)
Referrer Employment
-0.56*
-0.56* -0.58*
(0.232)
(0.232) (0.239)
Referrer-Referral Hire Job Congruence
0.00 -0.02 0.07
(0.222) (0.225) (0.240)
Wald χ2 782.07*** 876.34*** 803.75*** 904.81*** 759.91*** 783.90*** 762.14*** 906.55***
Note. Raw coefficients are reported. Standard errors in parentheses. Models control for Team. Efron method used to deal with tied failure events (i.e., turnover
and censored events that occurred on the same date). Standard errors are clustered around referrers (N = 305) to account for correlation within referrers. Wald χ2
model tests reported, as Likelihood ratio χ2 model tests are inappropriate when standard errors are clustered (Sribney, 2005).
Nweek-observations = 8,920; Nindividuals = 386; Nturnover events = 170.

This article is protected by copyright. All rights reserved. 57
†p < .10; *p < .05; **p < .01; ***p < .001. 2-tailed tests reported.

This article is protected by copyright. All rights reserved. 58
Table 8
Supplemental Analysis of Referral Hire Performance Regressed on Referrer Accessibility
Characteristics by Referral Bonus Plan Interaction
Performance–Calls/Houra
Performance–Qualityb
Variable Model 1 Model 2
Model 3 Model 4
Intercept 5.92*** 5.78***
72.63*** 69.46***
(0.647) (0.706)
(4.644) (4.958)
Call Volume 0.01*** 0.01***
0.00 -0.00
(0.000) (0.000)
(0.002) (0.002)
Tenure 0.05*** 0.05***
0.10*** 0.09***
(0.002) (0.002)
(0.014) (0.013)
Pay Rate 0.04 0.02
-0.72* -0.70*
(0.054) (0.054)
(0.350) (0.349)
Hours Per Week -0.04*** -0.04***
0.00 0.01
(0.004) (0.004)
(0.024) (0.024)
New Client -1.23*** -1.23***
-0.91 -0.70
(0.076) (0.075)
(0.495) (0.488)
Referrer Employed in $100 Bonus Plan --
--
Referrer Employed in $15 Bonus Plan -0.46*
2.13†
(0.191)
(1.140)
Referrer Termed in $15 Bonus Plan 0.11
2.44†
(0.211)
(1.291)
Referrer Termed in $100 Bonus Plan -0.03
-1.53*
(0.093)
(0.621)
Job Congruence in $100 Bonus Plan
--
--
Job Congruence in $15 Bonus Plan
-0.51
3.52
(0.403)
(2.444)
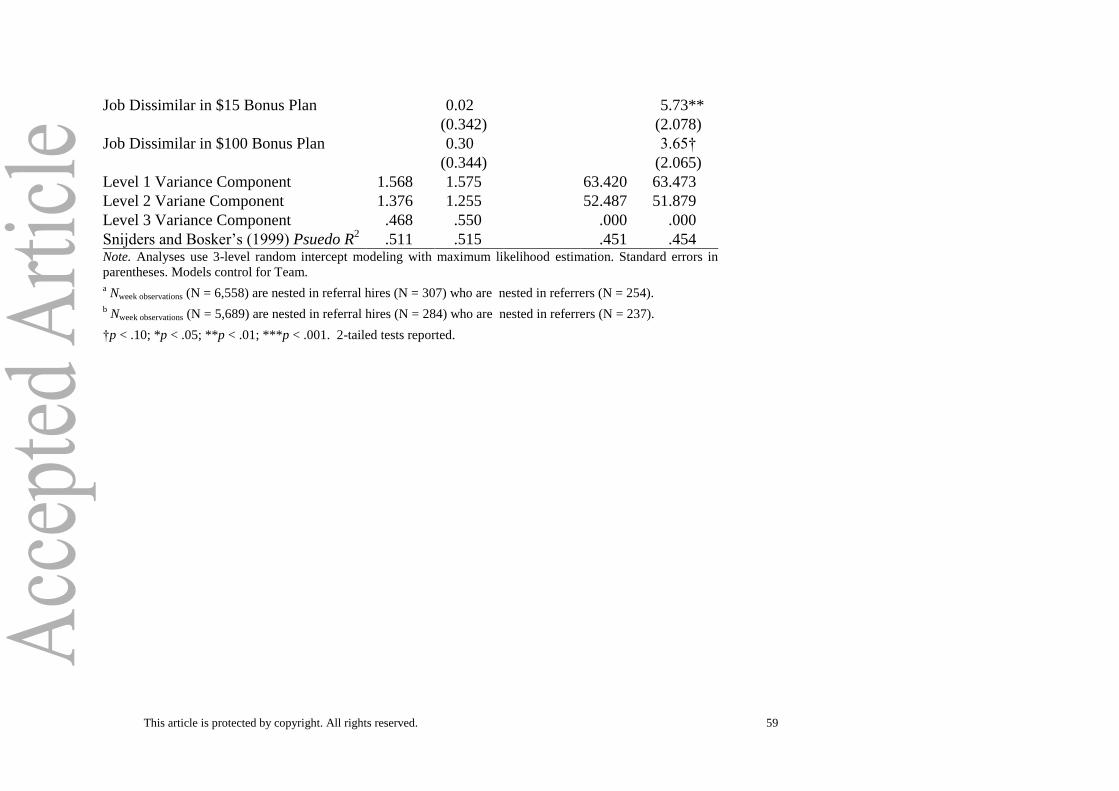
This article is protected by copyright. All rights reserved. 59
Job Dissimilar in $15 Bonus Plan
0.02
5.73**
(0.342)
(2.078)
Job Dissimilar in $100 Bonus Plan
0.30
3.65†
(0.344)
(2.065)
Level 1 Variance Component 1.568 1.575
63.420 63.473
Level 2 Variane Component 1.376 1.255
52.487 51.879
Level 3 Variance Component .468 .550
.000 .000
Snijders and Bosker’s (1999) Psuedo R2 .511 .515 .451 .454
Note. Analyses use 3-level random intercept modeling with maximum likelihood estimation. Standard errors in
parentheses. Models control for Team. a Nweek observations (N = 6,558) are nested in referral hires (N = 307) who are nested in referrers (N = 254).
b Nweek observations (N = 5,689) are nested in referral hires (N = 284) who are nested in referrers (N = 237).
†p < .10; *p < .05; **p < .01; ***p < .001. 2-tailed tests reported.
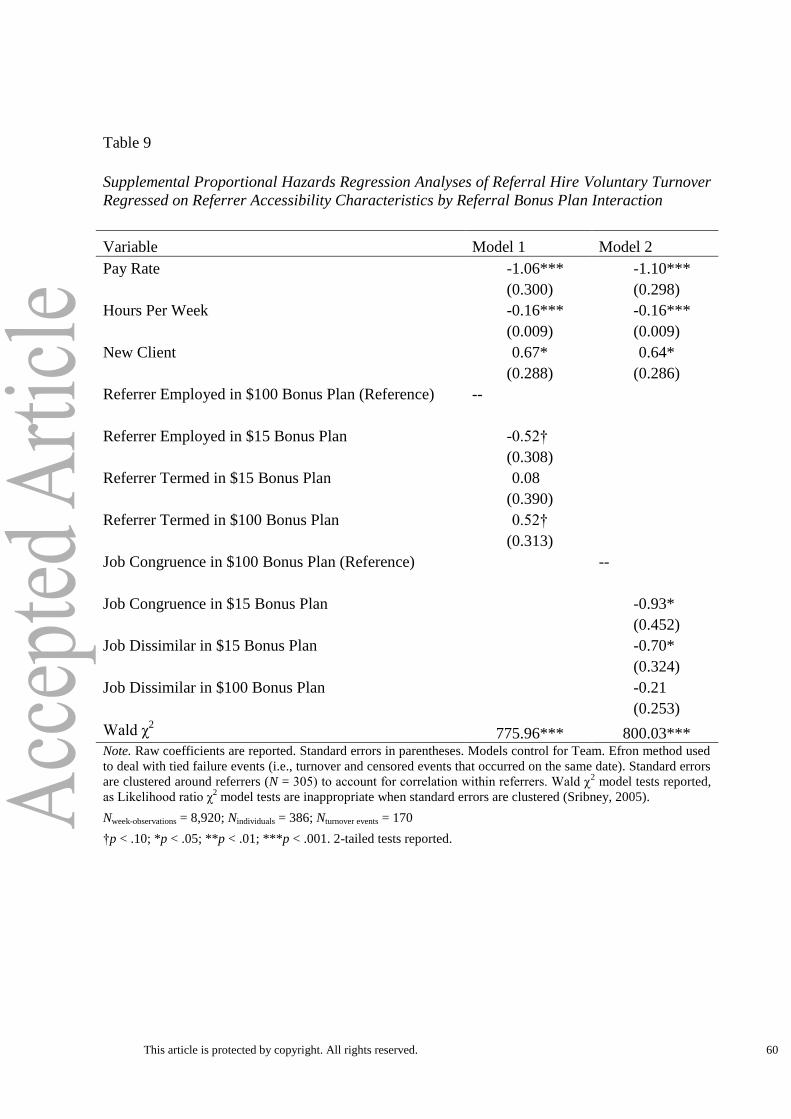
This article is protected by copyright. All rights reserved. 60
Table 9
Supplemental Proportional Hazards Regression Analyses of Referral Hire Voluntary Turnover
Regressed on Referrer Accessibility Characteristics by Referral Bonus Plan Interaction
Variable Model 1 Model 2
Pay Rate -1.06*** -1.10***
(0.300) (0.298)
Hours Per Week -0.16*** -0.16***
(0.009) (0.009)
New Client 0.67* 0.64*
(0.288) (0.286)
Referrer Employed in $100 Bonus Plan (Reference) --
Referrer Employed in $15 Bonus Plan -0.52†
(0.308)
Referrer Termed in $15 Bonus Plan 0.08
(0.390)
Referrer Termed in $100 Bonus Plan 0.52†
(0.313)
Job Congruence in $100 Bonus Plan (Reference)
--
Job Congruence in $15 Bonus Plan
-0.93*
(0.452)
Job Dissimilar in $15 Bonus Plan
-0.70*
(0.324)
Job Dissimilar in $100 Bonus Plan
-0.21
(0.253)
Wald χ2 775.96*** 800.03***
Note. Raw coefficients are reported. Standard errors in parentheses. Models control for Team. Efron method used
to deal with tied failure events (i.e., turnover and censored events that occurred on the same date). Standard errors
are clustered around referrers (N = 305) to account for correlation within referrers. Wald χ2 model tests reported,
as Likelihood ratio χ2 model tests are inappropriate when standard errors are clustered (Sribney, 2005).
Nweek-observations = 8,920; Nindividuals = 386; Nturnover events = 170
†p < .10; *p < .05; **p < .01; ***p < .001. 2-tailed tests reported.
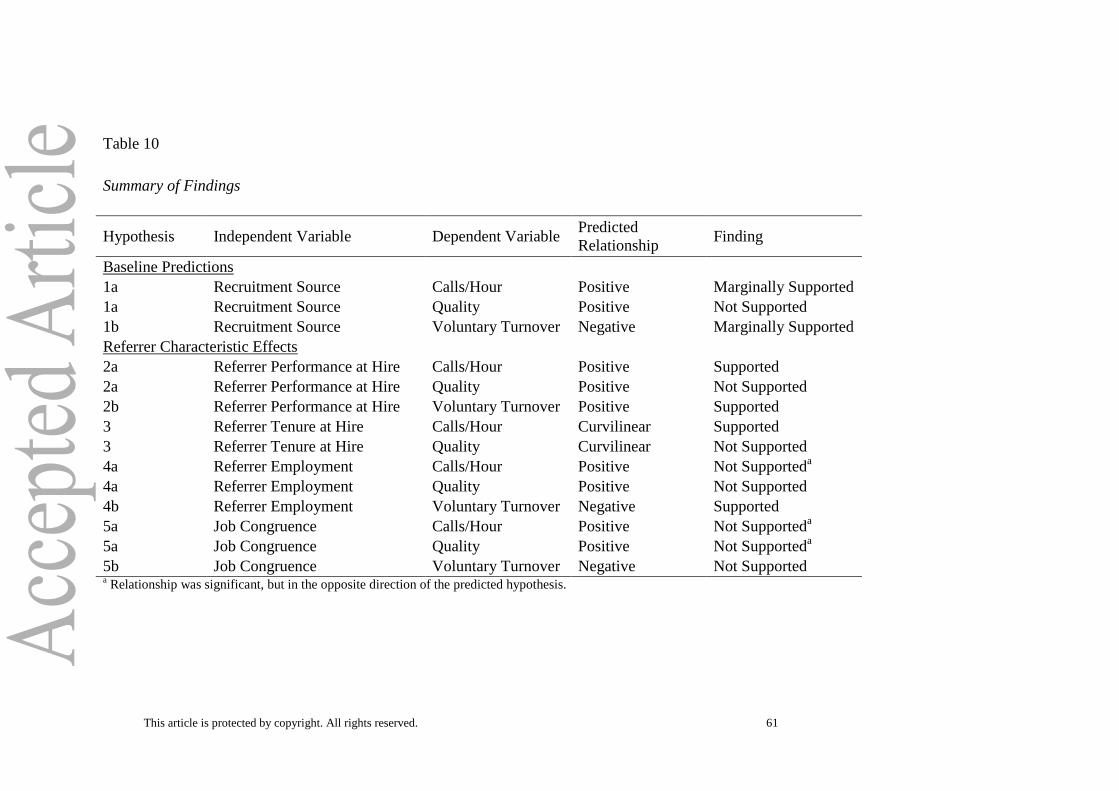
This article is protected by copyright. All rights reserved. 61
Table 10
Summary of Findings
Hypothesis Independent Variable Dependent Variable
Predicted
Relationship Finding
Baseline Predictions
1a Recruitment Source Calls/Hour Positive Marginally Supported
1a Recruitment Source Quality Positive Not Supported
1b Recruitment Source Voluntary Turnover Negative Marginally Supported
Referrer Characteristic Effects
2a Referrer Performance at Hire Calls/Hour Positive Supported
2a Referrer Performance at Hire Quality Positive Not Supported
2b Referrer Performance at Hire Voluntary Turnover Positive Supported
3 Referrer Tenure at Hire Calls/Hour Curvilinear Supported
3 Referrer Tenure at Hire Quality Curvilinear Not Supported
4a Referrer Employment Calls/Hour Positive Not Supporteda
4a Referrer Employment Quality Positive Not Supported
4b Referrer Employment Voluntary Turnover Negative Supported
5a Job Congruence Calls/Hour Positive Not Supporteda
5a Job Congruence Quality Positive Not Supporteda
5b Job Congruence Voluntary Turnover Negative Not Supported a Relationship was significant, but in the opposite direction of the predicted hypothesis.
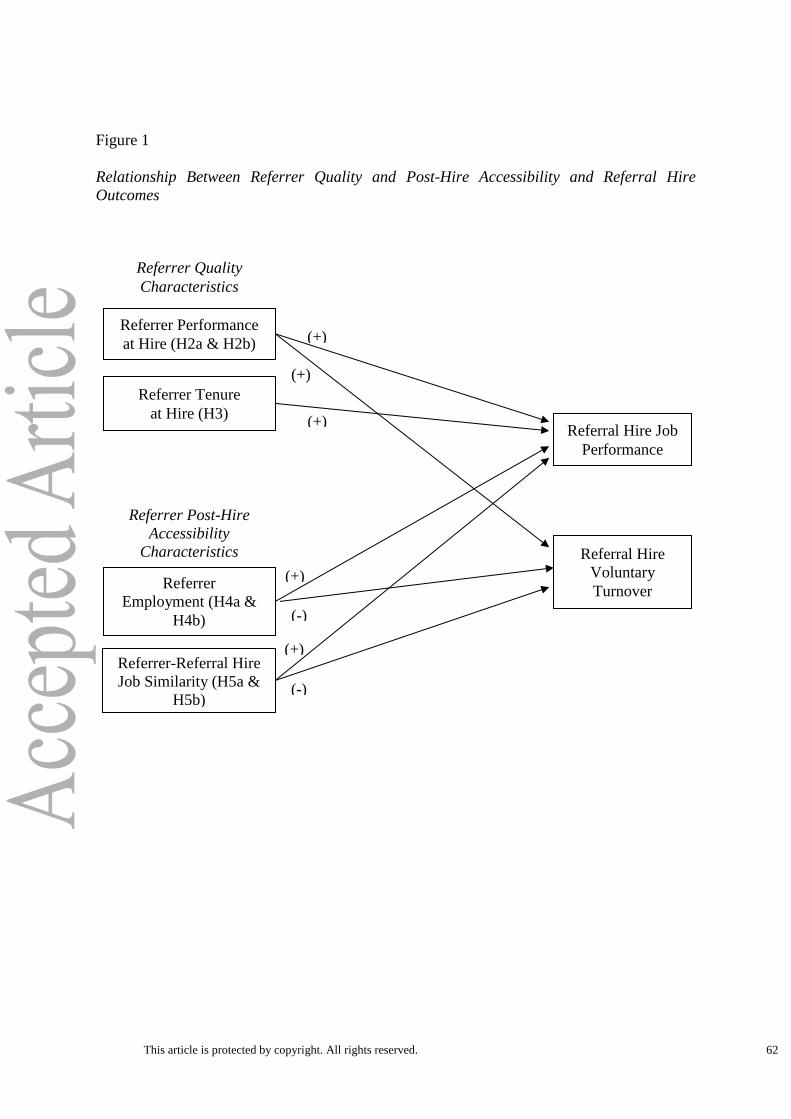
This article is protected by copyright. All rights reserved. 62
Figure 1
Relationship Between Referrer Quality and Post-Hire Accessibility and Referral Hire
Outcomes
(+)
(+)
Referrer Post-Hire
Accessibility
Characteristics
Referral Hire Job
Performance
Referral Hire
Voluntary
Turnover
Referrer Quality
Characteristics
Referrer
Employment (H4a &
H4b)
Referrer Tenure
at Hire (H3)
Referrer Performance
at Hire (H2a & H2b)
Referrer-Referral Hire
Job Similarity (H5a &
H5b)
(+)
(+)
(+)
(-)
(-)
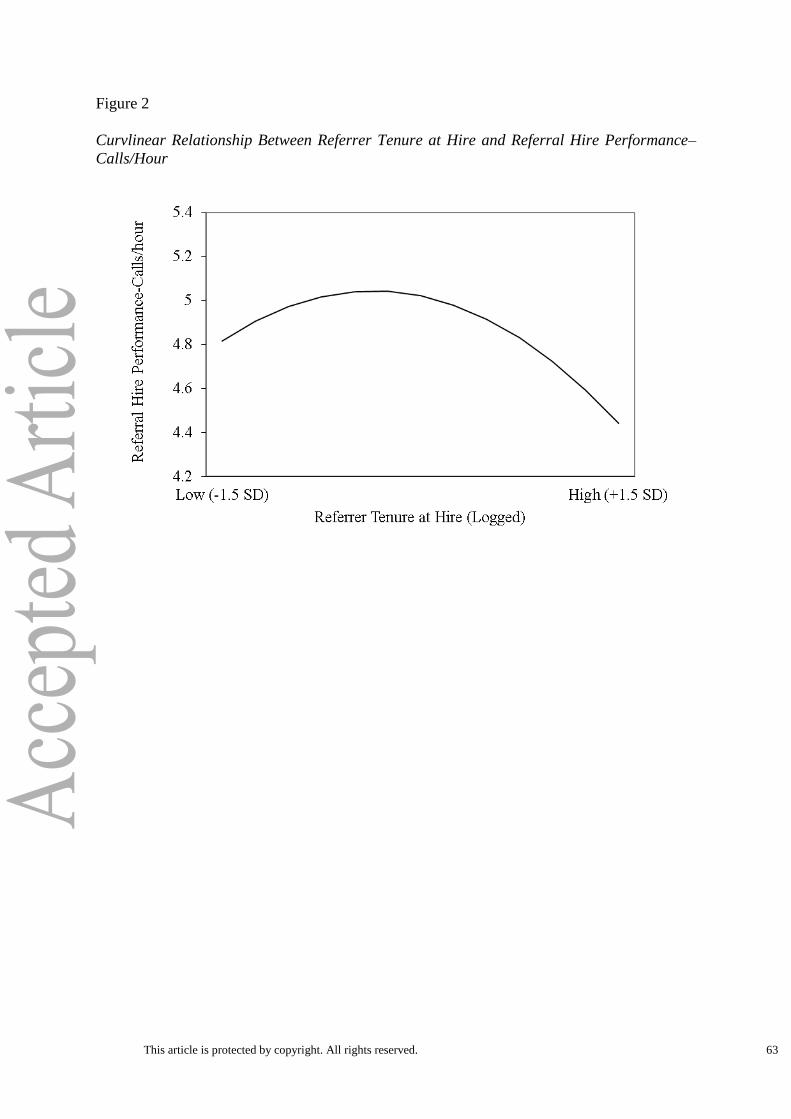
This article is protected by copyright. All rights reserved. 63
Figure 2
Curvlinear Relationship Between Referrer Tenure at Hire and Referral Hire Performance–
Calls/Hour
Related Documents