UNCOVERING CANDIDATE NOVEL PLURIPOTENCY AND CROSS-SPECIES COMPLEMENTATION GENES BY COMPARATIVE TRANSCRIPTOMICS IN HUMAN AND ZEBRAFISH CRYSTAL GOH WEI PIN UNIVERSITI SAINS MALAYSIA 2015

Welcome message from author
This document is posted to help you gain knowledge. Please leave a comment to let me know what you think about it! Share it to your friends and learn new things together.
Transcript

UNCOVERING CANDIDATE NOVEL
PLURIPOTENCY AND CROSS-SPECIES
COMPLEMENTATION GENES BY
COMPARATIVE TRANSCRIPTOMICS IN
HUMAN AND ZEBRAFISH
CRYSTAL GOH WEI PIN
UNIVERSITI SAINS MALAYSIA
2015

UNCOVERING CANDIDATE NOVEL
PLURIPOTENCY AND CROSS-SPECIES
COMPLEMENTATION GENES BY
COMPARATIVE TRANSCRIPTOMICS IN
HUMAN AND ZEBRAFISH
by
CRYSTAL GOH WEI PIN
Thesis submitted in fulfillment of the requirements
for the degree of
Doctor of Philosophy
February 2015

ii
ACKNOWLEDGEMENTS
First of all, I would like to thank my main supervisor, Prof. Alexander Chong
Shu Chien and my co-supervisor, Associate Prof. Chan Woon Khiong from National
University of Singapore (NUS), for their patience and dedication in guiding me
throughout the research project. I would like to express my deepest appreciation to
both supervisors for their comments, guidance and engagement in helping me to
accomplish this research.
I would also like to thank lab members of Molecular Genetics Laboratory in
NUS, especially Allan Tan Jee Hian, Millie Lam Kuen Kuen, Devika Anbazhagan,
Shruti Krishnan, Dr. Chak Li Ling and Dr. Shin Jihye for their friendship, assistants,
guidance and valuable experiences during my 3-year attachment in NUS. I would
also like to thank technical staffs in the aquarium facility of NUS, particularly Mr.
Subhas Balan for providing good quality of zebrafish embryos. I would also like to
thank past and present lab members in Universiti Sains Malaysia (USM), especially
Kuah Meng Kiat, Tan Sze Huey, Chung Hung Hui, Ann, Tan Boon Khai, Khor Beng
Siang, Cheng Jia Huey, Tay Shu Shen, Ho Sing Yee, Lee Youn Sing, Gan Jen Yang,
Lau Wai Kuan, Karthi, Adelina and Faiz for their full support and assistance in
aiding me to accomplish laboratory work. Special thanks to Malaysian Institute of
Pharmaceuticals and Nutraceuticals (IPharm), Universiti Sains Malaysia and NUS
for rendering good environment and facilities for students. Last but not least, I would
like to express my greatest gratitude to my family and friends for their love, support
and understandings. Lastly, a sincere thank to everyone in helping me to make this
thesis accomplished.

iii
TABLE OF CONTENTS
Acknowledgements ii
Table of contents iii
List of tables xii
List of figures xiv
List of symbol xvii
List of abbreviations xviii
List of publication xxii
Abstrak xxiii
Abstract xxv
CHAPTER 1: INTRODUCTION
1.1 Research background 1
1.2 Objectives of this study 3
CHAPTER 2: LITERATURE REVIEW
2.1 Pluripotency 4
2.1.1 Pluripotency in fish 6
2.1.2 Assessment of pluripotency 7
2.2 Sources of pluripotent cells 9
2.2.1 Embryonic stem (ES) cells 9
2.2.1.1 Fish ES-like cells 10
2.2.2 Embryonic carcinoma (EC) cells
11
iv
2.2.2.1 EC cells are malignant surrogates of ES
cells
13
2.2.2.2 Human ES cells, HES3 and human EC cells,
NCCIT, NT2D1 and GCT27C4
15
2.2.3 Induced pluripotent stem (iPS) cells 16
2.2.3.1 Approaches for making iPS cells 18
2.2.3.2 Genomic integrating methods 18
2.2.3.3 Non-genomic integrating methods 19
2.2.3.4 Generation of iPS cells in different species 21
2.2.3.5 Characterizations of iPS cells 23
2.3 Transcription factor 24
2.3.1 Core pluripotency transcription factor 25
2.3.1.1 POU5F1 25
2.3.1.1.1 Evolution of POU5F1
26
2.3.1.1.2 Sequence and expression profile
of POU2 and POU5F1
28
2.3.1.1.3 Sequence specificity and
structure of POU2/POU5F1
29
2.3.1.2 SOX2 30
2.3.1.2.1 Sequence specificity and structure
of SOX2
30
2.3.1.3 NANOG 31
2.3.1.3.1 Sequence specificity and structure
of NANOG
32

v
2.3.2 Cooperative binding of transcription factors POU5F1,
SOX2 and NANOG
33
2.4 Lentiviral vector 34
2.5 Next-Generation Sequencing 35
2.6 Transcriptome analysis 36
2.6.1 Tophat 37
2.6.2 Cufflinks 38
CHAPTER 3: MATERIALS AND METHODS
3.1 General maintenance of zebrafish 39
3.2 Preparation of tissue culture dishes and plates 39
3.3 Maintenance of zebrafish cell lines 40
3.3.1 Preparation of zebrafish embryo extract (ZEE) 40
3.3.2 Culture of ZES, Z428, ZES1 and ZES4 41
3.3.2.1 Preparation of ZES medium, ESM4 42
3.3.2.2 Subculture of Z428 and ZES1 42
3.3.2.3 Freezing of Z428 and ZES1 43
3.3.2.4 Thawing of Z428 and ZES1 43
3.3.2.5 Culture of ZES4 43
3.3.3 Culture of ZEF 44
3.3.3.1 Preparation of ZEF cell media 44
3.3.3.2 Derivation and culture of ZEF 45
3.4 Maintenance of mammalian cell lines 45
3.5 Preparation of gamma-irradiated MEF 46
3.6 Preparation of MEF-conditioned medium (CM) 47

vi
3.7 Total RNA isolation using TRIzol Reagent 48
3.8 Determination of yield and quality of nucleic acid 48
3.9 DNaseI treatment of total RNA 48
3.10 First strand cDNA synthesis 49
3.11 Polymerase chain reaction (PCR) 49
3.12 A-tailing reaction for blunt-ended PCR products 51
3.13 Restriction endonuclease digestion of plasmid DNA 51
3.14 Gel electrophoresis 51
3.15 Purification of DNA fragments 52
3.16 Cloning of PCR products (T-A cloning) 52
3.17 Sequencing of DNA constructs 52
3.18 Subcloning into lentiviral transfer vector 53
3.19 Preparation of electrocompetent E. coli bacterial cells 56
3.20 Transformation of electrocompetent E. coli bacterial cells 57
3.21 Purification of plasmids from bacterial culture 57
3.22 Isolation of genomic DNA from cells 58
3.23 Real time PCR 58
3.24 Lentivirus production 62
3.25 Lentivirus transduction 64
3.26 Lentivirus titration 64
3.27 Reprogramming of human fibroblast D551 cells to iPS cells 65
3.28 Bioinformatics analysis 68
3.29 Illumina TruSeq RNA sample preparation and sequencing 68
3.30 Analysis of Illumina Next-Generation Sequencing data 69
3.31 Microarray data analysis 71
vii
CHAPTER 4: RESULTS ON TRANSCRIPTOME ANALYSIS OF
HUMAN EMBRYONIC STEM CELLS (hESC),
HUMAN EMBRYONIC CARCINOMA CELLS
(hECC) AND HUMAN FETAL FIBROBLAST CELLS
4.1 Mapping of Illumina RNA-seq reads to human genome 72
4.2 Transcript quantification by Cufflinks 73
4.3 Identification of differentially expressed transcripts by RNA-seq 74
4.4 Functional annotation of differentially expressed transcripts 75
4.5 Post-transcriptional regulation between hESC/hECC and
differentiated human fibroblast D551 cells by alternative
splicing
77
4.6 Transcriptional regulation between hESC/hECC and
differentiated human fibroblast D551 cells by alternative
promoter usage
79
4.7 Expression of pluripotency-associated, tumorigenicity-
associated, germ-lineage specific and fibroblast-associated
markers
81
4.8 Visualization of mapped reads in pluripotency gene loci
POU5F1, SOX2, NANOG and LIN28A
82
4.9 Identification of novel hypothetical transcripts potentially
involved in pluripotency
84
4.10 Candidate transcripts potentially involved in the maintenance of
pluripotency
89
4.11 Correlation of gene expression profile between RNA-seq and
microarray
92

viii
4.12 Validation of RNA-seq data using real time PCR 93
CHAPTER 5: RESULTS ON CROSS-SPECIES
COMPLEMENTATION OF PLURIPOTENCY
GENES BETWEEN HUMAN AND ZEBRAFISH
5.1 Identification of zebrafish orthologues of pluripotency genes
POU5F1, SOX2 AND NANOG
95
5.1.1 POU5F1 95
5.1.2 SOX2 102
5.1.3 NANOG 106
5.2 Expression of zebrafish pou5f1, sox2, nanog and lin28a 111
5.3 Cloning of zebrafish pou5f1, sox2, nanog and lin28a into pSin-
EF2-Pur lentiviral backbone
114
5.4 Optimization of lentivirus production 119
5.5 Optimization of lentivirus transduction on human fibroblast
D551 cells
121
5.6 Lentivirus titration 122
5.7 Cross-species complementation of human and zebrafish
pluripotency genes POU5F1, SOX2, NANOG and LIN28A via
iPS cell reprogramming assay
125
ix
CHAPTER 6: RESULTS ON TRANSCRIPTOME ANALYSIS OF
ZEBRAFISH ES-LIKE CELLS (ZES) AND
ZEBRAFISH EARLY EMBRYOS
6.1 Zebrafish cell lines for RNA sequencing 138
6.2 Mapping and analysis of RNA-seq data from ZES and zebrafish
early embryos
139
6.3 Correlation of different zebrafish cell lines and zebrafish early
embryos
143
6.4 The most abundant annotated transcripts in zebrafish cell lines
and early embryos
146
6.5 Mapping and expression of pou5f1, sox2, nanog and lin28a in
zebrafish cell lines and early embryos
152
6.6 Expression of pluripotency-associated genes in zebrafish cell
lines and early embryos
153
6.7 Differentially expressed transcripts between ZES and ZEF 158
6.8 Functional annotation of differentially expressed transcripts 162
6.9 Identification of potential pluripotency-associated transcripts in
zebrafish
163
6.10 Validation of RNA-seq data using real time PCR 165
CHAPTER 7: DISCUSSION
7.1 Transcriptome analysis of human embryonic stem cells (hESC),
human embryonic carcinoma cells (hECC) and human fetal
fibroblast cells
168
7.1.1 Introduction 168

x
7.1.2 Advantages of RNA-seq 169
7.1.3 Mapping of sequencing reads 169
7.1.4 Differentially expressed transcripts and functional
annotation
170
7.1.5 Post-transcriptional and transcriptional regulation 173
7.1.6 Expression of pluripotency-associated,
tumorigenicity-associated, germ-lineage specific and
fibroblast-associated markers
174
7.1.7 Visualization of pluripotency-associated transcripts in
UCSC Genome Browser
175
7.1.8 Conclusion 176
7.2 Cross-species complementation of human and zebrafish
POU5F1, SOX2, NANOG and LIN28A
176
7.2.1 Introduction 176
7.2.2 Sequence specificity of POU5F1, SOX2 and NANOG 177
7.2.3 Expression of zebrafish pou5f1, sox2, nanog and
lin28a
179
7.2.4 Cloning of lentiviral transfer vectors 180
7.2.5 Lentivirus production 180
7.2.6 Lentivirus transduction and titration 181
7.2.7 Human iPS cell reprogramming assay 182
7.2.8 Conclusion 184
7.3 Transcriptome analysis of zebrafish ES-like cells (ZES) and
zebrafish early embryos
185
7.3.1 Introduction 185
xi
7.3.2 ZES for pluripotent transcriptome analysis 185
7.3.3 Mapping and analysis of RNA-seq data 187
7.3.4 Correlation of zebrafish cell lines and zebrafish early
embryos
188
7.3.5 The most abundant transcripts in zebrafish cell lines
and early embryos
190
7.3.6 Expression of pou5f1, sox2, nanog and lin28a in
zebrafish cell lines and early embryos
191
7.3.7 Discovery of novel transcribed regions in zebrafish
pou5f1, sox2, nanog and lin28a
195
7.3.8 Expression of pluripotency-associated genes in ZES
and early embryos
196
7.3.9 Differentially expressed transcripts in ZES and ZEF
and functional annotation
197
7.3.10 Identification of potential pluripotency-associated
transcripts in zebrafish
198
7.3.11 Conclusion 199
CHAPTER 8: CONCLUSION 201
REFERENCES 203
APPENDICES 237
xii
LIST OF TABLES
Page
Table 3.1 Cloning of zebrafish pluripotency genes 50
Table 3.2 Validation of positive clones 53
Table 3.3 Cloning of transgenes into lentiviral transfer vectors 55
Table 3.4 Gene expression analysis in zebrafish 59
Table 3.5 Validation of RNA-seq data 60
Table 3.6 Lentivirus titration 61
Table 3.7 Human iPS cell reprogramming 66
Table 3.8 GEO accession numbers for microarray samples 71
Table 4.1 Mapping of human RNA-seq data 73
Table 4.2 Functional annotation of hESC/hECCs 76
Table 4.3 Alternative spliced genes of hESC/hECCs. 79
Table 4.4 Genes with alternative promoter usage of hESC/hECCs 80
Table 4.5 Genomic locations of human pluripotency genes 83
Table 4.6 Novel hypothetical transcripts in HES3 85
Table 4.7 Annotated human pluripotency gene candidates 90
Table 4.8 Novel hypothetical human pluripotency gene candidates 91
Table 5.1 Residues of POUs domain of POU5F1 99
Table 5.2 Residues of POUh domain of POU5F1 101
Table 5.3 Residues of HMG domain of SOX2 105
Table 5.4 Residues of homeodomain of NANOG 110
Table 5.5 Size of zebrafish pluripotency gene coding sequence 117
Table 5.6 Size of restriction enzyme digested plasmids 118

xiii
Table 5.7 Lentivirus titer 124
Table 6.1 Mapping of RNA-seq data for zebrafish cell lines 141
Table 6.2 Mapping of RNA-seq data for zebrafish early embryos 141
Table 6.3 Abundant transcripts in zebrafish cell lines 147
Table 6.4 Abundant transcripts in zebrafish early embryos. 148
Table 6.5 Functional annotation of abundant transcripts in zebrafish
cell lines
150
Table 6.6 Functional annotation of abundant transcripts in zebrafish
embryos
151
Table 6.7 Genomic locations of zebrafish pluripotency genes 152
Table 6.8 Expression of zebrafish pluripotency genes 153
Table 6.9 Most differential expressed transcripts in ZES 159
Table 6.10 Functional annotation of differential expressed transcripts 163

xiv
LIST OF FIGURES
Page
Figure 2.1 Development of teratocarcinoma 12
Figure 2.2 Model of POU2/POU5F1 gene evolution 28
Figure 3.1 Design of the lentiviral transfer vector pSin-EF2-GOI-Pur 54
Figure 3.2 Lentiviral transfer vector cloning 55
Figure 3.3 Lentivirus production 63
Figure 3.4 Human iPS cell reprogramming 67
Figure 4.1 Transcript expression from human RNA-seq data 74
Figure 4.2 Annotated transcripts expressed in hESC/hECCs 75
Figure 4.3 Alternative splicing of hESC/hECCs 78
Figure 4.4 Alternative promoter usage of hESC/hECCs 80
Figure 4.5 Heat maps of different markers 82
Figure 4.6 Visualization of NANOG locus 84
Figure 4.7 Visualization of novel hypothetical transcript loci 86
Figure 4.8 Correlation of quantification by RNA-seq and microarray 92
Figure 4.9 Validation of human RNA-seq data 94
Figure 5.1 Protein sequences of zebrafish and human
Pou5f1/POU5F1
96
Figure 5.2 POUs domain of POU2/POU5F1 98
Figure 5.3 POUh domain of POU2/POU5F1 100
Figure 5.4 Protein sequences of zebrafish and human Sox2/SOX2 102

xv
Figure 5.5 HMG domain of SOX2 104
Figure 5.6 Protein sequences of zebrafish and human
Nanog/NANOG
107
Figure 5.7 Homeodomain of NANOG 108
Figure 5.8 Unique sequence of NANOG 109
Figure 5.9 Expression profiles of zebrafish pluripotency genes using
real time PCR
112
Figure 5.10 Intact total RNA 115
Figure 5.11 Amplification of zebrafish coding sequence 116
Figure 5.12 Validation of presence of insert in pSin-EF2-GOI-Pur
backbone
118
Figure 5.13 Optimization of lentivirus production 120
Figure 5.14 Optimization of lentivirus transduction 121
Figure 5.15 Intact genomic DNA 122
Figure 5.16 Standard curves for lentivirus titration 123
Figure 5.17 Tranduction with different volumes of lentivirus 124
Figure 5.18 Healthy human fibroblast cells 125
Figure 5.19 Human iPS cell reprogramming 126
Figure 5.20 Human iPS cell reprogramming with human pluripotency
genes
128
Figure 5.21 Human iPS cell reprogramming with zebrafish
pluripotency genes
134
Figure 5.22 Transduced D551 cells with lentivirus encoding EGFP 137
Figure 6.1 Zebrafish cell lines for RNA-seq 139

xvi
Figure 6.2 Transcript expression deduced from RNA-seq data 142
Figure 6.3 Correlation of zebrafish RNA-seq samples 143
Figure 6.4 Correlation of ZES 145
Figure 6.5 Expression of human pluripotency-associated gene
orthologues
155
Figure 6.6 Expression of target genes activated by zebrafish pou5f1 157
Figure 6.7 Differential transcript expression between ZES and ZEF 158
Figure 6.8 Annotated transcripts expressed in ZES 161
Figure 6.9 Novel hypothetical transcripts expressed in ZES 161
Figure 6.10 Identification of potential zebrafish pluripotency-
associated transcripts
164
Figure 6.11 Validation of zebrafish RNA-seq data 166

xvii
LIST OF SYMBOL
packaging signal

xviii
LIST OF ABBREVIATIONS
A adenine
bFGF basic fibroblast growth factor
BMP4 bone morphogenetic protein 4
CIS carcinoma in situ
cPPT central polypurine tract
cDNA complementary DNA
CM conditioned medium
Ct cycle threshold
DAVID Database for Annotation, Visualization and Integrated
Discovery
dpf days post fertilization
D551 Detroit 551
DMSO dimethyl sulfoxide
ds double-stranded
DMEM Dulbecco’s Modified Eagle Medium
DPBS Dulbecco’s Phosphate Buffered Saline
EF1α
elongation factor 1 alpha
EC embryonic carcinoma
EG embryonic germ
ES embryonic stem
EpiSC epistem cells
FBS fetal bovine serum
FGF fibroblast growth factor
xix
FPKM fragments per kilobase of transcript per million mapped
reads
GEO Gene Expression Omnibus
GOI gene of interest
HMG high mobility group
hpf hours post fertilization
hECC human embryonic carcinoma cells
hESC human embryonic stem cells
HIV human immunodeficiency virus
iPS induced pluripotent stem
IRES internal ribosomal entry site
KO KnockOut
LIF leukemia inhibitory factor
LTR long terminal repeat
MZT maternal-zygotic transition
mRNA messenger RNA
µg
microgram
µl
microliter
µm
micrometer
µM
micromolar
MBT mid-blastula transition
ml milliliter
mM millimolar
MEF mouse embryonic fibroblast
MOI multiplicity of infection

xx
NCBI National Center for Biotechnology Information
NEAA non-essential amino acids
NT2D1 NTERA-2 clone D1
r Pearson’s correlation coefficient
% percentage
PLL poly-L-lysine
PCR polymerase chain reaction
POUh POU homeodomain
POUs POU-specific
PGC primordial germ cells
Puro puromycin resistance gene
RRE Rev-responsive element
RIN RNA Integrity Number
SAGE serial analysis of gene expression
SCNT somatic cell nuclear transfer
TGCT testicular germ cell tumour
T thymine
TSS transcription start site
UPL Universal Probe Library
UTR untranslated region
VSV-G vesicular stomatitis virus-glycoprotein
v/v volume per volume
w/v weight per volume
YSCs yolk sac carcinomas

xxi
ZEE zebrafish embryo extract
ZEF zebrafish embryonic fibroblast
ZES1 zebrafish ES cell-like line 1
ZES4 zebrafish ES cell-like line 4
ZES zebrafish ES-like cells

xxii
LIST OF PUBLICATION
HO, S. Y., GOH, C. W., GAN, J. Y., LEE, Y. S., LAM, M. K., HONG, N., HONG,
Y., CHAN, W. K. & SHU-CHIEN, A. C. 2014. Derivation and long-term
culture of an embryonic stem cell-like line from zebrafish blastomeres under
feeder-free condition. Zebrafish, 11, 407-420.

xxiii
PENDEDAHAN CALON BARU PLURIPOTENSI DAN KOMPLEMENTASI
ANTARA SPESIES GEN DENGAN PERBANDINGAN TRANSKRIPTOMIK
DI MANUSIA DAN IKAN ZEBRA
ABSTRAK
Profil transkriptom pluripotensi manusia telah dikenali dengan menggunakan
DNA microarray, expressed sequence tag, penjujukan selari besar-besaran, serial
analysis of gene expression (SAGE) and SAGE terbalik. Untuk mendedahkan gen
lain yang terlibat dalam pluripotensi manusia, profile transckriptom sel pucuk embrio
(ES) and sel karsinoma embrio (EC) manusia dikaji dengan menggunakan Jujukan
Illumina Next Generation. Pendedahan gen lain ini akan menyediakan gambaran
komprehensif tentang pluripotensi manusia. Pengajian transkriptom ini menyokong
penemuan sebelumnya tentang gen pluripotensi yang dikenali, termasuk POU5F1,
SOX2, NANOG dan LIN28A. Selain itu, gen baru dan bahagian transkripsi baru yang
diekspres khususnya pada sel ES/EC manusia juga dikenali. Transkip ini besar
kemungkinan terlibat dalam pengekalan pluripotensi manusia. Dengan itu, data
transkriptom manusia ini menyumbang untuk pemahaman yang lebih baik tentang
pluripotensi manusia dan juga memajukan anotasi rujukan manusia semasa.
Walaupun POU5F1 tidak boleh dikecualikan untuk pluripotensi dalam vertebrata,
pou5f1 ikan zebra tidak boleh mengekalkan atau mengaruh pluripotensi dalam
vertebrata tinggi dalam laporan sebelumnya. Fungsi zebrafish pou5f1 yang tidak
dipelihara dalam pluripotensi mencetuskan pengajian pemeliharaan fungsi ini. Gen
POU5F1, SOX2 dan NANOG adalah teras transkripsi pengawal dalam rangkaian
pluripotensi. Dalam pengajian pemeliharaan fungsi ini, POU5F1, SOX2, NANOG
dan LIN28A manusia boleh memprogram sel fibroblast manusia kepada sel
pluripotensi pucuk aruhan (iPS) manusia ke takat tertentu tetapi ortolog ikan zebra

xxiv
tidak boleh. Dengan itu, fungsi pou5f1, sox2, nanog dan lin28a dalam aruhan
pluripotensi adalah tidak dipelihara pada ikan zebra. Ketidakupayaan pou5f1, sox2,
nanog and lin28a ikan zebra dalam aruhan pluripotensi menggesakan pengajian
profil transkriptom pluripotensi dalam ikan zebra denggan menggunakan Jujukan
Illumina Next Generation pada sel pucuk ikan zebra (ZES). Dataset transcriptom
awam pada embrio awal ikan zebra juga termasuk dalam analisis untuk menyediakan
gambaran menyeluruh tentang pluripotensi dalam ikan zebra. Sepadan dengan
pengajian pemeliharaan fungsi sebelumnya, teras faktor pluripotensi pou5f1, sox2
dan nanog tidak diekspres atau diekspres pada tahap yang amat rendah pada ZES
tetapi diekspres pada tahap yang tinggi pada embrio awal ikan zebra. Pemeliharaan
ekspresi sesetengah ortholog gen pluripotensi manusia dan ekspresi sesetengah gen
sasaran pou5f1 ikan zebra pada tahap tinggi pada ZES membayangkan lebihan fungsi
pou5f1, sox2 dan nanog untuk pluripotensi ikan zebra dan mekanisma lain
kemungkinan terlibat dalam pengekalan pluripotensi in vitro pada ikan zebra. Gen
nop14, zgc:109782 dan tuba8l4 dan transkrip hypotetikal novel pada loci
chr12:17512223-17550720, chr12:20132645-20193454 dan chr13:11761814-
11775511 besar kemungkinan terlibat dalam pluripotensi ikan zebra.

xxv
UNCOVERING CANDIDATE NOVEL PLURIPOTENCY AND CROSS-
SPECIES COMPLEMENTATION GENES BY COMPARATIVE
TRANSCRIPTOMICS IN HUMAN AND ZEBRAFISH
ABSTRACT
The transcriptome profile of human pluripotency has been revealed using
DNA microarray, expressed sequence tag, massively parallel signature sequencing,
serial analysis of gene expression (SAGE) and reverse SAGE. To discover additional
genes involved in human pluripotency, the transcriptome profile of human
embryonic stem (ES) and embryonic carcinoma (EC) cells was studied using
Illumina Next Generation Sequencing. The discovery of these additional genes will
provide a more comprehensive overview of human pluripotency. This transcriptome
study supported the previous findings of known pluripotency genes, including
POU5F1, SOX2, NANOG and LIN28A. In addition, additional genes and novel
transcribed regions specifically expressed in human ES/EC cells were also revealed.
These transcripts are likely to be involved in the maintenance of human pluripotency.
Thus, this human transcriptomic data contributes to a better understanding of the
human pluripotency as well as improves the current human reference annotation.
Though POU5F1 is indispensable for pluripotency in vertebrates, zebrafish pou5f1
could not maintain nor induce pluripotency in higher vertebrates in previous reports.
The non-conserved roles of zebrafish pou5f1 in pluripotency triggered this functional
conservation study. Pluripotency genes POU5F1, SOX2 and NANOG are core
transcriptional regulators of pluripotency network. In this functional conservation
study, human POU5F1, SOX2, NANOG and LIN28A could reprogram human
fibroblast to human induced pluripotent stem (iPS) cells to certain extent but not
zebrafish orthologues of these genes. Thus, the roles of pou5f1, sox2, nanog and

xxvi
lin28a in the induction of pluripotency were not conserved in zebrafish. The inability
of zebrafish pou5f1, sox2, nanog and lin28a in the induction of pluripotency
prompted the transcriptome profile study of pluripotency in zebrafish using Illumina
Next Generation Sequencing on zebrafish ES-like cells (ZES). Public transcriptome
data sets on zebrafish early embryos were also included in the analysis to provide a
comprehensive overview of pluripotency in zebrafish. Corresponding to the previous
functional conservation study, core pluripotency factors pou5f1, sox2 and nanog
were not expressed or expressed at extremely low levels in ZES but highly expressed
in zebrafish early embryos. The conserved expression of some other orthologues of
mammalian pluripotency genes and the high expression of some zebrafish pou5f1
target genes in ZES implied the functional redundancy of pou5f1, sox2 and nanog in
zebrafish pluripotency and other mechanisms might be involved in the maintenance
of in vitro pluripotency in zebrafish. Genes nop14, zgc:109782 and tuba8l4 and
novel hypothetical transcripts at loci chr12:17512223-17550720, chr12:20132645-
20193454 and chr13:11761814-11775511 are likely to be involved in zebrafish
pluripotency.

1
CHAPTER 1
INTRODUCTION
1.1 Research background
Human pluripotency gene candidates have been identified in different
transcriptome studies using DNA microarray, expressed sequence tag (Bhattacharya
et al., 2004), massively parallel signature sequencing (Wei et al., 2005), serial
analysis of gene expression (SAGE) (Richards et al., 2004) and reverse SAGE
(Richards et al., 2006). Some of these candidate genes were functionally proven
their significance in the maintenance of pluripotency. In each transcriptomic study,
additional potential genes involved in pluripotency were revealed. With the
introduction of Next-Generation Sequencing, a major transformation was seen in the
transcriptomic area with enormous throughput in the gathering of genomic and
transcriptomic information. Next-Generation Sequencing allows detection and
sequencing of all expressed transcripts without prior knowledge of transcript
sequence and reference annotation (Morozova et al., 2009). With this advance, we
hypothesized that an unprecedented exploration could be achieved in human
pluripotency with the discovery of additional annotated and novel hypothetical
pluripotency transcripts. Novel hypothetical transcripts mean transcripts that could
map to reference genome, but they have not been annotated in reference transcript
database.
2
POU5F1, SOX2 and NANOG (Boyer et al., 2005) are core transcriptional
regulators in pluripotency network in vertebrates. Various cross-species
complementation experiments were conducted between different species both in vitro
and in vivo to reveal the cross-species complementation of these genes in vertebrate.
The interchangeable function of POU5F1 and NANOG from different species in the
maintenance and induction of pluripotency in mouse ES cells in vitro (Morrison,
2006, Lavial et al., 2007, Niwa et al., 2008, Theunissen et al., 2011, Schuff et al.,
2012b) and the ability of mouse Pou5f1, Sox2 and Klf4 to reprogram Xenopus
tadpole muscle to proliferating cell clusters in vivo (Vivien et al., 2012) demonstrated
the cross-species complementation of pluripotency factors in vertebrates and the
induction of pluripotency could be induced in distant and diverse groups of animals.
Nonetheless, interaction necessary to maintain pluripotency in mouse and Xenopus
was lost in zebrafish. Zebrafish pou5f1 could not rescue Pou5f1-deficient mouse ES
cells (Morrison, 2006, Niwa et al., 2008) nor induce pluripotency in mouse (Tapia et
al., 2012) and zebrafish pou5f1 showed very little rescue in PouV depletion
phenotype in Xenopus (Morrison, 2006, Lavial et al., 2007). In addition, zebrafish
pou5f1 transcription was reported to be absent in zebrafish transient ES-like culture
but present abundantly in zebrafish oblong stage embryos which is the embryonic
stage for the derivation of zebrafish ES-like cells (ZES). The unusual expression and
the inability of zebrafish pou5f1 in the maintenance and induction of pluripotency
triggered us to study the cross-species complementation of pluripotency genes,
POU5F1, SOX2, NANOG and LIN28A in human and zebrafish via human induced
pluripotent stem (iPS) cell reprogramming assay. LIN28A was included in this assay
to increase the reprogramming efficiency (Yu et al., 2007).

3
From the reprogramming assay, zebrafish pou5f1, sox2, nanog and lin28a
could not induce pluripotency in human. Moreover, the expression of pou5f1 and
nanog orthologues was undetectable in ZES but was high in zebrafish early embryos.
These previous findings prompted us to conduct transcriptome profiling on ZES with
full developmental potency using Illumina Next-Generation Sequencing approach.
To gain a thorough profile on zebrafish pluripotency, transcriptomic data of zebrafish
early embryos from public database (Aanes et al., 2011) was included in the analysis
to reveal the molecular signatures of pluripotency in zebrafish.
1.2 Objectives of this study
The objectives of this study are:
I. To identify the pluripotency gene candidates in human by transcriptome
analysis of human ES and EC cell lines profiled using RNA-seq.
II. To study the cross-species complementation of pluripotency genes
POU5F1, SOX2, NANOG and LIN28A in human and zebrafish using
human iPS cell reprogramming assay.
III. To identify the pluripotency gene candidates in zebrafish using the RNA-
seq data from ZES cells and early embryos.

4
CHAPTER 2
LITERATURE REVIEW
2.1 Pluripotency
Pluripotency has different definitions by different scientists. The definition of
pluripotency which is widely accepted is the competency to self-renew indefinitely
and to differentiate into derivatives of all three embryonic germ layers both in vivo
and in vitro. This competency is a dynamic state influenced by cellular
microenvironment which affects the differentiation capacity of the cells into
functional tissues (Smith et al., 2009). Pluripotency is maintained by a globally open
chromatin state of cells. This open chromatin state is accessible to transcriptional
machinery and other factors maintaining a local silencing of lineage-specific genes
until differentiation is initiated (Gaspar-Maia et al., 2011).
Pluripotency is classified into two phases: naïve and primed. Mouse inner cell
mass from preimplantation embryos and embryonic stem (ES) cells derived from
mouse inner cell mass constitute naïve pluripotency or ground state. Mouse epiblast
cells from postimplantation embryos, mouse Epistem cells (EpiSC) derived from the
epiblast cells and human embryonic stem cells (hESC) constitute primed
pluripotency. Mouse EpiSC and hESC are similar in morphological traits, epigenetic,
genetic, culture conditions and signaling requirements (Nichols and Smith, 2009).
Epigenetic signatures and transcriptional network regulating pluripotency are
conserved in human and mouse. The same four transcription factors POU5F1, SOX2,

5
KLF4 and c-MYC could be used in the reprogramming of somatic cells to iPS cells in
these two species (Johnson et al., 2008). In spite of these similarities, hESC are
different from mouse ES cells in morphology, clonogenicity, global gene expression
profile, downstream target genes of POU5F1, SOX2 and NANOG, culture condition
and differentiation behavior (Johnson et al., 2008, Nichols and Smith, 2009). SSEA1
is expressed in undifferentiated mouse ES cells, but is expressed in differentiated
hESC. In contrast, SSEA3 and SSEA4 are expressed in undifferentiated hESC, but
are expressed in differentiated mouse ES cells (Draper et al., 2002). In term of
culture condition, hESC require Activin/Nodal and fibroblast growth factor (FGF)
while mouse ES cells require leukemia inhibitory factor (LIF) and bone
morphogenetic protein 4 (BMP4) in the absence of feeder cells for the maintenance
of pluripotency. LIF signaling could not maintain self-renewal of hESC and BMP4
induces differentiation of hESC to trophoblast (Vallier, 2005, Daheron et al., 2004,
Xu et al., 2002). These differences are thought to be developmental distinction
between naïve and primed pluripotency rather than species-specific difference
(Nichols and Smith, 2009).
Mouse ES cells are distinct from mouse EpiSC in culture condition, growth
factor dependence, gene expression, epigenetic status and function (Nichols and
Smith, 2009, Guo et al., 2009). The culture of mouse ES cells requires cytokine LIF
but the culture of mouse EpiSC requires Activin and FGF but not LIF (Brons et al.,
2007). Mouse ES cells could be converted to EpiSC in response to Activin A and
FGF2 with the resulting EpiSC show downregulation of Klf4. Mouse EpiSC could be
converted to mouse ES cells by overexpression of Klf4 and culture in ES cell media
containing Mek/Erk inhibitor, Gsk3 inhibitor and LIF. The resulting EpiSC–iPS cells
exhibit undifferentiated morphology, express ES cell specific transcripts and show

6
downregulation of lineage specification markers. Both X-chromosomes are activated
in mouse ES cells while one of the X-chromosome is silenced in mouse EpiSC.
Mouse ES cells could form chimera and germ-line transmission but mouse EpiSC
could not, after injecting the cells into blastocysts. The distinct differentiation ability
could be explained by different in X-chromosome silencing. In addition, mouse
EpiSC were argued to be differentiated from mouse ES cells developmentally,
functionally and epigenetically (Guo et al., 2009). Thus, mouse EpiSC are more
developmental restricted than mouse ES cells (Nichols and Smith, 2009). In spite of
the differences between mouse ES and EpiSC, these two cells are similar in the
expression of core pluripotency genes Pou5f1, Sox2, Nanog and in the ability to
differentiate into three germ layers via embryoid body and teratoma formation.
Pou5f1 and Nanog are two transcriptional regulators that are required for the
establishment and maintenance of pluripotent compartments in early embryos
(Nichols and Smith, 2009).
2.1.1 Pluripotency in fish
In order to explore the mechanism of pluripotency genes for therapeutic
application, it is important to understand the pluripotency gene in vivo. Fish is an
excellent model to study in vivo pluripotency. Fish could complement mouse model
by the combination of embryological, genetic and molecular analysis. The large
number of transparent fish embryos, ex utero development and easier gene function
manipulation enable rapid analysis of pluripotency genes in early embryonic
development and discovery of new molecules and mechanisms that govern the
pluripotency in vivo (Sanchez-Sanchez et al., 2011).

7
The discovery of pou5f1 and nanog homologues in medaka and zebrafish
genomes indicates that the key pluripotency genes are not exclusive to mammals
(Camp et al., 2009, Sánchez-Sánchez et al., 2010). Cross-species complementation
assay of pluripotency genes between fish and mammals are required to reveal the
extent of cross-species complementation of these genes in vertebrates. Functional
characterization of pluripotency genes in teleost could reveal the evolution of these
genes in vertebrate lineage and clarify some discrepancies in gene function between
mouse and human (Sanchez-Sanchez et al., 2011).
2.1.2 Assessment of pluripotency
Both undifferentiated state and differentiation potential are assayed in the
assessment of pluripotency. The assessments of undifferentiated state are cell
morphology, cell cycle, gene expression and epigenetics. Undifferentiated cells have
prominent nucleoli, high nuclear-to-cytoplasm ratio and they form multi-layered
colonies (Smith et al., 2009). In addition, undifferentiated cells have abbreviated G1
phase of cell cycle and they proliferate rapidly (Becker et al., 2006). The
undifferentiated cells could also be assessed by expression of alkaline phosphatase,
telomerase, cell surface antigens and three core pluripotency factors: OCT4 (Nichols
et al., 1998), SOX2 and NANOG (Mitsui, et al., 2003). The epigenetic status of
undifferentiated cells could be assessed by bisulfite sequencing of OCT4 and
NANOG gene promoters (Wernig et al., 2007) and expression of unique set of
microRNA (Houbaviy et al., 2003).
The assessment of differentiation potential could be assayed both in vitro and
in vivo. For in vitro differentiation potential, directed differentiation using specific
8
culture conditions and growth factors (Trounson, 2006) and differentiation via
embryoid bodies formation (Itskovitz-Eldor et al., 2000) into cell lineage
representatives of each germ layer (ectoderm, mesoderm and endoderm) could be
assessed. For in vivo differentiation potential, the capability of a cell to form
chimera, tetraploid blastocyst and teratoma (Smith et al., 2009) could be assayed.
Chimera and tetraploid blastocyst complementation are the gold standards for
the characterization of pluripotency (Smith et al., 2009). Chimera is formed by
injection of pluripotent cells into normal 2n blastocyst. These pluripotent cells will
then differentiate into various tissues when blastocyst develops into an adult (Okita
et al., 2007). Tetraploid blastocyst-complemented embryo is formed by injection of
pluripotent cells into 4n blastocyst. This 4n blastocyst is formed by the fusion of 2
cells and is developmentally defective. Thus, pluripotent cells compensate for this
developmental defectiveness and form the entire organism (Nagy et al., 1993).
Teratoma is a less stringent criterion to assess pluripotency in vivo (Smith et al.,
2009). Teratoma is a non-malignant tumor consisting of tissues from all three germ
layers. This tumor is formed by implantation of pluripotent ES cells into immuno-
compromised mouse (Wesselschmidt, 2011). Terotoma is used to assess pluripotency
of human pluripotent cells in vivo as both chimera and tetraploid complementation
are not ethically feasible in human. The standard criteria of human pluripotent cells
established by the US National Institutes of Health (NIH) are the ability of cells to
proliferate indefinitely, the expression of pluripotent transcription factors and cell
surface markers and the formation of teratoma containing derivatives of three germ
layers (Smith et al., 2009).

9
2.2 Sources of pluripotent cells
Pluripotent cells can be obtained from the following sources or processes:
inner cell mass of pre-implantation blastocyst (Evans and Kaufman, 1981, Martin,
1981, Thomson, 1998), teratocarcinoma (Andrews et al., 2005), somatic cell nuclear
transfer (SCNT) (Gurdon, 1968, Gurdon and Laskey, 1970), cellular hybridization
(Miller and Ruddle, 1976, Tada et al., 1997, Tada et al., 2001, Tada et al., 2003,
Cowan et al., 2005) and reprogramming (Takahashi and Yamanaka, 2006, Takahashi
et al., 2007, Yu et al., 2007). The pluripotent cells of teratocarcinoma are known as
EC cells (Andrews et al., 2005). Blastomeres of inner cell mass isolated from pre-
implantation blastocyst and cultured in vitro are known as ES cells (Evans and
Kaufman, 1981, Martin, 1981, Thomson, 1998). SCNT is a technique in which
somatic cell nucleus is injected into enucleated egg and host cell cytoplasm
reprograms the epigenome of somatic cell to pluripotent state (Gurdon, 1968, Gurdon
and Laskey, 1970). Cellular hybridization is the fusion of somatic cells and EC
(Miller and Ruddle, 1976), embryonic germ (EG) (Tada et al., 1997) or ES cells
(Tada et al., 2001, Tada et al., 2003, Cowan et al., 2005) forming pluripotent hybrid
cells. Reprogramming is the conversion of somatic cells into iPS cells by the
overexpression of transcription factors or the use of small molecules (Takahashi and
Yamanaka, 2006, Takahashi et al., 2007, Yu et al., 2007, Dey and Evans, 2011, Yuan
et al., 2011).
2.2.1 Embryonic stem (ES) cells
Embryonic stem (ES) cells are cells derived from the inner cell mass of
blastocysts. These cells are pluripotent which are capable to self-renew and to

10
differentiate. ES cells self-renew to produce more stem cells when cultured in
appropriate condition and differentiate to generate derivatives of all three embryonic
germ layers both in vivo and in vitro (Evans and Kaufman, 1981; Martin, 1981;
Thomson, 1998). During differentiation of ES cells, phenotypic and molecular
changes occurred hierarchically, with epiblast cells formed first, followed by germ
layers ectoderm, mesoderm and endoderm and subsequently somatic cells (Gaspar et
al., 2012).
The first embryo-derived pluripotent cells were derived from mouse by two
independent groups in 1981 (Evans and Kaufman, 1981, Martin, 1981). After 17
years since derivation of mouse ES cells, the first hESC was derived in 1998. These
pluripotent hESC display normal karyotypes, express high telomerase activity and
cell surface markers and capable of forming teratoma containing derivatives from
three embryonic germ layers (Thomson, 1998). Human ES cells provide an excellent
cell source for human development study, drug discovery and regenerative medicine.
However, its derivation from human early embryos raises ethical issues and
controversies. The reprogramming of somatic cells to ES-like cells serves as an
alternative to solve this disputation (Orkin, 2005).
2.2.1.1 Fish ES-like cells
Fish ES-like cells are commonly derived from blastula stage embryos. The
inner cell mass at this embryonic stage are pluripotent and developmental
undetermined (Robles et al., 2011, Wang et al., 2011b). These cells are capable of
forming germline chimera (Fan et al., 2004b). ES-like cells were derived and
characterized in medaka (Hong and Schartl, 2006), zebrafish (Fan et al., 2004a, Fan
11
et al., 2004b, Fan and Collodi, 2006), gilt-head bream (Bejar et al., 2002;
Parameswaran et al., 2012), sea perch (Chen et al., 2003), Asian sea bass
(Parameswaran et al., 2007), Indian major carp (Dash et al., 2010) and Atlantic cod
(Holen et al., 2010). These fish ES-like cells share in vitro properties with mouse ES
cells. In addition, it is possible to derive embryonic cell cultures from stages earlier
than blastula stage (Li et al., 2011) or at gastrula stage (Chen et al., 2004). Fish stem
cell serves as an excellent tool to study in vivo and in vitro stem cell biology as
observation of ES cell-derived chimeras is feasible with the external and transparent
fish embryos.
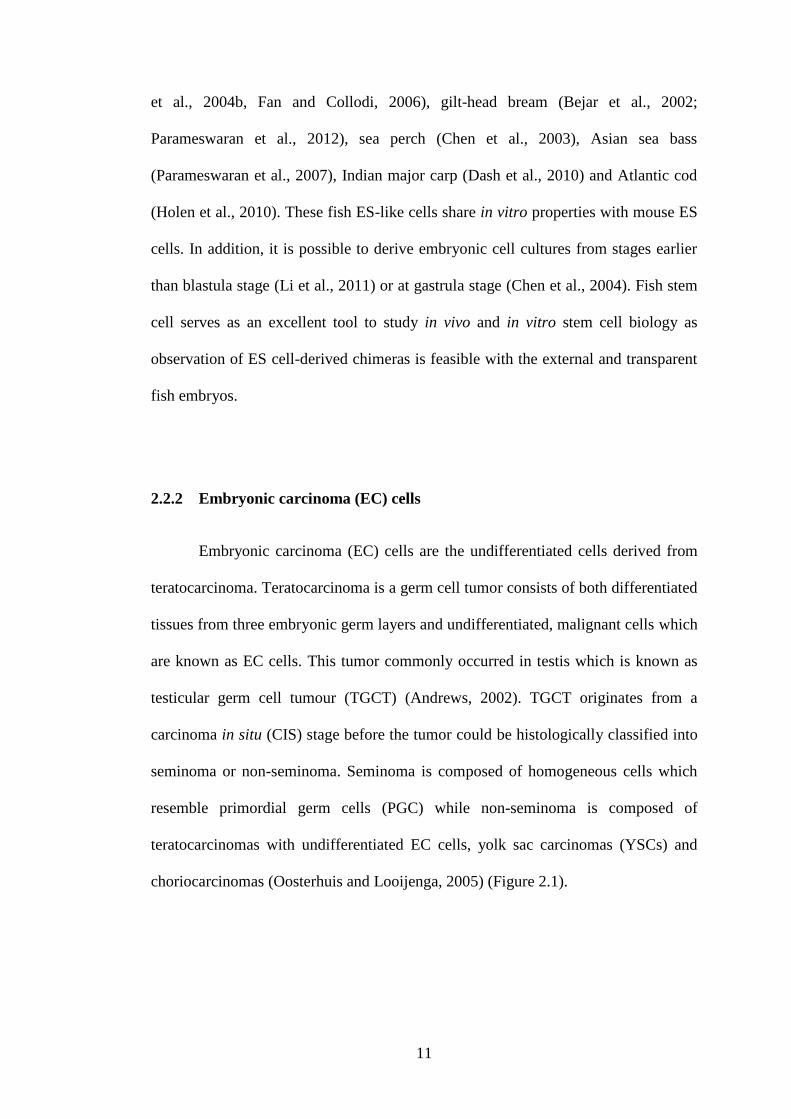
2.2.2 Embryonic carcinoma (EC) cells
Embryonic carcinoma (EC) cells are the undifferentiated cells derived from
teratocarcinoma. Teratocarcinoma is a germ cell tumor consists of both differentiated
tissues from three embryonic germ layers and undifferentiated, malignant cells which
are known as EC cells. This tumor commonly occurred in testis which is known as
testicular germ cell tumour (TGCT) (Andrews, 2002). TGCT originates from a
carcinoma in situ (CIS) stage before the tumor could be histologically classified into
seminoma or non-seminoma. Seminoma is composed of homogeneous cells which
resemble primordial germ cells (PGC) while non-seminoma is composed of
teratocarcinomas with undifferentiated EC cells, yolk sac carcinomas (YSCs) and
choriocarcinomas (Oosterhuis and Looijenga, 2005) (Figure 2.1).

12
Figure 2.1: Development of teratocarcinoma. Simplied diagram of teratocarcinoma
development.
EC cells were the first pluripotent cells isolated and cultured in vitro.
(Andrews, 2002). EC cells could be categorized into pluripotent EC cells and
nullipotent EC cells. There are several differences between these two types of EC
cells. Pluripotent EC cells show the full capacity to differentiate into somatic tissues
of ectodermal, mesodermal and endodermal lineages and extraembryonic tissues
while nullipotent EC cells show limited capacity for differentiation and could only
divide to form EC cells. In addition, nullipotent EC cells have shorter doubling time
and higher colony forming ability than pluripotent EC cells. In the absence of feeder
cells, pluripotent EC cells differentiate while nullipotent EC cells still could form
colonies. When EC cells are injected into immune-compromised mouse, pluripotent
EC cells form teratocarcinoma which is composed of EC cells and other
differentiated cell types while nullipotent EC cells form a sac of EC cells (Pera et al.,
1989, Teshima et al., 1988). Studies on nullipotent EC cells will provide information
on the tumorigenesis and regulation of proliferation in ES cells (Pera et al., 1989).
Human and mouse EC cells are resemble to each other in which they have
similar morphology, prominent nucleoli and sparse cytoplasm, grow in clusters of
tightly packed cells and express alkaline phosphatase (Bernstine et al., 1973; Benham
et al., 1981). In spite of these similarities, human and mouse EC are different in
molecular and differentiation potential. In molecular, human EC cells express
13
embryonic antigen SSEA3 but not SSEA1. Conversely, mouse EC cells express
SSEA1 but not SSEA3 (Andrews et al., 1982, Solter and Knowles, 1978). In
differentiation potential, human EC cells have the propensity to differentiate into
trophectoderm but this propensity is absence in mouse EC cells (Damjanov and
Andrews, 1983).
EC cells are important for the understanding of tumor progression, self-
renewal and differentiation in embryonic development (Andrews, 1998, Przyborski
et al., 2004). Compared to human ES cells, human EC cells are easier to culture, does
not require a feeder layer and almost no spontaneous differentiation (Knott et al.,
2012). Mouse ES cells are derived from 3.5 embryonic day of blastocyst while the
cut-off time for the formation of embryo-derived teratocarcinoma is 7.5 embryonic
day, which is too late for derivation of mouse ES cells.
2.2.2.1 EC cells are malignant surrogates of ES cells
In spite of the cancerous origin of EC cells, both ES cells and EC cells are
similar to each other. Both ES and EC cells are capable to self-renew indefinitely and
to differentiate. As seen in EC cells, culture-adapted ES cells also acquire karyotypic
change upon prolonged culture in vitro, increased proliferation and decreased
differention potential which are parallel to the malignant transformation (Baker et al.,
2007). Normal stem cells and cancer cells might use similar signaling pathways to
control self-renewal (Reya et al., 2001). In addition, ES cells also exhibit
tumorigenicity properties such as expression of tumor-related genes, downregulation
of p53, a tumor suppressor gene and increased telomerase activity which allows
indefinite proliferation (Wobus, 2010). This telomerase activity contributes to
14
immortality of both ES and EC cells (Shay et al., 2001). When ES cells are injected
into immuno-compromised mouse, teratocarcinoma is formed. This teratocarcinoma
contains stem cells which are similar to ES cells in morphology and expression of
cell surface markers such as SSEA3, SSEA4, Tra-1-60 and Tra-1-81. Similar to ES
cells, Pou5f1 knockdown in EC cells results in growth arrest and differentiation to
trophectoderm (Niwa et al., 2000, Matin et al., 2004). Poor differentiated tumors are
more similar to ES cells in gene expression pattern than well differentiated tumors,
including overexpression of ES-specific genes and underexpression of Polycomb-
regulated genes (Ben-Porath et al., 2008). Furthermore, both ES and EC cells are
capable to form chimera, though the chimera contribution of EC cells is lower than
ES cells. The chimera formed by EC cells develops tumour and these cells are not
germ-line transmitted (Barbaric and Harrison, 2012). The decreased differentiation
potential of EC cells might be explained by the high aneuploidy of EC cells
(Andrews, 2002).
The culture adaptation of ES cells in vitro might reflect the development and
progression of germ cell tumor in vivo (Baker et al., 2007, Harrison et al., 2007,
Andrews et al., 2005). Thus, in vitro culture of ES cells might be developed in a way
that is similar to the tumor progression of EC cells in vivo (Andrews et al., 2005). In
addition, the gene expression profiles of EC cell differentiation and normal
embryogenesis are similar to each other (Skotheim et al., 2005). As ES and EC cells
are pertinent to each other, these two cell lines could be used as complementary tools
to study pluripotency, differentiation, stem cell biology and cancer (Andrews et al.,
2005).

15
2.2.2.2 Human ES cells, HES3 and human EC cells, NCCIT, NT2D1 and
GCT27C4
HES3 (Pera et al., 2004) and NCCIT (Teshima et al., 1988, Damjanov et al.,
1993) are capable of self-renewal indefinitely and differentiate into cells of somatic
and extraembryonic lineages. Upon injection of NCCIT cells into nude mice, tumors
which consists of EC cells, immature somatic tissues, yolk sac tumors and
trophoblastic giant cells are formed (Teshima et al., 1988).
NT2D1 (NTERA-2 c1.D1) is a pluripotent human EC cell line which was
derived from NTERA2. NTERA2 shares the expression of the marker genes and
surface antigens with other human EC cells and human ES cells. Among them are
POU5F1, SSEA3, SSEA4, TRA-1-60, TRA-1-81 and human alkaline phosphatase-
associated antigens (Andrews et al., 1982, Andrews et al., 1990, Thomson et al.,
1998, Reubinoff et al., 2000, Draper et al., 2002). NT2D1 are flattened cells with a
high nuclear-to-cytoplasmic ratio and prominent nucleoli. NT2D1 remains
undifferentiated in the absence of feeder layer. In addition, NT2D1 could form
embryoid body-like structures. Upon induction, NT2D1 could be differentiated into
neuroectodermal and mesodermal derivatives (Andrews, 1984, Simões and Ramos,
2007).
GCT27C4 is a nullipotent human EC cell line (Pera et al., 1989) derived from
a multipotent clone, GCT27. Both GCT27 and GCT27C4 cells express surface
antigens SSEA3 and SSEA4 (Pera et al., 1987, Pera et al., 1989). GCT27C4 is
predominantly hypotriploid. In the absence of feeder cells, GCT27C4 could form
colonies with high efficiency. Upon injection of GCT27C4 into nude mice, tumours
consisted of only EC cells are formed (Pera et al., 1989).

16
2.2.3 Induced pluripotent stem (iPS) cells
Induced pluripotent stem (iPS) cells are pluripotent cells reprogrammed from
somatic cells by the overexpression of a set of transcription factors which are highly
expressed in ES cells (Takahashi and Yamanaka, 2006, Takahashi et al., 2007).
During reprogramming, reprogramming factors activate endogenous pluripotency
genes and repress lineage differentiation genes. iPS cells are useful in differentiation
studies, drug screening and regenerative medicine (Yu and Thomson, 2008).
Both adult progenitor and terminally differentiated cells could be
reprogrammed to iPS cells (Dey and Evans, 2011) with reprogramming efficiency
increases with immaturity of the starting cell type (Eminli et al., 2009). Mouse adult
neural stem cells represent an intermediate state between pluripotent and
differentiated cells. These neural stem cells express alkaline phosphatase and SSEA1
and could be reprogrammed earlier and more efficient than mouse embryonic
fibroblast. Overexpression of Pou5f1 alone is sufficient to induce pluripotency in
mouse adult neural stem cells (Kim et al., 2009b). In addition to differentiation status
of somatic cells, somatic cells from younger subjects accumulate minimal of somatic
mutations compared to cells from older subjects and these cells represent
advantageous cell source for reprogramming (Panepucci et al., 2012). Mouse
embryonic fibroblast (MEF) could be reprogrammed at higher efficiency than adult
skin cells, tail tip fibroblast, blood and cells from biopsy tissues (Rajarajan et al.,
2012).
Somatic cell reprogramming is a progressive event in which pluripotency
markers are expressed in sequential manner. Transgene expression from viral
transduction is required for a minimum of 12 days in MEF cells in order to generate
17
iPS cells. During reprogramming of MEF cells, alkaline phosphatase is activated first
on day-3 of transgene expression, followed by SSEA1 on day-9 which marks an
intermediate stage of reprogramming. The activation of endogeneous Pou5f1 and
Nanog which occurs late in the reprogramming process on day-16 marks the fully
reprogrammed cells (Brambrink et al., 2008).
iPS cells are similar to ES cells in morphology, gene expression profile,
proliferation rate, pluripotency and epigenetic status (Zwi-Dantsis et al., 2012). iPS
cells are capable to self-renew and to differentiate into derivatives of three germ
layers (Yu et al., 2007). Compared to iPS cells, ES cells are still the gold standard
and ES cells are more efficient than iPS cells in differentiating into other cell types
(Dey and Evans, 2011). The functional differences between iPS cells and ES cells
might be explained by both genetic and epigenetic factors. As activation level of
modular genes are inversely proportional to the DNA methylation level, DNA
methylation might account as one of the epigenetic mechanism underlying distinct
gene expression network and function between iPS and ES cells (Wang et al.,
2011a). In addition, differential methylation regions between human iPS and ES cells
(Doi et al., 2009) also suggest that iPS and ES cells are not equivalent in some
aspects and iPS cells have some memories of tissues origin. iPS cells might have
heterogeneous epigenetic profiles that alter the lineage-specific differentiation (Dey
and Evans, 2011). As the use of ES cells in clinical application raised the ethical and
immune rejection issues (Dey and Evans, 2011), the creation of patient-specific iPS
cells are able to resolve the use of ES cells in therapeutic medicine. However, the use
of iPS cells in clinical application is hampered by tumorigenicity concern which
originates from the use of viral vector and c-Myc in reprogramming and random
integration of transgene into host genome (Jalving & Schepers, 2009).

18
In addition to in vitro reprogramming, in vivo reprogramming was carried out
by injecting mouse Pou5f1, Sox2 and Klf4 into Xenopus tadpole tail muscle. The
resulting proliferating cell clusters display characteristics of pluripotency: alkaline
phosphatase staining, activation of endogeneous pluripotency genes, upregulation of
epigenetic regulators and capable to differentiate into derivatives of three germ layers
in vitro and neuronal and muscle phenotypes in vivo. This in vivo approach serves as
an alternative strategy for iPS cell generation and allows the study of the influence of
native environment on reprogramming. This study will provide a better
understanding of the transcriptional regulatory network that controls pluripotency
and lineage specification in vivo (Vivien et al., 2012).
2.2.3.1 Approaches for making iPS cells
The approaches for making iPS cells involve both genomic integrating and
non-genomic integrating methods (Lowry & Plath, 2008).
2.2.3.2 Genomic integrating methods
The genomic integrating methods are the use of retroviral and lentiviral
vectors to deliver transcription factors (Takahashi and Yamanaka, 2006, Takahashi et
al., 2007, Yu et al., 2007) in reprogramming. Following genomic integration, viral
vectors allow transgenes to be expressed for a prolonged period without provoking
immune response (Sommer and Mostoslavsky, 2010).
These are several differences between retroviral and lentiviral vectors.
Retroviral vector are capable to transduce dividing cells only; while lentiviral vector
19
is a subclass of retroviral vector that are capable to transduce both dividing and non-
dividing cells. Retroviral vector tends to integrate near to the transcriptional start site;
while lentiviral vector tends to integrate within the transcriptional unit (Wu et al.,
2003). Lentiviral vector gives higher viral yield and better transduction efficiency
than Moloney murine leukemia virus (MMuLV)-derived retroviral vector (Dick et
al., 2011b).
Retroviral and lentiviral transduction are the easiest approach to generate iPS
cell (Rajarajan et al., 2012). However, the use of retroviral and lentiviral vectors
causes random transgene integrations into host genome (Takahashi and Yamanaka,
2006, Takahashi et al., 2007, Yu et al., 2007) which will lead to insertional
mutagenesis, heterogeneous iPS clones and tumor formation (Dey and Evans, 2011).
Incomplete transgene silencing has been described for both retroviral (Takahashi and
Yamanaka, 2006) and lentiviral vectors (Brambrink et al., 2008), with silencing
occurred more frequently with lentiviral vector (Dick et al., 2011b).
2.2.3.3 Non-genomic integrating methods
The non-genomic integrating methods are the use of adenoviral vector
(Stadtfeld et al., 2008), plasmid transfection (Okita et al., 2008, Si-Tayeb et al.,
2010), episomal transfection of engineered synthetic factors (Wang et al., 2011c),
synthetic modified mRNA (Warren et al., 2010), recombinant proteins (Kim et al.,
2009a, Zhou et al., 2009) and small molecules (Huangfu et al., 2008, Dey and Evans,
2011, Esteban et al., 2010) in reprogramming. The reprogramming efficiency of
these methods are 0.1 to 1% of that reported for retroviral method (Dick et al.,
2011b).
20
Adenoviral vector and plasmid transfection are used to transiently express
reprogramming factors in somatic cells. This transient expression causes the
difficulty of maintaining reprogramming factors at sufficiently high level for a
duration which is sufficient for reprogramming. Subsequently, the reprogramming
efficiency with these methods is much lower than the reprogramming efficiency of
viral methods. However, these methods reduce the tumorigenicity risk of the iPS
cells (Stadtfeld et al., 2008, Okita et al., 2008).
Episomal transfection of engineered synthetic factors is another non-genomic
integrating method to generate iPS cells with higher efficiency and kinetics than
native factors. These engineered synthetic factors were synthesized by the fusion of
potent transactivation domain of herpex simplex virus protein VP16 to transcription
factors POU5F1, SOX2 and NANOG, respectively. The reprogramming efficiency
and kinetics are higher with increasing copy number of VP16 fused to POU5F1. The
fusion of VP16 to reprogramming factor elucidates the importance of transcriptional
activation in reprogramming (Wang et al., 2011c).
In spite of the gene transfer methods, the use of synthetic modified mRNAs
(Warren et al., 2010) and recombinant proteins (Kim et al., 2009a, Zhou et al., 2009)
are another non-genomic integrating methods to generate iPS cells. Synthetic
modified mRNAs allow reprogramming of human somatic cells to iPS cells and
direct differentiation of RNA-iPS cells to terminally differentiated myogenic cells.
The use of modified mRNA bases protects the mRNA from degradation. The
reprogramming efficiency and kinetics of this mRNA approach is higher than the
gene transfer techniques (Warren et al., 2010). To create recombinant
reprogramming proteins, the C-terminus of each reprogramming factor was fused to
a poly-arginine protein transduction domain which could penetrate the plasma

21
membrane of somatic cells. The recombinant proteins were then transduced into
somatic cells in four cycles.
The use of small molecules is another non-genomic integrating method of
reprogramming. This method eliminates insertional mutagenesis in iPS cells. Small
molecules can substitute reprogramming factors, enhance reprogramming efficiency
or induce epigenetics changes via restriction of chromatin modification enzymes
(Sommer and Mostoslavsky, 2010). Small molecules target enzymes and signaling
proteins that are involved in pluripotency and differentiation (Yuan et al., 2011).
2.2.3.4 Generation of iPS cells in different species
iPS cells were first established in mouse by Yamanaka group in 2006 with the
overexpression of mouse pluripotency genes Pou5f1, Sox2, Klf4, c-Myc in mouse
embryonic and adult fibroblast cells. These iPS cells are similar to ES cells in
morphology, growth properties, expression of ES cell markers, involvement in
embryonic development of chimera and formation of teratoma consisting of tissues
from three germ layers (Takahashi and Yamanaka, 2006).
Subsequently, iPS cells were established in human by Yamanaka group in
2007 with the overexpression of human POU5F1, SOX2, KLF4 and c-MYC in human
adult fibroblast (Takahashi et al., 2007). In the same year, Thomson group
established human iPS cells from human somatic cells using a different combination
of human reprogramming factors: POU5F1, SOX2, NANOG and LIN28A (Yu et al.,
2007). In agreement with the previous studies (Takahashi and Yamanaka, 2006,
Takahashi et al., 2007), NANOG and LIN28A are dispensable for reprogramming.

22
These two genes enhance the efficiency and frequency of reprogramming. These
human iPS cells generated by different groups are similar to human ES cells in
morphology, proliferation, telomerase activity, expression of cell surface markers,
epigenetic status of pluripotency genes and capable to differentiate into tissues of
three germ layers in embryoid bodies and teratomas (Takahashi et al., 2007, Yu et
al., 2007). Notably, POU5F1 is the only factor that is irreplaceable in
reprogramming (Nakagawa et al., 2008). The use of different gene combinations for
reprogramming suggests that combination of specific transcription factors could
modulate existing gene network and epigenetic marks (Nethercott et al., 2011).
In addition to reprogramming of human somatic cells from healthy
individuals, iPS cells were generated from amyotrophic lateral sclerosis (ALS)
(Dimos et al., 2008), Down syndrome (Mou et al., 2012), heart failure patients (Zwi-
Dantsis et al., 2012) and a variety of other genetic diseases (Park et al., 2008). The
heart failure-human-iPS cells could be differentiated into cardiomyocytes (Zwi-
Dantsis et al., 2012) and ALS-human iPS cells could be differentiated into motor
neurons (Dimos et al., 2008).
Human and mouse reprogramming factors were used in the iPS experiments
in different species. Human reprogramming factors were used in the reprogramming
of adult rat primary ear fibroblasts and bone marrow cells (Liao et al., 2009),
newborn marmoset skin fibroblast (Wu et al., 2010), adult rabbit liver and stomach
cells (Honda et al., 2010), porcine mesenchymal stem cells (West et al., 2010), quail
embryonic fibroblast (Lu et al., 2011), and fibroblast of two endangered species, drill
Mandrillus leucophaeus and northern white rhinoceros Ceratotherium simum cottoni
(Friedrich Ben-Nun et al., 2011). Mouse reprogramming factors were used in the
reprogramming of horse fetal fibroblast (Nagy et al., 2011).
23
The reprogramming of somatic cells from different species using human and
mouse reprogramming factors reveals a high degree of cross-species
complementation of pluripotency gene (Rajarajan et al., 2012) and reprogramming
process (Lu et al., 2011). Direct reprogramming using transcription factors is a
universal strategy in distantly-related species which might include all species (Lu et
al., 2011). In addition, comparison of iPS cells from different species could elucidate
the key aspect of pluripotency and early development (Rajarajan et al., 2012).
2.2.3.5 Characterizations of iPS cells
Alkaline phosphatase staining, expression of endogeneous POU5F1 and
NANOG and cell surface markers SSEA3, SSEA4, TRA-1-60 and TRA-1-81, in vitro
tri-lineage differentiation and in vivo terotoma formation are widely used for the
initial characterization of ES and iPS cells (Adewumi et al., 2007).
Fully reprogrammed iPS cells are highly similar to ES cells in gene
expression and epigenetic status. Fully reprogrammed iPS cells show complete
transgene silencing, expression of only endogeneous genes to maintain the
pluripotency state and form teratoma that consists of tissues of ectodermal,
mesodermal and endodermal origins (Chan et al., 2009, Mikkelsen et al., 2008).
Partially reprogrammed iPS cells show an incomplete transgene silencing, expression
of transgenes at higher level than endogenous pluripotency genes (Chan et al., 2009,
Mikkelsen et al., 2008), activation of a distinctive subset of stem cell-related genes,
incomplete repression of lineage-specific transcription factors, DNA
hypermethylation at pluripotency gene loci (Mikkelsen et al., 2008) and form

24
teratoma that consists of tissues of ectodermal and mesodermal origins but not of
endodermal origin (Chan et al., 2009).
In human fibroblast reprogramming, bona-fide iPS cells are CD13-, SSEA4
+,
TRA-1-60+, NANOG
+ and transgene silenced. Alkaline phosphatase, SSEA4,
hTERT, GDF3 and NANOG are not reliable markers to distinguish fully
reprogrammed cells from partially reprogrammed cells. However, proviral silencing,
REX1, DNMT3B and ABCG2 gene expression and TRA-1-60 expression are
validated markers that distinguish fully reprogrammed cells from partially
reprogrammed cells (Chan et al., 2009).
2.3 Transcription factor
Transcription factor is a protein that either binds directly to DNA or
facilitates the binding by adjacent region of protein (Schleif, 1988). Different
transcription factors could bind to identical DNA sequence and the interaction of
these transcription factors regulate the expression of downstream genes (Jaynes and
O'Farrell, 1988).
Spatial-temporal control of developmental genes in entire organisms is
regulated by functional multiprotein complex formed from finite sets of transcription
factors. Transcription factors have a propensity to cluster together at regulatory
regions of downstream genes (Biggin, 2011, Kadonaga, 2004). The clustering of
transcription factors on DNA motif is mediated through the interface of protein-
protein interaction of individual transcription factor (Ng et al., 2012). In spite of the
regulation by finite sets of transcription factors, DNA consensus sequence also
Related Documents