UNCORRECTED PROOF Food Hydrocolloids xxx (xxxx) xxx-xxx Contents lists available at ScienceDirect Food Hydrocolloids journal homepage: http://ees.elsevier.com The role of non-starch polysaccharides in determining the air-water interfacial properties of wheat, rye, and oat dough liquor constituents Frederik Janssen a,∗ , Arno G.B. Wouters a , Yannick Meeus c , Paula Moldenaers c , Jan Vermant d , Jan A. Delcour a a Laboratory of Food Chemistry and Biochemistry, Leuven Food Science and Nutrition Research Centre (LFoRCe), KU Leuven, Kasteelpark Arenberg 20, B-3001, Leuven, Belgium c Soft Matter Rheology and Technology, Department of Chemical Engineering, KU Leuven, Celestijnenlaan 200F, 3001, Leuven, Belgium d Soft Materials, Department of Materials, ETH Zürich, Vladimir-Prelog-Weg 5, 8093, Zürich, Switzerland ARTICLE INFO Keywords Dough liquor Arabinoxylan β-D-glucan Bulk shear rheology Air-water interfacial shear rheology ABSTRACT Dough gas cell stability is a prerequisite for obtaining breads with high specific volume and homogeneous crumb. The contribution of cereal endogenous non-starch polysaccharides (NSPs) to gas cell stability during wheat, rye, and oat bread making is still unclear. In this work, the aqueous phases from their fermented doughs were isolated as dough liquor (DL) by ultracentrifugation. The foaming, bulk shear rheology, and air-water (A-W) interfacial properties of wheat and rye DLs (treated with and without endoxylanase) and oat DL (treated with and without both lichenase and β-d-glucosidase) were studied. Enzymatic hydrolysis drastically reduced the apparent bulk shear viscosity of the different DLs and resulted in increased and decreased moduli (or magnitude) of the complex A-W interfacial shear viscosities of wheat and rye DL, respectively. The latter implies that (non-hydrolyzed) rye DL arabinoxylan strengthens the A-W interfacial film consisting of adsorbed proteins and lipids. No measurable A-W interfacial shear viscosities were obtained for oat DL irrespective of whether its β-D-glucans were hydrolyzed or not. This is probably because lipids dominate the oat DL A-W interfaces. The knowledge generated provides a fundamental basis for specifically modifying the composition of the aqueous phase in wheat, rye, and oat doughs to improve the quality of mixed cereal breads. 1. Introduction Gas cell stability is important for obtaining bread with a high spe- cific volume and a homogeneous crumb structure. In wheat (Triticum aestivum L.) bread making, the viscoelastic gluten network plays a major role in this regard (Sroan, Bean, & MacRitchie, 2009). Although di- rect evidence has – to the best of our knowledge – not yet been brought forward in literature, it has been suggested that towards the end of fermentation at least some gas cells are not completely surrounded by the gluten network because of its substantial extension upon dough ex- pansion (Gan et al., 1990) and that from this point onwards lipids, proteins, and non-starch polysaccharides (NSPs) in the dough aqueous phase may contribute to gas cell stabilization (Gan, Ellis, & Schofield, 1995; Sroan & MacRitchie, 2009). Non-wheat doughs lack the vis- coelastic gluten network that wheat doughs have. The argument can thus be made that gas cell stabilization by dough aqueous phase con- stituents is more important in non-wheat than in wheat doughs. Some lipids and proteins are amphiphilic and have the tendency to diffuse to and adsorb at air-water (A-W) interfaces. By doing so, they lower the surface tension ( ) of the A-W interface and, thus, the en ergy required to create new interfacial area. Lipids which do so typi- cally stabilize A-W interfaces by restoring spatial concentration and thus gradients by diffusing to areas of lower surface concentration. When proteins adsorb at an A-W interface, they in most cases spontaneously unfold to orient their more hydrophobic regions towards the air, interact mutually, and develop a viscoelastic film that physically stabilizes the A-W interface (Murray, 2007). Such film may also prevent neighboring gas cells from merging by exerting steric hindrance and/or electrostatic repulsion. NSPs in the dough aqueous phase may indirectly stabilize gas cell A-W interfaces (Courtin, Gelders, & Delcour, 2001; Primo-Martín, Hamer, & de Jongh, 2006; Sarker, Wilde, & Clark, 1998). First, it has been observed that water-extractable arabinoxylan (WE-AX) ac- count for the bulk viscosity (η bulk ) of wheat dough liquor (DL, cfr. in- fra) because they bind large amounts of water (Courtin et al., 2001). With that in mind, Courtin and Delcour (2002) reasoned that WE-AX may slow down drainage of liquid from the thin films that separate ad- jacent gas cells in dough. Second, it has been suggested that AX inter- act with proteins adsorbed at A-W interfaces and thereby increase the stability of said interface (Primo-Martín et al., 2006; Sarker et al., 1998). Sarker et al. (1998) observed an increase in the foam sta ∗ Corresponding author. E-mail address: [email protected] (F. Janssen) https://doi.org/10.1016/j.foodhyd.2020.105771 Received 4 December 2019; Received in revised form 22 January 2020; Accepted 13 Febraury 2020 Available online xxx 0268-005/© 2020.

Welcome message from author
This document is posted to help you gain knowledge. Please leave a comment to let me know what you think about it! Share it to your friends and learn new things together.
Transcript
UNCO
RREC
TED
PROO
F
Food Hydrocolloids xxx (xxxx) xxx-xxx
Contents lists available at ScienceDirect
Food Hydrocolloidsjournal homepage: http://ees.elsevier.com
The role of non-starch polysaccharides in determining the air-water interfacialproperties of wheat, rye, and oat dough liquor constituentsFrederikJanssen a,∗, Arno G.B.Wouters a, YannickMeeus c, PaulaMoldenaers c, JanVermant d,Jan A.Delcour a
a Laboratory of Food Chemistry and Biochemistry, Leuven Food Science and Nutrition Research Centre (LFoRCe), KU Leuven, Kasteelpark Arenberg 20, B-3001, Leuven, Belgiumc Soft Matter Rheology and Technology, Department of Chemical Engineering, KU Leuven, Celestijnenlaan 200F, 3001, Leuven, Belgiumd Soft Materials, Department of Materials, ETH Zürich, Vladimir-Prelog-Weg 5, 8093, Zürich, Switzerland
A R T I C L E I N F O
KeywordsDough liquorArabinoxylanβ-D-glucanBulk shear rheologyAir-water interfacial shear rheology
A B S T R A C T
Dough gas cell stability is a prerequisite for obtaining breads with high specific volume and homogeneous crumb.The contribution of cereal endogenous non-starch polysaccharides (NSPs) to gas cell stability during wheat, rye,and oat bread making is still unclear. In this work, the aqueous phases from their fermented doughs were isolatedas dough liquor (DL) by ultracentrifugation. The foaming, bulk shear rheology, and air-water (A-W) interfacialproperties of wheat and rye DLs (treated with and without endoxylanase) and oat DL (treated with and withoutboth lichenase and β-d-glucosidase) were studied. Enzymatic hydrolysis drastically reduced the apparent bulkshear viscosity of the different DLs and resulted in increased and decreased moduli (or magnitude) of the complexA-W interfacial shear viscosities of wheat and rye DL, respectively. The latter implies that (non-hydrolyzed) ryeDL arabinoxylan strengthens the A-W interfacial film consisting of adsorbed proteins and lipids. No measurableA-W interfacial shear viscosities were obtained for oat DL irrespective of whether its β-D-glucans were hydrolyzedor not. This is probably because lipids dominate the oat DL A-W interfaces. The knowledge generated provides afundamental basis for specifically modifying the composition of the aqueous phase in wheat, rye, and oat doughsto improve the quality of mixed cereal breads.
1. Introduction
Gas cell stability is important for obtaining bread with a high spe-cific volume and a homogeneous crumb structure. In wheat (Triticumaestivum L.) bread making, the viscoelastic gluten network plays a majorrole in this regard (Sroan, Bean, & MacRitchie, 2009). Although di-rect evidence has – to the best of our knowledge – not yet been broughtforward in literature, it has been suggested that towards the end offermentation at least some gas cells are not completely surrounded bythe gluten network because of its substantial extension upon dough ex-pansion (Gan et al., 1990) and that from this point onwards lipids,proteins, and non-starch polysaccharides (NSPs) in the dough aqueousphase may contribute to gas cell stabilization (Gan, Ellis, & Schofield,1995; Sroan & MacRitchie, 2009). Non-wheat doughs lack the vis-coelastic gluten network that wheat doughs have. The argument canthus be made that gas cell stabilization by dough aqueous phase con-stituents is more important in non-wheat than in wheat doughs.
Some lipids and proteins are amphiphilic and have the tendency todiffuse to and adsorb at air-water (A-W) interfaces. By doing so, theylower the surface tension ( ) of the A-W interface and, thus, the en
ergy required to create new interfacial area. Lipids which do so typi-cally stabilize A-W interfaces by restoring spatial concentration and thus
gradients by diffusing to areas of lower surface concentration. Whenproteins adsorb at an A-W interface, they in most cases spontaneouslyunfold to orient their more hydrophobic regions towards the air, interactmutually, and develop a viscoelastic film that physically stabilizes theA-W interface (Murray, 2007). Such film may also prevent neighboringgas cells from merging by exerting steric hindrance and/or electrostaticrepulsion.
NSPs in the dough aqueous phase may indirectly stabilize gas cellA-W interfaces (Courtin, Gelders, & Delcour, 2001; Primo-Martín,Hamer, & de Jongh, 2006; Sarker, Wilde, & Clark, 1998). First,it has been observed that water-extractable arabinoxylan (WE-AX) ac-count for the bulk viscosity (ηbulk) of wheat dough liquor (DL, cfr. in-fra) because they bind large amounts of water (Courtin et al., 2001).With that in mind, Courtin and Delcour (2002) reasoned that WE-AXmay slow down drainage of liquid from the thin films that separate ad-jacent gas cells in dough. Second, it has been suggested that AX inter-act with proteins adsorbed at A-W interfaces and thereby increase thestability of said interface (Primo-Martín et al., 2006; Sarker et al.,1998). Sarker et al. (1998) observed an increase in the foam sta
∗ Corresponding author.E-mail address: [email protected] (F. Janssen)
https://doi.org/10.1016/j.foodhyd.2020.105771Received 4 December 2019; Received in revised form 22 January 2020; Accepted 13 Febraury 2020Available online xxx0268-005/© 2020.
UNCO
RREC
TED
PROO
F
F. Janssen et al. Food Hydrocolloids xxx (xxxx) xxx-xxx
bility of a mixed protein (bovine serum albumin) – surfactant (Tween20) solution when purified wheat flour AX was added in concentrationslower than 0.30 mg/mL. These authors ascribed the improvement infoam stability to the formation of crosslinks between AX and proteinsadsorbed at the A-W interface. In addition, Primo-Martín et al. (2006)reported an albeit small increase of the magnitude of the complex sur-face dilatational modulus ( ) of wheat DL stabilized A-W interfaceswhen a xylanase that specifically hydrolyzes water-unextractable AX(WU-AX) was added to the dough formulation. However, in spite of theabove, the extent to which proteins and NSPs interact at A-W interfacesin a bread making context remains unclear.
AX is the major NSP in wheat and rye flour. It consists of a lin-ear backbone of β-1,4-linked d-xylopyranosyl residues. The C(O)-2 and/or C(O)-3 position(s) of the xylose residues can be substituted withmonomeric α-l-arabinofuranosyl units. In turn, the C(O)-5 position ofan α-l-arabinofuranosyl unit coupled to the C(O)-3 position of a xy-lose residue can be esterified with phenolic acids such as ferulic acid(Bengtsson, Åman, & Andersson, 1992; Cleemput, Roels, vanOort, Grobet, & Delcour, 1993; Courtin & Delcour, 2002; Vinkx &Delcour, 1996). The AX population is typically divided in WE-AX andWU-AX. Of course, the AX in the aqueous film surrounding gas cells islikely for the most part WE-AX and that in DL, i.e. the supernatant ob-tained after ultracentrifugation of fermented dough, by definition doesnot contain WU-AX.
β-D-glucan is the predominant NSP in oat flour. It is composed ofa quasi linear backbone of β-linked d-glucopyranosyl residues. About85–90% of these residues are linked through two or three successiveβ-1,4-bonds (referred to as cellotriosyl and cellotetraosyl units, respec-tively) separated by β-1,3-bonds. The other 10–15% of the β-D-glucanstructure consists of longer (at least five glucopyranosyl units) cellu-lose-like fragments linked by β-1,4-bonds (Wood, Weisz and Black-well, 1991, 1994).
The functionality of the constituents in DL is assumed to representthat of dough aqueous phase constituents (Baker, Parker, & Mize,1946; MacRitchie, 1976). Studies thus far have dealt with DLs isolatedfrom wheat dough. The emphasis has been on investigating the protein(Gerits, Pareyt, Masure, & Delcour, 2015; Pauly, Pareyt, Fierens,& Delcour, 2014; Salt, González-Thuillier, Chope, Penson, Tosi etal., 2018; Salt, Robertson, Jenkins, Mulholland, & Mills, 2005) orlipid (Gerits et al., 2015; Pauly et al., 2014; Salt et al., 2018; Saltet al., 2005) composition, ηbulk (Courtin et al., 2001; Pauly et al.,2014), or A-W interfacial properties (MacRitchie, 1976; MacRitchie& Gras, 1973; Pauly et al., 2014; Primo-Martín et al., 2006; Sahi,2003; Salt et al., 2018; Salt et al., 2006; Turbin-Orger et al.,2015) of such DLs. Overall, it has been suggested that proteins andlipids co-occur at wheat DL stabilized A-W interfaces and that WE-AXaccount for the wheat DL ηbulk. No attention has been given to DLs iso-lated from doughs made with flour from cereals other than wheat.
In recent work by our group (Janssen, Wouters, Pauly, & Del-cour, 2018), some conclusions were drawn about the composition andstability of A-W interfaces formed by adsorption of wheat, rye, and oatDL constituents. In a follow-up paper (Janssen et al. submitted for pub-lication), it was reported that proteins and lipids co-occur at wheat andrye DL stabilized A-W interfaces, whereas lipids are the predominantconstituent at oat DL stabilized A-W interfaces. Furthermore, the pres-ence of lipids at wheat and rye DL stabilized A-W interfaces was foundto weaken the microstructure of the adsorbed film as observed from apronounced increase of the interfacial shear viscosity upon defatting ofthe DL samples (Janssen et al. submitted for publication).
The ability of NSPs to increase ηbulk and the interplay betweenNSPs, proteins, and lipids adsorbed at dough gas cell A-W interfacesmay be of crucial importance for dough gas cell stability. We
here aimed to shed light on how NSPs influence the bulk and A-W inter-facial characteristics of wheat, rye, and oat DLs.
A common tool to understand the role of NSPs in cereal basedprocesses is the use of enzymes.
AX can be depolymerized by endo-β-1,4-xylanases (EC 3.2.1.8) (fur-ther referred to as xylanases) into AX molecules of reduced molecularweight (Baker et al., 1946). Courtin and Delcour (2001) reportedthat the xylanase from A. aculeatus preferentially hydrolyzes the WE-AXpopulation of wheat flour, whereas the xylanase from B. subtilis has moreaffinity for its WU-AX population. Similar substrate specificities havebeen observed with rye flour WE-AX and WU-AX populations (unpub-lished results).
In contrast, oat β-D-glucan is typically depolymerized by lichenase(EC 3.2.1.73). Lichenases convert it into β-D-gluco-oligosaccharides bycatalyzing the hydrolysis of β-1,4 bonds. β-D-glucosidases (EC 3.2.1.21)then selectively degrade these β-D-gluco-oligosaccharides into glucosemolecules by catalyzing the hydrolysis of both β-1,3- and β-1,4 bonds(McCleary & Nurthen, 1986).
In the present study, the role of NSPs was assessed by studyingthe foaming properties, the bulk shear rheology, the extent and rate atwhich γ of the A-W interface decreases, and the A-W interfacial shearrheology of wheat and rye DLs (treated with and without an A. aculea-tus xylanase) and oat DL (treated with and without both a B. subtilislichenase and an A. niger β-d-glucosidase). We also investigated whetherand to what extent the ability of NSPs to improve interfacial stabilitydepends on the presence of lipids at the A-W interface. To this end, theA-W interfacial properties of the constituents in defatted wheat and ryeDLs – with and without the above enzymatic treatments – were evalu-ated.
2. Materials & methods
2.1. Materials
2.1.1. Chemicals, bread making ingredients, and enzymesd-Allose, l-arabinose, d-xylose, d-mannose, d-galactose, d-glucose,
benzoic acid, sodium borohydride, 2-octanol, and ethyl acetate werefrom Sigma-Aldrich (Bornem, Belgium); chloroform, methanol, bro-mophenol blue, trifluoroacetic acid, 1-methylimidazole, and ethanolabsolute from Thermo Fisher Scientific (Aalst, Belgium); 25% ammo-nia, potassium hydroxide, acetic acid, acetic anhydride, and anhydridesodium sulfate from VWR International (Oud-Heverlee, Belgium); andethyl acetate from Merck (Darmstadt, Germany). All chemicals were atleast of analytical grade. Sugar, salt, and fresh compressed yeast (ABMauri, Dordrecht, Nederland) were bought in a local supermarket. Aliquid xylanase preparation from A. aculeatus (Shearzyme 500L) wasfrom Novozymes (Bagsvaerd, Denmark). Liquid lichenase (from B. sub-tilis) and β-d-glucosidase (from A. niger) preparations were those fromthe “β-D-glucan assay” kit of Megazyme (Bray, Ireland).
2.1.2. FloursCrousti commercial bread wheat flour from Dossche Mills (Deinze,
Belgium) contained 12.9% protein, 1.8% total lipids (of which 40%were free lipids and 60% were bound lipids), 2.1% total AX (of which18.2% was WE-AX), 0.2% β-D-glucan, and 0.67% ash (all on dm basis),and 13.6% moisture. Rye kernels (cultivar Dukato) from AVEVE (Merk-sem, Belgium) were conditioned to 16.0% moisture and roller milledin-house using a Bühler (Uzwil, Switserland) MLU-202 laboratory millas in Delcour, Vanhamel, and De Geest (1989). Rye flour contained4.0% protein, 0.9% total lipids (of which 36% were free lipids and64% were bound lipids), 4.2% total AX (of which 27.9% was WE-AX),1.1% β-D-glucan, and 0.41% ash (all on dm basis), and 13.6% mois-ture. Commercial oat flour was from Raisio Nutrition (Raisio, Finland)and contained 13.3% protein, 7.0% total lipids (of which 72% werefree lipids and 28% were bound lipids), 1.4% total AX (of which 10.9%
2
UNCO
RREC
TED
PROO
F
F. Janssen et al. Food Hydrocolloids xxx (xxxx) xxx-xxx
was WE-AX), 2.7% β-D-glucan, and 1.55% ash (all on dm basis), and10.2% moisture. The methods used to determine the composition of thedifferent flours are outlined in section 2.2.1.
2.2. Methods
2.2.1. Analysis of flour compositionAll analyses described in this section were executed in triplicate.Moisture and ash levels of flour were determined with AACCI Meth-
ods 44–19.01 and 08–01.01, respectively.Flour protein content was determined using an adaptation of AOAC
method 990.03 to an automated Dumas protein analysis system (VarioMax Cube, Elementar, Hanau, Germany).
Flour total lipid contents were determined gravimetrically as the sumof free and bound lipids as in Melis, Pauly, Gerits, Pareyt, and Del-cour (2017) using an accelerated solvent extractor. Free and boundlipids were subsequently extracted from about 1.0 g flour with hexaneand water-saturated butanol. After evaporating the butanol phase thenon-lipid material present in the water-saturated butanol extract was re-moved by sequentially adding chloroform (2.0 mL), methanol (2.0 mL),and milli-Q water (1.8 mL) (Bligh & Dyer, 1959). The samples werevortexed after addition of each solvent. Centrifugation (500 g, 20 min,23 ± 2 °C) yielded a lower chloroform phase containing mostly lipidsand an upper methanol-water phase containing impurities. The upperphase was discarded and the lower phase collected. After evaporatingthe hexane and chloroform phases, free and bound lipid levels, respec-tively, were quantified by weighing.
Total AX levels were the sum of xylose and arabinose levels, multi-plied by 0.88 to correct for the incorporation of water during hydrol-ysis. Xylose and arabinose levels were determined in a gas chromatog-raphy procedure in which flour samples were sequentially subjected toacid hydrolysis (2.0 M trifluoroacetic acid, 60 min at 110 °C), reductionof monosaccharides to alditols using sodium borohydride, and subse-quent conversion to alditol peracetates with acetic anhydride (Englyst& Cummings, 1984). The formed alditol peracetates were separatedwith an Agilent (Wilmington, DE, USA) gas chromatograph (6890 Se-ries) equipped with a polar column (Supelco SP 2380, 30.0 m length,0.32 mm inner diameter, 0.2 μm film thickness, Bellefonte, PA, USA).Helium was used as carrier gas. WE-AX levels were determined us-ing a procedure similar to the one described for determining the to-tal AX content, the only two exceptions being that (i) the acid hydrol-ysis was performed with 2.5 mL of an aqueous flour extract to whichwas added an equal volume of 4.0 M trifluoroacetic acid and that (ii)the arabinose level was corrected for the presence of arabinose origi-nating from arabinogalactan peptide (arabinose to galactose ratio 0.7)for wheat (Loosveld, Grobet, & Delcour, 1997) and rye (Van denBulck, Swennen, Loosveld, Courtin, Brijs et al., 2005) flours.Aqueous extracts were obtained by shaking 2.0 g flour (on wet matterbasis) in 20 mL water for 30 min at 23 ± 2 °C, followed by centrifuga-tion (1000 g, 10 min, 7 °C), and filtration of the supernatant over paper.
β-D-Glucan levels were colorimetrically measured using a Megazyme(Bray, Ireland) protocol, which is also available as AACCI Method32.23–01 (McCleary & Nurthen, 1986). In essence, flour samples(80 mg, on wet matter basis) were incubated with lichenase enzyme andhydrolyzed to completion with β-d-glucosidase. The d-glucose producedwas assayed using a glucose oxidase/peroxidase reagent at 510 nm andcorrected for the presence of free d-glucose.
2.2.2. Dough making and dough liquor isolationWheat, rye, and oat DLs were isolated as in Janssen et al. (2018).Wheat dough optimum water level and mixing time were determined
using AACCI Methods 54–21.02 and 54–40.02, respectively. Flour(100.0 g), deionized water (54.73 mL), sugar (6.0 g), compressed freshyeast (5.3 g), and salt (1.5 g) were mixed into dough in a
pin mixer (National Manufacturing, Lincoln, NE, USA) during 210 s.Rye or oat flour (265.0 g or 236.0 g, respectively), deionized water(200.9 mL or 232.3 mL, respectively), sugar (16.0 g or 14.8 g, respec-tively), fresh yeast (14.1 g or 13.1 g, respectively), and salt (4.0 g or3.7 g, respectively) were mixed into dough in a KitchenAid (St. Joseph,MI, USA) KPM5 mixer (60 s at speed 1 and 120 s at speed 4).
All doughs were fermented in a National Manufacturing fermenta-tion cabinet (30.0 °C, 90% relative humidity, 126 min). Wheat doughswere sheeted in a National Manufacturing sheeter thrice during fer-mentation (roll gaps were 4.8 mm after 52 and 77 min; 7.9 mm after90 min).
Fermented samples (ca. 15.0 g, accurately weighed) of the differentdoughs were transferred to ultracentrifuge tubes (38 mL thick polycar-bonate tubes, Beckman Coulter, Brea, CA, USA), centrifuged (165,000 g,20 °C, 60 min) (L7 Ultracentrifuge, Beckman Coulter), and directlyplaced on ice to minimize potential endogenous enzymatic activity. Thesupernatants, i.e. the DLs, were collected in tared amber-colored Falcontubes, weighed, freeze-dried, and stored at −18 °C until analysis. Thesefreeze-dried wheat, rye, and oat DL powders were used for analysisof composition (see section 2.2.3). For all other analyses, freeze-driedDL powders were dissolved (continuous stirring, 30 min, 23 ± 2 °C) indeionized water at various protein concentrations (depending on theanalysis) as outlined below, and are further referred to as ‘controlwheat, rye, and oat DLs’ (Fig. 1).
2.2.3. Analysis of dough liquor compositionThe compositions of the different freeze-dried DL powders were de-
termined as in Janssen et al. (2018). Protein, lipid, AX, and β-D-glu-can levels were determined in duplicate on DLs from each of two sepa-rate isolations.
DL protein (N x 6.25) content was determined with an adaptation ofAOAC method 990.03 to an automated 1108 Elemental Analyser (CarloErba, Hindley Green, UK) for microgram scale samples.
DL total AX and β-D-glucan levels were determined with the sameprocedures as described in section 2.2.1 for the different flours. Wheat(Loosveld et al., 1997) and rye (Van den Bulck et al., 2005) DLAX levels were again corrected for the presence of arabinose originatingfrom arabinogalactan peptides.
DL total lipid levels were determined following the extraction pro-tocol of Bligh and Dyer (1959). Chloroform (2.0 mL), methanol(2.0 mL), and milli-Q water (1.8 mL) were sequentially added to a10 mL glass tube (weight range: 17,000 to 19,000 mg) containing about250 mg accurately weighed freeze-dried DL powder. The samples werestirred using a vortex mixer after the addition of each solvent. Centrifu-gation (500 g, 20 min, 23 ± 2 °C) yielded three phases: a lower chlo-roform phase containing mostly lipids, a middle phase containing theremaining DL material, and an upper methanol-water phase containingimpurities. The upper phase was discarded and the lower phase col-lected. The middle phase was extracted twice more with chloroform,methanol, and milli-Q water. The three chloroform phases were com-bined, the solvent was evaporated and lipid levels were gravimetricallydetermined using a properly calibrated XA105DU Mettler Toledo bal-ance (Zaventem, Belgium), which has a readability of 0.01 mg.
2.2.4. Enzymatic hydrolysis of dough liquor non-starch polysaccharidesFor foaming (see section 2.2.6), bulk shear (see section 2.2.7), and
A-W interface (see section 2.2.8) measurements, analyses were carriedout on control and, hereafter so-called ‘enzyme-treated’ (Fig. 1) DLs atconcentrations of 5.00 or 1.50 mg protein/mL. Enzymatic treatments ofwheat, rye, and oat DLs were as follows. Freeze-dried wheat and rye DLpowders (see section 2.2.2) were dissolved at concentrations of 5.00 or1.50 mg protein/mL in deionized water. Xylanase solution (containing1.0 mL of xylanase preparation in 100 mL water) was added under gen-tle stirring to obtain a ratio of xylanase solution/DL dm protein of 2/
3
UNCO
RREC
TED
PROO
F
F. Janssen et al. Food Hydrocolloids xxx (xxxx) xxx-xxx
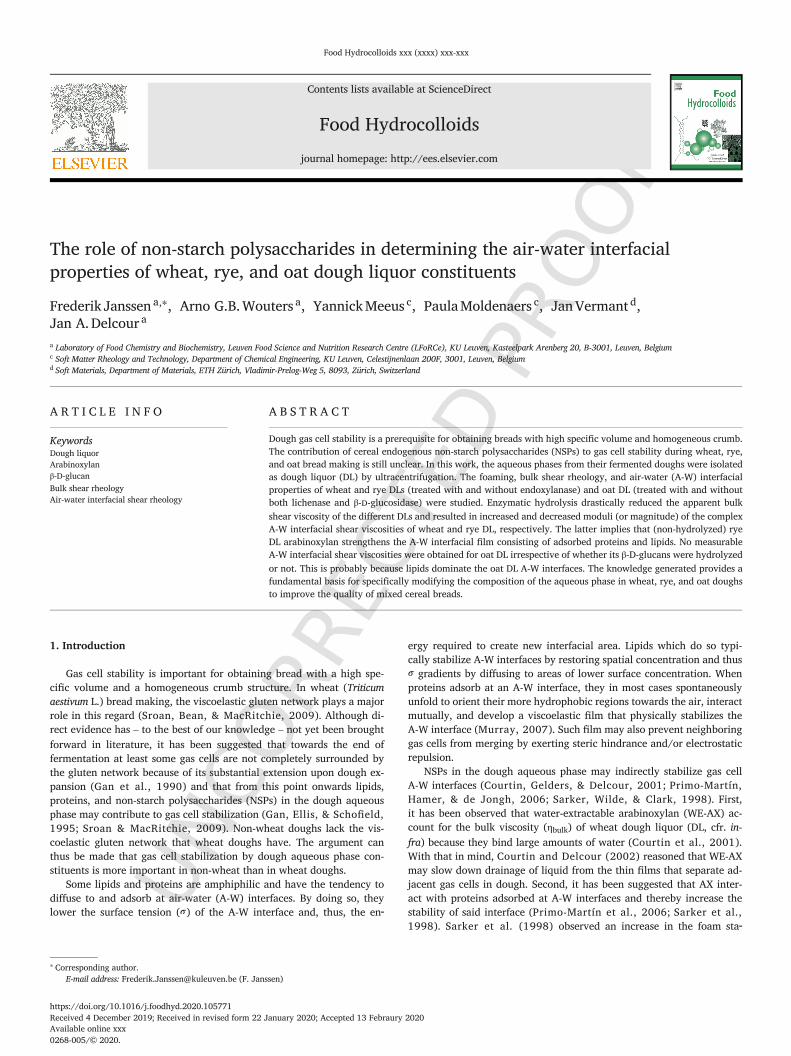
Fig. 1. Overview of the different dough liquor (DL) preparations. Wheat, rye, and oat DLs were isolated from fermented doughs by ultracentrifugation and freeze-dried. The freeze-driedDL powders were then dissolved in water at 5.00 or 1.50 mg protein/mL and are referred to as ‘control wheat, rye, and oat DLs’. Control wheat and rye DLs were treated with a xylanasewhich specifically hydrolyzes the water-extractable arabinoxylan (WE-AX) population. These DLs are referred to as ‘enzyme-treated wheat and rye DLs’. Control oat DLs were treated withboth lichenase and β-glucosidase solutions to break down the β-D-glucan population into glucose molecules. These DLs are referred to as ‘enzyme-treated oat DLs’. To assess the extent towhich the ability of NSPs to improve interfacial stability depends on the presence of lipids at the A-W interface, wheat, rye, and oat DL powders were defatted prior to enzymatic treatment.Wheat and rye DL powders defatted according to the protocol of Bligh and Dyer (1959), freeze-dried, and dissolved in water at 1.50 mg protein/mL are referred to as ‘defatted wheatand rye DLs’. Oat DL powder defatted with hexane, freeze-dried, and dissolved in water at 1.50 mg protein/mL is referred to as ‘defatted oat DL’. Defatted wheat and rye DLs were againtreated with xylanase, while defatted oat DL was treated with both lichenase and β-glucosidase. These DLs are referred to as ‘defatted + enzyme-treated wheat, rye, and oat DLs’.
1 (v/w). For example, 1.0 mL enzyme-treated wheat DL at a concen-tration of 5.00 mg dm protein/mL was prepared from 29.59 mg dmwheat DL (Table 1), 0.990 ml water, and 0.010 ml xylanase solution.Freeze-dried control oat DL powder was also dissolved as described insection 2.2.2 at concentrations of 5.00 or 1.50 mg protein/mL. Then,a solution of both lichenase and β-d-glucosidase (containing 0.50 mlof both the lichenase and β-d-glucosidase preparations in 100 mL wa-ter) was added under gentle stirring to obtain ratios of enzyme so-lution/DL dm protein of 1/1 (v/w) for each of the enzymes present.For example, 1.0 mL enzyme-treated oat DL solution at a concentration
of 5.00 mg dm protein/mL was prepared from 64.10 mg dm oat DL(Table 1), 0.990 ml water, 0.005 ml lichenase solution, and 0.005 mlβ-d-glucosidase solution. The above approaches were scaled to the sam-ple volumes necessary for measuring foaming properties (50.0 mL), bulkshear rheometry (4.0 mL), and analysis by maximum bubble pressuretensiometry (5.0 mL), pendant drop tensiometry (1.0 mL), and interfa-cial shear rheometry (18.8 mL).
When dissolved in water at the same concentrations as used in theabove outlined enzyme-treated DL solutions – no decrease in , as mea-sured with the pendant drop method (see section 2.2.8.1), was ob
Table 1aIsolation yield [% of dough dry matter (dm)] as well as chemical composition [% of dm] of dough liquor (DL) isolated from fermented wheat, rye, and oat doughs. Column values with thesame capital letter are not significantly different (α = 0.05). Error values represent the deviation from the mean for at least duplicate measurements of at least two separate DL isolationexperiments.
Isolation yield (% of dm)Arabinoxylan (AX) level(% of dm) β-D-glucan level (% of dm) Lipid level (% of dm) Protein level (% of dm)
WheatDL
3.4 ± 0.4 A 9.0 ± 0.1 A 0.6 ± 0.1 A 0.5 ± 0.0 A 16.9 ± 0.4 A
Rye DL 10.4 ± 0.8 B 15.1 ± 0.2 B 4.4 ± 0.4 B 1.5 ± 0.1 B 14.0 ± 0.7 AOat DL 4.0 ± 0.2 C 2.9 ± 0.1 C 11.9 ± 0.6 C 30.2 ± 0.5 C 7.8 ± 0.3 B
Table 1bdm, protein, lipid, arabinoxylan (AX), and β-D-glucan concentration and protein/lipid ratio (on mass basis) of wheat, rye, and oat dough liquors (DL) (all at 5.00 mg protein/mL).
dm (mg/mL) AX (mg/mL) β-glucan (mg/mL) Lipids (mg/mL) Proteins (mg/mL) Protein/lipid ratio (−)
Wheat DL 29.59 2.66 0.18 0.15 5.00 35.71Rye DL 35.71 5.39 1.57 0.54 5.00 9.62Oat DL 64.10 1.86 7.63 18.97 5.00 0.26
4
UNCO
RREC
TED
PROO
F
F. Janssen et al. Food Hydrocolloids xxx (xxxx) xxx-xxx
served. At the concentrations tested, the enzymes therefore did not in-terfere with the A-W interface measurements as outlined below (see sec-tion 2.2.8).
For bulk shear rheometry measurements (see section 2.2.7), analy-ses were also carried out on control and enzyme-treated DLs at concen-trations corresponding to those in the supernatant after centrifugationin the DL isolation protocol (see section 2.2.2) (40.1 mg protein/mL DLfor wheat, 29.1 mg protein/mL DL for rye, and 7.0 mg protein/mL DLfor oat). DLs at these concentrations are further referred to as ‘controland enzyme-treated DLs at their native concentrations’. The respectiveenzymatic treatment of control DLs at their native concentrations was asabove with the exception that the ratio of total enzyme solution/DL dmprotein was 10/1 (v/w) instead of 2/1 (v/w). The sample volumes re-quired for interfacial shear rheometry were 1.0 ml (parallel-plate geom-etry) and 4.0 ml (double-wall Couette geometry).
2.2.5. Defatting of dough liquorFreeze-dried wheat and rye DL powders were defatted as in Janssen,
Wouters et al. (submitted for publication) with an extraction proto-col similar to that of Bligh and Dyer (1959) (see section 2.2.3). Af-ter three extractions, the combined methanol/water phases were addedback to the middle phase to prevent loss of protein material from the DLsand the solvent was evaporated with a rotational vacuum concentrator(Q-lab, Vilvoorde, Belgium) at 40 °C and 2 mbar. The middle phase wasthen freeze-dried, ground, and stored at −18 °C until analysis.
Freeze-dried oat DL powder was defatted as in Janssen, Wouterset al. (submitted for publication) with hexane. Hexane (5.0 mL) wasadded to 250 mg of freeze-dried oat DL powder. The suspension wasmechanically shaken [175 movements per min, 30 min, room tempera-ture] and centrifuged (2000 g, 15 min). The supernatant was discardedand the extraction repeated twice more. The remaining DL material wasfreeze-dried, ground, and stored at −18 °C until analysis.
Each of the two defatting procedures were performed in six-fold onDL powders from each of two separate isolations. Protein levels of thesedefatted and freeze-dried wheat, rye, and oat DL powders were deter-mined as described in section 2.2.3. Defatted and freeze-dried wheat,rye, and oat DL powders were dissolved in deionized water at variousprotein concentrations as described in section 2.2.2 and are further re-ferred to as ‘defatted wheat, rye, and oat DLs’ (Fig. 1).
To assess the extent to which the ability of NSPs to affect interfacialstability depends on the presence of lipids at the A-W interface, defattedwheat, rye, and oat DLs were subjected to the same enzymatic treatmentdescribed in section 2.2.4 for control wheat, rye, and oat DLs. The re-sulting defatted and enzyme-treated wheat, rye, and oat DLs are furtherreferred to as ‘defatted + enzyme-treated wheat, rye, and oat DLs’ (Fig.1).
2.2.6. Analysis of dough liquor foaming propertiesA whipping test was carried out to determine foaming characteristics
of control and enzyme-treated wheat, rye, and oat DLs at 5.00 mg pro-tein/mL as in Janssen et al. (2018). DL aliquots (50.0 mL) in a gradu-ated glass cylinder (internal diameter: 60 mm) were stirred for 130 s at2k rotations/min using a rotating propeller (outer diameter: 45.0 mm,thickness: 0.4 mm) fixed on a cylindrical bar (diameter: 6.0 mm) in awater bath at 30 °C. Immediately after stirring, the propeller was re-moved and the glass cylinder covered with Parafilm M (Bemis, Neenah,WI, USA) to minimize foam disruption by air circulation. The foamingcapacity is the foam volume 180 s after the start of stirring. The foamvolume was calculated from its height and the internal diameter of thecylinder and monitored over a 60 min period. The rate and extent of thedecline of the foam volume over time is a measure for foam stability.Foaming properties were single measurements on DLs from each of threeseparate isolations.
2.2.7. Dough liquor bulk shear rheometryThe bulk shear rheological parameters were monitored with a
stress-controlled rheometer (MCR501, Anton Paar, Graz, Austria). Thesteady state bulk shear viscosities of control wheat, rye, and oat DLsat their native concentrations (40.1, 29.1, and 7.0 mg protein/mL, re-spectively) were measured as function of shear rate (logarithmic sweepbetween 0.1 and 100 s−1, 5 measurement points per decade) using aparallel-plate geometry (diameter: 25.0 mm, gap size: 1.0 mm). A sol-vent trap was used to prevent dehydration. Samples were allowed to rest2 min prior to performing measurements.
Both for samples which had been submitted to enzymatic hydrolysisof NSPs and at lower DL concentrations, the parallel-plate geometry wasnot suited for bulk shear rheometry measurements. Instead, the steadystate bulk shear viscosities of enzyme-treated wheat, rye, and oat DLsat their native concentrations and those of control and enzyme-treatedwheat, rye, and oat DLs (all at 1.50 mg protein/mL) were measured asfunction of shear rate (logarithmic sweep between 1 and 1000 s−1, 5measurement points per decade) with a double-wall Couette geometry(DG26.7, inner radius: 12.33 mm, outer radius: 13.33 mm, bob length:40.00 mm). A 4.0 mL aliquot was gently transferred to the double wallsample holder. Samples were again allowed to rest for 2 min prior toperforming measurements.
In both experimental setups, the temperature (21 °C) was kept con-stant using a Peltier heating element. A minimum torque limit of0.1 μN m was used to obtain reliable data. Bulk shear rheological prop-erties were single measurements on DLs from each of two separate iso-lations.
2.2.8. Analysis of dough liquor air-water interfacial propertiesThe surface stress in the principal direction n of rheologically
complex A-W interfaces such as those of gas cells in bread dough is com-posed of surface tension [ (Γ, T), which only depends on the excessconcentration Γ and the temperature T] and surface extra stress (contributions (Jaensson & Vermant, 2018):
These contributions are not separated in pendant drop tensiometrymeasurements (section 2.2.8.1). Thus, when τnn is not negligible, whichis the case for the A-W interfaces studied here, the parameters obtainedwith each of these methods in fact represents rather than (Γ, T).However, obtained values over time yield information about the diffu-sion and adsorption of DL constituents at A-W interfaces. Shear rheome-try measurements (section 2.2.8.2) provide information about the mag-nitude of τ of the film formed at the A-W interface.2.2.8.1. (Oscillating) pendant drop tensiometry The decrease of overtime was measured at ambient temperature (23 ± 2 °C) using a Thetaoptical tensiometer (Attension, Biolin Scientific, Stockholm, Sweden) asin Janssen et al. (2018). Control and enzyme-treated wheat, rye, andoat DLs (all at 5.00 mg protein/mL) were introduced in the device tocreate a pendant drop with a fixed volume (8.0 μl). The was mon-itored over 15 min (with 1.4 frames recorded/s in the first 5 min and0.14 frames recorded/s in the last 10 min). Immediately afterwards, thedroplet was sinusoidally oscillated (volume amplitude of approximately1.0 μl or 12.5% of droplet volume) at 0.8 Hz (with 6.9 frames recorded/sec) for 10 cycles. The magnitude of of the film formed at the A-Winterface was calculated by drop shape analysis and Fourier transforma-tions and represents the change in relative to the change in the nat-ural logarithm of the surface area A:
5
UNCO
RREC
TED
PROO
F
F. Janssen et al. Food Hydrocolloids xxx (xxxx) xxx-xxx
After each measurement, the device was thoroughly cleaned and ofpure water was verified to be 72.0 ± 0.50 mN/m as above before ini-tiating a new measurement. All pendant drop measurements were per-formed in duplicate on DLs from each of two separate isolations.2.2.8.2. Stress-controlled interfacial shear rheometry The linear viscoelas-tic rheological material functions of DL stabilized A-W interfaces weremeasured in simple shear deformations with a stress-controlled rheome-ter (Discovery HR-3, TA Instruments, New Castle, DE, USA) equippedwith the platinum double wall ring (DWR) geometry from TA Instru-ments. The DWR had the following dimensions: inner radius: 34.50 mm,outer radius: 35.50 mm, ring width: 1.00 mm. Aliquots (18.80 mL) ofcontrol, enzyme-treated, defatted, and defatted + enzyme-treatedwheat, rye, and oat DLs at 1.50 mg protein/mL were gently transferredto a double wall Teflon sample holder. In this set up, DL surface-ac-tive constituents spontaneously adsorbed at the A-W interface. Timesweeps were performed at 21 °C for 126 min (i.e. the total fermentationtime during the bread making protocol) at an oscillation frequency of3.14 rad/s or 0.50 Hz and a surface shear stress amplitude of 16.23 μN/m, which was within the linear viscoelastic regime for all DLs (see sup-plementary information). Oscillatory frequency sweeps (0.50–5.00 Hz)revealed that the obtained moduli increased linearly with the appliedfrequency. The oscillation frequency was thus relevant. Boussinesq (Bq)numbers were calculated to evaluate to which extent the bulk phase vis-cosity influenced the A-W interfacial viscosity measurements (Renggli,Alicke, Ewoldt, & Vermant, 2020). They were calculated with themagnitude of the initial modulus of the complex surface shear viscos-ity (|ηs*|) after positioning the ring at the A-W interface. As Bq num-bers were lower than 100, the components of |ηs*| were corrected usingan iterative solver to take into account the coupling of the flow in thesubphase with the A-W interface (Vandebril, Franck, Fuller, Molde-naers, & Vermant, 2010). This was essential to obtain the exact de-formation profile and shear rates at the A-W interface. The steady statebulk phase shear viscosities of control, enzyme-treated, defatted, and de-fatted + enzyme-treated wheat, rye, and oat DLs at 1.50 mg protein/mLwere monitored at 21 °C as described in section 2.2.7. Thus, the magni-tude of |η*s| in Fig. 5, 6, and 7 and of the phase angle (δs) in the Figuresin the supplementary information were calculated taking the subphasecoupling into account. The |η*s| can also be decomposed in an elasticpart (η″s, which is out of phase with the deformation rate) and a viscouspart (η′s, which is in phase with the deformation rate). A-W interfacialshear rheology experiments were single (defatted and defatted + en-zyme-treated DLs) or duplicate (control and enzyme-treated DLs) mea-surements on DLs from each of two separate isolations.
2.2.9. Statistical analysesData were analyzed with statistical software JMP pro 12 (SAS Insti-
tute, Cary, NC, USA). Significant differences, at a significance level ofα = 0.05, were identified using one-way analysis of variance combinedwith the post-hoc Tukey's honest significant difference (HSD) test.
3. Results and discussion
3.1. Dough liquor composition
Table 1a lists isolation yields as well as AX, β-D-glucan, lipid, andprotein levels of wheat, rye, and oat DLs. The isolation yield of DLs (ex-pressed as percentage of dough dm) decreased in the order rye (10.4%of dm), oat (4.0% of dm), and wheat (3.4% of dm) DLs. AX was themajor NSP in wheat and rye DLs (9.0 and 15.1% of DL dm, respec-tively) and β-D-glucan that in oat DL (11.9% of DL dm). The level ofAX was higher in rye than in wheat DL probably because of the higherlevel of WE-AX in rye (1.2% of dm) than in wheat (0.4% of dm) flour(see section 2.1.2). Lipid levels were high in oat (30.2% of DL dm)
DL and much lower in rye (1.5% of DL dm) and wheat (0.5% of DL dm)DLs. The protein content decreased in the order wheat (16.9% of DLdm), rye (14.0% of DL dm), and oat (7.8% of DL dm) DLs.
In what follows, the foaming properties, bulk shear rheology, andA-W interfacial properties of control and enzyme-treated wheat, rye, andoat DLs are documented. DLs were analyzed in solutions at their nativeconcentrations (bulk shear rheometry), at 5.00 mg protein/mL (foamingproperties and pendant drop tensiometry), and at 1.50 mg protein/mL(both bulk and interfacial shear rheometry). Because the freeze-dried DLpowders had different protein levels (Table 1a), such standardizationof course had consequences for the concentrations of the other DL con-stituents. Table 1b lists the AX, β-D-glucan, lipid, and protein concen-trations and protein/lipid ratios (on a mass basis) of the different controlDLs at 5.00 mg protein/mL.
3.2. Dough liquor foaming properties
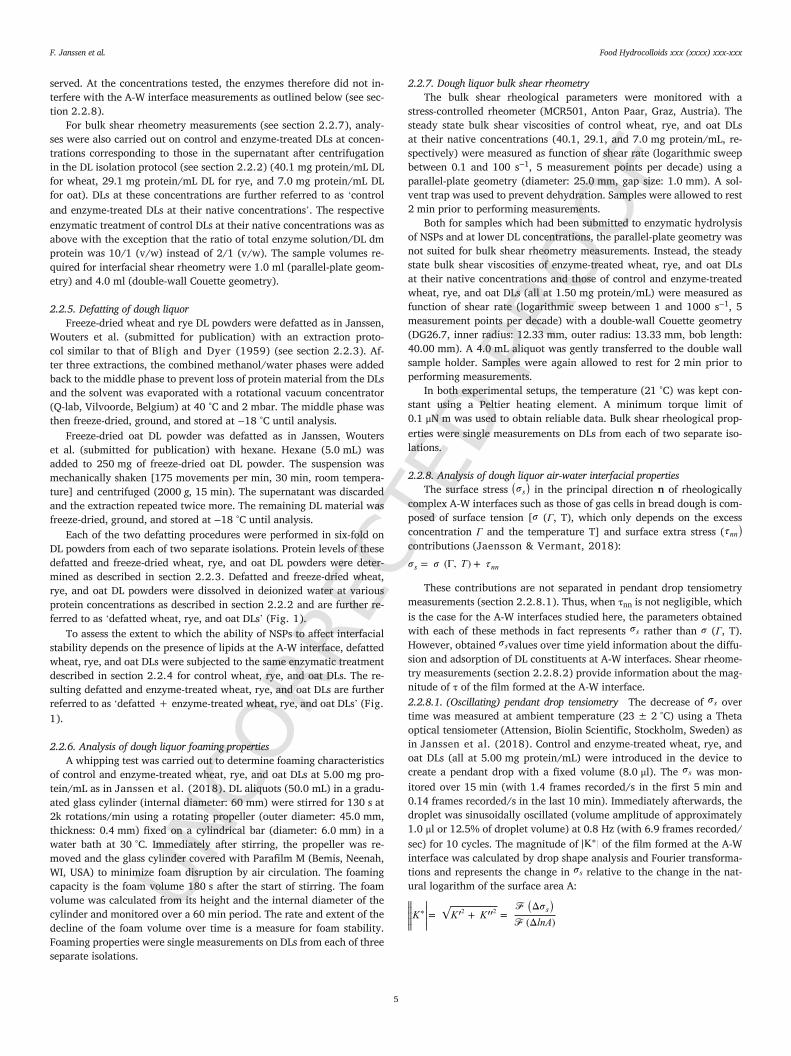
Fig. 2 shows foam volume over time plots of control and en-zyme-treated wheat, rye, and oat DLs (all at 5.00 mg protein/mL).Constituents in enzyme-treated wheat and rye DLs had a significantly(P < 0.05) lower foaming capacity than those in their respective con-trol DLs. Foam from enzyme-treated wheat DL disappeared within 5 minafter the start of stirring (Fig. 2). Similarly, only 17% of the foam re-mained after 60 min for enzyme-treated rye DL compared to 31% forcontrol rye DL (Fig. 2). Foam could not be produced from control oatDL (at 5.00 mg protein/mL) due to its very high apparent viscosity. Thisissue was overcome by enzymatic hydrolysis of oat DL β-D-glucan. Al-though enzyme-treated oat DLs (all at 5.00 mg protein/mL) produced alow initial foam volume of 23 mL, the foams were rather stable, with64% of the foam remaining after 60 min (Fig. 2). At 2.50 mg protein/mL (graphs not shown), the constituents in enzyme-treated oat DL hada significantly (P < 0.05) lower foaming capacity than those in controloat DL, which was in line with what was observed for wheat and ryeDLs. The stabilities of control and enzyme-treated oat DLs at 2.50 mgprotein/mL were roughly similar, with 67% and 75%, respectively, ofthe foam remaining after 60 min.
Thus, hydrolysis of wheat and rye DL AX had an overall negative im-pact on the foaming capacity of the obtained foams. A similar but lesspronounced effect was observed for foams from oat DLs treated withlichenase and β-d-glucosidase. The data thus demonstrate that NSPs con-tribute to the foaming properties of DL. This can probably be explainedby differences in ηbulk and/or the structure and stability of the adsorbedA-W interfacial film surrounding the gas cells.
3.3. Dough liquor bulk shear rheometry
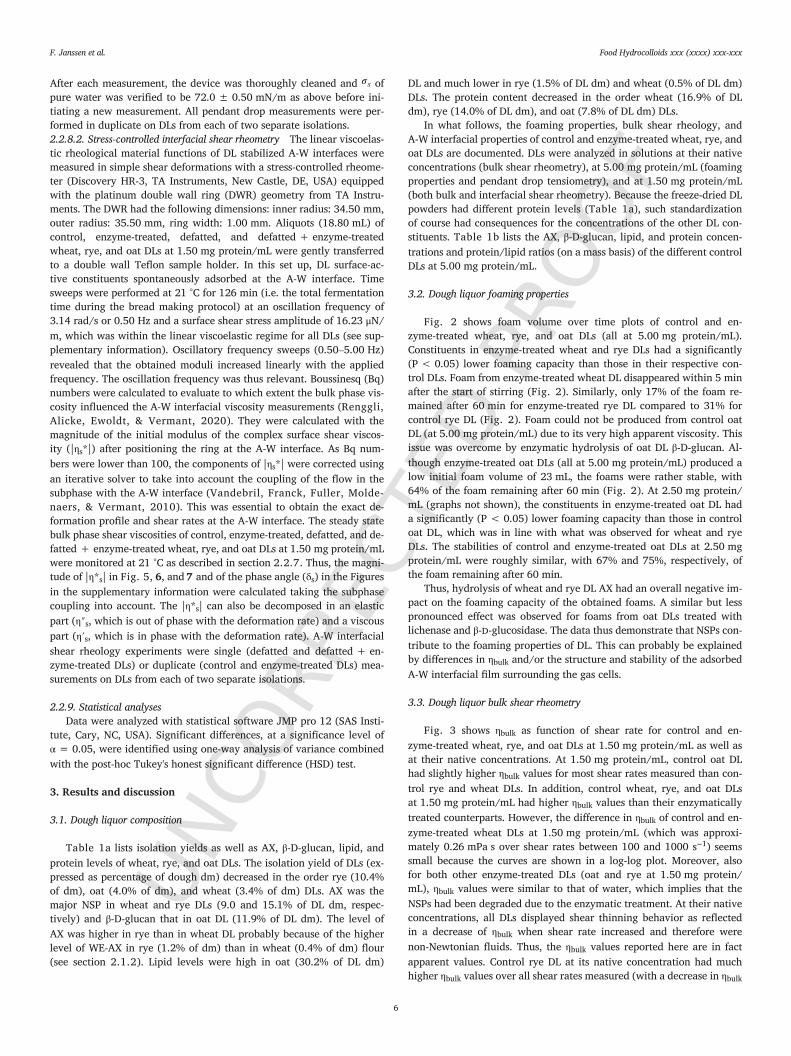
Fig. 3 shows ηbulk as function of shear rate for control and en-zyme-treated wheat, rye, and oat DLs at 1.50 mg protein/mL as well asat their native concentrations. At 1.50 mg protein/mL, control oat DLhad slightly higher ηbulk values for most shear rates measured than con-trol rye and wheat DLs. In addition, control wheat, rye, and oat DLsat 1.50 mg protein/mL had higher ηbulk values than their enzymaticallytreated counterparts. However, the difference in ηbulk of control and en-zyme-treated wheat DLs at 1.50 mg protein/mL (which was approxi-mately 0.26 mPa s over shear rates between 100 and 1000 s−1) seemssmall because the curves are shown in a log-log plot. Moreover, alsofor both other enzyme-treated DLs (oat and rye at 1.50 mg protein/mL), ηbulk values were similar to that of water, which implies that theNSPs had been degraded due to the enzymatic treatment. At their nativeconcentrations, all DLs displayed shear thinning behavior as reflectedin a decrease of ηbulk when shear rate increased and therefore werenon-Newtonian fluids. Thus, the ηbulk values reported here are in factapparent values. Control rye DL at its native concentration had muchhigher ηbulk values over all shear rates measured (with a decrease in ηbulk
6
UNCO
RREC
TED
PROO
F
F. Janssen et al. Food Hydrocolloids xxx (xxxx) xxx-xxx
Fig. 2. Foam volume over time plots of control and enzyme-treated wheat (green squares), rye (blue triangles), and oat (yellow diamonds) dough liquors (DLs) (all at 5.00 mg protein/mL),as measured with a standardized whipping test. Error values represent the deviation from the mean for single measurements of each of three separate DL isolations. (For interpretation ofthe references to color in this figure legend, the reader is referred to the Web version of this article.)
from 631,272 mPa s at 0.1 s−1 to 5511 mPa s at 100 s−1) than controloat (with a decrease in ηbulk from 31,100 mPa s at 0.1 s−1 to 769 mPa sat 100 s−1) and control wheat (with a decrease in ηbulk from 677 mPa sat 0.1 s−1 to 202 mPa s at 100 s−1) DLs at their native concentrations.Similar to what was the case at 1.50 mg protein/mL, the ηbulk valuesof control wheat, rye, and oat DLs at their native concentrations weresignificantly (P < 0.05) higher than those of their enzymatically treatedcounterparts. Indeed, at shear rates of 0.1 and 100 s−1, enzyme-treatedwheat, rye, and oat DLs at their native concentrations had ηbulk val-ues of 252 and 6 mPa s, 18,460 and 274 mPa s, and 16 and 2 mPa s,respectively. Thus, both at 1.50 mg protein/mL as well as at their na-tive concentrations, enzymatic hydrolysis of AX in control wheat andrye DLs and of β-D-glucan in control oat DL sufficed to substantially re-duce ηbulk of their respective enzyme-treated DLs. In what follows, theterm ‘non-hydrolyzed AX’ refers to the AX population present in controlwheat and rye DLs and thus to the AX population prior to enzymatic hy-drolysis.
The above showed that NSPs contribute substantially to ηbulk ofwheat, rye, and oat DLs and, hence, probably also to ηbulk of the aque-ous phase in their respective doughs. It is therefore highly likely thatNSPs slow down drainage of liquid from the aqueous film separating ad-jacent gas cells and provide resistance to coalescence. This phenomenonis probably more important in non-wheat than in wheat doughs as it canbe expected that drainage of the dough aqueous phase in between gascells occurs much slower in wheat doughs due to the high viscoelasticityof the gluten network (Mills, Wilde, Salt, & Skeggs, 2003; Pauly &Delcour, 2018).
3.4. Dough liquor air-water interfacial properties
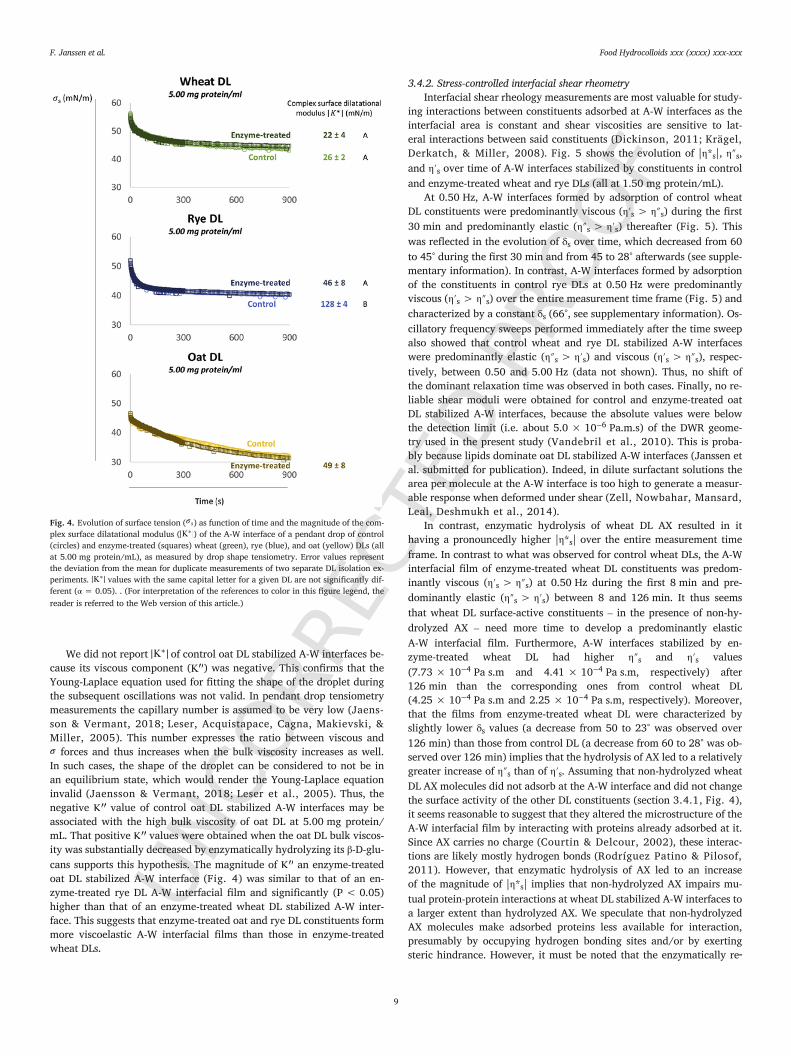
3.4.1. (Oscillating) pendant drop tensiometryFig. 4 shows over time plots and values of pendant droplet
A-W interfaces stabilized by control and enzyme-treated wheat, rye,and oat DL constituents (all at 5.00 mg protein/mL). The decrease in
of control oat DL stabilized A-W interfaces was much more pro
7
UNCO
RREC
TED
PROO
F
F. Janssen et al. Food Hydrocolloids xxx (xxxx) xxx-xxx
Fig. 3. Bulk viscosity (ηbulk) as function of shear rate of control and enzyme-treated wheat (green squares), rye (blue triangles), and oat (yellow diamonds) dough liquors (DLs) at 1.50 mgprotein/mL (left) and at the concentration corresponding to those found in the respective supernatant after ultracentrifugation (right), as measured with a stress-controlled rheometer.Error values represent the deviation from the mean for single measurements of two separate DL isolations. (For interpretation of the references to color in this figure legend, the reader isreferred to the Web version of this article.)
nounced than was the case for control wheat or rye DL stabilized A-W in-terfaces. This can be because lipids are the predominant DL constituentat oat DL A-W interfaces (Janssen et al. submitted for publication). En-zymatic hydrolysis of wheat or rye DL AX or of oat DL β-D-glucan had noimpact on the vs. time plots. Indeed, the molecular structures of AXand β-D-glucan are hydrophilic. Thus, they will most likely not adsorbat interfaces. In addition, the molecular weights of non-hydrolyzed AXand β-D-glucan are much higher than those of proteins and lipids. Thus,even if they would adsorb at interfaces, the rate at which they diffuse tothe interface would be much lower than that of proteins and lipids. Allthis implies that non-hydrolyzed AX and β-D-glucan molecules did notadsorb at the A-W interface themselves, but also that they did not influ-ence the diffusion and adsorption behavior of other DL constituents.
After 15 min, pendant droplets were subjected to sinusoidal volumeoscillations from which the magnitude of , a measure for the ef-fective viscoelasticity of the adsorbed film, was calculated (see section2.2.8.1). High values indicate that a strong elastic response is ob-tained, which can often be related to high foam stability as it delaysgas cell coalescence and disproportionation (Murray, 2007). In gen-eral, values obtained for DL stabilized A-W interfaces should be in
terpreted with care as the pendant drop technique was originally de-veloped for A-W interfaces characterized by an isotropic , in absenceof extra or deviatoric viscoelastic contributions (Jaensson & Vermant,2018). In such case a more elaborate analysis is required (Knoche etal., 2013; Nagel, Tervoort, & Vermant, 2017). As we will show insection 3.4.2, this was certainly not the case for the control and en-zyme-treated wheat and rye DL stabilized A-W interfaces.
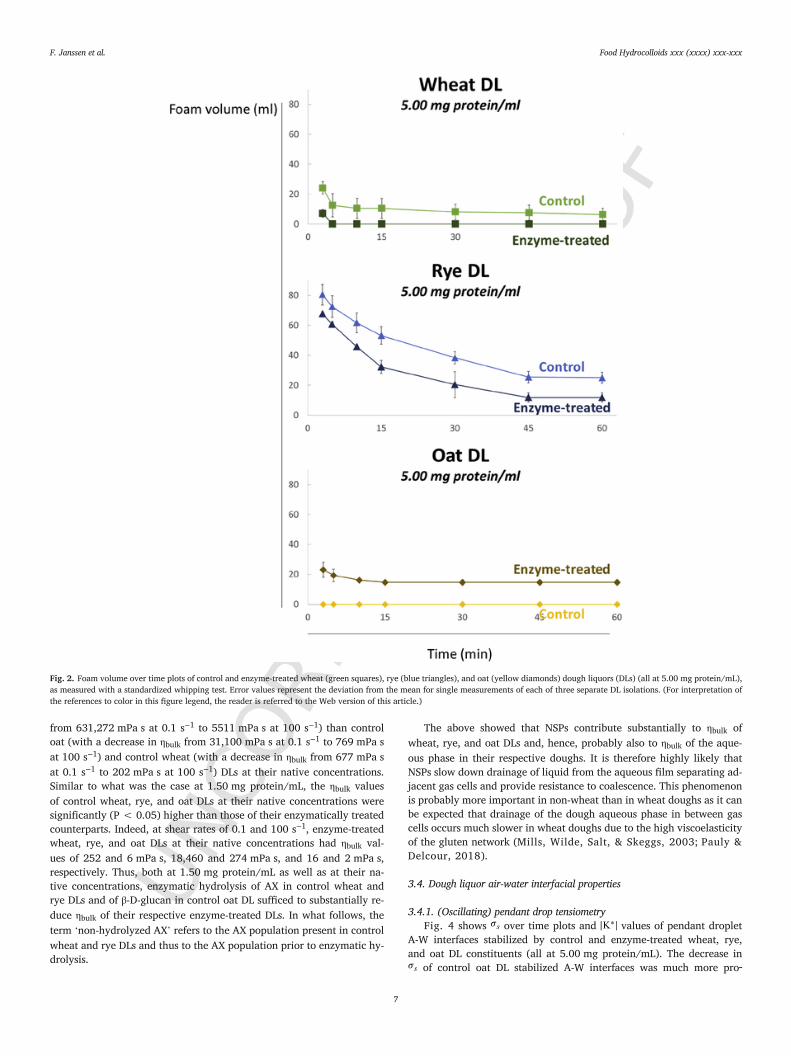
Fig. 4 shows that the magnitude of of control rye DL stabilizedA-W interfaces (128 mN/m) was significantly (P < 0.05) higher thanthat of control wheat DL stabilized A-W interfaces (26 mN/m). This im-plies that the film formed at control rye DL stabilized A-W interfaceswas effectively more viscoelastic than the A-W interfacial film formedby control wheat DL constituents. While the values of control andenzyme-treated wheat DL stabilized A-W interfaces were similar,of an enzyme-treated rye DL stabilized A-W interface (46 mN/m) wasmuch lower than that of A-W interfaces stabilized by control rye DLconstituents (128 mN/m). This implies that non-hydrolyzed rye DL AXmolecules increase the viscoelasticity and thus the strength of the ad-sorbed film to a greater extent than their enzymatically released hydrol-ysis products.
8
UNCO
RREC
TED
PROO
F
F. Janssen et al. Food Hydrocolloids xxx (xxxx) xxx-xxx
Fig. 4. Evolution of surface tension ( ) as function of time and the magnitude of the com-plex surface dilatational modulus ( ) of the A-W interface of a pendant drop of control(circles) and enzyme-treated (squares) wheat (green), rye (blue), and oat (yellow) DLs (allat 5.00 mg protein/mL), as measured by drop shape tensiometry. Error values representthe deviation from the mean for duplicate measurements of two separate DL isolation ex-periments. values with the same capital letter for a given DL are not significantly dif-ferent (α = 0.05). . (For interpretation of the references to color in this figure legend, thereader is referred to the Web version of this article.)
We did not report of control oat DL stabilized A-W interfaces be-cause its viscous component ( ) was negative. This confirms that theYoung-Laplace equation used for fitting the shape of the droplet duringthe subsequent oscillations was not valid. In pendant drop tensiometrymeasurements the capillary number is assumed to be very low (Jaens-son & Vermant, 2018; Leser, Acquistapace, Cagna, Makievski, &Miller, 2005). This number expresses the ratio between viscous and
forces and thus increases when the bulk viscosity increases as well.In such cases, the shape of the droplet can be considered to not be inan equilibrium state, which would render the Young-Laplace equationinvalid (Jaensson & Vermant, 2018; Leser et al., 2005). Thus, thenegative value of control oat DL stabilized A-W interfaces may beassociated with the high bulk viscosity of oat DL at 5.00 mg protein/mL. That positive values were obtained when the oat DL bulk viscos-ity was substantially decreased by enzymatically hydrolyzing its β-D-glu-cans supports this hypothesis. The magnitude of an enzyme-treatedoat DL stabilized A-W interface (Fig. 4) was similar to that of an en-zyme-treated rye DL A-W interfacial film and significantly (P < 0.05)higher than that of an enzyme-treated wheat DL stabilized A-W inter-face. This suggests that enzyme-treated oat and rye DL constituents formmore viscoelastic A-W interfacial films than those in enzyme-treatedwheat DLs.
3.4.2. Stress-controlled interfacial shear rheometryInterfacial shear rheology measurements are most valuable for study-
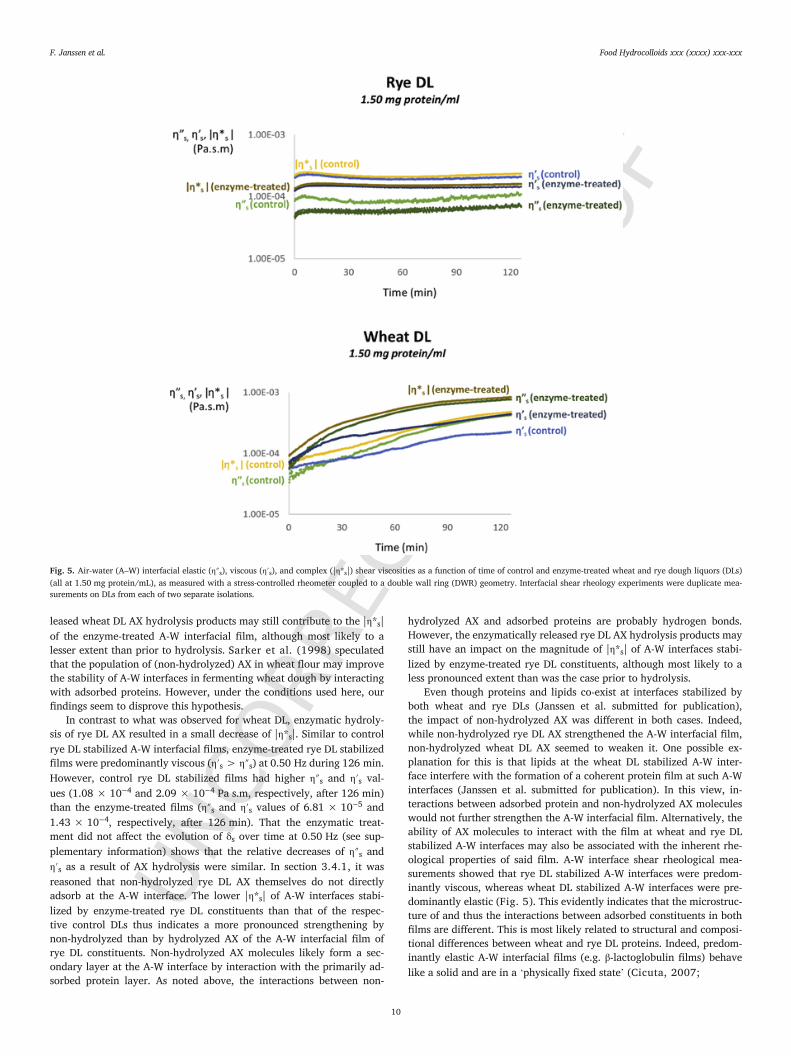
ing interactions between constituents adsorbed at A-W interfaces as theinterfacial area is constant and shear viscosities are sensitive to lat-eral interactions between said constituents (Dickinson, 2011; Krägel,Derkatch, & Miller, 2008). Fig. 5 shows the evolution of |η*s|, η″s,and η′s over time of A-W interfaces stabilized by constituents in controland enzyme-treated wheat and rye DLs (all at 1.50 mg protein/mL).
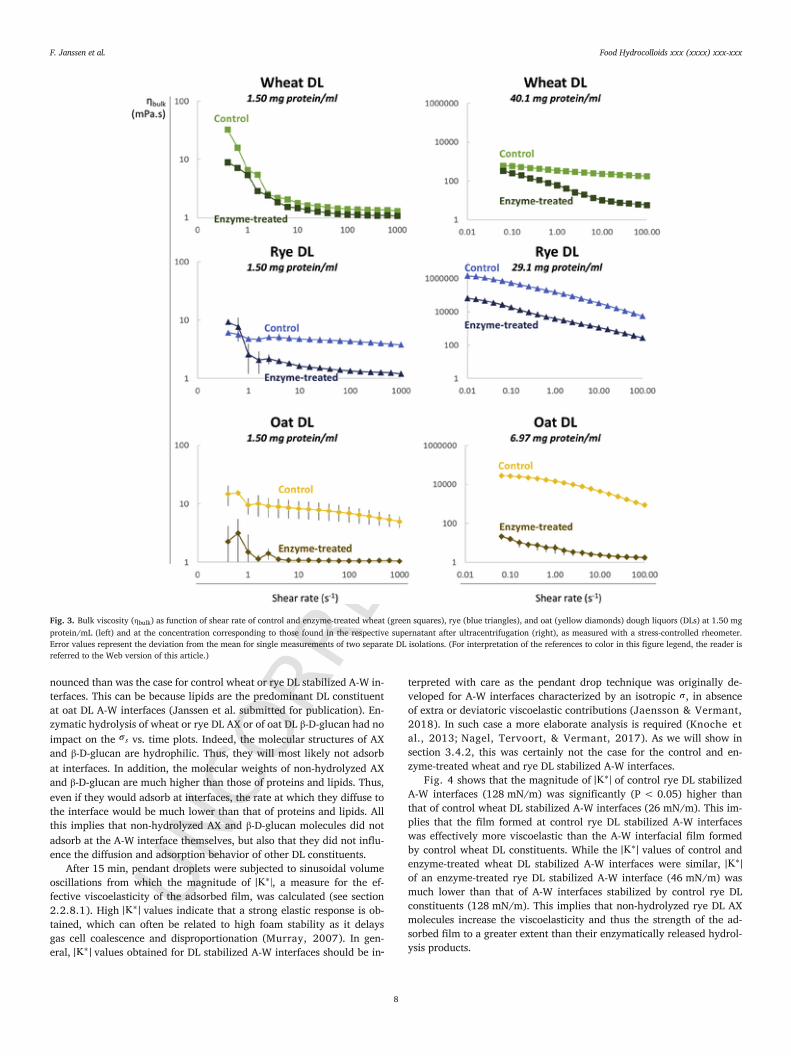
At 0.50 Hz, A-W interfaces formed by adsorption of control wheatDL constituents were predominantly viscous (η′s > η″s) during the first30 min and predominantly elastic (η″s > η′s) thereafter (Fig. 5). Thiswas reflected in the evolution of δs over time, which decreased from 60to 45° during the first 30 min and from 45 to 28° afterwards (see supple-mentary information). In contrast, A-W interfaces formed by adsorptionof the constituents in control rye DLs at 0.50 Hz were predominantlyviscous (η′s > η″s) over the entire measurement time frame (Fig. 5) andcharacterized by a constant δs (66°, see supplementary information). Os-cillatory frequency sweeps performed immediately after the time sweepalso showed that control wheat and rye DL stabilized A-W interfaceswere predominantly elastic (η″s > η′s) and viscous (η′s > η″s), respec-tively, between 0.50 and 5.00 Hz (data not shown). Thus, no shift ofthe dominant relaxation time was observed in both cases. Finally, no re-liable shear moduli were obtained for control and enzyme-treated oatDL stabilized A-W interfaces, because the absolute values were belowthe detection limit (i.e. about 5.0 × 10⁻⁶ Pa.m.s) of the DWR geome-try used in the present study (Vandebril et al., 2010). This is proba-bly because lipids dominate oat DL stabilized A-W interfaces (Janssen etal. submitted for publication). Indeed, in dilute surfactant solutions thearea per molecule at the A-W interface is too high to generate a measur-able response when deformed under shear (Zell, Nowbahar, Mansard,Leal, Deshmukh et al., 2014).
In contrast, enzymatic hydrolysis of wheat DL AX resulted in ithaving a pronouncedly higher |η*s| over the entire measurement timeframe. In contrast to what was observed for control wheat DLs, the A-Winterfacial film of enzyme-treated wheat DL constituents was predom-inantly viscous (η′s > η″s) at 0.50 Hz during the first 8 min and pre-dominantly elastic (η″s > η′s) between 8 and 126 min. It thus seemsthat wheat DL surface-active constituents – in the presence of non-hy-drolyzed AX – need more time to develop a predominantly elasticA-W interfacial film. Furthermore, A-W interfaces stabilized by en-zyme-treated wheat DL had higher η″s and η′s values(7.73 × 10⁻⁴ Pa s.m and 4.41 × 10⁻⁴ Pa s.m, respectively) after126 min than the corresponding ones from control wheat DL(4.25 × 10⁻⁴ Pa s.m and 2.25 × 10⁻⁴ Pa s.m, respectively). Moreover,that the films from enzyme-treated wheat DL were characterized byslightly lower δs values (a decrease from 50 to 23° was observed over126 min) than those from control DL (a decrease from 60 to 28° was ob-served over 126 min) implies that the hydrolysis of AX led to a relativelygreater increase of η″s than of η′s. Assuming that non-hydrolyzed wheatDL AX molecules did not adsorb at the A-W interface and did not changethe surface activity of the other DL constituents (section 3.4.1, Fig. 4),it seems reasonable to suggest that they altered the microstructure of theA-W interfacial film by interacting with proteins already adsorbed at it.Since AX carries no charge (Courtin & Delcour, 2002), these interac-tions are likely mostly hydrogen bonds (Rodríguez Patino & Pilosof,2011). However, that enzymatic hydrolysis of AX led to an increaseof the magnitude of |η*s| implies that non-hydrolyzed AX impairs mu-tual protein-protein interactions at wheat DL stabilized A-W interfaces toa larger extent than hydrolyzed AX. We speculate that non-hydrolyzedAX molecules make adsorbed proteins less available for interaction,presumably by occupying hydrogen bonding sites and/or by exertingsteric hindrance. However, it must be noted that the enzymatically re
9
UNCO
RREC
TED
PROO
F
F. Janssen et al. Food Hydrocolloids xxx (xxxx) xxx-xxx
Fig. 5. Air-water (A–W) interfacial elastic (η″s), viscous (η′s), and complex (|η*s|) shear viscosities as a function of time of control and enzyme-treated wheat and rye dough liquors (DLs)(all at 1.50 mg protein/mL), as measured with a stress-controlled rheometer coupled to a double wall ring (DWR) geometry. Interfacial shear rheology experiments were duplicate mea-surements on DLs from each of two separate isolations.
leased wheat DL AX hydrolysis products may still contribute to the |η*s|of the enzyme-treated A-W interfacial film, although most likely to alesser extent than prior to hydrolysis. Sarker et al. (1998) speculatedthat the population of (non-hydrolyzed) AX in wheat flour may improvethe stability of A-W interfaces in fermenting wheat dough by interactingwith adsorbed proteins. However, under the conditions used here, ourfindings seem to disprove this hypothesis.
In contrast to what was observed for wheat DL, enzymatic hydroly-sis of rye DL AX resulted in a small decrease of |η*s|. Similar to controlrye DL stabilized A-W interfacial films, enzyme-treated rye DL stabilizedfilms were predominantly viscous (η′s > η″s) at 0.50 Hz during 126 min.However, control rye DL stabilized films had higher η″s and η′s val-ues (1.08 × 10⁻⁴ and 2.09 × 10⁻⁴ Pa s.m, respectively, after 126 min)than the enzyme-treated films (η″s and η′s values of 6.81 × 10⁻⁵ and1.43 × 10−4, respectively, after 126 min). That the enzymatic treat-ment did not affect the evolution of δs over time at 0.50 Hz (see sup-plementary information) shows that the relative decreases of η″s andη′s as a result of AX hydrolysis were similar. In section 3.4.1, it wasreasoned that non-hydrolyzed rye DL AX themselves do not directlyadsorb at the A-W interface. The lower |η*s| of A-W interfaces stabi-lized by enzyme-treated rye DL constituents than that of the respec-tive control DLs thus indicates a more pronounced strengthening bynon-hydrolyzed than by hydrolyzed AX of the A-W interfacial film ofrye DL constituents. Non-hydrolyzed AX molecules likely form a sec-ondary layer at the A-W interface by interaction with the primarily ad-sorbed protein layer. As noted above, the interactions between non-
hydrolyzed AX and adsorbed proteins are probably hydrogen bonds.However, the enzymatically released rye DL AX hydrolysis products maystill have an impact on the magnitude of |η*s| of A-W interfaces stabi-lized by enzyme-treated rye DL constituents, although most likely to aless pronounced extent than was the case prior to hydrolysis.
Even though proteins and lipids co-exist at interfaces stabilized byboth wheat and rye DLs (Janssen et al. submitted for publication),the impact of non-hydrolyzed AX was different in both cases. Indeed,while non-hydrolyzed rye DL AX strengthened the A-W interfacial film,non-hydrolyzed wheat DL AX seemed to weaken it. One possible ex-planation for this is that lipids at the wheat DL stabilized A-W inter-face interfere with the formation of a coherent protein film at such A-Winterfaces (Janssen et al. submitted for publication). In this view, in-teractions between adsorbed protein and non-hydrolyzed AX moleculeswould not further strengthen the A-W interfacial film. Alternatively, theability of AX molecules to interact with the film at wheat and rye DLstabilized A-W interfaces may also be associated with the inherent rhe-ological properties of said film. A-W interface shear rheological mea-surements showed that rye DL stabilized A-W interfaces were predom-inantly viscous, whereas wheat DL stabilized A-W interfaces were pre-dominantly elastic (Fig. 5). This evidently indicates that the microstruc-ture of and thus the interactions between adsorbed constituents in bothfilms are different. This is most likely related to structural and composi-tional differences between wheat and rye DL proteins. Indeed, predom-inantly elastic A-W interfacial films (e.g. β-lactoglobulin films) behavelike a solid and are in a ‘physically fixed state’ (Cicuta, 2007;
10
UNCO
RREC
TED
PROO
F
F. Janssen et al. Food Hydrocolloids xxx (xxxx) xxx-xxx
Krägel et al., 2008). In contrast, predominantly viscous A-W interfa-cial protein films (e.g. β-casein films) are fluid-like and are in a ‘phys-ically mobile state’ (Bantchev & Schwartz, 2003; Cicuta, 2007;Krägel et al., 2008). We speculate that A-W interfacial films with apredominantly viscous shear response (rye DL stabilized A-W interfaces)are more susceptible to strengthening by non-hydrolyzed AX present inthe bulk phase than A-W interfacial films characterized by an elasticdominant shear response (wheat DL stabilized A-W interfaces). In addi-tion, the concentration and structure (molecular weight, degree of sub-stitution, and substitution pattern) of AX may play a role in determiningits interaction with adsorbed molecules. It is therefore important to men-tion that the concentration of non-hydrolyzed AX in control wheat DL at1.50 mg protein/mL (0.8 mg/mL) was much lower than that in controlrye DL at 1.50 mg protein/mL (1.6 mg/mL). Additionally, the WE-AX inwheat flour generally has a much higher level of unsubstituted xyloses(50–80%) (Cleemput et al., 1995) than that in rye flour (22–54%)(Vinkx, Delcour, Verbruggen, & Gruppen, 1995). To what extentthe structural features of non-hydrolyzed AX have an impact on its po-tential to interact with adsorbed surface-active constituents has, far aswe are aware, not yet been studied.
In conclusion, NSPs had no impact on the rate or extent at whichof A-W interfaces stabilized by wheat, rye, or oat DL decreased over
time.Enzyme-treated wheat DL constituents resulted in significantly
(P < 0.05) lower foaming capacities than was the case for control wheatDLs (Fig. 2). Despite this, non-hydrolyzed wheat DL AX seem to im-pair the degree to which protein-protein interactions occur at the A-Winterface. This seems to suggest that the lower foaming capacity of en-zyme-treated wheat DL constituents may at least to an extent be relatedto the lower ηbulk of enzyme-treated wheat DLs. However, the foamingproperties of control wheat DLs were still inferior over those of controlrye DLs. The poor foaming properties of wheat DL may be ascribed to acombined effect of (i) low ηbulk, (ii) co-occurrence of proteins and lipidsat the A-W interface, and (iii) unfavorable interactions between non-hy-drolyzed AX and adsorbed protein molecules at the A-W interface.
In contrast to what occurred for wheat DL, a cooperative effect in-volving a multilayer structure comprised of proteins as primary layerand non-hydrolyzed AX as secondary layer may explain the high |η*s|of rye DL stabilized A-W interfacial films. Hence, the excellent foamingproperties of rye DL constituents are most likely associated with (i) thehigh ηbulk and (ii) the formation of a multilayer structure between pro-teins and non-hydrolyzed AX at the A-W interface.
Finally, the shear moduli of oat DL stabilized A-W interfaces – irre-spective of whether β-D-glucans were present or not – were below thedetection limit of the DWR geometry. It thus seems that oat DL β-D-glu-cans only contribute to the stability of oat DL foams by increasing ηbulk.
The ability of non-hydrolyzed NSPs to strengthen the adsorbed A-Winterfacial film seems to be related to the composition and microstruc-ture of the interface. In earlier work, a defatting procedure was used toinvestigate the interplay between lipids and proteins (but not of NSPs)at wheat, rye and oat DL constituent stabilized interfaces (Janssen et al.submitted for publication). In the absence of lipids, proteins and NSPsevidently determine the A-W interfacial properties of DL. In what fol-lows, the air-water interfacial properties of defatted and defatted + en-zyme-treated wheat, rye, and oat DLs are compared.
3.5. Impact of enzymatic hydrolysis of non-starch polysaccharides on theinterfacial shear rheometry of defatted dough liquor constituents
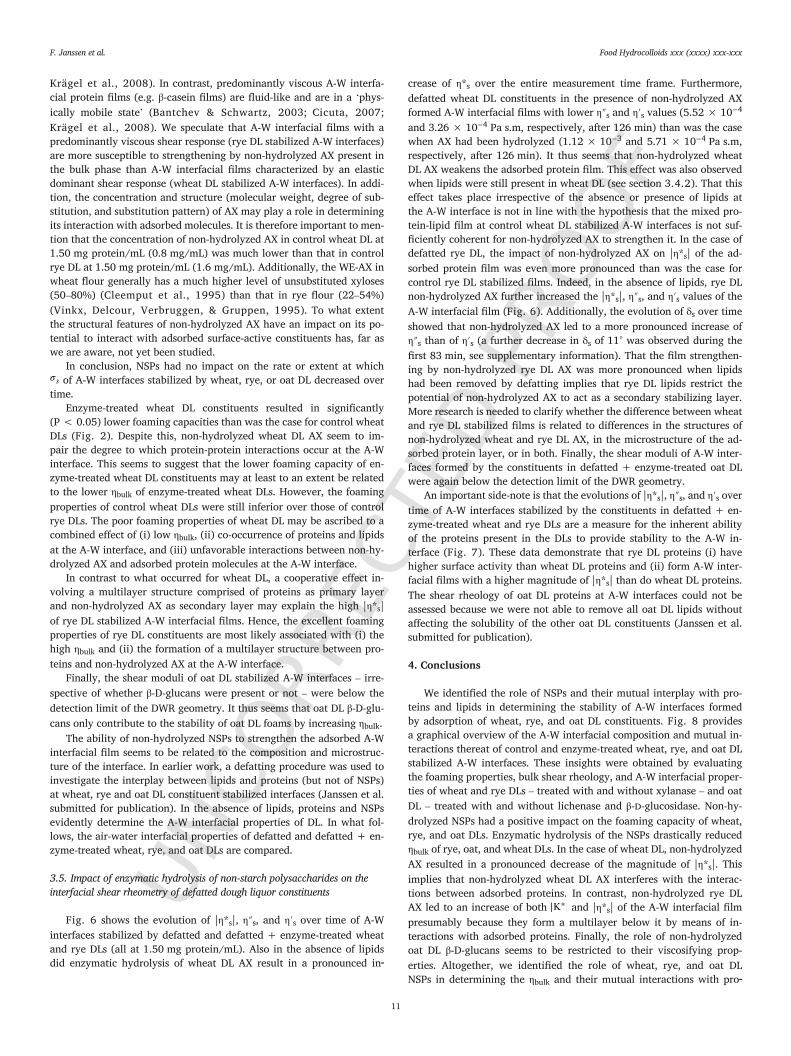
Fig. 6 shows the evolution of |η*s|, η″s, and η′s over time of A-Winterfaces stabilized by defatted and defatted + enzyme-treated wheatand rye DLs (all at 1.50 mg protein/mL). Also in the absence of lipidsdid enzymatic hydrolysis of wheat DL AX result in a pronounced in
crease of η*s over the entire measurement time frame. Furthermore,defatted wheat DL constituents in the presence of non-hydrolyzed AXformed A-W interfacial films with lower η″s and η′s values (5.52 × 10⁻⁴
and 3.26 × 10⁻⁴ Pa s.m, respectively, after 126 min) than was the casewhen AX had been hydrolyzed (1.12 × 10⁻³ and 5.71 × 10⁻⁴ Pa s.m,respectively, after 126 min). It thus seems that non-hydrolyzed wheatDL AX weakens the adsorbed protein film. This effect was also observedwhen lipids were still present in wheat DL (see section 3.4.2). That thiseffect takes place irrespective of the absence or presence of lipids atthe A-W interface is not in line with the hypothesis that the mixed pro-tein-lipid film at control wheat DL stabilized A-W interfaces is not suf-ficiently coherent for non-hydrolyzed AX to strengthen it. In the case ofdefatted rye DL, the impact of non-hydrolyzed AX on |η*s| of the ad-sorbed protein film was even more pronounced than was the case forcontrol rye DL stabilized films. Indeed, in the absence of lipids, rye DLnon-hydrolyzed AX further increased the |η*s|, η″s, and η′s values of theA-W interfacial film (Fig. 6). Additionally, the evolution of δs over timeshowed that non-hydrolyzed AX led to a more pronounced increase ofη″s than of η′s (a further decrease in δs of 11° was observed during thefirst 83 min, see supplementary information). That the film strengthen-ing by non-hydrolyzed rye DL AX was more pronounced when lipidshad been removed by defatting implies that rye DL lipids restrict thepotential of non-hydrolyzed AX to act as a secondary stabilizing layer.More research is needed to clarify whether the difference between wheatand rye DL stabilized films is related to differences in the structures ofnon-hydrolyzed wheat and rye DL AX, in the microstructure of the ad-sorbed protein layer, or in both. Finally, the shear moduli of A-W inter-faces formed by the constituents in defatted + enzyme-treated oat DLwere again below the detection limit of the DWR geometry.
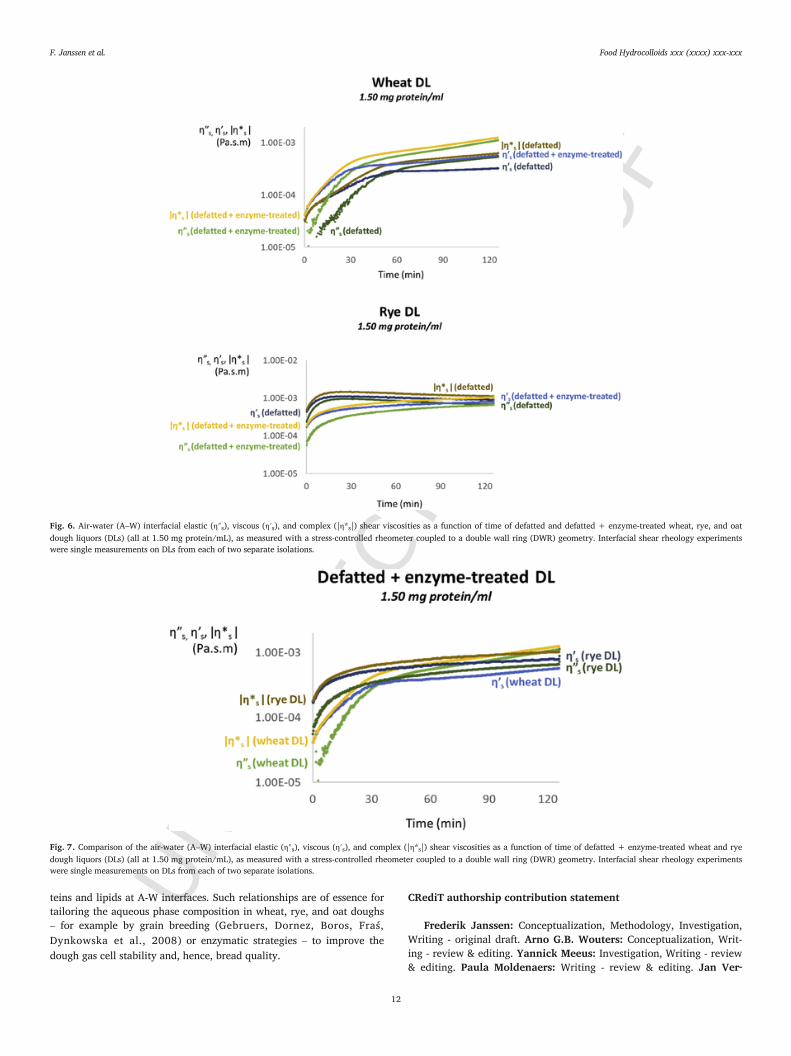
An important side-note is that the evolutions of |η*s|, η″s, and η′s overtime of A-W interfaces stabilized by the constituents in defatted + en-zyme-treated wheat and rye DLs are a measure for the inherent abilityof the proteins present in the DLs to provide stability to the A-W in-terface (Fig. 7). These data demonstrate that rye DL proteins (i) havehigher surface activity than wheat DL proteins and (ii) form A-W inter-facial films with a higher magnitude of |η*s| than do wheat DL proteins.The shear rheology of oat DL proteins at A-W interfaces could not beassessed because we were not able to remove all oat DL lipids withoutaffecting the solubility of the other oat DL constituents (Janssen et al.submitted for publication).
4. Conclusions
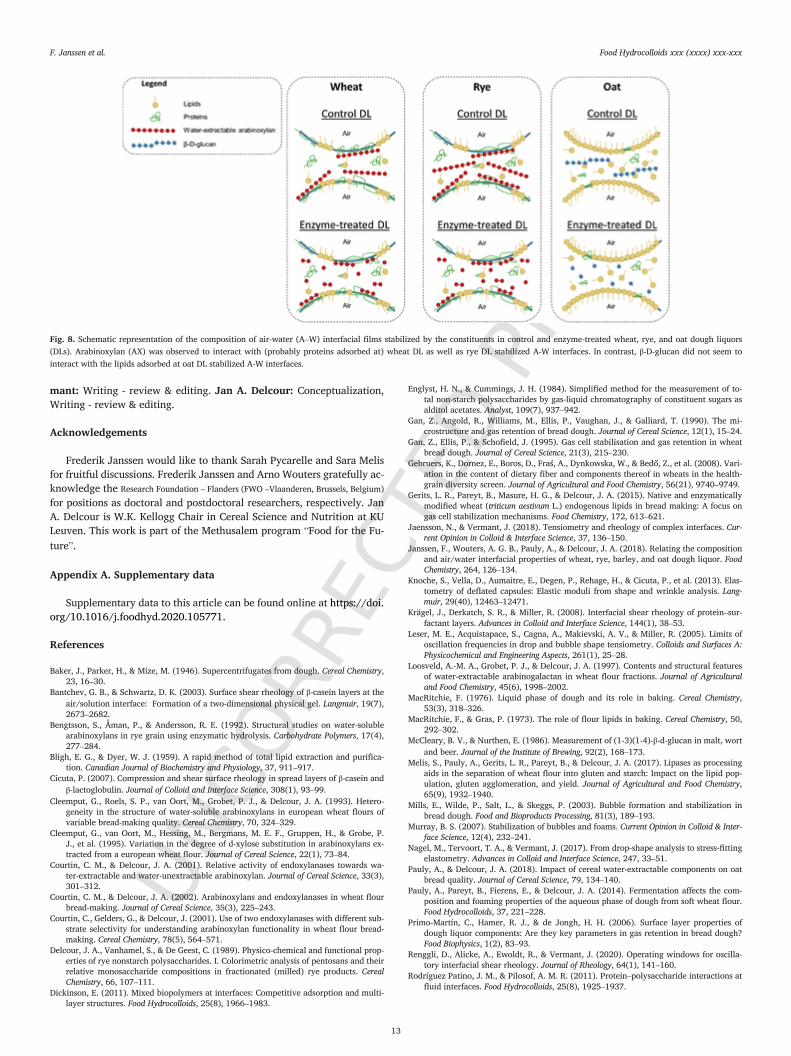
We identified the role of NSPs and their mutual interplay with pro-teins and lipids in determining the stability of A-W interfaces formedby adsorption of wheat, rye, and oat DL constituents. Fig. 8 providesa graphical overview of the A-W interfacial composition and mutual in-teractions thereat of control and enzyme-treated wheat, rye, and oat DLstabilized A-W interfaces. These insights were obtained by evaluatingthe foaming properties, bulk shear rheology, and A-W interfacial proper-ties of wheat and rye DLs – treated with and without xylanase – and oatDL – treated with and without lichenase and β-d-glucosidase. Non-hy-drolyzed NSPs had a positive impact on the foaming capacity of wheat,rye, and oat DLs. Enzymatic hydrolysis of the NSPs drastically reducedηbulk of rye, oat, and wheat DLs. In the case of wheat DL, non-hydrolyzedAX resulted in a pronounced decrease of the magnitude of |η*s|. Thisimplies that non-hydrolyzed wheat DL AX interferes with the interac-tions between adsorbed proteins. In contrast, non-hydrolyzed rye DLAX led to an increase of both and |η*s| of the A-W interfacial filmpresumably because they form a multilayer below it by means of in-teractions with adsorbed proteins. Finally, the role of non-hydrolyzedoat DL β-D-glucans seems to be restricted to their viscosifying prop-erties. Altogether, we identified the role of wheat, rye, and oat DLNSPs in determining the ηbulk and their mutual interactions with pro
11
UNCO
RREC
TED
PROO
F
F. Janssen et al. Food Hydrocolloids xxx (xxxx) xxx-xxx
Fig. 6. Air-water (A–W) interfacial elastic (η″s), viscous (η′s), and complex (|η*s|) shear viscosities as a function of time of defatted and defatted + enzyme-treated wheat, rye, and oatdough liquors (DLs) (all at 1.50 mg protein/mL), as measured with a stress-controlled rheometer coupled to a double wall ring (DWR) geometry. Interfacial shear rheology experimentswere single measurements on DLs from each of two separate isolations.
Fig. 7. Comparison of the air-water (A–W) interfacial elastic (η″s), viscous (η′s), and complex (|η*s|) shear viscosities as a function of time of defatted + enzyme-treated wheat and ryedough liquors (DLs) (all at 1.50 mg protein/mL), as measured with a stress-controlled rheometer coupled to a double wall ring (DWR) geometry. Interfacial shear rheology experimentswere single measurements on DLs from each of two separate isolations.
teins and lipids at A-W interfaces. Such relationships are of essence fortailoring the aqueous phase composition in wheat, rye, and oat doughs– for example by grain breeding (Gebruers, Dornez, Boros, Fraś,Dynkowska et al., 2008) or enzymatic strategies – to improve thedough gas cell stability and, hence, bread quality.
CRediT authorship contribution statement
Frederik Janssen: Conceptualization, Methodology, Investigation,Writing - original draft. Arno G.B. Wouters: Conceptualization, Writ-ing - review & editing. Yannick Meeus: Investigation, Writing - review& editing. Paula Moldenaers: Writing - review & editing. Jan Ver
12
UNCO
RREC
TED
PROO
F
F. Janssen et al. Food Hydrocolloids xxx (xxxx) xxx-xxx
Fig. 8. Schematic representation of the composition of air-water (A–W) interfacial films stabilized by the constituents in control and enzyme-treated wheat, rye, and oat dough liquors(DLs). Arabinoxylan (AX) was observed to interact with (probably proteins adsorbed at) wheat DL as well as rye DL stabilized A-W interfaces. In contrast, β-D-glucan did not seem tointeract with the lipids adsorbed at oat DL stabilized A-W interfaces.
mant: Writing - review & editing. Jan A. Delcour: Conceptualization,Writing - review & editing.
Acknowledgements
Frederik Janssen would like to thank Sarah Pycarelle and Sara Melisfor fruitful discussions. Frederik Janssen and Arno Wouters gratefully ac-knowledge the Research Foundation – Flanders (FWO –Vlaanderen, Brussels, Belgium)for positions as doctoral and postdoctoral researchers, respectively. JanA. Delcour is W.K. Kellogg Chair in Cereal Science and Nutrition at KULeuven. This work is part of the Methusalem program “Food for the Fu-ture”.
Appendix A. Supplementary data
Supplementary data to this article can be found online at https://doi.org/10.1016/j.foodhyd.2020.105771.
References
Baker, J., Parker, H., & Mize, M. (1946). Supercentrifugates from dough. Cereal Chemistry,23, 16–30.
Bantchev, G. B., & Schwartz, D. K. (2003). Surface shear rheology of β-casein layers at theair/solution interface: Formation of a two-dimensional physical gel. Langmuir, 19(7),2673–2682.
Bengtsson, S., Åman, P., & Andersson, R. E. (1992). Structural studies on water-solublearabinoxylans in rye grain using enzymatic hydrolysis. Carbohydrate Polymers, 17(4),277–284.
Bligh, E. G., & Dyer, W. J. (1959). A rapid method of total lipid extraction and purifica-tion. Canadian Journal of Biochemistry and Physiology, 37, 911–917.
Cicuta, P. (2007). Compression and shear surface rheology in spread layers of β-casein andβ-lactoglobulin. Journal of Colloid and Interface Science, 308(1), 93–99.
Cleemput, G., Roels, S. P., van Oort, M., Grobet, P. J., & Delcour, J. A. (1993). Hetero-geneity in the structure of water-soluble arabinoxylans in european wheat flours ofvariable bread-making quality. Cereal Chemistry, 70, 324–329.
Cleemput, G., van Oort, M., Hessing, M., Bergmans, M. E. F., Gruppen, H., & Grobe, P.J., et al. (1995). Variation in the degree of d-xylose substitution in arabinoxylans ex-tracted from a european wheat flour. Journal of Cereal Science, 22(1), 73–84.
Courtin, C. M., & Delcour, J. A. (2001). Relative activity of endoxylanases towards wa-ter-extractable and water-unextractable arabinoxylan. Journal of Cereal Science, 33(3),301–312.
Courtin, C. M., & Delcour, J. A. (2002). Arabinoxylans and endoxylanases in wheat flourbread-making. Journal of Cereal Science, 35(3), 225–243.
Courtin, C., Gelders, G., & Delcour, J. (2001). Use of two endoxylanases with different sub-strate selectivity for understanding arabinoxylan functionality in wheat flour bread-making. Cereal Chemistry, 78(5), 564–571.
Delcour, J. A., Vanhamel, S., & De Geest, C. (1989). Physico-chemical and functional prop-erties of rye nonstarch polysaccharides. I. Colorimetric analysis of pentosans and theirrelative monosaccharide compositions in fractionated (milled) rye products. CerealChemistry, 66, 107–111.
Dickinson, E. (2011). Mixed biopolymers at interfaces: Competitive adsorption and multi-layer structures. Food Hydrocolloids, 25(8), 1966–1983.
Englyst, H. N., & Cummings, J. H. (1984). Simplified method for the measurement of to-tal non-starch polysaccharides by gas-liquid chromatography of constituent sugars asalditol acetates. Analyst, 109(7), 937–942.
Gan, Z., Angold, R., Williams, M., Ellis, P., Vaughan, J., & Galliard, T. (1990). The mi-crostructure and gas retention of bread dough. Journal of Cereal Science, 12(1), 15–24.
Gan, Z., Ellis, P., & Schofield, J. (1995). Gas cell stabilisation and gas retention in wheatbread dough. Journal of Cereal Science, 21(3), 215–230.
Gebruers, K., Dornez, E., Boros, D., Fraś, A., Dynkowska, W., & Bedő, Z., et al. (2008). Vari-ation in the content of dietary fiber and components thereof in wheats in the health-grain diversity screen. Journal of Agricultural and Food Chemistry, 56(21), 9740–9749.
Gerits, L. R., Pareyt, B., Masure, H. G., & Delcour, J. A. (2015). Native and enzymaticallymodified wheat (triticum aestivum L.) endogenous lipids in bread making: A focus ongas cell stabilization mechanisms. Food Chemistry, 172, 613–621.
Jaensson, N., & Vermant, J. (2018). Tensiometry and rheology of complex interfaces. Cur-rent Opinion in Colloid & Interface Science, 37, 136–150.
Janssen, F., Wouters, A. G. B., Pauly, A., & Delcour, J. A. (2018). Relating the compositionand air/water interfacial properties of wheat, rye, barley, and oat dough liquor. FoodChemistry, 264, 126–134.
Knoche, S., Vella, D., Aumaitre, E., Degen, P., Rehage, H., & Cicuta, P., et al. (2013). Elas-tometry of deflated capsules: Elastic moduli from shape and wrinkle analysis. Lang-muir, 29(40), 12463–12471.
Krägel, J., Derkatch, S. R., & Miller, R. (2008). Interfacial shear rheology of protein–sur-factant layers. Advances in Colloid and Interface Science, 144(1), 38–53.
Leser, M. E., Acquistapace, S., Cagna, A., Makievski, A. V., & Miller, R. (2005). Limits ofoscillation frequencies in drop and bubble shape tensiometry. Colloids and Surfaces A:Physicochemical and Engineering Aspects, 261(1), 25–28.
Loosveld, A.-M. A., Grobet, P. J., & Delcour, J. A. (1997). Contents and structural featuresof water-extractable arabinogalactan in wheat flour fractions. Journal of Agriculturaland Food Chemistry, 45(6), 1998–2002.
MacRitchie, F. (1976). Liquid phase of dough and its role in baking. Cereal Chemistry,53(3), 318–326.
MacRitchie, F., & Gras, P. (1973). The role of flour lipids in baking. Cereal Chemistry, 50,292–302.
McCleary, B. V., & Nurthen, E. (1986). Measurement of (1-3)(1-4)-β-d-glucan in malt, wortand beer. Journal of the Institute of Brewing, 92(2), 168–173.
Melis, S., Pauly, A., Gerits, L. R., Pareyt, B., & Delcour, J. A. (2017). Lipases as processingaids in the separation of wheat flour into gluten and starch: Impact on the lipid pop-ulation, gluten agglomeration, and yield. Journal of Agricultural and Food Chemistry,65(9), 1932–1940.
Mills, E., Wilde, P., Salt, L., & Skeggs, P. (2003). Bubble formation and stabilization inbread dough. Food and Bioproducts Processing, 81(3), 189–193.
Murray, B. S. (2007). Stabilization of bubbles and foams. Current Opinion in Colloid & Inter-face Science, 12(4), 232–241.
Nagel, M., Tervoort, T. A., & Vermant, J. (2017). From drop-shape analysis to stress-fittingelastometry. Advances in Colloid and Interface Science, 247, 33–51.
Pauly, A., & Delcour, J. A. (2018). Impact of cereal water-extractable components on oatbread quality. Journal of Cereal Science, 79, 134–140.
Pauly, A., Pareyt, B., Fierens, E., & Delcour, J. A. (2014). Fermentation affects the com-position and foaming properties of the aqueous phase of dough from soft wheat flour.Food Hydrocolloids, 37, 221–228.
Primo-Martín, C., Hamer, R. J., & de Jongh, H. H. (2006). Surface layer properties ofdough liquor components: Are they key parameters in gas retention in bread dough?Food Biophysics, 1(2), 83–93.
Renggli, D., Alicke, A., Ewoldt, R., & Vermant, J. (2020). Operating windows for oscilla-tory interfacial shear rheology. Journal of Rheology, 64(1), 141–160.
Rodríguez Patino, J. M., & Pilosof, A. M. R. (2011). Protein–polysaccharide interactions atfluid interfaces. Food Hydrocolloids, 25(8), 1925–1937.
13
UNCO
RREC
TED
PROO
F
F. Janssen et al. Food Hydrocolloids xxx (xxxx) xxx-xxx
Sahi, S. S. (2003). The interfacial properties of the aqueous phases of full recipe breaddoughs. Journal of Cereal Science, 37(2), 205–214.
Salt, L. J., González-Thuillier, I., Chope, G., Penson, S., Tosi, P., & Haslam, R. P., et al.(2018). Intrinsic wheat lipid composition effects the interfacial and foaming proper-ties of dough liquor. Food Hydrocolloids, 75, 211–222.
Salt, L. J., Robertson, J. A., Jenkins, J. A., Mulholland, F., & Mills, E. (2005). The identi-fication of foam-forming soluble proteins from wheat (triticum aestivum) dough. Pro-teomics, 5(6), 1612–1623.
Salt, L. J., Wilde, P., Georget, D., Wellner, N., Skeggs, P., & Mills, E. (2006). Compositionand surface properties of dough liquor. Journal of Cereal Science, 43(3), 284–292.
Sarker, D., Wilde, P., & Clark, D. (1998). Enhancement of protein foam stability by forma-tion of wheat arabinoxylan-protein crosslinks. Cereal Chemistry, 75(4), 493–499.
Sroan, B. S., Bean, S. R., & MacRitchie, F. (2009). Mechanism of gas cell stabilization inbread making. I. The primary gluten–starch matrix. Journal of Cereal Science, 49(1),32–40.
Sroan, B. S., & MacRitchie, F. (2009). Mechanism of gas cell stabilization in breadmaking.II. The secondary liquid lamellae. Journal of Cereal Science, 49(1), 41–46.
Turbin-Orger, A., Della Valle, G., Doublier, J., Fameau, A.-L., Marze, S., & Saulnier, L.(2015). Foaming and rheological properties of the liquid phase extracted from wheatflour dough. Food Hydrocolloids, 43, 114–124.
Van den Bulck, K., Swennen, K., Loosveld, A.-M. A., Courtin, C. M., Brijs, K., & Proost, P.,et al. (2005). Isolation of cereal arabinogalactan-peptides and structural comparisonof their carbohydrate and peptide moieties. Journal of Cereal Science, 41(1), 59–67.
Vandebril, S., Franck, A., Fuller, G. G., Moldenaers, P., & Vermant, J. (2010). A doublewall-ring geometry for interfacial shear rheometry. Rheologica Acta, 49(2), 131–144.
Vinkx, C. J. A., & Delcour, J. A. (1996). Rye (secale cereale L.) arabinoxylans: A criticalreview. Journal of Cereal Science, 24(1), 1–14.
Vinkx, C. J. A., Delcour, J. A., Verbruggen, M. A., & Gruppen, H. (1995). Rye water-solublearabinoxylans also vary in their contents of 2-monosubstituted xylose. Cereal Chem-istry, 72, 227–228.
Wood, P. J., Weisz, J., & Blackwell, B. A. (1991). Molecular characterization of cerealbeta-d-glucans. Structural analysis of oat beta-d-glucan and rapid structural evaluationof beta-d-glucans from different sources by high-performance liquid chromatographyof oligosaccharides released by lichenase. Cereal Chemistry, 68. 31-39.
Wood, P. J., Weisz, J., & Blackwell, B. A. (1994). Structural studies of(1-3),(1-4)-beta-d-glucans by 13c-nuclear magnetic resonance spectroscopy and byrapid analysis of cellulose-like regions using high-performance anion-exchange chro-matography of oligosaccharides released by lichenase. Cereal Chemistry, 71(3),301–307.
Zell, Z. A., Nowbahar, A., Mansard, V., Leal, L. G., Deshmukh, S. S., & Mecca, J. M., etal. (2014). Surface shear inviscidity of soluble surfactants. Proceedings of the NationalAcademy of Sciences, 111(10), 3677.
14
Related Documents