International Conference On Recent Trends In Engineering Science And Management ISBN: 978-81-931039-2-0 Jawaharlal Nehru University, Convention Center, New Delhi (India), 15 March 2015 www.conferenceworld.in 2452 | Page ULTRA SENSITIVITY BIO-SENSOR BASED ON PHOTONIC CRYSTAL RING RESONATOR Subhashish Tiwari 1 , Ashutosh Dikshit 2 , Praveen C. Pandey 3 1,3 Department of Physics, 2 Dept. of Electronics Eng, Indian Institute of Technology (Banaras Hindu University), Varanasi(India) ABSTRACT In this paper we have presented a highly sensitive bio-sensor based on photonic crystal ring resonator (PCRR). The structure of the ring resonator consists of 4 big rods in the central cavity which are used for sensing purpose, their refractive index is varied according to the sample which is to be sensed. Plane wave expansion method (PWE) is employed for finding out the bandgap of the photonic crystal structure which provides the information for selecting the wavelength source. The simulation characteristics are studied by using finite difference time domain (FDTD) method with perfectly matched layer (PML) absorbing boundary conditions. Keywords: Photonic Crystal; Ring Resonator; Finite Difference Time Domain; Plane Wave Expansion. I.INTRODUCTION Photonic crystals (PCs) have the ability to control electromagnetic wave propagation. Devices based on PCs have attracted a great deal of interest in recent times due to their high speed of operations and high efficiency. By introducing defect or modifying PC structures in some form, different optical devices could be realized for example optical switches [1], power splitters [2], polarization beam splitters [3], multiplexers [4], all-optical sensors [5,6], band-stop filters [7], band-pass filters [8], channel drop filters/add-drop filters [9], directional couplers [10] etc. One of the important applications of PC structure is in the sensing regime. In today’s world there is a great need for a technique which is fast and reliable for the detection of chemicals and other substances present in the natural environment. A lot of research has been going on to make high sensitivity chemical sensors especially in the optical field [11-13]. A specialized structure known as photonic crystal ring resonator (PCRR) can be made out of two-dimensional (2-D) photonic crystal structure [14] for carrying out the sensing work. A PCRR contains a cavity region in the 2-D PC structure made by eliminating few PC rods. After this cavity is formed some PC rods are inserted into it in a specific pattern along with a rod placed in the center of the cavity. In this paper, a PCRR is proposed based on 4 big rods inside the cavity [15]. The material to be sensed is coated with a fine thin layer on these big rods and effect on the electromagnetic wave, which passes through this cavity

Welcome message from author
This document is posted to help you gain knowledge. Please leave a comment to let me know what you think about it! Share it to your friends and learn new things together.
Transcript
International Conference On Recent Trends In Engineering Science And Management ISBN: 978-81-931039-2-0
Jawaharlal Nehru University, Convention Center, New Delhi (India), 15 March 2015 www.conferenceworld.in
2452 | P a g e
ULTRA SENSITIVITY BIO-SENSOR BASED ON
PHOTONIC CRYSTAL RING RESONATOR
Subhashish Tiwari1, Ashutosh Dikshit2, Praveen C. Pandey3
1,3 Department of Physics, 2 Dept. of Electronics Eng,
Indian Institute of Technology (Banaras Hindu University), Varanasi(India)
ABSTRACT
In this paper we have presented a highly sensitive bio-sensor based on photonic crystal ring resonator (PCRR).
The structure of the ring resonator consists of 4 big rods in the central cavity which are used for sensing
purpose, their refractive index is varied according to the sample which is to be sensed. Plane wave expansion
method (PWE) is employed for finding out the bandgap of the photonic crystal structure which provides the
information for selecting the wavelength source. The simulation characteristics are studied by using finite
difference time domain (FDTD) method with perfectly matched layer (PML) absorbing boundary conditions.
Keywords: Photonic Crystal; Ring Resonator; Finite Difference Time Domain; Plane Wave
Expansion.
I.INTRODUCTION
Photonic crystals (PCs) have the ability to control electromagnetic wave propagation. Devices based on PCs
have attracted a great deal of interest in recent times due to their high speed of operations and high efficiency.
By introducing defect or modifying PC structures in some form, different optical devices could be realized for
example optical switches [1], power splitters [2], polarization beam splitters [3], multiplexers [4], all-optical
sensors [5,6], band-stop filters [7], band-pass filters [8], channel drop filters/add-drop filters [9], directional
couplers [10] etc. One of the important applications of PC structure is in the sensing regime. In today’s world
there is a great need for a technique which is fast and reliable for the detection of chemicals and other
substances present in the natural environment. A lot of research has been going on to make high sensitivity
chemical sensors especially in the optical field [11-13]. A specialized structure known as photonic crystal ring
resonator (PCRR) can be made out of two-dimensional (2-D) photonic crystal structure [14] for carrying out the
sensing work. A PCRR contains a cavity region in the 2-D PC structure made by eliminating few PC rods. After
this cavity is formed some PC rods are inserted into it in a specific pattern along with a rod placed in the center
of the cavity.
In this paper, a PCRR is proposed based on 4 big rods inside the cavity [15]. The material to be sensed is coated
with a fine thin layer on these big rods and effect on the electromagnetic wave, which passes through this cavity

International Conference On Recent Trends In Engineering Science And Management ISBN: 978-81-931039-2-0
Jawaharlal Nehru University, Convention Center, New Delhi (India), 15 March 2015 www.conferenceworld.in
2453 | P a g e
is observed at the output. The shape of these 4 rods is changed from circular to elliptical and again sensing is
performed.
II. STRUCTURE DESIGN
Initially a PC structure with 25 x 29 PC rods arranged in square lattice is designed [16]. Then the band-gap is
calculated for this structure by varying the refractive index and radius of the PC rods. The refractive index of the
PC rods is chosen to be 4.15 whereas the radius of the PC rods is made equal to 0.165 µm. Lattice constant,
which is the distance between any two adjacent PC rods is fixed for band-gap calculation at 0.615 µm value.
For the calculation of photonic band-gap of the designed structure, plane wave expansion (PWE) method [14] is
employed. Application of PWE provides us with two transverse electric (TE) band-gaps as shown in Fig.1. To
obtain a single TE band-gap is enough to place the source according to the wavelength of propagation in the
PCRR. We have chosen the second bandgap starting from top for our simulation purpose. The input
electromagnetic (EM) wave source is Gaussian in nature having a peak output at 1.55 µm. Cavity is created in
the center of the designed structure after finding out the photonic band-gap by eliminating few PC rods in a
square shape region. Linear waveguides are drawn to provide input to this cavity from source placed in the left
direction and extract its output in the right direction.
4 big rods are inserted into the cavity which acts as a medium for sensing. The radius of these rods is taken to be
0.3 µm and surface area, which can be calculated by applying standard equation for circle comes out to be 0.09
µm2. The refractive index of these rods can be varied according to the substances to be sensed and peaks in the
electromagnetic wave at the output could be analyzed. Now, these rods are squeezed to make them elliptical in
shape keeping the surface area equal as before. The major and minor radius of these 4 elliptical rods is recorded
to be 0.465 and 0.2 µm respectively. Again the refractive index of these elliptical rods is varied according the
sample and peaks in the output electromagnetic wave are studied.
III. FIGURE
International Conference On Recent Trends In Engineering Science And Management ISBN: 978-81-931039-2-0
Jawaharlal Nehru University, Convention Center, New Delhi (India), 15 March 2015 www.conferenceworld.in
2454 | P a g e
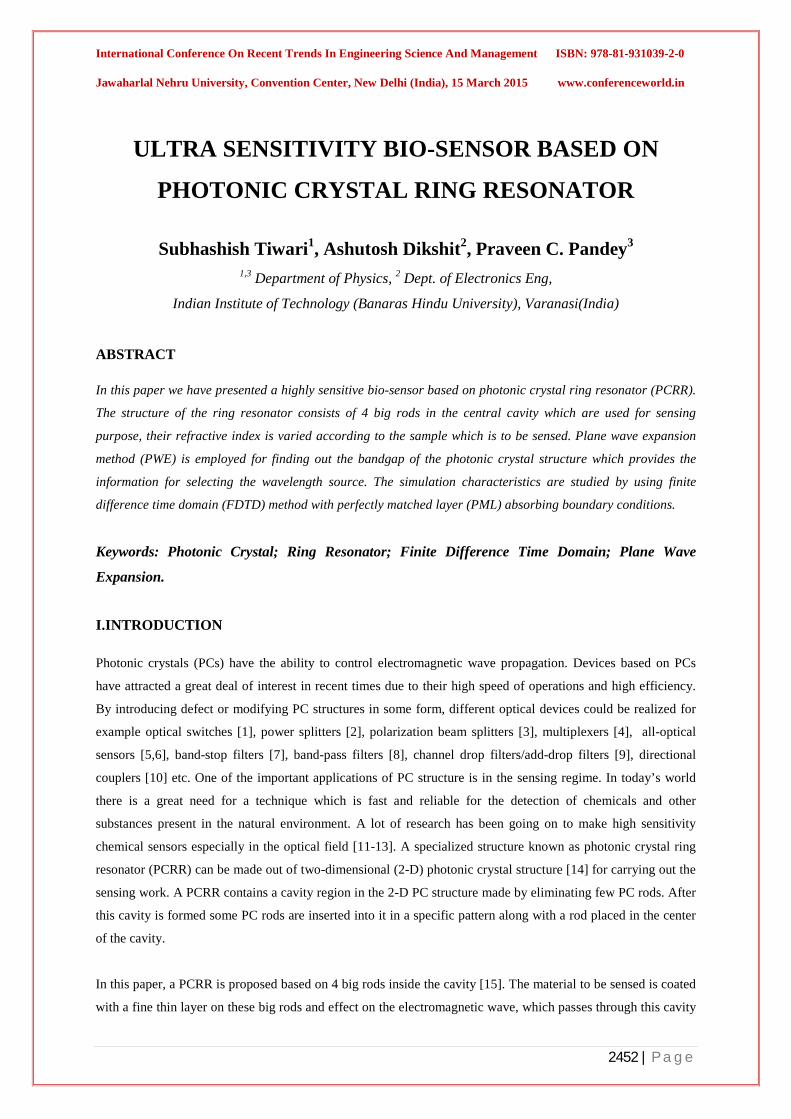
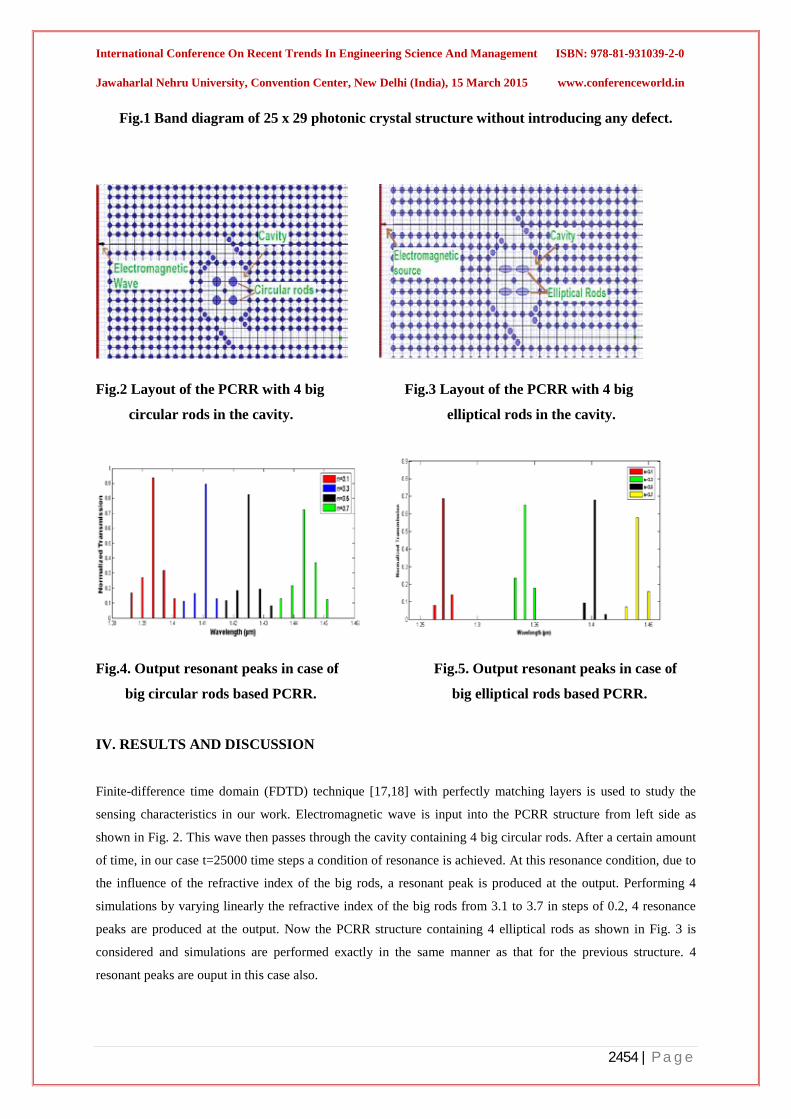
Fig.1 Band diagram of 25 x 29 photonic crystal structure without introducing any defect.
Fig.2 Layout of the PCRR with 4 big Fig.3 Layout of the PCRR with 4 big
circular rods in the cavity. elliptical rods in the cavity.
Fig.4. Output resonant peaks in case of Fig.5. Output resonant peaks in case of
big circular rods based PCRR. big elliptical rods based PCRR.
IV. RESULTS AND DISCUSSION
Finite-difference time domain (FDTD) technique [17,18] with perfectly matching layers is used to study the
sensing characteristics in our work. Electromagnetic wave is input into the PCRR structure from left side as
shown in Fig. 2. This wave then passes through the cavity containing 4 big circular rods. After a certain amount
of time, in our case t=25000 time steps a condition of resonance is achieved. At this resonance condition, due to
the influence of the refractive index of the big rods, a resonant peak is produced at the output. Performing 4
simulations by varying linearly the refractive index of the big rods from 3.1 to 3.7 in steps of 0.2, 4 resonance
peaks are produced at the output. Now the PCRR structure containing 4 elliptical rods as shown in Fig. 3 is
considered and simulations are performed exactly in the same manner as that for the previous structure. 4
resonant peaks are ouput in this case also.

International Conference On Recent Trends In Engineering Science And Management ISBN: 978-81-931039-2-0
Jawaharlal Nehru University, Convention Center, New Delhi (India), 15 March 2015 www.conferenceworld.in
2455 | P a g e
The output peaks of the both types of structure show that the peaks are shifting linearly in the increasing
direction of wavelength as the refractive index of the the 4 rods is increased from 3.1 to 3.7 as depicted in Fig.’s
4 and 5 for circular and elliptical rods respectively. The structure containing 4 big circular rods has a total shift
of 0.05 µm wavelength between the first and last peaks whereas in the case of the structure with 4 big elliptical
rods the total shift between the peaks has extended to about 0.16 µm wavelength. But at the same time the
normalized power of the peaks in case of elliptical rods has decreased to about 65 percent as average of 4 peaks.
Thus, on the basis of total shift between the resonant peaks which is directly proportional to sensitivity we can
say that by employing elliptical rods we achieve more sensitivity as compared to the big circular rods.
REFERENCES
[1] H.Z. Wang, W.M. Zhou, J.P. Zheng, A 2D rods-in-air square-lattice photonic crystal optical switch, Optik,
121, 2010, 1988-1993.
[2] Insu Park, Hyun-Shik Lee, Hyun-Jun Kim, Kyung-Mi Moon, Seung-Gol Lee, Beom Hoan O, Se-Geun
Park, and El-Hang Lee, Photonic crystal power-splitter based on directional coupling, Optics Express, 12,
2004, 3599-3604.
[3] V. Zabelin, L.A. Dunbar, N. Le Thomas, R. Houdre, M.V. Kotlyar, L. O’Faolain, T.F. Krauss, Self-
collimating photonic crystal polarization beam splitter, Opt. Lett., 32, 2007, 530-532.
[4] G. Manzacca, D. Paciotti, A. Marchese, M.S. Moreolo, G. Cincotti, 2D photonic crystal cavity-based WDM
multiplexer, Photon. Nanostruct.: Fundam. Appl., 5, 2007, 164-170.
[5] E. Krioukov, D. J. W. Klunder, A. Driessen, J. Greve, and C. Otto, Sensor based on an integrated optical
microcavity, Opt. Lett. 27, 2002, 512–514.
[6] E. Chow, A. Grot, L. W. Mirkarimi, M. Sigalas, and G. Girolami, Ultracompact biochemical sensor built
with two-dimensional photonic crystal microcavity, Opt. Lett., 29, 2004, 1093–1095.
[7] F. Monifi, M. Djavid, A. Ghaffari, M.S. Abrishamian, A new bandstop filter based on photonic crystals,
Proc. PIER I, 2008, 674-677.
[8] S. Robinson, R. Nakkeeran, Filter based on 2D square-lattice photonic crystal ring resonator, IEEE
International Conference on WOCN, 7, 2010, 1-4.
[9] M. Qiu, B. Jaskorzynska, Design of a channel drop filter in a two-dimensional triangular photonic crystal,
Appl. Phys. Lett., 83, 2003, 1074–1076.
[10] M.K. Moghaddam, A.R. Attari, M.M. Mirsalehi, Improved photonic crystal directional coupler with short
length, Photon. Nanostruct.: Fundam. Appl., 8, 2010, 47–53.
[11] C.Y. Chao, W. Fung, L.J. Guo, Polymer microring resonators for biochemical sensing applications, IEEE
J. Sel. Top. Quantum Electron., 12, 2006, 134–142.
[12] M. Kwon, W.H. Steier, Microring-resonator-based sensor measuring both the concentration and
temperature of a solution, Opt. Express, 16, 2008, 9372–9377.
[13] H. Ouyang, L.A. Deloulse, B.M. Miller, P.M. Fauchet, Label-free quantitative detection of protein using
macroporous silicon photonic bandgap biosensors, Anal. Chem., 79, 2007, 1502–1506.
[14] V. Dinesh Kumar, T. Srinivas, A. Selvarajan, Investigation of ring resonators in photonic crystal circuits,
Photon. Nanostruct. Fundam. Appl., 2, 2004, 199–206.

International Conference On Recent Trends In Engineering Science And Management ISBN: 978-81-931039-2-0
Jawaharlal Nehru University, Convention Center, New Delhi (India), 15 March 2015 www.conferenceworld.in
2456 | P a g e
[15] Cheng-Yang Liu, Tunable ultracompact electro-optical photonic crystal ring resonator, Journal of Modern
Optics, 60, 2013, 1337–1342.
[16] P.G. Shang, Sacharia Albin, Simple plane wave implementation for photonic crystal calculations, Opt.
Express, 11, 2003, 167–175.
[17] A. Taflove, S.C. Hagness, computational electrodynamics: the finite-difference time-domain method
(Boston: Artech House, 1995).
[18] A. Lavrinenko, P.I. Borel, L.H. Frandsen, M. Thorhauge, A. Harpoth, M. Kristensen, T. Niemi, H.M.H.
Chong, Comprehensive FDTD modeling of photonic crystal waveguide components, Opt. Express, 12,
2004, 234–248.

International Conference On Recent Trends In Engineering Science And Management ISBN: 978-81-931039-2-0
Jawaharlal Nehru University, Convention Center, New Delhi (India), 15 March 2015 www.conferenceworld.in
2457 | P a g e
SYNTHESIS OF SCHIFF BASES AND THEIR
TRANSITION METAL COMPLEXES
CHARACTERIZATION & APPLICATION 1Bharat A. Makwana, 2Pratik N. Dave, 3Pratik B. Timbadiya
1,2,3 HVHP Institute of PG Studies and Research, S.V Campus,
KSV University,Kadi-382715,Gujarat,(India) ABSTRACT Three new series of biologically active amino substituted Schiff bases with general formula, R1N=CHR2. Here
R1 = sulphanilamide , 4-amino-3-hydroxynaphthalene-1-sulfonic acids and 2-aminophenol. R2 = o-vaniline
and salicylaldehyde were synthesized by the reaction of two different amino substituted compounds and
substituted aldehydes in Methanol. Such compounds were characterized by different physico-chemical
techniques like, melting point, elemental analysis, IR and Uv-Vis spectroscopy. The free ligands and their metal
complexes have been screened for their in vitro biological activities against bacteria, fungi and yeast. The
ligand and metal complexes were screened for their physiological activities (antifungal activities) with
Asperigillus niger , R h i z o c t o n i a s o l a n i and A l t e r n a r i a fungi. The metal complexes show more potent
activities compared with Schiff base ligand.
Key Word:-Biological Activity, Complexes, Metal, Schiff Base
I. INTRODUCTION The chemistry of the carbon-nitrogen double bond plays a vital role in the progresses of chemistry science [1].
Schiff bases have been known since 1864 when Hugo Schiff reported the condensation of primary amines with
carbonyl compounds [2]. Schiff-bases have been widely used as ligands because of high stability of the
coordination compound, of them and their good solubility in common solvents such as ethanol, methanol,
chloroform, dimethyl formamide .
The common structural feature of these compounds is the azomethine group with a general formula RHC=N-R1,
where R and R1 are alkyl, aryl, cyclo alkyl or heterocyclic groups which may be variously substituted. These
compounds are also known as anils, imines or azomethines. Several studies [3-5] showed that the presence of a
lone pair of electrons in an sp2 hybridized orbital of nitrogen atom of the azomethine group is of considerable
chemical and biological importance. Because of the relative easiness of preparation, synthetic flexibility, and the
special property of C=N group, Schiff bases are generally excellent chelating agents,[6-9] especially when a
functional group like –OH or –SH is present close to the azomethine group so as to form a five or six membered
ring with the metal ion. Versatility of Schiff base ligands and biological, analytical and industrial applications of
their complexes make further investigations in this area highly desirable. Nowadays, the research field dealing
with Schiff base coordination chemistry has expanded enormously. The importance of Schiff base complexes
for bioinorganic chemistry, biomedical applications, supramolecular chemistry, catalysis and material science,
separation and encapsulation processes, and formation of compounds with unusual properties and structures has
been well recognized and reviewed [10]. Schiff-base compounds have been used as fine chemicals and medical
International Conference On Recent Trends In Engineering Science And Management ISBN: 978-81-931039-2-0
Jawaharlal Nehru University, Convention Center, New Delhi (India), 15 March 2015 www.conferenceworld.in
2458 | P a g e
substrates. Recently multi-dentate complexes of iron and nickel showed high activities of ethylene
oligomerization and polymerization [11]. Metal complexes of Schiff-base have played a central role in the
development of coordination chemistry. The complexes make these compounds effective and stereospecific
catalysts for oxidation, reduction and hydrolysis, and they show biological activity and other transformation of
organic and inorganic chemistry [12]. It is well known that some drugs have higher activity when administered
as metal complexes than as the free ligand. In addition potential application to many fields such as antibacterial,
antiviral, anticancer drugs, electrochemistry [13-15]
Their metal complexes have been widely studied because they have anticancer and herbicidal applications [16-
17]. Schiff bases are active against a wide range of organisms for example; Candida Albicans, Escherichia coli
Staphylococcus aureus, Bacillus polymxa, Trychophyton gypseum, Mycobacteria, Erysiphe graminis and
Plasmopora viticola.They serve as models for biologically important species. O-phenylenediamine Schiff bases
show clinical properties [18]. Isatin Schiff bases were reported to possess antiviral, anti-HIV, antiprotozoal and
anthelmintic activities [19]. They also exhibit significant anticonvulsant activity, apart from other
pharmacological properties [20-24]. Certain cobalt Schiff base complexes are potent antiviral agents [25-28].
Schiff bases derived from 4-dimethylamine benzaldehyde shows antifungal activity,In medicines used as
antibodies and anti-inflammatory agents [29-34].
This paper presents a series of new Schiff bases with a potential biological activity resulted from the acid
catalyzed condensation of aryl aldehydes with aromatic and amines. These compounds could also act as
valuable ligands. Here we report the effect of a neutral chelating ligand on the complexa- tion with iron to
determine it in different types of natural water using recovery test. The activity data show that the metal
complexes to be more potent/microbial than the parent Schiff base ligand against one or more bacterial species.
In the present study, Cu (II), and Co (II) complexes of Schiff base were prepared, characterized by IR, UV-
visible and elemental analyses were studied. The structures at the Schiff bases synthesized from o-vaniline,
salicylaldehyde with 2-aminophenol, sulphanilamide and 4-amino-3-hydroxynaphthalene -1-sulfonic acids are
shown on a scheme are shown on the scheme.
II. MATERIAL AND METHODS All the reagents and metal salts of AR graded were purchased from Sigma-Aldrich and used without further
purification. Solvents used for spectroscopic studies were purified and dried before use. All aqueous solutions were
prepared from quartz distilled deionized water, which was further purified by a Millipore Milli-Q water purification
system (Millipack 20, Pack name: Simpak 1,Synergy).Ether, ethanol, methanol, 2-hydroxy benzaldehyde, o-
aminophenol, O-Vaniline Sulphanilamide , 1- amino, 2-hydroxy napthane 4-sulfanilic acid from ( Fluka Co), acetic
acid, petroleum ether, Iodine, were purified before using [9]
2.1 Instruments Melting points (uncorrected) was taken in a single capillary tube using a VEEGO (Model No: VMP-DS, India)
melting point apparatus. The colloidal solutions were centrifuged in REMI, Model No. R-8C laboratory centrifuge.
FT-IR spectra was recorded on Bruker, tensor 27Infrared spectro-photometer as KBr pellets. Absorption spectra was
studied on a Jasco V-570 UV-Vis recording spectrophotometer. pH of the solutions was measured using pH analyzer
LI 614- Elico. The antimicrobial susceptibility of compound and complexes were evaluated using the disc diffusion or
Kirby-Bauer method and zones of inhibition were measured after 24 hours of incubation at 35 °C.
International Conference On Recent Trends In Engineering Science And Management ISBN: 978-81-931039-2-0
Jawaharlal Nehru University, Convention Center, New Delhi (India), 15 March 2015 www.conferenceworld.in
2459 | P a g e
2.2 Synthesis and Characterization
2.3 Spectroscopic Characterization Of Schiff Base And Metal Complexes Synthesis Of The
Ligand (1) And (2)
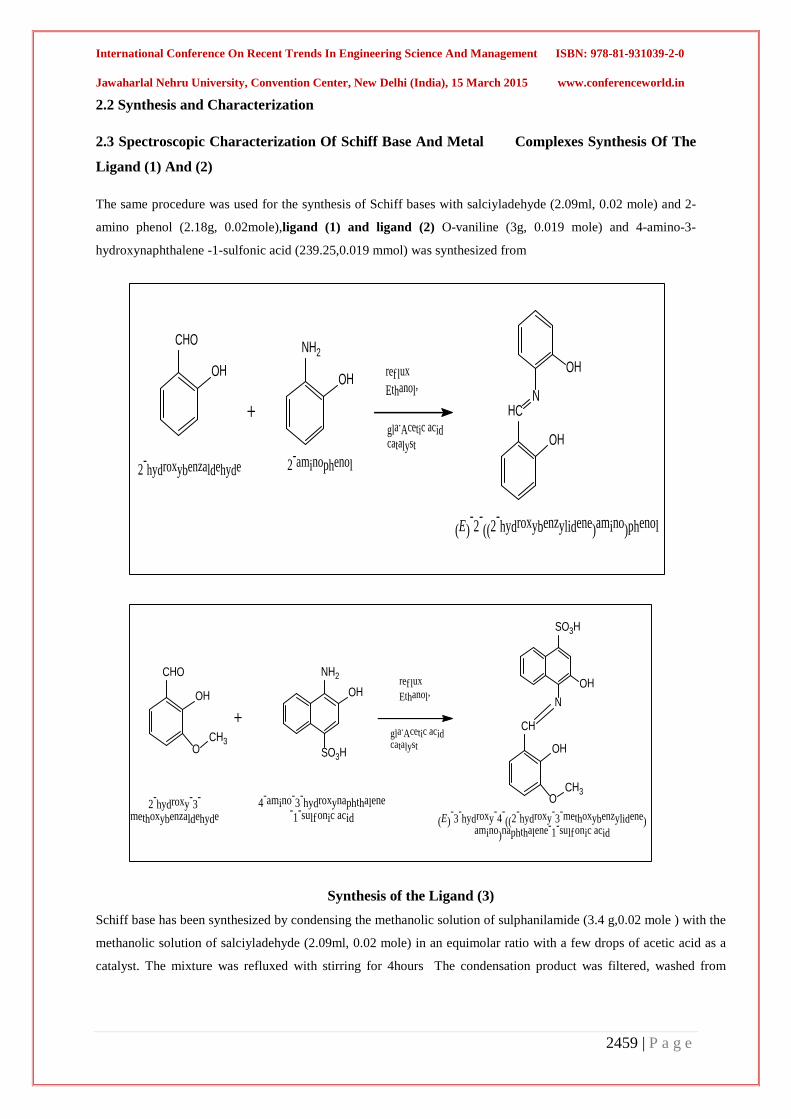
The same procedure was used for the synthesis of Schiff bases with salciyladehyde (2.09ml, 0.02 mole) and 2-
amino phenol (2.18g, 0.02mole),ligand (1) and ligand (2) O-vaniline (3g, 0.019 mole) and 4-amino-3-
hydroxynaphthalene -1-sulfonic acid (239.25,0.019 mmol) was synthesized from
CHO
OH
2-hydroxybenzaldehyde
NH2
OH
2-aminophenol
ref luxEthanol,
gla.Acetic acid
catalyst
HC
OH
N
OH
(E)-2-
((2-hydroxybenzylidene)amino)phenol
ref luxEthanol,
gla.Acetic acid
catalyst
NH2
OH
SO3H
4-amino-3-hydroxynaphthalene-1-sulfonic
acid
CHO
OH
OCH3
2-hydroxy-3-methoxybenzaldehyde
CH
OH
OCH3
NOH
SO3H
(E)-3-hydroxy-4-
((2-hydroxy-3-methoxybenzylidene)
amino)naphthalene-1-sulfonic acid
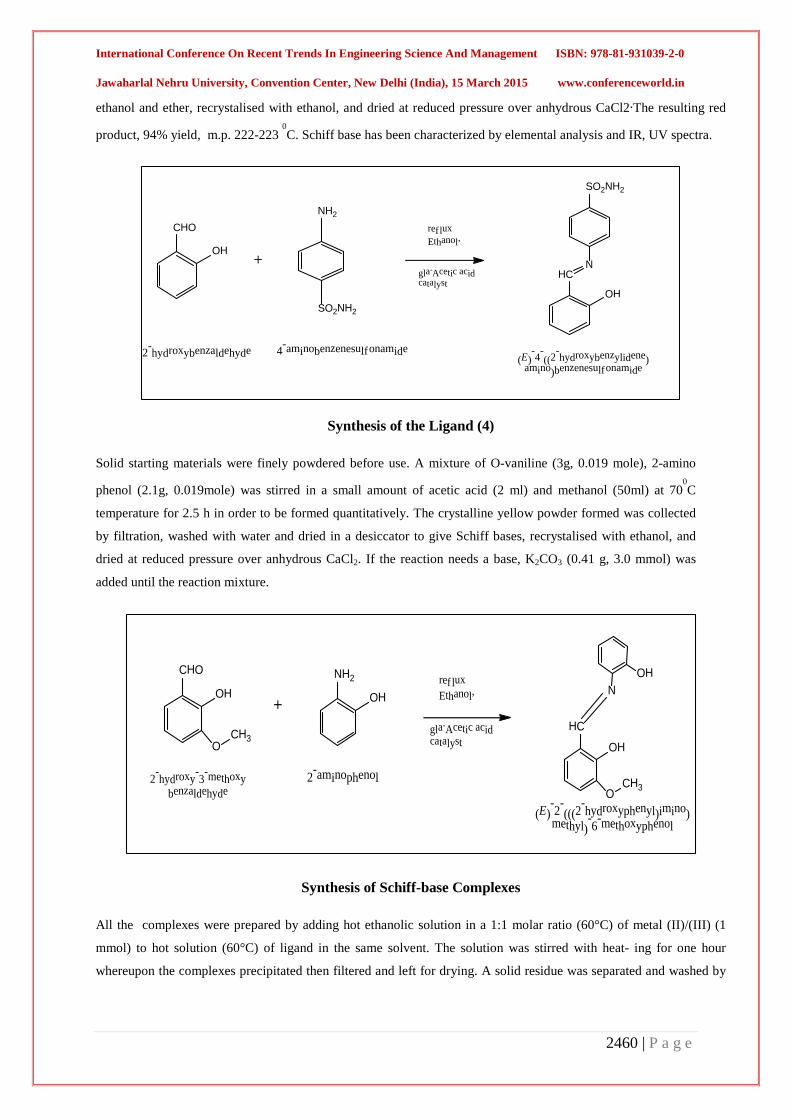
Synthesis of the Ligand (3)
Schiff base has been synthesized by condensing the methanolic solution of sulphanilamide (3.4 g,0.02 mole ) with the
methanolic solution of salciyladehyde (2.09ml, 0.02 mole) in an equimolar ratio with a few drops of acetic acid as a
catalyst. The mixture was refluxed with stirring for 4hours The condensation product was filtered, washed from
International Conference On Recent Trends In Engineering Science And Management ISBN: 978-81-931039-2-0
Jawaharlal Nehru University, Convention Center, New Delhi (India), 15 March 2015 www.conferenceworld.in
2460 | P a g e
ethanol and ether, recrystalised with ethanol, and dried at reduced pressure over anhydrous CaCl2.The resulting red
product, 94% yield, m.p. 222-223 0C. Schiff base has been characterized by elemental analysis and IR, UV spectra.
ref luxEthanol,
gla.Acetic acid
catalyst
NH2
SO2NH2
4-aminobenzenesulfonamide
CHO
OH
2-hydroxybenzaldehyde
HC
OH
N
SO2NH2
(E)-4-
((2-hydroxybenzylidene)
amino)benzenesulfonamide
Synthesis of the Ligand (4)
Solid starting materials were finely powdered before use. A mixture of O-vaniline (3g, 0.019 mole), 2-amino
phenol (2.1g, 0.019mole) was stirred in a small amount of acetic acid (2 ml) and methanol (50ml) at 700C
temperature for 2.5 h in order to be formed quantitatively. The crystalline yellow powder formed was collected
by filtration, washed with water and dried in a desiccator to give Schiff bases, recrystalised with ethanol, and
dried at reduced pressure over anhydrous CaCl2. If the reaction needs a base, K2CO3 (0.41 g, 3.0 mmol) was
added until the reaction mixture.
CHO
OH
OCH3
2-hydroxy-3-methoxybenzaldehyde
NH2
OH
2-aminophenol
HC
OH
OCH3
NOHref lux
Ethanol,
gla.Acetic acid
catalyst
(E)-2-
(((2-hydroxyphenyl)imino)
methyl)-6-methoxyphenol
Synthesis of Schiff-base Complexes
All the complexes were prepared by adding hot ethanolic solution in a 1:1 molar ratio (60°C) of metal (II)/(III) (1
mmol) to hot solution (60°C) of ligand in the same solvent. The solution was stirred with heat- ing for one hour
whereupon the complexes precipitated then filtered and left for drying. A solid residue was separated and washed by

International Conference On Recent Trends In Engineering Science And Management ISBN: 978-81-931039-2-0
Jawaharlal Nehru University, Convention Center, New Delhi (India), 15 March 2015 www.conferenceworld.in
2461 | P a g e
diethyl ether. Crystallization was done with methanol and the complexes dried over anhy- drous CaCl2 and the metal
contents were determined complex metrically then Characterized by elemental analysis and IR, UV spectra.
The studied samples were as discs covered in two sides by silver paint, .The Schiff-base, Cu(III) and Co(III)
complexes were dopped with Iodine by mixing 1g(0.004mole)ligand, 1g(0.0022mole)Cu-complex,
1g(0.002mole)Co-complex with 25ml of iodine solution in CCL4 (4%, w/v), the mixture was refluxed with stirring
for 48 hours, then filtered and dried in the vacuum oven at 500C . The conductivities at different temperatures were
calculated according to Ahrrenious equation as shown below [1, 12-13].
III. RESULT AND DISCUSSION IR SPECTRA In the present study, the Schiff-base compounds were identified by IR. Spectrophotometer in the as shown in figures
[5, 6, 7].The OH stretching vibration of the ligand was appeared at the range (3426 cm-1 – 3330 cm-1 ), while it
disappeared in the IR-spectra of the Schiff-base complexes due to the coordination of the metal ion to the oxygen of
the ligand(15).The band at (1617 cm-1) in the free ligand spectra is attributed to ν(C=N) vibration. On the other hand
, The absorption band at (1601 cm-1, 1609 cm-1) in Schiff-base complexes spectra due to ν(C=N) vibration. The new
bands at the range (749-788 cm-1) and at the range (683-666 cm-1) in the complexes have tentatively been assigned
to νM-O and νM-N respectively(16,17). The all mentioned bands were in Table (3 ).
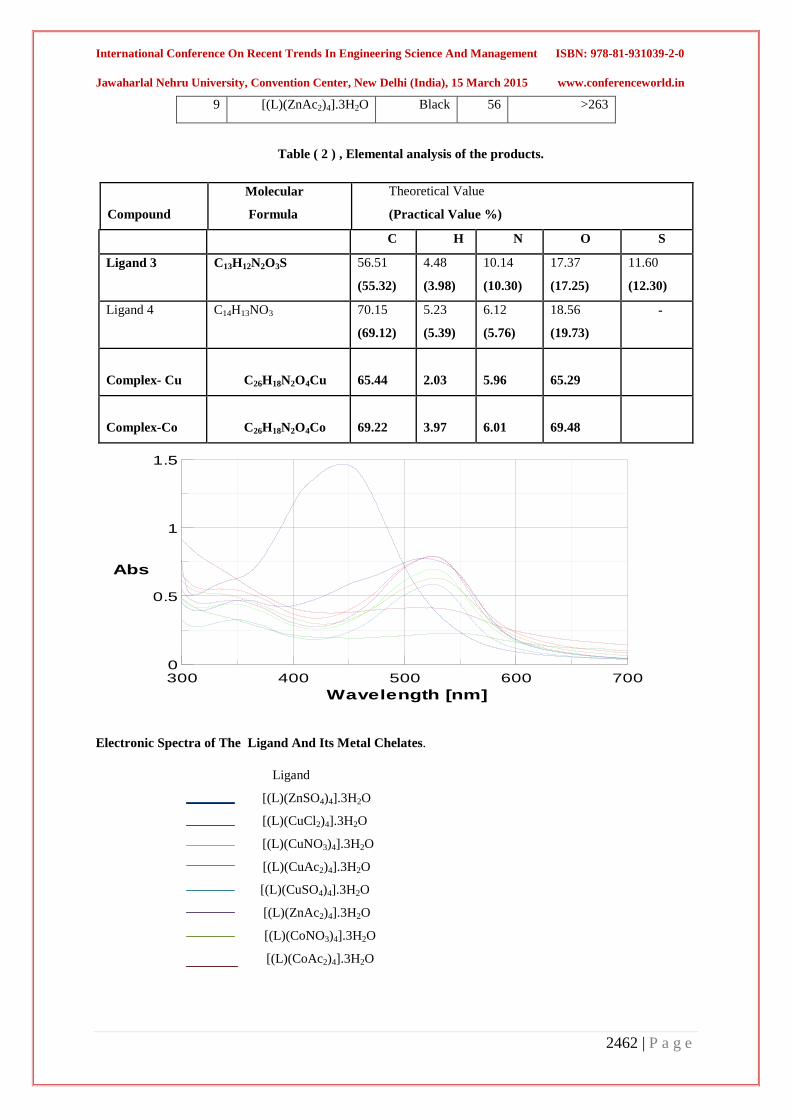
3.1 UV-Visible Spectra The electronic absorption spectra of the Schiff-base ligand and their complexes were recorded at room temperature
using DMF as solvent. The absorption band at (452nm) is observed in the spectrum of the free Schiff-base, suggesting
the presence of (π-π*)transition of aromatic rang or azomethine group(18). The UV–VIS spectral behavior of the
ligand and their metal chelates were investigated in DMF and the compared dates of the UV–VIS spectra are shown
in figure. It was found that all of the spectra show a strong absorption maximal in the 560–480 nm ranges with high
extinction coefficients. As shows, the absorption maximum of the Schiff base (ligand 4) chelates demonstrated a
bathochromic shift between ca. 100 nm in comparison with ligand only
Table (1) : physical data of the ligand and the complexes
Sr.
No
Ligand/Complex Colour Yield Dec.Point (oC)
1 HL Dark Red 71 >220
2 [(L)(CuCl2)4].3H2O Brown 65 >270
3 [(L)(CuNO3)4].3H2O Brown 62 >265
4 [(L)(CuAc2)4].3H2O Black 68 >263
5 [(L)(CuSO4)4].3H2O Dark Brown 64 >265
6 [(L)(CoAc2)4].3H2O Dark Red 65 >250
7 [(L)(CoNO3)4].3H2O Dark Red 69 >254
8 [(L)(ZnSO4)4].3H2O Black 59 >261
International Conference On Recent Trends In Engineering Science And Management ISBN: 978-81-931039-2-0
Jawaharlal Nehru University, Convention Center, New Delhi (India), 15 March 2015 www.conferenceworld.in
2462 | P a g e
9 [(L)(ZnAc2)4].3H2O Black 56 >263
Table ( 2 ) , Elemental analysis of the products.
Theoretical Value
(Practical Value %)
Molecular
Formula
Compound
S O N H C
11.60
(12.30)
17.37
(17.25)
10.14
(10.30)
4.48
(3.98)
56.51
(55.32)
C13H12N2O3S Ligand 3
- 18.56
(19.73)
6.12
(5.76)
5.23
(5.39)
70.15
(69.12)
C14H13NO3 Ligand 4
65.29
5.96
2.03
65.44
C26H18N2O4Cu
Complex- Cu
69.48
6.01
3.97
69.22
C26H18N2O4Co
Complex-Co
0
1.5
0.5
1
300 700400 500 600
Abs
Wavelength [nm]
Electronic Spectra of The Ligand And Its Metal Chelates.
Ligand
[(L)(ZnSO4)4].3H2O
[(L)(CuCl2)4].3H2O
[(L)(CuNO3)4].3H2O
[(L)(CuAc2)4].3H2O
[(L)(CuSO4)4].3H2O
[(L)(ZnAc2)4].3H2O
[(L)(CoNO3)4].3H2O
[(L)(CoAc2)4].3H2O

International Conference On Recent Trends In Engineering Science And Management ISBN: 978-81-931039-2-0
Jawaharlal Nehru University, Convention Center, New Delhi (India), 15 March 2015 www.conferenceworld.in
2463 | P a g e
Figure ( 5 ) : IR- spectrum of free ligand
Figure(6): IR-spectrum of Cu-Complex
Figure (7): IR-spectrum of Co-Complex
International Conference On Recent Trends In Engineering Science And Management ISBN: 978-81-931039-2-0
Jawaharlal Nehru University, Convention Center, New Delhi (India), 15 March 2015 www.conferenceworld.in
2464 | P a g e
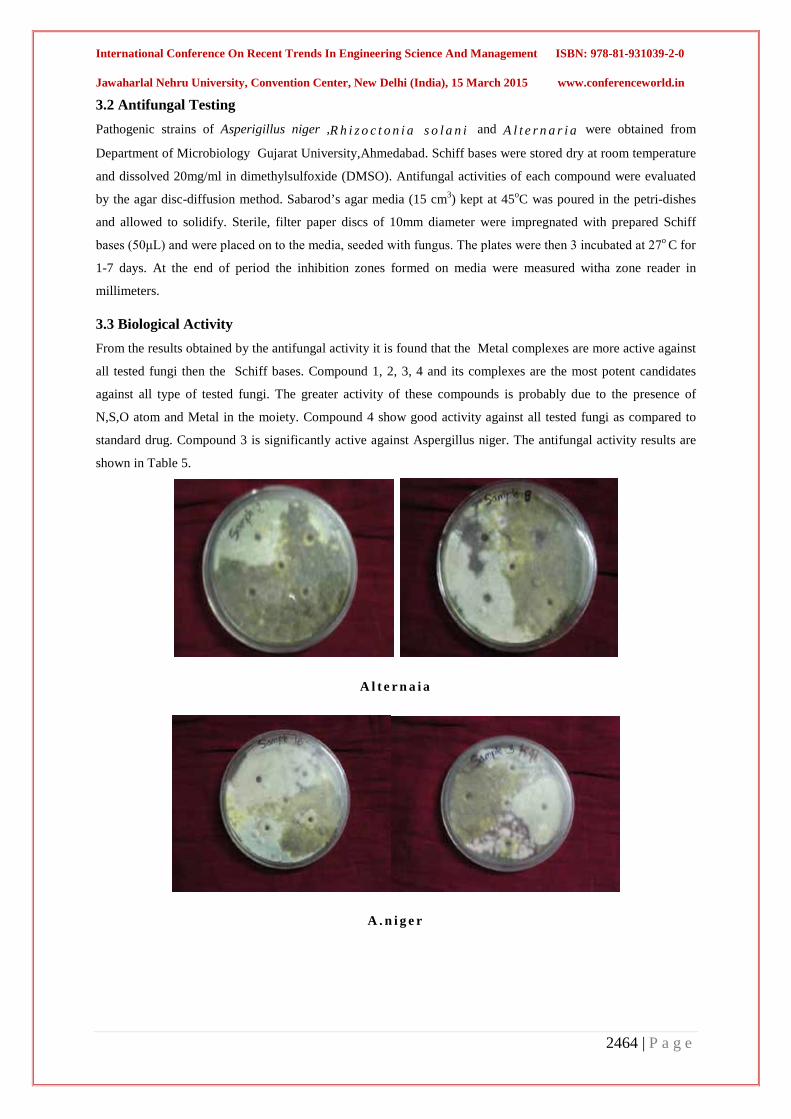
3.2 Antifungal Testing Pathogenic strains of Asperigillus niger ,R h i z o c t o n i a s o l a n i and A l t e r n a r i a were obtained from
Department of Microbiology Gujarat University,Ahmedabad. Schiff bases were stored dry at room temperature
and dissolved 20mg/ml in dimethylsulfoxide (DMSO). Antifungal activities of each compound were evaluated
by the agar disc-diffusion method. Sabarod’s agar media (15 cm3) kept at 45oC was poured in the petri-dishes
and allowed to solidify. Sterile, filter paper discs of 10mm diameter were impregnated with prepared Schiff
bases (50μL) and were placed on to the media, seeded with fungus. The plates were then 3 incubated at 27o C for
1-7 days. At the end of period the inhibition zones formed on media were measured witha zone reader in
millimeters.
3.3 Biological Activity From the results obtained by the antifungal activity it is found that the Metal complexes are more active against
all tested fungi then the Schiff bases. Compound 1, 2, 3, 4 and its complexes are the most potent candidates
against all type of tested fungi. The greater activity of these compounds is probably due to the presence of
N,S,O atom and Metal in the moiety. Compound 4 show good activity against all tested fungi as compared to
standard drug. Compound 3 is significantly active against Aspergillus niger. The antifungal activity results are
shown in Table 5.
A l t e r n a i a
A . n i g e r

International Conference On Recent Trends In Engineering Science And Management ISBN: 978-81-931039-2-0
Jawaharlal Nehru University, Convention Center, New Delhi (India), 15 March 2015 www.conferenceworld.in
2465 | P a g e
R . S o l a n i
T a b l e 3 A n t i f u n g a l a c t i v i t y o f S c h i f f B a se a n d i t s C o m p l e x e s
The antibacterial activity of the metal chelates against R . S o l a n i , A . N i g a r a n d A l t e r n a r i a were
carried out using Muller Hinton Agar media (Hi media). The activity for anti fungal study is reported in the
Table 3. The plates were then incubated for 18 h at room temperature. Among the various Schiff base -metal
chelates , No 3 and No 7 have been found out to be most effective against these fungi showing maximum clarity
of zones, its antifungal activity was found maximum agains R . S o l a n i > A . N i g a r > A l t e r n a r i a while
compound 3 & 4 was found out to be most effective R . S o l a n i > A l t e r n a r i a > A . N i g a r .
IV. CONCLUSIONS Schiff bases have been synthesized by condensing o-aminophenol, sulphanilamide with O-Vaniline, In this
dissertation we are presenting some Schiff base-metal chelates using ) schiff base derived by O-vaniline with o-
amino phenol, with transition metal ions like Copper, Zinc and Cobalt in solid state. Furthermore these type dyes
and their complexes have been most widely used in field such as biomedical studies, advanced applications in organic
synthesis and high technology areas like lasers, liquid crystalline displays, electro-optical devices, ink-jet printers,
cataysts, fluorescence properties. The complexes are colored and stable in air at room temperature. Based on the
experimental evidence thus obtained the complexes were characterized as six – coordinates, via the three bonding
siets of the azomethine nitrogen atom , hydroxyl group of the ligand, suggested to possess octahedral structures.The
S r .
N o .
N a m e o f c o p m o u n d G r o w t h d i a m e t e r i n n m ( % i n h i b i t i o n )
A . N i g a r R . S o l a n i A l t e r n a r i a
1 D M S O ( c o n t r o l ) 1 2 1 5 1 9
2 C o m p o u n d 3 2 1 3 4 2 6
3 C o m p o u n d 4 2 0 3 1 2 6
4 Complex 1 1 8 2 8 3 2
5 Complex 2 2 0 2 9 2 9
6 Complex 3 2 2 ( 2 3 ) 3 1 ( 3 2 ) 2 7 ( 3 0 )

International Conference On Recent Trends In Engineering Science And Management ISBN: 978-81-931039-2-0
Jawaharlal Nehru University, Convention Center, New Delhi (India), 15 March 2015 www.conferenceworld.in
2466 | P a g e
results of the antifungal screening of the test compounds indicate mild to moderate antifungal activities with
Asperigillus niger ,R h i z o c t o n i a s o l a n i and A l t e r n a r i a fungi.
V. ACKNOWLEDGEMENTS
The authors gratefully acknowledge the financial assistance provided by GUJCOST, Gandhinagar and
University Grant Commission (UGC), New Delhi. The authors also acknowledge CSMCRI
(Bhavanagar), GFSU (Gandhinagar), CDRI (Lucknow) for providing instrumental facilities and
INFLIBNET, Ahmedabad for e-journals.We are also thankful to Department of Microbiology
(Gujarat University) for help in antimicrobial studies.
REFERENCES 1. S. Patai, the Chemistry of the carbon-nitrogen double bond, John Wiley & Sons Ltd., London, 1970.
2. Z. Cimerman, S. Miljanic and N. Galic, Croatica Chemica Acta, 2000, 73 (1), 81- 95.
3. B. F. Perry, A. E. Beezer, R. J. Miles, B. W. Smith, J. Miller and M. G. Nascimento, Microbois., 1988, 45,
181.
4. A. Elmali, M. Kabak and Y. Elerman, J. Mol. Struct., 2000, 477, 151.
5. P. R. Patel, B. T. Thaker and S. Zele, Indian J. Chem., 1999, 38 A, 563.
6. M. Valcarcel and M. D. Laque de Castro, "Flow-Throgh Biochemical Sensors", Elsevier, 1994,
Amsterdam.
7. U. Spichiger-Keller, "Chemical Sesors and Biosensors for Medical and Biological Applications", Wiley-
VCH,1998, Weinheim.
8. J. F. Lawrence and R. W. Frei, "Chemical Derivatization in Chromatography", Elsevier, 1976, Amsterdam.
9. S. Patai, Ed., "The Chemistry of the Carbon-Nitrogen Double Bond", J. Wiley & Sons, 1970, London.
10. P. Singh, R. L. Goel and B. P. Singh, J. Indian Chem. Soc., 1975, 52, 958.
11. S. D. Ittel, L. K. Johnson, M. Brookhart, Chem. Rev., 2000, 100, 1169.
12. J.J.Bao, Meny and Rintoul, Coordination Chemistry Reviews, 250 (3-4), P.424-448 (2006)
13. H. Nora. Al-Shaalan, Molecules, 12, 1080-1091 (2005).
14. L. Savanini, L. Chiasserini, A. Gaeta, C. Pellerano, Biorg. Med. Chem. 10, 2193-2198, (2007).
15. R. K. Agarwal, L. Singh, D.K Sharma, Turk J.Chem. 29, 309 – 310 (2007).
16. G. H. Olie, and S. Olive, Springer, Berlin (1984).
17. S. Li, S. Chen, H.Ma, R. Yu and D. Liu, Corros. Sci, 41, 1273 (1999).
18. S. Li, S. Chen, H.Ma, R. Yu and D. Liu, Corros. Sci, 41, 1273 (1999).
19. H. Ashassi-Sorkhabi, B.Shabani, B. Aligholipour and D.Seifzadeh , Appl. Surf. Sci., 252, 4039 (2006).
20. Z.Quan, S.Chen and Y. Li, Corros. Sci., 43 (2001)1071.
21. D.R. Williams, Chem. Rev., 72, 203 (1972).
22. A. Campos, J.R. Anacona and M.M. Campos-Vallette, Mian group Metal chem., 22, 283 (1999).
23. N. Sari, S. Arslan, E. Logoglu and I. Sakiyan, G.U.J. Sci, 16, 283 (2003).
24. M. Verma, S.N. Pandeya, K N. Singh, J P. Stabler and Acta Pharm., 54, 49 (2004).
25. P.G. Cozzi, Chem. Soc. Rev., 410 (2004).
26. S. Chandra, J. Sangeetika, J. Indian Chem. Soc, 81, 203 (2004).

International Conference On Recent Trends In Engineering Science And Management ISBN: 978-81-931039-2-0
Jawaharlal Nehru University, Convention Center, New Delhi (India), 15 March 2015 www.conferenceworld.in
2467 | P a g e
27. A.M. Mahindra and J.M. Fisher, Rabinovitz., Nature (London), 303, 64 (1983)
28. S.N. Pandeya, P. Yogecswari, D. Sriram, Chemotherapy, 45,192 (1999).
29. W.J. Sawodny and M. Riederer, Angew. Chem. Int. Edn. Engi. 16, 859 (1977).
30. A. Bottcher, T. Takeuchi, M.I. Simon, T.J. Meade and H.B. Gray, J. Inorg. Bio-Chem., 59, 221 (1995).
31. G.L.P. Britovsek, V.V. Gibson, S. Mastroianni, D.C.H. Oakes, C. Redshaw, G.A. Solan, A.J.P. White,
D.J.Williams, Eur. J. Inorg. Chem., 431, 2 (2001).
32. B. Sun, J. Chen, J.Y. Hu, Lix., J. Chin. Chem. Soc, 12, 1043 (2001).
33. D.M. Boghaei and S. Mohebi, , Tetrahederon, 58, 5357 (2002).
34. S.Y. Liu, D.G. Nocera, , Tetrahedron Lett., 47, 1923 (2006).
35. A. Budakoti, M. Abid and A. Azam, Eur. J.Med. Chem., 41, 63 (2006).
36. A.R.F akhari et al./ Talanta 66 (2005) 813–817.
37. Nishinaga A, Yamada T, Fujisawa H & Ishizaki K, Catalysis by cobalt Schiff complexes in the oxygenation
of alkenes on the mechanism of ketonization, J Mol Catal, 48 (1988) 249-64,(1276); Chem Abstr, 111
(1989) 22902.
38. Meng F, Zhao Q, Li M & Xin Y, Yingyong Huaxue, 19 (2002) 1183-1185; Chem Abstr, 138 (2003) 330746.
39. Kozlov N S, Korotyshova G P, Rozhkova N G & Andreeva E I, Synthesis of fluorine containing aromatic
azomethines with a pesticidal activity, Vesti Akad Navuk USSR Ser Khim Navuk, 2 (1986); Chem Abstr, 106
(1987) 155955.
40. Wang Y, Lu B, Yu X, Ye W & Wang S, Studies of synthesis and plant harmone on Schiff bases of
tetrazole, Chem J Internet, 3 (2001); Chem Abstr, 137 (2002) 109238.
41. Hadjipavlu L, Dimitra J, Geronikaki & Athina A, Thiazolyl and benzothiazolyl Schiff base as novel
possible lipoxygenase inhibitors and anti-inflammatory agents, Drug Des Discovery, 15 (1998) 199-206;
Chem Abstr, 129 (1998) 148934.
42. Sharma K P, Jolly V S & Pathak P, Schiff base and their derivatives as potential anticancer agents, Ultra
Sci Phys Sci,10 (1998) 263-266; Chem Abstr, 130 (1999) 346977.
43. Ferrerira G C, Neame P J & Dailey H A, Heme biosynthesis in mammalian system, Evidence of a Schiff
base linkage between the pyridoxal 5’-phosphate cofactor and alysine residue in 5- aminoevuliinate
synthesis, Protein Sci, 2 (1993) 1959-1965.
44. Toyota E, Sekizaki H, Takahashi Y, Kunihiko & Tanizawa K, Amidino containing Schiff base Cu(II) and
Fe(II) chelates as a thrombin inhibitor, Chem Pharm Bull, 53 (2005) 22-26; Chem Abstr, 143 (2005) 37905.
45. Szwer G & Benjamin S, Carnosine and anseine act as effective trans glycating agents in decomposition of
aldose-derived Schiff bases, Biochem Biophys Res Comm, 336 (2005) 36-41

International Conference On Recent Trends In Engineering Science And Management ISBN: 978-81-931039-2-0
Jawaharlal Nehru University, Convention Center, New Delhi (India), 15 March 2015 www.conferenceworld.in
2468 | P a g e
POWER QUALITY ENHANCEMENT USING
DISTRIBUTION STATIC COMPENSATOR
(DSTATCOM) Ankit M. Patel1, Viral R. Patel2, Maulik V. Patel3
1,2 Department of Electrical Engineering (Power System), LDRP-ITR, Gandhinagar (India) 3Department of Electrical Engineering, LDRP-ITR, Gandhinagar (India)
ABSTRACT FACTS (Flexible AC Transmission System) devices observe various Power Quality issues that we have been
studied. In FACTS, power electronics devices & their switching control strategies are used for improving the
power flow in transmission & distribution network and improve the power quality. The Distribution Static
Compensator (DSTATCOM) is a type of FACTS Controller. It is shunt compensation device which is used to
solve power quality problems in distribution system. It is used for compensation of reactive power, mitigates
harmonics and unbalanced caused by various loads in distribution system. In this paper three phase three wire
distribution static compensator system is proposed for power quality improvement. The Control algorithm is
based on Synchronous Reference Frame (SRF) algorithm. The system is modelled by using MATLAB/Simulink
software and performance is observed.
Keywords – Distribution Static Compensator, Facts (Flexible Ac Transmission System), PLL
(Phase Locked Loop), Power Quality, Reactive Power, SRF (Synchronous Reference Frame)
I. INTRODUCTION Power Quality is the most important topic that has been of interest to electrical engineer in recent years. Major
Power Quality problems like Voltage Sag, Swell, Harmonics, Power Factor problems etc. Power Quality is
related with sensitive load like computers, semiconductor manufacturing plants, and food processing plants as a
voltage dip. Most of the power quality problems originate in distribution system. These problems like excessive
harmonic in current causes such as wiring failure, transformer over heat, malfunction of electrical equipment,
affect efficiency of the equipment. Many Custom Power Devices such as DSTATCOM, DVR (Dynamic voltage
restorer), etc which are used for mitigate above problems. In this paper, we consider the use of DSTATCOM to
address the issue of Harmonic mitigation [1]. Dstatcom is a voltage source converter (VSC) based shunt FACTS
Controller device. It essentially consists of voltage source converter (VSC) in parallel with a DC link capacitor
along with an interface inductor, through which current is injected into the line [1]. In fig. 1 show the single line
diagram of Dstatcom model consists source, load & Dstatcom which is connected to the PCC as indicated in fig.
In this paper, voltage at point of common coupling (PCC) is controlled and made balanced so that source current
can be balanced, even when load is unbalanced and non linear, to remove switching frequency component of the
voltage source converter (VSC) to the point of common coupling (PCC) voltage. A filter is connected at the
output of voltage source converter [2].

International Conference On Recent Trends In Engineering Science And Management ISBN: 978-81-931039-2-0
Jawaharlal Nehru University, Convention Center, New Delhi (India), 15 March 2015 www.conferenceworld.in
2469 | P a g e
Fig. 1: Single line Diagram of DSTATCOM
The scheme of DSTATCOM is shown in Fig. 1 in this system a load that can be unbalanced or non linear is
connected with a balance source (Vs) through a feeder. Resistance and Inductance of feeder are R and L. A
DSTATCOM that contains a voltage source converter (VSC) and filter which is connected at output of voltage
source converter (VSC) that is used to compensate the load, the voltage source converter (VSC) is supplied by
the DC storage capacitor Cdc. The aim of this scheme is to balance the three phase Point of common coupling
(PCC) Voltage.
II. MODES OF DSTATCOM OPERATION The basic VSC based DSTATCOM operating principle is to control current flow by generation and absorption
of controllable active/ reactive power for compensating voltage variation and unbalance active and reactive
power. Therefore the DSTATCOM can be treated as voltage controlled source. The VSC converts the DC
voltage across the DC storage device into set of three phase AC output voltages. These voltages are
synchronized with the main network voltage and coupled with the AC system through the reactance of the
coupling transformer which can be combined with the reactance of a filter, shown in fig. 2 [3] [4].
Fig. 2: Basic Configuration Of DSTATCOM Devices
The operation of DSTATCOM, the active and reactive power flow between the system voltages and the
DSTATCOM voltage are considered and written as
Sin § (1)
International Conference On Recent Trends In Engineering Science And Management ISBN: 978-81-931039-2-0
Jawaharlal Nehru University, Convention Center, New Delhi (India), 15 March 2015 www.conferenceworld.in
2470 | P a g e
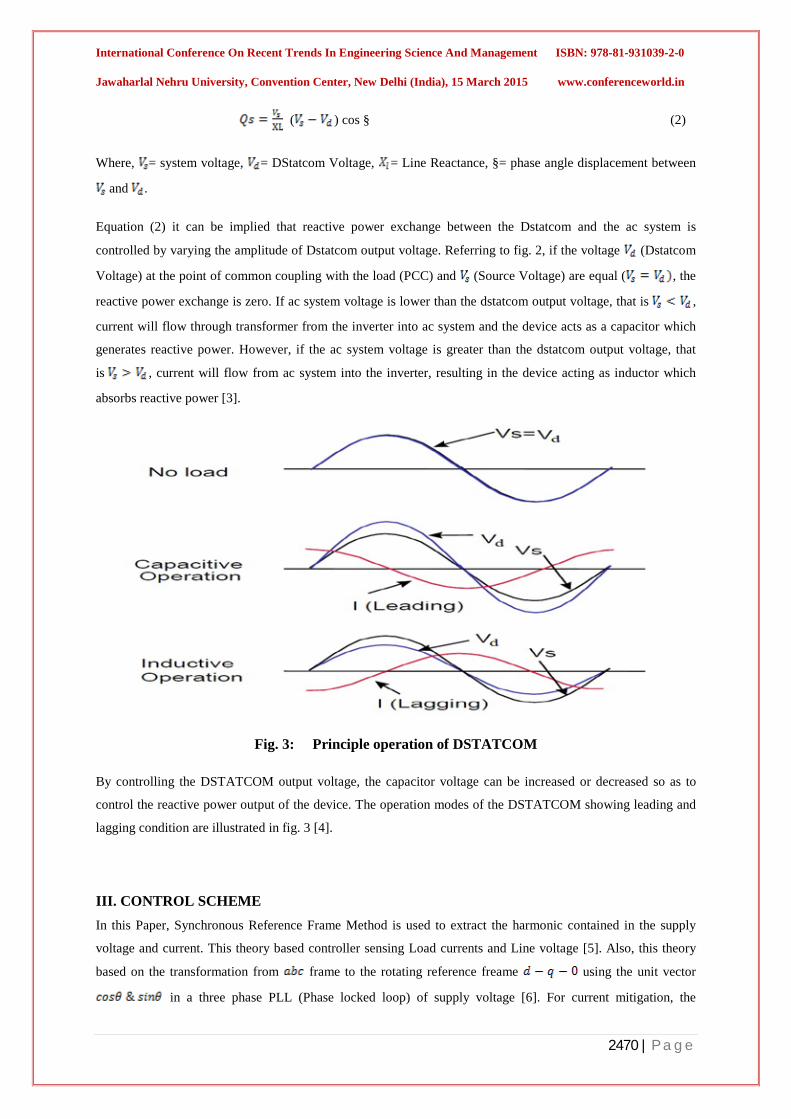
( ) cos § (2)
Where, = system voltage, = DStatcom Voltage, = Line Reactance, §= phase angle displacement between
and .
Equation (2) it can be implied that reactive power exchange between the Dstatcom and the ac system is
controlled by varying the amplitude of Dstatcom output voltage. Referring to fig. 2, if the voltage (Dstatcom
Voltage) at the point of common coupling with the load (PCC) and (Source Voltage) are equal ( , the
reactive power exchange is zero. If ac system voltage is lower than the dstatcom output voltage, that is ,
current will flow through transformer from the inverter into ac system and the device acts as a capacitor which
generates reactive power. However, if the ac system voltage is greater than the dstatcom output voltage, that
is , current will flow from ac system into the inverter, resulting in the device acting as inductor which
absorbs reactive power [3].
Fig. 3: Principle operation of DSTATCOM
By controlling the DSTATCOM output voltage, the capacitor voltage can be increased or decreased so as to
control the reactive power output of the device. The operation modes of the DSTATCOM showing leading and
lagging condition are illustrated in fig. 3 [4].
III. CONTROL SCHEME In this Paper, Synchronous Reference Frame Method is used to extract the harmonic contained in the supply
voltage and current. This theory based controller sensing Load currents and Line voltage [5]. Also, this theory
based on the transformation from frame to the rotating reference freame using the unit vector
in a three phase PLL (Phase locked loop) of supply voltage [6]. For current mitigation, the

International Conference On Recent Trends In Engineering Science And Management ISBN: 978-81-931039-2-0
Jawaharlal Nehru University, Convention Center, New Delhi (India), 15 March 2015 www.conferenceworld.in
2471 | P a g e
distorted current are convert into two phase stationary coordinates using transformation. The Load
current are divide into active & reactive component by using clark’s & park’s transformation. The clark
transformation is used to convert three phase current to two phase current in stationary frame which are also
called component & Prank’s transformation is used to convert these current in stationary frame
to synchrously rotating frame which are also known as component . The - component is
the active part and - component is the reactive part of the load current. Both active & reactive current
component of current are generated using the output of PI controller. & Reference dc voltage given to the PI
Controller. These components of reference currents are used to generate three phase fundamental
reference source current *, *, * by using inverse park’s and clark’s transformation [7]. Fig. 4 shows the
block diagram of the SRF (Synchronous Reference Frame) based controller. The AC components are eliminated
using low pass filters (LPF) and DC component is the fundamental frequency part of the load current [6].
Reference Source Current *, *, * are compared with sensed source currents , in order to
generate six signal for gate signal for IGBTs of VSC.
The benefit of this transformation method is we can easily control dstacom, also gives information about current
unbalance, faults in phases. The quantities are expressed in the instantaneous space vectors. The load currents
which are in a-b-c frame are first transformed into frame using clark’s transformation as shown in
equation (3).
= (3)
If is the transformation angle, then the currents transformation from to is defined as in equation
(4)
= (4)
Inverse Park’s transformation can now applied to obtain three phase reference current in coordinates
from the dc components given by equation (5)
= (5)

International Conference On Recent Trends In Engineering Science And Management ISBN: 978-81-931039-2-0
Jawaharlal Nehru University, Convention Center, New Delhi (India), 15 March 2015 www.conferenceworld.in
2472 | P a g e
Fig. 4: Block Diagram of SRF based controller
IV. MATLAB SIMULATION MATLAB based models of three phases three wire grid connected system is shown in simulation fig. 5 and fig.
7. In this system non linear load are connected at load side which can affect the source voltage and current and
also it can cause unbalance into the system, increase harmonics. In this simulation first we observe simple three
phase three wire system without Dstatcom, and then connect Dstatcom in parallel into the system and then
measure the THD (Total Harmonic Distortion).
4.1 Three Phase Three wire system (without Dstatcom)
Fig. 5: Three Phase Three wire system (without Dstatcom)
In Fig. 2 there is a direct supply feed to the load. Here Load is nonlinear type load. The nonlinear waveforms of
current appear on the load measurement side because of nonlinear load, which is directly affecting the source
current. By the nonlinear connection of load the sinusoidal source current is become distorted and become
nonlinear just like load current. So, in this condition load current is equal to source current (iL= iS) shown in Fig.
6 and Fig. 7
International Conference On Recent Trends In Engineering Science And Management ISBN: 978-81-931039-2-0
Jawaharlal Nehru University, Convention Center, New Delhi (India), 15 March 2015 www.conferenceworld.in
2473 | P a g e
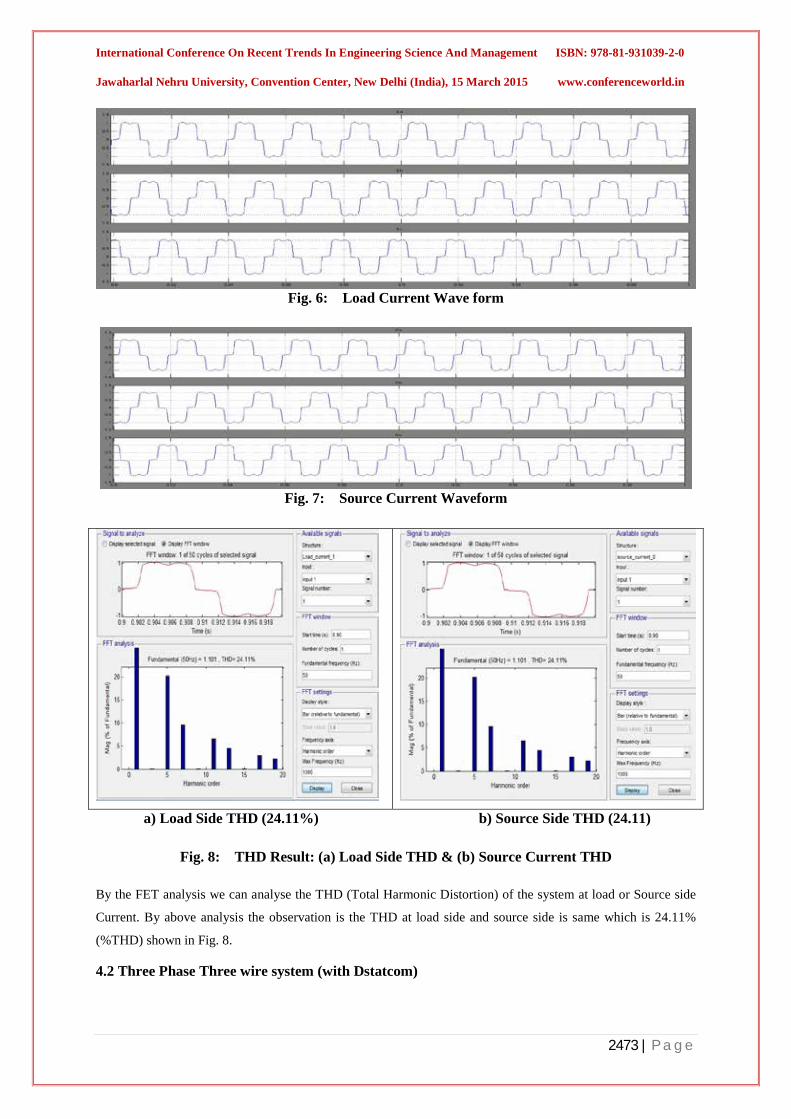
Fig. 6: Load Current Wave form
Fig. 7: Source Current Waveform
a) Load Side THD (24.11%) b) Source Side THD (24.11)
Fig. 8: THD Result: (a) Load Side THD & (b) Source Current THD
By the FET analysis we can analyse the THD (Total Harmonic Distortion) of the system at load or Source side
Current. By above analysis the observation is the THD at load side and source side is same which is 24.11%
(%THD) shown in Fig. 8.
4.2 Three Phase Three wire system (with Dstatcom)

International Conference On Recent Trends In Engineering Science And Management ISBN: 978-81-931039-2-0
Jawaharlal Nehru University, Convention Center, New Delhi (India), 15 March 2015 www.conferenceworld.in
2474 | P a g e
In Fig. 9 there is a direct supply feed to the load. Here Load is nonlinear type load. The nonlinear waveforms of
current appear on the load measurement side because of nonlinear load, which is directly affecting the source
current. Here with the use of Passive type Filter which is connect at PCC (Point of common connection) point
which are used to reduce the harmonics at source current shown in Fig. 10
Fig. 9: Three Phase Three Wire System (with Dstatcom)
Fig. 10: (a) Source Voltage, (b) Source Current, (c) Load Current, (d) DC link build-up
Voltage
International Conference On Recent Trends In Engineering Science And Management ISBN: 978-81-931039-2-0
Jawaharlal Nehru University, Convention Center, New Delhi (India), 15 March 2015 www.conferenceworld.in
2475 | P a g e
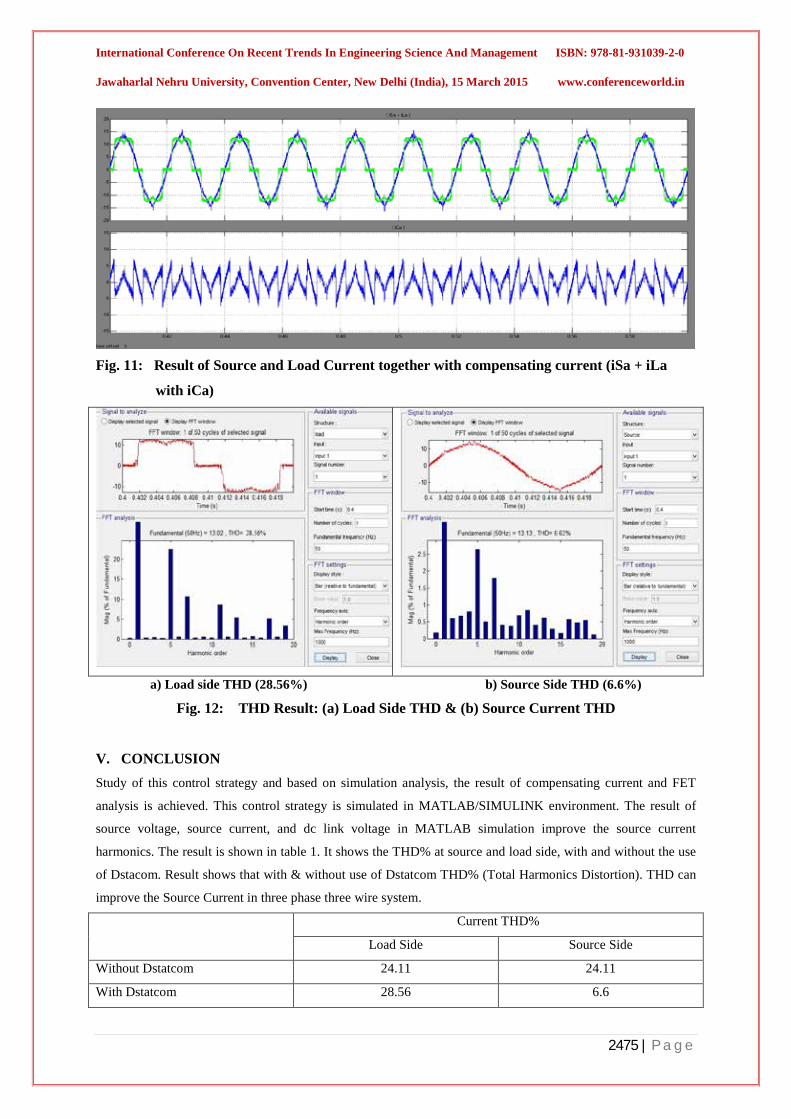
Fig. 11: Result of Source and Load Current together with compensating current (iSa + iLa
with iCa)
a) Load side THD (28.56%) b) Source Side THD (6.6%)
Fig. 12: THD Result: (a) Load Side THD & (b) Source Current THD
V. CONCLUSION Study of this control strategy and based on simulation analysis, the result of compensating current and FET
analysis is achieved. This control strategy is simulated in MATLAB/SIMULINK environment. The result of
source voltage, source current, and dc link voltage in MATLAB simulation improve the source current
harmonics. The result is shown in table 1. It shows the THD% at source and load side, with and without the use
of Dstacom. Result shows that with & without use of Dstatcom THD% (Total Harmonics Distortion). THD can
improve the Source Current in three phase three wire system.
Current THD%
Load Side Source Side
Without Dstatcom 24.11 24.11
With Dstatcom 28.56 6.6

International Conference On Recent Trends In Engineering Science And Management ISBN: 978-81-931039-2-0
Jawaharlal Nehru University, Convention Center, New Delhi (India), 15 March 2015 www.conferenceworld.in
2476 | P a g e
REFERENCES [1] Divya Nair, Ashwini Nambir, “Mitigation of power quality issues using Dstatcom”, IEEE, pp-65,2012
[2] Sachin goyal, Arindam ghosh, Gerad ledwich, “A Hybrid discontinuous Voltage controller for dstatcom
application”, IEEE, 2008
[3] Mahammad A Hannan, “Effect of DC Capacitor size on dstatcom voltage regulation performance
evaluation”, 2012, pp-244
[4] Wei-Neng Chang & Kuan-Dih Yeh, “Design and Implementation of Dstatcom for fast load compensation
of unbalanced loads”, journal of marine science and technology”, vol. 17. No. 4, pp. 257-263, 2009
[5] EnginOzdemir, Metin Kesler, “Synchronous Reference based control method for UPQC under unbalance
& distorted load condition”, IEEE transaction industry electronics, Vol-58, No.9,September-2011
[6] P.jayprakash, bhim singh, kamal Al Haddad, “Comprehensive Study of Dstatcom configuration”, IEEE
transactions on industrial informatics, vol-10, no.2,may-2014
[7] Ritu Sharma, Alka singh, A.N. Jha, “Performance Evaluation of Tuned PI Controller for Power Quality
[8] Chang, wei neng, kaun din, “Design & implementation of Dstatcom with symmetrical compensations
method for fast load compensation of unbalanced distribution system”, 4th IEEE international conference
on power electronics & drive system, vol- 2, pp-801-806, oct-2001

International Conference On Recent Trends In Engineering Science And Management ISBN: 978-81-931039-2-0
Jawaharlal Nehru University, Convention Center, New Delhi (India), 15 March 2015 www.conferenceworld.in
2477 | P a g e
ENERGY-AWARE VIDEO ENCODING FOR IMAGE
QUALITY IMPROVEMENT IN BATTERY-
OPERATED SURVEILLANCE CAMERA G.Sandhiya1, M.Rajkumar2 , Pacha Shobarani 3 , C.S.Anita4
1Asst Professor, Dept of ECE, R.M.K. College of Engineering and Technology, (India) 2,3,4Associate Professor, Dept of CSE, R.M.D Engineering College, (India)
ABSTRACT Growing needs for surveillance in locations without power lines necessitates the development of a surveillance
camera with extremely low power consumption and an assured stable operation until the time of expected run-
out of available energy. The “sum of the absolute difference” has to be used to comparing the video frames, to
identifying the different frame values to be encoding then to storing the memory. So this paper also reducing the
memory space. The sum of the absolute difference will be act as a block search algorithm for varying the video
quality a variable block search will be used. A novel architecture of maintaining the video quality of a
surveillance camera even with low battery backup is proposed. A variable block search algorithm which has the
capability to dynamically adapt the search window size according to external control is introduced. By
searching speed of the variable block search algorithm is very high compared with fixed block search and the
motion estimation quality is moderate. By varying the searching time of the variable block search algorithm, the
Battery backup is reserved to wok a long time than usual. The performance evaluation of timing comparison for
fixed block search algorithm and variable block search algorithm will be done using ALTRA QUARTUS II
TOOL.
Keyword: DS- Diamond search, HD- High Definition, ME- Motion Estimation, P-R-D power-rate-
distortion, SAD- Sum of absolute difference surveillance camera, VBS-Variable block search,
I. INTRODUCTION
To meet the growing demands on public security against crimes, accidents, and disasters, it is necessary to
enhance monitoring functions in places even without power lines, which, in turn, depends on the availability of
battery-operated video camera with very low cost and power consumption. In such a battery-powered
surveillance system, energy management becomes a very critical issue. The primary requirement of such
surveillance system is to capture events of concern and inform the relevant personnel before the battery runs out.
To extend the battery lifetime in the surveillance system until the battery replacement, it needs to be operated in
an event-driven manner, i.e., the system captures events and encodes the images for storage and/or transmission
when and only when the event is detected. However, duration and arrival time of an event is generally assumed
to be uncertain. Such uncertainties make it difficult to predict actual video encoding time and to find the pareto-
optimal (with respect to energy, distortion, and rate, according to the system specification) video encoding
configuration. Conventional methods based on worst-case scenario are likely to waste energy, because the
estimation of event duration is too conservative, i.e., each event is assumed to have the longest possible value. In

International Conference On Recent Trends In Engineering Science And Management ISBN: 978-81-931039-2-0
Jawaharlal Nehru University, Convention Center, New Delhi (India), 15 March 2015 www.conferenceworld.in
2478 | P a g e
smart surveillance systems, video encoding configuration is selected among many encoding configurations with
different distortion and energy consumption levels. In video encoding such as H.264 or MPEG4, the amount of
distortion of a compressed video can be represented as a function of the amount of consumed energy when the
bit rate is constant. In a power-scalable video encoding method is proposed to minimize the energy consumption
in portable video communication devices.
Several methods have been proposed to maximize the overall performance under energy constraints.
II. ENERGY MINIMIZATION OF PORTABLE VIDEO DEVICE
Multimedia has experienced massive growth in recent years due to improvements in algorithms and technology.
An important underlying technology is video coding and in recent years, compression efficiency and complexity
have also improved significantly. Applications of video coding have moved from set-top boxes to internet
delivery and mobile communications. H.264/AVC is the latest video coding standard adopting variable block
size, quarter-pixel accuracy, motion vector prediction and multi-reference frames for motion estimations. Thesis
new features result in higher computation requirements than that for previous coding standards. In this thesis,
we propose to maintain video quality in surveillance camera even with low battery backup.
Portable video communication devices operate on batteries with limited energy supply. However, video
compression is computationally intensive and energy-demanding. Therefore, one of the central challenging
issues in portable video communication system design is to minimize the energy consumption of video encoding
so as to prolong the operational life time of portable video devices.
In this work, based on power-rate-distortion (P-R-D) optimization, we develop a new approach for energy
minimization by exploring the energy tradeoff between video encoding and wireless communication and
exploiting the non stationary characteristics of input video data. Both analytically and experimentally, we
demonstrate that incorporating the third dimension of power consumption into conventional R-D analysis gives
us one extra dimension of flexibility in resource allocation and allows us to achieve significant energy saving.
Within the P-R-D analysis framework, power is tightly coupled with rate, enabling us to trade bits for joules and
perform energy minimization through optimum bit allocation. We analyze the energy saving gain of P-R-D
optimization by using Variable block search algorithm (VBS). We develop an adaptive scheme to estimate P-R-
D model parameters and perform online resource allocation and energy optimization for real-time video
encoding. Our experimental studies show that, for typical videos with non stationary scene statistics, using the
proposed P-R-D optimization technology, the energy consumption of video encoding can be significantly
reduced (by up to 50%), especially in delay-tolerant portable video communication applications.
There are three things to be chosen to develop motion estimation algorithm. They are Block matching
algorithm, Search algorithm for motion estimation and Type of motion estimation algorithm.
III. TYPE OF MOTION ESTIMATION ALGORITHM
3.1 Fixed Block Size Motion Estimation In the first generation coding standards, the block size is confined to 8 by 8 or 16 by 16. A large block size
favors encoding of a uniform area whereas small block sizes favor detailed area encoding. Within a picture,
detailed uniform areas coexist and fixed block sizes must sacrifice prediction quality to reduce complexity.

International Conference On Recent Trends In Engineering Science And Management ISBN: 978-81-931039-2-0
Jawaharlal Nehru University, Convention Center, New Delhi (India), 15 March 2015 www.conferenceworld.in
2479 | P a g e
3.2 Variable Block Size Motion Estimation In order to adaptively select a suitable block size for picture macroblocks, variable block size motion estimation
has been added in the latest codec standards, e.g. H.264. In H.264, each picture (frame) is segmented into
macroblocks. Each macroblocks is further divided into sub-blocks with 7 different types of block sizes (4x4,
4x8, 8x4, 8x8, 8x16, 16x8 and 16x16). Each macroblocks has in total 41 types of sub-blocks to cover the whole
macroblocks. In variable block size motion estimation, for each type of subblocks, a motion vector is produced.
In total 41 motion vectors are calculated per macroblocks. Variable block size motion estimation the signal to
noise ratio is increased. So it is best suited motion estimation procedure.
Fig 1.Variable block sizes
3.3 Reference and Current Frames Each picture is segmented into macro blocks. Each macro block is further divided into sub-blocks with 7
different types of block sizes (4x4, 4x8, 8x4, 8x8, 8x16, 16x8 and 16x16). After motion estimation, a picture
residue and a set of motion vectors are produced. The following procedure is executed for each block in the
current frame.
1. For the reference frame, a search area is defined for each block in the current frame. The search area is
typically sized at 2 to 3 times the macroblocks size (16x16). Using the fact that the motion between consecutive
frames is statistically small, the search range is confined to this area. After the search process, a ‘best” match
will be found within the area. The ‘best’ matching usually means having lowest energy in the sum of residual
formed by subtracting the candidate block in search region from the current block located in current frame. The
process of finding best match block by block is called block-based motion estimation.
2. When the best match is found, the motion vectors and residues between the current block and reference block
are computed. The process of getting the residues and motion vectors is known as motion compensation.
3. The residues and motion vectors of best match are encoded by the transform unit and entropy unit and
transmitted to the decoder side.
4. At decoder side, the process is reversed to reconstruct the original picture.

International Conference On Recent Trends In Engineering Science And Management ISBN: 978-81-931039-2-0
Jawaharlal Nehru University, Convention Center, New Delhi (India), 15 March 2015 www.conferenceworld.in
2480 | P a g e
Fig 2. Motion Estimation
IV. BLOCK MATCHING ALGORITHM
4.1 Sum of Absolute Difference (Sad) It is a widely used, extremely simple algorithm for measuring the similarity between image blocks. It works by
taking the absolute difference between each pixel in the original block and the corresponding pixel in the block
being used for comparison. These differences are summed to create a simple metric of block similarity, the L1
norm of the difference image. The sum of absolute differences may be used for a variety of purposes, such as
object recognition, the generation of disparity maps for stereo images, and motion estimation for video
compression.
SAD algorithm is frequently used in motion estimation process.SAD algorithm is used for measuring
similarities between the image frames. It is very efficient in hardware implementation, very fast and simple to
calculate.
4.1.1 Formula
Where SAD=sum of absolute difference. x, y, r, s are the block search parameters.
Fig 3. Sads of Larger Sub-Blocks are Obtained By Summing Up The Sads of Smaller Sub Blocks
For example:
Template Search image
2 5 5 2 7 5 8 6
4 0 7 1 7 4 2 7
7 5 9 8 4 6 8 5

International Conference On Recent Trends In Engineering Science And Management ISBN: 978-81-931039-2-0
Jawaharlal Nehru University, Convention Center, New Delhi (India), 15 March 2015 www.conferenceworld.in
2481 | P a g e
Calculating the SAD values for each of these locations gives the following:
Left Center Right
0 2 0 5 0 3 3 3 1
3 7 3 3 4 5 0 2 0
1 1 3 3 1 1 1 3 4
SAD value are 20, 25 and 17
Right side of the search image is the most similar to the template image, because it has the least difference as
compared to the other locations.
4.1.2 Sad Reuse Technique
To maximize distortion data reuse, a new fast VBSME algorithm is proposed. The proposed fast variable block
size motion estimation (FVBSME) algorithm unifies the motion search of different subblocks into a single
motion search process. Full distortion data reuse is achieved and thus reduces computational complexity
substantially. A novel stopping criterion and filled search pattern are used, which guarantee that all the 41 MVs
are pointing to a local or global distortion minimum during convergence.
V. BATTERY BASICS
A battery cell is characterized by the open-circuit potential (VOC), i.e. the initial potential of a fully charged cell
under no-load conditions, and the cut-off potential (Vcut) at which the cell is considered discharged. Each cell
consists of an anode, a cathode and the electrolyte that separates the two electrodes. The electrical current
obtained from a cell results from electrochemical reactions occurring at the electrode-electrolyte interface. The
two important effects that make battery performance sensitive to the discharge profile are (i) Rate Capacity
effect, and (ii) Recovery effect.
Fig 4:Non Ideal-Battery Properties: (A) Rate Capacity Effect, (B) Recovery Effect The lifetime of a cell depends on the availability and reachability of active reaction sites in the cathode. When
discharge current is low, the inactive sites (made inactive by previous cathode reactions) are distributed
uniformly throughout the cathode. But, at higher discharge current, reductions occur at the outer surface of the
cathode making the inner active sites inaccessible. Hence, the energy delivered (or the battery lifetime)
decreases since many active sites in the cathode remain un-utilized when the battery is declared discharged.
Concentration of the active species (charged ions of Lithium and Nickel) is uniform at electrode-electrolyte
interface at zero current. As the intensity of the current is increased, the deviation of the concentration from the
average becomes more significant and the state of charge as well as the cell voltage decrease. This phenomenon
is called Rate Capacity effect. Figure shows the loss of capacity with increasing load current for a typical NiCd
battery. The C rating is specified as the capacity for a given time of discharge.
International Conference On Recent Trends In Engineering Science And Management ISBN: 978-81-931039-2-0
Jawaharlal Nehru University, Convention Center, New Delhi (India), 15 March 2015 www.conferenceworld.in
2482 | P a g e
VI. SEARCH ALGORITHM
The faster approach is the block based motion estimation. The candidates frame is divided into non-overlapping
blocks ( of size 16 × 16, or 8 × 8 or even 4 × 4 pixels in the recent standards) and for each such candidate block,
the best motion vector is determined in the reference frame. Here, a single motion vector is computed for the
entire block The search algorithms are full search and diamond search.
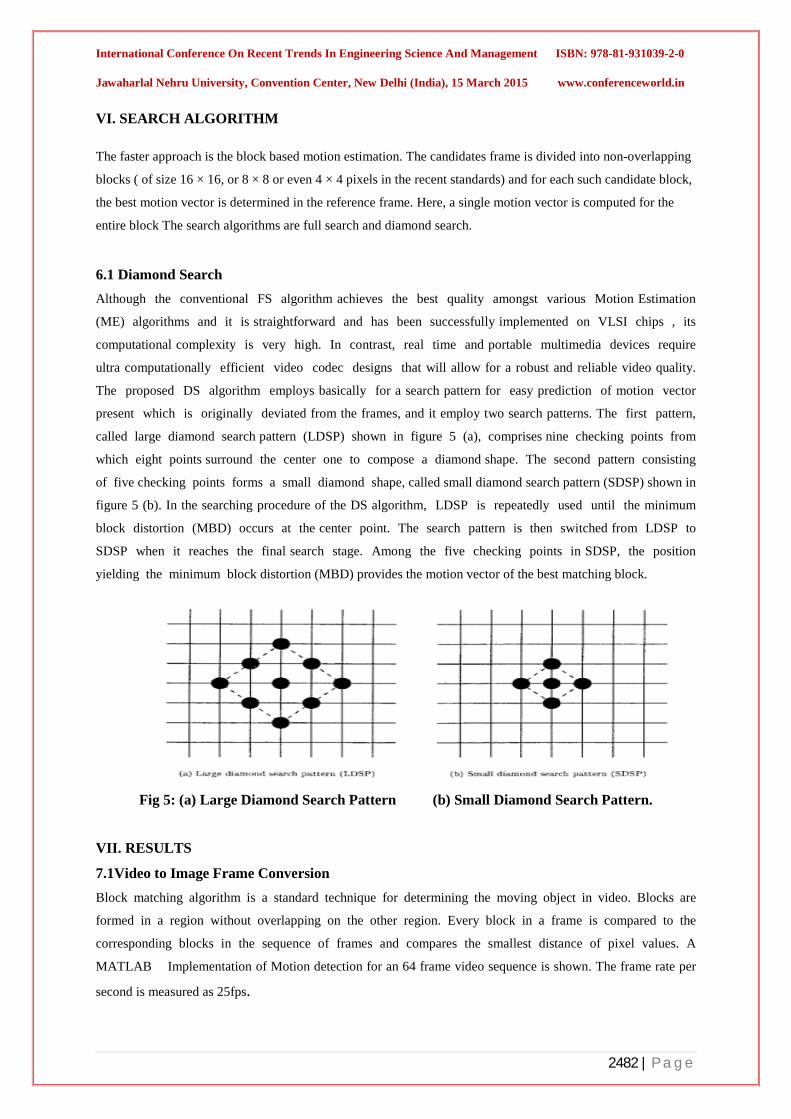
6.1 Diamond Search Although the conventional FS algorithm achieves the best quality amongst various Motion Estimation
(ME) algorithms and it is straightforward and has been successfully implemented on VLSI chips , its
computational complexity is very high. In contrast, real time and portable multimedia devices require
ultra computationally efficient video codec designs that will allow for a robust and reliable video quality.
The proposed DS algorithm employs basically for a search pattern for easy prediction of motion vector
present which is originally deviated from the frames, and it employ two search patterns. The first pattern,
called large diamond search pattern (LDSP) shown in figure 5 (a), comprises nine checking points from
which eight points surround the center one to compose a diamond shape. The second pattern consisting
of five checking points forms a small diamond shape, called small diamond search pattern (SDSP) shown in
figure 5 (b). In the searching procedure of the DS algorithm, LDSP is repeatedly used until the minimum
block distortion (MBD) occurs at the center point. The search pattern is then switched from LDSP to
SDSP when it reaches the final search stage. Among the five checking points in SDSP, the position
yielding the minimum block distortion (MBD) provides the motion vector of the best matching block.
Fig 5: (a) Large Diamond Search Pattern (b) Small Diamond Search Pattern.
VII. RESULTS
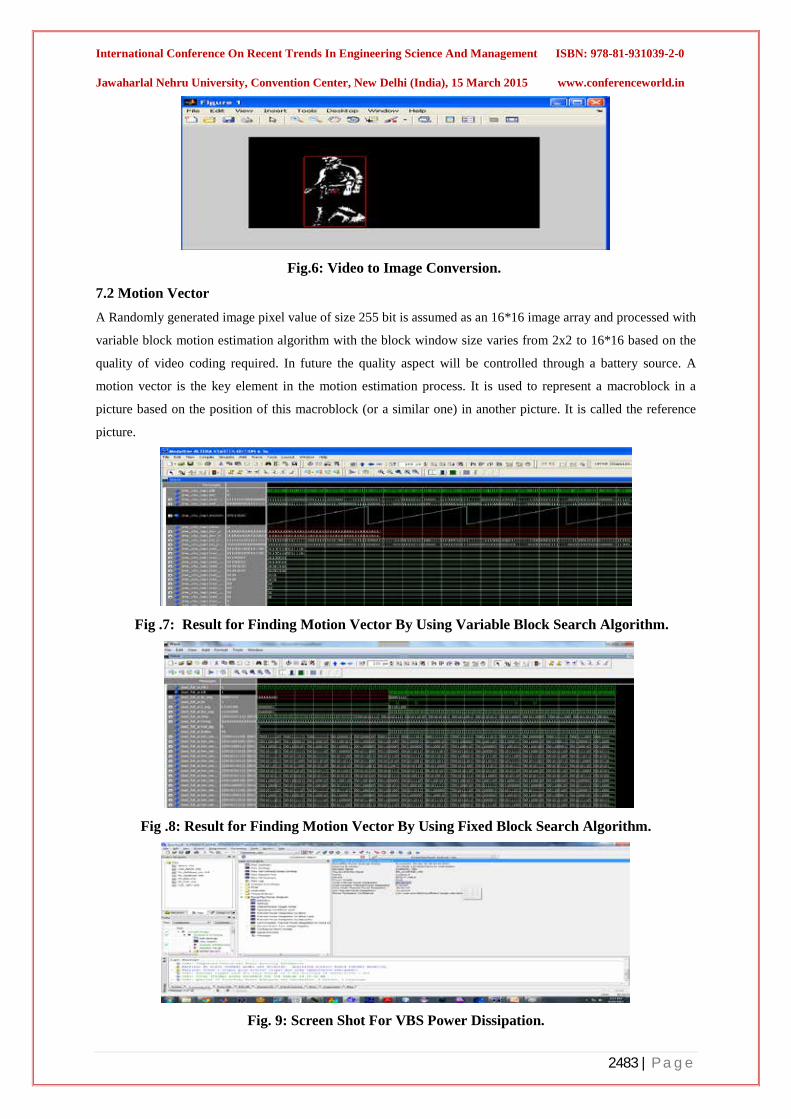
7.1Video to Image Frame Conversion Block matching algorithm is a standard technique for determining the moving object in video. Blocks are
formed in a region without overlapping on the other region. Every block in a frame is compared to the
corresponding blocks in the sequence of frames and compares the smallest distance of pixel values. A
MATLAB Implementation of Motion detection for an 64 frame video sequence is shown. The frame rate per
second is measured as 25fps.
International Conference On Recent Trends In Engineering Science And Management ISBN: 978-81-931039-2-0
Jawaharlal Nehru University, Convention Center, New Delhi (India), 15 March 2015 www.conferenceworld.in
2483 | P a g e
Fig.6: Video to Image Conversion.
7.2 Motion Vector A Randomly generated image pixel value of size 255 bit is assumed as an 16*16 image array and processed with
variable block motion estimation algorithm with the block window size varies from 2x2 to 16*16 based on the
quality of video coding required. In future the quality aspect will be controlled through a battery source. A
motion vector is the key element in the motion estimation process. It is used to represent a macroblock in a
picture based on the position of this macroblock (or a similar one) in another picture. It is called the reference
picture.
Fig .7: Result for Finding Motion Vector By Using Variable Block Search Algorithm.
Fig .8: Result for Finding Motion Vector By Using Fixed Block Search Algorithm.
Fig. 9: Screen Shot For VBS Power Dissipation.

International Conference On Recent Trends In Engineering Science And Management ISBN: 978-81-931039-2-0
Jawaharlal Nehru University, Convention Center, New Delhi (India), 15 March 2015 www.conferenceworld.in
2484 | P a g e
Fig . 10 Screen shot for FBS power dissipation.
VIII. COMPARISON TABLE FOR FBS AND VBS POWER DISSIPATION
POWER DISSIPATION FBS VBS
TOTEL THERMAL POWER
DISSIPATION
656.67MW 233.51MW
DYNAMIC THERMAL
POWER DISSIPATION
0.00MW 0.00MW
STATIC THERMAL POWER
DISSIPATION
220.94MW 176.63MW
I/O THERMAL POWER
DISSIPATION
435.73MW 56.88MW
IX. CONCLUSION Our algorithm proposals are suitable for low power devices ,low bit rate applications and designing consumer
electronics product that require real time processing or compression at affordable price. Thus a successful
implementation of utilizing the known Variable Block search Algorithm for maximizing battery backup lifetime
is done using Modelsim simulator. The performance evaluation of existing fixed block motion search is
compared with Variable block search algorithm and the Power analysis report of Quartus Synthesizer Tool
suggests the betterment of VBS over FBS for implementing in Battery life time maximization
REFERENCES
1] D. Alfonso, F. Rovati, D. Pau, and L. Celetto, “An innovative, programmable architecture for ultralow
powermotion estimation in reduced memory MPEG-4 encoder,” in Dig. Tech. Papers Int. Conf. Consumer
Electron., 2002, pp.344–345.
[2] K. Babionitakis, G. Doumenis, G. Georgakarakos, G.Lentaris, K.Nakos, D. Reisis, I. Sifnaios, and N.
Vlassopoulos,“A real-time motion estimation FPGA architecture,” J. Real-Time Image Process.,vol. 3, no.
1–2, pp. 3–20, Mar. 2008.
[3] C.-Y. Chen, S.-Y. Chien, Y.-W. Huang, T.-C. Chen, T.-C.Wang, and L.-G. Chen, “Analysis and architecture
design of variable block-size motion estimation for H.264/AVC,” IEEE Trans. Circuits Syst. I, Reg.Papers,
vol. 53, no. 3, pp. 578–593, Mar. 2006.1[Online]. Available: http://sharpeye.borelspace.com/

International Conference On Recent Trends In Engineering Science And Management ISBN: 978-81-931039-2-0
Jawaharlal Nehru University, Convention Center, New Delhi (India), 15 March 2015 www.conferenceworld.in
2485 | P a g e
[4] T. Dias, S. Momcilovic, N. Roma, and L. Sousa,“Adaptive motion estimation processor for autonomous
videodevices,” EURASIP J. Embedded Syst., vol. 2007, no. 1, p.41-41, 2007.
[5] Y.-W. Huang, C.-Y. Chen, C.-H. Tsai, C.-F. Shen, and L.-G. Chen,“Survey on block matching motion
estimationalgorithms and architectures with new results,” J. VLSI Signal Process. Syst., vol. 42, no. 3, pp.
297–320, 2006.
[6] Y.-W. Huang, T.-C. Wang, B.-Y. Hsieh, and L.-G. Chen,“Hardware architecture design for variable block
size motion estimation in MPEG-4 AVC/JVT/ITU-T H.264,” in Proc. ISCAS, May 2003, vol. 2,pp. 796–
799.
[7] C.-Y. Kao and L. Youn-Long, “AnAMBA-compliant motion estimator for H.264 advanced video coding,”
in Proc.IEEE Int. SoC DesignConf., Seoul, Korea, Oct. 2004, pp.200–206.
[8] B. M. Li and P. H. W. Leong, “Serial and parallel FPGAbased variable block size motion estimation
processors,” J.Signal Process. Syst., vol.51, no. 1, pp. 77–98, 2008.
[9] T. Moorthy and A.Ye, “Ascalable computing and memory architecture for variable block size motion
estimation on fieldprogrammable gate arrays,” in Proc. Int. Conf. Field Programmable Logic Applic.,
Sep.2008, pp. 83–88.
[10] J. Nunez-Yanez, E. Hung, and V. Chouliaras, “A configurable and programmable motion estimation
processor for the H.264 video codec,”in Proc. Int. Conf. Field Programmable Logic Applic., Sep. 2008,
pp.149–154.
International Conference On Recent Trends In Engineering Science And Management ISBN: 978-81-931039-2-0
Jawaharlal Nehru University, Convention Center, New Delhi (India), 15 March 2015 www.conferenceworld.in
2486 | P a g e
MIGRATING TOWARDS DOUBLE GUARD : CONTAINER BASED APPROACH TO DETECT
INTRUSION IN WEB APPLICATION
Sayyad Rijwanali1 , Kiran Joshi2, Sowmiya Raksha3 1Department Of Computer Engineering , V.J.T.I. Mumbai (India)
2,3Assistant Professor , Department Of Computer Engineering & IT , V.J.T.I. Mumbai (India)
ABSTRACT
Intrusion detection systems are used to detect attacks against computer systems, networks. It is difficult to
provide provably secure information systems and to maintain them in such a secure state during their lifetime.
Network Intrusion Detection Systems (NIDS) face challenges coming from the network link speed and
complexity of threats.
Internet plays a crucial role in our everyday life affects the individual life of every person in decisive ways .In
this architecture web services have upgraded into a multitier architecture in which web server runs the
application front-end logic and backend information is submitted to database server. Over past few years
internet services and applications had raised the complexity of the attacker to attack the web server. So in order
to avoid web attacks we should use container based approach to detect intrusion in web application. Our focus
is to study Double Guard intrusion detection system. Double Guard provides a secure environment for multitier
web application. Using double guard we can monitor the Web request and its subsequent database requests so
we can find out attack that cannot possible with normal intrusion detection system.
Keywords : Double Guard, Anomaly Detection, Misuse Detection, Web Server, Database Server,
Intruder.
I INTRODUCTION
Now-a-days, web-delivered services like banking, travel, social networking, shopping etc. become immensely
very popular as well as extremely complicated. These services significantly uses a web- server at front front-
end which runs the application program logic and a back-end database server that consists of a data or other
information . Because of their regular use for confidential, personal information web dependent services have
continuously been target for attacks. Because of shifting of attention from front end web server exploiting
vulnerabilities of the online applications so as to corrupt the back-end information system through SQL injection
[2]. Intrusion-detection systems aim to catch attacks against computer systems and networks, or against data
systems normally, it is tough to produce incontrovertibly secure information systems and maintain them in such
a secure state for their entire life time and for each utilization. To protect multitier web services, intrusion

International Conference On Recent Trends In Engineering Science And Management ISBN: 978-81-931039-2-0
Jawaharlal Nehru University, Convention Center, New Delhi (India), 15 March 2015 www.conferenceworld.in
2487 | P a g e
detection systems are widely used to find attacks by matching misused pattern or signatures to protect multitier
internet services. A category of intrusion detection system that uses machine learning can even finds unknown
attacks by identifying abnormal network traffic from previous behaviour of intrusion detection system.
II BACKGROUND
Fig. 1: NIDS Architecture
Intrusion detection is network-based when the system is used to analyze network packets. Network based
Intrusion Detection System (NIDS) capture the network traffic from the wire as it travels to a host. This can be
analyzed for a particular signature or for unusual or abnormal behaviours.
A Network Intrusion Detection System can be classified into two types
1.1 Anomaly Detection
In Anomaly detection, the proper and acceptable static and dynamic behaviour of the System is outlined and
characterized first. This could be used to find out the changes or abnormal behaviours. Then an anomaly
detector compares actual usage patterns against models that are already established so as to spot abnormal
events. We tend to follow the anomaly detection approach since we rely on a training phase to make the correct
model.
1.2 Misuse Detection
Misuse detection approach is used to detect attacks. In misuse detection approach, we have a tendency to outline
abnormal system behaviour initially, so define the any other behaviour, as normal behaviour. It stands against
anomaly detection approach that utilizes the reverse approach, process defining system behaviour and processes
any other behaviour as abnormal.
II RELATED WORK
Both data and pipeline parallelism have been used in the context of NIDS. In pipeline parallelism, the whole
packet processing is divided into several sequential stages that each run on a dedicated execution unit. A packet
is transferred sequentially from one execution unit in the pipeline to the next. In addition to the parallelism
gained, pipelining improves reference locality and potentially increases the cache hit ratio since each execution
unit only deals with a subset of the entire application memory. NIDS even though it is parallel it cannot detect
the web attacks.
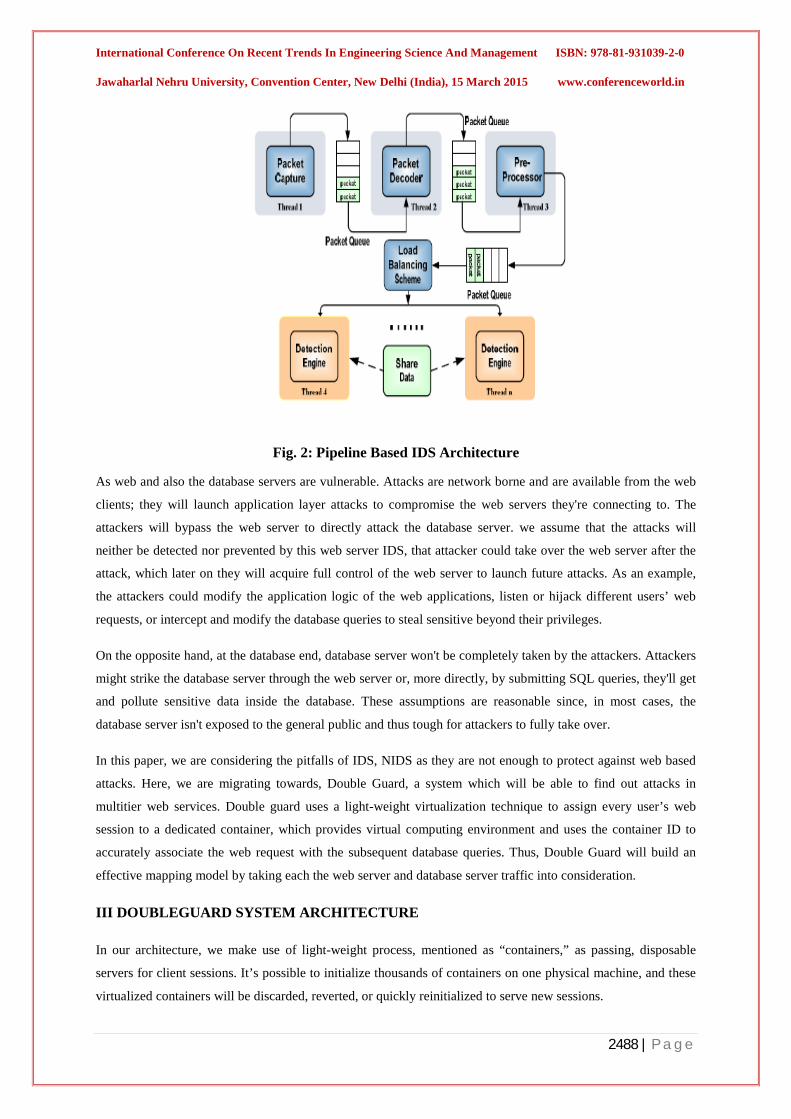
International Conference On Recent Trends In Engineering Science And Management ISBN: 978-81-931039-2-0
Jawaharlal Nehru University, Convention Center, New Delhi (India), 15 March 2015 www.conferenceworld.in
2488 | P a g e
Fig. 2: Pipeline Based IDS Architecture
As web and also the database servers are vulnerable. Attacks are network borne and are available from the web
clients; they will launch application layer attacks to compromise the web servers they're connecting to. The
attackers will bypass the web server to directly attack the database server. we assume that the attacks will
neither be detected nor prevented by this web server IDS, that attacker could take over the web server after the
attack, which later on they will acquire full control of the web server to launch future attacks. As an example,
the attackers could modify the application logic of the web applications, listen or hijack different users’ web
requests, or intercept and modify the database queries to steal sensitive beyond their privileges.
On the opposite hand, at the database end, database server won't be completely taken by the attackers. Attackers
might strike the database server through the web server or, more directly, by submitting SQL queries, they'll get
and pollute sensitive data inside the database. These assumptions are reasonable since, in most cases, the
database server isn't exposed to the general public and thus tough for attackers to fully take over.
In this paper, we are considering the pitfalls of IDS, NIDS as they are not enough to protect against web based
attacks. Here, we are migrating towards, Double Guard, a system which will be able to find out attacks in
multitier web services. Double guard uses a light-weight virtualization technique to assign every user’s web
session to a dedicated container, which provides virtual computing environment and uses the container ID to
accurately associate the web request with the subsequent database queries. Thus, Double Guard will build an
effective mapping model by taking each the web server and database server traffic into consideration.
III DOUBLEGUARD SYSTEM ARCHITECTURE
In our architecture, we make use of light-weight process, mentioned as “containers,” as passing, disposable
servers for client sessions. It’s possible to initialize thousands of containers on one physical machine, and these
virtualized containers will be discarded, reverted, or quickly reinitialized to serve new sessions.

International Conference On Recent Trends In Engineering Science And Management ISBN: 978-81-931039-2-0
Jawaharlal Nehru University, Convention Center, New Delhi (India), 15 March 2015 www.conferenceworld.in
2489 | P a g e
Fig. 3: Traditional three tier model. The web server used in the front end, and the database
servers are used in backend.
This container-based, session-separated web server architecture enhances the security performances as well as
provides us with the isolated information flows that are separated in each container for each session. It allows us
to identify the mapping between the HTTP requests and the subsequent Database queries, and utilize such a
mapping model to find out abnormal behaviour in session.
Fig. 4: Proposed architecture of double guard.
Once we learn the model, it can be used to find out abnormal behaviours. Both the HTTP request and the DB
queries within each session should be matched with the model. If there exists any request or query that does not
follow the normality model for session, then the session will be treated as a possible attack.
IV ATTACKS
4.1 Privilege Escalation Attack
In this attacker logs into the web server as a normal user, upgrades his/her privileges, and triggers admin queries
thus he obtains an administrator’s data. This attack will never be detected by either the web server IDS or the
Client 1
Client 1
Web Server
Data Base Server

International Conference On Recent Trends In Engineering Science And Management ISBN: 978-81-931039-2-0
Jawaharlal Nehru University, Convention Center, New Delhi (India), 15 March 2015 www.conferenceworld.in
2490 | P a g e
database IDS. Our approach, however, will notice this kind of attack since the database query doesn’t match the
request, according to our mapping model.
4.2 Hijack Future Session Attack
This category of attacks is especially aimed at the web server side. An attacker typically takes over the web
server and thus hijacks all succeeding legitimate user sessions to launch attacks.
According to the mapping model, the web request should invoke some database queries, and then the abnormal
scenario is detected. However, neither a traditional web server IDS nor a database IDS will find such an attack
by itself.
4.3 Injection Attack
Attacks like SQL injection don't need compromising the web server. Attackers will use existing vulnerabilities
within the web server logic to inject the data or string content that contains the exploits and then use the web
server to relay these exploits to attack the back end database. Since our approach provides a two-tier detection,
even if the exploits are accepted by the web server, the relayed contents to the database server wouldn't be able
to take on the expected structure for the given web server request.
4.4 Direct DB Attack
It is potential for an attacker to bypass the web server or firewalls and connect on to the database. An attacker
may even have already taken over the web server and be submitting such queries from the web server without
sending web requests. Without matched web requests for such queries, a web server IDS might detect neither.
Moreover, if these database queries were within the set of allowed queries, then the database IDS wouldn’t
detect it either. However, this sort of attack will be caught with our approach since we cannot match any web
requests with these queries.
V ALGORITHM FOR MAPPING WEB REQUEST WITH DATABASE QUERIES
Input: Training Data set, Threshold t
1. for each session separated traffic Ti do
2. Get different web requests r and database queries q in this session
3. for each different web requests r do
4. if r is a request to static file then
5. Add r into set EQS(Empty Query Set)
6. else
7. if r is not in set REQ then
8. Add r into REQ
9. Append web session ID i to the set ARr with r as the key
10. for each different q do
11. if q is not in set SQL then

International Conference On Recent Trends In Engineering Science And Management ISBN: 978-81-931039-2-0
Jawaharlal Nehru University, Convention Center, New Delhi (India), 15 March 2015 www.conferenceworld.in
2491 | P a g e
12. Add q into SQL
13. Append web session ID i to the set AQq with q as the Key
14. for each distinct web request r in REQ do [8]
5.1 Advantages of Intrusion Detection System
1. Accuracy
The accuracy of Intrusion Detection System is to detect attacks that are based on pair types and signatures. To
observe such attacks in multitier web applications an IDS uses internet IDS and database IDS [5].
2. Performance
The performance of an intrusion detection system is that the rate at which audit events are processed. If the
performance of the intrusion-detection system is good, then it's possible to observe real-time attack [5].
3. Timeliness
An intrusion-detection system performs and propagates its analysis as quickly as potential so that the security
officer able to react before abundant harm has been done, and also to prevent the attacker from subverting the
audit source or the intrusion-detection system itself [5].
Limitations of Intrusion Detection System
Drawbacks of Intrusion Detection System include the problem of gathering the required data on the known
attacks and keeping it with new vulnerabilities and environments. Also in Intrusion Detection System an
attacker will directly attack backend database server [5].
VI CONCLUSION
In this paper, we are considering the pitfalls of IDS, NIDS as they are not enough to protect against web based
attacks. Here, we are migrating towards Double guard IDS.
We discussed an Intrusion Detection System that builds models of traditional behaviour for multitier
applications from each front-end web (HTTP) requests and back-end database (SQL) queries. It forms container
based IDS with multiple input streams to provide alerts.
This builds models of traditional behaviour for multi tiered web applications that prevent each a network IDS
like Snort or a database IDS from detecting attacks against these vulnerabilities. However, by observing the
mapping relationship between web requests and database queries, Double Guard is effective at capturing such
attacks. We presented an Intrusion Detection System that builds models of traditional behaviour for multitier
applications from each front-end web (HTTP) requests and back-end database (SQL) queries. It forms container
based IDS with multiple input streams to provide alerts. We’ve seen that such correlation of input streams
provides a much better characterization of the system for anomaly detection. So, migrating towards double
guard IDS is better than other IDS.

International Conference On Recent Trends In Engineering Science And Management ISBN: 978-81-931039-2-0
Jawaharlal Nehru University, Convention Center, New Delhi (India), 15 March 2015 www.conferenceworld.in
2492 | P a g e
REFERENCES
[ 1 ] SANS, “The Top Cyber Security Risks,” http://www.sans.org/ top cyber-security-risks/,
[ 2 ] Niraj Gaikwad 1, Swapnil Kandage 2, Dhanashri Gho lap,” Double Guard: Detecting & Preventing
Intrusions in Multitier web applications”, http://warse.org/pdfs/2013/ ijns02222013.
[ 3 ] “Common Vulnerabilities and Exposures,” http://www.cve. mitre.org/, 2011.Fröhlich, B. and Plate, J.
2000. The cubic mouse: a new device for three-dimensional input. In Proceedings of the SIGCHI
Conference on Human Factors in Computing Systems.
[ 4 ] William Robertson, “Effective Anomaly Detection with Scarce Training Data”.
https://www.cs.ucsb.edu/2010.
[ 5 ] Greensql, http://www.greensql.net/, 2011.
[ 6 ] K. Bai, H. Wang, and P. Liu, “Towards Database Firewalls,” Proc. Ann. IFIP WG 11.3 Working Conf.
Data and Applications Security (DBSec ‟05) 2005.
[ 7 ] H. Debar, M. Dacier, and A. Wespi, “Towards Taxonomy of Intrusion-Detection Systems,” Computer
Networks, vol. 31, no. 9, pp. 805-822, 1999.
[ 8 ] Gopale Sheetal S 1, Gamane Sonali S. 2 , Monica Bachal K. 3,“DoubleGuard: Intrusion Detection
System in Web Application”
Biographical Notes
Sayyad Rijwanali is currently pursuing M. Tech final year in Computer Engineering Department
(Specialization in Network Infrastructure Management System) from V.J.T.I, Mumbai, India. Kiran Joshi is working as Assistant Professor in Computer Engineering & IT Department, V.J.T.I
Mumbai, India.
Sowmiya Raksha is working as Assistant Professor in Computer Engineering & IT Department,
V.J.T.I Mumbai, India.

International Conference On Recent Trends In Engineering Science And Management ISBN: 978-81-931039-2-0
Jawaharlal Nehru University, Convention Center, New Delhi (India), 15 March 2015 www.conferenceworld.in
2493 | P a g e
A HIGH POWER GRID CONNECTED 11-LEVEL HYBRID MULTILEVEL INVERTER FOR WIND
FARMS
Merin Rose Mathew1, Amaljith. M.K2, Geethanjali.R3
1,2,3Department of Electrical and Electronics, SNS College of Technology
Coimbatore, (India)
ABSTRACT
This paper proposes a single phase multilevel inverter used with less number of switching devices compared to
conventional diode clamped multilevel inverter to achieve desired level of output voltage for wind farm
applications, The switches are arranged in the two legs of multilevel inverter along with the H bridge form the
hybrid topology to generate 11 level output voltage, conventionally achieved by 16 switches. In this, the number
of switches has been reduced to obtain the same level, hence the gating circuit requirements and associated
switching losses are considerably reduced. The output ac voltage is filtered and supplied to the grid. The
simulation of the entire circuit has been carried out in MATLAB Simulink to validate the results and to monitor
the Harmonic profile
IndexTerms: Wind Energy Conversion System (WECS), Wind Generator (WG), Multilevel Inverter
(MLI), Sinusoidal Pulse Width Modulation (SPWM),), Total Harmonic Distortion (THD). I INTRODUCTION Wind power is undergoing the fastest rate of growth than any other form of electricity generation in the world.
The low environmental impact of wind energy makes it a very attractive solution. The resource potential is
large. Integration of wind power plant into the electric power system presents challenges primarily due to the
natural characteristic of the wind plants which differ in some respect from the conventional plants[1].A typical
wind energy conversion system includes a wind turbine, interconnection apparatus, control systems and
generators. Variable speed wind turbines are capable of producing 9% to 15% more energy output as compared
to their constant speed. But it necessitates the need for power electronic converters to provide a fixed frequency
and fixed voltage power to their loads.
The most advanced generator type used for wind energy conversion system perhaps the permanent-magnet
synchronous generator (PMSG).This machine offers, best efficiency compared to the same power level and
machine size the best efficiency among all types of machines. With high robustness in construction , easy
maintenance due to slip ring- less and exciter-less features. The inherent benefit of permanent magnet which
supplies rotor flux in synchronous machines without excitation loss supports the wind power generation
development.[3] The Electrical power output of the PMSG cannot be delivered directly to the grid. Power
electronics converters are used to overcome this limitation.The main disadvantage of the PMSG is the high cost
of the PM material and power converter. The three-level converter has been widely studied in literature but the

International Conference On Recent Trends In Engineering Science And Management ISBN: 978-81-931039-2-0
Jawaharlal Nehru University, Convention Center, New Delhi (India), 15 March 2015 www.conferenceworld.in
2494 | P a g e
application of diode-clamped converters with higher (four or more) levels has not been analyzed for the
production of wind power.
In this paper, a diode clamped multilevel inverter is cascaded with the H-bridge forming a hybrid
topology[4].The DC input to the inverter is fed from four independent wind generators. The controlled rectifier
connected at the output of each generator gives the controlled DC and is maintained constant by means of
regulator. This constant obtained from each is given as the input of inverter[2].The output voltage of the inverter
is controlled by generating pulse from the control circuit. The rest of the paper is organized as follows section II
describes the wind generator powered multilevel inverter. Section III describes Pulse Width
Modulation.,Simulation results are discussed in section IV,Section V FFT Analysis and Finally, concluding
remarks are given in section VI.
II WIND GENERATOR POWERED MULTILEVEL INVERTER In order to meet the demand, a wind power with highquality is obtained using theconverter, a multilevel
converters are good alternative to the conventional converters forthis systems.A multilevel converter enables the
ac voltage to be increased without an output transformer, reducing the output voltage and currentsharmonic
content and make the output waveform closer to sine wave.[6]In addition, the cancellation of low frequency
harmonics from the ac voltages at the different levels means that the size of the ac inductance can be
reduced,thus a consequent decrement in the expenses of the overall system.
Fig.1. Block Diagram of Overall System

International Conference On Recent Trends In Engineering Science And Management ISBN: 978-81-931039-2-0
Jawaharlal Nehru University, Convention Center, New Delhi (India), 15 March 2015 www.conferenceworld.in
2495 | P a g e
The block diagram for the constant output multilevel inverter is shown in figure 1.In this diagram it consists of
wind farm,an inverter, fuzzy logic controller and sinusoidal pulse width modulation block. Four DC source
voltage is given as input to the hybrid inverter which combines the diode clamped multilevel inverter and H-
bridge inverter. By using twelve switches in hybrid multilevel inverter with each switch having different voltage
to generate the eleven step voltage of symmetrical output. The eleven step output is applied to fuzzy controller
to maintain the constant output, by giving reference voltage to the fuzzy logic controller . If there any deviation
in output, the controller is used to compensate the output voltage and SPWM signal for the switch is varied.The
constant dc supply for the inverter is from the wind farm and the pulses for each switch are obtained from
Sinusoidal Pulse Width Modulation Technique.The Diode Clamped Inverter switching states is given in the
Table 1.The number of output phase voltage level is defined by m=2s+1, where s is the number of DC source.
Table 1: Switching Statesof Diode Clamped Inverter
The term H bridge is derived from the typical graphical representation circuit. An H bridge is built with four
switches (solid-state or mechanical). When the switches S1 and S4 are closed (and S2 and S3 are open) a
positive voltage will be obtained across the load. By opening S1 and S4 switches and closing S2 and S3
switches, this voltage is reversed, allowing reverse voltage across the load. Using the nomenclature above, the
switches S1 and S2 should never be closed at the same time, as this would cause a short circuit on the input
voltage source. The same applies to the switches S3 and S4[9]. This condition is known as shoot-through.
III PULSE WIDTH MODULATION
In sinusoidal PWM instead of maintaining the width of all pulses the same as in the case of multiple PWM, the
width of each is varied in proportion to the amplitude of a sine wave evaluated at the same pulse. The distortion
is reduced significantly compared to multiple PWM. In order to generate pulses for twelve switches a sinusoidal
wave is compared with twelve carrier wave having different amplitude as shown in the figure.A Fuzzy
Controller Output is given as an input to the PWM in order to maintain constant output voltage from multilevel
inverter.
SWITCHES
LEVEL
S4
S3
S2
S1
S4’
S3’
S2’
S1’
I ON OFF OFF OFF OFF ON ON ON
II ON ON OFF OFF OFF OFF ON ON
III ON ON ON OFF OFF OFF OFF ON
IV ON ON ON ON OFF OFF OFF OFF
-I ON ON ON OFF OFF OFF OFF ON
-II ON ON OFF OFF OFF OFF ON ON
-III ON OFF OFF OFF OFF ON ON ON
-IV OFF OFF OFF OFF ON ON ON ON

International Conference On Recent Trends In Engineering Science And Management ISBN: 978-81-931039-2-0
Jawaharlal Nehru University, Convention Center, New Delhi (India), 15 March 2015 www.conferenceworld.in
2496 | P a g e
Inverter output voltage, Vao = Vdc/2, When vcontrol>vtri, and Vao = -Vdc/2, When vcontrol<vtri . PWM frequency is
the same as the frequency of vtri . Amplitude is controlled by the peak value of vcontrol and Fundamental
frequency is controlled by the frequency of vcontrol. . Modulation Index (m) is given by :
m = = (1)
Fig.2 Logic Circuit for Pulse Generation
IV SIMULATION RESULTS The overall simulated system for the proposed system is implemented below and each section is shown
separately for better understanding.
Fig.3Grid Interface of a PMSG Based Wind Energy Conversion Systems inverter The system under consideration employs PMSG-based variable speed WECS .The wind turbine converts the
power of the wind to mechanical power in the rotor shaft. This is then converted to electricity using a permanent
magnet synchronous generator (PMSG). The output voltage is rectified using a three-phase diode bridge

International Conference On Recent Trends In Engineering Science And Management ISBN: 978-81-931039-2-0
Jawaharlal Nehru University, Convention Center, New Delhi (India), 15 March 2015 www.conferenceworld.in
2497 | P a g e
rectifier. The result is fed into a PI controller whose output is compared to a triangular waveform to determine
when to turn the dc-dc boost converter switch ON or OFF.
The simulation have shown that the developed waveform have less harmonics compared to the conventional
system and extracting maximum power from the air stream at any wind speed without the knowledge of wind
speed or rotor speed.
4.1PMSG Output Voltage
Fig.4.PMSG Output voltage PMSG generator connected to the wind turbine is simulated and corresponding output voltage is showed in the
figure7.In order to make the torque of the turbine equals to the torque of the generator a drive and train circuit is
connected. The output of the system is equal to 100V.
4.2 Uncontrolled Rectifier Output The output of the PMSG is given to an Uncontrolled Rectifier in order to convert the ac voltage to dc, the output
voltage is not able to control because diodes are used in this rectifier. Inorder to control the output voltage and
maintain it as a constant voltage a boost converter with a PI Controller is used.
Fig. 5 output voltage of uncontrolled rectifier 4.3Boost Converter Output

International Conference On Recent Trends In Engineering Science And Management ISBN: 978-81-931039-2-0
Jawaharlal Nehru University, Convention Center, New Delhi (India), 15 March 2015 www.conferenceworld.in
2498 | P a g e
Fig.6.Output voltage of boost converter
A boost converter is used here, because as the wind speed varies the output of the uncontrolled rectifier varies
and voltage drop will occur, so inorder to give inverter input a constant dc supply a boost converter with PI
Controller is used. And thus the output obtained is equal to 60V.
4.4Output of Hybrid Multilevel Inverter
Fig.7. Output Voltage of Symmetric Multilevel Inverter
The H Bridge inverter is connected with the diode clamped multilevel inverter with switches to form a H
ybridtopology.The level creator part produce output voltage which is always positive and the H-bridge part is to
change the polarity of the output. Basically the inverter operation is to convert the variable DC into an AC. The
input dc source is given by using batteries or photo voltaic cells to the cascaded circuit. Here fuzzy logic
controller is used to control the output voltage of the inverter. By using sinusoidal pulse width modulation
technique the triggering pulse given to the switches are controlled.
V FFT ANALYSIS OF OUTPUT
5.1Output Voltage without Filter
Fig. 8FFT Analysis
By using the sinusoidal pulse width modulation control we can control the output by changing the magnitude
and the modulation index value of the reference and carrier waveform. Mostly the carrier wave is triangular
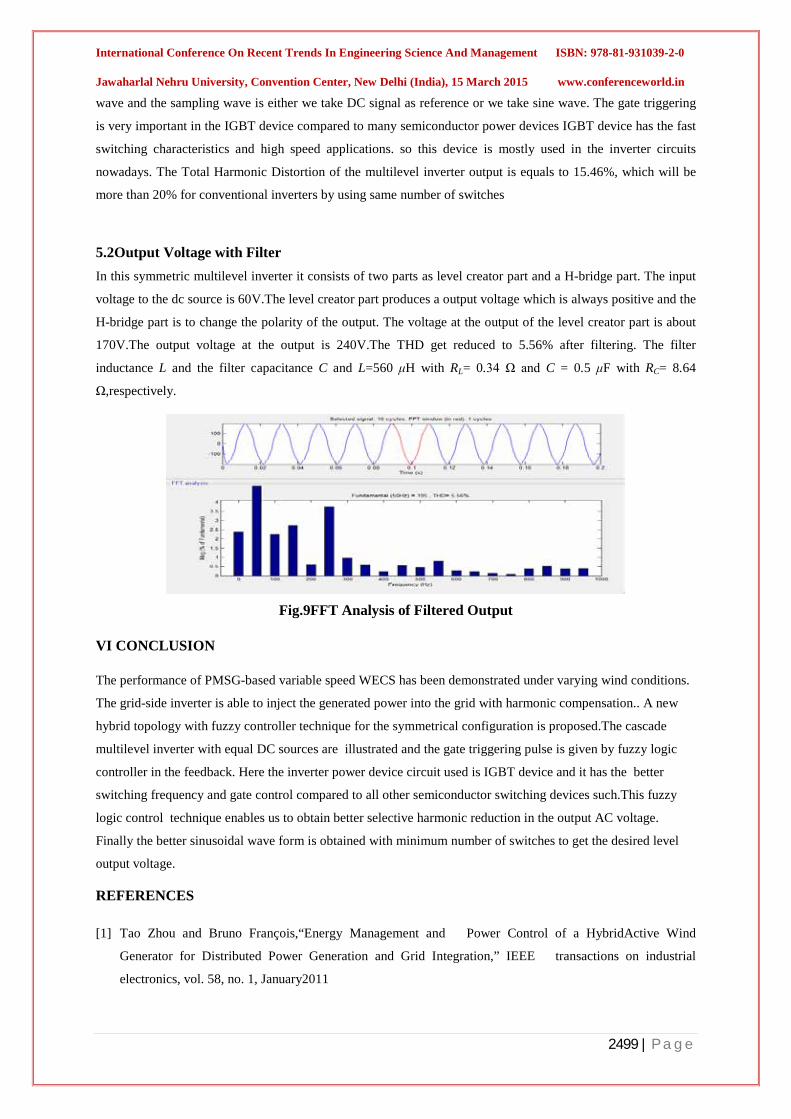
International Conference On Recent Trends In Engineering Science And Management ISBN: 978-81-931039-2-0
Jawaharlal Nehru University, Convention Center, New Delhi (India), 15 March 2015 www.conferenceworld.in
2499 | P a g e
wave and the sampling wave is either we take DC signal as reference or we take sine wave. The gate triggering
is very important in the IGBT device compared to many semiconductor power devices IGBT device has the fast
switching characteristics and high speed applications. so this device is mostly used in the inverter circuits
nowadays. The Total Harmonic Distortion of the multilevel inverter output is equals to 15.46%, which will be
more than 20% for conventional inverters by using same number of switches
5.2Output Voltage with Filter In this symmetric multilevel inverter it consists of two parts as level creator part and a H-bridge part. The input
voltage to the dc source is 60V.The level creator part produces a output voltage which is always positive and the
H-bridge part is to change the polarity of the output. The voltage at the output of the level creator part is about
170V.The output voltage at the output is 240V.The THD get reduced to 5.56% after filtering. The filter
inductance L and the filter capacitance C and L=560 μH with RL= 0.34 Ω and C = 0.5 μF with RC= 8.64
Ω,respectively.
Fig.9FFT Analysis of Filtered Output
VI CONCLUSION
The performance of PMSG-based variable speed WECS has been demonstrated under varying wind conditions.
The grid-side inverter is able to inject the generated power into the grid with harmonic compensation.. A new
hybrid topology with fuzzy controller technique for the symmetrical configuration is proposed.The cascade
multilevel inverter with equal DC sources are illustrated and the gate triggering pulse is given by fuzzy logic
controller in the feedback. Here the inverter power device circuit used is IGBT device and it has the better
switching frequency and gate control compared to all other semiconductor switching devices such.This fuzzy
logic control technique enables us to obtain better selective harmonic reduction in the output AC voltage.
Finally the better sinusoidal wave form is obtained with minimum number of switches to get the desired level
output voltage.
REFERENCES
[1] Tao Zhou and Bruno François,“Energy Management and Power Control of a HybridActive Wind
Generator for Distributed Power Generation and Grid Integration,” IEEE transactions on industrial
electronics, vol. 58, no. 1, January2011

International Conference On Recent Trends In Engineering Science And Management ISBN: 978-81-931039-2-0
Jawaharlal Nehru University, Convention Center, New Delhi (India), 15 March 2015 www.conferenceworld.in
2500 | P a g e
[2] Alian Chen, Lei Hu, Lifeng Chen, Yan Deng, and Xiangning He (2005), “A Multilevel Converter
Topology with Fault-Tolerant Ability” IEEE Transactions on Power Electronics, Vol. 20, No. 2
[3] AlirezaNami, FiruzZare and FredeBlaabjerg (2011), “A Hybrid Cascade Converter Topology with Series-
Connected Symmetrical and Asymmetrical Diode-Clamped H-Bridge Cells” IEEE Transactions on Power
Electronics, Vol. 26, No. 1
[4] A. Shukla, A. Ghosh and A. Joshi, “Control schemes forDC capacitor voltages equalization in diode-
clampedmultilevel inverter-based DSTATCOM,” IEEE Trans.Power Del., Vol. 23, pp. 1139-1149, Apr.
2008.
[5] Chong H. Ng, Max A. Parker, Li Ran, Peter J. Tavner, Jim R. Bumby, and Ed Spooner (2008), “A
Multilevel Modular Converter For A Large, Light Weight Wind Turbine Generator” IEEE Transactions on
Power Electronics, Vol. 23, No. 3
[6] Domingo A. Ruiz-Caballero, Reynaldo M. Ramos-Astudillo, Samir Ahmad Mussa and Marcelo Lobo
Heldwein (2010), “Symmetrical Hybrid Multilevel DC–AC Converters With Reduced Number of Insulated
Dc Supplies” IEEE Transactions on Industrial Electronics, Vol. 57, No. 7
[7] Fang ZhengPeng (2001), “A Generalized Multilevel Inverter Topology With Self Voltage Balancing” IEEE
Transactions On Industry Applications, Vol. 37, No. 2.
[8] JavadEbrahimi, EbrahimBabaei and Gevorg B. Gharehpetian (2012), “A New Multilevel Converter
Topology with Reduced Number of Power Electronic Components” IEEE Transactions on Industrial
Electronics, Vol. 59, No. 2
[9] Javier Pereda and Juan Dixon (2011), “High-Frequency Link: A Solution for Using Only One DC Source in
Asymmetric Cascaded Multilevel Inverters” IEEE Transactions on Industrial Electronics, Vol. 58, No. 9
[10] S. N. F. Mohamed, N. A. Azli, Z. Salam, and S. M. Ayob, “Fuzzy Sugenotype fuzzy logic controller
(SFLC) for a modular structured multilevelinverter (MSMI),” in Proc. Power Energy Conf., Dec. 2008, pp.
599–603.
International Conference On Recent Trends In Engineering Science And Management ISBN: 978-81-931039-2-0
Jawaharlal Nehru University, Convention Center, New Delhi (India), 15 March 2015 www.conferenceworld.in
2501 | P a g e
LIVE VIDEO STREAMING USING ANDROID Dharini Chhajed1, Shivani Rajput2 and Sneha Kumari3
1,2,3Department of Electronics Engineering,
Padmashree Dr. D. Y. Patil Institute of Engineering and Technology, Pimpri, Pune-18(India)
ABSTRACT Nowadays, most of the users have smart phone that supports videos as well as have fast internet connection.
Mobile learning, also known as m-learning, is a convenient, means of delivering an informational content to
learners using current mobile technology. This paper proposes framework which allow the mobile devices to
receive live streaming service using client server approach. The mobile devices, as a client, will connect to the
server and receive a digital broadcast including decode and display the schedule of events in real time mode, as
proof of the concept, in the Android platform. This paper shows that users can access live streaming and
display images in a good quality through their mobile. Moreover, users are capable to select the required date
to get real time schedule of TV event on Android smart phone.
Keywords: High- Definition, Live Video Streaming
I. INTRODUCTION
More and more people watch live video on the Internet instead of traditional media. High-Definition Live Video
Streaming(HD-LVS) would be the most popular Internet service in the future. VoD and LVS are two kinds of
streaming services. VoD allows the users to control the video playback absolutely. The functionality of pausing,
forwarding and rewinding are enabled just like playing a local video file. LVS [1], [2], [3] is fundamentally
different from VoD. It provides users the video content that is currently broadcasted by streaming servers.
Many TV stations have live streaming services which can only be enjoyed on the website, but has a
poor quality for mobile devices. This streaming media has a great potential to be one of the most effective
and technologically advanced methods for sending quality video and audio to any web site over existing
computer networks. One of the reasons why the smart phone’s popularity is increasing is that it gives more
convenience to its users in their everyday live activities. This condition has motivated us to develop live
streaming application on a mobile Android platform.
This paper will present the development of the mobile application which utilizes a digital capture broadcast
media server.
Ø To facilitate users to watch TV using an android smart phone,
Ø To provide TV schedule which can be viewed before live streaming,
Ø To provide acceptable image quality with a limited bandwidth which will not be too burdensome on an
android smart phone
Any, mobile learning architecture which needs internet connection to provide learning contents to users
should follow certain criterions such as using of low bandwidth and minimum network latency. Agent based
technology is flourishing as a low bandwidth solution for mobile learning platform. The Agent is defined as an
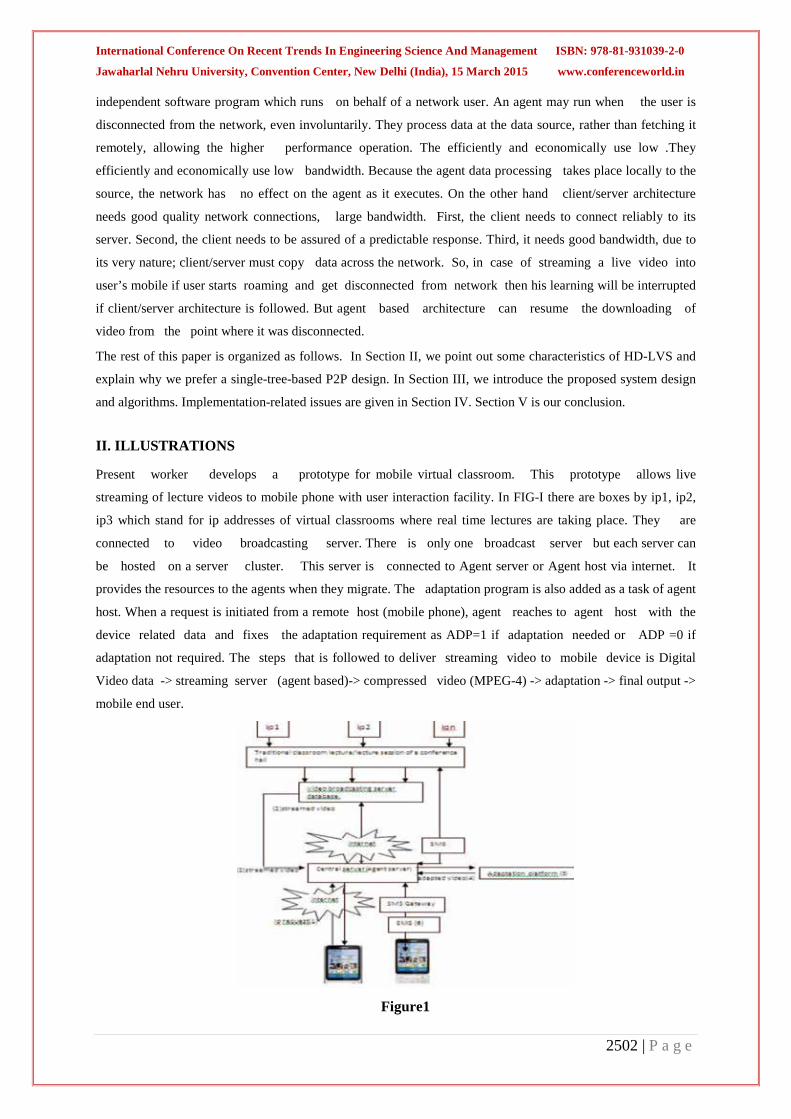
International Conference On Recent Trends In Engineering Science And Management ISBN: 978-81-931039-2-0
Jawaharlal Nehru University, Convention Center, New Delhi (India), 15 March 2015 www.conferenceworld.in
2502 | P a g e
independent software program which runs on behalf of a network user. An agent may run when the user is
disconnected from the network, even involuntarily. They process data at the data source, rather than fetching it
remotely, allowing the higher performance operation. The efficiently and economically use low .They
efficiently and economically use low bandwidth. Because the agent data processing takes place locally to the
source, the network has no effect on the agent as it executes. On the other hand client/server architecture
needs good quality network connections, large bandwidth. First, the client needs to connect reliably to its
server. Second, the client needs to be assured of a predictable response. Third, it needs good bandwidth, due to
its very nature; client/server must copy data across the network. So, in case of streaming a live video into
user’s mobile if user starts roaming and get disconnected from network then his learning will be interrupted
if client/server architecture is followed. But agent based architecture can resume the downloading of
video from the point where it was disconnected.
The rest of this paper is organized as follows. In Section II, we point out some characteristics of HD-LVS and
explain why we prefer a single-tree-based P2P design. In Section III, we introduce the proposed system design
and algorithms. Implementation-related issues are given in Section IV. Section V is our conclusion.
II. ILLUSTRATIONS
Present worker develops a prototype for mobile virtual classroom. This prototype allows live
streaming of lecture videos to mobile phone with user interaction facility. In FIG-I there are boxes by ip1, ip2,
ip3 which stand for ip addresses of virtual classrooms where real time lectures are taking place. They are
connected to video broadcasting server. There is only one broadcast server but each server can
be hosted on a server cluster. This server is connected to Agent server or Agent host via internet. It
provides the resources to the agents when they migrate. The adaptation program is also added as a task of agent
host. When a request is initiated from a remote host (mobile phone), agent reaches to agent host with the
device related data and fixes the adaptation requirement as ADP=1 if adaptation needed or ADP =0 if
adaptation not required. The steps that is followed to deliver streaming video to mobile device is Digital
Video data -> streaming server (agent based)-> compressed video (MPEG-4) -> adaptation -> final output ->
mobile end user.
Figure1
International Conference On Recent Trends In Engineering Science And Management ISBN: 978-81-931039-2-0
Jawaharlal Nehru University, Convention Center, New Delhi (India), 15 March 2015 www.conferenceworld.in
2503 | P a g e
Case study 1 There are several classrooms with ip addresses where lectures are going on (fig-1). They are connected to agent
based video broad casting/streaming server.
1) A user wants to attend one conference lecture given by renowned faculty. But he is unable to reach the
conference hall. So, he can access the lecture via his mobile device. He will send the request (ip address of the
class) of the lecture. Suppose there are lectures taking place in the classroom 1, classroom2 etc. So, as soon as
these videos are captured real Streaming starts by storing it in buffer of high powerful broadcast server.
A part of buffered video is streamed in real and rest of video is still being downloaded .This prototype uses
streaming protocol viz. (RTSP/SDP, RTP).
2) Now according to the request of user Central/Agent server connects to the broadcasted server and receives
the streamed video.
3) Streamed video is sent to adaptation platform if required.
4) Adapted video is relayed to the end user.
5) For interaction with classroom teacher mobile user can send SMS through the SMS gateway which can be
replied by the teacher instantly.
III.RELATED WORK Live video streaming has experienced a considerable growth over the years since its introduction in early
1990s.Its growth, in part, is supported by the growth in the internet world which makes the network channel
for the streaming is easier to be accessed. Utilising the Internet technology, there is HTTP-based streaming
which uses web servers to deliveren coded mediacontent. Hong et. al also studied the Internet based video
delivery by using the QoS control to improve the quality of the video at the receiver side . Zhang et.al as
well explored the QoS for video delivery. However, the transmission that used in the study is over
a wireless internet connection One of the worker thus proposed a mobile learning system that enables
mobile video streaming with agent software.
3.1 Video streaming
Streaming video is a term applied to the compression and buffering techniques that allow one to transmitand
view video in real-timethrough the internet.
Video streamingis of two types.
1) Pseudo streaming or progressive download.
2) Real streaming
3.1.1 Progressive download
Delivery of a file over HTTP is normally referred to as ‘progressive download’ or ‘http streaming’.
In reality, it is not streaming at all but a very simple bulk download of a video file to the end user’s computer. A
temporary copy of the video file is then stored on the local computer so that the viewer can
watch the file over and over without having to download the file each time. If the bandwidth available
to the machine downloading the file is smaller than the encoded bit-rate there may be a wait before the file
will start to play. For example, on a 56kbps dial-up modem, trying to play a file that is encoded at 500kbps

International Conference On Recent Trends In Engineering Science And Management ISBN: 978-81-931039-2-0
Jawaharlal Nehru University, Convention Center, New Delhi (India), 15 March 2015 www.conferenceworld.in
2504 | P a g e
people may have to wait a fairly long time before enough of the file has been downloaded for it to start
playing. On a 500kbps interne tconnection, or faster, playback should start almost immediately and the file
should download faster than it will play, meaning that playback will not have to stop because not enough data
has been downloaded. HTTP (Hypertext transport protocol) operates over TCP (Transport control protocol)
which controls the actual transport of the packets over the network. TCP is optimized for guarantee of delivery,
regardless of file format or size. If a packet is skipped during the transfer of a file, it will request a resend of that
packet. Resend requests take time and bandwidth and could increase the load on the server.
3.1.2 Real Streaming
A streaming server is a piece of software which deals with video requests. Unlike a standard web server
delivering a video file over HTTP (progressive download), a streaming server opens a conversation with
the local machine. There are two sides to this conversation, one is for transferring the video and the other is
for control messages between the media playerand the server. These control messages include commands such
as ‘play’, ‘pause’, ‘stop’ and ‘seek’. Streaming has many advantages.
1. Video can be played back at any point.
2. It makes a lot more efficient use of bandwidth as only using bandwidth for part of the video that are
actually watched as opposed to HTTP delivery where the whole file gets delivered.
3. The video file is not stored on the viewer’s computer – the video data is playedand then discarded by the
media player.
IV.IMPLEMENTATION
We proposed an algorithm to implement theproposed prototype.
1. User initiates a query for aparticular classroom lecturesuppose for lecture going on classroom 3.
2. Agent server receives the request
3. Read the device related data
4. Fix the adaptation parameters
5. If adaptation requires then set ADP
(adaptation parameter)=1 else ADP=0
6. Create agent 1.
7. Migrate agent to the one of video streaming server from the cluster listed in the itinerary.
8. Video streaming server receives the agent 1. The requested video starts streaming and embeds into agent 1.
Agent 1moves with required amount of video to adaptation server if ADP=1 or move to the central server.
During this period other agents released from main agent server standsin queue inside the broadcasting server.
9. Agent 1 starts streaming the same to the mainagent server.
10. Agent server relays the video to the enduser and destroys agent1. In this context it is important to discuss
that if afterreceiving first part of video user gets disconnected then what will happen? The answer is, in due
course of time, agent 2 will be activated only but its job is notto complete.From the characteristics of agents it

International Conference On Recent Trends In Engineering Science And Management ISBN: 978-81-931039-2-0
Jawaharlal Nehru University, Convention Center, New Delhi (India), 15 March 2015 www.conferenceworld.in
2505 | P a g e
can be told that agent 2 will keep on trying to get connected to the end user again and again until its job is not
finished. Thus user will have uninterrupted learning environment.
V. RESULTS AND ANALYSIS
Present work proposes a prototype to download or stream live video onto users’ mobile devices and incorporates
an interface to interact with the classroom teacher if required. We also proposed an algorithm to implement
architecture with agent technology as because it helps to fight with the constraints of mobile platform.
This kind of mobile learning scenario clearly increases the usability of mobile hand held devices and of
course a new kind of learning solution when users’ cannot reach to the classroom on time due to various
problems like traffic jam or illness. Also agent base technology has been used for implementation to give a
smooth learning experience to the users. The incorporation of the interaction facility with live broadcasting has
created real time traditional classroom environment. A usability test of this mobile app was conducted in a one
day workshop in NIT; Agartala with20 Android based mobile phone users. A real time video was broadcasted
with interaction facility to the attendees’ mobile phone. After that they were asked to fill up questionnaires
with 5 queries. The queries were-
1. Assists them in learning efficiently.
2. Mobile phone as a learning media in such situation is well enough.
3. They can interact with the teacher through SMS conveniently.
4. Help them in learning in urgency with live streaming.
5. Help them in learning by watching the lecture in their free time. It has been observed that 54% of the
attendees’ replied positively.
VI.LIMITATIONS
The prototype is not fully implemented. Only an algorithm for implementation has been proposed. So, different
parameters like time speed to stream a chunk of live or recorded video onto a mobile phone has not been
analyzed. What will be the difference of the above parameters in case of client - server architecture and the
agent based architecture are not analyzed . But another limitation is the unanalyzed cost to implement the
prototype with agent server and host. This work does not discuss the security related issues in such mobile
application.
VII.CONCLUSION
This paper proposes architecture of live video streaming into mobile phone. It highlights various issues like
what type of video streaming is perfect for mobile platform? How to handle the bandwidth and latency
problem of mobile network while streaming video? How to make the feeling of strearning as continuous when
user is on roaming and is therea chance of getting disconnected from the network? Present worker proposes a
solution to adopt live streaming and agent software.
Also it has added one adaptation platform which takes care of proper delivery of content to heterogeneous
mobile devices . Due to the increasing heterogeneity of wireless devices and increasing quality of
multimedia stream on the other hand, video adaptation will be very important in future wireless networks.

International Conference On Recent Trends In Engineering Science And Management ISBN: 978-81-931039-2-0
Jawaharlal Nehru University, Convention Center, New Delhi (India), 15 March 2015 www.conferenceworld.in
2506 | P a g e
REFERENCES
[1] M.Ripean, “Peer-to-Peer architecture case study: Gnutella network” in Proceedings of the First
International Conference on Peer-to-Peer Computing, 27-29 August 2001, pp, 99-100.
[2] B.Cohen:“Incentives build robustness in BitTorrent,”in Proceedings of the 1st Workshop on Economics
of Peer-to-Peer Systems, 5-6 June 2003.
[3] BRUMME S: “Multimedia streaming on mobile phone”. Lecture on Advanced Data Communications,
University of Technology, Sydney, 2004.
[4] http://www.javaworld.com
[5] T.LIU* and C.Choudhary*: “Scalable Coding and Wireless Streaming of Lecture Videos for Mobile
Learning”, Advanced Technology of Learning Vol.4, No.2, 2007.
International Conference On Recent Trends In Engineering Science And Management ISBN: 978-81-931039-2-0
Jawaharlal Nehru University, Convention Center, New Delhi (India), 15 March 2015 www.conferenceworld.in
2507 | P a g e
A CRITICAL STUDY OF CREATIVE PROBLEM SOLVING FOCUSING ON LEVEL, STYLE AND
COMPLEXITY Sheshadri Chatterjee
Department of Management Studies Indian Institute of Technology Hauz Khas, New Delhi (India)
ABSTRACT
For many years researchers and developers are engaged in identifying the fittest tool to be used in Creative
Problem Solving. Obviously, every individual possess own style of approach to solve a problem. Once the
individual becomes able to realize his own style of problem solving, it becomes easy for him to apply the process
tools more effectively and more efficiently. Again, it is more common experience that in a group, an individual
can realize his own style to tackle a problem, it appears that the problem solving efforts of the group, as a
whole, are enhanced to a great extent and group can solve the problem more easily. In this paper we will try to
find out a Creative Problem Solving model and also discuss about problem solving style and would try to update
the applicability of congenial tool for Creative Problem Solving(CPS) and would also like to discuss the
differences in individual style which give rise to an important clue to realize the value of interaction, processes,
products especially when managing change.
Keywords: Creative Problem Solving, Creative Support Tools, Creativity Level,Creativity Style
I. INTRODUCTION
For argument sake, we can say that had there been such a creative machine which could help an individual
galvanize his idea with more clarity and intelligence and would have helped widening amplitude of individual
power of creativity, it would be categorized as Creative Support Tool (CSTs) [1] and it could have also helped
enhance creative process and quality of product [2]. There are many examples of CSTs like Wikipedia, Google
Maps etc. [3]. Academic examples of such tools are like Axon Idea Processor [4], BRUTUS [5], Aaron [6].
These Creative Support Tools (CSTs) now-a-days have focused on producing new ideas with the help of
combination of ideas in existence [7, 8] e.g. Wikipedia with the help of its search engine provides mixture based
keyword entered by a user. Another type of creativity is there called Exploratory Creativity (E-Creativity). One
of the examples of E-Creativity is associated with Experiment in Musical Intelligence [EMI] by Cope [9]. It
helps to compose new style of music with the help of already composed music in existence produced by famous
musicians. This helps to explore a conceptual space. Another category of creativity is there called
Transformational Creativity (T-Creativity). It is nothing but to create new idea by transformation of one or more
dimensions of conceptual space for creation of new ideas. This category is very important and ideal because it
inspires the user very much. This T-Creativity helps to produce new ideas with much familiarity e.g. for design
of floorplans and layouts for brochures and posters this technique was issued by Banerjee et al [10] with meta-

International Conference On Recent Trends In Engineering Science And Management ISBN: 978-81-931039-2-0
Jawaharlal Nehru University, Convention Center, New Delhi (India), 15 March 2015 www.conferenceworld.in
2508 | P a g e
design approach. Be it mentioned here that by Wiggins’s Creative System Framework (CSF) users engage them
in profound searching beyond their limited amplitude of imagination and ultimately become able to brass up
their awareness to produce Transformational Creativity [11, 12, 13, 14]. However, without going into details our
purpose is to discuss and understand and develop Creative Problem Solving and Problem Solving Style in the
form of model and also to discuss how personalities of individuals cast shadow on the style in individual
capacity as well as while working in a team.
II. CREATIVE PROBLEM SOLVING
Creativity and Tools: It is very important as to what is meant by “Problem Solving?” By the word “Problem” it
is meant as a gap between where we are or rather what we have already got and the desired goal [15]. Now
“Problem Solving” is nothing but is associated with thinking and behavior we engage in with an interaction to
reach the goal. Needless to say that problem carries a negative sense. It is clearly linked with terminologies like
‘goal’, ‘challenges’ etc. When we push ourselves towards goal, we might face hindrances and then we face
‘something’ known as ‘Problem’. When we fear challenges we feel ‘Problem’. Actually ‘Creativity’ and
‘Problem Solving’ have a very close relation too. Many writers have taken attempts to distinguish between these
two and also have tried to establish relation between these two [16, 17, 18]. We have already mentioned about
‘Creative Support Tools’ but it is important to ascertain which tool is required to be applied in which situation to
yield best result. This ascertainment requires optimized sense of mind of the problem solver. More one is
creative more will be his accuracy in ascertainment and application for use of definite tool. IsaKsen [19] gave
ideas through which ‘Creativity’ and ‘Problem Solving’ can be distinguished and through which they can be
related. A problem area may be well defined or may be ill-defined. The former takes help with problem solving
and the latter requires creativity to solve problems or it may require to find out the real problem [20, 21]. In the
former case, way to solve the problem is simple and in the latter case the solver faces complex situation. To
solve a problem in the former case; memory, expertise, knowledge are required but in the latter case it requires
in-depth creativity of thoughts [22, 23]. In the former case the desired outcome is found to be almost already in
existence or can be readily available but in the latter case, the outcome is a new one. The former situation is
called focused inquiry whereas the latter is called creativity and inventiveness [24, 25]. This connection
consisting difference as well as relationship between creativity and problem solving have helped develop to
provide a pragmatic framework in Creative Problem Solving (CPS).
III. CREATIVE PROBLEM SOLVING MODEL
Over years many researchers gave different models of CPS focusing alternation to the variety of users and
organizations. Here we approach to give a model of CPS basing on the work of Osborn [26]. While proposing
this model, attention has also been focused on the different developments made subsequently on this Osborn’s
model [27]. Isaksen, Dorvalk and Triffingar [28] also introduced another component called ‘Planning Your
Approval’ which is important to be considered in management perspective. It guides the problem solvers to
select the process in which the solvers should proceed to fetch fruitful result. Obviously, to solve a problem it
should be kept in mind that approach should be systematic. It will help to bridge a link between the
characteristics of people and environment in which the solver try to solve the problem [29]. It will also help to
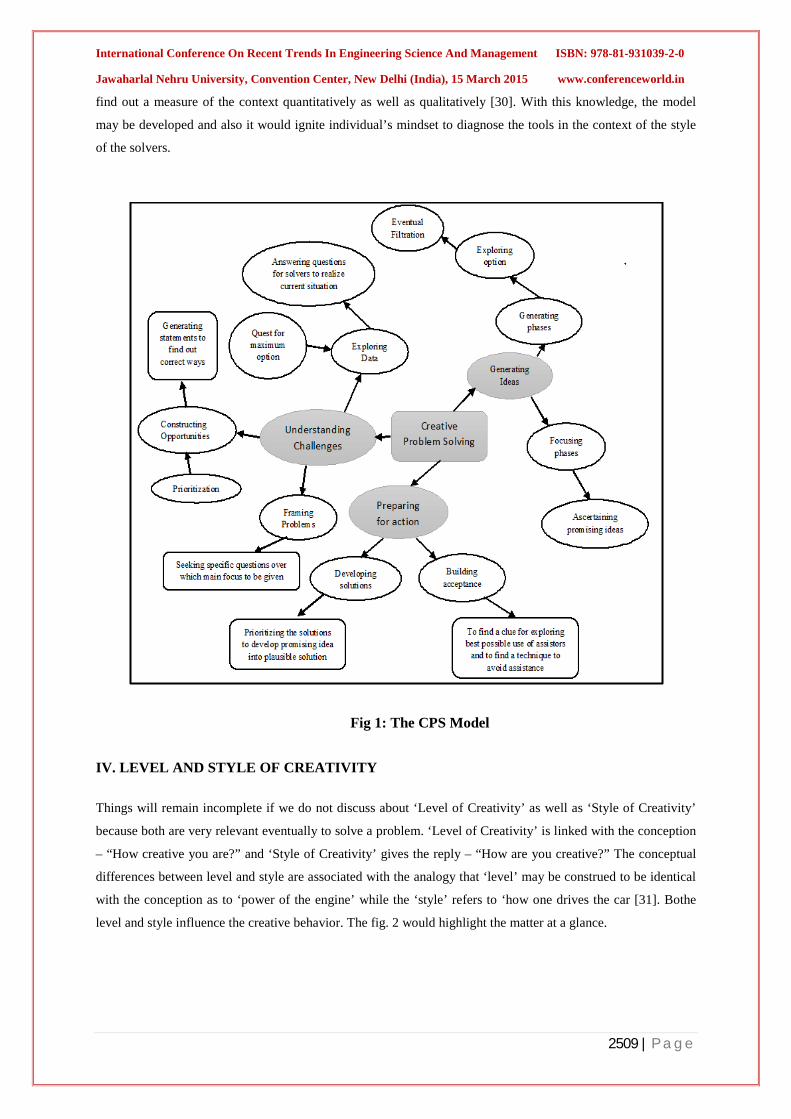
International Conference On Recent Trends In Engineering Science And Management ISBN: 978-81-931039-2-0
Jawaharlal Nehru University, Convention Center, New Delhi (India), 15 March 2015 www.conferenceworld.in
2509 | P a g e
find out a measure of the context quantitatively as well as qualitatively [30]. With this knowledge, the model
may be developed and also it would ignite individual’s mindset to diagnose the tools in the context of the style
of the solvers.
Fig 1: The CPS Model
IV. LEVEL AND STYLE OF CREATIVITY
Things will remain incomplete if we do not discuss about ‘Level of Creativity’ as well as ‘Style of Creativity’
because both are very relevant eventually to solve a problem. ‘Level of Creativity’ is linked with the conception
– “How creative you are?” and ‘Style of Creativity’ gives the reply – “How are you creative?” The conceptual
differences between level and style are associated with the analogy that ‘level’ may be construed to be identical
with the conception as to ‘power of the engine’ while the ‘style’ refers to ‘how one drives the car [31]. Bothe
level and style influence the creative behavior. The fig. 2 would highlight the matter at a glance.
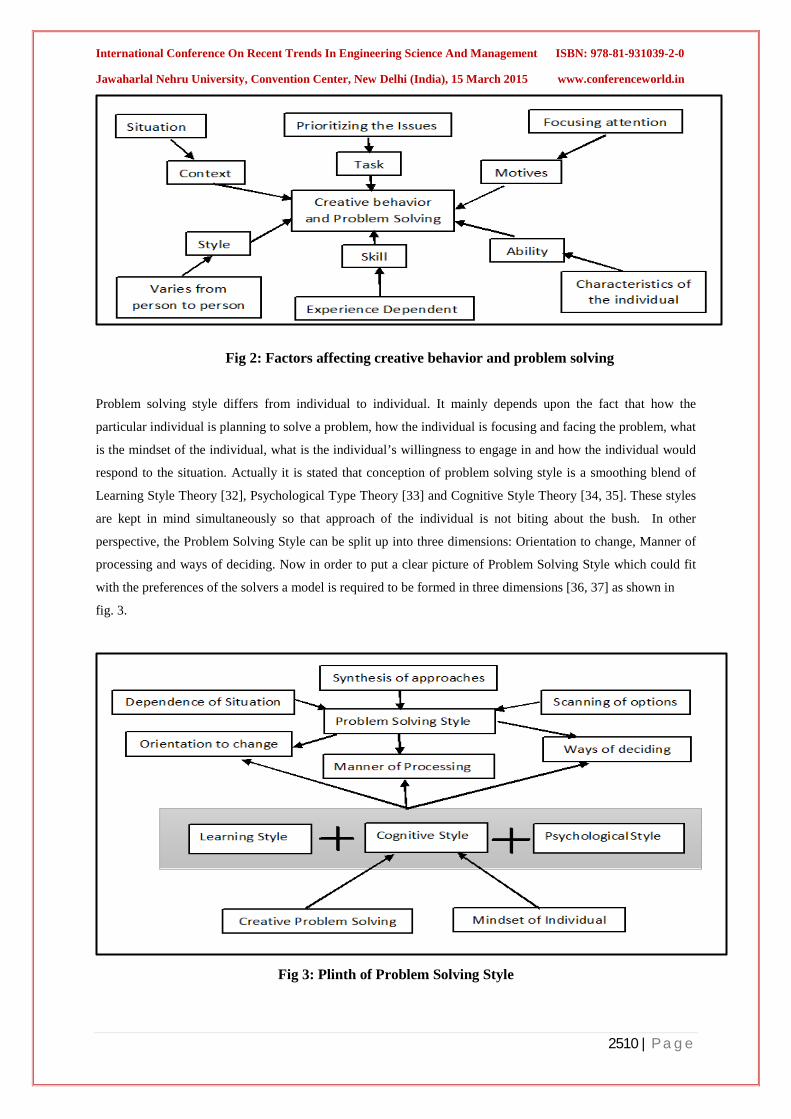
International Conference On Recent Trends In Engineering Science And Management ISBN: 978-81-931039-2-0
Jawaharlal Nehru University, Convention Center, New Delhi (India), 15 March 2015 www.conferenceworld.in
2510 | P a g e
Fig 2: Factors affecting creative behavior and problem solving
Problem solving style differs from individual to individual. It mainly depends upon the fact that how the
particular individual is planning to solve a problem, how the individual is focusing and facing the problem, what
is the mindset of the individual, what is the individual’s willingness to engage in and how the individual would
respond to the situation. Actually it is stated that conception of problem solving style is a smoothing blend of
Learning Style Theory [32], Psychological Type Theory [33] and Cognitive Style Theory [34, 35]. These styles
are kept in mind simultaneously so that approach of the individual is not biting about the bush. In other
perspective, the Problem Solving Style can be split up into three dimensions: Orientation to change, Manner of
processing and ways of deciding. Now in order to put a clear picture of Problem Solving Style which could fit
with the preferences of the solvers a model is required to be formed in three dimensions [36, 37] as shown in
fig. 3.
Fig 3: Plinth of Problem Solving Style

International Conference On Recent Trends In Engineering Science And Management ISBN: 978-81-931039-2-0
Jawaharlal Nehru University, Convention Center, New Delhi (India), 15 March 2015 www.conferenceworld.in
2511 | P a g e
V. CPS AND STYLE AND THEIR INTERACTIONS
Discussions in connection with CPS, Style of Problem Solving along with their interactions are very important
to study for the future researchers. It is important to realize human behavior and its study is also necessary to
enhance power of creativity in human behavior in solving problem. Studies of this also helps to develop talent
potentiality as well as skills [38, 39]. These implications cover as follows:
5.1 Clarification for Developing Creativity and Style
Creativity means the ability to generate ideas and products which are novel, useful, relevant and effective [40,
41, 42]. The degree of originality and usefulness and effect of applicability give rise to that what is nothing but
level of creativity. It is very tough to differentiate level and style of creativity but once individual deals with
their complex situation, his power of imagination increases and he is able to exert his highest potentiality.
Culture with aspects of level and style helps one improving his capability to solve a problem because by this,
one’s amplitude of conception, imagination, penetration is widened. The interaction between CPS and style
brings solvers more flexibility in ascertaining the real and pragmatic path to solve a problem.
5.2 Personalization of Instruction and Their Cogent Applications
For several years, efforts have been made to improve and increase the effectiveness and ability of CPS with
reference to the personal style, mindset, and pro-activeness so that the applications of CPS become more and
more fruitful. Actually, the personal characteristics of solvers ascertain the nature and role of forming CPS and
it helps to be involved in in-depth culture and study the interactions of persons and process in new way and
perspective. It is clear that Problem Solving Style varies from solver to solver and it is also clear that implication
of climate of creativity is also important for solving problem. As such these two factors are important to
consider for effective interaction in CPS [43].
5.3 Identification of Challenges and Ceaching of Creativity
Whenever one thinks of creativity and CPS and proceeds to solve a problem one question automatically crops
up: “what works best, for whom and under what conditions?” CPS has become more natural and flexible
framework and as such when we think of as to how to proceed as problem solvers, we start to examine with
normal view that CPS is a series of steps and stages for students to learn to solve problems. With children at an
elementary level approaching to solve problems we should accept the challenge to guide students in more
natural ways of applying CPS methodologies. But for students of upper level when proceeding to solve
problems; for their expected maturity of mindset, they can learn to monitor the effectiveness of their plans and
decisions and they become able to adjust their strategies in the context of the problem they are facing to solve.
Thus it is noted that CPS methodology is associated with variety of tools, strategies and techniques which may
find applications across a variety of domains.
International Conference On Recent Trends In Engineering Science And Management ISBN: 978-81-931039-2-0
Jawaharlal Nehru University, Convention Center, New Delhi (India), 15 March 2015 www.conferenceworld.in
2512 | P a g e
5.4 Importance of Team Work and Collaboration
It is a fact that when flexible set of tools be provided it would help generate multifarious options for decision
making. This is applicable to students of elementary class room or to teams of adolescents or even to high level
work groups. An understanding of styles helps in the differentiations of instructions when working with problem
solving team e.g. developers want analytic tools, explorers want to get liberty so that they can improve problem
solving tools, externals prefer projects, tools which can help in exchanging ideas and internals are benefitted
from projects and tools those may allow time for thinking before they share with the team.
VI. CONCLUSION
When the entire foregoing discussions are encapsulated it can be stated that research centering round creativity
and it’s applicability in the real world is continuously evolving. This development of research is associated with
a conception of more flexible realization of the process in CPS so that it may help problem solvers a clear
understanding as to which Creative Support Tool would fetch optimum result and also helps determining which
type of creativity e.g. E-Creativity or T-Creativity etc. would help in the context of that particular Creative
System Framework (CSF) to reach the goal. Not only that. The evolution is also associated with the
understanding of the construct of Problem Solving Style and the influence associated with Creative Productivity.
Assessment of Problem Solving Style is also finding its necessity and this instrument would help assessing an
individual’s style to solve a problem and would help the solver to reach its goal with ease. However, discussions
on the assessment instrument for problem solving have not been taken up here and it is left for future researchers
to deal with.
REFERENCES
[1] Z. Chen. Toward a better understanding of idea processors, Information and Software Technology 40
(10), 1998 541-553.
[2] B. Shneiderman, G. Fischer, M. Czerwinski, M. Resnick, B. Myers, L. Candy, E. Edmonds, M. Eisenberg,
E. Giaccardi, T. Hewett, P. Jennings, W. Kules, K. Nakakoji, J. Nunamaker, R. Pauch, T. Selker, E.
Sylvan, M. Terry. Creativity Support Tools: Reports from U.S. national science foundation sponsored
workshop, International Journal of Human-Computer Interaction 20(2), 2006, 61-77.
[3] T. Opas. An investigation into the Development of a Creativity Support Tool for Advertising. Doctoral
Dissertation, School of Computing and Mathematical Sciences, Auckland University of Technology,
2008
[4] B. Sheiderman. Creating Creativity: user interfaces for supporting innovation, ACM Transactions on
Computer-Human Interaction 7(1), 2000, 114-138.
[5] S. Bringsjord, D. Ferrucci. Artificial Intelligence and Literacy Creativity: Inside the mind of Brutus, A
Storytelling Machine, Lawrance Erlbaum, Mahwah, N J, 2000.
[6] H. Cohen, The further exploits of Aaron, Constructions of Mind 4(2), 1995, 141-158.
[7] M. Boden, Creativity and artificial intelligence, Artificial Intelligence 103, 1998, 347-356.

International Conference On Recent Trends In Engineering Science And Management ISBN: 978-81-931039-2-0
Jawaharlal Nehru University, Convention Center, New Delhi (India), 15 March 2015 www.conferenceworld.in
2513 | P a g e
[8] M. Boden, Computer models of creativity, AI Magazine 30(3), 2009, 23-34.
[9] D. Cope, Computer modeling of musical intelligence in EMI, Computer Music Journal 16(2), 1992, 69-
83.
[10] A. Banerjee, J. C. Quiroz, S.J. Louis. A computational model of collaborative creativity: a meta-design
approach, International Journal of Knowledge and Systems Science 2(2), 2011, 68-87.
[11] G. Wiggins. Towards a more precise characterization of creativity in AI, in: R. Weber, C. Wangenheim
(Eds), Case-Based Reasoning: Papers from the Workshop Programme ICCBR 01, 200.
[12] G. Wiggins. Categorizing creative systems, in: Proceedings of the third (IJCAI) Intelligence and Cognitive
Science, 2003.
[13] G. Wiggins. A preliminary framework for description, analysis and comparison of creative systems,
Journal of Knowledge-Based Systems 19(7), 2006, 449-458.
[14] G. Wiggins. Searching for computational creativity, New Generation Computing 24(3), 2006, 209-222.
[15] D. M Johnson. Systematic introduction to the psychology of thinking, New York: Harper and Row, 1972.
[16] J.P. Gilford. Way beyond the IQ: Guide to improving intelligence and creativity, Buffalo, N.Y: Bearly
Limited, 1977.
[17] H. Rugg. Imagination: An inquiry into sources and conditions that stimulate creativity. New York: Harper
and Row, 1963.
[18] M.A. Runco. To understand is to create: An epistemological perspective on human nature and personal
creativity. In R. Richards [Ed], Everyday creativity and new views of human nature: Psychological,
social, and spiritual perspectives. Washington, DC: American Psychological Association, 2007, 91-107.
[19] S.G. Isaksen. CPS: Linking creativity and problem solving. In G. Kaufmann, T. Helstrup, and K.H.
Teigen (Eds), Problem solving and cognitive processes: A festschrift in honor of KjellRaaheim, Bergen-
Sandviken, Norway: FogbokforlagetVigmostad and Bjorke AS, 1995, 67-81.
[20] D. K. Carson and M.A. Runco. Creative problem solving and problem finding in young adults:
Interconnections with stress, hassles, and coping abilities. Journal of creative Behavior 33, 1999, 167-
190.
[21] J.W. Getzels, M. Csikszentmihalyi. The creative vision: A longitudinal study of problem finding in art.
New York: John Wiley & Sons, 1976.
[22] D.C Geary. The origin of mind: Evolution of brain, cognition and general intelligence. Washington DC:
American Psychological Association, 2005.
[23] M.J. Kirton. Adoption-innovation in the context of diversity and change. London: Routledge,2003.
[24] M.Beer and N. Nohria. Breaking the code of change. Boston; Harvard Business School Press, 2000.

International Conference On Recent Trends In Engineering Science And Management ISBN: 978-81-931039-2-0
Jawaharlal Nehru University, Convention Center, New Delhi (India), 15 March 2015 www.conferenceworld.in
2514 | P a g e
[25] L. Bossidy and R. Charan. Execution: The discipline of getting things done. New York: Crown Business,
2002.
[26] A.F. Osborn. Applied imagination: Principals and procedures of creative thinking. New York: Charles
Scribner’s sons, 1953.
[27] S.G. Isaksen. The progress and potential of the creativity level-style distinction: Implications for research
and practice. In W. Hankedel and B. Kuvas. Creativity and Problem solving in the context of Business
Management, 2004, 40-71.
[28] S.G Isaksen, K.B Dorval & D.J Treffinger. Creative approaches to problem solving. Dubuque, IA:
Kendall/Hunt, 2000.
[29] S.G. Isaksen and J. Tidd. Meeting the innovation Challenge: Leadership for transformation and growth.
Chichester, U.K: Wiley, 2006.
[30] S.G. Isaksen and G. Ekrall. Assessing your context for change: A technical manual for the SOQ-Enhancing
performance of organizations, leaders and teams for over 50 years. Orchard Park, New York: The
Creative Problem Solving Group. (With contribution from Akkermans, Wilson and J.P. Gaulin), 2006.
[31] M.J. Kirton. A theory of cognitive style. In M.J. Kirton (Ed), Adaptors and innovators: Styles of creativity
and problem solving, 1994, 1-33.
[32] R. Dunn and K. Dunn. Teaching elementary students through their individual learning styles. Boston: Allyn
and Bacon, 1992.
[33] M. J. Kirton. Adopters and innovators: A description and measure. Journal of Applied Psychology, 1976,
622-629.
[34] O. Martinsen and G. Kaufmann. Cognitive style and creativity. In M.A. Runes and S.R. Pritzker (Eds),
Encyclopedia of creativity, NY: Academic Press, 1999, Vol. 1, 273-282.
[35] L. Myers and M. Mc Caulley. Manual: A guide to the development and use of the Myers-Briggs Type
Indicator Palo Alto, CA: Consulting Psychologists Press, 1995.
[36] S.G Isaksen, K.J. Laur and G.V. Wilson. An examination of the relationship between personality type and
cognitive style. Creativity Research Journal, 15(4),2003, 343-354.
[37] R.J Talbot. Talking style on board: Creativity and Innovation Management, 6, 1997, 177-184.
[38] E.P. Torrance. A national climate for creativity and innovation. Gifted Child Today. 15(1), 1992, 10-14.
[39] E.C. Selby and D.J Treffinger. Learning style, giftedness, and creativity. In R. Dunn and S. Griggs (Eds),
Synthesis of Dunn and Dunn learning style model research. Jamaica, NY: St. Johns University, 2003, 61-
66.
[40] A. Cropley. Definition of creativity. In S.R. Pritzker and M.A. Runco (Eds). Encyclopedia of creativity 2,
1999, 511-524.

International Conference On Recent Trends In Engineering Science And Management ISBN: 978-81-931039-2-0
Jawaharlal Nehru University, Convention Center, New Delhi (India), 15 March 2015 www.conferenceworld.in
2515 | P a g e
[41] D. Piffer. Can creativity be measured? An attempt to clarify the notion of creativity and general directions
for future research. Thinking skills and Creativity, 7, 2012, 258-264.
[42] U. Sak. About giftedness, creativity and teaching the creatively gifted in the classroom. Roaper Review,
26(4), 2004, 216-222.
[43] T.I Lubart. Model of the creative process: Past, Present and future. Creativity Research Journal 13(3, 4),
2000-200, 295-308.
International Conference On Recent Trends In Engineering Science And Management ISBN: 978-81-931039-2-0
Jawaharlal Nehru University, Convention Center, New Delhi (India), 15 March 2015 www.conferenceworld.in
2516 | P a g e
STUDYING VARIATIONS IN CAVITY EXPERIENCE AMONG THE MAJOR ETHNIC GROUPS OF DOOARS
REGION USING DATA MINING
Amrita Kundu1, Dr. Rajashri Kundu2
1Department of Computer Science, Banasthali Vidyapith (India) 2Assistant Professor, Department of Conservative Dentistry and Endodontics, MMDCH (India)
ABSTRACT Dental caries is a common problem today though its existence can be traced even in ‘Sushruta Samhita’ where
words like ‘mukha roga’ or ‘krimi dantaka’ have been mentioned. Till date almost everyone need to visit a dentist to
get these caries treated and the rate is increasing day by day. So studying the reason behind this has proved to be
the need of time. Studies are carried out on a large population of vivid type to find out the factors governing the
caries prevalence like age, sex, ethnicity etc among people and suggest the possible solutions. Data mining has
shown remarkable use in knowledge discovery from huge data sets. So in this paper we used data mining techniques
to study the caries experience among the major ethnic groups of Dooars area of West Bengal, India to see how it
varies among them and the possible reasons behind the variations.
Keywords- Caries, Caries Prevalence, Data Mining, DMF Index, Ethnicity. I INTRODUCTION
1.1. Problem According to Shafer (2006), Caries is an irreversible microbial disease of the calcified tissue of the teeth that can be
characterized by demineralization of the inorganic portion and destruction of the organic substance of the tooth that
leads to cavitations [1]. The history behind dental caries is very long. Dental caries problem was noticeably less
through the Bronze and Iron ages mostly due to dependency on animal protein food. The increase of caries during
the Neolithic period may be attributed to the increase of plant foods containing carbohydrates in them. It is believed
that the beginning of rice cultivation lead to an increase in dental caries. 5000 BC old Sumerian text describes
“toothworm” as the cause of caries [2].Though Pierre Fauchard was the first one to reject the idea of worms as the
cause of tooth decay [2], it was W.D. Miller who conducted a series of studies in the year 1890 and found that
bacteria inhabited the mouth and they produced acids that dissolved tooth structures in the presence of fermentable
carbohydrates [3]. Cavity is one of the most common disorders of childhood and has many undesirable effects on
child population like-
a. Pain.
b. Improper sleep.
c. Problems in speech.

International Conference On Recent Trends In Engineering Science And Management ISBN: 978-81-931039-2-0
Jawaharlal Nehru University, Convention Center, New Delhi (India), 15 March 2015 www.conferenceworld.in
2517 | P a g e
d. Psychological disorders [4].
There are some factors affecting the prevalence of caries beside carbohydrate and microbes. According to Shafer
they are ethnicity, age, gender and family history [1].
· Ethnicity: Some studies done in the past has shown remarkable difference between various ethnic groups.
For example among the American blacks and whites living in the same geographical area under similar
conditions [1].
· Age: Several studies have shown that about 20% of children have experienced dental caries in their
dentition. By the age of 12, 90% of children experience dental caries [1].
· Gender: Studies indicate that the total caries experience in permanent teeth is greater in females than in
males of the same age. This is attributed largely to the fact that the teeth of girls erupt at an early age than
the teeth of boys of the same age [1].
· Family history: Siblings of individuals with high caries susceptibility are also generally caries active,
whereas siblings of carries immune individuals generally exhibit low caries rate (Garn et al) [1].
1.2. Previous work 1.2.1. Creiohton W.E carried out an Epidemiological study on dental caries experience of Negro and Caucasian
children in Portland, Oregon in the year 1969. Baseline data was collected from 1374 children and 761 black
children to make the cross racial comparison of prevalence of dental caries. He found that black children have fewer
dental caries than the whites [5].
1.2.2. Downer M.C made a comparison of dental caries in European and Negro girls aged 13 and 14 years and of
periodontal disease in girls aged 11 to 14 years attending a secondary school in London in the year 1970. The Negro
girls had a significantly lower prevalence of caries experience and a significantly higher prevalence of destructive
periodontal disease than the Europeans [6].
1.2.3. Bedi R, Uppal RD conducted an oral health survey on the oral health of minority ethnic communities in the
United Kingdom in 1996 and found significant differences in caries experience among different ethnic groups [7].
1.2.4. Okunseri C, Badner V, Kumar J, Cruz, G D conducted a study to estimate dental caries prevalence and
treatment need among racial/ethnic minority school children in the Bronx in 2002. Hispanic children (mean DMFS
of 1.71) experienced more dental caries as compared to African-Americans (mean DFMS of 1.14) [8].
1.2.5. Xiaojuan Zeng, Yan Luo, Minquan Du, Raman Bedi measured the dental caries experience of preschool
children from different ethnic groups in Guangxi Province in China in 2005. Zhuang children had a significantly
higher prevalence of rampant caries (13% vs. 9%), mean DMFT (3.36 vs. 2.66) and mean DMFS (5.10 vs. 3.76)
than the Han children. An analysis of the factors contributing to the racial variation showed that dietary influence
was not the only factor responsible. The variation in caries susceptibility based on racial differences has been
postulated [9].
1.2.6. Jalili et al. (1993) designed a study amongst the tribal children (number=1016; aged 6-13 years) in Mandu,
Madhya Pradesh. The tribal children exhibited a low prevalence of caries in teeth, in permanent as well as
permanent dentition, compared to rural as well as urban Indian children of the same age group [10].

International Conference On Recent Trends In Engineering Science And Management ISBN: 978-81-931039-2-0
Jawaharlal Nehru University, Convention Center, New Delhi (India), 15 March 2015 www.conferenceworld.in
2518 | P a g e
1.2.7. Retnakumari studied the prevalence of dental caries in school children (aged 6-12 years) in Kerala in the year
1999. The findings indicated that highest prevalence (75.9%) was recorded in the subjects of age group of 10 years
and the lowest in the age group of 8 years. Statistically significant association was found with dental caries and oral
hygiene status [11].
1.2.8. Singh et al conducted a study on the prevalence of dental caries in school children (aged 12-16 years) of rural
settings of Haryana in 1999, was found to be 39.4%. It was 37.9% in boys and 42.6% in girls. A significant increase
in prevalence of dental caries with age was observed (33% in 12 year old children to 45.8% in 24 year old children)
[12].
1.2.9. Chawla et al measured the trend of dental caries in 2000 in children of Chandigarh and noticed a continuous
decline among the children (12-15 years) but a slight increase was found in the dental caries status of 5-6 year
children [13].
1.2.10. David et al. (2005) conducted a study on dental caries and its associated factors in 12 year old school
children in Thiruvananthapuram (Kerala). The authors observed the prevalence of dental caries in permanent
dentition as 27%. The study indicated that urban living conditions were associated with more dental caries. The
pattern of prevalence of dental caries in the primary dentition among 5 year old children (number=1009) in urban
Pondicherry was assessed by Saravan et al. (2006) [14].
1.2.11. Dutta A (1965) conducted a study in 1424 children in Calcutta to study the prevalence of caries. It was found
that the DMF increases with age. The observed DMF was 0.18 for 6 years and for 12 years it was 2.40. Caries
prevalence was high among the low socioeconomic group as compared to high socioeconomic group [15].
1.2.12. Saha et al (1996) studied the prevalence of dental caries and oral hygiene status in rural and urban areas of
Calcutta. 9600 children of age group 6-14 years were chosen for the examination. Dental caries prevalence in urban
area was 68.0% in boys and 69.9% in girls respectively in the age group of 6 years and the combined percentage was
69.0%. In 12 years old it was 71.1% and 72.2% respectively in boys and girls and the combined percentage was
71.4%. In 6 years old group of the rural area the prevalence was 54.0% and 54.6% for boys and girls respectively
and the combined percentage was 54.3%. In the age group of 12 years the prevalence was 55.3% for boys and
57.35% for girls with a combined value of 66.0% [16].
1.2.13. Yoh Tamaki et al (2008) proposed a model for the prediction of dental caries using data mining. About 500
students (age 5-8 years) were examined and data was collected mostly using questionnaires. A decision tree was
designed to assess the data. MS levels in saliva were tested. The mean number of decayed and filled teeth (DF) was
about 0.054 at the baseline [17].
1.3. Purpose
In this paper we have used data mining techniques on the data set of four major ethnic groups of Dooars region of
the state of West Bengal (India) [Annexure-1(Fig. a.)]. Dooars or Duars are the footplains of the eastern Himalayas
in north-East India including parts of Bhutan. The Sankosh river divides this area into the Eastern Dooars or the
Assam Dooars and the Western Dooars or the Bengal Dooars consisting of an area of about 8800 square kilometers
or 3400 square miles [18]. The various major towns in this region are Goalpara, Kokrajhar, Barpeta, Bongaigaon
and Dhubri in Assam and Siliguri, Coochbehar, Alipurduar, Jalpaiguri, Malbazar, Mainaguri and Birpara in West
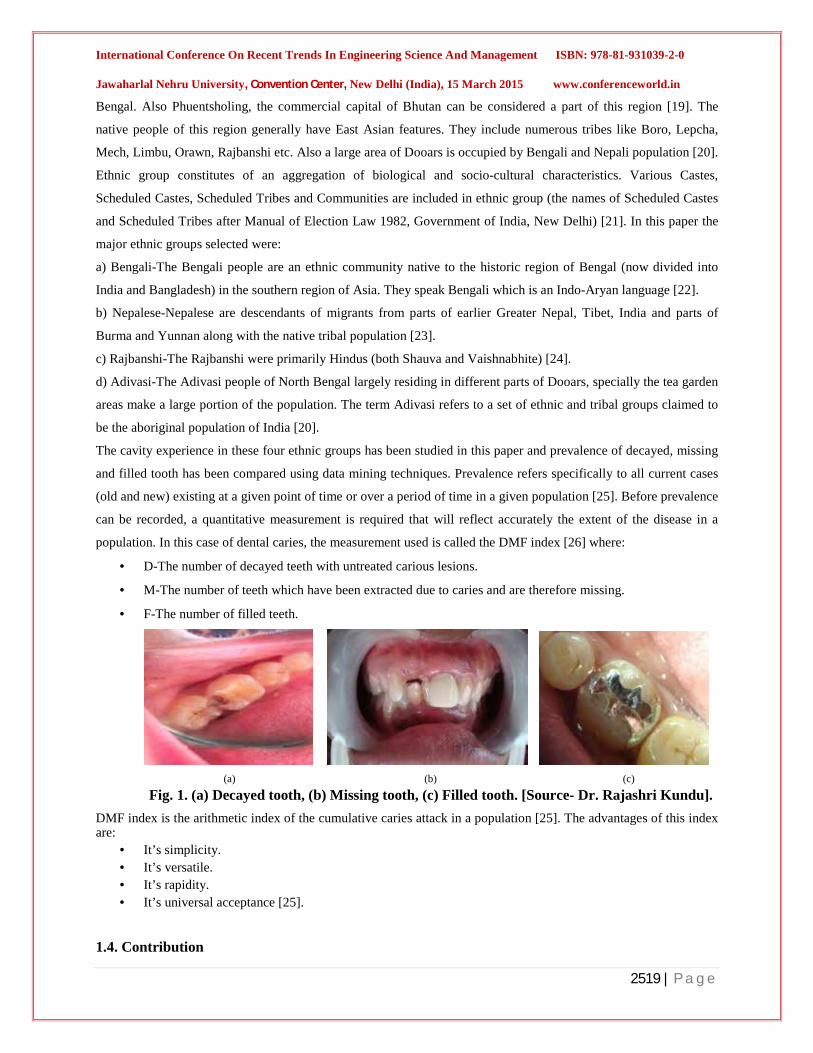
International Conference On Recent Trends In Engineering Science And Management ISBN: 978-81-931039-2-0
Jawaharlal Nehru University, Convention Center, New Delhi (India), 15 March 2015 www.conferenceworld.in
2519 | P a g e
Bengal. Also Phuentsholing, the commercial capital of Bhutan can be considered a part of this region [19]. The
native people of this region generally have East Asian features. They include numerous tribes like Boro, Lepcha,
Mech, Limbu, Orawn, Rajbanshi etc. Also a large area of Dooars is occupied by Bengali and Nepali population [20].
Ethnic group constitutes of an aggregation of biological and socio-cultural characteristics. Various Castes,
Scheduled Castes, Scheduled Tribes and Communities are included in ethnic group (the names of Scheduled Castes
and Scheduled Tribes after Manual of Election Law 1982, Government of India, New Delhi) [21]. In this paper the
major ethnic groups selected were:
a) Bengali-The Bengali people are an ethnic community native to the historic region of Bengal (now divided into
India and Bangladesh) in the southern region of Asia. They speak Bengali which is an Indo-Aryan language [22].
b) Nepalese-Nepalese are descendants of migrants from parts of earlier Greater Nepal, Tibet, India and parts of
Burma and Yunnan along with the native tribal population [23].
c) Rajbanshi-The Rajbanshi were primarily Hindus (both Shauva and Vaishnabhite) [24].
d) Adivasi-The Adivasi people of North Bengal largely residing in different parts of Dooars, specially the tea garden
areas make a large portion of the population. The term Adivasi refers to a set of ethnic and tribal groups claimed to
be the aboriginal population of India [20].
The cavity experience in these four ethnic groups has been studied in this paper and prevalence of decayed, missing
and filled tooth has been compared using data mining techniques. Prevalence refers specifically to all current cases
(old and new) existing at a given point of time or over a period of time in a given population [25]. Before prevalence
can be recorded, a quantitative measurement is required that will reflect accurately the extent of the disease in a
population. In this case of dental caries, the measurement used is called the DMF index [26] where:
· D-The number of decayed teeth with untreated carious lesions.
· M-The number of teeth which have been extracted due to caries and are therefore missing.
· F-The number of filled teeth.
(a) (b) (c) Fig. 1. (a) Decayed tooth, (b) Missing tooth, (c) Filled tooth. [Source- Dr. Rajashri Kundu].
DMF index is the arithmetic index of the cumulative caries attack in a population [25]. The advantages of this index are:
· It’s simplicity. · It’s versatile. · It’s rapidity. · It’s universal acceptance [25].
1.4. Contribution

International Conference On Recent Trends In Engineering Science And Management ISBN: 978-81-931039-2-0
Jawaharlal Nehru University, Convention Center, New Delhi (India), 15 March 2015 www.conferenceworld.in
2520 | P a g e
Dooars region is spread across an area of 8800 square kilometer [18] with about 13 major towns and is a major
tourist attraction. The tea gardens in the area contribute to the supply of high quality tea [27] for which India is
famous. However irrespective of its importance no study report have been found by us about the dental caries, oral
hygiene or comparative levels of caries status among the ethnic groups residing there ( Rajbanshi, Nepali, Bengali
and Adivasi etc[20]). This study conducted on the major ethnic groups (Bengali, Nepali, Rajbanshi and Adivasi) can
throw light on the factors leading to the variations in the cavity experience among them and suggest ways to modify
the present scenario mostly by means of preventing dental caries as restoration techniques can be out of reach of
many people residing in the area with a low socioeconomic status. Also we can compare the caries index of this area
with the rest of the world to better understand its variation and prevalence [Annexure-1(Fig. c.)].
II MATERIALS AND TECHNIQUES USED 2.1. Essential instruments and materials used by the doctor:
· Dental mirror, · Tweezers · Gloves · Mask · Disinfectants
2.2. Tools used for data collection and mining:
· Questionnaire · Interview · Observations · Microsoft Excel 2007 · SPSS 16.0
2.3. Information about study area and the studied population Some necessary information was collected before the study like:
· Map of the area from census office. · Surnames of the different ethnic groups from the Block Development Office. · List of secondary schools in the area from the office of Secondary School Inspector.
III RESEARCH METHODOLOGY For this study we chose the school going children belonging to the four ethnic groups of Dooars of age 12-15 years.
The reason behind selecting this age group was that at this age generally all permanent teeth are erupted. It is the age
of early permanent dentition. So it is ideal for measuring the severity of dental caries and its variation with ethnicity
too. For collecting the data dental checkups were conducted in some of the schools of Dooars region like Malbazar
and more than 2000 students of this age group were examined among which 500 students of each ethnic group (both
male and female) were considered for the study. The school authorities were informed the date of checkups from
beforehand and the children along with their parents participated in it. Inter racial marriage history of last three
generations were collected from the parents. Printed questionnaires were distributed among the students where they
had to fill some basic queries like their name, age, gender, name of the institution, address and food habit. The oral
examination was then done by Dr. Rajashri Kundu using the necessary instruments and the number of decayed,
missing and filled teeth was filled by her in the questionnaire itself. The inclusion criteria were:

International Conference On Recent Trends In Engineering Science And Management ISBN: 978-81-931039-2-0
Jawaharlal Nehru University, Convention Center, New Delhi (India), 15 March 2015 www.conferenceworld.in
2521 | P a g e
· Only the permanent teeth, including the third molars were considered.
· Teeth were considered “decayed” when there was presence of caries, teeth with restoration and recurrent
caries, teeth with temporary restoration (WHO DMF index modification, 1986) or those with decay
indicated for restoration. They were counted under ‘D’.
· Teeth were considered missing only when extracted due to carries and not due to any orthodontic reason or
accident or those which were congenitally missing. They were counted under ‘M’.
· A tooth was considered to be filled only when it had some kind of filling (e.g. Amalgam filling). They were
counted under ‘F’.
· A tooth was considered to be present even when the crown was totally destroyed and only the root was
present.
The students were also asked about how they take care of oral hygiene, the kind of toothpaste they used and number
of times they brushed. Fluoride concentration in the water plays an important role in oral cavity. Due to universal
presence of fluoride in the earth’s crust, all water contains fluoride in varying concentration. This variation is
noticed not only from place to place but also within the same locality. But as West Bengal comes under very low
fluoride concentration area, its affect was not considered [Annexure-1 (Fig. b.)].
3.1 Classification
Finally, the students were classified into four major ethnic groups (Bengali, Nepali, Rajbanshi and Adivasi) by
comparing their surnames with the list provided by the Block Development Office. Data of 500 students belonging
to each group and the student names with no ambiguity were selected and stored in Microsoft Excel 2007 along with
the number of decayed ‘D’, missing ‘M’, filled ‘F’ and total number of decayed, missing and filled teeth ‘DMF’ of
each student.
3.2. Data Mining
Data mining [28] was then applied on this summarized data using Microsoft Excel 2007 and SPSS 16.0 to find out:
· Mean and standard deviation of decayed teeth ‘D’ of all the groups.
· Mean and standard deviation of missing teeth ‘M’ of all the groups.
· Mean and standard deviation of filled teeth ‘F’ of all the groups.
· Mean and standard deviation of decayed, missing and filled teeth ‘DMF’ of all the groups.
· Prevalence of ‘D’, ‘M’, ‘F’ and ‘DMF’ among all the groups.
· Frequency of ‘D’, ‘M’, ‘F’ and ‘DMF’ in all the four groups using histograms.
IV RESULTS AND OBSERVATIONS The results obtained are summarized in the table below.
TABLE I. The mean and standard deviation of D, M, F and DMF
Ethnic group Mean ‘D’ S.D of ‘D’
Mean ‘M’ S.D of ‘M’
Mean ‘F’ S.D of ’F’
Mean ‘DMF’ S.D of ‘DMF’
Bengali 0.820 1.110886 0.106 0.3674 0.162 0.5062 1.088 1.6091 Nepali 1.036 1.168518 0.130 0.4577 0.116 0.4806 1.282 1.5792
Rajbansi 0.814 1.261184 0.020 0.1401 0.030 0.2987 0.864 1.2823 Adivasi 0.502 0.869199 0.000 0.0000 0.024 0.2179 0.526 0.8825

International Conference On Recent Trends In Engineering Science And Management ISBN: 978-81-931039-2-0
Jawaharlal Nehru University, Convention Center, New Delhi (India), 15 March 2015 www.conferenceworld.in
2522 | P a g e
Fig. 1. Comparative mean of ‘D’. Fig. 2. Comparative mean of ‘M’ The comparative analysis of mean of ‘D’ (Fig. 1.) showed significant difference between groups with highest value
of ‘D’ among Nepali (1.036) and lowest among Adiwasi (0.502). Bengali and Rajbanshi showed intermediary
values of ‘D’ (Bengali 0.82 and Rajbanshi 0.814).
The mean of ‘M’ when compared among different groups (Fig. 2.), showed significant difference in result, Nepali
having the highest number of missing teeth due to caries (0.13) followed by Bengali (0.106) and Rajbanshi (0.02).
Surprisingly Adivasi people had no missing tooth due to caries with a mean ‘M’ equal to zero.
Fig. 3. Comparative mean of ‘F’. Fig. 4. Comparative mean of ‘DMF’. When the mean of ‘F’ was compared among the groups, a remarkable decrease in the value was noticed from
Bengali to Adivasi.
Comparing the mean DMF of all the groups the highest ‘DMF’ was found among the Nepali (1.282) followed by
Bengali (1.088), Rajbanshi (0.864) and Adivasi (0.526).
TABLE II. Prevalence chart of D, M, F and DMF among the groups Race Prevalence
of ‘D’
Prevalence
of ‘M’
Prevalence
of ‘F’
Prevalence
of ‘DMF’
Bengali 44% 9% 11% 44%
Nepali 52% 8% 6% 52%
Rajbanshi 37% 2% 1% 37%
Adivasi 30% 0% 0% 30%
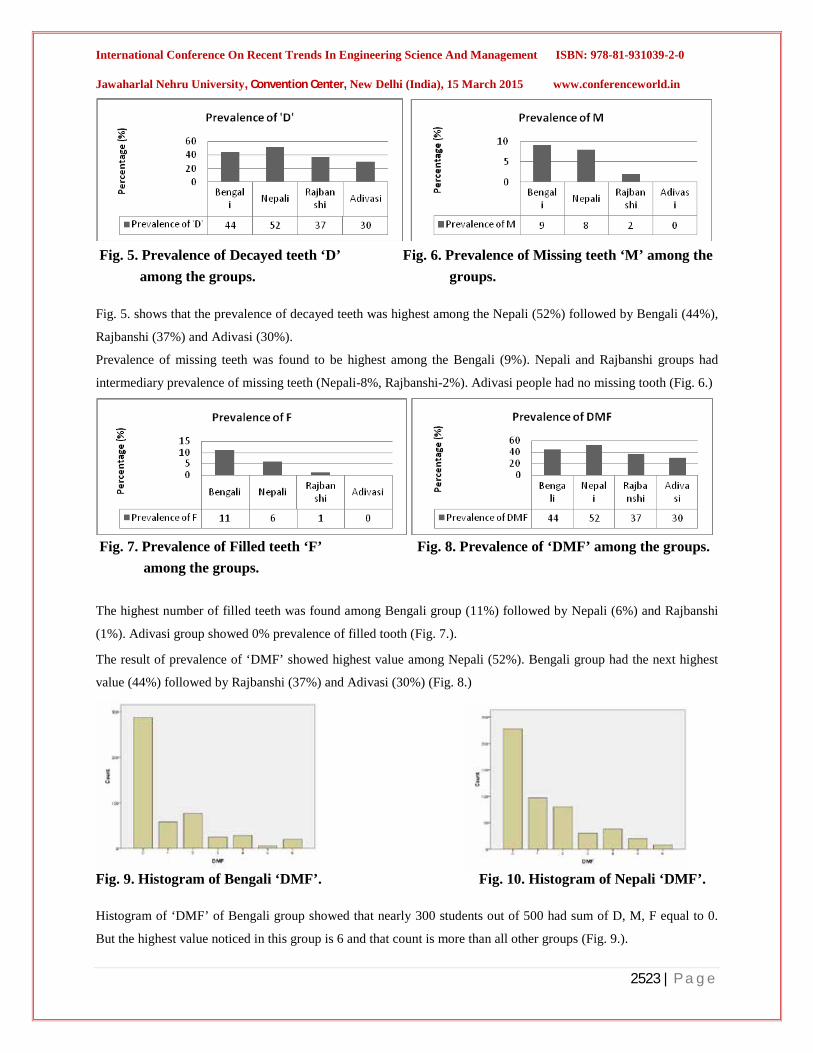
International Conference On Recent Trends In Engineering Science And Management ISBN: 978-81-931039-2-0
Jawaharlal Nehru University, Convention Center, New Delhi (India), 15 March 2015 www.conferenceworld.in
2523 | P a g e
Fig. 5. Prevalence of Decayed teeth ‘D’ Fig. 6. Prevalence of Missing teeth ‘M’ among the among the groups. groups.
Fig. 5. shows that the prevalence of decayed teeth was highest among the Nepali (52%) followed by Bengali (44%),
Rajbanshi (37%) and Adivasi (30%).
Prevalence of missing teeth was found to be highest among the Bengali (9%). Nepali and Rajbanshi groups had
intermediary prevalence of missing teeth (Nepali-8%, Rajbanshi-2%). Adivasi people had no missing tooth (Fig. 6.)
Fig. 7. Prevalence of Filled teeth ‘F’ Fig. 8. Prevalence of ‘DMF’ among the groups. among the groups. The highest number of filled teeth was found among Bengali group (11%) followed by Nepali (6%) and Rajbanshi
(1%). Adivasi group showed 0% prevalence of filled tooth (Fig. 7.).
The result of prevalence of ‘DMF’ showed highest value among Nepali (52%). Bengali group had the next highest
value (44%) followed by Rajbanshi (37%) and Adivasi (30%) (Fig. 8.)
Fig. 9. Histogram of Bengali ‘DMF’. Fig. 10. Histogram of Nepali ‘DMF’.
Histogram of ‘DMF’ of Bengali group showed that nearly 300 students out of 500 had sum of D, M, F equal to 0.
But the highest value noticed in this group is 6 and that count is more than all other groups (Fig. 9.).
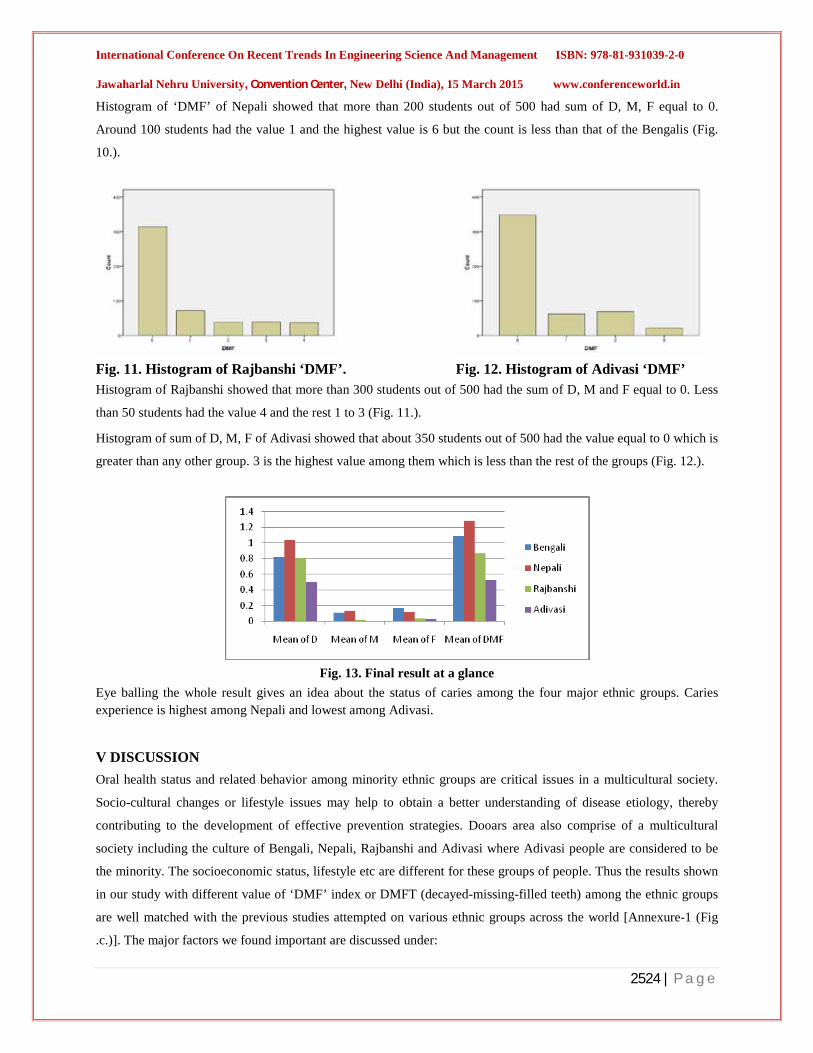
International Conference On Recent Trends In Engineering Science And Management ISBN: 978-81-931039-2-0
Jawaharlal Nehru University, Convention Center, New Delhi (India), 15 March 2015 www.conferenceworld.in
2524 | P a g e
Histogram of ‘DMF’ of Nepali showed that more than 200 students out of 500 had sum of D, M, F equal to 0.
Around 100 students had the value 1 and the highest value is 6 but the count is less than that of the Bengalis (Fig.
10.).
Fig. 11. Histogram of Rajbanshi ‘DMF’. Fig. 12. Histogram of Adivasi ‘DMF’ Histogram of Rajbanshi showed that more than 300 students out of 500 had the sum of D, M and F equal to 0. Less
than 50 students had the value 4 and the rest 1 to 3 (Fig. 11.).
Histogram of sum of D, M, F of Adivasi showed that about 350 students out of 500 had the value equal to 0 which is
greater than any other group. 3 is the highest value among them which is less than the rest of the groups (Fig. 12.).
Fig. 13. Final result at a glance
Eye balling the whole result gives an idea about the status of caries among the four major ethnic groups. Caries experience is highest among Nepali and lowest among Adivasi.
V DISCUSSION Oral health status and related behavior among minority ethnic groups are critical issues in a multicultural society.
Socio-cultural changes or lifestyle issues may help to obtain a better understanding of disease etiology, thereby
contributing to the development of effective prevention strategies. Dooars area also comprise of a multicultural
society including the culture of Bengali, Nepali, Rajbanshi and Adivasi where Adivasi people are considered to be
the minority. The socioeconomic status, lifestyle etc are different for these groups of people. Thus the results shown
in our study with different value of ‘DMF’ index or DMFT (decayed-missing-filled teeth) among the ethnic groups
are well matched with the previous studies attempted on various ethnic groups across the world [Annexure-1 (Fig
.c.)]. The major factors we found important are discussed under:

International Conference On Recent Trends In Engineering Science And Management ISBN: 978-81-931039-2-0
Jawaharlal Nehru University, Convention Center, New Delhi (India), 15 March 2015 www.conferenceworld.in
2525 | P a g e
5.1. Dietary factors: Most dietary factors found to be significant are related to the consumption of sugar-its amount,
frequency or time of consumption. In our study, the consumption of sugar and sticky carbohydrates in the form of
refined food are a new trend among the advancing ethnic groups of Dooars, like Bengali and Nepali which can
contribute to their larger value of DMF index than the Rajbanshi and Adivasi children who consume mainly fibrous
food.
5.2. Oral hygiene maintenance: Oral hygiene maintenance has been found to be a significant risk factor for dental
caries. In our study, Bengali and Nepali children were found more conscious about oral hygiene maintenance than
the tribal groups including Rajbanshi and Adivasi children of Dooars. But still the Rajbanshi and Adivasi group had
lower caries index which may be related to their tribal ethnicity.
5.3. Socioeconomic status: In our study population, Bengalis are socioeconomically sounder than the rest of the
population and hence show more concern about dental care. This is supported by the evidence of early treated teeth
like filled teeth. On the other hand the other less socioeconomically sound groups did not show much concern about
the dental care.
5.4. Tea intake: Tea extracts has been reported to contain substances, notably polyphenols that has antibacterial
properties against oral pathogens such as Streptococcus mutans which is the bacteria associated closely with the
caries of teeth. Some studies suggest that a diet supplemented with green tea may be beneficial in dental caries
management [29]. In the present study, Adivasi group of children are mainly living in areas of tea garden where they
consume tea on a regular basis. This could result in the lower prevalence of dental caries among them.
5.5. Fluoride: Our study area is reported to have much less Fluoride level in drinking water than needed to reduce
the caries index [Annexure-1 (Fig. b.)]. So its contribution in the variation of caries index among the groups cannot
be considered.
VI CONCLUSION In the current study it was observed that there is a definite difference in the caries level among the ethnic groups. A
majority of carious lesions were unrestored in all the groups and were active by nature. If allowed to continue would
certainly result in complications. The following measures are suggested from our side that can be taken to promote
better dental care among them-
· Dental health services should focus primarily on the prevention of dental caries since the cost of
management and restoration of teeth may not be within the reach of many residing in the Dooars area with
a low socioeconomic status.
· The role of primary health care workers should not be underestimated as they can perform the primary
prevention programs among the school children in the form of oral health education with emphasis on their
food habits and regular checkups.
· Use of fluorides especially in toothpastes has been documented with much benefit in caries prevention, and
therefore its use in caries prevention should be encouraged.
· At primary health centre a special manpower as “oral health educator” can be kept after training the
existing health educators by conducting crash courses so that they can take care of oral health education of
the people residing in Dooars.

International Conference On Recent Trends In Engineering Science And Management ISBN: 978-81-931039-2-0
Jawaharlal Nehru University, Convention Center, New Delhi (India), 15 March 2015 www.conferenceworld.in
2526 | P a g e
· Atraumatic Restorative Treatment (ART) is a well accepted treatment by rural school children. Specific
manpower (A special dental auxiliary), named as ‘RURAL SCHOOL DENTAL NURSE’ can be trained to
deliver ART to the rural school children.
Beside the chances of error in the reports so many subjects, there are also chances of observer biasness. In future
more surveys can be conducted with larger data and vivid ethnic groups and different data mining techniques can be
applied on those for extracting various kinds of knowledge. Training using Neural Networks can be introduced to
manage such huge data in an intelligent manner and better information retrieval techniques can be applied for easier
and faster retrieval.
VII ACKNOWLEDGEMENT I would like to take this opportunity to express my gratitude to all those people who have in various ways helped us
including the schools, students and their parents without whose cooperation our survey could not be successful. My
sincere thanks goes to Dr. Saurabh Mukherjee (Associate Professor, Dept. of Computer Science, Banasthali
Vidyapith) and Dr. Arnab Mukherjee (MDS, Oral and Maxillofacial Pathology) for sharing their wisdom,
knowledge and expertise to better understand the issues related to this work.
REFERENCES [1] R. Rajendran, Shafer’s Textbook of Oral Pathology (Elsevier India, 2006, 5th edition).
[2] Judit Forrai, The Beginnings of Dental Caries and its Treatments, Rev. Clín. Pesq. Odontol., Curitiba, v. 5, n. 2,
p. 187-192, maio/ago. 2009.
[3] Kleinberg I, A mixed-bacteria ecological approach to understanding the role of the oral bacteria in dental caries
causation: an alternative to Streptococcus mutans and the specific-plaque hypothesis. Crit Rev Oral Biol Med.
13 (2): 108–25. 1 March 2002.
[4] Sobha Tandon, Dental caries in Early childhood, Textbook of Pedodontics (Paras Publication, 2008, 2nd
edition).
[5] Creiohton W. E., Dental caries experience of Negro and Caucasian children in Portland, Oregon. / . Denl.Child:
36: 139-143, 1969.
[6] Downer M.C, Dental caries and periodontal disease in girls of different ethnic groups. A comparison in a
London secondary school. Brit. Dent J. Vol 128, No 8 p.p 378-85, 1970.
[7] Bedi R, Uppal RD, The oral health of minority ethnic communities in the United Kingdom, Br Dent J, 9-
23;179(11-12):421-5, Dec 1995.
[8] Okunseri C, Badner V, Kumar J, Cruz GD, Dental caries prevalence and treatment need among racial/ethnic
minority schoolchildren, N Y State Dent J., 68(8):20-3, Oct 2002.
[9] Xiaojuan Zeng,Yan Luo,Minquan Du,Raman Bedi. Dental caries experience in preschool children from
different ethnic groups in Guangxi Province in China. Oral Health Prev Dent 3: 1. 25-31, 2005.

International Conference On Recent Trends In Engineering Science And Management ISBN: 978-81-931039-2-0
Jawaharlal Nehru University, Convention Center, New Delhi (India), 15 March 2015 www.conferenceworld.in
2527 | P a g e
[10] 25. Jalili VP, Sidhu SS, Kharbanda OP, Status of Dental caries and treatment need in tribal children
in Madhu, 7:7-15, 1993.
[11] N Retnakumari, Prevalence of Dental Caries and risk assessment among primary school children of 6-12 years
in Varkal municipal area of Kerala, J Indian Soc Pedo Prev Dent;17:4:135-42, 1999.
[12] Singh A A. et al. A study of dental caries in school children from rural Haryana. J Indian Soc Pedo Prev Dent,
17(1):24-28, 1999.
[13] Chawla et al., Overview of the Impact of Changing Global Patterns of Dental Caries Experience on Caries
Clinical Trials, J DENT RES, 83: C29-C34, July 2004.
[14] Jamil David, Anne N Åstrøm, Nina J Wang, Prevalence and correlates of self-reported state of teeth among
schoolchildren in Kerala, India, BMC Oral Health, 6:10, 2006.
[15] Dutta A, A study of prevalence of periodontal disease and dental caries in school going children in Calcutta.
JIDA, 37(12): 367, 1965.
[16] Saha S, Sarkar S, Prevalence and severity of dental caries and oral hygiene status in rural and urban areas of
Calcutta. J Indian Soc Pedo Prev Dent:17-19, 1996.
[17] Yoh Tamaki et al., Construction of a dental caries prediction model by data mining, Journal of Oral Science,
Vol. 51, No. 1, 61-68, 2009.
[18] http://www.britannica.com/EBchecked/topic/172688/Duars
[19] http://www.coochbehar.gov.in/Htmfiles/Dooars.html
[20] Sailen Debnath, Essays on Cultural History of North Bengal (N. L. Publishers, 2008, 1st edition).
[21] M. K. Bhasin, Genetics of Castes and Tribes of India: Somatometry, Int J Hum Genet, 2006; 6(4): 323-356.
[22] N. K. Das, Cultural diversity, religious syncretism and people of India, an Anthropological interpretation,
Bangladesh e Journal of Sociology. Vol. 3, 2003.
[23] James L Olson, An Ethnohitorical Dictioary of China(Greenwood Press, 1998, 1st Edition).
[24] http://kochrajbanshi.blogspot.in/
[25] Soben Peter, Essentials of Preventive and Community Dentistry (Arya (Medi) Publishing House, New Delhi,
2007, 3rd edition).
[26] Edwina Kidd, Essentials of Dental Caries (Oxford University Press, January 15, 1997, 2nd edition).
[27] http://www.westbengaltourism.gov.in/web/guest/dooars-main
[28] Jiawei Han, Data Mining: Concepts and Techniques (The Morgan Kaufmann Series in Data Management
Systems, 2011, 3rd edition).
[29] VK Sharma, A Bhattacharya, A Kumar and HK Sharma. Health Benefits of Tea Consumption. Tropical
Journal of Pharmaceutical Research. 2007 Sep; 6 (3): 785-792.
Biographical Notes Ms. Amrita Kundu is presently pursuing M.Tech. first year in Computer Science Engineering
Department from Banasthali University,India.
Dr. Rajashri Kundu is an Assistant professor at Conservative Dentistry and Endodontics Department
MMDCH, India.

International Conference On Recent Trends In Engineering Science And Management ISBN: 978-81-931039-2-0
Jawaharlal Nehru University, Convention Center, New Delhi (India), 15 March 2015 www.conferenceworld.in
2528 | P a g e
ANNEXURE
Fig. a. Map of Dooars area.
Fig. b. Fluoride level in India.
Fig. c. DMFT worldwide.

International Conference On Recent Trends In Engineering Science And Management ISBN: 978-81-931039-2-0
Jawaharlal Nehru University, Convention Center, New Delhi (India), 15 March 2015 www.conferenceworld.in
2529 | P a g e
ANDROID BASED ROBOT SOCCER Tanvi P. Mahajan1, A. S. Bhide2, Ambarish D. Pundlik
1,3Department of Electronics & Communication, SSGB COET Bhusawal, (India) 2Professor, Department of Electronics & Communication, SSGB COET Bhusawal, (India)
ABSTRACT Robot soccer is an interesting domain in the research field of autonomous as well as intelligent system. It is
challenge to develop a robot which acts in real time to recognize the skills of real soccer game such as movement to
avoid obstacles, shoot and goal keeping. Up till now, robot soccer employs personal computer for communication
between server and soccer players. This paper concentrates on the use of Android platform for robot soccer rather
than personal computer. This method uses tagging technique and few mathematical formulations to detect the object
and follow the desired path so as to keep the game as close and real as the actual soccer game.
Keywords : Android, Client-Server architecture, Fira, J2E, NetBeans, Robot soccer
I INTRODUCTION The development of robots not only provide a great deal of business opportunities of technology industry, but also
have great impact on areas such as national defense, security, domestic life, medical treatment, rescue works,
exploitation in deep ocean, etc. According to different applications, robots can have different contribution in
different areas. One of the challenging issues in robotic research is the cooperation, coordination, and negotiation
among distributed agents in a multi-agent system. To speed up the development on this challenging issue, a group of
Korean researchers initiate a robotics soccer game called Fira in 1995. Later the league becomes a well-known
world competition, called Federation of International Robot Association (Fira). A soccer robot is a
specialized autonomous robot and mobile robot that is used to play variants of soccer.Till now, the communication,
object detection was based on computer technology. There are various methods, algorithms like adaptive Q-learning,
Fuzzy Logic, Artificial intelligence, Kalman Filter, Rete algorithm, etc. which are used in robot soccer. The same
thing can be implemented on android platform. Various algorithms which are stated above can be employed on
android base. In this methodology, tagging scheme is used.
II SYSTEM DETAILS Strategy in robot soccer is not about employing battles in a certain way, it is about using robots to win a robot soccer
game. Robot soccer policy would be: ‘we want to win matches’, or more precise: ‘we want to make more goals than
the opponent’. To reach this goal we need to score goals and prevent the opponent from scoring goals. This is the
goal of robot soccer strategy.Robot soccer is the small-size league played on a table-tennis sized field. Each team
consists of five small robots. A camera above the field is used to get a complete view of the game, which is send to
the computers of the teams on the side of the field. From this image a world model is constructed using the color
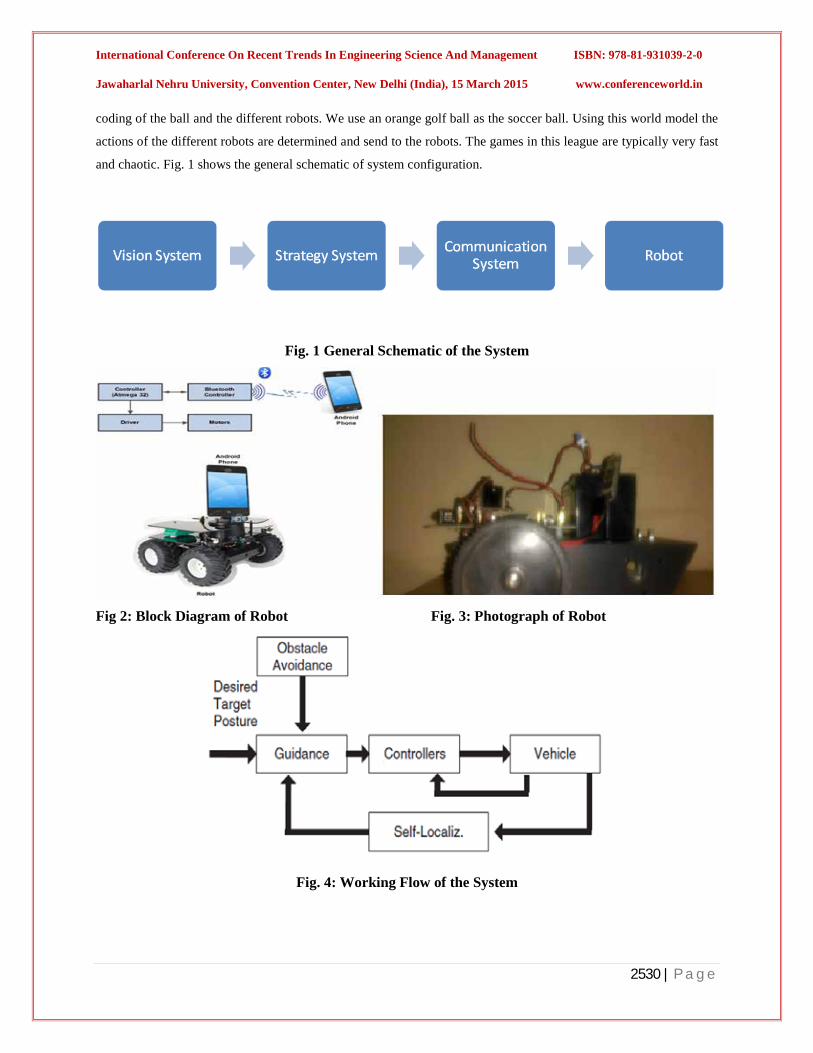
International Conference On Recent Trends In Engineering Science And Management ISBN: 978-81-931039-2-0
Jawaharlal Nehru University, Convention Center, New Delhi (India), 15 March 2015 www.conferenceworld.in
2530 | P a g e
coding of the ball and the different robots. We use an orange golf ball as the soccer ball. Using this world model the
actions of the different robots are determined and send to the robots. The games in this league are typically very fast
and chaotic. Fig. 1 shows the general schematic of system configuration.
Fig. 1 General Schematic of the System
Fig 2: Block Diagram of Robot Fig. 3: Photograph of Robot
Fig. 4: Working Flow of the System

International Conference On Recent Trends In Engineering Science And Management ISBN: 978-81-931039-2-0
Jawaharlal Nehru University, Convention Center, New Delhi (India), 15 March 2015 www.conferenceworld.in
2531 | P a g e
In this methodology, tagging scheme is used. The object to be followed is identified from the image by tagging it. &
then depending upon the role of each robot the task is accomplished. Figure 2 & 3 shows the block diagram and
photograph of the robotic system. There are five main subsystems in which all others are contained.
Ø The vision system records data on the robot and obstacle positions.
Ø The strategy system decides where the robots should move and solve the problem.
Ø The communication system transmits the commands from the strategy system to the robot through
communication media.
Ø The on-board control system processes the data received from the communication system and executes the
required commands.
The robot system controls the mechanical elements of the robot.
The working flow of the system is shown in figure 4. As soon as the supply is turned ON, the android unit for the
nearby Bluetooth device. The Bluetooth module drives the current of 20mA to 30mA (average of 25mA), while
pairing with the android unit. After pairing with the android unit, the Bluetooth module drives the current of 8mA.
The camera of the android unit captures the images on the field in real time. These captured frames are further
transferred the system on the robotic vehicle through Bluetooth module HC-06. The Bluetooth module
communicates with microcontroller ATMEGA 32 at baud rate of 9600. The desired information is extracted from
the captured images which are used by the strategy system. Strategy system includes microcontroller, motor driver,
etc. As per the strategy microcontroller gives commands to motor driver L293D, so that the robot can move in
forward, reverse, left or right direction. Here the motors used are of 60 RPM.
III MATHEMATICAL FORMULATION In order to make the right movement of the robot, mathematical formulation is necessary. Here coordinate theory is
used to determine the velocity as well as the angle between the nearest hurdle or ball and the robot.
The velocity of the robot can be estimated as-
‘VL = K1.de–Ka.θc (1)
‘VR = K1.de–Ka.θc (2) Where, Kp is proportional gain.
The proportional gain is nothing but the correction signal which is directly proportional to the error. There
are different values of kp for different angles. If smaller Kp is used for bigger angle errors and also for the small
angle error, the velocity values sent to the robot are smaller than the required values.
IV SOFTWARE DETAILS When the android application is initialized, there are four GUI steps to initialize the movement of the robot. As soon
as the Application is started, first step shows a GUI button to proceed as shown below-

International Conference On Recent Trends In Engineering Science And Management ISBN: 978-81-931039-2-0
Jawaharlal Nehru University, Convention Center, New Delhi (India), 15 March 2015 www.conferenceworld.in
2532 | P a g e
Fig. 5: First GUI Screen of Android Application
After clicking Proceed, we get the second screen which asks to turn ON the Bluetooth of the android unit
as shown below-
Fig. 6: Second GUI Screen of Android App
After selecting the desired Bluetooth device, here H-C-2010-06-01, camera starts. We have to tap on the screen to
select the object. As soon as we tap on the screen, robot starts to follow it & accordingly moves in forward, reverse,
left or right direction.
Fig.7: Third GUI Screen of Android App

International Conference On Recent Trends In Engineering Science And Management ISBN: 978-81-931039-2-0
Jawaharlal Nehru University, Convention Center, New Delhi (India), 15 March 2015 www.conferenceworld.in
2533 | P a g e
4.1 Java 2 Standard Edition (J2SE) Java Platform or Standard Edition is a widely used platform for programming in the Java language. It is the Java
Platform used to deploy portable applications for general use. In practical terms, Java SE consists of a virtual
machine, which must be used to run Java programs, together with a set of libraries (or "packages") needed to allow
the use of file systems, networks, graphical interfaces, and so on, from within those programs.
4.2 NetBeans Platform The NetBeans Platform is a reusable framework for simplifying the development of Java Swing desktop
applications. The NetBeans IDE bundle for Java SE contains what is needed to start developing NetBeans plugins
and NetBeans Platform based applications; no additional SDK is required. Applications can install modules
dynamically. Any application can include the Update Centre module to allow users of the application to download
digitally-signed upgrades and new features directly into the running application. Reinstalling an upgrade or a new
release does not force users to download the entire application again. The platform offers reusable services common
to desktop applications, allowing developers to focus on the logic specific to their application. Among the features
of the platform are:
Ø User interface management (e.g. menus and toolbars)
Ø User settings management
Ø Storage management (saving and loading any kind of data)
Ø Window management
Ø Wizard framework (supports step-by-step dialogs)
Ø NetBeans Visual Library
Ø Integrated Development Tools
4.3 Client-Server Architecture using Serialized Objects / Serialization In case the project needs client-server communication this is how it is handled in java-First step is to use data
structures like Vectors and Lists. These come under Java Collections API. Secondly we declare our own classes
using these data structures. E.g. a class Student to hold all the student information. Now these classes need to be pre-
compiled and called within Java application as libraries. This is called as a Java Class Library. Now class objects
cannot be sent via network directly. We need to convert these objects to bytes so that they can be sent/received. To
do this we must use a concept called as Serialization. Basically it is a concept where in objects are converted to byte
streams so that they can be sent via network and vice versa. The reverse process is called as deserialization. Finally
to send these bytes them via network we need Java Networking.
V CONCLUSION
Today’s era is Smartphone’s era. Use of android platform makes communication faster & efficient. The use of
android can be further extended for robotic soccer. Android based object detection algorithm could be used as one of

International Conference On Recent Trends In Engineering Science And Management ISBN: 978-81-931039-2-0
Jawaharlal Nehru University, Convention Center, New Delhi (India), 15 March 2015 www.conferenceworld.in
2534 | P a g e
the strategy in real robot soccer competition. Thus, using obstacle avoidance algorithm, robot can be made to move
in curve shape, avoiding opponent robots or any other obstacles. Depending on positioning, robot can be made to
move in straight line towards opponent goalie avoiding other robots or obstacles. The image processing algorithm,
object recognition algorithm are successfully implemented & tested on smart phone equipped with digital camera i.
e. HTC Desire 816.
VI ADVANTAGES
Ø We are using android platform we do not need overhead camera on the field as the camera is built in
android unit itself.
Ø The android platform makes the communication in real time with minimum noise.
Ø Remote desktop is not required as strategy system.
VII LIMITATIONS
Ø There is difficulty in color identification in varying lightening conditions on the field.
Ø The background & foreground must be highly contrasted to each other
VIII FUTURE SCOPE
To achieve the goal perfectly, the robot must recognize the ball accurately in any lightening condition. Also it must
recognize the difference between the ball & object if both are of same color. This may be achievable if image
processing is improved.
REFERENCES [1] Awang Hendrianto Pratomo, Anton Satria Prabuwono, Mohd. Shanudin Zakaria, Khairuddin Omar, Md.
Jan Nordin, Shahnorbanun Sahran, Siti Norul Huda Sheikh Abdullah and Anton Heryanto, Position and
Obstacle Avoidance Algorithm in Robot Soccer, Journal of Computer Science 6 (2): 173-179, 2010 ISSN
1549-3636
[2] ThiloWeigel, Jens-Steffen Gutmann, Associate Member, IEEE, Markus Dietl, Alexander Kleiner, and
Bernhard Nebel, CS Freiburg: Coordinating Robots for Successful Soccer Playing IEEE TRANSACTIONS
ON ROBOTICS AND AUTOMATION, VOL. 18, NO. 5, OCTOBER 2002
[3] Martin LauerRoland Hafner, Sascha Lange, Martin Riedmiller, Cognitive Concepts in Autonomous Soccer
Playing Robots, Institute of Measurement and Control, Karlsruhe Institute of Technology, Engler-Bunte-
Ring 21, 76131 Karlsruhe, GermanyInstitute of Computer Science, University of Freiburg, 79110 Freiburg,
Germany
[4] Shih-Lin Wuy,Yi-Ren Liou, Wei-Hua Lin, Ming-Han Wu, A Multi-agent Algorithm for Robot Soccer
Games in Fira Simulation League, Department of Computer Science and Information Engineering Chang
Gung University, Kwei-Shan Tao-Yuan, Taiwan, R.O.C

International Conference On Recent Trends In Engineering Science And Management ISBN: 978-81-931039-2-0
Jawaharlal Nehru University, Convention Center, New Delhi (India), 15 March 2015 www.conferenceworld.in
2535 | P a g e
[5] Ayan Banerjee, Ramanpreet Singh Arora, Aruna Chakrabarty, A Dynamic Identification Method for
Robotic Soccer Game, International Journal of Wisdom Based Computing, Vol. 1 (3).
[6] Savitha G Venugopal P S Dr. Sarojadevi Dr. Niranjan Chiplunkar, An Approach for Object Detection in
Android Device, 2014 Fifth International Conference on Signals and Image Processing
[7] K. Matusiak1, P.Skulimowski1 And P. Strumillo1, Object Recognition In A Mobile Phone Application for
Visually Impaired Users, Sopot, Poland, June 06-08, 201
Related Documents