Washington University in St. Louis Washington University in St. Louis Washington University Open Scholarship Washington University Open Scholarship Engineering and Applied Science Theses & Dissertations McKelvey School of Engineering Spring 5-15-2015 Photonic Molecules Formed by Ultra High Quality Factor Photonic Molecules Formed by Ultra High Quality Factor Microresonator for Light Control Microresonator for Light Control Bo Peng Washington University in St. Louis Follow this and additional works at: https://openscholarship.wustl.edu/eng_etds Part of the Engineering Commons Recommended Citation Recommended Citation Peng, Bo, "Photonic Molecules Formed by Ultra High Quality Factor Microresonator for Light Control" (2015). Engineering and Applied Science Theses & Dissertations. 96. https://openscholarship.wustl.edu/eng_etds/96 This Dissertation is brought to you for free and open access by the McKelvey School of Engineering at Washington University Open Scholarship. It has been accepted for inclusion in Engineering and Applied Science Theses & Dissertations by an authorized administrator of Washington University Open Scholarship. For more information, please contact [email protected].

Welcome message from author
This document is posted to help you gain knowledge. Please leave a comment to let me know what you think about it! Share it to your friends and learn new things together.
Transcript
Washington University in St. Louis Washington University in St. Louis
Washington University Open Scholarship Washington University Open Scholarship
Engineering and Applied Science Theses & Dissertations McKelvey School of Engineering
Spring 5-15-2015
Photonic Molecules Formed by Ultra High Quality Factor Photonic Molecules Formed by Ultra High Quality Factor
Microresonator for Light Control Microresonator for Light Control
Bo Peng Washington University in St. Louis
Follow this and additional works at: https://openscholarship.wustl.edu/eng_etds
Part of the Engineering Commons
Recommended Citation Recommended Citation Peng, Bo, "Photonic Molecules Formed by Ultra High Quality Factor Microresonator for Light Control" (2015). Engineering and Applied Science Theses & Dissertations. 96. https://openscholarship.wustl.edu/eng_etds/96
This Dissertation is brought to you for free and open access by the McKelvey School of Engineering at Washington University Open Scholarship. It has been accepted for inclusion in Engineering and Applied Science Theses & Dissertations by an authorized administrator of Washington University Open Scholarship. For more information, please contact [email protected].

WASHINGTON UNIVERSITY IN ST. LOUIS
School of Engineering and Applied Science
Department of Electrical and Systems Engineering
Thesis Examination Committee: Lan Yang, Chair Carl M. Bender Viktor Gruev Arye Nehorai
Sahin K. Ozdemir
Photonic Molecules Formed by Ultra High Quality Factor Microresonator for Light Control
by
Bo Peng
A dissertation presented to the Graduate School of Arts and Sciences of Washington University in St. Louis in partial fulfillment of the
requirements for the degree of
DOCTOR OF PHILOSOPHY
May 2015
Saint Louis, Missouri

© 2015, Bo Peng

ii
Contents List of Figures .................................................................................................................................................. v List of Tables .................................................................................................................................................... x Acknowledgments.......................................................................................................................................... xi Abstract .......................................................................................................................................................... xiii 1 Introduction ............................................................................................................................................... 1 1.1 Background ........................................................................................................................................ 1 1.2 Dissertation Outline ......................................................................................................................... 3 2 WGM Resonators ..................................................................................................................................... 5 2.1 Introduction ....................................................................................................................................... 5 2.2 Optical Properties of WGM Microresonators .............................................................................. 7 2.2.1 Q factor and Photon Lifetime ........................................................................................... 7 2.2.2 Mode Distribution and Mode Volume ............................................................................ 8 2.2.3 Free Spectral Range ............................................................................................................ 9 2.3 Optical Coupling of Input and Output ......................................................................................... 9 2.4 Theoretical Modeling ..................................................................................................................... 11 2.5 WGM Microresonator with Gain ................................................................................................. 13 2.5.1 Er3+ Doped Gain and Amplification .............................................................................. 13 2.5.2 WGM Microresonator with Silica Raman Gain ........................................................... 14 2.6 Nonlinear Effects in WGM Microresonators ............................................................................. 15 2.6.1 WGM Microresonator with Kerr Nonlinearity Induced Parametric Oscillation .... 16 2.6.2 WGM Microresonator with Optomechanics ................................................................ 17 2.7 Fabrication of WGM Microtoroidal Resonators ........................................................................ 19 2.7.1 Passive Silica Microtoroidal Resonators Fabrication ................................................... 19 2.7.2 Active Er3+-doped Silica Microtoroidal Resonators Fabrication ............................... 20 2.8 Nanoparticle Sensing with WGM Microresonators .................................................................. 22 2.8.1 Mode Shift and Mode Splitting ....................................................................................... 22 2.8.2 Nanoparticle Sensing with passive Microtoroidal Resonators ................................... 23 2.8.3 Nanoparticle Sensing with active Microtoroidal Resonators ...................................... 26 3 Photonic Molecules ............................................................................................................................... 29 3.1 Introduction to Photonic Molecules ............................................................................................ 29 3.1.1 Definition and Basic Properties of Photonic Molecules ............................................. 29 3.1.2 Different Types of Photonic Molecules ........................................................................ 30 3.2 Micortoroid and Micorsphere Based Photonic Molecules ....................................................... 31 3.2.1 Hybrid WGM Photonic Molecules ................................................................................ 32 3.2.2 Fabrication of WGM Photonic Molecules .................................................................... 32
iii
3.3 Supermodes of Photonic Molecules ............................................................................................ 35 3.4 Tuning Parameters .......................................................................................................................... 37 3.4.1 Inter-cavity Coupling Strength ........................................................................................ 37 3.4.2 Initial Resonance Detuning ............................................................................................. 38 3.5 Optical Analogue of Atomic Levels ans Spectral Engineering with Photonic Molecules ... 39 3.5.1 Formation of Multi-level System .................................................................................... 40 3.5.2 Energy Levels Tuning and Spectral Engineering ......................................................... 41 3.6 Evanescent Field Intensity Enhancement in Photonic Molecules .......................................... 45 3.7 Applications of Photonic Molecules ............................................................................................ 45 4 Electromagnetically Induced Transparency and Autler-Townes Splitting in WGM Photonic Molecules ..................................................................................................................................... 48 4.1 Introduction to EIT and Fano Resonance.................................................................................. 48 4.1.1 Definition and Basic Properties of EIT ......................................................................... 48 4.1.2 Fano Resonance ................................................................................................................ 50 4.1.3 Different Platforms for Implementation of EIT and Fano ........................................ 51 4.2 Introduction to Autler-Townes Splitting..................................................................................... 53 4.3 EIT and ATS in WGM Photonic Molecules .............................................................................. 54 4.3.1 EIT in Photonic Molecules .............................................................................................. 57 4.3.2 Fano Resonance in Photonic Molecules ........................................................................ 59 4.3.3 ATS in Photonic Molecules ............................................................................................. 60 4.4 Akaike Information Criterion ....................................................................................................... 62 4.4.1 Maximum Likelihood and AIC Values .......................................................................... 63 4.4.2 AIC Weight and AIC Per-point Weight ........................................................................ 65 4.5 Discerning EIT and ATS with AIC in WGM Photonic Molecules ........................................ 66 4.6 Discerning EIT Domain, ATS Domain and the EIT-ATS Transition .................................. 70 5 Parity-time Symmetry in WGM Photonic Molecules .................................................................. 73 5.1 Introduction to Parity-time Symmetry ......................................................................................... 73 5.1.1 Parity-time Symmetry in Quantum Mechanics ............................................................. 73 5.1.2 Parity-time Symmetry Breaking and Phase Transition ................................................ 74 5.2 Parity-time Symmetry in Mechanics and Acoustics ................................................................... 75 5.3 Parity-time Symmetry in Optics .................................................................................................... 77 5.4 Parity-time Symmetric WGM Microcavities ............................................................................... 79 5.4.1 Design and Characterization of PT Symmetric WGM Microcavity System ............ 80 5.4.2 Eigen-mode Evolutions in the PT Symmetric WGM Microcavites .......................... 82 5.4.3 Imperfect Gain/Loss Balance in PT Symmetric System............................................. 84 5.5 All-optical Diode with PT Symmetric Microcavities ................................................................. 88 5.5.1 Lorentz Reciprocity Theorem ......................................................................................... 88 5.5.2 Field Localization .............................................................................................................. 89 5.5.3 Nonlinearity Enhancement with PT Symmetry ............................................................ 91 5.5.4 All-optical Diode Realization with PT Symmetric Microcavites ................................ 93 5.5.5 Comparison with Other All-optical Diode Schemes ................................................... 94 6 Non-Hermitian System with WGM Photonic Molecules ......................................................... 97 6.1 Introduction to Non-Hermitian Quantum Mechanics ............................................................. 97 6.1.1 Definition of Non-Hermitian in Quantum Mechanics ............................................... 97
iv
6.1.2 Exceptional Points ............................................................................................................ 98 6.2 Non-Hermitian Optical Systems .................................................................................................. 99 6.3 Non-Hermitian Optical WGM Microcavities........................................................................... 101 6.3.1 Loss Tuning ..................................................................................................................... 102 6.3.2 Eigen-mode Evolution with Exceptional Points ........................................................ 103 6.4 Loss-induced Suppression and Recovery of Cavity Intensity ................................................ 106 6.4.1 Intra-cavity Fields Suppression and Recovery ............................................................ 106 6.4.2 Supermode Fields Suppresion and Recovery .............................................................. 113 6.5 Loss-induced Suppression and Recovery of Cavity Thermal Nonlinearity ......................... 114 6.6 Loss-induced Suppression and Recovery of Cavity Raman Laser ......................................... 118 6.7 Conclusion and Outlook .............................................................................................................. 120 References ..................................................................................................................................................... 122 Vita .................................................................................................................................................................. 138
v
List of Figures Figure 1.1: Basic diagram of a Fabry-Perot resonator with reflection light trajectory. M1 and M2
are two flat mirrors with reflectivity R1 and R2. ................................................................... 1 Figure 1.2: Basic diagram of a circular shape resonator with reflection light trajectory. ..................... 2 Figure 2.1: Illustration of a microsphere ray trajectory (a) and pattern of resonance mode (b). ....... 6 Figure 2.2: Illustration of typical WGM microresonators with different geometric shapes, (a)
microsphere, (b) microring, (c) microdisk, (d) microtoroid. ................................................ 6 Figure 2.3: Illustration of top view and side view of a typical WGM mode spatial distribution in a
microtoroid resonator, (a) top view, (b) side view ................................................................ 9 Figure 2.4: Cross section of a typical WGM mode electric field distribution (a). (b) Absolute value
of the electric field distribution along the axis in (a). .......................................................... 10 Figure 2.5: Schematics showing the evanescent coupling of input-output light from and to a
WGM microresonator with (a) prism coupling, (b) fiber taper coupling, and (c) angle polished fiber coupling. ........................................................................................................... 10
Figure 2.6: Schematics showing the evanescent coupling of input-output light from and to a WGM microresonator with (a) prism coupling, (b) fiber taper coupling, and (c) angle polished fiber coupling ............................................................................................................ 11
Figure 2.7: Erbium laser generation in the Er3+ doped microtoroid resonator at 1420nm pump. 14 Figure 2.8: Raman laser generation from silica microtoroid resonator at (a) 1450nm pump and (b)
660nm pump. ............................................................................................................................ 15 Figure 2.9: Parametric oscillation generation for silica microtoroid cavity at 1550nm band ............ 17 Figure 2.10: Experimentally obtained Microtoroid WGM resonator excited opto-mechanics. (a) and
(b) Mechanic excitation at 10.4MHz, in frequency domain or time domain; (c) and (b) Mechanic excitation at 26.3MHz, in frequency domain or time domain. ....................... 18
Figure 2.11: Schematic of fabrication of silica microtoroid WGM resonator. ..................................... 20 Figure 2.12: Scanning Electron Microscope image of a microtoroid WGM resonator and the
diagram of the size parameters. .............................................................................................. 20 Figure 2.13: Process flow for fabrication of Er3+-doped active microtoroid WGM resonator
through sol-gel process. .......................................................................................................... 21 Figure 2.14: Illustration of spectra for mode shift and mode splitting. ................................................. 23 Figure 2.15: Schematic of nanoparticle induced mode splitting in the WGM microresonator.
(a)Diagram of mode propagation and interaction with nanoparticle perturbation, (b) mode splitting spectra with corresponding mode distribution patterns. ......................... 25
Figure 2.16: Experimentally obtained real-time nano particle sensing with mode splitting scheme in microtoroid, the detected polystyrene nanoparticle is 100 nm in diameter. ................... 25
Figure 2.17: Schematic of nanoparticle sensing with active laser scheme in microtoroid, including rare-earth ion laser and Raman laser. .................................................................................... 27
Figure 2.18: Experimentally obtained real-time nanoparticle sensing with Raman laser in microtoroid. (a)(c) The detected polystyrene nanoparticle induced real-time Raman beatnote frequency change with different particle size, (b)(d) The measured beatnote frequency change distribution with different nanoparticle size. ....................................... 28
Figure 3.1: Different types of Photonic Molecules [74-81]. .................................................................. 31 Figure 3.2: Hybrid photonic molecules made of (a) coupled microtoroid resonators with silica and
PDMS, (b) coupled microtoroid and microsphere resonators. ......................................... 32
vi
Figure 3.3: Fabrication flow of free-standing microsphere and free standing microtoroid resonators. ............................................................................................................................... 33
Figure 3.4: Fabrication flow of edged microtoroid resonators for forming of photonic molecule.35 Figure 3.5: Supermodes with mode distribution patterns. ................................................................... 36 Figure 3.6: Supermodes splitting spectra. (a) The transmission spectra when the coupling strength
is increased from bottom to top. (b) Mode splitting of the supermodes in the FEM simulation as the coupling gap is increased. ....................................................................... 37
Figure 3.7: Supermodes with mode distribution patterns. ................................................................... 38 Figure 3.8: Initial Resonance tuning of the elements in photonic molecule. .................................... 39 Figure 3.9: Formation of atomic two level with nanoparticle perturbation. (a) Intensity graph of
the energy level evolution, (b) Spectra of the energy level evolution. ............................ 40 Figure 3.10: Formation of atomic multi-levels with supermodes from photonic molecule inter-
cavity coupling. ....................................................................................................................... 41 Figure 3.11: Spectral engineering with inter-cavity coupling strength tuning. .................................... 42 Figure 3.12: Theoretical spectral engineering with intra-cavity resonance detuning varied at strong
inter-cavity coupling condition. ............................................................................................ 43 Figure 3.13: Experimentally obtained spectral engineering with intra-cavity resonance detuning
varied at strong inter-cavity coupling condition. ............................................................... 43 Figure 3.14: Theoretical spectral engineering with intra-cavity resonance detuning varied at weak
inter-cavity coupling condition. ............................................................................................ 44 Figure 3.15: Experimentally obtained spectral engineering with intra-cavity resonance detuning
varied at weak inter-cavity coupling condition................................................................... 44 Figure 3.16: Evanescent field intensity enhancement in photonic molecules. (a) Symmetric mode
field distribution in the cross section. (b) Anti-symmetric mode field distribution in the cross section. (c) Single cavity mode field distribution. ............................................. 45
Figure 4.1: The effect of EIT on a typical absorption line(a). Rapid change of index of refraction (blue) in a region of rapidly changing absorption (gray) associated with EIT. The steep and positive linear region of the refractive index in the center of the transparency window gives rise to slow light (b)....................................................................................... 49
Figure 4.2: A typical Fano resonance in the transmission spectrum, inset shows the most general Fano asymmetric line feature. ............................................................................................... 50
Figure 4.3: Different platforms used for realizing electromagnetically induced transparency. (a) Atomic system. (b) Opto-mechanics System. (c) Coupled microresonator system. (d) Electronic circuits system. (e) Mechanical system. (f) Plasmonic system. ..................... 52
Figure 4.4: A typical ATS spectrum (a) and (b) Stark effect: computed regular (non-chaotic) Rydberg atom energy level spectra of hydrogen in an electric field near n=15 for magnetic quantum number m=0. Each n-level consists of n-1 degenerate sublevels; application of an electric field breaks the degeneracy. ...................................................... 53
Figure 4.5: EIT transmission spectra with real and imaginary parts of the susceptibility in the
weak driving regime. (a) Real part of the susceptibility. (Blue: 1 2r r , red: 1r ,
green: 2r ). (b) Imaginary part of the susceptibility. (Blue: 1 2i i , red: 1i , green:
2i ). (c) Normalized transmission. The parameters used are obtained from
experiments and are as follows. Decay rate of the first resonator: 1 1.05GHz ;
decay rate of the second resonator: 2 3MHz ; coupling strength 67MHz .. ..... 58
vii
Figure 4.6: Electromagnetically induced transparency (EIT) in coupled WGM microcavities. (a) Effect of coupling strength on the EIT spectra (i.e., zero detuning between resonance modes of the resonators). The coupling strength (increasing from the bottom to the top curve) depends on the distance between the resonators. (b) Effect of the coupling strength on the linewidth (red circles) and the peak transmission (blue squares) of the transparency window. The curves are the best fit to the experimental data.................. 59
Figure 4.7: Fano interference transmission spectra in photonic molecules. ..................................... 60 Figure 4.8: ATS transmission with real and imaginary parts of the susceptibility at strong
driving regime. (a) Real part of the susceptibility. (Blue: 1 2r r , red: 1r , green: 2r
). (b) Imaginary part of the susceptibility. (Blue: 1 2i i , red: 1i , green: 2i ). (c)
Normalized transmission. ..................................................................................................... 61 Figure 4.9: Autler-Townes Splitting (ATS) (a) and avoided-crossing (b) in photonic molecules. . 62 Figure 4.10: Akaike-Information-Criterion (AIC) per-point weights obtained as a function of the
coupling strength in the photonic molecules. (a) The AIC per-point weight for the pair of modes chosen in the first and second microresonators with Q ~ (1.91×10⁵, 7.26×10⁷). (b) The AIC per-point weight for pair of modes with Q ~ (1.63×10⁶, 1.54×10⁶). (c) The AIC per-point weight for the pair of modes with Q ~ (1.78×10⁶, 4.67×10⁶) ................................................................................................................................. 68
Figure 4.11: Akaike-Information-Criterion (AIC) weights obtained as a function of the coupling strength in the photonic molecules. (a) The AIC weight for the pair of modes chosen in the first and second microresonators with Q ~ (1.91×10⁵, 7.26×10⁷). (b) The AIC weight for pair of modes with Q ~ (1.63×10⁶, 1.54×10⁶). (c) The AIC weight for the pair of modes with Q ~ (1.78×10⁶, 4.67×10⁶) ................................................................... 69
Figure 4.12: Experimentally-observed transmission spectra with EIT and ATS model fittings in the photonic molecules. The transmission spectra shown here are chosen to represent the three regimes (EIT-dominated, ATS-dominated, and EIT-to-ATS transition regimes) observed in Fig.4.10 and Fig.4.11. ....................................................................... 70
Figure 4.13: Theoretical (noise model) AIC per-point weights as the function of coupling strength for EIT, ATS, and intermediate-driving models in the photonic molecules. ................ 71
Figure 4.14: Experimental AIC per-point weights as the function of coupling strength for EIT, ATS, and intermediate-driving models in the photonic molecules. ................................ 72
Figure 5.1: Diagram of PT symmetric mechanical system. .................................................................. 76 Figure 5.2: Conventional model (a) and PT symmetry realization in optical systems with gain/loss
configuration (b), and mode evolution.. ............................................................................. 77 Figure 5.3: Different optical platforms for realization of PT symmetry. (a) Coupled waveguides
with balanced gain and loss. (b) Single waveguide with gain/loss setting. (c) PT symmetric photonic lattice. ................................................................................................... 78
Figure 5.4: Schematic and device microscope images of PT-symmetric WGM microcavities. ...... 80 Figure 5.5: Gain cavity spectral demonstration with pump-probe scheme.. ..................................... 81 Figure 5.6: Experimental setup used for the study of PT-symmetric whispering gallery mode
(WGM) microcavities. ........................................................................................................... 82 Figure 5.7: Mode evolution and PT-symmetry breaking in coupled WGM microresonators. ....... 83 Figure 5.8: Experimentally obtained transmission spectra in broken-PT- and unbroken-PT-
symmetric regions................................................................................................................... 83 Figure 5.9: Mode evolution and PT-symmetry breaking with different gain/loss ratios in coupled
WGM microresonators. ......................................................................................................... 84
viii
Figure 5.10: Real and imaginary parts of the eigen-frequencies of the coupled system as a function of the coupling strength for balanced and unbalanced gain-loss conditions in PT-symmetric photonic molecules. ............................................................................................ 87
Figure 5.11: Localization of the optical field in the active resonator in the broken-PT symmetry phase. ........................................................................................................................................ 90
Figure 5.12: Comsol simulation for the optical field localization in the active resonator in the broken-PT symmetry phase. ................................................................................................. 91
Figure 5.13: Input-output relation in PT-symmetric WGM resonators and nonlinearity characterzation. ....................................................................................................................... 92
Figure 5.14: Transmission spectra in PT-symmetric WGM resonators and reciprocity in the linear regime. ...................................................................................................................................... 92
Figure 5.15: Experimentally observed unidirectional transmission for PT-symmetric WGM microresonators in the nonlinear regime for all-optical diode implementation. ........... 94
Figure 6.1: Perspective view of the Riemann sheet structure of two coalescing energy levels in the complex eigen-value plane, EPs are clearly seen in the Riemann sheet. ........................ 99
Figure 6.2: Different types of non-hermitian system. (a) lossy and lossless coupled optical waveguide system, (b) coupled microdisk quantum cascade laser at the microwave band. ....................................................................................................................................... 100
Figure 6.3: Experimental setup for implementation of non-Hermitian system in photonic molecules. .............................................................................................................................. 102
Figure 6.4: Transmission spectra showing the effect of increasing loss on the resonances in WGM microtoroid resonator via Chromium nanotip. ................................................... 103
Figure 6.5: Evolution of the transmission spectra and eigenfrequencies as a function of tip .. .. 104
Figure 6.6: Evolution of the eigen-frequencies as a function of loss tip and coupling strength
. ................................................................................................................................................ 105 Figure 6.7: Evolution of the real and imaginary parts of the eigen-frequencies of the supermodes
as a function of the loss in the second resonator 2 at different coupling strength
.. ............................................................................................................................................... 106 Figure 6.8: Loss-induced enhancement of intra-cavity field intensities at the eigen-frequency and
in the vicinity of an exceptional point. (a)(c)(e) corresponds to case1, (b)(d)(f) corresponds to case2. ........................................................................................................... 108
Figure 6.9: Theoretically obtained normalized intra-cavity field intensities of the coupled
resonators at the eigen-frequency and
0 .. ................................................................ 108
Figure 6.10: Theoretically and experimentally obtained intra-cavity field intensities normalized with the intensity at the exceptional point (EP). ...................................................................... 110
Figure 6.11: Effect of the frequency detuning from the exceptional point (EP) frequency 0 on
the additional loss min
tip at which total intra-cavity field intensity reaches its minimum
value........................................................................................................................................ 111
Figure 6.12: Intensity evolution of the supermodes as the additional loss tip increases in non-
Hermitian photonic molecules. (a-c) correspond to supermod A and (d-f) correspond
to the supermode A . ........................................................................................................... 113
ix
Figure 6.13: Theoretically-obtained thermal response of coupled resonators. (a) and (b), transmission and intra-cavity intensity for case 1; (c) and (d), transmission and intra-cavity intensity for case 2.. .................................................................................................. 117
Figure 6.14: Experimentally obtained loss-induced enhancement of thermal nonlinearity in the vicinity of an exceptional point. ......................................................................................... 118
Figure 6.15: Experimentally obtained loss-induced suppression and revival of Raman laser in the vicinity of an exceptional point. (a) Lasing spectra. (b) Lasing threshold characteristics. Inset: corresponding modes................................................................................................ 119

x
List of Tables Table 4.1: Correspondences among parameters of various systems (Fig.4.3) in which EIT and ATS
have been experimentally observed ........................................................................................ 52 Table 6.1: Values of the parameters used in the numerical simulations for the thermal response of
the coupled resonators ......................................................................................... …………116
xi
Acknowledgments Recalling my more than five years’ study and work in the Micro/Nano Photonics Lab at WashU, it
has been a pleasant and fruitful experience which will becomes my spiritual treasure not only in my
future career but also in my entire life. In my long journey for my education, especially for the
completion of this dissertation, I owe my gratitude to many people.
First and foremost I would like to thank my advisor Dr. Lan Yang who supports me through my
whole study and research period at WashU. Dr. Yang is the one who turned me from an unrefined
student to someone who can define a problem, analyze it with a top-down perspective, and solve it
individually. She is also my remarkable mentor who taught me how to think, and how balance live
and work. Thanks for always supporting me and share with me valuable advice whenever I need it. I
appreciate and deeply value all the helps you have ever provided.
I would like to acknowledge Prof. Carl Bender for providing us discussion and collaboration with
nice research topics, without which many of our exciting studies and experiments would not have
been performed. I also want to thank him for giving me strong support whenever I needed.
Meanwhile, I also want to thank all my committee members for supporting my degree pursuing,
spending time to attend my defense, reading and correcting my dissertation.
Furthermore, I am grateful for the numerous discussions accompany with all the current and former
group members: Dr. Sahin Kaya Ozdemir, Dr. Jiangang Zhu, Dr. Lina He, Dr. Woosung Kim, Dr.
Monifi Faraz, Dr. Jing Zhang, Dr. Fang Bo, Dr. Chuan Wang, Dr. Liang Lu, Dr. Zhangdi Huang,
Fuchuan Lei, and Xu Yang, Xiaofei Liu, Steven Huang, Huzeyfe Yilmaz, Weijian Chen, Guangming
Zhao, Linhua Xu, Michael Driscoll, Arunita Kar, Yulong Liu and many more. Especially, I want to
thank Sahin for his research guidance and valuable discussions in most of my projects. His in-depth
vision, ideas, and suggestions are always helpful which make my projects more solid and perfect.
I will also not forget the support from my friends during these years. There are far too many to list
but some of those that I spent most time with are: Peng Yang, Shouting Huang, Yaqi Chen, Ji Qi,
Xiaoxiao Xu, Zihan Xu, Zongyu Dong, Xu Zhang, Qin Li, Zhixuan Duan and all my best college

xii
classmates and high school classmates. For those friends reading this that are not on the list, you
know this is not an attempt to slight you and you know how thankful I am. Thank you for having
been in my life and I really enjoyed the great time we had.
Then I want to thank my warm family – my wife, my parents, and my parents in law. I know that a
few years’ of my absences bring difficulty and inconvenience for all of you. It is your love, priceless
support and help that bring me to today’s me.
Finally I would like to give my special thanks to my wife Geng Qian. Thank you for your acompany
and supporting. Thank you for cheering with me for my joy and sweeping my annoyance. Thank
you for entering and sharing my life. It is your love and support make this long journey filled with
joyful moments.
Bo Peng
Washington University in St. Louis
May 2015

xiii
ABSTRACT OF THE DISSERTATION
Photonic Molecules Formed by Ultra High Quality Factor Microresonator for Light Control
by
Bo Peng
Doctor of Philosophy in Electrical Engineering
Washington University in St. Louis, 2015
Professor Lan Yang, Chair
Whispering-gallery-mode (WGM) optical microresonators with micro-scale mode volumes and high
quality factors have been widely used in different areas ranging from sensing, quantum
electrodynamics (QED), to lasing and optomechanics. Due to the ultra-high Q and the tight spatial
confinement, the cavity provides high intra-cavity field intensity and long interaction time, which
enhances the interaction between light and materials. This feature makes WGM microresonator a
great candidate for low-threshold nonlinear processes, cavity optomechanics, signal processing, and
sensor with ultra-high sensitivity. Also, modification of the modes in these resonators has been of
considerable interest for their potential applications and underlying physics. Two or more coupled
resonators form a compound structure—photonic molecule (PM)—in which interactions of optical
modes create supermodes. This molecular analogy stems from the observation that confined optical
modes of a resonator and the electron states of atoms behave similarly. Thus, a single resonator is
considered as a “photonic atom,” and a pair of coupled resonators as the photonic analog of a
molecule. Studying the interactions in PMs is critical to understand their resonance properties and
the field and energy transfers to engineer new devices such as phonon lasers and enhanced sensors.
Further modification of the compound structure with gain mechanism such as rare-earth dopants
makes the coupled cavity system a novel Parity-Time symmetric optical device. More surprisingly,
the implementation of non-Hermitian on-chip WGM photonic molecule with exceptional points
even enables the control and modification of laser emission with just loss tuning.
In this dissertation, I present my study and new implementation of applications with ultra-high Q
WGM microresonator based photonic molecules. We discuss the on-chip Parity-Time symmetric
microresonator and non-Hermitian photonic molecule design for light manipulation and optical

xiv
isolation, lasing and dissipation control, directional switching and PM-based optical analog of
electromagnetically induced transparency, as well as highly sensitive tuning of WGM Raman
microlaser with PM loss manipulation.
1
Chapter 1
Introduction
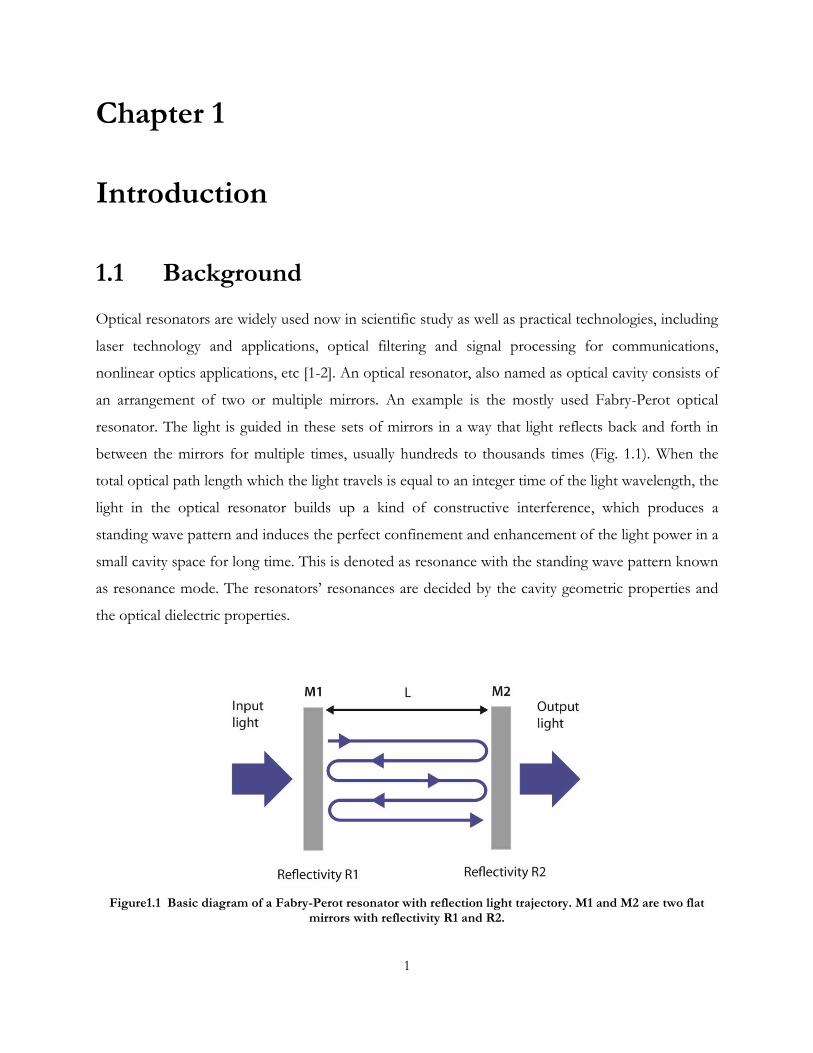
1.1 Background Optical resonators are widely used now in scientific study as well as practical technologies, including
laser technology and applications, optical filtering and signal processing for communications,
nonlinear optics applications, etc [1-2]. An optical resonator, also named as optical cavity consists of
an arrangement of two or multiple mirrors. An example is the mostly used Fabry-Perot optical
resonator. The light is guided in these sets of mirrors in a way that light reflects back and forth in
between the mirrors for multiple times, usually hundreds to thousands times (Fig. 1.1). When the
total optical path length which the light travels is equal to an integer time of the light wavelength, the
light in the optical resonator builds up a kind of constructive interference, which produces a
standing wave pattern and induces the perfect confinement and enhancement of the light power in a
small cavity space for long time. This is denoted as resonance with the standing wave pattern known
as resonance mode. The resonators’ resonances are decided by the cavity geometric properties and
the optical dielectric properties.
Figure1.1 Basic diagram of a Fabry-Perot resonator with reflection light trajectory. M1 and M2 are two flat
mirrors with reflectivity R1 and R2.
2
To enhance the advantage of optical resonator, mainly the light confinement and intensity
reinforcement, the development of optical resonator with smaller and smaller sizes is pursued,
targeting to micrometer and nanometer scales. These micro-nano-scale developments will enable the
potential strong light confinement. Also, reducing the optical loss of the resonator is required for
advance applications. However, the traditional mirror based resonators suffer from the difficulty in
size shrinking down and alignment problem severely. Therefore, in recent year, people have been
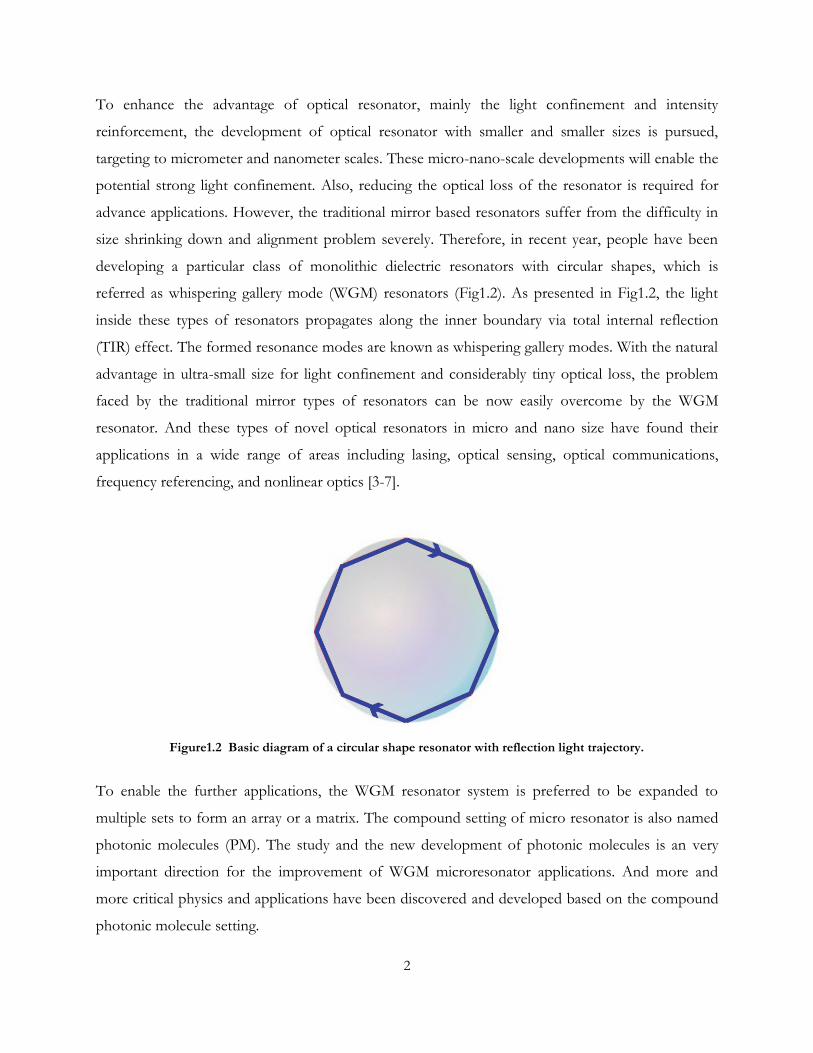
developing a particular class of monolithic dielectric resonators with circular shapes, which is
referred as whispering gallery mode (WGM) resonators (Fig1.2). As presented in Fig1.2, the light
inside these types of resonators propagates along the inner boundary via total internal reflection
(TIR) effect. The formed resonance modes are known as whispering gallery modes. With the natural
advantage in ultra-small size for light confinement and considerably tiny optical loss, the problem
faced by the traditional mirror types of resonators can be now easily overcome by the WGM
resonator. And these types of novel optical resonators in micro and nano size have found their
applications in a wide range of areas including lasing, optical sensing, optical communications,
frequency referencing, and nonlinear optics [3-7].
Figure1.2 Basic diagram of a circular shape resonator with reflection light trajectory.
To enable the further applications, the WGM resonator system is preferred to be expanded to
multiple sets to form an array or a matrix. The compound setting of micro resonator is also named
photonic molecules (PM). The study and the new development of photonic molecules is an very
important direction for the improvement of WGM microresonator applications. And more and
more critical physics and applications have been discovered and developed based on the compound
photonic molecule setting.

3
In this dissertation, the microtoroidal WGM resonators and the WGM resonator based photonic
molecules as well as their novel applications in light control are studied. The basic properties and
physics evolution of the WGM microtoroidal resonator and the photonic molecule formed by
coupling two of WGM microresonator is systematically studied, which can be useful for fully
understanding of the complex system and can benefit the further design and improvement of
applications. Coupled microtoroidal silica resonators with gain-loss setting, are proposed and
characterized as control elements for implementations of parity-time-symmetric micro cavity system
or non-Hermitian micro cavity systems to realize on-chip all-optical diode and laser control as well
as all-optical analogue of atomic system.
1.2 Dissertation Outline
In chapter 2, the basic theoretical model and critical characteristics of WGM microresonators are
introduced. Typical types of WGM microresonator geometries and materials are briefly introduced.
Two important features of WGM microcavity are reviewed. Coupling methods and the theoretical
equations are introduced to describe the waveguide-resonator system and the mode evolution, which
is crucial for studying the transmission properties of the resonator. In this dissertation we mainly
study silica microtoroidal resonators due to their unique advantages in low optical loss and highly
light confinement. The fabrication of microtoroids for both passive silica resonators and active rare-
earth ion doped silica resonators are described in chapter 2. An important and valuable application
of the WGM microtoroid resonator, which is nano particle sensing, is also briefly studied and
reviewed in chapter 2.
In chapter 3 of this dissertation, the photonic molecules are introduced at first, including different
types of photonic molecules, the advantage and main applications. Then the theoretical model and
the mode evolution including the formation of the supermodes are investigated. Tuning of the
system is analyzed, including spatial tuning and spectral tuning. Also, spectral engineering of the
photonic molecule system is characterized. Typical advantages and potential applications of
photonic molecule are introduced and investigated.

4
Chapter 4 studies the Electromagnetically Induced Transparency (EIT) and Autler-Townes Splitting
(ATS) in WGM photonic molecules. A brief introduction to EIT and Fano resonance is described as
well as their implementation in different types of physical platforms. ATS is also introduced briefly,
which is always confused with EIT. The implementations of EIT, Fano resonance, and ATS in
WGM photonic molecule are investigated theoretically and experimentally. The important method,
Akaike information criterion (AIC), to effectively discern the frequently confused EIT and ATS
phenomena is analyzed. Its practical application to discern EIT and ATS in WGM microcavity
spectra is demonstrated in detail.
Chapter 5 introduces the concept of party-time (PT) symmetry, its implementation in different
physics platforms (acoustics, optics, etc.). The investigation and development of a new PT
symmetric WGM optical microcavity system is described in detail. The model is analyzed with detail
characterization of eigen-mode evolution, theoretically and experimentally. The special fabrication of
the compound structure is described. Finally, an important application, that is, all-optical diode
implementation with this system is developed and characterized, as well as a comparison with other
all-optical diode design.
Chapter 6 reviews the concept of non-Hermitian system and exceptional points. The developed
non-Hermitian optical systems are introduced. The design and implementation of a non-Hermitian
optical WGM microcavity system is demonstrated and a full characterization of the system’s mode
evolution with exceptional points is included. The novel properties of the system such as the light
intensity enhancement by increasing loss are analyzed. The critical application with these properties
for optical nonlinear effect and on-chip laser light control tuning are demonstrated. At last, the
connection and a model conversion between general non-Hermitian optical WGM microcavity
system and PT symmetric WGM microcavity system is introduced.
5
Chapter 2
Whispering-Gallery-Mode Resonators
Due to the high surface smoothness which suppresses the scattering loss, and the selectively low
material absorption, as well as the tight light confinement, WGM optical microresonators are of
great interests for a variety of scientific disciplines. The advantage of low optical loss and high light
confinement lead to significant enhanced light-matter interactions. These features remarkably make
WGM resonators sensitive devices for perturbations detection including dielectric or metallic nano
particles, thermal and infrared signal, humidity change, and acoustic perturbations (micromechanical
displacement)[8-10]. Furthermore, the micro scale confinement of light enables and boosts the
tremendous light matter interaction inside the mcirocavity, leading to significant amplification of
cavity optical nonlinear effects, for instance, cavity optical Kerr nonlinear effect, cavity thermal-
optical nonlinear effect, cavity optomechanics, optical parametric oscillation, and Raman scattering
[11-14].
2.1 Introduction The name Whispering Gallery Modes were first introduced from the sound resonance effects in the
gallery of St Paul’s Cathedral in London. The refocusing effect of WGM for sound travelling along
the gallery was studied by Lord Rayleigh [15]. In 1961, WGMs in optics was firstly reported as the
laser action in Sm:CaF2 crystalline resonators was investigated [16]. Due to the total internal
reflection (TIR) effect, the light ray propagates inside the circular boundary and experiences
bouncing back in the inner boundary for multiple times, with a setting of higher refractive index
materials inside, leading to a total effect that the light travels along the boundary, as shown in Fig.
2.1a with a microsphere structure. When the wavelength of the light wave satisfies the following
condition
effm n L (2.1)
6
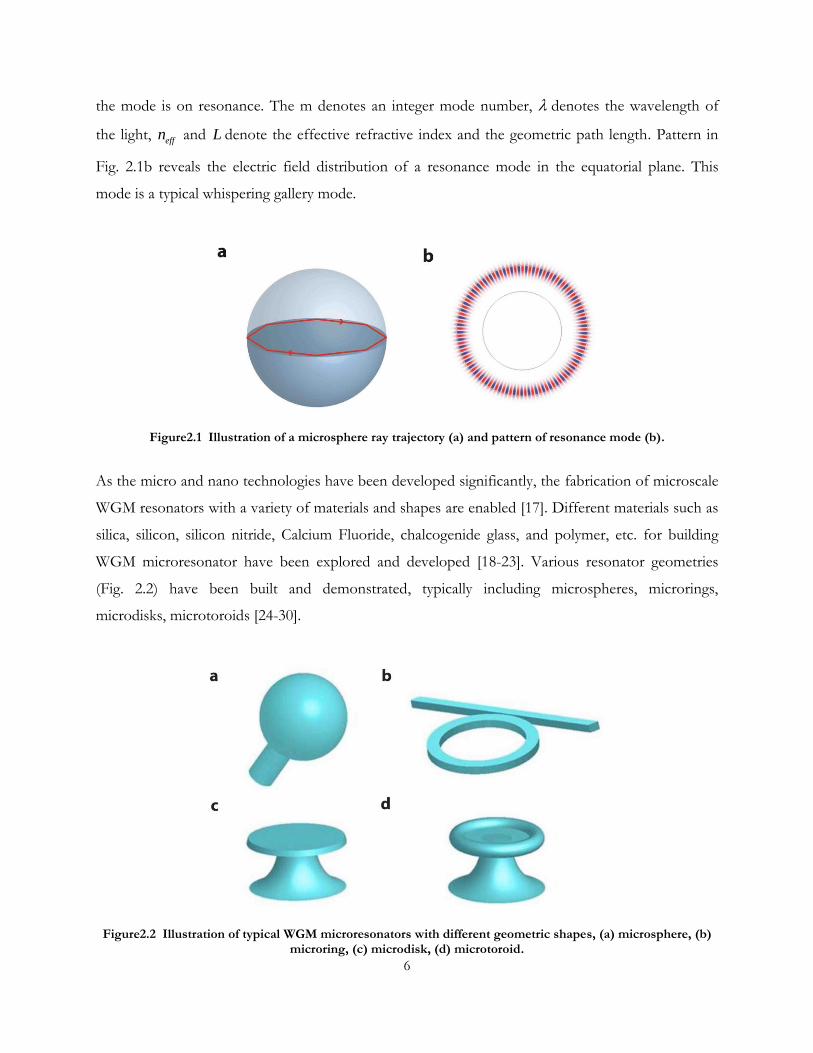
the mode is on resonance. The m denotes an integer mode number, denotes the wavelength of
the light, effn and L denote the effective refractive index and the geometric path length. Pattern in
Fig. 2.1b reveals the electric field distribution of a resonance mode in the equatorial plane. This
mode is a typical whispering gallery mode.
Figure2.1 Illustration of a microsphere ray trajectory (a) and pattern of resonance mode (b).
As the micro and nano technologies have been developed significantly, the fabrication of microscale
WGM resonators with a variety of materials and shapes are enabled [17]. Different materials such as
silica, silicon, silicon nitride, Calcium Fluoride, chalcogenide glass, and polymer, etc. for building
WGM microresonator have been explored and developed [18-23]. Various resonator geometries
(Fig. 2.2) have been built and demonstrated, typically including microspheres, microrings,
microdisks, microtoroids [24-30].
Figure2.2 Illustration of typical WGM microresonators with different geometric shapes, (a) microsphere, (b) microring, (c) microdisk, (d) microtoroid.
7
In this study, we mostly utilize the ultra-high quality factor microtoroid WGM resonator for the
device implementation.
2.2 Optical Properties of WGM Microresonators The WGM microresonators have several critical parameters which characterize their important
optical properties such as the optical loss and light confinement. The quality factor and photon
lifetime denotes the losses of the resonator. Free spectral range represents the periodical property of
the resonant modes. Mode volume denotes the spatial confinement of the resonant mode.
2.2.1 Quality Factor and Photon Lifetime
The Quality factor (Q factor), is a parameter characterizes the optical loss in a resonator. It is
defined as the ratio of total energy stored inside the resonator to the energy dissipation per cycle.
Typically, according to the Fourier transformation, the Q factor can be measured spectrally with the
resonance frequency and linewidth measurement
Q
(2.2)
where and are resonance frequency and resonance wavelength, and are the linewidth
or full width at half maximum (FWHM) of the resonance. By experimentally measuring the fine
resonance mode spectra, the Q value can be easily extracted.
Actually, the cavity total Q value is a combination of the cavity intrinsic loss and external signal
coupling loss. The intrinsic loss includes the material absorption loss, radiation loss, and scattering
loss. According to the above loss mechanism, the total Q value is determined as [31]
int
1 1 1 1 1 1 1
tot ex abs rad scat exQ Q Q Q Q Q Q (2.3)
where intQ denotes the total intrinsic Q, exQ denotes the external coupling Q. The absQ , radQ , scatQ
represent the effective material absorption Q, radiation Q, and scattering Q.
8
The photon lifetime on the other hand is defined as the time required for the photon energy in the
cavity to decay to 1/ e level, which is equal to the inverse of the linwidth and it relates with the Q
factor as
1
c
Q
(2.4)
2.2.2 Mode Distribution and Mode Volume
As shown in Fig.2.1b, the cavity resonance mode has a distributed pattern near the interface
between the inner dielectric material and the outside environment. A parameter named mode
volume V is defined as the equivalent volume that the resonance mode occupies if the photon
energy density is homogeneously distributed throughout the mode volume at the peak value, with
the expression as
22 3
22
( ) ( )
max ( ) ( )
n E d rV
n E
r r
r r
(2.5)
where ( )E r denotes the light wave electric field and ( )n r denotes the local refractive index. The
most critical feature that the mode volume characterized is the reflection of light intensity inside the
resonator. When the mode volume is small, the optical mode is more confined, leading to a higher
light intensity even with the same input power. This directly affects the light–matter interaction
strength [32].
Typical mode distribution pattern in a microtoroid resonator for the top view and side view cross-
section are presented in Fig.2.3.

9
Figure2.3 Illustration of top view and side view of a typical WGM mode spatial distribution in a microtoroid resonator, (a) top view, (b) side view.
2.2.3 Free Spectral Range
The free spectral range (FSR) is defined as the resonance frequency separation FSRf or resonance
wavelength separation FSR between two adjacent modes in a resonator. The approximate
expression of the FSR in a WGM resonator is defined as
2
FSR
cf
nR (2.6)
2
2FSR
nR
(2.7)
where c is the speed of light in vacuum and R denotes the effective cavity radius. For larger cavity,
the FSR is smaller while for smaller cavity, the FSR is larger. For the application of single-mode laser
or nanoparticle sensing, larger FSR is always preferred, for a cleaner spectrum for operation.
2.3 Optical Coupling of Input and Output The Fabry-Parot resonator utilizes the partial reflection and partial transmission mirror for input-
output signal coupling. However, in the WGM micro resonator, the input-output light coupling is
enabled by the near field evanescent coupling as shown in Fig.2.4.
10
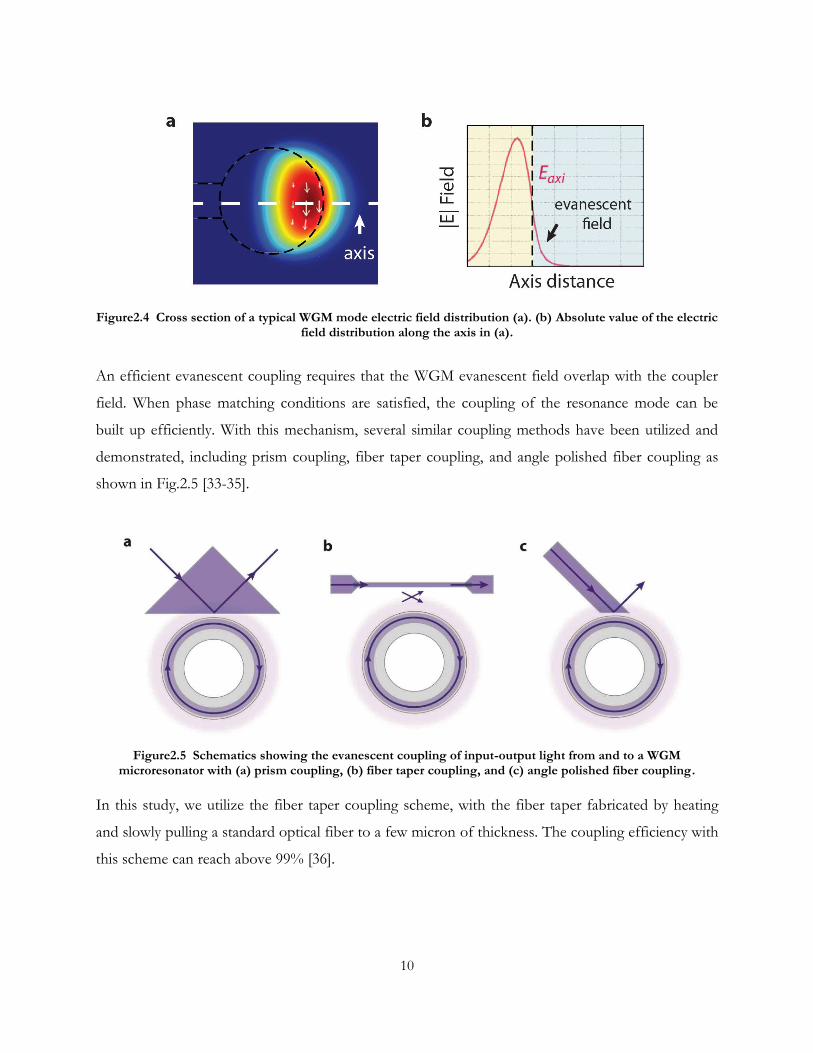
Figure2.4 Cross section of a typical WGM mode electric field distribution (a). (b) Absolute value of the electric field distribution along the axis in (a).
An efficient evanescent coupling requires that the WGM evanescent field overlap with the coupler
field. When phase matching conditions are satisfied, the coupling of the resonance mode can be
built up efficiently. With this mechanism, several similar coupling methods have been utilized and
demonstrated, including prism coupling, fiber taper coupling, and angle polished fiber coupling as
shown in Fig.2.5 [33-35].
Figure2.5 Schematics showing the evanescent coupling of input-output light from and to a WGM microresonator with (a) prism coupling, (b) fiber taper coupling, and (c) angle polished fiber coupling.
In this study, we utilize the fiber taper coupling scheme, with the fiber taper fabricated by heating
and slowly pulling a standard optical fiber to a few micron of thickness. The coupling efficiency with
this scheme can reach above 99% [36].
11
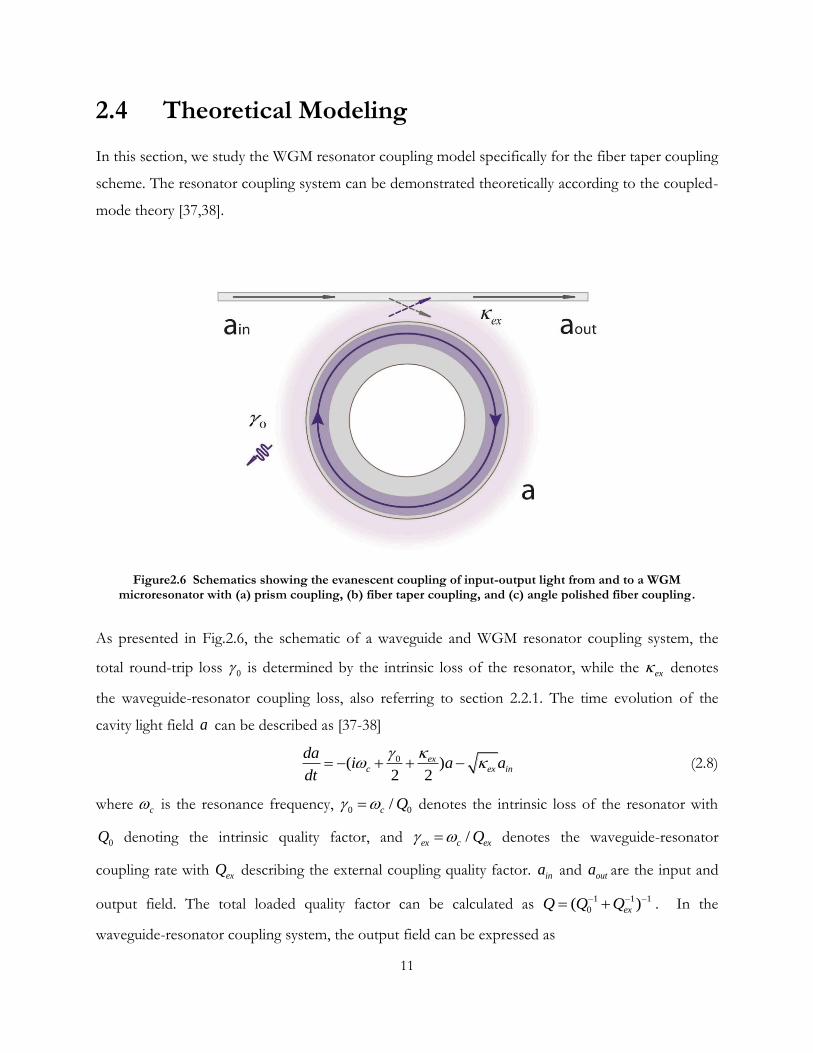
2.4 Theoretical Modeling In this section, we study the WGM resonator coupling model specifically for the fiber taper coupling
scheme. The resonator coupling system can be demonstrated theoretically according to the coupled-
mode theory [37,38].
Figure2.6 Schematics showing the evanescent coupling of input-output light from and to a WGM microresonator with (a) prism coupling, (b) fiber taper coupling, and (c) angle polished fiber coupling.
As presented in Fig.2.6, the schematic of a waveguide and WGM resonator coupling system, the
total round-trip loss 0 is determined by the intrinsic loss of the resonator, while the ex denotes
the waveguide-resonator coupling loss, also referring to section 2.2.1. The time evolution of the
cavity light field a can be described as [37-38]
0( )2 2
exc ex in
dai a a
dt
(2.8)
where c is the resonance frequency, 0 0/c Q denotes the intrinsic loss of the resonator with
0Q denoting the intrinsic quality factor, and /ex c exQ denotes the waveguide-resonator
coupling rate with exQ describing the external coupling quality factor. ina and outa are the input and
output field. The total loaded quality factor can be calculated as 1 1 1
0( )exQ Q Q . In the
waveguide-resonator coupling system, the output field can be expressed as

12
out in exa a a (2.9)
According to Eq. (2.8) and Eq. (2.9), with proper conditions, the transmission power which is
defined as 2 2
/out inT a a can be calculated.
Considering the steady state condition with Fourier transformation, the dynamic can be expressed as
0( ) 02 2
exex ini a a
(2.10)
where c is the frequency detuning between the input and the resonance frequency c .
Thus the intracavity field is derived as
0( ) / 2
ex in
ex
aa
i
. (2.11)
Combining Eq. (2.9) and Eq. (2.11), the expression of the power transmission is derived as
2
0
2
0 2 0
1 1( ) / 2
2
ex ex
ex ex
Ti
. (2.12)
In the real system, the cavity intrinsic loss is usually fixed, while the coupling rate can be tuned by
varying the gap distance between the waveguide and the cavity. The coupling rate increases
exponentially with the decrease of the coupling gap. According to the relation between the cavity
intrinsic loss 0 and the coupling rate ex , the coupling condition can be defined as three regimes:
under coupling, critical coupling, and over coupling.
(i) The under coupling regime is the regime where 0 ex , that is, the coupling loss is smaller than
the cavity intrinsic loss. Phase shift of the transmitted light at this condition is zero.
(ii) The critical coupling is defined as the coupling when 0 ex the waveguide coupling loss is
equal to the cavity intrinsic loss. At this condition, the power transmission at the exact resonance
frequency is zero, meaning resonant light trapped inside the cavity perfectly. Also, the circulating
power is maximized at this point. All the input power is coupled into the resonator and dissipated
within the photon lifetime.

13
(iii) The over coupling regime is the regime where 0 ex , when the coupling loss dominates the
total loss. At this regime, the transmitted light undergoes a phase shift, with the linewidth
broadened and resonance shallowed on the transmission spectra [36].
2.5 WGM Microresonator with Gain Gain and lasing in WGM resonators can be achieved by either introducing active materials to the
resonator or using intrinsic nonlinearities of the resonator material [39-47]. The combination of
high-Q microresonators and gain materials leads to a variety of laser configurations with good
performance. Different gain medium enables the WGM micro laser to cover a wide lasing spectral
range from ultraviolet to infrared.
2.5.1 Er3+ Doped Gain and Amplification
Among different gain materials, rare-earth ions (e.g., Er3+, Yb3+, Nd3+, etc) are widely used dopants
for solid-state lasers due to their high efficiency, long upper-level lifetime, ability to generate short
pulses, and wide emission spectrum spans from 0.3 to 3 um which cover important wavelengths not
only crucial to sensing but also to communication applications. For instance, Er3+ ion provides gain
around 1550 nm enables it as key dopant for optical communication signal amplification [95]. In this
study, we utilize the Er-doped microtoroidal resonator for active gain supply and for investigation of
the performance of WGM microlasers. The Er-doped microtoroidal resonators are prepared from
silica sol-gel thin film coating together with standard photolithography based semiconductor
fabrication scheme. The sol-gel process method and the fabrication of the device are demonstrated
in the section 2.7.2.
14
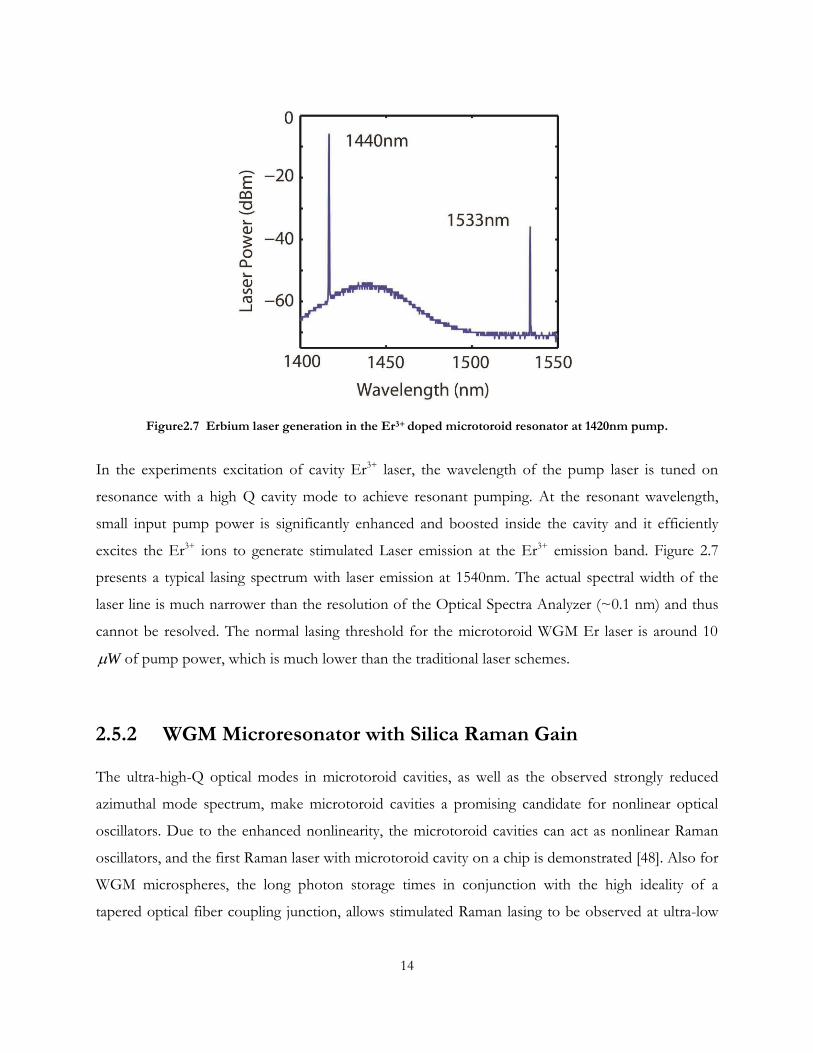
Figure2.7 Erbium laser generation in the Er3+ doped microtoroid resonator at 1420nm pump.
In the experiments excitation of cavity Er3+ laser, the wavelength of the pump laser is tuned on
resonance with a high Q cavity mode to achieve resonant pumping. At the resonant wavelength,
small input pump power is significantly enhanced and boosted inside the cavity and it efficiently
excites the Er3+ ions to generate stimulated Laser emission at the Er3+ emission band. Figure 2.7
presents a typical lasing spectrum with laser emission at 1540nm. The actual spectral width of the
laser line is much narrower than the resolution of the Optical Spectra Analyzer (~0.1 nm) and thus
cannot be resolved. The normal lasing threshold for the microtoroid WGM Er laser is around 10
W of pump power, which is much lower than the traditional laser schemes.
2.5.2 WGM Microresonator with Silica Raman Gain
The ultra-high-Q optical modes in microtoroid cavities, as well as the observed strongly reduced
azimuthal mode spectrum, make microtoroid cavities a promising candidate for nonlinear optical
oscillators. Due to the enhanced nonlinearity, the microtoroid cavities can act as nonlinear Raman
oscillators, and the first Raman laser with microtoroid cavity on a chip is demonstrated [48]. Also for
WGM microspheres, the long photon storage times in conjunction with the high ideality of a
tapered optical fiber coupling junction, allows stimulated Raman lasing to be observed at ultra-low

15
threshold as low as 74 μW at 1550 nm band. In the WGM microresonators, in addition to the single
mode emission, multiple laser emission is also observed to be over a large range of pump powers.
Figure2.8 Raman laser generation from silica microtoroid resonator at (a) 1450nm pump and (b) 660nm pump.
Fig.2.8 shows typical silica Raman laser spectra in silica microtoroid WGM resonator at different
wavelength band. Either single mode lasing and multimode lasing operation can be obtained, as the
pump power or coupling condition is tuned specifically.
2.6 Nonlinear Effects in WGM Microresonators Due to the ultra-low optical loss and highly light field confinement, strong Kerr-nonlinearity in a
microcavity is supported and Kerr-nonlinearity induced optical parametric oscillation is successfully
demonstrated, even in materials with weak nonlinear properties such as silica [49]. Geometrical
control of microtoroid WGM resonator enables a transition to optical parametric oscillation
regimes. Optical parametric oscillation (OPO) is observed with threshold as low as 100’s micro-
Watts, which is more than two orders of magnitude lower than for optical-fiber based OPO. Also,
the highly confined light enables the opto-elastic effect and the effective optical gradient force. This
generates a crucial phenomenon called cavity opto-mechanics [50]. With the strong excitation of
optical resonance field, the WGM microresonator excites a tiny mechanical vibration effect
coherently. The excited mechanical effect on the other hand modifies the optical mode nonlinearly,
also presenting as a nonlinear effect to the cavity optics.
16
2.6.1 WGM Microresonator with Kerr Nonlinearity Induced Parametric Oscillation
Optical parametric oscillators (OPOs) depend on energy and momentum conserving optical
processes to generate light at two new side bands, with one called “signal” and the other called
“idler” frequencies. In contrast to oscillation based on stimulated gain, optical parametric oscillation
does not involve coupling to a dissipative reservoir. This feature enables its related applications for
quantum information research, spectroscopy, as well as sensing. The oscillation based on optical
parametric gain requires strict phase matching of the optical fields with the combinations of high
field intensity or long interaction length. These requirements pose severe challenges to attaining
micro-cavity optical parametric oscillators.
The microtoroid WGM resonator has great advantage which makes it a good candidate for the Kerr-
nonlinearity induced optical parametric oscillation. However, even with ultra-high Q factor and
strong light confinement, it is not sufficient to ensure parametric oscillation. Due to inversion
symmetry, the lowest order nonlinearity in silica is the third order nonlinearity so that the elemental
parametric interaction converts two pump photons ( P ) into signal ( S ) and idler ( I ) photons
[51,52]. In order to enable parametric oscillations efficiently, both energy and momentum must be
conserved in this nonlinear process. In WGM resonators, such as microtoroids, momentum is
intrinsically conserved when signal and idler angular mode numbers are symmetrically located with
respect to the pump mode.
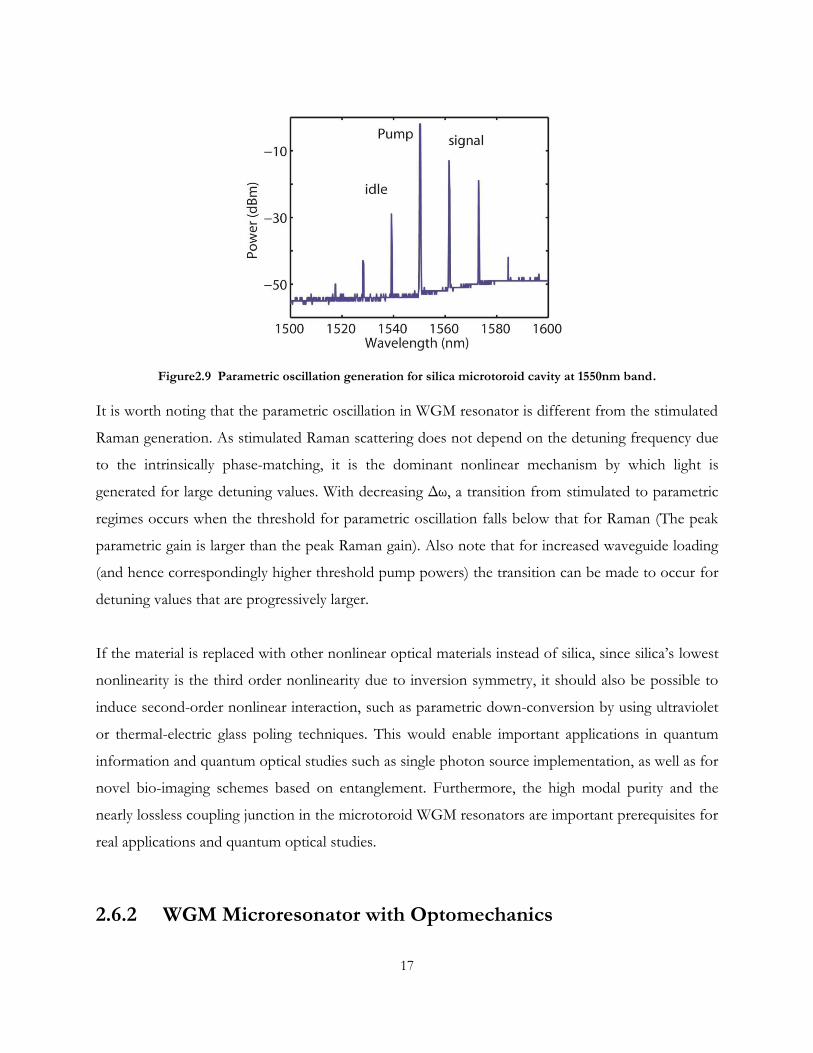
Fig.2.9 shows typical experimentally obtained optical parametric oscillation spectrum in a silica
microtoroid WGM resonator at the 1550nm band. Clear signal peak and idler peak have been
observed, even with second order and third order parametric signal generation.
17
Figure2.9 Parametric oscillation generation for silica microtoroid cavity at 1550nm band.
It is worth noting that the parametric oscillation in WGM resonator is different from the stimulated
Raman generation. As stimulated Raman scattering does not depend on the detuning frequency due
to the intrinsically phase-matching, it is the dominant nonlinear mechanism by which light is
generated for large detuning values. With decreasing Δω, a transition from stimulated to parametric
regimes occurs when the threshold for parametric oscillation falls below that for Raman (The peak
parametric gain is larger than the peak Raman gain). Also note that for increased waveguide loading
(and hence correspondingly higher threshold pump powers) the transition can be made to occur for
detuning values that are progressively larger.
If the material is replaced with other nonlinear optical materials instead of silica, since silica’s lowest
nonlinearity is the third order nonlinearity due to inversion symmetry, it should also be possible to
induce second-order nonlinear interaction, such as parametric down-conversion by using ultraviolet
or thermal-electric glass poling techniques. This would enable important applications in quantum
information and quantum optical studies such as single photon source implementation, as well as for
novel bio-imaging schemes based on entanglement. Furthermore, the high modal purity and the
nearly lossless coupling junction in the microtoroid WGM resonators are important prerequisites for
real applications and quantum optical studies.
2.6.2 WGM Microresonator with Optomechanics

18
The opto-mechanical coupling refers to systems where a mechanical oscillator is parametrically
coupled to an electromagnetic resonant system, for instance, between a moving mirror of FP
resonator and the radiation pressure of light. It has first appeared in the context of interferometric
gravitational wave experiments. The first observation of the dynamic back action between optical
resonance and mechanical resonance systems was reported in 2005 at a vastly different size scale in
microtoroid cavities [53-55].
The general model of the opto-mechanics system can be described as
0( ) ( )2 2
exex in
dai x a a a
dt
(2.13)
2 ( ) ( )
2
m RP Lm
m eff eff
F t F tx x x
Q m m
(2.14)
00( )x x
R
(2.15)
where a denotes the optical field amplitude, 0 and ex denotes the optical cavity intrinsic loss and
coupling rate, x denotes the mechanical displacement with mechanical frequency m and
mechanical quality factor mQ . The RPF and LF denotes the optical radiation force and mechanical
force with effm denoting the effective mass. R is the structural radius of the WGM resonator.
Figure2.10 Experimentally obtained Microtoroid WGM resonator excited opto-mechanics. (a) and (b) Mechanic excitation at 10.4MHz, in frequency domain or time domain; (c) and (b) Mechanic excitation at
26.3MHz, in frequency domain or time domain.
19
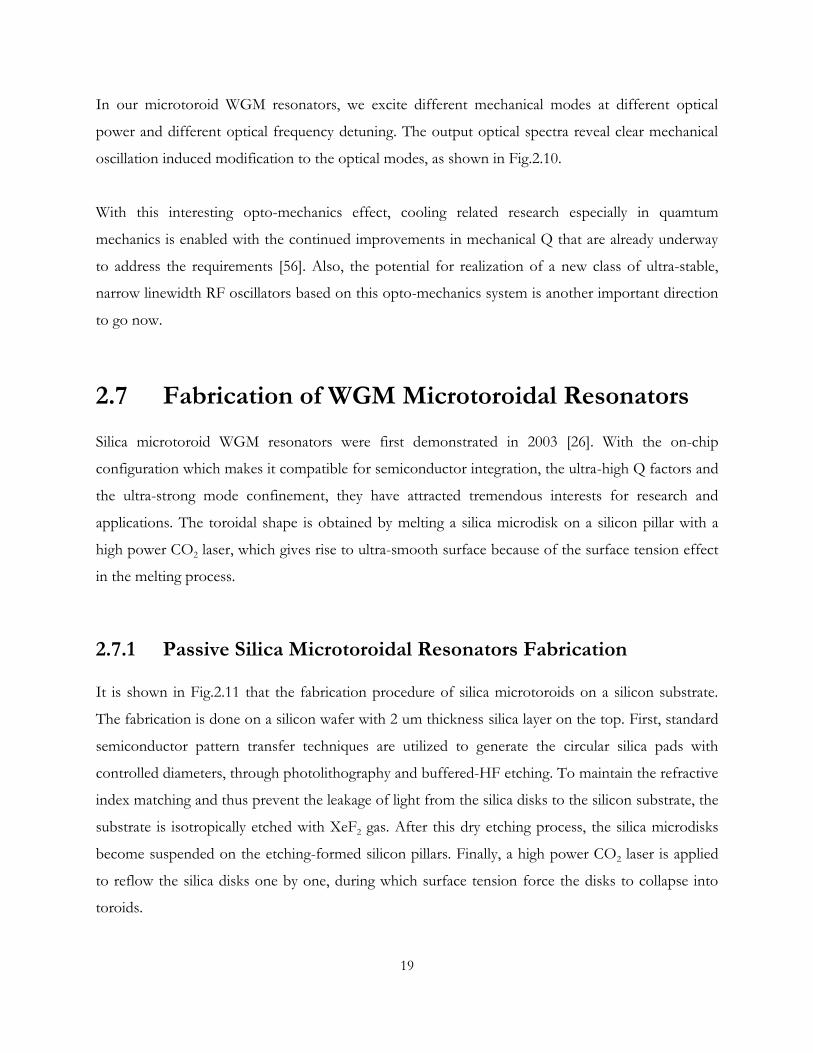
In our microtoroid WGM resonators, we excite different mechanical modes at different optical
power and different optical frequency detuning. The output optical spectra reveal clear mechanical
oscillation induced modification to the optical modes, as shown in Fig.2.10.
With this interesting opto-mechanics effect, cooling related research especially in quamtum
mechanics is enabled with the continued improvements in mechanical Q that are already underway
to address the requirements [56]. Also, the potential for realization of a new class of ultra-stable,
narrow linewidth RF oscillators based on this opto-mechanics system is another important direction
to go now.
2.7 Fabrication of WGM Microtoroidal Resonators Silica microtoroid WGM resonators were first demonstrated in 2003 [26]. With the on-chip
configuration which makes it compatible for semiconductor integration, the ultra-high Q factors and
the ultra-strong mode confinement, they have attracted tremendous interests for research and
applications. The toroidal shape is obtained by melting a silica microdisk on a silicon pillar with a
high power CO2 laser, which gives rise to ultra-smooth surface because of the surface tension effect
in the melting process.
2.7.1 Passive Silica Microtoroidal Resonators Fabrication
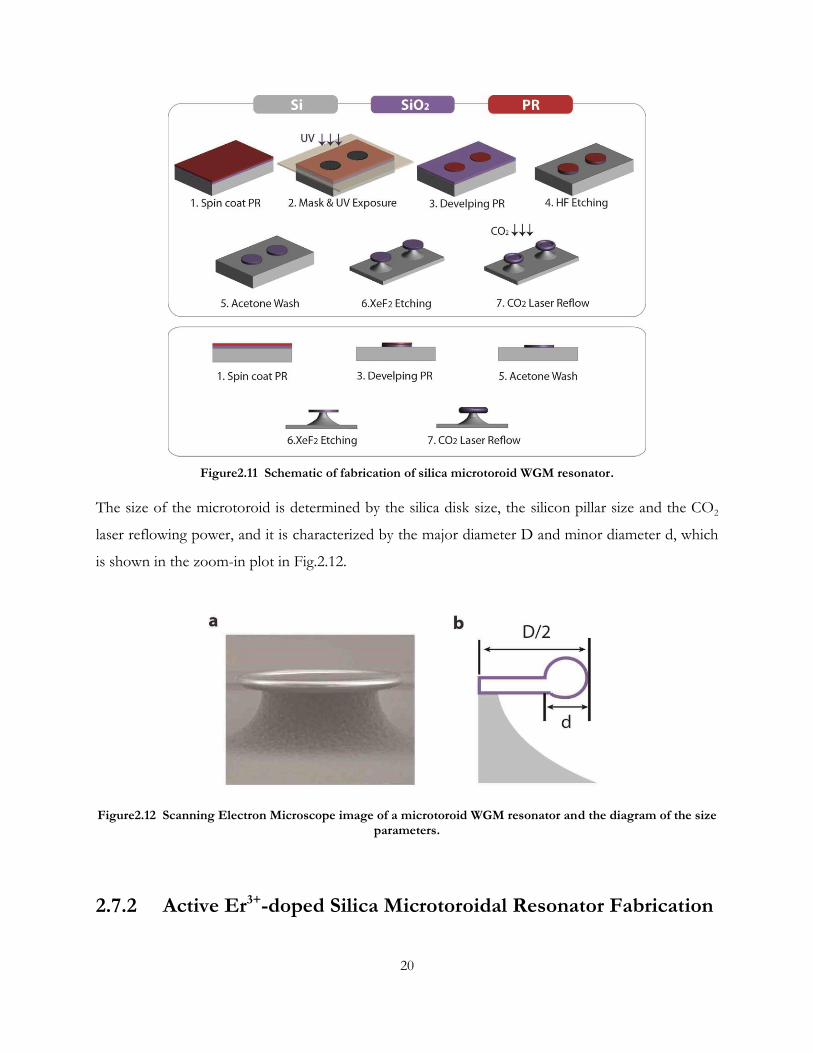
It is shown in Fig.2.11 that the fabrication procedure of silica microtoroids on a silicon substrate.
The fabrication is done on a silicon wafer with 2 um thickness silica layer on the top. First, standard
semiconductor pattern transfer techniques are utilized to generate the circular silica pads with
controlled diameters, through photolithography and buffered-HF etching. To maintain the refractive
index matching and thus prevent the leakage of light from the silica disks to the silicon substrate, the
substrate is isotropically etched with XeF2 gas. After this dry etching process, the silica microdisks
become suspended on the etching-formed silicon pillars. Finally, a high power CO2 laser is applied
to reflow the silica disks one by one, during which surface tension force the disks to collapse into
toroids.
20
Figure2.11 Schematic of fabrication of silica microtoroid WGM resonator.
The size of the microtoroid is determined by the silica disk size, the silicon pillar size and the CO2
laser reflowing power, and it is characterized by the major diameter D and minor diameter d, which
is shown in the zoom-in plot in Fig.2.12.
Figure2.12 Scanning Electron Microscope image of a microtoroid WGM resonator and the diagram of the size parameters.
2.7.2 Active Er3+-doped Silica Microtoroidal Resonator Fabrication
21
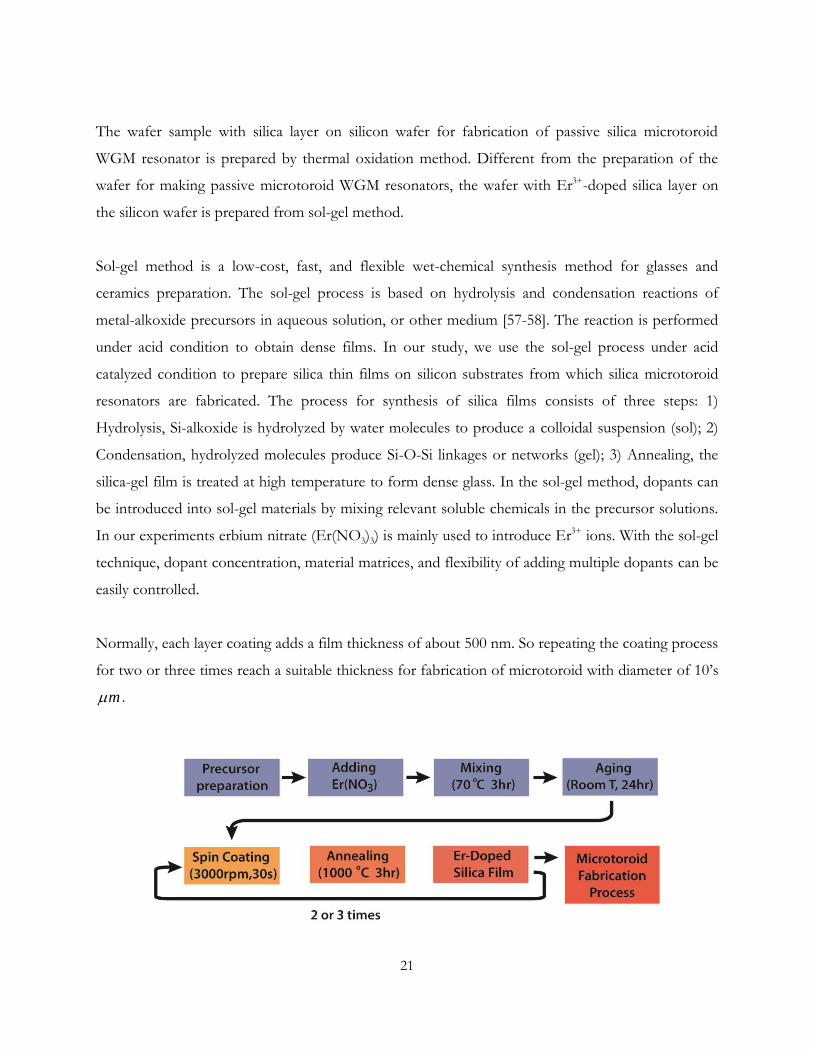
The wafer sample with silica layer on silicon wafer for fabrication of passive silica microtoroid
WGM resonator is prepared by thermal oxidation method. Different from the preparation of the
wafer for making passive microtoroid WGM resonators, the wafer with Er3+-doped silica layer on
the silicon wafer is prepared from sol-gel method.
Sol-gel method is a low-cost, fast, and flexible wet-chemical synthesis method for glasses and
ceramics preparation. The sol-gel process is based on hydrolysis and condensation reactions of
metal-alkoxide precursors in aqueous solution, or other medium [57-58]. The reaction is performed
under acid condition to obtain dense films. In our study, we use the sol-gel process under acid
catalyzed condition to prepare silica thin films on silicon substrates from which silica microtoroid
resonators are fabricated. The process for synthesis of silica films consists of three steps: 1)
Hydrolysis, Si-alkoxide is hydrolyzed by water molecules to produce a colloidal suspension (sol); 2)
Condensation, hydrolyzed molecules produce Si-O-Si linkages or networks (gel); 3) Annealing, the
silica-gel film is treated at high temperature to form dense glass. In the sol-gel method, dopants can
be introduced into sol-gel materials by mixing relevant soluble chemicals in the precursor solutions.
In our experiments erbium nitrate (Er(NO3)3) is mainly used to introduce Er3+ ions. With the sol-gel
technique, dopant concentration, material matrices, and flexibility of adding multiple dopants can be
easily controlled.
Normally, each layer coating adds a film thickness of about 500 nm. So repeating the coating process
for two or three times reach a suitable thickness for fabrication of microtoroid with diameter of 10’s
m .

22
Figure2.13 Process flow for fabrication of Er3+-doped active microtoroid WGM resonator through sol-gel process.
After a smooth Er3+-doped sol-gel silica film is formed with appropriate thickness, the sample can
be prepared following the standard fabrication procedure, the same as the fabrication of the passive
silica microtoroid WGM resonator.
2.8 Nanoparticle Sensing with WGM Microresonators
In recent years the development of micro- and nano-scale optical technologies for environmental
and bio sensing and detection, has experienced tremedous increase [59-61]. For biomedical
applications, the sensitive and label-free detection of biomolecules such as proteins, viruses, and
DNA, is crucial for implementing next-generation clinical diagnostic method. And it is essential to
achieve single molecule detection capability in an aqueous environment since clinical samples are
liquid based.
Although there are many approaches for label-free biosensing only few technologies promise single
molecule detection capability with integration on a chip-scale platform, including high-Q optical
resonators, nanomechanical resonators, plasmon resonance sensors, and nanowire sensors. Among
all these platforms, high-Q optical resonator-based biosensors have their unique advantage [62-65].
The sensitivity of optical resonators scales inversely with size, whereas non-resonant optical
detection schemes such as those based on Mach-Zander interferometers do not share this feature.
Thus the advantage of fabrication of miniature high-Q WGM optical microresonators from
different materials and in different geometries benefits the particularly important applications.
Furthermore, micro- and nano-scale optical WGM microresonators are not only one of the most
sensitive approaches to probing the biomedical targets, but also multi-function sensing platforms.
2.8.1 Mode Shift and Mode Splitting
The WGM optical microresonator detects the binding of molecules or nanoparticles via changes in
the resonance frequency. A WGM exhibits high sensitivity to such perturbations due to the highly

23
light confinement close to the surface where the evanescent field interacts strongly with the
surrounding medium.
The binding of the nanoparticle shifts the WGM resonance frequency (or wavelength) by a
miniscule amount as illustrated in Fig.2.14a. The shift to shorter resonance frequency occurs due to
that the binding particle effectively increases the effective index on the optical path, equivalent to
extracting part of the optical field to the outside of the microresonator, thereby increasing the
optical path length. Therefore, this increase in optical path length produces the shift to lower
frequency. To ensure the high sensitivity, a large Q factor is necessary in order to resolve the
fractional frequency shift with high resolution [66,67].
Figure2.14 Illustration of spectra for mode shift and mode splitting.
On the other hand, the mode splitting, in which the modal coupling is induced by a single Rayleigh
Scatterer, has a different physics explanation. The scatterer can be a subwavelength dielectric or
metallic particle. Considering a WGM microresonator modes without observable intrinsic splitting,
for which the resonance mode appears as a single peak, when a Rayleigh nanoparticle falls into the
evanescent field of WGMs, a portion of the scattered light is lost to the environment creating an
additional damping channel, while the rest couples back into the opposite propagating mode and
induces coupling between the counter-propagating WGMs, whose counter-propagating mode
degeneracy is lifted consequently, meaning that the two overlap modes splits into two, as illustrated
in Fig.2.14b [68,69].
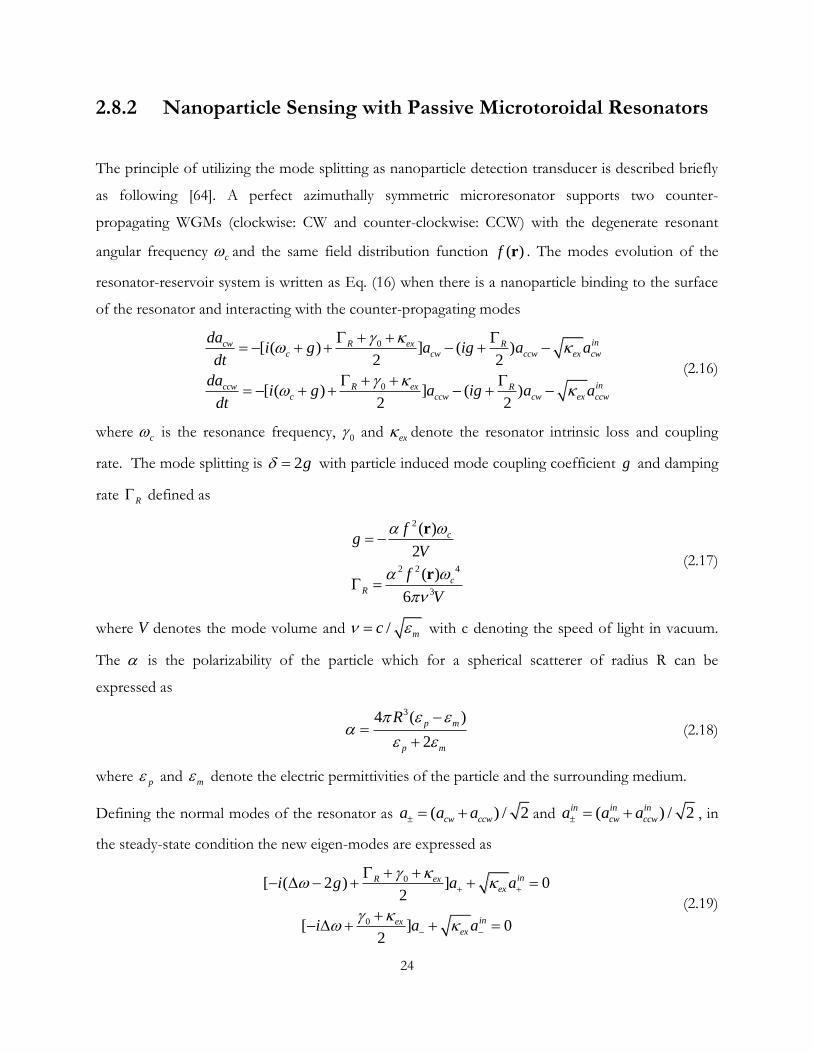
24
2.8.2 Nanoparticle Sensing with Passive Microtoroidal Resonators
The principle of utilizing the mode splitting as nanoparticle detection transducer is described briefly
as following [64]. A perfect azimuthally symmetric microresonator supports two counter-
propagating WGMs (clockwise: CW and counter-clockwise: CCW) with the degenerate resonant
angular frequency c and the same field distribution function ( )f r . The modes evolution of the
resonator-reservoir system is written as Eq. (16) when there is a nanoparticle binding to the surface
of the resonator and interacting with the counter-propagating modes
0
0
[ ( ) ] ( )2 2
[ ( ) ] ( )2 2
incw R ex Rc cw ccw ex cw
inccw R ex Rc ccw cw ex ccw
dai g a ig a a
dt
dai g a ig a a
dt
(2.16)
where c is the resonance frequency, 0 and ex denote the resonator intrinsic loss and coupling
rate. The mode splitting is 2g with particle induced mode coupling coefficient g and damping
rate R defined as
2
2 2 4
3
( )
2
( )
6
c
cR
fg
V
f
V
r
r (2.17)
where V denotes the mode volume and / mc with c denoting the speed of light in vacuum.
The is the polarizability of the particle which for a spherical scatterer of radius R can be
expressed as
34 ( )
2
p m
p m
R
(2.18)
where p and m denote the electric permittivities of the particle and the surrounding medium.
Defining the normal modes of the resonator as ( ) / 2cw ccwa a a and ( ) / 2in in in
cw ccwa a a , in
the steady-state condition the new eigen-modes are expressed as
0
0
[ ( 2 ) ] 02
[ ] 02
inR exex
inexex
i g a a
i a a
(2.19)
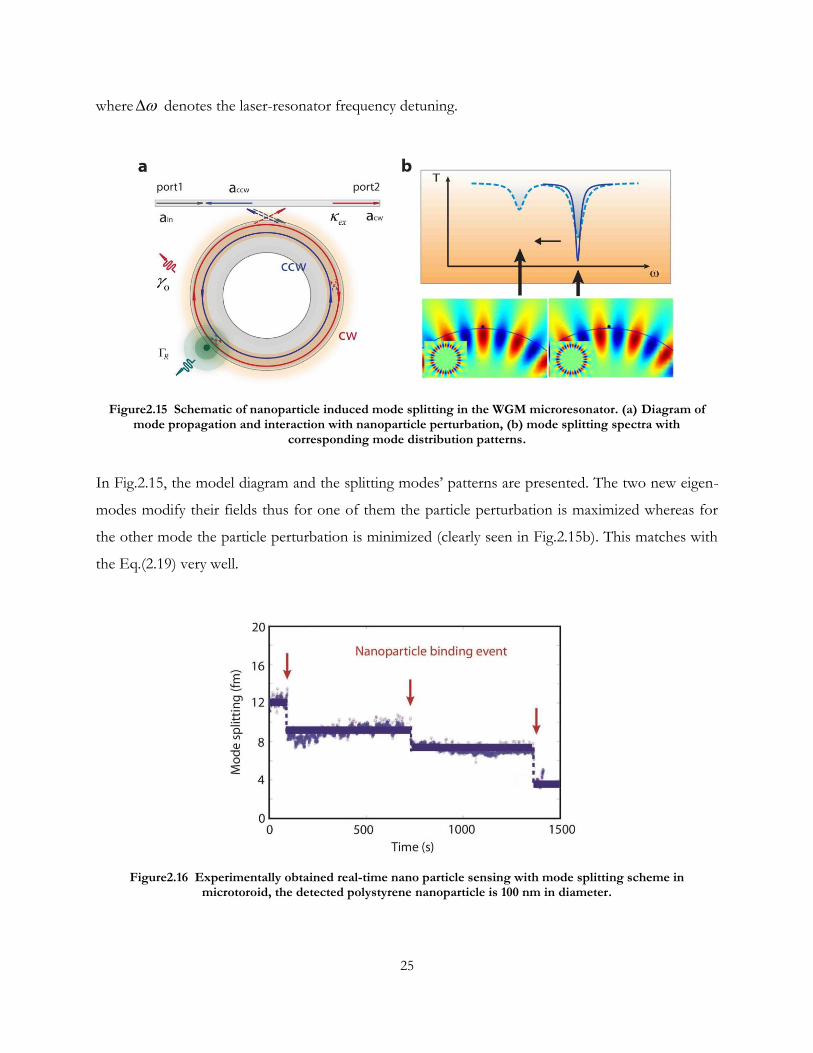
25
where denotes the laser-resonator frequency detuning.
Figure2.15 Schematic of nanoparticle induced mode splitting in the WGM microresonator. (a) Diagram of mode propagation and interaction with nanoparticle perturbation, (b) mode splitting spectra with
corresponding mode distribution patterns.
In Fig.2.15, the model diagram and the splitting modes’ patterns are presented. The two new eigen-
modes modify their fields thus for one of them the particle perturbation is maximized whereas for
the other mode the particle perturbation is minimized (clearly seen in Fig.2.15b). This matches with
the Eq.(2.19) very well.
Figure2.16 Experimentally obtained real-time nano particle sensing with mode splitting scheme in microtoroid, the detected polystyrene nanoparticle is 100 nm in diameter.

26
According to the above model analysis we know that when there is a nanoparticle binding to the
microresonator, it introduces non-degeneracy to the counter-propagating modes and leads to mode
splitting and difference of mode damping. As the nanoparticles continuously binds to the
microtoroid sensor, the mode splitting and damping difference change correspondingly at the
binding moments. This mechanism enables the real-time nanoparticle sensing with high sensitivity.
A typical sensing spectrum is presented in Fig.2.16, in which the discrete splitting changes
correspond to the each single nanoparticle binding event. Also, by extracting the splitting change
and damping difference in each event, the particle polarizability can be calculated accurately and thus
enabling the single nanoparticle size measurement in the meantime.
2.8.3 Nanoparticle Sensing with Active Microtoroidal Resonators
In WGM sensors, the fundamental limit of sensitivity is determined by Q/V, which quantifies the
strength of the interaction between the particle and the intra-cavity field. Thus, by increasing Q the
sensitivity can be improved. One way to increase the Q is compensating the losses. Q enhancement
of WGM resonances by compensating losses via optical gain has also been proved to be feasible
method [70,71] in silica microtoroids doped with rare-earth ions such as erbium (Er3+) and ytterbium
(Yb3+), or in silica resonator with Raman gain, referring to as active resonators. When such a
WGMR is optically pumped above lasing threshold, the resultant laser has a narrower linewidth than
the passive cavity and thereby improves the detection limit and sensitivity beyond what can be
achieved by the passive resonator or by the active resonator below lasing threshold. The basic
mechanism for this active scheme to enable the nanoparticle detection is described as following.
Similar to the mode-splitting evolution in passive resonator with nanoparticle perturbation, when the
active laser resonator has the particle binding, its lasing mode splits into two. The two splitting lasing
modes interfere at the output and thus generate a beatnote signal with the beating frequency equal to
the particle induced splitting. Thus, by detecting the beatnote signal and extracting the beatnote
frequency, the detection of nanoparticle binding is achieved (Fig.2.17).

27
Figure2.17 Schematic of nanoparticle sensing with active laser scheme in microtoroid, including rare-earth ion laser and Raman laser.
However, fabricating active WGMRs with dopants introduces additional processing steps and cost.
Meanwhile, rare-earth ion doped active resonators suffer from the fact that most rare-earth ions are
not biocompatible and that for each different wavelength band of operation a different rare-earth
ion and a different pump laser should be used.
Therefore, a fundamentally different physical process to increase Q/V and thereby the fundamental
sensitivity limit, as well as the detection limit can be developed. Instead of embedding rare-earth ions
as the gain medium in a silica microtoroid resonator, the intrinsic Raman gain [48, 72] in silica to
achieve loss compensation and highly sensitive nanoparticle detection is achieved. This does not
require any dopant or additional fabrication complexities. With this configuration, Raman gain-
induced Q enhancement (linewidth narrowing via loss compensation), Raman gain-enhanced
detection of mode splitting in the transmission spectra, and splitting in Raman lasing for single
nanoparticle detection and counting is demonstrated. Nanoparticle sensing such as polystyrene and
gold nanoparticles now can be easily achieved with this whispering-gallery Raman microlaser based
self-referenced and self-heterodyned method.

28
Figure2.18 Experimentally obtained real-time nanoparticle sensing with Raman laser in microtoroid. (a)(c) The detected polystyrene nanoparticle induced real-time Raman beatnote frequency change with different particle size, (b)(d) The measured beatnote frequency change distribution with different nanoparticle size.
Fig.2.18 shows the test of beatnote measurement in the WGM Raman laser system for nanoparticle
detection using NaCl nanoparticles. As discussed in the previous paragraph, particle binding to the
WGM microlaser led to the splitting of a lasing line into two, which eventually gave a self-
heterodyne beatnote signal when mixed at a photodetector, with the beatnote frequency
corresponding to the amount of splitting. Each consecutive nanoparticle binding event led to a
discrete change in the beatnote frequency. The frequency may increase or decrease depending on the
location of each particle with respect to the field distribution of the lasing modes and the position of
the particle with respect to previously deposited particles in the mode volume. As clearly shown in
Fig.2.18, the change in beat frequency and hence the splitting of the lasing mode as NaCl
nanoparticles of size R = 15 nm (Fig.2.18a), and 25 nm (Fig.2.18c) were continuously deposited
onto the WGM Raman laser. With each particle binding event we observe a discrete up or down
jump in the beat frequency. The histograms shown in Fig.2.18b and Fig.2.18d, reveal that the larger
the particles, the wider the distribution of the changes in the beatnote frequency [73].
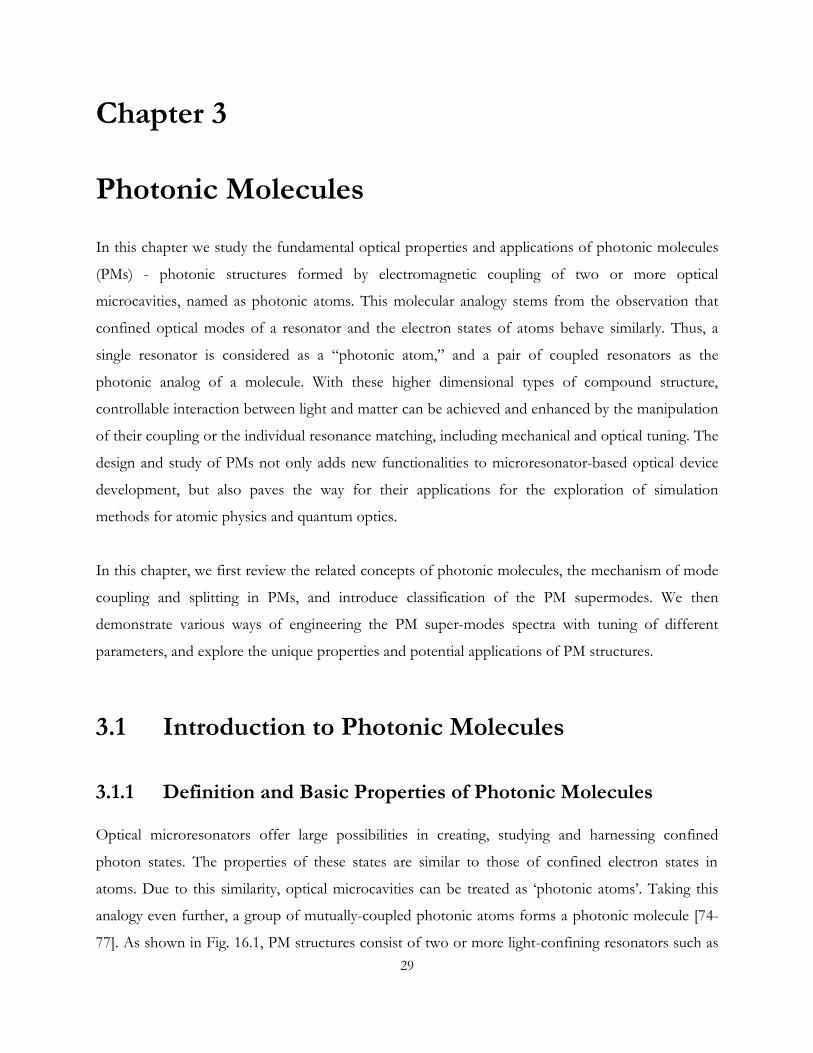
29
Chapter 3
Photonic Molecules
In this chapter we study the fundamental optical properties and applications of photonic molecules
(PMs) - photonic structures formed by electromagnetic coupling of two or more optical
microcavities, named as photonic atoms. This molecular analogy stems from the observation that
confined optical modes of a resonator and the electron states of atoms behave similarly. Thus, a
single resonator is considered as a “photonic atom,” and a pair of coupled resonators as the
photonic analog of a molecule. With these higher dimensional types of compound structure,
controllable interaction between light and matter can be achieved and enhanced by the manipulation
of their coupling or the individual resonance matching, including mechanical and optical tuning. The
design and study of PMs not only adds new functionalities to microresonator-based optical device
development, but also paves the way for their applications for the exploration of simulation
methods for atomic physics and quantum optics.
In this chapter, we first review the related concepts of photonic molecules, the mechanism of mode
coupling and splitting in PMs, and introduce classification of the PM supermodes. We then
demonstrate various ways of engineering the PM super-modes spectra with tuning of different
parameters, and explore the unique properties and potential applications of PM structures.
3.1 Introduction to Photonic Molecules
3.1.1 Definition and Basic Properties of Photonic Molecules
Optical microresonators offer large possibilities in creating, studying and harnessing confined
photon states. The properties of these states are similar to those of confined electron states in
atoms. Due to this similarity, optical microcavities can be treated as ‘photonic atoms’. Taking this
analogy even further, a group of mutually-coupled photonic atoms forms a photonic molecule [74-
77]. As shown in Fig. 16.1, PM structures consist of two or more light-confining resonators such as
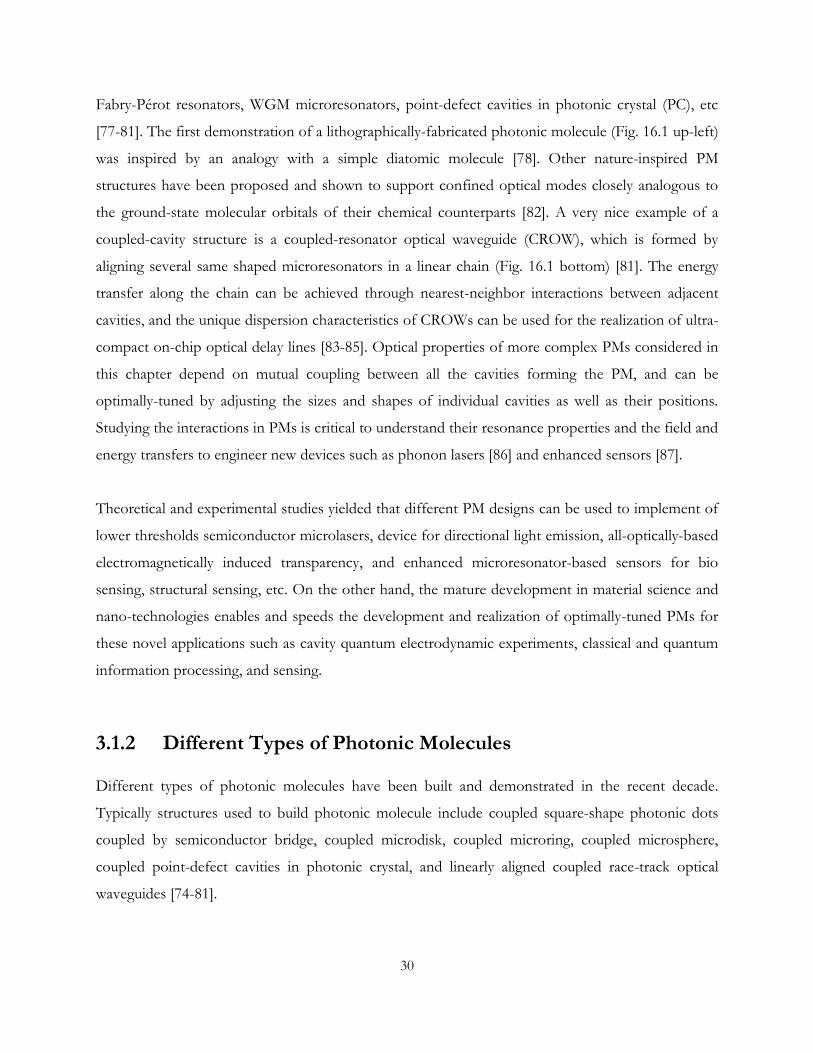
30
Fabry-Pérot resonators, WGM microresonators, point-defect cavities in photonic crystal (PC), etc
[77-81]. The first demonstration of a lithographically-fabricated photonic molecule (Fig. 16.1 up-left)
was inspired by an analogy with a simple diatomic molecule [78]. Other nature-inspired PM
structures have been proposed and shown to support confined optical modes closely analogous to
the ground-state molecular orbitals of their chemical counterparts [82]. A very nice example of a
coupled-cavity structure is a coupled-resonator optical waveguide (CROW), which is formed by
aligning several same shaped microresonators in a linear chain (Fig. 16.1 bottom) [81]. The energy
transfer along the chain can be achieved through nearest-neighbor interactions between adjacent
cavities, and the unique dispersion characteristics of CROWs can be used for the realization of ultra-
compact on-chip optical delay lines [83-85]. Optical properties of more complex PMs considered in
this chapter depend on mutual coupling between all the cavities forming the PM, and can be
optimally-tuned by adjusting the sizes and shapes of individual cavities as well as their positions.
Studying the interactions in PMs is critical to understand their resonance properties and the field and
energy transfers to engineer new devices such as phonon lasers [86] and enhanced sensors [87].
Theoretical and experimental studies yielded that different PM designs can be used to implement of
lower thresholds semiconductor microlasers, device for directional light emission, all-optically-based
electromagnetically induced transparency, and enhanced microresonator-based sensors for bio
sensing, structural sensing, etc. On the other hand, the mature development in material science and
nano-technologies enables and speeds the development and realization of optimally-tuned PMs for
these novel applications such as cavity quantum electrodynamic experiments, classical and quantum
information processing, and sensing.
3.1.2 Different Types of Photonic Molecules
Different types of photonic molecules have been built and demonstrated in the recent decade.
Typically structures used to build photonic molecule include coupled square-shape photonic dots
coupled by semiconductor bridge, coupled microdisk, coupled microring, coupled microsphere,
coupled point-defect cavities in photonic crystal, and linearly aligned coupled race-track optical
waveguides [74-81].

31
Figure3.1 Different types of Photonic Molecules [74-81].
In our study, we focus on the research on PMs formed by coupled microtoroid or microsphere
structure, or hybrid PMs formed by mix of these two. We introduce a method to detach an on-chip
microresonator from its pillar, connecting it to the substrate, to form a free high-Q microresonator,
and report studies of the optical modes in PMs made from pairs of directly coupled free-standing
and on-chip WGM resonators of different shapes, sizes, and materials (hybrid resonators). We
investigate the interaction and supermode formation in these types of PMs, including the directly
coupled on-chip and free-standing silica microtoroids, directly coupled on-chip polydimethylsiloxane
(PDMS)-coated silica microtoroid and a silica microsphere having a fiber stem, as well as coupled
two edged on-chip microtoroid.
3.2 Microtoroid and Microsphere Based Photonic Molecules
As briefly discussed above, we implement and demonstrate the photonic molecule design based on
microtoroid and microsphere structure. The microtoroid and microsphere based PMs have the
advantage of small structural dimension, high quality factor and loss optical loss, large spectral and
mechanical tenability, and clean photonic mode evolution. They are very good platform for
demonstration of novel properties and phenomena in typical photonic molecules.
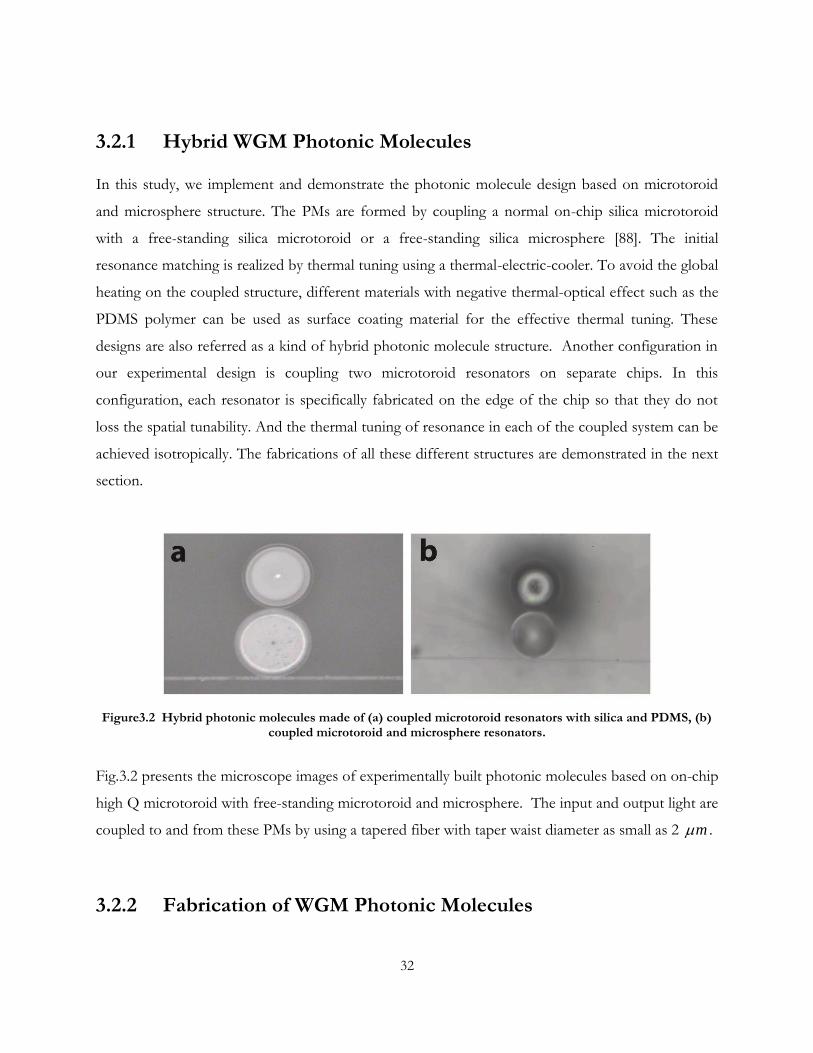
32
3.2.1 Hybrid WGM Photonic Molecules
In this study, we implement and demonstrate the photonic molecule design based on microtoroid
and microsphere structure. The PMs are formed by coupling a normal on-chip silica microtoroid
with a free-standing silica microtoroid or a free-standing silica microsphere [88]. The initial
resonance matching is realized by thermal tuning using a thermal-electric-cooler. To avoid the global
heating on the coupled structure, different materials with negative thermal-optical effect such as the
PDMS polymer can be used as surface coating material for the effective thermal tuning. These
designs are also referred as a kind of hybrid photonic molecule structure. Another configuration in
our experimental design is coupling two microtoroid resonators on separate chips. In this
configuration, each resonator is specifically fabricated on the edge of the chip so that they do not
loss the spatial tunability. And the thermal tuning of resonance in each of the coupled system can be
achieved isotropically. The fabrications of all these different structures are demonstrated in the next
section.
Figure3.2 Hybrid photonic molecules made of (a) coupled microtoroid resonators with silica and PDMS, (b) coupled microtoroid and microsphere resonators.
Fig.3.2 presents the microscope images of experimentally built photonic molecules based on on-chip
high Q microtoroid with free-standing microtoroid and microsphere. The input and output light are
coupled to and from these PMs by using a tapered fiber with taper waist diameter as small as 2 m .
3.2.2 Fabrication of WGM Photonic Molecules

33
The fabrication of microtoroid and microsphere based photonic molecules in our study are as
following. In the on-chip microtoroid coupling with free standing microsphere scheme, the on-chip
microtoroid is fabricated following the method described in section 2.7.1, whereas the free-standing
microsphere is formed via melting a silica fiber tip with CO2 laser pulse. The temporal high energy
which is absorbed by the head of the fiber tip immediately melts the silica and reshapes it into a
well-formed sphere, with the rest fiber part acting as a stem supporting the sphere, as shown in
Fig.3.3a. In the on-chip microtoroid coupling with free standing microtoroid scheme, the on-chip
microtoroid is fabricated with the same method as the above scheme, whereas the free-standing
microtoroid is formed with steps as shown in Fig.3.3b. The free-standing microtoroid is first
processed with pillar etching making it easy to be detached from the chip. Then a head-polished
fiber tip with tip head much smaller than the microtoroid’s major diameter is used to pick up the
pillar detached microtoroid. To firmly attach the microtoroid without pillar to the fiber stem, a small
amount of optical UV glue is applied to the fiber tip. And after the successful detaching of the
microtoroid, the glue is fast cured to bond the fiber stem with the microtoroid firmly.
Figure3.3 Fabrication flow of free-standing microsphere and free standing microtoroid resonators.
Another scheme to form the coupled microtoroid photonic molecule is achieved by fabricating each
of the resonators at the edge of a different chip and by controlling the separation between chips by
using nano positioning systems on which the chips are placed [89].
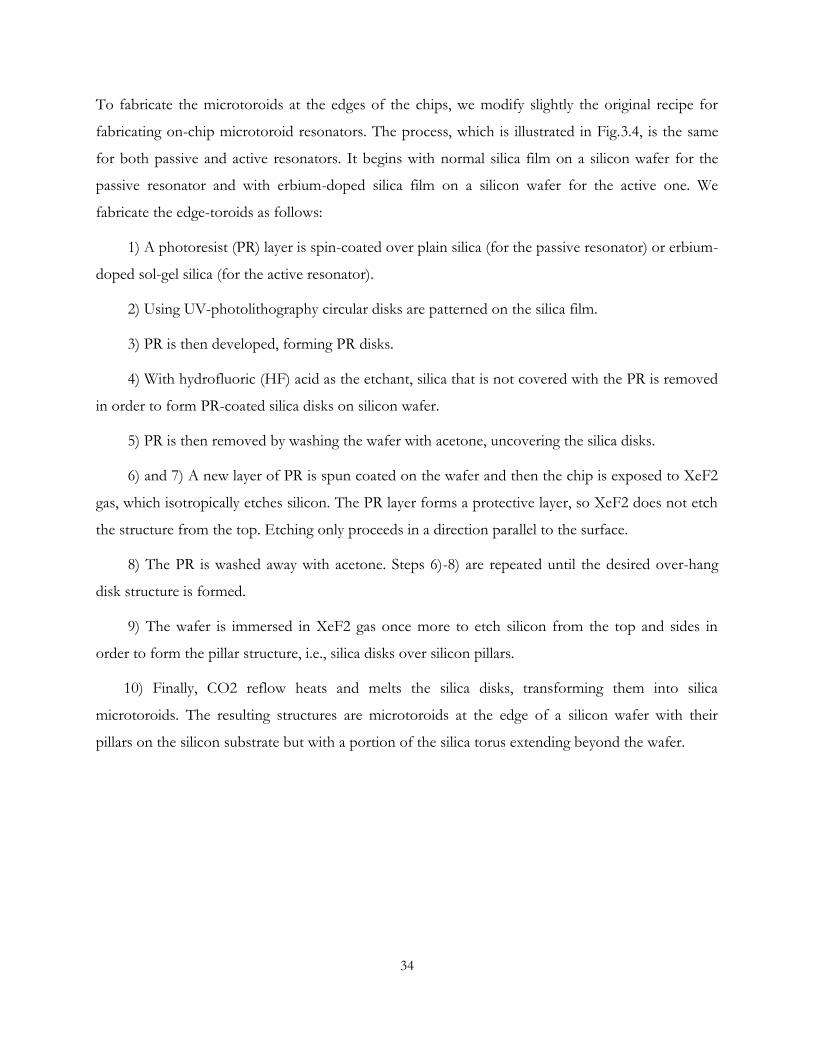
34
To fabricate the microtoroids at the edges of the chips, we modify slightly the original recipe for
fabricating on-chip microtoroid resonators. The process, which is illustrated in Fig.3.4, is the same
for both passive and active resonators. It begins with normal silica film on a silicon wafer for the
passive resonator and with erbium-doped silica film on a silicon wafer for the active one. We
fabricate the edge-toroids as follows:
1) A photoresist (PR) layer is spin-coated over plain silica (for the passive resonator) or erbium-
doped sol-gel silica (for the active resonator).
2) Using UV-photolithography circular disks are patterned on the silica film.
3) PR is then developed, forming PR disks.
4) With hydrofluoric (HF) acid as the etchant, silica that is not covered with the PR is removed
in order to form PR-coated silica disks on silicon wafer.
5) PR is then removed by washing the wafer with acetone, uncovering the silica disks.
6) and 7) A new layer of PR is spun coated on the wafer and then the chip is exposed to XeF2
gas, which isotropically etches silicon. The PR layer forms a protective layer, so XeF2 does not etch
the structure from the top. Etching only proceeds in a direction parallel to the surface.
8) The PR is washed away with acetone. Steps 6)-8) are repeated until the desired over-hang
disk structure is formed.
9) The wafer is immersed in XeF2 gas once more to etch silicon from the top and sides in
order to form the pillar structure, i.e., silica disks over silicon pillars.
10) Finally, CO2 reflow heats and melts the silica disks, transforming them into silica
microtoroids. The resulting structures are microtoroids at the edge of a silicon wafer with their
pillars on the silicon substrate but with a portion of the silica torus extending beyond the wafer.
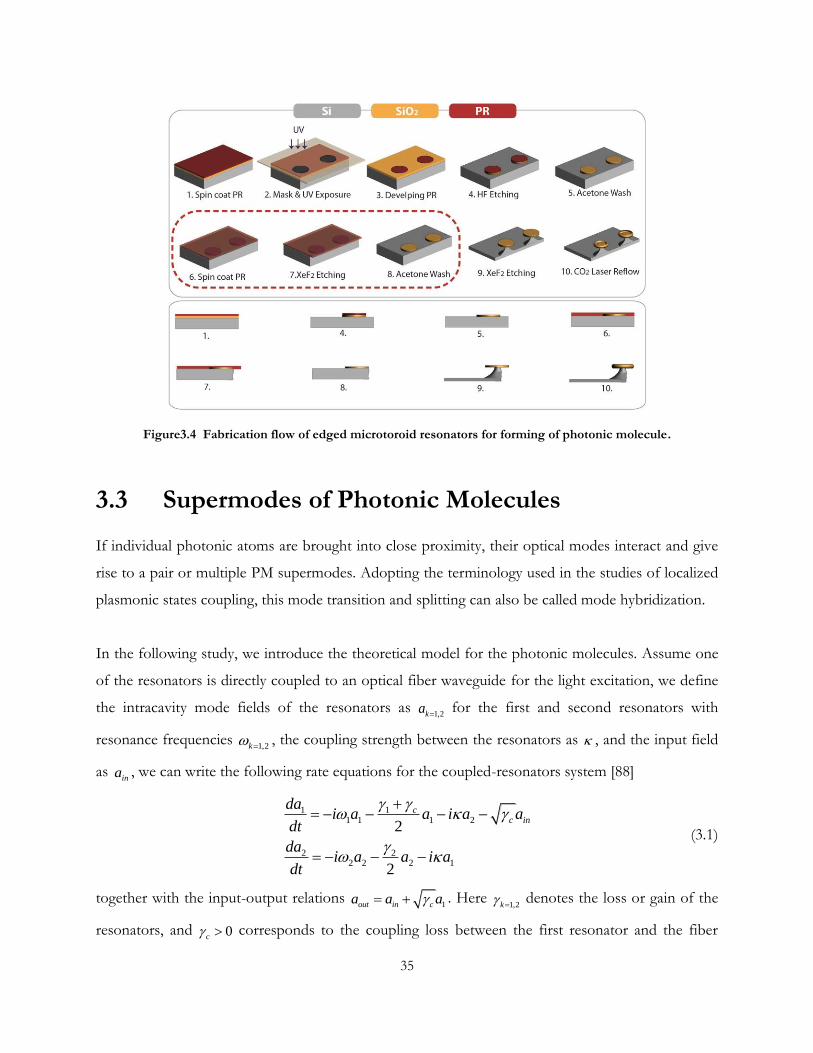
35
Figure3.4 Fabrication flow of edged microtoroid resonators for forming of photonic molecule.
3.3 Supermodes of Photonic Molecules
If individual photonic atoms are brought into close proximity, their optical modes interact and give
rise to a pair or multiple PM supermodes. Adopting the terminology used in the studies of localized
plasmonic states coupling, this mode transition and splitting can also be called mode hybridization.
In the following study, we introduce the theoretical model for the photonic molecules. Assume one
of the resonators is directly coupled to an optical fiber waveguide for the light excitation, we define
the intracavity mode fields of the resonators as 1,2ka
for the first and second resonators with
resonance frequencies 1,2k
, the coupling strength between the resonators as , and the input field
as ina , we can write the following rate equations for the coupled-resonators system [88]
111 1 1 2
2 22 2 2 1
2
2
cc in
dai a a i a a
dt
dai a a i a
dt
(3.1)
together with the input-output relations 1out in ca a a . Here
1,2k denotes the loss or gain of the
resonators, and 0c corresponds to the coupling loss between the first resonator and the fiber
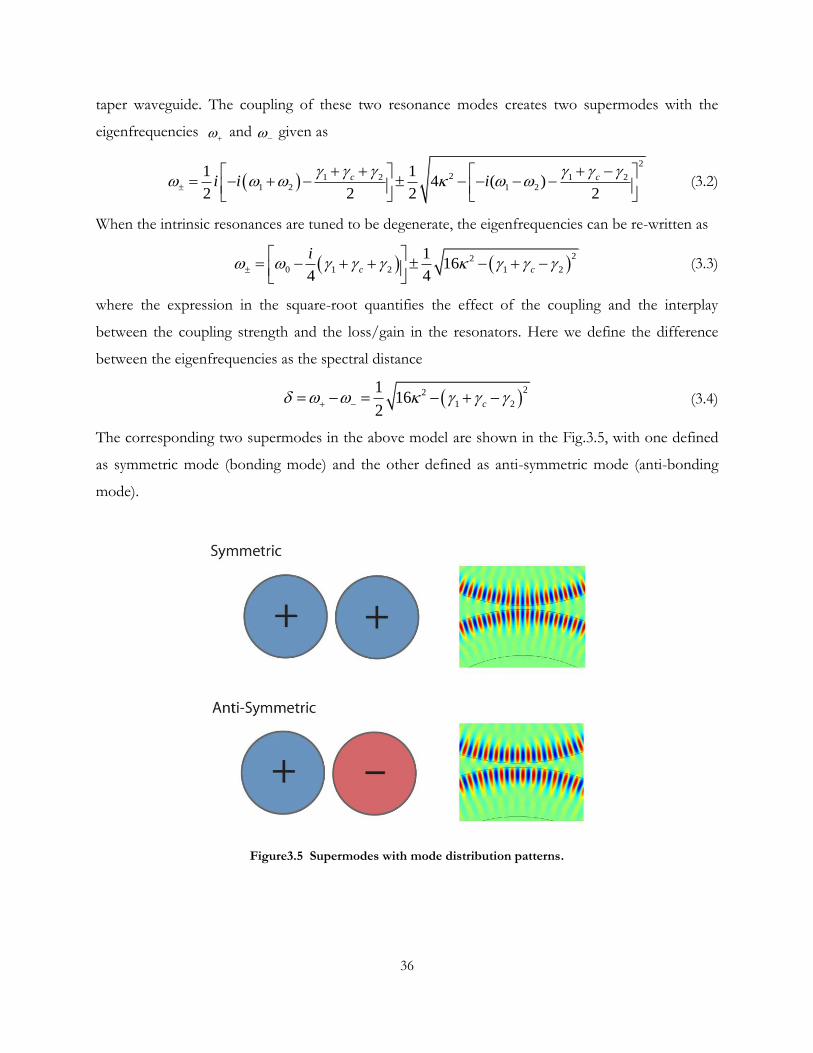
36
taper waveguide. The coupling of these two resonance modes creates two supermodes with the
eigenfrequencies and
given as
2
21 2 1 21 2 1 2
1 14 ( )
2 2 2 2
c ci i i
(3.2)
When the intrinsic resonances are tuned to be degenerate, the eigenfrequencies can be re-written as
22
0 1 2 1 2
116
4 4c c
i
(3.3)
where the expression in the square-root quantifies the effect of the coupling and the interplay
between the coupling strength and the loss/gain in the resonators. Here we define the difference
between the eigenfrequencies as the spectral distance
22
1 2
116
2c (3.4)
The corresponding two supermodes in the above model are shown in the Fig.3.5, with one defined
as symmetric mode (bonding mode) and the other defined as anti-symmetric mode (anti-bonding
mode).
Figure3.5 Supermodes with mode distribution patterns.
37
3.4 Tuning Parameters
As presented in the theoretical model, the supermode evolution can be tuned by the inter-cavity
coupling strength and the intrinsic cavity resonance frequency detuning. In our investigation, the
tunability or tuning range of these two aspects of parameters are analyzed.
3.4.1 Inter-cavity Coupling Strength
In our experimental study as well as the simulation, we monitored the spectral change in the mode
splitting (difference between the resonance frequencies of the supermodes) as the distance between
the resonators is varied (Fig.3.6). From the experimentally obtained splitting and the simulation, we
estimated the value of using Eq. (3.4). The resultant relation between mode splitting and the distance
between the resonators is given in Fig.3.7 where we see that the coupling strength exponentially
decreases with increasing distance between the resonators. This result agrees with previous reports
in the literature.
Figure3.6 Supermodes splitting spectra. (a) The transmission spectra when the coupling strength is increased from bottom to top. (b) Mode splitting of the supermodes in the FEM simulation as the coupling gap is
increased.
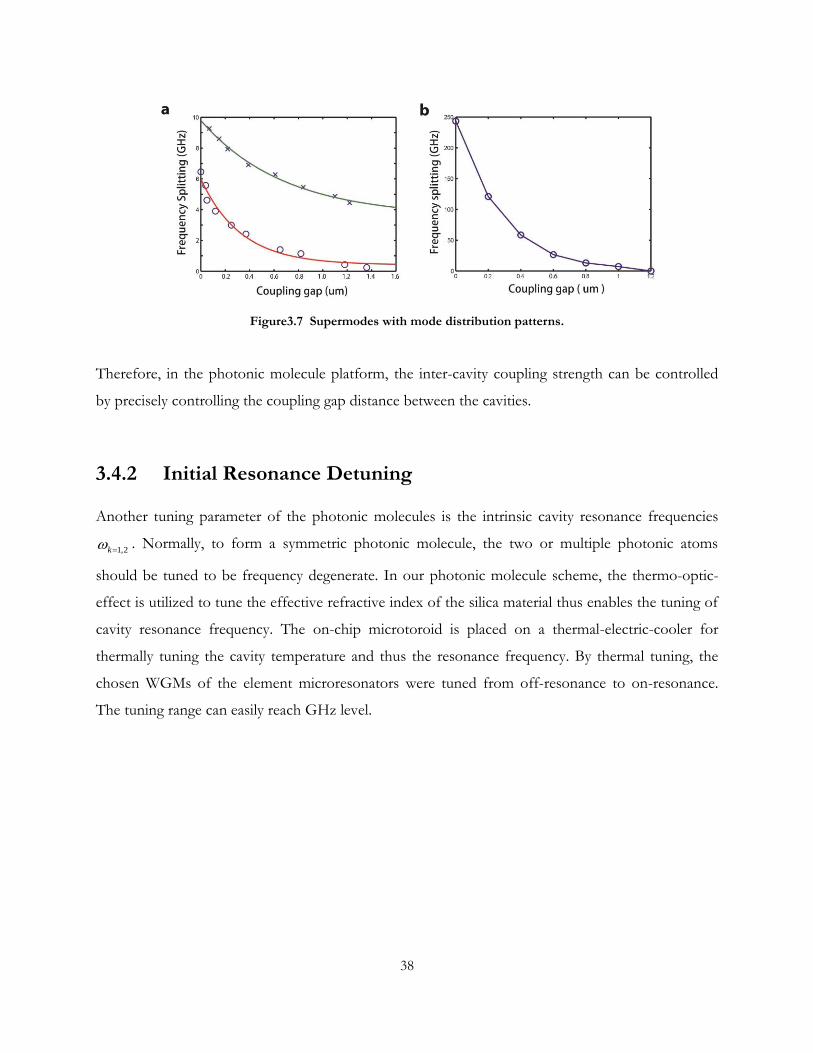
38
Figure3.7 Supermodes with mode distribution patterns.
Therefore, in the photonic molecule platform, the inter-cavity coupling strength can be controlled
by precisely controlling the coupling gap distance between the cavities.
3.4.2 Initial Resonance Detuning
Another tuning parameter of the photonic molecules is the intrinsic cavity resonance frequencies
1,2k . Normally, to form a symmetric photonic molecule, the two or multiple photonic atoms
should be tuned to be frequency degenerate. In our photonic molecule scheme, the thermo-optic-
effect is utilized to tune the effective refractive index of the silica material thus enables the tuning of
cavity resonance frequency. The on-chip microtoroid is placed on a thermal-electric-cooler for
thermally tuning the cavity temperature and thus the resonance frequency. By thermal tuning, the
chosen WGMs of the element microresonators were tuned from off-resonance to on-resonance.
The tuning range can easily reach GHz level.
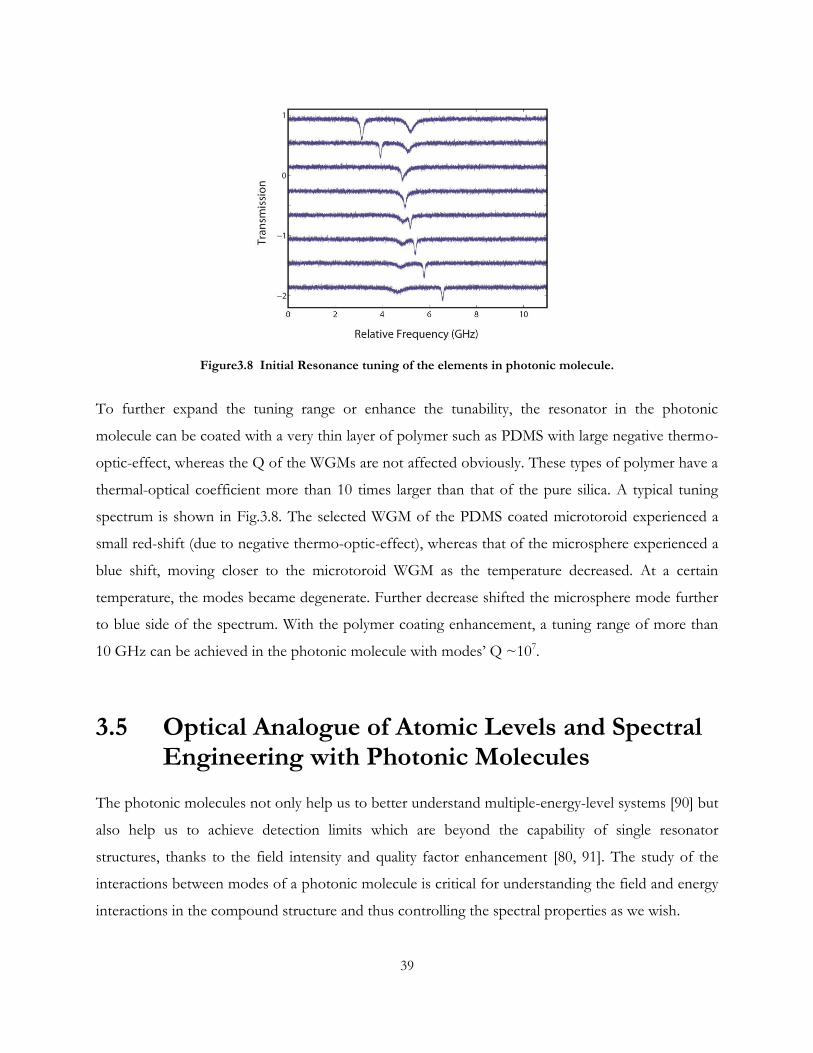
39
Figure3.8 Initial Resonance tuning of the elements in photonic molecule.
To further expand the tuning range or enhance the tunability, the resonator in the photonic
molecule can be coated with a very thin layer of polymer such as PDMS with large negative thermo-
optic-effect, whereas the Q of the WGMs are not affected obviously. These types of polymer have a
thermal-optical coefficient more than 10 times larger than that of the pure silica. A typical tuning
spectrum is shown in Fig.3.8. The selected WGM of the PDMS coated microtoroid experienced a
small red-shift (due to negative thermo-optic-effect), whereas that of the microsphere experienced a
blue shift, moving closer to the microtoroid WGM as the temperature decreased. At a certain
temperature, the modes became degenerate. Further decrease shifted the microsphere mode further
to blue side of the spectrum. With the polymer coating enhancement, a tuning range of more than
10 GHz can be achieved in the photonic molecule with modes’ Q ~107.
3.5 Optical Analogue of Atomic Levels and Spectral Engineering with Photonic Molecules
The photonic molecules not only help us to better understand multiple-energy-level systems [90] but
also help us to achieve detection limits which are beyond the capability of single resonator
structures, thanks to the field intensity and quality factor enhancement [80, 91]. The study of the
interactions between modes of a photonic molecule is critical for understanding the field and energy
interactions in the compound structure and thus controlling the spectral properties as we wish.

40
3.5.1 Formation of Multi-level System
In the optical resonance system, an optical resonance mode is an analogue to an atomic two level
transition. As demonstrated in previous chapter, the nanoscatterer can be utilized to induce the
resonance splitting of the optical modes [64, 68]. Therefore, it is an effective way to manipulate the
simulation of multi-level energy transition system. As presented in Fig.3.9, the non-degenerate
splitting modes in the optical resonance system are tuned as the nanoscatterer size is continuously
varied. A clear mode-anti-crossing is observed where the two modes approach to each other in the
beginning, but repel with each other as the size of the nanoscatterer is further varied.
Figure3.9 Formation of atomic two level with nanoparticle perturbation. (a) Intensity graph of the energy level evolution, (b) Spectra of the energy level evolution.
Another method to realize the analogue of multi-level energy transition system is the configuration
with coupled cavities in photonic molecule. As shown in Fig.3.10, in the coupled microtoroid
photonic molecule, the spatially tuned photonic molecule supermodes form the non-degenerate two
levels. The energy difference between these two levels is controlled by the inter-cavity coupling
strength in the photonic molecule.

41
Figure3.10 Formation of atomic multi-levels with supermodes from photonic molecule inter-cavity coupling.
3.5.2 Energy Levels Tuning and Spectral Engineering
With the combination of nanoscatterer induced multi-level formation and the photonic molecule
mode splitting, even finer multi-level analogue system and the spectral engineering with it can be
achieved. In our study, the system is built on coupled-microtoroid photonic molecule with a silica
nanotip working as the nanoscatterer on one of the microtoroid in the photonic molecule. As the
tuning parameters are manipulated, including the inter-cavity coupling strength and the intrinsic
cavity resonance detuning, the evolution of multi levels in the system can be monitored accordingly.
Interesting phenomena including energy splitting, frequency anti-crossing and linewidth crossing are
observed clearly [92].
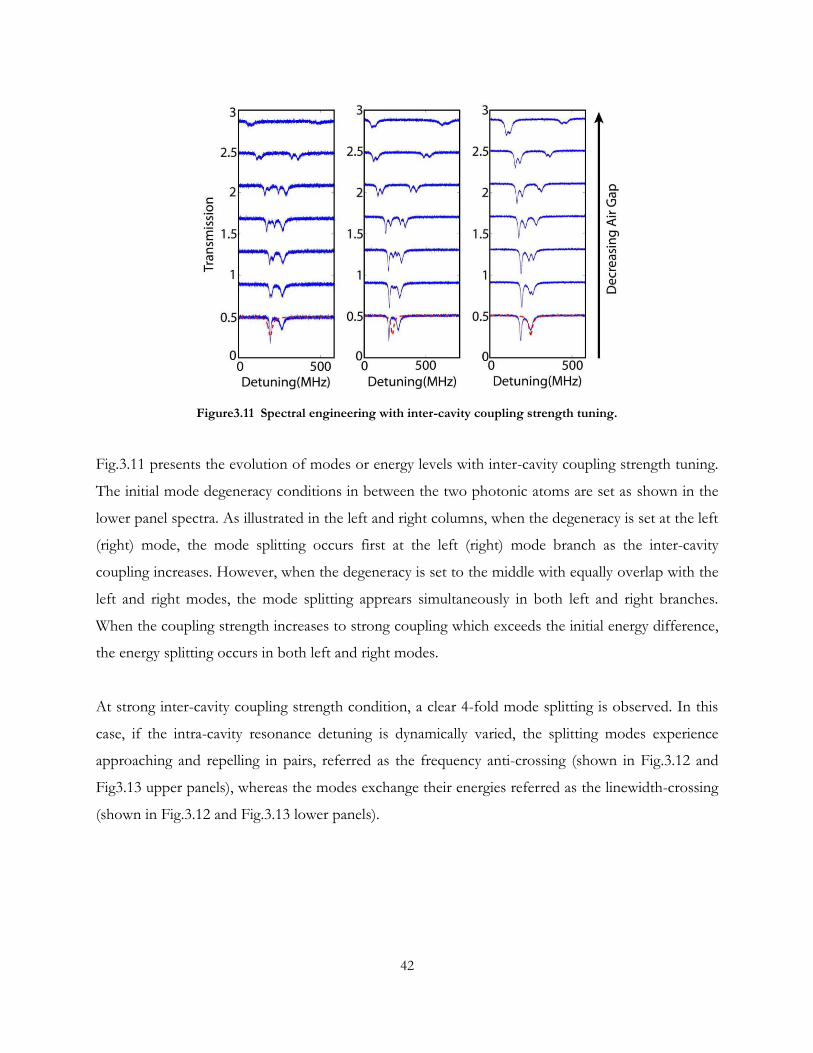
42
Figure3.11 Spectral engineering with inter-cavity coupling strength tuning.
Fig.3.11 presents the evolution of modes or energy levels with inter-cavity coupling strength tuning.
The initial mode degeneracy conditions in between the two photonic atoms are set as shown in the
lower panel spectra. As illustrated in the left and right columns, when the degeneracy is set at the left
(right) mode, the mode splitting occurs first at the left (right) mode branch as the inter-cavity
coupling increases. However, when the degeneracy is set to the middle with equally overlap with the
left and right modes, the mode splitting apprears simultaneously in both left and right branches.
When the coupling strength increases to strong coupling which exceeds the initial energy difference,
the energy splitting occurs in both left and right modes.
At strong inter-cavity coupling strength condition, a clear 4-fold mode splitting is observed. In this
case, if the intra-cavity resonance detuning is dynamically varied, the splitting modes experience
approaching and repelling in pairs, referred as the frequency anti-crossing (shown in Fig.3.12 and
Fig3.13 upper panels), whereas the modes exchange their energies referred as the linewidth-crossing
(shown in Fig.3.12 and Fig.3.13 lower panels).

43
Figure3.12 Theoretical spectral engineering with intra-cavity resonance detuning varied at strong inter-cavity
coupling condition.
Figure3.13 Experimentally obtained spectral engineering with intra-cavity resonance detuning varied at strong
inter-cavity coupling condition.
On the other hand, at weak inter-cavity coupling strength condition, a 3-fold mode splitting is
observed, in which the interaction between modes in different photonic atoms occurs successively.
Therefore for this case, if the intra-cavity resonance detuning is dynamically varied, the splitting
modes also experience approaching and repelling successively, referred as the frequency anti-
crossing (shown in Fig.3.14 and Fig.3.15 upper panels), whereas the modes exchange their energies
referred as the linewidth-crossing (shown in Fig.3.14 and Fig.3.15 lower panels). Specifically, in the
deep detuning regime, the inter-cavity coupling induced mode splitting becomes too small which can
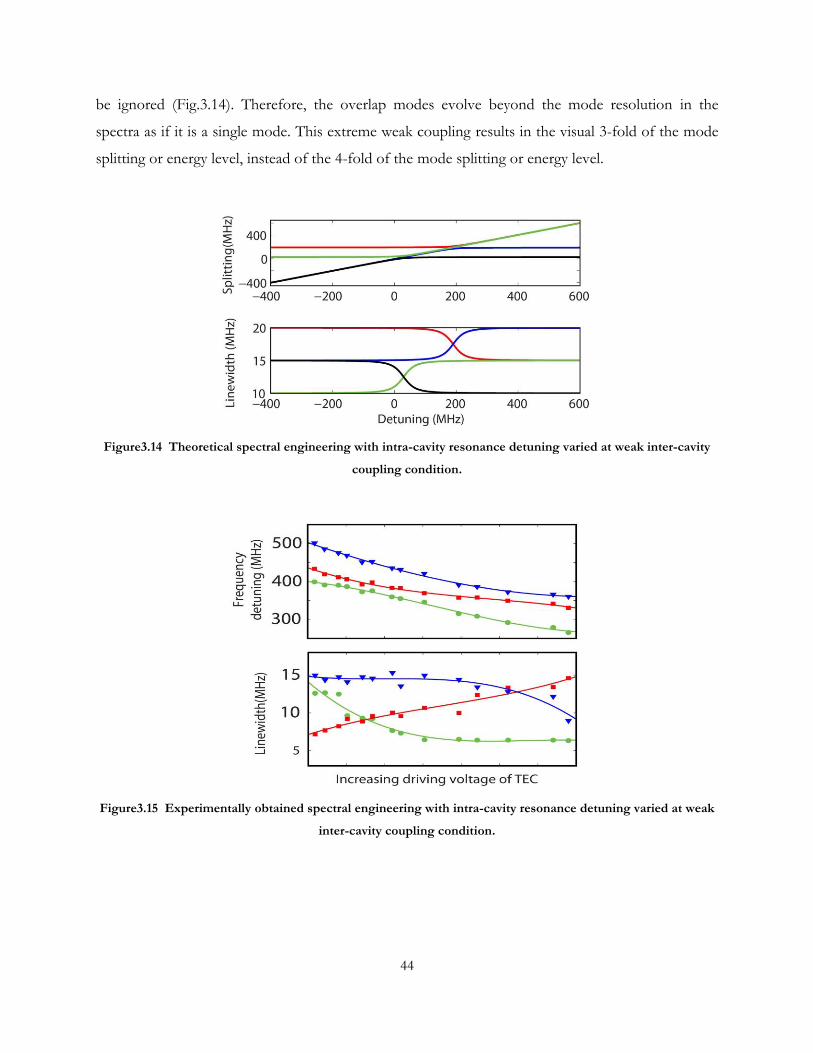
44
be ignored (Fig.3.14). Therefore, the overlap modes evolve beyond the mode resolution in the
spectra as if it is a single mode. This extreme weak coupling results in the visual 3-fold of the mode
splitting or energy level, instead of the 4-fold of the mode splitting or energy level.
Figure3.14 Theoretical spectral engineering with intra-cavity resonance detuning varied at weak inter-cavity
coupling condition.
Figure3.15 Experimentally obtained spectral engineering with intra-cavity resonance detuning varied at weak
inter-cavity coupling condition.
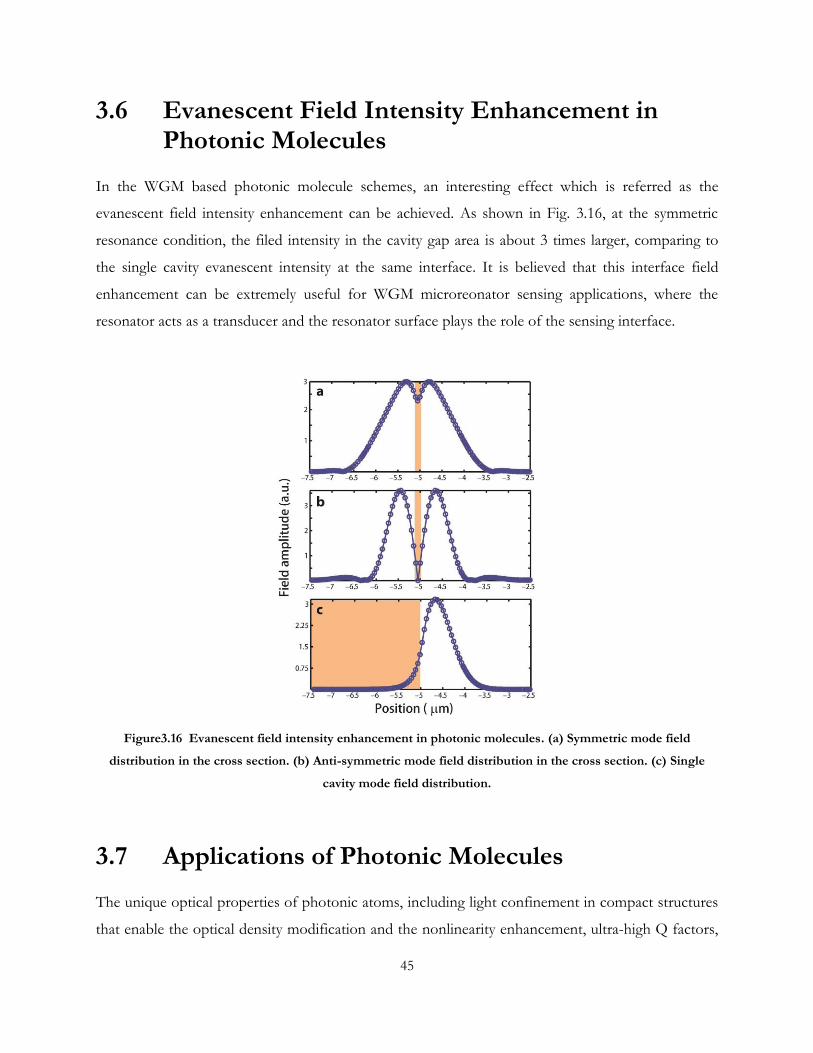
45
3.6 Evanescent Field Intensity Enhancement in Photonic Molecules
In the WGM based photonic molecule schemes, an interesting effect which is referred as the
evanescent field intensity enhancement can be achieved. As shown in Fig. 3.16, at the symmetric
resonance condition, the filed intensity in the cavity gap area is about 3 times larger, comparing to
the single cavity evanescent intensity at the same interface. It is believed that this interface field
enhancement can be extremely useful for WGM microreonator sensing applications, where the
resonator acts as a transducer and the resonator surface plays the role of the sensing interface.
Figure3.16 Evanescent field intensity enhancement in photonic molecules. (a) Symmetric mode field
distribution in the cross section. (b) Anti-symmetric mode field distribution in the cross section. (c) Single
cavity mode field distribution.
3.7 Applications of Photonic Molecules
The unique optical properties of photonic atoms, including light confinement in compact structures
that enable the optical density modification and the nonlinearity enhancement, ultra-high Q factors,
46
and ultra-high sensitivity make them attractive platforms for a variety of applications in quantum
physics simulation, information processing, micro laser manipulation and biochemical sensing.
Mechanical tunability and design flexibility and other advantages of photonic molecules not only
improve the above advantages of photonic atoms but also add new functionalities to microcavity-
based optical device development. PMs have been successfully demonstrated in the field of sensing
as optical transducers for high-sensitivity stress [93], rotation [94-96], and refractive index [97,98]
measurements. Lineshape- and bandwidth-tuning capabilities of PMs drive their applications as
optical filter and switch [99-103] and also improve sensitivity of PM-based sensors [91,104].
Furthermore, the optical interactions between photonic atoms can be tuned to enhance selected
modes in PMs and to shape their angular emission profiles [105], paving the way to achieving low-
threshold single-mode microlasers with high collection efficiency. Also, it was discovered that PMs
can also serve as simulators of quantum many-body physics, yielding unique insights into new
physical regimes in quantum optics and promising applications in quantum information [106].
Among the most promising potential applications of PMs in integrated optics, signal processing and
quantum cryptography is engineering of single-mode high-power microlasers and single photon
sources. A single-mode micro-laser can be engineered by optimally coupling two size-mismatched
photonic atoms to yield selective enhancement of a single optical mode [107].
On the other hand, tunable dual- (or multiple-) wavelength laser sources based on PMs are desirable
in several applications. Two-wavelength laser emission has been successfully demonstrated in
various types of vertical cavity surface emitting lasers (VCSELs) composed of two coupled
microcavities containing multiple quantum wells. It has also been shown that to achieve stable dual-
frequency lasing in such double-cavity sandwiches it is enough to pump only one of the cavities,
whose emission then acts as an optical pump for the quantum wells in the other cavity. Coupling-
induced splitting of the cavity optical modes in multi-atom photonic molecules leads to the
appearance of multiple peaks in their lasing spectra.
A possibility of manipulating the spectral response of PMs by tuning the inter-cavity coupling
strength also facilitated their application as multi-functional components for all-optical on-chip
networks. By adapting the microwave circuit design principles, higher-order band-pass and add-drop
filters can be engineered with cascaded WGM resonators.
47
Furthermore, the shapes of the transmission characteristics of the PMs are very sensitive to the
detuning of any of the cavities in the PMs, making them attractive candidates for designing optical
switches, routers, and tunable delay lines. For example, high-bandwidth optical data streams can be
dynamically routed on the optical chip by tuning one or more microcavities in the cascaded high-
order filter configuration out of resonance [108].
It should finally be noted that dynamical intensity switching between different parts of PMs can be
utilized to coherently transfer excitation between quantum dots (QD) [109] or quantum wells (QW)
[110] embedded in different cavities. Controllable interaction between bonding and anti-bonding
PM supermodes and degenerate QW exciton states confined in separate cavities enables coupling
between excitons over very large macroscopic distances. Overall, the possibility to selectively address
individual cavities in the PM structures doped with atoms or containing quantum wells/dots makes
them very attractive platforms for simulating complex behavior of strongly-correlated solid-state
systems. Controllable interaction of PM modes with atoms or QDs also paves the way to
engineering devices for distributed quantum optical information processing. The spectrally
engineered PMs can also benefit the implementation of many other basic elements needed for
quantum information processing, including state transfer, entanglement generation and quantum
gate operations.
48
Chapter 4
Electromagnetically Induced Transparency and Autler-Townes Splitting in WGM Photonic Molecules
There has been an increasing interest in all-optical analogues of Electromagnetically-induced-
transparency (EIT) and Autler-Townes splitting (ATS). Despite the differences in their underlying
physics, both EIT and ATS are quantified by a transparency window in the absorption or
transmission spectrum, which often leads to confusion about its origin. While in EIT the
transparency window is a result of Fano interference among different transition pathways, in ATS it
is the result of strong field-driven interactions leading to the splitting of energy levels. Objectively
discerning whether an observed transparency-window is due to EIT or ATS is crucial for
applications and for clarifying the physics involved. In this chapter we study the EIT, Fano
Resonance, ATS and their characteristics. We demonstrate the pathways leading to EIT, Fano, and
ATS in coupled whispering-gallery-mode (WGM) resonators. Moreover, we demonstrate the
application of the Akaike Information Criterion discerning between all-optical analogues of EIT and
ATS, and clarifying the transition between them.
4.1 Introduction to EIT and Fano Resonance
4.1.1 Definition and Basic Properties of EIT
Electromagnetically induced transparency (EIT) is a coherent optical process which renders a
medium transparent over a narrow spectral range within an absorption line. Meanwhile, extreme
dispersion is also created within this transparency. Basically it is a quantum interference effect that
permits the propagation of light through an otherwise opaque atomic medium [111-114].

49
Observation of EIT involves two optical fields (highly coherent light sources, such as lasers) which
are tuned to interact with three quantum states of a material. As shown in Fig.4.1, the probe field is
tuned near resonance between two of the states and characterizes the absorption spectrum of the
transition. A much stronger coupling field is introduced near resonance at a different transition. If
the states are selected properly, the presence of the coupling field will create a spectral window of
transparency on the probe spectra. As shown in the Fig.4.1a the weak probe normally experiences
absorption shown in blue. A second coupling beam induces EIT and creates a "window" in the
absorption region (red). The coupling laser is sometimes referred to as the control field. EIT is
based on the destructive interference of the transition probability amplitude between atomic states.
Also the well-known coherent population trapping (CPT) phenomena are losely related to EIT.
Figure4.1 The effect of EIT on a typical absorption line(a). Rapid change of index of refraction (blue) in a
region of rapidly changing absorption (gray) associated with EIT. The steep and positive linear region of the
refractive index in the center of the transparency window gives rise to slow light (b).
It is important to realize that EIT is the only diverse mechanisms which can produce slow light. The
Kramers–Kronig relations dictate that a change in absorption (or gain) over a narrow spectral range
must be accompanied by a change in refractive index over a similarly narrow region. As presented in
Fig.4.1b, this rapid and positive change in refractive index produces an extremely low group velocity.
The first experimental observation of the low group velocity produced by EIT was by Boller,
Imamoglu, and Harris at Stanford University in 1991 in strontium. The current record for slow light
in an EIT medium is held by Budker, Kimball, Rochester, and Yashchuk at U.C. Berkeley in 1999.
Group velocities as low as 8 m/s were measured in a warm thermal rubidium vapor [115].
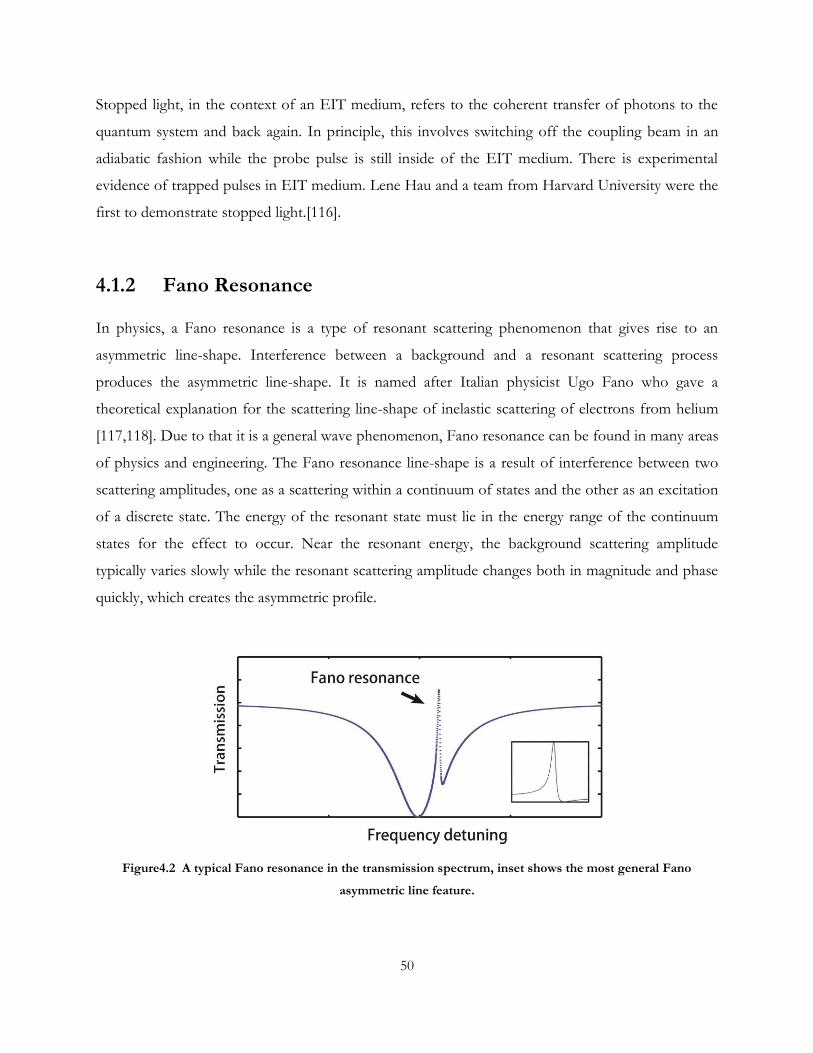
50
Stopped light, in the context of an EIT medium, refers to the coherent transfer of photons to the
quantum system and back again. In principle, this involves switching off the coupling beam in an
adiabatic fashion while the probe pulse is still inside of the EIT medium. There is experimental
evidence of trapped pulses in EIT medium. Lene Hau and a team from Harvard University were the
first to demonstrate stopped light.[116].
4.1.2 Fano Resonance
In physics, a Fano resonance is a type of resonant scattering phenomenon that gives rise to an
asymmetric line-shape. Interference between a background and a resonant scattering process
produces the asymmetric line-shape. It is named after Italian physicist Ugo Fano who gave a
theoretical explanation for the scattering line-shape of inelastic scattering of electrons from helium
[117,118]. Due to that it is a general wave phenomenon, Fano resonance can be found in many areas
of physics and engineering. The Fano resonance line-shape is a result of interference between two
scattering amplitudes, one as a scattering within a continuum of states and the other as an excitation
of a discrete state. The energy of the resonant state must lie in the energy range of the continuum
states for the effect to occur. Near the resonant energy, the background scattering amplitude
typically varies slowly while the resonant scattering amplitude changes both in magnitude and phase
quickly, which creates the asymmetric profile.
Figure4.2 A typical Fano resonance in the transmission spectrum, inset shows the most general Fano
asymmetric line feature.
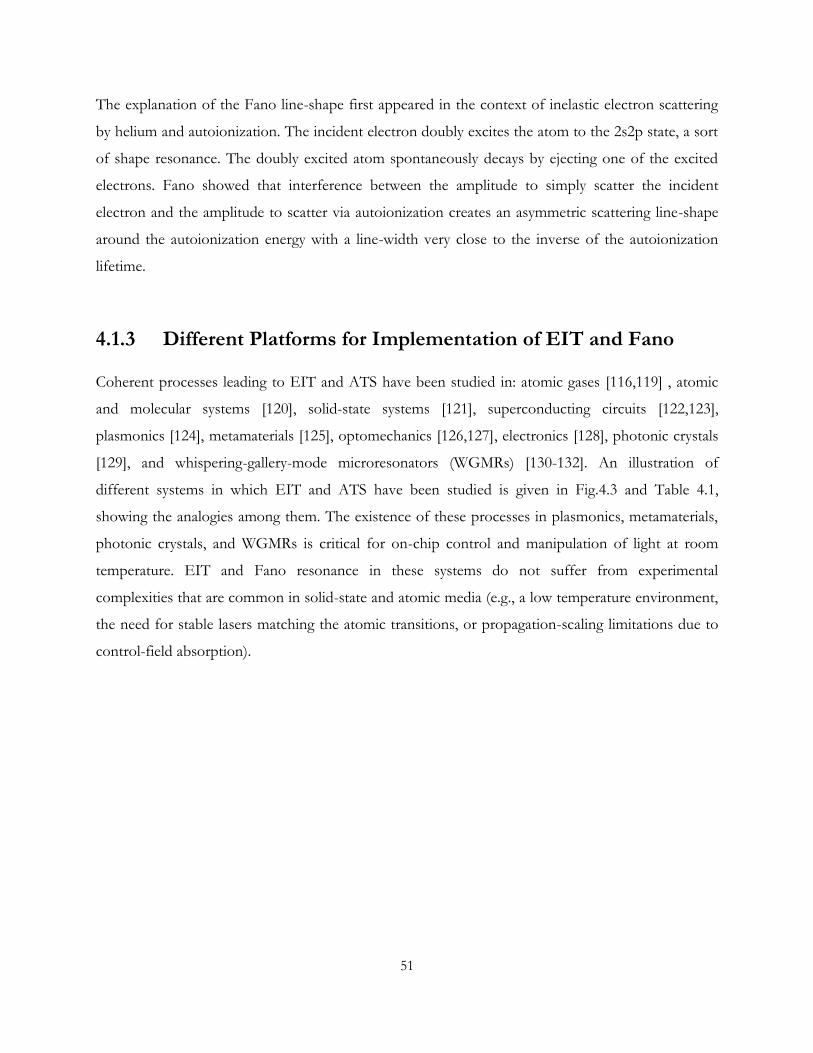
51
The explanation of the Fano line-shape first appeared in the context of inelastic electron scattering
by helium and autoionization. The incident electron doubly excites the atom to the 2s2p state, a sort
of shape resonance. The doubly excited atom spontaneously decays by ejecting one of the excited
electrons. Fano showed that interference between the amplitude to simply scatter the incident
electron and the amplitude to scatter via autoionization creates an asymmetric scattering line-shape
around the autoionization energy with a line-width very close to the inverse of the autoionization
lifetime.
4.1.3 Different Platforms for Implementation of EIT and Fano
Coherent processes leading to EIT and ATS have been studied in: atomic gases [116,119] , atomic
and molecular systems [120], solid-state systems [121], superconducting circuits [122,123],
plasmonics [124], metamaterials [125], optomechanics [126,127], electronics [128], photonic crystals
[129], and whispering-gallery-mode microresonators (WGMRs) [130-132]. An illustration of
different systems in which EIT and ATS have been studied is given in Fig.4.3 and Table 4.1,
showing the analogies among them. The existence of these processes in plasmonics, metamaterials,
photonic crystals, and WGMRs is critical for on-chip control and manipulation of light at room
temperature. EIT and Fano resonance in these systems do not suffer from experimental
complexities that are common in solid-state and atomic media (e.g., a low temperature environment,
the need for stable lasers matching the atomic transitions, or propagation-scaling limitations due to
control-field absorption).
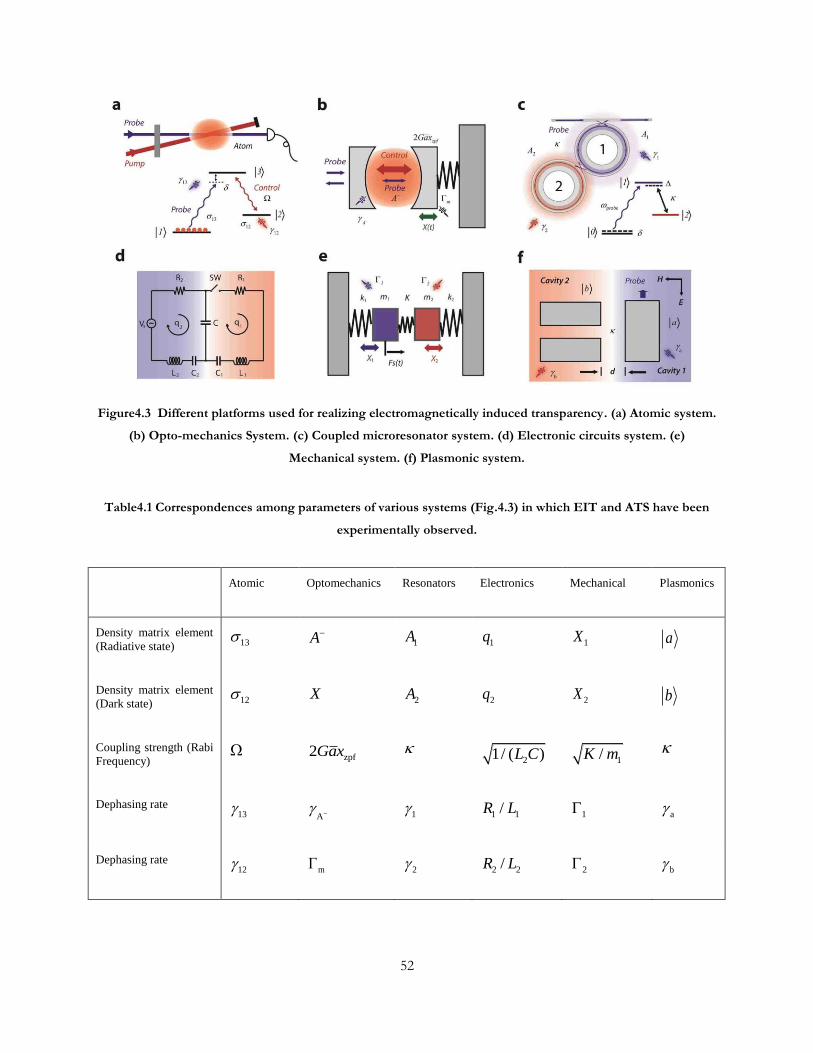
52
Figure4.3 Different platforms used for realizing electromagnetically induced transparency. (a) Atomic system.
(b) Opto-mechanics System. (c) Coupled microresonator system. (d) Electronic circuits system. (e)
Mechanical system. (f) Plasmonic system.
Table4.1 Correspondences among parameters of various systems (Fig.4.3) in which EIT and ATS have been
experimentally observed.
Atomic Optomechanics Resonators Electronics Mechanical Plasmonics
Density matrix element
(Radiative state)
13 A 1A 1q 1X a
Density matrix element
(Dark state) 12 X 2A 2q 2X b
Coupling strength (Rabi
Frequency)
zpf2Gax
21/ ( )L C 1/K m
Dephasing rate 13
A
1 1 1/R L 1 a
Dephasing rate 12 m 2 2 2/R L 2 b
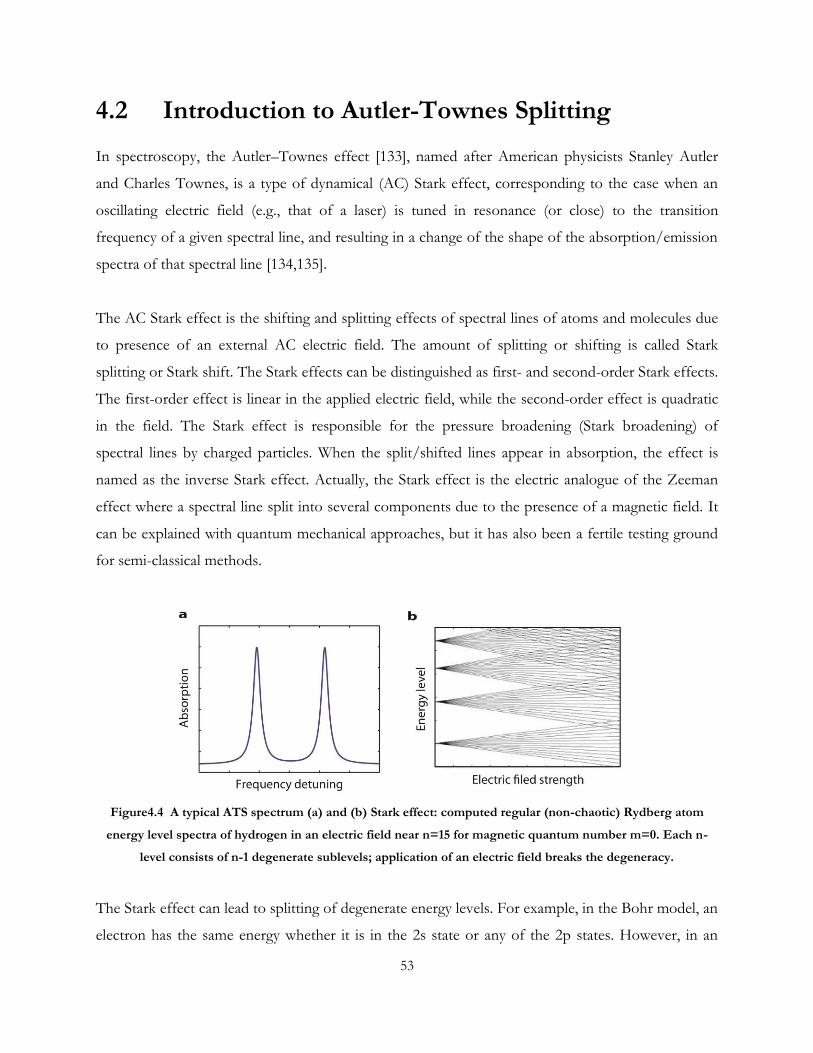
53
4.2 Introduction to Autler-Townes Splitting
In spectroscopy, the Autler–Townes effect [133], named after American physicists Stanley Autler
and Charles Townes, is a type of dynamical (AC) Stark effect, corresponding to the case when an
oscillating electric field (e.g., that of a laser) is tuned in resonance (or close) to the transition
frequency of a given spectral line, and resulting in a change of the shape of the absorption/emission
spectra of that spectral line [134,135].
The AC Stark effect is the shifting and splitting effects of spectral lines of atoms and molecules due
to presence of an external AC electric field. The amount of splitting or shifting is called Stark
splitting or Stark shift. The Stark effects can be distinguished as first- and second-order Stark effects.
The first-order effect is linear in the applied electric field, while the second-order effect is quadratic
in the field. The Stark effect is responsible for the pressure broadening (Stark broadening) of
spectral lines by charged particles. When the split/shifted lines appear in absorption, the effect is
named as the inverse Stark effect. Actually, the Stark effect is the electric analogue of the Zeeman
effect where a spectral line split into several components due to the presence of a magnetic field. It
can be explained with quantum mechanical approaches, but it has also been a fertile testing ground
for semi-classical methods.
Figure4.4 A typical ATS spectrum (a) and (b) Stark effect: computed regular (non-chaotic) Rydberg atom
energy level spectra of hydrogen in an electric field near n=15 for magnetic quantum number m=0. Each n-
level consists of n-1 degenerate sublevels; application of an electric field breaks the degeneracy.
The Stark effect can lead to splitting of degenerate energy levels. For example, in the Bohr model, an
electron has the same energy whether it is in the 2s state or any of the 2p states. However, in an
54
electric field, there will be hybrid orbitals (quantum superpositions) of the 2s and 2p states where the
electron tends to be to the left, which will acquire a lower energy, and other hybrid orbitals where
the electron tends to be to the right, which will acquire a higher energy. Therefore, the formerly
degenerate energy levels will split into slightly lower and slightly higher energy levels.
4.3 EIT and ATS in WGM Photonic Molecules
WGM photonic molecules have been a fruitful platform to study various aspects of classical and all-
optical analogues of EIT and ATS. Fano resonances and EIT have been observed in: two directly-
coupled silica microspheres two silicon microrings indirectly coupled via waveguides, and a system
of indirectly-coupled microdisk and microtoroid. In these EIT implementations, two WGMs of high
and low quality factors (Q) are coupled, having zero-detuning in their resonance frequencies, and
destructive interference of the optical pathways cancels the absorption leading to a narrow peak in
the transmission spectra. If a frequency detuning is introduced, the transmission spectra show sharp
asymmetric Fano resonances. ATS has been observed in: directly-coupled silica microspheres,
directly-coupled silica microtoroids, hybrid systems formed by directly coupling PDMS-coated silica
microtoroids with silica microtoroids or microspheres, and directly-coupled polyethylene and quartz
disks in THz domain. In these photonic molecule systems, ATS originates from the lifting of the
frequency-degeneracy of the eigenmodes, hence their splitting into two resonances, due to strong
inter-resonator coupling. The spectral region between the split modes corresponds to a transparency
window.
Our system consists of two directly-coupled silica microtoroidal WGM resonators μR1 and μR2,
with μR1 coupled to a fiber-taper. (Fig.4.3c) [136]. We fabricated photonic molecule by using the
edged fabricated silica microtoroids at the edges of two separate silicon wafers, as discussed in the
previous chapter. The wafers were placed on separate nanopositioning systems so that the distance
between the microtoroids was finely tuned to control the coupling strength between them. The
coupling strength decreases exponentially with increasing distance. The probe light in the 1550 nm
band from a narrow linewidth tunable laser was coupled into a WGM of μR1 via the fiber taper. The
same fiber taper was also used to couple out the light from the WGM. The output light was then
sent to a photodetector connected to an oscilloscope, to obtain the transmission spectra as the
55
wavelength of the input light was linearly scanned. Fiber-based polarization controllers were used to
set the polarization of the input light for maximal coupling into WGMs. A thermo-electric-cooler
was placed under one of the wafers so that resonance frequency of the WGM of interest in a
microtoroid could be tuned via the thermo-optic effect, to control the frequency detuning of the
chosen WGMs in the two microtoroids. A tuning range of 8 GHz was achieved. The microtoroids
supported many WGMs in the same band but with different quality factors Q, which is the signature
of the amount of loss or dissipation. This allowed us to investigate the effects of Q of the selected
modes on the Fano, EIT and ATS processes by choosing WGM-pairs with different Q-contrasts. In
addition to the ability of choosing different WGM-pairs, our set-up allowed us to investigate Fano,
EIT and ATS processes and the transitions among them by steering the system independently via
the coupling strength or the frequency detuning between the selected WGMs. In our experiment, we
selected three different sets of WGM pairs with the intrinsic quality factors 1 2,R RQ Q of
5 71.91 10 , 7.26 10 , 6 61.63 10 , 1.54 10 and 6 61.78 10 , 4.67 10 . Note that the intrinsic
Q includes all the losses (e.g., material, radiation, scattering) except the coupling losses, as discussed
in Chapter 2. Since the probe light is input at the μR1 side with a fiber taper, the Q of the μR1 is
smaller than the above intrinsic Q values due to the additional coupling losses (i.e., μR1 has more
loss than μR2).
Here we will elucidate the analogy between atomic and photonic coherence effects leading to EIT
and ATS. Using coupled-mode-theory, we find the equations of motion for the complex intracavity
field amplitudes 1A and 2A in the steady-state as
1 1 1 2 c p
2 2 2 1
/ 2
( / 2) 0
i A A i A
i A A
(4.1)
where 1 1 c and 2
denote the total losses in μR1 and μR2, respectively, 1 is the intrinsic loss
of μR1 and c is the coupling loss between the fiber-taper and μR1, 1 1 and 2 2
denote the detuning between the frequency of the probe light field pA and the resonance
frequencies 1 and 2 of the WGMs, and is the coupling strength between the WGMs. In the
EIT and ATS experiments we set 1 2 0 via the thermo-optic effect by thermally tuning the
56
frequency of one of the WGMs to be equal to the frequency of the other. Consequently, for the
degenerate frequencies 1 and 2 we have
2 1 0 , and in the rotated frame (0 0 ) we
have 1 2 . Also note that in the system depicted in Fig. 1b and Fig.2, the input and output
ports are at the side of μR1, hence the output field is given as out p c 1A A A where the intracavity
field 1A can be written as 1 c pA i A with
2
2
1 2
( )
( )( )
i
i i
(4.2)
where we used / 2k k ki , with 1,2k . This solution has a form similar to the response
of an EIT medium (three-level atom) to a probe field. Then, we can write the normalized
transmission 2
out p/T A A as
22
c c i1 2T (4.3)
where i is the imaginary part of . Since 22
c1 and 22
c c i we can re-write the
transmission as
c i1 2T (4.4)
Thus it is sufficient to analyze the behavior of i to understand the conditions leading to EIT or
ATS (Supplementary Note 1). This is similar to considering the imaginary part of the susceptibility
which determines the absorption of a probe in an atomic system. This analogy between the atomic
media and the coupled-WGMRs can be extended to other systems by using the analogy-map given
in Fig.4.3 and Table 4.1.
The eigenfrequencies of this coupled system can be found from the denominator of Eq. (4.2) and
are given as 1 2 / 2i i , with 22 2
1 24 . This reveals a transition at the
threshold coupling strength T 1 2 1 22 ( ) / 2 , where we have used the fact that in our
system 1 2 , as stated in the previous section. We define the regimes where T and T
as the weak- and strong-driving regimes, respectively, and T as the transition point. Using the
eigenfrequencies, we can re-write the expression in Eq.(4.2) as
57
(4.5)
where 2 / 1/ 2 /i i satisfying 1 and 1 2 / 4 .
4.3.1 EIT in Photonic Molecules
The EIT effect corresponds to the weak-driving regime ( T ). In this regime, is imaginary,
that is ii and rRe( ) 0 . This leads to a real (i.e, iIm 0 ) with
rRe 1/ 2 / , and imaginary eigenfrequencies with rRe 0 and
iIm / 2 , where 1 2 / 4 . Thus the supermodes have the same
resonance frequencies and are located at the center of the frequency axis, but have different
linewidths quantified by their imaginary parts. The imaginary parts of are then given by
i r i ri 2 2 2 2
i i
(4.6)
which consists of two Lorentzians centered at 0 with different signs (i.e, the first term in
Eq.(4.6) is negative whereas the second term is positive). The transmission in this regime becomes
i r i r 1 2EIT c i c 2 2 2 2 2 2 2 2
i i 1 2
1 2 1 2 1C C
T
(4.7)
where all the parameters whose values cannot be determined precisely are incorporated into the
coefficients kC and k that can be used as free parameters to perform curve-fitting to
experimentally-obtained transmission spectra. Clearly, the opposite signs of the Lorentzians lead to a
destructive interference which results in a transmission profile exhibiting a transparency window
similar to that of EIT, as shown in Fig.4.5.
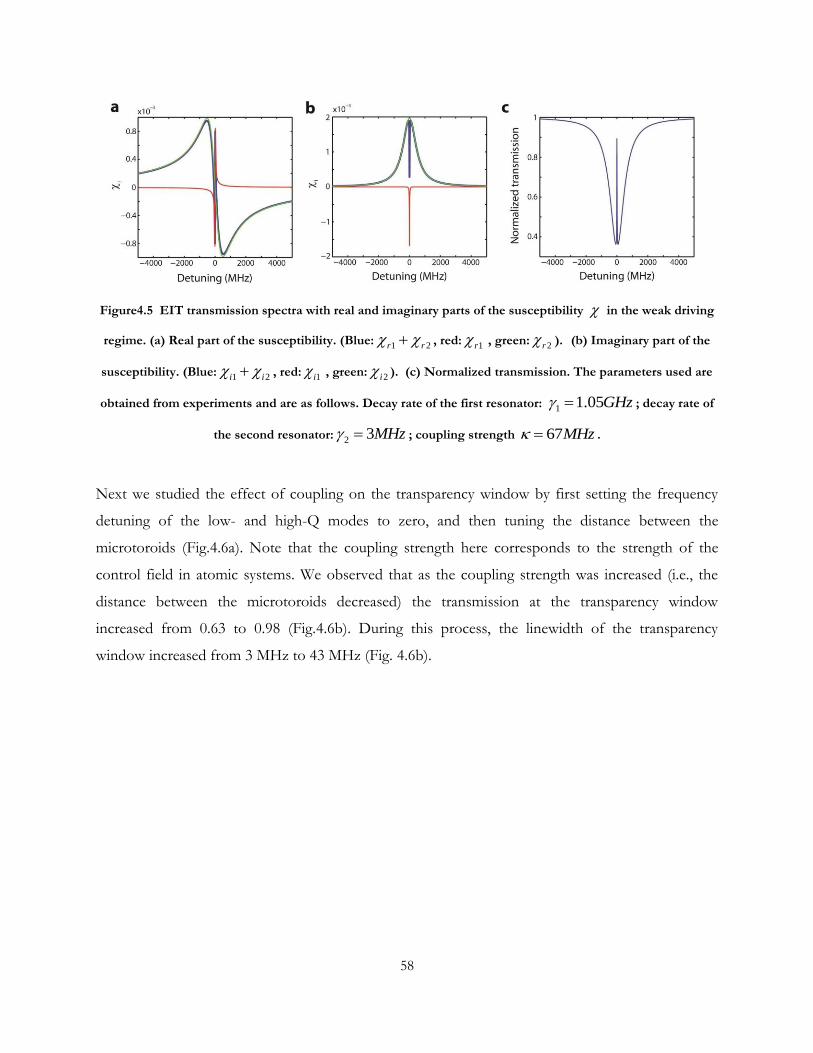
58
Figure4.5 EIT transmission spectra with real and imaginary parts of the susceptibility in the weak driving
regime. (a) Real part of the susceptibility. (Blue: 1 2r r , red: 1r , green: 2r ). (b) Imaginary part of the
susceptibility. (Blue: 1 2i i , red: 1i , green: 2i ). (c) Normalized transmission. The parameters used are
obtained from experiments and are as follows. Decay rate of the first resonator: 1 1.05GHz ; decay rate of
the second resonator: 2 3MHz ; coupling strength 67MHz .
Next we studied the effect of coupling on the transparency window by first setting the frequency
detuning of the low- and high-Q modes to zero, and then tuning the distance between the
microtoroids (Fig.4.6a). Note that the coupling strength here corresponds to the strength of the
control field in atomic systems. We observed that as the coupling strength was increased (i.e., the
distance between the microtoroids decreased) the transmission at the transparency window
increased from 0.63 to 0.98 (Fig.4.6b). During this process, the linewidth of the transparency
window increased from 3 MHz to 43 MHz (Fig. 4.6b).

59
Figure4.6 Electromagnetically induced transparency (EIT) in coupled WGM microcavities. (a) Effect of
coupling strength on the EIT spectra (i.e., zero detuning between resonance modes of the resonators). The
coupling strength (increasing from the bottom to the top curve) depends on the distance between the
resonators. (b) Effect of the coupling strength on the linewidth (red circles) and the peak transmission (blue
squares) of the transparency window. The curves are the best fit to the experimental data.
4.3.2 Fano Resonance in Photonic Molecules
Actually EIT is a result of strong Fano interferences at zero frequency detuning. The Fano
resonance takes place when a high-Q WGM of one microresonator is directly-coupled to a low-Q
WGM of a second microresonator with nonzero-detuning in their resonance frequencies. In order
to demonstrate this, we chose a low-Q mode in μR1 (5
μR1 1.91 10Q ) and a high-Q mode in μR2 (
7
μR2 7.26 10Q ). We then set the distance between the resonators such that the coupling strength
was smaller than the total loss of the system. At this point, we continuously tuned the frequency of
the high-Q mode in μR2 such that it approached to the frequency of the low-Q mode in μR1. As
the frequency-detuning between the modes gradually decreased, the modes became spectrally
overlapped. Consequently, we first observed an asymmetric Fano lineshape with the peak located
closer to the lower-detuning side (Fig.4.7, upper panels), and then a transparency window appeared
at zero-detuning 2 1 0 (Fig.4.7, middle panel). The linewidth of the transparency windows
was 5 MHz. The asymmetry of Fano resonances decreased as we approached to zero-detuning. As
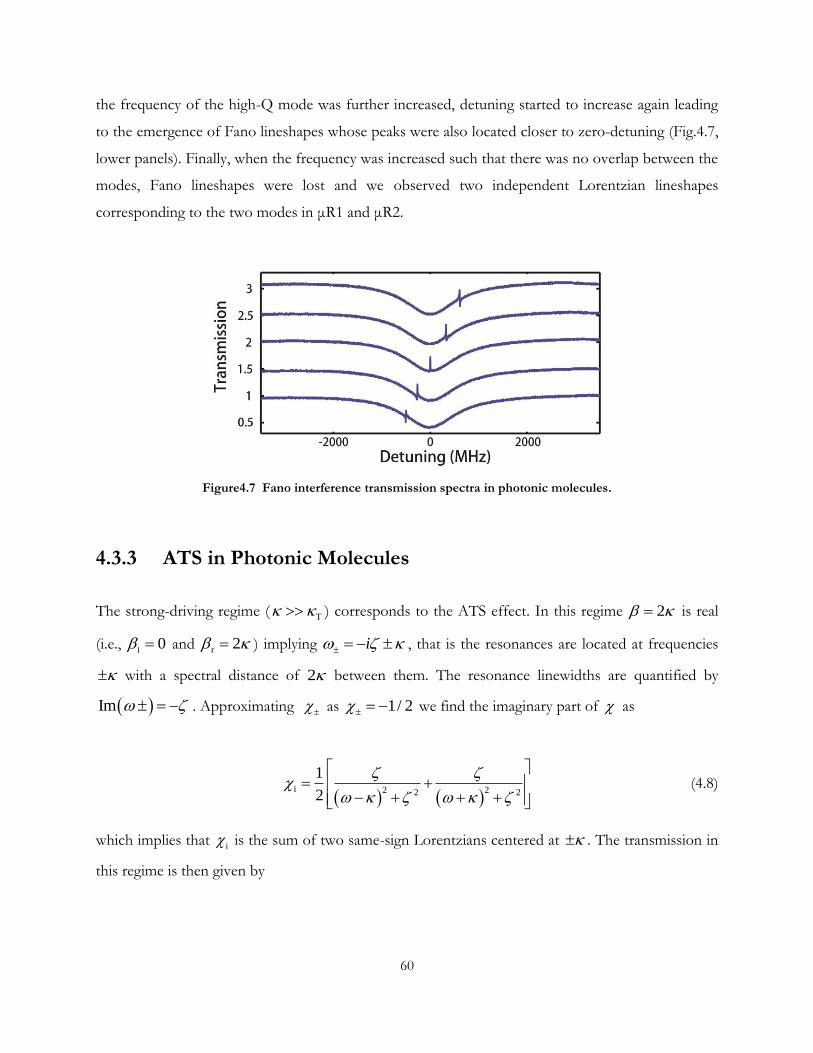
60
the frequency of the high-Q mode was further increased, detuning started to increase again leading
to the emergence of Fano lineshapes whose peaks were also located closer to zero-detuning (Fig.4.7,
lower panels). Finally, when the frequency was increased such that there was no overlap between the
modes, Fano lineshapes were lost and we observed two independent Lorentzian lineshapes
corresponding to the two modes in μR1 and μR2.
Figure4.7 Fano interference transmission spectra in photonic molecules.
4.3.3 ATS in Photonic Molecules
The strong-driving regime ( T ) corresponds to the ATS effect. In this regime 2 is real
(i.e., i 0 and r 2 ) implying i , that is the resonances are located at frequencies
with a spectral distance of 2 between them. The resonance linewidths are quantified by
Im . Approximating as 1/ 2 we find the imaginary part of as
i 2 22 2
1
2
(4.8)
which implies that i is the sum of two same-sign Lorentzians centered at . The transmission in
this regime is then given by
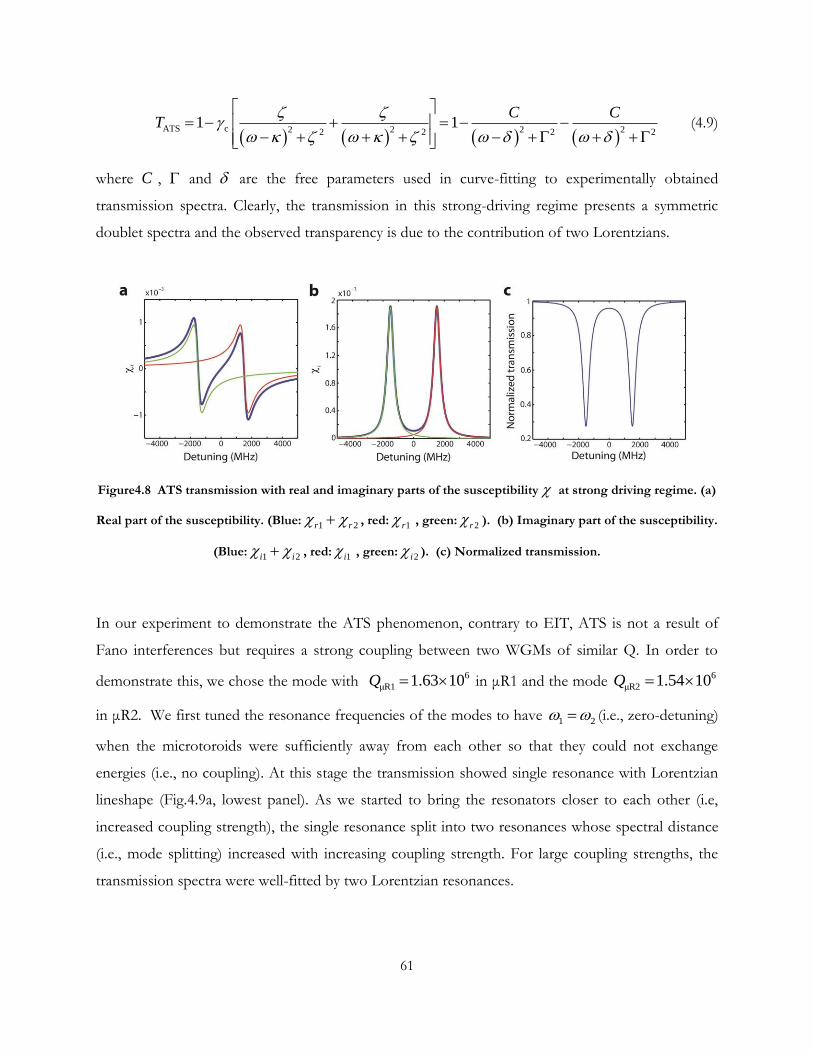
61
ATS c 2 2 2 22 2 2 21 1
C CT
(4.9)
where C , and are the free parameters used in curve-fitting to experimentally obtained
transmission spectra. Clearly, the transmission in this strong-driving regime presents a symmetric
doublet spectra and the observed transparency is due to the contribution of two Lorentzians.
Figure4.8 ATS transmission with real and imaginary parts of the susceptibility at strong driving regime. (a)
Real part of the susceptibility. (Blue: 1 2r r , red: 1r , green: 2r ). (b) Imaginary part of the susceptibility.
(Blue: 1 2i i , red: 1i , green: 2i ). (c) Normalized transmission.
In our experiment to demonstrate the ATS phenomenon, contrary to EIT, ATS is not a result of
Fano interferences but requires a strong coupling between two WGMs of similar Q. In order to
demonstrate this, we chose the mode with 6
μR1 1.63 10Q in μR1 and the mode 6
μR2 1.54 10Q
in μR2. We first tuned the resonance frequencies of the modes to have 1 2 (i.e., zero-detuning)
when the microtoroids were sufficiently away from each other so that they could not exchange
energies (i.e., no coupling). At this stage the transmission showed single resonance with Lorentzian
lineshape (Fig.4.9a, lowest panel). As we started to bring the resonators closer to each other (i.e,
increased coupling strength), the single resonance split into two resonances whose spectral distance
(i.e., mode splitting) increased with increasing coupling strength. For large coupling strengths, the
transmission spectra were well-fitted by two Lorentzian resonances.
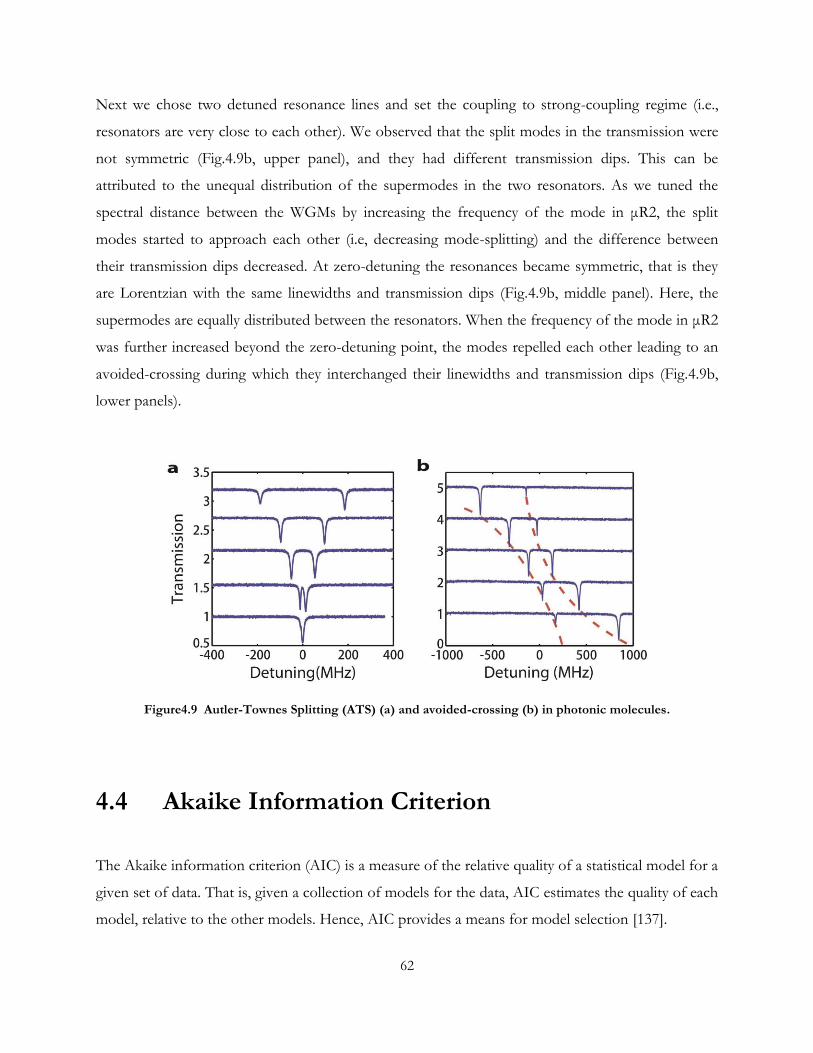
62
Next we chose two detuned resonance lines and set the coupling to strong-coupling regime (i.e.,
resonators are very close to each other). We observed that the split modes in the transmission were
not symmetric (Fig.4.9b, upper panel), and they had different transmission dips. This can be
attributed to the unequal distribution of the supermodes in the two resonators. As we tuned the
spectral distance between the WGMs by increasing the frequency of the mode in μR2, the split
modes started to approach each other (i.e, decreasing mode-splitting) and the difference between
their transmission dips decreased. At zero-detuning the resonances became symmetric, that is they
are Lorentzian with the same linewidths and transmission dips (Fig.4.9b, middle panel). Here, the
supermodes are equally distributed between the resonators. When the frequency of the mode in μR2
was further increased beyond the zero-detuning point, the modes repelled each other leading to an
avoided-crossing during which they interchanged their linewidths and transmission dips (Fig.4.9b,
lower panels).
Figure4.9 Autler-Townes Splitting (ATS) (a) and avoided-crossing (b) in photonic molecules.
4.4 Akaike Information Criterion
The Akaike information criterion (AIC) is a measure of the relative quality of a statistical model for a
given set of data. That is, given a collection of models for the data, AIC estimates the quality of each
model, relative to the other models. Hence, AIC provides a means for model selection [137].
63
AIC is founded on information theory: it offers a relative estimate of the information lost when a
given model is used to represent the process that generates the data. In doing so, it deals with the
trade-off between the goodness of fit of the model and the complexity of the model. Suppose that
we have a statistical model of some data. Let L be the maximized value of the likelihood function
for the model; let k be the number of parameters in the model (i.e. k is the number of degrees of
freedom). Then the AIC value is as follows.
2 2log( )AIC k L (4.10)
Given a set of candidate models for the data, the preferred model is the one with the minimum AIC
value. Hence AIC rewards goodness of fit (as assessed by the likelihood function), but it also
includes a penalty that is an increasing function of the number of estimated parameters. The penalty
discourages overfitting (increasing the number of parameters in the model almost always improves
the goodness of the fit).
Suppose that the data is generated by some unknown process f. We consider two candidate models
to represent f: g1 and g2. If we knew f, then we could find the information lost from using g1 to
represent f by calculating the Kullback–Leibler divergence as well as the information lost from
using g2 to represent f by calculating DKL. We would then choose the candidate model that
minimized the information loss. We cannot choose with certainty, because we do not know f.
Akaike (1974) showed, however, that we can estimate, via AIC, how much more (or less)
information is lost by g1 than by g2. The estimate, though, is only valid asymptotically; if the
number of data points is small, then some correction is often necessary.
4.4.1 Maximum Likelihood and AIC Values
In statistics, maximum-likelihood estimation (MLE) is a method of estimating the parameters of a
statistical model. When applied to a data set and given a statistical model, maximum-likelihood
estimation provides estimates for the model's parameters.
The method of maximum likelihood corresponds to many well-known estimation methods in
statistics. For example, one may be interested in the heights of adult female monkey, but be unable
to measure the height of every single monkey in a population due to cost or time constraints.
64
Assuming that the heights are normally (Gaussian) distributed with some unknown mean and
variance, the mean and variance can be estimated with MLE while only knowing the heights of some
sample of the overall population. MLE would accomplish this by taking the mean and variance as
parameters and finding particular parametric values that make the observed results the most
probable (given the model).
In general, for a fixed set of data and underlying statistical model, the method of maximum
likelihood selects the set of values of the model parameters that maximizes the likelihood function.
Intuitively, this maximizes the "agreement" of the selected model with the observed data, and for
discrete random variables it indeed maximizes the probability of the observed data under the
resulting distribution. Maximum-likelihood estimation gives a unified approach to estimation, which
is well-defined in the case of the normal distribution and many other problems. However, in some
complicated problems, difficulties do occur: in such problems, maximum-likelihood estimators are
unsuitable or do not exist.
Suppose there is a sample 1 2, ,..., nx x x of n independent and identically distributed observations,
coming from a distribution with an unknown probability density function 0 ( )f . It is however
surmised that the function 0f belongs to a certain family of distributions ( | ),f
(where is a vector of parameters for this family), called the parametric model, so
that 0 0( | )f f . The value 0 is unknown and is referred to as the true value of the parameter
vector. It is desirable to find an estimator which would be as close to the true value 0 as
possible. Either or both the observed variables ix and the parameter can be vectors.
To use the method of maximum likelihood, one first specifies the joint density function for all
observations. For an independent and identically distributed sample, this joint density function is
1 2 1 2( , ,..., | ) ( | ) ( | ) ( | ).n nf x x x f x f x f x (4.11)
Now we look at this function from a different perspective by considering the observed
values 1 2, ,..., nx x x to be fixed "parameters" of this function, whereas will be the function's
variable and allowed to vary freely; this function will be called the likelihood:

65
1 2 1 2
1
( ; , ,..., ) ( , ,..., | ) ( | ).n
n n i
i
L x x x f x x x f x
(4.12)
Note “;” denotes a separation between the two input arguments: and the vector-valued
input 1 2, ,..., nx x x .
In practice it is often more convenient to work with the logarithm of the likelihood function, called
the log-likelihood:
1 2
1
log ( ; , ,..., ) log ( | ).n
n i
i
L x x x f x
(4.13)
or the average log-likelihood:
1ˆ log Ln
(4.14)
The hat over indicates that it is akin to some estimator. Indeed, ˆ estimates the expected log-
likelihood of a single observation in the model.
Therefore, considering the spacific statistical model of some data, L which is the maximized value of
the likelihood function for the model can be calculated, with the known k which is the number of
parameters in the model (i.e. k is the number of degrees of freedom). The AIC value
2 2log( )AIC k L can be calculated accordingly.
4.4.2 AIC Weight and AIC Per-point Weight
The AIC provides a method to select the best model from a set of models based on the Kullback-
Leibler (K-L) distance between the model and the truth. The K-L distance quantifies the amount of
information lost when approximating the truth. Thus, a good model is the one which minimizes the
information loss and hence the K-L distance. Then AIC quantifies the amount of information lost
when the model i with ik unknown parameters out of N models is used to fit the data
1 2, , , nx x x x obtained in the measurements, and is given as 2log 2i i iI L k , where iL is the
maximum likelihood for the candidate model i and 2 ik accounts for the penalty for the number of
parameters used in the fitting. Then the relative likelihood of the model i is given by the Akaike
66
weight /2/2
1
/ ji
NII
i
j
w e e
. In the case of least-squares and the presence of technical noise in the
experiments, a fitness test using per-point (mean) AIC weight /2/2
1
/ ji
NII
i
j
w e e
, where /i iI I n
, can be applied. In our study involving only two models ( 2N ), with one for the EIT model and
another for the ATS model, we can re-write iw and iw as
EIT
ATSEIT
/ 2
EIT / 2/ 2
I
II
ew
e e
,
EIT
ATSEIT
/ 2
EIT / 2/ 2
I n
I nI n
ew
e e
(4.15)
with EIT ATS 1w w and EIT ATS 1w w .
4.5 Discerning EIT and ATS with AIC in WGM Photonic Molecules
In our experiments, we performed experiments in various conditions of our coupled-resonators
system, obtained transmission spectra, and used the Akaike Information Criterion (AIC) proposed
to discriminate between EIT and ATS in atomic systems to discern EIT or ATS [123]. We acquired
ten-thousand data points ( 10,000n ) to form a transmission spectrum at each setting of coupling-
strength and frequency-detuning, and we repeated the measurements to obtain ten transmission
spectra at each setting, to take into account the fluctuations and uncertainty in the measurements.
We used EITT and ATST given in Eqs. (4.7) and (4.9), respectively, to fit the transmission spectra
obtained in the experiments, and then used the AIC tests by calculating ( EITw , ATSw ) and ( EITw , ATSw
) proposed by Anisimov, Dowling, and Sanders to determine which of the models (EIT or ATS) is
the mostly likely for the experimental observation.
In Fig.4.10 we present typical curves of ( EITw , ATSw ) and ( EITw , ATSw ) obtained at three different
experimental settings, corresponding to three different regimes of operation, as the coupling
strength was increased: EIT-dominated regime (Fig.4.10a), ATS-dominated (Fig.4.10b) and EIT-
to-ATS transition (Fig.4.10c). The models assigned using AIC to the experimental data agree very
well with the requirements to observe EIT or ATS.
67
In the first case (Fig.4.10a), the WGMs in the resonators were chosen such that their decay rates,
quantified by μR1Q (i.e., 1 ) and
μR2Q (i.e., 2 ), significantly differed from each other (i.e.,
μR2 μR1/ ~ 400Q Q ). We calculated T 1 2 / 4 312.8MHz which was larger than the coupling
strengths used in the experiments ( 100MHz ). Starting from EIT ATS 0.5w w (i.e., both the
EIT and the ATS models are equally likely) for very weak coupling strength T0 15MHz
, the likelihood of EIT model increased as the coupling strength was increased up to 100 MHz.
Thus, we conclude that in this setting, which corresponded to weak driving regime ( T ), the
data obtained in the experiments favors the EIT model, as revealed by EIT ATSw w .
In the second case (Fig.4.10b), the decay rates of the coupled WGMs were very similar to each other
(i.e., μR2 μR1/ ~ 0.95Q Q ), and we estimated the critical coupling strength as T 16.2MHz which
was smaller than the coupling strengths considered 60MHz . Therefore, as demonstrated in the
model, this falls in the strong-driving regime ( T ), where ATS is expected. Indeed, in this
experimental setting, starting from EIT ATS 0.5w w , the likelihood of the ATS model increased as
the coupling strength was increased up to 400 MHz. Thus, the data obtained in the experiments
favors the ATS model as revealed by ATS EITw w .
The third case (Fig.4.10c) revealed an interesting phenomena: transition from an EIT-dominated
regime to an ATS-dominated regime through an inconclusive regime, where both EIT and ATS are
equally likely. The decay rates of the chosen WGMs were similar (i.e., μR2 μR1/ ~ 2.6Q Q ); larger than
that of the setting of Fig. 4.10b, but much smaller than that of the setting in Fig.4.10a. We estimated
the critical coupling strength as T 29.5MHz . In this case, the EIT model first dominated (
EIT ATSw w ) when the coupling strength was small. Then the likelihood of the EIT model decreased
and that of the ATS model increased as the coupling strength was increased up to 50 MHz, where
we observed EIT ATS 0.5w w . Further increase of the coupling strength beyond this point revealed
a transition to an ATS-dominated regime ( ATS EITw w ). This results agree well with the predictions
of the model: In the EIT-dominated regime we had T , in the transition regime we had T~
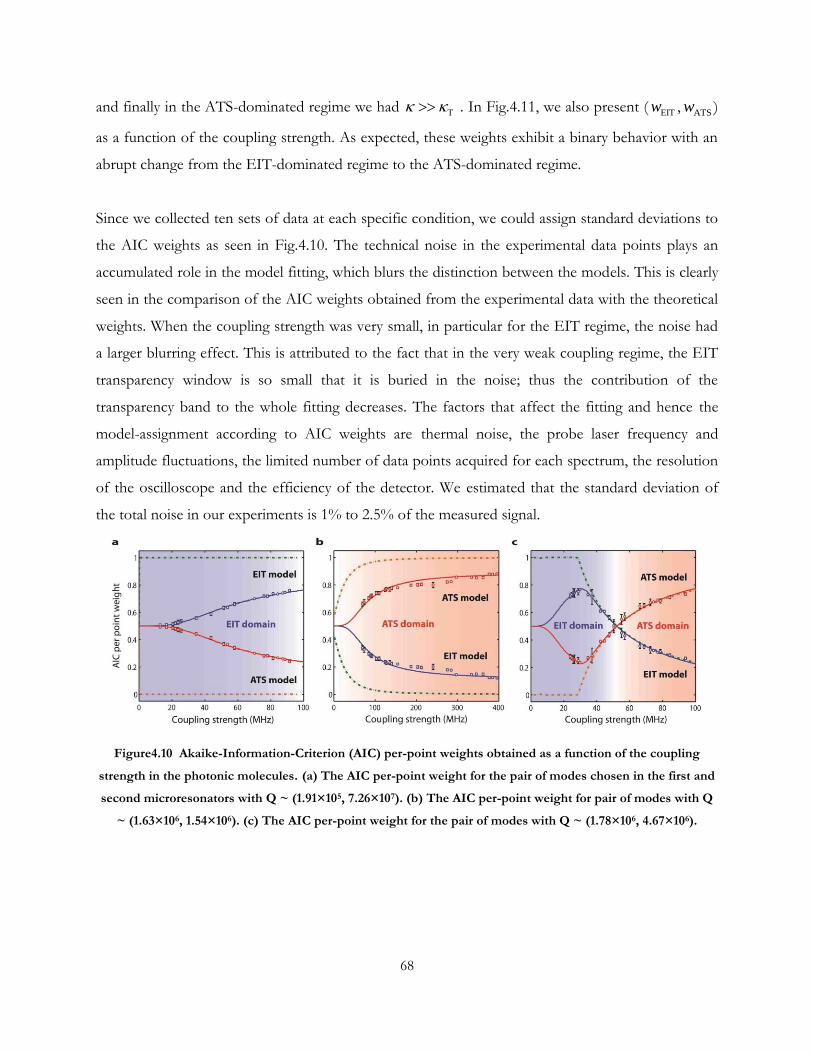
68
and finally in the ATS-dominated regime we had T . In Fig.4.11, we also present ( EITw , ATSw )
as a function of the coupling strength. As expected, these weights exhibit a binary behavior with an
abrupt change from the EIT-dominated regime to the ATS-dominated regime.
Since we collected ten sets of data at each specific condition, we could assign standard deviations to
the AIC weights as seen in Fig.4.10. The technical noise in the experimental data points plays an
accumulated role in the model fitting, which blurs the distinction between the models. This is clearly
seen in the comparison of the AIC weights obtained from the experimental data with the theoretical
weights. When the coupling strength was very small, in particular for the EIT regime, the noise had
a larger blurring effect. This is attributed to the fact that in the very weak coupling regime, the EIT
transparency window is so small that it is buried in the noise; thus the contribution of the
transparency band to the whole fitting decreases. The factors that affect the fitting and hence the
model-assignment according to AIC weights are thermal noise, the probe laser frequency and
amplitude fluctuations, the limited number of data points acquired for each spectrum, the resolution
of the oscilloscope and the efficiency of the detector. We estimated that the standard deviation of
the total noise in our experiments is 1% to 2.5% of the measured signal.
Figure4.10 Akaike-Information-Criterion (AIC) per-point weights obtained as a function of the coupling
strength in the photonic molecules. (a) The AIC per-point weight for the pair of modes chosen in the first and
second microresonators with Q ~ (1.91×10⁵, 7.26×10⁷). (b) The AIC per-point weight for pair of modes with Q
~ (1.63×10⁶, 1.54×10⁶). (c) The AIC per-point weight for the pair of modes with Q ~ (1.78×10⁶, 4.67×10⁶).
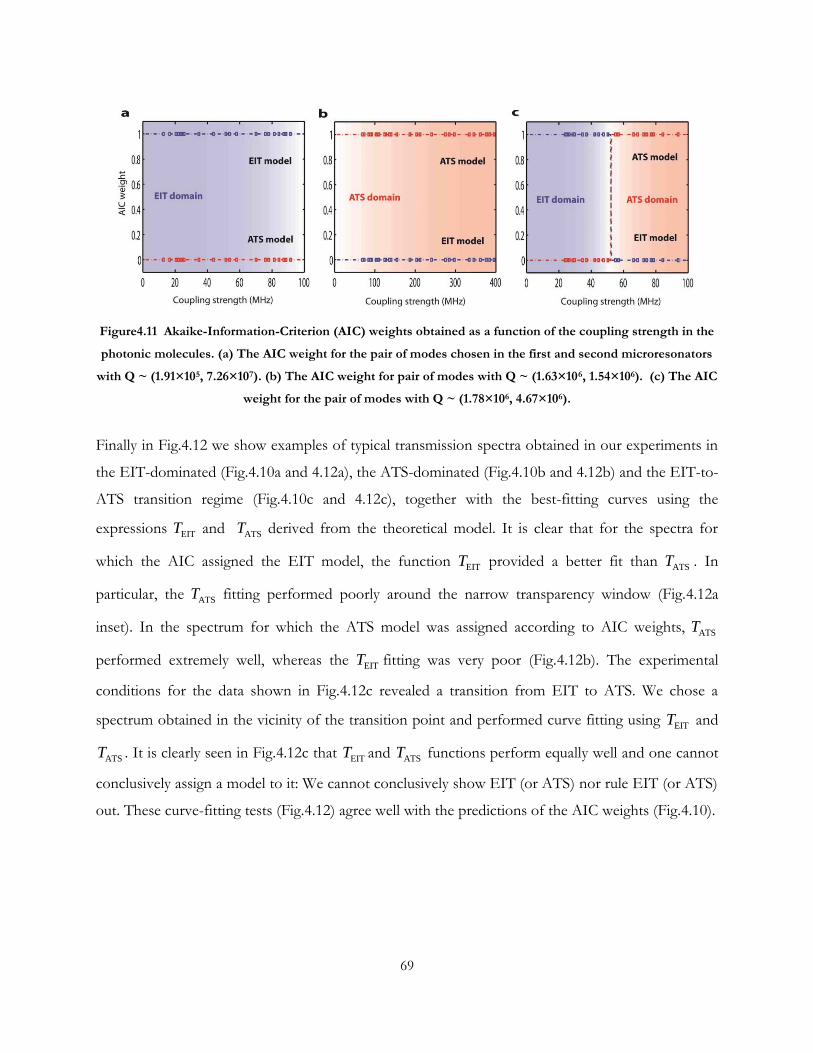
69
Figure4.11 Akaike-Information-Criterion (AIC) weights obtained as a function of the coupling strength in the
photonic molecules. (a) The AIC weight for the pair of modes chosen in the first and second microresonators
with Q ~ (1.91×10⁵, 7.26×10⁷). (b) The AIC weight for pair of modes with Q ~ (1.63×10⁶, 1.54×10⁶). (c) The AIC
weight for the pair of modes with Q ~ (1.78×10⁶, 4.67×10⁶).
Finally in Fig.4.12 we show examples of typical transmission spectra obtained in our experiments in
the EIT-dominated (Fig.4.10a and 4.12a), the ATS-dominated (Fig.4.10b and 4.12b) and the EIT-to-
ATS transition regime (Fig.4.10c and 4.12c), together with the best-fitting curves using the
expressions EITT and ATST derived from the theoretical model. It is clear that for the spectra for
which the AIC assigned the EIT model, the function EITT provided a better fit than ATST . In
particular, the ATST fitting performed poorly around the narrow transparency window (Fig.4.12a
inset). In the spectrum for which the ATS model was assigned according to AIC weights, ATST
performed extremely well, whereas the EITT fitting was very poor (Fig.4.12b). The experimental
conditions for the data shown in Fig.4.12c revealed a transition from EIT to ATS. We chose a
spectrum obtained in the vicinity of the transition point and performed curve fitting using EITT and
ATST . It is clearly seen in Fig.4.12c that EITT and ATST functions perform equally well and one cannot
conclusively assign a model to it: We cannot conclusively show EIT (or ATS) nor rule EIT (or ATS)
out. These curve-fitting tests (Fig.4.12) agree well with the predictions of the AIC weights (Fig.4.10).
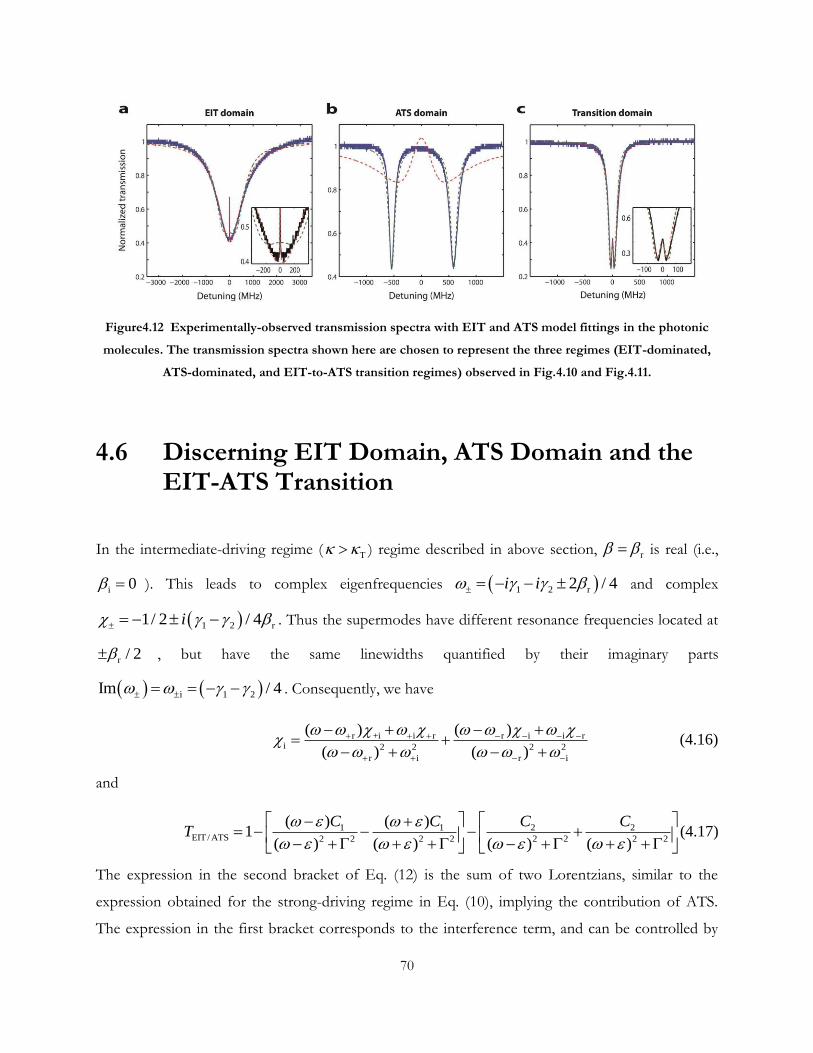
70
Figure4.12 Experimentally-observed transmission spectra with EIT and ATS model fittings in the photonic
molecules. The transmission spectra shown here are chosen to represent the three regimes (EIT-dominated,
ATS-dominated, and EIT-to-ATS transition regimes) observed in Fig.4.10 and Fig.4.11.
4.6 Discerning EIT Domain, ATS Domain and the EIT-ATS Transition
In the intermediate-driving regime ( T ) regime described in above section, r is real (i.e.,
i 0 ). This leads to complex eigenfrequencies 1 2 r2 / 4i i and complex
1 2 r1/ 2 / 4i . Thus the supermodes have different resonance frequencies located at
r / 2 , but have the same linewidths quantified by their imaginary parts
i 1 2Im / 4 . Consequently, we have
r +i i r r i i ri 2 2 2 2
r i r i
( ) ( )
( ) ( )
(4.16)
and
1 1 2 2EIT / ATS 2 2 2 2 2 2 2 2
( ) ( )1
( ) ( ) ( ) ( )
C C C CT
(4.17)
The expression in the second bracket of Eq. (12) is the sum of two Lorentzians, similar to the
expression obtained for the strong-driving regime in Eq. (10), implying the contribution of ATS.
The expression in the first bracket corresponds to the interference term, and can be controlled by
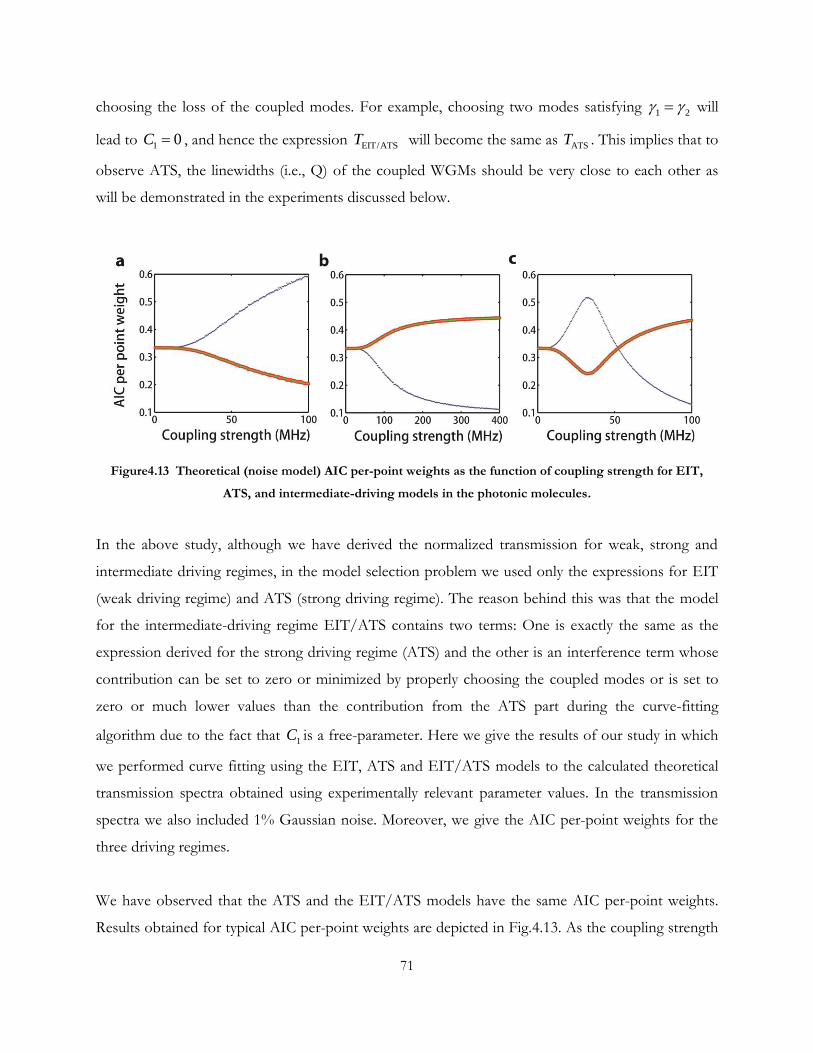
71
choosing the loss of the coupled modes. For example, choosing two modes satisfying 1 2 will
lead to 1 0C , and hence the expression EIT/ATST will become the same as ATST . This implies that to
observe ATS, the linewidths (i.e., Q) of the coupled WGMs should be very close to each other as
will be demonstrated in the experiments discussed below.
Figure4.13 Theoretical (noise model) AIC per-point weights as the function of coupling strength for EIT,
ATS, and intermediate-driving models in the photonic molecules.
In the above study, although we have derived the normalized transmission for weak, strong and
intermediate driving regimes, in the model selection problem we used only the expressions for EIT
(weak driving regime) and ATS (strong driving regime). The reason behind this was that the model
for the intermediate-driving regime EIT/ATS contains two terms: One is exactly the same as the
expression derived for the strong driving regime (ATS) and the other is an interference term whose
contribution can be set to zero or minimized by properly choosing the coupled modes or is set to
zero or much lower values than the contribution from the ATS part during the curve-fitting
algorithm due to the fact that 1C is a free-parameter. Here we give the results of our study in which
we performed curve fitting using the EIT, ATS and EIT/ATS models to the calculated theoretical
transmission spectra obtained using experimentally relevant parameter values. In the transmission
spectra we also included 1% Gaussian noise. Moreover, we give the AIC per-point weights for the
three driving regimes.
We have observed that the ATS and the EIT/ATS models have the same AIC per-point weights.
Results obtained for typical AIC per-point weights are depicted in Fig.4.13. As the coupling strength
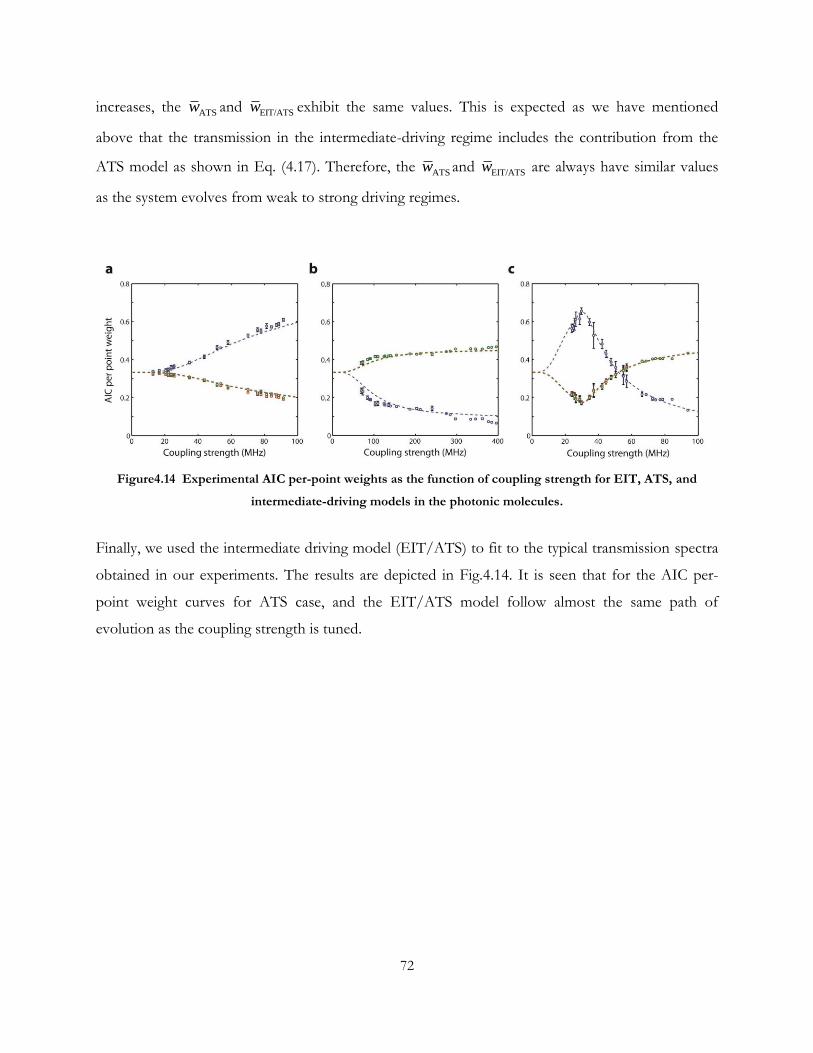
72
increases, the ATSw and EIT/ATSw exhibit the same values. This is expected as we have mentioned
above that the transmission in the intermediate-driving regime includes the contribution from the
ATS model as shown in Eq. (4.17). Therefore, the ATSw and EIT/ATSw are always have similar values
as the system evolves from weak to strong driving regimes.
Figure4.14 Experimental AIC per-point weights as the function of coupling strength for EIT, ATS, and
intermediate-driving models in the photonic molecules.
Finally, we used the intermediate driving model (EIT/ATS) to fit to the typical transmission spectra
obtained in our experiments. The results are depicted in Fig.4.14. It is seen that for the AIC per-
point weight curves for ATS case, and the EIT/ATS model follow almost the same path of
evolution as the coupling strength is tuned.
73
Chapter 5
Parity-time Symmetry in WGM Photonic Molecules
Optical systems with balanced loss and gain provide a unique platform to implement classical
analogues of quantum systems described by non-Hermitian parity–time (PT)-symmetric
Hamiltonians. Such systems can be used to create synthetic materials with properties that cannot be
attained in materials having only loss or only gain. In this chapter we study the PT-symmetry
breaking in WGM resonator based photonic molecules. We built the PT-symmetric WGM
microcavity system and observed non-reciprocity in the PT-symmetry-breaking phase due to strong
field localization, which significantly enhances nonlinearity. In the linear regime, light transmission is
reciprocal regardless of whether the symmetry is broken or unbroken. We show that in one direction
there is a complete absence of resonance peaks whereas in the other direction the transmission is
resonantly enhanced, a feature directly associated with the use of resonant structures. Our results
could lead to a new generation of synthetic optical systems enabling on-chip manipulation and
control of light propagation.
5.1 Introduction to Parity-time Symmetry
5.1.1 Parity-time Symmetry in Quantum Mechanics
In quantum mechanics theory, an energy conserved close system requires that the Hamiltonian
operator must be Hermitian in order for that the energy levels be real and that the theory be unitary.
The Hermiticity of a Hamiltonian, is expressed as †H H , where the symbol † denotes the usual
Dirac Hermitian conjugation, that is, transpose and complex conjugate. The properties of these
states are very similar to those of atomic confined electron states, including that the energy
eigenvalues are real and that time evolution is unitary. However, for an energy non-conserved open
system, the non-Hermitian Hamiltonian H , 2 3H p ix for example, which is clearly not Dirac
74
Hermitian, also has a real positive discrete spectrum and generates unitary time evolution, and thus it
defines a fully consistent quantum mechanics [138].
One may generalize the above general example and contemplate 2 ( )H p V x with any symmetric
real well { ( )} { ( )}V x V x and with its purely imaginary anti-symmetric complement
{ ( )} { ( )}V x V x . In place of the current Hermiticity of the Hamiltonians, the new class of
models satisfies a weaker condition which, presumably, implies the reality of the spectrum under
certain circumstances. The condition is called PT symmetry and means just the commutativity
, 0H PT (5.1)
where P is the parity operation ( ,x x p p ) and T denotes the time operation (
, ,x x p p i i ). The T performs complex conjugation [139].
5.1.2 Parity-time Symmetry Breaking and Phase Transition
The PT -symmetric quantum theory is studied to replace the condition that the Hamiltonian of a
quantum theory be Hermitian with the weaker condition that it possesses space-time reflection
symmetry which is the definition of PT symmetry. These new Hamiltonians have remarkable
mathematical properties and it will be very useful in describing different physical systems. It is worth
mentioning that in replacing the condition of Hermiticity by PT symmetry, any of the key physical
properties that a quantum theory must have is not given up. If the PT symmetry of the Hamiltonian
is not broken, then the Hamiltonian will exhibit all of the features of a quantum theory described by
a Hermitian Hamiltonian.
The association between PT symmetry and the reality of spectra can be understood as following: the
PT symmetry of a Hamiltonian H is unbroken if all of the eigen-functions of H are simultaneously
eigen-functions of PT [140, 141]. In another word, that if the PT symmetry of a Hamiltonian H is
unbroken, then the spectrum of H is real. Assume that the Hamiltonian H possesses PT symmetry
and that if is an eigen-state of H with eigen-value E , then it is simultaneously an eigen-state of
PT with eigenvalue λ:
.H E PT (5.2)

75
When the spectrum of a PT system is not real anymore with specific parameter tuning, the system
goes into spontaneous symmetry breaking regime, or named broken regime. There is always a phase
transition between the PT symmetric regime and symmetry broken regime when the system
parameters such as gain/loss ratio or mode coupling strength are tuned. The transition point is
normally called PT threshold. This clear phase transition is a characteristic feature of the PT
symmetric system.
5.2 Parity-time Symmetry in Mechanics and Acoustics
Owing to the recent progress in nanotechnology and materials science, nano- and micro-mechanics
have emerged as a subject of great interest due to their potential use in demonstrating macroscopic
quantum phenomena, and possible applications in precision measurements, detecting gravitational
waves, building filters, switches and logic gates, and signal amplification. In particular, on-chip
single-phonon devices are accepted as ideal candidates for hybrid quantum information processing
systems due to the ability of phonons to interact and rapidly switch between optical fields and
microwave fields. Fabrication of high-frequency mechanical resonators, demonstration of coherent
phonon coupling between nanomechanical resonators, ground-state cooling, optomechanics in
microtoroids, microspheres, microdisks, photonic crystals, doubly- or singly-clamped cantilevers,
and membranes have opened new directions and provided new tools to control and manipulate
phonons in on-chip devices. However, an obstacle to further develop the field is the ability to
control the flow of phonons such that the transport is allowed in one direction but completely
prevented in the other direction- nonreciprocal phonon transport. There have been several attempts
to fabricate nonreciprocal devices for phonons, but these are almost exclusively based on
asymmetric linear structures which indeed cannot break Lorentz reciprocity: a static linear structure
cannot break reciprocity. These linear structures proposed do obey the reflection-transmission
reciprocity and thus cannot be considered as “phonon diode”. The diode-like behavior is seen in
these linear acoustic structures because the input-output channels are not properly switched.
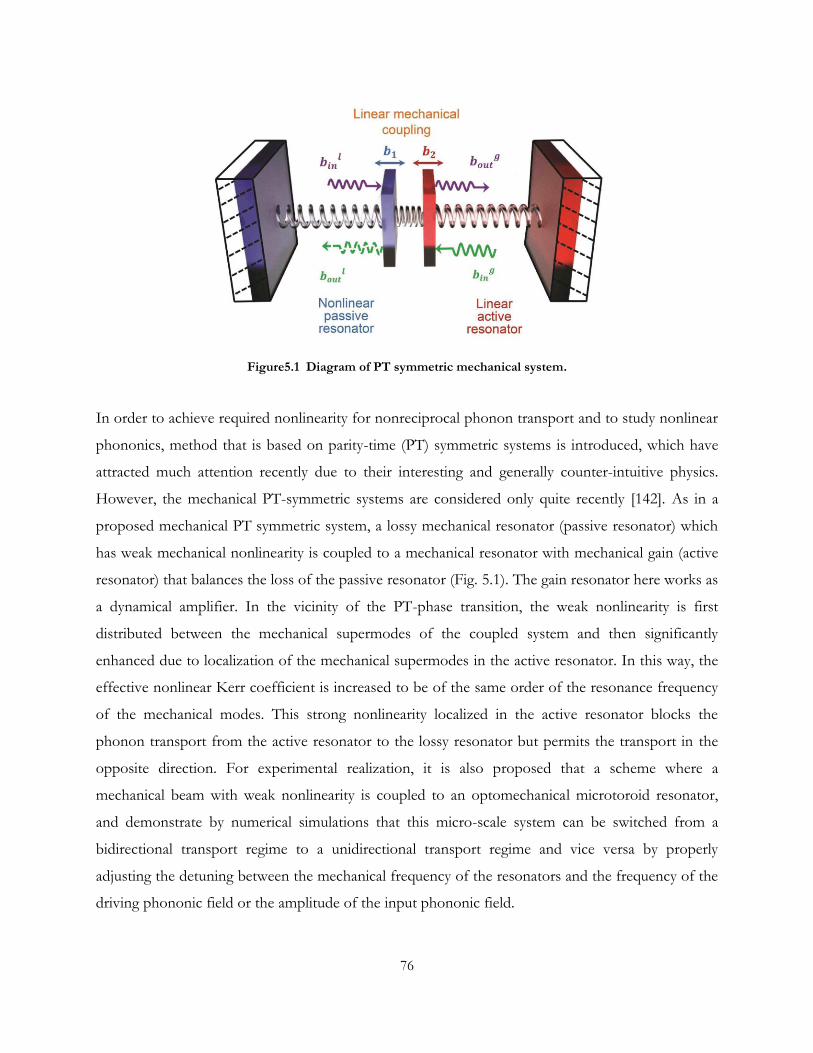
76
Figure5.1 Diagram of PT symmetric mechanical system.
In order to achieve required nonlinearity for nonreciprocal phonon transport and to study nonlinear
phononics, method that is based on parity-time (PT) symmetric systems is introduced, which have
attracted much attention recently due to their interesting and generally counter-intuitive physics.
However, the mechanical PT-symmetric systems are considered only quite recently [142]. As in a
proposed mechanical PT symmetric system, a lossy mechanical resonator (passive resonator) which
has weak mechanical nonlinearity is coupled to a mechanical resonator with mechanical gain (active
resonator) that balances the loss of the passive resonator (Fig. 5.1). The gain resonator here works as
a dynamical amplifier. In the vicinity of the PT-phase transition, the weak nonlinearity is first
distributed between the mechanical supermodes of the coupled system and then significantly
enhanced due to localization of the mechanical supermodes in the active resonator. In this way, the
effective nonlinear Kerr coefficient is increased to be of the same order of the resonance frequency
of the mechanical modes. This strong nonlinearity localized in the active resonator blocks the
phonon transport from the active resonator to the lossy resonator but permits the transport in the
opposite direction. For experimental realization, it is also proposed that a scheme where a
mechanical beam with weak nonlinearity is coupled to an optomechanical microtoroid resonator,
and demonstrate by numerical simulations that this micro-scale system can be switched from a
bidirectional transport regime to a unidirectional transport regime and vice versa by properly
adjusting the detuning between the mechanical frequency of the resonators and the frequency of the
driving phononic field or the amplitude of the input phononic field.
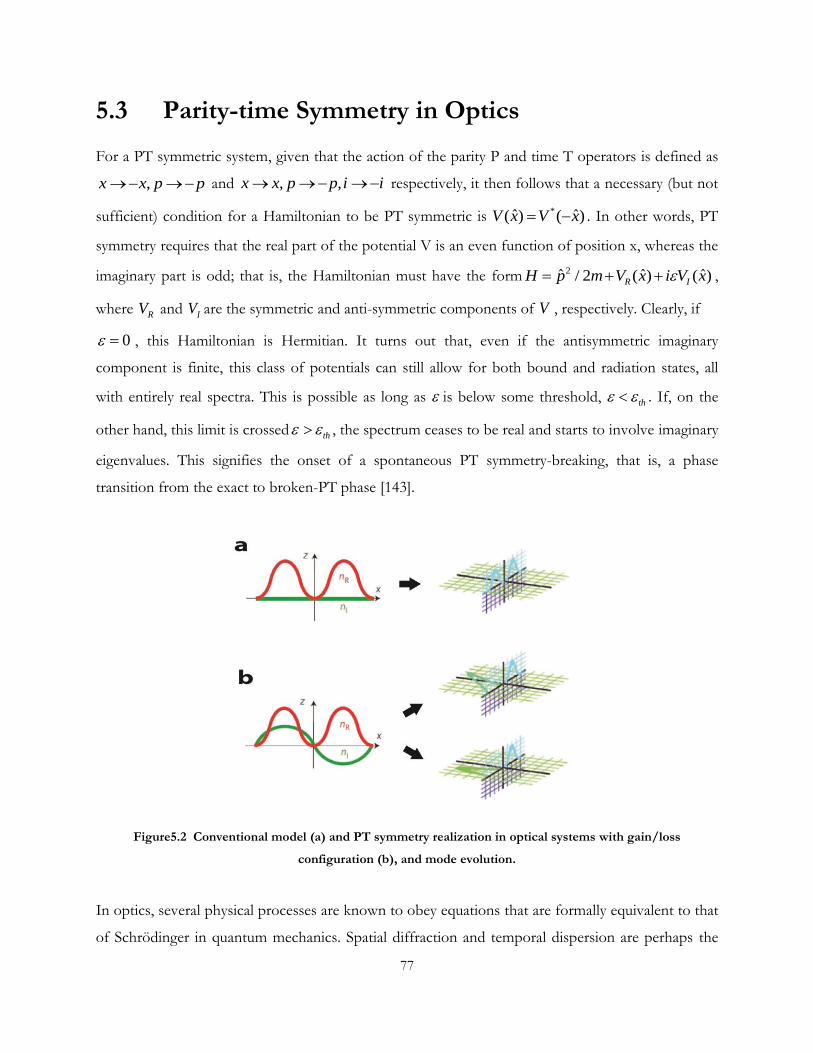
77
5.3 Parity-time Symmetry in Optics
For a PT symmetric system, given that the action of the parity P and time T operators is defined as
,x x p p and , ,x x p p i i respectively, it then follows that a necessary (but not
sufficient) condition for a Hamiltonian to be PT symmetric is *ˆ ˆ( ) ( )V x V x . In other words, PT
symmetry requires that the real part of the potential V is an even function of position x, whereas the
imaginary part is odd; that is, the Hamiltonian must have the form 2ˆ ˆ ˆ/ 2 ( ) ( )R IH p m V x i V x ,
where RV and IV are the symmetric and anti-symmetric components of V , respectively. Clearly, if
0 , this Hamiltonian is Hermitian. It turns out that, even if the antisymmetric imaginary
component is finite, this class of potentials can still allow for both bound and radiation states, all
with entirely real spectra. This is possible as long as is below some threshold, th . If, on the
other hand, this limit is crossed th , the spectrum ceases to be real and starts to involve imaginary
eigenvalues. This signifies the onset of a spontaneous PT symmetry-breaking, that is, a phase
transition from the exact to broken-PT phase [143].
Figure5.2 Conventional model (a) and PT symmetry realization in optical systems with gain/loss
configuration (b), and mode evolution.
In optics, several physical processes are known to obey equations that are formally equivalent to that
of Schrödinger in quantum mechanics. Spatial diffraction and temporal dispersion are perhaps the

78
most prominent examples. If we focus on the spatial domain, for example optical beam propagation
in PT-symmetric complex potentials, in fact, such PT optical potentials can be realized through a
judicious inclusion of index guiding and gain/loss regions. Given that the complex refractive-index
distribution ( ) ( ) ( )R In x n x in x plays the role of an optical potential, we can then design a PT-
symmetric system by satisfying the conditions ( ) ( )R Rn x n x and ( ) ( )I In x n x , as shown in
Fig.5.2. In other words, the refractive-index profile must be an even function of position x whereas
the gain/loss distribution should be odd. Under these conditions, the electric-field envelope E of
the optical beam is governed by the paraxial equation of diffraction in the guided wave optical
system:
2
02
1[ ( ) ( )] 0
2R I
E Ei k n x in x E
z k x
(5.3)
where 0 0 02 / ,k k k n , with denotes the wavelength of light in vacuum and 0n denotes the
substrate index. This mechanism enables the realization of PT symmetry in optical systems with a
gain/loss coupling pair. Under these conditions, and by using the coupled mode theory, the optical-
field dynamics in the two coupled guided waves are described by
11 2 0, 0
2 2
dE dEi i E E i i E E
dz dz
2
2 1+ (5.4)
Figure5.3 Different optical platforms for realization of PT symmetry. (a) Coupled waveguides with balanced
gain and loss. (b) Single waveguide with gain/loss setting. (c) PT symmetric photonic lattice.
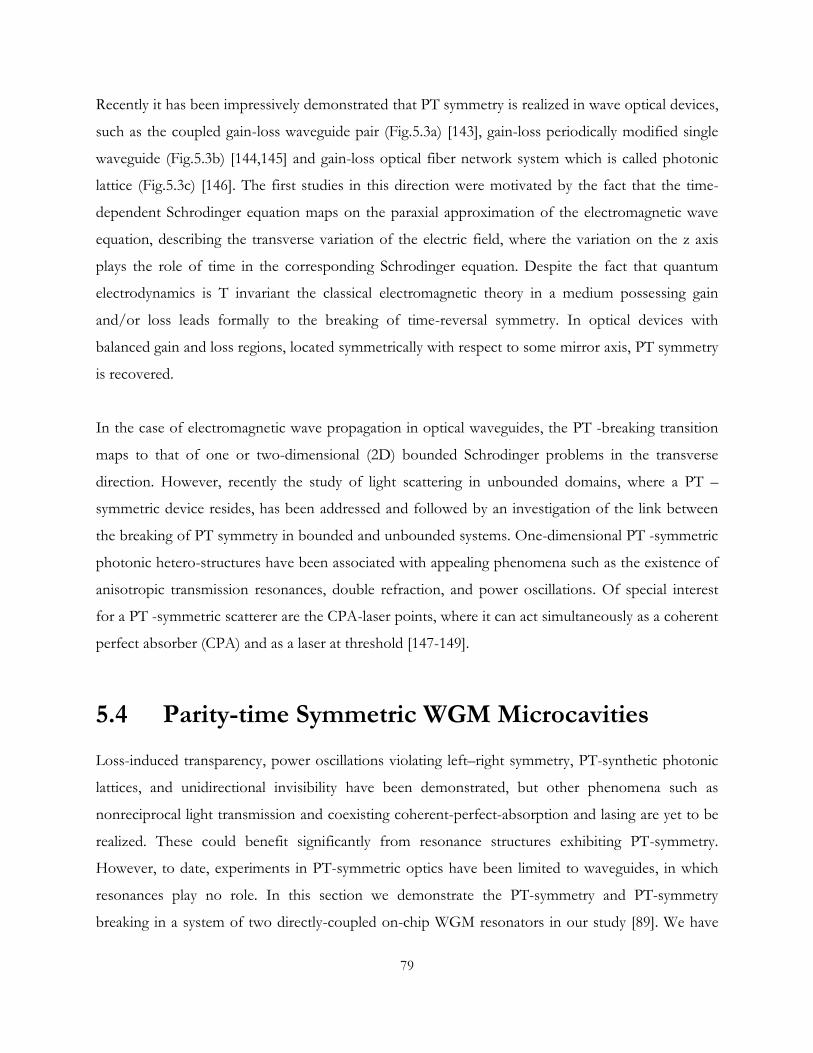
79
Recently it has been impressively demonstrated that PT symmetry is realized in wave optical devices,
such as the coupled gain-loss waveguide pair (Fig.5.3a) [143], gain-loss periodically modified single
waveguide (Fig.5.3b) [144,145] and gain-loss optical fiber network system which is called photonic
lattice (Fig.5.3c) [146]. The first studies in this direction were motivated by the fact that the time-
dependent Schrodinger equation maps on the paraxial approximation of the electromagnetic wave
equation, describing the transverse variation of the electric field, where the variation on the z axis
plays the role of time in the corresponding Schrodinger equation. Despite the fact that quantum
electrodynamics is T invariant the classical electromagnetic theory in a medium possessing gain
and/or loss leads formally to the breaking of time-reversal symmetry. In optical devices with
balanced gain and loss regions, located symmetrically with respect to some mirror axis, PT symmetry
is recovered.
In the case of electromagnetic wave propagation in optical waveguides, the PT -breaking transition
maps to that of one or two-dimensional (2D) bounded Schrodinger problems in the transverse
direction. However, recently the study of light scattering in unbounded domains, where a PT –
symmetric device resides, has been addressed and followed by an investigation of the link between
the breaking of PT symmetry in bounded and unbounded systems. One-dimensional PT -symmetric
photonic hetero-structures have been associated with appealing phenomena such as the existence of
anisotropic transmission resonances, double refraction, and power oscillations. Of special interest
for a PT -symmetric scatterer are the CPA-laser points, where it can act simultaneously as a coherent
perfect absorber (CPA) and as a laser at threshold [147-149].
5.4 Parity-time Symmetric WGM Microcavities
Loss-induced transparency, power oscillations violating left–right symmetry, PT-synthetic photonic
lattices, and unidirectional invisibility have been demonstrated, but other phenomena such as
nonreciprocal light transmission and coexisting coherent-perfect-absorption and lasing are yet to be
realized. These could benefit significantly from resonance structures exhibiting PT-symmetry.
However, to date, experiments in PT-symmetric optics have been limited to waveguides, in which
resonances play no role. In this section we demonstrate the PT-symmetry and PT-symmetry
breaking in a system of two directly-coupled on-chip WGM resonators in our study [89]. We have

80
observed a clear transition of the eigen-mode evolution from the PT-symmetric regime to PT-
symmetry breaking regime.
5.4.1 Design and Characterization of PT Symmetric WGM Microcavity System
Our system consists of two directly-coupled microtoroidal WGMRs, each coupled to a different
fiber-taper coupler (Fig. 5.4). This system is PT symmetric because under parity reflection P the
WGMRs become interchanged and under time reversal T loss becomes gain and gain becomes loss.
The first microtoroid (μR1) is an active resonator made from Er3+-doped silica, the second
microtoroid (μR2) is a passive (no-gain-medium) resonator made from silica without dopants. Gain
in μR1 was provided in the 1550 nm wavelength band by optically pumping Er3+ ions with a pump
laser in the 1460 nm band. The Q-factors of μR1and μR2 in the 1550 nm band were 3.3×10⁶ and
3×10⁷, respectively, and μR1 had a Q-factor of 2.4×10⁶ in the 1460 nm band. The microtoroids
were fabricated at the edges of two separate chips placed on nanopositioning systems to control
precisely the distance and hence the coupling between the microtoroids (as discussed in Chapter 2
and Chapter 3).
We mediated the coupling between μR1 and μR2 in the 1550 nm band by controlling detuning
between their resonant wavelengths through the tuning of the resonance wavelength of μR2 via the
thermo-optic effect of silica.
Figure5.4 Schematic and device microscope images of PT-symmetric WGM microcavities.

81
There was no coupling between the resonators in the 1460 nm band; thus, the pump existed only in
μR1. Compensation of the μR1 losses in the 1550nm band with the optical gain provided by Er3+
was confirmed by the narrowing of resonance linewidth with increasing pump power (Fig. 5.5a and
Fig.5.5b) and by the emergence of a strong resonance peak (Fig. 5.5c) due to the amplification of a
very weak probe by the gain.
Figure5.5 Gain cavity spectral demonstration with pump-probe scheme.
We conducted two sets of experiments using the apparatus in Fig.5.6. The first set determined the
broken and unbroken PT phases as a function of the coupling strength . In our second set of
experiments we tested this in our PT-symmetric system [Fig.5.4a with transmission from input port
1 (4) to output port 4 (1) defined as the forward T1→4 (backward T4→1)] and demonstrated strong
nonreciprocal light transmission associated with nonlinearity enhancement induced by PT-
symmetry-breaking.
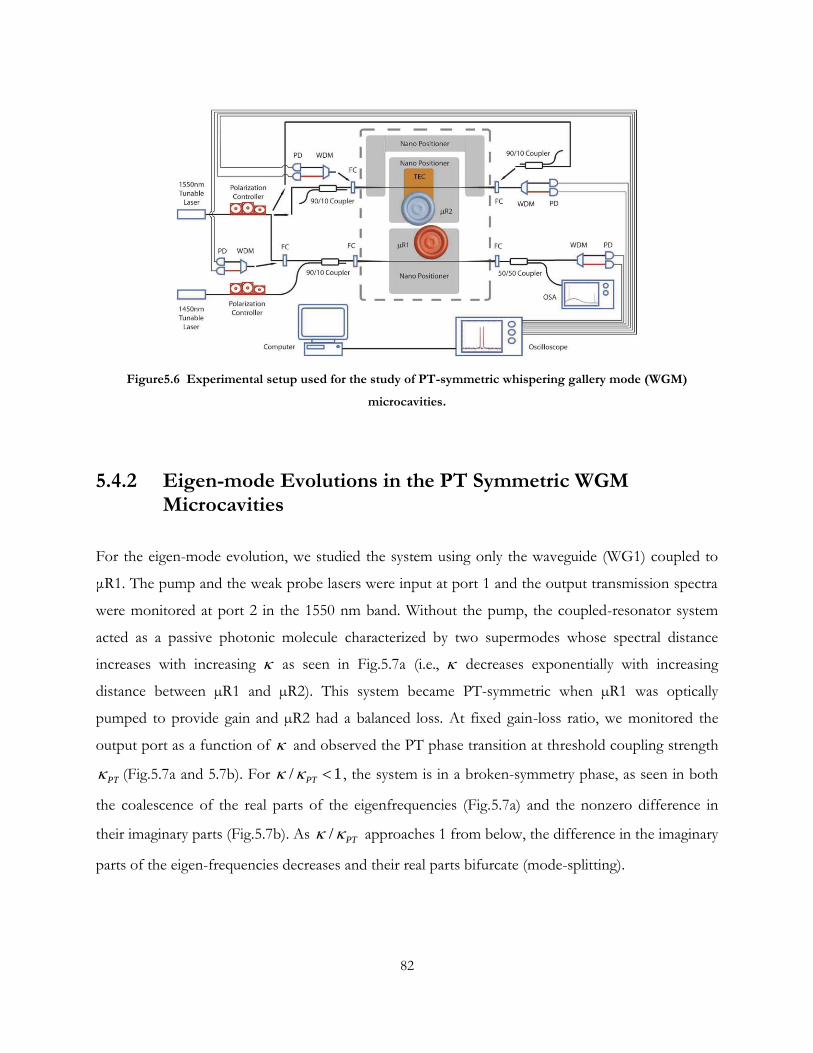
82
Figure5.6 Experimental setup used for the study of PT-symmetric whispering gallery mode (WGM)
microcavities.
5.4.2 Eigen-mode Evolutions in the PT Symmetric WGM Microcavities
For the eigen-mode evolution, we studied the system using only the waveguide (WG1) coupled to
μR1. The pump and the weak probe lasers were input at port 1 and the output transmission spectra
were monitored at port 2 in the 1550 nm band. Without the pump, the coupled-resonator system
acted as a passive photonic molecule characterized by two supermodes whose spectral distance
increases with increasing as seen in Fig.5.7a (i.e., decreases exponentially with increasing
distance between µR1 and µR2). This system became PT-symmetric when µR1 was optically
pumped to provide gain and µR2 had a balanced loss. At fixed gain-loss ratio, we monitored the
output port as a function of and observed the PT phase transition at threshold coupling strength
PT (Fig.5.7a and 5.7b). For / 1PT , the system is in a broken-symmetry phase, as seen in both
the coalescence of the real parts of the eigenfrequencies (Fig.5.7a) and the nonzero difference in
their imaginary parts (Fig.5.7b). As / PT approaches 1 from below, the difference in the imaginary
parts of the eigen-frequencies decreases and their real parts bifurcate (mode-splitting).
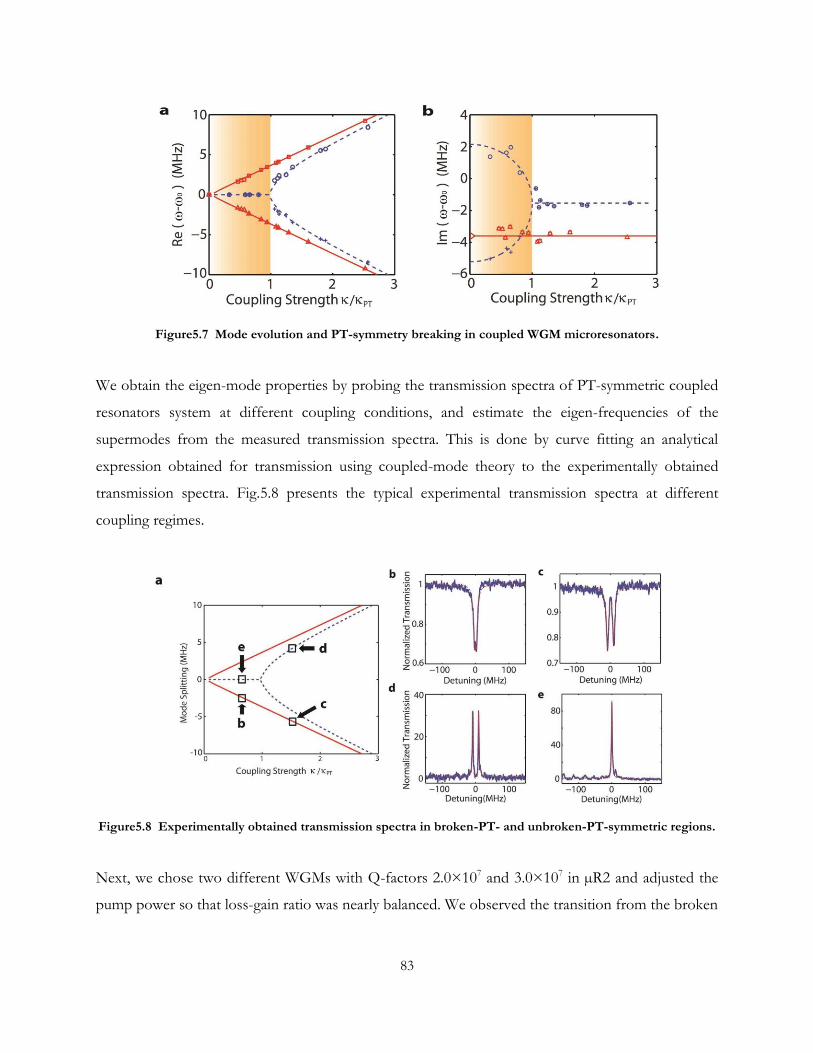
83
Figure5.7 Mode evolution and PT-symmetry breaking in coupled WGM microresonators.
We obtain the eigen-mode properties by probing the transmission spectra of PT-symmetric coupled
resonators system at different coupling conditions, and estimate the eigen-frequencies of the
supermodes from the measured transmission spectra. This is done by curve fitting an analytical
expression obtained for transmission using coupled-mode theory to the experimentally obtained
transmission spectra. Fig.5.8 presents the typical experimental transmission spectra at different
coupling regimes.
Figure5.8 Experimentally obtained transmission spectra in broken-PT- and unbroken-PT-symmetric regions.
Next, we chose two different WGMs with Q-factors 2.0×10⁷ and 3.0×10⁷ in µR2 and adjusted the
pump power so that loss-gain ratio was nearly balanced. We observed the transition from the broken
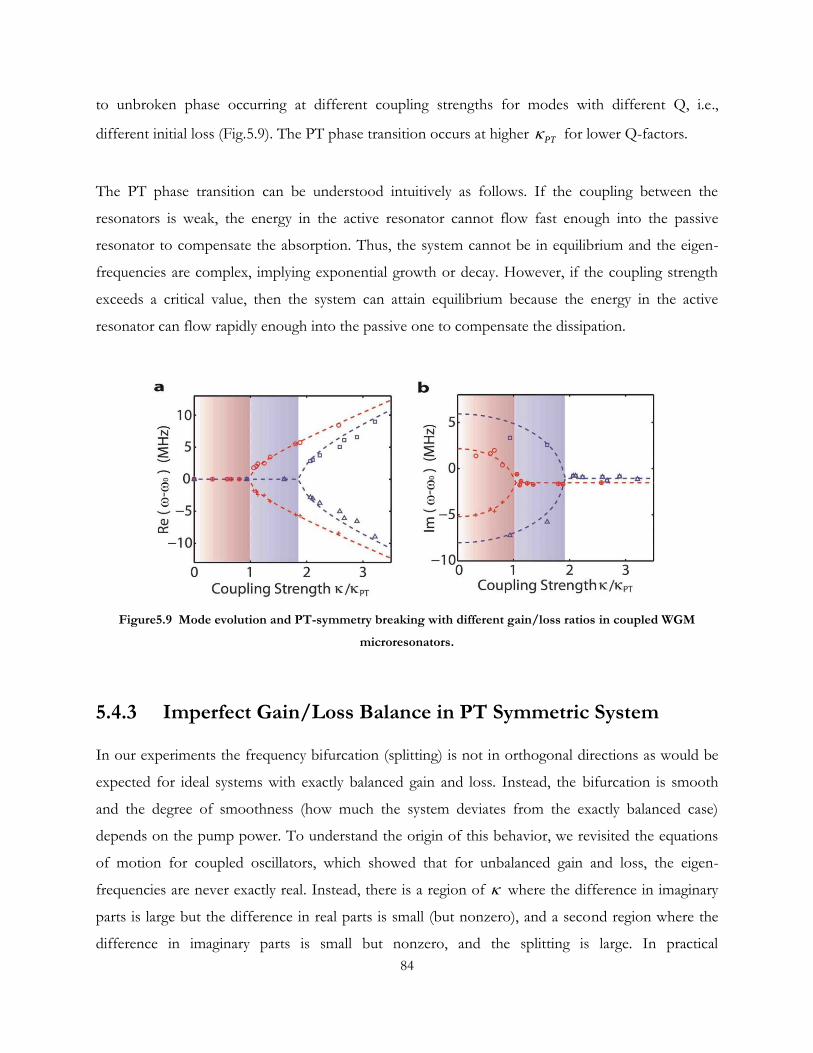
84
to unbroken phase occurring at different coupling strengths for modes with different Q, i.e.,
different initial loss (Fig.5.9). The PT phase transition occurs at higher PT for lower Q-factors.
The PT phase transition can be understood intuitively as follows. If the coupling between the
resonators is weak, the energy in the active resonator cannot flow fast enough into the passive
resonator to compensate the absorption. Thus, the system cannot be in equilibrium and the eigen-
frequencies are complex, implying exponential growth or decay. However, if the coupling strength
exceeds a critical value, then the system can attain equilibrium because the energy in the active
resonator can flow rapidly enough into the passive one to compensate the dissipation.
Figure5.9 Mode evolution and PT-symmetry breaking with different gain/loss ratios in coupled WGM
microresonators.
5.4.3 Imperfect Gain/Loss Balance in PT Symmetric System
In our experiments the frequency bifurcation (splitting) is not in orthogonal directions as would be
expected for ideal systems with exactly balanced gain and loss. Instead, the bifurcation is smooth
and the degree of smoothness (how much the system deviates from the exactly balanced case)
depends on the pump power. To understand the origin of this behavior, we revisited the equations
of motion for coupled oscillators, which showed that for unbalanced gain and loss, the eigen-
frequencies are never exactly real. Instead, there is a region of where the difference in imaginary
parts is large but the difference in real parts is small (but nonzero), and a second region where the
difference in imaginary parts is small but nonzero, and the splitting is large. In practical
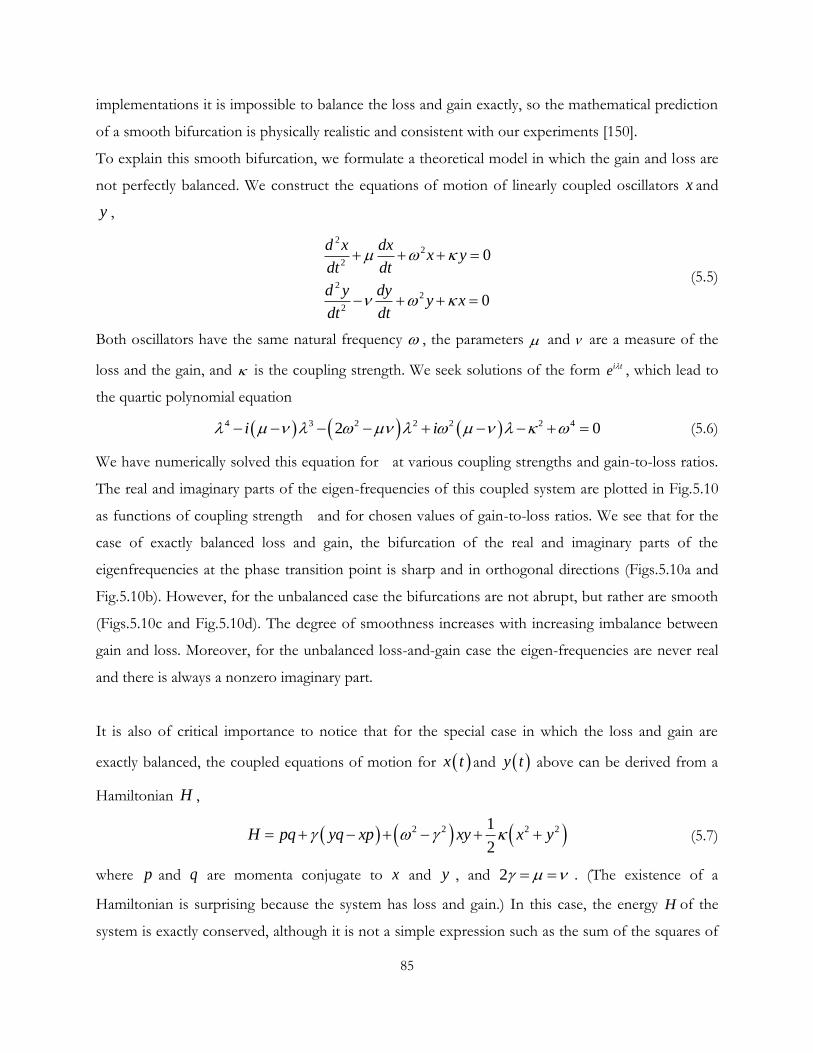
85
implementations it is impossible to balance the loss and gain exactly, so the mathematical prediction
of a smooth bifurcation is physically realistic and consistent with our experiments [150].
To explain this smooth bifurcation, we formulate a theoretical model in which the gain and loss are
not perfectly balanced. We construct the equations of motion of linearly coupled oscillators x and
y ,
22
2
22
2
0
0
d x dxx y
dt dt
d y dyy x
dt dt
(5.5)
Both oscillators have the same natural frequency , the parameters and are a measure of the
loss and the gain, and is the coupling strength. We seek solutions of the form i te , which lead to
the quartic polynomial equation
4 3 2 2 2 2 42 0i i (5.6)
We have numerically solved this equation for at various coupling strengths and gain-to-loss ratios.
The real and imaginary parts of the eigen-frequencies of this coupled system are plotted in Fig.5.10
as functions of coupling strength and for chosen values of gain-to-loss ratios. We see that for the
case of exactly balanced loss and gain, the bifurcation of the real and imaginary parts of the
eigenfrequencies at the phase transition point is sharp and in orthogonal directions (Figs.5.10a and
Fig.5.10b). However, for the unbalanced case the bifurcations are not abrupt, but rather are smooth
(Figs.5.10c and Fig.5.10d). The degree of smoothness increases with increasing imbalance between
gain and loss. Moreover, for the unbalanced loss-and-gain case the eigen-frequencies are never real
and there is always a nonzero imaginary part.
It is also of critical importance to notice that for the special case in which the loss and gain are
exactly balanced, the coupled equations of motion for x t and y t above can be derived from a
Hamiltonian H ,
2 2 2 21
2H pq yq xp xy x y (5.7)
where p and q are momenta conjugate to x and y , and 2 . (The existence of a
Hamiltonian is surprising because the system has loss and gain.) In this case, the energy H of the
system is exactly conserved, although it is not a simple expression such as the sum of the squares of
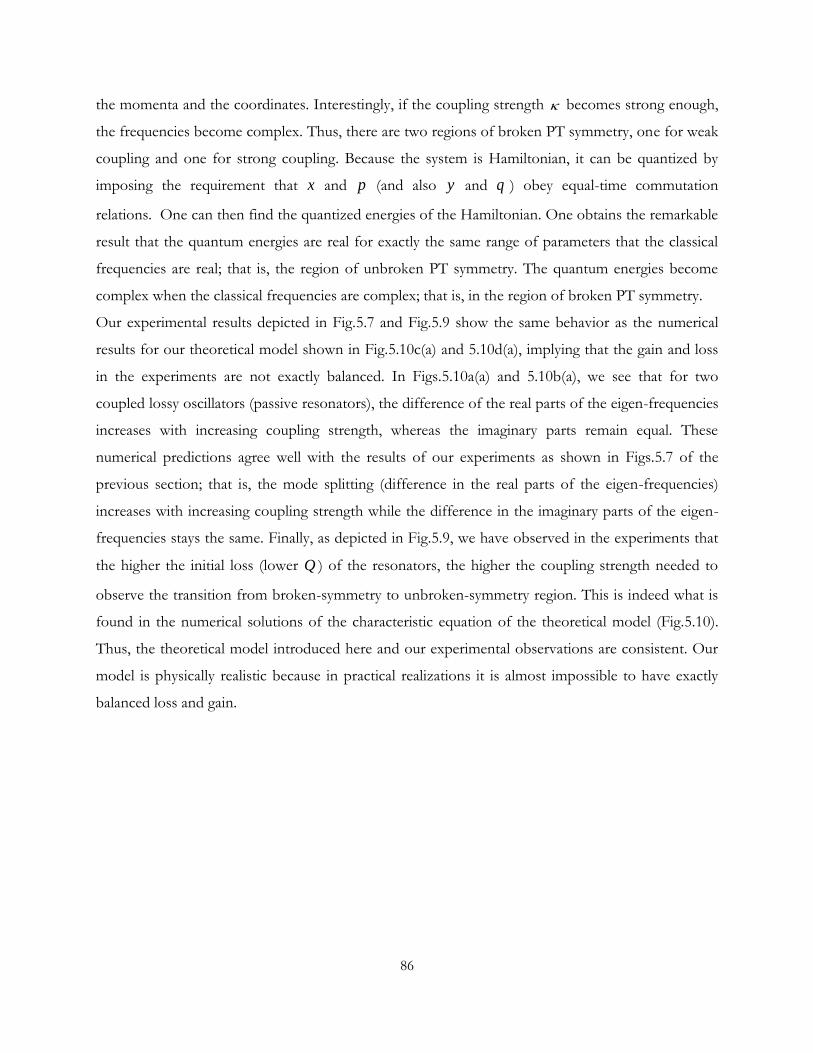
86
the momenta and the coordinates. Interestingly, if the coupling strength becomes strong enough,
the frequencies become complex. Thus, there are two regions of broken PT symmetry, one for weak
coupling and one for strong coupling. Because the system is Hamiltonian, it can be quantized by
imposing the requirement that x and p (and also y and q ) obey equal-time commutation
relations. One can then find the quantized energies of the Hamiltonian. One obtains the remarkable
result that the quantum energies are real for exactly the same range of parameters that the classical
frequencies are real; that is, the region of unbroken PT symmetry. The quantum energies become
complex when the classical frequencies are complex; that is, in the region of broken PT symmetry.
Our experimental results depicted in Fig.5.7 and Fig.5.9 show the same behavior as the numerical
results for our theoretical model shown in Fig.5.10c(a) and 5.10d(a), implying that the gain and loss
in the experiments are not exactly balanced. In Figs.5.10a(a) and 5.10b(a), we see that for two
coupled lossy oscillators (passive resonators), the difference of the real parts of the eigen-frequencies
increases with increasing coupling strength, whereas the imaginary parts remain equal. These
numerical predictions agree well with the results of our experiments as shown in Figs.5.7 of the
previous section; that is, the mode splitting (difference in the real parts of the eigen-frequencies)
increases with increasing coupling strength while the difference in the imaginary parts of the eigen-
frequencies stays the same. Finally, as depicted in Fig.5.9, we have observed in the experiments that
the higher the initial loss (lower Q ) of the resonators, the higher the coupling strength needed to
observe the transition from broken-symmetry to unbroken-symmetry region. This is indeed what is
found in the numerical solutions of the characteristic equation of the theoretical model (Fig.5.10).
Thus, the theoretical model introduced here and our experimental observations are consistent. Our
model is physically realistic because in practical realizations it is almost impossible to have exactly
balanced loss and gain.
87
Figure5.10 Real and imaginary parts of the eigen-frequencies of the coupled system as a function of the
coupling strength for balanced and unbalanced gain-loss conditions in PT-symmetric photonic molecules.
The observation in our experiments and the theoretical model above is critical in two ways. First,
imposing exactly balanced loss and gain in coupled systems for extended durations of time is not
practical. Second, in the broken-symmetry phase, the field propagating in the PT-symmetric system
is always confined in the structure with gain, thereby experiencing a strong overall gain and leading
to enhanced transmission. At the phase transition point, the change in the gain experienced by the
field should be abrupt in the ideally balanced gain and loss situation. Thus, if the coupling strength is
changed by a very small amount around the phase transition point, there is a large abrupt change in
the real and imaginary parts of the eigenfrequencies, leading to an abrupt change in the amplification
or the gain experienced by the field. In the non-ideal case where the bifurcation is not orthogonal
but smoothened, the change in the gain/amplification experienced by the field around the phase
transition point is reduced.

88
5.5 All-optical Diode with PT Symmetric Microcavities
A linear static dielectric system, even with gain and loss, cannot have nonreciprocal response.
However, a nonlinear system can exhibit strong nonreciprocity. In our second set of experiments we
tested this in our PT-symmetric system [Fig.5.4a with transmission from input port 1 (4) to output
port 4 (1) defined as the forward T1→4 (backward T4→1)] and demonstrated strong nonreciprocal light
transmission associated with nonlinearity enhancement induced by PT-symmetry-breaking.
5.5.1 Lorentz Reciprocity Theorem
In classical electromagnetism, reciprocity refers to a variety of related theorems involving the
interchange of time-harmonic electric current densities (sources) and the resulting electromagnetic
fields in Maxwell's equations for time-invariant linear media under certain constraints. Reciprocity is
closely related to the concept of Hermitian operators from linear algebra, applied to
electromagnetism.
Perhaps the most common and general such theorem is Lorentz reciprocity (and its various special
cases such as Rayleigh-Carson reciprocity), named after work by Hendrik Lorentz in 1896 following
analogous results regarding sound by Lord Rayleigh and Helmholtz (Potton, 2004). Loosely, it states
that the relationship between an oscillating current and the resulting electric field is unchanged if one
interchanges the points where the current is placed and where the field is measured. For the specific
case of an electrical network, it is sometimes phrased as the statement that voltages and currents at
different points in the network can be interchanged. More technically, it follows that the mutual
impedance of a first circuit due to a second is the same as the mutual impedance of the second
circuit due to the first.
Specifically, suppose that one has a current density 1J that produces an electric field E and
a magnetic field 1H , where all three are periodic functions of time with angular frequency , and in
particular they have time-dependence j te . Suppose that we similarly have a second current 2J at

89
the same frequency which produces fields 2E and 2H . The Lorentz reciprocity theorem then
states, under certain simple conditions on the materials of the medium described below, that for an
arbitrary surface S enclosing a volume V :
1 2 1 2 1 2 2 1[ ] [ ] .V S
J E E J dV E H E H dA (5.8)
Equivalently, in differential form (by the divergence theorem):
1 2 1 2 1 2 2 1[ ].J E E J E H E H (5.9)
This general form is commonly simplified for a number of special cases. In particular, one usually
assumes that 1J and 2J are localized (i.e. have compact support), and that there are no incoming
waves from infinitely far away. In this case, if one integrates over all space then the surface-integral
terms cancel (see below) and one obtains:
1 2 1 2 .J E dV E J dV (5.10)
This result (along with the following simplifications) is sometimes called the Rayleigh-Carson
reciprocity theorem, after Lord Rayleigh's work on sound waves and an extension by John R.
Carson to applications for radio frequency antennas. Often, one further simplifies this relation by
considering point-like dipole sources, in which case the integrals disappear and one simply has the
product of the electric field with the corresponding dipole moments of the currents. Or, for wires of
negligible thickness, one obtains the applied current in one wire multiplied by the resulting voltage
across another and vice versa; see also below.
Another special case of the Lorentz reciprocity theorem applies when the volume V entirely
contains both of the localized sources (or alternatively if V intersects neither of the sources). In this
case:
1 2 2 1( ) ( ) .S S
E H dA E H dA (5.11)
5.5.2 Field Localization
This enhancement, on the other hand, originated from the strong field-localization in the broken
symmetry phase. Field localization here means that regardless of which port is used as the input
port, the field is always localized in the active resonator (i.e., resonator with gain and with less loss).
Therefore, the signal at the output port of the fiber taper coupled to this active resonator shows a
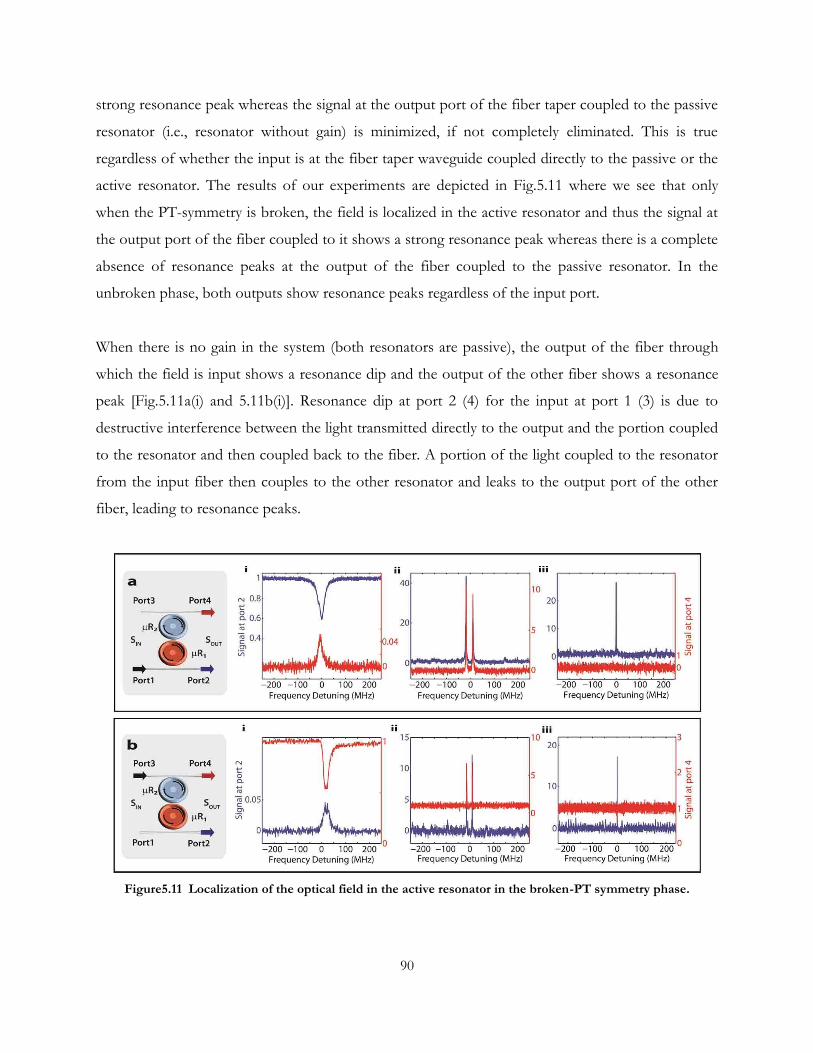
90
strong resonance peak whereas the signal at the output port of the fiber taper coupled to the passive
resonator (i.e., resonator without gain) is minimized, if not completely eliminated. This is true
regardless of whether the input is at the fiber taper waveguide coupled directly to the passive or the
active resonator. The results of our experiments are depicted in Fig.5.11 where we see that only
when the PT-symmetry is broken, the field is localized in the active resonator and thus the signal at
the output port of the fiber coupled to it shows a strong resonance peak whereas there is a complete
absence of resonance peaks at the output of the fiber coupled to the passive resonator. In the
unbroken phase, both outputs show resonance peaks regardless of the input port.
When there is no gain in the system (both resonators are passive), the output of the fiber through
which the field is input shows a resonance dip and the output of the other fiber shows a resonance
peak [Fig.5.11a(i) and 5.11b(i)]. Resonance dip at port 2 (4) for the input at port 1 (3) is due to
destructive interference between the light transmitted directly to the output and the portion coupled
to the resonator and then coupled back to the fiber. A portion of the light coupled to the resonator
from the input fiber then couples to the other resonator and leaks to the output port of the other
fiber, leading to resonance peaks.
Figure5.11 Localization of the optical field in the active resonator in the broken-PT symmetry phase.
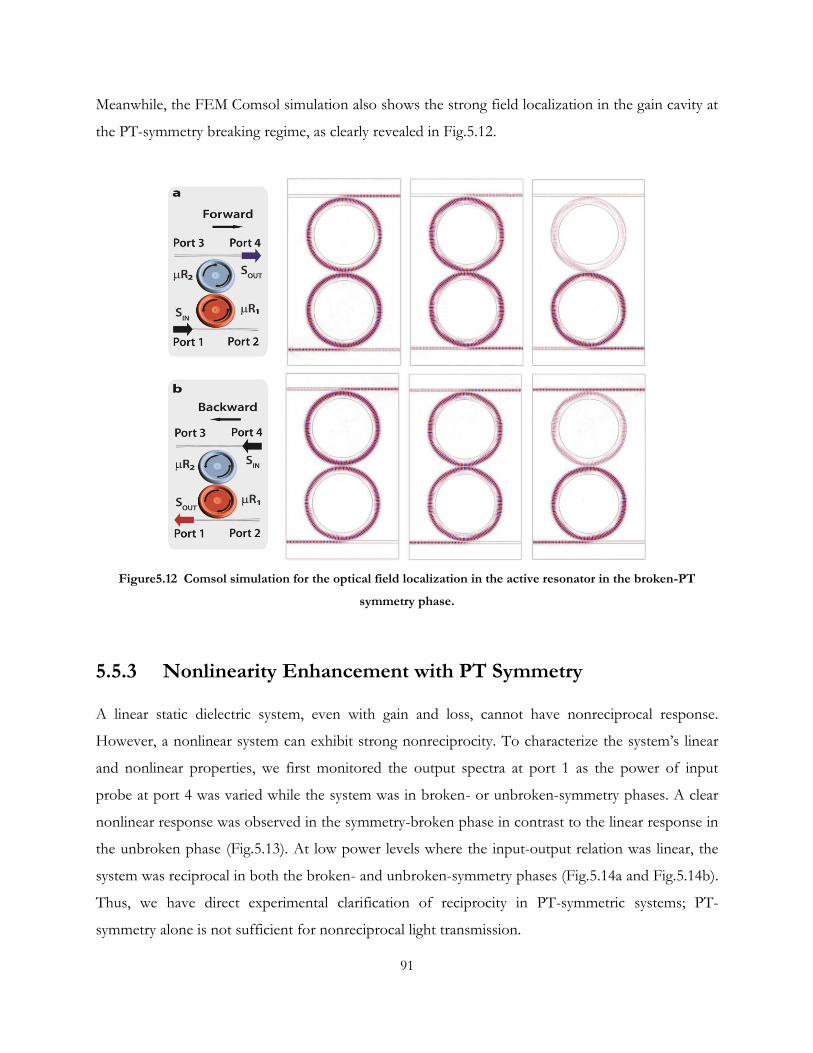
91
Meanwhile, the FEM Comsol simulation also shows the strong field localization in the gain cavity at
the PT-symmetry breaking regime, as clearly revealed in Fig.5.12.
Figure5.12 Comsol simulation for the optical field localization in the active resonator in the broken-PT
symmetry phase.
5.5.3 Nonlinearity Enhancement with PT Symmetry
A linear static dielectric system, even with gain and loss, cannot have nonreciprocal response.
However, a nonlinear system can exhibit strong nonreciprocity. To characterize the system’s linear
and nonlinear properties, we first monitored the output spectra at port 1 as the power of input
probe at port 4 was varied while the system was in broken- or unbroken-symmetry phases. A clear
nonlinear response was observed in the symmetry-broken phase in contrast to the linear response in
the unbroken phase (Fig.5.13). At low power levels where the input-output relation was linear, the
system was reciprocal in both the broken- and unbroken-symmetry phases (Fig.5.14a and Fig.5.14b).
Thus, we have direct experimental clarification of reciprocity in PT-symmetric systems; PT-
symmetry alone is not sufficient for nonreciprocal light transmission.
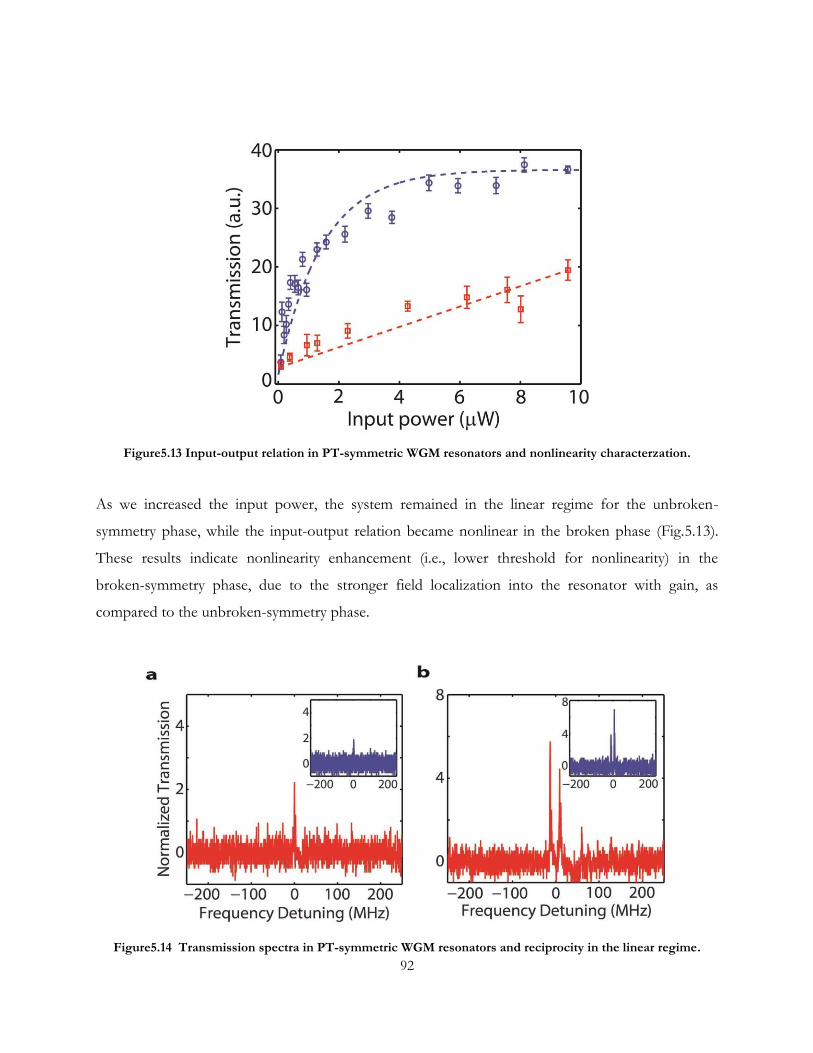
92
Figure5.13 Input-output relation in PT-symmetric WGM resonators and nonlinearity characterzation.
As we increased the input power, the system remained in the linear regime for the unbroken-
symmetry phase, while the input-output relation became nonlinear in the broken phase (Fig.5.13).
These results indicate nonlinearity enhancement (i.e., lower threshold for nonlinearity) in the
broken-symmetry phase, due to the stronger field localization into the resonator with gain, as
compared to the unbroken-symmetry phase.
Figure5.14 Transmission spectra in PT-symmetric WGM resonators and reciprocity in the linear regime.
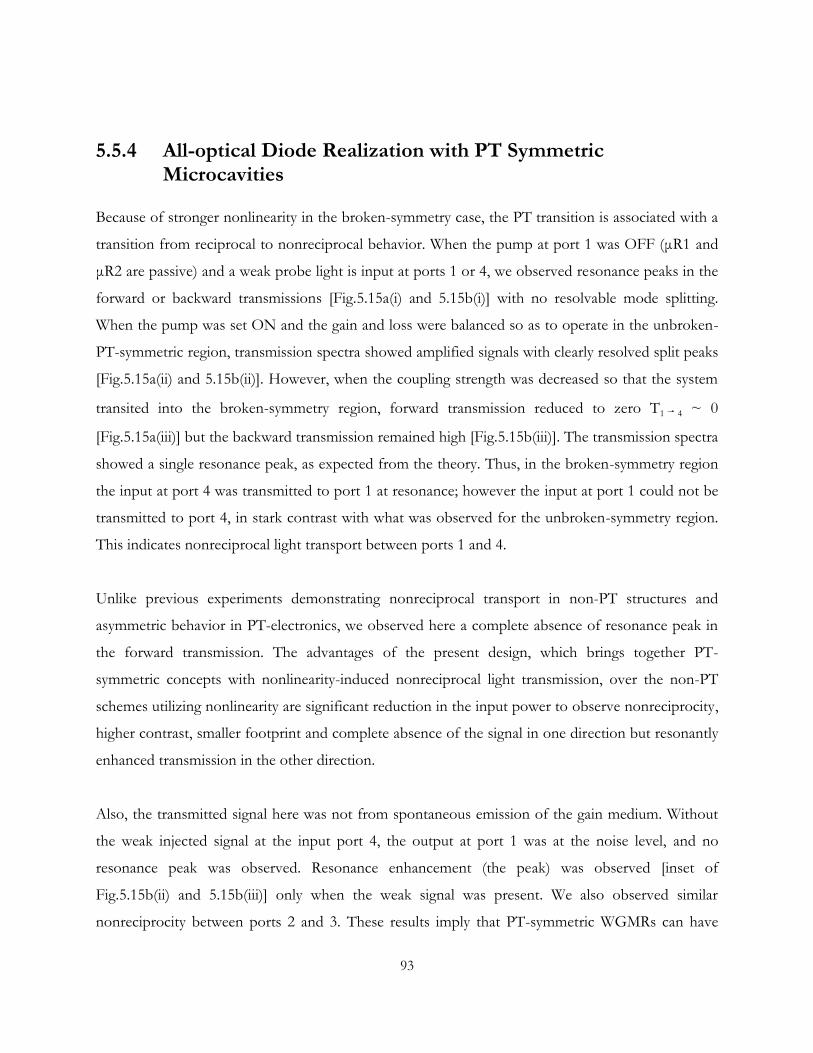
93
5.5.4 All-optical Diode Realization with PT Symmetric Microcavities
Because of stronger nonlinearity in the broken-symmetry case, the PT transition is associated with a
transition from reciprocal to nonreciprocal behavior. When the pump at port 1 was OFF (μR1 and
μR2 are passive) and a weak probe light is input at ports 1 or 4, we observed resonance peaks in the
forward or backward transmissions [Fig.5.15a(i) and 5.15b(i)] with no resolvable mode splitting.
When the pump was set ON and the gain and loss were balanced so as to operate in the unbroken-
PT-symmetric region, transmission spectra showed amplified signals with clearly resolved split peaks
[Fig.5.15a(ii) and 5.15b(ii)]. However, when the coupling strength was decreased so that the system
transited into the broken-symmetry region, forward transmission reduced to zero T1 → 4 ~ 0
[Fig.5.15a(iii)] but the backward transmission remained high [Fig.5.15b(iii)]. The transmission spectra
showed a single resonance peak, as expected from the theory. Thus, in the broken-symmetry region
the input at port 4 was transmitted to port 1 at resonance; however the input at port 1 could not be
transmitted to port 4, in stark contrast with what was observed for the unbroken-symmetry region.
This indicates nonreciprocal light transport between ports 1 and 4.
Unlike previous experiments demonstrating nonreciprocal transport in non-PT structures and
asymmetric behavior in PT-electronics, we observed here a complete absence of resonance peak in
the forward transmission. The advantages of the present design, which brings together PT-
symmetric concepts with nonlinearity-induced nonreciprocal light transmission, over the non-PT
schemes utilizing nonlinearity are significant reduction in the input power to observe nonreciprocity,
higher contrast, smaller footprint and complete absence of the signal in one direction but resonantly
enhanced transmission in the other direction.
Also, the transmitted signal here was not from spontaneous emission of the gain medium. Without
the weak injected signal at the input port 4, the output at port 1 was at the noise level, and no
resonance peak was observed. Resonance enhancement (the peak) was observed [inset of
Fig.5.15b(ii) and 5.15b(iii)] only when the weak signal was present. We also observed similar
nonreciprocity between ports 2 and 3. These results imply that PT-symmetric WGMRs can have
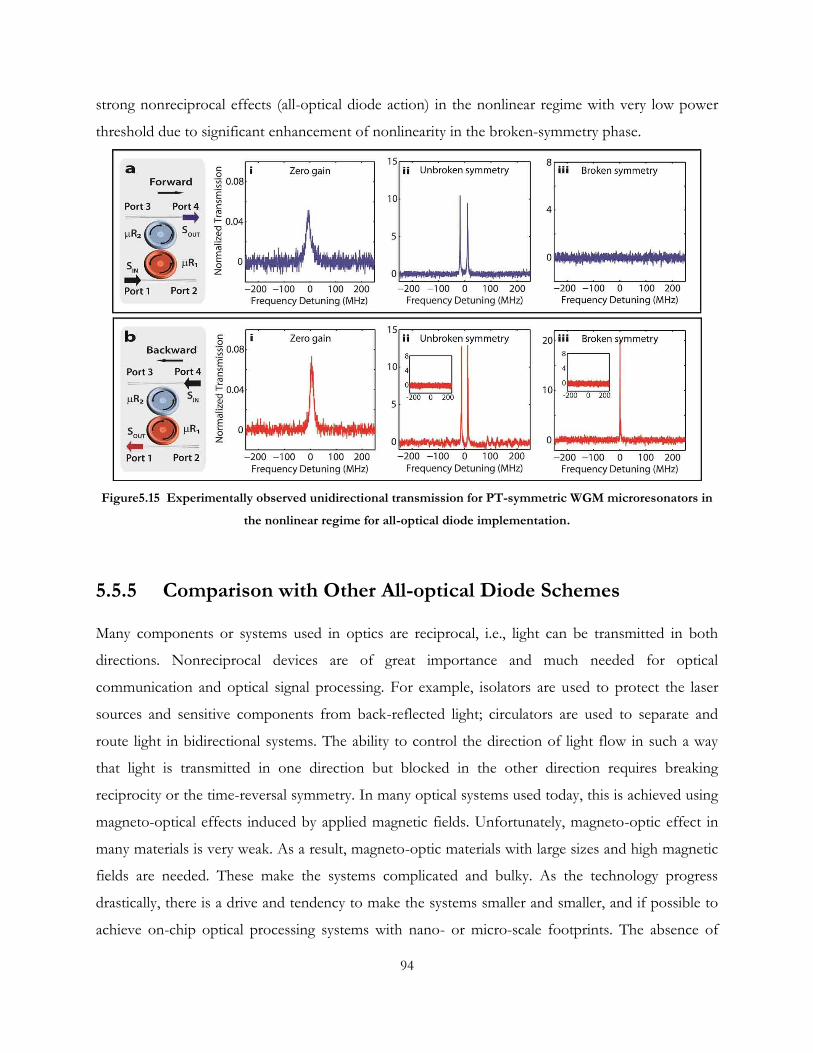
94
strong nonreciprocal effects (all-optical diode action) in the nonlinear regime with very low power
threshold due to significant enhancement of nonlinearity in the broken-symmetry phase.
Figure5.15 Experimentally observed unidirectional transmission for PT-symmetric WGM microresonators in
the nonlinear regime for all-optical diode implementation.
5.5.5 Comparison with Other All-optical Diode Schemes
Many components or systems used in optics are reciprocal, i.e., light can be transmitted in both
directions. Nonreciprocal devices are of great importance and much needed for optical
communication and optical signal processing. For example, isolators are used to protect the laser
sources and sensitive components from back-reflected light; circulators are used to separate and
route light in bidirectional systems. The ability to control the direction of light flow in such a way
that light is transmitted in one direction but blocked in the other direction requires breaking
reciprocity or the time-reversal symmetry. In many optical systems used today, this is achieved using
magneto-optical effects induced by applied magnetic fields. Unfortunately, magneto-optic effect in
many materials is very weak. As a result, magneto-optic materials with large sizes and high magnetic
fields are needed. These make the systems complicated and bulky. As the technology progress
drastically, there is a drive and tendency to make the systems smaller and smaller, and if possible to
achieve on-chip optical processing systems with nano- or micro-scale footprints. The absence of
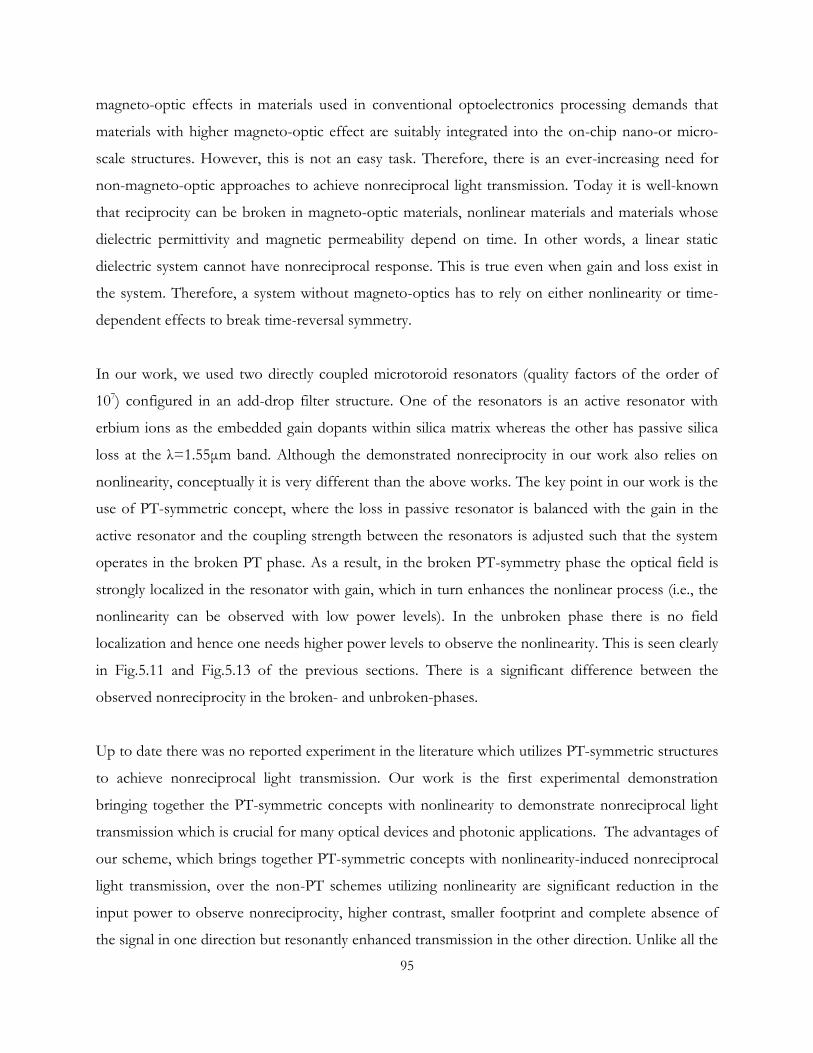
95
magneto-optic effects in materials used in conventional optoelectronics processing demands that
materials with higher magneto-optic effect are suitably integrated into the on-chip nano-or micro-
scale structures. However, this is not an easy task. Therefore, there is an ever-increasing need for
non-magneto-optic approaches to achieve nonreciprocal light transmission. Today it is well-known
that reciprocity can be broken in magneto-optic materials, nonlinear materials and materials whose
dielectric permittivity and magnetic permeability depend on time. In other words, a linear static
dielectric system cannot have nonreciprocal response. This is true even when gain and loss exist in
the system. Therefore, a system without magneto-optics has to rely on either nonlinearity or time-
dependent effects to break time-reversal symmetry.
In our work, we used two directly coupled microtoroid resonators (quality factors of the order of
107) configured in an add-drop filter structure. One of the resonators is an active resonator with
erbium ions as the embedded gain dopants within silica matrix whereas the other has passive silica
loss at the λ=1.55μm band. Although the demonstrated nonreciprocity in our work also relies on
nonlinearity, conceptually it is very different than the above works. The key point in our work is the
use of PT-symmetric concept, where the loss in passive resonator is balanced with the gain in the
active resonator and the coupling strength between the resonators is adjusted such that the system
operates in the broken PT phase. As a result, in the broken PT-symmetry phase the optical field is
strongly localized in the resonator with gain, which in turn enhances the nonlinear process (i.e., the
nonlinearity can be observed with low power levels). In the unbroken phase there is no field
localization and hence one needs higher power levels to observe the nonlinearity. This is seen clearly
in Fig.5.11 and Fig.5.13 of the previous sections. There is a significant difference between the
observed nonreciprocity in the broken- and unbroken-phases.
Up to date there was no reported experiment in the literature which utilizes PT-symmetric structures
to achieve nonreciprocal light transmission. Our work is the first experimental demonstration
bringing together the PT-symmetric concepts with nonlinearity to demonstrate nonreciprocal light
transmission which is crucial for many optical devices and photonic applications. The advantages of
our scheme, which brings together PT-symmetric concepts with nonlinearity-induced nonreciprocal
light transmission, over the non-PT schemes utilizing nonlinearity are significant reduction in the
input power to observe nonreciprocity, higher contrast, smaller footprint and complete absence of
the signal in one direction but resonantly enhanced transmission in the other direction. Unlike all the

96
experimental works mentioned above (those utilizing magneto-optical effects, nonlinearity and
interband transitions), we observed in this work a complete absence of resonance peak in one
direction. Our work constitutes the first direct experimental proof of the connection between
nonreciprocity and PT-symmetry which has been largely confused.

97
Chapter 6
Non-Hermitian System with WGM Photonic Molecules
In this chapter, we show how to build a non-Hermitian WGM photonic molecule and steer the
parameters of the optical system to the vicinity of an exceptional point (EP), a non-Hermitian
degeneracy observed when the eigenvalues and the corresponding eigenstates of a system coalesce.
We ultimately show how to turn losses into gain by steering the parameters of an optical system to
the vicinity of an exceptional point (EP). In our system of WGM silica resonator photonic
molecules, the EP transitions are manifested as the loss-induced suppression and revival of lasing.
Below a critical value, adding loss to the system annihilates an existing Raman laser. Beyond this
critical threshold, however, the lasing recovers despite the increasing loss, in stark contrast to what
one would expect from conventional laser theory. Our results exemplify the counterintuitive features
of non-Hermitian physics and present an innovative method for reversing the effect of loss.
6.1 Introduction to Non-hermitian Quantum Mechanics
6.1.1 Definition of Non-Hermitian in Quantum Mechanics
As briefly described in previous chapter, in quantum mechanics the Hermiticity of a Hamitonian H
is expressed as
†H H (6.1)
where the Dirac Hermitian conjugation symbol † represents the combined operations of matrix
transposition and complex conjugation [138,151,152].
Hamiltonians which are non-Hermitian have traditionally been used to describe dissipative
processes, such as the phenomenon of radioactive decay, or open system which experience energy
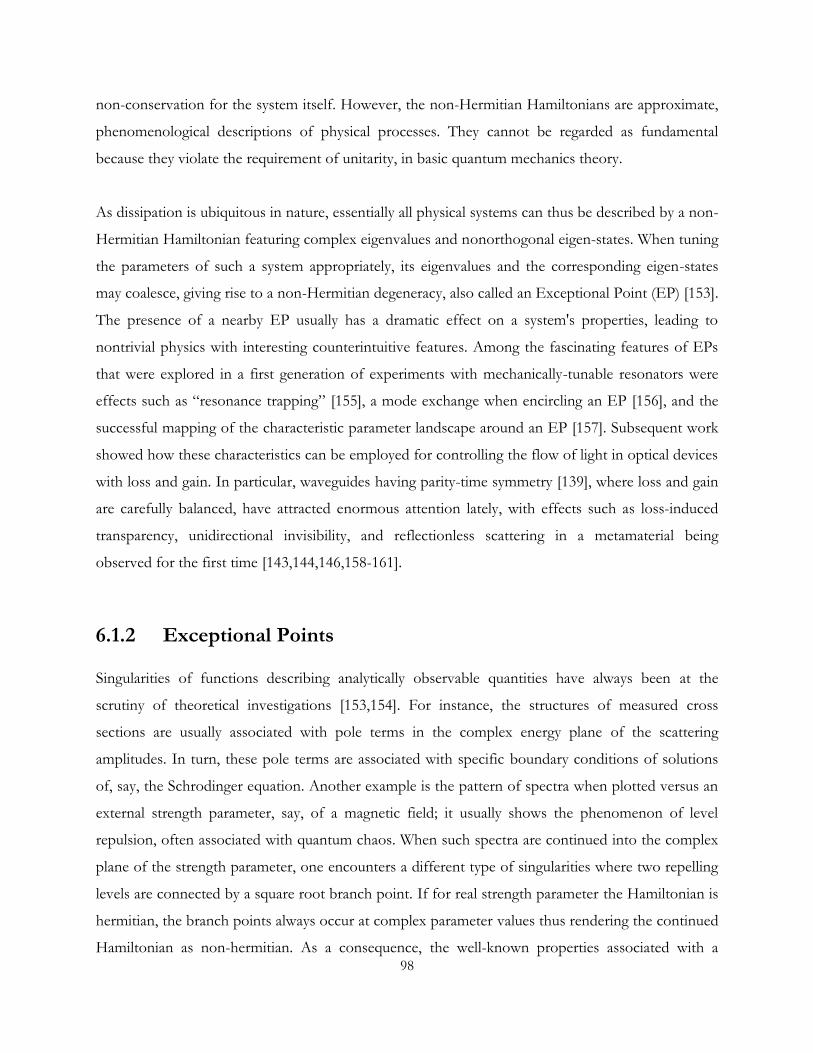
98
non-conservation for the system itself. However, the non-Hermitian Hamiltonians are approximate,
phenomenological descriptions of physical processes. They cannot be regarded as fundamental
because they violate the requirement of unitarity, in basic quantum mechanics theory.
As dissipation is ubiquitous in nature, essentially all physical systems can thus be described by a non-
Hermitian Hamiltonian featuring complex eigenvalues and nonorthogonal eigen-states. When tuning
the parameters of such a system appropriately, its eigenvalues and the corresponding eigen-states
may coalesce, giving rise to a non-Hermitian degeneracy, also called an Exceptional Point (EP) [153].
The presence of a nearby EP usually has a dramatic effect on a system's properties, leading to
nontrivial physics with interesting counterintuitive features. Among the fascinating features of EPs
that were explored in a first generation of experiments with mechanically-tunable resonators were
effects such as “resonance trapping” [155], a mode exchange when encircling an EP [156], and the
successful mapping of the characteristic parameter landscape around an EP [157]. Subsequent work
showed how these characteristics can be employed for controlling the flow of light in optical devices
with loss and gain. In particular, waveguides having parity-time symmetry [139], where loss and gain
are carefully balanced, have attracted enormous attention lately, with effects such as loss-induced
transparency, unidirectional invisibility, and reflectionless scattering in a metamaterial being
observed for the first time [143,144,146,158-161].
6.1.2 Exceptional Points
Singularities of functions describing analytically observable quantities have always been at the
scrutiny of theoretical investigations [153,154]. For instance, the structures of measured cross
sections are usually associated with pole terms in the complex energy plane of the scattering
amplitudes. In turn, these pole terms are associated with specific boundary conditions of solutions
of, say, the Schrodinger equation. Another example is the pattern of spectra when plotted versus an
external strength parameter, say, of a magnetic field; it usually shows the phenomenon of level
repulsion, often associated with quantum chaos. When such spectra are continued into the complex
plane of the strength parameter, one encounters a different type of singularities where two repelling
levels are connected by a square root branch point. If for real strength parameter the Hamiltonian is
hermitian, the branch points always occur at complex parameter values thus rendering the continued
Hamiltonian as non-hermitian. As a consequence, the well-known properties associated with a
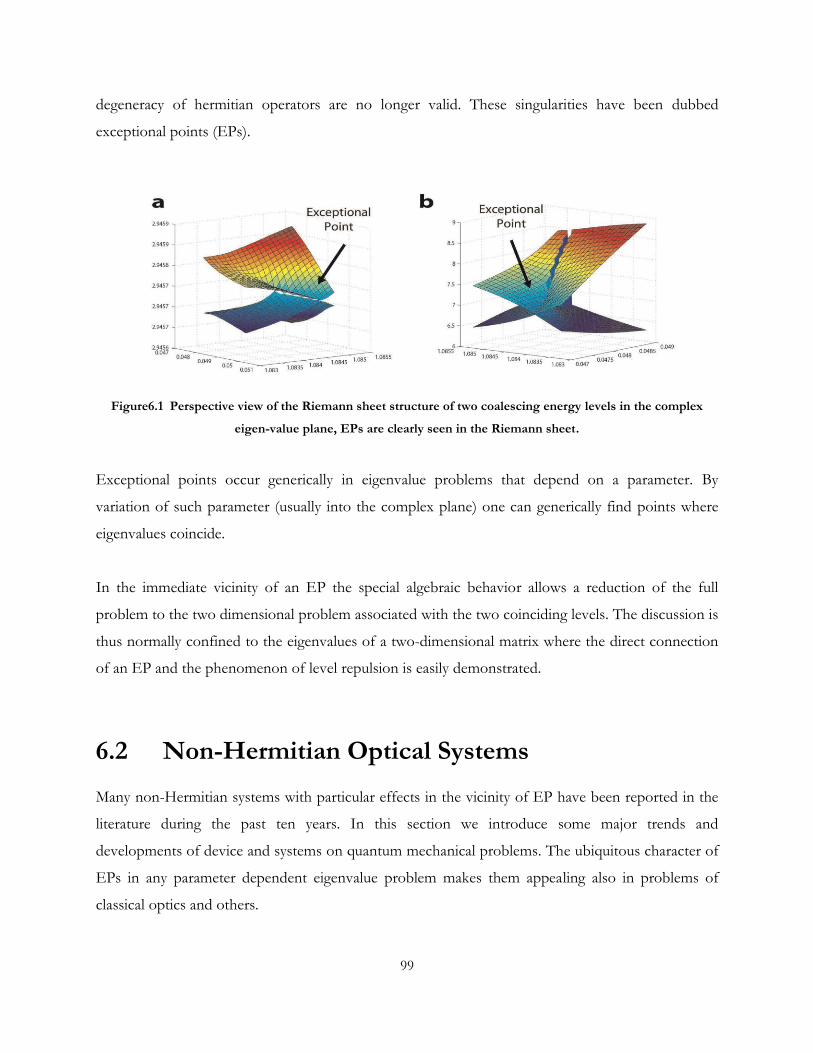
99
degeneracy of hermitian operators are no longer valid. These singularities have been dubbed
exceptional points (EPs).
Figure6.1 Perspective view of the Riemann sheet structure of two coalescing energy levels in the complex
eigen-value plane, EPs are clearly seen in the Riemann sheet.
Exceptional points occur generically in eigenvalue problems that depend on a parameter. By
variation of such parameter (usually into the complex plane) one can generically find points where
eigenvalues coincide.
In the immediate vicinity of an EP the special algebraic behavior allows a reduction of the full
problem to the two dimensional problem associated with the two coinciding levels. The discussion is
thus normally confined to the eigenvalues of a two-dimensional matrix where the direct connection
of an EP and the phenomenon of level repulsion is easily demonstrated.
6.2 Non-Hermitian Optical Systems
Many non-Hermitian systems with particular effects in the vicinity of EP have been reported in the
literature during the past ten years. In this section we introduce some major trends and
developments of device and systems on quantum mechanical problems. The ubiquitous character of
EPs in any parameter dependent eigenvalue problem makes them appealing also in problems of
classical optics and others.
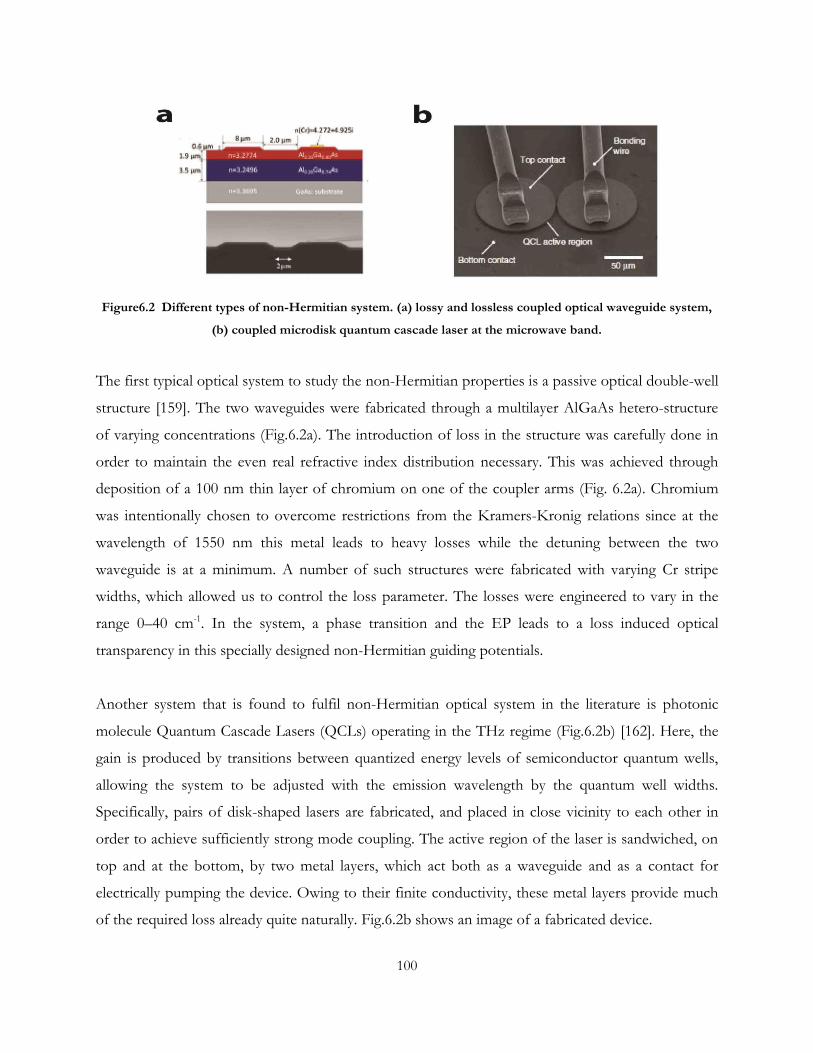
100
Figure6.2 Different types of non-Hermitian system. (a) lossy and lossless coupled optical waveguide system,
(b) coupled microdisk quantum cascade laser at the microwave band.
The first typical optical system to study the non-Hermitian properties is a passive optical double-well
structure [159]. The two waveguides were fabricated through a multilayer AlGaAs hetero-structure
of varying concentrations (Fig.6.2a). The introduction of loss in the structure was carefully done in
order to maintain the even real refractive index distribution necessary. This was achieved through
deposition of a 100 nm thin layer of chromium on one of the coupler arms (Fig. 6.2a). Chromium
was intentionally chosen to overcome restrictions from the Kramers-Kronig relations since at the
wavelength of 1550 nm this metal leads to heavy losses while the detuning between the two
waveguide is at a minimum. A number of such structures were fabricated with varying Cr stripe
widths, which allowed us to control the loss parameter. The losses were engineered to vary in the
range 0–40 cm-1. In the system, a phase transition and the EP leads to a loss induced optical
transparency in this specially designed non-Hermitian guiding potentials.
Another system that is found to fulfil non-Hermitian optical system in the literature is photonic
molecule Quantum Cascade Lasers (QCLs) operating in the THz regime (Fig.6.2b) [162]. Here, the
gain is produced by transitions between quantized energy levels of semiconductor quantum wells,
allowing the system to be adjusted with the emission wavelength by the quantum well widths.
Specifically, pairs of disk-shaped lasers are fabricated, and placed in close vicinity to each other in
order to achieve sufficiently strong mode coupling. The active region of the laser is sandwiched, on
top and at the bottom, by two metal layers, which act both as a waveguide and as a contact for
electrically pumping the device. Owing to their finite conductivity, these metal layers provide much
of the required loss already quite naturally. Fig.6.2b shows an image of a fabricated device.
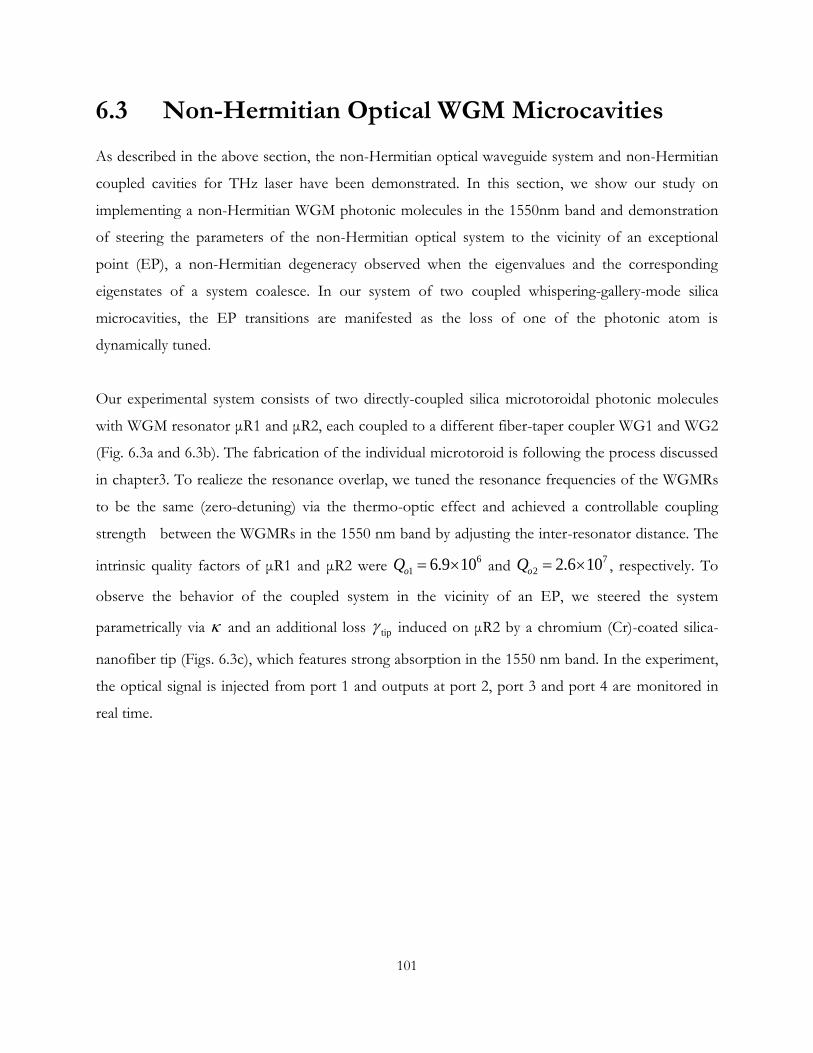
101
6.3 Non-Hermitian Optical WGM Microcavities
As described in the above section, the non-Hermitian optical waveguide system and non-Hermitian
coupled cavities for THz laser have been demonstrated. In this section, we show our study on
implementing a non-Hermitian WGM photonic molecules in the 1550nm band and demonstration
of steering the parameters of the non-Hermitian optical system to the vicinity of an exceptional
point (EP), a non-Hermitian degeneracy observed when the eigenvalues and the corresponding
eigenstates of a system coalesce. In our system of two coupled whispering-gallery-mode silica
microcavities, the EP transitions are manifested as the loss of one of the photonic atom is
dynamically tuned.
Our experimental system consists of two directly-coupled silica microtoroidal photonic molecules
with WGM resonator μR1 and μR2, each coupled to a different fiber-taper coupler WG1 and WG2
(Fig. 6.3a and 6.3b). The fabrication of the individual microtoroid is following the process discussed
in chapter3. To realieze the resonance overlap, we tuned the resonance frequencies of the WGMRs
to be the same (zero-detuning) via the thermo-optic effect and achieved a controllable coupling
strength between the WGMRs in the 1550 nm band by adjusting the inter-resonator distance. The
intrinsic quality factors of μR1 and μR2 were 6
1 6.9 10oQ and 7
2 2.6 10oQ , respectively. To
observe the behavior of the coupled system in the vicinity of an EP, we steered the system
parametrically via and an additional loss tip induced on μR2 by a chromium (Cr)-coated silica-
nanofiber tip (Figs. 6.3c), which features strong absorption in the 1550 nm band. In the experiment,
the optical signal is injected from port 1 and outputs at port 2, port 3 and port 4 are monitored in
real time.
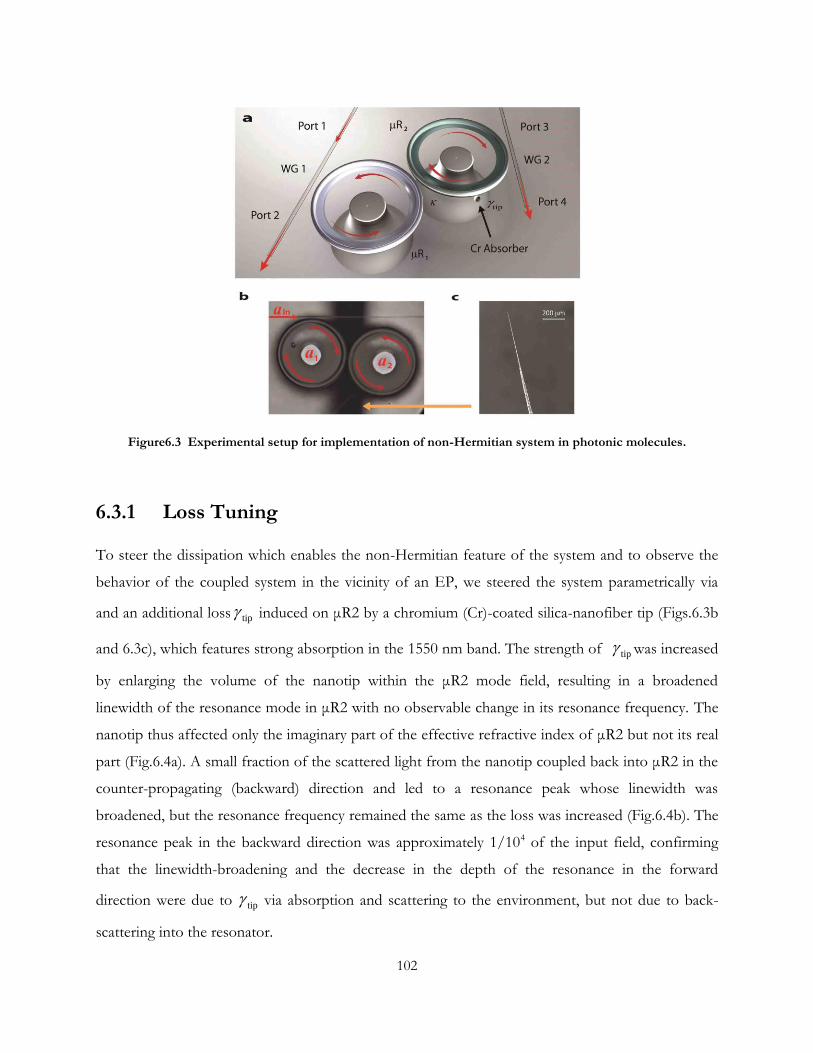
102
Figure6.3 Experimental setup for implementation of non-Hermitian system in photonic molecules.
6.3.1 Loss Tuning
To steer the dissipation which enables the non-Hermitian feature of the system and to observe the
behavior of the coupled system in the vicinity of an EP, we steered the system parametrically via
and an additional loss tip induced on μR2 by a chromium (Cr)-coated silica-nanofiber tip (Figs.6.3b
and 6.3c), which features strong absorption in the 1550 nm band. The strength of tip was increased
by enlarging the volume of the nanotip within the μR2 mode field, resulting in a broadened
linewidth of the resonance mode in μR2 with no observable change in its resonance frequency. The
nanotip thus affected only the imaginary part of the effective refractive index of μR2 but not its real
part (Fig.6.4a). A small fraction of the scattered light from the nanotip coupled back into μR2 in the
counter-propagating (backward) direction and led to a resonance peak whose linewidth was
broadened, but the resonance frequency remained the same as the loss was increased (Fig.6.4b). The
resonance peak in the backward direction was approximately 1/104 of the input field, confirming
that the linewidth-broadening and the decrease in the depth of the resonance in the forward
direction were due to tip via absorption and scattering to the environment, but not due to back-
scattering into the resonator.
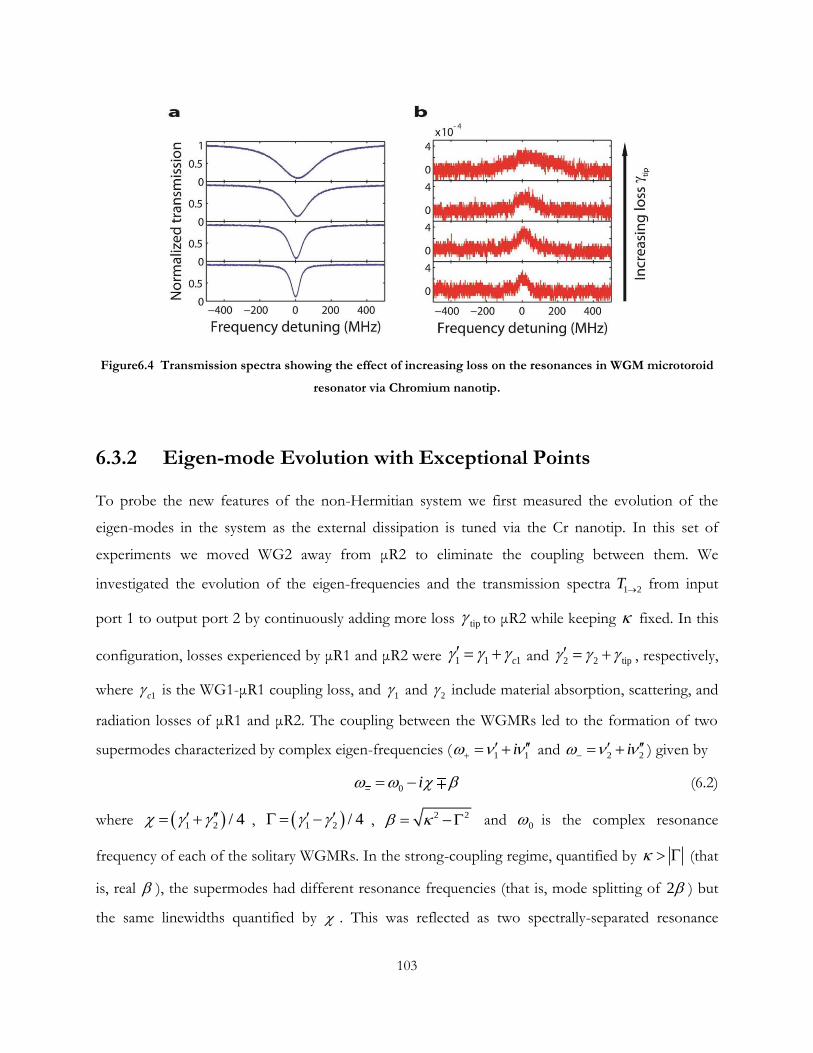
103
Figure6.4 Transmission spectra showing the effect of increasing loss on the resonances in WGM microtoroid
resonator via Chromium nanotip.
6.3.2 Eigen-mode Evolution with Exceptional Points
To probe the new features of the non-Hermitian system we first measured the evolution of the
eigen-modes in the system as the external dissipation is tuned via the Cr nanotip. In this set of
experiments we moved WG2 away from μR2 to eliminate the coupling between them. We
investigated the evolution of the eigen-frequencies and the transmission spectra 1 2T from input
port 1 to output port 2 by continuously adding more loss tip to μR2 while keeping fixed. In this
configuration, losses experienced by μR1 and μR2 were 1 1 1c and 2 2 tip , respectively,
where 1c is the WG1-μR1 coupling loss, and 1 and 2 include material absorption, scattering, and
radiation losses of μR1 and μR2. The coupling between the WGMRs led to the formation of two
supermodes characterized by complex eigen-frequencies ( 1 1i and 2 2i
) given by
0 i (6.2)
where 1 2 / 4 , 1 2 / 4 , 2 2 and 0 is the complex resonance
frequency of each of the solitary WGMRs. In the strong-coupling regime, quantified by (that
is, real ), the supermodes had different resonance frequencies (that is, mode splitting of 2 ) but
the same linewidths quantified by . This was reflected as two spectrally-separated resonance
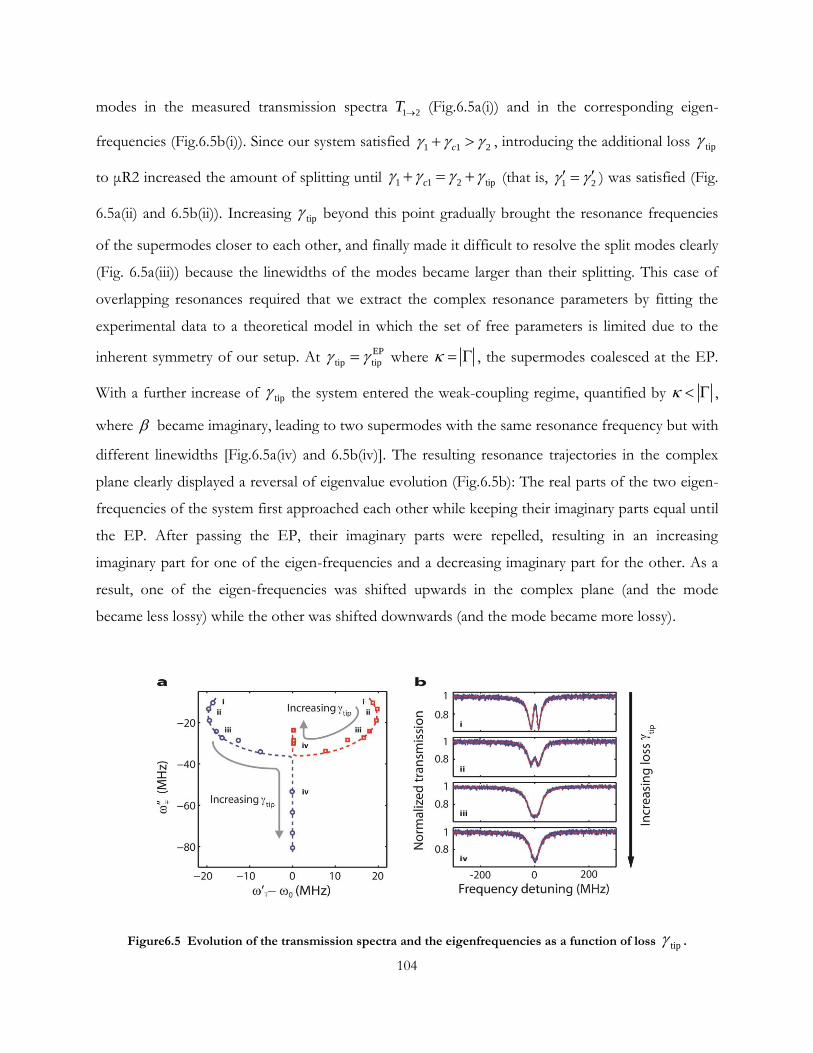
104
modes in the measured transmission spectra 1 2T (Fig.6.5a(i)) and in the corresponding eigen-
frequencies (Fig.6.5b(i)). Since our system satisfied 1 1 2c , introducing the additional loss tip
to μR2 increased the amount of splitting until 1 1 2 tipc (that is, 1 2 ) was satisfied (Fig.
6.5a(ii) and 6.5b(ii)). Increasing tip beyond this point gradually brought the resonance frequencies
of the supermodes closer to each other, and finally made it difficult to resolve the split modes clearly
(Fig. 6.5a(iii)) because the linewidths of the modes became larger than their splitting. This case of
overlapping resonances required that we extract the complex resonance parameters by fitting the
experimental data to a theoretical model in which the set of free parameters is limited due to the
inherent symmetry of our setup. At EP
tip tip where , the supermodes coalesced at the EP.
With a further increase of tip the system entered the weak-coupling regime, quantified by ,
where became imaginary, leading to two supermodes with the same resonance frequency but with
different linewidths [Fig.6.5a(iv) and 6.5b(iv)]. The resulting resonance trajectories in the complex
plane clearly displayed a reversal of eigenvalue evolution (Fig.6.5b): The real parts of the two eigen-
frequencies of the system first approached each other while keeping their imaginary parts equal until
the EP. After passing the EP, their imaginary parts were repelled, resulting in an increasing
imaginary part for one of the eigen-frequencies and a decreasing imaginary part for the other. As a
result, one of the eigen-frequencies was shifted upwards in the complex plane (and the mode
became less lossy) while the other was shifted downwards (and the mode became more lossy).
Figure6.5 Evolution of the transmission spectra and the eigenfrequencies as a function of loss tip .

105
Next, we checked the co-manipulation of the inter-cavity coupling strength and the additional loss
tip to the evolution of the eigen-modes. By repeating the experiments for different and tip we
obtained the eigen-frequency surfaces 2( , ) . We depict both their real and imaginary parts (
1,2 2( , ) and 1,2 2( , ) ) in Figs. 6.6a and 6.6b, respectively. The resulting surfaces exhibit a
complex square-root-function topology with the special feature that, due to the identical resonance
frequencies 0 of the solitary WGMRs, a coalescence of the eigen-frequencies can be realized by
varying either or tip alone, leading to a continuous thread of EPs along what may be called an
exceptional line. As expected, the slope of this line is such that stronger requires higher values of
tip to reach the EP.
Figure6.6 Evolution of the eigen-frequencies as a function of loss tip and coupling strength .
If we compare the eigen-mode evolution with tip tuning at different inter-cavity coupling strength
, we can find the different to reach the EP. Fig. 6.7a and Fig. 6.7b provide additional results which
depict the difference between the real (Fig.6.7a) and imaginary (Fig.6.7b) parts of the eigen-
frequencies as a function of the induced loss tip and the coupling strength . It is seen that the
coalescence of eigen-frequencies (EP) occurs at different tip for different : The EP transition
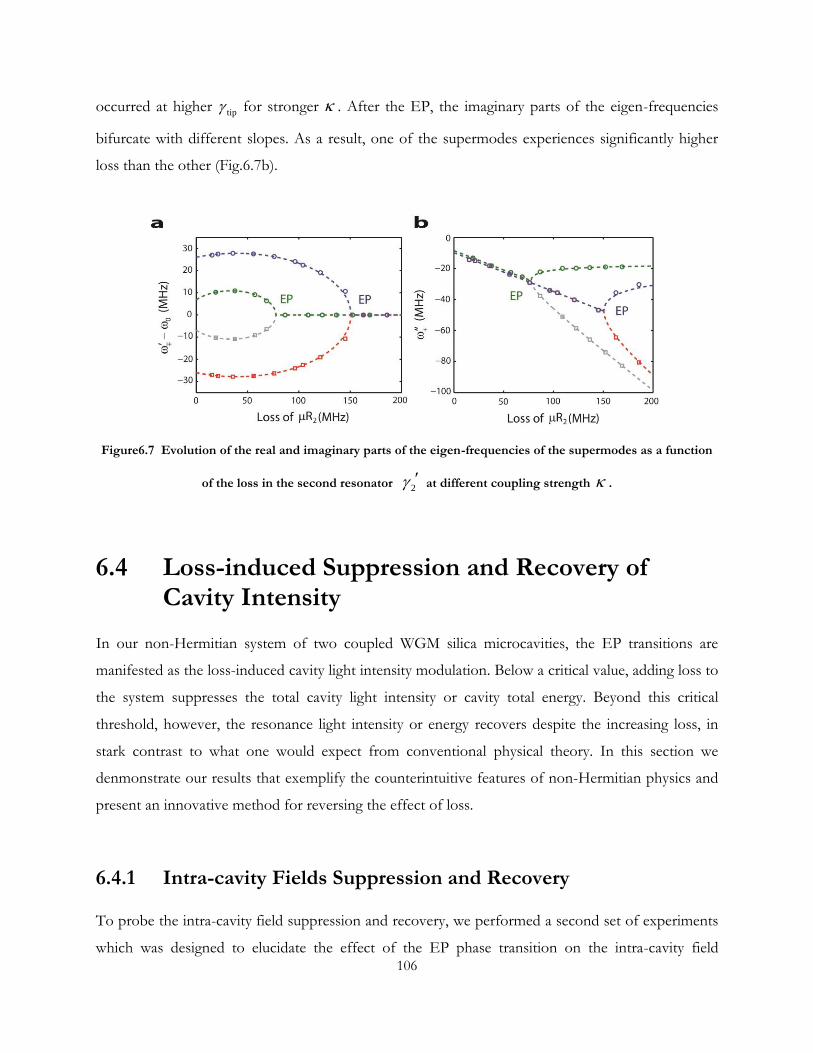
106
occurred at higher tip for stronger . After the EP, the imaginary parts of the eigen-frequencies
bifurcate with different slopes. As a result, one of the supermodes experiences significantly higher
loss than the other (Fig.6.7b).
Figure6.7 Evolution of the real and imaginary parts of the eigen-frequencies of the supermodes as a function
of the loss in the second resonator 2 at different coupling strength .
6.4 Loss-induced Suppression and Recovery of Cavity Intensity
In our non-Hermitian system of two coupled WGM silica microcavities, the EP transitions are
manifested as the loss-induced cavity light intensity modulation. Below a critical value, adding loss to
the system suppresses the total cavity light intensity or cavity total energy. Beyond this critical
threshold, however, the resonance light intensity or energy recovers despite the increasing loss, in
stark contrast to what one would expect from conventional physical theory. In this section we
denmonstrate our results that exemplify the counterintuitive features of non-Hermitian physics and
present an innovative method for reversing the effect of loss.
6.4.1 Intra-cavity Fields Suppression and Recovery
To probe the intra-cavity field suppression and recovery, we performed a second set of experiments
which was designed to elucidate the effect of the EP phase transition on the intra-cavity field
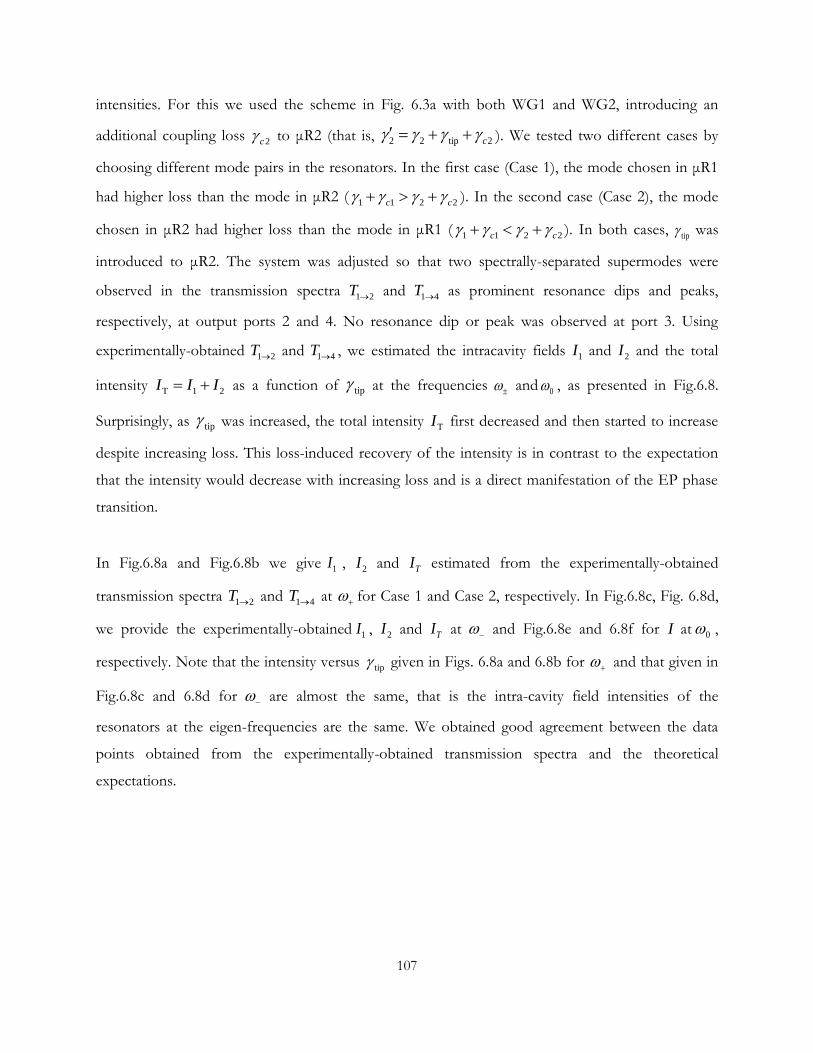
107
intensities. For this we used the scheme in Fig. 6.3a with both WG1 and WG2, introducing an
additional coupling loss 2c to μR2 (that is, 2 2 tip 2c ). We tested two different cases by
choosing different mode pairs in the resonators. In the first case (Case 1), the mode chosen in μR1
had higher loss than the mode in μR2 ( 1 1 2 2c c ). In the second case (Case 2), the mode
chosen in μR2 had higher loss than the mode in μR1 ( 1 1 2 2c c ). In both cases, tip was
introduced to μR2. The system was adjusted so that two spectrally-separated supermodes were
observed in the transmission spectra 1 2T and 1 4T as prominent resonance dips and peaks,
respectively, at output ports 2 and 4. No resonance dip or peak was observed at port 3. Using
experimentally-obtained 1 2T and 1 4T , we estimated the intracavity fields 1I and 2I and the total
intensity T 1 2I I I as a function of tip at the frequencies and
0 , as presented in Fig.6.8.
Surprisingly, as tip was increased, the total intensity TI first decreased and then started to increase
despite increasing loss. This loss-induced recovery of the intensity is in contrast to the expectation
that the intensity would decrease with increasing loss and is a direct manifestation of the EP phase
transition.
In Fig.6.8a and Fig.6.8b we give 1I , 2I and TI estimated from the experimentally-obtained
transmission spectra 1 2T and 1 4T at for Case 1 and Case 2, respectively. In Fig.6.8c, Fig. 6.8d,
we provide the experimentally-obtained 1I , 2I and TI at and Fig.6.8e and 6.8f for I at 0 ,
respectively. Note that the intensity versus tip given in Figs. 6.8a and 6.8b for and that given in
Fig.6.8c and 6.8d for are almost the same, that is the intra-cavity field intensities of the
resonators at the eigen-frequencies are the same. We obtained good agreement between the data
points obtained from the experimentally-obtained transmission spectra and the theoretical
expectations.
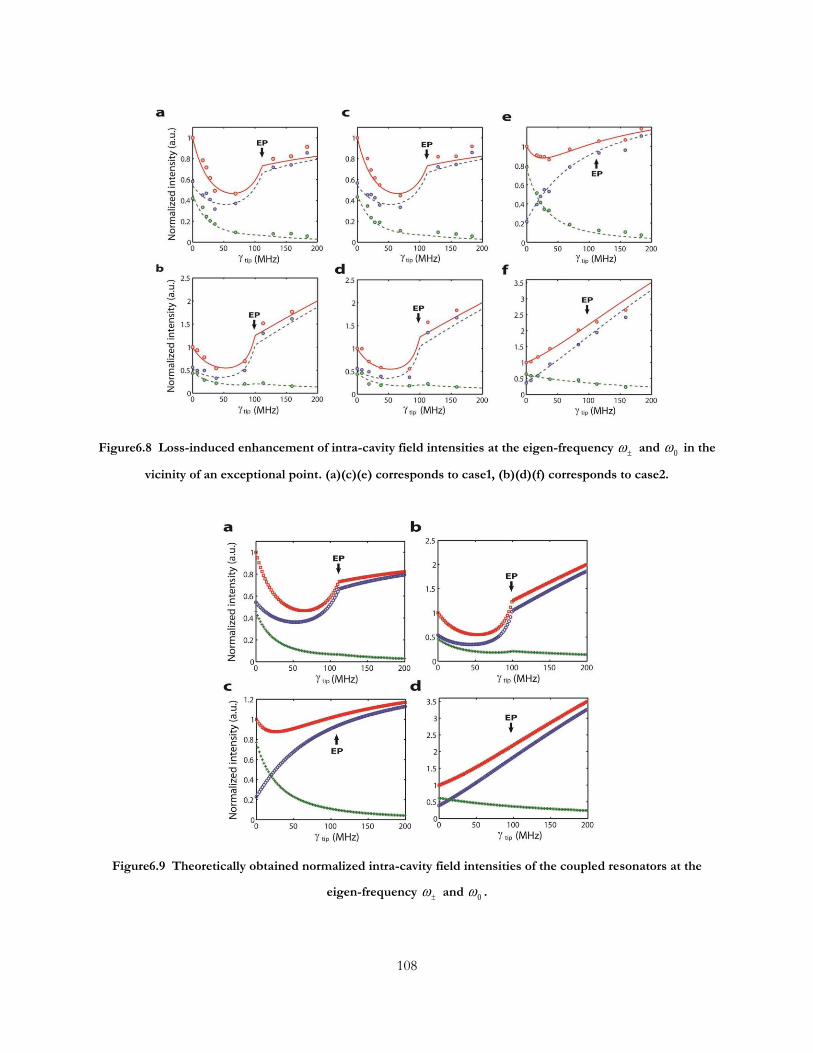
108
Figure6.8 Loss-induced enhancement of intra-cavity field intensities at the eigen-frequency and 0 in the
vicinity of an exceptional point. (a)(c)(e) corresponds to case1, (b)(d)(f) corresponds to case2.
Figure6.9 Theoretically obtained normalized intra-cavity field intensities of the coupled resonators at the
eigen-frequency and
0 .
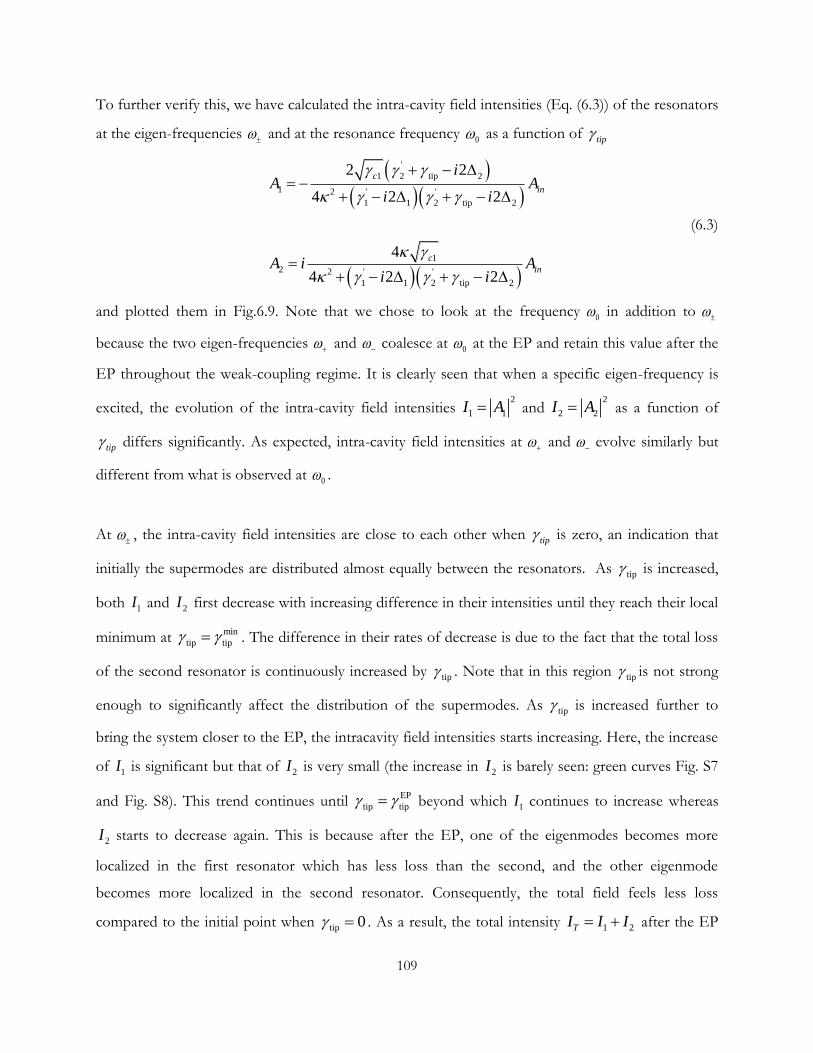
109
To further verify this, we have calculated the intra-cavity field intensities (Eq. (6.3)) of the resonators
at the eigen-frequencies and at the resonance frequency
0 as a function of tip
'
1 2 tip 2
1 2 ' '
1 1 2 tip 2
1
2 2 ' '
1 1 2 tip 2
2 2
4 2 2
4
4 2 2
c
in
c
in
iA A
i i
A i Ai i
(6.3)
and plotted them in Fig.6.9. Note that we chose to look at the frequency 0 in addition to
because the two eigen-frequencies and
coalesce at 0 at the EP and retain this value after the
EP throughout the weak-coupling regime. It is clearly seen that when a specific eigen-frequency is
excited, the evolution of the intra-cavity field intensities 2
1 1I A and 2
2 2I A as a function of
tip differs significantly. As expected, intra-cavity field intensities at and
evolve similarly but
different from what is observed at 0 .
At , the intra-cavity field intensities are close to each other when tip is zero, an indication that
initially the supermodes are distributed almost equally between the resonators. As tip is increased,
both 1I and 2I first decrease with increasing difference in their intensities until they reach their local
minimum at min
tip tip . The difference in their rates of decrease is due to the fact that the total loss
of the second resonator is continuously increased by tip . Note that in this region
tip is not strong
enough to significantly affect the distribution of the supermodes. As tip is increased further to
bring the system closer to the EP, the intracavity field intensities starts increasing. Here, the increase
of 1I is significant but that of 2I is very small (the increase in 2I is barely seen: green curves Fig. S7
and Fig. S8). This trend continues until EP
tip tip beyond which 1I continues to increase whereas
2I starts to decrease again. This is because after the EP, one of the eigenmodes becomes more
localized in the first resonator which has less loss than the second, and the other eigenmode
becomes more localized in the second resonator. Consequently, the total field feels less loss
compared to the initial point when tip 0 . As a result, the total intensity 1 2TI I I after the EP
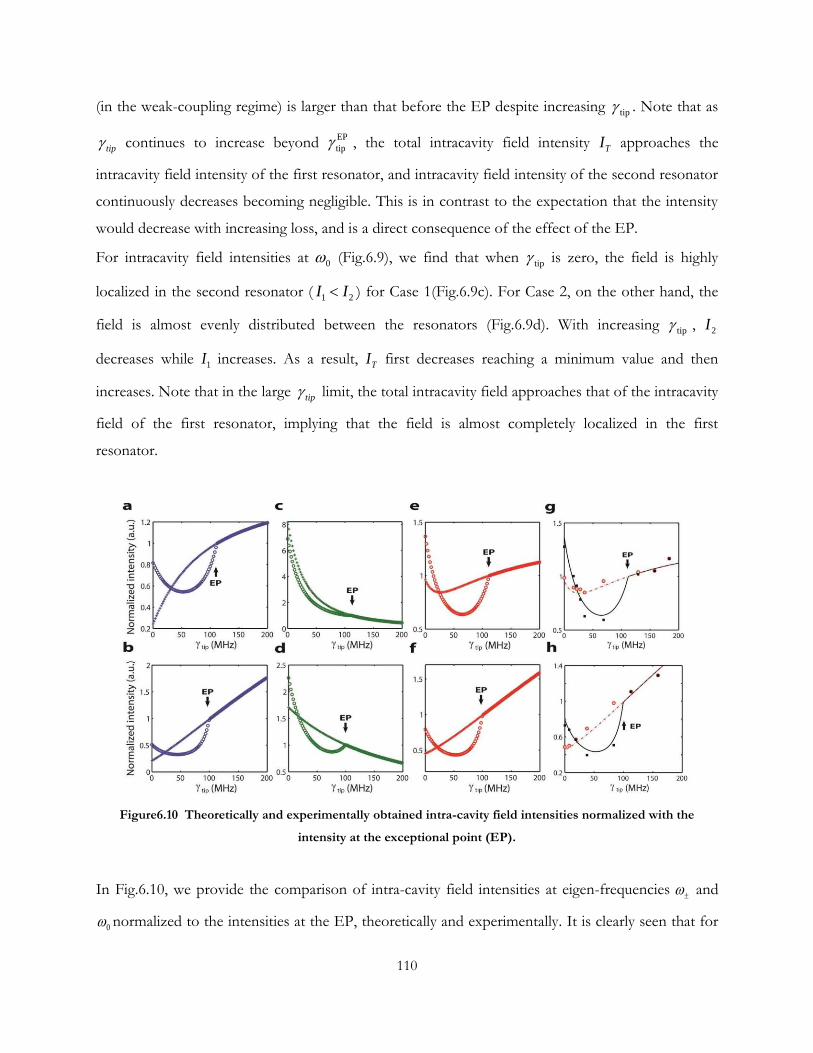
110
(in the weak-coupling regime) is larger than that before the EP despite increasing tip . Note that as
tip continues to increase beyond EP
tip , the total intracavity field intensity TI approaches the
intracavity field intensity of the first resonator, and intracavity field intensity of the second resonator
continuously decreases becoming negligible. This is in contrast to the expectation that the intensity
would decrease with increasing loss, and is a direct consequence of the effect of the EP.
For intracavity field intensities at 0 (Fig.6.9), we find that when tip is zero, the field is highly
localized in the second resonator ( 1 2I I ) for Case 1(Fig.6.9c). For Case 2, on the other hand, the
field is almost evenly distributed between the resonators (Fig.6.9d). With increasing tip , 2I
decreases while 1I increases. As a result, TI first decreases reaching a minimum value and then
increases. Note that in the large tip limit, the total intracavity field approaches that of the intracavity
field of the first resonator, implying that the field is almost completely localized in the first
resonator.
Figure6.10 Theoretically and experimentally obtained intra-cavity field intensities normalized with the
intensity at the exceptional point (EP).
In Fig.6.10, we provide the comparison of intra-cavity field intensities at eigen-frequencies and
0 normalized to the intensities at the EP, theoretically and experimentally. It is clearly seen that for
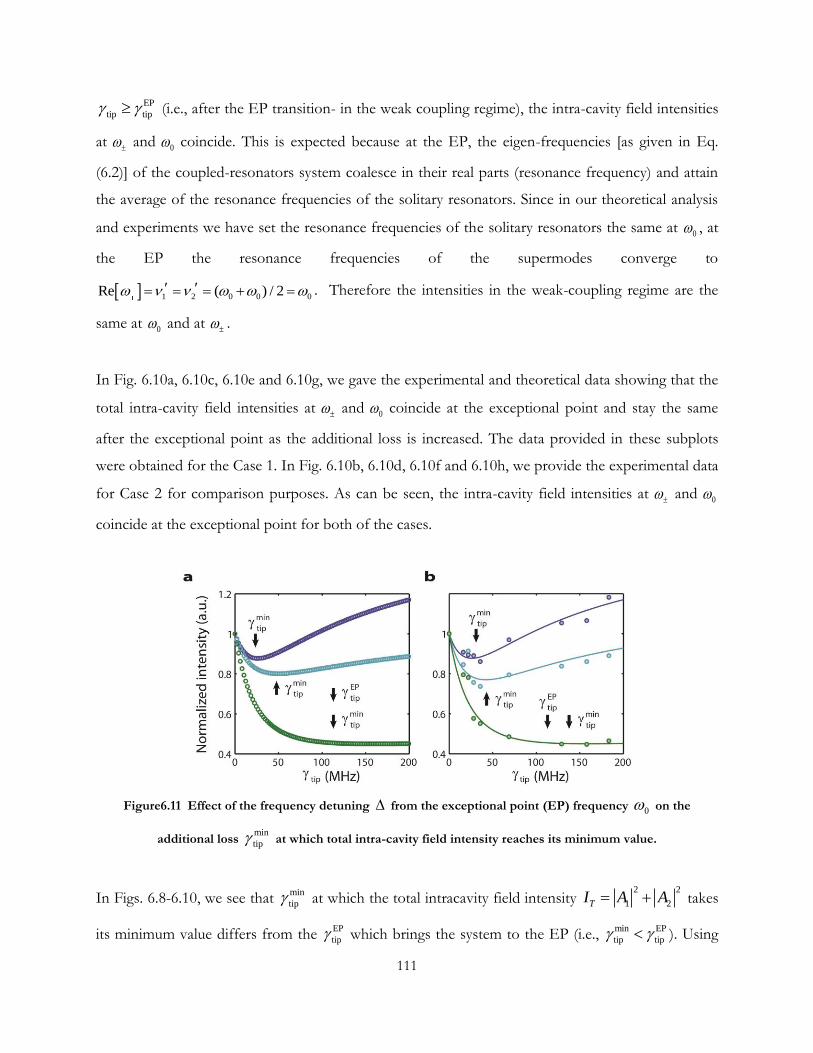
111
EP
tip tip (i.e., after the EP transition- in the weak coupling regime), the intra-cavity field intensities
at and
0 coincide. This is expected because at the EP, the eigen-frequencies [as given in Eq.
(6.2)] of the coupled-resonators system coalesce in their real parts (resonance frequency) and attain
the average of the resonance frequencies of the solitary resonators. Since in our theoretical analysis
and experiments we have set the resonance frequencies of the solitary resonators the same at 0 , at
the EP the resonance frequencies of the supermodes converge to
1 2 0 0 0Re ( ) / 2 . Therefore the intensities in the weak-coupling regime are the
same at 0 and at
.
In Fig. 6.10a, 6.10c, 6.10e and 6.10g, we gave the experimental and theoretical data showing that the
total intra-cavity field intensities at and
0 coincide at the exceptional point and stay the same
after the exceptional point as the additional loss is increased. The data provided in these subplots
were obtained for the Case 1. In Fig. 6.10b, 6.10d, 6.10f and 6.10h, we provide the experimental data
for Case 2 for comparison purposes. As can be seen, the intra-cavity field intensities at and
0
coincide at the exceptional point for both of the cases.
Figure6.11 Effect of the frequency detuning from the exceptional point (EP) frequency 0 on the
additional loss min
tip at which total intra-cavity field intensity reaches its minimum value.
In Figs. 6.8-6.10, we see that min
tip at which the total intracavity field intensity 2 2
1 2TI A A takes
its minimum value differs from the EP
tip which brings the system to the EP (i.e., min EP
tip tip ). Using
112
the expressions given in Eq. (6.3) and assuming 1 2 (i.e., 2 1 0 and 0 ) as
this is the condition in our experiments, we find that TI takes its minimum value at
min
tip :
2
2 2 2 2 2 2 2
1 1 2 1 1min
tip
1
2 4 3 4 12 64
2
(6.4)
On the other hand, from Eq. (6.2) and the discussions in the previous subsections, we know that
tip required to bring the system to the EP is given by
EP
tip 2 1 4 (6.5)
which, contrary to min
tip , does not depend on . From Eqs. (6.4) and (6.5), we find min EP
tip tip is
satisfied only when Eqs. (6.6) and (6.7) are simultaneously satisfied
EP
tip 2 1 4 (6.6)
1
1
2
2 3
(6.7)
In Figs. 6.8-6.10, we presented TI at frequencies 0 (i.e., 0 ), (i.e., 0 ), and
(i.e., 0 ). In none of these cases, Eqs. (6.6) and (6.7) are satisfied. For example,
for the first case 0 , we have 0 which is satisfied when 0 or 1 / 2 . The former
implies that there is no coupling which is not the case here. The latter implies gain in the first
resonator which is not realized in our experiments. (Note that 1 0 implies net loss whereas 1 0
implies net gain in the first resonator). In addition, plugging 1 / 2 in Eq. (6.6) leads to
EP
tip 2 1 1 2 12 which implies that under this condition the EP can only be
observed with a net total gain in the compound resonator system. Therefore, it is normal that min
tip
and EP
tip do not coincide in our simulations and experiments where we have calculated and
estimated TI at 0 . In Fig. 6.11, we present the effect of on min
tip both theoretically and
experimentally, and determine which leads to min EP
tip tip in our system. The theoretical curves
were plotted for typical values of system parameters in our experiments. As increases, min
tip
approaches EP
tip . The theoretically expected value for leading to min EP
tip tip in our system is

113
19.8 MHz which is in good agreement with what we observe in the experiments. The slight
discrepancy between theory and experiment is within our experimental error range and can be
attributed to the shallowness of the minimum as well as to accumulated errors in curve fittings, loss
of phase information in the measurement of transmission spectra between ports 1 and 2, and to the
frequency fluctuations of the probe laser. Note that we do not use any active or passive stabilization
and locking methods in our experiments.
6.4.2 Supermode Fields Suppression and Recovery
If we elucidate the intensity evolution at the supermode picture, we can obtain similar system
behavior. The intensity of one of the supermodes A experiences first suppression but recovery after
the additional loss approaches and even passes the EP, whereas the intensity of the other supermode
A experiences loss and further suppression after the additional loss passes the EP, as shown in
Fig.6.12.
Figure6.12 Intensity evolution of the supermodes as the additional loss tip increases in non-Hermitian
photonic molecules. (a-c) correspond to supermode A and (d-f) correspond to the supermode A .
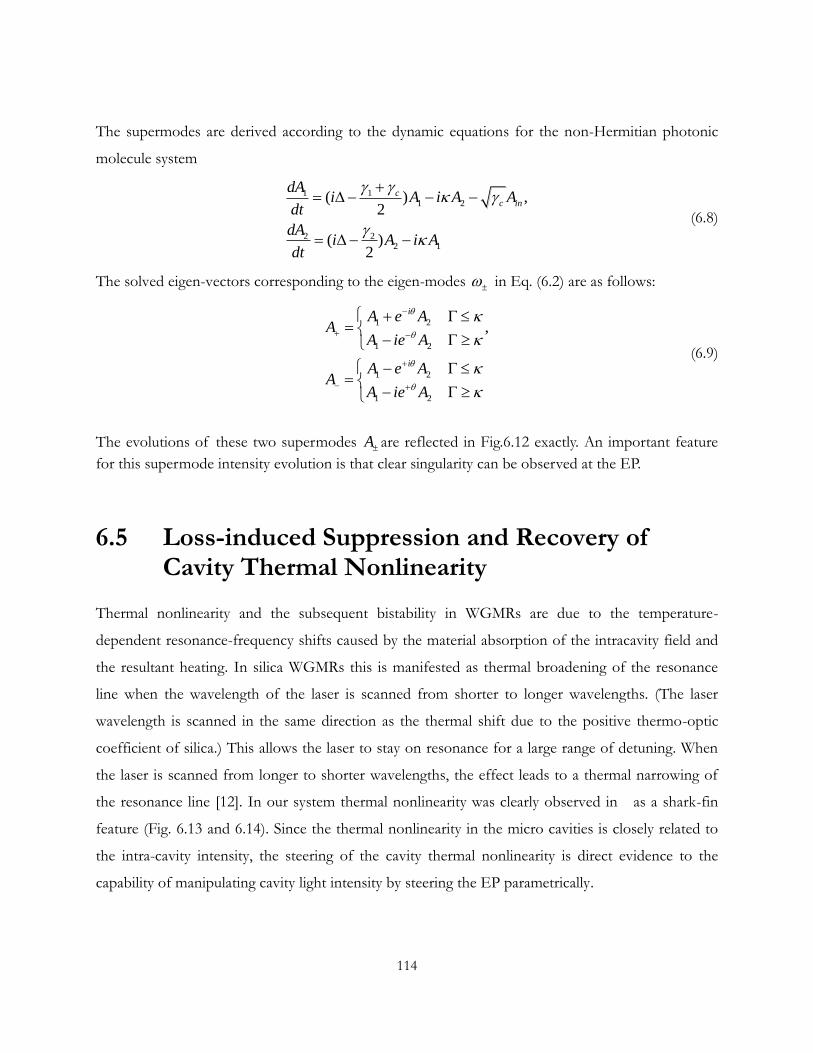
114
The supermodes are derived according to the dynamic equations for the non-Hermitian photonic
molecule system
111 2
2 22 1
( ) ,2
( )2
cc in
dAi A i A A
dt
dAi A i A
dt
(6.8)
The solved eigen-vectors corresponding to the eigen-modes in Eq. (6.2) are as follows:
1 2
1 2
1 2
1 2
,i
i
A e AA
A ie A
A e AA
A ie A
(6.9)
The evolutions of these two supermodes A are reflected in Fig.6.12 exactly. An important feature
for this supermode intensity evolution is that clear singularity can be observed at the EP.
6.5 Loss-induced Suppression and Recovery of Cavity Thermal Nonlinearity
Thermal nonlinearity and the subsequent bistability in WGMRs are due to the temperature-
dependent resonance-frequency shifts caused by the material absorption of the intracavity field and
the resultant heating. In silica WGMRs this is manifested as thermal broadening of the resonance
line when the wavelength of the laser is scanned from shorter to longer wavelengths. (The laser
wavelength is scanned in the same direction as the thermal shift due to the positive thermo-optic
coefficient of silica.) This allows the laser to stay on resonance for a large range of detuning. When
the laser is scanned from longer to shorter wavelengths, the effect leads to a thermal narrowing of
the resonance line [12]. In our system thermal nonlinearity was clearly observed in as a shark-fin
feature (Fig. 6.13 and 6.14). Since the thermal nonlinearity in the micro cavities is closely related to
the intra-cavity intensity, the steering of the cavity thermal nonlinearity is direct evidence to the
capability of manipulating cavity light intensity by steering the EP parametrically.

115
First we give a brief overview of this phenomenon and cite the related works that can be found in
the literature. Using the coupled resonator model, we can characterize the thermal response of a
coupled resonator system with the following set of equations:
1 111 1 1 2 1
2 tip22 2 2 1
2
2
cc in
dai a a i a a
dt
dai a a i a
dt
(6.10)
2
111
1
2
222
2
( )( )
( )( )
abs th
r
abs th
r
adT tT t
dt
adT tT t
dt
(6.11)
where Eq. (6.10) describes the time evolution of the intra-cavity optical fields of the coupled
resonators, and Eq. (6.11) describes the evolution of the temperature inside the mode volumes of
the microresonators. abs is the thermal absorption coefficient and is responsible for the
temperature change due to the absorption of light by the material used to fabricate the
microresonator (in our case, it is silica). th represents the thermal relaxation rate and quantifies the
heat dissipation process. 1,2 ( )jT t is the temperature inside the resonator.
In our experiments, the wavelength of a tunable laser is scanned to probe the resonances and
response of the microresonators. As the laser wavelength is up-scanned from shorter to longer
wavelengths to approach the resonance wavelength (decreasing detuning), the intra-cavity fields are
gradually built up inside the resonators. Material absorption then gives rise to an increase in the
temperature of the resonator. This, on the other hand, alters the refractive index of the resonators
through the thermo-optic effect and therefore shifts the resonance frequencies of the resonators. In
order to take this dynamic effect into account and complete the model, we introduce the following
two equations:
1 1 1
2 2 2
( ) 1 ( )
( ) 1 ( )
t a dT t
t a dT t
(6.12)

116
where a represents a thermal coefficient which takes into account the thermal expansion and the
thermo-optic coefficients.
Table 6.1 Values of the parameters used in the numerical simulations for the thermal response of the coupled
resonators.
Parameter Value
(Case 1)
Value
(Case 2)
Unit
Intrinsic loss of μR1: 1 24.18 9.67 MHz
Intrinsic loss of μR2: 2 19.34 38.68 MHz
Additional loss: tip 77.38
947.75
90.26
928.41
MHz
Coupling loss between WG1 and μR1: 1c 24.18 24.18 MHz
Intra-resonator coupling strength: 3.65 3.65 MHz
Resonant wavelength of solitary resonators:
0
1550 1550 nm
Thermal coefficient: a 66 10 66 10 1 /
oC
Thermal relaxation rate: th 90 90 kHz
Thermal absorption coefficient: abs 31.83 10 31.83 10 K/J
We numerically solved Eqs. (6.10)-(6.12) to characterize the thermal response of the coupled
resonators used in our experiments, and to quantify how well this theoretical model represent our
experimental results shown in Fig. 6.14 below. We performed the numerical simulations for the
settings used in Fig. 6.14. These two cases differ in whether the additional loss tip is introduced to
the resonator with initially lower or higher quality factor. In Table 6.1, we have listed the value of the
parameters used in the simulations. The results are shown in Fig. 6.13a and Fig. 6.13c which clearly
show that with increasing additional loss the thermal response of the coupled-resonators system
evolves into a waveform similar to that of a single resonator (top spectra in Fig. 6.13a and Fig.
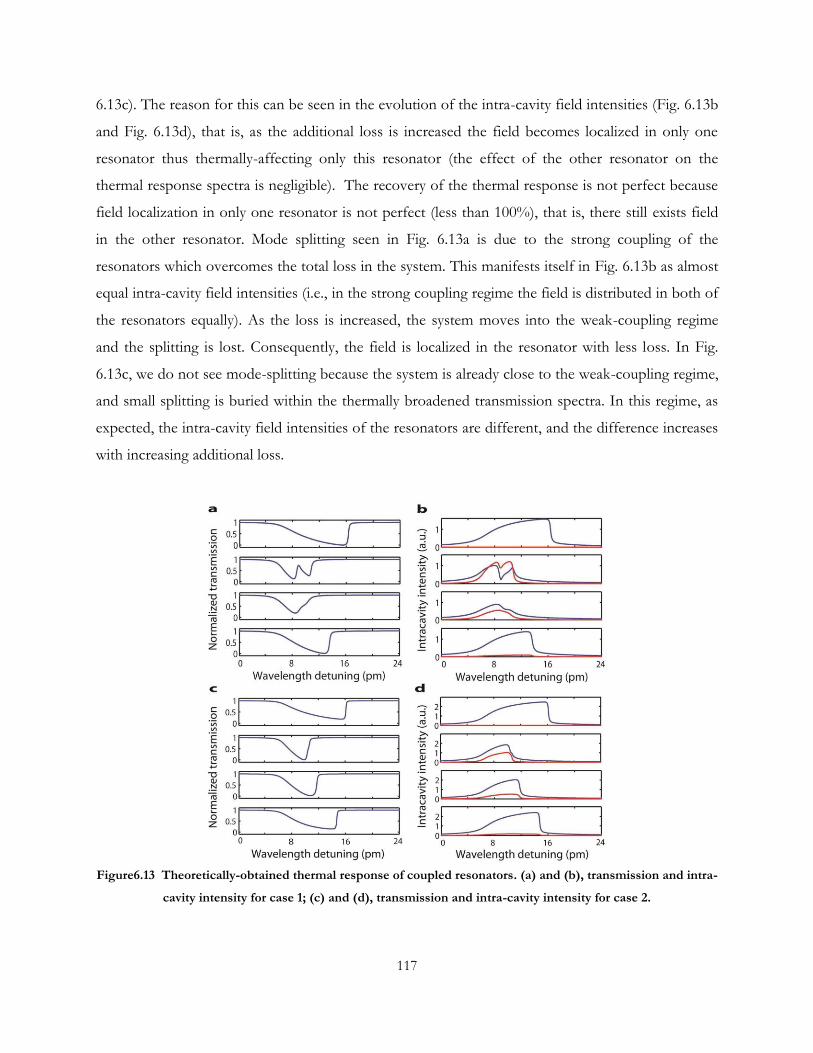
117
6.13c). The reason for this can be seen in the evolution of the intra-cavity field intensities (Fig. 6.13b
and Fig. 6.13d), that is, as the additional loss is increased the field becomes localized in only one
resonator thus thermally-affecting only this resonator (the effect of the other resonator on the
thermal response spectra is negligible). The recovery of the thermal response is not perfect because
field localization in only one resonator is not perfect (less than 100%), that is, there still exists field
in the other resonator. Mode splitting seen in Fig. 6.13a is due to the strong coupling of the
resonators which overcomes the total loss in the system. This manifests itself in Fig. 6.13b as almost
equal intra-cavity field intensities (i.e., in the strong coupling regime the field is distributed in both of
the resonators equally). As the loss is increased, the system moves into the weak-coupling regime
and the splitting is lost. Consequently, the field is localized in the resonator with less loss. In Fig.
6.13c, we do not see mode-splitting because the system is already close to the weak-coupling regime,
and small splitting is buried within the thermally broadened transmission spectra. In this regime, as
expected, the intra-cavity field intensities of the resonators are different, and the difference increases
with increasing additional loss.
Figure6.13 Theoretically-obtained thermal response of coupled resonators. (a) and (b), transmission and intra-
cavity intensity for case 1; (c) and (d), transmission and intra-cavity intensity for case 2.
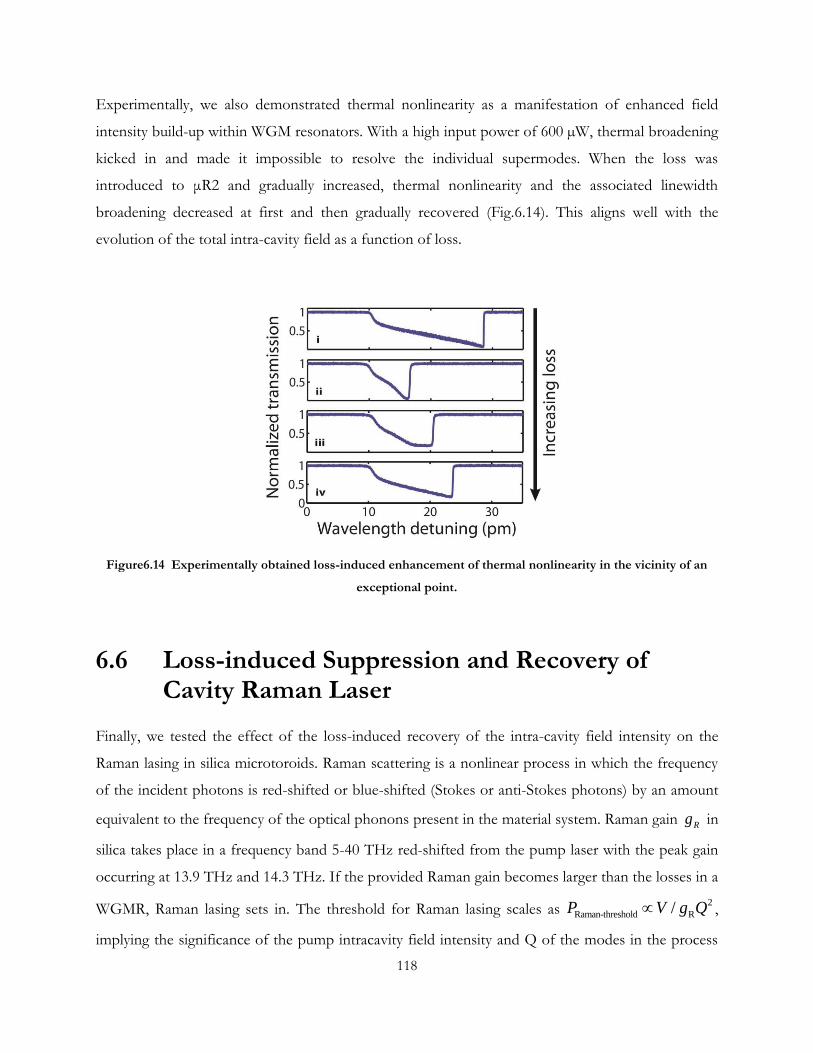
118
Experimentally, we also demonstrated thermal nonlinearity as a manifestation of enhanced field
intensity build-up within WGM resonators. With a high input power of 600 µW, thermal broadening
kicked in and made it impossible to resolve the individual supermodes. When the loss was
introduced to μR2 and gradually increased, thermal nonlinearity and the associated linewidth
broadening decreased at first and then gradually recovered (Fig.6.14). This aligns well with the
evolution of the total intra-cavity field as a function of loss.
Figure6.14 Experimentally obtained loss-induced enhancement of thermal nonlinearity in the vicinity of an
exceptional point.
6.6 Loss-induced Suppression and Recovery of Cavity Raman Laser
Finally, we tested the effect of the loss-induced recovery of the intra-cavity field intensity on the
Raman lasing in silica microtoroids. Raman scattering is a nonlinear process in which the frequency
of the incident photons is red-shifted or blue-shifted (Stokes or anti-Stokes photons) by an amount
equivalent to the frequency of the optical phonons present in the material system. Raman gain Rg in
silica takes place in a frequency band 5-40 THz red-shifted from the pump laser with the peak gain
occurring at 13.9 THz and 14.3 THz. If the provided Raman gain becomes larger than the losses in a
WGMR, Raman lasing sets in. The threshold for Raman lasing scales as 2
Raman-threshold R/P V g Q ,
implying the significance of the pump intracavity field intensity and Q of the modes in the process

119
[72]. With a pump laser in the 1550 nm wavelength band, Raman lasing takes place in the 1650 nm
band in silica WGMR. Fig.6.15 depicts the spectrum and the efficiency of Raman lasing in our
system. The lasing threshold for the solitary resonator was about 150 µW (Fig.6.15b blue curve).
Keeping the pump power fixed, we introduced the second resonator, which had a much larger loss
than the first one. This effectively increased the total loss of the system and annihilated the laser
(Fig.6.15a, gray curve). Introducing additional loss tip to the second resonator helped to recover
the Raman lasing, whose intensity increased with increasing loss (Fig.6.15a). We also checked the
lasing threshold of each of the cases depicted in Fig.6.15a and observed that as tip was increased,
the threshold power increased at first but then decreased (Fig.6.15b).
Figure6.15 Experimentally obtained loss-induced suppression and revival of Raman laser in the vicinity of an
exceptional point. (a) Lasing spectra. (b) Lasing threshold characteristics. Inset: corresponding modes.
These observations are in stark contrast with what one would expect in conventional systems, where
the higher the loss, the higher the lasing threshold. Surprisingly, in the vicinity of an EP, less loss is
detrimental and annihilates the process of interest. However, more loss is good because it helps to
recover the process. These counterintuitive observations can be explained by the fact that the
supermodes of the coupled system readjust themselves as loss is gradually increased. When the loss
exceeds a critical amount, the supermodes are mostly located in the system with less loss and thus
the total field can build up more strongly. As our results clearly demonstrate, this behavior also
affects the nonlinear processes, such as thermal broadening and Raman lasing, that rely on
intracavity field intensity.
120
6.7 Conclusion and Outlook
Our study on implementation of non-Hermitian photonic molecule systems including the PT-
symmetric microcavities extend non-Hermitian optics from centimetre/metre-scale structures to on-
chip micro-scale structures and, more importantly, from waveguides to microresonators. This
overcomes the long-standing open challenge of implementing a true PTsymmetric resonator system
in the optical regime, and most importantly, opens the door for exploring new functionalities such as
coherent-perfect-absorption lasers, topologically protected optical diodes, enhanced nonlinearities
and light-matter interactions that can be achieved only with resonant structures and resonant
enhancement. Our specifically designed WGM photonic molecules provide a comprehensive
framework for understanding resonance effects in PT-symmetric optical systems and could thereby
aid in developing on-chip synthetic structures to harness the flow of light. For example, the
electromagnetically induced transparency in coupled passive resonators may benefit from PT-
symmetric resonators through lossless modulation of the transparency for slowing and stopping of
light. Similarly, these PT-symmetric microresonators can be used for studying nonlinear Fano
resonances that may give rise to ultralow-power and high-contrast switching and non-reciprocity due
to their sharp asymmetric line shapes. Moreover, there has been an emerging interest in exploring
PT symmetry in various fields, such as microlasers, sensing, plasmonics, optomechanics and cavity-
quantum electrodynamics, where passive WGMRs have been traditionally used. This may bring
about new results and physical insights into these fields. Meanwhile, the scheme can be further
expanded using a variety of platforms, gain could be provided by quantum dots or other rare-earth
ions, and also through nonlinear processes, such as Raman or parametric amplification. Further
improvement of the system for specific applications can also be done. For the non-reciprocal light
transmission application, like any non-reciprocal device utilizing resonant effects, our PT-symmetric
all-optical diode is bandwidth-limited. However, by thermally tuning resonance wavelengths and by
using active resonators doped with multiple rare-earth ions, operation over large wavelength bands
should be possible.
In general, in this study our photonic molecule system provides a comprehensive platform for
further studies of EPs and opens up new avenues of research on non-Hermitian systems and their
behavior. Our findings may also lead to new schemes and techniques for controlling and harnessing

121
the light in other physical systems, such as in photonic crystal cavities, plasmonic structures, and
metamaterials.

122
References
[1] N. Hodgson and H. Weber, Laser resonators and beam propagation : fundamentals,
advanced concepts and applications. Springer, New York, 2nd edn (2005).
[2] A. E. Siegman, "Laser beams and resonators: Beyond the 1960s," Ieee J Sel Top Quant 6, 1389-1399 (2000).
[3] K. Vahala, Optical microcavities. World Scientific, Singapore ; Hackensack, N.J., (2004).
[4] A. B. Matsko and V. S. Ilchenko, "Optical resonators with whispering-gallery modes - Part I: Basics," Ieee J Sel Top Quant 12, 3-14 (2006).
[5] V. S. Ilchenko and A. B. Matsko, "Optical resonators with whispering-gallery modes - Part II: Applications," Ieee J Sel Top Quant 12, 15-32 (2006).
[6] A. Chiasera, Y. Dumeige, P. Feron, M. Ferrari, Y. Jestin, G. N. Conti, S. Pelli, S. Soria and G. C. Righini, "Spherical whispering-gallery-mode microresonators," Laser Photonics Rev 4, 457-482 (2010).
[7] J. Ward and O. Benson, "WGM microresonators: sensing, lasing and fundamental optics with microspheres," Laser Photonics Rev 5, 553-570 (2011).
[8] F. Vollmer and L. Yang, "Label-free detection with high-Q microcavities: a review of Biosensing mechanisms for integrated devices," Nanophotonics, 1, 267-291 (2012)
[9] M. R. Watts, M. J. Shaw, and G. N. Nielson, "Optical resonators- Microphotonic thermal
imaging, " Nature Photon. 1, 632 (2007).
[10] T. Ling, S. Chen, and J. Guo, "High-sensitivity and wide-directivity ultrasound detection
using high Q polymer microring resonators," App. Phys Lett., 98, 204103 (2011).
[11] V. B. Braginsky, M. L. Gorodetsky and V. S. Ilchenko, "Quality-factor and nonlinear
properties of optical whispering-gallery modes," Phys Lett A 137, 393-397 (1989).
123
[12] T. Carmon, L. Yang, and K. J. Vahala, "Dynamical thermal behavior and thermal self-
stability of microcavities" Opt. Express 12, 4742 (2004)
.
[13] T. J. Kippenberg, and K. J. Vahala, "Cavity optomechanics: back-action at the mesoscale, "
Science 321, 1172-1176 (2008).
[14] B. Min, L. Yang, and K. J. Vahala, "Controlled transition between parametric and Raman
oscillations in ultra-high-Q silica toroidal microcavities" App. Phys. Lett., 87, 181109 (2005).
[15] L. Rayleigh, "The problem of the whispering gallery," Phil. Mag. 20, 1001-1004 (1910).
[16] C. G. B. Garrett, W. Kaiser and W. L. Bond, "Stimulated emission into optical whispering
modes of spheres," Phys Rev 124, 1807-1809 (1961).
[17] K. J. Vahala, "Optical microcavities," Nature 424, 839-846 (2003).
[18] A. Ashkin and J. M. Dziedzic, "Observation of resonances in the radiation pressure on
dielectric spheres," Phys Rev Lett 38, 1351-1354 (1977).
[19] A. Kiraz, A. Kurt, M. A. Dundar and A. L. Demirel, "Simple largely tunable optical
microcavity," App. Phys. Lett. 89, 081118 (2006).
[20] V. B. Braginsky, M. L. Gorodetsky and V. S. Ilchenko, "Quality-factor and nonlinear
properties of optical whispering-gallery modes," Phys Lett A 137, 393-397 (1989).
[21] M. Borselli, K. Srinivasan, P. E. Barclay and O. Painter, "Rayleigh scattering, mode coupling,
and optical loss in silicon microdisks," Appl Phys Lett 85, 3693-3695 (2004).
[22] C. Y. Chao and L. J. Guo, "Polymer microring resonators fabricated by nanoimprint
technique," J Vac Sci Technol B 20, 2862-2866 (2002).
124
[23] I. S. Grudinin, A. B. Matsko, A. A. Savchenkov, D. Strekalov, V. S. Ilchenko and L. Maleki,
"Ultra high Q crystalline microcavities," Opt Commun 265, 33-38 (2006).
[24] M. L. Gorodetsky, A. A. Savchenkov and V. S. Ilchenko, "Ultimate Q of optical microsphere
resonators," Opt Lett 21, 453-455 (1996).
[25] M. Soltani, S. Yegnanarayanan and A. Adibi, "Ultra-high Q planar silicon microdisk
resonators for chip-scale silicon photonics," Opt Express 15, 4694-4704 (2007).
[26] D. K. Armani, T. J. Kippenberg, S. M. Spillane and K. J. Vahala, "Ultra-high-Q toroid
microcavity on a chip," Nature 421, 925-928 (2003).
[27] T. A. Birks, J. C. Knight and T. E. Dimmick, "High-resolution measurement of the fiber
diameter variations using whispering gallery modes and no optical alignment," Ieee Photonic Tech L
12, 182-183 (2000).
[28] I. M. White, H. Oveys and X. D. Fan, "Liquid-core optical ring-resonator sensors," Opt Lett
31, 1319-1321 (2006).
[29] G. S. Murugan, J. S. Wilkinson and M. N. Zervas, "Optical excitation and probing of
whispering gallery modes in bottle microresonators: potential for all fiber add-drop filters," Opt Lett
35, 1893-1895 (2010).
[30] M. Pollinger, D. O'Shea, F. Warken and A. Rauschenbeutel, "Ultrahigh-Q tunable
whispering-gallery-mode microresonator," Phys Rev Lett 103, 053901 (2009).
[31] M. L. Gorodetsky and V. S. Ilchenko, "Optical microsphere resonators: optimal coupling to
high-Q whispering-gallery modes," J Opt Soc Am B 16, 147-154 (1999).
[32] K. Srinivasan, M. Borselli and O. Painter, "Cavity Q, mode volume, and lasing threshold in
small diameter AlGaAs microdisks with embedded quantum dots," Opt Express 14, 1094-1105
(2006).
125
[33] M. L. Gorodetsky and V. S. Ilchenko, "High-Q Optical Whispering-Gallery Microresonators
- Precession Approach for Spherical Mode Analysis and Emission Patterns with Prism Couplers,"
Opt Commun 113, 133-143 (1994).
[34] J. C. Knight, G. Cheung, F. Jacques and T. A. Birks, "Phase-matched excitation of
whispering-gallery-mode resonances by a fiber taper," Opt Lett 22, 1129-1131 (1997).
[35] V. S. Ilchenko, X. S. Yao and L. Maleki, "Pigtailing the high-Q microsphere cavity: a simple
fiber coupler for optical whispering-gallery modes," Opt Lett 24, 723-725 (1999).
[36] M. Cai, O. Painter and K. J. Vahala, "Observation of critical coupling in a fiber taper to a
silica-microsphere whispering-gallery mode system," Phys Rev Lett 85, 74-77 (2000).
[37] M. L. Gorodetsky and V. S. Ilchenko, "Optical microsphere resonators: optimal coupling to
high-Q whispering-gallery modes," J Opt Soc Am B 16, 147-154 (1999).
[38] H. A. Haus, Waves and fields in optoelectronics. Prentice-Hall, Englewood Cliffs, NJ,
(1984).
[39] L. Yang, T. Carmon, B. Min, S. M. Spillane and K. J. Vahala, "Erbium-doped and Raman
microlasers on a silicon chip fabricated by the sol-gel process," App. Phys. Lett. 86, 091114 (2005).
[40] L. He, S. K. Ozdemir, J. Zhu and L. Yang, "Self-pulsation in fiber-coupled, onchip
microcavity lasers," Opt Lett 35, 256-258 (2010).
[41] V. Sandoghdar, F. Treussart, J. Hare, V. LefevreSeguin, J. M. Raimond and S. Haroche,
"Very low threshold whispering-gallery-mode microsphere laser," Phys. Rev. A 54, R1777-R1780
(1996).
[42] S. I. Shopova, G. Farca, A. T. Rosenberger, W. M. S. Wickramanayake and N.A. Kotov,
"Microsphere whispering-gallery-mode laser using HgTe quantum dots," App. Phys. Lett. 85, 6101-
6103 (2004).
[43] H. S. Rong, S. B. Xu, Y. H. Kuo, V. Sih, O. Cohen, O. Raday and M. Paniccia, "Low-
threshold continuous-wave Raman silicon laser," Nature Photon 1, 232-237 (2007).
126
[44] S. M. Spillane, T. J. Kippenberg and K. J. Vahala, "Ultralow-threshold Raman laser using a
spherical dielectric microcavity," Nature 415, 621-623 (2002).
[45] L. He, S. K. Ozdemir and L. Yang, "Whispering gallery microcavity lasers," Laser & Photon.
Rev. 7, 60-82 (2013).
[46] H. M. Tzeng, K. F. Wall, M. B. Long and R. K. Chang, "Laser emission from individual
droplets at wavelengths corresponding to morphology-dependent resonances," Opt Lett, 9, 499-501
(1984).
[47] M. Tanyeri, R. Perron and I. M. Kennedy, "Lasing droplets in a microfabricated channel,"
Opt Lett 32, 2529-2531 (2007).
[48] T. J. Kippenberg, S. M. Spillane, D. K. Armani, and K. J. Vahala "Ultra-low threshold
microcavity Raman Laser on a microelectronic Chip," Opt Lett 29, No. 11 (2004).
[49] T. J. Kippenberg, S. M. Spillane, and K. J. Vahala "Kerr-nonlinearity optical parametric
oscillation in an ultrahigh-Q toroid microcavity" Phys. Rev. Lett. 93, 083904 (2004).
[50] T. J. Kippenberg, and K. J. Vahala "Cavity Opto-Mechanics," Opt Express, 15, 17172-17205
(2007).
[51] M.O. Scully and M.S. Zubairy, Quantum Optics. Cambridge, 1996.
[52] Robert W. Boyd, Nonlinear optics. Academic Press, Boston, 1992.
[53] T. J. Kippenberg, H. Rokhsari, T. Carmon, A. Scherer, and K. J. Vahala, "Analysis of
Radiation-Pressure Induced Mechanical Oscillation of an Optical Microcavity," Phys Rev Lett 95,
033901 (2005).
[54] H. Rokhsari, T. J. Kippenberg, T. Carmon, and K. J. Vahala, "Radiation-pressure-driven
micro-mechanical oscillator," Opt Express 13, 5293–5301 (2005).
127
[55] T. Carmon, H. Rokhsari, L. Yang, T. J. Kippenberg, and K. J. Vahala, "Temporal behavior
of radiation-pressure induced vibrations of an optical microcavity phonon mode, " Phys Rev Lett
94, 223902 (2005).
[56] T. Corbitt, Y. B. Chen, E. Innerhofer, H.Muller-Ebhardt, D. Ottaway, H. Rehbein, D. Sigg,
S.Whitcomb, C.Wipf, and N. Mavalvala, "An all-optical trap for a gram-scale mirror," Phys Rev
Letts 98, 150802 (2007).
[57] R. Roy, "Ceramics by the Solution-Sol-Gel Route," Science 238, 1664-1669 (1987).
[58] L. L. Hench and J. K. West, "The Sol-Gel Process," Chem Rev 90, 33-72 (1990).
[59] A. K. Naik, M. S. Hanay, W. K. Hiebert, X. L. Feng and M. L. Roukes, "Towards single-
molecule nanomechanical mass spectrometry," Nature Nanotech 4, 445-450 (2009).
[60] S. P. Wang, X. N. Shan, U. Patel, X. P. Huang, J. Lu, J. H. Li and N. J. Tao, "Label-free
imaging, detection, and mass measurement of single viruses by surface plasmon resonance," P Natl
Acad Sci USA 107, 16028-16032 (2010).
[61] A. Mitra, B. Deutsch, F. Ignatovich, C. Dykes and L. Novotny, "Nano-optofluidic
detection of single viruses and nanoparticles," Acs Nano 4, 1305-1312 (2010).
[62] F. Vollmer and S. Arnold, "Whispering-gallery-mode biosensing: label-free detection down
to single molecules," Nature Methods 5, 591-596 (2008).
[63] S. I. Shopova, R. Rajmangal, Y. Nishida and S. Arnold, "Ultrasensitive nanoparticle detection
using a portable whispering gallery mode biosensor driven by a periodically poled lithium-niobate
frequency doubled distributed feedback laser," Rev Sci Instrum 81, 103110 (2010).
[64] J. Zhu, S. K. Ozdemir, Y. F. Xiao, L. Li, L. He, D. R. Chen and L. Yang, "Onchip single
nanoparticle detection and sizing by mode splitting in an ultrahigh-Q microresonator," Nature
Photon 4, 46-49 (2010).
[65] L. He, S. K. Ozdemir, J. Zhu, W. Kim and L. Yang, "Detecting single viruses and
nanoparticles using whispering gallery microlasers," Nature Nanotech 6, 428-432 (2011).
128
[66] S. Arnold, M. Khoshsima, I. Teraoka, S. Holler, F. Vollmer, "Shift of whispering-gallery
modes in microspheres by protein adsorption," Opt Lett 28, 272–274, (2003).
[67] F. Vollmer, D. Braun, A. Libchaber, M. Khoshsima, I. Teraoka, S. Arnold "Protein detection
by optical shift of a resonant microcavity," App Phys Lett 80, 4057–4059, (2002).
[68] A. Mazzei, S. Goetzinger, L.D. Menezes, G. Zumofen, O. Benson, V. Sandoghdar,
"Controlled coupling of counterpropagating whispering-gallery modes by a single Rayleigh scatterer:
a classical problem in a quantum optical light," Phys Rev Lett 99, 173603 (2007).
[69] J. Zhu, S.K. Ozdemir, L. He, D. R. Chen and L. Yang, "Single virus and nanoparticle size
spectrometry by whispering-gallery-mode microcavities," Opt Express, 19, 16195-16206 (2011).
[70] L. He, S.K. Ozdemir, Y-F Xiao, L. Yang, "Gain-induced evolution of mode splitting spectra
in a high-Q active microresonator," IEEE J Quantum Electron 46, 1626–1633 (2010).
[71] L. He, S.K. Ozdemir, J. Zhu, L. Yang, "Ultrasensitive detection of mode splitting in active
optical microcavities," Phys Rev A 82, 053810 (2010).
[72] S. M. Spillane, T. J. Kippenberg & K. J. Vahala, "Ultralow-threshold Raman laser using a
spherical dielectric microcavity," Nature 415, 621-623 (2002).
[73] SK Ozdemir, J Zhu, X Yang, B Peng, H Yilmaz, L He, F Monifi, GL Long, L Yang, "Highly
sensitive detection of nanoparticles with a self-referenced and self-heterodyned whispering-gallery
Raman microlaser," P Natl Acad Sci, 111, E3836-3844 (2014).
[74] Q. Li, T. Wang, Y. Su, M. Yan, and M. Qiu, "Coupled mode theory analysis of mode-
splitting in coupled cavity system," Opt. Express 18, 8367 (2010).
[75] A. V. Kanaev, V. N. Astratov, and W. Cai, "Optical coupling at a distance between detuned
spherical cavities," App. Phys. Lett. 88, 111111 (2006).
129
[76] S. P. Ashili, V. N. Astratov, and E. C. Sykes, "The effects of inter-cavity separation on
optical coupling in dielectric bispheres," Opt. Express 14, 9460 (2006).
[77] K. A. Atlasov, K. F. Karlsson, A. Rudra, B. Dwir, and E. Kapon, "Wavelength and loss
splitting in directly coupled photonic-crystal defect microcavities," Opt. Express 16, 16255 (2008).
[78] M. Bayer, , T.Gutbrod, , J. P. Reithmaier, and A. Forchel, "Optical modes in photonic
molecules," Phys. Rev. Lett. 81, 2582 (1998).
[79] S. Ishii , T. Baba, "Bistable lasing in twin microdisk photonic molecules," App. Phys. Lett.
87, 181102 (2005).
[80] M. Benyoucef, J.B. Shim, J. Wiersig, and O. G. Schmidt, "Quality-factor enhancement of
supermodes in coupled microdisks," Opt Lett 36, 1317-1319 (2011).
[81] M. L. Cooper, G. Gupta, M. A. Schneider, W. M. Green, S. Assefa, F. Xia, D. K. Gifford,
and S. Mookherjea, "Waveguide dispersion effects in silicon-on-insulator coupled-resonator optical
waveguides," Opt Lett, 35, 3030-3032 (2010).
[82] B.S. Lin, "Variational analysis for photonic molecules: Application to photonic benzene
waveguides," Phys. Rev. E. 68, 036611 (2003).
[83] A. Melloni, F. Morichetti and M. Martinelli, "Linear and nonlinear pulse propagation in
coupled resonator slow-wave optical structures," Opt Quant Electron 35, 365-379 (2003).
[84] F.Xia, L. Sekaric, "Ultracompact optical buffers on a silicon chip," Nat. Photon. 1, 65-71
(2007).
[85] J.K.S. Poon, J. Scheuer, Y. Xu, and A. Yariv, "Designing coupled-resonator optical
waveguide delay lines," J. Opt. Soc. Am. B. 21, 1665-1673 (2004).
130
[86] I. S. Grudinin, H. Lee, O. Painter, and K. J. Vahala, "Phonon Laser Action in a Tunable
Two-Level System," Phys. Rev. Lett. 104, 083901 (2010).
[87] S. V. Boriskina and L. D. Negro, "Self-referenced photonic molecule bio(chemical)sensor,"
Opt Lett 35, 2496-2498 (2010).
[88] B. Peng, S. K. Ozdemir, J. Zhu and L. Yang, "Photonic molecules formed by coupled hybrid
resonators," Opt Lett 37, 3435-3437 (2012).
[89] B. Peng, SK Ozdemir, F Lei, F Monifi, M Gianfreda, GL Long, S Fan, F Nori, CM Bender,
L Yang, "Parity-time-symmetric whispering-gallery microcavities," Nat Phys, 10, 394-398 (2014).
[90] D. Bouwmeester, N.H. Dekker, F.E.v. Dorsselaer, C.A. Schrama, P.M. Visser and J.P.
Woerdman, "Observation of Landau-Zener dynamics in classical optical systems," Phys Rev A 51,
646-654 (2010).
[91] Y-F Xiao, V. Gaddam, and L. Yang, "Coupled optical microcavities: an enhanced
refractometric sensing configuration," Opt Express 16, 12538-12543 (2008).
[92] B. Peng, F. Lei, S. K. Ozdemir, G. Long and L. Yang, "Engineering the spectral properties
of photonic molecules," Proceedings CLEO, JTu4A. 46 (2013).
[93] T.-W. Lu, P.-T., Lee, "Ultra-high sensitivity optical stress sensor based on double-layered
photonic crystal microcavity," Opt. Express. 17, 1518-1526 (2009).
[94] C. Peng, Z. Li, et al, "Optical gyroscope based on a coupled resonator with the all-optical
analogous property of electromagnetically induced transparency," Opt. Express. 15, 3864-3875
(2007).
[95] J. Scheuer, A. Yariv, "Sagnac effect in coupled-resonator slow-light waveguide struc-tures,"
Phys. Rev. Lett. 96, 053901-4 (2006).

131
[96] B.Z. Steinberg, A. Boag, "Splitting of microcavity degenerate modes in rotating photon-ic
crystals: the miniature optical gyroscopes," J. Opt. Soc. Am. B. 24, 142-151 (2007).
[97] A. Francois, M. Himmelhaus, "Optical biosensor based on whispering gallery mode
excitations in clusters of microparticles," Appl. Phys. Lett. 92, 141107-3 (2008).
[98] S.V. Boriskina, "Spectrally engineered photonic molecules as optical sensors with en-hanced
sensitivity: a proposal and numerical analysis," J. Opt. Soc. Am. B. 23, 1565-1573 (2006).
[99] J.V. Hryniewicz, P.P. Absil, et al, "Higher order filter response in coupled microring
resonators,” IEEE Photon. Technol. Lett. 12, 320-322 (2000).
[100] L.Y. Mario, D.C.S. Lim, et al. "Proposal for an ultranarrow passband using two cou-pled
rings," IEEE Photon. Technol. Lett. 19, 1688-1690 (2007).
[101] I. Chremmos, N. Uzunoglu, "Reflective properties of double-ring resonator system cou-pled
to a waveguide," IEEE Photon. Technol. Lett. 17, 2110-2112 (2005).
[102] F. Xia, M. Rooks, et al. "Ultra-compact high order ring resonator filters using submi-cron
silicon photonic wires for on-chip optical interconnects," Opt. Express. 15, 11934-11941 (2007).
[103] A.A. Savchenkov, V.S. Ilchenko, et al. "High-order tunable filters based on a chain of
coupled crystalline whispering gallery-mode resonators," IEEE Photon. Technol. Lett. 17, 136-138
(2005).
[104] V.M.N. Passaro, F. De Leonardis, "Modeling and design of a novel high-sensitivity electric
field silicon-on-insulator sensor based on a whispering-gallery-mode resonator," IEEE J. Select.
Top. Quant. Electron. 12, 124-133 (2006).
[105] S.V. Boriskina, "Theoretical prediction of a dramatic Q-factor enhancement and degen-eracy
removal of whispering gallery modes in symmetrical photonic molecules, " Opt. Lett. 31, 338-340
(2006).
132
[106] M.J. Hartmann, F.G.S.L. Brandão, et al. "Quantum many-body phenomena in coupled cavity
arrays," Laser Photon. Rev. 2, 527-556 (2008).
[107] L. Shang, L. Liu, et al. "Single-frequency coupled asymmetric microcavity laser," Opt. Lett.
33, 1150-1152 (2008).
[108] Y. Vlasov, W.M.J. Green, et al. "High-throughput silicon nanophotonic wavelength-
insensitive switch for on-chip optical networks," Nat. Photon. 2, 242-246 (2008).
[109] M. Benyoucef, S. Kiravittaya, et al. "Strongly coupled semiconductor microcavities: A route
to couple artificial atoms over micrometric distances," Phys. Rev. B. 77, 035108-5 (2008).
[110] M.S. Skolnick, V.N. Astratov, et al. "Exciton polaritons in single and coupled micro-
cavities," J. Luminescence. 87-89, 25-29 (2000).
[111] W. R. Kelly et al. "Direct observation of coherent population trapping in a superconducting
artificial atom," Phys. Rev. Lett. 104, 163601 (2010).
[112] M. Fleischhauer, A. Imamoglu, J. P. Marangos, "Electromagnetically induced transparency:
optics in coherent media," Rev. Mod. Phys. 77, 633–673 (2005).
[113] J. P. Marangos, "Electromagnetically induced transparency," J. Mod. Opt. 45, 471 (1998).
[114] K. J. Boller, A. Imamoglu, S. E. Harris, "Observation of electromagnetically induced
transparency," Phys. Rev. Lett. 66, 2593 (1991).
[115] D. Budker, D. F. Kimball, S. M. Rochester, and V. V. Yashchuk, "Nonlinear Magneto-optics
and Reduced Group Velocity of Light in Atomic Vapor with Slow Ground State Relaxation," Phys.
Rev. Lett. 83, 1767–1770 (1999).
133
[116] L. V. Hau, S. E. Harris, Z. Dutton, C. H. Behroozi, "Light speed reduction to 17 metres per
second in an ultracold atomic gas," Nature 397, 594 (1999).
[117] U. Fano, "Effects of configuration interaction on intensities and phase shifts," Phys. Rev.
124, 1866 (1961).
[118] A. E. Miroshnichenko, S. Flach, Y. S. Kivshar, "Fano resonances in nanoscale structures,"
Rev. Mod. Phys. 82, 2257–2298 (2010).
[119] M. D. Lukin, et al. "Spectroscopy in dense coherent media: line narrowing and interference
effects," Phys. Rev. Lett. 79, 2959 (1997).
[120] M. Mu c̈ke, et al. "Electromagnetically induced transparency with single atoms in a cavity,"
Nature 465, 755–758 (2010).
[121] J. J. Longdell, E. Fraval, M. J. Sellars, N. B. Manson, "Stopped light with storage times
greater than one second using electromagnetically induced transparency in a solid," Phys. Rev. Lett.
95, 063601 (2005).
[122] A. A. Abdumalikov et al. "Electromagnetically induced transparency on a single artificial
atom," Phys. Rev. Lett. 104, 193601 (2010).
[123] P. M. Anisimov, J. P. Dowling, B. C. Sanders, "Objectively discerning Autler-Townes
splitting from electromagnetically induced transparency," Phys. Rev. Lett. 107, 163604 (2011).
[124] S. Zhang, D. A. Genov, Y. Wang, M. Liu, X. Zhang, "Plasmon-induced transparency in
metamaterials," Phys. Rev. Lett. 101, 047401 (2008).
[125] N. Papasimakis, V. A. Fedotov, N. I. Zheludev, S. L. Prosvirnin, "Metamaterial analog of
electromagnetically induced transparency," Phys. Rev. Lett. 101, 253903 (2008).
134
[126] S. Weis et al. "Optomechanically induced transparency," Science 330, 1520–1523 (2010).
[127] C. Dong, V. Fiore, M. C. Kuzyk, H. Wang, "Optomechanical dark mode," Science 21, 1609–
1613 (2012).
[128] C. G. Alzar, M. A. G. Martinez, P. Nussenzveig, "Classical analog of electromagnetically
induced transparency," Am. J. Phys. 70, 37–41 (2002).
[129] Y. Xiaodong, M. Yu, D.-L. Kwong, C. H. Wong, "All-optical analog to electromagnetically
induced transparency in multiple coupled photonic crystal cavities," Phys. Rev. Lett. 102, 173902
(2009).
[130] D. D. Smith, H. Chang, K. A. Fuller, A. T. Rosenberger, R. W. Boyd, "Coupled-resonator-
induced transparency," Phys. Rev. A 69, 063804 (2004).
[131] A. Naweed, G. Farca, S. I. Shopova, A. T. Rosenberger, "Induced transparency and
absorption in coupled whispering-gallery microresonators," Phys. Rev. A 71, 043804 (2005).
[132] Q. Xu et al. "Experimental realization of an on-chip all-optical analogue to
electromagnetically induced transparency," Phys. Rev. Lett. 96, 123901 (2006).
[133] S. H. Autler, C. H. Townes, "Stark effect in rapidly varying fields," Phys. Rev. 100, 703
(1955).
[134] M. J. Piotrowicz et al. "Measurement of the electric dipole moments for transitions to
Rubidium Rydberg states via Autler–Townes splitting," New J. Phys. 13, 093012 (2011).
[135] H. Ahmed et al. "Quantum control of the spin-orbit interaction using the Autler-Townes
effect," Phys. Rev. Lett. 107, 163601 (2011).

135
[136] B. Peng, SK Ozdemir, W. Chen, F. Nori and L. Yang, "What is and what is not
Electromagnetically Induced Transparency in Whispering-Gallery Microcavities" Nature
Communications 5, 5082 (2014).
[137] K. P. Burnham and D. R. Anderson, Model Selection and Multimodel Inference (Springer-
Verlag, New York, 2002), 2nd ed.
[138] C. M. Bender, "Making sense of non-Hermitian Hamiltonians," Rep. Prog. Phys. 70, 947-
1018 (2007).
[139] S. Boettcher, C. M. Bender, "Real spectra in non-Hermitian Hamiltonians having PT
symmetry," Phys. Rev. Lett. 80, 5243-5246 (1998).
[140] Carl M. Bender, "Introduction to PT-Symmetric Quantum Theory," Contemp. Phys. 46,
277-292 (2005).
[141] A. Mostafazadeh, "Pseudo-Hermiticity versus PT symmetry: the necessary condition for the
reality of the spectrum of a non-Hermitian Hamiltonian," J. Math. Phys. 43, 205-214 (2002).
[142] X. F. Zhu, H. Ramezani, C. Z. Shi, J. Zhu, X. Zhang, "PT-symmetric acoustics," Phys. Rev.
X 4, 031042 (2014).
[143] C. E. Rüter et al. "Observation of paritytime symmetry in optics," Nat Phys. 6, 192-195
(2010).
[144] L. Feng et al. "Experimental demonstration of a unidirectional reflectionless parity-time
metamaterial at optical frequencies," Nature Mater. 12, 108-113 (2012).
[145] L. Feng et al. "Nonreciprocal light propagation in a silicon photonic circuit," Science 333,
729-733 (2011).
[146] A. Regensburger et al. "Parity-time synthetic photonic lattices," Nature 488, 167-171 (2012).
136
[147] Y. D. Chong, L. Ge, H. Cao, A. D. Stone, "Coherent perfect absorbers: Time-reversed
lasers," Phys. Rev. Lett. 105, 053901 (2010).
[148] S. Longhi, "PT-symmetric laser absorber," Phys. Rev. A 82, 031801 (2010).
[149] Y. D. Chong, L. Ge, A. D. Stone, "PT-symmetry breaking and laser-absorber modes in
optical scattering systems," Phys. Rev. Lett. 106, 093902 (2011).
[150] C. M. Bender, M. Gianfreda, S. K. Ozdemir, B. Peng, L. Yang, "Twofold transition in PT-
symmetric coupled oscillators," Phys. Rev. A 88, 062111 (2013).
[151] I. Rotter, "A non-Hermitian Hamilton operator and the physics of open quantum systems,"
J. Phys. Math. Theor. 42, 153001 (2009).
[152] N. Moiseyev, Non-Hermitian quantum mechanics (Cambridge University Press, Cambridge;
New York, 2011).
[153] M. V. Berry, "Physics of non-Hermitian degeneracies," Czechoslov. J. Phys. 54, 1039–1047
(2004).
[154] W. D. Heiss, "Exceptional points of non-Hermitian operators," J. Phys. A 37, 2455 (2004).
[155] E. Persson, I. Rotter, H. J. Stöckmann, M. Barth, "Observation of resonance trapping in an
open microwave cavity," Phys. Rev. Lett. 85, 2478–2481 (2000).
[156] C. Dembowski et al., "Experimental observation of the topological structure of exceptional
points," Phys. Rev. Lett. 86, 787–790 (2001).
[157] S. B. Lee et al., "Observation of an exceptional point in a chaotic optical microcavity," Phys.
Rev. Lett. 103, 134101 (2009).
137
[158] R. El-Ganainy, K. G. Makris, D. N. Christodoulides, Z. H. Musslimani, "Theory of coupled
optical PT-symmetric structures," Opt. Lett. 32, 2632 (2007).
[159] A. Guo et al., "Observation of PT-symmetry breaking in complex optical potentials," Phys.
Rev. Lett. 103, 093902 (2009).
[160] H. Wenzel, U. Bandelow, H.-J. Wunsche, J. Rehberg, "Mechanisms of fast self pulsations in
two-section DFB lasers," IEEE J. Quantum Electron. 32, 69-78 (1996).
[161] M. Liertzer et al., "Pump-induced exceptional points in lasers," Phys. Rev. Lett. 108, 173901
(2012).
[162] M. Brandstetter et al., "Reversing the pump-dependence of a laser at an exceptional point,"
Nat. Commun. 5, 4034 (2014).
138
Vita
Bo Peng
Degrees Ph.D. Electrical Engineering, Washington University in St. Louis, May 2015 M.S. Electrical Engineering, Washington Univesity in St. Louis, December 2011 B.S. Optical Information Science and Technology, University of Science and Technology of China, July 2009 Professional Institute of Electrical and Electronics Engineers Societies Optical Society of America Publications [1] B. Peng, S. K. Ozdemir, S. Rotter, H. Yilmaz, M. Liertzer, F. Monifi, C.M.
Bender, F. Nori, L. Yang, "Loss-induced Suppression and revival of lasing," Science, 346, 328-332 (2014).
[2] B. Peng, S. K. Ozdemir, F. Lei, F. Monifi, M. Gianfreda, G. L. Long, S.
Fan, F. Nori, C. M. Bender, Lan Yang,"Parity-time-symmetric whispering-gallery microcavities", Nat Physics, 10, 394-398 (2014).
[3] B. Peng, S. K. Ozdemir, W. Chen, F. Nori, L. Yang, "What is and what is
not Electromagnetically Induced Transparency in Whispering-Gallery Microcavities", Nat Commun, 5, 5082 (2014).
[4] B. Peng, S. K. Ozdemir, J. Zhu, and L. Yang, "Photonic molecules
formed by coupled hybrid resonators", Opt Lett, 37, 3435-3437 (2012). [5] S. K. Ozdemir, J. Zhu, X. Yang, B. Peng, H. Yilmaz, L. He, F. Monifi, G.
L. Long, L. Yang, "Highly sensitive detection of nanoparticles with a self-referenced and self-heterodyned whispering-gallery Raman microlasers," Proc. Natl. Acad. Sci. U.S.A 111, E3836-E3844 (2014).
[6] C. M. Bender, M. Gianfreda, S. K. Ozdemir, B. Peng, L.Yang, "Twofold
transition in PT-symmetric coupled oscillators," Phys. Rev. A, 88, 062111 (2013).
[7] J. Zhu, S. K. Ozdemir, H. Yilmaz, B. Peng, M. Dong, M. Tomes, T.
Carmon, L. Yang,"Interfacing whispering-gallery microresonators and free space light with cavity enhanced Rayleigh scattering," Sci Rep, 4, 6396 (2014).
139
[8] P. Edwards, C.T. Janisch, B. Peng, J. Zhu, S. K. Ozdemir, L. Yang, Z.
Liu, "Label-Free Particle Sensing by Fiber Taper-Based Raman Spectroscopy," IEEE Photo. Tech. Lett, 26, 2093 (2014).
[9] F. Lei, B. Peng, S. K. Ozdemir, G. L. Long, L. Yang, "Dynamic Fano-like
resonances in erbium-doped whispering-gallery-mode microresonators," App Phys Lett, 105, 101112 (2014).
[10] I. Kandas, B. Zhang, C. Daengngam, I. Ashry, C-Y Jao, B. Peng, S. K.
Ozdemir, H. D. Robinson, J. R. Heflin, L. Yang, and Y. Xu, "High quality factor silica microspheres functionalized with self-assembled nanomaterials," Opt Express, 21, pp. 20601-20610 (2013).
May 2015
Related Documents


![Interference Black Holes, Photonic molecules, Ball ...vixra.org/pdf/1704.0272v2.pdf · Leo Vuyk, Architect, Rotterdam, the Netherlands. LeoVuyk@Gmail.com ... Ref [5,6,8,9]. As a consequence](https://static.cupdf.com/doc/110x72/5fd1855e79e53a049a6933ec/interference-black-holes-photonic-molecules-ball-vixraorgpdf1704-leo.jpg)

