UK LULUCF Action Progress Report Progress on actions in the Land Use, Land Use Change and Forestry (LULUCF) sector. Submitted to the European Commission pursuant to Article 10 of Decision 529/2013/EU December 2016

Welcome message from author
This document is posted to help you gain knowledge. Please leave a comment to let me know what you think about it! Share it to your friends and learn new things together.
Transcript
UK LULUCF Action Progress Report
Progress on actions in the Land Use Land Use Change and Forestry (LULUCF) sector Submitted to the European Commission pursuant to Article 10 of Decision 5292013EU
December 2016
3
Contents
Executive Summary 4
Introduction 7
Chapter 1 A general overview of national circumstances on LULUCF 10
Chapter 2 Past emissions and removals from the LULUCF sector 20
Chapter 3 UK Projections for the LULUCF sector 32
Chapter 4 Analysis of the potential to limit or reduce emissions and maintain or increase removals from the LULUCF sector 36
Chapter 5 List of measures that could be implemented to achieve emissions reductions or increased removals in the LULUCF sector under UK conditions 41
Chapter 6 Identification of existing policies that deliver implementation of these measures and identification of their impacts 44
4 UK LULUCF Action Progress Report
Executive Summary
As required by Article 10(4) of Decision 5292013EU this report describes the United Kingdomrsquos progress in implementation of its chosen Land Use Land Use Change and Forestry (LULUCF) greenhouse gas (GHG) mitigation actions This updates the information previously submitted to the European Commission in January 2015 pursuant to Articles 10(1) and 10(2) which require that Member States submit information on the most relevant current and future LULUCF actions being taken in Member States for all LULUCF categories
The actions include those aimed at limiting or reducing GHG emissions and maintaining or increasing GHG removals resulting from Afforestation Reforestation and Deforestation (ARD) Forest Management (FM) Cropland Management (CM) Grazing Land Management (GM) Wetland Drainage and Rewetting (WDR) and Revegetation (RV) as defined in Articles 3(1) 3(2) and 3(3) of the Decision
In accordance with Article 10(1) the UK submitted the LULUCF actions as an addendum to the Carbon Plan ndash the UKrsquos Low Carbon Development Strategy ndash on 9th January 2015 The UK estimates emissionsremovals from the LULUCF sector through the national inventory reported annually under the UNFCCC and its Kyoto Protocol and the EU Monitoring Mechanism (EUMM) The Climate Change Act 2008 requires the UK to set five-year Carbon Budgets to reduce emissions by at least 80 in 2050 and the Carbon Plan
detailed how the UK will meet current and future legislated budgets The Fifth Carbon Budget (2027 to 2032) was set in legislation in July 2016 and requires the UK to reduce emissions by at least 57 below the level in 1990 The historical inventory for LULUCF also provides a basis for projections of the LULUCF sectoral emissions in support of the UK Climate Change Actrsquos requirement that the UK Government set Carbon Budgets
The UK has moved from being a net source of carbon dioxide (CO2) from LULUCF activities in 1990 to a net sink for all years since 1991 The land use categories which have the greatest effect on the net LULUCF emissionsremovals are Forest Land and Grassland (net sinks) and Cropland (a net source) Forest Land has become a decreasing sink since 2010 due to much of the large area of productive forest planted in the 1950s to 1980s maturing and being harvested together with the relatively low rates of afforestation since 1990 Emissions from Cropland are estimated to have decreased while removals from Grassland have increased Compared to CO2 emissions of methane (CH4) and nitrous oxide (N2O) are relatively low in this sector
A forest carbon accounting model CARBINE is used to estimate the net change in pools of carbon in living biomass litter and soil in conifer and broadleaved forests Research is being conducted to allow a more accurate estimation of the effects of grassland management practices and WDR on net emissions from soils
Executive Summary 5
The UK produces LULUCF emissions projections each year The projections used here are based on data from the 2016 GHG inventory (covering the period 1990 to 2014) The projections indicate that the LULUCF sector will be a net sink of approximately 12 Mt CO2eqyear in 2020 The Forestry Cropland Grassland and Settlement categories dominate the trend
Work to assess the mitigation potential in the sector has been carried out by the Forestry Commission (forest sector) and Defra (grassland and cropland soil carbon stocks) In 2014 BEIS commissioned work to investigate the possible magnitude direction and trends in emissions and removals resulting from WDR
The Committee on Climate Change (CCC) advises UK Government on how the UKrsquos commitments to GHG mitigation targets can be met The CCC has adopted a bottom-up marginal abatement cost curve (MACC) approach to help advise on setting appropriate Carbon Budgets
An economy wide MACC was developed by Government as part of the process for setting the Fifth Carbon Budget in 2016 including both peatland restoration and afforestation1 Current work indicates that woodland creation has a relatively high mitigation potential in relation to other forestry measures Reducing deforestation has a medium mitigation potential although in many cases abatement would be difficult to deliver due to environmental policy conflicts Improving forest management has a relatively low mitigation potential
The majority of the potential abatement identified in the GHG projections arises from woodland creation (Kyoto Protocol activities Afforestation and Reforestation) The nature of the woodland planted determines the level of abatement the timeframe over which
1 DECC (2016) Impact Assessment for the level of the Fifth Carbon Budget httpwwwlegislationgovukukia2016177pdfsukia_20160177_enpdf
abatement is delivered and the contribution to abatement delivered in other sectors including through providing a renewable energy feedstock Unmanaged woodland particularly on productive sites will generally make the largest contribution to LULUCF removals but will make no contribution to abatement in other sectors
For Cropland and Grassland recent UK research indicates that there are few measures that could be implemented to reliably achieve significant emissions reductions or increased removals without impacting production These measures could include increasing the land area under perennial crops (with limited possibility for the UK) increasing the use of set aside improving grassland and altering grassland rotation patterns Peatland restoration (rewetting) has been identified as a measure to reduce greenhouse gas emissions although the amount of abatement that can be achieved is still being investigated
Since the first Action Report was submitted in 2015 the UK and its devolved administrations have made progress in a number of ways as follows
United Kingdom
bull Completion in 2016 of the pilot phase of the Peatland Code ndash a UK Voluntary Code to encourage and support private sector funding for peatland restoration projects
England
bull Natural Englandrsquos Strategic Approach to the Restoration of Blanket Bog ndash published in 2015
bull pound100m capital funding investment in projects to support the natural environment over the next five years including the restoration of peatlands
6 UK LULUCF Action Progress Report
bull The forthcoming 25-Year Environment Plan which will set out Englandrsquos long term plans for environmental policy and will help to target this resource in the right places
bull Woodland Creation Planning Grant ndash to support the planning of woodlands larger than 30 ha to help break down the perceived barrier that the UKrsquos regulatory framework presents in England
bull Woodland Carbon Fund ndash to support the planting of woodlands larger than 30 ha with a significant productive element
Northern Ireland
bull The Northern Ireland Rural Development Plan (RDP) was approved by the European Commission in August 2015
bull The Department of Agriculture Environment and Rural Affairsrsquo (DAERA) new agri-environment scheme the Environmental Farming Scheme (EFS) is planned to open for applications in February 2017
Scotland
bull The Scottish Government and Scottish Natural Heritage (SNH) consulted on a National Peatland Plan in 2014 and the final plan was published in August 2015
bull Through the SNH-led Peatland Action initiative 10000 hectares of peatlands have been restored since 2013
Introduction
Purpose of the UK LULUCF Action Progress Report
Pursuant to Article 10(4) of Decision 5292013EU2 this report provides an update to the European Commission (EC) on progress on the United Kingdomrsquos Land Use Land Use Change and Forestry (LULUCF) mitigation actions
On 9th January 2015 the United Kingdom (UK) submitted an Action Report as required under Article 10(1) of Decision 5292013EU to provide the EC specified information no later than 18 months after the beginning of each accounting period on its current and future LULUCF actions to limit or reduce emissions and maintain or increase removals resulting from LULUCF This information was provided as an addendum to the UK National Low-Carbon Development Strategy
Development of the UK LULUCF Action Progress Report
The UKrsquos LULUCF Action Report (2015) was developed by the Department of Energy and Climate Change (DECC) in close collaboration with the Devolved Administrations (DAs) ndash Scotland Wales and Northern Ireland the 2 Decision No 5292013EU of the European
Parliament and of the Council of 21 May 2013 on accounting rules on greenhouse gas emissions and removals resulting from activities relating to land use land-use change and forestry and on information concerning actions relating to those activities httpeur-lexeuropaeulegal-contentENTXTPDFuri=CELEX32013D0529ampfrom=EN
Department for Environment Food amp Rural Affairs (Defra) and the Forestry Commission Similarly this Action Progress Report has been coordinated by the Department for Business Energy and Industrial Strategy (BEIS) with inputs from these organisations
Structure of the LULUCF Action Progress Report
The UKrsquos LULUCF Action Report (2015) was organised into 6 sections and this Action Progress Report follows the same structure
Chapter 1 provides a general overview of national circumstances on LULUCF with a particular focus on Afforestation Reforestation and Deforestation (ARD) Forest Management (FM) Cropland Management (CM) Grazing Land Management (GM) and also relevant information on Wetland Drainage and Rewetting (WDR)
Chapter 2 outlines past emissions and removals for the LULUCF sector with some emphasis on the key categories and land management types for CM GM and FM activities
Chapter 3 outlines projections for the LULUCF sector and by land use category (with or without measures) up to 2020
Chapter 4 provides an analysis of the potential to limit or reduce emissionsremovals for the LULUCF sector (an assessment of mitigation potential)
Introduction 7
8 UK LULUCF Action Progress Report
Chapter 5 outlines the list of measures which could be implemented to achieve emissions reductions in the LULUCF sector under UK conditions (not limited to indicative measures specified in Annex IV of LULUCF Decision 5292013EU)
Chapter 6 discusses the identification of existing policies and measures and their impacts (including semi-quantitative or qualitative description of the effects of measures on emissionsremovals) It provides updated information on the range of action being undertaken in the UKrsquos LULUCF sector
Strategic context
Articles 10(1) and 10(2) of Decision 5292013EU require that Member States submit information on the most relevant current and future LULUCF actions being taken in Member States for all LULUCF categories The actions include those aimed at limiting or reducing GHG emissions and maintaining or increasing GHG removals resulting from Afforestation Reforestation and Deforestation (ARD) Forest Management (FM) Cropland Management
(CM) Grazing Land Management (GM) Wetland Drainage and Rewetting (WDR) and Revegetation (RV) (as defined in Articles 3(1) 3(2) and 3(3)) The UK opted to submit the LULUCF actions in 2015 as an addendum to the Low-Carbon Development Strategy
In tandem with Decision 5292013EU the Regulation on the mechanism for monitoring and reporting (MMR) of greenhouse gases No 5252013EU345 also entered into force on 8 July 2013 It streamlines and enhances the legal basis for the Monitoring and Verification procedures for Member Statesrsquo
3 Regulation No 5252013EU of the European Parliament and of the Council of 21 May 2013 on a mechanism for monitoring and reporting greenhouse gas emissions and for reporting other information at national and Union level relevant to climate change It replaces the earlier legislative act Decision No 2802004EC of the European Parliament and of the Council of 11 February 2004 concerning a mechanism for monitoring Community greenhouse gas emissions and for implementing the Kyoto Protocol
4 Following Decision 2CMP75 Mandatory for those Member States which elected
the activity in the first commitment period
Box 1 Status of LULUCF activities under the KP and the EU Decision
Activity KP-LULUCF 1st commitment period
KP-LULUCF 2nd commitment period4
Decision 5292013EU
Relevant article of Decision 5292013EU
AfforestationReforestation
Mandatory Mandatory Mandatory Article 3(1)
Deforestation Mandatory Mandatory Mandatory Article 3(1)Forest Management Elective Mandatory Mandatory Article 3(1)Cropland Management
Elective Elective5 Mandatory from 2021
Article 3(2)
Grazing Land Management
Elective Elective3 Mandatory from 2021
Article 3(2)
Wetland Drainage and Rewetting
Not applicable Elective3 Elective Article 3(3)
Revegetation Elective Elective3 Elective Article 3(3)
Introduction 9
annual GHG inventories and for assessing efforts towards meeting emissions targets under the Kyoto Protocol (KP) The new MMR integrates requirements linked to the LULUCF reporting categories whilst building on existing common processes for gathering and publishing Member Statesrsquo information on GHG projections as well as the policies and measures already in place to reduce emissions
In addition to the Article 10 reporting requirements there are requirements of Member States to provide updates on progress with the systems in place and estimates of GHG emissions and removals in relation to Cropland Management and Grazing Land Management under Article 3 of the Decision Box 1 provides an overview of the main reporting and accounting requirements for all the LULUCF categories as set out under Article 3
During the first commitment period of the KP the UK elected FM and did not elect CM GM and WDR However for the second commitment period the UK has elected to report and account for all three activities The UK has a good basis for estimating emissionsremovals from the LULUCF sector through the national inventory submitted under the UNFCCC and KP The historical inventory for LULUCF also provides a basis for projections for the LULUCF sector up to 2050 under the UK Climate Change Act ndash UK Carbon Budgets The way land is used and managed has the potential to contribute positively to climate change mitigation However as emissions associated with agriculture and forestry depend on many external factors such as weather water or soil conditions there is a high level of uncertainty in some of the emissions and removals estimates Therefore it is often difficult to assess the potential of individual climate-related policies and measures
10 UK LULUCF Action Progress Report
Chapter 1 A general overview of national circumstances on LULUCF
This chapter provides an overview of the UK national circumstances with regards to reporting of emissionsremovals in the LULUCF sector This builds on existing systems in place under the UNFCCC and the Kyoto Protocol and information presented here is consistent with the 6th UK National Communication submitted to the UNFCCC
National Circumstances
Climate profile
The UKrsquos climate is maritime moist and temperate with a moderate annual temperature range Average annual precipitation in the UK typically ranges from approximately 600 mm to 1400 mm The UK climate is heavily influenced by its proximity to the Atlantic Ocean and the Gulf StreamNorth Atlantic Drift which brings warm water into high northern latitudes Prevailing winds are westerly and so the UK regional climates vary with distance from the Atlantic as well as topography Continental influences are most strongly seen in the southeast of the country
The climate affects crop systems grasslands and forestry Crop losses and other impacts on grasslands have been identified due to flooding and coastal erosion6
6 DECC (2013) The UKrsquos Sixth National Communication and First Biennial Report under the UNFCCC httpunfcccintfilesnational_reportsannex_i_natcomsubmitted_natcomapplicationpdfuk_6nc_and_br1_2013_final_web-access[1]pdf
Forestry profile
According to forestry statistics the area of woodland in the UK is 316 million hectares (ha) as of 31st March 2016 Of this total 144 million ha (45) are in Scotland 131 million ha (41) are in England 031 million ha (10) are in Wales and 011 million ha (4) are in Northern Ireland This has changed relatively little over the period 2007 to 2011 State forests account for 086 million ha7
Around 16 million ha (51) of the total UK woodland area is made up predominantly of conifer species the remainder being broadleaved The total area of new planting and restocking in the UK was 19 thousand ha in 2015-16 Restocking accounted for 71 of this total Broadleaved species accounted for 65 of the new planting area but just 26 of the restocked area in 2015-168
A total of 108 million green tonnes of softwood was produced in the UK in 2015 UK hardwood production totalled 05 million green tonnes in 20159 Softwood availability in Great Britain is projected to increase from an annual average of 165 million green tonnes over the
7 Forestry Commission (2016) Forestry Statistics 2016 httpwwwforestrygovukpdfCh1_Woodland_FS2016pdf$FILECh1_Woodland_FS2016pdf
8 Forestry Commission (2016) Forestry Statistics 2016 ndash Woodland area and planting httpwwwforestrygovukpdfCh1_Woodland_FS2016pdf$FILECh1_Woodland_FS2016pdf
9 Forestry Commission (2016) Forestry Statistics 2016 ndash Wood production httpwwwforestrygovukpdfCh2_Timber_FS2016pdf$FILECh2_Timber_FS2016pdf
period 2013-2016 to 172 million green tonnes over the five-year period 2017 to 2021 and 184 million green tonnes from 2027 to 2031 Apparent consumption of wood in the UK amounted to 556 million m3 wood raw material equivalent in 2015 made up of 106 million m3 UK production 491 million m3 imports and 41 million m3 exports10
In the UK 83 of forests are managed for production 18 are managed for conservation of biodiversity and 4 are for public access11
10 Forestry Commission (2016) Forestry Statistics 2016 ndash Trade httpwwwforestrygovukpdfCh3_Trade_FS2016pdf$FILECh3_Trade_FS2016pdf
11 FAO (2010) Global Forest Resources Assessment 2010 Main Report httpwwwfaoorgdocrep013i1757ei1757epdf
Agriculture profile
The total area of agricultural land in the UK in 2014 was around 185 million ha12 About 49 million ha of this was under crops (including uncropped arable land) of which around 65 was under cereal production 111 million ha is currently under grass (temporary permanent and sole right rough grazing) The remainder was common rough grazing other land (roads paths buildings etc) or farm woodland
12 Defra (2015) Farming Statistics Final crop areas yields livestock populations and agricultural workforce At June 2015 ndash United Kingdom httpswwwgovukgovernmentuploadssystemuploadsattachment_datafile486326structure-jun2015final-uk-17dec15pdf
13 Defra (2016) UK land areas livestock numbers and agricultural workforce on agricultural holdings on 1 June httpswwwgovukgovernmentstatistical-data-setsstructure-of-the-agricultural-industry-in-england-and-the-uk-at-june
Table 1-1 Total crop areas in the UK 2011-2014 (thousand hectares)14
Area of arable crops 2011 2012 2013 2014Total area of arable crops 4497 4576 4502 4559of which wheat 1969 1992 1615 1936
barley 970 1002 1213 1080oats 109 122 177 137rye mixed corn amp triticale 27 26 24 26oilseed rape 705 756 715 675linseed 36 29 34 15potatoes 146 149 139 141sugar beet (not for stockfeeding) 113 120 117 116peas for harvesting dry and field beans 155 120 147 139maize 164 158 194 183
Total area of horticultural crops 175 172 163 164of which vegetables grown outdoors 129 123 116 116
orchard fruit 24 24 23 23soft fruit amp wine grapes 10 9 10 9outdoor plants and flowers 11 12 12 12glasshouse crops 2 3 3 3
Chapter 1 A general overview of national circumstances of LULUCF 11
12 UK LULUCF Action Progress Report
The crop area increased by 2 between 2011 and 2014 while the area of uncropped arable land increased by 3
The total crop areas in the UK from 2011 to 2014 are presented in Table 1-1
The production of biomass based non-food crops is increasing but is still a small percentage of overall cropland In April 2012 the UK Bioenergy Strategy was published which encourages the production of biomass In August 2013 there were 11000 ha of land approved for planting with energy crops6
In 2014 66 of the total agricultural area was grassland There are three main types of grassland
bull Rotational grassland intensively managed ldquograss leysrdquo sown every few years as part of a crop rotation This type of grassland can be used for fodder production and livestock grazing (Equivalent to temporary grassland in the UK Survey of Agriculture)
bull Permanent pasture grassland maintained perpetually without reseeding In the UK this has mostly been created by draining or fertilising rough grazing land (Equivalent to grass over 5 years old in the UK Survey of Agriculture)
bull Rough grazing uncultivated grassland found in upland and heath areas of the UK Used for extensive livestock grazing (Equivalent to sole right and common rough grazing in the UK Survey of Agriculture)
Reporting of the LULUCF sector in the GHG inventory
The UK annually reports emissions and removals from the LULUCF sector under the UNFCCC and the Kyoto Protocol (KP) In the UK three principal organisations are involved in estimating and reporting emissions and removals from the LULUCF sector Ricardo Energy amp Environment (Ricardo-EE) the UK
Natural Environment Research Councilrsquos Centre for Ecology and Hydrology (CEH) and Forest Research CEH compiles estimates of emissions and removals from the LULUCF sector with assistance from Forest Research using national data sources on land use and management Ricardo-EE provides support on Quality Assurance and co-ordinates the reporting of the UKrsquos GHG emission inventory
The UNFCCC basis for reporting of emissions and removals from the LULUCF sector includes all human-induced changes to land-based carbon stocks and GHG (CO2 CH4 and N2O) emissions from land use and land use change This is undertaken for six land use categories ndash Forest Land (5A) Cropland (5B) Grassland (5C) Wetlands (5D) Settlements (5E) Other land (5F) and Harvested Wood Products (5G)
Reporting of carbon stock changes from land use change is complete and reporting of GHG emissions and removals from non-forest land management in the LULUCF sector is approaching completion The UK is conducting research into the effects of land management on LULUCF sector emissions and removals and the results of this will be included in future inventories in order to move towards a more comprehensive GHG reporting and accounting system by 2020 (see Table 1-2)
The EU Decision requires as a minimum information relating to each of the activities referred to in Article 3(1) 3(2) and 3(3) The specific activities that the decision refers to are Kyoto Protocol activities Afforestation (A) Reforestation (R) Deforestation (D) Forest Management (FM) Cropland Management (CM) and Grazing Land Management (GM) The activities of Revegetation and WDR remain voluntary and the UK has chosen to elect and report emissionsremovals from WDR
The sections below set out the accounting requirements for the LULUCF sector emissions and removals under the KP and the reporting requirements under the UNFCCC
Chapter 1 A general overview of national circumstances of LULUCF 13
KP Forestry Activities Afforestation Reforestation Deforestation and Forest Management
The UK currently reports net emissions and removals from AfforestationReforestation Deforestation and Forest Management under the KP in the UK National Inventory Report The UK definition of forest is consistent between the UNFCCC reporting and the KP reporting and the entire forest area is considered as managed rather than unmanaged land
The areas of forest land accounted for in AR and FM under the KP are broadly equivalent to the area reported under 4A Forest Land in the UNFCCC reporting14 Carbon stock changes are reported for above- and below-ground biomass litter (including deadwood) mineral and organic soils and harvested wood products Greenhouse gas sources are 14 DECC (2016) UK Greenhouse Gas Inventory
1990 to 2014 Brown P Broomfield M Buys G Cardenas L Kilroy E MacCarthy J Murrells T Pang Y Passant N Ramirez Garcia J Thistlethwaite G Webb N httpsuk-airdefragovukassetsdocumentsreportscat071605241007_ukghgi-90-14_Issue2pdf
reported for N2O from forest fertilisation N2O emissions from drained forest soils and N mineralisation following land use change and CO2 CH4 and N2O emissions from biomass burning in wildfires Carbon stock changes dominate net emissions from the AR and FM activities
The area accounted for under Deforestation is the land area converted from forests to cropland grassland and settlements since 1990 Carbon stock changes are reported for above- and below-ground biomass litter (including deadwood) and soils Harvested wood products are assumed to be instantaneously oxidised following deforestation Greenhouse gas sources are reported for N2O emissions from N mineralisation following land use change and CO2 CH4 and N2O emissions from controlled biomass burning during deforestation and a small area of wildfires on previously deforested land Carbon stock changes and biomass burning are the main source of net emissions from this activity
Emissions and removals from forestry are modelled using the Tier 3 CARBINE forest carbon accounting model (Forest Research) The model uses areaage-class information from the UKrsquos National Forest Inventory and
Table 1-2 Timetable of implementation of LULUCF inventory improvements
Inventory development projects Estimated date of implementation
Defra project SP1113 on impact of cropland and grassland management on soil carbon
2015 (Cropland Management)
BEIS project on impact of cropland and grassland management on biomass carbon 2015-18BEIS project on implementing the IPCC 2013 Wetlands supplement Feasibility study on reporting of WDR 2019Development of stock change factors for reporting of Grazing Land Management 2018BEIS project on applying Earth Observation to assess land use change 2020Integration of outputs from above research projects into LULUCF Inventory 2015 onwards
14 UK LULUCF Action Progress Report
Forestry Commission planting statistics15 This is combined with forest stand-level yield tables on stand structure and growth CARBINE can be used to estimate historical current and future forest carbon stocks under different forest area and management scenarios The CARBINE model is described in the 1990-2014 National Inventory Report (NIR) CARBINE takes account of losses of Forest Land converted to other categories and the associated carbon stock changes and emissions and removals are then estimated and reported under the category concerned
Activity data on Deforestation are compiled from Forestry Commission felling licence data historical estimates of land use change from forestry and estimates of forest conversion from the National Forest Inventory16 (see the NIR for further details) The activity data for the GHG sources are the same as those used in the CARBINE model with a Tier 1 methodology applied to estimate emissions
The strength of the carbon sink in forests is determined by the afforestation rate in earlier decades and the effect this has on the age structure and average growth rates of existing forests (with forest management typically operating over rotations of 40-120 years) Forest land is currently a decreasing sink due to much of the large productive area planted in the 1950s to 1980s maturing and being harvested together with low rates of afforestation since the 1990s6
15 Forestry Commission (2016) Forestry Statistics 2016 ndash Woodland area and planting httpwwwforestrygovukwebsiteforstats2016nsfLUContentsTopopenviewampRestrictToCategory=1
16 Forestry Commission (2016) Preliminary estimates of the changes in canopy cover in British woodlands between 2006 and 2015 httpwwwforestrygovukpdfPreliminary_ estimatesofthechangesincanopycoverin Britishwoodlandsbetween2006and2015pdf$FILEPreliminary_ estimatesofthechangesincanopycoverin Britishwoodlandsbetween2006and2015pdf
Nitrogen fertilisers (relevant to emissions of N2O) are only applied to forests when it is absolutely necessary This would occur during the first rotation on lsquopoorrsquo soils such as reclaimed slag heaps impoverished brown field sites and upland organic soils In terms of the inventory this means that nitrogen fertilisation is assumed for areas of Settlements converted to Forest Land and Grassland converted to Forest Land on organic soils Nitrogen fertilisers are not generally applied to native woodlands mature forests or re-planted forests in the UK No lime (relevant to emissions of CO2) is applied to established or newly planted forests in the UK In England lime may be applied to land deforested to cropland
Drainage of forest land occurs in UK forests planted on certain soils types Controlled burning of forest land (for example for habitat management) does not take place in the UK Wildfires do occur but to a limited extent on account of the generally moderate to high rainfall in the northern and western UK and it is assumed that land use change does not occur following wildfire
KP Agricultural Activities Cropland Management
Cropland Management (CM) is defined as a system of practices on land on which agricultural crops are grown and on land that is set-aside or temporarily not being used for crop production CM includes all lands under annual and perennial crops and all fallow lands set at rest for one or several years before being cultivated again17 The UK has elected to report this activity for the second commitment period of the Kyoto Protocol
Carbon stock changes for above-ground biomass and soils and GHG emissions from wildfires and N mineralisation due to carbon losses associated with land-use conversions and management change are reported for
17 FCCCCP200113Add1 21 January 2002 Page 58 httpunfcccintresourcedocscop713a01pdf
Chapter 1 A general overview of national circumstances of LULUCF 15
KP Cropland Management These can result from both land use change and cropland management activities and are estimated using the same methods for reporting of UNFCCC category 4B Cropland The area of KP Cropland Management is estimated by combining annual agricultural census data and information from the land use change matrices (derived from the Countryside Survey) Additional activity data on different cropland management practices come from fertiliser and farm practice surveys18
Carbon stock changes due to land use change are estimated using the Tier 3 land use change matrix-soil carbon model for the UK and GHG emissions from wildfires and N mineralisation are estimated using Tier 1 methods (see Annex 34 in the 1990-2014 NIR) Change in soil carbon stocks due to Cropland Management is estimated using the Tier 2 methodology developed in Defra project SP111319 which reviewed UK relevant literature on the effects of cropland management practices on soil carbon stocks and attempted to model UK specific emission factors Change in cropland biomass carbon stocks was assessed based on agricultural census data on the areas under
18 British Survey of Fertiliser Practice 2014 httpswwwgovukgovernmentuploadssystemuploadsattachment_datafile419275fertiliseruse-statsnotice-01apr15pdf Farm Practice Survey (England) 2010 httpwebarchivenationalarchivesgovuk20130315143000httpwwwdefragovukstatisticsfilesFPS2010pdf Scottish Survey of Agricultural Production Methods 2010 httpwwwgovscotPublications2012107669 Scottish Survey of Farm Structure and Methods 2013 httpwwwgovscotPublications20131176255
19 Moxley J Anthony S Begum K Bhogal A Buckingham S Christie P Datta AUlrike Dragosits U Fitton N Higgins A Myrgiotis VKuhnert MLaidlaw S Malcolm H Rees B Smith P Tomlinson S Topp K Watterson J Webb J Yeluripati J (2014) Capturing Cropland and Grassland Management Impacts on Soil Carbon in the UK LULUCF Inventory Contract Report prepared for the Department for Environment Food and Rural Affairs Project SP1113
different crop types and UK-specific biomass stock factors Biomass carbon stock change was assumed to occur in the year in which the change in crop type was reported Cropland biomass stock changes resulting from land use change to or from Cropland were subtracted from the changes due to change in cropland management The methodology is also used for the UNFCCC inventory reporting and is described fully in the 1990-2014 NIR
KP Agricultural Activities Grazing Land Management
Grazing Land Management (GM) is the system of practices on land used for livestock production aimed at manipulating the amount and type of vegetation and livestock produced20 The UK has elected this activity for the second commitment period of the Kyoto Protocol
Carbon stock changes due to land use change are estimated using the Tier 3 land use change matrix-soil carbon model for the UK and GHG emissions from wildfires and N mineralisation are estimated using Tier 1 methods (see Annex 34 in the 1990-2014 NIR) Only biomass stock changes due to grassland management activities are included for KP Grazing Land Management as it has not been possible to develop appropriate emission factors for UK soils Defra project SP1113 suggested that Tier 1 emission factors for emissions and removals as a result of changing soil carbon stocks due to management activities on Grazing Land may not be appropriate for high carbon organo-mineral soils which are present under large areas of rough grazing land in the UK and further research has been commissioned by BEIS to identify suitable emission factors and activity data for these systems As a result soil carbon stock changes for Article 34 Grazing Land Management are not yet reported fully but work is being done to address this
20 FCCCCP200113Add1 21 January 2002 Page 58 httpunfcccintresourcedocscop713a01pdf
16 UK LULUCF Action Progress Report
The area of Grazing Land Management reported under Article 34 is estimated from Countryside Survey data using the assumption that all grassland in the UK is subject to grazing and management to some degree
KP Activities Wetland Drainage and Rewetting
Wetland Drainage and Rewetting (WDR) is a system of practices for draining and rewetting on land with organic soil The activity applies to all lands that have been drained since 1990 and to all lands that have been rewetted since 1990 and that are not accounted for under any other KP activity
This activity was only introduced for the second commitment period The UK has decided to elect this activity Work is being undertaken to establish systems for reporting and accounting for WDR in the LULUCF inventory and WDR will be reported in future LULUCF inventories in preparation for the submission of WDR accounts for the period 2013-2020 under both EU and KP
KP Activities Revegetation
Revegetation (RV) is a direct human-induced activity to increase carbon stocks on sites through the establishment of vegetation that covers a minimum area of 005 hectares and does not meet the definitions of AR Revegetation activities are not known to occur in the UK and the UK has not elected this activity
Differences in the UNFCCC categories and KP accounting
Forestry related
The UK estimates and reports emissions and removals from land transitions to forest land and from forest management activities Full methodological details are provided in the UK NIR As stated above the area of forest land accounted for in Afforestation and Forest Management are broadly equivalent
to the area reported under category 4A in the UNFCCC inventory The UKrsquos LULUCF inventory allows the estimation of land use type following deforestation
Mapping of KP activities to UNFCCC categories (KP Supplement 2013)
UNFCCC Land use categories
Kyoto Protocol activities
Cropland converted to Forest Land
33 Afforestation and Reforestation
Grassland converted to Forest LandWetlands Settlements and Other land converted to Forest LandForest Land converted to Cropland Grassland Wetlands Settlements and Other land
33 Deforestation
Forest Land remaining Forest Land
34 Forest Management
UNFCCC Cropland category and KP Cropland Management activity
Under UNFCCC reporting the 4B Cropland category includes estimates of carbon stock change as a result of land conversion to cropland and emissions from historical land use change in the cropland remaining cropland category21 Soil and biomass carbon stock changes from cropland management are also reported GHG emissions from drainage of organic soils N2O emissions from N mineralisation following land use change and emissions from biomass burning during deforestation and non-CO2 emissions from wildfires on cropland are included CO2 21 IPCC (2006) 2006 IPCC Guidelines for National
Greenhouse Gas Inventories Prepared by the National Greenhouse Gas Inventories Programme Eggleston HS Buendia L Miwa K Ngara T and Tanabe K (eds) Published IGES Japan Volume 4 Agriculture Forestry and Other Land Use Section 56 httpwwwipcc-nggipigesorjppublic2006glvol4html
Chapter 1 A general overview of national circumstances of LULUCF 17
emissions from wildfires on cropland are assumed to be recaptured within a year by new plant growth
Definitions of cropland are shared between the UNFCCC Cropland and the KP Cropland Management categories The main differences arise due to the hierarchical nature of KP reporting land that has been deforested to cropland will remain in the Deforestation activity and land that has been converted from cropland to other land uses (not to forest land or to grassland) remains in the KP Cropland Management activity
Mapping of KP activities to UNFCCC categories (KP Supplement 2013)
UNFCCC Land use categories
Kyoto Protocol activities
Cropland remaining Cropland
34 Cropland Management
Grassland converted to CroplandWetlands Settlements and Other land converted to CroplandCropland converted to other land use (Wetlands Settlements and Other land)
UNFCCC Grassland category and KP Grazing Land Management activity
Under UNFCCC reporting the 4C Grassland category includes estimates of carbon stock change as a result of land conversion to grassland and emissions from historical land use change in the grassland remaining grassland category Biomass carbon stock changes from grassland management are reported and the potential for reporting soil carbon stock changes from grassland management has been assessed but there are currently insufficient UK-specific data to allow reporting GHG emissions from drainage of organic soils N2O emissions from
N mineralisation following land use change and emissions from biomass burning during deforestation and non-CO2 emissions from wildfires on grassland are included CO2 emissions from wildfires on grassland are assumed to be recaptured within a year by new plant growth
The definition of the area that falls under KP Grazing Land Management mostly matches with the UNFCCC inventory definition of grassland Similarly to KP Cropland Management land that has been deforested to grazing land will remain in the Deforestation activity and land that has been converted from grazing land to other land uses (not to forest land or to cropland) remains in the KP Grazing Land Management activity
Mapping of KP activities to UNFCCC categories (KP Supplement 2013)
UNFCCC Land use categories
Kyoto Protocol activities
Grassland remaining Grassland
34 Grazing Land Management
Cropland converted to GrasslandWetlands Settlements and Other land converted to GrasslandGrassland converted to other land use (Wetlands Settlements and Other land)
UNFCCC Wetlands category and KP Wetland Drainage and Rewetting activity
In the UNFCCC Wetlands category the UK reports on-site and off-site emissions from peat extraction and loss of biomass carbon on conversion to flooded land Emissions of CO2 and N2O from peat extraction account for lt01 of total UK emissions of greenhouse gases Work is on-going to allow the UK to develop a framework for reporting and accounting of emissionsremovals from WDR
18 UK LULUCF Action Progress Report
based on the methodology in the IPCC 2013 Wetlands Supplement22
WDR was not included in the first commitment period of the KP WDR is not comparable to the Wetlands category in the UNFCCC inventory The KP WDR activity can include areas of organic soils under agriculture and forestry (reported under the Cropland Grassland and Forest Land UNFCCC categories) The WDR definition clearly states that this activity is at the bottom of the KP activity hierarchy and can only apply to areas not accounted for under other KP land-use activities Once the UKrsquos WDR development programme is complete (in 2017) we will have a clearer understanding of the comparability of the UNFCCC and KP wetland activities
Key Carbon pools and Carbon sources in the various KP LULUCF categories (ARD and FM) and for CM and GM
In the UK KP GHG inventory five categories are considered to be key in the 1990-2014 inventory (from the LULUCF Key Category Analysis)
bull Article 33 Afforestation and Reforestation (CO2)
bull Article 33 Deforestation (CO2)
bull Article 34 Forest Management (CO2)
bull Article 34 Cropland Management (CO2) and
bull Article 34 Grazing Land Management (CO2)
22 IPCC (2014) 2013 Supplement to the 2006 IPCC Guidelines for National Greenhouse Gas Inventories Wetlands Hiraishi T Krug T Tanabe K Srivastava N Baasansuren J Fukuda M and Troxler TG (eds) Published IPCC Switzerland httpwwwipcc-nggipigesorjppublicwetlands
These have been determined according to the IPCC 2013 Kyoto Protocol Supplement section 236 The net emissions from these activities have been compared with the main key category analysis for the latest reported year of the UK inventory (2014) based on level of emissions (including LULUCF)
Article 33 Afforestation and Reforestation (CO2) The associated UNFCCC category 4A (-1737 Mt CO2) is a key category and the AR component (forest planted since 1990) is key on its own (ie its category contribution (-336 Mt CO2) is greater than the smallest UNFCCC key category (4G Harvested Wood Products) Removals from this category are also predicted to increase over time as a result of tree planting schemes partially focussed on climate change mitigation
Article 33 Deforestation (CO2) The associated UNFCCC categories (4B 4C and 4E) are key categories (1186 -931 and 592 Mt CO2 respectively) however the Deforestation category contribution (089 Mt CO2) to these UNFCCC categories is smaller than the smallest UNFCCC key category (4G Harvested Wood Products) The data used in the calculation of deforestation emissions are the most uncertain of the data sources in the KP-LULUCF inventory but improvements have been made in reporting
Article 34 Forest Management (CO2) The associated UNFCCC category 4A is a key category (-1737 Mt CO2) The Forest Management category contribution (-1710 Mt CO2) is also greater than other categories in the UNFCCC key category analysis
Article 34 Cropland Management (CO2) The associated UNFCCC category 4B is a key category (1186 Mt CO2) The Cropland Management category contribution (727 Mt CO2) is also greater than the smallest UNFCCC key category (4G Harvested Wood Products)
Chapter 1 A general overview of national circumstances of LULUCF 19
Article 34 Grazing Land Management (CO2) The associated UNFCCC category 4C is a key category (-931 Mt CO2) The Grazing Land Management category contribution (-289 Mt CO2) is also greater than the smallest UNFCCC key category (4G Harvested Wood Products)
There is insufficient information available on the emissions and removals from the WDR category to allow an assessment of whether this will also be a key category
Estimates of the carbon contents of all Forest Land carbon pools have been published in Forestry Statistics23 Data from the National Forest Inventory including from Carbon in live woodland trees in Britain24 have been used to update these estimates
Key sources of non-CO2 emissions
No sources of non-CO2 emissions under current KP reporting are considered to be key categories Emissions of N2O are reported from fertilization of forest land (AR) from disturbance associated with land-use change (Deforestation Cropland Management and Grazing Land Management) and drainage of soils under forest management (FM) N2O and CH4 emissions from biomass burning are reported for all relevant categories
23 Forestry Commission (2016) Forestry Statistics 2016 ndash UK forests and climate change httpwwwforestrygovukpdfCh4_Climate-Change_FS2016pdf$FILECh4_Climate-Change_FS2016pdf httpwwwforestrygovukwebsiteforstats2016nsfLUContentsTopopenviewampRestrictToCategory=1
24 Forestry Commission (2014) Carbon in live woodland trees in Britain National Forest Inventory report httpwwwforestrygovukpdffcnfi113pdf$FILEfcnfi113pdf
20 UK LULUCF Action Progress Report
Chapter 2 Past emissions and removals from the LULUCF sector
Overview of historical emissions and removals for the LULUCF sector
Both emissions and removals occur in this sector Forest Land and Grassland are typically net sinks while the Cropland area is a net source
The UK has moved from being a net source of GHG emissions from LULUCF activities in 1990 to a net sink for all years after 1991 see Figure 2-1
As the LULUCF sector comprises both emissions and removals of greenhouse gases it is inappropriate to express the change since 1990 on a percentage basis Total estimated direct emissionsremovals of greenhouse gases from the LULUCF sector fell from a source of 027 Mt CO2e per year in 1990 to a sink of 896 Mt CO2e per year in 2014 The land use categories which have the greatest effect on the net LULUCF emissionsremovals are Forest Land and Grassland (net sinks) and Cropland and Settlement (net sources)
-10
-8
-6
-4
-2
0
2
Net
em
issi
ons
rem
oval
s (M
t CO
2e)
1990
1991
1992
1993
1994
1995
1996
1997
1998
1999
2000
2001
2002
2003
2004
2005
2006
2007
2008
2009
2010
2011
2012
2013
2014
Figure 2-1 Time series of net GHG emissions and removals from the LULUCF sector 1990-2014 (Mt CO2e)
Chapter 2 Past emissions and removals from the LULUCF 21
UNFCCC basis historical emissions and removals from all LULUCF categories
This section provides an overview of the emissions and removals in the LULUCF sector according to UNFCCC category
The LULUCF sector (Sector 4 in the national GHG inventory) is divided into six land use types for reporting of emissionsremovals 4A Forest Land 4B Cropland 4C Grassland 4D Wetlands 4E Settlements 4F Other Land Net carbon stock changes from Harvested Wood Products are reported in 4G
Carbon uptake associated with UK forests is calculated using CARBINE as mentioned above under KP-LULUCF reporting
For Cropland Grassland and Settlements changes in biomass and soil carbon due to land use change are estimated using a land use change matrix approach Fluxes arising from land use change in the 20 years before the inventory year are reported under the Land converted to categories Fluxes from historical land use change (more than 20 years before the inventory year) are reported under the Land remaining Land categories A dynamic model of carbon stock change is used with the land use change matrices to estimate soil carbon stock changes due to land use change
Emissions from wetlands due to peat harvesting have been developed using a Tier 1 methodology
The time series of emissions and removals for UNFCCC categories are presented in Figure 2-2
22 UK LULUCF Action Progress Report
-20
-15
-10-505101520
2014
2013
2012
2011
2010
2009
2008
2007
2006
2005
2004
2003
2002
2001
2000
1999
1998
1997
1996
1995
1994
1993
1992
1991
1990
Net Emissions and Removals All Gasses (Mt CO2e)
4B4C
4D
Year
4F4A
4E4G
Tota
l LU
LUC
F
Fig
ure
2-2
LULU
CF
emis
sio
ns a
nd r
emov
als
fro
m t
he U
K 1
990
-201
4 b
y ca
teg
ory
(Mt
CO
2e)
The land use categories which have the greatest effect on net LULUCF emissionsremovals are Forest Land and Grassland (net sinks) and Cropland and Settlement (net sources) Forest Land is currently a decreasing sink due to much of the large productive area planted in the 1950s to 1980s maturing and being harvested together with the relatively low rates of afforestation since 1990
Emissions from Cropland and emissions from Settlement have decreased by 22 and 15 respectively since 1990 Cropland is a shrinking net source as rates of land use change have reduced since before 1990 Net removals by Grassland have increased by 37 since 1990
Compared to CO2 emissions of CH4 and N2O are relatively low in this sector Methane emissions from the Forest Land Cropland Grassland and Settlements categories have increased by 74 since 1990 although emissions of methane are highly variable
because wildfires are one of the main LULUCF sources Emissions of nitrous oxide have decreased by 33 since 1990
In 2014 the Forest Land Grassland and Harvested Wood Products categories represented a net sink while Cropland Wetlands and Settlements represented a net source in the UK see Figure 2-3 The emission from Settlements arises mainly from the assumption that all soil carbon is lost from half of the area of land converted to Settlement which may over-estimate emissions but more realistic estimates of soil carbon stocks under buildings are difficult to obtain
In 2014 CO2 represented a net removal of -971 Mt CO2e while CH4 and N2O represented the main sources with emissions of 003 Mt CO2e and 072 Mt CO2e respectively see Figure 2-4
Net
em
issi
ons
rem
oval
s (M
t CO
2e)
-20
-15
-10
-5
0
5
10
15
Forest Land Cropland GrasslandWetland Settlements Harvested Wood Products
Figure 2-3 Net LULUCF emissions by source 2014 (Mt CO2e)
Chapter 2 Past emissions and removals from the LULUCF 23
24 UK LULUCF Action Progress Report
-10
-8
-6
-4
-2
0
2
Net
em
issi
ons
rem
oval
s (M
t CO
2e)
CO2 CH4 N2O
Figure 2-4 Net LULUCF emissions by gas 2014 (Mt CO2e)
KP Activities historical emissions and removals ndash Forestry
This section provides an overview of the forestry-related emissions and removals currently reported for each KP activity Table 2-1 provides a time series of emissions and removals according to KP activity from 1990 to 2014 (NIR 2016)
Methods for estimating carbon stock changes in forests for Article 33 AfforestationReforestation and Article 34 Forest Management are the same as those used for the UNFCCC GHG inventory Estimates for carbon stock changes as a result of Article 33 Deforestation are based on the same methods as the UNFCCC GHG inventory
The carbon uptake by UK forests is calculated using CARBINE Overall carbon uptake is calculated as the net change in the pools of carbon in standing trees litter soil and
harvested wood products for conifer and broadleaf forests The model is able to represent all of the introduced and native plantation and naturally-occurring species relevant to the UK the different growth rates of forests and four broad classes of forest management (clear-fell with thinnings clear-fell without thinnings thinned but not clear-felled and no timber production) The forest carbon sub-model is further compartmentalised to represent fractions associated with tree stems branches foliage and roots The method can be described as Tier 3 as defined in the IPCCrsquos Good Practice Guidance for LULUCF22 The CARBINE model produces separate gains and losses for carbon stock change in living biomass from which the net change is calculated
Other GHG emissions including from forest fertilisation wildfires and N2O emissions from forest drainage are estimated using IPCC Tier 1 or Tier 2 approaches
Chapter 2 Past emissions and removals from the LULUCF 25
Figure 2-5 shows the net emissions and removals of GHGs from Afforestation Reforestation and Deforestation (Article 33)
Figure 2-6 shows the net emissions and removals of GHGs from Forest Management activities (Article 34) The UKrsquos Forest Management Reference Level (FMRL) during the second commitment period is -9275 Mt CO2eyr or -5658 Mt CO2eyr when including harvested wood products This FMRL takes account of the technical correction in the 1990-2014 NIR
The main driver of the emissions and removals trends for the reported KP-LULUCF activities before application of the forest management cap is the degree of forest planting achieved between the 1950s and the 1980s followed by a period of reduced planting rates As these forest stands have reached maturity and are now being harvested the net removal of carbon dioxide from forest management (excluding HWP) has started to fall For Article 33 activities the expansion of forest area at an average of 139 kha per year since 1990 has produced a net removal from afforestation and reforestation that is currently about three times the emission from deforestation Deforestation emissions have however increased since 1990 primarily due to the restoration of open-ground habitats from forests and for the development of wind-farms involving the felling of mature trees
26 UK LULUCF Action Progress Report
Tab
le 2
-1 E
mis
sio
ns a
nd r
emov
als
fro
m K
P a
ctiv
ities
199
0-2
014
(Mt
CO
2e)
Art
icle
Bas
e Ye
ar19
9019
9119
9219
9319
9419
9519
9619
9719
9819
9920
0020
01A
rtic
le 3
3 A
ffore
stat
ion
R
efor
esta
tion
and
Def
ores
tatio
n0
20
20
10
0-0
1-0
2-0
3-0
3-0
5-0
5-0
1-0
1A
rtic
le 3
4 F
MR
LA
rtic
le 3
4 T
echn
ical
Cor
rect
ion
to F
MR
LA
rtic
le 3
4 F
ores
t Man
agem
ent
rem
oval
s co
mpa
red
to F
MR
L an
d Te
chni
cal C
orre
ctio
n (c
appe
d)A
rtic
le 3
4 C
ropl
and
Man
agem
ent
04
04
12
19
28
35
44
49
55
61
67
66
68
Art
icle
34
Gra
zing
Lan
d M
anag
emen
t0
10
10
10
10
10
10
10
00
0-0
1-0
4-0
6-0
7A
rtic
le 3
4 W
etla
nd D
rain
age
and
Rew
ettin
g
Art
icle
2002
2003
2004
2005
2006
2007
2008
2009
2010
2011
2012
2013
2014
Art
icle
33
Affo
rest
atio
n
Ref
ores
tatio
n an
d D
efor
esta
tion
-02
-02
-04
-05
-09
-09
-11
-12
-14
-18
-20
-21
-24
Art
icle
34
FM
RL
-83
-83
Art
icle
34
Tec
hnic
al C
orre
ctio
n to
FM
RL
-57
-57
Art
icle
34
For
est M
anag
emen
t re
mov
als
com
pare
d to
FM
RL
and
Tech
nica
l Cor
rect
ion
(cap
ped)
-37
-31
Art
icle
34
Cro
plan
d M
anag
emen
t6
97
07
27
27
47
37
57
87
98
08
18
17
9A
rtic
le 3
4 G
razi
ng L
and
Man
agem
ent
-09
-10
-12
-13
-15
-16
-18
-19
-20
-22
-23
-25
-26
Art
icle
34
Wet
land
Dra
inag
e an
d R
ewet
ting
Chapter 2 Past emissions and removals from the LULUCF 27
Fig
ure
2-5
Art
icle
33
Aff
ore
stat
ion
Ref
ore
stat
ion
and
Def
ore
stat
ion
activ
ities
em
issi
ons
and
rem
oval
s b
y g
as (M
t C
O2e
)
-40
0
-35
0
-30
0
-25
0
-20
0
-15
0
-10
0
-05
0
000
050
100
150
KP Article 33 emissions and removals of all gases (Mt CO2e)
Soi
l and
Bio
mas
s C
O2
ndash D
efor
esta
tion
Bio
mas
s bu
rnin
g C
O2
ndash D
efor
esta
tion
Bio
mas
s bu
rnin
g C
H4
ndash D
efor
esta
tion
Bio
mas
s b
urni
ng a
nd S
oil N
2O ndash
Def
ores
tatio
nH
WP
from
Affo
rest
atio
n la
nd
Soi
l and
Bio
mas
s C
O2
ndash A
ffore
stat
ion
Bio
mas
s bu
rnin
g C
O2
ndash A
ffore
stat
ion
Bio
mas
s bu
rnin
g C
H4
ndash A
ffore
stat
ion
Bio
mas
s b
urni
ng a
nd S
oil a
nd fe
rtilis
er N
2O ndash
Affo
rest
atio
nTo
tal A
RD
1990
1991
1992
1993
1994
1995
1996
1997
1998
1999
2000
2001
2002
2003
2004
2005
2006
2007
2008
2009
2010
2011
2012
2013
2014
28 UK LULUCF Action Progress Report
Fig
ure
2-6
Art
icle
34
Fo
rest
Man
agem
ent
emis
sio
ns a
nd r
emov
als
by
gas
(Mt
CO
2e)
KP Art 34 FM emissions and removals of all gases (Mt CO2e)
Bio
mas
s an
d so
il C
O2
ndash FM
Bio
mas
s bu
rnin
g amp
Soi
lfer
tilis
erd
rain
age
N2O
ndash F
M
Bio
mas
s bu
rnin
g C
O2
ndash FM
Bio
mas
s bu
rnin
g C
H4
ndash FM
HW
P fr
om F
M la
ndFM
cap
(inc
l H
WP
)
1990
1991
1992
1993
1994
1995
1996
1997
1998
1999
2000
2001
2002
2003
2004
2005
2006
2007
2008
2009
2010
2011
2012
2013
2014
-20
00
-18
00
-16
00
-14
00
-12
00
-10
00
-80
0
-60
0
-40
0
-20
0
000
200
Chapter 2 Past emissions and removals from the LULUCF 29
KP Activities historical emissions and removals ndash Cropland Management and Grazing Land Management
This section provides an overview of the agricultural land-related emissions and removals currently reported for each KP activity
Methods for estimating carbon stock changes and LULUCF GHG emissions on Article 34 Cropland Management and Grazing Land Management are the same as those used for the UNFCCC greenhouse gas inventory These are described in the KP Agricultural Activities section in Chapter 1
Table 2-1 provides a time series of emissions and removals according to KP activity from 1990 to 2014 (NIR 2016)
Figure 2-7 shows the net emissions and removals by gas from Article 34 Cropland Management Figure 2-8 shows the net emissions and removals by gas from Article 34 Grazing Land Management
KP Cropland Management is an increasing source over time based on the 1990-2014 inventory This trend is driven by land use changes to cropland which produce soil carbon losses over long time periods KP Grazing Land Management is a small net source of emissions in 1990 but becomes an increasing net sink in 1997 This trend is also driven by land use change in this case because change to grazing land typically leads to soil carbon stock gains over time
30 UK LULUCF Action Progress Report
Fig
ure
2-7
Art
icle
34
em
issi
ons
and
rem
oval
s fr
om
Cro
pla
nd M
anag
emen
t b
y g
as (M
t C
O2e
)
KP Art 34 Cropland Management net emissions amp removals for all gases (Mt CO2e)
Bio
mas
s bu
rnin
g C
H4
ndash C
ropl
and
Man
agem
ent
Bio
mas
s bu
rnin
g amp
Soi
l N2O
ndash C
ropl
and
Man
agem
ent
Bio
mas
s amp
soi
l CO
2 ndash
Cro
plan
d M
anag
emen
t
1990
1991
1992
1993
1994
1995
1996
1997
1998
1999
2000
2001
2002
2003
2004
2005
2006
2007
2008
2009
2010
2011
2012
2013
2014
000
100
200
300
400
500
600
700
800
900
Chapter 2 Past emissions and removals from the LULUCF 31
Fig
ure
2-8
Art
icle
34
em
issi
ons
and
rem
oval
s fr
om
Gra
zing
Lan
d M
anag
emen
t b
y g
as (M
t C
O2e
)
KP Art 34 Grazing Land Management emissions amp removals for all gases (Mt CO2e)
Bio
mas
s bu
rnin
g C
H4
ndash G
razi
ng L
and
Man
agem
ent
Bio
mas
s bu
rnin
g amp
Soi
l N2O
ndash G
razi
ng L
and
Man
agem
ent
Bio
mas
s amp
soi
l CO
2 ndash
Gra
zing
Lan
d M
anag
emen
t
1990
1991
1992
1993
1994
-35
-30
-25
-20
-15
-10
-050
05
1995
1996
1997
1998
1999
2000
2001
2002
2003
2004
2005
2006
2007
2008
2009
2010
2011
2012
2013
2014
32 UK LULUCF Action Progress Report
Chapter 3 UK Projections for the LULUCF sector
Approach to creating projections in the LULUCF sector
LULUCF emissions projections are produced by CEH Forest Research and Ricardo-EE under contract to BEIS The projections take account of the dynamics of carbon stocks in the relevant pools and GHG emissions produced by LULUCF activities The assumptions underlying the projections were developed by a group of representatives from BEIS Defra the Forestry Commission CEH and the Devolved Administrations Five projection scenarios have been developed which take account of current land use policies andor aspirations and meet various policy needs Land management activities are now represented in the projections and development work is ongoing to improve their coverage
Scenarios
LULUCF emissions and removals are projected to 2050 which is the target date for 80 emissions reductions below the 1990 baseline in the UK Climate Change Act Projections are made for carbon stock changes and CO2 CH4 and N2O emissions arising from LULUCF activities reported in the latest UK Greenhouse Gas Inventory 1990-201415
The projection scenarios were revised in 2016 in order to align them more closely with policy needs These needs are
bull The projections must be aligned with international commitments including the
EU requirement for biennial reporting of projections with and without policy measures and with additional measures
bull Second and linked to both domestic and international commitments BEIS produces annually updated Energy and Emissions Projections (EEP) which help to both set and track progress towards Government climate targets including the recently set Fifth Carbon Budget (CB5 2027 to 2032) which requires the UK to reduce emissions by at least 57 below 1990
bull The projections are used to support the development of the Emissions Reduction Plan (ERP) which will succeed the 2011 Carbon Plan a statutory requirement of the UKrsquos Climate Change Act The ERP will lay out the strategy to be taken to achieve CB5
bull Projections are also required to monitor progress towards targets under the Climate Change (Scotland) Act the Well-being of Future Generations (Wales) Act the Environment (Wales) Act and for the UN Framework Convention on Climate Change (UNFCCC)
Three policy scenarios (Central Low and Stretch) have been constructed along with two Baseline scenarios which continue existing trends with no new policy interventions
The Baseline 1 scenario is based on climate change-related and forestry policies extant in July 2009 (required for reporting the Forest Management Reference Level used in the second commitment period of the Kyoto
Chapter 3 UK Projections for the LULUCF sector 33
Protocol)25 The projections continue 2009 (forestry) or 2000-2009 (non-forestry) average activity rates out to 2050 The Baseline 2 scenario is similar to Baseline 1 except that forest planting rates drop to a low level after 2015 to project the time-limited nature of Common Agricultural Policy (CAP) supported grant-aided planting and other activities are projected to continue at 2000-2009 average rates until 2050 This is used as the EEP lsquobaselinersquo scenario
The Central scenario is based on current policies and funding (as extant in 2014) continuing at the same rate into the future (this is the EEP lsquoreferencersquo scenario) It continues 2014 rates to 2050 for non-forest activities The Low scenario assumes that climate change mitigation policy aspirations for each of the Devolved Administrations are projected forward beyond 2021 Finally the Stretch scenario assumes an ambitious climate change mitigation programme exceeding current policy aspirations or funding
The latest forestry projections differ from the forestry numbers published in the 1990-2014 inventory because the input data to the forest carbon accounting model were based on the National Forest Inventory dataset (2011-2015)26
25 Submission of information on forest management reference levels by United Kingdom of Great Britain and Northern Ireland in accordance with Decision 2CMP6 httpunfcccintfilesmeetingsad_hoc_working_groupskpapplicationpdfuk_frmlpdf
26 National Forest Inventory httpwwwforestrygovukinventory
rather than the previous National Inventory of Woodland and Trees (1995-99)27 This had the effect of increasing the forest area of the UK and hence carbon stocks In addition there was a methodological revision to ensure that forest carbon stock changes were attributed to the correct reporting year (this affected Forest Land and Harvested Wood Products net emissions)
Trends in UK sources and sinks in the LULUCF sector
The main trends in UK sources and sinks from the LULUCF sector are presented in the 2016 GHG inventory (covering the period 1990 to 2014) and the latest Central projections produced by CEH are shown in Table 3-1 CO2 is the main greenhouse gas associated with LULUCF although emissions derived from N2O also make a significant contribution
The net CO2 equivalent emissions removals from all parts of the LULUCF sector combine to produce an increasing net carbon sink (decreasing emissions) between 1990 and 2014 This trend continues until the 2020s when the trend reverses driven by the decreasing sink in the Forest Land category The different scenarios start to diverge at 2020
Forestry is projected to be a net sink under all scenarios It is relatively stable between 1990 and 2020 but then shows a net decrease
27 National Inventory of Woodland and Trees httpwwwforestrygovukfrhcou-54pg9u
Table 3-1 GHG emissions and removals from LULUCF for the UK in Mt CO2 equivalents for 1990-2014 and 2020 (Central scenario)
Mt CO2e 1990-2014 Inventory Central scenario
projectionGas 1990 1995 2000 2005 2010 2014 2020Carbon dioxide (CO2) -3743 -5278 -7850 -10368 -12050 -12602 -13478Methane (CH4) 0021 0041 0043 0053 0043 0039 0039Nitrous oxide (N2O) 1674 1652 1578 1349 1179 1109 1073Total GHG emissions -2048 -3585 -6229 -8965 -10828 -11453 -12365
34 UK LULUCF Action Progress Report
in sink strength under all scenarios The scenarios are driven by the projected planting rates and management with the biggest projected sink beyond 2020 coming from the Stretch scenario with high planting rates and the smallest sink coming from the Baseline and Central scenarios with low planting rates The long term decrease in the sink is due to large numbers of trees being thinned or reaching maturity (some 35-50 years since planting) and hence being harvested and a relatively low planting rate during the 1980s and 1990s
Cropland is projected to be a slowly increasing source post-2015 mostly driven by land use change to Cropland Grassland is projected to be a gradually increasing sink Although the scenario assumptions for the Wetlands category have been revised in 2016 the scale of changes is small compared to the other land use categories Emissions from (land use change to) Settlements are projected to decrease over the time period under all scenarios Although Settlement areas are projected to increase under all scenarios the rate of change of land to Settlement (and hence emissions from land use change) is projected to be less than historical levels Harvested Wood Products (HWPs) are projected to be a small sink over the period 2015 to 2050 with some inter-annual variation The trend is driven by the balance between deforestation rates thinning and felling regimes and the expected lifetime of the HWPs There is little difference between the scenarios as the majority of harvest originates from trees planted before the projection time period
Trends in the Kyoto Protocol Article 33 and 34 categories
Emissions and removals in the Kyoto Protocol Article 33 and 34 activities have been projected on the same basis (with the same underlying activity data) as the UNFCCC LULUCF sector Summary numbers are shown in Table 3-2 and Table 3-3Table 3-2 Article 33 emissions and removals of CO2 equivalents (Mt CO2e) 1990-202028
Scenario 1990 2014 2020Baseline 1 0275 -3686 -5397Baseline 2 0275 -3686 -5381Central 0275 -3686 -5412Low 0275 -3686 -5434Stretch 0275 -3686 -5471
28 Buys G Malcolm H Moxley J Matthews RJ and Henshall P (2014) Projections of emissions and removals from the LULUCF sector to 2050 httpuk-airdefragovukassetsdocumentsreportscat071407090749_Projections_of_emissions_and_removals_from_the_LULUCF_sector_to_2050-PUBLISHED_VERSION-JULY2014pdf
Chapter 3 UK Projections for the LULUCF sector 35
Table 3-3 Article 34 emissions and removals of CO2 equivalents (Mt CO2e) 1990-2020
Activity Scenario 1990 2014 2020
34 Forest Management
Baseline 1 -18983 -14685 -14096Baseline 2 -18983 -14685 -14095Central -18983 -14685 -14053Low -18983 -14685 -14055Stretch -18983 -14685 -14120
34 Cropland Management
Baseline 1 0401 7930 9232Baseline 2 0401 7930 9232Central 0401 7930 9343Low 0401 7930 9251Stretch 0401 7930 9246
34 Grazing Land Management
Baseline 1 0105 -2600 -3579Baseline 2 0105 -2600 -3579Central 0105 -2600 -3438Low 0105 -2600 -3662Stretch 0105 -2600 -3673
36 UK LULUCF Action Progress Report
Chapter 4 Analysis of the potential to limit or reduce emissions and maintain or increase removals from the LULUCF sector
One of the requirements of the EU Decision is an analysis of the potential to limit or reduce emissions and maintain or increase removals Such an analysis allows Government to assess the mitigation potential of LULUCF activities while identifying where further measures or action is required in the continuing goal to reduce GHG emissions from this sector Up to date information on the mitigation potential is useful in making a quantitative assessment of the measures that are already implemented or are planned in relation to this sector This chapter provides an analysis of our understanding of the mitigation potential of LULUCF activities under the EU Decisionrsquos Article 3(1) (AR D and FM) Article 3(2) (CM and GM) and Article 3(3) (WDR)In the UK the Committee on Climate Change (CCC) advises the Government on how the UKrsquos commitments under the Climate Change Act can be met The CCC has adopted a bottom-up marginal abatement cost curve (MACC) approach on setting appropriate carbon budgets MACCs detail abatement potentials from a suite of technically feasible mitigation measures and define their relative cost-effectiveness The use of a reference carbon price allows measures to be considered from a notional cost-benefit perspective and provides a threshold for defining an efficient budget (ie those measures delivering mitigation at a unit cost less than the chosen reference price) There are however some weaknesses in a MACC based approach since it can be difficult to value all policy co-benefits of abatement measures particularly those relating to social
and environmental objectives In addition to the advice from the CCC the UK Government continues to develop a more comprehensive analysis for the mitigation potential of LULUCF activities in order to inform various policy initiatives as set out in the Impact Assessment for setting the Fifth Carbon Budget (CB5)1
An analysis of existing data on the mitigation potential in relation to LULUCF activitiesIn December 2008 the CCC published the results of its commissioned project that developed MACCs for the agriculture land use and land use change and forestry sectors29 Following the publication of the initial MACCs two studies reassessed the MACCs and reached differing abatement potential conclusions3031 In addition a significant amount of feedback was received on the work from Government and industry and further evidence was identified29 Moran D Macleod M Wall E Eory V Pajot
G Matthews R McVittie A Barnes A Rees B Moxey A Williams A and Smith P (2008) UK Marginal Abatement Cost Curves for agriculture and land use land-use change and forestry sectors out to 2022 with qualitative analysis of options to 2050 Final Report to the Committee on Climate Change London
30 AEA (2009) Unpublished Review of the SAC MACC Undertaken for Defra
31 Harris D Jones G Elliott J Williams J Chambers B Dyer R George C Salado R Crabtree B (2009) RMP5142 Analysis of Policy Instruments for Reducing Greenhouse Gas Emissions from Agriculture Forestry and Land Management Wolverhampton ADAS
Chapter 4 Analysis of the potential to limit or reduce emissions and maintain or increase removals from LULUCF sector 37
In 2010 the CCC commissioned a project32 to review the MACCs subsequent studies and feedback in order to explore the uncertainties through three activities one-to-one consultation with experts on specific points an expert meeting and a short survey A series of revisions were made to the original assumptions based on the findings of these activities The MACCs were then recalculated using the revised assumptions and a new approach to interactions However the focus was on methane and nitrous oxide emissions and the effects on soil carbon were not thoroughly considered Hence most of the mitigation potential suggested by the work for the cropland and grassland activities (eg in relation to nutrient management) is not directly relevant to the LULUCF sector and would be realised and reported in the agriculture sector In relation to the LULUCF sector the MACCs have been partly superseded by recent research for example the extent to which emissions due to changes in soil organic carbon (SOC) stocks arising from cropland and grasslandgrazing land management can be incorporated into the UKrsquos LULUCF inventory20
In 2012 the Forestry Commission (FC) reviewed all past studies that have produced MACCs for UK forestry33 Their literature search identified three primary studies estimating MACCs that include UK forestry measures Radov et al (2007)34 Moran et al
32 MacLeod M Moran D McVittie A Rees B Jones G Harris D Antony S Wall E Eory V Barnes A Topp K Balla B Hoad S and Eory L (2010) Review and update of UK marginal abatement cost curves for agriculture Final Report to the Committee on Climate Change London
33 Valatin G (2012) Marginal abatement cost curves for UK forestry Forestry Commission Edinburgh httpwwwforestrygovukpdfFCRP019pdf$FILEFCRP019pdf
34 Radov D Klevnas P Skurray J Harris D Chambers B Chadwick D Dyer R and Nagler D (2007) Market mechanisms for reducing GHG emissions from agriculture forestry and land management NERA Economic Consulting London Defra
(2008)35 and ADAS (2009)36 The Read Report provided a synthesis of the potential of UK forestry to contribute to the UK Governmentrsquos emissions reduction commitments which included results from the last three studies37 Eighteen recommendations for developing UK MACCs covering forestry emerged from the FCrsquos review and a new MACC for UK forestry has recently been published38 However the new MACC is restricted to woodland creation as the sole forestry measure The CCC has subsequently incorporated forestry in a revised MACC as has Government in its evidence supporting the setting of the Fifth Carbon Budget34
35 Moran D Macleod M Wall E Eory V Pajot G Matthews R McVittie A Barnes A Rees B Moxey A Williams A and Smith P (2008) UK Marginal Abatement Cost Curves for agriculture and land use land-use change and forestry sectors out to 2022 with qualitative analysis of options to 2050 Final Report to the Committee on Climate Change London
36 ADAS (unpublished) Analysis of policy instruments for reducing greenhouse gas emissions from agriculture forestry and land management ndash forestry options Report to Forestry Commission England ADAS Abingdon Oxfordshire
37 Matthews RW and Broadmeadow MSJ (2009) The potential of UK forestry to contribute to governmentrsquos emissions reduction commitments In DJ Read PH Freer-Smith JIL Morison N Hanley CC West and P Snowdon eds Combating climate change ndash a role for UK forests ndash an assessment of the potential of the UKrsquos trees and woodlands to mitigate and adapt to climate change TSO Edinburgh
38 CJC Consulting (2014) Assessing the cost-effectiveness of woodlands in the abatement of carbon dioxide emissions httpwwwforestrygovukforestryinfd-8rck8m
38 UK LULUCF Action Progress Report
Mitigation potentials in relation to forestry measures (AR D and FM)
The forestry sector GHG inventory projections39 indicate a declining trend in net removals although lsquoforest landrsquo will remain a sink at least through to the middle of the century Additional abatement could be delivered through increasing afforestation reducing deforestation or focusing forest management on increasing carbon stocks The potential abatement indicated in the GHG inventory projections do not include abatement associated with other sectors such as energy and construction through the use of woodfuel and timber respectively
The CCC identified potential for an additional 24 Mt CO2yr abatement in 2030 through afforestation and further deployment of agroforestry which rises to up to 48 Mt CO2yr under the lsquomaximumrsquo scenario40 Based on consideration of all the evidence a semi-
39 Thomson A Hallsworth S and Malcolm H (2013) Projections of emissions and removals from the UK LULUCF sector to 2050 httpuk-airdefragovukreportscat071304300925_Projections_of_emissions_and_removals_from_the_LULUCF_sector_to_2050_2011i_UK-FINAL-VERSIONpdf
40 Committee on Climate Change (2015) Sectoral Scenarios for the Fifth Carbon Technical report Budget httpswwwthecccorgukwp-contentuploads201511Sectoral-scenarios-for-the-fifth-carbon-budget-Committee-on-Climate-Changepdf
quantitative evaluation of abatement potential in 2030 is shown in Table 4-1
Mitigation potentials in relation to Cropland Management and Grazing Land Management
A recent project (SP1113)20 evaluated the extent to which emissions due to changes in SOC stocks arising from Cropland and GrasslandGrazing Land management can be incorporated into the UKrsquos LULUCF inventory based on
bull A literature review of emissions and removals from Cropland and Grassland Management42 and
bull An assessment of whether the default stock change factors for land management activities given in the 2006 IPCC guidance are appropriate for UK conditions and
41 Thomson et al (Forthcoming) Projections of emissions and removals from the LULUCF sector to 2050 Report to BEIS
42 Buckingham S Cloy J Topp K Rees R and Webb J Capturing cropland and grassland management impacts on soil carbon in the UK Land Use Land Use Change and Forestry (LULUCF) inventory Report for DEFRA Project SP1113 (2013) httprandddefragovukDefaultaspxMenu=MenuampModule=MoreampLocation= NoneampCompleted=0ampProjectID=18355
Table 4-1 Mitigation potentials in relation to forestry measures
Forestry measure Scale of additional mitigation potential
Quantified mitigation potential (if known)
Woodland creation (AR) High 14 to 2 Mt CO2yr depending on assumptions42
Reduced deforestation (D) Medium 09 Mt CO2yr assuming reduced to zero42
Improved management (FM) Low -5 to 5 Mt CO2yr depending on timeframe and assumptions38
Woodland enrichment (FM) Unknown Unknown
Enhanced resilience (FM) Low to HighLess than zero protects existing stocks but often at a cost to growth rate in the short term38
Chapter 4 Analysis of the potential to limit or reduce emissions and maintain or increase removals from LULUCF sector 39
attempted modelling of more appropriate stock change factors where necessary
The literature review concluded that
bull Tillage reduction cannot be considered a reliable management option to increase the SOC content of UK soils
bull Increasing crop residue returns and increasing inputs of manure and fertiliser could increase SOC stock although the SOC stock increases resulting from manure and fertiliser inputs could be outweighed by increases in nitrous oxide emissions and the risk of nitrate run-off
bull Increasing crop yields through increased fertilisation and improved crop rotation could increase the annual input of crop residues and root exudate to soils and hence increase SOC on low fertility soils
bull Manure additions resulted in greater C sequestration than the addition of equivalent amounts of N as mineral fertiliser and the effect lasted longer However increasing inputs of nitrogen from fertiliser or manure risk increasing N2O emissions which could negate any increases in SOC stock
IPCC default stock change factors were judged by project SP1113 to be inappropriate for the UK based on expert opinion and the literature review findings Therefore the project used the Daily DayCent and Landscape DNDC models to estimate stock change factors for Cropland Management activities under UK conditions Although based on a very limited dataset outputs from the model suggested that the effect of Cropland Management activities under UK conditions might be less than implied by the IPCC stock change factors Tillage reduction was found to have little effect on SOC stocks Increasing manure and crop residue inputs increased SOC stocks with manure inputs being particularly effective
A framework for reporting SOC stock changes resulting from Cropland Management was developed in SP1113 and used to assess mitigation options Overall the impact of Cropland Management on SOC is likely to be very small compared to other activities in the LULUCF inventory such as land use change The most effective mitigation option was converting Cropland from annual tillage crops to perennial crops fallow and set aside However given the need for food production there is limited scope for such change Increasing manure fertiliser and crop residue inputs gave smaller increases in SOC stocks but practical considerations such as the availability of manures and residues limit the scope of these actions
A lack of field data on the effect of Grassland Management on SOC stocks was identified as a knowledge gap by SP1113 The literature review suggested that intensification could increase SOC stocks under pasture on mineral soils However expert opinion suggested that this might not be the case for rough grazing on organo-mineral soils where intensification might lead to SOC loss This lack of data meant that it was not possible to calibrate or validate models to estimate UK specific stock change factors for Grassland As the IPCC stock change factors were judged to be inappropriate to UK conditions assessment of the mitigation potential of Grassland Management using these factors was not carried out to avoid presenting potentially misleading results BEIS has commissioned work to provide SOC stock change factors for Grassland Management which is due to complete in 2017 and will be fed into future inventories and projections
Table 4-2 provides a semi-quantitative synthesis of mitigation potentials of Cropland Management and Grassland Management measures based on the results of SP1113
Project SP1113 identified practical limits on the mitigation potentials of Cropland Management (and Grassland Management) To be effective
40 UK LULUCF Action Progress Report
in mitigating climate change increases in SOC would need to be weighed against increased nitrous oxide emissions from increased nitrogen inputs from fertiliser and manure and from compaction (and yield losses) due to the zero tillage In addition to nitrous oxide emissions which could outweigh the carbon dioxide reduction achieved by increased SOC sequestration there would also be an issue of availability of sufficient quantities of manure or organic waste as UK supplies are already almost fully utilised Increasing livestock numbers in order to increase SOC stocks under Cropland would lead to increased methane emissions from ruminants and potentially require conversion of Grassland to Cropland to provide fodder and is therefore unlikely to reduce GHG emissions although a full life-cycle analysis to confirm this has not been carried out
Mitigation potentials in relation to Wetland Drainage and Rewetting
In late 2014 BEIS commissioned a study to provide an initial assessment on the possible magnitude direction and trends in emissions and removals resulting from WDR The study considers how emissions and removals from these activities can be estimated following the methods set out in the IPCC 2013 Wetlands Supplement The study which will report in 2017 will identify relevant activity data and emission factors including an assessment of their uncertainties
Table 4-2 Mitigation potentials of Cropland Management and Grassland Management measures based on SP1113
CM or GM measure Scale of additional mitigation potential
Converting Cropland from annual tillage crops to perennial crops fallow and set aside (CM)
Low to Medium
Increasing manure fertiliser and crop residue (CM) LowIntensification of pasture on mineral soils (GM) Zero to Low (Unknown)Intensification of rough grazing on organo-mineral soils Less than Zero (Unknown)
Chapter 5 List of measures that could be implemented to achieve emissions reductions or increased removals in the LULUCF sector under UK conditions
While our knowledge base of emissions and removals estimates from this sector continues to improve there remain significant gaps in our understanding of estimates of costs and benefits of existing measures in reducing emissionsremovals in this sector
The UK does not currently have quantitative assessments of costs and benefits of all the measures that could be implemented to achieve emission reductions Work is on-going towards developing a more comprehensive quantitative assessment on the list of measures currently implemented This chapter identifies the measures that could be implemented to achieve emission reductions and sets out the available evidence which at present suggests that there are limited measures with significant potential to reduce GHG emissions for both CM and GM Work is still on-going to identify measures for WDR The majority of UK mitigation potential appears to be in the forestry activities of the LULUCF sector
LULUCF measures that will lead to reduction of GHGs or avoid new GHG emissions in key LULUCF categories
Afforestation deforestation and forest management
The majority of the potential abatement identified in the GHG Inventory projections42 arises from woodland creation (AR) The nature of the woodland planted determines the level of abatement the timeframe over which
abatement is delivered and the contribution to abatement delivered in other sectors including through providing a renewable energy feedstock Unmanaged woodland particularly on productive sites will generally make the largest contribution to LULUCF removals over the second commitment period of the Kyoto Protocol but will make no contribution to abatement in other sectors nor to the rural economy Other potential abatement measures to achieve GHG emissions mitigation involving forest land are
bull Reducing deforestation (avoidance of D)
bull Improved woodland management (FM) including measures aimed at increasing the resilience of forests to climate change
Further detail on abatement options for forestry is provided in the following section
Increasing afforestationWoodland expansion is a policy objective of all four countries of the United Kingdom in part to deliver GHG abatement through sequestration in growing biomass GHG inventory projections indicate significant abatement potential through to 2050 If woodland creation aspirations across all four countries of the UK are to be met significant private sector investment will be required to supplement Rural Development Programme grant-aid while the UK remains in the European Union and any successor schemes following the UKrsquos exit An example of a measure being taken in the UK is the Woodland Carbon Code and associated carbon registry for domestic woodland carbon schemes to encourage private sector funding for woodland creation projects
Chapter 5 List of measures that could be implemented to achieve emissions reductions or increased 41 removals in the LULUCF sector under UK conditions 41
42 UK LULUCF Action Progress Report
Reducing deforestationA strong regulatory framework means that rates of deforestation are relatively low most recently reported in 2014 as 1913 ha across the UK
The majority of deforestation is for priority open habitat restoration principally lowland heath and upland peat bog In England a lsquobalancing mechanismrsquo is in place as a component of the Open Habitats Policy43 to reduce the risk of net deforestation the balancing mechanism requires compensatory planting in cases where non-priority sites are restored A similar policy on the control of woodland removal is in place in Scotland44 Further policy measures to reduce levels of deforestation could compromise other policy objectives
The loss of woodland to development falls outside the remit of the Forestry Act (1967) and is subject to the Town and Country Planning Act The National Forest Inventory indicates that loss of woodland of more than 05 ha to development has been limited in recent years with approximately 4000 ha lost across Great Britain between 2006 and 201545 There are very limited opportunities for policy intervention to deliver significant carbon savings through reduced deforestation of development land
Reducing harvestingenhancing carbon stocksThe Read Report (2009)42 indicated that abatement opportunities from differing
43 FC England (2010) When to convert woods and forests to open habitat in England Government policy httpwwwforestrygovukpdfeng-oh-policy-march2010pdf$FILEeng-oh-policy-march2010pdf
44 FC Scotland (2009) The Scottish Governmentrsquos Policy on Control of Woodland Removal httpwwwforestrygovukpdffcfc125pdf$FILEfcfc125pdf
45 FC (2016) Preliminary estimates of the changes in canopy cover in British woodlands between 2006 and 2015 Forestry Commission httpwwwforestrygovukpdfPreliminary_estimatesofthechangesincanopycoverin Britishwoodlandsbetween2006and2015pdf$FILEPreliminary_estimatesofthechangesincanopycoverin Britishwoodlandsbetween2006and2015pdf
approaches to sustainable forest management (as set out in the UK Forestry Standard) are limited particularly when viewed in the longer term (50-100 years) and when abatement delivered in other sectors through direct and indirect fossil fuel substitution is considered
In England only 58 of woodlands have management plans (including those on the Public Forest Estate which all have management plans and comprise 15 of the woodland resource)46 The lack of management is particularly acute in private sector broadleaf woodlands of which less than 20 are in active management47 This lack of management has led to a well-documented decline in habitat condition and the woodland birds index The Governmentrsquos Forestry and Woodlands Policy Statement48 aspires to bring 80 of the woodland resource into management in the long term to contribute to the rural economy renewable energy and biodiversity targets and to provide opportunities for climate change adaptation measures to be implemented
While reducing the level of management (ie harvesting) would lead to GHG abatement in the short term other Government policy objectives would not be delivered and it is highly likely that the resilience of Englandrsquos woodlands to pest and disease outbreaks and to the impacts of climate change would decline placing their large carbon stocks at significant risk of being returned to the atmosphere
46 FC England (2016) Corporate Plan Performance Indicators 2016 httpwwwforestrygovukpdfFC-England-Indicators-Report-20163pdf$FILEFC-England-Indicators-Report-20163pdf
47 FC (2014) 50-year forecast of hardwood timber availability httpwwwforestrygovukpdf50_YEAR_FORECAST_OF_HARDWOOD_AVAILABILITYpdf$FILE50_YEAR_FORECAST_OF_HARDWOOD_AVAILABILITYpdf
48 Defra (2013) Government Forestry and Woodlands Policy Statement httpswwwgovukgovernmentuploadssystemuploadsattachment_datafile221023pb13871-forestry-policy-statementpdf
Chapter 5 List of measures that could be implemented to achieve emissions reductions or increased 43 removals in the LULUCF sector under UK conditions 43
Forest enrichmentThis intervention is characterised by enrichment planting of derelict or under-stocked woodland The area of this category of woodland is unknown at the present time but data collected on the 15000 sample squares of the National Forest Inventory could allow such an estimate to be derived along with an estimate of abatement potential
Climate change adaptationIntervening to increase resilience is characterised by increasing species and genetic diversity planting or restocking with species better able to cope with the climatic conditions represented in climate projections converting to continuous cover systems of management and reducing other pressures such as over grazing by deer and by controlling grey squirrel populations as set out in the National Adaptation Programme49 Adaptation measures can only be introduced if woodlands are in management Although adaptation measures may reduce growth rates and thus abatement through sequestration in the short term they will help to ensure that carbon stocks are not lost to the atmosphere in the future as a result of climatic unsuitability or pestdisease outbreaks
Cropland and grassland management
A recent Defra project50 assessed management activities in relation to Cropland Management (CM) and Grassland Management (GM) in the UK that have the potential to affect soil carbon stocks As identified in Table 4-2 the practices which have the potential to result in increased soil 49 Defra (2013) The National Adaptation Programme
Making the country resilient to a changing climate httpswwwgovukgovernmentuploadssystemuploadsattachment_datafile221023pb13871-forestry-policy-statementpdf
50 Defra (2014) Capturing Cropland and Grassland Management Impacts on Soil Carbon in the UK LULUCF Inventory ndash SP1113 Retrieved from httprandddefragovukDefaultaspxMenu= MenuampModule=MoreampLocation=NoneampCompleted= 0ampProjectID=18355
carbon stocks are converting cropland from annual tillage to perennial crops fallow and set aside and increasing manure fertiliser and crop residue inputs However there are constraints on the use of these practices and the increased emissions of N2O as a result of increased nutrient inputs needs to be considered These issues are discussed in Chapter 4
Peatland restoration (rewetting) has been identified as a measure to reduce GHG emissions and the amount of abatement that can be achieved is being investigated
Semi-quantitative ranking based on costs and benefits of measures and maximum level of potential uptake
The cost-effectiveness of carbon abatement associated with 96 forestry systems was assessed across England Scotland and Wales51 The study concluded that woodland creation was generally a cost-effective means of reducing greenhouse gas emissions with the cost-effectiveness of conventional forestry systems in the range of pound21 per tCO2e to pound245 per tCO2e Conifer systems were typically the most cost-effective with costs mainly in the range pound20-40 per tCO2e Permanent broadleaved and Continuous Cover Forestry (CCF) systems were generally in the pound40- 90 per tCO2e range An alternative cost-effectiveness metric found that 72 (69 out of 96) of scenarios analysed showed that the cost of sequestering carbon dioxide was less than the value of that carbon and hence cost effective The results are sensitive to timber prices with an increase of 1 per annum resulting in the cost-effectiveness of the most efficient system improving from pound21 per tCO2e to pound13 per tCO2e and also highly dependent on assumptions over agricultural income foregone and future management costs
51 CJC Consulting (2014) Assessing the cost-effectiveness of woodlands in the abatement of carbon dioxide emissions httpwwwforestrygovukforestryinfd-8rck8m
44 UK LULUCF Action Progress Report
Chapter 6 Identification of existing policies that deliver implementation of these measures and identification of their impacts
This chapter sets out existing policies that deliver implementation of the measures identified as appropriate for UK national circumstances providing an update on the 2015 Action Report
The UKrsquos commitment to tackle climate change is framed by the Climate Change Act (2008) This is domestic legislation and is therefore unaffected by the result of the UK referendum on exiting the EU Until exit occurs the UK will remain a full member of the EU with all of the rights and obligations this entails
The UKrsquos decision to exit the European Union will result in a new policy landscape for agriculture and land use Although options are still in development at this stage this change represents a significant opportunity to further address climate change issues in agriculture
The UK does not currently have data on the quantitative impacts of policy instruments per policy Furthermore some polices are bundled together and it is difficult to separate the impacts of these different policies This chapter also highlights the challenges of separating the impacts of policies due to data gaps
Key policies are presented in Table 6-1 with updates to the 2015 Action Report in bold
Chapter 6 Identification of existing policies that deliver implementation of these measures and identification of their impacts 45
Tab
le 6
-1 T
he U
Krsquos
imp
lem
ente
d p
olic
ies
and
mea
sure
s re
latin
g to
LU
LUC
F p
rese
nted
in t
he lsquow
ith m
easu
resrsquo
sce
nari
o in
the
6th
Nat
iona
l Co
mm
unic
atio
n a
nd s
upp
lem
ente
d w
ith
othe
r re
cent
miti
gat
ion
mea
sure
s U
pd
ated
mea
sure
s ar
e in
bo
ld
Nam
e o
f m
itig
atio
n ac
tion
Ob
ject
ive
and
o
r ac
tivit
y af
fect
edTy
pe
of
inst
rum
ent
Bri
ef d
escr
iptio
nS
tart
yea
r o
f im
ple
men
tatio
nIm
ple
men
ting
en
tity
(s)
Fore
stry
Wo
od
land
C
reat
ion
Pla
nnin
g
Gra
nt
Gra
nt a
id to
sup
port
th
e pl
anni
ng o
f lar
ge-
scal
e w
oodl
ands
in
supp
ort o
f mee
ting
the
requ
irem
ents
of t
he U
K
Fore
stry
Sta
ndar
d
Econ
omic
R
egul
ator
yG
rant
sup
port
for
the
plan
ning
of w
oodl
ands
la
rger
than
30
ha to
hel
p br
eak-
dow
n th
e pe
rcei
ved
barr
ier
that
the
UK
rsquos re
gula
tory
fra
mew
ork
pres
ents
in E
ngla
nd
2015
Fore
stry
C
omm
issi
on (F
C)
Wo
od
land
Car
bo
n Fu
ndG
rant
aid
to s
uppo
rt th
e pl
antin
g of
larg
e-sc
ale
woo
dlan
ds to
hel
p m
eet
futu
re c
arbo
n m
eetin
gs
and
max
imis
e na
tura
l ca
pita
l
Econ
omic
Gra
nt s
uppo
rt fo
r th
e pl
antin
g of
woo
dlan
ds
larg
er th
an 3
0 ha
with
a s
igni
fican
t pro
duct
ive
elem
ent
2016
FC
Wo
od
land
Car
bo
n C
od
eIn
crea
se r
ate
of
affo
rest
atio
nVo
lunt
ary
Agr
eem
ent
Info
rmat
ion
Volu
ntar
y C
ode
and
asso
ciat
ed c
arbo
n re
gist
ry
(201
3) fo
r U
K d
omes
tic w
oodl
and
carb
on
sche
mes
to e
ncou
rage
priv
ate
sect
or fu
ndin
g fo
r w
oodl
and
crea
tion
proj
ects
Rec
ogni
sed
as
com
pone
nt o
f net
GH
G e
mis
sion
s re
port
ing
for
busi
ness
es in
Gov
ernm
entrsquos
Env
ironm
enta
l R
epor
ting
Gui
delin
es
2011
FC
Rev
ised
UK
Fo
rest
ry S
tand
ard
Enh
ance
rem
oval
s an
d re
duce
em
issi
ons
thro
ugh
woo
dlan
d cr
eatio
n an
d su
stai
nabl
e fo
rest
man
agem
ent
Reg
ulat
ory
In
form
atio
nR
evis
ed n
atio
nal s
tand
ard
for
sust
aina
ble
fore
st m
anag
emen
t to
incl
ude
a ne
w g
uide
line
on c
limat
e ch
ange
cov
erin
g bo
th a
dapt
atio
n an
d m
itiga
tion
2011
FC
Fore
stry
Act
Fe
lling
Lic
ence
R
egul
atio
ns a
nd
Env
iro
nmen
tal
Imp
act
(Fo
rest
ry)
reg
ulat
ions
Reg
ulat
ory
fram
ewor
k to
lim
it de
fore
stat
ion
and
fore
st d
egra
datio
n
Reg
ulat
ory
Str
ong
regu
lato
ry fr
amew
ork
that
con
trol
s fe
lling
onl
y al
low
s de
fore
stat
ion
for p
urpo
ses
of
natu
re c
onse
rvat
ion
and
prev
ents
affo
rest
atio
n of
dee
p pe
at L
egis
latio
n up
date
d 19
99
1999
FC
46 UK LULUCF Action Progress Report
Nam
e o
f m
itig
atio
n ac
tion
Ob
ject
ive
and
o
r ac
tivit
y af
fect
edTy
pe
of
inst
rum
ent
Bri
ef d
escr
iptio
nS
tart
yea
r o
f im
ple
men
tatio
nIm
ple
men
ting
en
tity
(s)
Gro
wn
in B
rita
inIn
dust
ry le
d ac
tion
plan
w
ith th
e ob
ject
ive
of
incr
easi
ng w
oodl
and
crea
tion
and
the
use
of h
arve
sted
woo
d pr
oduc
ts
Volu
ntar
y A
gree
men
t In
form
atio
n
Educ
atio
n
Indu
stry
-led
actio
n pl
an a
nnou
nced
in
Gov
ernm
entrsquos
For
estr
y an
d W
oodl
ands
Pol
icy
Sta
tem
ent (
2013
) whi
ch a
spire
s to
enc
oura
ge
busi
ness
es to
inve
st in
woo
dlan
d cr
eatio
n an
d su
stai
nabl
e fo
rest
man
agem
ent p
ract
ice
2013
Dep
artm
ent f
or
Env
ironm
ent
Food
and
Rur
al
Affa
irs (D
efra
)
Wo
od
fuel
Im
ple
men
tatio
n P
lan
Str
ateg
y to
incr
ease
w
oodf
uel s
uppl
y fo
r re
new
able
hea
t
Info
rmat
ion
Ed
ucat
ion
Ec
onom
ic
Initi
ativ
e to
dev
elop
sup
ply
chai
ns i
nclu
ding
th
roug
h su
ppor
t for
har
vest
ing
proc
essi
ng a
nd
woo
dlan
d ac
cess
to
incr
ease
woo
dfue
l sup
ply
from
exi
stin
g w
oodl
and
2011
FC
Rur
al D
evel
op
men
t P
rog
ram
me
and
CA
P
Rur
al D
evel
op
men
t P
rog
ram
me
(200
7)G
rant
aid
for
affo
rest
atio
nEc
onom
icW
oodl
and
crea
tion
gran
ts p
rovi
ded
thro
ugh
EU
cofin
ance
d R
ural
Dev
elop
men
t Pro
gram
mes
in
all f
our
coun
trie
s of
the
UK
2007
Def
ra
Rur
al D
evel
op
men
t P
rog
ram
me
(201
5)G
rant
aid
for
affo
rest
atio
n an
d m
easu
res
rele
vant
to
crop
land
and
gra
ssla
nd
man
agem
ent
Econ
omic
The
RD
P is
inte
nded
to h
elp
farm
ing
fore
stry
an
d ho
rtic
ultu
ral b
usin
esse
s to
bec
ome
mor
e ef
ficie
nt a
t usi
ng re
sour
ces
and
deliv
er
envi
ronm
enta
l obj
ectiv
es T
he N
ort
hern
Ir
elan
d R
DP
was
ap
pro
ved
by
the
Eur
op
ean
Co
mm
issi
on
in A
ugus
t 20
15
DA
ER
Arsquos
new
ag
ri-e
nvir
onm
ent
sche
me
th
e E
nvir
onm
enta
l Far
min
g S
chem
e (E
FS
) is
pla
nned
to
op
en f
or
app
licat
ions
in
Feb
ruar
y 20
17
New
sch
emes
fo
r 20
15 a
nd
2017
Def
raD
evol
ved
Adm
inis
tratio
ns
(DA
s)
CA
P C
ross
C
om
plia
nce
Soi
l Man
agem
ent
Req
uire
men
ts N
utrie
nt
man
agem
ent (
NV
Z)
EIA
Reg
ulat
ory
bullG
ood
Agr
icul
tura
l and
Env
ironm
enta
l C
ondi
tions
in p
lace
to e
nsur
e m
inim
um
soil
cove
r to
mai
ntai
n so
il or
gani
c m
atte
r an
d to
min
imis
e er
osio
n
bullIm
plem
enta
tion
of th
e N
itrat
es D
irect
ive
bullR
eten
tion
of p
erm
anen
t pas
ture
(up
to
2014
ndash n
ow u
nder
Gre
enin
g m
easu
res)
Cro
ss-
com
plia
nce
rule
s in
pla
ce fr
om
Janu
ary
2005
R
evis
ed r
ules
in
pla
ce f
rom
Ja
nuar
y 20
15
Def
raD
As
Chapter 6 Identification of existing policies that deliver implementation of these measures and identification of their impacts 47
Nam
e o
f m
itig
atio
n ac
tion
Ob
ject
ive
and
o
r ac
tivit
y af
fect
edTy
pe
of
inst
rum
ent
Bri
ef d
escr
iptio
nS
tart
yea
r o
f im
ple
men
tatio
nIm
ple
men
ting
en
tity
(s)
CA
P G
reen
ing
Mai
nten
ance
of
Per
man
ent G
rass
land
in
trod
uctio
n of
Ec
olog
ical
Foc
us
Are
as (E
FA) a
nd C
rop
Div
ersi
ficat
ion
Reg
ulat
ory
bullO
btai
n co
nsen
t bef
ore
impr
ovin
g gr
assl
and
that
has
not
bee
n cu
ltiva
ted
for
15 y
ears
or
mor
e (E
IA)
bullS
elec
t a r
ange
of E
FA m
easu
res
to m
eet
new
sta
ndar
ds r
elev
ant a
ctio
ns in
clud
e en
hanc
ed b
uffe
r st
rips
cov
er c
rops
and
gr
owin
g N
-fixi
ng c
rops
bullIn
Wal
es c
onse
nt m
ust b
e ob
tain
ed to
im
prov
e gr
assl
and
that
has
less
than
25
ry
e gr
ass
bullIn
Wal
es u
nder
CA
P G
reen
ing
farm
ers
can
sele
ct a
num
ber
of re
leva
nt E
FA
mea
sure
s in
clud
ing
fallo
w la
nd s
hort
ro
tatio
n co
ppic
e an
d ni
trog
en fi
cro
ps
bullIn
Nor
ther
n Ire
land
und
er C
AP
Gre
enin
g
farm
ers
can
sele
ct a
num
ber
of re
leva
nt
EFA
mea
sure
s in
clud
ing
land
scap
e fe
atur
es f
allo
w la
nd a
gro-
fore
stry
sho
rt
rota
tiona
l cop
pice
and
nitr
ogen
fixi
ng
crop
s
New
rul
es in
20
15D
efra
DA
Pea
tlan
ds
UK
Pea
tlan
d C
od
eIn
crea
se p
rivat
e fu
ndin
g of
pea
tland
rest
orat
ion
Volu
ntar
y A
gree
men
t In
form
atio
n
Econ
omic
A U
K V
olun
tary
Cod
e to
enc
oura
ge a
nd
supp
ort p
rivat
e se
ctor
fund
ing
for
peat
land
re
stor
atio
n pr
ojec
ts
Pro
vide
s st
anda
rds
and
robu
st s
cien
ce to
gi
ve b
usin
ess
supp
orte
rs c
onfid
ence
that
thei
r fin
anci
al c
ontr
ibut
ion
is m
akin
g a
mea
sura
ble
and
verifi
able
diff
eren
ce
2013
(pilo
t)
2016
(fin
alis
ed)
Def
ra
Inte
rnat
iona
l U
nion
for
the
Con
serv
atio
n of
N
atur
e (IU
CN
) UK
48 UK LULUCF Action Progress Report
Nam
e o
f m
itig
atio
n ac
tion
Ob
ject
ive
and
o
r ac
tivit
y af
fect
edTy
pe
of
inst
rum
ent
Bri
ef d
escr
iptio
nS
tart
yea
r o
f im
ple
men
tatio
nIm
ple
men
ting
en
tity
(s)
Eng
land
Nat
ural
E
nvir
onm
ent
Whi
te P
aper
(N
EW
P) t
arg
ets
on
hort
icul
tura
l pea
t
A p
oliti
cal c
omm
itmen
t to
redu
ce h
ortic
ultu
ral
peat
use
to z
ero
by
2030
Pol
icy
The
Sus
tain
able
Gro
win
g M
edia
Tas
kfor
ce
was
set
up
to lo
ok a
t way
s in
whi
ch th
e ba
rrie
rs to
the
use
of p
eat a
ltern
ativ
es c
ould
be
ove
rcom
e T
he G
over
nmen
t pub
lishe
d its
re
spon
se to
the
Task
For
cersquos
repo
rt a
nd d
raft
ro
adm
ap in
201
3 w
hich
set
out
whe
re o
ur
reso
urce
s w
ill be
focu
ssed
A p
olic
y re
view
w
ill b
e p
ublis
hed
in 2
017
asse
ssin
g t
he
del
iver
y o
f th
e ro
adm
ap a
nd id
entif
ying
fu
rthe
r ac
tions
nec
essa
ry t
o a
chie
ve a
tr
ansi
tion
to s
usta
inab
le g
row
ing
med
ia a
nd
red
uced
pea
t us
e
2011
Def
ra
Are
a D
esig
natio
nsIm
prov
emen
t of
peat
land
hab
itats
into
lsquofa
vour
able
rsquo con
ditio
n
Reg
ulat
ory
3 ou
t of 1
2 N
atur
e Im
prov
emen
t Are
as (N
IA
2012
) are
focu
ssed
on
peat
land
rest
orat
ion
47
Eng
land
rsquos w
etla
nds
are
prot
ecte
d by
(S
ites
of S
peci
al S
cien
tific
Inte
rest
(SS
SIs
)
2004
and
201
2D
efra
DA
s
Co
untr
ysid
e S
tew
ard
ship
Fund
ing
to d
eliv
er
effe
ctiv
e en
viro
nmen
tal
man
agem
ent o
f lan
d in
clud
ing
moo
rland
ha
bita
ts
Econ
omic
Agr
i-env
ironm
ent s
chem
e to
pro
vide
fund
ing
to
farm
ers
and
othe
r la
nd m
anag
ers
in E
ngla
nd
to d
eliv
er e
ffect
ive
envi
ronm
enta
l man
agem
ent
on th
eir
land
pot
entia
lly in
clud
ing
optio
ns fo
r th
e m
aint
enan
ce a
nd re
stor
atio
n of
moo
rland
ha
bita
ts
New
sch
eme
for
2015
Def
ra
Nat
ural
Eng
land
rsquos
Str
ateg
ic
Ap
pro
ach
to t
he
Res
tora
tion
of
Bla
nket
Bo
g
To e
nsur
e th
at th
e bl
anke
t bog
hab
itat
is a
ctiv
ely
mov
ed
tow
ards
lsquofav
oura
blersquo
co
nser
vatio
n st
atus
Info
rmat
ion
Nat
ural
Eng
land
pub
lishe
d t
he S
trat
egy
for
the
Res
tora
tion
of
Bla
nket
Bo
g in
Eng
land
in
201
5 T
he a
ppro
ach
sets
out
the
exte
nt
natu
re a
nd im
port
ance
of t
he b
lank
et b
og
reso
urce
acr
oss
Eng
land
and
wha
t is
curr
ently
be
ing
done
to c
onse
rve
it a
s w
ell a
s se
ttin
g ou
t the
requ
ired
man
agem
ent a
nd ti
mef
ram
e fo
r de
liver
y to
ach
ieve
an
impr
ovem
ent
in s
ite c
ondi
tion
acro
ss th
e re
sour
ce a
t a
stra
tegi
c le
vel
2015
Def
ra
Nat
ural
E
ngla
nd (N
E)
No
rthe
rn Ir
elan
d
Pea
t R
esto
ratio
n
Res
tora
tion
of p
eatla
nds
Volu
ntar
y A
gree
men
tN
orth
ern
Irela
nd (N
I) w
ill in
clud
e pe
atla
nd
rest
orat
ion
mea
sure
s w
ithin
the
new
agr
i-en
viro
nmen
t sch
eme
the
Env
ironm
enta
l Fa
rmin
g S
chem
e (E
FS)
as p
art o
f its
NI R
ural
D
evel
opm
ent P
rogr
amm
e 20
14-2
020
The
fir
st E
FS
H
ighe
r Le
vel
agre
emen
ts
to c
om
men
ce
in 2
018
Nor
ther
n Ire
land
Chapter 6 Identification of existing policies that deliver implementation of these measures and identification of their impacts 49
Nam
e o
f m
itig
atio
n ac
tion
Ob
ject
ive
and
o
r ac
tivit
y af
fect
edTy
pe
of
inst
rum
ent
Bri
ef d
escr
iptio
nS
tart
yea
r o
f im
ple
men
tatio
nIm
ple
men
ting
en
tity
(s)
Wal
es
Pea
t re
sto
ratio
n
Wal
es a
re d
evel
opin
g a
peat
land
act
ion
plan
an
d pr
iorit
y ac
tion
map
Volu
ntar
yW
ales
has
und
erta
ken
a co
mpr
ehen
sive
pr
ogra
mm
e to
und
erst
and
the
stat
us o
f all
peat
land
s in
Wal
es E
ach
area
will
be a
sses
sed
for
the
pote
ntia
l mul
tiple
ben
efits
of r
esto
ratio
n to
dev
elop
a p
roje
ct p
riorit
isat
ion
map
A k
ey
deliv
ery
met
hod
is th
e co
-ord
inat
ion
of th
e m
ultip
le fu
ndin
g m
echa
nism
s
Wal
es
Sco
tlan
d
Nat
iona
l Pea
tlan
d
Pla
n
To p
rom
ote
impr
ovem
ents
in th
e pr
otec
tion
and
cond
ition
of
pea
tland
s
Info
rmat
ion
Sco
ttis
h G
over
nmen
t and
Sco
ttis
h N
atur
al
Her
itage
(SN
H)
wor
king
with
a r
ange
of
stak
ehol
ders
hav
e pu
blis
hed
a N
atio
nal
Pea
tlan
d P
lan
to h
ighl
ight
the
impo
rtan
ce
of S
cotla
ndrsquos
pea
tland
s It
dra
ws
atte
ntio
n to
th
e po
or s
tate
of l
arge
are
as a
nd p
ropo
ses
build
ing
on e
xist
ing
initi
ativ
es to
sec
ure
thei
r su
stai
nabl
e us
e m
anag
emen
t and
rest
orat
ion
2015
Sco
tland
50 UK LULUCF Action Progress Report
Impact of policy instruments on emissionsremovals
The following discussion of the impact of policy instruments on emissionsremovals is consistent with the UK 6th National Communication supplemented by more recent information Actual and projected CO2e savings apportioned to each policy have not been published Updates are provided in bold
Sustainable forestry policy
Forestry policy is devolved in the UK All four countries have established policies for woodland creation co-financed through the EU Rural Development Programme The development of the Woodland Carbon Code including its launch on an international carbon registry is attracting private and corporate funding to complement the Rural Development Programme A revised UK Forestry Standard (UKFS) was published in November 2011 including a new guideline on Forests and Climate Change The requirement for climate change mitigation is that lsquoforest management should contribute to climate change mitigation over the long term through the net capture and storage of carbon in the forest ecosystem and in wood productsrsquo Meeting the requirements of the UKFS is a condition of grant-aid and also underpins both the Woodland Carbon Code and forest certification under the UK Woodland Assurance Standard A strong regulatory framework continues to protect existing woodland from deforestation and degradation
In England objectives for forestry are set out in the Forestry and Woodlands Policy Statement (2013) including an aspiration to increase woodland cover from 10 to 12 by 2060 The policy statement recognises the need to make woodland planting more attractive to landowners and attract private investment to fund it particularly through the development of payments for ecosystem services as set out by the Ecosystems Market
Task Force The Woodland Carbon Task Force has been established to help deliver emissions reductions by the forestry sector A policy on when to convert woods and forests to open habitats in England is in place which includes an assessment of implications for carbon balance in the process of prioritising sites for restoration The development of a thriving forestry sector through an industry-led action plan (Grown in Britain) is highlighted as an essential element to achieve woodland planting aspirations and deliver emissions savings in other sectors through the sustainable use of woodfuel as a source of renewable energy and harvested wood products substituting for other materials
In Scotland forestry is recognised as having an important role in contributing to emissions reduction targets through carbon sequestration and climate change mitigation is a specific objective of woodland creation Following on from the 2012 Woodland Expansion Advisory Group review a target to create an additional 100000 ha of new woodland by 2022 was set out in the 2013 Low Carbon Scotland Report This level of woodland creation aims to reduce Scotlandrsquos emissions by around 48 Mt CO2e in the period to 2027 To complement woodland creation a framework to better control woodland removal is also in place along with proposals to further increase emissions abatement through greater use of Scottish timber in building construction and refurbishment
The Welsh government has also set a target to create 100000 hectares of new woodland in Wales by 2030 which will not only mitigate the impacts of climate change by locking up carbon emissions but also achieve other multiple objectives such as reducing run-off after heavy rain
England Scotland and Wales have also established Woodfuel Strategies that aim to maximise the contribution of both existing and new woodlands to renewable energy production
An independent study (the Read Report combating climate change ndash a role for UK forestry) commissioned by the Forestry Commission was published in 2009 and evaluated the role of forests and harvested wood products in GHG balance
Rural development regulation and environmental stewardship
Rural Development Programmes for 2014-2020 are currently being implemented in Scotland Wales Northern Ireland and England These include delivering agri-environment-climate schemes and climate change will be a cross-cutting priority across each Programme
Peat restoration
EnglandThe UK Government is committed to ensuring that all soils in England are managed sustainably by 2030 Measures such as the UK Peatland Code peatland restoration through the new Countryside Stewardship (RDP) scheme conservation designations and targets for the reduction of peat use in horticulture will help to achieve this ambition for Englandrsquos peatlands pound100m capital funding is being invested directly in projects to support the natural environment over the next five years including the restoration of peatlands The forthcoming 25-Year Environment Plan will set out long term plans for environmental policy and will help to target this resource in the right places
WalesThe Welsh Government is committed to taking action to restore peatlands in Wales Recent ministerial statements have set out an ambition to deliver restoration in a more coordinated manner using the RDP as the main delivery mechanism In addition this co-ordination will be used to develop a prioritisation for restoration and action plan to achieve cost effective mitigation Steps include co-ordinating restoration effort across privately
owned land and the Government estate and to co-ordinate RDP funded projects with domestic and LIFE funded projects with private finance initiatives to achieve landscape scale interventions
ScotlandThe Scottish Government and SNH consulted on a National Peatland Plan in 2014 and the final plan was published in August 2015 It highlights the Scottish Governmentrsquos aspirations around peatlands both in terms of protecting and managing peatlands as well as where appropriate restoring them As part of the Scottish Rural Development Programme 2015-2020 pound10m has currently been identified to support peatland restoration Through the SNH led Peatland Action initiative 10000 hectares of peatlands have been restored since 2013
Northern IrelandNorthern Ireland (NI) will include peatland restoration measures within its new agri-environment scheme the Environmental Farming Scheme (EFS) as part of its NI Rural Development Programme 2014-2020 The first EFS Higher Level agreements will commence in 2018
Identified challenges with effective implementation of measures and how data gaps could be addressed
The UK has a programme of research to address data gaps to complete reporting of land management practices in the UK LULUCF inventory (see Table 1-2) Research to enhance the understanding of the forest GHG balance support LULUCF inventory modelling and underpin the National Forest Inventory are components of the Science and Innovation Strategy for British Forestry published in 2014
Chapter 6 Identification of existing policies that deliver implementation of these measures and identification of their impacts 51
copy Crown copyright 2016Department for Business Energy amp Industrial Strategy1 Victoria Street London SW1H 0ETwwwgovukbeis
- UK LULUCF Action Progress Report
- Contents
- Executive Summary
- Introduction
- Chapter 1
- Chapter 2
- Chapter 3
- Chapter 4
- Chapter 5
- Chapter 6
-
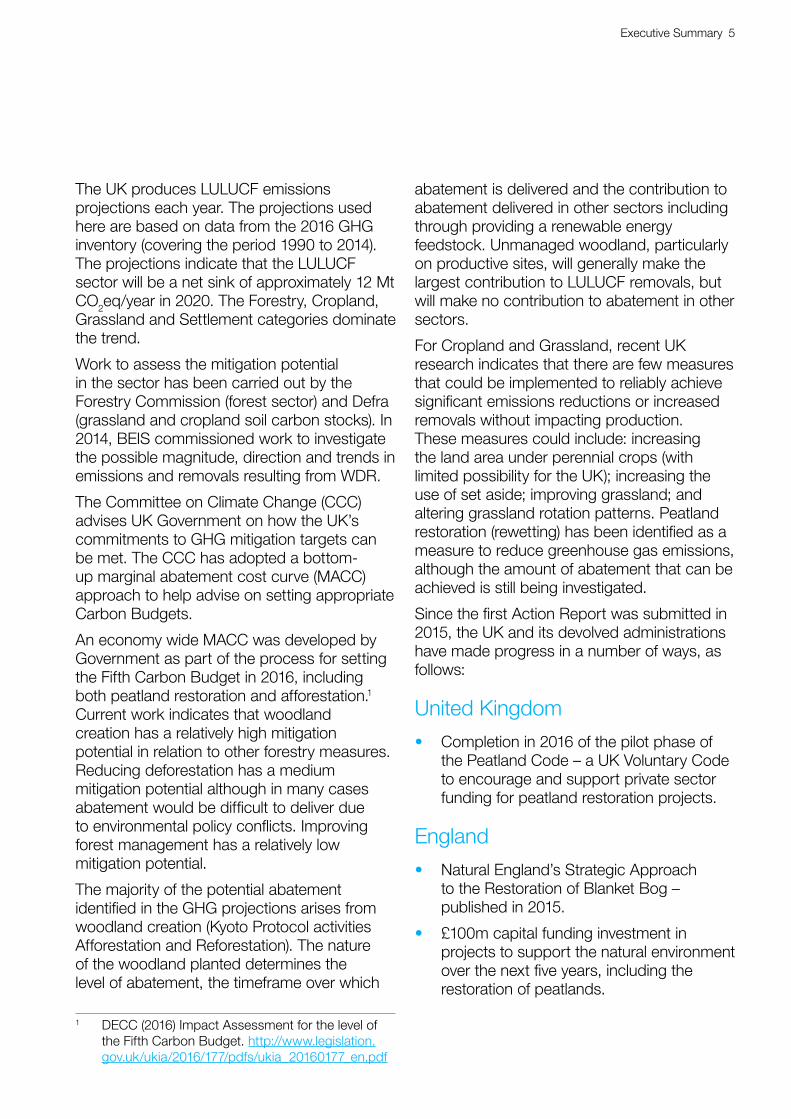
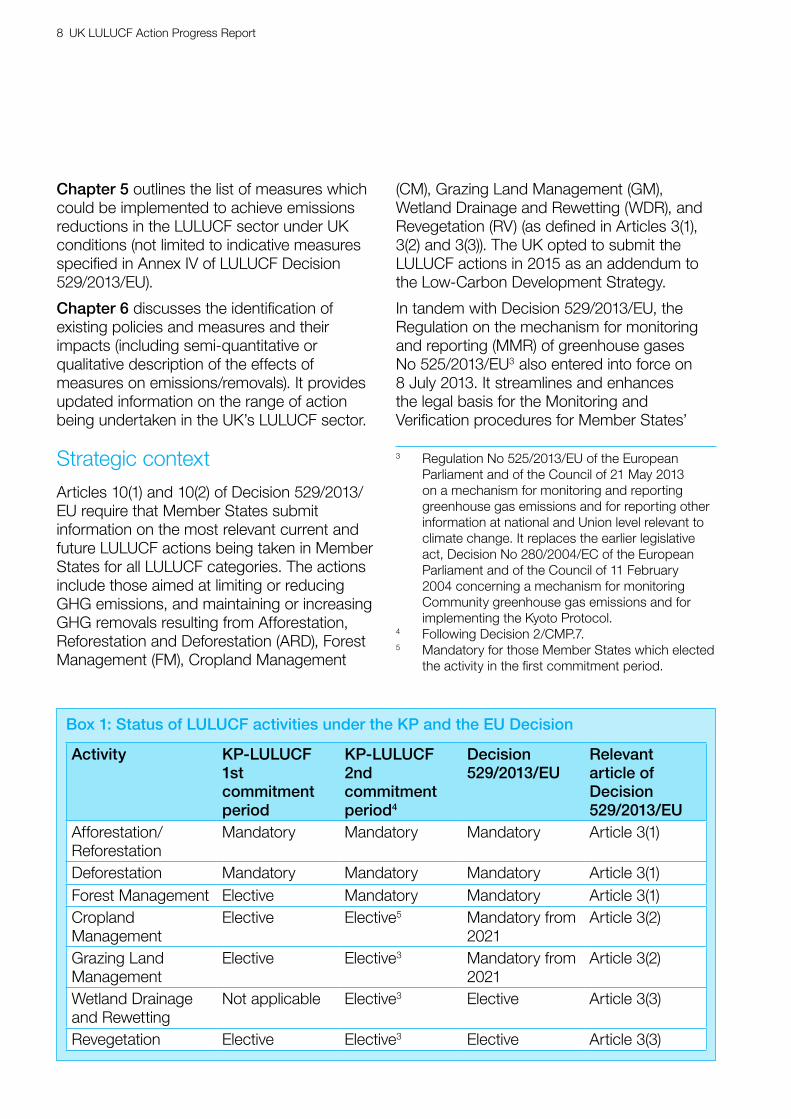
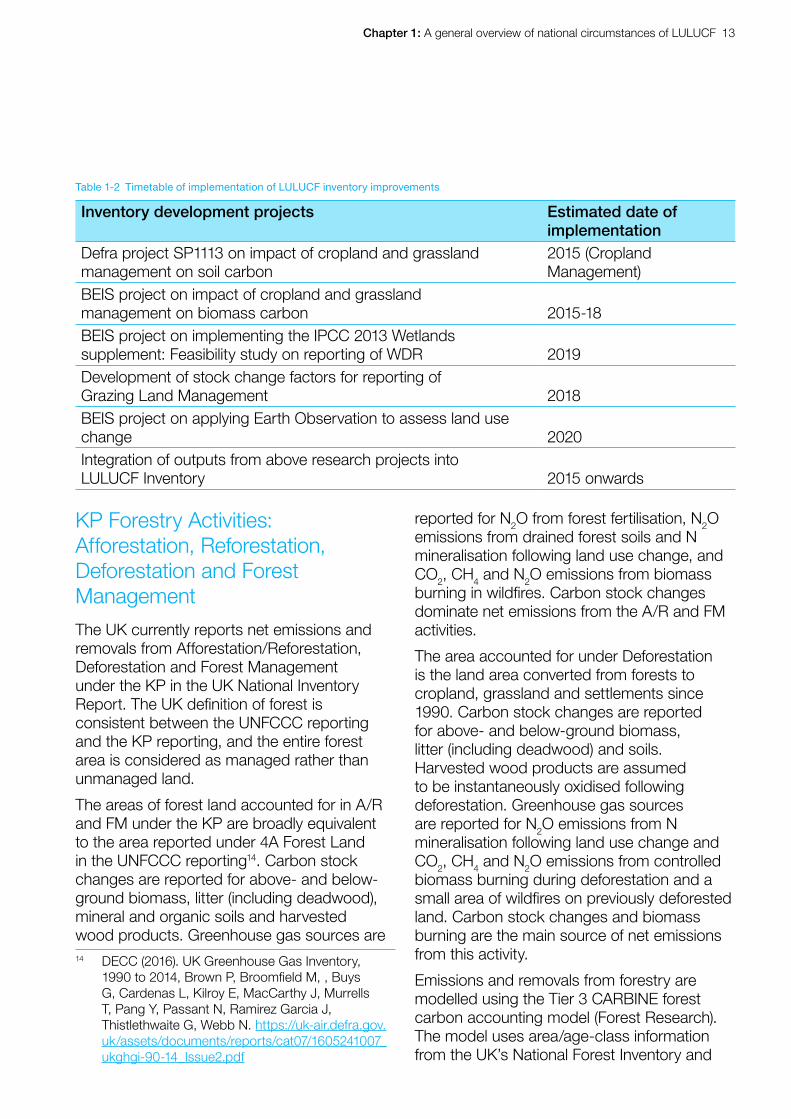
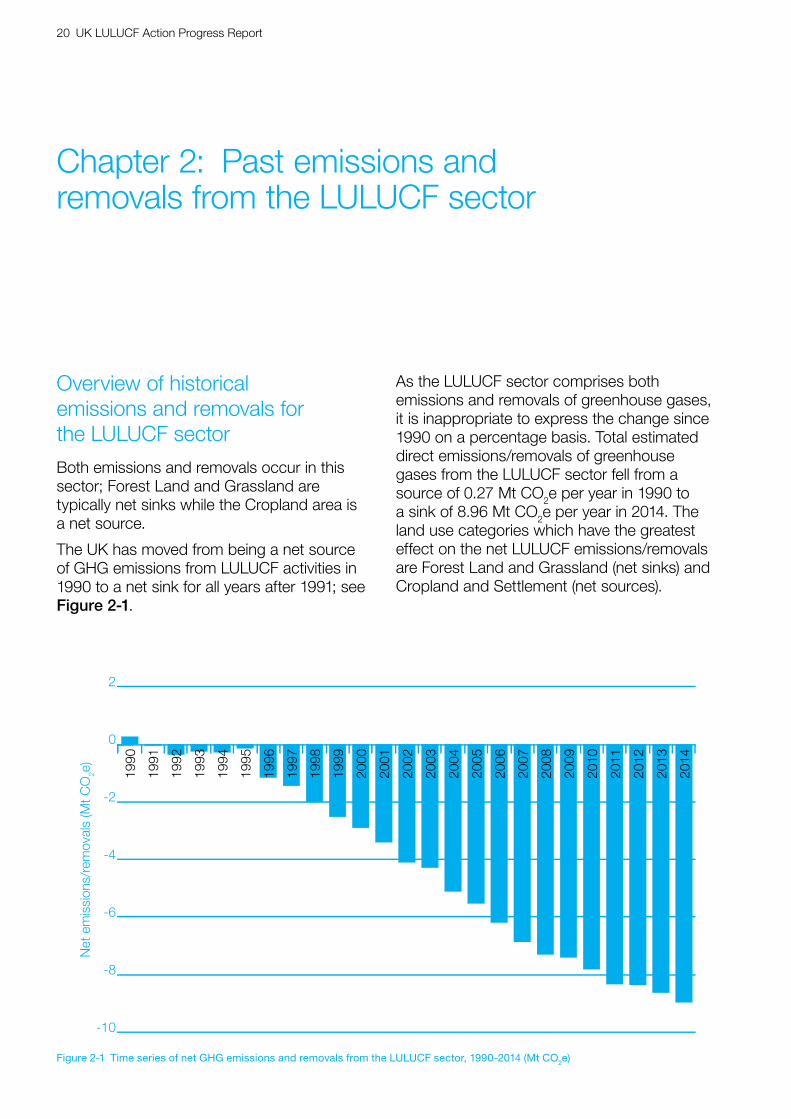
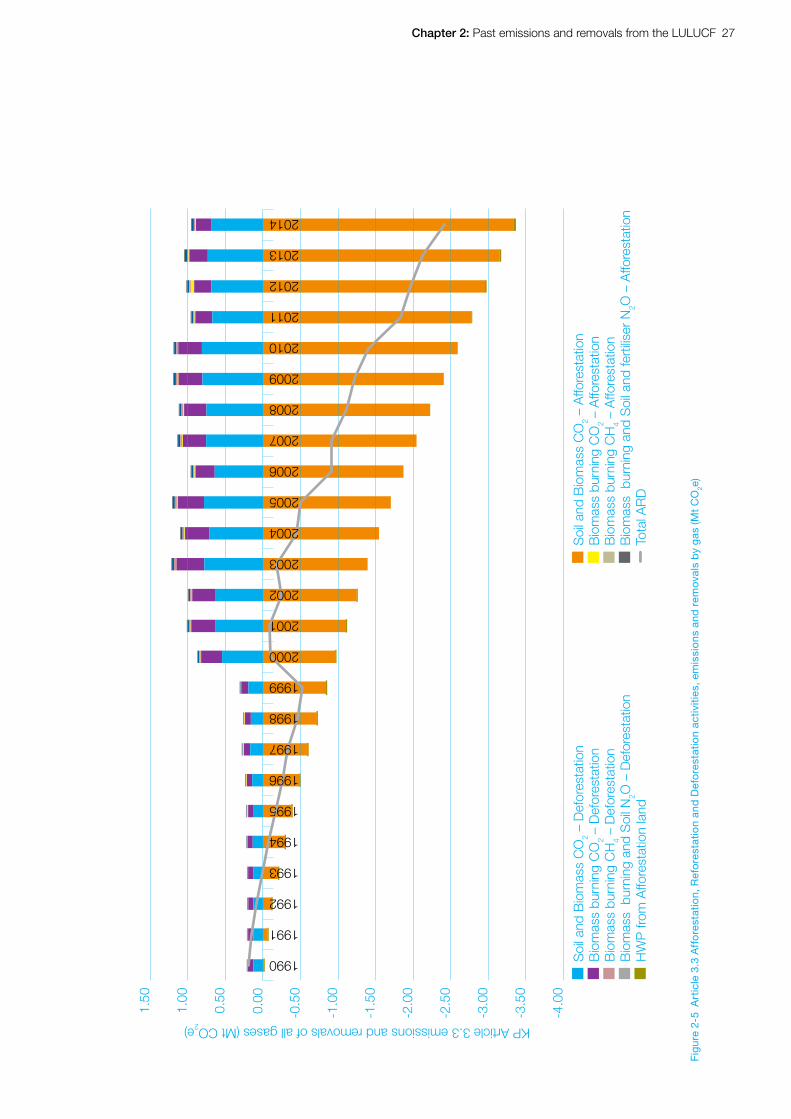
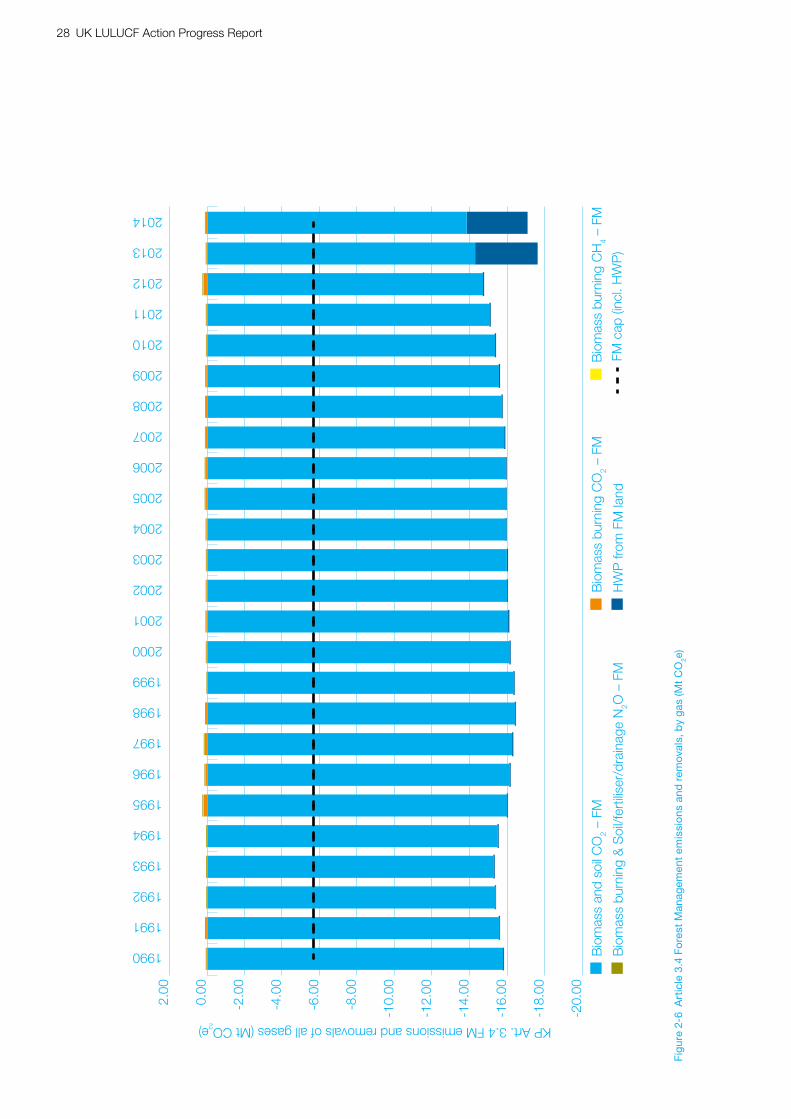
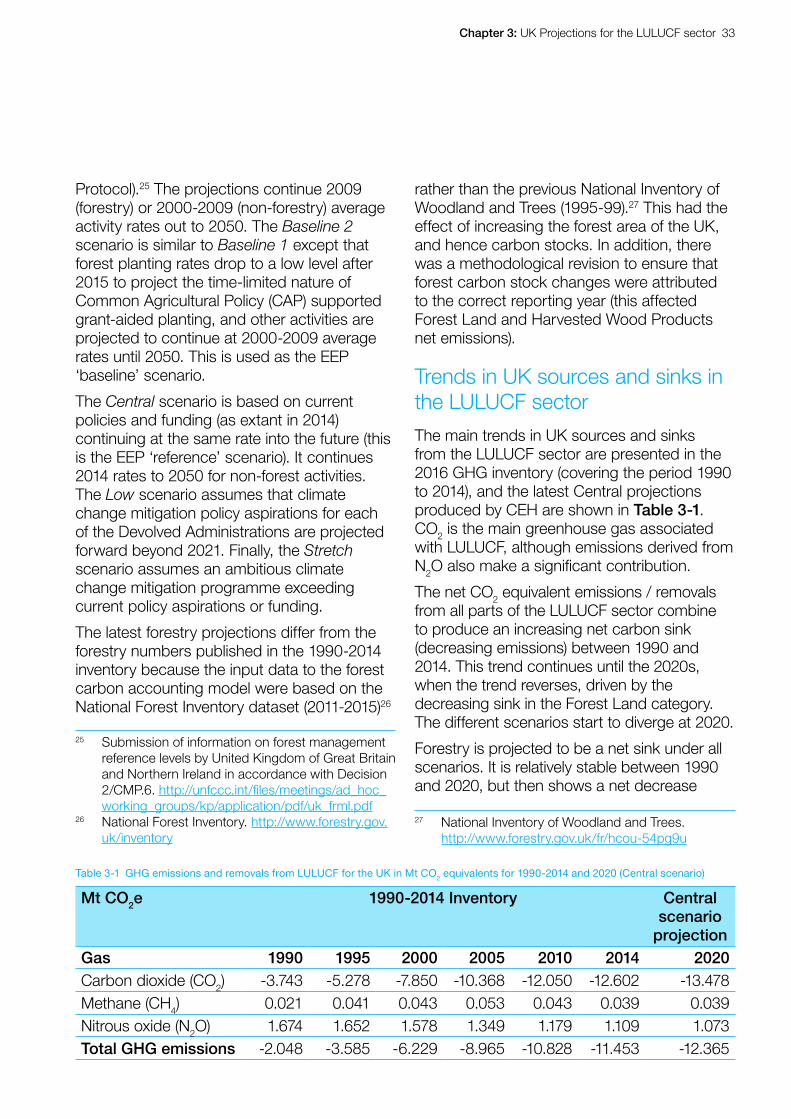
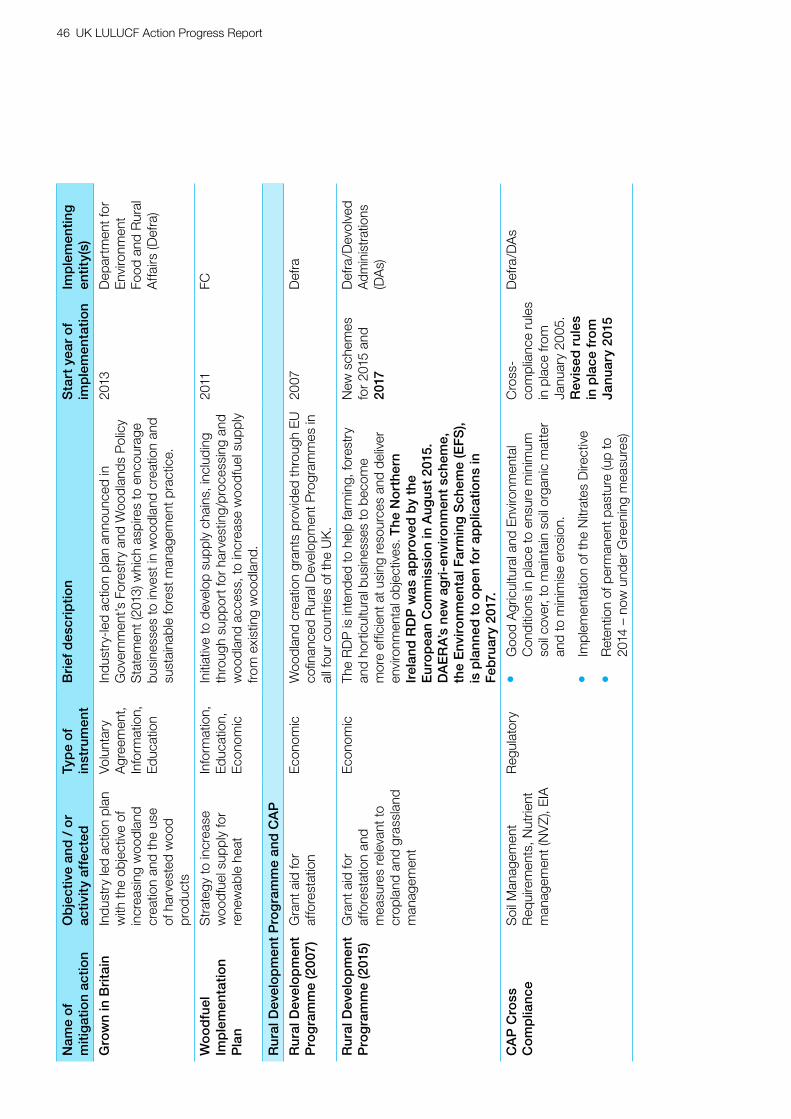
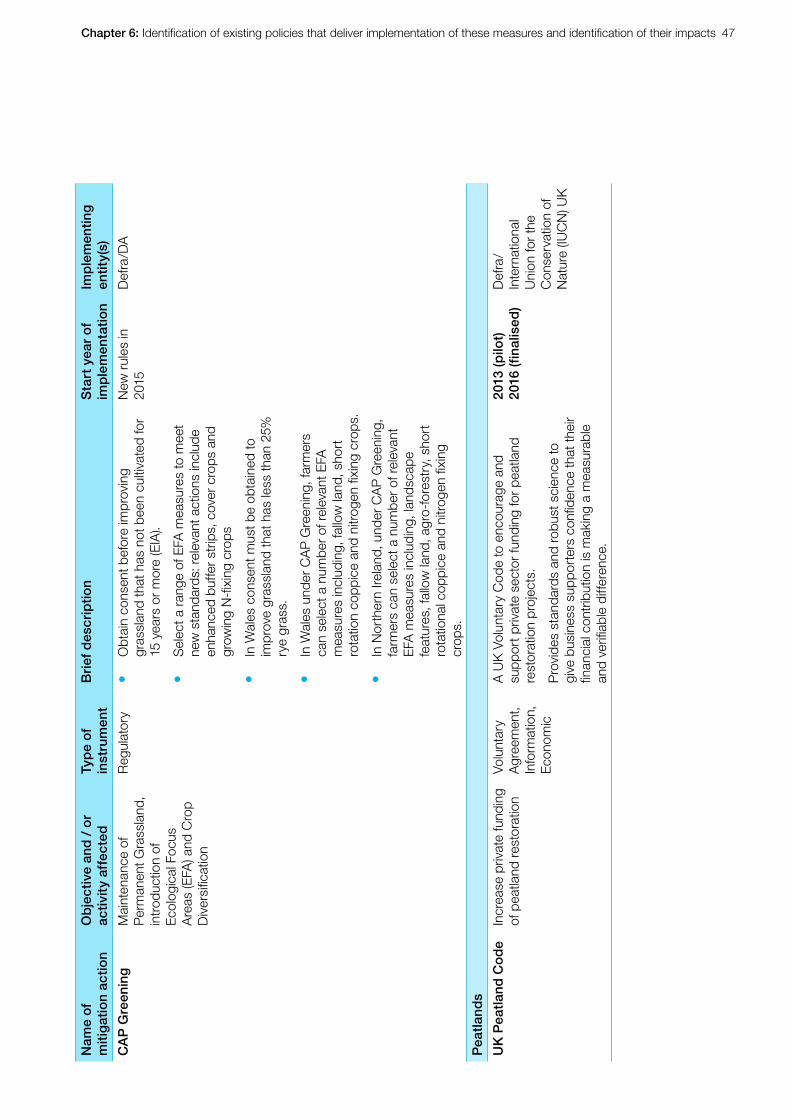
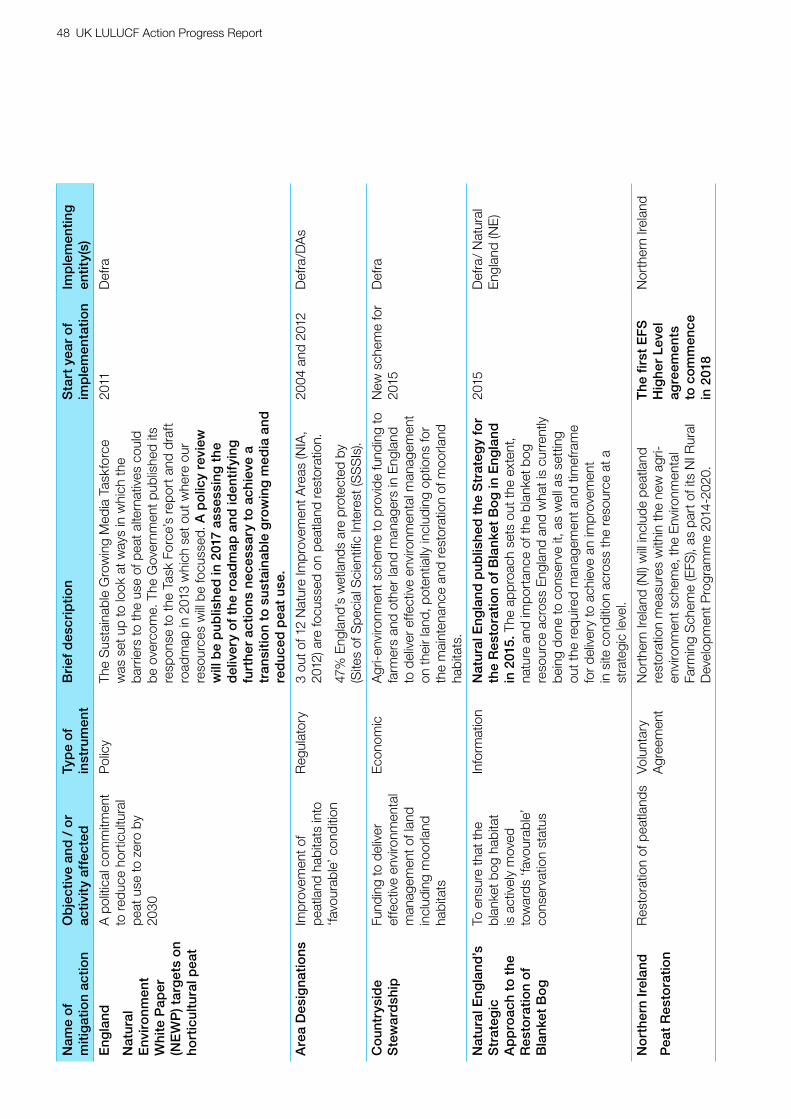

copy Crown copyright 2016Department for Business Energy amp Industrial Strategy1 Victoria Street London SW1H 0ETwwwgovukbeis
- UK LULUCF Action Progress Report
- Contents
- Executive Summary
- Introduction
- Chapter 1
- Chapter 2
- Chapter 3
- Chapter 4
- Chapter 5
- Chapter 6
-
Related Documents


