UBS Global Financial Services Conference Reinforcing market share in a deleveraging environment Gonzalo Gortázar, CFO New York, 8 th May 2012

Welcome message from author
This document is posted to help you gain knowledge. Please leave a comment to let me know what you think about it! Share it to your friends and learn new things together.
Transcript

UBS Global Financial Services Conference
Reinforcing market share in a deleveraging environment
Gonzalo Gortázar, CFO New York, 8th May 2012

2
Important note
Disclaimer
The purpose of this presentation is purely informative. In particular, regarding the data provided by third parties, neither CaixaBank, S.A. (“CaixaBank”) as a legal entity, nor any of its administrators, directors or employees, is obliged, either explicitly or implicitly, to vouch that these contents are exact, accurate, comprehensive or complete, nor to keep them updated, nor to correct them in the case that any deficiency, error or omission were to be detected. Moreover, in reproducing these contents in any medium, CaixaBank may introduce any changes it deems suitable, may omit partially or completely any of the elements of this document, and in the case of any deviation between such a version and this one, assumes no liability for any discrepancy.
This document has at no time been submitted to the Comisión Nacional del Mercado de Valores (CNMV – the Spanish Stock Markets regulatory body) for approval or scrutiny. In all cases its contents are regulated by the Spanish law applicable at time of writing, and it is not addressed to any person or legal entity located in any other jurisdiction. For this reason it may not necessarily comply with the prevailing norms or legal requisites as required in other jurisdictions.
This presentation on no account should be construed as a service of financial analysis or advice, nor does it aim to offer any kind of financial product or service. In particular, it is expressly remarked here that no information herein contained should be taken as a guarantee of future performance or results.
Without prejudice to legal requirements, or to any limitations imposed by CaixaBank that may be applicable, permission is hereby expressly refused for any type of use or exploitation of the contents of this presentation, and for any use of the signs, trademarks and logotypes which it contains. This prohibition extends to any kind of reproduction, distribution, transmission to third parties, public communication or conversion into any other medium, for commercial purposes, without the previous express permission of CaixaBank and/or other respective proprietary title holders. Any failure to observe this restriction may constitute a legal offence which may be sanctioned by the prevailing laws in such cases.
In so far as it relates to results from investments, this financial information from the CaixaBank Group has been prepared mainly on the basis of estimates.
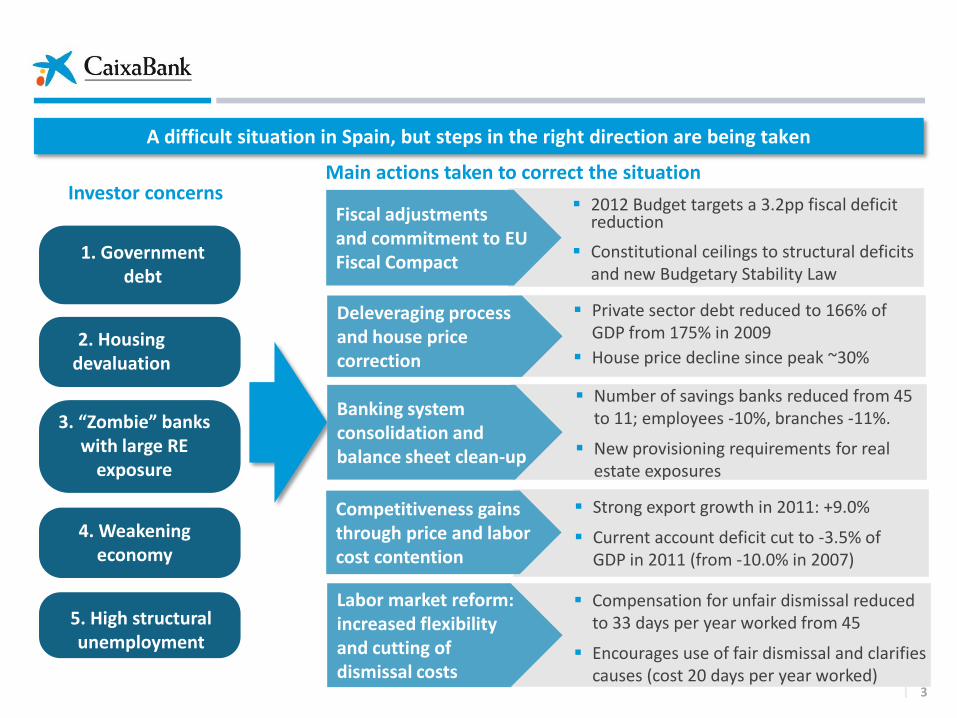
A difficult situation in Spain, but steps in the right direction are being taken
3. “Zombie” banks with massive loans to
developers
Investor concerns Main actions taken to correct the situation
5. High structural unemployment
2. Housing devaluation
4. Weakening economy
1. Government debt
3. “Zombie” banks with large RE
exposure
3
2012 Budget targets a 3.2pp fiscal deficit reduction
Constitutional ceilings to structural deficits and new Budgetary Stability Law
Private sector debt reduced to 166% of
GDP from 175% in 2009
House price decline since peak ~30%
Number of savings banks reduced from 45 to 11; employees -10%, branches -11%.
New provisioning requirements for real estate exposures
Strong export growth in 2011: +9.0%
Current account deficit cut to -3.5% of GDP in 2011 (from -10.0% in 2007)
Compensation for unfair dismissal reduced to 33 days per year worked from 45
Encourages use of fair dismissal and clarifies causes (cost 20 days per year worked)
Deleveraging process and house price correction
Competitiveness gains through price and labor cost contention
Fiscal adjustments and commitment to EU Fiscal Compact
Deleveraging process and house price correction
Banking system consolidation and balance sheet clean-up
Competitiveness gains through price and labor cost contention
Labor market reform: increased flexibility and cutting of dismissal costs
3

4
Reinforcing market share in a deleveraging environment
CaixaBank at a glance p. 5
The Banca Cívica deal - developing franchise value p. 7
Bolstering balance sheet strength p. 13
Profitability levers p. 21
Key takeaways p. 27

Leading retail franchise in Spain
Loans: €184 bn
Customer funds: €246 bn
CaixaBank at a glance
10.4 million customers serviced by a segmented business model
More than 1 out of 5 Spaniards have CaixaBank as their main banking relationship
Multi-channel platform: branches (5,172); ATMs (7,979); leader in online and mobile banking
Excellence in customer service and highly-rated brand
NPL ratio well below peers; superior provisioning coverage
Low exposure to RE assets: foreclosed assets prior to February 28th 2011 were not transferred to CaixaBank in the “la Caixa” Group reorganisation process.
Comfortable liquidity position: €29.4 bn
Solid base of capital: core capital of 12.4% (BIS II)
Figures as of March 2012
A flagship institution
Ranked 1st in retail banking in Spain
Sound risk profile
Robust financial metrics
5

6
Reinforcing market share in a deleveraging environment
CaixaBank at a glance p. 5
The Banca Cívica deal - developing franchise value p. 7
Bolstering balance sheet strength p. 13
Profitability levers p. 21
Key takeaways p. 27

7
Banca Cívica proposed acquisition
Transaction summary
Integration by means of a merger with fixed exchange ratio: 5 CABK shares for 8 BCIV shares
Existing €904 M of BCIV retail preferred shares will be offered a swap into MCB prior to closing
€977M of “FROB 1” funding of BCIV to be repaid during the next twelve months
Accelerated execution timetable
A cleaned-up and market-leading franchise in
complementary regions
The leading retail bank with the widest
commercial network and strongest balance sheet
+
(1) Subject to approvals by both Shareholders’ Meetings, Saving Banks’ General Assemblies and regulators (BoS, CNMV, Min. of Economy, DGS and Competition Commission)
MARCH
APRIL
MAY
JUNE/ JULY
3Q 2012
1H 2013
Transaction announcement
Boards approved merger project
Bank’s shareholders meetings/ Regulatory approvals(1)
Expected Closing
Savings Banks’ General Assemblies
Full systems integration
8
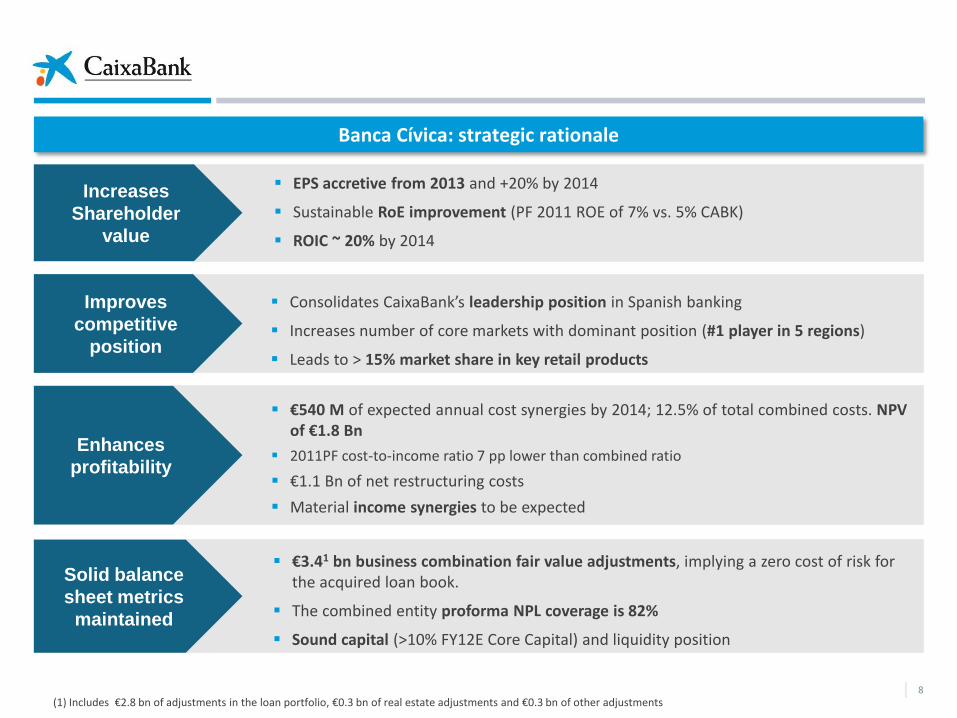
Banca Cívica: strategic rationale
Consolidates CaixaBank’s leadership position in Spanish banking
Increases number of core markets with dominant position (#1 player in 5 regions)
Leads to > 15% market share in key retail products
€540 M of expected annual cost synergies by 2014; 12.5% of total combined costs. NPV of €1.8 Bn
2011PF cost-to-income ratio 7 pp lower than combined ratio
€1.1 Bn of net restructuring costs
Material income synergies to be expected
€3.41 bn business combination fair value adjustments, implying a zero cost of risk for the acquired loan book.
The combined entity proforma NPL coverage is 82%
Sound capital (>10% FY12E Core Capital) and liquidity position
Solid balance
sheet metrics
maintained
Improves
competitive
position
Enhances
profitability
(1) Includes €2.8 bn of adjustments in the loan portfolio, €0.3 bn of real estate adjustments and €0.3 bn of other adjustments
EPS accretive from 2013 and +20% by 2014
Sustainable RoE improvement (PF 2011 ROE of 7% vs. 5% CABK)
ROIC ~ 20% by 2014
Increases
Shareholder
value

9
The integration reinforces CABK’s position as the market leader in retail banking
Information for individuals as of 2011. Peer group includes: BBVA, BKIA, Popular + Pastor, Sabadell + CAM and Santander Adjusted for shared clients Source FRS
Overall client penetration Client penetration as preferred entity 1st 1st
4.6% 6.2% 6.5%
10.9%
14.1%
21.0%
15.7%
26.8% 1.7X
3.2%
5.1% 6.4%
7.5%
10.2%
16.6%
12.4%
21.8% 1.8X

Higher efficiency in core markets and opportunity to restructure “expansion markets”
Market share
Business volume Branches B. Volume/
Branches
Cataluña
Baleares
Co
re M
arke
ts 28.3% 24.5% 115%
Navarra
Andalucía
Castilla y León
Canarias
12.3% 10.3% 119%
Exp
ansi
on
M
arke
ts
% of branches
Pre-deal Post-deal
47% 64%
36% 53%
6.8% 10.0% 68%
81% 0.7% 0.9%
CABK
BCIV
CABK
BCIV
High productivity
Opportunity to
restructure
10 10

-9.9
-4.1
-3.2
-2.4
-0.1
1.9
Peer 5
Peer 4
Peer 3
Peer 2
Peer 1
CABK’s organic market share gains bolstered through acquisition
Source: quarterly results of the companies. Peers (March’12 figures except for Bankia, Dec’11) include Banesto, Banco Popular, Santander (Spanish network), BBVA (Spanish network), Banco Sabadell and Bankia . CaixaBank as of March’12 1. As of 31st March 2012. 2. As of 31st December 2011. Source Asociación Española de Factoring and SWIFT 3. As of 29th February 2012- assets under management
Stable business volume despite a declining loan book as country
deleverages
Lower deleveraging and franchise strength lead to sustained market share growth
Customer funds
Mutual funds3
Demand deposits2
Time deposits2
Loans
Commercial loans
Total loans
13.7%
15.3%
13.2%
12.1%
12.3%
9.3%
12.1%
13.4%
10.4%
10.4%
CABK market share
CABK+BCIV
Transactional products
Payroll deposits1
Pension deposits1
20.1%
20.1%
15.7%
13.8%
yoy growth
+3bps
+51bps
+2bps
+88bps
+7bps
+21bps
+22bps
Bps BCIV
+160bps
+307bps
+389bps
+167bps
+300bps
+440bps
+630bps
11

12
Reinforcing market share in a deleveraging environment
CaixaBank at a glance p. 5
The Banca Cívica deal - developing franchise value p. 7
Bolstering balance sheet strength p. 13
Profitability levers p. 21
Key takeaways p. 27

A solid balance sheet has set the scene for this market share growth
Core capital (BIS II) 12.4%
Full compliance with BIS-III ~10.5% Core Capital3 look-through 2019
€29.4bn of available net liquidity
€20.9 bn of covered bonds issuance capacity
Robust capital base Strong liquidity position
CaixaBank figures as of March 2012 (1) All the foreclosed assets prior to February 28th 2011 were not transferred in the reorganisation process. (2) Fully phased-in
13
• Low NPL ratio vs peers:
(5.25%) and solid coverage (61%)
• Lower relative exposure to real estate assets2
Superior asset quality
BIS II/ BIS III above 10% during the transition period
>33 bn of combined available net liquidity
NPL coverage at 82%, significantly above the sector average
Banca Cívica acquisition will not materially impact balance sheet metrics
BCIV acquisition

2.22.2
3.23.5
4.24.44.4
4.95.0
5.45.55.6
5.96.26.46.6
7.4
Peer 16Peer 15Peer 14Peer 13Peer 12Peer 11Peer 10
Peer 9Peer 8Peer 7Peer 6Peer 5Peer 4Peer 3Peer 2Peer 1
CaixaBankPeer 1
Strong capital ratios maintained in BIS-II and BIS- III, while TE/TA proves quality
14 (1) Fully phased-in (2) Peers (March’12 figures except for Bankia, Dec’11) include Bankia, Banesto, BBVA, Popular,
Sabadell and Santander. CaixaBank as of March’12
“la Caixa” Group comfortably meets EBA capital requirements at 10.3%- €1.8bn surplus
Availability of surplus capital has been a key consideration in the Banca Civica transaction
Tangible Common Equity / Tangible Assets (%) March’12
The highest Core Capital among peers2
~10.5%
BIS-III (1) 12.4% 11.9% 10.7%
10.1% 10.1% 9.8% 9.2%
Peer 1 Peer 2 Peer 3 Peer 4 Peer 6 Peer 5
Peer 17
Peer 16
Peer 15
Peer 14
Peer 13
Peer 12
Peer 11
Peer 10
Peer 9
Peer 8
Peer 7
Peer 6
Peer 5
Peer 4
Peer 3
Peer 2
Peer 1
CaixaBank
Spanish Banks Other Eurozone Banks
8.3
Source: KBW 2012 Estimates Peers include Santander, BBVA, Banco Popular, Banesto, Sabadell, Société Générale, BNP Paribas , CASA, Natixis, UniCredit, ISP, Deutsche Bank, Commerzbank, ING, KBC, Erste and Raiffeisen.

11.1 11.9
9.8
17.5
December 2011 March 2012
Bolstering liquidity has been one key goal over recent quarters
15
€1bn 5yr covered bond issued at MS+243bps in February
€4.3 bn decline in commercial funding gap
LTRO facility (Dec. ‘11 + Feb. ‘12): €18.5 bn, of which ~€6 bn kept in deposit at ECB
(1) Includes cash, interbank deposits, accounts at central banks and short duration unencumbered Spanish sovereign debt. (2) From April to December 2012
€29.4bn 10.6%
CaixaBank Assets
€20.9bn
Unused ECB discount facility
Balance sheet liquidity1
Comfortable wholesale maturity profile
Wholesale maturities (€bn)
1.8
6.1 6.9
2012 2013 2014 2
Strong liquidity levels provide a high degree of comfort

Provisioning effort to reinforce high NPL coverage, which remains above peers
NPL ratio mostly explained by real estate developers
Better asset quality than peers
16
Sector:
8.16% (Feb’12)
Loans to individuals
Residential mortgages
Consumer credit
Loans to businesses
Corporate and SMEs
Real estate developers
ServiHabitat2
Public sector
Total loans
92.5
69.1
23.4
79.8
55.0
21.7
3.1
11.6
183.9
1.95%
1.57%
3.07%
10.37%
3.93%
28.16%
0.00%
0.66%
5.25%
€bn NPL ratio1
31st March 2012
(1) Includes contingent liabilities (2) Includes Servihabitat and other subsidiaries of Caja de Ahorros y Pensiones de Barcelona,
CaixaBank’s major shareholder
Sector:
57% (Feb’12)
61 51 50 47 46 45 43
Peer 1 Peer 2 Peer 3 Peer 4 Peer 6 Peer 5
NPL Coverage ratio comparison3
(3) Peers (March’12 figures except for Bankia, Dec’11) include Bankia, Banesto, BBVA, Popular, Sabadell and Santander. CaixaBank as of March’12

14%
6%
12%
50%
16%2%
A lower risk profile helps in maintaining asset quality well above sector
17
Prudent LTVs: Average LTV 51.5% 90% with LTV <80% First residence real estate developments
With mortgage guarantee: • Land • In progress • Finished
Unsecured /other guarantees:
92% 17.5% 13.1% 61.4% 8%
Collateral breakdown (%)
March 2012
€12.7bn
€2.9bn
€6.1bn
€21.7 bn
Performing
Substandard
NPL
A retail oriented loan portfolio
Individuals
SMEs
Large corporates
RE developers
Public Sector
Servihabitat
Total loans (1Q12): €184 Bn
100
92 872
72
102 99 93
4Q08 4Q09 4Q10 4Q11
-7%
-28%
(1) Source: Bank of Spain (Table 4.18 “Actividades inmobiliarias”) (2) Impacted by the acquisition of Caixa Girona
28% reduction in balance versus sector1 since Dec. ‘08
RE developer portfolio breakdown (€ bn)
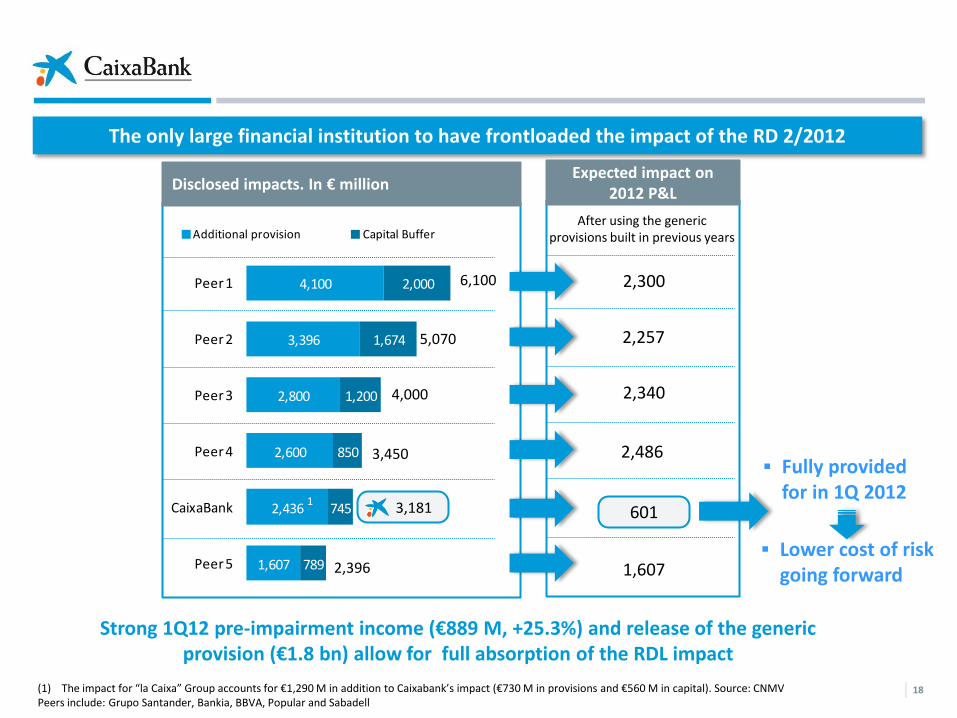
1,607
2,436
2,600
2,800
3,396
4,100
789
745
850
1,200
1,674
2,000
Peer 5
CaixaBank
Peer 4
Peer 3
Peer 2
Peer 1
Additional provision Capital Buffer
18
The only large financial institution to have frontloaded the impact of the RD 2/2012
(1) The impact for “la Caixa” Group accounts for €1,290 M in addition to Caixabank’s impact (€730 M in provisions and €560 M in capital). Source: CNMV Peers include: Grupo Santander, Bankia, BBVA, Popular and Sabadell
3,181
4,000
6,100
Disclosed impacts. In € million Expected impact on
2012 P&L
2,396
3,450
1,607
601
2,340
2,300
2,486
After using the generic provisions built in previous years
5,070 2,257
1
Strong 1Q12 pre-impairment income (€889 M, +25.3%) and release of the generic provision (€1.8 bn) allow for full absorption of the RDL impact
Fully provided for in 1Q 2012
Lower cost of risk going forward
19
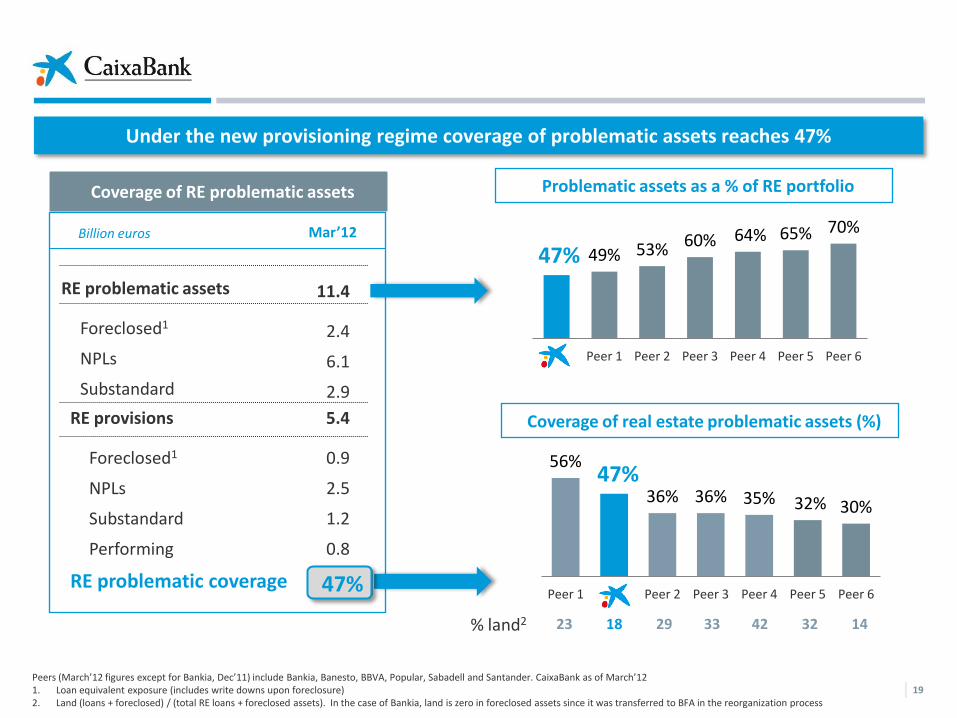
Under the new provisioning regime coverage of problematic assets reaches 47%
Coverage of RE problematic assets
RE problematic assets
Foreclosed1
NPLs
Substandard
RE provisions
Foreclosed1
NPLs
Substandard
Performing
RE problematic coverage
11.4
2.4
6.1
2.9
5.4
0.9
2.5
1.2
0.8
39%
Mar’12 Billion euros
Peers (March’12 figures except for Bankia, Dec’11) include Bankia, Banesto, BBVA, Popular, Sabadell and Santander. CaixaBank as of March’12 1. Loan equivalent exposure (includes write downs upon foreclosure) 2. Land (loans + foreclosed) / (total RE loans + foreclosed assets). In the case of Bankia, land is zero in foreclosed assets since it was transferred to BFA in the reorganization process
47% 49% 53% 60% 64% 65% 70%
Peer 1 Peer 2 Peer 3 Peer 4 Peer 5 Peer 6
56% 47%
36% 36% 35% 32% 30%
Peer 1 Peer 2 Peer 3 Peer 4 Peer 5 Peer 6
Problematic assets as a % of RE portfolio
Coverage of real estate problematic assets (%)
47%
% land2 18 23 29 33 42 32 14

20
Reinforcing market share in a deleveraging environment
CaixaBank at a glance p. 5
The Banca Cívica deal - developing franchise value p. 7
Bolstering balance sheet strength p. 13
Profitability levers p. 21
Key takeaways p. 27
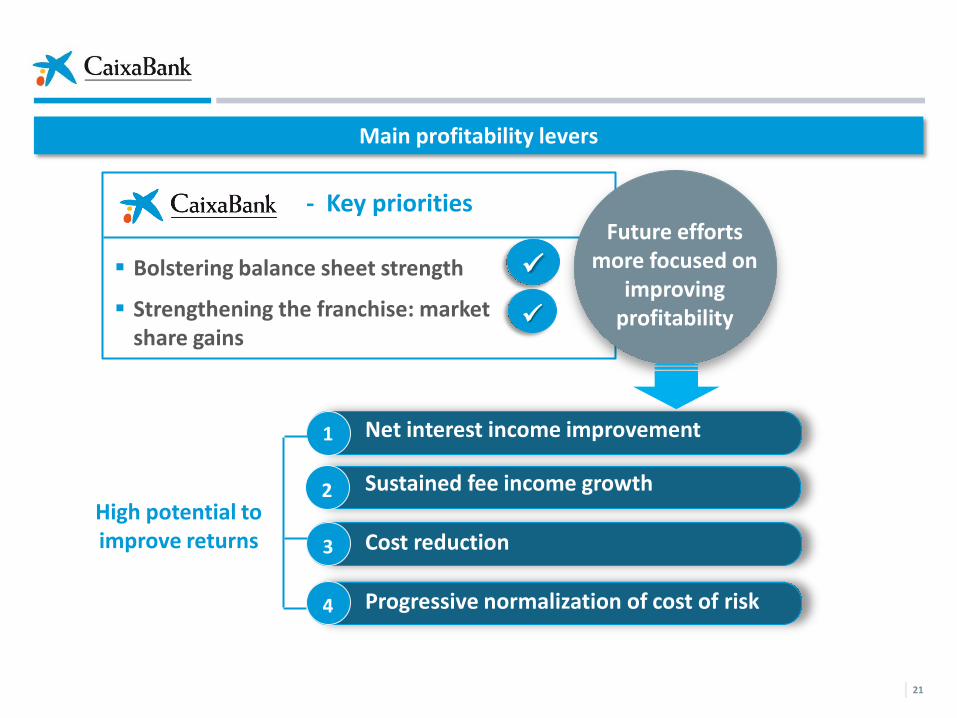
Main profitability levers
21
High potential to improve returns
1. Net interest income improvement
2. Sustained fee income growth
3. Cost reduction
4. Progressive normalization of cost of risk
1
3
4
- Key priorities
Future efforts more focused on
improving profitability
Bolstering balance sheet strength
Strengthening the franchise: market share gains
2
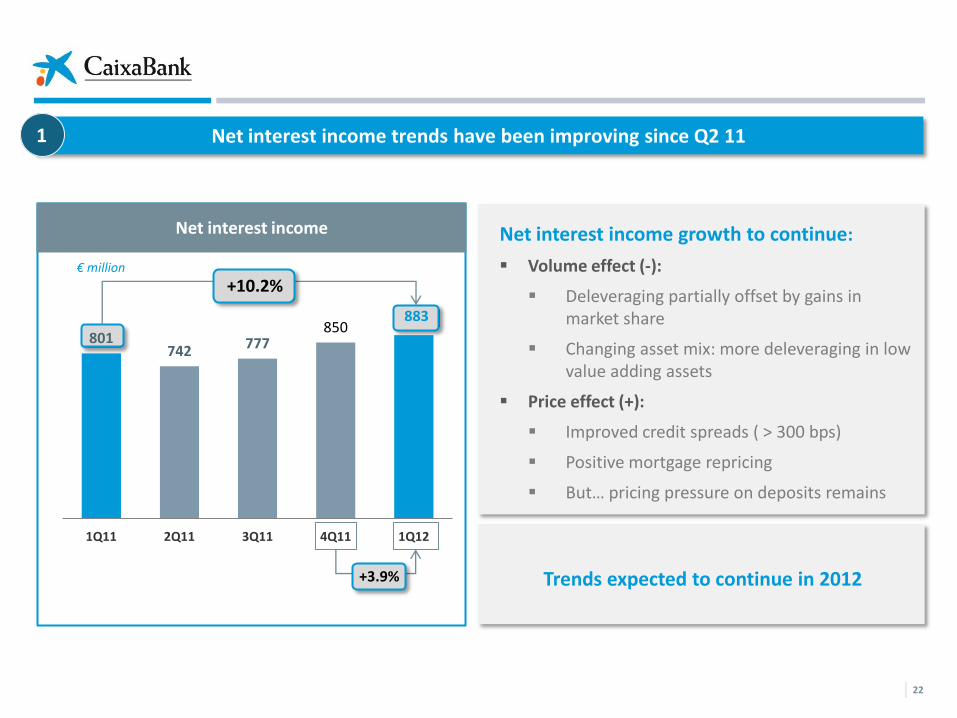
Net interest income trends have been improving since Q2 11
22
Net interest income growth to continue:
Volume effect (-):
Deleveraging partially offset by gains in market share
Changing asset mix: more deleveraging in low value adding assets
Price effect (+):
Improved credit spreads ( > 300 bps)
Positive mortgage repricing
But… pricing pressure on deposits remains
1
Net interest income
Trends expected to continue in 2012
€ million
801 742 777
850 883
1Q11 2Q11 3Q11 4Q11 1Q12
+10.2%
+3.9%

Resilient fee income in a tough environment as franchise proves its worth
23
2
Net fees
383 389 365
425 413
1Q11 2Q11 3Q11 4Q11 1Q12
€ million
+7.8%
-2.8%
1Q’ 12 YoY(%)
Banking Services 311 11.8%
Mutual funds 38 0%
Insurance and pension plans
49 15.5%
Custody and distribution fees(1) 15 (40.0%)
Net Fees
€ million
Net fees break-down
413 7.8%
Increased banking service fees a good indication of business health
(1) Includes distribution fees for regional government securities

24
Strong capacity of generating pre-impairment income Sustained efforts in cost-cutting and improving efficiency
(1) On a recurrent basis
Cost-cutting discipline will continue to play a significant role.
3
Positive trends in efficiency ratios
Cost-to-income ratio below 50%1
51.5
52.5 52.6
51.3
49.6
1Q11 2Q11 3Q11 4Q11 1Q12
% € million
Additional efforts in cost reduction1
2009 2010 2011 1Q12
3,366 3,507
-4%
-4% 3,232
783
-6% yoy
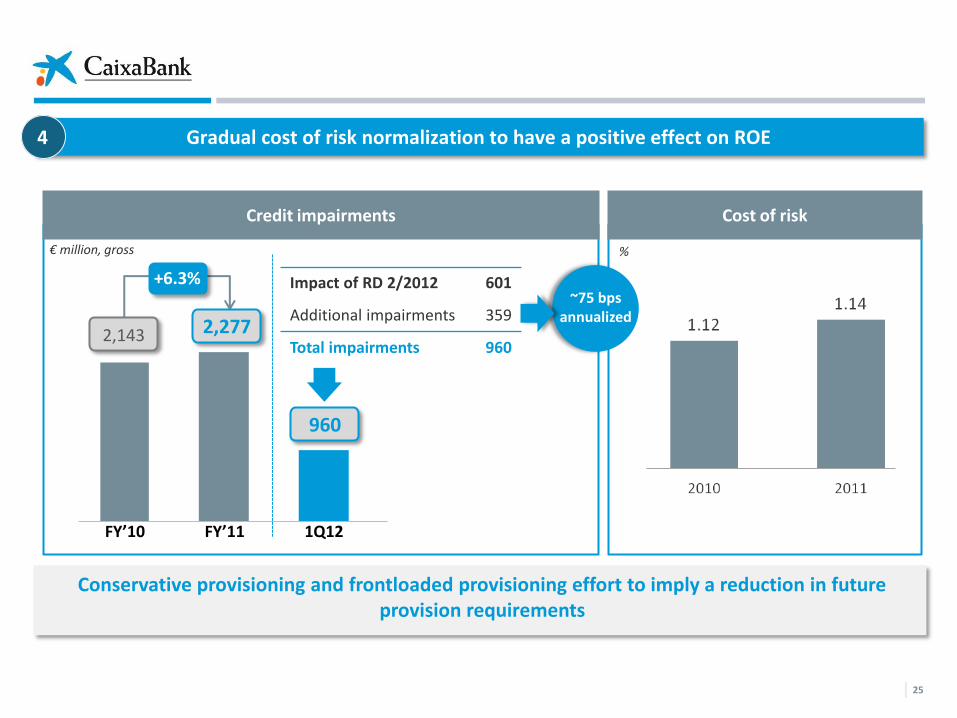
Gradual cost of risk normalization to have a positive effect on ROE
Conservative provisioning and frontloaded provisioning effort to imply a reduction in future provision requirements
25
Cost of risk
4
%
Credit impairments
€ million, gross
2,277 2,143
+6.3%
960
FY’10 FY’11 1Q12
Impact of RD 2/2012 601
Additional impairments 359
Total impairments 960
~75 bps annualized

26
Reinforcing market share in a deleveraging environment
CaixaBank at a glance p. 5
The Banca Cívica deal - developing franchise value p. 7
Bolstering balance sheet strength p. 13
Profitability levers p. 21
Key takeaways p. 27
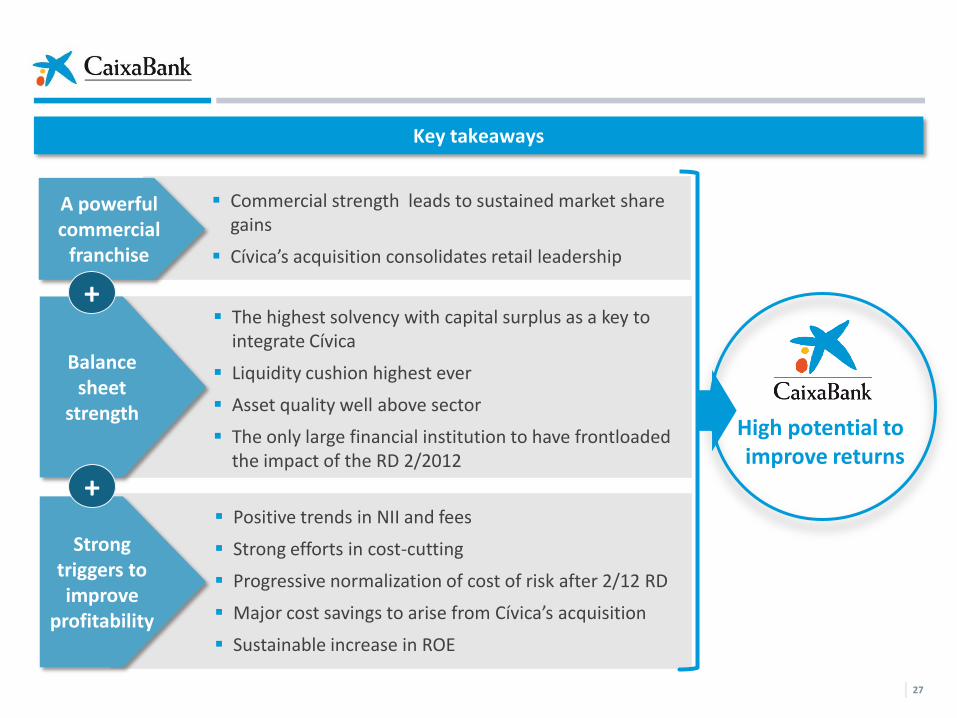
Key takeaways
27
Positive trends in NII and fees
Strong efforts in cost-cutting
Progressive normalization of cost of risk after 2/12 RD
Major cost savings to arise from Cívica’s acquisition
Sustainable increase in ROE
High potential to improve returns
The highest solvency with capital surplus as a key to integrate Cívica
Liquidity cushion highest ever
Asset quality well above sector
The only large financial institution to have frontloaded the impact of the RD 2/2012
Commercial strength leads to sustained market share gains
Cívica’s acquisition consolidates retail leadership
A powerful commercial
franchise
Strong triggers to improve
profitability
Balance sheet
strength
+
+
+34 93 411 75 03
Institutional Investors & Analysts Contact
We are at your entire disposal for any questions or suggestions you may wish to make. To contact us, please call or write to us at the following email address and telephone number:
Related Documents