www.csiro.au Two-Rocks moorings data report C. B. Fandry, D. Slawinski and L. Pender CSIRO Marine and Atmospheric Research Paper 005 January 2006

Welcome message from author
This document is posted to help you gain knowledge. Please leave a comment to let me know what you think about it! Share it to your friends and learn new things together.
Transcript
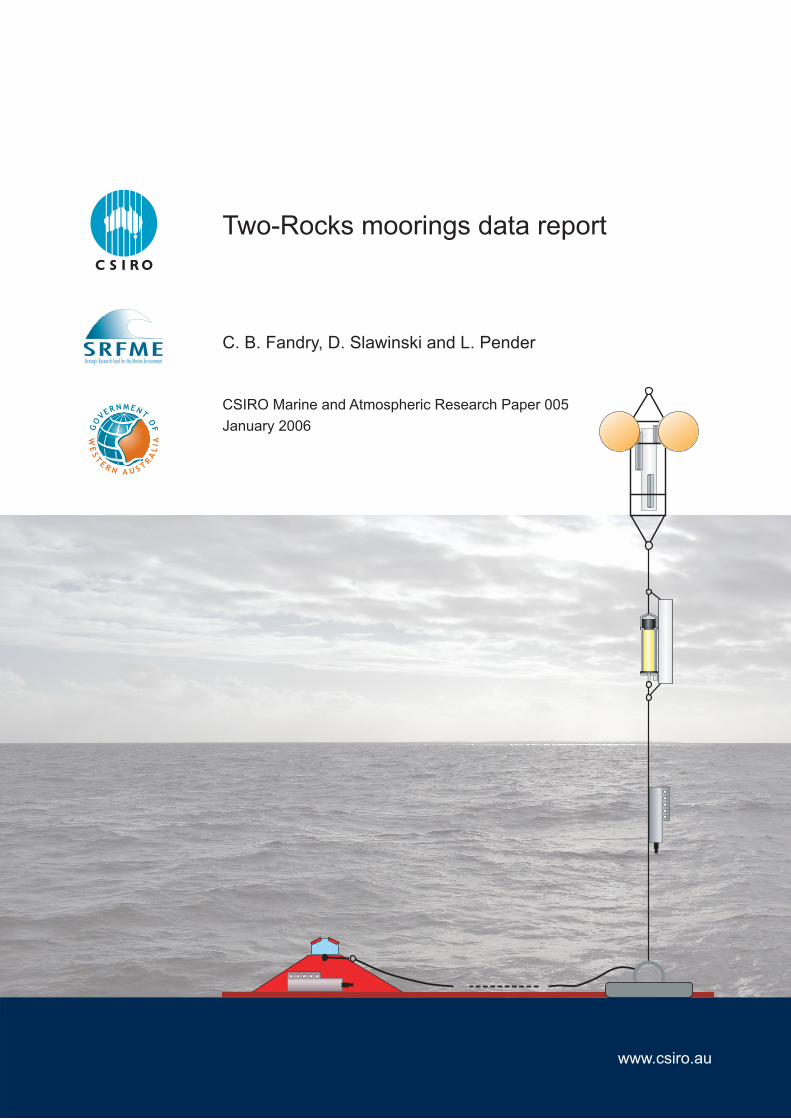
www.csiro.au
Two-Rocks moorings data report
C. B. Fandry, D. Slawinski and L. Pender
CSIRO Marine and Atmospheric Research Paper 005
January 2006

Fandry, C. B. (Chris B.). Two Rocks moorings data report.
Bibliography.
Includes index. ISBN 1 921061 21 9
ISSN 1833 2331.
1. Oceanography - Research - Western Australia - Two Rocks.
2. Ocean currents - Observations - Indian Ocean. 3. Ocean
temperature - Observations - Indian Ocean. 4. Salinity - Observations - Indian Ocean. 5. Sea level - Observations -
Indian Ocean. 6. Oxygen - Observations - Indian Ocean. 7.
Fluorescence - Observations - Indian Ocean. I. Slawinski,
D. II. Pender, L. F. III. CSIRO. Marine and Atmospheric Research. IV. Title. (Series : CSIRO Marine and
Atmospheric Research paper; 5).
551.4615

Two Rocks Data Report 3
Enquiries should be addressed to:
Dr Chris Fandry
CSIRO Marine and Atmospheric Research
Private Bag No. 5 WEMBLEY WESTERN AUSTRALIA 6913
Phone 08 9333 6570
Distribution list
Chief of Division
Operations Manager
Project Manager
Client
Authors
Other CSIRO Staff
National Library
CMAR Libraries
Important Notice
© Copyright Commonwealth Scientific and Industrial Research Organisation
(‘CSIRO’) Australia 2005
All rights are reserved and no part of this publication covered by copyright may be reproduced or copied in
any form or by any means except with the written permission of CSIRO.
The results and analyses contained in this Report are based on a number of technical, circumstantial or
otherwise specified assumptions and parameters. The user must make its own assessment of the suitability
for its use of the information or material contained in or generated from the Report. To the extent permitted by
law, CSIRO excludes all liability to any party for expenses, losses, damages and costs arising directly or
indirectly from using this Report.
Use of this Report The use of this Report is subject to the terms on which it was prepared by CSIRO. In particular, the Report may
only be used for the following purposes.
this Report may be copied for distribution within the Client’s organisation;
the information in this Report may be used by the entity for which it was prepared (“the Client”), or by the
Client’s contractors and agents, for the Client’s internal business operations (but not licensing to third
parties);
Two Rocks Data Report 4
Table of Contents
Introduction.......................................................................................................................... 5
Mooring Summary ............................................................................................................... 6
First Deployment.................................................................................................................. 6
Mooring A............................................................................................................................................... 6
Mooring B............................................................................................................................................... 6
Mooring C............................................................................................................................................... 7
Second Deployment ............................................................................................................ 7
Mooring A............................................................................................................................................... 7
Mooring B............................................................................................................................................... 8
Mooring C............................................................................................................................................... 8
Third Deployment ................................................................................................................ 8
Mooring A............................................................................................................................................... 8
Mooring B............................................................................................................................................... 8
Mooring C............................................................................................................................................... 9
Fourth Deployment .............................................................................................................. 9
Mooring A............................................................................................................................................... 9
Mooring B............................................................................................................................................. 10
Mooring C............................................................................................................................................. 10
Data Files............................................................................................................................ 11
Data Figures ....................................................................................................................... 12
Temperature ........................................................................................................................................ 12
Salinity .................................................................................................................................................. 12
Pressure............................................................................................................................................... 12
Long-shore Currents ........................................................................................................................... 12
Long-shore Currents, Winds and Pressure ....................................................................................... 12
Temperature Comparisons ................................................................................................................. 13
Mooring Design.................................................................................................................. 24
Acknowledgements ........................................................................................................... 26
Two Rocks Data Report 5
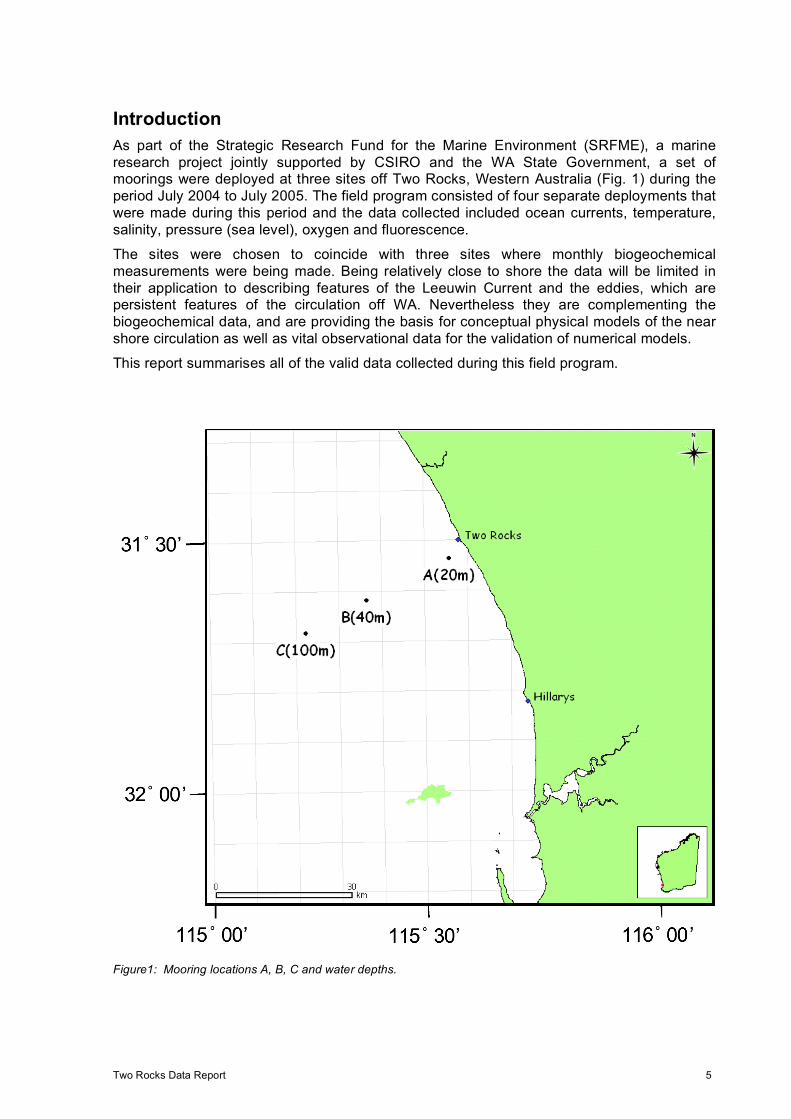
Introduction
As part of the Strategic Research Fund for the Marine Environment (SRFME), a marine
research project jointly supported by CSIRO and the WA State Government, a set of moorings were deployed at three sites off Two Rocks, Western Australia (Fig. 1) during the
period July 2004 to July 2005. The field program consisted of four separate deployments that
were made during this period and the data collected included ocean currents, temperature,
salinity, pressure (sea level), oxygen and fluorescence.
The sites were chosen to coincide with three sites where monthly biogeochemical
measurements were being made. Being relatively close to shore the data will be limited in
their application to describing features of the Leeuwin Current and the eddies, which are persistent features of the circulation off WA. Nevertheless they are complementing the
biogeochemical data, and are providing the basis for conceptual physical models of the near
shore circulation as well as vital observational data for the validation of numerical models.
This report summarises all of the valid data collected during this field program.
Figure1: Mooring locations A, B, C and water depths.

Two Rocks Data Report 6
Mooring Summary
Mooring Position Water
Depth
1st
deploy
ment
2nd
deploy
ment
3rd
deploy
ment
4th
deploy
ment
A 31º 32.2S, 115º 33.5E 20m 30/6/04 to
10/10/04
13/10/04 to
20/1/05
8/2/05 to
16/4/05
18/4/05 to
16/7/05
B 31º 37.1S, 115º 21.9E 40m 30/06/04 to
7/10/04
8/10/04 to
6/1/05
8/2/05 to
16/4/05
No data
C 31º 40.9S, 115º 13.3E 100m 30/06/04
to 7/10/04
8/10/04
to 6/1/05
12/1/05
to 19/4/05
20/6/05
to 16/7/05
Table 1: Summary of mooring positions, depth and deployment periods
First Deployment
Mooring A
Instrument Serial
no.
Nominal
Depth
Description
SBE 19-plus 4534 10m Multi-sensor – CTD, Oxygen, PAR and
Fluorescence
SBE 37 3125 20m Microcat – CT (conductivity and temperature)
SBE 26 0409 20m Tide/wave gauge
RBR XR-
420-TG
010095 20m Tide gauge with temperature sensor.
Aquadopp 1036 20m ADCP
Commentary
With the exception of the Microcat (3125) conductivity data and SBE 19 Plus multi-sensor
(4534) auxiliary data, all instruments were working properly. Very early in the deployment,
the conductivity sensor of the Microcat filled with sand rendering the data useless. The SBE 26 (0409) tide gauge also filled with sand, however the data is okay. The batteries in the
SBE 19 Plus multi-sensor went flat around 1 Sept. and thus auxiliary data (oxygen, PAR and
fluorescence) are not valid after this time. There appears to be valid CTD data up until 15 Sept.
The Brankner tide gauge (RBR XR-420-TG) was incorrectly configured to sample every 15
hours (instead of 15 minutes), and the data are therefore not included in this report.
Mooring B
Instrument Serial
no.
Nominal
Depth
Description
SBE 37 2972 20m Microcat – CTD (conductivity, temperature and
pressure)
SBE 26 0408 40m Tide/wave gauge
RDI
Workhorse
3712 40m 300khz ADCP – lost and later recovered

Two Rocks Data Report 7
Commentary
The ADCP was lost sometime during this deployment and later recovered using a
commercial ROV. From the state of the ADCP cage upon recovery, it is evident that the cage was upside-down for at least some of the deployment. No data was recovered from
this ADCP. The SBE 26 (0408) tide gauge underwent a slow failure from about 22 July, 2004
and no data is included here. The Microcat (2972) data appears to be okay.
Mooring C
Instrument Serial
no.
Nominal
Depth
Description
SBE 19-plus 4536 10m Multi-sensor – CTD, Oxygen, PAR and
Fluorescence
SBE 37 3050 50m Microcat – CT (conductivity and temperature)
SBE 37 3027 100m Microcat – CTD (conductivity, temperature and
depth)
RDI Workhorse
3713 100m 300 khz ADCP
Commentary
There appeared to be a problem with the deployment of the ADCP cage on this mooring. There is no valid ADCP data until late on 24 Aug. when the ADCP pitch and roll sensors
indicated that the ADCP flipped from pointing down to pointing up. There was a storm event
on the 24 Aug which probably caused the instrument to right itself. The Microcat (3027)mounted on the ADCP cage had valid temperature data; however, the salinity data
indicates fouling of the conductivity cell up until the same time that the ADCP began to work,
although the salinity data is still noisy after this time
The batteries in the SBE 19 Plus multi-sensor (4536) went flat around 19 Sept. and thus auxiliary data (oxygen, PAR and fluorescence) are not valid after this time. There appears to
be valid CTD data up until the mooring was recovered. The fluorometer data becomes noisy
from around 1 Sept. Data from the second Microcat (3050) appears to be okay.
Second Deployment
Mooring A
Instrument Serial no.
Nominal Depth
Description
SBE 19-plus 4534 10m Multi-sensor – CTD, Oxygen, PAR and
Fluorescence
SBE 37 3125 20m Microcat – CT (conductivity and temperature)
SBE 26 0409 20m Tide/wave gauge
RBR XR-
420-TG
010095 20m Tide gauge with temperature sensor.
Aquadopp 1036 20m ADCP
Commentary
The SBE 26 tide gauge (0409) failed to store any data. Fortunately the Brankner tide gauge
(010095) worked well. The PAR sensor on the SBE 19 Multisensor failed on 31 Oct after a calibration drift which started around 25 Oct. As in the first deployment, the conductivity cell
on the SBE 37 Microcat (3125) filled with sand on 8 Dec despite being mounted vertically.
Thus the conductivity and salinity data are of little value. There is also evidence that the
conductivity cell was partially blocked on occasions before this date.

Two Rocks Data Report 8
Data from the Microcat temperature sensor and all sensors on the SBE 19 Multisensor
(4534) with the exception of PAR as noted above appeared to be of good quality.
Mooring B
Instrument Serial
no.
Nominal
Depth
Description
SBE 37 2972 20m Microcat – CTD (conductivity, temperature and
pressure)
Commentary Good quality data was measured by the Microcat (2972).
Mooring C
Instrument Serial
no.
Nominal
Depth
Description
SBE 19-plus 4536 10m Multi-sensor – CTD, Oxygen, PAR and
Fluorescence
SBE 37 3027 20m Microcat – CTD (conductivity, temperature and
depth)
SBE 37 3050 100m Microcat – CTD (conductivity and temperature)
Commentary
With the exception of the SBE 19 Multisensor 4536) PAR sensor, which was not operational for the duration of the deployment, all instruments provided good quality data.
Third Deployment
Mooring A
Instrument Serial
no.
Nominal
Depth
Description
SBE 19-plus 4534 10m Multi-sensor – CTD, Oxygen, PAR and
Fluorescence
SBE 37 3125 20m Microcat – CT (conductivity and temperature)
SBE 26 0409 20m Seabird Tide/wave gauge
RBR XR-
420-TG
010095 20m Tide gauge with temperature sensor.
Aquadopp 1484 11m Single point acoustic doppler current meter.
Commentary
All instruments provided good quality data except for the SBE 19 plus (4534). As with the previous deployments the geochemical sensors malfunctioned and none of the data is
useful.
Mooring B
Instrument Serial
no.
Nominal
Depth
Description
SBE 37 2972 25m Microcat – CTD (conductivity, temperature and
pressure).
Aquadopp 1414 26m Single point acoustic doppler current meter.

Two Rocks Data Report 9
Commentary
The Aquadopp (1414) gave a full record for the deployment period and the data appears to be good. The SBE37 (2972) was deployed, but unfortunately was not turned on to log data.
Mooring C
Instrument Serial no.
Nominal Depth
Description
SBE 19-plus 4536 15m Multi-sensor – CTD, Oxygen, PAR and
Fluorescence.
SBE 37 3050 50m Microcat – CTD (conductivity, temperature).
SBE 37 3027 100m Microcat – CTD (conductivity, temperature
and depth).
SBE 26 0408 100m Seabird Tide/wave gauge.
RDI Workhorse
3712 100m 300khz ADCP.
Commentary
The Seabird SBE37’s (3027 and 3050) provided good data for the full deployment period. SBE 26 (0408) developed a leak in its pressure sensor and the data slowly drifted off during
the deployment. The SBE19-plus (4536) recorded data from 12th Jan until it ran out of
batteries on 30th March. The temperature, pressure and conductivity/salinity records all
appears to give good data, however the data from the geochemical sensors are once again unreliable. The RDI ADCP (3712) recorded data from 12th Jan until a fault developed in the
unit on 19th Feb. The data for that 5 week period appears to be good.
Fourth Deployment
Mooring A
Instrument Serial
no.
Nominal
Depth
Description
SBE 19-plus 4534 10m Multi-sensor – CTD, Oxygen, PAR and
Fluorescence
SBE 37 3125 20m Microcat – CT (conductivity and temperature)
SBE 26 0409 20m Seabird Tide/wave gauge
RBR XR-
420-TG
010095 20m Tide gauge with temperature sensor.
Aquapro AQP1036 20m Nortek 600khz ADCP
Commentary Data from all instruments appear of good quality with the exception noted below. The SBE19
(4534) recorded from the start of the deployment until 23rd June when it ran out of batteries.
The temperature, pressure, and conductivity/salinity sensor records all appear to give good data, however the data from the geochemical sensors are unreliable.

Two Rocks Data Report 10
Mooring B
Instrument Serial no.
Nominal Depth
Description
SBE 37 2972 25m Microcat – CTD (conductivity, temperature and
pressure).
RDI ADCP 3713 45m 300khz Workhorse ADCP
Commentary
No data is available from this mooring at the time of publication of this report because the mooring was not recovered until mid January 2006. If the data is found to be good, it will be
available via the link on p11.
Mooring C
Instrument Serial no.
Nominal Depth
Description
SBE 19-plus 4536 15m Multi-sensor – CTD, Oxygen, PAR and
Fluorescence.
SBE 37 3027 50m Microcat – CTD (conductivity, temperature and pressure).
SBE 37 3050 100m Microcat – CTD (conductivity and temperature).
RDI Workhorse 3712 100m 300khz ADCP.
Commentary
This mooring was not deployed until 20th June. All the data records therefore are of
approximately 4 weeks duration only. All instruments recorded for the full 4 weeks duration, and all appear to have good data, except the geochemical sensors on the SBE (4536).

Two Rocks Data Report 11
Data Files
The instruments were configured to provide a time-series of raw data at 15 minute intervals.
A simple moving average over five point samples (1.25hours) was applied to the time-series
which was then sampled at hourly intervals on the hour. For each mooring and oceanic variable the hourly data from all the instruments were combined to form data files covering
one full year (Table 3). In some cases data from different instruments were used to construct
the full year data files. There are data gaps where instrument failures occurred and during
deployment change overs. Hourly wind data from an automatic weather station at a nearby coastal town, Ocean Reef, is also available on this site. The data files can be accessed with
approval at http://www.marine.csiro.au/marlin/search_contents.html
Mooring
Variable Instrument (s) Depth File Name
A T SBE 4534 10m Temperature_A_SBE4534_ July04-July05.xls
A T SBE 3125 20m Temperature_A_SBE3125_
July04-July05.xls
B T SBE 2972 25m Temperature_B_SBE2972_ July04-Dec04.xls
C T SBE 3027/3050 50m Temperature_C_SBE3027_
3050_50m_July04-July05.xls
C T SBE 3027/3050 100m Temperature_C_SBE3027_ 3050_July04-July05.xls
C T SBE 2972 10-50m Temperature_C_SBE2972_
July04-July05.xls
A S SBE 3125 20m Salinity_A_SBE3125_July04-June05.xls
A S SBE 4534 10m Salinity_A_SBE4534_July04-
June05.xls
C S SBE 3050/3027 50m Salinity_C_SBE3050-
3027_50m_July04-June05.xls
C S SBE3050/3027 100m Salinity_C_SBE3050-
3027_July04-June05.xls
C S SBE 4536 10m Salinity_C_SBE4536_July04-
June05.xls
A
P AQD1036/
RBR010095
20m Pressure_A_AQD1036_RBR0
10095_July04-July05.xls
C P SBE 3037/RDI 3712 100m Pressure_C_SBE3027_RDI
3712_July04-July05.xls
A Currents AQD1036/AQD1484 5-20m Currents_A_AQD1036_AQD
1484_July04-July05.xls
B Currents AQD1414 28m Currents_B_AQD1414_Feb05-
April05.xls
C Currents RDI 3712/3713 11-97m Currents_C_RDI3713_3712_
July04-June05.xls
Table 3: Listing of data files (T is temperature, S is salinity and P is pressure). The currents are resolved as long-
shore and cross-shore components where the positive longshore direction is defined as 310 to the west of North,
and positive cross-shore direction is 310 to the north of East.

Two Rocks Data Report 12
Data Figures
Temperature
Figures 2-6 show time-series of temperature based on hourly data derived from the raw 15 minute data using a running 5 point (1.25 hour) average.
Salinity
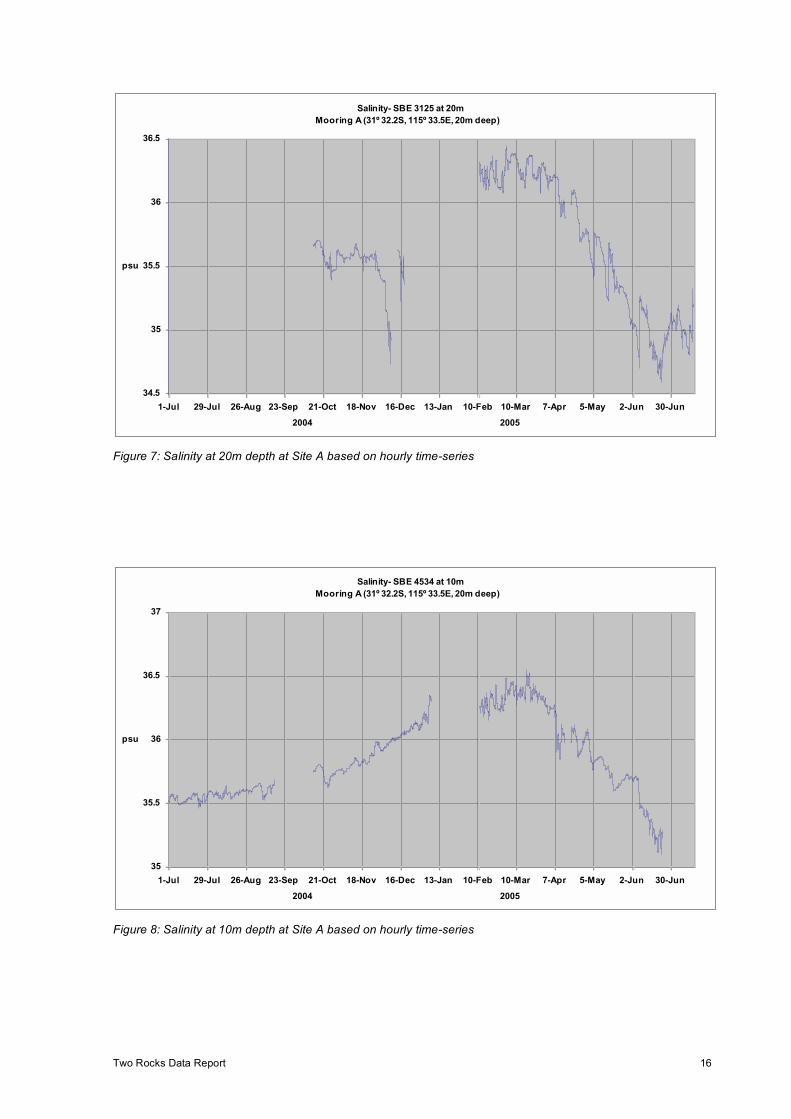
Figures 7-11 show time-series of salinity based on hourly data derived from the raw 15
minute data using a running 5 point (1.25 hour) average. While there has been a quality check on the salinity data, and bad data eliminated, some data may still be questionable (eg.
Fig. 10)
Pressure
Figures 12-13 show time-series of pressure based on hourly data derived from the raw 15 minute data using a running 5 point (1.25 hour) average. The spring and neap cycles of the
(diurnal) tides are clearly evident.
Long-shore Currents
Figures 14 and 15 show time-series of long-shore currents based on hourly data derived from the raw 15 minute data using a running 5 point (1.25 hour) average. The depth-
averaged currents shown in Fig.14 are based on ADCP data, and the currents at 28m shown
in Fig.15 are based on a fixed depth current meter.
Long-shore Currents, Winds and Pressure
Figure 16 compares time-series of 24 hour averaged long-shore bottom stress with long-
shore wind stress at site A. Bottom stress is based on the depth-averaged current and given
by the quadratic form B = waterCDV(U2+V2) where CD = 0.003 is the bottom drag coefficient,
water =1024kgm-3 , and (U, V) the cross-shore and longshore components of depth-averaged
current respectively. A linear regression analysis confirms the strong correlation between the
two variables with a correlation coefficient of 0.79. The relationship is similar for other
periods which shows that the coastal long-shore currents are essentially wind –driven.
Figure 17 compares the 48 hour averaged residual pressure (mean sea-level atmospheric
pressure removed) with the long-shore wind stress. Clearly evident is the strong negative correlation between the two due to the Ekman effect ie. a northward wind stress causes, a
northward flow with a corresponding offshore Ekman flow and hence a fall in sea-level, and a
southward wind stress has the reverse effect.
Figure 18 shows monthly averaged long-shore current profiles at Sites C and A. At Site A
the currents are on average northwards in the months October to April and southwards in the
months May to September. This is a response to the prevailing winds during these periods. At Site C the currents are northwards in January and February, and southwards in May to
October. The southward flow is much stronger than that at Site A and is probably due to the
influence of the southward flowing Leeuwin current.
Figures 19 and 20 compare the monthly averaged near surface long-shore currents with 3%
of the long-shore wind speed (this is a sometimes used rule of thumb law). The relationship
is reasonable at Site A for all months and at Site C during January and February.

Two Rocks Data Report 13
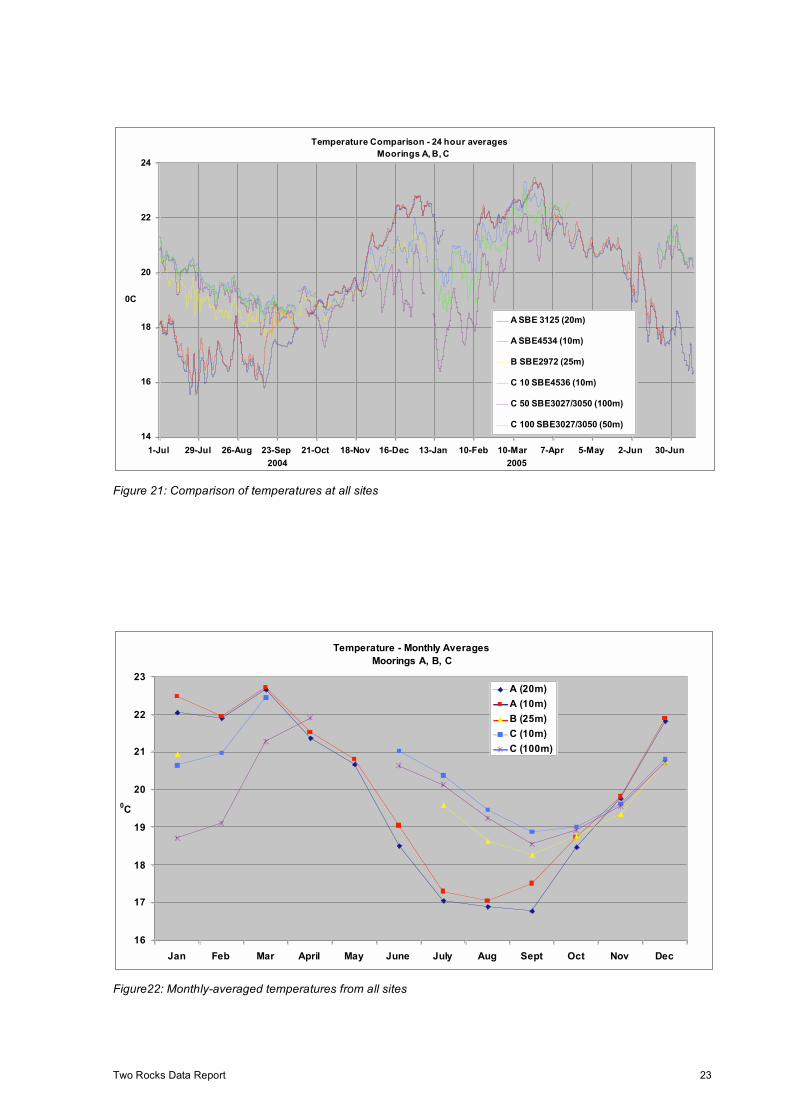
Temperature Comparisons
Temperatures at all sites are compared for the entire mooring perid 1 July 2004 to 15 July
2005 in Figure 21. At the shallow Site A, the waters are well mixed throughout the year, while
at Site C there is some stratification in the summer months. During the winter months the
inshore waters at Site A are cooler than the offshore waters at Site C by as much as 50C. The warmer offshore water is due to the influence of the Leeuwin current. In summer the
inshore waters are warmer than the offshore waters by up to 20C, due to local surface
heating having a greater effect in the near-shore shallow waters than in the offshore waters.
Monthly-averaged temperatures at all sites are shown in Figure 22. The trend for offshore
waters to be warmer than inshore waters during winter and cooler in summer is clearly evident.
Temperature- SBE 4534 at 10m
Mooring A (31º 32.2S, 115º 33.5E, 20m deep)
15
16
17
18
19
20
21
22
23
24
1-Jul 29-Jul 26-Aug 23-Sep 21-Oct 18-Nov 16-Dec 13-Jan 10-Feb 10-Mar 7-Apr 5-May 2-Jun 30-Jun
2004 2005
0C
Figure 2: Temperature at 10m depth at Site A based on hourly time-series

Two Rocks Data Report 14
Temperature- SBE 3125 at 20m
Mooring A (31º 32.2S, 115º 33.5E, 20m deep)
15
16
17
18
19
20
21
22
23
24
1-Jul 29-Jul 26-Aug 23-Sep 21-Oct 18-Nov 16-Dec 13-Jan 10-Feb 10-Mar 7-Apr 5-May 2-Jun 30-Jun
2004 2005
0C
Figure 3: Temperature at 20m depth at Site A based on hourly time-series
Temperature- SBE 2972 at 25m
Mooring B (31º 37.1S, 115º 21.9E, 40m deep)
15
16
17
18
19
20
21
22
23
24
1-Jul 29-Jul 26-Aug 23-Sep 21-Oct 18-Nov 16-Dec 13-Jan 10-Feb 10-Mar 7-Apr 5-May 2-Jun 30-Jun
2004 2005
0C
Figure 4: Temperature at 25m depth at Site B based on hourly time-series

Two Rocks Data Report 15
Temperature- SBE 3027/3050 at 50m
Mooring C (31º 40.96S, 115º 13.3E, 100m deep)
15
16
17
18
19
20
21
22
23
24
1-Jul 29-Jul 26-Aug 23-Sep 21-Oct 18-Nov 16-Dec 13-Jan 10-Feb 10-Mar 7-Apr 5-May 2-Jun 30-Jun
2004 2005
0C
Figure 5: Temperature at 50m depth at Site C based on hourly time-series
Temperature- SBE 3027/3050 at 100m
Mooring C (31º 40.96S, 115º 13.3E, 100m deep)
15
16
17
18
19
20
21
22
23
24
1-Jul 29-Jul 26-Aug 23-Sep 21-Oct 18-Nov 16-Dec 13-Jan 10-Feb 10-Mar 7-Apr 5-May 2-Jun 30-Jun
2004 2005
0C
Figure 6: Temperature at 100m depth at Site C based on hourly time-series
Two Rocks Data Report 16
Salinity- SBE 3125 at 20m
Mooring A (31º 32.2S, 115º 33.5E, 20m deep)
34.5
35
35.5
36
36.5
1-Jul 29-Jul 26-Aug 23-Sep 21-Oct 18-Nov 16-Dec 13-Jan 10-Feb 10-Mar 7-Apr 5-May 2-Jun 30-Jun
2004 2005
psu
Figure 7: Salinity at 20m depth at Site A based on hourly time-series
Salinity- SBE 4534 at 10m
Mooring A (31º 32.2S, 115º 33.5E, 20m deep)
35
35.5
36
36.5
37
1-Jul 29-Jul 26-Aug 23-Sep 21-Oct 18-Nov 16-Dec 13-Jan 10-Feb 10-Mar 7-Apr 5-May 2-Jun 30-Jun
2004 2005
psu
Figure 8: Salinity at 10m depth at Site A based on hourly time-series

Two Rocks Data Report 17
Salinity- SBE 3050/3027 at 50m
Mooring C (31º 40.96S, 115º 13.3E, 100m deep)
35.25
35.5
35.75
36
1-Jul 29-Jul 26-Aug 23-Sep 21-Oct 18-Nov 16-Dec 13-Jan 10-Feb 10-Mar 7-Apr 5-May 2-Jun 30-Jun
2004 2005
psu
Figure 9: Salinity at 50m depth at Site C based on hourly time-series
Salinity- SBE 3050/3027 at 100m
Mooring C (31º 40.96S, 115º 13.3E, 100m deep)
35.25
35.5
35.75
36
1-Jul 29-Jul 26-Aug 23-Sep 21-Oct 18-Nov 16-Dec 13-Jan 10-Feb 10-Mar 7-Apr 5-May 2-Jun 30-Jun
2004 2005
psu
Figure 10: Salinity at 100m depth at Site C based on hourly time-series

Two Rocks Data Report 18
Salinity- SBE 4536 at 10m
Mooring C (31º 40.96S, 115º 13.3E, 100m deep)
35.25
35.5
35.75
36
1-Jul 29-Jul 26-Aug 23-Sep 21-Oct 18-Nov 16-Dec 13-Jan 10-Feb 10-Mar 7-Apr 5-May 2-Jun 30-Jun
2004 2005
psu
Figure 11: Salinity at 10m depth at Site C based on hourly time-series
Pressure
Mooring A (31º 32.2S, 115º 33.5E, 20m deep)
19.5
20
20.5
21
1-Jul 29-Jul 26-Aug 23-Sep 21-Oct 18-Nov 16-Dec 13-Jan 10-Feb 10-Mar 7-Apr 5-May 2-Jun 30-Jun
2004 2005
m
Figure 12: Pressure at the ocean bottom at Site A based on hourly time-series

Two Rocks Data Report 19
Pressure
Mooring C (31º 40.96S, 115º 13.3E, 100m deep)
102
102.5
103
103.5
104
1-Jul 29-Jul 26-Aug 23-Sep 21-Oct 18-Nov 16-Dec 13-Jan 10-Feb 10-Mar 7-Apr 5-May 2-Jun 30-Jun
2004 2005
m
Figure 13: Pressure at the ocean bottom at Site C based on hourly time-series
Depth-Averaged Long-shore Currents - AQD1036
Mooring A (31º 32.2S, 115 º 33.5E, 20m deep )
-0.6
-0.5
-0.4
-0.3
-0.2
-0.1
0
0.1
0.2
0.3
0.4
1-Jul 29-Jul 26-Aug 23-Sep 21-Oct 18-Nov 16-Dec 13-Jan 10-Feb 10-Mar 7-Apr 5-May 2-Jun 30-Jun
2004 2005
m/s
Figure 14: Depth-Averaged long-shore current at Site A based on hourly time-series

Two Rocks Data Report 20
Long-shore Current
Mooring B (31º 37.1S, 115º 21.9E, 40m) - AQD 1414
-0.4
-0.2
0
0.2
0.4
9-Feb 16-Feb 23-Feb 2-Mar 9-Mar 16-Mar 23-Mar 30-Mar 6-Apr 13-Apr
2005
m/s
28m
Figure 15: Long-shore current at 28m depth at Site B based on hourly time-series
24h Averaged Long-shore Bottom Stress vs Wind Stress - AQD1036
Correlation Coefficient 0.79
Mooring A (31º 32.2S, 115º 33.5E, 20m deep)
-0.4
-0.3
-0.2
-0.1
0
0.1
0.2
0.3
13-Oct 27-Oct 10-Nov 24-Nov 8-Dec 22-Dec 5-Jan 19-Jan
2004 2005
Nm-2
Bottom Stress
Wind Stress
Figure 16: 24hr-averaged long-shore quadratic bottom stress (based on depth averaged current) vs long-shore
wind stress at Site A from 13 Oct 2004 to 19 Jan 2005

Two Rocks Data Report 21
48 Hour-Averaged Residual Pressure vs Long-shore Wind Stress
Correlation Coefficient 0.71
Mooring A (31º 32.2S, 115º 33.5E, 20m deep)
-0.3
-0.2
-0.1
0
0.1
0.2
0.3
15-Oct 29-Oct 12-Nov 26-Nov 10-Dec 24-Dec 7-Jan
2004 2005
Residual Pressure (m)
Longshore Wind Stress (N/m-2)
Figure 17: 48hr-averaged residual pressure vs long-shore wind stress at Site A from 15 Oct 2004 to 19 Jan 2005
Figure 18: Monthly-averaged long-shore current profiles at Sites C and A
Long-shore Current Profiles
Mooring C (31º 40.96S, 115º 13.3E, 100m deep)
0
10
20
30
40
50
60
70
80
90
100
-0.25 -0.15 -0.05 0.05 0.15 0.25
southwards m/s northwards
dep
th (
m)
Jan
Feb
May
June
Aug
Sept
Oct
Long-shore Current Profiles
Mooring A (31º 32.2S, 115º 33.5E, 20m deep)
0
5
10
15
20
-0.15 -0.1 -0.05 0 0.05 0.1 0.15
southwards m/s northwards
Dep
th (
m)
Jan
April
May
June
July
Aug
Sept
Oct
Nov
Dec

Two Rocks Data Report 22
Longshore Current vs Wind Speed - AQD1036
Mooring A (31º 32.2S, 115º 33.5E, 20m deep)
-0.1
-0.05
0
0.05
0.1
0.15
0.2
Jan Feb Mar April May June July Aug Sept Oct Nov Dec
Surface Current (m/s)
3% Wind Speed
Figure 19: Long-shore current near the surface vs 3% of the long-shore component of wind speed at Site A.
Longshore Current vs Wind Speed - RDI3713/3712
Mooring C (31º 40.96S, 115º 13.3E, 100m deep)
-0.25
-0.2
-0.15
-0.1
-0.05
0
0.05
0.1
0.15
0.2
0.25
Jan Feb Mar April May June July Aug Sept Oct Nov Dec
m/s
Surface Current
3% Wind Speed
Figure 20: Long-shore current near the surface vs 3% of the long-shore component of wind speed at Site C
Two Rocks Data Report 23
Temperature Comparison - 24 hour averages
Moorings A, B, C
14
16
18
20
22
24
1-Jul 29-Jul 26-Aug 23-Sep 21-Oct 18-Nov 16-Dec 13-Jan 10-Feb 10-Mar 7-Apr 5-May 2-Jun 30-Jun
2004 2005
0C
A SBE 3125 (20m)
A SBE4534 (10m)
B SBE2972 (25m)
C 10 SBE4536 (10m)
C 50 SBE3027/3050 (100m)
C 100 SBE3027/3050 (50m)
Figure 21: Comparison of temperatures at all sites
Temperature - Monthly Averages
Moorings A, B, C
16
17
18
19
20
21
22
23
Jan Feb Mar April May June July Aug Sept Oct Nov Dec
0C
A (20m)
A (10m)
B (25m)
C (10m)
C (100m)
Figure22: Monthly-averaged temperatures from all sites

Two Rocks Data Report 24
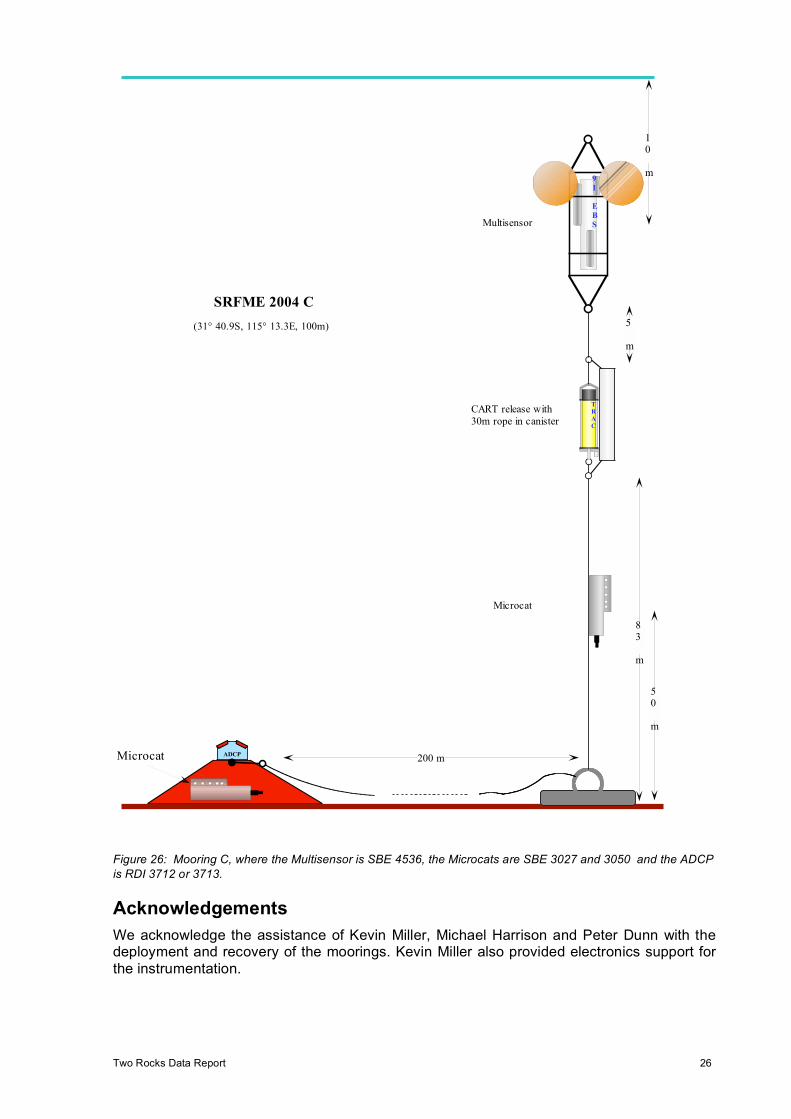
Mooring Design
The following three diagrams depict the basic mooring design for each of the moorings.
There were some variations on these for different deployments.
50 m
10 m
1
0
m
SRFME 2004 A
(No release)
Branker tide gauge
Seabird
tide gauge
Microcat
ADCP
Multisensor
(31° 32.2S, 115° 33.5E, 20m)
S
B
E
1
9
Figure 24: Mooring A, where the Multisensor is SBE 4534, Microcat is SBE 3125 and ADCP is AQD 1036. No
data was collected by the Branker tide gauge.

Two Rocks Data Report 25
ADCP80 m
20 m
SRFME 2004 B
Seabird
tide gauge
0.5 m
3 x 310mm
Plastic floats
Microcat
CART release with
30m rope in canister
20 m
(31° 37.1S, 115° 21.9E, 40m)
C
A
R
T
0.5 m
Figure 25: Mooring B, where the Microcat is SBE 2972 and ADCP is RDI 3712 (no data due to failure) and RDI
3713. No data was collected by the Seabird tide gauge.
Two Rocks Data Report 26
ADCP200 m
50 m
SRFME 2004 C
Microcat
Microcat
CART release with
30m rope in canister
10 m
5 m
Multisensor S
B
E
1
9
C
A
R
T
83 m
(31° 40.9S, 115° 13.3E, 100m)
Figure 26: Mooring C, where the Multisensor is SBE 4536, the Microcats are SBE 3027 and 3050 and the ADCP
is RDI 3712 or 3713.
Acknowledgements
We acknowledge the assistance of Kevin Miller, Michael Harrison and Peter Dunn with the deployment and recovery of the moorings. Kevin Miller also provided electronics support for
the instrumentation.
Related Documents