Eur. J. Immunol. 1989.19: 285-292 Franco Calabi', John M. Jarvis, Luis Martinm and Cesar Milstein Medical Research Council Laboratory of Molecular Biology, Cambridge Human CD1 genes 285 Two classes of CD1 genes Herein, we report the.DNA sequence of two human CD1 genes, R2 and R3, distinct from those encoding the CDla, -b and -c antigens. Both genes appear to have an exodintron structure analogous to the previously analyzed CD1 genes and to be functional on the basis of their sequence. Analysis of the variability patterns, poten- tial intramolecular interactions and predicted secondary structure profile on an align- ment of all known CD1 a chains suggest some shared structural features with major histocompatibility complex class I molecules in the a1 domains but substantial differ- ences in the a 2 domains. Sequence comparison shows that, while R2 is most related to CDla, -b and -c, albeit to a somewhat lower degree than the latter are to themselves, R3 is more homologous to mouse than to human CD1, suggesting the existence of two functional classes within the CD1 gene family. We propose to retain the non-commit- tal R2 and R3 names until the putative antigens have been identified and their tissue distribution has been established. 1 Introduction CD1 are a somewhat enigmatic family of major histocompati- bility complex (MHC)-related molecules. They were originally described in man and thought to be the human homologues of the mouse TL antigens [l, 21. However, this idea has been disputed by the recent findings that the CD1 genes map out- side the MHC both in man and in mouse [3, 41 and, although clearly related to both MHC class I a and class I1 fl chains, do not share any specific sequence homology with Tla [5, 61. In order to more fully characterize the CD1 family and facili- tate future studies of their function and regulation, we have cloned and characterized the human CD1 genes. Five genes have been found, of which three have been identified through the use of DNA transfection assays as encoding the serologi- cally defined CDla, -b and -c antigens [7]. This leaves two genes without a known product. As a first step in the study of such genes, we have determined their sequences, which are the subject of the present report. These were compared to the other known human and mouse sequences as well as to MHC molecules in order to gain some insight into CD1 overall struc- ture and possible function. 2 Materials and methods 2.1 DNA sequencing The isolation of h genomic clones R3G1, R2G4 and cDNA clone FCCl has been previously described [6, 81. The follow- ing fragments were subcloned from the h clones into pUC for sequencing (Fig. 1). (a) From R3G1, a 3.8-kbp HindIII-XbaI and an overlapping 3.2-kbp EcoRI fragment; (b) from R2G4, [I 71851 Present address: Institute for Biotechnology Research, 6100 Royal Mount Avenue, Montreal, Quebec, Canada, H4P 2R2. Supported by the Wellcome Trust. + Supported by a special fellowship from the Leukemia Society of America. Correspondence: Cesar Milstein, Medical Research Council Labora- tory of Molecular Biology, Hills Road, Cambridge, CB22QH, GB Abbreviation: MHC: Major histocompatibility complex 0 VCH Verlagsgesellschaft mbH, D-6940 Weinheim, 1989 a 6.1-kbp Hind111 fragment, a 3.1-kbp Sac1 fragment and a 2.6-kbp Eco RI fragment which overlapped with the other two, and (c) from FCCl, the whole 1.5-kbp insert. DNA was sequenced by the chain termination procedure in conjunction with shotgun cloning [9]. Shotgun libraries were prepared in the SmaI site of either TG130 (R3G1 and R2G4) or M13mpll (FCCl). Sequences were aligned using the MULTALIGN program [ 101. Percent sequence homologies were determined using the TWOB program (R. Staden, unpublished). 2.2 Determination of observed and expected frequencies of non-synonymous nucleotide changes The principle of this analysis was essentially as described [ll] and relies on the assumption that each nucleotide difference between two evolutionary related sequences is the result of an individual mutational event, and that the frequency of such an event is sufficiently low that multiple events at the same posi- tion can be disregarded. In each sequence, every nucleotide position received a poten- tially non-synonymous site score of 1, 213 or 113 depending on the number of substitutions which would result in an amino acid change. The sum of the scores over the whole sequence gave the total number of potentially non-synonymous sites. When comparing two sequences relative to each other, each nucleotide difference was classified as either fully non-synony- mous (when the different nucleotide resulted in an amino acid change in both sequences) or half non-synonymous (when the different nucleotide resulted in an amino acid change in only one of the sequences). The total number of observed non- synonymous differences was then compared to that expected on a purely random basis, presumably in the absence of selec- tion. The average number of random non-synonymous differ- ences should be equal to nR with a standard deviation of qm, where n is the total number of observed changes (synonymous plus non-synonymous) and R the fraction of total sites which are potentially non-synonymous averaged over the two sequences compared. 2.3 Structural predictions on CD1 For the calculation of variability, two parameters were simul- taneously used: the conservation number, Ci, based on the 00 14-2980/89/0202-0285 $02.50/0

Welcome message from author
This document is posted to help you gain knowledge. Please leave a comment to let me know what you think about it! Share it to your friends and learn new things together.
Transcript
Eur. J. Immunol. 1989.19: 285-292
Franco Calabi', John M. Jarvis, Luis Martinm and Cesar Milstein
Medical Research Council Laboratory of Molecular Biology, Cambridge
Human CD1 genes 285
Two classes of CD1 genes
Herein, we report the.DNA sequence of two human CD1 genes, R2 and R3, distinct from those encoding the CDla, -b and -c antigens. Both genes appear to have an exodintron structure analogous to the previously analyzed CD1 genes and to be functional on the basis of their sequence. Analysis of the variability patterns, poten- tial intramolecular interactions and predicted secondary structure profile on an align- ment of all known CD1 a chains suggest some shared structural features with major histocompatibility complex class I molecules in the a1 domains but substantial differ- ences in the a2 domains. Sequence comparison shows that, while R2 is most related to CDla, -b and -c, albeit to a somewhat lower degree than the latter are to themselves, R3 is more homologous to mouse than to human CD1, suggesting the existence of two functional classes within the CD1 gene family. We propose to retain the non-commit- tal R2 and R3 names until the putative antigens have been identified and their tissue distribution has been established.
1 Introduction
CD1 are a somewhat enigmatic family of major histocompati- bility complex (MHC)-related molecules. They were originally described in man and thought to be the human homologues of the mouse TL antigens [ l , 21. However, this idea has been disputed by the recent findings that the CD1 genes map out- side the MHC both in man and in mouse [3, 41 and, although clearly related to both MHC class I a and class I1 fl chains, do not share any specific sequence homology with Tla [5 , 61.
In order to more fully characterize the CD1 family and facili- tate future studies of their function and regulation, we have cloned and characterized the human CD1 genes. Five genes have been found, of which three have been identified through the use of DNA transfection assays as encoding the serologi- cally defined CDla, -b and -c antigens [7]. This leaves two genes without a known product. As a first step in the study of such genes, we have determined their sequences, which are the subject of the present report. These were compared to the other known human and mouse sequences as well as to MHC molecules in order to gain some insight into CD1 overall struc- ture and possible function.
2 Materials and methods
2.1 DNA sequencing
The isolation of h genomic clones R3G1, R2G4 and cDNA clone FCCl has been previously described [6, 81. The follow- ing fragments were subcloned from the h clones into pUC for sequencing (Fig. 1). (a) From R3G1, a 3.8-kbp HindIII-XbaI and an overlapping 3.2-kbp EcoRI fragment; (b) from R2G4,
[I 71851
Present address: Institute for Biotechnology Research, 6100 Royal Mount Avenue, Montreal, Quebec, Canada, H4P 2R2. Supported by the Wellcome Trust.
+ Supported by a special fellowship from the Leukemia Society of America.
Correspondence: Cesar Milstein, Medical Research Council Labora- tory of Molecular Biology, Hills Road, Cambridge, CB22QH, GB
Abbreviation: MHC: Major histocompatibility complex
0 VCH Verlagsgesellschaft mbH, D-6940 Weinheim, 1989
a 6.1-kbp Hind111 fragment, a 3.1-kbp Sac1 fragment and a 2.6-kbp Eco RI fragment which overlapped with the other two, and (c) from FCCl, the whole 1.5-kbp insert. DNA was sequenced by the chain termination procedure in conjunction with shotgun cloning [9]. Shotgun libraries were prepared in the SmaI site of either TG130 (R3G1 and R2G4) or M13mpll (FCCl). Sequences were aligned using the MULTALIGN program [ 101. Percent sequence homologies were determined using the TWOB program (R. Staden, unpublished).
2.2 Determination of observed and expected frequencies of non-synonymous nucleotide changes
The principle of this analysis was essentially as described [ l l ] and relies on the assumption that each nucleotide difference between two evolutionary related sequences is the result of an individual mutational event, and that the frequency of such an event is sufficiently low that multiple events at the same posi- tion can be disregarded.
In each sequence, every nucleotide position received a poten- tially non-synonymous site score of 1, 213 or 113 depending on the number of substitutions which would result in an amino acid change. The sum of the scores over the whole sequence gave the total number of potentially non-synonymous sites. When comparing two sequences relative to each other, each nucleotide difference was classified as either fully non-synony- mous (when the different nucleotide resulted in an amino acid change in both sequences) or half non-synonymous (when the different nucleotide resulted in an amino acid change in only one of the sequences). The total number of observed non- synonymous differences was then compared to that expected on a purely random basis, presumably in the absence of selec- tion. The average number of random non-synonymous differ- ences should be equal to nR with a standard deviation of q m , where n is the total number of observed changes (synonymous plus non-synonymous) and R the fraction of total sites which are potentially non-synonymous averaged over the two sequences compared.
2.3 Structural predictions on CD1
For the calculation of variability, two parameters were simul- taneously used: the conservation number, Ci, based on the
00 14-2980/89/0202-0285 $02.50/0
286 F. Calabi, J. M. Jarvis, L. Martin and C. Milstein
chemical properties of the amino acids [12], and the variability index (Vi) [13]. Positions were regarded as conserved whenever Ci > 0.7 and Vi < 4 or Ci > 0.5 and Vi < 3. Positions were regarded as variable when Ci<3 and Vi>6 or Ci<4 and Vi > 8.
9389 7974 9185 8277 8378 9388 7975 9289 82 78 8380 93 87
7871 77 70 7871 8073 8377 8478 9285
9999 8377 84 78 _ _ _ ~ . ~ _ _ _ ~ _ -
In the case of MHC molecules, variability was calculated on a set of 32 complete sequences derived from EMBL protein and DNA databanks. They are: HLA-A2, A3, A l l , A24, A28, A32, Aw68, Aw69, B7, B27, B40, B44, Bw58, Cwl, Cw2, Cw3, Cw4, H-2Kb, H-2Kd, H-2Kk, H-2Db, H-2Dd, H-2P, H- 2Ld, H-2Q7b, H-2Q7d, H-2Q8b, H-2Q9b, H-2Q10b, H-2Tlaa, H-2Tlab and H-2TlaC.
For secondary structure prediction, the Robson algorithm [14] was applied to each individual CD1 sequence and the values corresponding to the four different parameters at each posi- tion were averaged over all sequences. The secondary struc- ture prediction was improved by subtracting from the aver- aged helical and extended conformation values the correction factor [Csi-C,,] X 150, where Csi is the smoothed conservation number, C, the average conservation number and 150 an empirical constant [ 121.
3 Results
3.1 Sequences of R2 and R3 CD1 genes
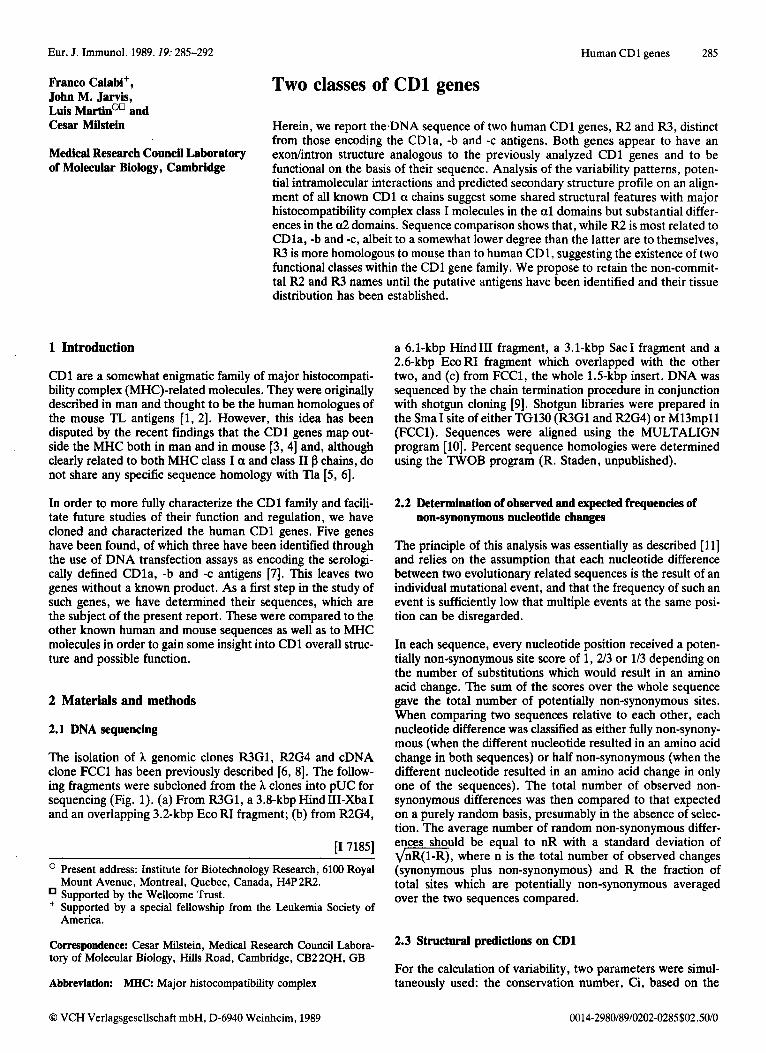
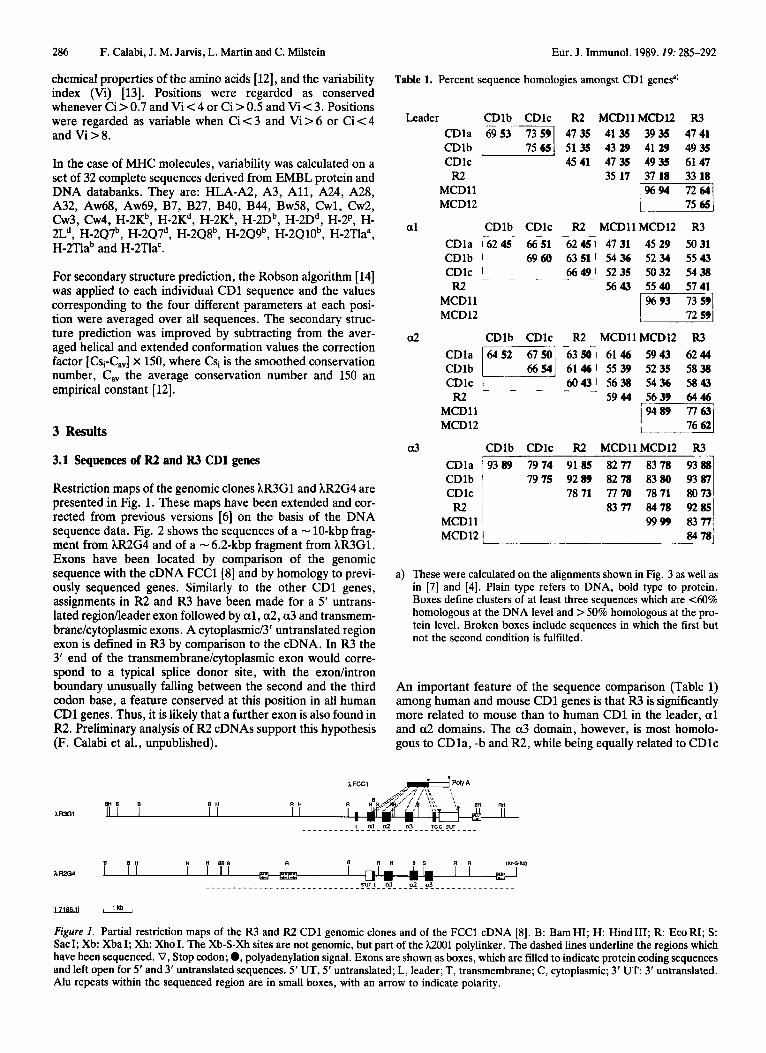
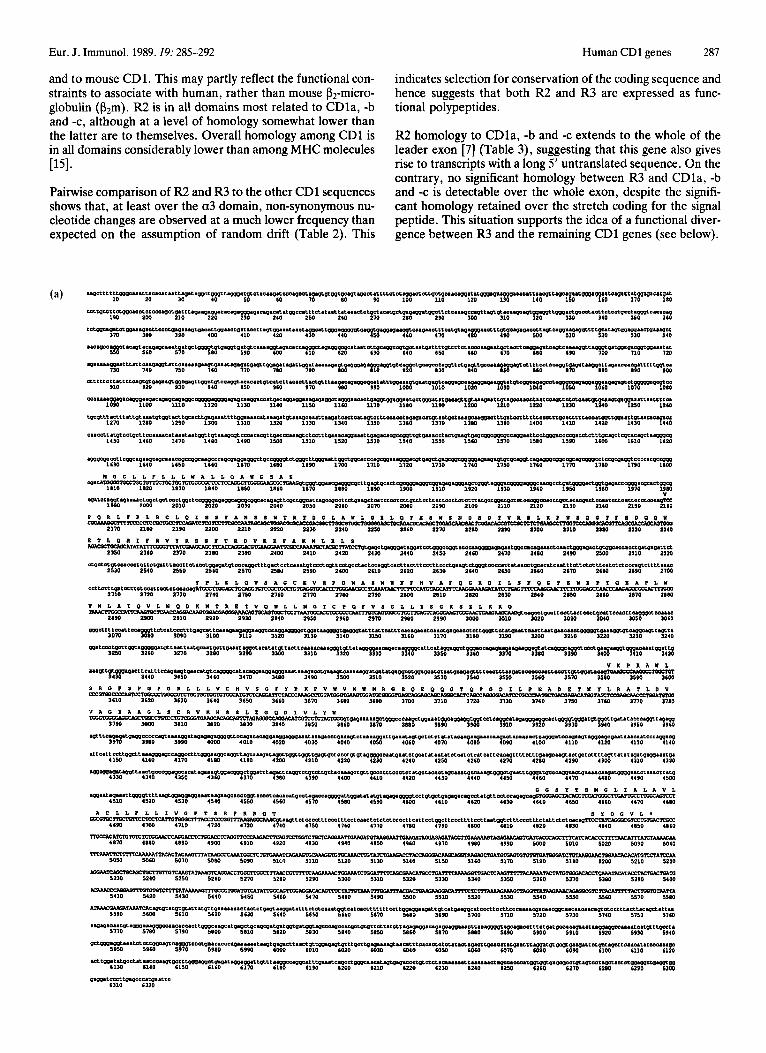
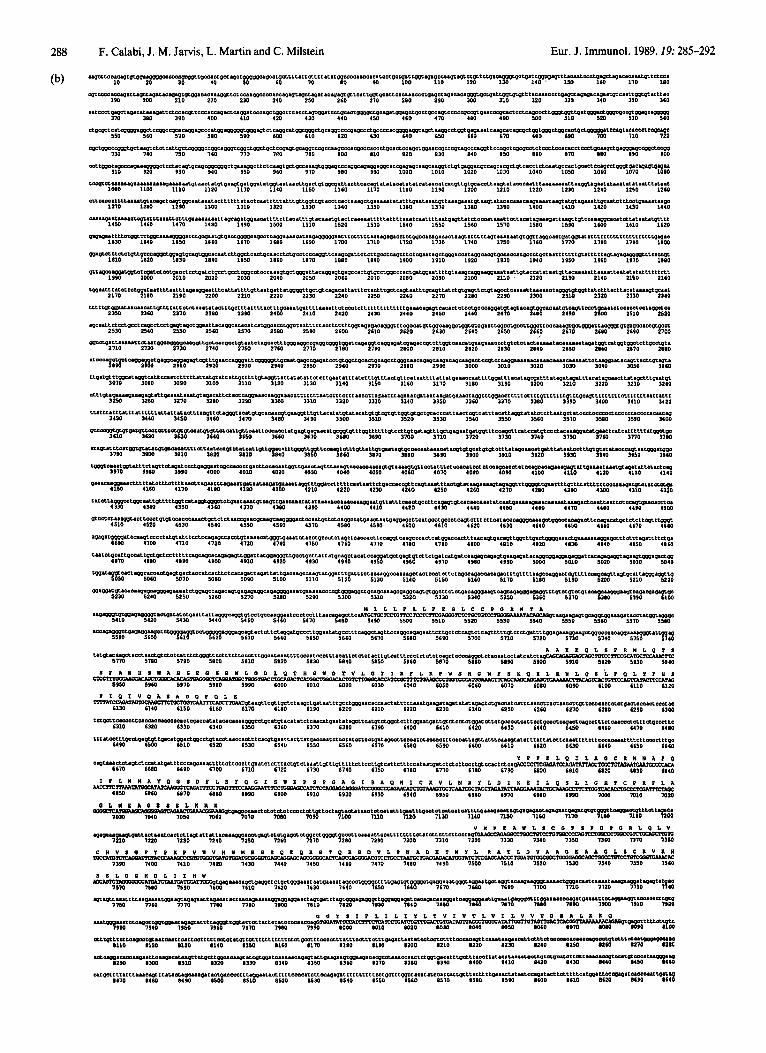
Restriction maps of the genomic clones hR3G1 and hR2G4 are presented in Fig. 1. These maps have been extended and cor- rected from previous versions [6] on the basis of the DNA sequence data. Fig. 2 shows the sequences of a - 10-kbp frag- ment from hR2G4 and of a - 6.2-kbp fragment from kR3Gl. Exons have been located by comparison of the genomic sequence with the cDNA FCCl[8] and by homology to previ- ously sequenced genes. Similarly to the other CD1 genes, assignments in R2 and R3 have been made for a 5' untrans- lated regionlleader exon followed by a l , a2, a 3 and transmem- branekytoplasmic exons. A cytoplasmic/3' untranslated region exon is defined in R3 by comparison to the cDNA. In R3 the 3' end of the transmembranekytoplasmic exon would corre- spond to a typical splice donor site, with the exodintron boundary unusually falling between the second and the third codon base, a feature conserved at this position in all human CD1 genes. Thus, it is likely that a further exon is also found in R2. Preliminary analysis of R2 cDNAs support this hypothesis (F. Calabi et al., unpublished).
Eur. J. Immunol. 1989.19: 285-292
Table 1. Percent sequence homologies amongst CDl genesa)
Leader CDlb CDlc R2 MCDllMCDl2 R3
a 1
a2
a3
CDla 6953 73 59 4735 41 35 3935 4741 CDlb 11 51 35 43 29 41 29 4935 CDlc 4541 47 35 4935 61 47 R2 35 17 37 18 33 18
I""] MCDll MCD12
CDlb CDlc R2 MCDllMCDl2 R3 CDla 76245 66-51 26246 4731 4529 5031 CDlb I 6960 63 51 I 54 36 5234 55 43
6649) 52 35 5032 54 38 CDlc R2 5643 5540 5741
MCDll MCDl2
- _ -
CDla /w CDlb CDlc I R2
MCDll MCD12
- -
CDlb
CDlc R2 MCDllMCD12 R3 2 3 SO? 61 46 5943 6244 61 46 I 55 39 5235 5838 60431 5638 5436 5843
5944 5639 6446 - - _
CDlc R2 MCDllMCDl2 R3 CDla CDlb CDlc R2
MCDll MCDlZ
a) These were calculated on the alignments shown in Fig. 3 as well as in [7] and [4]. Plain type refers to DNA, bold type to protein. Boxes define clusters of at least three sequences which are 4 0 % homologous at the DNA level and > 50% homologous at the pro- tein level. Broken boxes include sequences in which the first but not the second condition is fulfilled.
An important feature of the sequence comparison (Table 1) among human and mouse CD1 genes is that R3 is significantly more related to mouse than to human CD1 in the leader, a1 and a2 domains. The a3 domain, however, is most homolo- gous to CDla, -b and R2, while being equally related to CDlc
AFCCl ..:-- ..~ i ~ . .. . . . . . . . . . . . . . . . . . . . . . . > .. . . . . . . . B H
A m 1
B B H H H B B B A B R H B S R R WSQI AR2G4 I= I I mm
w SUTL 111 02 a3 __._._____._____________________________--------.-.-...---
mm A
Figure 1. Partial restriction maps of the R3 and R2 CDl genomic clones and of the FCCl cDNA [8 ] . B: BamHI; H: HindIII; R: EcoRI; S: SacI; Xb: XbaI; Xh: Xho I. The Xb-S-Xh sites are not genomic, but part of the h2001 polylinker. The dashed lines underline the regions which have been sequenced. V, Stop codon; 0, polyadenylation signal. Exons are shown as boxes, which are filled to indicate protein coding sequences and left open for 5' and 3' untranslated sequences. 5' UT, 5' untranslated; L, leader; T, transmembrane; C, cytoplasmic; 3' U T 3' untranslated. Alu repeats within the sequenced region are in small boxes, with an arrow to indicate polarity.
Eur. J. Immunol. 1989.19: 285-292
and to mouse CD1. This may partly reflect the functional con- straints to associate with human, rather than mouse P2-micro- globulin (P2m). R2 is in all domains most related to CDla, -b and -c, although at a level of homology somewhat lower than the latter are to themselves. Overall homology among CD1 is in all domains considerably lower than among MHC molecules ~ 5 1 .
Pairwise comparison of R2 and R3 to the other CD1 sequences shows that, at least over the a3 domain, non-synonymous nu- cleotide changes are observed at a much lower frequency than expected on the assumption of random drift (Table 2). This
Human CD1 genes 287
indicates selection for conservation of the coding sequence and hence suggests that both R2 and R3 are expressed as func- tional polypeptides.
R2 homology to CDla, -b and -c extends to the whole of the leader exon [7] (Table 3), suggesting that this gene also gives rise to transcripts with a long 5' untranslated sequence. On the contrary, no significant homology between R3 and CDla, -b and -c is detectable over the whole exon, despite the signifi- cant homology retained over the stretch coding for the signal peptide. This situation supports the idea of a functional diver- gence between R3 and the remaining CD1 genes (see below).
288 F. Calabi, J. M. Jarvis, L. Martin and C. Milstein Eur. J. Immunol. 1989.19: 285-292
Eur. J . Immunol. 1989.19: 285-292 Human CD1 genes 289
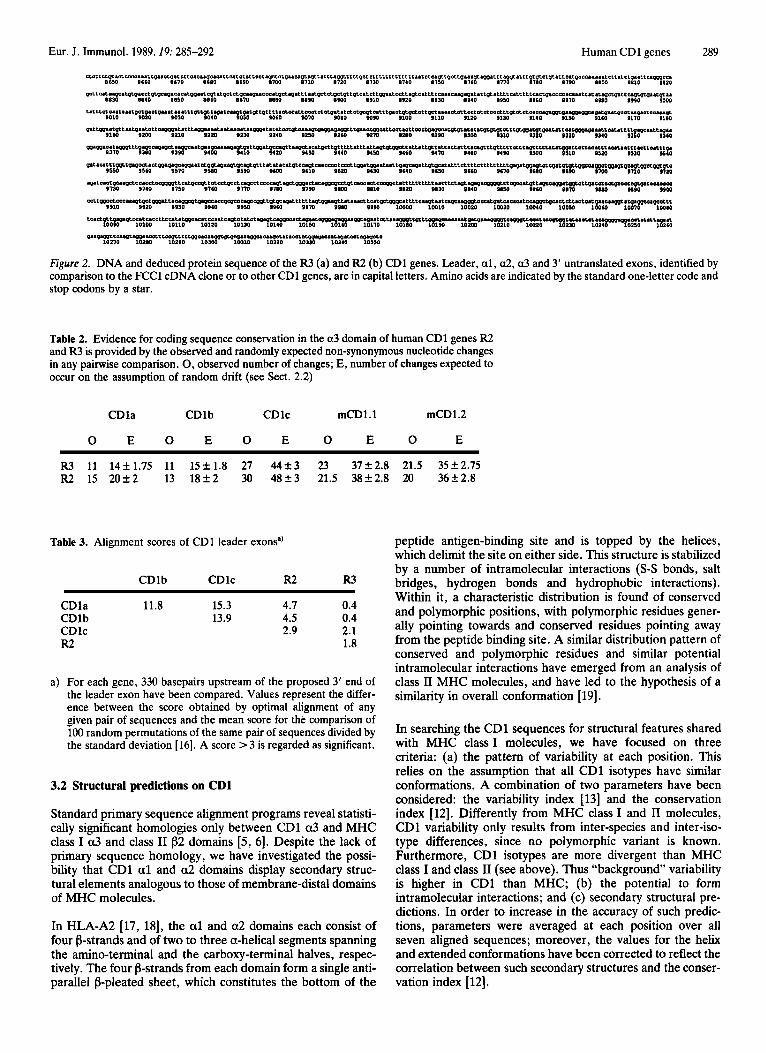
Table 2. Evidence for coding sequence conservation in the a3 domain of human CD1 genes R2 and R3 is provided by the observed and randomly expected non-synonymous nucleotide changes in any pairwise comparison. 0, observed number of changes; E, number of changes expected to occur on the assumption of random drift (see Sect. 2.2)
CDla CDlb CDlc mCDl.1 mCD1.2
O E O E O E 0 E 0 E
R3 11 14f1.75 11 15k1.8 27 4 4 k 3 23 37k2.8 21.5 35k2.75 R2 15 2 0 f 2 13 1 8 f 2 30 4 8 f 3 21.5 38f2 .8 20 36f2 .8
Table 3. Alignment scores of CD1 leader exonsa)
CDlb CDlc R2 R3
CDla 11.8 15.3 4.7 0.4 CDlb 13.9 4.5 0.4 CDlc 2.9 2.1 R2 1.8
a) For each gene, 330 basepairs upstream of the proposed 3' end of the leader exon have been compared. Values represent the differ- ence between the score obtained by optimal alignment of any given pair of sequences and the mean score for the comparison of 100 random permutations of the same pair of sequences divided by the standard deviation [16]. A score > 3 is regarded as significant.
3.2 Structural predictions on CDl
Standard primary sequence alignment programs reveal statisti- cally significant homologies only between CD1 a3 and MHC class I a3 and class I1 f32 domains [S, 61. Despite the lack of primary sequence homology, we have investigated the possi- bility that CD1 a1 and a2 domains display secondary struc- tural elements analogous to those of membrane-distal domains of MHC molecules.
In HLA-A2 [17, 181, the a1 and a2 domains each consist of four f3-strands and of two to three a-helical segments spanning the amino-terminal and the carboxy-terminal halves, respec- tively. The four f3-strands from each domain form a single anti- parallel f3-pleated sheet, which constitutes the bottom of the
peptide antigen-binding site and is topped by the helices, which delimit the site on either side. This structure is stabilized by a number of intramolecular interactions (S-S bonds, salt bridges, hydrogen bonds and hydrophobic interactions). Within it, a characteristic distribution is found of conserved and polymorphic positions, with polymorphic residues gener- ally pointing towards and conserved residues pointing away from the peptide binding site. A similar distribution pattern of conserved and polymorphic residues and similar potential intramolecular interactions have emerged from an analysis of class I1 MHC molecules, and have led to the hypothesis of a similarity in overall conformation [19].
In searching the CD1 sequences for structural features shared with MHC class I molecules, we have focused on three criteria: (a) the pattern of variability at each position. This relies on the assumption that all CD1 isotypes have similar conformations. A combination of two parameters have been considered: the variability index [ 131 and the conservation index [12]. Differently from MHC class I and I1 molecules, CD1 variability only results from inter-species and inter-iso- type differences, since no polymorphic variant is known. Furthermore, CD1 isotypes are more divergent than MHC class I and class TI (see above). Thus "background" variability is higher in CD1 than MHC; (b) the potential to form intramolecular interactions; and (c) secondary structural pre- dictions. In order to increase in the accuracy of such predic- tions, parameters were averaged at each position over all seven aligned sequences; moreover, the values for the helix and extended conformations have been corrected to reflect the correlation between such secondary structures and the conser- vation index [12].
290 F. Calabi, J. M. Jarvis, L. Martin and C. Milstein Eur. J . Immunol. 1989.19: 285-292
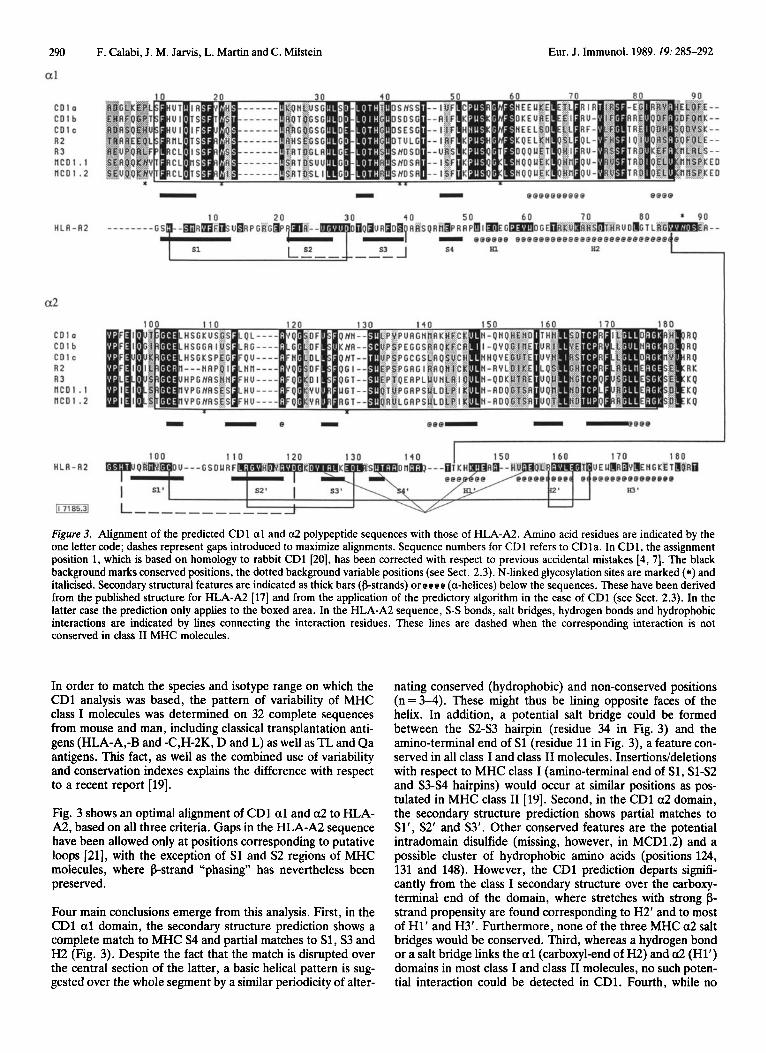
Figure 3. Alignment of the predicted CD1 a1 and a2 polypeptide sequences with those of HLA-A2. Amino acid residues are indicated by the one letter code; dashes represent gaps introduced to maximize alignments. Sequence numbers for CD1 refers to CDla. In CD1, the assignment position 1, which is based on homology to rabbit CD1 [20], has been corrected with respect to previous accidental mistakes [4,7]. The black background marks conserved positions, the dotted background variable positions (see Sect. 2.3). N-linked glycosylation sites are marked (*) and italicised. Secondary structural features are indicated as thick bars @strands) or ccce (a-helices) below the sequences. These have been derived from the published structure for HLA-A2 [17] and from the application of the predictory algorithm in the case of CD1 (see Sect. 2.3). In the latter case the prediction only applies to the boxed area. In the HLA-A2 sequence, S-S bonds, salt bridges, hydrogen bonds and hydrophobic interactions are indicated by lines connecting the interaction residues. These lines are dashed when the corresponding interaction is not conserved in class I1 MHC molecules.
In order to match the species and isotype range on which the CDl analysis was based, the pattern of variability of MHC class I molecules was determined on 32 complete sequences from mouse and man, including classical transplantation anti- gens (HLA-A,-B and -C,H-2K, D and L) as well as TL and Qa antigens. This fact, as well as the combined use of variability and conservation indexes explains the difference with respect to a recent report [19].
Fig. 3 shows an optimal alignment of CDl a1 and a2 to HLA- A2, based on all three criteria. Gaps in the HLA-A2 sequence have been allowed only at positions corresponding to putative loops [21], with the exception of S1 and S2 regions of MHC molecules, where b-strand “phasing” has nevertheless been preserved.
Four main conclusions emerge from this analysis. First, in the CD1 a1 domain, the secondary structure prediction shows a complete match to MHC S4 and partial matches to S1, S3 and H2 (Fig. 3). Despite the fact that the match is disrupted over the central section of the latter, a basic helical pattern is sug- gested over the whole segment by a similar periodicity of alter-
nating conserved (hydrophobic) and non-conserved positions (n=3-4). These might thus be lining opposite faces of the helix. In addition, a potential salt bridge could be formed between the S2-S3 hairpin (residue 34 in Fig. 3) and the amino-terminal end of S1 (residue 11 in Fig. 3), a feature con- served in all class I and class I1 molecules. Insertions/deletions with respect to MHC class I (amino-terminal end of S1, Sl-S2 and S3-S4 hairpins) would occur at similar positions as pos- tulated in MHC class I1 [19]. Second, in the CD1 a2 domain, the secondary structure prediction shows partial matches to Sl’, S2‘ and S3’. Other conserved features are the potential intradomain disulfide (missing, however, in MCD1.2) and a possible cluster of hydrophobic amino acids (positions 124, 131 and 148). However, the CD1 prediction departs signifi- cantly from the class I secondary structure over the carboxy- terminal end of the domain, where stretches with strong b- strand propensity are found corresponding to H2’ and to most of H1’ and H3’. Furthermore, none of the three MHC a2 salt bridges would be conserved. Third, whereas a hydrogen bond or a salt bridge links the a1 (carboxyl-end of H2) and a2 (Hl’) domains in most class I and class I1 molecules, no such poten- tial interaction could be detected in CD1. Fourth, while no
Eur. J. Immunol. 1989.19: 285-292 Human CD1 genes 291
CD1 has a potential N-glycosylation site matching the con- served site in MHC class I molecules (at the carboxyl end of H2), the single conserved site in CD1 is found at a position equivalent to that of the conserved site in MHC class I1 p1 domains. All other potential CD1 N-glycosylation sites would be accessible to solvent.
4 Discussion
Both R3 and R2 CD1 genes appear to be functional. Both are transcribed and at least a proportion of the transcripts are correctly spliced ([8] and F. Calabi et al., unpublished). Fur- thermore, the extent of coding sequence conservation, at least over the a3 exons, strongly suggests that they are translated into functional polypeptides. Such polypeptides would be expected to be associated with &m, but need not be expressed in a CD1-like pattern. Experiments are in progress to raise antibodies against the predicted protein sequences. Until this is achieved and the tissue distribution of the antigens is estab- lished, we consider it premature to assign them to a CD nomenclature.
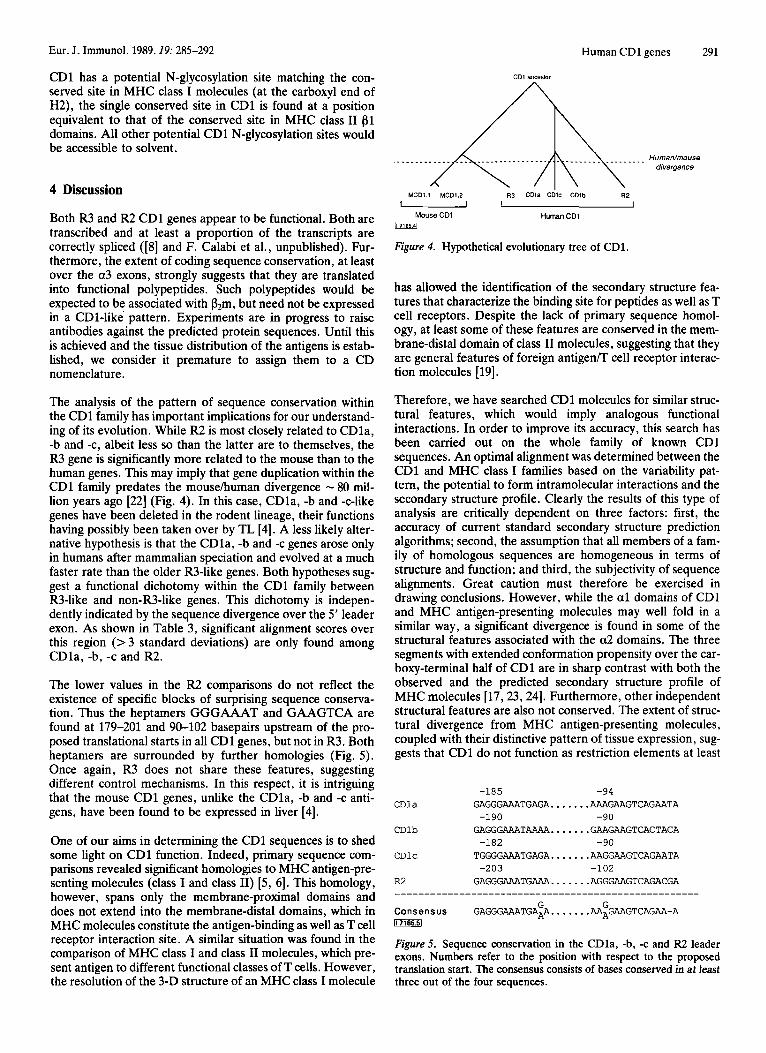
The analysis of the pattern of sequence conservation within the CD1 family has important implications for our understand- ing of its evolution. While R2 is most closely related to CDla, -b and -c, albeit less so than the latter are to themselves, the R3 gene is significantly more related to the mouse than to the human genes. This may imply that gene duplication within the CD1 family predates the mouse/human divergence - 80 mil- lion years ago [22] (Fig. 4). In this case, CDla, -b and -c-like genes have been deleted in the rodent lineage, their functions having possibly been taken over by TL [4]. A less likely alter- native hypothesis is that the CDla, -b and -c genes arose only in humans after mammalian speciation and evolved at a much faster rate than the older R3-like genes. Both hypotheses sug- gest a functional dichotomy within the CD1 family between R3-like and non-R3-like genes. This dichotomy is indepen- dently indicated by the sequence divergence over the 5' leader exon. As shown in Table 3, significant alignment scores over this region (>3 standard deviations) are only found among CDla, -b, -c and R2.
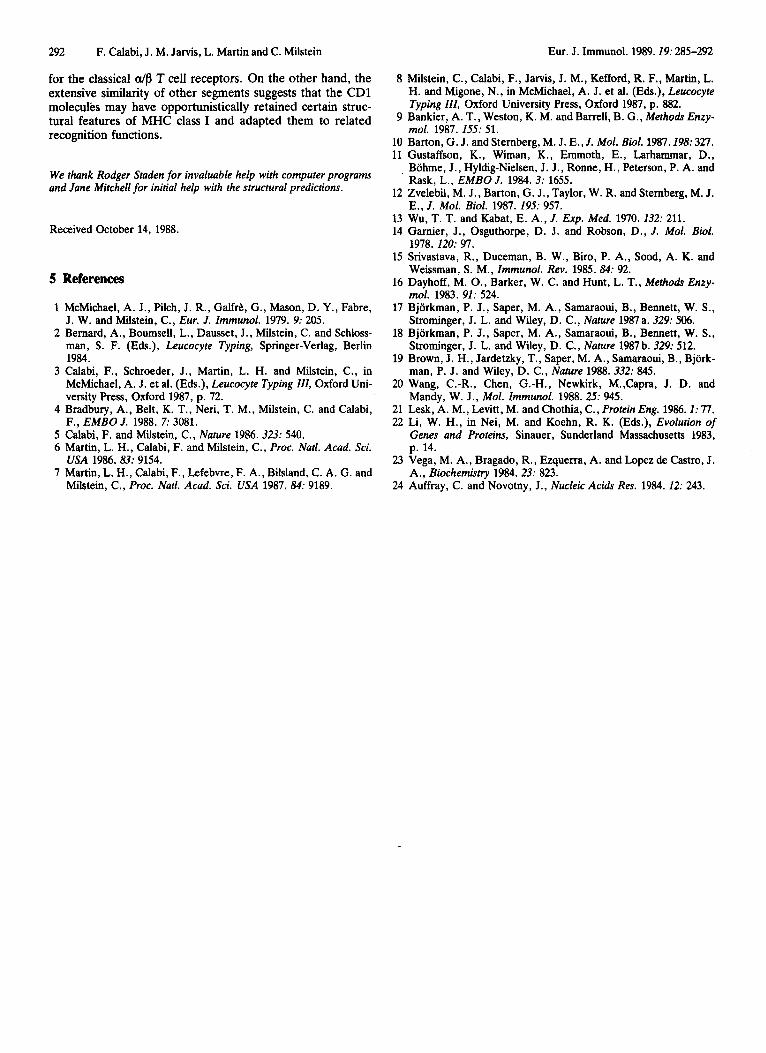
The lower values in the R2 comparisons do not reflect the existence of specific blocks of surprising sequence conserva- tion. Thus the heptamers GGGAAAT and GAAGTCA are found at 179-201 and 90-102 basepairs upstream of the pro- posed translational starts in all CD1 genes, but not in R3. Both heptamers are surrounded by further homologies (Fig. 5). Once again, R3 does not share these features, suggesting different control mechanisms. In this respect, it is intriguing that the mouse CD1 genes, unlike the CDla, -b and -c anti- gens, have been found to be expressed in liver [4].
One of our aims in determining the CD1 sequences is to shed some light on CD1 function. Indeed, primary sequence com- parisons revealed significant homologies to MHC antigen-pre- senting molecules (class I and class 11) [5, 61. This homology, however, spans only the membrane-proximal domains and does not extend into the membrane-distal domains, which in MHC molecules constitute the antigen-binding as well as T cell receptor interaction site. A similar situation was found in the comparison of MHC class I and class I1 molecules, which pre- sent antigen to different functional classes of T cells. However, the resolution of the 3-D structure of an MHC class I molecule
Homan/mouse divergence
MCD1.l MCDI.2 R3 CDla CDIC CDlb R 2 u I I
Mouse CDI Human CDI m
Figure 4. Hypothetical evolutionary tree of CD1.
has allowed the identification of the secondary structure fea- tures that characterize the binding site for peptides as well as T cell receptors. Despite the lack of primary sequence homol- ogy, at least some of these features are conserved in the mem- brane-distal domain of class I1 molecules, suggesting that they are general features of foreign antigenm cell receptor interac- tion molecules [19].
Therefore, we have searched CD1 molecules for similar struc- tural features, which would imply analogous functional interactions. In order to improve its accuracy, this search has been carried out on the whole family of known CD1 sequences. An optimal alignment was determined between the CD1 and MHC class I families based on the variability pat- tern, the potential to form intramolecular interactions and the secondary structure profile. Clearly the results of this type of analysis are critically dependent on three factors: first, the accuracy of current standard secondary structure prediction algorithms; second, the assumption that all members of a fam- ily of homologous sequences are homogeneous in terms of structure and function; and third, the subjectivity of sequence alignments. Great caution must therefore be exercised in drawing conclusions. However, while the a1 domains of CD1 and MHC antigen-presenting molecules may well fold in a similar way, a significant divergence is found in some of the structural features associated with the a2 domains. The three segments with extended conformation propensity over the car- boxy-terminal half of CD1 are in sharp contrast with both the observed and the predicted secondary structure profile of MHC molecules [17,23,24]. Furthermore, other independent structural features are also not conserved. The extent of struc- tural divergence from MHC antigen-presenting molecules, coupled with their distinctive pattern of tissue expression, sug- gests that CD1 do not function as restriction elements at least
-185 -94
-190 -90
-182 -90
-203 -102
CDla GAGGGAAATGAGA.......AA?GAAGTCAGAATA
CDlb GAGGGAAAT AAAA....... GAAGAAGTCACTACA
CDlc TGGGGAAATGAGA. ...... AAGGAAGTCAGAATA R2 GAGGGAAATG AAA....... AGGGAAGTCAGACGA
G G Consensus GAGGGAAATGAAA ....... AAAGAAGTCAGAA-A
Figure 5 . Sequence conservation in the CDla, -b, -c and R2 leader exons. Numbers refer to the position with respect to the proposed translation start. The consensus consists of bases conserved in at least three out of the four sequences.
292 F. Calabi, J. M. Jarvis, L. Martin and C. Milstein
for the classical dB T cell receptors. On the other hand, the extensive similarity of other segments suggests that the CD1 molecules may have opportunistically retained certain struc- tural features of h4HC class I and adapted them to related recognition functions.
Eur. J. Immunol. 1989.19: 285-292
We thank Rodger Staden for invaluable help with computer programs and Jane Mitchell for initial help with the structural predictions.
Received October 14, 1988.
5 References
1 McMichael, A. J., Pilch, J. R., Galfrk, G., Mason, D. Y., Fabre, J. W. and Milstein, C., Eur. J . Immunol. 1979. 9: 205.
2 Bernard, A., Boumsell, L., Dausset, J., Milstein, C. and Schloss- man, S. F. (Eds.), Leucocyte Typing, Springer-Verlag, Berlin 1984.
3 Calabi, F., Schroeder, J., Martin, L. H. and Milstein, C., in McMichael, A. J. et al. (Eds.), Leucocyte Typing Ill, Oxford Uni- versity Press, Oxford 1987, p. 72.
4 Bradbury, A., Belt, K. T., Neri, T. M., Milstein, C. and Calabi, F., EMBO J . 1988. 7: 3081.
5 Calabi, F. and Milstein, C., Nature 1986. 323: 540. 6 Martin, L. H., Calabi, F. and Milstein, C., Proc. Natl. Acad. Sci.
7 Martin, L. H., Calabi, F., Lefebvre, F. A., Bilsland, C. A. G. and USA 1986.83: 9154.
Milstein, C., Proc. Natl. Acad. Sci. USA 1987. 84: 9189.
8 Milstein, C., Calabi, F., Jarvis, J. M., Kefford, R. F., Martin, L. H. and Migone, N., in McMichael, A. J. et al. (Eds.), Leucocyte Typing IIZ, Oxford University Press, Oxford 1987, p. 882.
9 Bankier, A. T., Weston, K. M. and Banell, B. G., Methods Enzy- mol. 1987. 155: 51.
10 Barton, G. J. and Sternberg, M. J. E., J. Mol. Biol. 1987.198: 327. 11 Gustaffson, K., Wiman, K., Emmoth, E., Larhammar, D.,
, Bohme, J., Hyldig-Nielsen, J. J., Ronne, H., Peterson, P. A. and
12 Zvelebil, M. J., Barton, G. J., Taylor, W. R. and Sternberg, M. J.
13 Wu, T. T. and Kabat, E. A,, J . Exp. Med. 1970. 132: 211. 14 Gamier, J., Osguthorpe, D. J. and Robson, D., J. Mol. Biol.
1978. 120: 97. 15 Srivastava, R., Duceman, B. W., Biro, P. A., Sood, A. K. and
Weissman, S . M., Immunol. Rev. 1985. 84: 92. 16 Dayhoff, M. O., Barker, W. C. and Hunt, L. T., Methods Enzy-
mol. 1983. 91: 524. 17 Bjorkman, P. J., Saper, M. A., Samaraoui, B., Bennett, W. S.,
Strominger, J. L. and Wiley, D. C., Nature 1987a. 329: 506. 18 Bjorkman, P. J., Saper, M. A., Samaraoui, B., Bennett, W. S.,
Strominger, J. L. and Wiley, D. C., Nature 1987 b. 329: 512. 19 Brown, J. H., Jardetzky, T., Saper, M. A., Samaraoui, B., Bjork-
man, P. J. and Wiley, D. C., Nature 1988.332: 845. 20 Wang, C.-R., Chen, G.-H., Newkirk, M.,Capra, J. D. and
Mandy, W. J., Mol. Immunol. 1988.25: 945. 21 Lesk, A. M., Levitt, M. and Chothia, C., Protein Eng. 1986.1: 77. 22 Li, W. H., in Nei, M. and Koehn, R. K. (Eds.), Evolution of
Genes and Proteins, Sinauer, Sunderland Massachusetts 1983, p. 14.
23 Vega, M. A., Bragado, R., Ezquerra, A. and Lopez de Castro, J. A., Biochemistry 1984.23: 823.
24 Auffray, C. and Novotny, J., Nucleic Acids Res. 1984.12: 243.
Rask, L., EMBO J . 1984. 3: 1655.
E., J . Mol. Biol. 1987. 195: 957.
Related Documents