THE TURKISH ONLINE JOURNAL OF EDUCATIONAL TECHNOLOGY JANUARY 2010 Volume 9 - Issue 1 Prof. Dr. Aytekin İşman Editor-in-Chief Prof. Dr. Jerry Willis Editor Fahme Dabaj Associate Editor ISSN: 1303 - 6521 Indexed by Scocial Science Citation Index - SSCI Education Resources Information Center - ERIC

Welcome message from author
This document is posted to help you gain knowledge. Please leave a comment to let me know what you think about it! Share it to your friends and learn new things together.
Transcript
THE
TURKISH ONLINE JOURNAL
OF
EDUCATIONAL TECHNOLOGY
JANUARY 2010 Volume 9 - Issue 1
Prof. Dr. Aytekin İşman Editor-in-Chief
Prof. Dr. Jerry Willis
Editor
Fahme Dabaj Associate Editor
ISSN: 1303 - 6521
Indexed by Scocial Science Citation Index - SSCI
Education Resources Information Center - ERIC

TOJET: The Turkish Online Journal of Educational Technology – January 2010, volume 9 Issue 1
Copyright The Turkish Online Journal of Educational Technology 1
Copyright © 2001 - THE TURKISH ONLINE JOURNAL OF EDUCATIONAL TECHNOLOGY All rights reserved. No part of TOJET's articles may be reproduced or utilized in any form or by any means, electronic or mechanical, including photocopying, recording, or by any information storage and retrival system, without permission in writing from the publisher. Published in TURKEY Contact Address: Prof. Dr. Aytekin İŞMAN TOJET, Editor in Chief Sakarya-Turkey
TOJET: The Turkish Online Journal of Educational Technology – January 2010, volume 9 Issue 1
Copyright The Turkish Online Journal of Educational Technology 2
Message from the Editor-in-Chief
Dear Readers, In this century, technological advances have been rapid, with the result that distributors of educational hardware and software are constantly coming up with new options for global organizations, individuals, and families. These technological advances have led to a variety of new educational practices. A relatively new practice for global educators is e-learning. In the world, k12 and university level education have adopted the use of internet in the instruction of courses, and the educational system has benefited greatly from the internet. As global society begins to live in the 21st century, one of the principal goals of global education is to offer equal educational opportunities for all students. To achieve this objective at the all levels, educators use e-learning system to deliver instruction through internet. In this system, learning and teaching facilities made available in one place are delivered to one or more other places using internet. The Turkish Online Journal of Educational Technology is online journal and published only through internet. In online system, accessing articles is available in one place are delivered to all over the world using internet. TOJET`s quality research papers on theory, applications and development of educational technology can be reached easily from Asia, America, Europe, Australia, and others through internet. The Turkish Online Journal of Educational Technology is the center of research about educational technology used in instruction. The main goal of TOJET is to establish a bridge the gap between theory and practice. To help bridge the gap, TOJET provides readers with the new developments in educational technology world-wide and a main source for academics and professionals in the expanding fields of educational technology. Articles consist of all kinds of quality research on theory, applications and development of educational technology. I am always honored to be the editor in chief of TOJET. I am always proud of TOJET for its valuable contributions to the field of educational technology. TOJET is interested in academic articles on the issues of educational technology. The articles should talk about using educational technology in classroom, how educational technology impacts learning, and the perspectives of students, teachers, school administrators and communities on educational technology. These articles will help researchers to increase the quality of both theory and practice in the field of educational technology. The guest editor of this issue was Prof. Dr. Murat BARKAN. TOJET thanks and appreciate the guest editor and the editorial board who have acted as reviewers for one or more submissions of this issue for their valuable contributions. TOJET's reviewers are drawn quite widely from all over the world.
Prof. Dr. Aytekin İŞMAN Sakarya University
TOJET: The Turkish Online Journal of Educational Technology – January 2010, volume 9 Issue 1
Copyright The Turkish Online Journal of Educational Technology 3
President Prof. Dr. Mehmet DURMAN (Sakarya University, Turkey) Editors Prof. Dr. Aytekin İŞMAN (Sakarya University, Turkey) Prof. Dr. Jerry WILLIS (Manhattanville College, USA) Associate Editor Senior Instructor Fahme DABAJ (Eastern Mediterranean University, TRNC) Editorial Board Prof. Dr. Aytekin İŞMAN (Sakarya University, Turkey) Prof. Dr. Brent G. WILSON (University of Colorado at Denver, USA) Prof. Dr. Enver Tahir RIZA (Dokuz Eylül University, Turkey) Prof. Dr. Petek AŞKAR (Hacettepe University, Turkey) Prof. Dr. Ülkü KÖYMEN (Çukurova University, Turkey) Prof. Dr. Ali Ekrem ÖZKUL (Anadolu University, Turkey) Prof. Dr. Jerry WİLLİS (Manhattanville College, USA) Prof. Dr. Asaf VAROL (Fırat University, Turkey) Prof. Dr. Murat BARKAN (Yaşar University, Turkey) Prof. Dr. Ali ŞİMŞEK (Anadolu University, Turkey) Prof. Dr. Uğur DEMİRAY (Anadolu University, Turkey) Prof. Dr. Marina Stock MCISAAC (Arizona State University, USA) Prof. Dr. Charlotte N. (Lani) GUNAWARDENA (University of New Mexico, USA) Prof. Dr. Francine Shuchat SHAW (New York University, USA) Prof. Dr. Don M. FLOURNOY (Ohio University, USA) Prof. Dr. Akif ERGIN (Başkent University, Turkey) Prof. Dr. Arvind SINGHAL (University of Texas, USA) Prof. Dr. Mehmet GÜROL (Fırat University, Turkey) Prof. Dr. Buket AKKOYUNLU (Hacettepe University, Turkey) Prof. Dr. Colleen SEXTON (Governor State University, USA) Prof. Dr. Ferhan ODABAŞI (Anadolu University, Turkey) Prof. Dr. Hafize KESER (Ankara University, Turkey) Prof. Dr. Stefan AUFENANGER (University of Mainz, Germany) Prof. Dr. Antoinette J. MUNTJEWERFF (University of Amsterdam) Prof. Dr. Ali Rıza AKADENİZ (Karadeniz Teknik University, Turkey) Prof. Dr. Ali Paşa AYAS (Karadeniz Teknik University, Turkey) Prof. Dr. Adnan BAKİ (Karadeniz Teknik University, Turkey) Prof. Dr. Salih ÇEPNİ (Karadeniz Teknik University, Turkey) Prof. Dr. Servet BAYRAM (Marmara University, Turkey) Prof. Dr. Hasan AMCA (Eastern Mediterranean University, TRNC) Prof. Dr. Ing. Giovanni ADORNI (University of Genova, Italy) Prof. Dr. Gianni Viardo VERCELLI (University of Genova, Italy) Prof. Dr. Heli RUOKAMO (University of Lapland, Finland) Prof. Dr. Halil İbrahim YALIN (Gazi University, Turkey) Prof. Dr. Rauf YILDIZ (Çanakkale 19 Mart University, Turkey) Prof. Dr. Colin LATCHEM (Open Learning Consultant, Australia) Prof. Dr. Zeki KAYA (Gazi University, Turkey) Prof. Dr. Mehmet KESİM (Anadolu University, Turkey) Prof. Dr. Mustafa Şahin DÜNDAR (Sakarya University, Turkey) Prof. Dr. Yavuz AKPINAR (Boğaziçi University, Turkey) Prof. Dr. Hüseyin Ekiz (Sakarya University, Turkey) Associate Prof. Dr. Eralp ALTUN (Ege University, Turkey) Associate Prof. Dr. Larysa M. MYTSYK (Gogol State University, Ukraine) Associate Prof. Dr. Rozhan Hj. Mohammed IDRUS (Universiti Sains Malaysia, Malaysia) Associate Prof. Dr. C. Hakan AYDIN (Anadolu University, Turkey) Associate Prof. Dr. Ahmet Zeki SAKA (Karadeniz Technical University, Turkey) Associate Prof. Dr. Arif ALTUN (Hacettepe University, Turkey) Associate Prof. Dr. Mehmet ÇAĞLAR (Near East University, TRNC) Associate Prof. Dr. Hüseyin UZUNBOYLU (Near East University, TRNC)
TOJET: The Turkish Online Journal of Educational Technology – January 2010, volume 9 Issue 1
Copyright The Turkish Online Journal of Educational Technology 4
Associate Prof. Dr. Hasan Hüseyin ÖNDER (Eastern Mediterranean University, TRNC) Associate Prof. Dr. Teressa FRANKLIN (Ohio University, USA) Associate Prof. Dr. Galip AKAYDIN (Hacettepe University, Turkey) Associate Prof. Dr. Selahattin GELBAL (Hacettepe University, Turkey)) Assistant Prof. Dr. Mustafa Murat INCEOGLU (Ege University, Turkey) Assistant Prof. Dr. Pamela EWELL (Central College of IOWA, USA) Assistant Prof. Dr. Aaron L. DAVENPORT (Grand View College, USA) Assistant Prof. Dr. Paula FITZGIBBON (University of Victoria, Canada) Assistant Prof. Dr. Betül ÖZKAN (University of Arizona, USA) Assistant Prof. Dr. Hamit CANER (Eastern Mediterranean University, TRNC) Assistant Prof. Dr. Dale HAVILL (Dhofar University, Sultanate of Oman) Assistant Prof. Dr. Hüseyin YARATAN (Eastern Mediterranean University, TRNC) Assistant Prof. Dr. Erkan TEKİNARSLAN (Bolu Abant İzzet Baysal University, Turkey) Assistant Prof. Dr. Murat ATAİZİ (Anadolu University, Turkey) Assistant Prof. Dr. Hasan ÇALIŞKAN (Anadolu University, Turkey) Assistant Prof. Dr. Muhammet DEMİRBİLEK (Süleyman Demirel University, Turkey) Assistant Prof. Dr. Selma KOÇ Vonderwell (Cleveland State University, Cleveland) Assistant Prof. Dr. Jagannath. K DANGE (Kuvempu University, India) Dr. İsmail İPEK (Bilkent University, Turkey) Dr. Manoj Kumar SAXENA (Advance Institute of Management - India) Dr. Fahriye ALTINAY (Eastern Mediterranean University, TRNC) Dr. Zehra ALTINAY (Eastern Mediterranean University, TRNC) Fahme DABAJ (Eastern Mediterranean University, TRNC) John FITZGIBBON (Ministry of Education, Jordan)
TOJET: The Turkish Online Journal of Educational Technology – January 2010, volume 9 Issue 1
Copyright The Turkish Online Journal of Educational Technology 5
Table of Contents
A Major E-Learning Project to Renovate Science Leaning Environment in Taiwan 911 Chun-Yen CHANG, Greg LEE 7
A Needs Assessment Survey to Investigate Pre-Service Teachers’ Knowledge, Experiences and Perceptions about Preparation to Using Educational Technologies 912 Mustafa KOC, Nesrin BAKIR
13
An Initial Comparison of Educational Technology Courses for Training Teachers at Malaysian Universities: A Comparative Study 913 Mona MASOOD
23
Antecedents of ICT Attitudes of Distance Education Students 914 Rugayah HASHIM, Hashim AHMAD, Che Zainab ABDULLAH 28
Challenges of Malaysian Developers in Creating Good Interfaces for Interactive Courseware 915 Norfadilah KAMARUDDIN 37
Digital Divide in Turkish Primary Schools: Sakarya Sample 916 Hasan Basri GÜNDÜZ 43
E-Halagat: an E-Learning System for Teaching the Holy Quran 917 Yahya O. Mohamed ELHADJ 54
Effects of Computer Assisted Instruction (CAI) on Secondary School Students’ Performance in Biology 918 Mudasiru Olalere YUSUF, Adedeji Olufemi AFOLABI 62
Evaluation of Learning Performance of E-Learning in China: A Methodology Based on Change of Internal Mental Model of Learners 919 Lingxian Zhang, Xiaoshuan Zhang, Yanqing Duan, Zetian Fu, Yanwei Wang
70
High School Students in the New Learning Environment: A Profile of Distance e-Learners 9110 Dale KIRBY, Dennis SHARPE 83
How the Use of Computer Types and Frequency Affects Adolescences towards Anger and Aggression 9111 Emete YAĞCI, Mehmet ÇAĞLAR 89
ICT in Vocational and Technical Schools: Teachers’ Instructional, Managerial and Personal Use Matters 9112 Filiz KUSKAYA MUMCU, Yasemin KOCAK USLUEL 98
Integration of the Internet into a Language Curriculum in a Multicultural Society 9113 Songül KİLİMCİ 107
Investigation of the Predictions and Decisions about Information and Communication Technologies in the Development Plans in Turkey 9114 Sevgi GEREK
114
Meta Analysis of the Computer Assisted Studies in Science and Mathematics: A Sample of Turkey 9115 Mustafa YEŞİLYURT 123
New Perspective to Educational Technology: Interdisciplinary Cooperation “An Example of Faculties of Education and Engineering” 9116 Hasan KARAL, Tugba BAHÇEKAPILI
132
Pre-Service English Language Teachers’ Perceptions of Computer Self-Efficacy and General Self-Efficacy 9117 Ece ZEHİR TOPKAYA 143
Pre-Service English Teachers in Blended Learning Environment in Respect to Their Learning Approaches 9118 M. Betül YILMAZ, Feza ORHAN 157
Students’ Opinions on Using Classroom Technology in Science and Technology Lessons - A Case Study for Turkey (Kilis City) 9119 Murat ESKİL, Habib ÖZGAN, Betül BALKAR
165
Students’ Perceptions in Developing a Multimedia Project within a Constructivist Learning Environment: A Malaysian Experience 9120 Mai NEO, Tse-Kian NEO (Ken)
176
Students’ Perceptions to Use Technology for Learning: Measurement Integrity of the Modified Fennema-Sherman Attitudes Scales 9121 Murat KAHVECI
185
Teacher Education from E-Learner to E-Teacher: Master Curriculum 9122 Dragana BJEKIĆ, Radojka KRNETA, Danijela MILOŠEVIĆ 202
The Attitudes of the Prospective Mathematics Teachers towards Instructional Technologies and Material Development Course 9123 Sevinç Mert UYANGÖR, Denizhan Karaca ECE
213
TOJET: The Turkish Online Journal of Educational Technology – January 2010, volume 9 Issue 1
Copyright The Turkish Online Journal of Educational Technology 6
The Effects of CBI Lesson Sequence Type and Field Dependence on Learning from Computer-Based Cooperative Instruction in WEB 9124 Ismail IPEK
221
Turkish University Students’ Technology Use Profiles and Their Thoughts about Distance Education 9125 Bahar BARAN, Eylem KILIC, Aysegul BAKAR ÇÖREZ, Kursat CAGİLTAY 235
Usability Level of Distance Education Website (Sakarya University Sample) 9126 Aytekin İŞMAN, Onur İŞBULAN 243
TOJET: The Turkish Online Journal of Educational Technology – January 2010, volume 9 Issue 1
Copyright The Turkish Online Journal of Educational Technology 7
A MAJOR E-LEARNING PROJECT TO RENOVATE SCIENCE LEANING ENVIRONMENT IN TAIWAN
Chun-Yen CHANG a* and Greg LEE b
a Graduate Institute of Science Education & Department of Earth Sciences & Science Education Center
b Dept. of Computer Science and Information Engineering National Taiwan Normal University, Taiwan
*Corresponding author: Chun-Yen Chang Tel: +886 229354393; Fax: +886 229333315; E-mail: [email protected];
Web: http://ese.geos.ntnu.edu.tw/~chunyen Address: 88, Section 4, Ting-Chou Road, Taipei, 11677 Taiwan
ABSTRACT This article summarizes a major e-Learning project recently funded by the National Science Council of Taiwan and envisions some of the future research directions in this area. This project intends to initiate the ‘Center for excellence in e-Learning Sciences (CeeLS): i4 future learning environment’ at the National Taiwan Normal University. In collaboration with multiple leading institutes and universities involved in the areas of science education, computer science and computer engineering from around the world, NTNU proposes to develop an innovative science learning environment which integrates various modern technologies such as image processing, speech processing, automatic video processing, speech recognition, mobile technologies, machine translation, natural language processing, data mining and machine learning. Our aim is to create an intelligent classroom embedded with individualized and interactive learning materials and assessment tools. To realize the aforementioned goals, the CeeLS endeavors to bring together a group of experts in the area of science education, cognitive science, computer science, and computer engineering. We will propose three closely interrelated research directions conducted by three major projects: (1) Project Classroom 2.0, to establish this envisioned future classroom; (2) Project Mobile 2.0, to enhance the interactions among teacher, students, and student peers, and (3) Project Testing 2.0, to pioneer new technologies on assessment and to assist the CeeLS to carry out program evaluations for the project. Four major changes (in both cognitive and affective domains including students’ domain knowledge, higher-order thinking ability and attitudes and motivation in the subject matters) will be investigated and evaluated under the innovative learning environment. The investigations will include: (1) Teachers' Teaching Approaches (TTA), (2) Students' Learning Strategies (SLS), (3) Student-Teacher Interactions (STI), and (4) Student Science Learning Outcomes (SLO). BACKGROUND Science teaching is conducted primarily in three types of learning environments: classroom, laboratory; and outdoors (Orion et al., 1997). The importance of Science Classroom Learning Environment (SCLE) has been recognized by many researchers and teachers during the past two decades. The teaching standard proposed by the recent science education standards in the USA also describes that:
As part of challenging students to take responsibility for their learning, teachers involve students in the design and management of the learning environment. (National Research Council, 1996) The specific criteria for a science learning environment will depend on many factors such as the needs of the students and the characteristics of the science program. (National Research Council, 1996)
Educational research has usually compared or contrasted two different types of instructional methods or learning environments: one being traditional, and the other referred to as the new, modern, or reform (Chang, 2001, 2002, 2003; Chang, Hsiao, & Barufaldi, 2006; Chang & Mao, 1999). The modern SCLE is mainly categorized as the constructivist learning environment. It adopts the constructive pedagogy and is ‘constructive oriented,’ ‘interdisciplinary oriented’, or ‘student centered’. Students in the constructive setting are encouraged to be actively engaged throughout the learning process with a high degree of self-regulation. Teachers in this environment adopt internal control over the learning process of the classroom. On the other hand, the traditional SCLE is frequently labeled as the objectivism/expository learning
TOJET: The Turkish Online Journal of Educational Technology – January 2010, volume 9 Issue 1
Copyright The Turkish Online Journal of Educational Technology 8
environment, which emphasizes the objective pedagogy and is ‘reproduction oriented’, ‘subject matter oriented’, or ‘teacher centered’. Students in this setting learn in a reproductive/surface approach where memorization of facts is stressed. Teachers in this setting adopt external control over the learning process of the classroom. The stereotypical, traditional image is so prevalent among many science teachers and educators that many people consider teacher-centered learning (or reproductive learning) and student-centered learning (or constructive learning) as two contrasting poles of one dimension (Wierstra et al., 2003). Nevertheless, some previously conducted studies revealed that constructive learning and reproductive learning were not always negatively correlated and sometimes resulted in a positive correlation (Slaats et al., 1999; Vermetten et al., 1999). Kinchin (2004) pointed out that the tension created between objectivism (the objective teacher-centered pedagogy) and constructivism (the constructive and student-centered pedagogy) represents a real classroom issue that influences teaching and learning. The recent TIMSS (Third International Mathematics and Science Study) 2003 International Science Report (Martin et al., 2004) specifically documented that internationally, the three most predominant activities accounting for 57 percent of class time were teacher lecture (24%), teacher-guided student practice (19%), and students working on problems on their own (14%) in science classes around the world. Therefore, it appears that the current science classroom learning environment is often a mixture of divergent pedagogies and diverse student orientations or preferences (Chang & Tsai, 2005; Chang, Hsiao, & Barufaldi, 2006). The modern science learning environment is also filled with new technologies such as computers and the Internet. After reviewing meta-analyses and other studies of media's influence on learning, Clark (1983) concluded that there are no learning benefits to be gained from employing any specific medium to deliver instruction (Clark, 1983). He went on to argue that most media comparison research, which compared computer-assisted instruction with conventional instruction or other media, suffered from inherently flawed methodologies. He also made the claim that media is only the vehicle that delivers instruction but that it does not influence student achievement or learning (Clark, 1994). Hokanson and Hooper (2000) claimed that the expanded use of computers in education continues despite research having failed to accrue definite benefits in learners’ performance. They also argued that, ‘traditional achievement has not changed through the use of computers to apply or deliver the same instructional methods.’ (Hokanson & Hooper, 2000). The mixed research results and perspectives on computer or Internet aided learning/learning environments perhaps stems from some unknown factors that might revolve around the capabilities and designs of new technologies and students’ characteristics and their preferences of (online) learning environment in the science classes. For example, Linn (2003) reviewed the past, present, and future of technology in science education and concluded that two overall trends in technological advance have been present over the past 25 years. First, designers have tailored general tools to specific disciplines by offering learners features specific to the topics or tasks to be learned. Second, new technologies usually support user customization, enabling individuals to personalize their modeling tools, Internet portals, or discussion boards (Linn, 2003). However, both the tailoring of applications and the customization of tools require a trade-off between supporting specialized learning activities and allowing tool generalizations. In addition to the aforementioned debates/issues, the science learning environment (classroom, lab, and outdoor) seems to have remained relatively unchanged for the past few decades. De Corte (2000) writes: “Recent research on learning and instruction has substantially advanced our understanding of the processes of knowledge and skill acquisition. However, school practices have not been innovated and improved in ways that reflect this progress in the development of a theory of learning from instruction”. School practices in a realistic sense are majorly centered on school learning environment. It is generally recognized among practitioners that our school science learning environment has neither been innovated nor reformed to reflect the new knowledge of learning and teaching. Moreover, modern technologies, beyond just the use of computers and internet, in the school have not been fully integrated/incorporated in the current science learning environment (Chang & Wang, 2009). Therefore, this research project sets out to establish a Center for excellence in e-Learning Sciences (CeeLS) with the aim of realizing the common goal of modernizing school practices. We endeavor to renovate the science leaning environment through an integration of three major research directions:
TOJET: The Turkish Online Journal of Educational Technology – January 2010, volume 9 Issue 1
Copyright The Turkish Online Journal of Educational Technology 9
(1) Classroom 2.0: creating an intelligent classroom environment with smart technologies (ex., automatic video processing and speech recognition) embedded into the process of teaching and learning. The technologies in this type of innovative classroom should be intelligent, interactive, individualized and integrated as the follows: (A) intelligent: the classroom technology should be highly context-aware and adaptively support tasks that originally require excessive human interventions; (b) interactive: the classroom technology should facilitate interactions between classroom instructor and the students; (c) individualized: the classroom technology should react differently in accordance to individual user; and (d) integrated: the classroom technologies should be integrated as one i4 system instead of many separate systems.
(2) Mobile 2.0: enhancing the interactions among teacher, students, and student peers through a common communication platform for ubiquitous interactions among different handheld devices. This study will involve research in autonomic computing of handheld devices, and the resulting lecturing environment will be self-configurable, self-healing, self-optimized, and self-protected. Research in adaptive rate control techniques for data transmission in the i4 future learning environments, and agile transposing techniques for audio, video, and documents will also be conducted in the project. This study will also involve research into network security techniques that can automatically detect malicious attacks and adapt themselves to secure data transmissions in the i4 future learning environments.
(3) Testing 2.0: pioneering new technologies (Wang, Chang & Li, 2008) such as machine learning, natural language processing, machine translation and user modeling to improve assessment tools in terms of content, formats, scoring and analysis methods. In particular, Testing 2.0 will investigate two lines of research. The first line of research aims to develop interactive and intelligent tools for supporting tasks of item authoring, response grading, grade reporting, and item banking in educational testing. Thorough behavioral and educational tasks, analysis will be conducted as the foundation for technological innovation. Another line of research will investigate machine translation technologies for localizing international tests into traditional Chinese items. Related assistive technologies, including text mining and retrieval for intelligent item access, duplication detection, item categorization, and item augmentation and expansion, will also be explored. Testing 2.0 will adopt the current Web standards and technologies, such as Web 2.0, XML, and AJAX, throughout the design and development of online assessment tools. Testing 2.0 will develop a state-of-the-art item banking system to achieve the research objectives.
An innovative modern learning environment, from our point of view, should incorporate all the aforementioned new technologies into its settings. Accordingly the following questions need to be addressed: 1) How will these new technologies be properly incorporated into science learning environment? 2) How will the newly developed learning environment change/affect the practice of school learning and teaching in terms of teachers’ teaching approaches, student learning strategies, student-teacher interactions, and student science learning outcomes? These research questions not only trigger our research interest in this area but also merit further in-depth investigations. Our research team will try to address the aforementioned issues via establishing the new center and conducting a three-year study/project. PROJECT FRAMEWORK
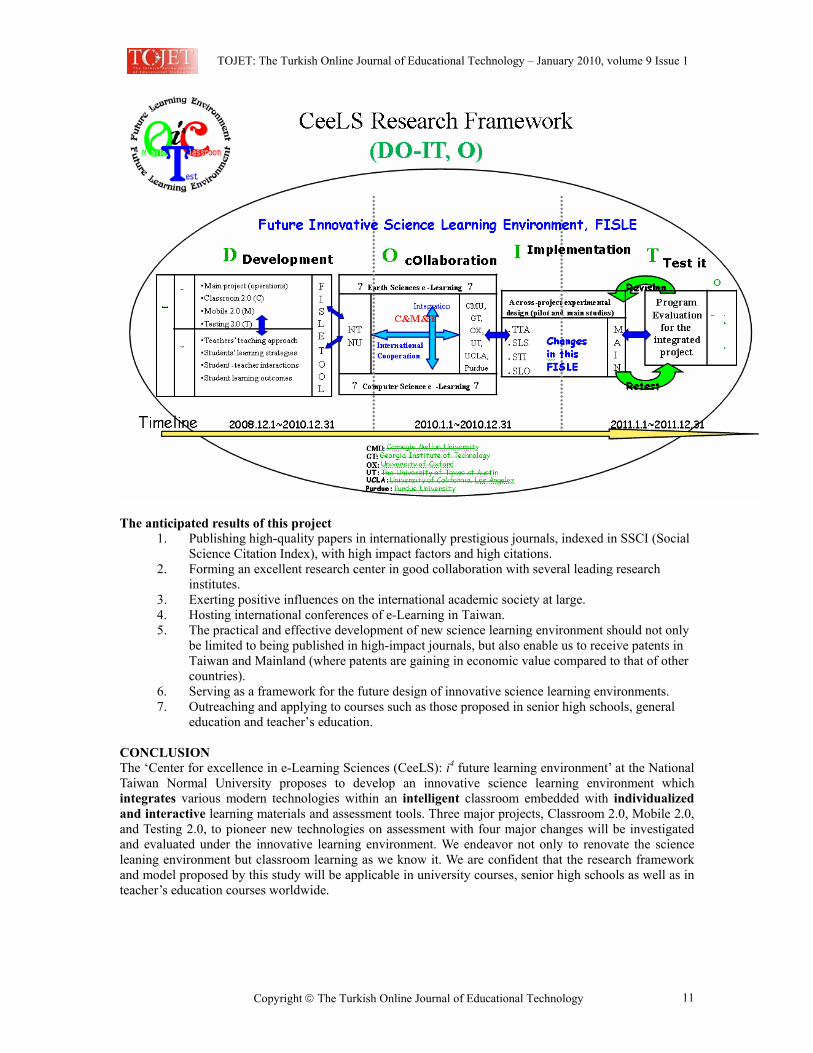
The project framework is delineated in four major stages, DOIT (Development, cOllaborations, Implementations, and Test it), followed by Oh! (Outreach) as illustrated in Figure 1. The following three research teams will be involved in the project efforts throughout the 3-year period: (1) Classroom 2.0; (2) Mobile 2.0; and (3) Testing 2.0. Under the same umbrella of research framework, the aforementioned teams will not only work closely together on the same research agenda but also conduct their own research schemes. 1. D (Development stage): The major goal of this stage will be the development of a future innovative
science learning environment with various new embedded technologies. Innovative educational research tools such as machine-assisted processing of videos will be included in the future vision of the CeeLS. Several classes of students enrolled in earth sciences/computer science courses will be first test pilots of the new science learning environment; this will provide a base for further revisions, derived from the suggestions and comments of those participating students and professors. The final
TOJET: The Turkish Online Journal of Educational Technology – January 2010, volume 9 Issue 1
Copyright The Turkish Online Journal of Educational Technology 10
version of the learning environment will be improved based on several subsequent pilot studies and is expected to be completed before the end of year 2009.
2. O (cOllaborations stage): This stage represents the major collaboration between NTNU and other
prestigious institutes around the world in designing new materials and exchanging ideas. The proposed CeeLS has received letters of collaboration from leading universities such as Carnegie Mellon University, Georgia Institute of Technology, the University of Oxford, The University of Texas at Austin, Purdue University and University of California at Los Angeles. It is noteworthy that the collaborations among these institutes will not only be limited to the ‘O’ stage but rather extending to the outer circle (the big black circle encompassing the entire DO-IT, O! framework), ensuring the on-going collaborations throughout the project periods and collaborated efforts between NTNU and other institutes.
3. I (Implementations stage): The objectives of this stage will be the development of assessment tools (starting from the first year) to tap TTA, SLS, STI, and SLO as explained below. The science courses will also be piloted and field tested during this period. Four major changes (components) will be investigated through the development and administering of respective instruments to answer our research questions:
A. TTA: Teachers’ Teaching Approaches B. SLS: Students’ Learning Strategies C. STI: Student-Teacher Interactions D. SLO: Student Learning Outcomes
4. T (Test it stage): This is the main program evaluation stage which incorporates an experimental design
involving different groups. The results of the main evaluation studies will not only serve as a framework for the future design of an innovative learning environment for the university course but it will also enable teachers to customize their own instruction styles into their future classes or courses. The innovative science learning environment is also envisioned to be applied to the senior high schools. It is noted that the ‘implementations and test it’ stages, as illustrated in Figure 1, are actually cyclical stages that allow for re-entry into those stages for revision and re-evaluation purposes (as well as to further improve and corroborate the feasibility of the DO-IT framework). Therefore, the results of the study will not only serve as a viable alternative for teaching university students but could also be the base for development of a future science learning environment for both university and senior high school classes.
5. O (Outreach programs): The results of the project efforts will have new development and instructional implications regarding the use of new technologies and the implementation of future science learning environments within university courses and senior high schools worldwide.
TOJET: The Turkish Online Journal of Educational Technology – January 2010, volume 9 Issue 1
Copyright The Turkish Online Journal of Educational Technology 11
The anticipated results of this project
1. Publishing high-quality papers in internationally prestigious journals, indexed in SSCI (Social Science Citation Index), with high impact factors and high citations.
2. Forming an excellent research center in good collaboration with several leading research institutes.
3. Exerting positive influences on the international academic society at large. 4. Hosting international conferences of e-Learning in Taiwan. 5. The practical and effective development of new science learning environment should not only
be limited to being published in high-impact journals, but also enable us to receive patents in Taiwan and Mainland (where patents are gaining in economic value compared to that of other countries).
6. Serving as a framework for the future design of innovative science learning environments. 7. Outreaching and applying to courses such as those proposed in senior high schools, general
education and teacher’s education. CONCLUSION The ‘Center for excellence in e-Learning Sciences (CeeLS): i4 future learning environment’ at the National Taiwan Normal University proposes to develop an innovative science learning environment which integrates various modern technologies within an intelligent classroom embedded with individualized and interactive learning materials and assessment tools. Three major projects, Classroom 2.0, Mobile 2.0, and Testing 2.0, to pioneer new technologies on assessment with four major changes will be investigated and evaluated under the innovative learning environment. We endeavor not only to renovate the science leaning environment but classroom learning as we know it. We are confident that the research framework and model proposed by this study will be applicable in university courses, senior high schools as well as in teacher’s education courses worldwide.
TOJET: The Turkish Online Journal of Educational Technology – January 2010, volume 9 Issue 1
Copyright The Turkish Online Journal of Educational Technology 12
REFERENCES Chang, C. Y. (2001) A problem-solving based computer-assisted tutorial for the earth sciences. Journal of
Computer Assisted Learning, 17, 263-274. Chang, C. Y. (2002). The impact of different forms of multimedia CAI on students’ science achievement.
Innovations in Education & Teaching International, 39(4), 280-288. Chang, C. Y. (2003). Teaching earth sciences: Should we implement teacher-directed or student-controlled
CAI in the secondary classroom? International Journal of Science Education, 25(4), 427-438. Chang, C. Y., Hsiao, C. H., & Barufaldi, J. P. (2006). Preferred-actual learning environment ‘spaces’ and
earth science outcomes in Taiwan. Science Education, 90(3), 420-433. Chang, C. Y., & Mao, S. L. (1999) Comparison of Taiwan science students’ outcomes with inquiry-group
versus traditional instruction. The Journal of Educational Research, 92, 340-346. Chang, C. Y., & Tsai, C.-C. (2005). The interplay between different forms of CAI and students’
preferences of learning environment in the secondary science class. Science Education, 89, 707-724. Chang, C. Y., & Wang, H.-C. (2009). Issues of inquiry learning in digital learning environments. British
Journal of Educational Technology. 40, 169-173. Clark, R. (1983). Reconsidering research on learning from media. Review of Educational Research, 53,
445-459. Clark, R. (1994). Media will never influence learning. Educational Technology Research and Development,
42, 21-29. De Corte, E. (2000). Marrying theory building and the improvement of school practice: A permanent
challenge for instructional psychology. Learning and Instruction, 10, 249-266. Hokanson, B., & Hooper, S. (2000). Computes as cognitive media: Examining the potential of computers in
education. Computers in Human Behavior, 16, 537-552. Kinchin, I. M. (2004). Investigating students' beliefs about their preferred role as learners. Educational
Research, 46 (3), 301-312. Linn, M. C. (2003). Technology and science education: Starting points, research programs, and trends.
International Journal of Science Education, 25(6), 727-758. Martin, M. O., Mullis, I. V. S., Gonzalez, E. J., & Chrostowski, S. J. (2004). TIMSS 2003 international
science report. Boston, MA: TIMSS & PIRLS International Study Center, Lynch School of Education, Boston College.
National Research Council. (1996). National science education standards. Washington, DC: National Academy Press.
Orion, N., Hofstein, A., Tamir, P., & Giddings, G. J. (1997). Development and validation of an instrument for assessing the learning environment of outdoor science activities. Science Education, 81(2), 161-171.
van Driel, J. H., Bulte, A. M. W., & Verloop, N. (2005). The conceptions of chemistry teachers about teaching and learning in the context of a curriculum innovation. International Journal of Science Education, 27(3), 303-322.
Wang, H.-C., Chang, C. -Y., & Li, T. -Y. (2008). Assessing creative problem-solving with automated text grading. Computers & Education, 51, 1450–1466.
Wierstra, R. F. A., KANSELAAR, G., VAN DER LINDEN, J. L., LODEWIJKS, H. G. L. C., & VERMUNT, J. A. D. (2003). The impact of the university context on European students’ learning approaches and learning environment preferences. Higher Education, 45, 503-523.
TOJET: The Turkish Online Journal of Educational Technology – January 2010, volume 9 Issue 1
Copyright The Turkish Online Journal of Educational Technology 13
A NEEDS ASSESSMENT SURVEY TO INVESTIGATE PRE-SERVICE TEACHERS’ KNOWLEDGE, EXPERIENCES AND PERCEPTIONS ABOUT PREPARATION TO
USING EDUCATIONAL TECHNOLOGIES
Mustafa KOC Suleyman Demirel University, College of Technical Education, Turkey
Nesrin BAKIR University of Illinois at Urbana-Champaign, College of Education, USA
ABSTRACT This paper reports the results of a needs assessment survey that was conducted to find out pre-service teachers’ background knowledge, experiences and perceptions about their preparation for technology integration at a university in the Middle East USA. A questionnaire with both closed and open-ended items was administered to a group of student teachers. Participants seemed neutral with regards to feelings of being adequately prepared to use technology in their teaching but perceived that they needed more training. Majority knew how to use office tools, webpage design, and presentation tools. However, they did not feel comfortable using spreadsheets, databases, concept mapping, hypermedia, WebQuest, simulation tools, and video editing. In addition, the overall results suggested that pre-service teachers still used technologies within the objectivist model of teaching and learning. Based on the findings, teacher education programs need to provide pre-service teachers with additional and alternative technology training programs. The characteristics of such programs were discussed to help pre-service teachers learn how to use technologies as instructional tools to enhance their teaching and students` learning. Keywords: Pre-service teachers, Technology adoption, Needs assessment, Experience and Perceptions, Technology training. INTRODUCTION In today’s rapidly changing world, information and communication technologies have become a part of every aspect of society and human’s life at an exponential rate. This phenomenon has been of interest to educators, researchers, and policymakers in the field of education. Nowadays, technology integration to enhance student learning and to train students in accordance with the expectations of the current industry and workplace is one of the most desired missions of educational institutions. To fulfill this, schools have been spending a great deal of money, time and effort on getting the latest technological tools. However, no matter how much technology is brought into classrooms, it does not assure effective integration. Teachers need to be trained in both technical and pedagogical issues related to technology implementation. Consequently, the purpose of this research is to find out pre-service teachers’ background knowledge, experiences and perceptions about their preparation for technology integration at a university in the Middle East USA. A needs assessment was conducted for the development of an instructional program for professional development of pre-service teachers during 2003-2005 academic years. The results of the needs assessment survey were reported in this paper. RELATED LITERATURE The earlier research studies in the area of pre-service teachers’ technology adoption can be grouped into three main categories. The first group of work has focused on pre-service teachers’ technology proficiency and experiences during their undergraduate education. Secondly, a number of studies have examined student teachers’ attitudes toward technology use in teaching and learning, and their readiness to use technology. Lastly, research has dealt with possible barriers influencing pre-service teachers’ learning about educational technologies. Whetstone and Carr-Chellman (2001) found that pre-service teachers’ learning experiences with computers included method courses, self-taught experiences, self-contained computer courses, family and friends teaching them about computers, and seminars given by academic centers. Of these, the first two were the most frequently reported modes for building technology skills. Their results revealed that pre-service teachers used word processing to type papers, e-mail to correspond with others, and used library information access system to conduct research. In addition, Iding, Crosby and Speitel (2002) found that pre-service teachers used computers mostly for their own personal use and large number of them were unaware of educational software facilitating demonstrations and simulations, portfolios, individual enrichment, remediation and student collaboration. As far as Internet applications are concerned, recent studies indicated that pre-service teachers were comfortable with utilizing electronic social communication tools including e-mail and instant messaging (Doering, Lewis,
TOJET: The Turkish Online Journal of Educational Technology – January 2010, volume 9 Issue 1
Copyright The Turkish Online Journal of Educational Technology 14
Veletsianos & Nichols-Besel, 2008). However, a more recent study by Lei (2009) showed that pre-service teachers lacked the experience and expertise in using Web 2.0 technologies (e.g. wikis, blogs and podcasts) for classroom applications, publishing audio files and videos, and using classroom technologies such as interactive whiteboards, idea processors and assistive technologies. On the whole, research demonstrated that pre-service teachers were proficient with basic technologies such as word processing, e-mail, drill-and-practice applications, and presentation tools but were not familiar with more advanced tools including multimedia packages, problem-solving applications, electronic collaboration tools, spreadsheets, databases and simulations. (Brush, Glazewski & Hew 2008; Lei, 2009). Despite increasing number of technologies and level of technology education provided by teacher education programs, effective and high-level integration of technology into learning and teaching processes is still minority (Cuban, 2001; Ertmer, 2005; Hew & Brush, 2007). One reason for this can be type of technology courses offered to pre-service teachers. Past research indicated that stand-alone courses solely focusing on technology literacy or awareness (e.g. knowledge about how to operate a specific tool or software) were not effective and sufficient. What is required is to offer well-designed and technology-enhanced methods courses emphasizing pedagogical strategies on how to use technology (Hasselbring et al., 2000). In this way, student teachers have the opportunity to observe an instructional model of technology use and understand what the role of technology should be in various teaching and learning contexts. Rizza (2000) concluded that increased exposure to technology activities during undergraduate years improved their competence and comfort levels with computers and reinforced basic computer skills such word processing and webpage construction. Similarly, Karchmer-Klein (2007) found that having student teachers watch and analyze experienced teachers` high-quality technology-supported instructions motivated them to use technology in their own future teachings. Furthermore, Vannatta and Beyerbach (2000) found that technology integration into educational method courses increased pre-service teachers’ technology proficiency. In a recent action research study, Keeler (2008) found that incorporating technology-rich instructional approaches into the social studies method course helped pre-service teachers become familiar with how to utilize technology in educational contexts and made them realize the usefulness and transferability of instructional technology techniques. Research also demonstrated that incorporating technology into method courses and training programs could transform views of technology and epistemological beliefs to constructivist orientations including active learning, problem solving, critical thinking and discovery (Howard, McGee, Schwartz & Purcell, 2000; Vannatta & Beyerbach, 2000). Another reason for low level of technology integration could be related to pedagogical beliefs and attitudes toward educational technology. In fact, Ertmer (2005) pointed out that such beliefs teachers hold about technology were the ultimate determinant of their decision of whether to use technology in teaching. Teachers` early perceptions and intense experiences with technology can form beliefs with cognitive and affective functions. The ways teachers use technology is usually consistent with their beliefs about teaching and learning (Niederhauser & Stoddart, 2001). These beliefs become deeply personal and extremely resistant to change over time and greatly influence teachers’ classroom practices (Ertmer, 2005). Vermillion, Young and Hannafin (2007) observed that pedagogical beliefs still remained as barriers after the removal of access and infrastructure shortcomings. Therefore, alternative approaches and different methods should be provided in order to change teachers’ conceptions about and attitudes toward technology implementation. Recent research studies highlighted the importance and need of integrating technology throughout the teacher education curriculum rather than solely teaching technology skills. For example, Allsopp, McHatton and Cranston-Gingras (2009) conducted a one-to-one laptop initiative and examined the effects of this attempt on pre-service teachers’ belief systems. All faculty and student teachers in special education program used laptops and wireless technologies during classes and field experiences. The results indicated that perceptions of ability to integrate technology in teaching increased and attitudes toward technology implementation remained constantly high across the semesters. Herner-Patnode and Lee (2009) used web-based student portfolios for teacher preparation and witnessed positive changes in pre-service teacher’s knowledge, skills and dispositions toward technology and teaching. Park and Ertmer (2008) examined the effect of using problem-based approach in an educational technology course on changing pre-service teachers’ beliefs. The results showed that beliefs regarding technology use did not change but participants’ intended teaching practices shifted from teacher-directed to student-centered learning. Demographic and psychological characteristics have been shown to influence technology adoption. Watson (1997) demonstrated that low level of perceived competence in technology was related to gender and age as females expressed more negative feelings towards technology integration and reported lower computer self-efficacy than males did. However, recent studies show that mediating effects of gender on attitudes and
TOJET: The Turkish Online Journal of Educational Technology – January 2010, volume 9 Issue 1
Copyright The Turkish Online Journal of Educational Technology 15
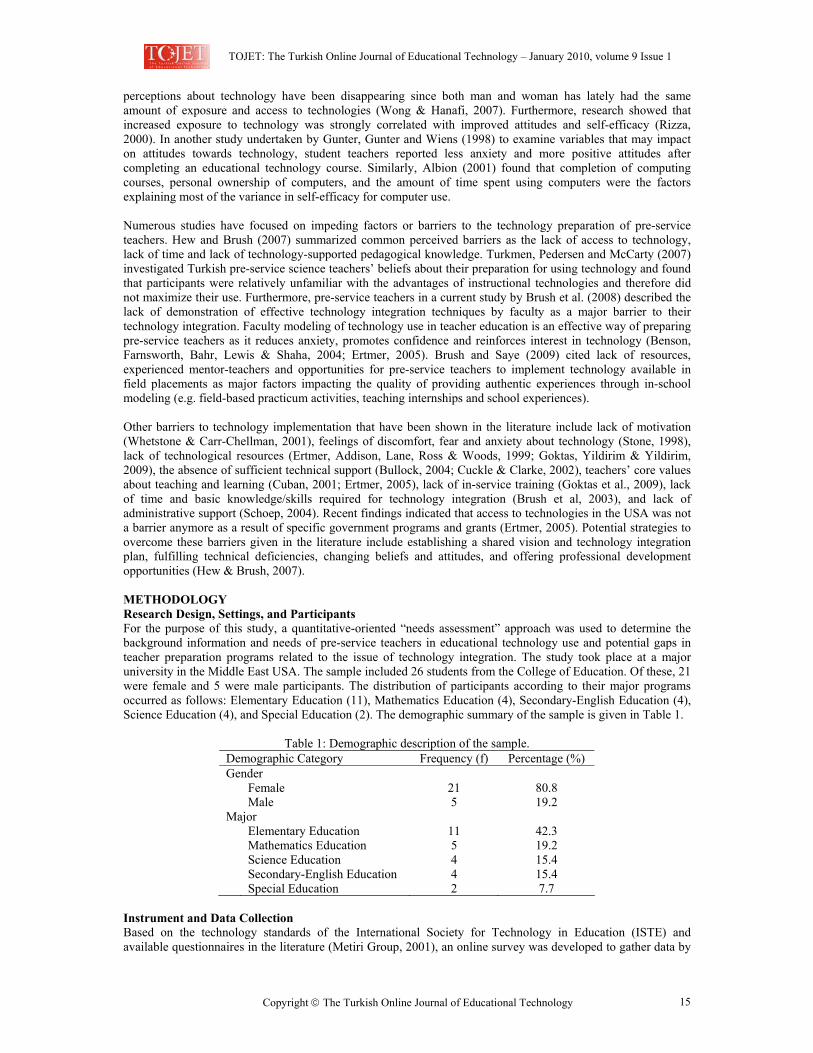
perceptions about technology have been disappearing since both man and woman has lately had the same amount of exposure and access to technologies (Wong & Hanafi, 2007). Furthermore, research showed that increased exposure to technology was strongly correlated with improved attitudes and self-efficacy (Rizza, 2000). In another study undertaken by Gunter, Gunter and Wiens (1998) to examine variables that may impact on attitudes towards technology, student teachers reported less anxiety and more positive attitudes after completing an educational technology course. Similarly, Albion (2001) found that completion of computing courses, personal ownership of computers, and the amount of time spent using computers were the factors explaining most of the variance in self-efficacy for computer use. Numerous studies have focused on impeding factors or barriers to the technology preparation of pre-service teachers. Hew and Brush (2007) summarized common perceived barriers as the lack of access to technology, lack of time and lack of technology-supported pedagogical knowledge. Turkmen, Pedersen and McCarty (2007) investigated Turkish pre-service science teachers’ beliefs about their preparation for using technology and found that participants were relatively unfamiliar with the advantages of instructional technologies and therefore did not maximize their use. Furthermore, pre-service teachers in a current study by Brush et al. (2008) described the lack of demonstration of effective technology integration techniques by faculty as a major barrier to their technology integration. Faculty modeling of technology use in teacher education is an effective way of preparing pre-service teachers as it reduces anxiety, promotes confidence and reinforces interest in technology (Benson, Farnsworth, Bahr, Lewis & Shaha, 2004; Ertmer, 2005). Brush and Saye (2009) cited lack of resources, experienced mentor-teachers and opportunities for pre-service teachers to implement technology available in field placements as major factors impacting the quality of providing authentic experiences through in-school modeling (e.g. field-based practicum activities, teaching internships and school experiences). Other barriers to technology implementation that have been shown in the literature include lack of motivation (Whetstone & Carr-Chellman, 2001), feelings of discomfort, fear and anxiety about technology (Stone, 1998), lack of technological resources (Ertmer, Addison, Lane, Ross & Woods, 1999; Goktas, Yildirim & Yildirim, 2009), the absence of sufficient technical support (Bullock, 2004; Cuckle & Clarke, 2002), teachers’ core values about teaching and learning (Cuban, 2001; Ertmer, 2005), lack of in-service training (Goktas et al., 2009), lack of time and basic knowledge/skills required for technology integration (Brush et al, 2003), and lack of administrative support (Schoep, 2004). Recent findings indicated that access to technologies in the USA was not a barrier anymore as a result of specific government programs and grants (Ertmer, 2005). Potential strategies to overcome these barriers given in the literature include establishing a shared vision and technology integration plan, fulfilling technical deficiencies, changing beliefs and attitudes, and offering professional development opportunities (Hew & Brush, 2007). METHODOLOGY Research Design, Settings, and Participants For the purpose of this study, a quantitative-oriented “needs assessment” approach was used to determine the background information and needs of pre-service teachers in educational technology use and potential gaps in teacher preparation programs related to the issue of technology integration. The study took place at a major university in the Middle East USA. The sample included 26 students from the College of Education. Of these, 21 were female and 5 were male participants. The distribution of participants according to their major programs occurred as follows: Elementary Education (11), Mathematics Education (4), Secondary-English Education (4), Science Education (4), and Special Education (2). The demographic summary of the sample is given in Table 1.
Table 1: Demographic description of the sample. Demographic Category Frequency (f) Percentage (%) Gender Female 21 80.8 Male 5 19.2 Major Elementary Education 11 42.3 Mathematics Education 5 19.2 Science Education 4 15.4 Secondary-English Education 4 15.4 Special Education 2 7.7
Instrument and Data Collection Based on the technology standards of the International Society for Technology in Education (ISTE) and available questionnaires in the literature (Metiri Group, 2001), an online survey was developed to gather data by
TOJET: The Turkish Online Journal of Educational Technology – January 2010, volume 9 Issue 1
Copyright The Turkish Online Journal of Educational Technology 16
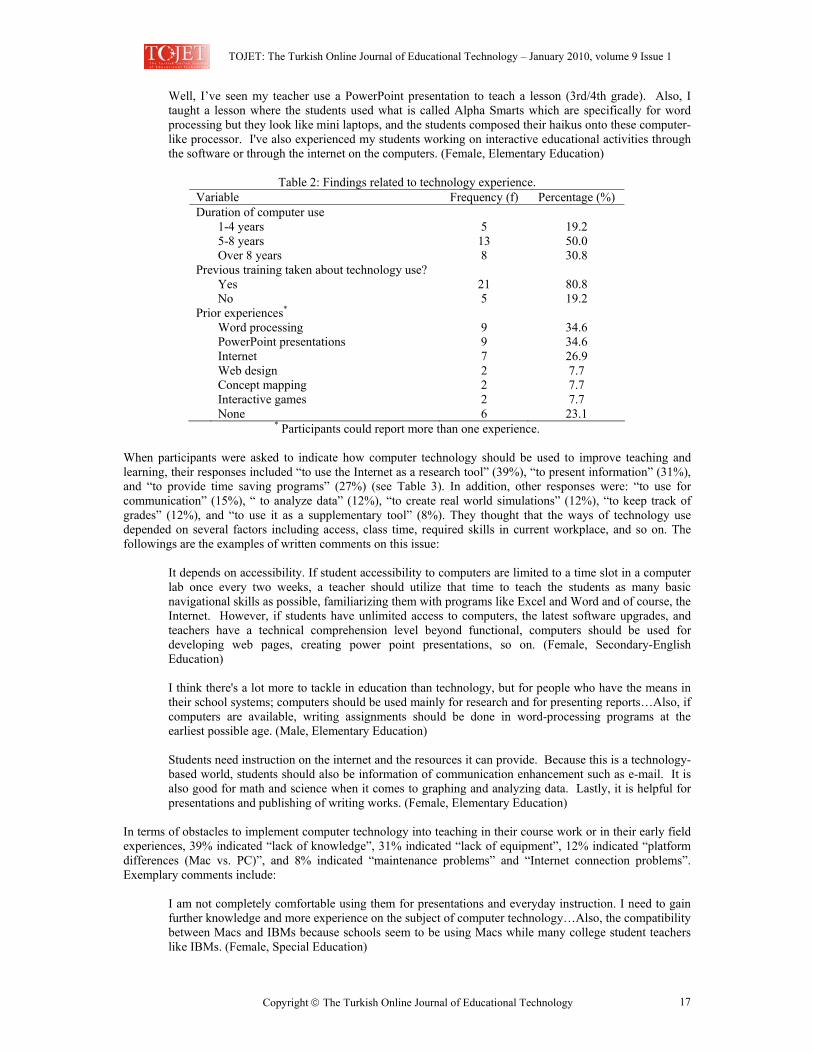
using a web-based questionnaire software program, “SurveyIt”. The researchers contacted the advisors and instructors and asked them to inform their students about the questionnaire and how they could access the survey. Participants were able to access the questionnaire at anytime and anywhere with Internet connection. Upon accessing the survey site, participants were initially prompted to read consent information and indicate whether they were willing to participate in the study. Then, those who accepted to participate were directed to the survey page. The questionnaire consisted of three parts. In the first part, participants were asked to provide demographic information (e.g. gender, major, etc.) and background information on their technology experience including how long they have been using technology to enhance their personal and academic productivity, whether they have received any training about the use of technology, and what prior experiences they have with integrating technology into teaching. This section also asked their opinions about the role of technology in teaching and learning and barriers to technology implementation. These questions were mostly open-ended; therefore, allowed participants to explicitly express what they thought about such issues. Second part of the questionnaire were related to perceptions and beliefs about participants’ knowledge and preparation to various aspects of using available technology for course planning, teaching, assessment, and communication. This section consisted of 11 statements and asked participants to indicate their level of agreement on each of statement by using a 5-point Likert scale ranging from strongly disagree (1) to strongly agree (5). Sample statements include “I am well prepared to use technology as a teaching tool”, “I am able to use computers for engaging students in critical and higher order thinking”, and “I have strategies for using computer technology to manage student assessment.” The final part of the survey was designed to assess participants’ current level of knowledge and skills for using a variety of technological applications (e.g. word processing, databases, web searching tools, video editing, etc.). Participants were asked to rate their levels of comfort with each tool by using a 3-point Likert scale (1=low, 2=medium, 3=high). Data Analysis Data were entered into statistical analysis software SPSS 10 for quantitative analysis. Since the main purpose of this research was to understand pre-service teachers’ technology adoption, descriptive statistics such as frequency, percentage, mean and standard deviation were calculated to summarize the data. Open-ended items were coded to identify key patterns and themes emerged from the responses. Where appropriate, verbatim quotations from participants’ written comments were reported in order to complement and support the quantitative findings by providing contextual-based and more-detailed information. The results were tabulated in the order of mean scores from highest to lowest to identify the salient issues. RESULTS One purpose of the study was to find pre-service teachers technology experiences. Findings related to this issue were presented in Table 2 below. Half of the participants reported that they had been using computer for five years to eight years while 30% and 19% reported more than eight years and 1-4 years respectively. When they were asked whether they had received any training courses about the use of computer technology, 81% answered “yes” whereas the remaining answered “no.” Participants listed their prior experiences with integrating computer technology into instruction in their course work or in their early field experiences. 35% reported word processing, 35% PowerPoint presentations, 27% Internet, 8% web design, 8% concept mapping, and 8% interactive games. A little more than one fifth reported no prior experiences. Below are representative comments on prior experience:
I have had access to a computer since I was 6 or 7 when my family got a Macintosh. I have been using Microsoft Word and various art programs such as Print Shop Deluxe since grade school. I learned Publisher and Excel from my dad in junior high and high school. I learned Power Point my senior year in high school…I have been using the internet since junior high when my family got AOL, and I am very family with various search engines and ways to find information. I am also familiar with web page publishing. (Female, Elementary Education)
I've created power point presentations, two web pages, and have participated in several online communities. I have worked with an underprivileged student one-on-one during a class period involving wireless laptops. I have created lesson plans that require computer technology. (Male, Science Education)
TOJET: The Turkish Online Journal of Educational Technology – January 2010, volume 9 Issue 1
Copyright The Turkish Online Journal of Educational Technology 17
Well, I’ve seen my teacher use a PowerPoint presentation to teach a lesson (3rd/4th grade). Also, I taught a lesson where the students used what is called Alpha Smarts which are specifically for word processing but they look like mini laptops, and the students composed their haikus onto these computer-like processor. I've also experienced my students working on interactive educational activities through the software or through the internet on the computers. (Female, Elementary Education)
Table 2: Findings related to technology experience.
Variable Frequency (f) Percentage (%) Duration of computer use 1-4 years 5 19.2 5-8 years 13 50.0 Over 8 years 8 30.8 Previous training taken about technology use? Yes 21 80.8 No 5 19.2 Prior experiences* Word processing 9 34.6 PowerPoint presentations 9 34.6 Internet 7 26.9 Web design 2 7.7 Concept mapping 2 7.7 Interactive games 2 7.7 None 6 23.1
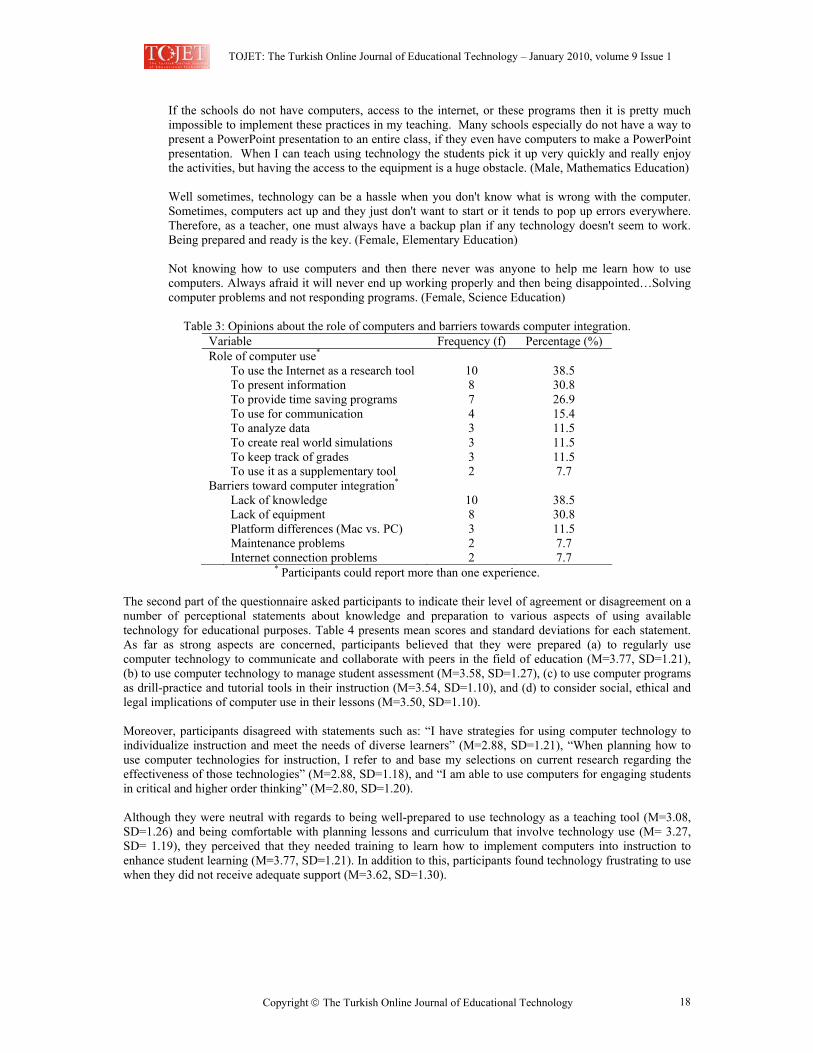
* Participants could report more than one experience. When participants were asked to indicate how computer technology should be used to improve teaching and learning, their responses included “to use the Internet as a research tool” (39%), “to present information” (31%), and “to provide time saving programs” (27%) (see Table 3). In addition, other responses were: “to use for communication” (15%), “ to analyze data” (12%), “to create real world simulations” (12%), “to keep track of grades” (12%), and “to use it as a supplementary tool” (8%). They thought that the ways of technology use depended on several factors including access, class time, required skills in current workplace, and so on. The followings are the examples of written comments on this issue:
It depends on accessibility. If student accessibility to computers are limited to a time slot in a computer lab once every two weeks, a teacher should utilize that time to teach the students as many basic navigational skills as possible, familiarizing them with programs like Excel and Word and of course, the Internet. However, if students have unlimited access to computers, the latest software upgrades, and teachers have a technical comprehension level beyond functional, computers should be used for developing web pages, creating power point presentations, so on. (Female, Secondary-English Education) I think there's a lot more to tackle in education than technology, but for people who have the means in their school systems; computers should be used mainly for research and for presenting reports…Also, if computers are available, writing assignments should be done in word-processing programs at the earliest possible age. (Male, Elementary Education) Students need instruction on the internet and the resources it can provide. Because this is a technology-based world, students should also be information of communication enhancement such as e-mail. It is also good for math and science when it comes to graphing and analyzing data. Lastly, it is helpful for presentations and publishing of writing works. (Female, Elementary Education)
In terms of obstacles to implement computer technology into teaching in their course work or in their early field experiences, 39% indicated “lack of knowledge”, 31% indicated “lack of equipment”, 12% indicated “platform differences (Mac vs. PC)”, and 8% indicated “maintenance problems” and “Internet connection problems”. Exemplary comments include:
I am not completely comfortable using them for presentations and everyday instruction. I need to gain further knowledge and more experience on the subject of computer technology…Also, the compatibility between Macs and IBMs because schools seem to be using Macs while many college student teachers like IBMs. (Female, Special Education)
TOJET: The Turkish Online Journal of Educational Technology – January 2010, volume 9 Issue 1
Copyright The Turkish Online Journal of Educational Technology 18
If the schools do not have computers, access to the internet, or these programs then it is pretty much impossible to implement these practices in my teaching. Many schools especially do not have a way to present a PowerPoint presentation to an entire class, if they even have computers to make a PowerPoint presentation. When I can teach using technology the students pick it up very quickly and really enjoy the activities, but having the access to the equipment is a huge obstacle. (Male, Mathematics Education) Well sometimes, technology can be a hassle when you don't know what is wrong with the computer. Sometimes, computers act up and they just don't want to start or it tends to pop up errors everywhere. Therefore, as a teacher, one must always have a backup plan if any technology doesn't seem to work. Being prepared and ready is the key. (Female, Elementary Education) Not knowing how to use computers and then there never was anyone to help me learn how to use computers. Always afraid it will never end up working properly and then being disappointed…Solving computer problems and not responding programs. (Female, Science Education)
Table 3: Opinions about the role of computers and barriers towards computer integration.
Variable Frequency (f) Percentage (%) Role of computer use* To use the Internet as a research tool 10 38.5 To present information 8 30.8 To provide time saving programs 7 26.9 To use for communication 4 15.4 To analyze data 3 11.5 To create real world simulations 3 11.5 To keep track of grades 3 11.5 To use it as a supplementary tool 2 7.7 Barriers toward computer integration* Lack of knowledge 10 38.5 Lack of equipment 8 30.8 Platform differences (Mac vs. PC) 3 11.5 Maintenance problems 2 7.7 Internet connection problems 2 7.7
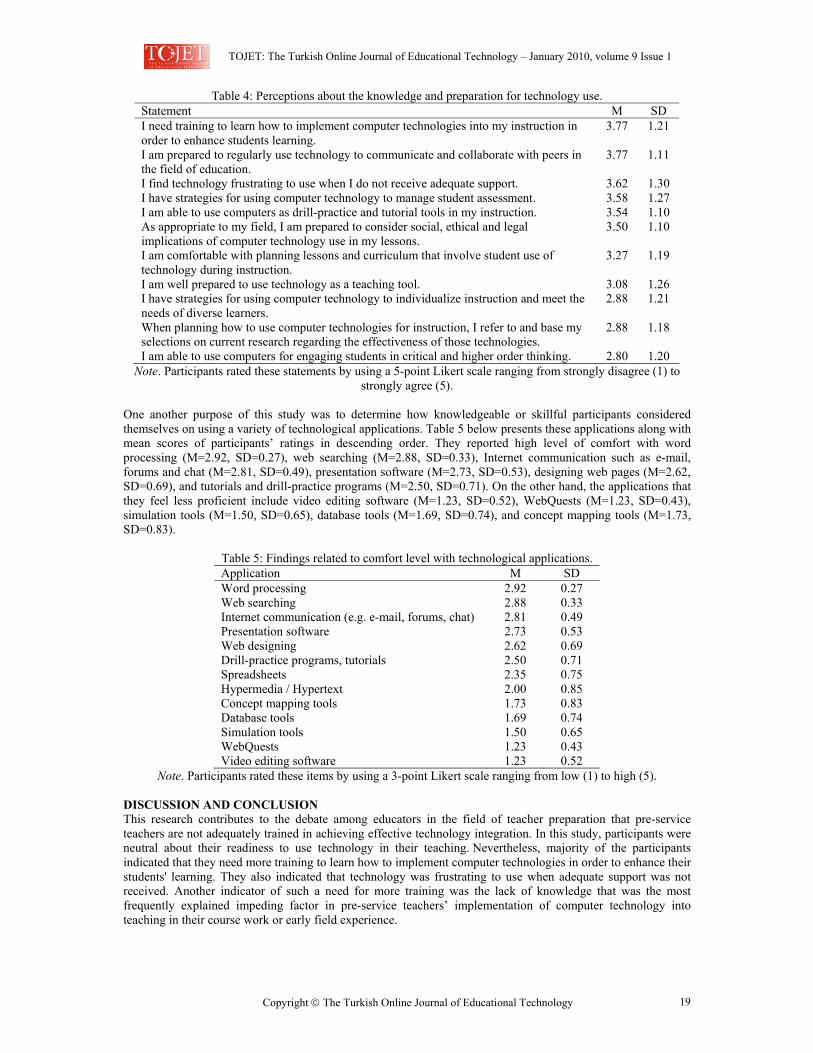
* Participants could report more than one experience. The second part of the questionnaire asked participants to indicate their level of agreement or disagreement on a number of perceptional statements about knowledge and preparation to various aspects of using available technology for educational purposes. Table 4 presents mean scores and standard deviations for each statement. As far as strong aspects are concerned, participants believed that they were prepared (a) to regularly use computer technology to communicate and collaborate with peers in the field of education (M=3.77, SD=1.21), (b) to use computer technology to manage student assessment (M=3.58, SD=1.27), (c) to use computer programs as drill-practice and tutorial tools in their instruction (M=3.54, SD=1.10), and (d) to consider social, ethical and legal implications of computer use in their lessons (M=3.50, SD=1.10). Moreover, participants disagreed with statements such as: “I have strategies for using computer technology to individualize instruction and meet the needs of diverse learners” (M=2.88, SD=1.21), “When planning how to use computer technologies for instruction, I refer to and base my selections on current research regarding the effectiveness of those technologies” (M=2.88, SD=1.18), and “I am able to use computers for engaging students in critical and higher order thinking” (M=2.80, SD=1.20). Although they were neutral with regards to being well-prepared to use technology as a teaching tool (M=3.08, SD=1.26) and being comfortable with planning lessons and curriculum that involve technology use (M= 3.27, SD= 1.19), they perceived that they needed training to learn how to implement computers into instruction to enhance student learning (M=3.77, SD=1.21). In addition to this, participants found technology frustrating to use when they did not receive adequate support (M=3.62, SD=1.30).
TOJET: The Turkish Online Journal of Educational Technology – January 2010, volume 9 Issue 1
Copyright The Turkish Online Journal of Educational Technology 19
Table 4: Perceptions about the knowledge and preparation for technology use. Statement M SD I need training to learn how to implement computer technologies into my instruction in order to enhance students learning.
3.77 1.21
I am prepared to regularly use technology to communicate and collaborate with peers in the field of education.
3.77 1.11
I find technology frustrating to use when I do not receive adequate support. 3.62 1.30 I have strategies for using computer technology to manage student assessment. 3.58 1.27 I am able to use computers as drill-practice and tutorial tools in my instruction. 3.54 1.10 As appropriate to my field, I am prepared to consider social, ethical and legal implications of computer technology use in my lessons.
3.50 1.10
I am comfortable with planning lessons and curriculum that involve student use of technology during instruction.
3.27 1.19
I am well prepared to use technology as a teaching tool. 3.08 1.26 I have strategies for using computer technology to individualize instruction and meet the needs of diverse learners.
2.88 1.21
When planning how to use computer technologies for instruction, I refer to and base my selections on current research regarding the effectiveness of those technologies.
2.88 1.18
I am able to use computers for engaging students in critical and higher order thinking. 2.80 1.20 Note. Participants rated these statements by using a 5-point Likert scale ranging from strongly disagree (1) to
strongly agree (5). One another purpose of this study was to determine how knowledgeable or skillful participants considered themselves on using a variety of technological applications. Table 5 below presents these applications along with mean scores of participants’ ratings in descending order. They reported high level of comfort with word processing (M=2.92, SD=0.27), web searching (M=2.88, SD=0.33), Internet communication such as e-mail, forums and chat (M=2.81, SD=0.49), presentation software (M=2.73, SD=0.53), designing web pages (M=2.62, SD=0.69), and tutorials and drill-practice programs (M=2.50, SD=0.71). On the other hand, the applications that they feel less proficient include video editing software (M=1.23, SD=0.52), WebQuests (M=1.23, SD=0.43), simulation tools (M=1.50, SD=0.65), database tools (M=1.69, SD=0.74), and concept mapping tools (M=1.73, SD=0.83).
Table 5: Findings related to comfort level with technological applications. Application M SD Word processing 2.92 0.27 Web searching 2.88 0.33 Internet communication (e.g. e-mail, forums, chat) 2.81 0.49 Presentation software 2.73 0.53 Web designing 2.62 0.69 Drill-practice programs, tutorials 2.50 0.71 Spreadsheets 2.35 0.75 Hypermedia / Hypertext 2.00 0.85 Concept mapping tools 1.73 0.83 Database tools 1.69 0.74 Simulation tools 1.50 0.65 WebQuests 1.23 0.43 Video editing software 1.23 0.52
Note. Participants rated these items by using a 3-point Likert scale ranging from low (1) to high (5). DISCUSSION AND CONCLUSION This research contributes to the debate among educators in the field of teacher preparation that pre-service teachers are not adequately trained in achieving effective technology integration. In this study, participants were neutral about their readiness to use technology in their teaching. Nevertheless, majority of the participants indicated that they need more training to learn how to implement computer technologies in order to enhance their students' learning. They also indicated that technology was frustrating to use when adequate support was not received. Another indicator of such a need for more training was the lack of knowledge that was the most frequently explained impeding factor in pre-service teachers’ implementation of computer technology into teaching in their course work or early field experience.
TOJET: The Turkish Online Journal of Educational Technology – January 2010, volume 9 Issue 1
Copyright The Turkish Online Journal of Educational Technology 20
Having found that more training is needed, it is now important to identify the content and delivery method of the training. Perhaps, these factors are rarely considered when it comes to planning technology training because more attention is often given to increase either the number of technological equipments or the weekly hours of training already existed. This study revealed that pre-service teachers have approximately five years of computer use and basic computer skills such as word processing, presentation tools and the Internet are the most frequently reported prior experiences with computer technology in teaching and learning. It is reasonable to assume that pre-service teachers may have come to teacher education programs with adequate expertise in such skills. In addition, the results illustrated that they were less knowledgeable about more advanced and emerging technological tools such as video editing software, databases, WebQuests, concept mapping tools and simulations. Therefore, these applications along with wide variety of activities should be emphasized in the content of additional training programs or educational technology courses. Moreover, pre-service teachers should be taught about the nature of technology and its alternative roles in educational contexts other than searching and presenting information and time saving applications. More emphasis should be put on the potential cognitive contributions of technology on teaching and learning. In this way, pre-service teachers could understand the pedagogical rationale underlying technology integration and develop more fruitful and high level technology-supported instructions. Teacher educators should model effective use of technology by incorporating it throughout the entire curriculum rather than exclusively offering stand-alone technology courses. The study indicated that pre-service teachers still use technologies within the objectivist model of teaching and learning. Most of the participants indicated that they feel comfortable using computers as drill-practice and tutorial tools in their instruction; however, they were not able to use computers to engage their students in critical and higher order thinking. In addition to this, almost half of them referred to and based their selections on current research regarding the effectiveness of technologies when planning how to use computer technologies for instruction. Hence, they need to be trained about current pedagogical theory and practice particularly in constructivist models of technology infusion. One way of having teachers to teach with a constructivist model of technology use is to teach them in a similar model of technology use during their pre-service education. On the whole, teacher education programs should provide pre-service teachers with learner-centered, collaborative, authentic and inquiry-based learning environments in order to help them understand how to use technologies as tools to enhance their teaching and students` learning. Such environments should be in the way to enable them to (a) generate technology-integrated instructional projects and strategies to address their questions, problems, and issues related to technology integration, (b) implement and evaluate their products to investigate in what kind of situations technology is really working effectively, and finally (c) share their experiences and findings with their peers. Even these trainings can be web-based and accessible at distance so that pre-service teachers can make use of these based on their own interests, pace, and time. Although one limitation of the data is small size of the sample, the outcomes of the study are promising and demonstrate the situation in teacher education programs. It is suggested that similar future studies especially more detailed case studies can be replicated using a larger number of participants. REFERENCES Albion, P. R. (2001). Some factors in the development of self-efficacy beliefs for computer use among teacher
education students. Journal of Technology and Teacher Education, 9, 321-347. Allsopp, D. H., McHatton, P. A., & Cranston-Gingras, A. (2009). Examining perceptions of systematic
integration of instructional technology in a teacher education program. Teacher Education and Special Education, 32(4), 337-350.
Benson, L. F., Farnsworth, B. J., Bahr, D. L., Lewis, V. K., & Shaha, S. H. (2004). The impact of training in technology assisted instruction on skills and attitudes of pre-service teachers. Education, 124(4), 649-663.
Brush, T., Glazewski, K., Rutowski, K., Berg, K., Stromfors, C., Van-Nest, M., et al. (2003). Integrating technology in a field-based teacher training program: The PT3@ASU project. Educational
Technology Research & Development, 51(1), 57-72. Brush, T., Glazewski, K. D., & Hew, K. F. (2008). Development of an instrument to measure preservice
teachers’ technology skills, technology beliefs, and technology barriers. Computers in the Schools, 25(1-2), 112-125.
Brush, T., & Saye, J.W. (2009). Strategies for preparing preservice social studies teachers to integrate technology effectively: Model and practices. Contemporary Issues in Technology and Teacher Education, 9(1), 46-59.
TOJET: The Turkish Online Journal of Educational Technology – January 2010, volume 9 Issue 1
Copyright The Turkish Online Journal of Educational Technology 21
Bullock, D. (2004). Moving from theory to practice: An examination of the factors that preservice teachers encounter as they attempt to gain experience teaching with technology during field placement experiences. Journal of Technology and Teacher Education, 12(2), 211-237.
Cuban, L. (2001). Oversold and underused: Computers in the classrooms. Cambridge, MA: Harvard University Press.
Cuckle, P., & Clarke, S. (2002). Mentoring student-teachers in schools: Views, practices and access to ICT. Journal of Computer Assisted Learning, 18, 330-340.
Doering, A., Lewis, C., Veletsianos, G., & Nichols-Besel, K. (2008). Preservice teachers’ perceptions of instant messaging in two educational contexts. Journal of Computing in Teacher Education, 25(1), 5-12.
Ertmer, P. A. (2005). Teacher pedagogical beliefs: The final frontier in our quest for technology integration? Educational Technology Research & Development, 53(4), 25-39.
Ertmer, P. A., Addison, P., Lane, M., Ross, E., & Woods, D. (1999). Examining teachers’ beliefs about the role of technology in the elementary classroom. Journal of Research on Computing in Education, 32, 54-72.
Goktas, Y., Yildirim, S., & Yildirim, Z. (2009). Main barriers and possible enablers of ICTs integration into pre-service teacher education programs. Educational Technology & Society, 12(1), 193-204.
Gunter, G. A., Gunter, R. E., & Wiens, G. A. (1998). Teaching pre-service teachers technology: An innovative approach. Proceedings of the Ninth International Conference of the Society for Information Technology & Teacher Education, USA, 224-227.
Hasselbring, T. S., Smith, L., Glaser, C. W., Barron, L., Risko, V., & Snyder, C., et al. (2000). Literature review: Technology to support teacher development. Washington, DC: National Partnership for Excellence and Accountability in Teaching. (ERIC Document Reproduction Service No. ED448159).
Hew, K. F., & Brush, T. (2007). Integrating technology into K-12 teaching and learning: Current knowledge gaps and recommendations for future research. Educational Technology Research & Development, 55(3), 223-252
Herner-Patnode, L. M., & Lee, H. J. (2009). A capstone experience for preservice teachers: Building a web-based portfolio. Educational Technology & Society, 12(2), 101-110.
Howard, B. C., McGee, S., Schwartz, N., & Purcell, S. (2000). The experience of constructivism: Transforming teacher epistemology. Journal of Research on Computing in Education, 32, 455-465.
Iding, M. K., Crosby, M. E., & Speitel, T. (2002). Teachers and technology: Beliefs and practices. International Journal of Instructional Media, 29(2), 153-170.
Karchmer-Klein, R. (2007). Reexamining the practicum placement: How to leverage technology to prepare preservice teachers for the demands of the 21st century. Journal of Computing in Teacher Education, 23(4), 121-129.
Keeler, C. G. (2008). When curriculum and technology meet: Technology integration in methods courses. Journal of Computing in Teacher Education, 25(1), 23-30.
Lei, J. (2009). Digital natives as preservice teachers: What technology preparation is needed? Journal of Computing in Teacher Education, 25(3), 87-97.
Metiri Group (2001). Faculty technology survey. http://tools.metiri.com/survey/samples/FacultySurveySample.pdf
Niederhauser, D. S., & Stoddart, T. (2001). Teachers’ instructional perspectives and use of educational software. Teaching and Teacher Education, 17, 15-31.
Park, S. H., & Ertmer, P. A. (2008). Impact of problem-based learning (PBL) on teachers’ beliefs regarding technology use. Journal of Research on Technology in Education, 40(2), 247-267.
Rizza, M. G. (2000). Perspectives on preservice teachers' attitudes toward technology. The Teacher Educator, 36, 132-147.
Schoep, K. W. (2004). Technology integration barriers in a technology-rich environment: A CBAM perspective. Unpublished master’s thesis, University of Calgary, Alberta.
Stone, C. (1998). Overcoming resistance to technology. The Delta Kappa Gamma Bulletin, 64(2), 15-19. Turkmen, H., Pedersen, J. E., & McCarty, R. (2007). Exploring Turkish pre-service science education teachers’
understanding of educational technology and use. Research in Comparative and International Education, 2(2), 162-171.
Vannatta, R. A., & Beyerbach, B. (2000). Facilitating a constructivist vision of technology integration among education faculty and preservice teachers. Journal of Research on Computing in Education, 33, 132-148.
Vermillion, J., Young, M., & Hannafin, R. (2007). An academic technology initiative for teacher preparation candidates: Implications for preservice teacher programs. Journal of Computing in Teacher Education, 23(3), 99-104.
Watson, G. (1997). Pre-service teachers’ views on their information technology education. Technology, Pedagogy and Education, 6(3), 255-270.
Whetstone, L., & Carr-Chellman, A. A. (2001). Preparing preservice teachers to use technology: Survey results. TechTrends, 45(4), 11-17.

TOJET: The Turkish Online Journal of Educational Technology – January 2010, volume 9 Issue 1
Copyright The Turkish Online Journal of Educational Technology 22
Wong, S. L., & Hanafi, A. (2007). Gender differences in attitudes towards information technology among Malaysian student teachers: A case study at Universiti Putra Malaysia. Educational Technology & Society, 10(2), 158-169.
TOJET: The Turkish Online Journal of Educational Technology – January 2010, volume 9 Issue 1
Copyright The Turkish Online Journal of Educational Technology 23
AN INITIAL COMPARISON OF EDUCATIONAL TECHNOLOGY COURSES FOR TRAINING TEACHERS AT MALAYSIAN UNIVERSITIES: A COMPARATIVE
STUDY
Mona MASOOD Centre for Instructional Technology and Multimedia, Universiti Sains Malaysia, 11800 Minden, Malaysia -
[email protected] ABSTRACT Introducing a course in educational technology is vital especially to pre-service teachers in establishing early interest and long term habits. The initial disclosure and guidance in educational technology will determine the technique of beginning teachers at integrating ICT into their teaching-learning activities. Educators should feel comfortable in the utilization and deployment of proper instructional techniques. This is to ascertain the continuity of knowledge and skills obtained during the training program and consequently transfer in the real teaching situation. Institutions of higher learning that offers an undergraduate degree in education will include at least a course in the foundation of educational technology. However, the contents and emphasis of the curriculum differs from one institution to the next. Thus, there should be a standard or an indicator that essential areas of educational technology be met by pre-service teachers. This paper reports a small part of a larger ongoing research on the standards of ICT training curriculum and strategies for pre-service teachers throughout Malaysia. Specifically the curriculum and strategies at four local universities will be compared to the revised International Society for Technology in Education’s (ISTE’s) 2008 National Educational Technology Standards for teachers (NETS T). An analysis of the extent of training curriculum in which the program adhere to the standards and the development of the field will be discussed. Keywords ICT, educational technology, pre-service teacher INTRODUCTION Over the past couple decades the development of media technology has seen changes in the tendency of using and incorporating various available technology in schools over the world. In Malaysia, educators are strongly encouraged to utilize these media technology (in particular computers) since the government has injected billions of ringgit in the expenditure of restructuring the school technology infrastructure besides providing appropriate equipment including computers, software, courseware, and training since the early 1980s. Now, Information Communication and Technology (ICT) in schools has gained prominence and this can be observed globally as the movement of educational media shifts from educational radio to educational TV and to computer-based instruction. The incorporation of ICT in the classroom is deemed essential and one is expected to decide, explore, apply, and evaluate information efficiently. With proper equipment in place, teachers are expected to utilize these media technology in their teaching. However, teaching with technology requires knowledge in the area of educational technology. Thus, pre-service teachers (or student teachers) should have a foundation of what this demands. The Association of Educational Communications and Technology (AECT) defines Educational Technology as “the theory and practice of design, development, utilization, management, and evaluation of processes and resources for learning” (Seels & Richey, 1994). This definition has been principally used by educators worldwide. As seen by many practitioners, educational technology is a complex field but can be simplified to mean the method of applying apt instructional approaches (such as direct, indirect, interactive, and experiential) in delivering education with the proper use of medium or tools (such as models, charts, videos, and computers). It is irrefutable that much research has looked into the success of pre-service teacher programs and many have concluded that several institutions of higher learning have failed to appropriately prepare pre-service teachers with positive experiences and an insight into the potential of educational technology (Becker, 1999; Gunter, 1999; Gunter, 2001; Roblyer & Edwards, 2000). At institutions of higher learning the exposure to the foundation of educational technology and in turn, ICT, a sub discipline, will have been introduced in any Bachelor’s degree in education. As defined by UNESCO (2006-2008), ICT refers to “forms of technology that are used to transmit, store, create, display, share or exchange information by electronic means. This broad definition of ICT includes such technologies as radio, television, video, DVD, telephone (both fixed line and mobile phones), satellite systems, computer and network hardware and software; as well as the equipment and services associated with these technologies, such as videoconferencing, e-mail and blogs.”
TOJET: The Turkish Online Journal of Educational Technology – January 2010, volume 9 Issue 1
Copyright The Turkish Online Journal of Educational Technology 24
The preliminary training on ICT—that is found in any educational technology foundation class—will establish the habits of beginning teachers in integrating ICT in their teaching and learning activities at schools. Besides, strategies and curriculum may differ from one institution of higher learning to the next. Consequently, the relevance of the curriculum provided by these institutions of higher learning with respect to the development of ICT in education should be scrutinized. Therefore, the intent of this paper is to report a small part of the larger ongoing research under Universiti Sains Malaysia’s short term grant on the standards of ICT training curriculum and strategies for pre-service teachers throughout Malaysia. Specifically, the curriculum and strategies used at four local universities, Universiti Sains Malaysia (USM), Universiti Kebangsaan Malaysia (UKM), Universiti Putra Malaysia (UPM), and Universiti Malaysia Sabah (UMS), will be compared to the International Society for Technology in Education (ISTE) 2008 National Educational Technology Standards for teachers (NETS T). International Society for Technology in Education (ISTE) National Educational Technology Standards (NETS) ISTE is the professional education organization responsible for recommending guidelines for accreditation for programs in educational computing and technology teacher preparation in the United States. The ISTE NETS T was first established in 2000 that focuses on pre-service teacher education and provides a framework for implementing technologies in teaching and learning. Conversely, the first ISTE NETS for students’ (NETS S) framework was issued in 1998 and has been widely used by 45 U.S. states (Devaney, 2007). However, in 2007, the ISTE NETS S was refreshed to meet demands of advancing technology as well as a changed economy; that include societal, learning, technological and economic landscapes evolvement. In turn, it is inescapable that the NETS T should be revised as well. ISTE released the new NETS T during the 29th Annual National Education Computing Conference (NECC) at San Antonio in July of 2008. Briefly, NETS T and Performance Indicators 2008 guideline emphasizes five areas in which teachers should: 1. Facilitate and Inspire Student Learning and Creativity 2. Design and Develop Digital-Age Learning Experiences and Assessments 3. Model Digital-Age Work and Learning 4. Promote and Model Digital Citizenship and Responsibility 5. Engage in Professional Growth and Leadership
(Adapted from the ISTE NETS for Teachers, 2008)
The NETS T hopes to ensure that teachers have the set of skills that should transfer over to students. In consequence students will perform and benefit in using technology in appropriate ways. With the standards for students specified, teachers are more aware and have the responsibility to ensure that the standards are met. Before that can happen they themselves need to be apt at using, applying, and integrating technology into their classrooms. For pre-service teachers, they will have to go through a basics course in educational technology especially in their education program to better equip them when they are in the field. Preliminary Research Questions The preliminary research questions include: a. To what extent is the ICT training program for pre-service teachers conducted at universities in Malaysia comparable to ISTE 2008 NETS T? b. Is there a knowledge and skills gap between pre-service teacher training programs conducted at universities in Malaysia with the ISTE 2008 NETS T? c. What is the training strategies used to train pre-service teachers in the field of ICT in education at these four universities? METHOD Sampling Even though Malaysia has a total of twenty public universities, only nine universities were identified that offers a Bachelor degree in Education including: USM, UPM, UKM, UM, UMS, UniMAS, UTM, UPSI, and UUM. Data were gathered for all these universities but for this paper, only four institutions, randomly chosen, USM, UKM, UPM, and UMS were analyzed (a sample size deemed appropriate, 44% of the population). These institutions offer at least one educational technology core course and have similar objectives at providing ample experience in understanding, learning, applying, and integrating educational technology into their pre-service teaching practices respectively.
TOJET: The Turkish Online Journal of Educational Technology – January 2010, volume 9 Issue 1
Copyright The Turkish Online Journal of Educational Technology 25
Data Collection Data collection started between March and September 2008 and were collected from document analyses, i) review of documents related to ISTE 2008 NETS T education guideline and ii) documents of ICT based course curricula and course outlines for pre-service teachers from faculties of education at the four universities. Interview Session Five course coordinators were interviewed (each from USM, UKM, UPM, and two from UMS) to elicit course content, structure and delivery method as well as for triangulation purposes. An interview protocol was administered with a few open-ended questions posed to seek further clarification when deemed necessary. The summarization from the interview and content analysis are reported in the findings. FINDINGS Extent of ICT training program for pre-service teachers at the Malaysian universities comparable to the ISTE NETS T 2008 All four universities offers a three credit hour course on specifically Educational Technology that combines the theoretical and practical aspects of the field. Table 1 shows a snapshot of NETS and a brief description of parts of the course content of the four local universities that meet the standards laid out by ISTE. The extent of ICT training for pre-service teachers in all cases ranges from basic to intermediate knowledge and skills. Hands-on project varies at the universities emphasizing different aspects. The ICT training program at USM offers one mandatory course for all pre-service teachers pursuing a Bachelor degree in education (excluding Bachelor of Education—TESOL and Interactive Multimedia students). The program considers an overall approach that includes the theoretical aspects of educational technology and emphasizes intermediate skills on Microsoft Office application software. On the application side, major projects include a PowerPoint presentation (designed for a two period lesson) and a website on blogging. In contrast, UMS has two mandatory courses for their pre-service teacher pursuing a generic Bachelor degree in education program. The courses are designed so that pre-service teachers establish contacts and a strong rapport with the state education resource centre. Their pre-service teachers also need to develop a courseware that requires the pre-service teachers to learn skills in various aspects of multimedia development. However, this university separates out the theoretical component which is emphasized in one course, Technology and Educational Resource Centre, from the more computer focused course, Computer and Multimedia in Education course. Similar to UMS, UKM offers a course in Computer Education and Educational Technology for their BEd degree. One interesting finding is that the technique of using and designing transparencies is still prevalent although digital modes of presenting are taught. Likewise, UPM too find the necessity to maintain the importance of transparencies but a special emphasis is given to charts. This is because many schools throughout Malaysia are still using these medium and the need exist. Knowledge skills gap between pre-service teacher training programs at Malaysian universities with the ISTE NETS T 2008 Skills obtained during pre-service teacher training program at the four universities are seen to be highly in line with the older ISTE NETS 2000 but only at an average to the newer ISTE NETS T 2008. The first component, Facilitate and Inspire Student Learning and Creativity, all four universities met this standard with varying performance in preparing their pre-service teachers. However, there is a lack on part of component two, Design and Develop Digital-Age Learning Experiences and Assessments. The educational technology curriculum lack in providing students with multiple and varied formative and summative assessments except in theory, but these can be found in other core or elective courses. Component three, Model Digital-Age Work and Learning, is highly met since the skills and knowledge they gained during the education technology class is incorporated and demonstrated in other new technologies and applied in other courses throughout their study. Promote and Model Digital Citizenship and Responsibility, the fourth standard is stressed throughout the whole course. The fifth component, Engaging in Professional Growth and Leadership, pre-service teachers have yet to participate in local and global learning communities to ensure creative applications of technology to improve student learning apart from the UMS curriculum.
Training strategies use to train pre-service teachers in the field of ICT in education
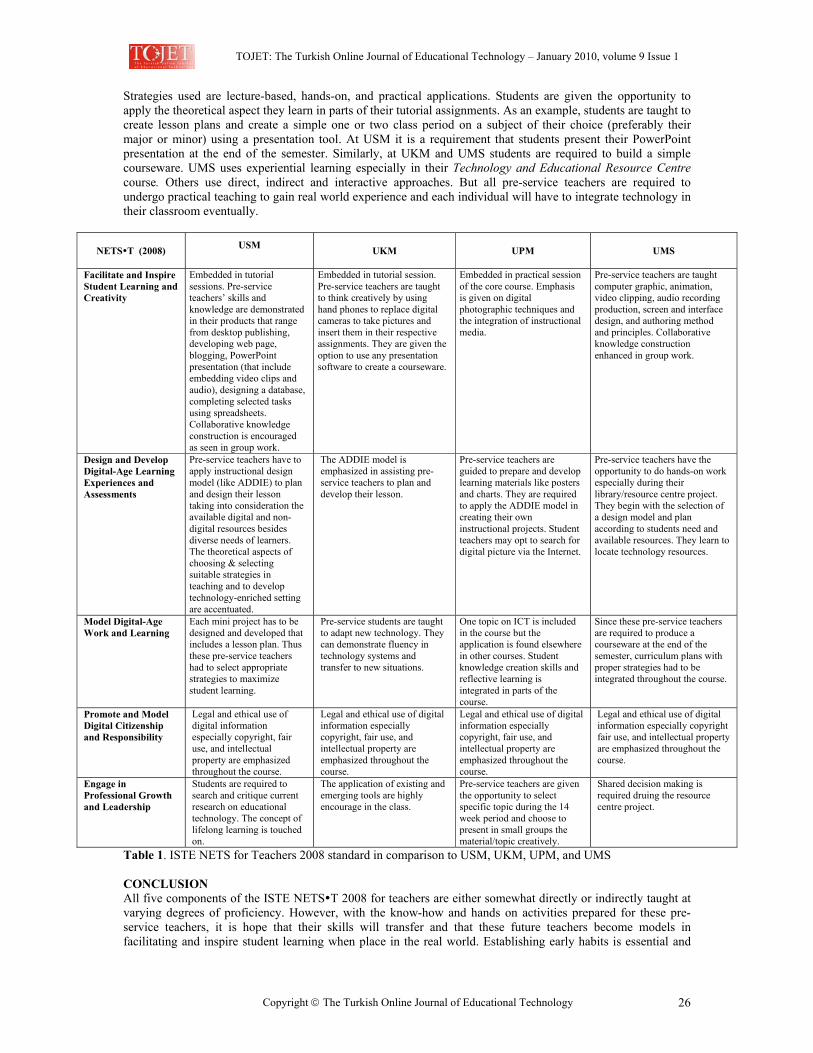
TOJET: The Turkish Online Journal of Educational Technology – January 2010, volume 9 Issue 1
Copyright The Turkish Online Journal of Educational Technology 26
Strategies used are lecture-based, hands-on, and practical applications. Students are given the opportunity to apply the theoretical aspect they learn in parts of their tutorial assignments. As an example, students are taught to create lesson plans and create a simple one or two class period on a subject of their choice (preferably their major or minor) using a presentation tool. At USM it is a requirement that students present their PowerPoint presentation at the end of the semester. Similarly, at UKM and UMS students are required to build a simple courseware. UMS uses experiential learning especially in their Technology and Educational Resource Centre course. Others use direct, indirect and interactive approaches. But all pre-service teachers are required to undergo practical teaching to gain real world experience and each individual will have to integrate technology in their classroom eventually.
NETS T (2008) USM UKM UPM UMS
Facilitate and Inspire Student Learning and Creativity
Embedded in tutorial sessions. Pre-service teachers’ skills and knowledge are demonstrated in their products that range from desktop publishing, developing web page, blogging, PowerPoint presentation (that include embedding video clips and audio), designing a database, completing selected tasks using spreadsheets. Collaborative knowledge construction is encouraged as seen in group work.
Embedded in tutorial session. Pre-service teachers are taught to think creatively by using hand phones to replace digital cameras to take pictures and insert them in their respective assignments. They are given the option to use any presentation software to create a courseware.
Embedded in practical session of the core course. Emphasis is given on digital photographic techniques and the integration of instructional media.
Pre-service teachers are taught computer graphic, animation, video clipping, audio recording production, screen and interface design, and authoring method and principles. Collaborative knowledge construction enhanced in group work.
Design and Develop Digital-Age Learning Experiences and Assessments
Pre-service teachers have to apply instructional design model (like ADDIE) to plan and design their lesson taking into consideration the available digital and non-digital resources besides diverse needs of learners. The theoretical aspects of choosing & selecting suitable strategies in teaching and to develop technology-enriched setting are accentuated.
The ADDIE model is emphasized in assisting pre-service teachers to plan and develop their lesson.
Pre-service teachers are guided to prepare and develop learning materials like posters and charts. They are required to apply the ADDIE model in creating their own instructional projects. Student teachers may opt to search for digital picture via the Internet.
Pre-service teachers have the opportunity to do hands-on work especially during their library/resource centre project. They begin with the selection of a design model and plan according to students need and available resources. They learn to locate technology resources.
Model Digital-Age Work and Learning
Each mini project has to be designed and developed that includes a lesson plan. Thus these pre-service teachers had to select appropriate strategies to maximize student learning.
Pre-service students are taught to adapt new technology. They can demonstrate fluency in technology systems and transfer to new situations.
One topic on ICT is included in the course but the application is found elsewhere in other courses. Student knowledge creation skills and reflective learning is integrated in parts of the course.
Since these pre-service teachers are required to produce a courseware at the end of the semester, curriculum plans with proper strategies had to be integrated throughout the course.
Promote and Model Digital Citizenship and Responsibility
Legal and ethical use of digital information especially copyright, fair use, and intellectual property are emphasized throughout the course.
Legal and ethical use of digital information especially copyright, fair use, and intellectual property are emphasized throughout the course.
Legal and ethical use of digital information especially copyright, fair use, and intellectual property are emphasized throughout the course.
Legal and ethical use of digital information especially copyright fair use, and intellectual property are emphasized throughout the course.
Engage in Professional Growth and Leadership
Students are required to search and critique current research on educational technology. The concept of lifelong learning is touched on.
The application of existing and emerging tools are highly encourage in the class.
Pre-service teachers are given the opportunity to select specific topic during the 14 week period and choose to present in small groups the material/topic creatively.
Shared decision making is required druing the resource centre project.
Table 1. ISTE NETS for Teachers 2008 standard in comparison to USM, UKM, UPM, and UMS CONCLUSION All five components of the ISTE NETS T 2008 for teachers are either somewhat directly or indirectly taught at varying degrees of proficiency. However, with the know-how and hands on activities prepared for these pre-service teachers, it is hope that their skills will transfer and that these future teachers become models in facilitating and inspire student learning when place in the real world. Establishing early habits is essential and
TOJET: The Turkish Online Journal of Educational Technology – January 2010, volume 9 Issue 1
Copyright The Turkish Online Journal of Educational Technology 27
could make them feel more confident in their ability to conduct classes especially to teach with technology and to consistently model digital citizenship and responsibility highly. The finding shows that these universities use different approaches with some similarity in course content in conveying what entails educational technology (including, ICT). In comparison to the ISTE NETS T 2008, all components would have been met exceptionally well by all four universities to the older ISTE NETS T 2000. The curriculum at all four universities need to emphasize more on the digital-age learning experiences and engage in professional growth and leadership. It is imperative that faculty/lecturers guide pre-service teachers to teach with technology in the actual classroom and to provide them with skills that will enhance their technology abilities especially taking into account the emphasis on digital-age learing experiences. It is no longer sufficient to pre-service teachers with skills and knowledge but the practical aspect has to be integrated so that these teachers will feel comfortable using technology. Although the knowledge skills gap do not seem to exist within the four cases, other factors should be considered so that the courses offered can be further strengthened. It is also very important that other higher institutions around the world be conscious with evolving technology by revising their curriculum often (at least once every 3-5 years) to meet societal needs and expectation to move towards a higher quality of human capital. Since this is a preliminary finding, a matrix can be sketched to look at further similarities and differences in the final analysis of the whole project. This project can also stretch out to other curriculum by comparing their own curriculum to existing standards or match it up to world standards. REFERENCES Becker, H. J. (1999). Internet use by teachers, Center for Research on Information Technology and
Organizations (CRITO). Available: http://www.crito.uci/edu/TLC/findings/Internet-Ues/startpage.htm. Gunter, G. A. (1999). Finding new avenues for motivating preservice teachers by Web enhancing technology
course, Technology and Teacher Education 1999 Annual, 224-227. Available: http://discovery.coe.uh.edu/downloads/ aace/stie/default.htm.
Gunter, G. A. (2001). Making a difference: Using emerging technologies and teaching strategies to restructure an undergraduate technology course for pre-service teachers. Education Media International [Online]. Available: http://www.tandf.co.uk/journals.
International Society for Technology in Education. (2007). National Educational Technology Standards [Online], Available: http://cnets.iste.org.
Roblyer, M. C. & Edwards, J. (2000). Integrating technology into teaching. NJ: Prentice-Hall, Inc. Seels, B. B. & Richey, R. C. (1994). Instructional technology: The definition and domains of the field.
Washington, DC: Association for Educational Communications and Technology. UNESCO. (2006-2008). Technologies [Online]. Available: http://www.unescobkk.org/education/education-
units/ict-in-education/technologies
TOJET: The Turkish Online Journal of Educational Technology – January 2010, volume 9 Issue 1
Copyright The Turkish Online Journal of Educational Technology
28
ANTECEDENTS OF ICT ATTITUDES OF DISTANCE EDUCATION STUDENTS
Rugayah HASHIMa*, Hashim AHMADb, Che Zainab ABDULLAHc aFaculty of Administrative Science and Policy Studies, UiTM
b,cInstitute of Education Development, Universiti Teknologi MARA (UiTM) *[email protected]
ABSTRACT The objective of this study was to assess the antecedents of ICT attitudes of distance education (e-PJJ) students at the Institute of Education Development (InED), UiTM. The antecedents studied were computer anxiety, confidence, liking and, usefulness. The findings are important to strengthen InED’s policy for using ICT and other technologies to impart knowledge and education at the diploma and undergraduate levels. Five hundred students were the units of analysis for this study and the response rate was 56.8%. Even in this Information Age, the findings showed that there are still some students who are uncomfortable with using ICT or educational technology for e-learning. Keywords: Computer attitude, e-learning, ICT usage, distance education, computer phobia. INTRODUCTION University Technology Mara (UiTM) Shah Alam is the oldest and biggest public institution of higher learning in Malaysia. In the Shah Alam campus alone, the student population comes to about 150,000 of which more than 5,000 are following various diploma and undergraduate programs via the e-learning mode (UiTM Strategic Planning Center, 2007). It is an affirmative action university set up by the government of Malaysia to correct the economic and social imbalances that occurred amongst the various races in Malaysia. A good academic qualification will guarantee a person to a well-paid job and hence enjoy a better standard of living. In certain circumstances it can lead one’s family out of poverty. Almost ninety percent of students are of the Malay race while the remaining balance of ten percent consists of various indigenous races. Distance learning program was offered by the university with the aim of providing opportunities for the working population in Malaysia to further their study. All students who enrolled in InED’s e-PJJ program are working adult and have at least a year working experience. Distance learning in InED UiTM is being done through blended learning. Beside a two-hour face-to-face meeting per course per month (ten hours per semester), students were supplied with self-instructional materials or study guide to help them with their learning. The face-to-face meeting that is known as seminar only permits the course facilitator to conduct discussion with their students. One of UiTM’s objectives is to educate the students to become professionals of high caliber who will be independent, knowledgeable and morally upright in the conduct of competing in business, trade, science and technology. With this objective in mind, it is crucial that UiTM students realize that computers are ubiquitous, that is, computers have invaded all aspects of our lives and therefore, the anxiety, nervousness, computer phobia or any dislike towards computers should not be inherent in them. Furthermore, in the Information Era, ICT is the foundation for all of our needs. Thus the policy makers of InED was far-sighted and wise to make the decision to shift its conventional distance learning to electronic distance learning or e-PJJ in 1997. The embarkation from conventional distance learning to e-PJJ marked a new era of learning in Malaysia. It was a bold move then, taking into consideration the low level of ICT literacy among the students, lack of accessibility and insufficient financial support from the university. Problems aside, the desire to elevate InED’s distance learning program to a formidable level as well as technologically innovative, a smart partnership with a technology provider was duly concluded. e-PJJ was introduced by InED in the first place with the hope of enhancing students learning due to limited time for interaction with the course facilitator during seminars. Through e-PJJ, students should be able to communicate, discuss and interact with their facilitators and colleagues via on-line or the internet anywhere and at anytime convenient to them. Additional course materials can be posted on-line and easily access by students twenty-four hours a day. Time is not a limiting factor anymore for students to interact and engage in their study, and for the facilitators to impart knowledge to them. Education in Malaysia Malaysia looks to education as the key to its socio-economic development particularly in the Knowledge Economy. Furthermore, with the dawn of the new millennium a market-sensitive education system is evolving
TOJET: The Turkish Online Journal of Educational Technology – January 2010, volume 9 Issue 1
Copyright The Turkish Online Journal of Educational Technology
29
here in Malaysia and strategic plans have been concocted by the Federal Government to make Malaysia the education hub of Asia. According to the web site of the Ministry of Higher Education Malaysia (2008), “Our schools and universities are taking up the challenge of globalization by changing not only the content of curriculum and programs but more importantly the delivery systems. IT-enhanced teaching and learning are already making computers in schools, distance learning, video conferencing and internet link a common place for interaction. We have to race ahead to achieve a significant transformation of our educational infrastructure in order to meet the next millennium as a technologically competent and scientifically adapt society.” With this goal in mind, Malaysia hopes to become a fully industrialized country by the 21st century because by that time, the young person entering the workforce will be judged not so much on the knowledge and skills acquired, but on the capacity for lateral thinking, creativity and an integrated approach to learning. Again, according to the Ministry of Education’s (2008) web site, “The university system is expected to bridge the fundamental shift from an information-based society to a knowledge-based one. Malaysia is therefore putting in place the ‘hardware’ and ‘software’ to equip students to take advantage of the opportunities offered by an increasingly inter-connected world.” Technology and Change in Malaysia In this Digital Era, the world of work has changed considerably. The proliferation of personal computers throughout the business environment will continue to place demands on workers at all levels to develop proficient computer skills. The nature of work will be more complex, and the demand will be for a new type of industrial worker, that is for one who will be able to deal with machines and computers in his daily work. The Knowledge Era has arrived and as internet technology become pervasive and cheap, it will offer an enormous opportunity to diminish a different, but real divide (Compaine, 2001). This is the critical divide between those who can read well and take full advantage of the treasures of information that will be so widely available and those who are not fully computer literate and, cannot take advantage of easily accessible information resources provided by ICT. The ICT advantage as set out by the Malaysian Ministry of Education in its web site states the science and technology, commerce and industry and even the arts and humanities have been swept along by the powerful currents of the Information Revolution. Therefore, the Ministry of Higher Education (2008) has responded by implementing wide-ranging reforms to give schools, universities and other higher education institution skills and competence to ride the crest of the IT wave. “Already the education system is putting interactive IT at the core of the teaching and learning and, management process. Smart Schools are being set up where learning will be dynamic, lively and brimming with interaction through the use of multimedia technology and worldwide networking” (Ministry of Higher Education, 2008). Capron (1987) made several statements relating to the computer in our future, which include: there will be a computer on almost every desk by mid-1990s; the computer will lead the way in increased productivity; and computer-based word processing will be the means of recording and transmitting the written word – typewriters will be in museums. The effective application and exploitation of information technology for national socio-economic growth and development in Malaysia is now at a critical state. Emerging cultural, social and economic trends arising from the pervasive use of information technology have indicated that information and knowledge of computers are also strategic factors besides land, labor, capital and entrepreneurship in determining the future potentials of our nation. Today, skills, concepts, information and knowledge are the new tools of competition. Human skills and knowledge of computer technology will play a significant role in the national drive to achieve a fully developed country status. The Information Technology advantage as written on the web site of the Ministry of Education, Malaysia, states that “Science and technology, commerce and industry and even the arts and humanities have been swept along by the powerful currents of the Information Revolution. The Ministry of Higher Education (2008) has responded by implementing wide-ranging reforms to give schools, universities and other higher education institution the skills and competence to ride the crest of the IT wave.” STATEMENT OF THE PROBLEM The problem of the study was gauging the attitudes toward ICT of e-PJJ students at the Institute of Education Development (InED), UiTM. This problem cropped up when these students requested to have more face-to-face seminars when their mode of learning and teaching was through the use of ICT. By having more traditional teaching would defeat the purpose of having e-learning for InED, UiTM. In addition, feedbacks received from the distance learners through InED’s public forum showed that the use of computers as a mode of education exchange do not augur well for them. Thus, this study was conducted at an
TOJET: The Turkish Online Journal of Educational Technology – January 2010, volume 9 Issue 1
Copyright The Turkish Online Journal of Educational Technology
30
appropriate time as both parties need to have a win-win situation. The identification of attitudes relating to age, education background, program registered for, gender, work sector and level of computer usage would support the research hypotheses. Also, the relationship of these demographic variables with computer usefulness, confidence, liking and anxiety would provide sufficient empirical evidence for InED to adjust to the students’ needs. Furthermore, the findings from this study would be relevant as one of the sources of reference for other institutions of higher learning that offers e-learning programs and courses. By improving the condition of the curricula, the top management of InED and UiTM would be able to ascertain the ICT needs and trends and to suggest recommendations for changes. Research Objective The objective of this study is to determine the students’ attitudes toward ICT relative to age, qualification, program registered for, gender, and computer skill level. RESEARCH APPROACH AND METHODOLOGY This study will employ the usual traditional approach to descriptive and practical research with quantitative analyses used to derive the empirical evidence that would answer the research questions (Coakes, 2005; Sekaran, 2003; Heiman, 2001). Cross-sectional and convenience sampling techniques were used to determine the scope and unit of analysis (Coakes, 2005; Sekaran, 2003; Heiman, 2001). The instrument used has been pre-designed, that is, the questionnaire was replicated from Loyd and Gressard’s (1988) study. Previous researches using the same questionnaire for example, Hashim and Mustapha (2004) and Hashim, Latiff and Kassim (2007) have proved the validity and reliability of the instrument. For this study, the Cronbach Alpha score was 0.869, which means that this questionnaire is valid and reliable. As mentioned before, the purpose of this study was to gather information concerning the attitudes toward information and communication technologies (ICTs) of distance education students at InED, UiTM. The four attitudes are anxiety, confidence, liking and usefulness. Consequently, these attitudes will be correlated with the six demographic variables such as gender, age, level of education, and previous computer experience. Sample Size and Sampling Techniques 500 respondents were targeted for this research. This number is 10% of the overall population of distance education learners registered with InED, UiTM. Two sampling techniques were employed; cross-sectional and convenience samplings. Cross-sectional sampling technique was used in order to obtain samples at a single point in time where exposure and outcome are simultaneously determined (Coakes, 2005; Sekaran, 2003; Heiman, 2001). The second sampling technique is convenience sampling. This technique is required as the questionnaires were given to respondents who were conveniently available when they were distributed by the research assistant (Coakes, 2005; Sekaran, 2003; Heiman, 2001).
Measurement and Instrument Design The instrument used in this study was replicated from the revised version of the Survey of Attitudes Towards Learning About and Working with Computers which was developed by Dr. Brenda H. Loyd and Dr. Clarice P. Gressard (1984). Using the permission granted by Dr. Brenda Loyd’s assistant, Sandra L. West, University of Virginia, U.S.A, in September of 2001, the questionnaire was reproduced to fit with the research setting undertaken including translating the questionnaire to Bahasa Malaysia (Malay Language). The instrument consisted of two sections. Section A dealt with the demographic profiles of the respondents. These questions provided data for categorical analyses of responses. On the other hand, Section B consisted of 40 statements rated on a five-point Likert scale from ‘1=Strongly Agree’ to ‘5=Strongly Disagree’. Of these 40 statements, 20 were worded positively and 20 were worded negatively. Procedure Five hundred sets of questionnaires were administered to the students in the various classrooms. This occurred whilst the students were attending their various seminars at UiTM’s International Education Center (INTEC) Campus, Section 17, Shah Alam, Selangor. Data analysis Data were analyzed using the Statistical Package for Social Science (SPSS) software. The demographic variables for this study were discrete data (nominal and ordinal), therefore, descriptive statistics were used to run for frequencies, mean, and standard deviation (Coakes, 2005; Beins, 2004; Sekaran, 2003; Stangor, 2004; Blaikie,
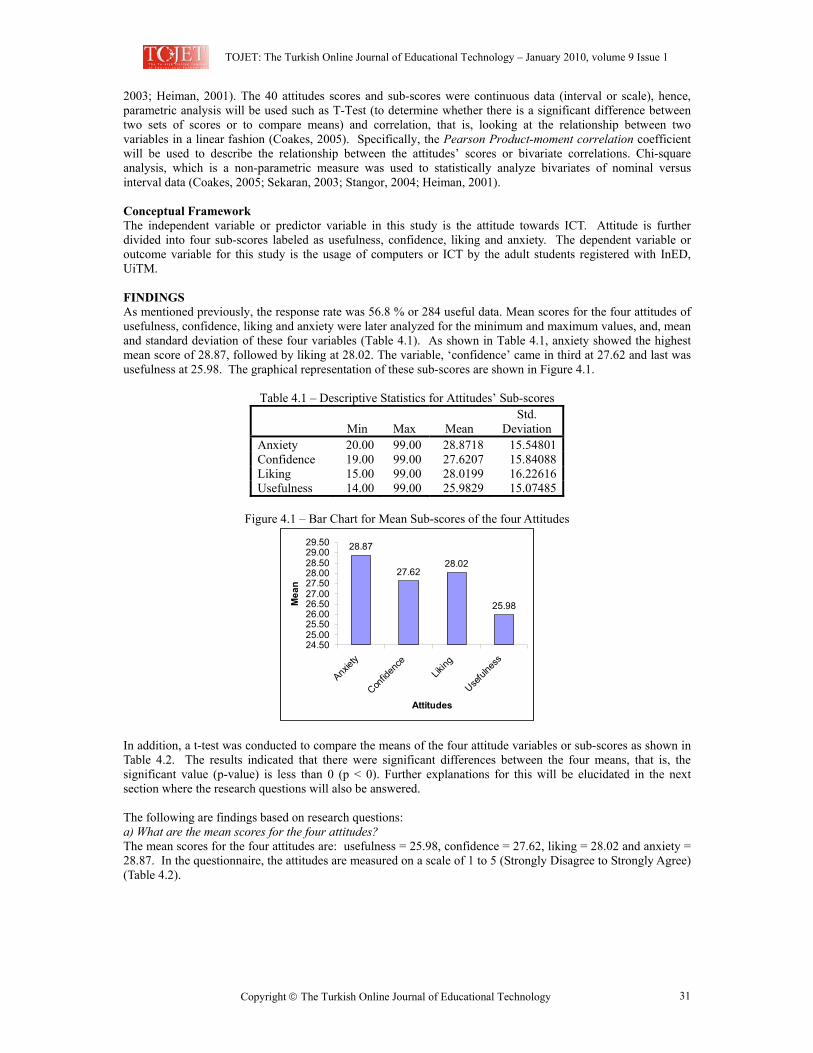
TOJET: The Turkish Online Journal of Educational Technology – January 2010, volume 9 Issue 1
Copyright The Turkish Online Journal of Educational Technology
31
2003; Heiman, 2001). The 40 attitudes scores and sub-scores were continuous data (interval or scale), hence, parametric analysis will be used such as T-Test (to determine whether there is a significant difference between two sets of scores or to compare means) and correlation, that is, looking at the relationship between two variables in a linear fashion (Coakes, 2005). Specifically, the Pearson Product-moment correlation coefficient will be used to describe the relationship between the attitudes’ scores or bivariate correlations. Chi-square analysis, which is a non-parametric measure was used to statistically analyze bivariates of nominal versus interval data (Coakes, 2005; Sekaran, 2003; Stangor, 2004; Heiman, 2001). Conceptual Framework The independent variable or predictor variable in this study is the attitude towards ICT. Attitude is further divided into four sub-scores labeled as usefulness, confidence, liking and anxiety. The dependent variable or outcome variable for this study is the usage of computers or ICT by the adult students registered with InED, UiTM. FINDINGS As mentioned previously, the response rate was 56.8 % or 284 useful data. Mean scores for the four attitudes of usefulness, confidence, liking and anxiety were later analyzed for the minimum and maximum values, and, mean and standard deviation of these four variables (Table 4.1). As shown in Table 4.1, anxiety showed the highest mean score of 28.87, followed by liking at 28.02. The variable, ‘confidence’ came in third at 27.62 and last was usefulness at 25.98. The graphical representation of these sub-scores are shown in Figure 4.1.
Table 4.1 – Descriptive Statistics for Attitudes’ Sub-scores Min Max Mean
Std. Deviation
Anxiety 20.00 99.00 28.8718 15.54801Confidence 19.00 99.00 27.6207 15.84088Liking 15.00 99.00 28.0199 16.22616Usefulness 14.00 99.00 25.9829 15.07485
Figure 4.1 – Bar Chart for Mean Sub-scores of the four Attitudes
28.87
27.6228.02
25.98
24.5025.0025.5026.0026.5027.0027.5028.0028.5029.0029.50
Anxiet
y
Confid
ence
Liking
Useful
ness
Attitudes
Mean
In addition, a t-test was conducted to compare the means of the four attitude variables or sub-scores as shown in Table 4.2. The results indicated that there were significant differences between the four means, that is, the significant value (p-value) is less than 0 (p < 0). Further explanations for this will be elucidated in the next section where the research questions will also be answered. The following are findings based on research questions: a) What are the mean scores for the four attitudes? The mean scores for the four attitudes are: usefulness = 25.98, confidence = 27.62, liking = 28.02 and anxiety = 28.87. In the questionnaire, the attitudes are measured on a scale of 1 to 5 (Strongly Disagree to Strongly Agree) (Table 4.2).
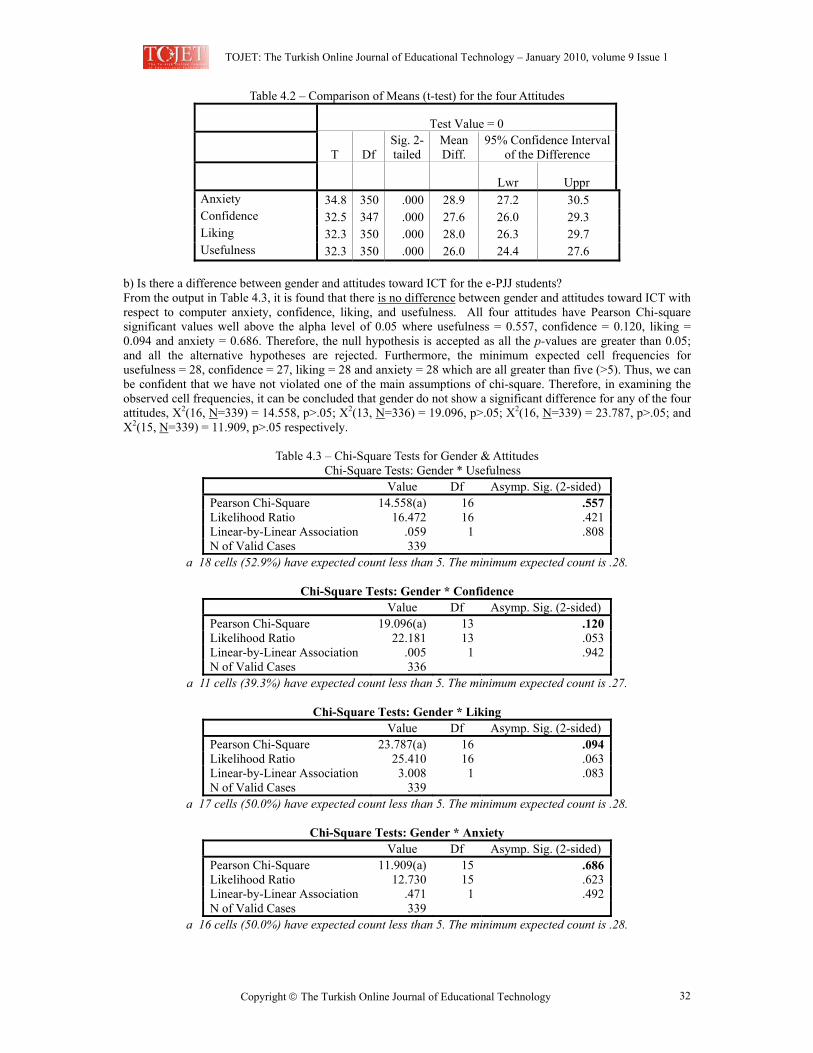
TOJET: The Turkish Online Journal of Educational Technology – January 2010, volume 9 Issue 1
Copyright The Turkish Online Journal of Educational Technology
32
Table 4.2 – Comparison of Means (t-test) for the four Attitudes
Test Value = 0
T Df Sig. 2-tailed
Mean Diff.
95% Confidence Interval of the Difference
Lwr Uppr Anxiety 34.8 350 .000 28.9 27.2 30.5 Confidence 32.5 347 .000 27.6 26.0 29.3 Liking 32.3 350 .000 28.0 26.3 29.7 Usefulness 32.3 350 .000 26.0 24.4 27.6
b) Is there a difference between gender and attitudes toward ICT for the e-PJJ students? From the output in Table 4.3, it is found that there is no difference between gender and attitudes toward ICT with respect to computer anxiety, confidence, liking, and usefulness. All four attitudes have Pearson Chi-square significant values well above the alpha level of 0.05 where usefulness = 0.557, confidence = 0.120, liking = 0.094 and anxiety = 0.686. Therefore, the null hypothesis is accepted as all the p-values are greater than 0.05; and all the alternative hypotheses are rejected. Furthermore, the minimum expected cell frequencies for usefulness = 28, confidence = 27, liking = 28 and anxiety = 28 which are all greater than five (>5). Thus, we can be confident that we have not violated one of the main assumptions of chi-square. Therefore, in examining the observed cell frequencies, it can be concluded that gender do not show a significant difference for any of the four attitudes, X2(16, N=339) = 14.558, p>.05; X2(13, N=336) = 19.096, p>.05; X2(16, N=339) = 23.787, p>.05; and X2(15, N=339) = 11.909, p>.05 respectively.
Table 4.3 – Chi-Square Tests for Gender & Attitudes
Chi-Square Tests: Gender * Usefulness Value Df Asymp. Sig. (2-sided) Pearson Chi-Square 14.558(a) 16 .557 Likelihood Ratio 16.472 16 .421 Linear-by-Linear Association .059 1 .808 N of Valid Cases 339
a 18 cells (52.9%) have expected count less than 5. The minimum expected count is .28.
Chi-Square Tests: Gender * Confidence Value Df Asymp. Sig. (2-sided) Pearson Chi-Square 19.096(a) 13 .120 Likelihood Ratio 22.181 13 .053 Linear-by-Linear Association .005 1 .942 N of Valid Cases 336
a 11 cells (39.3%) have expected count less than 5. The minimum expected count is .27.
Chi-Square Tests: Gender * Liking Value Df Asymp. Sig. (2-sided) Pearson Chi-Square 23.787(a) 16 .094 Likelihood Ratio 25.410 16 .063 Linear-by-Linear Association 3.008 1 .083 N of Valid Cases 339
a 17 cells (50.0%) have expected count less than 5. The minimum expected count is .28.
Chi-Square Tests: Gender * Anxiety Value Df Asymp. Sig. (2-sided) Pearson Chi-Square 11.909(a) 15 .686 Likelihood Ratio 12.730 15 .623 Linear-by-Linear Association .471 1 .492 N of Valid Cases 339
a 16 cells (50.0%) have expected count less than 5. The minimum expected count is .28.
TOJET: The Turkish Online Journal of Educational Technology – January 2010, volume 9 Issue 1
Copyright The Turkish Online Journal of Educational Technology
33
c) Is there a relationship between the adult students’ age and his/her attitude towards ICT? Firstly, the output for the individual attitudes were:
age and usefulness (r = 0.001, p > .05), where p = 0.992 age and confidence (r = 0.101, p > .05), where p = 0.062 age and liking (r = .108, p < .05), where p = 0.045 age and anxiety ( r = 0.078, p > .05), were p = 0.149
The p-values for usefulness, confidence and anxiety are greater than the alpha value, that is p > .05, therefore, we can accept the null hypothesis, that is, there are no significant relationships between age and usefulness, confidence and, anxiety. On the other hand, there is a significant relationship between age and liking since the p-value is less than alpha (0.045 < 0.050), hence the alternative hypothesis is accepted. In simple words, this means that the significant positive relationship between age and liking would indicate that liking for ICT increases with age (r = 0.108, p < .045). d) Does the level of computer skill exerts a positive influence on the attitudes of the e-PJJ students? The results were:
• Computer skill and usefulness (r = 0.004, p > .05), where p = 0.948 • Computer skill and confidence (r = -0.019, p > .05), where p = 0.724 • Computer skill and liking (r = 0.297, p > .05), where p = 0.761 • Computer skill and anxiety ( r = -0.019, p > .05), were p = 0.185
The p-values for all the four attitudes of usefulness, confidence, liking and anxiety are > .05, therefore, previous computer experience does not exert a positive influence on any of the four attitudes. Consequently, all four attitudes showed significant positive correlations towards computer skill. The correlations for anxiety, confidence, and liking are negative, although not significantly different from zero because the p-values are greater than 0.10; this suggests that the students should not focus their efforts on these three variables because there isn’t an appreciable effect on attitudes. It should be noted that a directional hypothesis was not stated, a one-tailed probability test or partial correlation is not necessary. e) Is there a relationship between the students’ qualification and their attitudes toward ICT? From the output, the following results were obtained:
• Usefulness (p = -.054, p > .05) where p = .325) • Confidence (p = -.022, p > .05) where p = .695) • Liking (p = -.027 p > .05) where p = .626) • Anxiety (p = -.055, p > .05) where p = .313)
Based on the above results, it can be concluded that there were no relationships between qualification and attitudes as the p-values for these attitudes were > .05. Also, it was determined that negative correlations derived from the analyses, would not be significantly different from zero because the p-values were greater than 0.10. This suggests that the qualification has no appreciable effects on attitudes.
DISCUSSIONS The discussions presented were drawn from the results or findings of this research. Results related to each research question are discussed as follows: Research Question One What are the mean scores for the four attitudes? The survey results indicated that anxiety has the highest mean score of 28.87, followed by liking, confidence and usefulness. Therefore, it can be safely assumed that the e-PJJ students were apprehensive and probably ‘technophobic’ toward ICTs. Hence, the Institute of Education Development (InED), UiTM should look into this matter seriously because non-usage of computers in distance education or e-learning defeat the purpose of offering e-learning programs and investing in ICT. Close to the heel of anxiety is the attitude, liking. This indicated a high positive attitude, which meant that the e-PJJ students like using ICTs but were anxious and unsure of what to do with certain features in customized software particularly InED’s learning management systems (LMS).
TOJET: The Turkish Online Journal of Educational Technology – January 2010, volume 9 Issue 1
Copyright The Turkish Online Journal of Educational Technology
34
InED’s current LMS is called i-class which made its debut in June 2007. As many students were used to the old LMS, they need time to adopt and adapt i-Class. The present situation does not allow students to have a proper and adequate training on the use of i-Class. Training was done by only giving a short briefing on the features and their usage to the new students and no hands-on training were ever given. Students are expected to do their own training base on the manual provided. Feedbacks received through InED’s general forum showed that quite a substantial number of students voiced their dissatisfaction on the use of i-Class. Laments from students that the old LMS is more user-friendly than i-Class were occasionally heard. As such, a well-organized and proper training should be conducted to overcome this attitude. But, on average, confidence and usefulness show high mean scores, that is, the students have positive attitudes toward ICT. Research Question Two Is there a difference between gender and attitudes toward ICT for e-PJJ students? The results indicated that there are no differences between gender and the four attitudes. In fact, all four attitudes have Pearson Chi-square significant values well above the alpha level of 0.05 where usefulness = 0.557, confidence = 0.120, liking = 0.094 and anxiety = 0.686. Hence, there is no gender discrimination towards ICT and working with computers as neither male nor female students have any reason not to embrace ICT in their learning. As all respondents are e-PJJ students they must possess adequate ICT skill and knowledge to enable them to engage in e-learning. The bulk of teaching and learning process are done on-line, so students have no choice but to embrace it. This will ensure that they are at par with their fellow students in learning and preparing for all the courses that they enrolled for. The situation at the work place also warrants them to acquire certain level of ICT skill in carrying their daily routines be it in the public or the private sector. As ICT usage at their work place increases steadily, what choice or reason do they have for not embracing it? Research Question Three Is there a relationship between student’s age and his/her attitude towards ICT? The results showed that there are no significant relationships between age and usefulness, confidence and, anxiety. This means that age is not a factor that inhibits the students’ usage of ICT. On the contrary, there is a significant positive relationship between age and liking. The results indicated that liking for ICT increases with age. As e-PJJ students, they must at least possess a minimum level of ICT skill to enable them to operate the features in the LMS. Without this skill they will not be able to operate the LMS or i-Class for their learning purposes such as on-line discussion, assessment, accessing additional study materials posted and other virtual class activities. So, all e-PJJ students, regardless of their age, must have the necessary ICT skill and knowledge as to enable them to engage in e-learning. The younger generation in Malaysia were fortunate as they were exposed to ICT at an early age in comparison to their elders. They were already introduced to ICT at the primary school level whereas the older generation, quite a large number of them, were introduced to ICT later and mostly at their workplace. It’s a new and interesting experience for them as they discovered the wonders of ICT in assisting their work and enhancing their learning. This should explain the craze for ICT by the older students. To the younger generation, ICT is nothing new to them as they were exposed to its usage since their primary school days. Research Question Four Does the level of computer skills exerts a positive influence on the attitudes of the e-PJJ students? The findings indicated that the level of computer skills does not exert a positive influence on any of the four attitudes. Hence, it can be assumed that previous computer experience doesn’t make any difference to usefulness, confidence, liking and anxiety. This is in contradiction to literature reviewed as previous computer experience would ensure higher computer usage. Certainly, anxiety towards ICT use would be greatly reduced but somehow the results did not show a high correlation towards the three positive attitudes of usefulness, confidence and liking. Perhaps, this is an indication that further research should be conducted to investigate and determine the absolute correlation between previous computer experience and attitudes. Research Question Five Is there a relationship between the qualification and the students’ attitudes toward ICT? Based on the findings, there are no relationships between qualification and the four attitudes. This means that InED has to divert their efforts on ensuring that the students have more training on the use of the LMS, the i-class. Furthermore, depending on the level of study that the student is undertaking, such as at the diploma level, then there is a need to have more training sessions as most of the student population at this level have not taken proper computer classes. This is because their previous background was at high school or secondary school
TOJET: The Turkish Online Journal of Educational Technology – January 2010, volume 9 Issue 1
Copyright The Turkish Online Journal of Educational Technology
35
level. Moreover, at the undergraduate level, the minimum requirement for entry is the subject on computers and information processing (CSC134).
Henceforth, the implications from the above discussion and of researching on attitudes toward ICT would involve long term benefits and strategic exploitation of ICT investment and the future of e-learning. It is important to remember that ICT is a tool or an enabler towards better delivery of education, but the user is the key. If the students exhibit negative attitudes toward ICT, then e-learning would not be their choice of seeking higher education.
CONCLUSION To conclude, ICT is the foundation for e-learning. Without ICT there would obviously be no e-learning. In distance education, ICT is the enabler for most means in imparting education. Hence, the requests by students to have more face-to-face seminars rather than online teaching should not be catered to. Furthermore, the findings from this research proved that attitudes toward ICT are more of the selfish nature of the adult students. If traditional teaching is preferred, then being a full-time student would be the solution. RECOMMENDATION The recommendations put forth were based on the research findings and other observations: 1. The results indicated high anxiety when using ICT and working with computers among the respondents.
A needs assessment should be conducted in order to determine the various components of computer training for the students.
2. Also, the findings from the survey indicated that students with no experience in ICT usage have more negative attitude towards ICT. Further research should be conducted to determine the reasons for this and to suggest possible solutions.
To enforce the above recommendations, Ward and Peppard (2002) suggested the following which InED should pay heed to. This would allow InED to reduce the students’ complaints on the non user-friendliness of the current LMS, the i-class. 1. Perceived credibility gap between the ‘hype’ of the ICT industry and what ICT can actually do and how
easy it is to do it. Given these difficulties, InED may not be able to claim the benefits offered by ICT. 2. Despite the difficulty in expressing all ICT benefits in economic terms, InED, UiTM and the Ministry of
Higher Education should not demand to see financial justification for investments in ICT. Producing quality graduates who are skilled in most aspects of ICT usage should be the objective of InED. Producing better workforce to meet Malaysia’s market needs would also ensure other economic gains from other stakeholders. Ensuring better ICT infrastructure and Internet access would cushion the impact of globalization, yet generate wealth through knowledge and information.
REFERENCES Beins, B.C. (2004). Research Methods: A Tool for Life. Boston, MA: Pearson. Blaikie, N. (2003). Analyzing Quantitative Data: From Description to Explanation. Thousand Oaks, CA, USA:
Sage. Capron, H.L. (1987). Computers: Tools for the Information Age. Menlo Park, CA: Benjamin-Cummings. Coakes, S.J. (2005). SPSS: Analysis Without Anguish: Version 12.0 for Windows. Queensland, Australia:
Wiley. Compaigne, B. 2001. Declare the War Won. In B. M. Compaigne (Ed.) The Digital Divide: Facing a Crisis or
Creating a Myth? p. 315-336. Cambridge, MA: MIT Press. Hashim, R. and Mustapha, W.N. (2004). Attitudes Toward Learning about and Working with Computers of
Students at UiTM Shah Alam. Turkish Online Journal of Education Technology, Vol. 3, Issue 2. Hashim, R.; Rahman, A.L.A and Kassim, A. (2007). Antecedents of Computer Attitudes: A Case of the Royal
Malaysia Police, Sabah. Unpublished research paper. Loyd, B.H. and Gressard, C.P. & (1988). The nature and correlates of computer anxiety in college students.
Journal of Human Behavior and Learning, 3, 28-33. Heiman, G.W. (2001). Understanding Research Methods and Statistics: An Integrated Introduction for
Psychology. 2nd edition. Boston, MA: Houghton Mifflin. Ministry of Education Malaysia. (2008). Retrieved on September 30, 2008 at
http://www.moe.gov.my/educ3.htm Sekaran, U. (2003). Research Methods for Business: A Skill-Building Approach. 4th Edition. Singapore. John
Wiley & Sons, Inc.
TOJET: The Turkish Online Journal of Educational Technology – January 2010, volume 9 Issue 1
Copyright The Turkish Online Journal of Educational Technology
36
Stangor, C. (2004). Research Methods for the Behavioral Sciences. 2nd Edition. New York. Houghton Mifflin. Ward, J. and Peppard, J. (2002). Strategic Planning for Information Systems, 3rd. Ed. England, Great Britain:
Wiley. Bio-data of the presenters: Dr. Hjh. Rugayah Haji Hashim is an Associate Professor and Deputy Dean of Research and Industry Linkage, Faculty of Administrative Science and Policy Studies, and a Visiting Research Fellow – University of New South Wales, Sydney, Australia. Her areas of research are in Management Information Systems, digital government, sustainable development, social capital and distance education. Hashim bin Ahmad is the ePJJ Coordinator for the Diploma in Public Administration, InED, UiTM. His areas of research are in e-learning and distance education. Che Zainab Abdullah is also an ePJJ Coordinator for the Diploma of Information Management at InED, UiTM. Her areas of research are in information management and distance education.
TOJET: The Turkish Online Journal of Educational Technology – January 2010, volume 9 Issue 1
Copyright The Turkish Online Journal of Educational Technology 37
CHALLENGES OF MALAYSIAN DEVELOPERS IN CREATING GOOD INTERFACES FOR INTERACTIVE COURSEWARE
Norfadilah KAMARUDDIN
Creative Industries Faculty, Queensland University of Technology, Brisbane, Australia [email protected]
ABSTRACT There are many reasons why interface design for interactive courseware fails to support quality of learning experiences. The causes such as the level of interactivity, the availability of the interfaces to interact with the end users and a lack of deep knowledge about the role of interface design by the designers in the development process are most acknowledged. Related to this, as a creator for the interactive courseware, generally the developers expect the resources that they produced are effective, accurate and robust. However, rarely do the developers have the opportunity to create good interfaces with the emphasis on time consuming, money and skill. Thus, some challenges faces by them in the interface design development can’t be underestimated as well. Therefore, their perspective of the interactive courseware is important to ensure the material and also the features of the interactive courseware can facilitate teaching and learning activity. Within this context in mind, this paper highlights the challenges that faces by the Malaysian developer from the ten face to face interviewed data gathered. It discusses from the Malaysian developer perspectives that involved in the development of interface design for interactive courseware for the Smart School Project. Particularly, in creating such a great interfaces, the highlights challenges will present within the constraints of time, curriculum demand, and competencies of the development team. Keywords: Educational courseware; courseware development process; interface design; interaction design.
INTRODUCTION In today’s education, learning environments had been greatly changes through the emerging technologies such as multimedia and the internet. In the current Malaysian education context, particularly, the rapid advancement of this new technology was plays as one of the most important roles in classrooms as interactive courseware has been used in presenting learning content and information. Meanwhile, these new media approaches are expected to motivate students to learn and encourage them become as an active participator (Win et al., 2004). Therefore, a broad literature shown, there is multiplied reaction and opinions regarding the effectiveness application of an interactive courseware in learning and teaching process. Overall views however, definite that there are two categories of idea exist in the process of evaluating the effectiveness of interactive courseware performance: Firstly, those who does situated that an interactive courseware is the solution for enhancing the quality teaching and learning performance (Bates, 2005; Boud & Prosser, 2001). Secondly, the others group considered that an interactive courseware it’s just a tool in providing an entertainment material in teaching and learning process (McMillan & Schumacher, 2001; Mayer & Moreno, 2002). Although there are different views exist between these two outlooks, both of them are agreed that teaching and learning strategy and style should equivalent with the current digital demand. On the other hand, Helen (2006) stated that a good values of the interactive courseware should be provide with the interfaces that can entertained the end user and available to enhance the level of understandings and experiences among the learner. He further claimed that an effective interactive courseware should be able to use by the different level of learners either for group collaboration or individual uptake and an effectives interface design can accommodating the learner needs as well. From this idea, it was found that in order to produce a good and an effective interactive courseware, it’s required that every developers of this tool highly needs to know and be aware on the role of interface design that can enhance quality learning experiences. Thus, with the availability of this new technology in today’s education setting, many private companies in Malaysia have been ventured into courseware development. The main reason is to create an interactive learning material and online learning resource for the students use. According to Multimedia Development Corporation (MDC) (2007), however the existents of multiply choice of interactive courseware in Malaysia currently were make up a difficulty among the end user in choosing a good quality of interactive courseware. On the other hand, it was defined currently, that much of this interactive courseware have not meet with the level of success expected because many of the courseware developers had to outsource their work (in e.g. MOE, 2008; MDC, 2007; Kamariah, 2006; Neo, 2005). As a result, the instructional sessions at school continued to be based on printed textbooks, which are delivered by the teacher (Muda & Mohamed, 2006). Consequently, up to the recent review by the Malaysian Ministry of Education on this related interactive courseware, identified that a level of courseware acceptance is still at the average and it’s was related to the lack of interfaces performance. Beside,
TOJET: The Turkish Online Journal of Educational Technology – January 2010, volume 9 Issue 1
Copyright The Turkish Online Journal of Educational Technology 38
attitudes of the teachers and students towards this application (MOE, 2008) are influenced as well. However, in view of these outcomes, it’s shown that more investigations related to the development of this interactive courseware need a further investigation. Thus, relating to the effectiveness used of Malaysian interactive courseware in term of interface design performance, this paper addresses some misunderstanding and challenges faces by the developers particularly on the development of interface design. Within this context, this paper is organised in the following ways. Section 2, will discuss about the roles of interface design in courseware development followed by the discussion of some general misunderstanding about it and reflection among the Malaysian courseware developers in producing an effective’s interactive courseware. Section 3 presents the various challenges that were faced in the development of interactive courseware particularly for interface design development. Finally, Section 4 concludes the paper by highlighting the factor that should take consideration for the future development of interface design and for an effective interactive courseware uptake as well. The roles of interface design in the courseware development process. Ideally, the interface design is the visible personality of software system with specific kind of design where the designer commonly will take information and organize it and presented in a meaningful ways (Galitz, 2002). Meanwhile, when applied into computer software, interface design is known as a graphical user interface which is refer to the surface of screen that facilitates certain interpretation of the medium on the way user perceives the communication process (Preece, Rogers and Sharp, 2002). Moreover, a type of this interactive communication is determined as a vehicle of interaction between machine and a human. As a tool of communication between the users to interact with a system in delivery particular information, the term of interface design for an interactive multimedia application particularly, is not just simply refer a font size, a button placement or the images that the user sees and feels but including every element of a system such as screen layout (consist of the shape of buttons, the positioning of menus, the display of a warning message, the color applied) and selection modes of interaction (Borchers, 2001). In facts, an effective interface design of interactive multimedia material will allows the user to received the messages of multimedia material by find the information that they require and rewards the users with the maximum amount of information needed by them. Thus, as a crucial part of user’s experience with any piece of courseware, interface design performance is significantly related to the effectiveness of learning experiences (Shneiderman, 1998). The development of interface design requires the understanding of at least three things: (1) the user who interacts with the interface, (2) the system (the computer technology and its usability), and (3) the interaction between the user and the system (Galitz, 2002). Therefore, the ambitions of producing a good quality of interactive product is often lost among the courseware developers because a poor user interfaces design is the reason why so many interactive courseware are never used and cause lack of user interest as well as being visually unattractive. Besides, rarely do courseware developers have the opportunity to create such a great interfaces with the emphasis on time and money and much courseware developers comment that a good user interface design is just a common sense (Liu, Jones, and Hemstreet, 1998). Even though every courseware development has different needs or requirements, the objective of any courseware developer should be to design and implemented a quality of user interfaces in any interactive products. With this objective, interface design should be design to match the skill, experience and expectations of its anticipated users but courseware developers commonly have a different view of the product, a different skill set of teams, and often enforces their own desires rather than those of the end users (Preece, Rogers and Sharp, 2002). Consequently, most of the interactive courseware failed to provide an interface design that can accommodating the end user need. Meanwhile, it is not easy to design the interactive learning material, as it should not be limited to just content and should include other components to enhance teaching and learning process. The problem can be mapped in producing a good interface design of multimedia courseware is to understand what users require from a product and how to provide effective engagement. In terms of media organization, interface design needs to consider carefully on graphic visual and navigation that engage learners in meaningful authentic tasks (Wilson, Jonassen, and Cole, 1993; Wilson and Cole, 1991). However, from a courseware development point of view, interface design means how to provide a learning environment that encourages and motivates learners to recognize the important concepts of meaningful learning. On the other hand, simply knowing basic interface design concepts will not be helpful to courseware developer for the creation of effective learning courseware and the facilitation of learning in electronic environment.
TOJET: The Turkish Online Journal of Educational Technology – January 2010, volume 9 Issue 1
Copyright The Turkish Online Journal of Educational Technology 39
Consequently, the ambitious to produce a good quality of interactive learning material often happened among the courseware developers. Therefore, rarely do courseware developers have the opportunity to create a great interface with the emphasis on time consuming, money and skill (Helen, 2006). However, as a creator of the products, generally the courseware developers who developed this interactive teaching material expect the resources that they developed to be effective, accurate and robust. Thus, some crucial challenges faces by the development team in the interface design development can’t be underestimated by us. METHODOLOGY This paper is based on the data gathered from research study that was conducted as an exploratory research in investigating the development of interface design particularly looking at interactive courseware development process. By focusing on the development of interactive science courseware in the Malaysia Smart School Project as a sample of study, a face to face semi structured interviews were conducted among the courseware developers that were participated in the development of the existing interactive courseware in May 2009 across Klang Valley in Malaysia. This semi structured interviews had been conducted through open ended question consisted of ten main questions. A guiding research questions for this interview have been identified and designed by the authors to be answered by the project leader of courseware development team. All interviews session had been recorded and transcribed by the author followed by comprehensive analysis. The main aims of this interview are to determine the level of developers understanding about the role of interface design for interactive courseware and the challenges that had been faced by them in presenting a good quality of interface design for an effective interactive courseware in fulfilled the expectations of the end user. FINDINGS AND DISCUSSION Based on ten different courseware developers that were interviewed, in summary, it was defined that a general development process of the existing Malaysian Smart School interactive courseware is still similar to the generic water fall model of development process identified in the worldwide literature. Correspondingly, they went through process of analysis, design, development, evaluation and implementation. The development of these existing interactive courseware begins with the government provided the content and instructional guideline to the developers appointed. Based on the content and instructional guideline provided, the developers will develop a prototype. They further create the potential interface design for an interactive courseware as requested. This interactive courseware therefore will be implemented by the student after getting approval from the government. In addition, from the interviews conducted, some of the general misunderstandings about the role of interface design in courseware development and the challenges faces by the developers are identified as well. Within these misunderstandings, the author believes that this is the first step towards the successful of interactive courseware development for Malaysian perspective. 1. The general misunderstandings about the role of interface design in Malaysian courseware
development:
• Converting learning modules from print into electronic format: Analysis of the face-to-face interviews with ten developers shows, most of the developers assume that the development of the interface design of interactive courseware simply involves an improvement phase from a printed version of content material into an electronic format. For example, one informant responded, “Sometime we just convert the sample test from the current existing textbook into the interactive courseware. It’s easier, rather than spending a long time on analysis.” (Developer 2) However, another participant showed an understanding of the differences between digital applications when giving this response: “Designing interfaces for the computer screen is different from the printed design. You can not simply prepare the interfaces without have some understanding about the overall concept”. (Developer 3) Conversely, most respondents also underestimated the role of interactive learning, where courseware development is not merely a simple process of converting a printed learning module with exercises into an electronic format (e.g. Norhayati and Siew, 2004). That is, it is important for the developers to not ignore the function of interface design in the development process if they are to produce quality interactive courseware. • The Concept of Interactive Learning: The accomplishment of learning outcomes from the interactive courseware relies on the quality of the courseware itself (Preece, Rogers and Sharp, 2002). Thus it requires the effective development of the interactive courseware, which in turn relies on the developer having some
TOJET: The Turkish Online Journal of Educational Technology – January 2010, volume 9 Issue 1
Copyright The Turkish Online Journal of Educational Technology 40
understanding of interactive learning concepts. However, most of the developers who participated in the study showed that they did not have in-depth knowledge of interactive learning concepts, but only relied on more general principles for courseware design. This was illustrated by one project manager’s response, “There is not much difference when you are preparing digital learning material. The difference is just a platform of delivery. But at the end of the day, it depends on the user. Either they like to use it or not.” (Developer 4) Another project manager answered: “You should have your own initiative when you are designing this interactive courseware. We just develop it based on our previous experience.” (Developer 2) However, most of the members in their production team have been involved with different types of interactive material development, including preparing corporate videos and other multimedia presentations. Therefore, developing interactive courseware is totally different. Thus, while most of the developers tried to produce the courseware to fulfil the guidelines of the Ministry of Education, most of them depended on their previous experience only, rather than researching pedagogical approaches.
2. Challenges faced by Malaysian developers in the development of interface design for interactive courseware. More recently, interactive courseware has emerged as an instructional technology with the potential to overcome the limitations of traditional media in supporting the prospect to provide learning environments with strong visual elements. Realistically, in improving the quality of interface design for an interactive courseware, the important challenges for the Malaysian courseware developers defined from the interviewed is how to provide the high quality of interface design by reducing the courseware development cost and time consumption. In this regard, there are a few issues and challenges that can be highlighted from the interview data so far. These are presented below:
• Team expertise and the basic pedagogical knowledge of the interface designer: One of the biggest challenges’ faced by the development team is most of their interface designers do not have basic knowledge of pedagogy. Moreover, most of the courseware developers do not have a specific content expert on the subject on which they are working. Currently, before the development of interface design begins, all the developers involved will received the content of the potential courseware and instructional design from the content expert those are not in their production team. The content experts are usually teachers who are in the government team. Frequently, during this early stage of design, if the interface designer or graphic designer had difficulty understanding of some specific concept, they will pose their questions to the content expert in the government team. Unfortunately most of the developers have found that the content expert in the government team assumes that interface designers in the development team already knows the fundamental pedagogical concept in producing interactive learning material, yet this is not the case. One of the project managers claimed that, “It is not easy to fulfil their requirements because no one in our team is a teacher. Ministry have a content expert and we need to work with them. But they are expecting our designer knows everything. That is the problem.” (Developer 2) He further claimed that this contributes to the level of effectiveness of the interface design performance during the implementation. He stated, “Even though we had followed the requirement in the tender document, … As a developer we just prepared it according to what they required in order to get an approval. We don’t border what will happen later; though we worry it will affect the effectiveness of the courseware.” (Developer 2) Thus, while the developers carefully consider what medium will be used, a basic understanding of pedagogical knowledge among the production team members is required in order to design and produce quality interactive courseware. • Skill constraint and availability of the team: Courseware development teams generally require input from many disciplines into the interface design. For example, instructional designers establish the learning objectives, content experts will provide the teachable know and how of the subject and graphic designers will
TOJET: The Turkish Online Journal of Educational Technology – January 2010, volume 9 Issue 1
Copyright The Turkish Online Journal of Educational Technology 41
be responsible for enhancing the media performance. Each of these experts plays a different role in the development process. On the other hand, the Malaysian Ministry also requires that the interface design of the potential courseware is multi-media rich. In order to fulfil this requirement, all courseware developers must to produce appropriate interactive animations or simulations. For example, one project manager referred to his experience designing interactive science courseware, where it is required that a real-life simulation of an actual experiment or situation be provided for the user, “Ministry always request non-static designs for their project. Which means the entire courseware must be presented as fully interactive. They prefer real life simulations. They also need every single part of the courseware to become active.” (Developer 4) Therefore, courseware development requires a range of specialized skills workers, such as programmers, interaction designers, writers, language editors, visualisers, voice talent, animators and illustrators. However, in the Malaysian context, the teams are limited and most of the developers involved claimed that their production team does not have the capacity to achieve this. The preliminary analysis also identified that the numbers of team members involved were very limited and most of the developers tried to make their team members become multitasking workers. Moreover, it often requires aspects of the interface design to be outsourced to third parties. As claimed by one participant, “If we do not have enough of a workforce, especially skilled workers, the task will be outsourced to others. And frequently, we outsource the job of preparing the interface design to a freelance designer who is also a friend to our designer. But then, it is based on our designer’s recommendations.” (Developer 1) When this happens, it involves more implications such as the increase of cost and development time. Further, while the development team is already fractured between the software companies and the Ministry, it is then fractured further. The disintegration of the production team disconnects them from a common understanding of the learning objectives, pedagogical principles and user needs. • Curriculum demands: In Malaysia, the Ministry of Education requires interactive courseware must present particular aspects of cultural and moral values that can be guided by criteria in the curriculum. For instance, the design of a particular characteristic of interface such as layout, images, buttons, and colours must signify or reflect Malaysian looks without having any bias regarding ethnicity or religion. This is because of the diversity of a complex mixture of multicultural society in Malaysia. As such, visual symbolism for the 3 mains Malaysian ethnic groups (Malay, Indian and Chinese) must be considered. However, the interface design of the interactive courseware cannot display specific elements which preference one group of users. By way of example, the developer cannot use a swine picture because swine can be an indication of an ethnic symbol of the Chinese. In term of colour usage, colour can also represent different meanings in different cultural groups. For example, red is significant in the images of Chinese culture and green corresponds with the Malays. Chinese believed on red is a symbol of good wishes and good fortune. The Malays believe green is a symbol of religion. Developers must therefore realise that green or red in this context are a form of communication through visual representation. Because of these restrictions, the developers of interactive courseware cannot simply use copies of the visuals or images from other countries. Developers therefore claim that they have to spend much time preparing the interface design components for the courseware.
CONCLUSION Based on the findings presented previously, in conclusion, the misunderstandings experienced by the existing courseware developers in Malaysian are clearly associated with their challenges. However, the developers who developed this interactive teaching and learning material normally do expect the resources that had been developed by them to be effective, accurate and robust. And yet, rarely do developers have the opportunity to create a great interface with the emphasis on time consuming, money and skill. Even though it is widely agreed that interactive teaching and learning material has immense potential for educational setting, as a creator of the products, the Malaysian courseware developers also need to have a sound knowledge of pedagogical principles in producing an effective interface design that can accommodate the end user need. They furthermore should have a right understanding about the role of interface design in the

TOJET: The Turkish Online Journal of Educational Technology – January 2010, volume 9 Issue 1
Copyright The Turkish Online Journal of Educational Technology 42
development of effective interactive educational courseware and critical demands on how interface design can be utilised to make learning experience among the end user highly achievable. Moreover, developing a quality interface design for educational applications also requires understandings of the interactive learning concepts by the team production. In this analysis, it is revealed that many Malaysian developers assume that developing the interface design is just a simple task. Thus, to fulfil this mission successfully, they must understand what had been generated these barriers or challenges for the application of interactive courseware in education. In opposition, the objective of this paper is to verify the challenges of developing interface design for interactive courseware and to gain better understanding of developers are achieved. REFERENCES Bates, A.W. (2005). Technology, e-learning and distance education. Routledge Falmer, London Borchers, Jan O. (2001). A Pattern Approach to Interaction Design. AI & Society Journal of Human-Centred
Systems and Machine Intelligence, (15)4:359-376. Boud, D., & Prosser, M. (2001). Key principles for high quality student learning in Higher Education forms: a
learning perspective. Educational Media International, 39(3 & 4), 237 – 245 Galitz, W. O. (2002). The Essential Guide to User Interface Design: An Introduction to GUI Design Principles
and Techniques. Wiley Computer Publishing, New York. Helen, B. (2006). Evaluating interface aesthetics: A measure of symmetry. Proceeding paper for the International
Conference of Society for Optical Engineering, 60 (6), 52-63. Kamariah, A. B. (2006). Malaysian Smart School courseware: Lifelong learning tool for science, mathematics
and IT teachers. Malaysian Online Journal of Instructional Technology (MOJIT), 3 (2), 17-25 Liu, M., Jones, C., & Hemstreet, S. (1998). Interactive multimedia design and production processes. Journal of
Computing in Education, 30 (3), 254-280. Malaysia Ministry of Education (MOE) (2008). National report: education in Malaysia. Ministry of Education,
Malaysia Mayer, R. E., & Moreno, R. (2002). Aid to computer based multimedia learning. Journal of Educational
Psychology, 93 (1), 187-198. McMillan, J. H., & Schumacher, S. (2001). Research in education: a conceptual introduction. Longman, New
York MDC (Multimedia Development Corporation) (2007). Report of the Smart School Roadmap 2005-2020: An
educational Odyssey. Retrieved May 10, 2008, from http://www.scribd.com/doc/1030589/Malaysian-Smart-School-roadmap
Muda, Z., & Mohamed, R. (2006). Adaptive user interface design in multimedia courseware. Proceeding paper of Conference on Information and Communication Technologies, 16 (1), 196- 199.
Neo, M. (2005). Engaging student in group based co-operating learning – A Malaysian perspective. Journal on educational Technology and Society, 8 (4), 220-232.
Norhayati, A. M., & Siew, P. H. (2004). Malaysian perspective: Designing interactive multimedia learning environment for moral values education. Journal on Educational Technology and Society, 7 (4), 143-152.
Preece, J., Rogers, Y., & Sharp, H. (2002). Interaction Design: Beyond Human-Computer Interaction. John Wiley & Sons, New York.
Schneiderman, B. (1998). Designing the user interface: Strategies for effective human-computer interaction. Addison-Wesley Publishing, UK.
Wilson, B. G., Jonassen, D. H., & Cole, P. (1993). Cognitive approaches to instructional design, in G.M. Piskurich (ed.) The ASTD Handbook of Instructional Technology, 21(1), 21-22. McGraw-Hill, New York
Wilson, B., & Cole, P. (1991). A review of cognitive teaching models. Educational Technology Research and Development, 39 (4), 47-64.
Win, J., Jeroen, V.M. & Rob K. (2004). Integrated e-learning: Implications for Pedagogy, Technology and Organization. Routledge Falmer, London.
Author Biodata Norfadilah Kamaruddin is a lecturer at Universiti Teknologi Mara, Malaysia, as well as a PhD student at Queensland University of Technology, Australia. Her research is focused on developing interface design guidelines for an effective interactive educational courseware to enhance the interactive learning experience.
TOJET: The Turkish Online Journal of Educational Technology – January 2010, volume 9 Issue 1
Copyright The Turkish Online Journal of Educational Technology 43
DIGITAL DIVIDE IN TURKISH PRIMARY SCHOOLS: SAKARYA SAMPLE
Assist. Prof. Dr. Hasan Basri GÜNDÜZ Sakarya University Education Faculty
ABSTRACT Accessing to information technology and the ability to use it is increasingly becoming part of the toolkit necessary to participate and prosper in an information-based society. Inequalities in ICT access and use not only mirror existing patterns of social stratification, but can also maintain and even widen current disparities between these groups in important indicators of well-being such as academic success and earnings. Use of Information and Communication Technologies (ICT) in education has been an important concern in many countries. In this sense, the purpose of this research is to assess the digital divide conditions and the affects of digital divide on their level assessment exam (STS) success rank and school grades. This research was carried out in 7 counties including Sakarya city center and 6 counties involving 375 elementary schools in Sakarya city center and 12 counties it has and 7 of them are private elementary schools. Data of the research have been collected via questionnaire prepared by the researcher. It is seen that while most of the students, who ranked in top ten in the Level Assessment Exam (STS), have computer and internet in their homes, those who ranked “last ten” do not have computer and internet in their homes. It may be interpreted as there is a parallel relation between the increase of average grade of students and the increase of having computer and internet connection in their home. When it is examined thoroughly, there is a digital divide between primary school students. It is believed that, this situation goes in parallel with the socio-economic status of the families. Key words: Digital divide, equal opportunity in education, information and communication technologies. INTRODUCTION The digital divide has become an important topic of research because it involves more than simply documenting the characteristics of people who own computers. The increasing popularity and economic utility of computers and the Internet have brought changes in the way societies and their individuals interact, the way we shop, attain college degrees, pay taxes, use the library and even find a job (Wilson, Wallin, & Reiser, 2003). Computers, which are replaced with typewriters by taking their functions in the beginning, are now being commonly used in a scope ranging from interpersonal communication to e-school and e-state applications. So, they have become an inseparable part of the social life. This new technology is being incorporated into the public school curriculum and is transforming the way information is being created and distributed. Communities that wish to keep or recruit new high-paying jobs need to provide businesses with high-speed access. Individuals must learn to use this new technology to have any chance of being successful in the emerging knowledge economy (Wilson, et al, 2003). The use of information and communication technologies (ICT) are seen by many commentators as underpinning the social and economic progression of nation-states throughout the first stages of the 21st century (Livingstone & Helsper, 2007; Selwyn, 2004). The revolution in information and communication technologies (ICTs) has transformed both the economy and society (Castells 2000; Kotkin 2000). The ICT revolution has created new tools, such as personal computers (PCs) and the Internet, which have reinvented and, in many instances, improved the ways all societies communicate, learn, and earn a living today (Chakraborty and Bosman, 2005). Most of the analysts have presented convincing arguments over the past two decades as to how new computer and telecommunications technologies will transform countries into ‘knowledge economies’ and ‘network societies’. The ability to use ICT has been heralded by politicians to be ‘the indispensable grammar of modern life’ and a fundamental aspect of citizenship in the prevailing information age. Indeed, many governments in industrialized countries have been spurred on by the apparent inevitability of the information society and have initiated ICT based programmes which aim to ensure that their citizens do not get ‘left behind’ and are able to ‘win’ in the new global era (Selwyn, 2002, 2004). In the usually less hyperbolic confines of academe, the transformative nature of ICT has been welcomed also as offering an unprecedented opportunity to overcome existing social divisions and inequalities. It is assumed by many academic commentators that ICT can ‘empower’ individuals, increase levels of social interaction and civic involvement as well as facilitate easy and widespread access to education and other public and government services (Selwyn, 2002; 2004). As Servon and Nelson (2001) put it, ‘‘access to information technology and the ability to use it [have] increasingly become part of the toolkit necessary to participate and prosper in an information-based society”.
TOJET: The Turkish Online Journal of Educational Technology – January 2010, volume 9 Issue 1
Copyright The Turkish Online Journal of Educational Technology 44
However such as ‘techno-enthusiasm’ has been tempered of late by concerns over potentially divisive aspects of the information age. In particular, issues of inequalities of access to both technology and information have begun to prompt concern about emerging ‘digital divides’ between social groups. If individuals or groups of individuals are excluded from using ICT, it is argued, and then they will be excluded from many of the benefits that ICT can bring (Selwyn, 2002; 2004). There are heated debates occurring in the United States and in Europe concerning questions of whether there is a so-called “digital divide” and if there is, how important it might be. In turn, the question is whether it will close or widen in future years. Much of this discussion is politically charged. Old views reappear about markets and people who are supposed to solve all problems by themselves, or not, and about the need or rejection of government intervention (Van Dijk & Hacker, 2003). In this research, it is attempted to postpone this ideological discussion in order to develop scientific conceptual distinctions and to present reliable and valid empirical data on this subject matter. In this sense, the purpose of the research is to assess the digital divide conditions and the effects of digital divide on their level assessment exam (STS) success rank and school grades. In line with this purpose, answers were looked for the questions given below:
1) What is the digital divide level of students according to their socio-economic levels? 2) What is the
a) time of use b) purpose of use of digital technologies by students according to their socio-economic level.
3) What is the a) rank of the students in level assessment exam, b) average points of students who have digital technologies and who do not?
4) Does having digital technologies create a meaningful difference in regards with the academic success of students?
Digital Divide For much of the past decade, policy leaders and social scientists have grown increasingly concerned about a societal split between those with and those without access to computers and the Internet. The U.S. National Telecommunications and Information Administration popularized a term for this situation in the mid-1990s: the "digital divide". The phrase soon became used in an international context as well, to describe the status of information technology from country to country (Warschauer, 2003). There has been much discussion and debate about the definition of the digital divide and of the empirical analyses of its components (Bozionelos, 2004; Compaine, 2001; Cooper, 2002; Dewan & Riggins, 2005; DiMaggio et al., 2004; Hargittai, 2003; Norris, 2001; Van Dijk, 1999; Warschauer, 2003). In the 1990s the traditional focus was mainly on infrastructural access. Today the discourse about the digital divide has expanded to other concerns and factors that generate digital inequality, differential modes of use and economic development and so on, (Benkler, 2006; Lebo, 2003; Wilson, 2006). While the traditional access-oriented thinking focused on questions related to measures such as ownership, availability, and affordability of infrastructure, now the focus is moving beyond technology to the users. The American Library Association has advocated a further refinement of the concept to include differences in access to information through the internet and other information technologies and the knowledge, skills, and abilities to use online information (American Library Association, 2002). Moreover, attention is also now being directed toward more sophisticated analyses of the uses of ICTs (Howard, Rainie and Jones, 2001). For instance, a growing number of researchers are beginning to focus on a ‘‘second level digital divide’’ (DiMaggio and Hargittai, 2001; Lynette, Payton, Mbarika, Amadi and Meso, 2008;), exploring differences in ICT users’ online skills, knowledge, activities, and attitudes toward using technologies. They identified five dimensions of Internet use that they posited would influence the benefits that users derive from the medium (DiMaggio and Hargittai, 2001):
1. The quality of equipment used for access; 2. The user's autonomy in ability to access it; 3. The navigational skills needed to understand how to use the complex Web of Information stored on the Internet; 4. The social support networks that inform some users to become more familiar with its potentials, and finally; 5. The types of sites the user visits while online.
TOJET: The Turkish Online Journal of Educational Technology – January 2010, volume 9 Issue 1
Copyright The Turkish Online Journal of Educational Technology 45
These give the dimensions that affect the use of internet and utilization of internet by individuals. They also give information about the utilization quality of individuals who have come over the access to internet and computer problem. However, access to communication and information technologies problem still continues in Turkey. Thus, the definition of digital divide must include material access problem as well. Classification related with digital divide made by Van Dijk (1999) is more applicable for this research. He distinguishes four kinds of barriers to access and the type of access they restrict (Van Dijk, 1999):
1. Lack of elementary digital experience caused by lack of interest, computer anxiety, and unattractiveness of the new technology (“mental access”). 2. No possession of computers and network connections (“material access”). 3. Lack of digital skills caused by insufficient user friendliness and inadequate education or social support (“skills access”). 4. Lack of significant usage opportunities (“usage access”).
Clearly, public opinion and public policy are strongly preoccupied with the second kind of access. Many people think that the problem of information inequality in the use of digital technology or computer-mediated commu-nication (CMC) is solved at the moment that everyone has the ability to obtain a personal computer and a connection to the Internet. The first kind of access problem, the mental barrier, is neglected or viewed as a temporary phenomenon touching only elderly people, some categories of housewives, illiterates, and the unemployed. The problem of inadequate digital skills is reduced to the skills of operation, managing hardware and software. Sometimes this is also viewed as a temporary phenomenon to be solved shortly after the purchase of a computer and a network connection (Van Dijk & Hacker, 2003). According to Van Dijk (1999), access problems of digital technology gradually shift from the first two kinds of access to the last two kinds. When the problems of mental and material access have been solved, wholly or partly, the problems of structurally different skills and uses become more operative. Van Dijk (1999) does not limit the definition of digital skills to the abilities of operating computers and network connections only. Instead, he includes the abilities to search, select, process, and apply information from a super abundance of sources. In this way, he anticipates the appearance of a usage gap between parts of the population systematically using and benefiting from advanced digital technology and the more difficult applications for work and education, and other parts only using basic digital technologies for simple applications with a relatively large part being entertainment (Van Dijk & Hacker, 2003). Digital Divide in Education Information and communication technology (ICT) in the past decade has added an important new element to the issue of education inequality. New technologies are widely viewed as having the potential to either alleviate or exacerbate existing inequalities (Warschauer, 2000, 2003). On one hand, if computers and the Internet are dis-tributed equally and used well, they are viewed as powerful tools to increase learning among marginalized students and provide greater access to a broader information society (Cummins & Sayers, 1995). On the other hand, many fear that unequal access to new technologies, both at school and at home, will serve to heighten educational and social stratification, thereby creating a new digital divide (Bolt & Crawford, 2000). Many educators and researchers as well as parents and youths themselves, have expressed several reasons why the nation should be concerned about the gap between the ICT “haves” and “have-nots” (Hick & McNutt, 2000; Turow & Nir, 2000). These concerns fall into four main themes: educational advantages, future employment and earnings, opportunities for social and civic involvement, and equity and civil rights issues. In this research, only the educational advantages and disadvantages are dealt with. Many educators and researchers maintain that computers, educational software, and the internet offer a number of educational advantages (Lepper& Gurtner, 1989; Ross, Smith, & Morrison, 1991; Tezci, & Dikici, 2006; Yalçınalp & Aşkar, 2003). ICT can provide students and teachers with a large body of easily accessible information; create opportunities to reinforce learning basic, new, and higher-order cognitive skills; and increase student interest and motivation, parent-school communication, and parent involvement. These advantages, in turn, are expected to produce positive educational outcomes such as increased student success and school retention (U.S. Department of Education, 1999; Wenglinsky, 1998). Research tends to support these expectations, generally finding positive relations between school, home, and community uses of ICT and a variety of academic outcomes both for socio-economically disadvantaged and other children and youth (Ross et al., 1991; Sutton, 1991). Recent studies also indicate that parents share the belief that ICT provides students with educational advantages. For example, almost 90% of parents agreed that access to ICT assists children with their
TOJET: The Turkish Online Journal of Educational Technology – January 2010, volume 9 Issue 1
Copyright The Turkish Online Journal of Educational Technology 46
school work, and 74% of parents believed that children without access to ICT are at an educational disadvantage (Turow & Nir, 2000). Children’s and adolescent’s access to and use of ICT also are expected to increase future employment and earning opportunities. ICT skills assist youth in researching and locating employment. ICT skills prepare youth to successfully compete in job markets in which an increasing number of occupations require such skills (U.S. Department of Education, 1999), and employers compensate workers who possess them with higher wages (Krueger, 1993). Information technologies are not only the instruments used in learning and teaching, but they are also the tools used to find and transfer information (Akkoyunlu & Kurbanoğlu, 2003). In this context, two essential skills come forward. One of them is computer technologies, as the inevitable result of using technology in education process; and the other is information literacy. Information literacy skills are among the essentials of learning for a lifetime which arises as a requirement of the 21st century. Using computer technologies is not only an element that supports education, but also a precondition for information literacy skills (Akkoyunlu & Kurbanoğlu, 2002). Depriving or/and not utilizing these technologies create unfavorable situations both in social and individual aspects. This unfavorable situation, which is also called digital divide, is inequity of opportunity originating from technology. It is the limitation of activating potentials of individuals due to the reasons that are out of their control (Gündüz and Hamedoğlu, 2003). The digital divide has also been defined by Bozionelos (2004) as "the unequal distribution of opportunities across societal groups to reap the benefits of computerization. Socio-economic level is one of the major factors implicated in the digital divide". Disparities in technology access and the ability to skillfully use technology is an important consideration, if students are to be prepared for economic opportunity and political participation (Mosseberger, Tolbert, & Stansbury, 2003). Inequalities in ICT access and use not only mirror existing patterns of social stratification, but can also maintain and even widen current disparities between these groups in important indicators of well-being such as academic success and earnings (Johnson, 2000; Krueger, 1993). Disparities in academic success might widen because students from lower socio-economic backgrounds are unable to take full advantage of the educational benefits of ICT. Inequalities in earnings might increase as a result of students from lower socio-economic backgrounds be-ing less prepared to compete for higher paying jobs that require ICT skills, or result from the link between academic success and subsequent educational attainment and future earnings (Jencks & Phillips, 1999). In many countries, especially in Europe, similarly in Turkey as well, school systems are tracked; students are assigned to different school types officially on the basis of prior performance. These tracks range from purely academic tracks to vocational tracks and prepare students for different educational and labor market destinations (Marks, Cresswell, and Ainley, 2006; Shavit, 1990). Like many tracked educational systems, the sharpest break in students’ differentiation takes place in secondary school system in Turkish educational system. Thereby, the process of allocation from elementary school to secondary school is of the essence in terms of equal opportunity. In Turkish educational system, allocation of students from elementary to secondary education is carried out by an examination that is held by a single center of Turkish National Education. Until 2008, students had been placed into secondary schools by a single exam they took at the end of 8th grade. As of 2007/2008 academic year, the number of examinations has been increased to three. Thus, students’ “class score” is determined by adding students’ end-of-year success and behavioral points to the points they get from the central exam which they shall take at the end of 6th, 7th and 8th grades that are the last three years of elementary education. (Tebliğler Dergisi, 2007). Students try to be placed into the limited quotas of the secondary schools, with the scores calculated in the aforementioned manner. For this purpose, STS (Level Determination Examination) which is very similar to this exam is taken as a base in the research. STS is a tentative competitive examination held at provincial level in Turkey. Taking Level Determination Examination is not compulsory but optional. Students take Level Determination Examination in accordance with their class level and the questions asked in this examination are suitable for their class level. Thanks to this examination, students are able to compare themselves with other students with the same class level who take the exam as well. According to the scores, students are able to see and get their ranks on provincial basis. Thus, they are able to shape their future educational programs. From this aspect, STS may be used as a tool for unofficially labeling students and schools and ranking them based upon these labels. The school community considers these exams very important. The performance of students in these exams is regarded as the indicator of quality of the school in public. The scores taken in these exams are also an
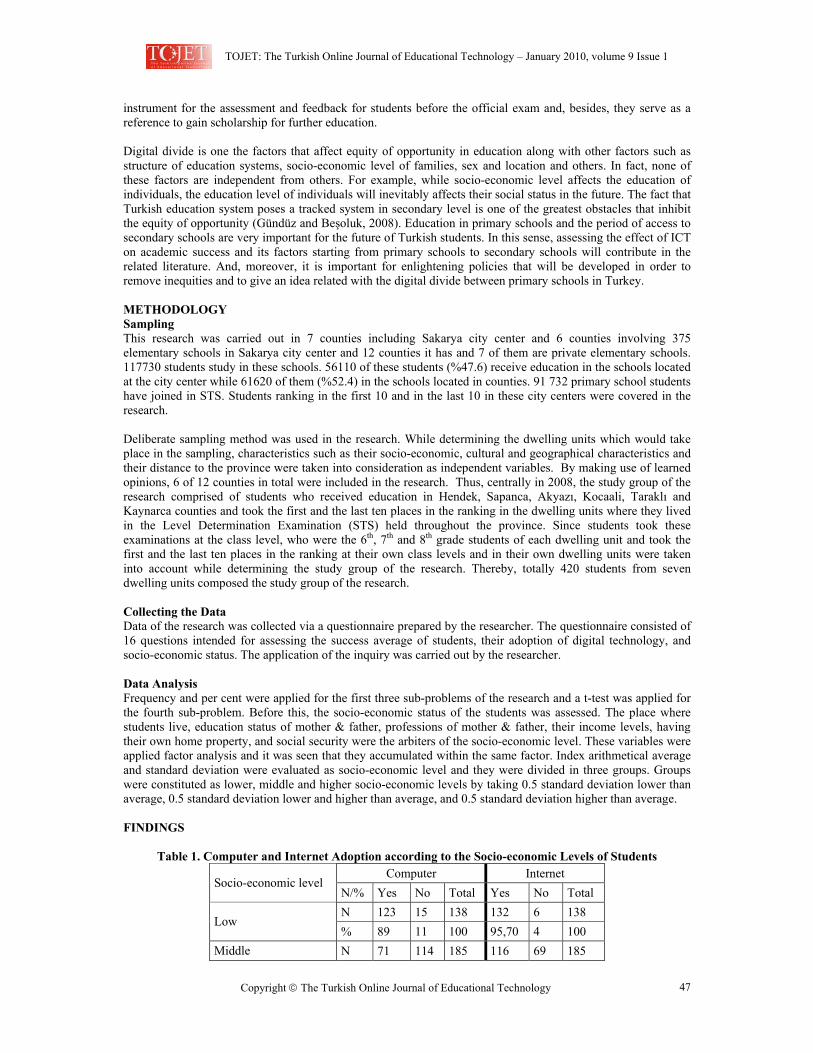
TOJET: The Turkish Online Journal of Educational Technology – January 2010, volume 9 Issue 1
Copyright The Turkish Online Journal of Educational Technology 47
instrument for the assessment and feedback for students before the official exam and, besides, they serve as a reference to gain scholarship for further education. Digital divide is one the factors that affect equity of opportunity in education along with other factors such as structure of education systems, socio-economic level of families, sex and location and others. In fact, none of these factors are independent from others. For example, while socio-economic level affects the education of individuals, the education level of individuals will inevitably affects their social status in the future. The fact that Turkish education system poses a tracked system in secondary level is one of the greatest obstacles that inhibit the equity of opportunity (Gündüz and Beşoluk, 2008). Education in primary schools and the period of access to secondary schools are very important for the future of Turkish students. In this sense, assessing the effect of ICT on academic success and its factors starting from primary schools to secondary schools will contribute in the related literature. And, moreover, it is important for enlightening policies that will be developed in order to remove inequities and to give an idea related with the digital divide between primary schools in Turkey. METHODOLOGY Sampling This research was carried out in 7 counties including Sakarya city center and 6 counties involving 375 elementary schools in Sakarya city center and 12 counties it has and 7 of them are private elementary schools. 117730 students study in these schools. 56110 of these students (%47.6) receive education in the schools located at the city center while 61620 of them (%52.4) in the schools located in counties. 91 732 primary school students have joined in STS. Students ranking in the first 10 and in the last 10 in these city centers were covered in the research. Deliberate sampling method was used in the research. While determining the dwelling units which would take place in the sampling, characteristics such as their socio-economic, cultural and geographical characteristics and their distance to the province were taken into consideration as independent variables. By making use of learned opinions, 6 of 12 counties in total were included in the research. Thus, centrally in 2008, the study group of the research comprised of students who received education in Hendek, Sapanca, Akyazı, Kocaali, Taraklı and Kaynarca counties and took the first and the last ten places in the ranking in the dwelling units where they lived in the Level Determination Examination (STS) held throughout the province. Since students took these examinations at the class level, who were the 6th, 7th and 8th grade students of each dwelling unit and took the first and the last ten places in the ranking at their own class levels and in their own dwelling units were taken into account while determining the study group of the research. Thereby, totally 420 students from seven dwelling units composed the study group of the research. Collecting the Data Data of the research was collected via a questionnaire prepared by the researcher. The questionnaire consisted of 16 questions intended for assessing the success average of students, their adoption of digital technology, and socio-economic status. The application of the inquiry was carried out by the researcher. Data Analysis Frequency and per cent were applied for the first three sub-problems of the research and a t-test was applied for the fourth sub-problem. Before this, the socio-economic status of the students was assessed. The place where students live, education status of mother & father, professions of mother & father, their income levels, having their own home property, and social security were the arbiters of the socio-economic level. These variables were applied factor analysis and it was seen that they accumulated within the same factor. Index arithmetical average and standard deviation were evaluated as socio-economic level and they were divided in three groups. Groups were constituted as lower, middle and higher socio-economic levels by taking 0.5 standard deviation lower than average, 0.5 standard deviation lower and higher than average, and 0.5 standard deviation higher than average. FINDINGS
Table 1. Computer and Internet Adoption according to the Socio-economic Levels of Students Computer Internet
Socio-economic level N/% Yes No Total Yes No Total N 123 15 138 132 6 138
Low % 89 11 100 95,70 4 100
Middle N 71 114 185 116 69 185
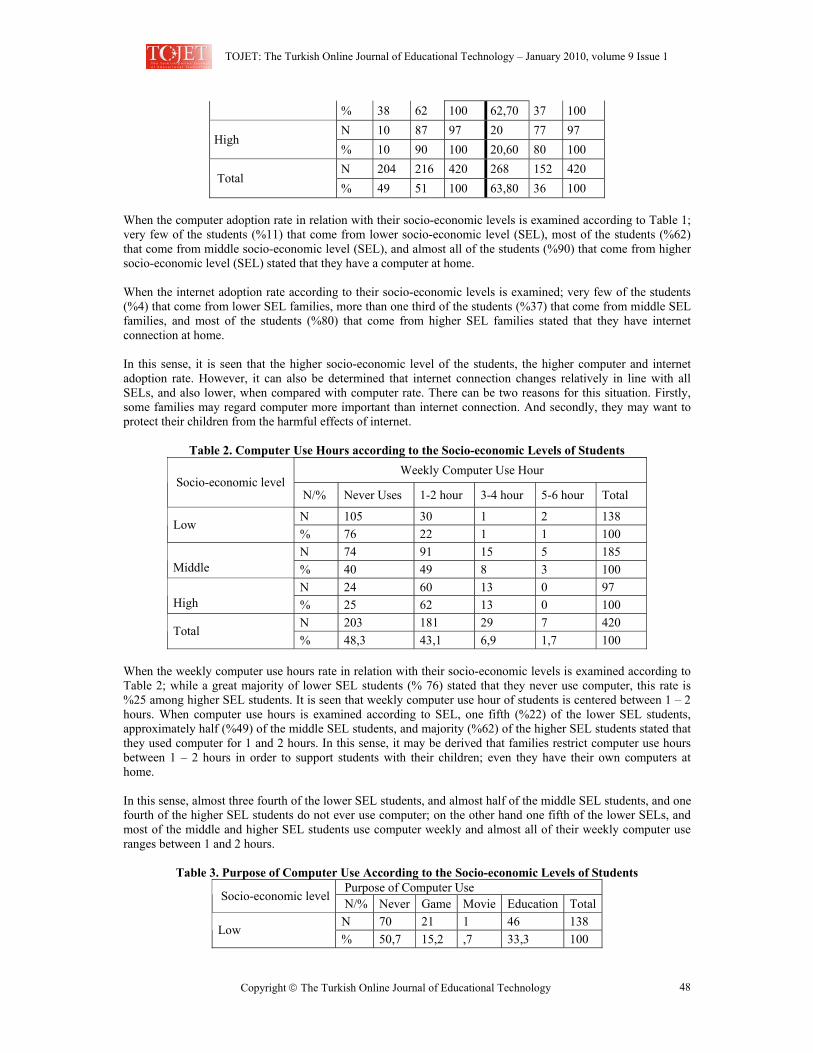
TOJET: The Turkish Online Journal of Educational Technology – January 2010, volume 9 Issue 1
Copyright The Turkish Online Journal of Educational Technology 48
% 38 62 100 62,70 37 100 N 10 87 97 20 77 97
High % 10 90 100 20,60 80 100 N 204 216 420 268 152 420
Total % 49 51 100 63,80 36 100
When the computer adoption rate in relation with their socio-economic levels is examined according to Table 1; very few of the students (%11) that come from lower socio-economic level (SEL), most of the students (%62) that come from middle socio-economic level (SEL), and almost all of the students (%90) that come from higher socio-economic level (SEL) stated that they have a computer at home. When the internet adoption rate according to their socio-economic levels is examined; very few of the students (%4) that come from lower SEL families, more than one third of the students (%37) that come from middle SEL families, and most of the students (%80) that come from higher SEL families stated that they have internet connection at home. In this sense, it is seen that the higher socio-economic level of the students, the higher computer and internet adoption rate. However, it can also be determined that internet connection changes relatively in line with all SELs, and also lower, when compared with computer rate. There can be two reasons for this situation. Firstly, some families may regard computer more important than internet connection. And secondly, they may want to protect their children from the harmful effects of internet.
Table 2. Computer Use Hours according to the Socio-economic Levels of Students Weekly Computer Use Hour
Socio-economic level N/% Never Uses 1-2 hour 3-4 hour 5-6 hour Total
N 105 30 1 2 138 Low
% 76 22 1 1 100 N 74 91 15 5 185
Middle % 40 49 8 3 100 N 24 60 13 0 97
High % 25 62 13 0 100 N 203 181 29 7 420
Total % 48,3 43,1 6,9 1,7 100
When the weekly computer use hours rate in relation with their socio-economic levels is examined according to Table 2; while a great majority of lower SEL students (% 76) stated that they never use computer, this rate is %25 among higher SEL students. It is seen that weekly computer use hour of students is centered between 1 – 2 hours. When computer use hours is examined according to SEL, one fifth (%22) of the lower SEL students, approximately half (%49) of the middle SEL students, and majority (%62) of the higher SEL students stated that they used computer for 1 and 2 hours. In this sense, it may be derived that families restrict computer use hours between 1 – 2 hours in order to support students with their children; even they have their own computers at home. In this sense, almost three fourth of the lower SEL students, and almost half of the middle SEL students, and one fourth of the higher SEL students do not ever use computer; on the other hand one fifth of the lower SELs, and most of the middle and higher SEL students use computer weekly and almost all of their weekly computer use ranges between 1 and 2 hours.
Table 3. Purpose of Computer Use According to the Socio-economic Levels of Students Purpose of Computer Use
Socio-economic level N/% Never Game Movie Education Total N 70 21 1 46 138
Low % 50,7 15,2 ,7 33,3 100
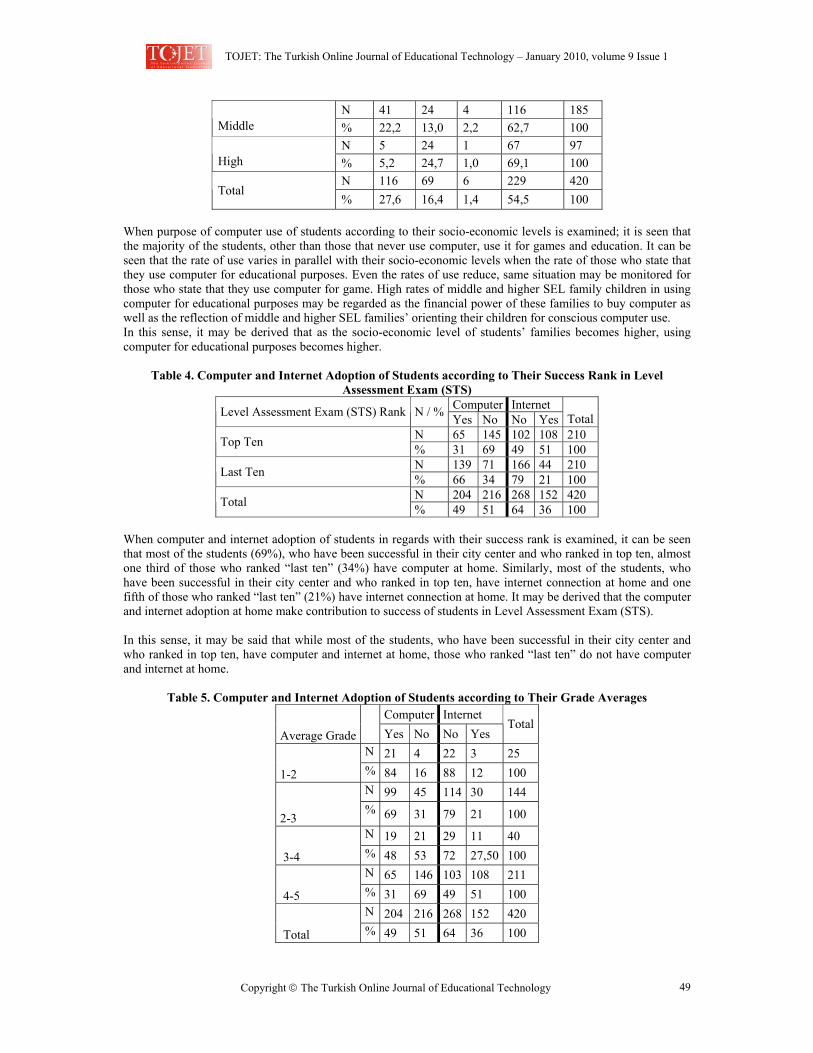
TOJET: The Turkish Online Journal of Educational Technology – January 2010, volume 9 Issue 1
Copyright The Turkish Online Journal of Educational Technology 49
N 41 24 4 116 185 Middle % 22,2 13,0 2,2 62,7 100
N 5 24 1 67 97 High % 5,2 24,7 1,0 69,1 100
N 116 69 6 229 420 Total
% 27,6 16,4 1,4 54,5 100 When purpose of computer use of students according to their socio-economic levels is examined; it is seen that the majority of the students, other than those that never use computer, use it for games and education. It can be seen that the rate of use varies in parallel with their socio-economic levels when the rate of those who state that they use computer for educational purposes. Even the rates of use reduce, same situation may be monitored for those who state that they use computer for game. High rates of middle and higher SEL family children in using computer for educational purposes may be regarded as the financial power of these families to buy computer as well as the reflection of middle and higher SEL families’ orienting their children for conscious computer use. In this sense, it may be derived that as the socio-economic level of students’ families becomes higher, using computer for educational purposes becomes higher.
Table 4. Computer and Internet Adoption of Students according to Their Success Rank in Level Assessment Exam (STS)
Computer Internet Level Assessment Exam (STS) Rank N / % Yes No No Yes Total
N 65 145 102 108 210 Top Ten % 31 69 49 51 100 N 139 71 166 44 210 Last Ten % 66 34 79 21 100 N 204 216 268 152 420 Total % 49 51 64 36 100
When computer and internet adoption of students in regards with their success rank is examined, it can be seen that most of the students (69%), who have been successful in their city center and who ranked in top ten, almost one third of those who ranked “last ten” (34%) have computer at home. Similarly, most of the students, who have been successful in their city center and who ranked in top ten, have internet connection at home and one fifth of those who ranked “last ten” (21%) have internet connection at home. It may be derived that the computer and internet adoption at home make contribution to success of students in Level Assessment Exam (STS). In this sense, it may be said that while most of the students, who have been successful in their city center and who ranked in top ten, have computer and internet at home, those who ranked “last ten” do not have computer and internet at home.
Table 5. Computer and Internet Adoption of Students according to Their Grade Averages Computer Internet
Average Grade Yes No No Yes Total
N 21 4 22 3 25
1-2 % 84 16 88 12 100 N 99 45 114 30 144
2-3 % 69 31 79 21 100 N 19 21 29 11 40
3-4 % 48 53 72 27,50 100 N 65 146 103 108 211
4-5 % 31 69 49 51 100 N 204 216 268 152 420
Total % 49 51 64 36 100
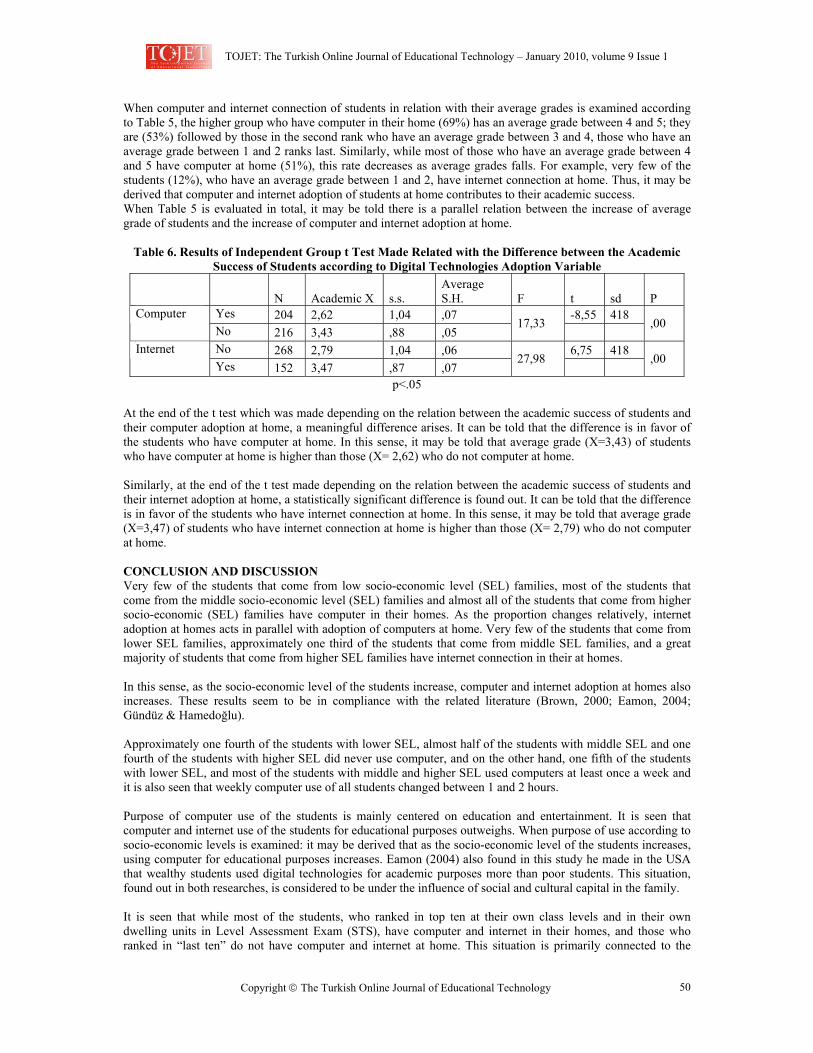
TOJET: The Turkish Online Journal of Educational Technology – January 2010, volume 9 Issue 1
Copyright The Turkish Online Journal of Educational Technology 50
When computer and internet connection of students in relation with their average grades is examined according to Table 5, the higher group who have computer in their home (69%) has an average grade between 4 and 5; they are (53%) followed by those in the second rank who have an average grade between 3 and 4, those who have an average grade between 1 and 2 ranks last. Similarly, while most of those who have an average grade between 4 and 5 have computer at home (51%), this rate decreases as average grades falls. For example, very few of the students (12%), who have an average grade between 1 and 2, have internet connection at home. Thus, it may be derived that computer and internet adoption of students at home contributes to their academic success. When Table 5 is evaluated in total, it may be told there is a parallel relation between the increase of average grade of students and the increase of computer and internet adoption at home.
Table 6. Results of Independent Group t Test Made Related with the Difference between the Academic Success of Students according to Digital Technologies Adoption Variable
N Academic X s.s.
Average S.H. F t sd P
Yes 204 2,62 1,04 ,07 -8,55 418 Computer No 216 3,43 ,88 ,05
17,33
,00
No 268 2,79 1,04 ,06 6,75 418 Internet Yes 152 3,47 ,87 ,07
27,98
,00
p<.05 At the end of the t test which was made depending on the relation between the academic success of students and their computer adoption at home, a meaningful difference arises. It can be told that the difference is in favor of the students who have computer at home. In this sense, it may be told that average grade (X=3,43) of students who have computer at home is higher than those (X= 2,62) who do not computer at home. Similarly, at the end of the t test made depending on the relation between the academic success of students and their internet adoption at home, a statistically significant difference is found out. It can be told that the difference is in favor of the students who have internet connection at home. In this sense, it may be told that average grade (X=3,47) of students who have internet connection at home is higher than those (X= 2,79) who do not computer at home. CONCLUSION AND DISCUSSION Very few of the students that come from low socio-economic level (SEL) families, most of the students that come from the middle socio-economic level (SEL) families and almost all of the students that come from higher socio-economic (SEL) families have computer in their homes. As the proportion changes relatively, internet adoption at homes acts in parallel with adoption of computers at home. Very few of the students that come from lower SEL families, approximately one third of the students that come from middle SEL families, and a great majority of students that come from higher SEL families have internet connection in their at homes. In this sense, as the socio-economic level of the students increase, computer and internet adoption at homes also increases. These results seem to be in compliance with the related literature (Brown, 2000; Eamon, 2004; Gündüz & Hamedoğlu). Approximately one fourth of the students with lower SEL, almost half of the students with middle SEL and one fourth of the students with higher SEL did never use computer, and on the other hand, one fifth of the students with lower SEL, and most of the students with middle and higher SEL used computers at least once a week and it is also seen that weekly computer use of all students changed between 1 and 2 hours. Purpose of computer use of the students is mainly centered on education and entertainment. It is seen that computer and internet use of the students for educational purposes outweighs. When purpose of use according to socio-economic levels is examined: it may be derived that as the socio-economic level of the students increases, using computer for educational purposes increases. Eamon (2004) also found in this study he made in the USA that wealthy students used digital technologies for academic purposes more than poor students. This situation, found out in both researches, is considered to be under the influence of social and cultural capital in the family. It is seen that while most of the students, who ranked in top ten at their own class levels and in their own dwelling units in Level Assessment Exam (STS), have computer and internet in their homes, and those who ranked in “last ten” do not have computer and internet at home. This situation is primarily connected to the
TOJET: The Turkish Online Journal of Educational Technology – January 2010, volume 9 Issue 1
Copyright The Turkish Online Journal of Educational Technology 51
financial power of the families to buy computer and internet. The fact that families with high economic levels and which did not have computer and internet connection lacked the awareness of contribution into educational success may be considered to stem from mental accesses (Van Dijk, 1999) such as computer anxiety and neglecting technologies, which are called access obstacles. When computer and internet connection of students in relation with their average grades is examined according to Table 5, the higher group who have computer in their homes (69%) has an average grade between 4 and 5; they are (53%) followed by those in second rank who have an average grade between 3 and 4, those who have an average grade between 1 and 2 ranks last. Similarly, while most of those who have an average grade between 4 and 5 have computer in their homes (51%), this rate decreases as average grades falls. For example, very few of students (12%), who have an average grade between 1 and 2, have internet connection in their home. It may be told there is a parallel relation between the increase of average grade of the students and the increase of having computer and internet connection in their homes. It is widely believed that computer and internet connection students’ home contributes to their academic success. These findings are also supported by the related literature (Eamon, 2004; Ross et al., 1991; Sutton, 1991). A meaningful difference is found out in academic success of students according to their internet connection in their homes. It is also seen that the average grade of students that have computer and internet connection in their homes is higher than the average grade of those who do not. When examined totally, there is a digital divide between primary school students. It is believed that this situation is in parallel with the socio-economic level of the families. As explained by Gündüz and Hamedoğlu (2003), it wouldn’t be expected that new technologies reach all people at the same time. However, groups or individuals that have digital technologies belong to higher and middle classes. In this context digital technologies realize the continuation of the available structure and widening the gap ever getting bigger (McConnaughey, 1997; Shapiro, 2001). It is believed that economical and social factors are the essential of digital divide witnessed among students. So, in order to prevent the digital divide arising from economical effects, first of all, digital instruments must be financially available for each class of the society. And it is also suggested that these technologies must be made more available for those who have even poorer opportunities. In order to come over mental access problems, offering guidance service that will increase sensitivity of the families and arranging education intended against obstacles of use may be suggested. REFERENCES Akkoyunlu, B. & Kurbanoğlu, S. (2003), “Oğretmen adaylarının bilgi okuryazarlığı ve bilgisayar öz-yeterlik
algıları üzerine bir çalışma”, Hacettepe Üniversitesi Eğitim Fakültesi Dergisi, 24 : 1-10. American Library Association. (2002). What is the digital divide? www.ala.org/oitp/digitaldivide/what.html (last
accessed 16 June 2009). Benkler, Y. (2006). The Wealth of Networks. New haven, CT: Yale University Press. Bertot, J. C., & McClure, C. R. (1998). The 1998 National Survey of U.S. Public Library Outlet Internet
Connectivity: Final report. Retrieved February 1999 from http://www.ala.org/oitp/digitaldivide/ survey.html(last accessed 16 June 2009).
Bolt, D., & Crawford, R. (2000). The Digital Divide: Computers and Our Children’s Future. New York: TV Books.
Bozionelos, N. (2004). Socioeconomic background and computer use: The role of computer anxiety and computer experience on ownership. International Journal of Human-Computer Studies, 61, 725-746.
Castells, M. (1999). The Media Reader: Continuity and Transformation. H. M. T. (Dü.), An Introduction to the Information Age. London: Sage.
Castells, M. (2000). The Rise of the Network Society (2nd ed.). Oxford, U.K.: Basil Blackwell. Chakraborty, J. and Bosman, M. M. (2005). Measuring the digital divide in the united states: race, income, and
personal computer ownership, The Professional Geographer, 57 (3), 395–410. Cummins, J., & Sayers, D. (1995). Brave New Schools: Challenging Cultural Illiteracy Through Global
Learning Networks. New York: St. Martin’s Press. Compaine, B. M. (2001). The Digital Divide: Facing a Crisis or Creating a Myth? Cambridge, MA: MIT Press. Cooper, M. (2004). Expanding The Digital Divide & Falling Behind on Broadband: Why Telecommunications
Policy of Neglect is Not Benign. Consumer Federation of America, Consumer Union, the Civil Rights Forum, Washington DC. http://www.consumerfed.org/pdfs/digitaldivide.pdf (accessed 15 June 2009).
TOJET: The Turkish Online Journal of Educational Technology – January 2010, volume 9 Issue 1
Copyright The Turkish Online Journal of Educational Technology 52
Dewan, S., and Riggins, F. J. (2005). The digital divide: current and future research directions. Journal of Association for Information Systems 6 (2) : 298–337.
DiMaggio, P. and E. Hargittai. (2001). "From the 'Digital Divide' to 'Digital Inequality': Studying Internet Use as Penetration Increases." Princeton: Center for Arts and Cultural Policy Studies, Woodrow Wilson School, Princeton University.
DiMaggio, P., Hargittai, E., Celeste, C., and Shafer, S. (2004). Digital İnequality: From Unequal Access to Differentiated Use. In Social inequality, ed. K Neckerman, pp. 355–400. New York: Russell Sage Foundation.
Eamon, M. K. (2004). Digital Divide in Computer Access and Use Between Poorand Non-pooryouth, Journal of Sociology and Social Welfare, Volume XXXI, Number 2, 91 – 112.
Gündüz, H.B. ve Hamedoğlu, M.A.. (2003). Liselerde sayısal kopuş (Sakarya İli Örneği), Sakarya Üniversitesi Eğitim Fakültesi Dergisi, Sayı:6, 214-245.
Gündüz, H.B. ve Ş. Beşoluk. (2008). Türk ortaöğretim sisteminde mesleki ve genel eğitim ikilemi” Sakarya Üniversitesi Eğitim Fakültesi Dergisi, Sayı:15, 42 - 60 Nisan
Hargittai, E. (2003). The Digital Divide and What to Do About It. In New Economy Handbook, (ed.) Jones, D.C. San Diego, CA: Academic Press.
Hick, S. F., & McNutt, J. G. (Eds.) (2002). Advocacy, activism, and the internet. Chicago: Lyceum. Howard, P. E. N., L. Rainie, and S. Jones. (2001). Days and nights on the internet: the impact of a diffusing
technology. American Behavioral Scientist 45 (3): 383–404. Information, C. O. (1998). Our Information Age: the Government’s Vision. London: Stationery Office. Jencks, C., & Phillips, M. (1999 ). Aptitude Orsuccess: Why Do Test Scores Predict Educational Attainment and
Earnings? InS.E. Mayer& P.E.Peterson (Eds.), Earning and Learning: How Schools Matter (pp. 15–47). Washington, DC: Brookings Institution Press.
Johnson, K. A. (2000). Do Computers in the Classroom Boost Academic Success? Washington, DC: The Heritage Foundation.
Kotkin, J. (2000). The New Geography: How The Digital Revolution is Reshaping the American Landscape. New York: Random House.
Kurbanoğlu, S. & Akkoyunlu, B. (2002) Öğrencilere bilgi okuryazarlığı becerilerinin kazandırılması üzerinebir çalışma. Hacettepe Üniversitesi Eğitim Fakültesi Dergisi. Say›: 21. ss. 81 - 88.
Krueger, A. B. (1993). How computers have changed the wage structure: Evidence from microdata, 1984–1989. The Quarterly Journal of Economics, 108, 33–60.
Lebo, H. (2003). The UCLA Internet Report: Surveying the Digital Future—Year Three: 89. Los Angeles: UCLA Center for Communication Policy.
Lepper, M. R., & Gurtner, J. (1989). Children and computers: Approaching the twenty-first century. American Psychologist, 44, 170–178.
Lıvıngstone, S. & Helsper E. (2007) Gradations in digital ınclusion: children, young people and the digital divide, New Media & Society. Vol. 9,4, 671–696.
Lynette K., Payton F. C., Mbarika, V. W. Amadi, A. and Meso P. (2008), Gendered perspectives on the digital divide, ıt education, and workforce participation in Kenya, IEEE Transactıons on Educatıon, Vol. 51, 2, 256 – 261.
Marks, G. N., J. Cresswell, and J. Ainley. (2006). Explaining socioeconomic inequalities in student success: the role of home and school factors. Educational Research and Evaluation Vol. 12, No. 2, April 2006, pp. 105 – 128.
McConnaughey, J.W. (2000) “Falling Through the Net II: New Data on the Digital Divide National Telecommunications and İnformation Administration” http.//www.ntia.doc.gov/ntiahome/ net2/failing.html. (Last Accessed: 07,05,2001).
Mosseberger, K., Tolbert, C, & Stansbury, M. (2003). Virtual inequality: Beyond the digital divide. Washington, DC: Georgetown University Press.
Norris, P. (2001). The Digital Divide: Civic Engagement, İnformation Poverty & the Internet Worldwide. Cambridge: Cambridge University Press.
Ross, S. M., Smith, L. S. & Morrison, G. R. (1991). The longitudinal influences of computer-intensive learning experiences on at-risk elementary students. Educational Technology Research & Development, 41, 33–46.
Shapiro, R.J. (2001) “Falling Through the Net: Toward Digital Inclusıon” http://www.ntia.doc.gov/ ntiahome/fttn/ intoduction.html. (last accessed 07.05.2001)
Shavit, Y (1990). Tracking and the persistence of ethnic occupational inequalities in Israel. International per-spectives on education and society: Vol. 2. Greenwich, CT: JAI Press.
Selwyn, N. (2002). Defining the ‘Digital Divide’: Developing a Theoretical Understanding of Inequalities in the Information Age. Occasional Paper 49. Cardiff: Cardiff University. Retrieved June 15, 2009 from http://lion. Inchon .ac.kr/~sjinwan/egov/chamgo/ definingdigitaldivide.pdf.
TOJET: The Turkish Online Journal of Educational Technology – January 2010, volume 9 Issue 1
Copyright The Turkish Online Journal of Educational Technology 53
Selwyn, N. (2004). Reconsidering Political and Popular Understandings of the Digital Divide. New Media Society , 6 (3), s. 341–362.
Servon L. J., and Nelson, M. K. (2001. Community technology centers: narrowing the digital divide in low-income, urban communities, Journal of Urban Affairs 23:279–90.
Sutton, R. E. (1991). Equity and computers in the schools: A decade of research. Review of Educational Research, 61, 475–503.
Tebliğler Dergisi (2007). Ortaöğretim Kurumlarına Geçiş Yönergesi. Sayı 2604. Tezci, E. & Dikici A. (2006). The effects of Dıgıtal Portfolıo Assessment Process on Students’ Wrıtıng and
Drawıng Performances, The Turkish Online Journal of Educational Technology – TOJET, Volume 5, Issue 2, Article 7.
Turow, J., & Nir, L. (2000, May). The Internet and the family 2000: The view from parents; the view from kids. Report series No. 33. Philadelphia, PA: The An-nenberg Public Policy Center of the University of Pennsylvania. Retrieved January 12, 2003, from http://www.appcpenn.org/internet/family/ finalrepor fam.pdf.
U.S. Department of Education. Office of Educational Research and Improve¬ment. National CenterforEducational Statistics. (1999).
Van Dijk, Jan. (1999). The Network Society, Social Aspects of New Media.Thousand Oaks, CA: Sage. Van Dijk J. & Hacker K. (2003). The Digital Divide as a Complex and Dynamic Phenomenon, The Information
Society, 19: 315-326 Warschauer,M.(2000). Technologyand school reform:Aview frombothsides of the track. Education Policy
Analysis Archives, 8(4). Retrieved April 1, 2004, from http://epaa.asu.edu/ epaa/v8n4.html. (accessed 15 June 2009).
Warschauer,M. (2003). Technology and Social İnclusion: Rethinking The Digital Divide. Cambridge, MA: MIT Press.
Warschauer, M. (2003). Demystifying the Digital Divide. Scientific American , Vol. 289 (Issue 2), s. 42. Wilhelm, A. (2001). They threw me a computer. . .but what I really needed was a life presever. First
Monday6(4). www.firstmonday.org/issues/issue6_4/ wilhelm/ (last accessed 15 June 2009). çıkartılabilir Wills, M. (1999, December). Bridging the Digital Divide. Adults Learning , 10–11. Wilson, E. J. III. (2006). Why We Need a Negotiation Model to Explain Internet Diffusion. Access to Knowledge
Conference, Yale University, New Heaven, CT. Wilson, K. R. Wallin, J. S. & Reiser C. (2003). Social Stratification and the Digital Divide, Social Science
Computer Review, Vol. 21 No. 2, 133-143. Wenglinsky,H.(1998).Doesitcompute?The relationship betweeneducationaltechnol-ogy and student success in
mathematics. Princeton, NJ: Policy Information Center, Educational Testing Service. Yalçınalp, S.& Aşkar P. (2003). Öğrencilerin Bilgi Arama Amacıyla İnternet’i Kullanım Biçimlerinin
İncelenmesi, The Turkish Online Journal of Educational Technology – TOJET, Volume 2, Issue 4, Article 15.
TOJET: The Turkish Online Journal of Educational Technology – January 2010, volume 9 Issue 1
Copyright The Turkish Online Journal of Educational Technology 54
E-HALAGAT: AN E-LEARNING SYSTEM FOR TEACHING THE HOLY QURAN
Yahya O. Mohamed ELHADJ Research Center at the College of Computer & Information Sciences
Al-Imam Muhammad Ibn Saud Islamic University P.O.Box. 5701, Riyadh 11432, KSA
Phone/Fax: +966 1 25 82 140 Email: [email protected], [email protected]
ABSTRACT Recently, there has been a great interest in Islamic software that try to harness computer to serve the religion. This brought about some applications and programs for the Holy Quran and its sciences, Hadith " الحديث" (Prophet’s Tradition) and its methodology, Fiqh "ه .and Islamic law in general ,(Islamic jurisdiction) "الفقHowever, these computer-programs, especially those developed for the sake of the noble Quran are still limited and have been focused on a direct application of the Information Technology techniques, such as storing, listening, searching, etc, without using more elaborated techniques in the domain. To contribute in the improvement of these efforts, a project for Computerized Teaching of the Holy Quran (CTHQ) is initiated. It aims to introduce advanced techniques and methodologies to develop an appropriate environment for self learning of the Holy Quran and its sciences. Different sub-systems are being developed separately and will then be combined together to set up this environment. This paper presents the design and development of one of these subsystems devoted to teaching how to recite the noble Quran and to memorize it in a manner similar to the usual way followed in the Quranic schools and rings at mosques, known in Arabic as "halagat" (حلقات). Keywords: Holy Quran, Quran recitation, Quran memorization, Quran sciences, E-learning. 1. INTRODUCTION Interest to the recitation and memorization of the Holy Quran began since its revelation to the Prophet Muhammad pbh. It was directly memorized by heart and recited (by his companions) as taught by the Prophet and then transmitted orally from teachers to learners throughout generations. In addition, companions of the Prophet wrote it down to leave a hard copy (Al-Mashaf المصحف) for next generations. Reciting the Holy Quran in the appropriate way is very important for all Muslims and is indispensable in Islamic worshiping such as prayers. For these reasons, teaching how to recite has been done through teachers who pronounce the Quranic sounds accurately. Such method has been considered, since the revelation of the Holy Quran, as the only way to learn how to recite it correctly until the twenteenth century, where Technology produced recording systems and electronic devices that are able to keep both text and sound of the Quran with tajweed rules " د ام التجوي Since then, it becomes possible to .(rules of correct pronunciation of the Holy Quran)"أحكlisten to the Quranic recitations recorded from authentic reciters. Many software have then appeared to assist novice learners by letting them listening while following the corresponding text on the screen. However, the efforts spent by the computer scientists in general for the sake of the noble Quran are still limited and have only focused on the straightforward use of the Information Technology techniques, such as storing, listening, searching, etc, without using more elaborated techniques in the domain. This paper is a part of a project aiming to build a computerized-environment for learning the Holy Quran and its sciences "CTHQ". It is an attempt to improve computerization of the Holy Quran by introducing advanced techniques and methodologies. Four main tracks have been designed to carry out this project. In the first track, the focuse was on gathering and improving the most important aspects related to the recitation and memorization of the Holy Quran that are available in the existing Quranic programs, and then putting them in a comprehensive and consistent environment. In the second track, speech recognition techniques have been used to assist reading the noble Quran. A speech corpus of Quranic recitations has been firstly collected and used to extract Quranic sounds (Alghamdi et al, 2007; Elhadj, 2009a; Elhadj et al, 2009b). Next, these sounds are modelled by Hidden Markov Models (HMM) and trained on the developed corpus. They are now under consideration for building software-component to assist reading and memorizing by automatically detecting and correcting mistakes. In the third track, techniques for determining the similarity between verses (ayah ة of the noble Quran were (آيinvestigated (Alsughayeir & Ohali, 2007; Alsughayeir et al, 2009). Computer-tools have been developed for analyzing the text of the noble Quran based on complete words and their stems in order to link similar verses (Elhadj et al, 2009c). In the fourth track, a sub-system for teaching tajweed rules was developed (Elhadj et al, 2009d). A mathematical formulation of tajweed rules was proposed and then programmed in an engine that can be used to detect places of tajweed rules in the Quranic verses and also to assist to learn these rules. In the last
TOJET: The Turkish Online Journal of Educational Technology – January 2010, volume 9 Issue 1
Copyright The Turkish Online Journal of Educational Technology 55
track, we integrate different developed subsystems in order to provide the user with a system containing the most important aspects and tools helping to learn the noble Quran and its sciences. In this paper, we present our work related to the first track. It consists on the design and develop a platform for teaching how to recite the noble Quran and to assist memorizing it in a manner similar to the usual way followed in the Quranic schools and rings at mosques, which are known as "halagat". The speech recognizer can be integrated later on when it becomes ready to use. This can be seen as a true e-learning system for the teaching of the noble Quran. 2. SURVEY OF EXISTING TOOLS To meet the requirements stated in the first track of the CTHQ project, a study has focused on surveying the most important existing systems in order to know and to collect together different aspects available in these systems (Elhadj & Alsughayeir, 2005; Alsughayeir & Elhadj, 2006). The methodology employed to conduct this study consisted of collecting a maximum number of Quranic applications, either desktop, web-based or hand-held applications. Each application is separately studied and evaluated in order to know the characteristics and services it offers. This is done in three phases:
a) In the first phase, general information about the product is determined: the name, objective, efficiency (interface, speed of execution, etc.), availability and accessibility, price of the product as well as the name and address of its provider.
b) In the second phase, the basic functions of the product are explored: memorization "tahfeez يظ ,"التحفperfect reading "tajweed التجويد", interpretation "tafseer التفسير", similarity "tashabouh التشابه", reasons of revelation "nuzoul زول أسباب از scientific inimitability "Ejaz ," الن ة translation "tarjama ,"االعج ,"الترجمavailability of different reciters "Qurraa راء راءات ways of recitations "Qeraat ,"ق ,such as Hafs, Qaloun "قWarsh, etc (Habash, 1986).
c) In the third phase, the technical aspects of the product are devoted: display of the Holy Quran (image or text), availability and use of the index and colour coding, searching flexibilities, copying and selecting verses, repetition of the recitation as well as the possibility of recording which is helpful in the verification of the memorization.
From the collected software, we selected ten desktop applications, nine web-based applications, and seven hand-haled applications. They are chosen based-on some criteria related to the existence of features that are important for learning the Holy Quran and its sciences. Next, an appropriate form has been designed and used to report together information about different applications in order to facilitate the extraction and comparison of the most important features. These features can be summarized and shortly analyzed as follows: 2.1. Memorization Many products support this property, as it is important in any Quran product, and use different methods to implement it:
a) Repetition: some products employ repetition of the recitation as a technique of memorization. Repetition can, either on the Qranic verse or on the whole section (set of verses) with specified number of repetition.
b) Memorization Chart: some products use a table of memorization. This table contains different sections that need to be memorized and used to control and evaluate the level of memorization of each user.
2.2. Memorization Tests Recording, fill in the blanks or printing words have been used in the evaluated products as methods to verify the correctness and the quality of the memorization.
a) Recording: the user can verify its own memorization by first recording its recitation and then listening it in order to correct himself.
b) Fill in or Printing: a Quranic verse or a section can be showed for a specified time to a user before being asked to fill in or printing some words or the whole section to verify its own memorization. He cannot pass any word without being sure of its spelling.
However, no product has tried to apply any kind of an immediate vocal recognition to follow the reader in its recitation in order to discover mistakes. This characteristic is one of our main objectives in the CTHQ project and is under consideration as we have already explained.
TOJET: The Turkish Online Journal of Educational Technology – January 2010, volume 9 Issue 1
Copyright The Turkish Online Journal of Educational Technology 56
2.3. Recitation Rules "Tajweed" Most of the evaluated products list tajweed rules as simple and traditional lessons (text or sound) independently of the Quranic verses to be recited. However, we need to link the tajweed rules directly to the verse at the same time with its recitation in order to memorize it correctly. 2.4. Interpretation "Tafseer" Most of the evaluated products support more than one book of interpretation as references. However, they are also not directly linked, in most of the products, with the Quanic verses. Instead, they are accessed by navigating the whole book. We think that it is important that the learner be able to access the interpretation of a given verse directly from the Holy Quran (Al-Mashaf) without the need to go through the interpretation book. 2.5. Reasons of Revelation "Nuzoul" The evaluated products that support this characteristic are very few in general. Some of them link every verse with its reasons of revelation, whereas others list them independently of the underlying verses. 2.6. Similarity "Tashabouh" There are special products that support this characteristic, but are not linked to any of the surveyed products used for memorizing the Holy Quran. In fact, the similarity helps in clarification of the explanation and bringing to light the rhetoric of the noble Quran, and then makes the memorization much easier. So, it is important to be linked with other Quran sciences in the same product in order to be effective for learners. 2.7. Scientific Inimitability "Ejaz" As for the similarity, there are also special products that support this characteristic, but are not linked to any of the surveyed products. Indeed, this property is very important, because it helps people explain some modern science discoveries concerning their specializations. 2.8. Translation "Tarjama" Most of the evaluated products support the translation to more than one foreign language. Translations are given, in some of the evaluated products, for individual words of the Quran, whereas, in other products, they are given for the meaning of the whole verse. In both cases, they are often directly linked to the verse. 2.9. Reciters "Qurraa" Many of the evaluated products offer recorded recitations of famous Islamic reciters. They are used in these software as a reference for learning how to pronounce Quranic words and to recite them properly. 2.10. Quran Display The evaluated products displayed the Quran on the screen, either as an image of Al-Mashaf pages, or as a text using "Othmanic" or normal scripts. Indeed, the way used to display the Quran on the screen plays a significant role in the memorization, because people can remember verses or passages of the Quran basing on its appearance during its memorization. So, displaying pages of the Holy book on the screen is very helpful for the memorization. 2.11. Search Engine The evaluated products propose search engines for the Holy Quran and for books of its sciences that are supported, like tafseer books for example. Many ways of search are supported, like the search about single words with or without prefixes and suffixes, or the search about sequence of words considered as consecutive or separated words. There is also a possibility to search by the syntax of Quran words. Some products are powerful in the term of speed and quality of retrieval. 2.12. Index "Fahras" The Quran index is classified in some of the evaluated products according to the category of Surahs (Makiya مكية or Madaniya ة ,The Quran index is often displayed on the form of a table that contains names of Surahs .(مدنيtheir numbers, the number of their verses, the beginning of Quran parts ( رآن as well as the category (بدايات أجزاء القand other information about the specified Surah. Some of the evaluated products show the rate of the user's memorization in the index. As a conclusion from the survey and the analysis we made, it appeared that the software developed for the sake of the Holy Quran are still very limited either in their objectives or in the term of availability and relevance of features. No one of the surveyed programs gathers the main properties and services that have to be present in a convenient program for a computerized teaching of the Holy Quran and its sciences. None of them also tried to
TOJET: The Turkish Online Journal of Educational Technology – January 2010, volume 9 Issue 1
Copyright The Turkish Online Journal of Educational Technology 57
follow the reciter during its recitation in order to detect his mistakes and to correct him. In addition, many of these products are very weak in term of design and technical quality. To contribute to the improvement of the Holy Quran computerization, a specification of an environment for learning the Holy Quran and its sciences is thus proposed in the framework of the CTHQ project (Elhadj et al, 2008). It contains the most important aspects and tools helping to learn the noble Quran taking in consideration the opinions and suggestions received as feedback from some stakeholders. These features are organized in different sub-systems for flexibility and efficiency purposes. In this paper, only the part related to the memorization of the Holy Quran is presented. A general description of this e-learning system and its architecture is given in the next sections. 3. SYSTEM DESCRIPTION 3.1. Approach and Methodology It is important to remember that our proposed system is designed to simulate the usual way to inculcate the Holy Quran either in the Quranic schools or in the Quranic rings at mosques. In the Quranic schools, learners (or simply students) are distributed on different levels according to specific criteria such as age, ability of memorization, etc. In the Quranic rings, learners are organized in a set of groups, called "halagat", but not necessarily according to the same previous criteria. The main difference resides in the fact that students of a given level follow the same program, while learners of the same halaga may have different contents. Each halaga has its own tutors (teachers), which are responsible of the teaching side, and may share with other halagat a supervisor, which is responsible of its administration issues. Halagat are most spread in the teaching of the Holy Quran due to their flexibility and are present under different forms in Islamic countries. Our system is designed based-on the halagat approach that we will call "e-halagat" (i.e. electronic halagat). Each ehalaga (singular of ehalagat) simulates the real one in having tutors, supervisor, and registered students. As we will see below, the creation of ehalagh is done by its supervisor, which is in turn created by the system administrator either directly or by approving an online request from the supervisor itself. The supervisor is responsible of running the ehalaga in terms of adding or deleting tutors, distributing learners and following up in general. This is to have a hierarchical distribution of roles. For a full picture, we will describe the different involved users and their roles in the following sections. 3.2. Users and Their Roles The ehalagat system is built around for main kinds of users: learners, parents, tutors, and supervisors. The system administrator can be seen as a fifth kind of registered users. For the sake of efficiency and flexibility, responsibilities and roles are distributed hierarchically. The administrator is just managing supervisors, whereas supervisors are responsible of running ehalagat and their tutors. Tutors in turn are directly concerned with learners. Description of these users and their roles are given in the following subsections. 3.2.1. Learners Learners constitute the main target group; they can be classified at least into two categories according to their ages: adults and children. The age is important here to determinate access rules to the learner. For example, accessibility of children to some features is only allowed via their parents. Registration of learners and how they can work are explained below. 3.2.1.1. Registration Learners have two ways to register in the system according to their age group:
a. Adults: the system allows learners (who are over a certain age indicated in the ehalaga settings) to register themselves online in a page in the system.
b. Children: the system does not allow learners who are below a certain age to register alone; this would rather be done through their parents in the parent’s page.
In both cases the system asks for fill in the learner’s personal data as well as the parameters of the teaching method. It is worth to mention that memorization of the Holy Quran in the halagat consists in specifying for each learner a daily amount to be memorized starting from somewhere in the Quran. This amount can be measured by either ayah (Quranic verse) or page (page of the Al-Mashaf). It is generally preferable to use Al-Mashaf pages as they allow an easy switching and retrieving. As the learner progresses, he needs to have in parallel a revision program for memorized parts to improve their quality. So, for our ehalagat system, we have to specify the following parameters:
TOJET: The Turkish Online Journal of Educational Technology – January 2010, volume 9 Issue 1
Copyright The Turkish Online Journal of Educational Technology 58
a. Beginning of Memorization: the learner must designate a starting point to enable the system to add next parts to be memorized progressively. This is done by indicating the ayah (Quranic verse) and the surah (Quranic chapter). The system will then retrieve the corresponding page based-on our well-designed database of the Holy Quran, which includes different tables storing basic information related to the Quran in its both formats (textual and Al-Mashaf), Reciters, Ways of recitation, etc.
b. Length of the text to be memorized: the default length is one page, but it can be changed to any number of pages according to the capability of the learner.
c. Length of the text to be revised: it should be at least twice as long as the text to be memorized. We think that the learner need to continuously revise from the beginning up to the verse he just memorized and then backward again up to the starting point. This explains why the revision amount needs to be greater than the memorization one. Revision is a very important stage to perfect the learner’s memorization.
d. Reviewing previously-memorized texts: the system allows the learner to enter his previous memorized texts, which he covered before registration. In doing so, the system will include the previous memorized texts in the revision program for the perfection of memorization. This is an extra feature offered by the system.
Having set all needed data and parameters, the learner can choose the way of recitation (Qeraa) that he likes. He will be given a list of the ehalagat that support the selected way of recitation to join one. If there is no one supporting the way of recitation required, the learner will be asked to change it; otherwise he will not be registered. Once an ehalaga is selected, a list of registered tutors that have not reached their teaching load (a default value specified in the ehalagh settings) will be given according to choose one. It is noteworthy to mention that once tutors got their teaching load, the system will automatically add learners in a fashion that guarantee a maximum load-balancing of the teaching. Having fixed all above information, the system will provide the learner with a specific user name and password enabling him to follow his specific program in the system. 3.2.1.2. How Learners' System Works Once a learner logs in, he will be redirected to the memorization/revision part where he can find a list of useful options. He can browse his own profile and change it as needed (only for adults), measure his performance during a given period of time on charts that draw the number of sections perfected, times of failure in every section, duration of memorizing, print out his transcript, etc. If a section of the memorization/revision is chosen, the corresponding pages of the Holy Quran are displayed to the learner. Using Al-Mashaf pages in the display of the Holy Quran plays a major role in the process of memorization since the learner may recall the shape and position of the verse afterwards. This makes the process of memorizing easier. While browsing/reading the section's pages of a memorization/revision, the learner can listen to an ideal recitation taken from one of the famous reciters stored in the system as a reference for perfect recitation. Reference recitation can be solicited for a single verse or for a range of verses in the current section and can be repeated as many as needed. If the learner wants to know for a given verse, the included tajweed rules, tashabouh, nuzoul, tafseer, erab, etc., he can highlight it and then chooses whatever needed. Such features were developed as independent subsystems in the CTHQ project (Elhadj et al, 2009e) and are being integrated together in the global environment. After listening to the reference recitation several times, or reciting directly, the learner can test his memory by clicking on an icon to record the section. Then the pages of the section will disappear to test his memory. Clicking on the button of “end recording”, the pages will appear again so that the memorization can be verified in one of two ways:
a. Self Verification: as the learner listens to his own voice, he can find out his mistakes by reading the section or by listening to the reference recitation of it.
b. Automatic Verification: this is the target method of correction that we are developing now. It consists to use automatic speech recognition techniques to follow the reader and to correct its recitation. For this reason, we have started by building a speech database of the Holy Quran recitations that can be used to learn statistical models for Quranic sounds. Recitations of ten chosen reciters have been recorded in an appropriate environment and then manually transcribed at three levels: word, phoneme, allophone (Alghamdi et al, 2007; Elhadj, 2009a; Elhadj et al, 2009b). Quranic sounds at phoneme and allophone levels are modelled by Hidden Markov Models (HMMs) with three emitting states each and a mixture of sixteen Gaussian distributions per state. Hidden Markov Model Tool Kit (HTK) is used as an environment for developing our Quranic-sound recognizer. The average recognition rates reached 89% for allophones and about 96% for phonemes without using any language model. A direct explanation of
TOJET: The Turkish Online Journal of Educational Technology – January 2010, volume 9 Issue 1
Copyright The Turkish Online Journal of Educational Technology 59
this difference in the recognition rate is related to the number of phonemes which is roughly the half of allophones. Another reason is the difficulty to distinguish between allophonic variations of some sounds, which may necessitate a good training on a huge corpus. Different kinds of tunings are under considerations to improve the quality of the recognizer. The details of the development of these Quranic recognition tools and their tunings are being published separately.
The learner can repeat the recording and verification as described above till the perfection of memorization. At each test, the old recording of the section to be memorized is replaced by the new one. The audio file corresponding to the recording is named uniquely by combining the learner's user name and the number of the section to be memorized and is temporarily kept on the local machine. Once the learner approves his recording, the audio file is uploaded to the server and the learner will not be able to modify it. The tutor is then notified (by a short message or when he logs on) with an unmarked recorded section of that learner. After the tutor marks the section, the learner can benefit from the tutor’s audio and/or textual remarks (see the section about tutors) related to the mistakes made by the learner. It is noteworthy to mention that while the learner is waiting for a feedback from the tutor on an uploaded recording, the system can progressively add more sections to be memorized unless a certain number specified in the settings is reached. This is to ensure that the learner’s progress in memorizing will not be affected by the tutor being behind schedule. 3.2.2. Tutors They supervise and follow up the memorization of the learners. Their job can be summed up as follows. 3.2.2.1. Tutor’s Role and Registration The tutor can supervise several learners. He listens to the learners’ recitation during the process of memorizing and revising, and then he corrects their mistakes and gives them their due score and audio/textual remarks. The tutor has a free hand to modify the learner’s score and issue a record of his score. He can also report his remarks about the learner to the supervisor of the ehalaga. The registration of the tutor in the system can be done either directly by the supervisor of an ehalaga or by fill in an online form and requesting an approval from the supervisor of the selected ehalaga. After registration, the tutor will receive a user name and password for authentication purposes. 3.2.2.2. How Tutors' System Works Upon logging on, the tutor will have a list of the learners under his supervision. Once he selects one learner, he will see all his record, marked and unmarked memorized sections. He can update the record or modify it by clicking on the audio file attached to the memorized section where he will be transferred to a page in the system in which the section can be browsed and the learner’s recording can be played. Then the tutor enters the score and can add textual and/or audio comments to help the learner correct his mistakes in a better way. The score and textual comments are directly stored as a record in the learners' database, whereas the audio comments are uploaded as a file to the server and becomes visible to the learner. If the mark given for a section is less than the default success-score specified in the ehalgha settings, the system will leave the learner in the same section. If not, he passes to a new section to be memorized and the previous section will be added to the revision list. Notice that there are other options available in the system for the tutor. 3.2.3. Parents Parents can follow up the performance of their children in memorization. This function is an extra feature for children. An adult learner is not required to have parent to follow up his performance. Parents can register themselves and their children (at the same time or later on) in a specific page in the system. Accordingly, they can follow up the performance of their children in memorization, in terms of how perfect their memorization is, times of failure, absence, etc. by reading the charts and reports which can be printed out, in addition to notices that can be sent by the system automatically. 3.2.4. Supervisors They are responsible of all the persons concerned with the process of memorization: tutors and learners. Every ehalaga is managed by a supervisor, who can add or delete tutors. If a new tutor is added to an ehalaga, the system will look for tutors of extra loads and move the extra learners (lastly added) to the newly-added tutor. Upon deleting a tutor, the system will distribute his learners among tutors who are below the teaching load, or as equal as possible. Adding a tutor to an ehalaga must be done by its supervisor either directly or by approving an online request received from the tutor itself as we said before. In a similar manner, the supervisor can be created and activated by the system administrator either directly or by approving a request from him. Once created, the
TOJET: The Turkish Online Journal of Educational Technology – January 2010, volume 9 Issue 1
Copyright The Turkish Online Journal of Educational Technology 60
supervisor can initiate one or more ehalagh and adjust their settings, such as specifying the teaching load for tutors, success scores for memorization and revision, number of new sections to be memorized or revised before tutors finalizing previously-sent sections, the default value of age groups, etc. The supervisor can follow up tutors by generating reports about their performance, their quick responses, etc. He can also evaluate learners through charts that show their seriousness in memorization, quality of performance, times of failures in memorizing the assigned sections, absence, etc. 3.2.5. System Administrator The system administrator is who adjust the general settings for the different functions in the CTHQ environment. In the ehalaght subsystem, the administrator is mainly managing supervisors as responsibilities and roles are set hierarchically. He can also set the time for the lifespan of audio files of learners and tutors. On another hand, the administrator is he who controls adjusting and updating in general; he can add reciters, new ways of recitation (Qeraat), holy books (mashafs), etc. 4. TECHNICAL DESIGNING AND IMPLEMENTING ISSUES The system was designed and implemented as web-based application to particularly help people who have no appropriate channels for memorizing and studying the Holy Quran, though they have access to modern technology that facilitate communication. Many features and considerations have been taken into account to simplify interaction and use of the system, especially for those who are not so familiar with computers such as tutors as we guess. One of the most important features is that we keep all the files and information at the server side so that the user will not have to download them when he changes the computer. Therefore, in most cases, procedures are done at the server side while keeping in mind speed. Streaming techniques have been used for the sound files of either reference recitations, or learners' recording that need to be listened by tutors or vice-versa. Learners’ audio files are recorded at the client side as waves and are temporarily kept on the user’s computer so they can be used, if needed, for automatic verification by the HMM-based phone recognizer. When the learner approves his recording, it will be converted to an mp3 format to make it as compressed as possible and then uploaded to the server where it is saved in the learner’s folder and becomes visible to and accessible by the tutor for correction and marking. It is noteworthy to mention that the conversion to the mp3 format is done at the discretion of the user and handled in a manner that does not need installing anything on the client machine. It is also important to notice that, due to the problem of the size of audio files and maybe the quality of the available connection, the user should be restricted to a number of pages while recording his memorization, i.e. the recorded audio file should not exceed a certain size; otherwise it should be divided into more than one and then sent separately. 5. CONCLUSION AND FUTURE WORKS In this paper, we presented an e-learning system (ehalagat) for the interactive teaching of the holy Quran simulating the usual way followed either in the Quranic schools or in the Quranic rings at mosques. It provides all the required computational tools for the perfection of the learner’s recitation, following up, and correcting his memorization electronically. In our knowledge, it is the first of its kind which is built for the sake of the holy Quran. This does not mean that the system is now perfect and ideal; it still needs some improvements and adding new features. One of the important features that we plan to add is a voice-chatting component that can be used for a direct oral communication between students and their tutors, when they are connected at the same time. Indeed, we need a real-time VoIP conference call component that can be hosted on our web server and controlled by the system itself. We are thinking about developing our own component or looking for an available one that can be customized and integrated in the system. This will be decided later on and maybe added as a new feature in a next version of the system. Our main focus in the near future will be devoted to the improvement of the developed Quranic-sound recognizer in order to be highly accurate as the holy Quran needs. Once it became at the desired level of maturity, we will integrate it in the ehalagat system and open it for public use in different ways other than its main objective in the memorization process. It can be used to teach how to pronounce both Arabic and Quranic sounds correctly. The ehalagat system is now under final testing and verification by a targeted sample of users. It will be opened soon on the link http://www.qtadarus.net. We hope that this system becomes an effective and useful tool for learning the Holy Quran for interested persons around the world. We think, it will be very helpful to the Muslim migrants or those who seek to benefit from one of the Quran scientists (scholars) without need to see him.
TOJET: The Turkish Online Journal of Educational Technology – January 2010, volume 9 Issue 1
Copyright The Turkish Online Journal of Educational Technology 61
ACKNOWLEDGMENT This paper is supported by King Abdulaziz City for Science and Technology under the grant number AT-25-113, Riyadh, Saudi Arabia. Many thanks for all the team members of the CTHQ Project. 6. REFERENCES Alghamdi, M., Elhadj, Y.O.M, Alkanhal, M. A. (2007). Manual System to Segment and Transcribe Arabic
Speech. Proc. of IEEE/ICSPC'07, pp. 233-236, Dubai, UAE. Alsughayeir, I.A., Elhadj, Y.O.M. (2006). Computerized Quran Products: State-Of-Art (in Arabic). STCEX'06,
pp. 304-313, Riyadh, Saudi Arabia. Alsughayeir, I.A., Khorsi, A.M., Alansari, A.M., Ohali, Y. M. (2009). Search Engine for the similarity in
Quranic Terms (in Arabic). Proc. of the International Conference on the Glorious Quran and Contemporary Technologies, King Fahd Complex for the Printing of the Holy Quran, Almadinah, Saudi Arabia, October 13-15.
Alsughayeir, I.A., Ohali, Y. M. (2007). Similarity in Quranic Terms: computer-study (in Arabic). Proc. of ITRAS'07, Riyadh, Saudi Arabia.
Elhadj, Y.O.M. (2009). Sound Database with Perfect Reading of the Last Part of the Holy Quran. IJCSNS, 9(7), 85-90.
Elhadj, Y.O.M., Alghamdi, M., Alkanhal, M., Alansari, A.M. (2009). Sound Corpus of a part of the noble Quran (in Arabic). Proc. of the International Conference on the Glorious Quran and Contemporary Technologies, King Fahd Complex for the Printing of the Holy Quran, Almadinah, Saudi Arabia, October 13-15.
Elhadj, Y.O.M., Alsughayeir, I.A., Khorsi, A.M., Alansari, A.M. (2009). Morphology Analysis of the Holy Quran (in Arabic). Proc. of the 5th International Conference on Computer Science Practices in Arabic (CSPA'09), pp. 72-84, May 10-13, 2009, Morocco.
Elhadj, Y.O.M., Alsughayeir, I.A. (2005). Computerized Teaching of the Holy Quran: Survey Study (in Arabic). UTTIAT'05, pp. 141-182, Damam, Saudi Arabia.
Elhadj, Y.O.M., Alsughayeir, I.A., Alghamdi, M., Alkanhal, M., Ohali, Y. M., Alansari, A.M. (2009). Computerized teaching of the Holy Quran (in Arabic). Final technical report, KACST.
Elhadj, Y.O.M., Alsughayeir, I.A., Alghamdi, M., Alkanhal, M., Ohali, Y. M., Alansari, A.M. (2008). Computerized teaching of the Holy Quran (in Arabic). 2nd technical report, KACST.
Elhadj, Y.O.M., AounaAllah, M., Alansari, A.M., Alsughayeir, I.A. (2009). Interactive learning system for Tajweed (in Arabic). Proc. of the International Conference on the Glorious Quran and Contemporary Technologies, King Fahd Complex for the Printing of the Holy Quran, Almadinah, Saudi Arabia, October 13-15.
Habash, M. (1986). How to memorize the Holy Quran. Dar al-Khayr, Beirut.
TOJET: The Turkish Online Journal of Educational Technology – January 2010, volume 9 Issue 1
Copyright The Turkish Online Journal of Educational Technology 62
EFFECTS OF COMPUTER ASSISTED INSTRUCTION (CAI) ON SECONDARY SCHOOL STUDENTS’ PERFORMANCE IN BIOLOGY
Mudasiru Olalere YUSUF (PhD),
Senior Lecturer (Educational Technology), Department of Science Education,
Faculty of Education, University of Ilorin, Ilorin, Nigeria
[email protected] and [email protected] 2348033950774 and 238077764779
Adedeji Olufemi AFOLABI (PhD), Centre for Educational Technology,
Emmanuel Alayande College of Education, Oyo, Nigeria [email protected]
234803464948
ABSTRACT This study investigated the effects of computer assisted instruction (CAI) on secondary school students’ performance in biology. Also, the influence of gender on the performance of students exposed to CAI in individualised or cooperative learning settings package was examined. The research was a quasi experimental involving a 3 x 2 factorial design. The sample for the study comprised 120 first year senior secondary school students (SSS I) sampled from three private secondary schools, in Oyo State, Nigeria. The students’ pre-test and post test scores were subjected to Analysis of Covariance (ANCOVA). The findings of the study showed that the performance of students exposed to CAI either individually or cooperatively were better than their counterparts exposed to the conventional classroom instruction. However, no significant difference existed in the performance of male and female students exposed to CAI in either individual or cooperative settings. Based on the research findings recommendations were made on the need to develop relevant CAI packages for teaching biology in Nigerian secondary schools. INTRODUCTION Biology occupies a unique position in the school curriculum. Biology is central to many science related courses such as medicine, pharmacy, agriculture, nursing, biochemistry and so on. It is obvious that no student intending to study these disciplines can do without biology. These factors, among others, have drawn attention of researchers and curriculum planners towards biology as a subject in the school curriculum (Kareem, 2003). In spite of the importance and popularity of biology among Nigerian students, performance at senior secondary school level had been poor (Ahmed, 2008). The desire to know the causes of the poor performance in biology has been the focus of researchers for some time now. It has been observed that poor performance in the sciences is caused by the poor quality of science teachers, overcrowded classrooms, and lack of suitable and adequate science equipment, among others (Abdullahi, 1982; Bajah, 1979; Kareem, 2003; Ogunniyi, 1979). Students perform poorly in biology because the biology classes are usually too large and heterogeneous in terms of ability level. In addition, the laboratories are ill-equipped and the biology syllabus is over loaded (Ahmed, 2008; Ajayi, 1998). The potential benefits of Computer Assisted Instruction (CAI) cannot be underestimated in the contemporary world. There is a plethora of established findings on the instructional value of computer, particularly in advanced countries. There are now several CAI packages on different subjects. It is obvious that the current trend in research all over the world is the use of computer facilities and resources to enhance students’ learning. This may be the reason why Handelsman, Ebert-May, Beichner, Bruns, Chang, et al (2004) opined that “many exercises that depart from traditional method are now readily accessible on the web” (p. 521), even though teachers do not use these facilities. They further showed that the interactive approaches to lecturing significantly enhance learning. In a review of empirical studies on CAI, Cotton (1997) concluded, among others, that the use of CAI as a supplement to conventional instruction produces higher achievement than the use of conventional instruction alone, research is inconclusive regarding the comparative effectiveness of conventional instruction alone and CAI alone, and that computer-based education (CAI and other computer applications) produce higher achievement than conventional instruction alone. In addition, students learn instructional contents faster with CAI than with conventional instruction alone, they retain what they have learned better with CAI than with conventional instruction alone, and CAI activities appear to be at least as cost effective as and sometimes more
TOJET: The Turkish Online Journal of Educational Technology – January 2010, volume 9 Issue 1
Copyright The Turkish Online Journal of Educational Technology 63
cost-effective than other instructional methods, such as teacher-directed instruction and tutoring. Furthermore, computer assisted instruction has been found to enhance students’ performance than the conventional instructional method in counselor education (Karper, Robinson, & Casado-Kehoe, 2005). However, Mill (2001) findings revealed that CAI was found to be as effective as classroom for fact based learning, but not as effective for topics requiring critical thinking or mathematical problem solving. In addition, the time required for by learners to use CAI was higher overall than conventional classroom instruction. Students taught using traditional instruction combined with the use of computer performed significantly better than students taught using traditional instruction in a college setting (Akour, 2006). Similarly, college students taught statistics using lecture-plus-CAI obtained higher averages on midterm and final exams than students taught using lecture method only (Basturk, 2005). Based on a review of several studies and shortcoming on studies comparing CAI with conventional instruction, CAI can be considered as effective as traditional instruction. Furthermore, how CAI is delivered can affect its effectiveness, and that new studies are needed to clarify the effect of CAI in contemporary student environment (Jenk & Springer, 2002). Thus, empirical findings on the use of CAI have been mixed. Gender issues too have been linked with performance of students in academic tasks in several studies but without any definite conclusion. But there is a general conclusion that general imbalance exist in computer use, access, career and attitude. That is why Davies, Klawe, Ng, Nyhus, and Sullivan, (n.d.) based on their review suggested that current gender imbalance in technology and the role that technology will play in the future should be a concern for men and women, practitioners, policy makers and parents. Some studies revealed that male students perform better than the females in physics, chemistry, and biology (Danmole, 1998; Novak & Mosunda, 1991; Okeke & Ochuba, 1986) while others revealed that female students are better off than males (Kelly, 1978: Wonzencreaft, 1963). Some studies such as those of Bello (1990) did not find any form of influence being exerted by gender on students’ academic performance in the sciences. Gender factor on the use of CAI has also been of interest to researchers. Collazos, Guerrero, Llana, and Oetzel, (n.d.) examined gender influence on collaborative use of computer based communication. They found that group with minority women had low index of collaboration compared to homogenous group and group with majority women. Spence (2004) found no significant influence of gender on the achievement of college students in mathematics when they were exposed to mathematics courseware in online and traditional learning environment. However, female online learners were significantly less likely to complete the course compared to their traditional female counterpart or male online counterparts. In a review of studies on access, use, attitude, and achievement with computer, Kirkpatrick and Cuban (1998) concluded that when female and male students at all levels of education had the same amount and types of experiences on computers, female achievement scores and attitudes are similar in computer classes and classes using computer. Learning setting in either cooperative or individualized setting may be a significant factor in students’ learning. Cooperative learning is meant to enhance students’ learning and develop their social skills like decision-making, conflict management, and communication (Bonwell & Eison, 1991). Through cooperative learning methods students share ideas together so that they can learn to work together and to learn that they are responsible for one another’s learning as well as their own learning (Slavin, 1991). Cooperative learning tends to be more carefully structured and delineated than most other forms of small-group learning (Newberry, nd). Four key elements of cooperative learning are: positive interdependence, individual accountability, group rewards, and group training (Johnson & Johnson, 1987; Slavin, 1995). The close affinity and links between technology and technology had been noted by Millis and Cottell (1998) in their assertion that cooperative learning and technology are natural partners. This is because use of technology involves human dimensions of caring, community, and commitment. Furthermore, using technology in ways that promote sequenced learning within groups can lead to more in-depth processing of course content and, hence, more retention of information (Newberry, nd). However, little is known about the use of computer assisted instructional package in the Nigerian education system particularly in cooperative learning setting. In addition, very few empirical studies exist in Nigeria regarding the use of CAI in biology. Thus, much remain to be empirically studied on the effect of CAI in biology education, in Nigeria.
TOJET: The Turkish Online Journal of Educational Technology – January 2010, volume 9 Issue 1
Copyright The Turkish Online Journal of Educational Technology 64
PURPOSE OF THE STUDY The study investigated the effect of computer-assisted instruction on the performance of secondary school students in biology. Specifically, the study examined: (1) The difference in performance in biology, if any, of secondary school students exposed to individualized
computer assisted instruction, cooperative computer assisted instruction, and those exposed to conventional instruction.
(2) The influence of students’ gender on their performance in biology, when they are exposed to individualized computer assisted instruction, or cooperative computer assisted instruction.
Research Questions 1. Will there be any difference in the performance of biology students exposed to individualized computer
assisted instruction, cooperative computer assisted instruction, and those taught using conventional method? 2. Does gender influence the performance of biology students exposed to individualized computer assisted
instruction? 3. Does gender influence the performance of biology students exposed to cooperative computer assisted
instruction? Research Hypotheses The following research hypotheses were tested in the study. Ho1 There is no significant difference in the performance of students in biology when they are exposed to (i)
individualized computer assisted instruction, (ii) cooperative computer assisted instruction, and (iii) conventional instruction.
Ho2 There is no significant difference between the performance of male and female students in biology when they are exposed to individualized computer assisted instruction.
Ho3 There is no significant difference between the performance of male and female students in biology when they are exposed to cooperative computer assisted instruction.
RESEARCH METHODOLOGY Research Design This study was a quasi-experimental type, of the pre-test, post-test, non-equivalents, non- randomized, control group design. The design is a 3x2 factorial design. This paradigm represents three levels of treatment: the individualized Computer Assisted Instruction (experimental group 1), Cooperative Computer Assisted Instruction (experimental group 2) and the Conventional Instruction (control group); and two levels of gender (Male and female). Sample The target population of this research was the first year senior secondary biology students in Oyo town and Ibadan city, Nigeria. The nature of the study, however, required that the research sample was purposively selected. This is because a research on CAI must necessarily be conducted in schools where computers are available for students’ use and where the students are computer literate. This was why the NESTO College, Oyo, and Ise Oluwa Montessori Secondary School, Ibadan were purposely sampled for the study. These two schools were selected as the experimental groups. A third school, St. Francis Catholic College, Oyo was also sampled as the control group, as the school is believed to be more or less equivalent in standard to the schools used for the experimental group. The sample for Experimental Group 1 is made up of 40 students. This comprises of 20 males and 20 females. The Experimental Group II also has 40 students made up of 19 males and 21 females, while the control group was made up of 19 males and 21 female students. Research Instruments The instruments for this research were the treatment instrument “Computer Assisted Instructional Package (CAIP)” and the test instrument, “Biology Performance Test (BIOPET)”. The treatment instrument, Computer Assisted Instructional Package (CAIP) on Biology, was a self-instructional, interactive package that lasted for 21/2 hour for an average student. It contained five lessons structured into modules. The topics covered in the package are food chain, food web, energy flow, nutrient, movement, and pyramid of numbers, all from the ecology aspect of the Nigerian senior secondary biology curriculum. It was developed by the researchers, with the assistance of a professional programme developer using Dream weaver and flash that is, written in Hypertext Markup Language (HTML) with illustrations converted to Graphic Interchange Format (GIF). Intrinsic
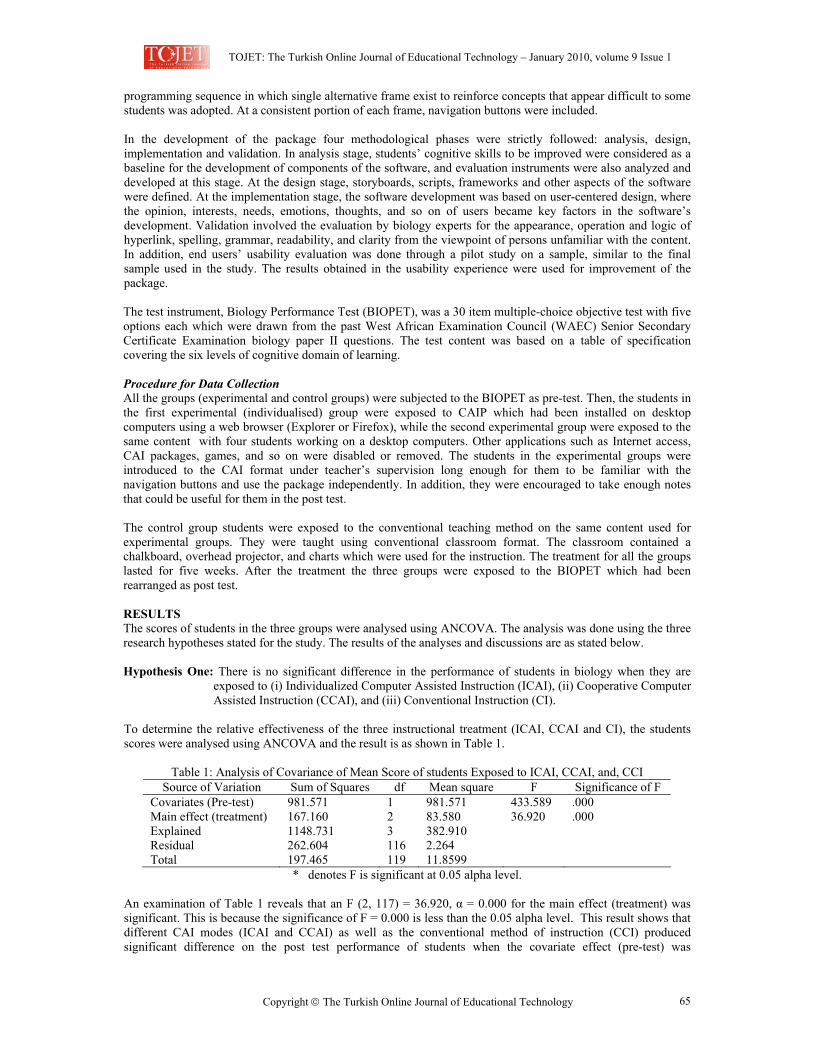
TOJET: The Turkish Online Journal of Educational Technology – January 2010, volume 9 Issue 1
Copyright The Turkish Online Journal of Educational Technology 65
programming sequence in which single alternative frame exist to reinforce concepts that appear difficult to some students was adopted. At a consistent portion of each frame, navigation buttons were included. In the development of the package four methodological phases were strictly followed: analysis, design, implementation and validation. In analysis stage, students’ cognitive skills to be improved were considered as a baseline for the development of components of the software, and evaluation instruments were also analyzed and developed at this stage. At the design stage, storyboards, scripts, frameworks and other aspects of the software were defined. At the implementation stage, the software development was based on user-centered design, where the opinion, interests, needs, emotions, thoughts, and so on of users became key factors in the software’s development. Validation involved the evaluation by biology experts for the appearance, operation and logic of hyperlink, spelling, grammar, readability, and clarity from the viewpoint of persons unfamiliar with the content. In addition, end users’ usability evaluation was done through a pilot study on a sample, similar to the final sample used in the study. The results obtained in the usability experience were used for improvement of the package. The test instrument, Biology Performance Test (BIOPET), was a 30 item multiple-choice objective test with five options each which were drawn from the past West African Examination Council (WAEC) Senior Secondary Certificate Examination biology paper II questions. The test content was based on a table of specification covering the six levels of cognitive domain of learning. Procedure for Data Collection All the groups (experimental and control groups) were subjected to the BIOPET as pre-test. Then, the students in the first experimental (individualised) group were exposed to CAIP which had been installed on desktop computers using a web browser (Explorer or Firefox), while the second experimental group were exposed to the same content with four students working on a desktop computers. Other applications such as Internet access, CAI packages, games, and so on were disabled or removed. The students in the experimental groups were introduced to the CAI format under teacher’s supervision long enough for them to be familiar with the navigation buttons and use the package independently. In addition, they were encouraged to take enough notes that could be useful for them in the post test. The control group students were exposed to the conventional teaching method on the same content used for experimental groups. They were taught using conventional classroom format. The classroom contained a chalkboard, overhead projector, and charts which were used for the instruction. The treatment for all the groups lasted for five weeks. After the treatment the three groups were exposed to the BIOPET which had been rearranged as post test. RESULTS The scores of students in the three groups were analysed using ANCOVA. The analysis was done using the three research hypotheses stated for the study. The results of the analyses and discussions are as stated below. Hypothesis One: There is no significant difference in the performance of students in biology when they are
exposed to (i) Individualized Computer Assisted Instruction (ICAI), (ii) Cooperative Computer Assisted Instruction (CCAI), and (iii) Conventional Instruction (CI).
To determine the relative effectiveness of the three instructional treatment (ICAI, CCAI and CI), the students scores were analysed using ANCOVA and the result is as shown in Table 1.
Table 1: Analysis of Covariance of Mean Score of students Exposed to ICAI, CCAI, and, CCI Source of Variation Sum of Squares df Mean square F Significance of F
Covariates (Pre-test) 981.571 1 981.571 433.589 .000 Main effect (treatment) 167.160 2 83.580 36.920 .000 Explained 1148.731 3 382.910 Residual 262.604 116 2.264 Total 197.465 119 11.8599
* denotes F is significant at 0.05 alpha level. An examination of Table 1 reveals that an F (2, 117) = 36.920, α = 0.000 for the main effect (treatment) was significant. This is because the significance of F = 0.000 is less than the 0.05 alpha level. This result shows that different CAI modes (ICAI and CCAI) as well as the conventional method of instruction (CCI) produced significant difference on the post test performance of students when the covariate effect (pre-test) was
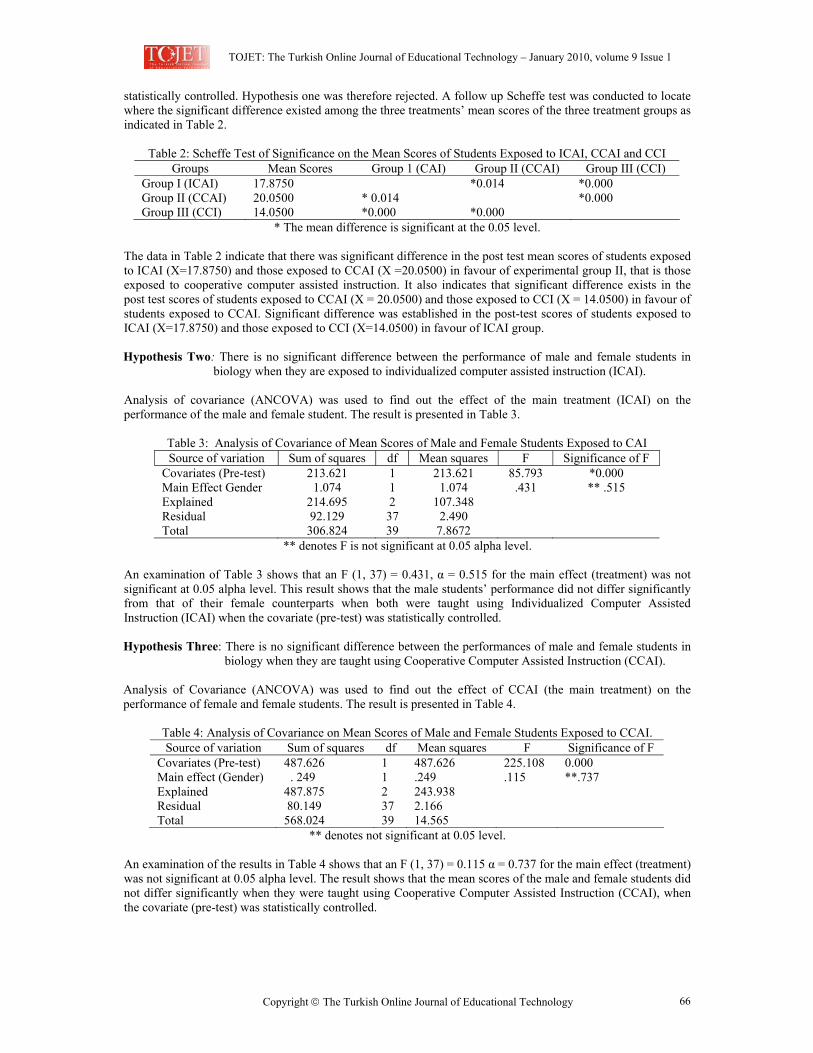
TOJET: The Turkish Online Journal of Educational Technology – January 2010, volume 9 Issue 1
Copyright The Turkish Online Journal of Educational Technology 66
statistically controlled. Hypothesis one was therefore rejected. A follow up Scheffe test was conducted to locate where the significant difference existed among the three treatments’ mean scores of the three treatment groups as indicated in Table 2.
Table 2: Scheffe Test of Significance on the Mean Scores of Students Exposed to ICAI, CCAI and CCI Groups Mean Scores Group 1 (CAI) Group II (CCAI) Group III (CCI)
Group I (ICAI) 17.8750 *0.014 *0.000 Group II (CCAI) 20.0500 * 0.014 *0.000 Group III (CCI) 14.0500 *0.000 *0.000
* The mean difference is significant at the 0.05 level. The data in Table 2 indicate that there was significant difference in the post test mean scores of students exposed to ICAI (X=17.8750) and those exposed to CCAI (X =20.0500) in favour of experimental group II, that is those exposed to cooperative computer assisted instruction. It also indicates that significant difference exists in the post test scores of students exposed to CCAI (X = 20.0500) and those exposed to CCI (X = 14.0500) in favour of students exposed to CCAI. Significant difference was established in the post-test scores of students exposed to ICAI (X=17.8750) and those exposed to CCI (X=14.0500) in favour of ICAI group. Hypothesis Two: There is no significant difference between the performance of male and female students in
biology when they are exposed to individualized computer assisted instruction (ICAI). Analysis of covariance (ANCOVA) was used to find out the effect of the main treatment (ICAI) on the performance of the male and female student. The result is presented in Table 3.
Table 3: Analysis of Covariance of Mean Scores of Male and Female Students Exposed to CAI Source of variation Sum of squares df Mean squares F Significance of F
Covariates (Pre-test) 213.621 1 213.621 85.793 *0.000 Main Effect Gender 1.074 1 1.074 .431 ** .515 Explained 214.695 2 107.348 Residual 92.129 37 2.490 Total 306.824 39 7.8672
** denotes F is not significant at 0.05 alpha level. An examination of Table 3 shows that an F (1, 37) = 0.431, α = 0.515 for the main effect (treatment) was not significant at 0.05 alpha level. This result shows that the male students’ performance did not differ significantly from that of their female counterparts when both were taught using Individualized Computer Assisted Instruction (ICAI) when the covariate (pre-test) was statistically controlled. Hypothesis Three: There is no significant difference between the performances of male and female students in
biology when they are taught using Cooperative Computer Assisted Instruction (CCAI). Analysis of Covariance (ANCOVA) was used to find out the effect of CCAI (the main treatment) on the performance of female and female students. The result is presented in Table 4.
Table 4: Analysis of Covariance on Mean Scores of Male and Female Students Exposed to CCAI. Source of variation Sum of squares df Mean squares F Significance of F
Covariates (Pre-test) 487.626 1 487.626 225.108 0.000 Main effect (Gender) . 249 1 .249 .115 **.737 Explained 487.875 2 243.938 Residual 80.149 37 2.166 Total 568.024 39 14.565
** denotes not significant at 0.05 level. An examination of the results in Table 4 shows that an F (1, 37) = 0.115 α = 0.737 for the main effect (treatment) was not significant at 0.05 alpha level. The result shows that the mean scores of the male and female students did not differ significantly when they were taught using Cooperative Computer Assisted Instruction (CCAI), when the covariate (pre-test) was statistically controlled.
TOJET: The Turkish Online Journal of Educational Technology – January 2010, volume 9 Issue 1
Copyright The Turkish Online Journal of Educational Technology 67
DISCUSSION OF FINDINGS The result of the analysis of covariance on the performance of students taught biology using computer assisted instructional packages in cooperative and individualised learning settings and those taught with conventional classroom instruction indicated a significant difference in favour of the students in the experimental groups. Scheffe test used as post hoc to locate the observed significant difference indicated that there was significant difference between the performances of students exposed to ICAI and CCAI (the two experimental groups). It is to be noted that students exposed to CCAI did better than those exposed to ICAI, as reflected in higher group mean. Furthermore, between the two experimental groups and the control group (conventional group) significant differences were established in favour of the two experimental groups. These findings agree with earlier findings of Phillips and Moss (1993) and the findings of Jegede, Okebukola and Ajewole (1992) which are directly on biology. Similarly, the findings agree with the studies of Ajelabi (1998) on social studies, Egunjobi, (2002) in geography, (Udousoro, 2000) in mathematics, and Okoro, and Etukudo, (2001) in chemistry, conducted in Nigeria which confirmed that CAI has been effective in enhancing students’ performance in other subjects than the conventional classroom instruction. The finding is also supported by the findings of Karper, Robinson, and Casado-Kehoe (2005) on counselling education. It, however, contradicts the conclusion of Mill (2001). It is possible to infer that the significant difference observed may be accounted for by the novel nature of the CAI settings, in the Nigerian school setting. The influence of gender on the academic performance of students in biology when taught with CAI package in individualised or cooperative learning settings was examined using hypotheses two and three. The result of the analysis of covariance (ANCOVA) showed no significant gender difference for learners exposed to CAI package in the two settings. These findings showed that gender had no influence on the performance of students in biology whether they were taught with CAI in individualised or cooperative setting. These findings on gender agree with the earlier findings of Bello (1990) on gender and performance in biology. It also agreed with the conclusions of Kirkpatrick and Cuban (1998) based on their review of studies on computer and gender, and also the findings of Spence (2004). Thus, it can be deduced that the use of computer assisted instruction enhanced the performance of both male and female students. Limitations of the Study The following limitations can be observed regarding this study. First, the study was designed to focus on learning of biology by senior secondary students drawn from three private Nigerian secondary schools. Thus, the findings may not be generalisable to other public institutions and other private institutions. Second, the study did not examine other alternative means like Internet for delivering the course content. Third, the curriculum content was limited to six ecology topics of the entire biology curriculum. Fourth, computer use was limited to the presentation of curriculum contents only, as the three groups were exposed to pre-test and post-test using paper and pencil approach. Despite these limitations the findings are significant, particularly in the use of CAI in the Nigerian school system. RECOMMENDATIONS Based on the findings of this study, the following recommendations are made. 1. Necessary attention should be accorded computer literacy and operation in the secondary schools and
relevant computer assisted instructional packages should be developed for use within the Nigerian school systems. In addition, Nigerian public schools should be equipped with necessary ICT facilities to leverage the potentials of ICT in Nigerian schools.
2. Since the findings of this study showed that students who worked on the computer cooperatively performed better than those who work on the computer singly, students should be encourage to develop social interaction in the use of computer. In addition, the finding implies that the number of computers to be procured for the schools does not have to be on individual students’ basis. A class of 40 would not need more than eight computers systems for instructional needs.
3. Further empirical studies should be carried out on the use of computer for instructional purposes, on different subjects and at different levels to provide sound basis for the integration of computer in Nigerian schools.
REFERENCES Abdullahi, A. (1982): Science teaching in Nigeria. Ilorin: Atoto Press. Ahmed, M. A. (2008). Influence of personality factors on biology lecturers’ assessment of difficulty levels of
genetics concepts in Nigerian colleges of education. Unpublished PhD thesis, University of Ilorin, Ilorin. Ajayi, D. O. (1998). Community science: Implications for science teacher: Proceeding of the 39th Annual
Conference of STAN.

TOJET: The Turkish Online Journal of Educational Technology – January 2010, volume 9 Issue 1
Copyright The Turkish Online Journal of Educational Technology 68
Ajelabi, A (1998): The relative effectiveness of computer assisted and text- assisted programme instruction on students learning outcomes in social studies. Unpublished PhD thesis of the University of Ibadan, Ibadan, Nigeria.
Akour, M. A. A. (2006). The effects of computer-assisted instruction on Jordanian college students' achievements in an introductory computer science course. Electronic Journal for the Integration of Technology in Education, 5, 17 – 24. Retrieved July 10, 2008, from http://ejite.isu.edu/Volume5/Akour.pdf
Bajah, S. T. (1979). Correlates of students’ extrinsic school environmental factors with level of attainment in standardized test in chemistry. Journal of Science Teachers Association of Nigeria, 18 (1), 40 -63.
Basturk, R. (2005). The effectiveness of computer-assisted instruction in teaching introductory statistics. Educational Technology & Society, 8 (2), 170-178. Retrieved July 10, 2008, from http://www.ifets.info/journals/8_2/16.pdf
Bello, G (1990). Senior secondary school students’ knowledge misconceptions and alternative conception of a major biology proposition. Unpublished M.Ed. Thesis, University of Ilorin, Ilorin.
Bonwell, C.C. & Eison, J. A. (1991). Active learning: Creating excitement in the classroom. ASHE-ERIC Higher Education Report No. 1. Washington, D.C.: The George Washington University, School of Education and Human Development.
Collazos, C; Guerrero, L. A.; Llana, M. Oetzel, J. (nd). Gender: An influence factor in the collaborative work process in computer-mediated communication. Retrieved December 17, 2008, from http://www.dcc.uchile.cl/~luguerre/papers/ICNEE-02.pdf
Cotton, K. (1997). Computer-assisted instruction. North West Regional Educational Laboratory. Retrieved June 12, 2007, from http://www.borg.com/~rparkany/PromOriginal/ETAP778/CAI.html
Danmole, B. T (1998). The influence of teacher preparation and use of instructional materials on primary school pupils’ performance in integrated science. Ilorin Journal of Education, 12, 56 - 64.
Davies, A.R., Klawe, M., Ng, M., Nyhus, C., Sullivan, H. (n.d.). Gender issues in computer science education. Retrieved 23rd October, 2005 from http://www.wcer.wisc.edu/archive/nise/News_Activities/Forums/Klawepaper.htm
Egunjobi A. O. (2002). The efficacy of two computer assisted instructional modes on learners’ practical geography achievement at the secondary school level in Ibadan metropolis, Nigeria. Paper delivered at NAEMT conference, 20 -23 Nov. 2002.
Handelsman, J., Ebert-May, D., Beichner, R., Bruns, P., Chang, A., DeHaan, R., Gentile, J., Lauffer, S., Stewart, J., Tilghman, S.M., Wood, W.B. (2004). Scientific teaching. Science, 304, 521 - 522. http://www.sciencemag.org/cgi/reprint/304/5670/521.pdf
Jegede, O. ; Okebukola, P. A & Ajewole, G. (1992). Students’ attitude to the use of computer for learning and achievement in biological concept. Journal of Science Teachers Association of Nigeria, 27 (2), 61 – 65
Jenks, M. & Springer, J. M. (2002). A view of the research on the efficacy of CAI. Electronic Journal for the Integration of Technology in Education, 1 (2), 43 – 58. Retrieved July 15, 2006, from http://ejite.isu.edu/Volume1No2/Jenks.pdf
Johnson, D.W. & Johnson, R.T. (1987). Learning together and alone: Cooperative, competitive, and individualistic learning. Englewood Cliffs, NJ: Prentice- Hall.
Kareem, L. O. (2003). Effects of audio-graphic self-instructional packages on senior secondary school students’ performance in biology in Ilorin, Nigeria. Unpublished PhD thesis of the University of Ilorin, Ilorin.
Karper, C.; Robinson, E. H. & Casado-Kehoe, M. (2005). Computer assisted instruction and academic achievement in counselor education. Journal of Technology in Counseling, 4 (1). Retrieved December 22, 2007, from http://jtc.colstate.edu/Vol4_1/Karper/Karper.htm
Kelly, A (1978). Girls and science. International Association for Evaluation of Educational Achievement Monograph (9). Stockholm: Almguist and wilksell.
Kirkpatrick, H. & Cuban, L. (1998, July-August). Should we be worried? What the research says about gender differences in access, use, attitudes, and achievement with computers. Educational Technology, 38 (4), 56 – 60.
Millis, B.J. & Cottell, Jr., P.G. (1998). Cooperative learning for higher education faculty. Phoenix, AZ: American Council on Education, Oryx Press.
Mills, R. (2001). A comparison study of the learning effectiveness of computer aided instruction vs classroom lecture. Retrieved December 22, 2007, from http://wwwconcentric.net/~Walwpr/thesis/4_result.html
Newberry, S. (nd). Cooperative learning or individualized instruction: Which is best for computer-based instruction of the adult learner? http://www.coedu.usf.edu/itphdsem/Eme7938/sn899.pdf
Novak, J. D. & Mosunda, D (1991). A twelve-year longitudinal study of science concept learning. Americana Research Journal. (28) 117 - 153
Ogunniyi, M. B. (1979) Meanings Associated with Science Concepts and Generalization of Science by Scientists and students. African Journal of Educational Research. 2 (2), 175 -185.
TOJET: The Turkish Online Journal of Educational Technology – January 2010, volume 9 Issue 1
Copyright The Turkish Online Journal of Educational Technology 69
Okeke, E. A. & Ochuba C. V (1986). The Level of Understanding of Selected Ecology Concept Among Nigerian School Certificates. Journal of the Science Teachers Association of Nigeria. 25 (1), 6 – 102.
Okoro, C. A. & Etukudo, U. E (2001). CAI versus Extrinsic Motivation based traditional method: It’s Effect on Female Genders’ Performance in Chemistry. A paper presented at 42nd STAN Conference in Ilorin.
Phillips T & Moss, G. D (1993). Can computer assisted instruction biology packages be used to replace teacher? Journal of Biological Education, 27 (3), 213 – 215.
Slavin, R. E. (1991). Synthesis of research on cooperative learning. Educational Leadership, 48, 71-82. Slavin, R. E. (1995). Cooperative learning; Theory, research, and practice. Boston, MA: Allyn and Bacon. Spencer, D. J. (2004). Engagement with mathematics courseware in traditional and online learning
environments: Relationship to motivation, achievement, gender, and gender orientation. Unpublished dissertation submitted to the Faculty of Graduate School of Emory University, in partial fulfilment of the requirement for the degree of Doctor of Philosophy. Retrieved March 17, 2007, from http://www.des.emory.edu/mfp/SpenceDissertation2004.pdf
Udousoro, V. J. (2000). The relative effectiveness of computer and text-assisted programme instruction on students’ learning outcomes in mathematics. Unpublished Ph.D. Thesis of the University of Ibadan.
Wonzencreft, M. (1963). Sex Comparism of certain abilities. Journal of Educational Research 57, 21 – 22.
TOJET: The Turkish Online Journal of Educational Technology – January 2010, volume 9 Issue 1
Copyright The Turkish Online Journal of Educational Technology 70
EVALUATION OF LEARNING PERFORMANCE OF E-LEARNING IN CHINA: A METHODOLOGY BASED ON CHANGE OF INTERNAL MENTAL MODEL OF
LEARNERS
Lingxian ZHANGa, Xiaoshuan ZHANGa,Yanqing DUANb, Zetian FUa *, Yanwei WANGa aCollege of Information & Electrical Engineering, China Agricultural University, Beijing, China; bSchool of
Business, University of Bedfordshire, Luton, UK ABSTRACT This paper presents a method of assessment on how Human-Computer Interaction (HCI) and animation influence the psychological process of learning by comparing a traditional web design course and an e-learning web design course, based on the Change of Internal Mental Model of Learners. We constructed the e-learning course based on Gagne’s learning theory and theory of instructional design; and designed and analyzed questionnaires on the psychological process of learning in order to measure the change in a learner’s mental model and performance. The result shows that HCI and animation features of e-learning have been proved to positively influence learners’ cognitive perception and structuring, while the psychological process of learning as a whole is positively influenced by these technological features. In addition, the result indicates that the learning theory can be applied during the process of designing e-learning courses, and the theory of cognitive psychology is successfully used in measuring both a learner’s psychological process of learning and changes in the mental model. Keywords: E-learning, Learning performance, Internal mental model, Cognitive learning theory, Assessment 1. INTRODUCTION The application of information and communication technology (ICT) in education is now making it possible for education to transcend space, time and political boundaries (Kirschner, Kester, & Corbalan, 2007). ICT in such areas as education and training has currently offered new paradigms for university training and the topic of electronic learning (E-learning) has deserved careful attention (Wu J.-H., Tennyson R. D., Hsia T.-L., & Liao Y.-W., 2008). E-learning refers to the use of electronic devices for learning, including the delivery of content via electronic media such as Internet/Intranet/Extranet, audio or video tape, satellite broadcast, interactive TV, or CD-ROM. This type of learning moves the traditional instruction paradigm to a learning paradigm (Jönsson, 2005), thereby relinquishing much control over planning and selection to the learners. In addition, E-learning can bring the following advantages to learners: cost-effectiveness, timely content, and access flexibility (Lorenzetti, 2005). The rapid development of ICT and great demand for increasing the efficiency and effectiveness of learning drive the development of E-learning. The growing literature on E-learning education shows how technological, economic and scientific factors are contributing to the development of a new educational panorama (Kirschner & Kester, 2007). A hypercube innovation model was utilized to analyze the differences in technology and learning models (instruction model/environment) used in traditional classroom learning versus E-learning environments. The innovation from traditional classroom learning to E-learning is radical for both the learner and instructor, leading to drastic changes in the technology and learning model (Wu J.-H., Tennyson R. D., Hsia T.-L., Liao Y.-W., & 2008).Based on self-determination theory, Roca & Gagné (2008) proposed an extended Technology Acceptance Model in the context of e-learning service. In the proposed model perceived usefulness, perceived playfulness and perceived ease of use are predicted to be influenced by perceived autonomy support, perceived competence and perceived relatedness (Roca J. C. & Gagné M., 2008). Based on the model of Rogers’ innovation adoption theory, every factor of perceived innovative attributes influencing the individual adoption behaviour, namely perceived relative advantage, perceived compatibility, perceived trialability, and perceived observability, was proved to have certain influences on people’s adoption of e-learning (Fu Z.T., Yue J., Li D.L., et al., 2007; Zhang L.X., Wen H.J., Li D.L., Fu Z.T., Cui S., 2009). The present construction of E-learning courses both in the education and business sectors put too much focus on the technological side of designing E-learning courses (Attwell, Holmfeld, Fabian, Karpati, et al., 2003). However, little attention is paid to application of the traditional learning theory in designing E-learning courses. There exists much research which has failed to prove the positive effectiveness of E-learning in the educational sector (Clark & Jones, 2001). This probably may be caused by neglecting the use of learning theory during the
* Corresponding author. Tel.: +86 010 62736323; fax: +86 010 62737741.
E-mail address: [email protected](L.X. Zhang); [email protected](Z.T. Fu).
TOJET: The Turkish Online Journal of Educational Technology – January 2010, volume 9 Issue 1
Copyright The Turkish Online Journal of Educational Technology
71
instructional design of E-learning courses. Applying cognitive psychology into the measurement of a learner’s psychological learning process and change of mental model after learning, previous research suggests that Technology Mediated Learning (TML) may improve the student’s achievements (Alavi, 1994; Hiltz, 1995; Schutte, 1997; Wetzel, 1994), students’ attitudes towards learning (Schutte, 1997), and students’ evaluation of the learning experience (Alavi, 1994; Hiltz, 1995). The Internet is rapidly transforming a range of human activities; socio-cognitive theory assumes that engagement in transformed activities, over time, transforms human cognition. Without exception, frequent Internet users cognitively outperformed infrequent Internet users. Tool use increases cognitive capacity and tools represent extension of cognitive processes (Johnson G.M., 2008). However, research on these issues is limited. This paper applies the cognitive learning theory into designing the E-learning course, in order to analyze the psychological process of learning when a learner learns a course; and tests how the psychological process of learning will be affected by different learning methods. Our research will show that the design of E-learning based on cognitive learning theory will have the expected impact on a learner’s internal cognition as measured according to cognitive psychology. The remainder of this paper is organized as follows: Section 2 provides a theoretical background, and discusses the development of previous learning theories and theories of cognitive learning, particularly Gagne’s Learning Theory and Theory of Instructional Design. Section 3 explains the theoretical framework and hypotheses based on Gagne’s theory and theory of cognitive learning. Section 4 describes designing E-learning courses and choosing variables. Section 5 analyzes data collected from the questionnaires. In Section 6 the conclusions are provided. 2. THEORETICAL BACKGROUND 2.1. Research of Learning Theory 2.1.1 The Development of Learning Theory Research on learning has been a part of psychology since it began as a science in the 1800s. Learning Theory experienced a three-stage evolution during its development. The first stage involved learning theory from a behaviorist perspective. In the early 20th century, most of Learning Theory was from a behavioral perspective. In Behaviorism, learning occurs when new behaviors or changes in behaviors are acquired as the result of an individual’s response to stimuli. In the early 1900’s, behaviorist John Watson launched the behaviorist revolution. Moving from mainstream thought that the proper subject for psychology was not the operation of the mind but rather the examination of objective, observable behavior (Gardner, 1985). This set the stage for others to investigate the idea of cognitive maps in guiding the behavior of animals in problem solving. Skinner (1954) believed that students could be taught to learn through averse stimulation. In the second stage, Learning Theory focused on an information processing perspective. In the middle of the 20th century, cognitive psychology overtook the position of behavioral psychology. In the 1950s, Learning Theory mainly evolved from the information processing perspective. In the information processing perspective, learning is characterized as a change in knowledge stored in one’s memory. It is governed by an internal process rather than by external circumstances. In cognitive psychology, memory is usually divided into three stores: the sensory, the short-term, and the long-term. The sorting of information through these stores is often referred to as the information processing model (Anderson, 1999). The third stage of Learning Theory evaluates from the constructivist perspective. The constructivist perspective is the view that emphasizes the active role of the learner in building understanding and making sense of information. Moshaman classified constructivism into the following categories: Exogenous Constructivism,Endogenous Constructivism,and Dialectical Constructivism. 2.1.2 Gagne’s Learning Theory Learning is a change in human disposition or capability, which persists over a period of time, and which is not simply ascribable to processes of growth (Gagne, 1977). That is the most famous definition of learning by Gagne and was referenced most frequently by the scholars in the learning and psychology field. Gagne made a great contribution to educational psychology. What mainly concerned him in his research was how to apply the learning theory to the application of instructional design. His book, The Conditions of Learning, written in 1977, Principles of Instructional Design in 1979, and Essentials of Learning for Instruction in 1975 classified the learning type according to the learning result, and built one of the most comprehensive and influential sets of instructional models. Gagne shares both the behaviorism psychology perspective and the cognitive psychology perspective. He is regarded as an experimental psychologist. While much of Gagne’s Learning Theory, including signal learning, stimulus-response learning, verbal association and discrimination learning, is based on
TOJET: The Turkish Online Journal of Educational Technology – January 2010, volume 9 Issue 1
Copyright The Turkish Online Journal of Educational Technology 72
behaviorism’s stimulus-response (S-R) theory (Novak & Tyler, 1977), Gagne’s experiments in his later work also paid attention to cognitive activity during learning, which is considered an intermediary factor between stimulus and response. In his view, learning theory from an information processing perspective is important. 2.1.3 Cognitive Learning: Perception and Structuring Research in learning was significantly affected by cognitive psychology after the mid 20th century. Learning theory from a cognitive perspective is a general approach that regards learning as an active mental process of acquiring, remembering, and using knowledge. Learning results in a change in knowledge, which leads to in turn a change in behavior. Learning is not directly observable. According to Alavi, Marakas, & Yoo et al. (2002), cognitive learning theories identify a number of cognitive sub-processes involved in learning, and these sub-processes can be divided broadly into two categories: perception (Ausubel, 1968) and structuring (Norman, 1982). 2.2. Measurement of the psychological process of learning Much research has failed to prove the positive effectiveness of E-learning in the educational sector (Clark & Jones, 2001; Marttunen & Laurinen, 2001; Johnson, Aragon, Shaik, & Palma-Rivas, 2000; Summer & Hosterler, 2002). That fact is caused by the neglect of related psychological and learning theory during the design process of E-learning. Designers of E-learning courses should not just simply copy the content of the traditional learning to E-learning and randomly add some technological features into E-learning courses. Also, in the past decades, the designers of computer-based learning always paid a lot of attention to the technological side of the designing, while paying little attention to the user side (Attwell et al., 2003). In order to increase the effectiveness and efficiency of E-learning, some psychological theory and learning theory should be applied during the construction of the E-learning course. How the learner's learning process operates and how the learner perceives a new form of learning should be given enough consideration. Technological features should not be randomly added in E-learning. Misuse of technology may mislead the learner and distract the learner's attention, which will negatively influence the learning result. Since Gagne’s (1979) theory on instructional design divides the instruction into nine stages and each of the stages implies the corresponding learner’s internal cognitive learning process, it is very useful when applying the new technology in the design of the E-learning course. Previously, an overwhelming amount of research measured the learning result based on certain tests on the subjects’ performance. Although this method is useful in measuring the subjects’ achievement, it provides little help to study how to increase the effectiveness and efficiency of E-learning in the future. The traditional method of measuring learning results just shows what the present situation is, instead of how the present situation can be changed. Also, there is some research that measures the learning result by taking a cognitive approach. However, they neglect the measurement of the objective performance of the learner. The cognitive measurement of the learning result can show a map on how the learner’s internal mental model is influenced, but it doesn’t give a map on whether this influence can really increase the learner’s ability. When measuring the structuring process of knowledge, both a subjective measurement and objective measurement are used. Both the subjective questions and the objective questions are based on the Associative Network Model (Collins & Loftus, 1975; Nelson, Bennett, Gee, Schreiber, & Mckinney, 1993; Quillian, 1969). However, the subjective questions take a cognitive approach by asking what the learner thinks. In contrast, the objective questions take a performance approach by asking them to solve real problems in web design. The subjective part along with objective part together can give a more reliable result of the measurement of the learning result. 2.3. Effectiveness and efficiency of E-learning In the infant stages of E-learning’s history, little systemic research on the effectiveness of distributed learning existed (Alavi, Wheeler, & Valicich, 1995; Storck & Sproull, 1995). From then on, with the development of E-learning, more and more research switched their focus on the effectiveness and efficiency of E-learning. The hottest and most critical topic in research of E-learning in recent years is the effectiveness and efficiency of E-learning, since scientific proof of the value of E-learning is needed. Effectiveness is concerned with the achievement of the intended objectives of the educational experience. Efficiency is concerned with producing the maximum benefits possible for the given expenditure of public money. However, whether the effectiveness and efficiency of E-learning betters traditional learning still remains unresolved. Some research shows that E-learning does not make a significant difference in effectiveness or efficiency over traditional learning (Clark & Jones, 2001; Marttunen & Laurinen, 2001). Some research even shows that E-
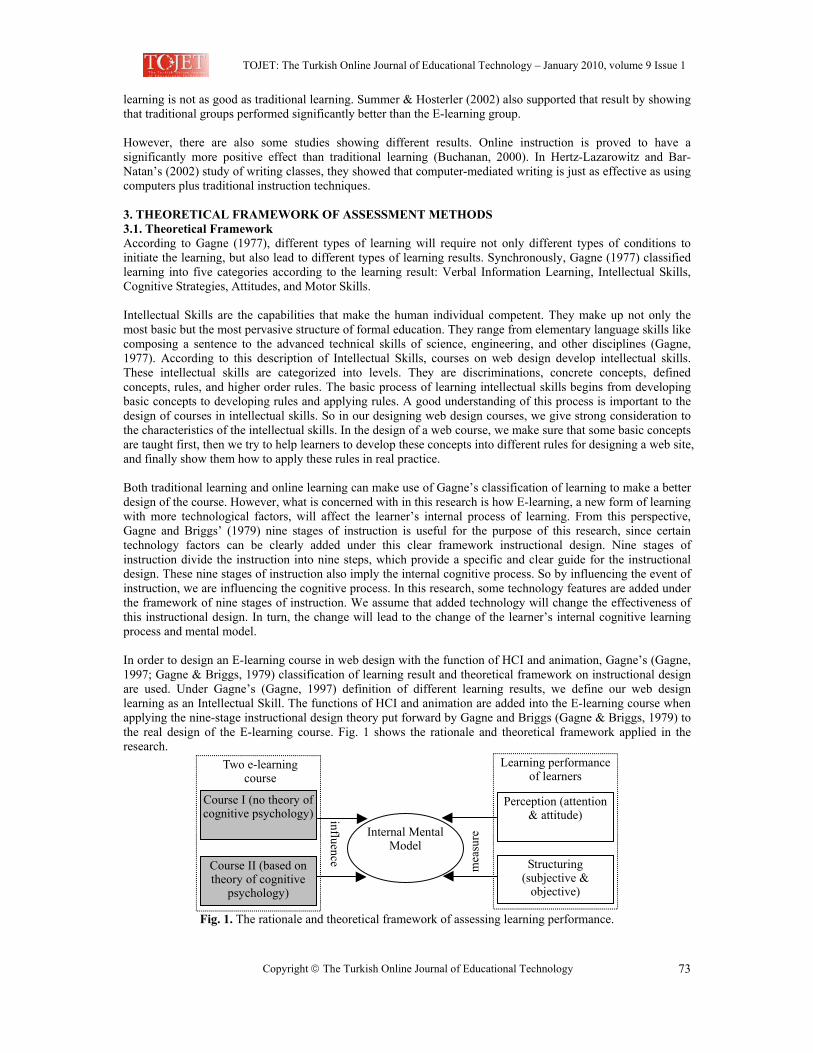
TOJET: The Turkish Online Journal of Educational Technology – January 2010, volume 9 Issue 1
Copyright The Turkish Online Journal of Educational Technology
73
learning is not as good as traditional learning. Summer & Hosterler (2002) also supported that result by showing that traditional groups performed significantly better than the E-learning group. However, there are also some studies showing different results. Online instruction is proved to have a significantly more positive effect than traditional learning (Buchanan, 2000). In Hertz-Lazarowitz and Bar-Natan’s (2002) study of writing classes, they showed that computer-mediated writing is just as effective as using computers plus traditional instruction techniques. 3. THEORETICAL FRAMEWORK OF ASSESSMENT METHODS 3.1. Theoretical Framework According to Gagne (1977), different types of learning will require not only different types of conditions to initiate the learning, but also lead to different types of learning results. Synchronously, Gagne (1977) classified learning into five categories according to the learning result: Verbal Information Learning, Intellectual Skills, Cognitive Strategies, Attitudes, and Motor Skills. Intellectual Skills are the capabilities that make the human individual competent. They make up not only the most basic but the most pervasive structure of formal education. They range from elementary language skills like composing a sentence to the advanced technical skills of science, engineering, and other disciplines (Gagne, 1977). According to this description of Intellectual Skills, courses on web design develop intellectual skills. These intellectual skills are categorized into levels. They are discriminations, concrete concepts, defined concepts, rules, and higher order rules. The basic process of learning intellectual skills begins from developing basic concepts to developing rules and applying rules. A good understanding of this process is important to the design of courses in intellectual skills. So in our designing web design courses, we give strong consideration to the characteristics of the intellectual skills. In the design of a web course, we make sure that some basic concepts are taught first, then we try to help learners to develop these concepts into different rules for designing a web site, and finally show them how to apply these rules in real practice. Both traditional learning and online learning can make use of Gagne’s classification of learning to make a better design of the course. However, what is concerned with in this research is how E-learning, a new form of learning with more technological factors, will affect the learner’s internal process of learning. From this perspective, Gagne and Briggs’ (1979) nine stages of instruction is useful for the purpose of this research, since certain technology factors can be clearly added under this clear framework instructional design. Nine stages of instruction divide the instruction into nine steps, which provide a specific and clear guide for the instructional design. These nine stages of instruction also imply the internal cognitive process. So by influencing the event of instruction, we are influencing the cognitive process. In this research, some technology features are added under the framework of nine stages of instruction. We assume that added technology will change the effectiveness of this instructional design. In turn, the change will lead to the change of the learner’s internal cognitive learning process and mental model. In order to design an E-learning course in web design with the function of HCI and animation, Gagne’s (Gagne, 1997; Gagne & Briggs, 1979) classification of learning result and theoretical framework on instructional design are used. Under Gagne’s (Gagne, 1997) definition of different learning results, we define our web design learning as an Intellectual Skill. The functions of HCI and animation are added into the E-learning course when applying the nine-stage instructional design theory put forward by Gagne and Briggs (Gagne & Briggs, 1979) to the real design of the E-learning course. Fig. 1 shows the rationale and theoretical framework applied in the research.
mea
sure
influence
Two e-learning course
Course I (no theory of cognitive psychology)
Course II (based on theory of cognitive
psychology)
Learning performance of learners
Internal Mental Model
Perception (attention & attitude)
Structuring (subjective &
objective)
Fig. 1. The rationale and theoretical framework of assessing learning performance.
TOJET: The Turkish Online Journal of Educational Technology – January 2010, volume 9 Issue 1
Copyright The Turkish Online Journal of Educational Technology 74
3.2. Research Hypotheses Learning is regarded as a process involving knowledge acquisition and change in knowledge structures rather than as having a behavior purpose (Greeno, 1974). According to Ausubel (1968), besides knowledge acquisition (learning), a successful performance (behavior) also requires other abilities that include perseverance, flexibility, improvisation, problem sensitivity, and tactical astuteness. While the behavior is only a possible outcome of learning (Shuell, 1981; Stevenson, 1983), changes in cognitive learning more accurately measure changes in outcomes of learning. So the measurement of the change in the cognitive learning process will be useful. As has been mentioned before, the cognitive learning sub-process includes perception and structuring. Based on the above theoretical framework, this study proposes the following hypotheses. Hypothesis I: The Human-Computer Interaction (HCI) and animation features of E-learning will positively influence the learning result. Hypothesis II: The HCI and animation features of E-learning will positively change the learner’s cognitive perception. Hypothesis III: The HCI and animation features of E-learning will positively change the process of structuring of knowledge. Since cognitive perception stands for the learner’s psychological process of learning in the short-term, and structuring of knowledge stands for the psychological process of learning in the long-term, together they represent the complete psychological process of learning. If Hypotheses II and III are proven, it is clearly right to say that the HCI and animation feature of E-learning will affect the psychological process of learning from a short-term perspective to the long-run perspective. Therefore we also have promoted a fourth hypothesis. Hypothesis IV: The HCI and animation feature of E-learning will positively influence learners’ psychological process of learning. 4. DESIGNING E-LEARNING COURSES AND CHOOSING OF VARIABLES 4.1. Design of the Web Design Course Since this research is based on the comparative study between a traditional course in web design and an E-learning course in web design, design and construction of two versions of the same course in web design was needed. The content and the structure of the traditional course and the E-learning course in web design should be completely identical because it must eliminate the possibility that the different content of the course, rather than employment of technological features of the course, lead to the different learning outcomes. So during the designing process of the E-learning course in web design, the principle of retaining identical content was strictly adhered to. The content of both the traditional web design course and the E-learning web design course came from a web design course. A web design handbook was printed directly for the traditional learners to use. In order to eliminate the possibility that the color of the images appearing in the learning material would affect the learning result, the handbook was printed with a color printer, so that the color images used in the handbook could be consistent with the images used in the E-learning web design course. The E-learning version of the web design course was constructed by using software for professional E-learning construction, which allowed the designers to easily integrate the HCI and multimedia into the text content. After the E-learning web design course was constructed, the subjects could get access to the E-learning material on web design through the Virtual Campus by uploading the course. 4.2. The Subjects There were 60 subjects who participated in this study. For the research purpose, these 60 subjects were divided into two groups, each of which contained 30 subjects. One group was chosen to learn the web design course by the traditional learning method, and the other group was chosen for the E-learning course. Both of the groups were required to learn this web design course in 50 days. After their learning, the questionnaires were sent out for the subjects to complete. 4.3. Independent Variable The most important part of designing this E-learning web design course involved where to integrate the HCI and animation features into the original content. Human-Computer Interaction (HCI) is the study of the interaction between both the user and computers. Interaction between users and computers occurs at the interface, which will decide which and how information is presented to the user on a screen (Baecker, Grudin, Buxton, & Greenberg, 1995; Nielson, 1993). In our research, certain HCI techniques were employed in the E-learning course for the learners to control: which, when and how the information is presented. Animation is a sequence of frames that presents a smoothly moving image like a film or video. Animation can include digitized video,
TOJET: The Turkish Online Journal of Educational Technology – January 2010, volume 9 Issue 1
Copyright The Turkish Online Journal of Educational Technology
75
computer-generated graphics, or a combination. With the rapid development of Internet technology, animation has become much easier to create and popular on the Web (Spool, Scanlon, Snyder, Schroeder, & DeAngelo, 1999). Animation has the function of increasing comprehension by information visualization (Baecker, 1988; Mackinlay, Robertson, & Deline, 1994). In addition, flash animation was added in the E-learning web design course in order to help the learners to understand the difficult concepts in learning web design. By reviewing Gagne's (Gagne & Briggs, 1979) nine-stages of instruction, our research added HCI and animation to influence the following three stages: acquire attention, stimulate the recall of prior learning, and present the stimulus content. For example, in order to draw the learner's attention to initiate the learning behavior, we used the interactive course navigation on the very first web page of the E-learning course. In the interface introductions to Flash and Dreamweaver, the function of pop-up windows was used. This new method of learning the software interface drew the learner's interest and encouraged them to continue to explore the function of different panels in the software interface. We used the pop-up window and hyperlinks to help stimulate the recall of prior learning. Some terms and concepts appeared frequently by the form of pop-up windows and hyperlinks, which stimulated the recall of these terms and concepts. Presenting the stimulus content is improved by using both the HCI and animation. For example, in the graphic demonstration of defining a site, learners controlled the paces of the flow of information by choosing the different steps. Two ways of drawing a layer were demonstrated by using two Flash animations. All types of content in the E-learning course were more stimulating, compared with the pure static text content contained in the traditional course’s handbook. 4.4. Dependent Variable A comparative analysis on the effectiveness of HCI and animation on the psychological process of learning was based on the measurement of perception and structuring, since perception and structuring cover the whole sub-processes were involved in the learning (Alavi et al., 2002). Perception involves the discernment of information in short-term cognitive learning (Ausubel, 1968). Structuring is a process that stores information in long-term cognitive learning (Norman, 1982). Previous research has used the focused attention and attitude to measure perception (Hong, Thong, & Tam, 2004). In order to measure the focused attention, we divided focused attention according to Enns (1990) and Haberlandt’s (1997) four varieties of attention. So the focused attention section of the questionnaire of this research was designed according to these four varieties of attention. The attitude section of the questionnaire design was based on the three components of attitudes. The structuring of knowledge will lead to a change in mental model, which is defined as “all forms of mental representation, general or specific, from any domain, causal, intentional or spatial” (Vosniado & Brewer, 1987). However, previous research did not provide a unique or unanimous way to measure the mental model concept (Wilson & Rutherford, 1989; Staggers & Norcio, 1993). Because the mental model is an internal representation in the memory, it cannot be measured directly. An indirect approach is needed to measure the change of mental model. One indirect approach to measure the mental model involves representing the internal knowledge structure (cognitive structure) graphically. A lot of literature in education and learning has taken the indirect approach to measure the internal knowledge structure graphically. The literature includes Newell’s (1977) association memory approach, Pask’s (1976) entailment structure of conversation theory, Minsky’s (1977) frame-system theory for memory, Dana’s (1993) concept-mapping, Jones’ & Vesilind’s (1995) concept-mapping and Rumelhar’s (1997) network of semantics approach. Usually, these indirect approaches ask the subjects to draw flowchart diagrams to show their internal knowledge representation on what has just been learned. Then, several experts in the related field will judge the diagram drawn by the subjects and score the diagram. Although this approach is an applicable way to measure the change of mental model, it is not very suitable for our research. Representing the internal knowledge structure graphically is more suitable for knowledge that is concept-focused. Since our research was based on a web design course, which both has concepts and specific skills, this research will not use the graphical approach to measure the change of mental model. Instead, another approach to measure the mental model is to represent the internal knowledge structure by designing questions for subjects to answer. Sein, Bostrom, & Olfman(1987) tested their subject’s knowledge structure via questions, and then the tests were scored to measure the quality of subjects’ mental models. Lim, Ward, & Benbasat(1997) used open-ended questions to assess the knowledge of their subjects, which were evaluated by related experts for measuring the mental model. In our research, seventeen questions were used to measure the change in the subject’s mental model resulting from the process of structuring of knowledge. These seventeen questions were divided into subjective questions and objective questions. The subjective test questions

TOJET: The Turkish Online Journal of Educational Technology – January 2010, volume 9 Issue 1
Copyright The Turkish Online Journal of Educational Technology 76
were designed according to the associative network model, which try to ask the subjects to subjectively demonstrate their ability to form a new structure for web design knowledge. Since the subjective questions alone cannot reflect the real situation, objective questions were also used. The objective questions included specific questions on some web design skills. Both the subjective questions and the objective questions were scored to measure the change in subjects’ mental model, and the result of the objective questions were used to measure the subjects’ performance and learning result. The focused attention, attitude, and subjective part of the structuring were measured by using the 5-point Likert scale, where 1 stands for Strongly Agree; 2 stands for Agree; 3 stands for Feel Neutral; 4 stands for Disagree; and 5 stands for Strongly Disagree. All the questions in the questionnaire were asked as affirmative statements. In other words, if a subject chose 1, which stands for Strongly Agree, he or she admitted that they felt positively with the affirmative statement. If a subject chose 5, which stands for Strongly Disagree, he or she admitted that they felt negatively toward the affirmative statement. In summary, for focused attention, attitude, and the subjective part of the structuring, the smaller number always implied a better result. In the objective part of the structuring, on the contrary, the subjects could choose one or more answers that they thought correct according to their own judgment. Then the number of correct answers to the questions was converted into category data for the convenience of this research. All the objective structuring questions in the questionnaire were evaluated according to the same standard stated above, so that the consistency of evaluation of the learning result was ensured. 4.5. Control Variables The learning result could be affected by some cognitive and psychological characteristics of the subjects. According to Hiltz (1995), the level of academic ability, motivation, and degree of effort have been shown to positively correlate with the learning outcomes in computer-based learning. In addition to the differences in learners’ cognitive and psychological characteristics, students’ comfort with their onscreen image was observed as affecting their behavior in the synchronous distance learning environment (Webster, 1997). Other individual difference including age, gender, personal computer experience, Internet experience, and even previous E-learning experiences may affect the learning result. In order to eliminate the possibility that individuals’ differences rather than the technical features of the E-learning would affect the result of this research, those individual differences were controlled by randomly choosing the subjects and randomly dividing the subjects into two groups. The subjects were volunteers found through an advertisement on the Internet. 5. DATA ANALYSIS 60 subjects finally successfully took the web design course created by this research. They were equally divided into two groups at random. 30 subjects were selected to learn the web design course by the traditional learning method, and the other 30 subjects learned the web design course by the method of e-learning. The response rate to the questionnaire was 100%, since the sample was small and easy to control. Also, the promised gift for responding to the questionnaire motivated the subjects to respond quickly. 5.1. Construct Reliability of the Questionnaire Cronbach’s Alpha is a good way to measure construct reliability (Cooper & Schindler, 2003). The higher the Cronbach’s Alpha is, the more reliable the construct is. The variables in the questionnaire of this research demonstrate adequate reliability. For the traditional questionnaire, the Cronbach’s Alpha is 0.7844 for focused attention, 0.7805 for attitude, 0.8373 for the subjective parts of the structuring, and 0.8136 for the objective parts of the structuring. For the E-learning questionnaire, the Cronbach’s Alpha is 0.7986 for focused attention, 0.8192 for attitude, 0.8654 for the subjective parts of the structuring, and 0.7603 for the objective parts of the structuring. 5.2. Basic Statistics Information of the Subjects Among the 60 subjects, 6.7% were between 18 and 22 years old, 55% were between 23 and 25 years old, 28.3% were from 26 to 30 years old. There were more females than males among the subjects. Female subjects accounted for 56.7% of the total subjects. Most of the subjects held a bachelor degree, which accounted for 65% of the total subjects. 28.3% held a master’s degree, and 6.7% were high school student graduates. Most of the subjects did not have work experience. On average, the subjects had from four to six years of experience using computers and Internet. None of the subjects claimed to have experienced e-learning before. Most of the subjects (68.3%) did not have e-learning experience before. None of the subjects previously had much knowledge about web design. Most of the subjects (81.7%) took this course because they wanted to increase their skills in web design. Most of the subjects took this course seriously and devoted much effort, except for one subject who tried
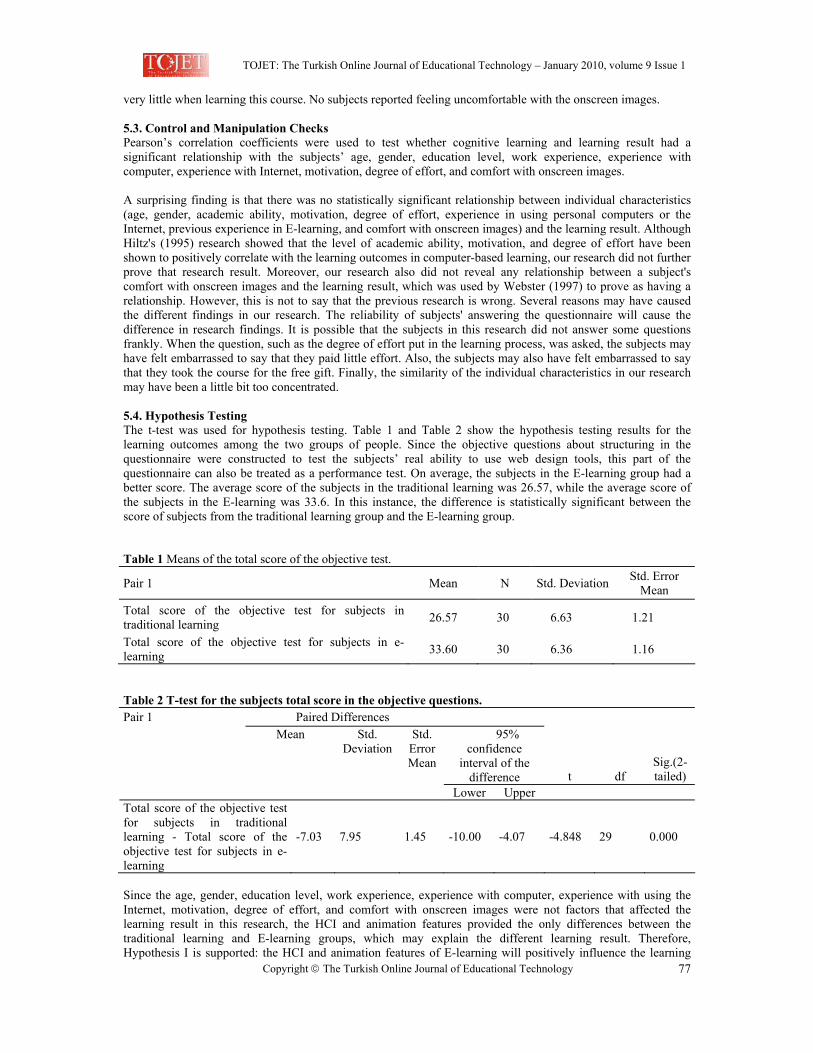
TOJET: The Turkish Online Journal of Educational Technology – January 2010, volume 9 Issue 1
Copyright The Turkish Online Journal of Educational Technology
77
very little when learning this course. No subjects reported feeling uncomfortable with the onscreen images. 5.3. Control and Manipulation Checks Pearson’s correlation coefficients were used to test whether cognitive learning and learning result had a significant relationship with the subjects’ age, gender, education level, work experience, experience with computer, experience with Internet, motivation, degree of effort, and comfort with onscreen images. A surprising finding is that there was no statistically significant relationship between individual characteristics (age, gender, academic ability, motivation, degree of effort, experience in using personal computers or the Internet, previous experience in E-learning, and comfort with onscreen images) and the learning result. Although Hiltz's (1995) research showed that the level of academic ability, motivation, and degree of effort have been shown to positively correlate with the learning outcomes in computer-based learning, our research did not further prove that research result. Moreover, our research also did not reveal any relationship between a subject's comfort with onscreen images and the learning result, which was used by Webster (1997) to prove as having a relationship. However, this is not to say that the previous research is wrong. Several reasons may have caused the different findings in our research. The reliability of subjects' answering the questionnaire will cause the difference in research findings. It is possible that the subjects in this research did not answer some questions frankly. When the question, such as the degree of effort put in the learning process, was asked, the subjects may have felt embarrassed to say that they paid little effort. Also, the subjects may also have felt embarrassed to say that they took the course for the free gift. Finally, the similarity of the individual characteristics in our research may have been a little bit too concentrated. 5.4. Hypothesis Testing The t-test was used for hypothesis testing. Table 1 and Table 2 show the hypothesis testing results for the learning outcomes among the two groups of people. Since the objective questions about structuring in the questionnaire were constructed to test the subjects’ real ability to use web design tools, this part of the questionnaire can also be treated as a performance test. On average, the subjects in the E-learning group had a better score. The average score of the subjects in the traditional learning was 26.57, while the average score of the subjects in the E-learning was 33.6. In this instance, the difference is statistically significant between the score of subjects from the traditional learning group and the E-learning group.
Table 1 Means of the total score of the objective test.
Pair 1 Mean N Std. Deviation Std. Error Mean
Total score of the objective test for subjects in traditional learning 26.57 30 6.63 1.21
Total score of the objective test for subjects in e-learning 33.60 30 6.36 1.16
Table 2 T-test for the subjects total score in the objective questions. Pair 1 Paired Differences
95% confidence
interval of the difference t df
Sig.(2-tailed)
Mean Std. Deviation
Std. Error Mean
Lower Upper Total score of the objective test for subjects in traditional learning - Total score of the objective test for subjects in e-learning
-7.03 7.95 1.45 -10.00 -4.07 -4.848 29 0.000
Since the age, gender, education level, work experience, experience with computer, experience with using the Internet, motivation, degree of effort, and comfort with onscreen images were not factors that affected the learning result in this research, the HCI and animation features provided the only differences between the traditional learning and E-learning groups, which may explain the different learning result. Therefore, Hypothesis I is supported: the HCI and animation features of E-learning will positively influence the learning
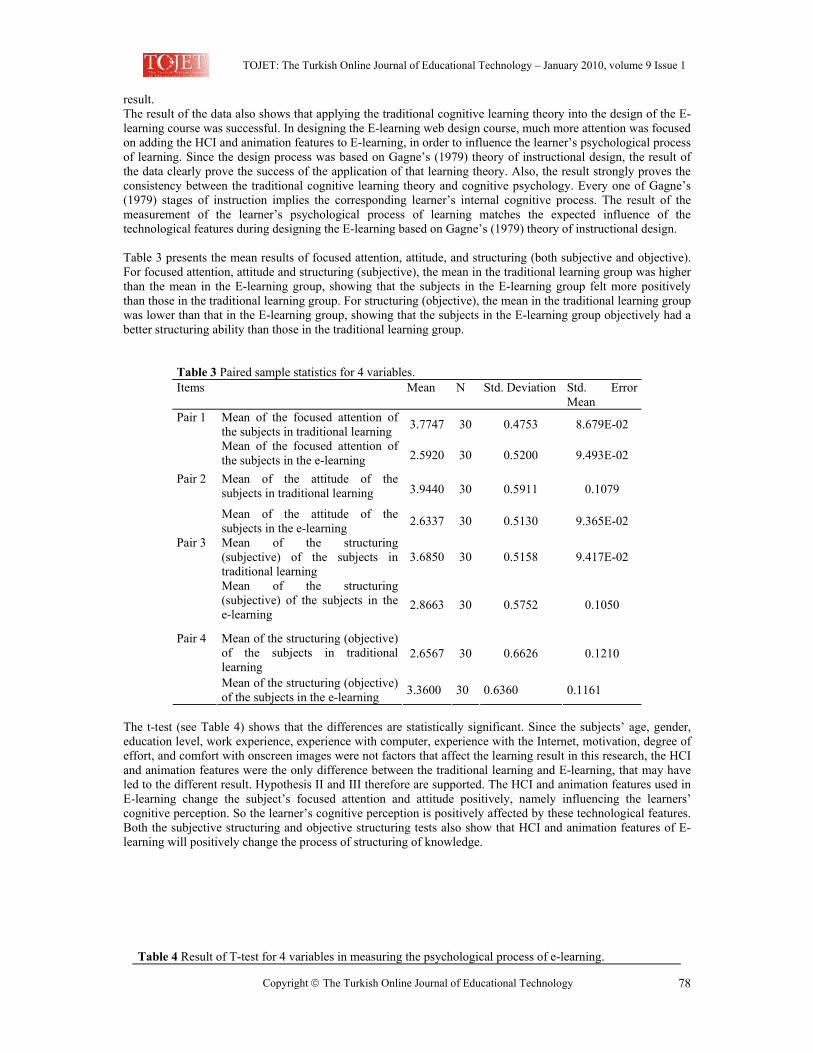
TOJET: The Turkish Online Journal of Educational Technology – January 2010, volume 9 Issue 1
Copyright The Turkish Online Journal of Educational Technology 78
result. The result of the data also shows that applying the traditional cognitive learning theory into the design of the E-learning course was successful. In designing the E-learning web design course, much more attention was focused on adding the HCI and animation features to E-learning, in order to influence the learner’s psychological process of learning. Since the design process was based on Gagne’s (1979) theory of instructional design, the result of the data clearly prove the success of the application of that learning theory. Also, the result strongly proves the consistency between the traditional cognitive learning theory and cognitive psychology. Every one of Gagne’s (1979) stages of instruction implies the corresponding learner’s internal cognitive process. The result of the measurement of the learner’s psychological process of learning matches the expected influence of the technological features during designing the E-learning based on Gagne’s (1979) theory of instructional design. Table 3 presents the mean results of focused attention, attitude, and structuring (both subjective and objective). For focused attention, attitude and structuring (subjective), the mean in the traditional learning group was higher than the mean in the E-learning group, showing that the subjects in the E-learning group felt more positively than those in the traditional learning group. For structuring (objective), the mean in the traditional learning group was lower than that in the E-learning group, showing that the subjects in the E-learning group objectively had a better structuring ability than those in the traditional learning group.
Table 3 Paired sample statistics for 4 variables. Items Mean N Std. Deviation Std. Error
Mean Mean of the focused attention of the subjects in traditional learning 3.7747 30 0.4753 8.679E-02 Pair 1
Mean of the focused attention of the subjects in the e-learning 2.5920 30 0.5200 9.493E-02
Mean of the attitude of the subjects in traditional learning 3.9440 30 0.5911 0.1079
Pair 2
Mean of the attitude of the subjects in the e-learning 2.6337 30 0.5130 9.365E-02
Mean of the structuring (subjective) of the subjects in traditional learning
3.6850 30 0.5158 9.417E-02 Pair 3
Mean of the structuring (subjective) of the subjects in the e-learning
2.8663 30 0.5752 0.1050
Mean of the structuring (objective) of the subjects in traditional learning
2.6567 30 0.6626 0.1210 Pair 4
Mean of the structuring (objective) of the subjects in the e-learning 3.3600 30 0.6360 0.1161
The t-test (see Table 4) shows that the differences are statistically significant. Since the subjects’ age, gender, education level, work experience, experience with computer, experience with the Internet, motivation, degree of effort, and comfort with onscreen images were not factors that affect the learning result in this research, the HCI and animation features were the only difference between the traditional learning and E-learning, that may have led to the different result. Hypothesis II and III therefore are supported. The HCI and animation features used in E-learning change the subject’s focused attention and attitude positively, namely influencing the learners’ cognitive perception. So the learner’s cognitive perception is positively affected by these technological features. Both the subjective structuring and objective structuring tests also show that HCI and animation features of E-learning will positively change the process of structuring of knowledge.
Table 4 Result of T-test for 4 variables in measuring the psychological process of e-learning.
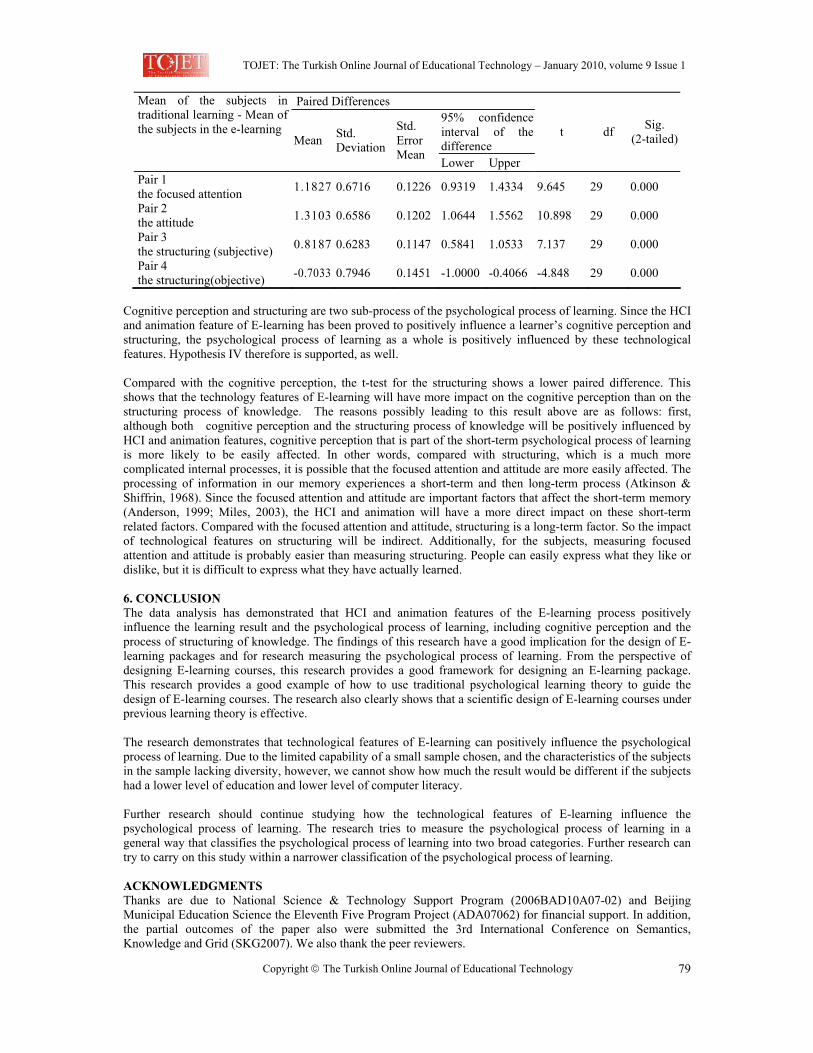
TOJET: The Turkish Online Journal of Educational Technology – January 2010, volume 9 Issue 1
Copyright The Turkish Online Journal of Educational Technology
79
Paired Differences 95% confidence interval of the difference
Mean of the subjects in traditional learning - Mean of the subjects in the e-learning
Mean Std. Deviation
Std. Error Mean Lower Upper
t df Sig. (2-tailed)
Pair 1 the focused attention 1.1827 0.6716 0.1226 0.9319 1.4334 9.645 29 0.000
Pair 2 the attitude 1.3103 0.6586 0.1202 1.0644 1.5562 10.898 29 0.000
Pair 3 the structuring (subjective) 0.8187 0.6283 0.1147 0.5841 1.0533 7.137 29 0.000
Pair 4 the structuring(objective) -0.7033 0.7946 0.1451 -1.0000 -0.4066 -4.848 29 0.000
Cognitive perception and structuring are two sub-process of the psychological process of learning. Since the HCI and animation feature of E-learning has been proved to positively influence a learner’s cognitive perception and structuring, the psychological process of learning as a whole is positively influenced by these technological features. Hypothesis IV therefore is supported, as well. Compared with the cognitive perception, the t-test for the structuring shows a lower paired difference. This shows that the technology features of E-learning will have more impact on the cognitive perception than on the structuring process of knowledge. The reasons possibly leading to this result above are as follows: first, although both cognitive perception and the structuring process of knowledge will be positively influenced by HCI and animation features, cognitive perception that is part of the short-term psychological process of learning is more likely to be easily affected. In other words, compared with structuring, which is a much more complicated internal processes, it is possible that the focused attention and attitude are more easily affected. The processing of information in our memory experiences a short-term and then long-term process (Atkinson & Shiffrin, 1968). Since the focused attention and attitude are important factors that affect the short-term memory (Anderson, 1999; Miles, 2003), the HCI and animation will have a more direct impact on these short-term related factors. Compared with the focused attention and attitude, structuring is a long-term factor. So the impact of technological features on structuring will be indirect. Additionally, for the subjects, measuring focused attention and attitude is probably easier than measuring structuring. People can easily express what they like or dislike, but it is difficult to express what they have actually learned. 6. CONCLUSION The data analysis has demonstrated that HCI and animation features of the E-learning process positively influence the learning result and the psychological process of learning, including cognitive perception and the process of structuring of knowledge. The findings of this research have a good implication for the design of E-learning packages and for research measuring the psychological process of learning. From the perspective of designing E-learning courses, this research provides a good framework for designing an E-learning package. This research provides a good example of how to use traditional psychological learning theory to guide the design of E-learning courses. The research also clearly shows that a scientific design of E-learning courses under previous learning theory is effective. The research demonstrates that technological features of E-learning can positively influence the psychological process of learning. Due to the limited capability of a small sample chosen, and the characteristics of the subjects in the sample lacking diversity, however, we cannot show how much the result would be different if the subjects had a lower level of education and lower level of computer literacy. Further research should continue studying how the technological features of E-learning influence the psychological process of learning. The research tries to measure the psychological process of learning in a general way that classifies the psychological process of learning into two broad categories. Further research can try to carry on this study within a narrower classification of the psychological process of learning. ACKNOWLEDGMENTS Thanks are due to National Science & Technology Support Program (2006BAD10A07-02) and Beijing Municipal Education Science the Eleventh Five Program Project (ADA07062) for financial support. In addition, the partial outcomes of the paper also were submitted the 3rd International Conference on Semantics, Knowledge and Grid (SKG2007). We also thank the peer reviewers.
TOJET: The Turkish Online Journal of Educational Technology – January 2010, volume 9 Issue 1
Copyright The Turkish Online Journal of Educational Technology 80
REFERENCES Alavi, M. (1994). Computer-Mediated Collaborative Learning: An Empirical Evaluation. MIS Quarterly 18(2),
159-174. Alavi, M., Marakas, G. M., & Yoo, Y. (2002). A Comparative Study of Distributed Learning Environments on
Learning Outcomes. Information Systems Research. 13(4), 404-415. Alavi, M., Wheeler, B., & Valicich, J. (1995). Using It to Reengineer Business Education: An Exploratory
Investigation of Collaborative Telelearning. MIS Quart. 19, 159-174. Anderson, J. R. (1999). Learning and Memory: An Integrated Approach. New York: Wiley. Atkinson, R. C., & Shiffrin, R. M. (1968). Human Memory: A Proposed System and its Control Processes. In
Spence, W. K., & J. T. Spence (eds.). The Psychology of Learning and Motivation: Advances in Research and Theory. New York: Academic Press.
Attwell, G.., Holmfeld, L. D., Fabian, P., Karpati, A., &Littig, P. (2003). E-learning in Europe-Result and Recommendations. Thematic Monitoring Under the LEONARDO DA VINCI-Programme. ISSN 1618-9477, ISBN 3-88555-744-4, Bestell-Nr:09.090.
Ausubel, D. P. (1968). Educational Psychology: A Cognitive View. New York; Holt, Reinhart, and Winston. Baecker, R. (1988). Enhancing Program Readability and Comprehensibility with Tools for Program
Visualization. Proc. 10th Internat. Conf. Software Engrg., Singapore, IEEE Computer Society Press. Baecker, R. M., Grudin, J., Buxton, W. A. S., & Greenberg, S. (1995). Readings in Human-Computer
Interaction: Toward the Year 2000, Second Edition, Morgan Kaufmann Publishers, Inc., San Francisco, CA, 450-456.
Buchanan, T. (2000). The Efficacy of a World Wide Web. Computing Research, 23(2), 203-216. Clark, R. A., & Jones, D. (2001). A Comparison of Traditional and Online Formats in a Public Speaking Course.
Communication Education, 50(2), 109-124. Collins, A. M., & Loftus, E. F. (1975). A Spreading Activation Theory of Semantic Processing. Psychology
Review, 82(6), 407-428. Cooper, D. R. & Schindler, P. S. (2003). Business Research Method. Boston: McGraw-Hill Irwin. Dana, N. F. (1993). Elementary School Pre-service Teachers Conceptions of Social Studies Teaching and
Learning. Paper presented at the Annual Meeting of the National Council for the Social Studies (ED367576), Nashville, TN.
Dobson, C. B. (1982). Attitude Formation and Measurement. London: Longman. Enns, J. T. (1990). Relations between components of visual attention. In Enns, J. T. (ed.): The Development of
Attention: Research and Theory. Amsterdam: Elsevier Science Publishers. Fu Z.T., Yue J., Li D.L., Zhang X.S, Zhang L.X., Gao Y.J. (2007). Evaluation of learner adoption intention of e-
learning in China: a methodology based on perceived innovative attributes. New Zealand Journal of Agricultural Research, 50(5), 609–615
Gagne, R. M., & Briggs, L. J. (1979). Principles of Instructional Design. New York: Holt, Rinehart and Winston. Gagne, R. M. (1977). The Conditions of Learning. New York: Holt, Rinehart and Winston. Gardner, H. (1985). The Mind’s New Science: A History of Cognitive Revolution. New York: Basic Books. Greeno, J. G. (1974). Processes of Learning and Comprehension. In Greg, L.W. (eds). Knowledge and Cognition.
Hillsdale, NJ: Lawrence Erlbaum Associates. Haberlandt, Karl (1997).Cognitive Psychology. New York: Allyn and Bacon. Hertz-Lazarowitz, R., & Bar-Natan, I. (2002). Writing Development of Arab and Jewish Students Using
Cooperative Learning (CL) and Computer-mediated Communication (CMC). Computer & Education, 39(1), 19-36.
Hiltz, S. R. (1995). Teaching in a Virtual Classroom. International Journal of Educational Telecommunications, 1(2), 185-198.
Hong, W. Y., Thong, J. Y. L., & Tam, K. Y. (2004). Does Animation Attract Online Users’ Attention? The Effects of Flash on Information Search Performance and Perceptions. Information Systems Research, 15(1), 60-86.
Johnson, S., Aragon, S., Shaik, N., & Palma-Rivas, N. (2000). Comparative Analysis of Learner Satisfaction and Learning Outcomes in On-line and Face-to-face Learning Environments. Journal of Computer-Assisted Learning, 17 (3), 275-283.
Johnson G.M.(2008). Cognitive processing differences between frequent and infrequent Internet users. Computers in Human Behavior 24, 2094–2106
Jones, G. M., & Vesilind, E. (1995). Pre-service Teachers Cognitive Frameworks for Class Management. Teaching and Teacher Evaluation, 11(4), 313-330.
Jönsson, B.A. (2005). A case study of successful e-learning: a web-based distance course in medical physics held for school teachers of the upper secondary level. Medical Engineering & Physics, 27(7), 571-581.
Kirschner, P., & Kester, L. (Eds.). (2007). Avoiding simplicity, confronting complexity: Advances in designing
TOJET: The Turkish Online Journal of Educational Technology – January 2010, volume 9 Issue 1
Copyright The Turkish Online Journal of Educational Technology
81
powerful electronic learning environments. Computers in Human Behavior, 23. Kirschner, P., Kester, L., & Corbalan, G. (2007). Designing support to facilitate learning in powerful electronic
learning environments. Computers in Human Behavior, 23, 1047–1054. Lim, K. H., Ward, L. M. & Benbasat, I. (1997). An Empirical Study of Computer System Learning: Comparison
of Co-discovery and Self-discovery Methods. Information Systems Research, 8(3), 254-272. Lorenzetti, J. P. (2005). How e-learning is changing higher education: a new look. Distance Education Report,
22(July), 4-7. Mackinlay, J. D., Robertson, G. G., & Deline, R. (1994). Developing Calendar Visaulizers for the Information
Visualizer and User Interface Software Tech. Marina del Rey, CA: ACM Press. Marttunen, M., & Laurinen, L. (2001). Learning of Argumentation Skills in Networked and Face-to-face
environments. Journal of Instructional Science, 29, 127-153. Miles, R. N. (2003). Memory: Can It Be Affected by My “Attitude”? Project Report of California State Science
Fair. Minsky, M. (1977). Frame-system Theory. In P. N. Johnson-Laird and P. C. Wason (eds), Thinking-Readings in
Cognitive Science. Cambridge, UK: Cambridge University Press. Nelson, D. L., Bennett, D. J., Gee, N. R., Schreiber, T. A., & Mckinney, V. M. (1993). Implicit Memory: Effects
of Network Size and Interconnectivity on Cued Recall. Journal of Experimental Psychology, 19(4), 747-764.
Newwell, A. (1977). On the Analysis of Human Problem Solving. In Johnson-Laird, P. N., & Wason, P. C. (eds), Thinking-Readings in Cognitive Science. Cambridge, UK: Cambridge University Press.
Nielson, Jakob. (1993). Usability Engineering. Boston: Academic Press. Novak, J., & Tyler, R.( 1977).A Theory of Education. Cambridge University Press, New York. Norman, D. A. (1982). Learning and Memory. San Francisco, CA: W. H. Freeman. Pask, G. (1976). Conversation Techniques in the Study and Practice of Education. British Journal of
Educational Psychology, 46(1), 12-25. Quillian, M. R. (1969). The Teachable Language Comprehender: A Simulation Program and Theory of
Language. Comm. ACM, 12(8), 459-476. Roca J. C., Gagné M. (2008). Understanding e-learning continuance intention in the workplace: A self-
determination theory perspective. Computers in Human Behavior, 24, 1585–1604 Rosenberg, M.J., & Hovland, C. I. (1960). Cognitive, Affective and Behavioral Components of Attitudes. In
Rosenberg, M. J., Hovland, C. I., McGuire, W. J., Abelson, R. P., & Brehm, J.W. (eds) Attitude Organization and Change: An Analysis of Consistency Among Attitude Comments. New Haven, Conn: Yale University Press.
Rumelhar, D. E. (1977). Instruction to Human Information Processing. New York: John Wiley and Sons. Schutte, J. G. (1997).Virtual Teaching in Higher Education: The New Intellectual Superhighway or Just Another
Traffic Jam? [Online]. Available: http://wyw.csun.edu/sociology/virexp.htm[9th August, 2004]. Sein, M. K.,Bostrom, R. P., & Olfman, L. (1987). Conceptual Models in Training Novice Users. In Bullinger, H.
J., & Shackel, B. (eds), Human-Computer Interaction-INTERFACE. North Holland: Elsevier Science Publishers B. V.
Shuell, T. J. (1981). Toward a Model of Learning from Instructions. In Block, K.(eds), Psychological Theory and Educational Practices: Is it Possible to Bridge the Gap? Los Angeles, CA: Meeting of the Amer. Educational Res. Association.
Skinner. R. (1954). The science of learning and the art of teaching. Harvard Educational Review, 24(2), P86-97. Spool, J. M., Scanlon, T., Snyder, C., Schroeder, W., & DeAngelo, T. (1999). Web Site Usability: A Designer's
Guide. San Francisco: Morgan Kaufmann Publisher. Staggers, N. and Norcio, A. F. (1993). Mental Models: Concepts for Human-computer Interaction Research.
International Journal of Man-Machine Study, 38, 587-605. Stevenson, H. (1983). Making the grade: School achievement in Japan, Taiwan, and the United States. Paper
presented as the Annual Report of the Center for Advanced Study in the Behavioral Science, Rockville, MD.
Storck, J., & Sproull, L. (1995). Through a Glass Darkedly: What do People learn in Videoconferencing? Human Communication Research, 22, 197-219.
Summer, M., & Hosterler, D. (2002). A Comparative Study of Computer Conferencing and Face-to-face Communications in Systems Designs. Journal of Interactive Learning Research, 13(3), 277-291.
Vosniadou, S., & Brewer, W. F. (1987). Theories of Knowledge Structuring in Development. Rev. Ed. Res, 57(1), 51-67.
Webster, J., & Hackley, P. (1997). Teaching Effectiveness in Technology-mediated Distance Learning. Acad. Management Journal, 40(6), 1282-1309.
Wetzel, C. D., Radtke, P. H., & Stern, H. W. (1994). Instructional Effectiveness of Video Media. Hillsdale: Lawrence Erlbaum Associates.
TOJET: The Turkish Online Journal of Educational Technology – January 2010, volume 9 Issue 1
Copyright The Turkish Online Journal of Educational Technology 82
Wilson, J. R., & Rutherford, A. (1989). Mental Models: Theory and Application in Human Factors. Human Factors, 31(6), 617-634.
Wu J.-H., Tennyson R. D., Hsia T.-L., Liao Y.-W..(2008). Analysis of E-learning innovation and core capability using a hypercube model. Computers in Human Behavior, 24, 1851–1866
Zhang L.X., Wen H.J., Li D.L., Fu Z.T., Cui S.(2009). E-learning adoption intention and its key influence factors based on innovation adoption theory, Mathematical and Computer Modelling, doi:10.1016/j.mcm.2009.11.013
TOJET: The Turkish Online Journal of Educational Technology – January 2010, volume 9 Issue 1
Copyright The Turkish Online Journal of Educational Technology 83
HIGH SCHOOL STUDENTS IN THE NEW LEARNING ENVIRONMENT: A PROFILE OF DISTANCE E-LEARNERS
Dale KIRBY, PhD Assistant Professor
Dennis SHARPE, PhD Professor Memorial University of Newfoundland
St. John's, NL Canada A1B 3X8 e-mail: [email protected]
Acknowledgement: This research was funded by a grant from the Social Sciences and Humanities Research Council of Canada
ABSTRACT The relative ubiquity of computer access and the rapid development of information and communication technology have profoundly impacted teaching and learning at a distance. Relatively little is currently known about the characteristics of those students who participate in distance e-learning courses at the secondary school level. In an effort to provide a better understanding of who secondary school distance e-learners are, this study utilized a logistic regression analysis to examine data from a survey of students at 35 public schools in the Eastern Canadian province of Newfoundland and Labrador. The survey sample included students who did and did not participate in distance e-learning courses. The results of the analysis suggest that secondary school distance e-learners are more likely to be females who are a) completing a demanding academic program, b) positively disposed toward school, c) not employed in a part-time job, and d) confident of their computer and reading abilities. INTRODUCTION While the origins of distance education may be traced back to the nineteenth century, the rapid evolution of information and communication technology (ICT) over the past two decades has significantly transformed distance education delivery in many jurisdictions (Abrami et al., 2006; Canadian Council on Learning, 2009; Shachar & Neumann, 2003). One of the resultant new paradigms for distance education, online e-learning, utilizes web-based ICT learning tools as the primary mechanism for mediating student-teacher communications and facilitating teaching and learning at a distance. Online courses that integrate distance e-learning (DEL) technology tools have had a growing presence in Canada’s secondary school systems since the mid-1990’s (Barbour & Stewart, 2008). At present, 8 of the 10 Canadian provinces have developed some form of province-wide online DEL program for students in the Kindergarten to Grade 12 education system. In keeping with the dictum that necessity is the mother of all invention, many of these developments have taken place in order to provide students with access to courses that, for a variety of reasons, would not otherwise be available. This is particularly the case in rural and remote communities where schools are often challenged to offer a full range of course options because of low levels of student enrolment in certain courses or difficulty recruiting teachers with appropriate subject matter expertise (Barbour, 2007; Provasnik et al., 2007). This issue is of concern for education policymakers since limited course availability, especially with regard to courses required for secondary school graduation and subsequent admission to tertiary education institutions, can narrow the range of career options available to students. It is for these specific reasons that education authorities in Canadian province of Newfoundland and Labrador have had an extensive history of providing DEL courses to secondary school students, dating back to the late1980’s. In fact, there is a growing population of rural students in the province who are completing a portion of their secondary-level education in DEL environments that differ substantively from the traditional classroom learning environment.
CHARACTERISTICS OF DISTANCE E-LEARNERS Despite growth in the numbers of students engaged in secondary school DEL in recent years, there have been relatively few examinations of the characteristics of students who participate in this form of learning in secondary school. Much of the research examining the characteristics of distance e-learners has focussed on student learning outcomes, retention, attitudes (e.g., satisfaction), and technical issues (Dobbs, Waid, & del Carmen, 2009; Lofstrom & Nevgi, 2007; Wilkes, Simon, & Brooks, 2006). These studies have reported that students in DEL courses attain similar, and sometimes better, results compared to traditional courses but frequently fail to complete courses. Students in such courses report varied levels of satisfaction and frequently experience difficulties as a result of technical skill issues and limitations (Bernard et al., 2004).
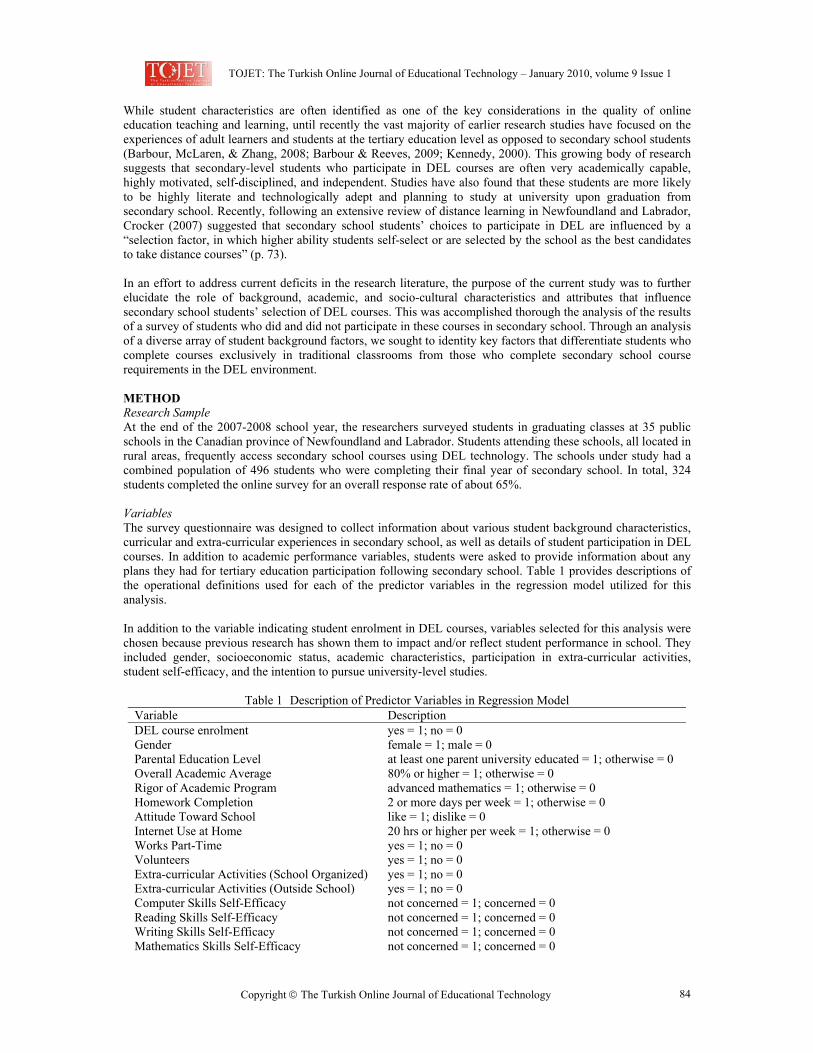
TOJET: The Turkish Online Journal of Educational Technology – January 2010, volume 9 Issue 1
Copyright The Turkish Online Journal of Educational Technology 84
While student characteristics are often identified as one of the key considerations in the quality of online education teaching and learning, until recently the vast majority of earlier research studies have focused on the experiences of adult learners and students at the tertiary education level as opposed to secondary school students (Barbour, McLaren, & Zhang, 2008; Barbour & Reeves, 2009; Kennedy, 2000). This growing body of research suggests that secondary-level students who participate in DEL courses are often very academically capable, highly motivated, self-disciplined, and independent. Studies have also found that these students are more likely to be highly literate and technologically adept and planning to study at university upon graduation from secondary school. Recently, following an extensive review of distance learning in Newfoundland and Labrador, Crocker (2007) suggested that secondary school students’ choices to participate in DEL are influenced by a “selection factor, in which higher ability students self-select or are selected by the school as the best candidates to take distance courses” (p. 73). In an effort to address current deficits in the research literature, the purpose of the current study was to further elucidate the role of background, academic, and socio-cultural characteristics and attributes that influence secondary school students’ selection of DEL courses. This was accomplished thorough the analysis of the results of a survey of students who did and did not participate in these courses in secondary school. Through an analysis of a diverse array of student background factors, we sought to identity key factors that differentiate students who complete courses exclusively in traditional classrooms from those who complete secondary school course requirements in the DEL environment.
METHOD Research Sample At the end of the 2007-2008 school year, the researchers surveyed students in graduating classes at 35 public schools in the Canadian province of Newfoundland and Labrador. Students attending these schools, all located in rural areas, frequently access secondary school courses using DEL technology. The schools under study had a combined population of 496 students who were completing their final year of secondary school. In total, 324 students completed the online survey for an overall response rate of about 65%. Variables The survey questionnaire was designed to collect information about various student background characteristics, curricular and extra-curricular experiences in secondary school, as well as details of student participation in DEL courses. In addition to academic performance variables, students were asked to provide information about any plans they had for tertiary education participation following secondary school. Table 1 provides descriptions of the operational definitions used for each of the predictor variables in the regression model utilized for this analysis. In addition to the variable indicating student enrolment in DEL courses, variables selected for this analysis were chosen because previous research has shown them to impact and/or reflect student performance in school. They included gender, socioeconomic status, academic characteristics, participation in extra-curricular activities, student self-efficacy, and the intention to pursue university-level studies.
Table 1 Description of Predictor Variables in Regression Model
Variable Description DEL course enrolment yes = 1; no = 0 Gender female = 1; male = 0 Parental Education Level at least one parent university educated = 1; otherwise = 0 Overall Academic Average 80% or higher = 1; otherwise = 0 Rigor of Academic Program advanced mathematics = 1; otherwise = 0 Homework Completion 2 or more days per week = 1; otherwise = 0 Attitude Toward School like = 1; dislike = 0 Internet Use at Home 20 hrs or higher per week = 1; otherwise = 0 Works Part-Time yes = 1; no = 0 Volunteers yes = 1; no = 0 Extra-curricular Activities (School Organized) yes = 1; no = 0 Extra-curricular Activities (Outside School) yes = 1; no = 0 Computer Skills Self-Efficacy not concerned = 1; concerned = 0 Reading Skills Self-Efficacy not concerned = 1; concerned = 0 Writing Skills Self-Efficacy not concerned = 1; concerned = 0 Mathematics Skills Self-Efficacy not concerned = 1; concerned = 0
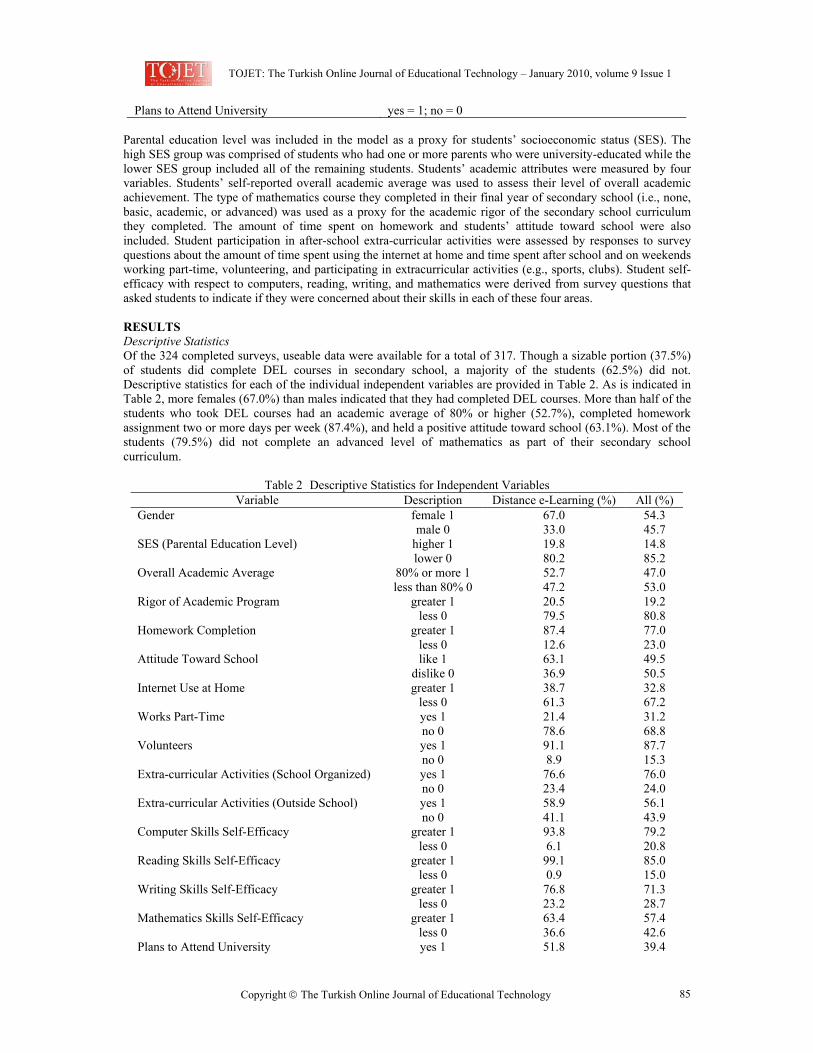
TOJET: The Turkish Online Journal of Educational Technology – January 2010, volume 9 Issue 1
Copyright The Turkish Online Journal of Educational Technology 85
Plans to Attend University yes = 1; no = 0
Parental education level was included in the model as a proxy for students’ socioeconomic status (SES). The high SES group was comprised of students who had one or more parents who were university-educated while the lower SES group included all of the remaining students. Students’ academic attributes were measured by four variables. Students’ self-reported overall academic average was used to assess their level of overall academic achievement. The type of mathematics course they completed in their final year of secondary school (i.e., none, basic, academic, or advanced) was used as a proxy for the academic rigor of the secondary school curriculum they completed. The amount of time spent on homework and students’ attitude toward school were also included. Student participation in after-school extra-curricular activities were assessed by responses to survey questions about the amount of time spent using the internet at home and time spent after school and on weekends working part-time, volunteering, and participating in extracurricular activities (e.g., sports, clubs). Student self-efficacy with respect to computers, reading, writing, and mathematics were derived from survey questions that asked students to indicate if they were concerned about their skills in each of these four areas.
RESULTS Descriptive Statistics Of the 324 completed surveys, useable data were available for a total of 317. Though a sizable portion (37.5%) of students did complete DEL courses in secondary school, a majority of the students (62.5%) did not. Descriptive statistics for each of the individual independent variables are provided in Table 2. As is indicated in Table 2, more females (67.0%) than males indicated that they had completed DEL courses. More than half of the students who took DEL courses had an academic average of 80% or higher (52.7%), completed homework assignment two or more days per week (87.4%), and held a positive attitude toward school (63.1%). Most of the students (79.5%) did not complete an advanced level of mathematics as part of their secondary school curriculum.
Table 2 Descriptive Statistics for Independent Variables Variable Description Distance e-Learning (%) All (%)
Gender female 1 67.0 54.3 male 0 33.0 45.7 SES (Parental Education Level) higher 1 19.8 14.8 lower 0 80.2 85.2 Overall Academic Average 80% or more 1 52.7 47.0 less than 80% 0 47.2 53.0 Rigor of Academic Program greater 1 20.5 19.2 less 0 79.5 80.8 Homework Completion greater 1 87.4 77.0 less 0 12.6 23.0 Attitude Toward School like 1 63.1 49.5 dislike 0 36.9 50.5 Internet Use at Home greater 1 38.7 32.8 less 0 61.3 67.2 Works Part-Time yes 1 21.4 31.2 no 0 78.6 68.8 Volunteers yes 1 91.1 87.7 no 0 8.9 15.3 Extra-curricular Activities (School Organized) yes 1 76.6 76.0 no 0 23.4 24.0 Extra-curricular Activities (Outside School) yes 1 58.9 56.1 no 0 41.1 43.9 Computer Skills Self-Efficacy greater 1 93.8 79.2 less 0 6.1 20.8 Reading Skills Self-Efficacy greater 1 99.1 85.0 less 0 0.9 15.0 Writing Skills Self-Efficacy greater 1 76.8 71.3 less 0 23.2 28.7 Mathematics Skills Self-Efficacy greater 1 63.4 57.4 less 0 36.6 42.6 Plans to Attend University yes 1 51.8 39.4
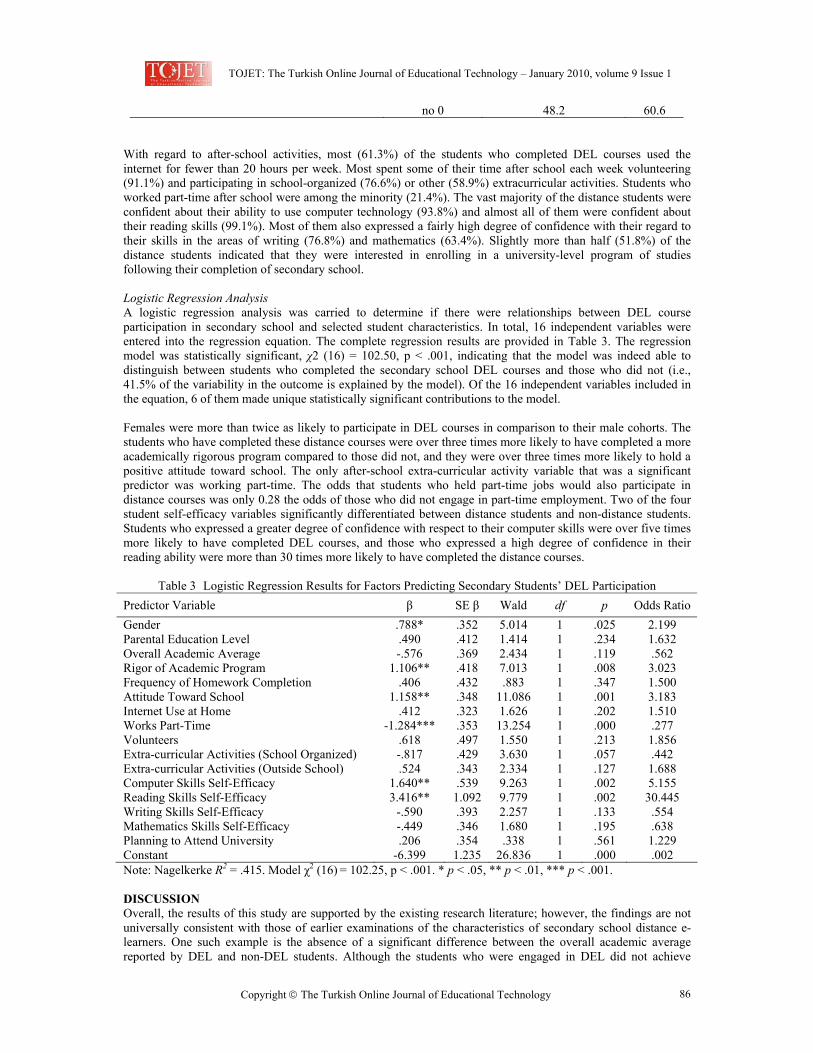
TOJET: The Turkish Online Journal of Educational Technology – January 2010, volume 9 Issue 1
Copyright The Turkish Online Journal of Educational Technology 86
no 0 48.2 60.6
With regard to after-school activities, most (61.3%) of the students who completed DEL courses used the internet for fewer than 20 hours per week. Most spent some of their time after school each week volunteering (91.1%) and participating in school-organized (76.6%) or other (58.9%) extracurricular activities. Students who worked part-time after school were among the minority (21.4%). The vast majority of the distance students were confident about their ability to use computer technology (93.8%) and almost all of them were confident about their reading skills (99.1%). Most of them also expressed a fairly high degree of confidence with their regard to their skills in the areas of writing (76.8%) and mathematics (63.4%). Slightly more than half (51.8%) of the distance students indicated that they were interested in enrolling in a university-level program of studies following their completion of secondary school. Logistic Regression Analysis A logistic regression analysis was carried to determine if there were relationships between DEL course participation in secondary school and selected student characteristics. In total, 16 independent variables were entered into the regression equation. The complete regression results are provided in Table 3. The regression model was statistically significant, χ2 (16) = 102.50, p < .001, indicating that the model was indeed able to distinguish between students who completed the secondary school DEL courses and those who did not (i.e., 41.5% of the variability in the outcome is explained by the model). Of the 16 independent variables included in the equation, 6 of them made unique statistically significant contributions to the model. Females were more than twice as likely to participate in DEL courses in comparison to their male cohorts. The students who have completed these distance courses were over three times more likely to have completed a more academically rigorous program compared to those did not, and they were over three times more likely to hold a positive attitude toward school. The only after-school extra-curricular activity variable that was a significant predictor was working part-time. The odds that students who held part-time jobs would also participate in distance courses was only 0.28 the odds of those who did not engage in part-time employment. Two of the four student self-efficacy variables significantly differentiated between distance students and non-distance students. Students who expressed a greater degree of confidence with respect to their computer skills were over five times more likely to have completed DEL courses, and those who expressed a high degree of confidence in their reading ability were more than 30 times more likely to have completed the distance courses.
Table 3 Logistic Regression Results for Factors Predicting Secondary Students’ DEL Participation
Predictor Variable β SE β Wald df p Odds Ratio Gender .788* .352 5.014 1 .025 2.199 Parental Education Level .490 .412 1.414 1 .234 1.632 Overall Academic Average -.576 .369 2.434 1 .119 .562 Rigor of Academic Program 1.106** .418 7.013 1 .008 3.023 Frequency of Homework Completion .406 .432 .883 1 .347 1.500 Attitude Toward School 1.158** .348 11.086 1 .001 3.183 Internet Use at Home .412 .323 1.626 1 .202 1.510 Works Part-Time -1.284*** .353 13.254 1 .000 .277 Volunteers .618 .497 1.550 1 .213 1.856 Extra-curricular Activities (School Organized) -.817 .429 3.630 1 .057 .442 Extra-curricular Activities (Outside School) .524 .343 2.334 1 .127 1.688 Computer Skills Self-Efficacy 1.640** .539 9.263 1 .002 5.155 Reading Skills Self-Efficacy 3.416** 1.092 9.779 1 .002 30.445 Writing Skills Self-Efficacy -.590 .393 2.257 1 .133 .554 Mathematics Skills Self-Efficacy -.449 .346 1.680 1 .195 .638 Planning to Attend University .206 .354 .338 1 .561 1.229 Constant -6.399 1.235 26.836 1 .000 .002 Note: Nagelkerke R2 = .415. Model χ2 (16) = 102.25, p < .001. * p < .05, ** p < .01, *** p < .001.
DISCUSSION Overall, the results of this study are supported by the existing research literature; however, the findings are not universally consistent with those of earlier examinations of the characteristics of secondary school distance e-learners. One such example is the absence of a significant difference between the overall academic average reported by DEL and non-DEL students. Although the students who were engaged in DEL did not achieve
TOJET: The Turkish Online Journal of Educational Technology – January 2010, volume 9 Issue 1
Copyright The Turkish Online Journal of Educational Technology 87
significantly higher academic averages than traditional classroom learners, they were more likely to be completing a more rigorous academic program. This would appear to be in line with earlier studies that have suggested that students choosing DEL courses are more academically capable than their peers (Barbour & Reeves, 2009). Like Crocker (2007), the findings indicate that female secondary school students are more likely to enrol in DEL courses. This finding is consistent with the fact that females tend to perform better generally in Canadian schools, tend to be more engaged than males in secondary school, and are also more likely than young men to complete more academically-challenging secondary school programs (Educational Policy Institute, 2008). Distance e-learners were also shown to have a significantly more positive attitude toward school. This finding is important because it appears that a more positive school experience heightens the possibility that a student would be inclined to choose to participate in DEL. Amongst the after-school activities included in the analysis, the only one that significantly differentiated distance e-learners from their peers was involvement in part-time employment. Students who did not engage in DEL were more likely to work part-time than those who did. The reason for this is not entirely obvious from the data but it is notable that earlier research studies have shown that part-time work can sometimes have a detrimental effect on secondary students’ achievement. Research in this area has also shown that working students can often have difficulty balancing the demands of both school and work (Singh, Chang, & Dika, 2007). The results highlight the importance of literacy and technology skills in determining who will participate in DEL courses. Consistent with the results of earlier investigations, students whose perceived self-efficacy with computer technology is higher relative to their peers are more likely to pursue DEL (Barbour & Reeves, 2009). Likewise, the results of our analysis also strongly support the contention that reading ability is a good predictor of student choice between DEL courses and traditional classroom courses. The results suggest that high reading ability is the best predictor of DEL course participation. A notable unexpected result was the finding that, unlike earlier studies which found DEL students to be more inclined to choose to pursue university-level studies following secondary school (Barbour & Reeves, 2009), the DEL and non-DEL students who participated in the current study were equally likely to have plans to attend university. Because it is possible that this finding is a reflection of generally high levels of university participation amongst the population of students included in this study, this result should be interpreted with some degree of caution. Implications of the Research The findings of this study suggest that DEL students are likely to be females completing a demanding academic program who are positively disposed toward school and not employed in a part-time job. These are students who are also likely to report feeling highly efficacious with respect to their computer and reading abilities. Efforts to identify these predisposing characteristics of secondary school DEL students and to create a profile of their attributes are important for two reasons. First, a better understanding of the characteristics of students who do not chose DEL courses is useful in developing strategies to increase and diversify the secondary school population enrolled in DEL. This research also enables us to better support distance e-learners and to identify at-risk learners in order to increase their chances of success. Limitations of the Research The current investigation included students from rural communities in one Canadian province which possibly limits the generalizability of the findings to some extent. A more comprehensive sample that includes students in settlements from other parts of Canada could help to validate and clarify the findings further. It is also important to acknowledge that one of the limitations of the survey data used for this research is the possibility of a self-selection bias amongst the respondents. There is a possibility that students who did not participate in DEL courses could have been somewhat less inclined to complete the survey for some unforeseen reason(s). As with the majority of studies of this type, this investigation was limited by the quality and the quantity of the collected data. Thus, the potential for extraneous causes of the observed differences between students, while unlikely, cannot be ruled out with complete certainty.
REFERENCES Abrami, P. C., et al. (2006). A review of e-learning in Canada: A rough sketch of the evidence, gaps and
promising directions. Montreal, QC: Centre for the Study of Learning and Performance, Concordia University.
TOJET: The Turkish Online Journal of Educational Technology – January 2010, volume 9 Issue 1
Copyright The Turkish Online Journal of Educational Technology 88
Barbour, M. K., McLaren, A., & Zhang, L. (2008, July). Secondary students’ perceptions of web-based learning. Paper presented at the World Conference on E-Learning in Corporate, Government, Healthcare and Higher Education, Norfolk, VA.
Barbour, M. K., & Reeves, T. C. (2009). The reality of virtual schools: A review of the literature. Computers & Education, 52, 402–416.
Barbour, M. K., & Stewart, R. (2008). A snapshot state of the nation study: K-12 online learning in Canada. Vienna, VA: North American Council for Online Learning.
Barbour, M. K. (2007). Portrait of rural virtual schooling. Canadian Journal of Educational Administration and Policy, 59, 1-21.
Bernard, R. M., et al. (2004). How does distance education compare to classroom instruction? A meta-analysis of the empirical literature. Review of Educational Research, 74(3), 379-439
Canadian Council on Learning. (2009). State of e-learning in Canada. Ottawa, ON: Author. Crocker, R. (2007). Distance learning: Access and outcomes. St. John's, NL: Killick Centre for E-Learning
Research. Dobbs, R., R., Waid, C. A., & del Carmen, A. (2009). Students' perceptions of online courses: The effect of
online course experience. The Quarterly Review of Distance Education, 10(1), 9-26. Educational Policy Institute. (2008). Access, persistence, and barriers in postsecondary education: A literature
review and outline of future research. Toronto, ON: Author. Kennedy, C. A. (2000). What influences student learning in an online course. Retrieved July 17, 2009, from the
ERIC database. Lofstrom, E., & Nevgi, A. (2007). From strategic planning to meaningful learning: Diverse perspectives on the
development of web-based teaching and learning in higher education. British Journal of Educational Technology, 38(2), 312-332.
Provasnik, S., et al. (2007). Status of education in rural America. Washington: National Center for Education Statistics.
Shachar, M., & Neumann, Y. (2003). Differences between traditional and distance education academic performance: A meta-analytic approach. International Review of Research in Open and Distance Education, 4(1), 1-20.
Singh, K., Chang, M., & Dika, S. (2007). Effects of part-time work on school achievement during high school. Journal of Educational Research, 101(1), 12-23.
Wilkes, R. B., Simon, J. C., & Brooks, L. D. (2006). A comparison of faculty and undergraduate students’ perceptions of online courses and degree programs. Journal of Information Systems Education, 17(2), 131-140.
TOJET: The Turkish Online Journal of Educational Technology – January 2010, volume 9 Issue 1
Copyright The Turkish Online Journal of Educational Technology 89
HOW THE USE OF COMPUTER TYPES AND FREQUENCY AFFECTS ADOLESCENCES TOWARDS ANGER AND AGGRESSION
Emete YAĞCI
Main Scientific Area of Guidance and Psychology Counseling Near East University, Nicosia-North Cyprus
Assoc. Prof. Dr. Mehmet ÇAĞLAR
Near East University, Nicosia-North Cyprus ABSTRACT This study was conducted to research the relationship between use of computer types and frequency and anger and aggression in adolescents. The study was conducted among years 9, 10 and 11 students (secondary level) in 2008-2009 academic year. The general research tool for this study used was “Relationship research” model. The focal schools of this research were randomly selected from the Nicosia district in North Cyprus. There were a total of 214 participating students and the data collection tools were: Aggression Scale, Anger Scale and a Personal Information form. In addition, the data collected through these scales and questionnaires were analyzed by using statistical calculations of frequency, mean, standard deviation, Anova and T-test techniques at p< 0,5 level. The results of the study show that there was no significant difference between adolescences who play and those who do not play computer games. It was also found that there was no significance in the relationship of playing computer games in other places between adolescences towards anger and aggression. Together with this, the average amount of computer games played within a week among adolescences has no significant impact on the levels of their anger and aggression. Also, there was no significance observed of playing weekly computer games at an internet café and the use of computer types and frequency in relation to their anger and aggression. Moreover, there was no significant difference between adolescents’ levels of anger and aggression towards computer games of sports and competitive games, war and strategic games and general logic computer games. Key Words: Adolescence, anger, aggression, computer. INTRODUCTION The rapid development and changes made in technology has also affected the changes in the attitudes and behavior in people. The way of communication, habits, the activities that people spend their free time with and even their life styles are affected by these rapid changes in technology. These fast changes and new trends in technology however may produce positive or negative results. Adolescence generally begins from the age of 10 and continues until the age of 20; it is a period where biological, psychological, social development and maturity takes place. With the development in this period, identity, closeness, gender and success are priorities. This period of maturity it puts forward expectations, emotions, ideas, beliefs, attitudes and behavior. Maturity has many factors within itself; who am I , what will happen, what will I do, who and what will I believe, to know how to face problems, searching for answers to the problems, searching within yourself and the difference between you and others. In these stages youngsters have more courage, are more optimistic, excited and are seeking adventure to bring out their own identity, and therefore are more open to taking risks and accepting their faults (Yörükoğlu, 1989). In adolescence, individuals are swayed towards new relationships. They make friends from both genders and get into more matured relationships which they want to be part of and accepted (Adams, 1995; Erwin, 2000; Gander and Gardiner, 1995; Steinberg, 2007; Yavuz, 1994). Some adolescents that have a more problematic period are those that are in an abusive scope where their behaviors begin to turn into anti-social behavior (Guilmet and Whited, 2000). Whereas, the relationship mannerism in this stage should encourage them to learn their future social roles and try out new opportunities, it is both mother’s and father’s priority to encourage them to face their responsibilities and duties. The word aggression may generally emphasize negativity in behavior but its dictionary definition is the approach to someone or something, to begin something or at the same time instead of approaching, attacking/aggression is used. Yet, in today’s dialogue aggression is defined as a behavior when vandalizing someone or something, hurting, or even killing and fracturing. In some studies, hostile and aggressive behaviors are treated as equals. A hostile person is someone who has feelings of dislike towards others and defines them as negative people Berkowitz (1990) draws attention to the relationship between hostile and aggressive behavior. Hostile isn’t introverted aggressive behavior; it’s extroverted aggressive behavior. These definitions point out that anger management is a minority and
TOJET: The Turkish Online Journal of Educational Technology – January 2010, volume 9 Issue 1
Copyright The Turkish Online Journal of Educational Technology 90
extroverted aggression is an important variable that triggers hostility (Bridewell ve Chang, 1997: Riley, Treiberve Woods, 1989). Even though it can be said that everybody has knowledge on what aggression is, the answer to the question “Which behaviors can be evaluated as aggressive?” is still variable. The answer to this question has still not been classified but this definition doesn’t consider the reason of that person’s approach. Behaviorism or social learning approaches prefer a more realistic definition where “Aggression includes all type of behaviors by being hurt or hurting”. For this reason, the word Aggression can be defined as “physically or intentionally hurting someone, or targeting to vandalize type of behavior or intention” (Freedman, Sears, Carlsmith, 1998). Aggression, on the other hand, is putting forward a behavior aiming to vandalize an individual or a group. When aggression is defined as a behavior, it excludes the feeling that is turned into hatred. The definition includes physical aggression (for example, to hit someone) and verbal aggression (for exmaple, to insult and accuse someone) (Bilgin,1988). The increased of the use of both scientific technology and the internet has brought up popular discussions of an increase in aggressive behavior. In the media, there are non-stop news about the continuous increase of aggressive behavior among youngsters, alongside with the computer; internet and computer games are being mentioned. Like the changes that have taken place in our lives by the development of technology, children’s gaming habits have also changed. The first video game that was introduced to marketing in 1970 was used as a free time entertainment by children and adults, but in time these habits have changed and developed into other diversities (Doğan, 2006). Among children and youngsters, the most popular past-time technological tools were computer games. “Video games” and “computer games” terms were used interchangeably because both of the inputs were through joysticks or keyboards and viewing the game was through a monitor (Kirriemuir, 2002). After the first marketing production computer game Pong in the year of 1974, especially after the development of graphical technologies, computer games have become more and more realistic (Setzer, Duckett, 1994). Boxer and Tisak (2005), defined the term aggression as, “A behavior that makes someone or something feel uncomfortable or irritable”. LITERATURE REVIEW Anger is a feeling which everybody has experienced and lived. When the reasons for this feeling and its consequent behaviors are sought for, there are many views. According to Morgan (1988) anger is a temporary impression or it’s a feeling that needs to get out of your system. Morgan explains that when this system doesn’t perform functionally and it is obstructed, this triggers the beginning of anger. Morgan (1988) puts forward that another reason for anger is behaviors that perform anger that needs to be punished (Akt; Akgül, 2000). The reasons that make people angry are; obstructions, not being taken seriously, to be put down, to face a disbelieved attitude and facing an attack. We all may face anger in situations that may obstruct something, an issue or someone (Baltaş, Baltaş, 2004). Anger is a normal and healthy situation. It is not morally right for a person to feel guilty when he/she experiences anger or annoyance. The unhealthiest situation is that of anger being converted into physical actions. Obstructions create energy. This energy can be used as constructive or abusive. It is healthy that anger is aimed as an external guide, mostly in a way where it is accepted by the public and mostly in long term situations that will bring advantages to the individual. In an unhealthy situation anger becomes an external guide, attacks and one largely injures himself/herself. In a more constructive view, anger brings strength to both body and mind (Baltaş, Baltaş, 2004). While anger is defined as a symptom erupted by a strong uncomfortable and sad feeling, anger is also an individual threat or when it is faced an obstruction, depending on the threat, that leads to hopeless, weakness and the depressive feeling of sufficiency corrupts a feeling of anger and abuse (Thomas, 1983). According to Hankins (1988), anger is an individual’s transparent attack, criticism or when faced with obstruction, an introverted or universal feeling. Anger and hostility are more related to feelings and attitudes, attacking others or other objects and in the scope of triggering, a destructive behavior (Spielberger ve ark. 1995).
TOJET: The Turkish Online Journal of Educational Technology – January 2010, volume 9 Issue 1
Copyright The Turkish Online Journal of Educational Technology 91
Anger; 1) To be hindered, to be attacked, to be threatened, to be isolated, to be restricted, etc are types of such feelings and generally these are the reasons for performing the action of attacking someone for some reason, which is a very intense negative feeling. 2) Kubler-Ross puts forward two of the five universal compositions. Showing feelings of anger hurts and envies to someone who is on the verge of death (Budak, 2005). The core feelings that are reflected in the adolescence period are; anger, love, fright and fancy. Anger, pressure, restrictions, disappointments, hurt, fright and rights being taken away are the feelings that are performed as reflections (Kulaksızoğlu, 2001). Although anger may be a natural feeling, it is something that may not be controlled and may lead to attacking and negative behaviors (Lerner, 1999; Kılıçarslan, 2000; Köknel, 1997; Taylor, 1988). Anger has physical, scientific and behavioral dimensions. This can be reflected through physically or through gestures, such as tense muscles, frowns, a red face, sweating, feeling cold, numbness, feeling of suffocation, having a dry mouth, etc (Archier, 1989; Arenofsky, 2001; Geçtan, 1986; Gottlieb, 1999; Retzinger, 1991;Tavris, 1982). Anger may sometimes last for a short period, at a medium rate and it may be useful for an individual, though sometimes it may be very violent, ongoing and hurtful. When we think about it, this emotion plainly shows an affect of destruction. In many cultures anger is mostly evaluated as negative. This feeling of anger can cause a person to attack verbally or physically. This may also create corruptions among family and people (Schuerger 1979). This may also result in disrespect to an individual’s identity (Deffenbacher 1992). Anger that is hidden deep beneath can also cause pysical illnesses such as, high blood pressure, coroner artiary illnesses and cancer (Bitti ve ark. 1995, Siegman 1993, Spielberger ve ark. 1991). The literature supports these claims that similar illnesses that are mentioned above can also occur (Ellis 1997, Martin ve Watson 1997). 2.2. Adolescent and Anger Reactions during the Adolescence Period Today in the west, “adolescence” means “to grow” (Yörükoğlu, 1998). The word “adolescence” was first used in the 15th Century (Muuss, 1996) and the root of its meaning comes from the Latin word “adolescere”. Adolescere means “to grow” and “to mature”. In Latin, this word carries the meaning of to grow and to mature; it doesn’t convey the construction of the situation, but it conveys a period of time. This word today also defines an individual’s speed and continuity of the development on the universe (Yavuzer, 1998, sf. 277). Generally, the childhood is a calm period but when adolescence comes, intense variables are at work. There may also be diversity whilst getting to know themselves, their social lives and judgmental abilities (Bernstein, Clarke-Stewart, Penner, Roy, Wickens, 2000). The adolescence, from childhood to adulthood, carries a number of developments and the person matures biologically, physically, mentally and socially (Yavuzer, 1998). Erikson defines this period as seeking for identity and the answer to “who am I?” Whilst in search of their identity, they focus on their gender roles, occupation and ideology (religion, politics). Therefore, maturity is a period of clashes between ego identity and role. According to Spengle (1980), the emotional adolescent world is full of contradictions. On one hand, there are feelings of isolation; the need of joining to a group, not obeying their elders and on the other hand, there is seeing a brighter future rather than worry and hopelessness. This is an obvious contradiction within their emotions (Akt; Baygöl, 1997). According to the Ministry of Education, the definition of youngsters is, “by approaching the teenage period and bio-psychologically leaving behind their childhood, it’s an age group between 12-24, it’s the period that starts public responsibilities” (Kulaksızoğlu, 2002). 2.15. Aggression and Computer Games That Can Be Played on the Computer and the Internet In most of the research literature, reasons for playing games are as follows: Curiosity and wanting to be warned (Grauman, 1971), boredom, stress, anger together with wanting to be far away from anger and the feeling of being unsuccessful (Toksöz, 1999). Anderson and Ford (1986) measured undergraduate learners’ feelings of the “enemy” after a computer game based on violence. Their results showed that computer games that involve violence affected their emotions in a negative manner. They also claim that those who play games have an increase in their feelings of animosity and

TOJET: The Turkish Online Journal of Educational Technology – January 2010, volume 9 Issue 1
Copyright The Turkish Online Journal of Educational Technology 92
anxiety. Kubey and Larson (1990) explain that, in the research scope of 483 associations between the age groups of 9-15, 63% of male children from a high socio-economic level play video games. On the contrary, other researchers believe that (Braun and others, 1986; Dominick, 1984) there are no significant relationship between playing video games and changes in social class (Alantar, 1996). A study made by Calvert and Tan (1994), looked at adolescents’ computer games that involved violence or/and watching, feelings of animosity, thoughts of attacking and results of their physical actions. With this aim, a questionnaire was distributed to collect the adolescents’ feelings after playing a computer game. As a result, a comparison was made of their feelings when they played computer games that involved violence and when they played computer games that was based on educational points. Their results pointed out that youngsters developed a headache and felt nauseous when they had thoughts of attack. Funk (1995) studied 357 year 7 and 8 students about their computer game practices. These students were asked to define the most played computer games using a scale of 1 to 5. The most preferred games with a 32% agreement were those that involved fantasy and violence. 29% thought that computer games that involved sports and violence were popular. 20% of the students preferred the general entertainment games and 1% were those that put violence into practice by people. In this sample, only 2% preferred games that involved education. The National Coalition on Television Violence, an institution that made an evaluation in the year 1989, showed that out of 176 computer games, 55.7% involved a high level of violence. Only 20% of these games were educational. A research made by the same institution in 1990, showed games that involved violence increased to 82% (NCTV, 1990). Kubey, Lavin and Barrows (2001) have observed that those university students using the internet for more that 11.18 hours are more likely to be poor achievers academically compared to students using the internet for 3.84 hours and below. According to Berson and Berson (2003), 92% of youngsters between the ages 12-18 have access to the internet at home.This search shows that a high percentage of these youngsters utilise their time entering chat lines and only 1% use the internet for research and education purposes. Bilgi, (2005), has researched computer games and aggressive behaviour. This study included a total of 310 students; 134 female and 176 male. As a direct result of these, it has been found that students who spent more time playing these computer games were more anti–social and aggressive. Students playing these types of computer games at home were found to be at higher risk of aggressive behaviour in comparison to students playing the same type of games at an internet cafe. Students playing games involving combat, warfare and advanture carry a higher risk of developing anti social behaviour and aggression compared to somebody who is not playing these types of computer games at all. Mathews et al. (2005) conducted a medical research to show how much adolescents’ brains were affected when they played violent games.44 adolescents who were selected randomly were asked to play violent or non-violent computer games in 30 minutes and at the same time their brain were examinated by FMRI device. As a result of this, it was observed that adolescents who played violent video games had emotional activity in the amygdala part which is a higher scale than the adolescents who did not play these video games at all. Kurfallı (2005) did a research in Uşak Anotalian Girls Career High School and Uşak Technical Vocational High School. There were 205 adolescent participants (67 female and 138 male adolescents) taking parts in the research on the education of computer games in it’s effect on activity that students study. They looked at how often, how long, where and what kind of computer games students played. The pursuit of other social activities was examined. The adolescents were asked various questions about the games; whether they had advantage of computer games, did they benefit from these games, were these games social networking and educational for the students. The result of the research shows that there is no proof of computer games affecting or blocking adolescents from their social activities. A research conducted by Suhail and Bargees (2006) using 200 pupils concluded that pupils using the internet found it difficult to be social with other people. Another research shows that youngsters who spend long hours on the internet find themselves isolated and find it difficult to interact and form friendships with others (Kraut et all, 1998).
TOJET: The Turkish Online Journal of Educational Technology – January 2010, volume 9 Issue 1
Copyright The Turkish Online Journal of Educational Technology 93
Lee et al. (2007) looked at Korean adolescents and their preferred game types. 627 adolescents were selected from primary and secondary schools. ‘Korea Internet Loyality Test was implemented where the participants were classified as ‘normal’, ‘potential risk group’ and ‘high-risk group’ as classified. The results showed that 4% of the participants were in ‘high risk group’; It was interesting to see that 96% of male adolescents were in the high risk group. At research, adolescents on the internet being played games preferred by determining the time spent on the game type, on weekdays and weekends. METHODOLOGY This study is conducted to research the relationship between the use of computer types and frequency and its effects on adolescences’ anger and aggression. A general research tool has been used to put forward this study. It is also a relationship research model. The general research tool “is a sample of taking point of views of participants as individuals or as a group to reach the target of the study” (Karasar, 2000). The relationship research “is aimed to find the two or more variables among the varieties and/or to show the degree in which it is varied.” It is made up of relation in solutions, correlation types, relations or relations that are in comparison (Karasar, 2000). The sample in the study represents the secondary schools in Nicosia. It is made up of randomly selected classes. It has been limited to the Nicosia district of TRNC in 2007-2008 academic year and the participants are those of the students studying in the secondary education institutions. Classes were chosen randomly where the questionnaire reached 300 students and a data collection tool was also used. The research data was collected through a “Personal Information Form”, and a questionnaire that pointed out an individual’s personal emotional view and their “anger and aggression reactions”. Below, you will find a short explanation of the data collection tool. This measure tool is equal to PP1 and has been limited to the anger levels. The scale was made up of 34 statements and it was evaluated based on a 4-level Likert scale as follows: “Always” (4), “Mostly” (3), “Sometimes” (2) and “Never” (1). To be able to collect data and put the questionnaire into practice, necessary permission was acquired from the Ministry of Education in Nicosia. Then the questionnaire was distributed to 300 students. The collected data was put into and was analyzed the SPSS 11.0 program. Later tables were draw and necessary comments and explanations were made. The Personal Information Form was made-up of the school that the student studied at, the class which the student studied in, gender, whether they have a computer at home or not, where they play the computer, an average time computer games played in a week at home, an average time computer games played in a week at an internet café, the frequency of how much they played computer games based on sports and racing, adventure, war and strategic games and logic games. Arithmetic average, standard deviation and the average were analyzed. The students’ reaction towards anger and aggression is shown as an average in the limitation data given below.
Options Weight Boarders Never 1 1.00-1.75 Sometimes 2 1.76 -2.50 Mostly 3 2.51-3.25 Always 4 3.26-4.00
In the measuring of the students’ anger and aggression the average points have been calculated. To test whether there is significance between the levels of anger and aggression a t-test was performed and to analyze the differences or similarities between 3 or more groups ANOVA was used. If there were any significance among the variables then the Post-Hoc LSD test was used. RESULT AND DISCUSSION It can be seen that there is a significant difference between adolescences who play computers and those who doesn’t (t=.348= P>0.05). There is no significant difference of those adolescences’ anger and aggression frequencies related to playing computer games at different places (F=1.591, p>.005). There was no significant difference in adolescents playing computers at home for a week in relation to their anger and aggression. Together with there being no significant difference in adolescents playing a variation of computer games at an internet cafe in a week in relation to their anger and aggression, there was also no significant difference in adolescents playing sports and racing, war and strategic and logic games in relation to their anger and aggression. However, it can be seen that there is a significant difference between female and male adolescents
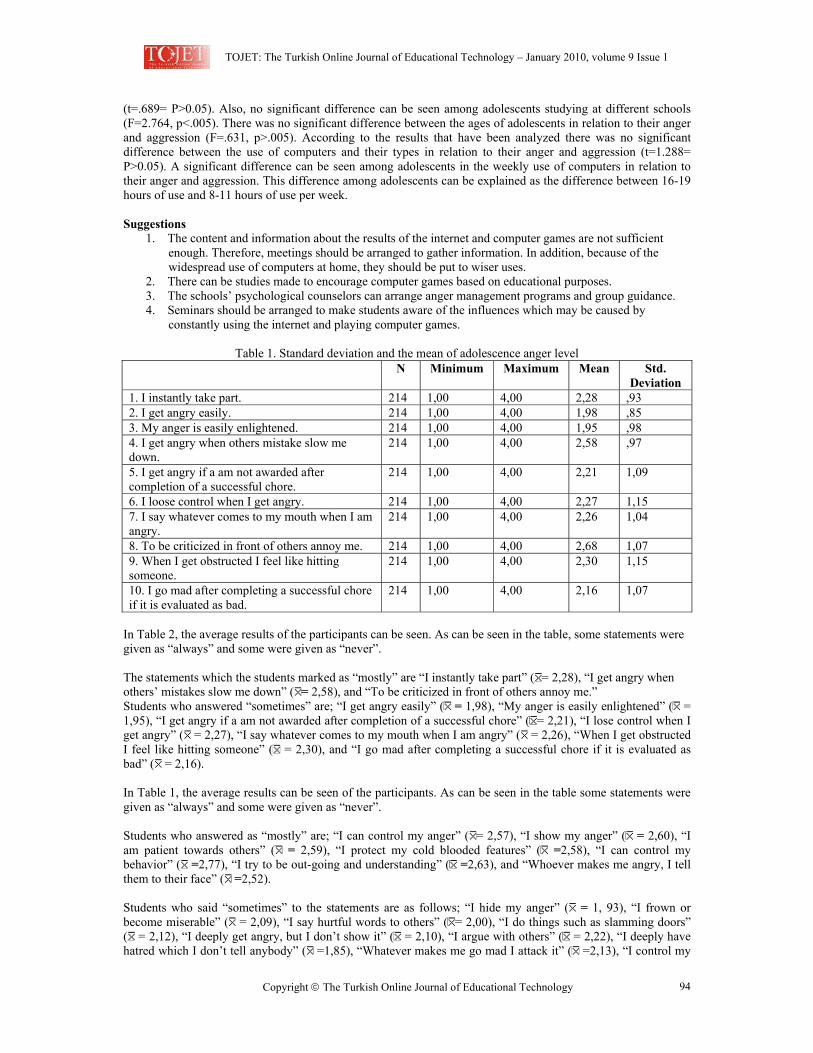
TOJET: The Turkish Online Journal of Educational Technology – January 2010, volume 9 Issue 1
Copyright The Turkish Online Journal of Educational Technology 94
(t=.689= P>0.05). Also, no significant difference can be seen among adolescents studying at different schools (F=2.764, p<.005). There was no significant difference between the ages of adolescents in relation to their anger and aggression (F=.631, p>.005). According to the results that have been analyzed there was no significant difference between the use of computers and their types in relation to their anger and aggression (t=1.288= P>0.05). A significant difference can be seen among adolescents in the weekly use of computers in relation to their anger and aggression. This difference among adolescents can be explained as the difference between 16-19 hours of use and 8-11 hours of use per week. Suggestions
1. The content and information about the results of the internet and computer games are not sufficient enough. Therefore, meetings should be arranged to gather information. In addition, because of the widespread use of computers at home, they should be put to wiser uses.
2. There can be studies made to encourage computer games based on educational purposes. 3. The schools’ psychological counselors can arrange anger management programs and group guidance. 4. Seminars should be arranged to make students aware of the influences which may be caused by
constantly using the internet and playing computer games.
Table 1. Standard deviation and the mean of adolescence anger level N Minimum Maximum Mean Std.
Deviation 1. I instantly take part. 214 1,00 4,00 2,28 ,93 2. I get angry easily. 214 1,00 4,00 1,98 ,85 3. My anger is easily enlightened. 214 1,00 4,00 1,95 ,98 4. I get angry when others mistake slow me down.
214 1,00 4,00 2,58 ,97
5. I get angry if a am not awarded after completion of a successful chore.
214 1,00 4,00 2,21 1,09
6. I loose control when I get angry. 214 1,00 4,00 2,27 1,15 7. I say whatever comes to my mouth when I am angry.
214 1,00 4,00 2,26 1,04
8. To be criticized in front of others annoy me. 214 1,00 4,00 2,68 1,07 9. When I get obstructed I feel like hitting someone.
214 1,00 4,00 2,30 1,15
10. I go mad after completing a successful chore if it is evaluated as bad.
214 1,00 4,00 2,16 1,07
In Table 2, the average results of the participants can be seen. As can be seen in the table, some statements were given as “always” and some were given as “never”. The statements which the students marked as “mostly” are “I instantly take part” ( = 2,28), “I get angry when others’ mistakes slow me down” ( = 2,58), and “To be criticized in front of others annoy me.” Students who answered “sometimes” are; “I get angry easily” ( = 1,98), “My anger is easily enlightened” ( = 1,95), “I get angry if a am not awarded after completion of a successful chore” ( = 2,21), “I lose control when I get angry” ( = 2,27), “I say whatever comes to my mouth when I am angry” ( = 2,26), “When I get obstructed I feel like hitting someone” ( = 2,30), and “I go mad after completing a successful chore if it is evaluated as bad” ( = 2,16). In Table 1, the average results can be seen of the participants. As can be seen in the table some statements were given as “always” and some were given as “never”. Students who answered as “mostly” are; “I can control my anger” ( = 2,57), “I show my anger” ( = 2,60), “I am patient towards others” ( = 2,59), “I protect my cold blooded features” ( =2,58), “I can control my behavior” ( =2,77), “I try to be out-going and understanding” ( =2,63), and “Whoever makes me angry, I tell them to their face” ( =2,52). Students who said “sometimes” to the statements are as follows; “I hide my anger” ( = 1, 93), “I frown or become miserable” ( = 2,09), “I say hurtful words to others” ( = 2,00), “I do things such as slamming doors” ( = 2,12), “I deeply get angry, but I don’t show it” ( = 2,10), “I argue with others” ( = 2,22), “I deeply have hatred which I don’t tell anybody” ( =1,85), “Whatever makes me go mad I attack it” ( =2,13), “I control my
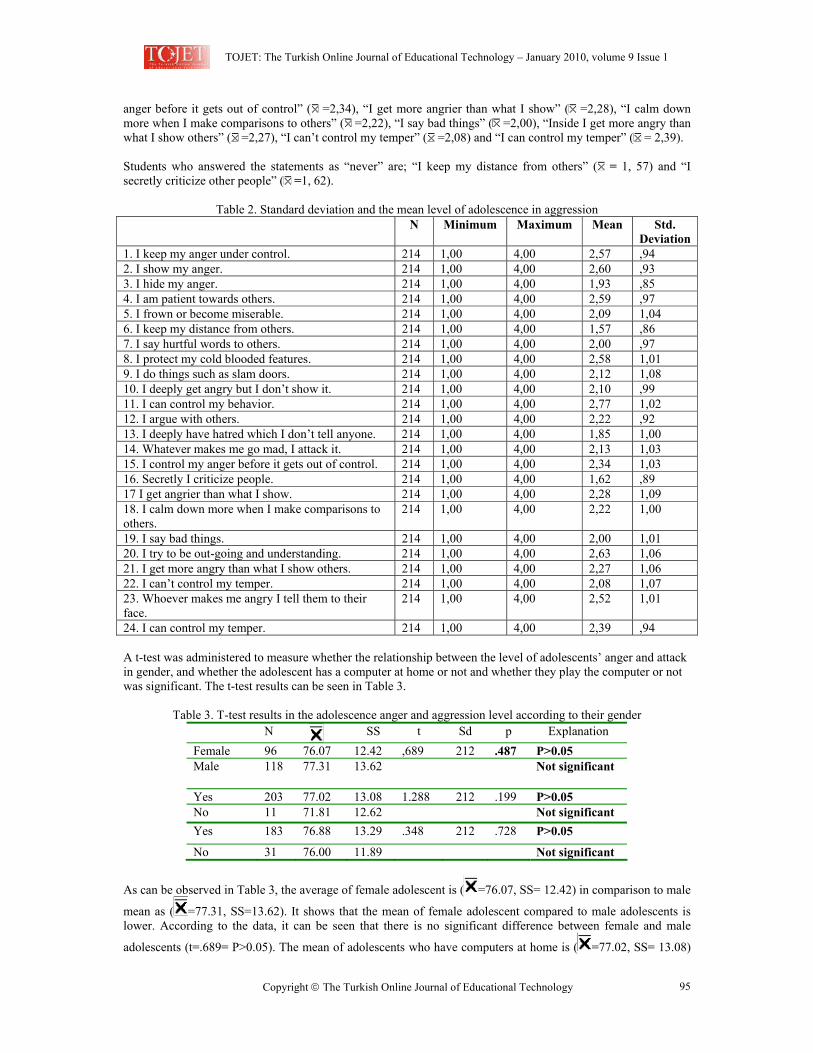
TOJET: The Turkish Online Journal of Educational Technology – January 2010, volume 9 Issue 1
Copyright The Turkish Online Journal of Educational Technology 95
anger before it gets out of control” ( =2,34), “I get more angrier than what I show” ( =2,28), “I calm down more when I make comparisons to others” ( =2,22), “I say bad things” ( =2,00), “Inside I get more angry than what I show others” ( =2,27), “I can’t control my temper” ( =2,08) and “I can control my temper” ( = 2,39). Students who answered the statements as “never” are; “I keep my distance from others” ( = 1, 57) and “I secretly criticize other people” ( =1, 62).
Table 2. Standard deviation and the mean level of adolescence in aggression N Minimum Maximum Mean Std.
Deviation 1. I keep my anger under control. 214 1,00 4,00 2,57 ,94 2. I show my anger. 214 1,00 4,00 2,60 ,93 3. I hide my anger. 214 1,00 4,00 1,93 ,85 4. I am patient towards others. 214 1,00 4,00 2,59 ,97 5. I frown or become miserable. 214 1,00 4,00 2,09 1,04 6. I keep my distance from others. 214 1,00 4,00 1,57 ,86 7. I say hurtful words to others. 214 1,00 4,00 2,00 ,97 8. I protect my cold blooded features. 214 1,00 4,00 2,58 1,01 9. I do things such as slam doors. 214 1,00 4,00 2,12 1,08 10. I deeply get angry but I don’t show it. 214 1,00 4,00 2,10 ,99 11. I can control my behavior. 214 1,00 4,00 2,77 1,02 12. I argue with others. 214 1,00 4,00 2,22 ,92 13. I deeply have hatred which I don’t tell anyone. 214 1,00 4,00 1,85 1,00 14. Whatever makes me go mad, I attack it. 214 1,00 4,00 2,13 1,03 15. I control my anger before it gets out of control. 214 1,00 4,00 2,34 1,03 16. Secretly I criticize people. 214 1,00 4,00 1,62 ,89 17 I get angrier than what I show. 214 1,00 4,00 2,28 1,09 18. I calm down more when I make comparisons to others.
214 1,00 4,00 2,22 1,00
19. I say bad things. 214 1,00 4,00 2,00 1,01 20. I try to be out-going and understanding. 214 1,00 4,00 2,63 1,06 21. I get more angry than what I show others. 214 1,00 4,00 2,27 1,06 22. I can’t control my temper. 214 1,00 4,00 2,08 1,07 23. Whoever makes me angry I tell them to their face.
214 1,00 4,00 2,52 1,01
24. I can control my temper. 214 1,00 4,00 2,39 ,94 A t-test was administered to measure whether the relationship between the level of adolescents’ anger and attack in gender, and whether the adolescent has a computer at home or not and whether they play the computer or not was significant. The t-test results can be seen in Table 3.
Table 3. T-test results in the adolescence anger and aggression level according to their gender N SS t Sd p Explanation
Female 96 76.07 12.42 ,689 212 .487 P>0.05 Male 118 77.31 13.62 Not significant
Yes 203 77.02 13.08 1.288 212 .199 P>0.05 No 11 71.81 12.62 Not significant Yes 183 76.88 13.29 .348 212 .728 P>0.05
No 31 76.00 11.89 Not significant
As can be observed in Table 3, the average of female adolescent is ( =76.07, SS= 12.42) in comparison to male
mean as ( =77.31, SS=13.62). It shows that the mean of female adolescent compared to male adolescents is lower. According to the data, it can be seen that there is no significant difference between female and male
adolescents (t=.689= P>0.05). The mean of adolescents who have computers at home is ( =77.02, SS= 13.08)
TOJET: The Turkish Online Journal of Educational Technology – January 2010, volume 9 Issue 1
Copyright The Turkish Online Journal of Educational Technology 96
and those who don’t have a computer at home is ( =71.81, SS=12.62). In terms of the relationship between the type of computer usage and frequency with regards to anger and aggression level, the results suggest that there is no significant difference between those adolescents that own and don’t own a computer (t=1.288= P>0.05). The
mean of adolescents who play computer games is ( =76.88, SS= 13.29), in comparison to those who don’t play
computer games as ( =76.00, SS=11.89). According to the given results of the data, it can be said that there is no statistically significant difference between those who play computer games to those who don’t play computer games (t=.348= P>0.05). CONCLUSION As a conclusion, it can be observed that technology is not only taking place in our social lives, but also in our educational lives too. It is a matter of fact that with the development of technology we can be defeated mentally and physically too. This can affect humans both in a negative and a positive way. The negative factors should be dealt with constructively and focus should be on the positive sides. From childhood to the adolescence, it is a very challenging and diverse period for those involved. In this period, they experience effects of adolescence in their social lives with family and friends together with their educational lives within their learning environments and classrooms. It is very difficult to challenge a growing and maturing person, so it’s not right to take a chance to be in control of them, but to make them feel that they are in control unconsciously. Therefore, the use of computer types and frequency among adolescences and its relationship with anger and aggression are important factors that must be taken into consideration. Seminars and meetings should be held to make the adolescent learner aware of what the pros and cons of playing computer games via home computers or through the internet are. REFERENCES Alantar, M. (1996), "Video game play and some personality traits of adolescents do not play in free time
activities comparison of assessment", Unpublished Ph.D. Thesis, Istanbul: Marmara University Social Sciences Institute.
Anderson, C.A. ve Ford, C.M. (1986), “ Affect of the game player: Short-term effects of highly and mildly aggressive video games.” Personality and Social Psychology Bulletin, 12(4), 290-402.
Baltas, A., Baltas, Z. (2004), Stress and Coping Ways, Istanbul: Remzi Bookstore. Baygöl, E. (1997), 'Adolescent Reactions of the examination of Anger', Unpublished Master Thesis, Uludag
University, Social Sciences Institute, Bursa. Berkowitz, L. (1965), ‘The concept of agressive drive: Some additional considerations’, Advances in
Experimental Social Psychology, c. 2. New York: Academic Press. Bernstein, D. A.; Clarke-Stewart, A.; Penner, L .A.; Roy, E.; Wickens, C.D. (2000), Psychology, 5.basım;
Houghton Mifflin Company, Boston, New York. Berson, I. Berson, M. (2003), Digital literacy for effective citizenship. Social Education. 67(3): 164-167. Bilgi,A. (2005), “Primary school level kids, some who play computer games and some who don’t. A research
about there agressive behaviour, depression and loneliness”, Unpublished Master Tehsis, İstanbul:Marmara University Social Science Institute.
Bridewell, B.W. ve E. Change. (1997). Distinguishing Between Anxiety, Depression and Hostility: Relations to Anger-in, Anger-out and Anger Control. Personal Individual Differences. 22 (4),587-590.
Budak, Selcuk. (2005), Dictionary of Psychology, Ankara: Science and Profession Publications. Calvert, S.L., ve Tan, S.L. (1994), “Impact of Virtual Reality on Young Adults’ Physiological Arousal and
Aggressive Thoughts: Interaction Versus Observation”, Journal of Applied Developmental Psychology, 15; 125-139.
Deffenbacher, J. L., Stark, R. S. (1992), ‘Relaxation and Cognitive Relaxation Treatments of General Anger’, Journal of Counseling Psychology, 39 (2): 158–167.
Doğan, FÖ. (2006), “Video games and children: violence in video games”,Symposium Journal, Ekim 2006. <http://psikiyatridizini.org/viewarticle.php?article_id=5610>, 3.06.2008
Funk, J. B., ve Buchman, D. D. (1995), “Video game controversies”, Pediatric Annals, 24, 91–94. Geçtan, E. (2004), Psychoanalysis and later, Metis Publications, Istanbul. Kirriemuir, J. (2002), “Video gaming, education and digital learning technologies”, D. Lib Magazine, 8(2),
Retrieved February, 25, 2003 from http://www.dlib.org/dlib/february02/kirriemuir/02kirriemuir.html, 2 February 2002
Kubey, R.W., Lavin, M.J., Barrows. JR. (2001), Internet use and collegiate academic performance decrements: Early findings. Journal of Communication, 366-382.
Kulaksızoğlu, A. (2002), The Psychology of Adolescence, 3rd edition, Istanbul: Remzi Bookstore.
TOJET: The Turkish Online Journal of Educational Technology – January 2010, volume 9 Issue 1
Copyright The Turkish Online Journal of Educational Technology 97
Kurfallı, H., (2005) "The Effect of Computer Games Education Activities". Gaziantep University Science Congress.
Lee, M-S., Ko, Y-H., Song, H-S., Kwon, K-H., Lee, H-S., Nam, M.& Jung, I-K.(2007).Characteristics of internet use in relation to game genre in Korean adolescents.CyberPsychology & Behavior, 10(2), 278-285.
Lerner, H. (2004), Dance of Anger, Istanbul: Heritage Publications. National Coalition on Television Violence(NCTV) (1990), “Nintendo Tainted by Extreme Violence”, NCTV
News, 11 ; 3-4. Mathews V, Kronenberger WG.,Wang Y.,Lurito JT,Lowe MJ,Dunn DW,(2005), “Media violence exposure and
frontol lobe activation measured by functional magnatic resonance imaging in aggressive adolescents”;29:287-292
Setzer, V.W. ve Duckett,G.E. (1994), “The risks to children using electronic games”, Retrieved April, 08, 2003 from http://www.ime.usp.br/~vwsetzer/video-g-risks.html, 12 June 2007
Shuerger, J. M. (1979), ‘Understanding and Controlling Anger’, Helping Clients with Special Concerns, Ed. Elsenberg S., Patterson, L. E. Boston: Houghton Mifflin Company, s.79–102.
Spielberger, C. D., Crane, R. S., Kearns, W. D. (1991), ‘Anger and anxiety in essential hypertension’, Stress and Emotion: Anxiety, Anger and Curiosity, 265–279.
Spielberger, C. D., Crane, R. S., Kearns, W. D. (1991), ‘Anger and anxiety in essential hypertension’, Stress and Emotion: Anxiety, Anger and Curiosity, 265–279.
Suhail, K., Bargees, Z. (2006), Effects of excessive internet use on undergraudate students in Pakistan. Cyber Psychol Behav, 9(3): 297-307.
Toksöz, MR (1999), "A new type of media as interactive computer games", Unpublished Master Thesis, Ankara: Ankara University Social Sciences Institute.
Yavuzer, H. (1998), Child Psychology, 16th publication, Istanbul: Remzi Bookstore. Yörükoğlu, A. (1998), Children's Mental Health, 22nd Publication, İstanbul: Özgür Publications.
TOJET: The Turkish Online Journal of Educational Technology – January 2010, volume 9 Issue 1
Copyright The Turkish Online Journal of Educational Technology 98
ICT IN VOCATIONAL AND TECHNICAL SCHOOLS: TEACHERS’ INSTRUCTIONAL, MANAGERIAL AND PERSONAL USE MATTERS
Filiz KUSKAYA MUMCU, Yasemin KOCAK USLUEL
Hacettepe University, Faculty of Education, Department of Computer Education and Instructional Technology, 06800 Beytepe-Ankara, TURKEY
[email protected], [email protected] ABSTRACT The focus of this study is to determine the teachers’ usage of Information and Communication Technologies (ICT) in vocational and technical schools in Turkey according to their age, level of education, opportunity of access to computers and ways of learning to use computers. Study group of the research was four hundred and sixteen teachers from vocational and technical schools in Turkey. Data were obtained a questionnaire which was designed by the researchers. One-way analysis of variance (ANOVA) was used to analyze the data. The results of the analysis reveal that teachers use ICT most frequently for managerial purposes, and the least for instructional purposes and there is a significant difference in teachers’ usage of ICT based on their ages, level of education, opportunity of access to computers, ways of learning to use computers. Level of education appears as the variable which has the greatest effect on teachers’ purposes of using ICT. Keywords: Teachers’ ICT Usage, Vocational and Technical Education, Purposes of ICT Usage INTRODUCTION It is a common acceptance, in accordance with the requirements of information age, providing educational support to the individuals in their growing, technology is an indispensable part of education. International standards can be seen as an indication of this common acceptance (ISTE, 2006). To this direction many governments have developed plans, in the late 1990s, to intensify their investments regarding ICT usage in education (Ping, Swe, Hew, Wong, and Shanti, 2003; Pelgrum, 2001). In Turkey, using information technologies in the field of education also started in 1984 with the establishment of “Specialization Committee on Computer Training in Secondary Education” by the Ministry of National Education (MONE) in Turkey. In order to promote the use of technology throughout the process of education and instruction, laboratories were established in schools, and in-service trainings were offered to teachers and administrative staff. Among the recommendations of the Commission first was teaching how to use computers to the students, then initiating computer training and computer-assisted education in upper secondary schools in 1985-1986, training teachers and enlarging the required systems to achieve these purposes. National and international projects have still been carried out by the central organization of the MONE so as to make ICT applications more widespread throughout the country. In Turkey most of the projects funded by foreign resources are supported by two main bodies: The World Bank and The European Union (EU) (Celik, 2003). The common objective of these projects and programs, whether they are World Bank-EU or local, carried out in Turkey is to develop the physical and equipment capacity of secondary education institutions and to improve the quality of education and training in consideration of changing needs of the individuals and society with the rapid developments in technology (MONE, 2003b. p. 66), and to make computer-assisted education and computer training more widespread. In addition to these projects, schools exert individual efforts to meet their own requirements; however, it is not possible to provide exact figures about their efforts. Vocational and Technical Education in Turkey In Turkey, secondary education is composed of general secondary schools, and vocational and technical secondary schools. However, the concept of vocational and technical education is used mostly to refer to vocational and technical secondary education. The rate of schooling in vocational and technical secondary education has increased 170 times since the proclamation of Republic in Turkey (MONE, 2001. p. 27). The MONE initiates the above mentioned projects which overwhelmingly focus on pre-service and in-service training for teachers to ensure teachers’ active involvement to the fulfillment of objectives. One of the decisions concerning vocational and technical education adopted in 16th National Education Council on 22-26 February 1999 was to train individuals who are able to recognize, implement and develop the evolving technologies (MONE, 2001).
TOJET: The Turkish Online Journal of Educational Technology – January 2010, volume 9 Issue 1
Copyright The Turkish Online Journal of Educational Technology 99
PROBLEM Despite of training and resources investments and important political supports made by governments, ICT usage in teaching and learning process is still insufficient (Gill and Dalgarno, 2008; Martin and Vallance, 2008; Dawson, Forster, and Reid, 2006). Namely, it is not only enough to talking about effect of technology on education. Because effect of technology on education is not a linear one, it was found out that teachers established their own premises and judgments in the usage of ICT in their classroom (Jedeskog & Nissen, 2004; Cope & Ward, 2002; Mumtaz, 2000). While the rapid changes are occurring in Turkey, the rapid development in ICT and multimedia alternatives provide a wide range of instructional opportunities for teachers. Though it is a complex and multidimensional issue how and when ICT should be used in education and instruction, Higgins (2004) suggests that the ways of using ICT by teachers result in differences in teaching and learning process. Hence, teachers’ purposes of using ICT in education pose an important problem (Braak, 2001). At this point, it is clear that teachers play a key role in using ICT effectively in the teaching and learning process. However studies showed that teachers don’t benefit from ICT in activities they developed in the classroom environment already and teachers’ ICT usage often remains on a personal level. Teachers cannot transfer their ICT usage from personal purposes to professional life, especially to instructional purposes (Holden, Ozok, and Rada, 2008; Usluel, Mumcu, and Demiraslan, 2007; Askar, Usluel and Mumcu, 2006). However, the researchers studied usage of ICT in teaching and learning process mostly focused on teachers (Muir-Herzig, 2004; Bucci, Copenhaver, Lehman, and O’Brien, 2003; Demetriatis, Barbas, Molohides, Palaigeorgiou, Psillos, Vlahavas, Tsoukalas, and Pombortsis, 2003; Loveless, 2003; Pelgrum, 2001). To receive expected output from ICT usage in learning, primarily depend upon the teachers’ awareness on ability, provided by ICT and regular usage of ICT in classroom activities (Demiraslan and Usluel, 2008; Muir-Herzig, 2004; Bucci et. al., 2003; Roblyer, 2003; Milliken and Barnes, 2002; Kennewell, 2001). The researchers have developed various points of views about the relation between education and technology. Szabo (2000) focuses on the technical and nontechnical aspects of the relation between education and technology. According to Szabo, using technologies such as software, hardware, telecommunication and digital instruction tools in education is the technical aspect of the problem whereas variables such as vision, objective, strategy, education and infrastructure concern its nontechnical aspect. Toots and Idnurm (2001) distinguish between direct and indirect relation between technology and education. In the basis of the indirect relation lies the conception that school is not a whole of classes, but a kind of miniature world which consists of teachers’ and students’ social attitudes and personal characteristics. The direct relation of ICT with the learning process is based on the need for using computers by teachers and students both in course preparations and in-class activities. Toots and Idnurm (2001) suggest that the criteria for measuring the direct relation are the frequency of using ICT and the development of the habit of using ICT-related information and skills. As for teachers, the focus of the problem is being able to use computers at a desirable and “actual” level in their professional tasks, and the requirement for computer skills and training for their tasks. Proulx and Campbell (1997) examine using computers in terms of task-related purposes, distinguishing between instructional purposes and other purposes whereas Szabo and Suen (1998) make a classification of instructional and non-instructional purposes. Usluel and Askar (2002) categorize teachers’ use of ICT for instructional and managerial tasks. These researches revealed that teachers have started to use ICT; however, they use these technologies overwhelmingly for managerial purposes, and that their using ICT in instructional tasks has not been sufficient yet. At this point, in regard to benefits of ICT usage in teaching and learning process how to make the teachers use ICT appears as an important issue (Bucci et. al., 2003; Loveless, 2003). Different researches showed that proper ICT usage in learning environment made development in students’ high level thinking skills (Muir-Herzig, 2004; O’Mahony, 2003; Ping et. al., 2003; Harun, 2001). Besides, teachers’ use of this wide range of alternatives depends on numerous variables. These variables may be personal ones such as their education level, age, experience, understanding or institutional ones such as the opportunities of access to resources and support from the management. And, this subsequently necessitates the closer look to the issue.
TOJET: The Turkish Online Journal of Educational Technology – January 2010, volume 9 Issue 1
Copyright The Turkish Online Journal of Educational Technology 100
This study focuses on the use of ICT by teachers, adopting an approach which deals with the direct relation between education and technology. To this end, teachers’ purposes of using ICT, and the relations between their purpose and some variables were examined. Teachers’ ICT using purposes were categorized as instructional, managerial and personal purposes.
• Instructional purposes: Teachers’ instructional ICT using purposes are divided into two as out-class and in-class uses of ICT. Out-class uses involve preparation for the course, preparation of handouts and search the Internet for the course content whereas among the in-class tasks are using instructional software during the course, making presentations, carrying out the tasks in laboratories or workshops and experimenting.
• Managerial purposes: Managerial purposes are using ICT for preparing course plans as well as monthly and annual plans, preparing examinations and for official correspondence.
• Personal purposes: Among the personal purposes is personal communication, chatting, surfing through the Internet, preparing and storing personal information and files.
In this study the response to the following question was sought for: ‘ Does the teachers’ ICT usage in vocational and technical schools differ by their ages, level of education, opportunity of access to computers, ways of learning to use computers? Does the difference make significant effects on purposes of ICT usage?’ METHODOLOGY Research Group The research group is composed of 416 teachers from Ankara, the capital of Turkey. These teachers work in 8 vocational and technical schools in Cankaya, one of eight central districts in Ankara. 68.8 percent of the research group is female teachers whereas 31.2 percent are male teachers. The age groups of teachers are categorized as follows: 10.6 percent between 20 and 29, 40.9 percent between 30 and 39, 41.8 percent between 40 and 49 and 6.7 percent between 50 and 59. As for their years of experience, 10.1 percent of the teachers have been working for 1-5 years, 17.8 percent for 6-10 years, 28.6 percent for 11-15 years and 19.7 percent for 16-20 years. Collection and Analysis of the Data The data were collected by Mumcu (2004) through a questionnaire which was originally used for her master’s thesis. The questionnaire consists of three parts. First part consists of demographic questions, second part consists of questions about using computers and third part consists of questions about purposes of using computers. There are 7 questions about demographic features of teachers (age, gender, year of experience, etc.), 5 questions about using ICT (period of using ICT, opportunities of access to computers, how they learned to use ICT, etc.) and a total of 10 questions about the purposes of using ICT (4 questions about using ITC for instructional purposes, 3 questions for managerial purposes and 3 questions for personal purposes). In these questions 3-likert type scale was used and the points of the choices were as follows: I mostly use (3), I sometimes use (2) and I never use (1). The tasks concerning instructional purposes were coded respectively as I1, I2, I3, I4; managerial tasks as M1, M2 and M3; and personal tasks as P1, P2 and P3. Instructional Purposes:
• I1: preparation for the course, preparation of handouts and search the Internet to find additional information about the course content
• I2: using instructional software for the lecture, repetition of the subjects, reinforcing students’ understanding of the subjects, exercising
• I3: making presentations during the course • I4: carrying out the tasks in laboratories or workshops and experimenting
Managerial Purposes:
• M1: preparing course plans as well as monthly and annual plans, preparing examinations, and for official correspondence
• M2: preparing the exam questions, making exams and organizing the grades of students • M3: making and storing official correspondence
TOJET: The Turkish Online Journal of Educational Technology – January 2010, volume 9 Issue 1
Copyright The Turkish Online Journal of Educational Technology 101
Personal Purposes: • P1: chatting and being in contact with friends (e-mail, ICQ, etc.) • P2: preparing and storing personal information and files • P3: surfing through the Internet for fun
Frequency, percentile distribution and one-way analysis of variance (ANOVA) were used for the analysis of the data in view of the objective of the research. For ANOVA, probability of type-1 error (significance level) is set α=0.05. The grading used for analysis of variance is as follows: I mostly use (3), I sometimes use (2) and I never use (1). Scheffe test was applied to find out among which groups are the difference in means. In addition, Eta (η) coefficient was used to measure the effect size. DATA ANALYSIS AND FINDINGS The analysis of the data reveals that 71.8 percent of the teachers use ICT. 20 percent of the teachers stated that they never had computer education and did not use computers whereas nearly half of them (41.1 percent) mentioned that they had recently started to use computers (1-3 years). The rate of teachers who stated that they had been using computers more than 10 years is merely 13.5 percent. 2 percent of them mentioned that they met computers; however, they did not use them, and it is assumed that these teachers are at the beginner level as computer users. Most teachers have access to computers in their homes (66.4 percent) whereas 5.6 percent of the teachers stated that they had no opportunity of access to computers. Nearly half of the teachers (45.9 percent) said that they learned to use computers in in-service trainings. This rate is followed by the ones who learned by their own efforts (38.7 percent) and who learned it at the university (15.4 percent). In addition, 1.7 percent of the teachers stated they had elective computer courses in upper secondary school, a one teacher stated s/he learned it when working in a data processing centre. Comparing the purposes of using ICT, it is found out that teachers mostly use ICT for managerial purposes and the least for instructional purposes. For managerial purposes, teachers mostly use ICT in preparing exam questions (44.3 percent) and the least in official correspondence (37.3 percent). For personal purposes, teachers mostly use ICT in preparing their personal files, and the least for Internet (17.4 percent) and e-mail (17.4 percent). For instructional purposes, teachers mostly use ICT in preparation stages of the course (25.4 percent) and the least for making a presentation in the classroom. It is found out that teachers’ use of ICT for in-class activities (I2, I3, and I4) is less than their uses for out-class activities (I1). In the study of technology and its effects on classroom, Muir-Herzig has found out that most of the teachers, in fact, use the ICT for instructional purposes, in the out of classroom implementations. 1. Age ANOVA analysis was used to find out whether there is a significant difference between age and teachers’ use of ICT for instructional, managerial and personal purposes. The results of the ANOVA are illustrated in Table 1.
Table 1. One-way ANOVA Results for Comparison of ICT Usage Means, by Age
Variable Purpose of Use Groups X S.D. F3,400 P Scheffe 20-29 (1) 6,977 ,331 30-39 (2) 6,078 ,170 40-49 (3) 5,435 ,168 Instructional
50-59 (4) 4,929 ,415
8,109 ,000 1a, 2a,b, 3b, 4b
20-29 (1) 6,932 ,342 30-39 (2) 6,377 ,176 40-49 (3) 5,852 ,175 Managerial
50-59 (4) 4,857 ,429
6,267 ,000 1a, 2a, 3a,b, 4b
20-29 (1) 6,432 ,286
Age
Personal 30-39 (2) 5,665 ,147
12,542 ,000 1a, 2a,b, 3b,c, 4c
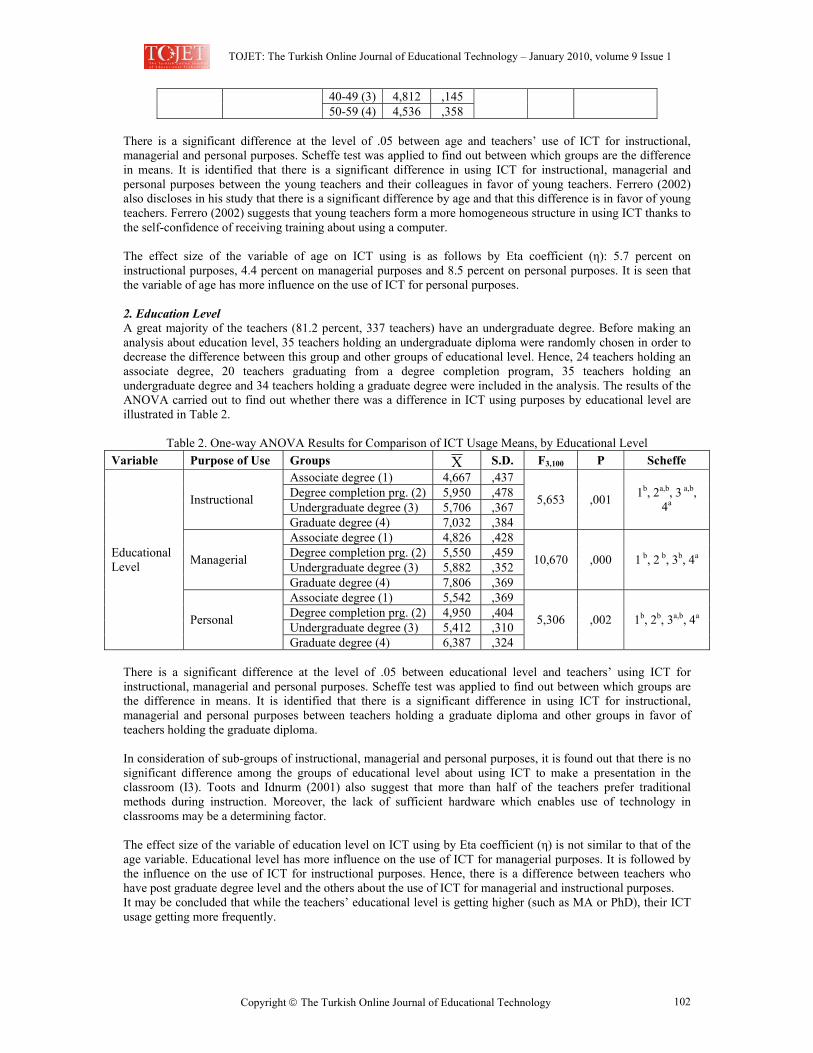
TOJET: The Turkish Online Journal of Educational Technology – January 2010, volume 9 Issue 1
Copyright The Turkish Online Journal of Educational Technology 102
40-49 (3) 4,812 ,145 50-59 (4) 4,536 ,358
There is a significant difference at the level of .05 between age and teachers’ use of ICT for instructional, managerial and personal purposes. Scheffe test was applied to find out between which groups are the difference in means. It is identified that there is a significant difference in using ICT for instructional, managerial and personal purposes between the young teachers and their colleagues in favor of young teachers. Ferrero (2002) also discloses in his study that there is a significant difference by age and that this difference is in favor of young teachers. Ferrero (2002) suggests that young teachers form a more homogeneous structure in using ICT thanks to the self-confidence of receiving training about using a computer. The effect size of the variable of age on ICT using is as follows by Eta coefficient (η): 5.7 percent on instructional purposes, 4.4 percent on managerial purposes and 8.5 percent on personal purposes. It is seen that the variable of age has more influence on the use of ICT for personal purposes. 2. Education Level A great majority of the teachers (81.2 percent, 337 teachers) have an undergraduate degree. Before making an analysis about education level, 35 teachers holding an undergraduate diploma were randomly chosen in order to decrease the difference between this group and other groups of educational level. Hence, 24 teachers holding an associate degree, 20 teachers graduating from a degree completion program, 35 teachers holding an undergraduate degree and 34 teachers holding a graduate degree were included in the analysis. The results of the ANOVA carried out to find out whether there was a difference in ICT using purposes by educational level are illustrated in Table 2.
Table 2. One-way ANOVA Results for Comparison of ICT Usage Means, by Educational Level
Variable Purpose of Use Groups X S.D. F3,100 P Scheffe Associate degree (1) 4,667 ,437 Degree completion prg. (2) 5,950 ,478 Undergraduate degree (3) 5,706 ,367 Instructional
Graduate degree (4) 7,032 ,384
5,653 ,001 1b, 2a,b, 3 a,b, 4a
Associate degree (1) 4,826 ,428 Degree completion prg. (2) 5,550 ,459 Undergraduate degree (3) 5,882 ,352 Managerial
Graduate degree (4) 7,806 ,369
10,670 ,000 1 b, 2 b, 3b, 4a
Associate degree (1) 5,542 ,369 Degree completion prg. (2) 4,950 ,404 Undergraduate degree (3) 5,412 ,310
Educational Level
Personal
Graduate degree (4) 6,387 ,324
5,306 ,002 1b, 2b, 3a,b, 4a
There is a significant difference at the level of .05 between educational level and teachers’ using ICT for instructional, managerial and personal purposes. Scheffe test was applied to find out between which groups are the difference in means. It is identified that there is a significant difference in using ICT for instructional, managerial and personal purposes between teachers holding a graduate diploma and other groups in favor of teachers holding the graduate diploma. In consideration of sub-groups of instructional, managerial and personal purposes, it is found out that there is no significant difference among the groups of educational level about using ICT to make a presentation in the classroom (I3). Toots and Idnurm (2001) also suggest that more than half of the teachers prefer traditional methods during instruction. Moreover, the lack of sufficient hardware which enables use of technology in classrooms may be a determining factor. The effect size of the variable of education level on ICT using by Eta coefficient (η) is not similar to that of the age variable. Educational level has more influence on the use of ICT for managerial purposes. It is followed by the influence on the use of ICT for instructional purposes. Hence, there is a difference between teachers who have post graduate degree level and the others about the use of ICT for managerial and instructional purposes. It may be concluded that while the teachers’ educational level is getting higher (such as MA or PhD), their ICT usage getting more frequently.
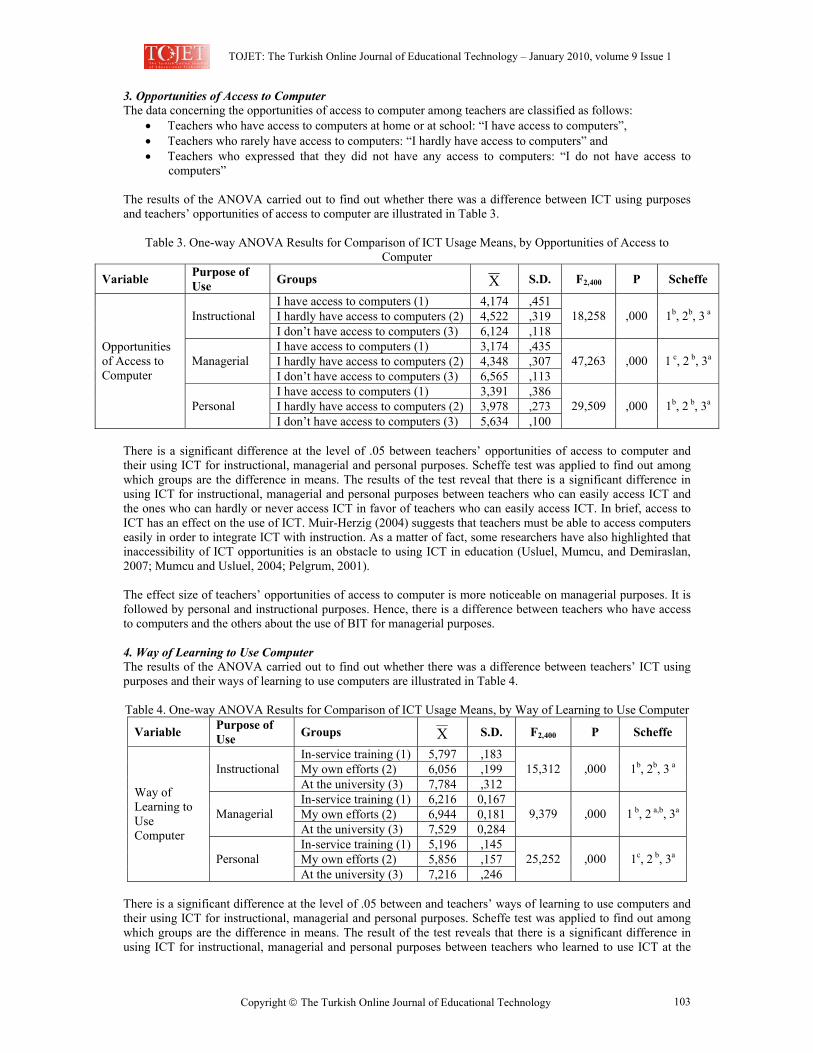
TOJET: The Turkish Online Journal of Educational Technology – January 2010, volume 9 Issue 1
Copyright The Turkish Online Journal of Educational Technology 103
3. Opportunities of Access to Computer The data concerning the opportunities of access to computer among teachers are classified as follows:
• Teachers who have access to computers at home or at school: “I have access to computers”, • Teachers who rarely have access to computers: “I hardly have access to computers” and • Teachers who expressed that they did not have any access to computers: “I do not have access to
computers” The results of the ANOVA carried out to find out whether there was a difference between ICT using purposes and teachers’ opportunities of access to computer are illustrated in Table 3.
Table 3. One-way ANOVA Results for Comparison of ICT Usage Means, by Opportunities of Access to
Computer
Variable Purpose of Use Groups X S.D. F2,400 P Scheffe
I have access to computers (1) 4,174 ,451 I hardly have access to computers (2) 4,522 ,319 Instructional I don’t have access to computers (3) 6,124 ,118
18,258 ,000 1b, 2b, 3 a
I have access to computers (1) 3,174 ,435 I hardly have access to computers (2) 4,348 ,307 Managerial I don’t have access to computers (3) 6,565 ,113
47,263 ,000 1 c, 2 b, 3a
I have access to computers (1) 3,391 ,386 I hardly have access to computers (2) 3,978 ,273
Opportunities of Access to Computer
Personal I don’t have access to computers (3) 5,634 ,100
29,509 ,000 1b, 2 b, 3a
There is a significant difference at the level of .05 between teachers’ opportunities of access to computer and their using ICT for instructional, managerial and personal purposes. Scheffe test was applied to find out among which groups are the difference in means. The results of the test reveal that there is a significant difference in using ICT for instructional, managerial and personal purposes between teachers who can easily access ICT and the ones who can hardly or never access ICT in favor of teachers who can easily access ICT. In brief, access to ICT has an effect on the use of ICT. Muir-Herzig (2004) suggests that teachers must be able to access computers easily in order to integrate ICT with instruction. As a matter of fact, some researchers have also highlighted that inaccessibility of ICT opportunities is an obstacle to using ICT in education (Usluel, Mumcu, and Demiraslan, 2007; Mumcu and Usluel, 2004; Pelgrum, 2001). The effect size of teachers’ opportunities of access to computer is more noticeable on managerial purposes. It is followed by personal and instructional purposes. Hence, there is a difference between teachers who have access to computers and the others about the use of BIT for managerial purposes. 4. Way of Learning to Use Computer The results of the ANOVA carried out to find out whether there was a difference between teachers’ ICT using purposes and their ways of learning to use computers are illustrated in Table 4. Table 4. One-way ANOVA Results for Comparison of ICT Usage Means, by Way of Learning to Use Computer
Variable Purpose of Use Groups X S.D. F2,400 P Scheffe
In-service training (1) 5,797 ,183 My own efforts (2) 6,056 ,199 Instructional At the university (3) 7,784 ,312
15,312 ,000 1b, 2b, 3 a
In-service training (1) 6,216 0,167 My own efforts (2) 6,944 0,181 Managerial At the university (3) 7,529 0,284
9,379 ,000 1 b, 2 a,b, 3a
In-service training (1) 5,196 ,145 My own efforts (2) 5,856 ,157
Way of Learning to Use Computer
Personal At the university (3) 7,216 ,246
25,252 ,000 1c, 2 b, 3a
There is a significant difference at the level of .05 between and teachers’ ways of learning to use computers and their using ICT for instructional, managerial and personal purposes. Scheffe test was applied to find out among which groups are the difference in means. The result of the test reveals that there is a significant difference in using ICT for instructional, managerial and personal purposes between teachers who learned to use ICT at the
TOJET: The Turkish Online Journal of Educational Technology – January 2010, volume 9 Issue 1
Copyright The Turkish Online Journal of Educational Technology 104
university and the ones who learned it in in-service trainings or by their own efforts in favor of teachers learned it at the university. In consideration of sub-groups of instructional, managerial and personal purposes, it is found out that there is no significant difference between the teachers who learned it at the university and the ones who learned it by their own efforts about using ICT for M2, M3 and P2. The way of learning to use computers has more influence on the use of ICT for personal purposes. It is followed by the influence on the use of ICT for instructional purposes. CONCLUSION The results of the analysis reveal that teachers use ICT most frequently for managerial purposes, and the least for instructional purposes and there is a significant difference in teachers’ usage of ICT based on their ages, level of education, opportunity of access to computers, ways of learning to use computers. However, it is remarkable that teachers’ use of ICT for in-class activities is less frequent than their use of it for out-class activities. In short, it can be concluded that teachers are not able to integrate ICT into teaching and learning process yet. The integration of ICT into teaching and learning process is a multidimensional and complex process which requires both equipment and skills; however, it is undeniable that teachers play a significant role in this process. Briefly, as the age of teachers increases, their use of ICT for instructional, managerial and personal purposes decreases; and as their educational level increases, their use of ICT for these purposes increases. In addition to this, the easier teachers’ access to ICT, the more they use ICT. It can be said that teachers’ opportunities of access to computers influence their use of ICT. It is expected that “A Notebook Computer for Every Teacher Project” which was initiated by the MONE in 2005 and still continues will have positive effects on our education system, contributing to technology ownership among teachers. Although, having ability to access ICT does not mean effective use of ICT in teaching-learning process. The teachers who learned to use ICT at the university use ICT for instructional, managerial and personal purposes more than the ones who learned it in in-service trainings or by their own efforts. The teachers who learned to use computers in-service trainings use ICT for instructional, managerial and personal purposes less than other teachers. Hence, it is recommended that the content, structure and functioning of in-service trainings have to revised. When organizing the content of in-service trainings, it should be kept in mind that in-service trainings must focus on technology literacy and that the most significant objective of in-service training is to ensure the use of ICT for instructional purposes in order to assure the integration of ICT teaching-learning processes. The use of technology for in-class activities is of primary importance in using ICT for instructional purposes. Furthermore, taking into consideration that the teachers who learned to use ICT at the university use ICT more than their colleagues, it can be concluded that the content of the programs of teacher training institutions have to be revised. Researchers say training teachers in ICT is a continuing process (Muir-Herzig, 2004; Ping et. al., 2003). Demetriatis et. al. (2003) indicate that although teachers express considerable interest in learning how to use technology they need consistent support and extensive training in order to consider themselves able for integrating ICT into their instructional practice. Balanskat, Blamire and Kefala (2006) expressed that poor ICT skills, low motivation and lack of confidence to use new technologies in teaching are the most important barriers to teachers’ ICT usage for instructional purposes. According to authors, especially these three barriers are directly related to prospective teachers’ education program and in-service training program of teachers. Consequently, there is no single or simple solution for using ICT effectively in education and instruction (Higgins, 2004). However, it is certain that teachers have to develop new technical and pedagogical skills. Teachers have to be prepared to adopt new technologies. Technology may become a distinctive tool in education when it integrates into teaching-learning. However, it is certain that education and time are required to use ICT as an effective instructional method (Muir-Herzig, 2004). When the investments made on ICT usage in education and the implemented projects -in terms of numbers, magnitude and their objectives-, are considered; to make effective use of projects, ability for the continuous access to the ICT, pre-service and in-service training should be provided to the students and teachers respectively.
TOJET: The Turkish Online Journal of Educational Technology – January 2010, volume 9 Issue 1
Copyright The Turkish Online Journal of Educational Technology 105
REFERENCES Askar, P., Usluel, Y. K., and Mumcu F. K. (2006) Logistic regression modeling for predicting task-related ICT
use in teaching, Educational Technology & Society, 9(2), 141-151. Balanskat, A., Blamire, R., and Kefala, S. (2006) The ICT Impact Report: A Review of Studies of ICT Impact on
Schools in Europe, European Schoolnet Available online: http://ec.europa.eu/education/pdf/doc254_en.pdf (accessed 14 October 2008).
Braak, J. V. (2001) Factors influencing the use of computer mediated communication by teachers in secondary schools, Computers & Education, 36, 41-57.
Bucci, T. T., Copenhaver, LJ, Lehman, B, and O’Brien, T (2003) Technology integration: Connections to educational theories, Contemporary Issues in Technology and Teacher Education, 3(1), 30-46.
Celik, S. (2003) Projects originating from foreign in vocational and technical education in Turkey. Paper presented at the Ankara University IVETA Regional Conference, 20-22 October, Ankara, Turkey (in Turkish).
Cope, C. and Ward, P. (2002) Integrating learning technology into classrooms: The importance of techers’ perceptions, Educational Technology & Society, 5(1), 67-70.
Dawson, V., Forster, P., and Reid, D. (2006) ICT integration a science education unit for preservice science teachers; students’ perceptions of their ICT skills, knowledge and pedagogy, International Journal of Science and Mathematics Education, 4, 345–363.
Demetriatis, S., Barbas, A., Molohides, A., Palaigeorgiou, G., Psillos, D., Vlahavas, I., Tsoukalas, I., and Pombortsis, A. (2003) “Cultures in negotiation”: Teachers’ acceptance/resistance attitudes considering the infusion of technology into schools, Computers & Education, 41, 19-37.
Demiraslan, Y. and Usluel, Y. K. (2008) ICT integration processes in Turkish schools: Using activity theory to study issues and contradictions, Australasian Journal of Educational Technology, 24(4), 458-474.
Dogan, M. (2000) Educate vocational and technical education teachers. In Coskun, H (eds). Teaching profession, CBT Publications, Ankara, Turkey (in Turkish).
Ferrero, S. (2002) Two generations of teacher: Differences in attitudes towards ICT Available online: http://www.emile.eu.org/papers/I3-Teachers-Generation.pdf (accessed 14 March 2004).
Gill, L. and Dalgarno, B. (2008) Influences on pre-service teachers’ preparedness to use ICTs in the classroom. In Hello! Where are you in the landscape of educational technology? Proceedings ascilite Melbourne 2008 Available online: http://www.ascilite.org.au/conferences/melbourne08/procs/gill.pdf (accessed 27 January 2009).
Harun, M. H. (2001) Integrating e-Learning into the workplace, Internet and Higher Education, 4 (3&4), 301-310.
Higgins, S. (2004) Does ICT improve learning and teaching in schools? Available online: http://www.bera.ac.uk/publications/pdfs/ICT%20PUR%20MB%20r-f-p%201Aug03.pdf (accessed 10 May 2004).
Holden, H., Ozok, A. A. and Rada, R. (2008) Technology use and perceptions in the classroom: Results from an exploratory study among secondary education teachers, Interactive Technology and Smart Education, 5(2), 113-134.
ISTE (2006) National Educational Technology Standards for Students Available online: http://cnets.iste.org/students/s_stands.html (accessed 11 July 2006).
Jedeskog, G. and Nissen, J. (2004) ICT in the classroom: Is doing more important than knowing?, Education and Information Technologies, 9(1), 37-45.
Kennewell, S. (2001) Using affordances and constraints to evaluate the use of information and communications technology in teaching and learning, Journal of Information Technology for Teacher Education, 10 (1&2), 101-116.
Loveless, A. M. (2003) The interaction between primary teachers’ perceptions of ICT and their pedagogy, Education and Information Technologies, 8 (4), 313-326.
Martin, S. and Vallance, M. (2008) The impact of synchronous inter-networked teacher training in information and communication technology integration, Computers and Education, 51(1), 34-53.
Milliken, J. and Barnes, L. P. (2002) Teaching and technology in higher education: student perceptions and personal reflections, Computers & Education, 39(3), 207-317.
MONE (2001) National education at the beginning of 2002, MONE Publications, Ankara, Turkey (in Turkish). MONE (2003a) The report regarding MONE budget in Turkish Grand National Assembly (TGNA) General
Assembly, MONE Publications, Ankara, Turkey (in Turkish). MONE (2003b) The report regarding budget bill of 2004 fiscal year, MONE Publications, Ankara, Turkey (in
Turkish). Muir-Herzig, R. G. (2004) Technology and its impact in the classroom, Computers & Education, 42(2), 111-131. Mumcu, F. K. (2004) Diffusion of Information and Communication Technologies in Vocational and Technical
Schools, MS Thesis, Hacettepe University, Turkey (in Turkish).
TOJET: The Turkish Online Journal of Educational Technology – January 2010, volume 9 Issue 1
Copyright The Turkish Online Journal of Educational Technology 106
Mumcu, F. K. and Usluel, Y. K. (2004) Usage of computers by vocational and technical schools’ teachers and obstacles, Hacettepe University Journal of Faculty of Education, 26, 91-100 (in Turkish).
Mumtaz, S. (2000) Factors affecting teachers’ use of Information and Communications Technology: A review of the literature, Journal of Information Technology for Teacher Education, 9 (3), 319-333.
O’Mahony, C. (2003) Getting the information and communications technology formula right: access + ability = confident use, Technology, Pedagogy and Education, 12 (2), 295-311.
Pelgrum, W. J. (2001) Obstacles to the integration of ICT in education: Results from a worldwide educational assessment, Computers & Education, 37, 163-178.
Ping, L. C., Swe, K. M., Hew, T., Wong, P., and Shanti, D. (2003) Exploring critical aspects of information technologies integration in Singapore schools, Australian Journal of Educational Technology, 19 (1), 1-24.
Proulx, M. and Campbell, B. (1997) The professional practices of faculty and the diffusion of computer technologies in university teaching, Electronic Journal of Sociology, March.
Roblyer, M. D. (2003) Integrating Educational Technology into Teaching (3rd ed), New Jersey: Merrill Prentice Hall.
Szabo, M. and Suen, C. (1998) A Study of the Impact of A School District Computer Technology Program on Adoption of Educational Technology. Available online: http://www.quasar.ualberta.ca/edmedia/readingsnc/suen.html (accessed 10 January 2002).
Szabo, M. (2000) Technical and non-technical aspects of computer based instruction. Paper presented at the Information Technology in the Social Sciences Symposium, June, Baptist University, Hong Kong.
Simsek, A. (1999) Reconstructing Vocational and Technical Education in Turkey, TÜSİAD publications, TÜSİAD-T/99-2/252, Istanbul, Turkey (in Turkish).
Toots, A and Idnurm, T. (2001) Tiger under Magnifying Glass: Study on ICT in Estonian Schools in 2000. Available online: http://www.tiigrihype.ee/eng/publikatsioonid/tiigerluup_eng/tiigerluup_eng.html (accessed 01 September 2003).
Union of Metal Industrialist (UMI) (1999) Vocational Education and Training on The Threshold of Millennium, UMI Publications, ISBN 975-7152-64-1, Istanbul, Turkey (in Turkish).
Usluel, Y. and Askar, P. (2002) Teachers’ computer usage. Paper presented at the METU BTIE Conference, 20-22 May, Ankara, Turkey.
Usluel, Y. K., Mumcu, F. K., and Demiraslan Y. (2007) ICT in the learning and teaching process: Teachers’ views on the integration and obstacles, Hacettepe University Journal of Faculty of Education, 32, 164-179 (in Turkish).
VOTERDEC (1999) Evaluation of computer laboratories’ activity in vocational and technical schools, MONE Publications, Ankara, Turkey (in Turkish).
TOJET: The Turkish Online Journal of Educational Technology – January 2010, volume 9 Issue 1
Copyright The Turkish Online Journal of Educational Technology 107
INTEGRATION OF THE INTERNET INTO A LANGUAGE CURRICULUM IN A MULTICULTURAL SOCIETY
Dr. Songül KILIMCI
Cukurova University, Adana, Turkey [email protected]
ABSTRACT The rapid growth of the Internet, the global collection of interconnected computer networks, is both stimulative and instructive. The Internet has become one of the most powerful resources in accessing information. It is used for entertainment, sharing items, collecting and analyzing data, conducting interviews, chating, downloading, and so on as well as education. Among the users of the internet, there are the educational researchers who try to enhance exploring of this rich resource. Using the Internet in language teaching has been practiced for a while. Exploiting videoconferencing for teaching the language online, on the other hand, is relatively a new and exciting innovation in education. Using such tools as the skype or msn allows people or groups of individuals to see each other and talk to one another over the internet without a long distance telephone charge as well. It is almost inevitable to ignore the necessity of the Internet in educating the new generation who utilize it in every aspect of their life. In other words, technology lets us teach all the four skills –reading, writing, listening and speaking- simultaneously. This paper presents some examples on how language teaching practiced online at Uppsala University in Sweden with the students from different parts of the world and the importance of the integration of the Internet into the curriculum in such a multicultural society. Key Words: Distant Learning, Distant Teaching, Internet, Teaching Language, Multicultural education INTRODUCTION This paper is about education in a multicultural environment and integration of the Internet into the curriculum, one of the ways to achieve multicultural communication and understanding. World is a country where many diverse populations live together. Although each nationality has its own language, culture, tradition, life style, habits and so on, the world is the hometown for all the humanity. The citizens in the world are all the same and all different. The difference and sameness in a multicultural virtual classroom can be an advantage when learning and teaching a language. Bullivant (1987) defines culture as a group’s program for survival in and adaptation to its environment. The cultural program consists of knowledge, concepts, and values shared by group members through systems of communication. Culture also consists of shared beliefs, symbols, and interpretations within a human group. The key to defining multicultural education lies in the root word culture because everyone is born into a culture. Our experiences in life shape the beliefs that derive from ethnic and family backgrounds. As Tiedt and Tiedt (1990) state, multicultural education aims at awareness of the diversity that is characteristic of a national population and the source of that diversity.
Banks and Banks (2007) define multicultural education as at least three things: an idea or concept, an educational reform movement, and a process whose major goal is to change the structure of educational institutions. The goal is that male and female students, exceptional students, and students who are members of diverse racial, ethnic, and cultural groups will have an equal chance to achieve academically in school. As Carlson and Rabo (2007) discuss, Multiculturalism is a term used normatively to express important liberal and humanitarian values where difference is celebrated. Difference considered contributing to the richness of society and even to the development of global understanding. All the societies are multicultural and some see the multicultural society as a threat to the unity, and cohesion of the nation, while others see it as a recipe for solving various problems in societies.
In the same year as Carlson and Rabo, Banks and Banks (2007) discuss the vagueness of this term and claim that:
“Multicultural education is a process whose goals will never be fully realized. Educational equality, like liberty and justice, are ideals toward which human beings work but never fully attain. Racism, sexism, and discrimination will exist to some extent no matter how hard we work to eliminate these problems. When prejudice and discrimination are reduced toward one group, they are usually directed toward another group or they take new forms” (p.4).
Banks and Banks (2007) also claim that it is impossible to attain the goals of multicultural education, which requires continuous effort to increase educational equality for all students.
TOJET: The Turkish Online Journal of Educational Technology – January 2010, volume 9 Issue 1
Copyright The Turkish Online Journal of Educational Technology 108
Schools inevitably reflect society. Students born in the 21st century are crazy about using technology and recently attention has turned to integrating technology into the curriculum. Wallace (2004) lays out the possibilities for teaching with the Internet such as using it as a source of information, a means of representing content, a means of communication, or a site for collaboration.
The Internet in Education The Internet, together with its merits and defects, is widely questioned. It is criticized because it is claimed to depict various technological developments, such as electronic databases, computerized searches, and surveillance instruments, and so is seen as a threat to privacy (Etzioni, 2007). Although disputed to be a privacy-invading technology, the Internet is also valued for several conveniences it provides.
A report by National Center for Education Statistics - NCES (1998) presented that the use of the Internet in education is continually increasing. In just 3 years, the percentage of U.S. public schools with Internet access increased from 35 percent in 1994 to 78 percent in 1997. The same report concluded the advantages of using the Internet in education as such: The increased availability of Internet opportunities would enable teachers and administrators to employ the technology in many different ways, including record keeping, communicating with parents, distance learning, professional development, curriculum development, and as a classroom-teaching tool. Another report by NCES (1999a) makes it clear that the traditional teaching method, which was conceptualized as the transmission of facts to students, who are seen as passive receptors, still seems to be regarded as safer. In classrooms where this type of teaching predominates, teachers typically conduct lessons through a lecture format, instruct the entire class as a unit, write notes on the chalkboard, and pass out worksheets for students to complete. In such classrooms, knowledge is presented as fact. On the other hand, in educational endeavors where students are encouraged to pose hypotheses and explore ways to test them, students “construct” a new understanding of subject matter. Constructivism advocates innovative instruction, which in return requires the use of educational technology. The survey in the U.S revealed that 80% of teachers did not feel well prepared to use educational technology in their teaching (National Center for Education Statistics, 1999a). However, a further study demonstrated that small percentages of students in equipped classrooms spent significant instructional time per week on the computer (National Center for Education Statistics, 1999b). The comparison of these three surveys makes it clear that the Internet is regarded as important and necessary to keep pace with Information and Communication Technology. A recent survey on “educational technology in teacher education programs for initial licensure”, raised from this need, suggests that while institutions with teacher education programs for initial licensure were oriented toward preparing their teacher candidates to use educational technology, many reported a range of barriers that impeded these efforts within both program coursework and field experiences (National Center for Education Statistics, 2007). The teachers’ not being equipped with enough information on how to use the Internet in teaching and learning efficiently puts forward the need for the use of the Internet in the didactics in teacher training curriculum, which will be discussed in detail in a further study. Researchers (Chapelle 1998, Wallace 2004, Koeber 2005) have demonstrated several strategies for using Information and Communication Technology to ease learning and teaching in classrooms. They all suggested so-called Computer Assisted Language Learning (CALL) to provide the researchers with detailed information about learners' interactions and performance. These technical capacities for collecting interaction data need to be accompanied by well-motivated procedures for describing and interpreting them in terms of their value for language development (Chapelle, 1998). Recently the route of the discussions changed from the focus on using computers in the classroom to the focus on e-learning (Wallace, 2004; Koeber, 2005; Oh, 2003). Wallace (2004) in his paper entitled “A framework for Understanding Teaching with the Internet” investigated how teachers use their knowledge and skills to engage students with content through the medium of the Internet. In his paper, he points out that teaching with the Internet is a complex endeavor that varies widely in implementation and impact. Wallace (2004) discusses that the Internet can be good or bad depending on its implementation. He also defines the goals of education and the contribution of technology to those goals. However, the study also provides evidence that the Internet can be used effectively in a variety of settings, although he concludes stating that “Internet activities demand each teacher create new ways to cope with difference between teaching with the Internet and with conventional materials” (p.38). The introduction of new technologies into the educational arena is not a matter of a more efficient way of delivering the same, but a means of creating a new social context for learning (Bigum&Green, 1995). Regarding this issue, Muffoletto (1996) suggests that teachers need to adopt the processes and learn the new skills.
TOJET: The Turkish Online Journal of Educational Technology – January 2010, volume 9 Issue 1
Copyright The Turkish Online Journal of Educational Technology 109
These ideas are far beyond the fact that the Internet plays a receptive and transformative role in education. With the growing population and advancements in technology, school is no longer seen as the only place to have the education. Lawson and Comber (2000) argue the transformative role of the Internet in terms of boundaries. The location boundaries, subject boundaries, traditional roles of teachers, and spatial and temporal boundaries are the basis for the Internet. They conclude that the use of the Internet has a transformative capacity and the potential for blurring the traditional boundaries within schools. However, the quality of online learning is also subject to questioning. Hillesheim (1998) and Garson (2000) claim that an authentic relationship is a necessary tool for sufficient quality in education. Oh (2003) argues that students enrolled in online courses across regions or nations may be less likely to feel that they indeed belong to a school. Regarding the perceptions of the teacher, a research carried out by Fish and Gill (2009) shows that teachers see value in using online availability to enhance the traditional classroom environment. The discussions and research have mainly been on the use of the Internet as a source of information or as an assisting tool. It is possible to use the Internet as the main aid in teaching a language and as a basic source of communication in distance education. The advantages of learning a language in an actual classroom and using the Internet as an assisting tool would be an ideal way of teaching. The blended learning/teaching method has been widely used for this purpose. Yet, if the students want the education but cannot be actively involved in the educational settings, then the Internet can provide that opportunity and it is quite possible to teach a language with the assistance of the Internet. The Internet as an Aid in Teaching a Language The Internet can be efficiently used in teaching and learning a language. Recent studies show that the Internet can be a useful aid in teaching reading, writing, vocabulary activities, and some grammatical exercises. In addition, video recordings and so forth can provide listening activities. One of the most important roles of the Internet in learning a language is having access to a large range of audiovisual materials. The Internet provides the learners and teachers with such materials as listening to the news, radio, and/or TV programs, by recording and playing them back to see how native speakers use the language, phrases, and idioms, which also facilitates practice of pronunciation The advantages are not limited to this extent. It is very easy to find several reading materials in different web pages, and libraries are within reach to almost anyone who has access to the Internet. Teaching speaking with the internet through the real-time communication has not yet been so feasible and easy. Teaching Turkish as a Foreign Language in Sweden through the Internet Sweden is a sparsely inhabited country, where it may not be always possible to learn a language by attending a school. Teaching Turkish as a foreign language is the focus in this study. The Turkic languages department is only available at Uppsala University in Sweden. Many people from different parts of the country want to learn Turkish in Sweden. However, because it is not always possible to be in school due to climate, distance, financial, political, or physical boundaries, some students prefer to have distance education. Uppsala University, Linguistics, and Philology department has provided language courses via the Internet since 2003. These distance language courses last 15 weeks each term. About 25-35 students attend the courses every year. Those who complete the course successfully earn 22.5 ECTS (Csato&Kilimci, 2008). Some of the goals stated in the webpage (http://www.lingfil.uu.se/afro/turkiskasprak/) are:
I. To use a web-based annotated corpus of a foreign language as the basis for learning grammatical patterns by comparing the structure found in the corpus with the patterns found in Swedish;
II. To develop web-supported collaborative learning in grammar where a corpus of natural language material will form the basis for group activities, illustrations in lectures, and as part of the final examination;
III. To use the web-supported collaborative method in regular courses in grammar in Linguistics and grammar courses in the curriculum for Swedish as a second language.
The same webpage further states that in the proposed method interactive practical training and corpus-based exercises comprise an integral part of the students' learning process, giving them the opportunity and incentive to participate more actively in their own learning process. Using IT as a tool for collaborative work allows the students to choose the problem-solving strategy that suits them best, as well as the time and place to work on the problem. Apart from the lecture sessions, the student-teacher contact in this context can either be in the classroom or virtual, i.e. by means of electronic communication.
TOJET: The Turkish Online Journal of Educational Technology – January 2010, volume 9 Issue 1
Copyright The Turkish Online Journal of Educational Technology 110
The webpage also provides information about online course materials. The proposed training material has a modular architecture, composed of four types of modules:
I. 'Encyclopedia' module, containing descriptions of grammatical concepts and constructions; II. 'Text corpora' module, containing an annotated corpus of a foreign language; III. 'Interactive exercise' module which provides students with a set of exercises with basic tools for
computer-mediated student cooperation in virtual workgroups (a 'spreadsheet' for problem-solving; optional 'step-by-step questions' for the grammatical topic covered), with hyperlinks to the 'encyclopedia', to the 'resources' and to the annotated corpus of a foreign language (which, in turn, will be hyperlinked to the dictionary) and
IV. The 'Resource' modules will provide a pool of resources for further reading and relevant links to other sites.
The aim of the course is to teach the Turkish language both in theory and in practice. The learner can get access to learning Turkish via the Internet at any time, anywhere, and on any subject provided by the web site. Apart from the grammar exercises, reading comprehension, listening exercises, translation activities, vocabulary exercises, dictionaries, texts etc, which are mainly followed on the Internet and e-mail communication, the students are also provided with some speaking exercises (Csato&Kilimci, 2008). The students are provided guidance on how to study and which page they should follow but they are also free to choose, repeat, and/or skip the activities they would like to. They are not obliged to follow a certain route between the pages. They can get access to the activities provided whichever way they want. An Example for Speaking Courses on the Internet The speaking exercises on the Internet give the learner and the teacher the opportunity to engage in an online, simultaneous, class-like atmosphere with the help of applications such as Messenger and Skype. Skype provides a real-time speaking opportunity with a group of students in a virtual classroom. Twenty-four students can get involved in these virtual classes at the same time, where they can listen to and speak with the teacher and each other, write on the same window, and see what the others and the teacher write. While the communication with the teacher and the other group members is going on, the students follow certain materials, such as the course book or the materials previously sent via e-mail by the mentor or the teacher. The teacher is the administrator who leads the activities and guides each class member on what to do next. The teacher can open a pop up window to write messages, to show the spelling of certain words or to follow the track. Everyone in the group has the opportunity to write something on the message box (similar to a chalkboard). Moreover, the students have the opportunity to write on a separate window individually. This is a chance for the shy or timid students who are hesitant and do not want their comments or questions to be seen by others. Such students can open a new private window and get into communication with the teacher personally. This totally free facility is used in certain times of the week. A course book and several other materials are used for this purpose. The materials are carefully chosen especially to reflect the culture of each participant. The teacher is responsible for monitoring the course and guiding the students to do the activities. The repetition, substitution, word formation, sentence formation, sentence completion, story telling, drills, and various other exercises are used. Although four basic skills are practiced, improving listening and speaking skills of the learners is the main goal, which has been achieved in these courses. To improve writing, e-mailing is also used. The students are supposed to send five sentences in target language (Turkish) to the teacher and virtual-class mates every night. The students write five sentences before going to sleep and e-mail them to the teacher. The aim is to construct sentences with the new vocabulary or structure and to give some information about their own culture using the target language (Turkish). All students get feedback from the teacher the following morning. The issues are then included into the course on Skype as a discussion. This activity significantly facilitated to improve writing and speaking skills of the participants. Another important achievement has been the multicultural understanding and communication that provided the participants the possibility to learn more about each other in our virtual classes and to provide the sense of “cultural understanding.” Suggestions on How to Tackle Problems in Teaching with the Internet The mishaps or restraints of teaching speaking with the Internet are many: However, some solutions could be suggested to overcome certain obstacles, one of which is the limited opportunity for the teacher to see what exactly the student is doing. If a book or a written document is the material then the teacher might have difficulty in following the students. In this case, it might be necessary for the teacher to repeatedly remind the students and emphasize what is being carried out to make sure everybody is on the same track. It is also important for the
TOJET: The Turkish Online Journal of Educational Technology – January 2010, volume 9 Issue 1
Copyright The Turkish Online Journal of Educational Technology 111
teacher to learn the names and recognize the voices very well. Guided activities are best during the speaking courses on the Internet. Another important disadvantage of teaching with the Internet is the lack of the students’ and the teacher’s facial expressions. Facial expressions, gestures, and body language that are important elements in teaching must be replaced with intonation and careful tones in the voice in order to overcome this defect. It is also important to follow a route among the students not to cause any confusion. In other words, the students should know whose turn it is to do the activity and follow the others accordingly. Otherwise, the teacher might announce the name of the student that s/he wants to take turn. Synchronous (real time) teaching can be interrupted due to unexpected circumstances such as bad or instable connection. Having a high quality connection is necessary during the courses.
Suggestions on how to Build “Cultural Understanding” into the Curriculum Before giving examples and suggestions, it might be a good idea to identify the four-approaches introduced by Banks (2006). The Contribution Approach, which we mainly used in our courses, to integrate ethnic and multicultural content into the mainstream curriculum, suggests that ethnic content should include special days, weeks, and months related to ethnic events and celebrations. The Additive Approach is the addition of content, concepts, themes, and perspectives, without changing the basic structure, purposes, and characteristics, usually by the addition of a book, a unit, or a course to the curriculum without substantial change. In both approaches, ethnic content is added to the mainstream core curriculum without changing its basic assumptions, nature, and structure. The Transformation Approach, on the other hand, aims to change the goals, structure, and perspectives of the curriculum. The Social Action Approach is similar to the Transformation Approach in which all the elements are included. It furthermore adds components that require students to make decisions and take actions related to the concept, issue, or problem in the unit (pp. 140-144). Banks (2006) argues, “It is unrealistic to expect a teacher to move directly from a highly mainstream-centric curriculum to one that focuses on decision-making and social action” (p.143). He agrees that integration of the multicultural contents should be gradual and cumulative. In our courses, we mainly used the Contribution Approach. We inserted ethnic heroes/heroines, writers, novelists into the curriculum. In addition, we involved the discrete cultural elements such as music, dance, food etc. We also included the special days, weeks, and months related to ethnic celebrations. Each student was actively involved in these discussions. This approach together with the help of the Internet has so far eased not only the cultural understanding but also the language learning for the students who come from diverse cultural background at Uppsala University in Sweden.
DISCUSSION AND CONCUSION With the facilities the Internet provides, it has become unavoidable to use it in the education system as well. This rapid growing technology seems to make it burdensome for some teachers to keep pace with the use of the Information and Communication Technology as they find it difficult to carry it out in their classrooms or in distance education as an aid to teaching and learning. Using the Internet as a part of the curriculum in teacher training courses would help solve the problem of coping with the difference between teaching with the Internet and with the conventional materials. Technology-based methodologies in the teacher training courses should be the starting point for the prospective teachers being competent in their teaching. Going far beyond the discussion on the positive and negative aspects that the Internet provides, this study aims to show how the Internet can be used in education actively. It is evident that the introduction of the Internet has made it possible to create a new social context for learning. With the inclusion of synchronous Internet speaking courses into the program, a noticeable improvement was realized in the students’ speaking skills. We believe that with the development of technology there will be more facilities gained in the educational arena.
Traditional concepts and methodologies are no longer sufficient in the changing learning environment. Although there are still many restrains in using the internet in teaching and learning process, the participants obviously take the advantage of the Internet tool in learning a new language.
When carefully and aptly used, the Internet can enhance students’ engagement with the course and help them to learn a language. As more materials become available in digital form, users of the Internet can get easier access to the information from different parts of the world. The Internet is a perfect aid to teach cultural understanding
TOJET: The Turkish Online Journal of Educational Technology – January 2010, volume 9 Issue 1
Copyright The Turkish Online Journal of Educational Technology 112
since it represents the most diversified mass medium in the world and a great number of people can put forth their ideas through it.
The integration of the Contribution Approach and the Internet into the curriculum enhances the cultural understanding as well as learning a foreign language. The Internet is not only a convenient tool for teaching a language but it also provides the learners with an excellent opportunity to become familiar with different cultures, and facilitates different learning styles to the students in diverse population. It also provides the opportunity to achieve a multicultural understanding and respect to the citizens of the world. It offers students an opportunity to know each other and learn how to exchange ideas, opinions, and contributions by using the Internet. This, of course, promotes intercultural understanding and raises awareness of common values for teachers and students, practicing and improving a foreign language.
Since the knowledge of how to use the Internet, together with the Information and Communication Technology and the teacher’s level of expertise in the subject influences the positive effect of the technology in classrooms, it seems to be mandatory to include this subject into the curriculum of teacher training departments as well. Therefore, making strategies for effective course management, preparing the instructors to be more qualified in using the Internet in education should be the basic step. The instructors in such courses need to be more struggler in articulating strategies for course management, motivating the students to get involved in the courses and competent enough in the knowledge of cultural differences in the students’ background.
REFERENCES Banks, J.A. (2006). Race, Culture, and Education. New York: Routlegge. Banks, J.A., Banks C.A.M. (1989). Multicultural Education: Issues and Perspectives Massachusetts: Allyn and
Bacon. Bigum, C, Green, B. (1995). Managing Machines: Educational Administrator-and Information Technology
Geelong: Deakin University Press. Bullivant, B. M. (1987). The Ethnic Encounter in the Secondary School London: The Farmer Press. Carlson, M., Rabo, A. (2007). Introduction in Carlson, M., Rabo, A., Gök, F. (Eds). Education in Multicultural
Societies Turkish and Swedish Perspectives. Istanbul: Swedish Research Institute. Chapelle, C.A. (1998). Analysis of Interaction Sequences in Computer-Assisted Language Learning TESOL
Quarterly, 32 (4): 753-757. Csato, E., Kilimci, S. (2008). “Türkçe eğitiminde İnternet: İsveç örneği.” Paper presented at the international
symposium on Turkish Language: Teaching and Instruction, March 27–28, in Famagusta, North Cyprus. Fish, W.W., Gill, P.B. (2009). Perceptions of Online Instruction. The Turkish Online Journal of Educational
Technology – TOJET. 8 (1). Article 6. Garson, D. (2000). The role of information technology in quality education. In D. Garson (ed) Social dimensions
of information technology, 177-97. Hershey, PA: Idea Group. Hillesheim, G. (1998). The search for quality standards in distance learning. Paper presented at the Annual
Conference on Distance Teaching and Learning, 5-7 August, Madison, WI. Etzioni, A. (2007). Are new technologies the enemy or privacy. Know Tech Pol, 20: 115-119. Koeber, C. (2005). Introducing multimedia presentations and a course website to an introductory sociology
course: How technology affects student perceptions of teaching effectiveness Teaching Sociology, 33(3): 285-300.
Lawson, T. Comber, C. (2000). Introducing information and communication technologies into schools: the blurring of boundaries. British Journal of Sociology of Education,. 21 (3): 419-433.
Muffoletto, R. (1996). Technology and school reform in the US, Journal of lnformation Technology for Teacher Education, 5: 139-153.
National Center for Education Statistics. (2007). Educational technology in teacher education programs for initial licensure. Statistical analysis report. December 2007. Available at http://nces.ed.gov/pubsearch/pubsinfo.asp?pubid=2008040 (20 April 2008)
National Center for Education Statistics. (1999a). Teacher quality: A report on the preparation and qualifications of public school teachers. Statistical analysis report January 1999. Available at nces.ed.aov/~ubs99/1999080.htm. (22 March, 2008)
National Center for Education Statistics (1999b). Internet access in public schools and classrooms: 1994-1998. Available at: nces.ed.aov/~ubs9911999017.htm (6 March, 2008)
National Center for Education Statistics (1998). Internet access in public schools. Statistical analysis report March 1998 Available at nces.ed.aov/~ubs99/1999080.htm (16 April, 2008).
Oh, C.H. (2003). Information communication technology and the new university: A view on e-learning Annals of the American Academy of Political and Social Science, Higher Education in the Twenty-First Century, 585: 134-153.
TOJET: The Turkish Online Journal of Educational Technology – January 2010, volume 9 Issue 1
Copyright The Turkish Online Journal of Educational Technology 113
Tiedt P., Tiedt, I. (1990). Multicultural Teaching: A Handbook of Activities, Information and Resources. Massachusetts: Allyn and Bacon.
Uppsala University, Department of Linguistics and Philology, Turkic Languages webpage: (http://www.lingfil.uu.se/afro/turkiskasprak/). (08.05.2008)
Wallace R., M. (2004). A framework for understanding teaching with the Internet American Educational Research Journal, 41(2): 447-488.
Biodata: Songül Kilimci Dr. Songül Kilimci is a lecturer at Cukurova University, Turkey; a guest researcher as a post doc at the Department of Education and also a lecturer at the Department of Linguistics and Philology, Turkic Languages, Uppsala University, Sweden. She studies comparative education, teacher training, distant education, language teaching and multicultural education in general. Theoretically, she works within the tradition of curriculum studies. Dr. Songül Kilimci Cukurova University, Adana, Turkey. [email protected] [email protected] Uppsala University Department of Linguistics and Philology Turkic languages Box 635-751 26 Uppsala, Sweden. [email protected]
TOJET: The Turkish Online Journal of Educational Technology – January 2010, volume 9 Issue 1
Copyright The Turkish Online Journal of Educational Technology 114
INVESTIGATION OF THE PREDICTIONS AND DECISIONS ABOUT INFORMATION AND COMMUNICATION TECHNOLOGIES IN THE
DEVELOPMENT PLANS IN TURKEY
Assoc. Prof. Dr. Sevgi GEREK Department of Economics
Anadolu University, Turkey ABSTRACT Conscious and balanced use of information and communication technologies (ICT) is one of the main foundations of the concept put forward as new economy. Studies on the forming process of new economy in Turkey are conducted, but failures are also experienced in forming an accurate policy in terms of information, technology and innovation. The aim of this study is to investigate the predictions and decisions with regard to information and communication technologies (ICT) in the development plans of Turkey and make an investigation in parallel to this. For this purpose, document analysis technique was employed in the research, and content analysis was used for the data analysis. Themes emerging from the data analysis were analyzed in terms of problem, purpose and application policies in the development plans. In this context, the results of the study revealed that problem, purpose and application policies with regard to technology production, technology development, technology policy, technology plan, and information and communication technologies were not included at all in the 1st and 2nd development plans. Moreover, it was found out that technology policies were first emphasized in the 3rd Development Plan in terms of purpose and application, and a technology plan was first emphasized in the 5th Development Plan as purpose. As for the information and communication technologies, it was first involved in the 8th Development Plan. Therefore, it was concluded that Turkey has latched on to the policies still valid today in the Information, Technology and Research field from the very beginning; however, failed to practice them in real life. The findings of the study are discussed with their causes and effects in Turkey. Keywords: New economy, information and communication technologies, development plans, information and technology policy, technology production, technology development. 1. INTRODUCTION Fast advances and developments experienced in the information and communication technologies lie behind the globalization phenomenon. (Odyakmaz, 2000). Information and communication technologies deeply affect the economic and social lives of societies and take them out of the routines they have got used to. Therefore, it is very difficult for the individuals or societies to stay out of technology in today’s world. Sociologists have suggested two opposite views while researching the effects of technology on society: Technologic Optimism and Technologic Pessimism. What lies behind it may be not accepting or rejecting technology without questioning it (Kabakçı & Odabaşı, 2004). In March of 1998, a group of technology writers who have reached a new and more balanced consensus with regard to technology started technorealism movement (Bennahum, Biggs and et al., 1998). In time, technorealism movement has put forward eight principles which suggest that technology is not a neutral phenomenon, internet is revolutionary but not utopian, governments have important rights and responsibilities in limiting electronic frontier, information is not knowledge, educational institutions cannot totally eradicate the education problems by wiring, information should be protected, airwaves belong to the public, so frequency spectrums should be used in favor of the public, and understanding technology is an essential component of global citizenship (Kabakçı & Odabaşı, 2004). Nowadays, technology has entered our lives so much; therefore, it is of great importance to use it consciously and balanced. Actually, what is suggested as new economy today is a concept indentified with new communication and information technologies (Barışık & Yirmibeşcik, 2006). While a group of people view the dissolution of Union of Soviet Socialist Republics and east block, and the ending of cold war as a fact causing this process, another group claim that the radical change in information and communication technologies caused this formation (Pak, 2001).In all over the world, information economy, net economy, knowledge economy, digital economy and new economy have been used interchangeably (Smith, 2002). With the concept of new economy, information and communication technologies has started to take place as the main variable in the economic and social progresses of the countries.

TOJET: The Turkish Online Journal of Educational Technology – January 2010, volume 9 Issue 1
Copyright The Turkish Online Journal of Educational Technology 115
Information and Communications in Development Plans Turkey, a developing country, started planned development in 1963, and prepared eight development plans. It started to practice the Ninth Development Plan which covers the years from 2007 to 2013 two years ago. In today’s world, benefiting from science, technology, and innovation is very essential in reaching economic and social goals. Creating, generalizing, and evaluating scientific and technologic information have been key determiners in international competition. It can be claimed that dealing with science and technology within a specific policy started with the Development Period Plans in Turkey, which is a heavily agricultural developing country. Goals, realization numbers, and policies with regard to these are found under the heading of science, technology and research development in Turkey’s development plans. Further, determining inclusion and realization levels of decisions with regard to information and communication technologies (ICT) in the development plans of Turkey will contribute to making predictions about the future periods. This being the case, the aim of this study is to explore the predictions and decisions with regard to information and communication technologies (ICT) in the development plans of Turkey, in terms of purpose and application policies, and make a situation analysis. METHODOLOGY The research was carried out with document analysis technique which is a qualitative research method. In qualitative research, documents enable to work on text based rich data, and contribute to understanding and evaluating the main phenomenon investigated (Creswell, 2005; Patton, 2002). The Documents of the Research The documents of the research were development plans thus the research was carried out on the text based rich data which is thought to contribute to understanding and evaluating the main phenomenon investigated. The documents taken into account in parallel with the purpose of the research are:
• 9th Five Year Development Plan (2007-2013) • 8th Five Year Development Plan (2001-2005) • 7th Five Year Development Plan (1996-2000) • 6th Five Year Development Plan (1990-1994) • 5th Five Year Development Plan (1985-1989) • 4th Five Year Development Plan (1979-1983) • 3rd Five Year Development Plan (1973-1977) • 2nd Five Year Development Plan (1968-1972) • 1st Five Year Development Plan (1963-1967)
Data Analysis Content analysis technique was employed in the data analysis of the documents stated. First, the documents were read by the researcher, the expressions thought to be concerned with the information and communication technologies were identified, then a theme expression was formed for these expressions and coding was performed. After analyzing all the documents, the themes under the same dimension were grouped, and new themes were formed. These codes were re-examined after the reading part, the ones related to each other were grouped, and a theme list based on coding was created. In this stage, two experts with qualitative research and field knowledge were consulted for the reliability of the themes and codes formed. The markings of the researchers and experts were compared, the similarities and differences were identified, and the reliability of the research was calculated to be 85%. As this value is over 80%, it was concluded that the reliability condition was met. The thematic framework formed as a result of validity and reliability endeavor was retouched and the themes were defined. The themes were supported with direct quotations from the raw data of the documents and the findings were formed. FINDINGS AND RESULTS As a result of the data analysis, the themes “technology production”, “technology development”, “technology policy”, “information and communication technology”, and “technology plan” were obtained. Since the themes “information and communication technology” and “technology plan” were included only in one development plan, they were explained under the heading of miscellaneous themes. The themes were analyzed in terms of problem, purpose and application by taking into consideration the content of the development plans.
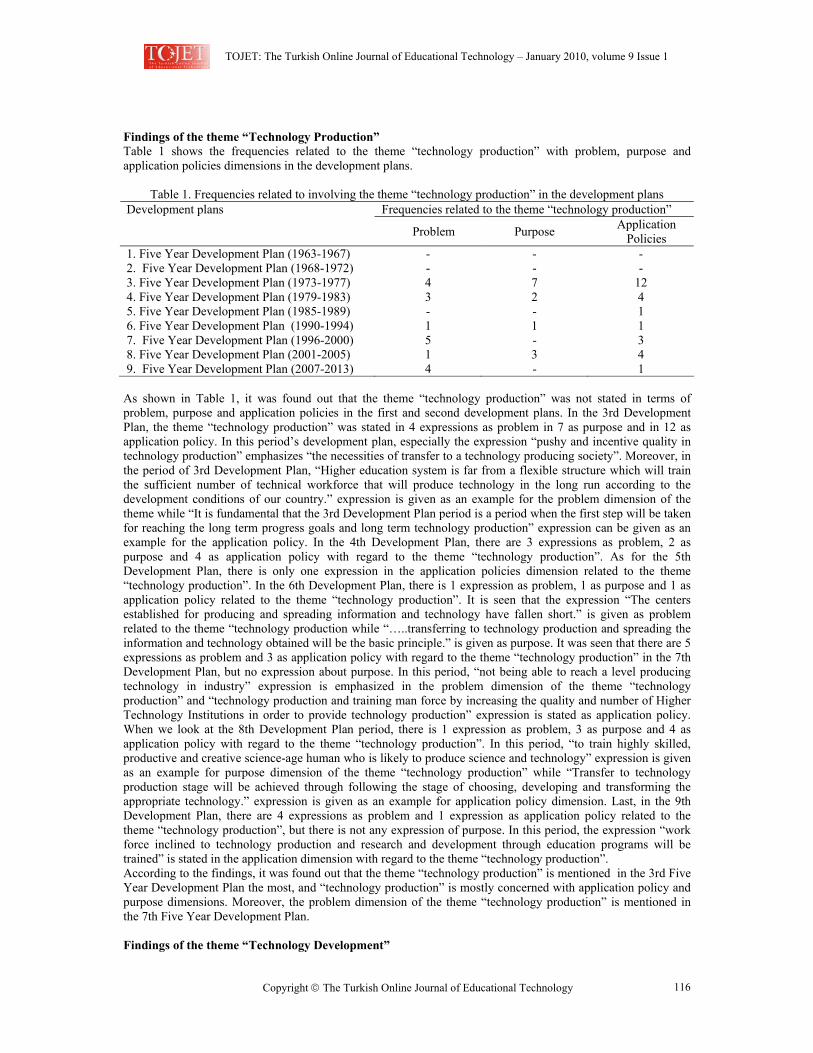
TOJET: The Turkish Online Journal of Educational Technology – January 2010, volume 9 Issue 1
Copyright The Turkish Online Journal of Educational Technology 116
Findings of the theme “Technology Production” Table 1 shows the frequencies related to the theme “technology production” with problem, purpose and application policies dimensions in the development plans.
Table 1. Frequencies related to involving the theme “technology production” in the development plans Frequencies related to the theme “technology production” Development plans
Problem Purpose Application Policies
1. Five Year Development Plan (1963-1967) - - - 2. Five Year Development Plan (1968-1972) - - - 3. Five Year Development Plan (1973-1977) 4 7 12 4. Five Year Development Plan (1979-1983) 3 2 4 5. Five Year Development Plan (1985-1989) - - 1 6. Five Year Development Plan (1990-1994) 1 1 1 7. Five Year Development Plan (1996-2000) 5 - 3 8. Five Year Development Plan (2001-2005) 1 3 4 9. Five Year Development Plan (2007-2013) 4 - 1
As shown in Table 1, it was found out that the theme “technology production” was not stated in terms of problem, purpose and application policies in the first and second development plans. In the 3rd Development Plan, the theme “technology production” was stated in 4 expressions as problem in 7 as purpose and in 12 as application policy. In this period’s development plan, especially the expression “pushy and incentive quality in technology production” emphasizes “the necessities of transfer to a technology producing society”. Moreover, in the period of 3rd Development Plan, “Higher education system is far from a flexible structure which will train the sufficient number of technical workforce that will produce technology in the long run according to the development conditions of our country.” expression is given as an example for the problem dimension of the theme while “It is fundamental that the 3rd Development Plan period is a period when the first step will be taken for reaching the long term progress goals and long term technology production” expression can be given as an example for the application policy. In the 4th Development Plan, there are 3 expressions as problem, 2 as purpose and 4 as application policy with regard to the theme “technology production”. As for the 5th Development Plan, there is only one expression in the application policies dimension related to the theme “technology production”. In the 6th Development Plan, there is 1 expression as problem, 1 as purpose and 1 as application policy related to the theme “technology production”. It is seen that the expression “The centers established for producing and spreading information and technology have fallen short.” is given as problem related to the theme “technology production while “…..transferring to technology production and spreading the information and technology obtained will be the basic principle.” is given as purpose. It was seen that there are 5 expressions as problem and 3 as application policy with regard to the theme “technology production” in the 7th Development Plan, but no expression about purpose. In this period, “not being able to reach a level producing technology in industry” expression is emphasized in the problem dimension of the theme “technology production” and “technology production and training man force by increasing the quality and number of Higher Technology Institutions in order to provide technology production” expression is stated as application policy. When we look at the 8th Development Plan period, there is 1 expression as problem, 3 as purpose and 4 as application policy with regard to the theme “technology production”. In this period, “to train highly skilled, productive and creative science-age human who is likely to produce science and technology” expression is given as an example for purpose dimension of the theme “technology production” while “Transfer to technology production stage will be achieved through following the stage of choosing, developing and transforming the appropriate technology.” expression is given as an example for application policy dimension. Last, in the 9th Development Plan, there are 4 expressions as problem and 1 expression as application policy related to the theme “technology production”, but there is not any expression of purpose. In this period, the expression “work force inclined to technology production and research and development through education programs will be trained” is stated in the application dimension with regard to the theme “technology production”. According to the findings, it was found out that the theme “technology production” is mentioned in the 3rd Five Year Development Plan the most, and “technology production” is mostly concerned with application policy and purpose dimensions. Moreover, the problem dimension of the theme “technology production” is mentioned in the 7th Five Year Development Plan. Findings of the theme “Technology Development”
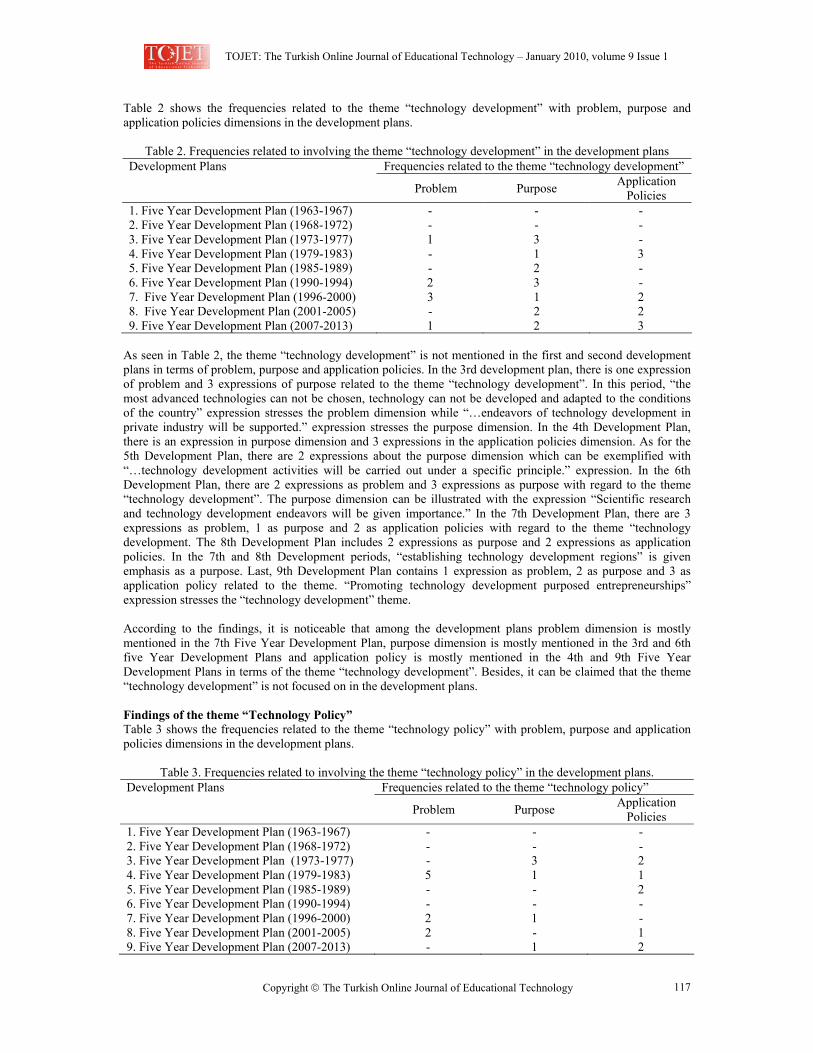
TOJET: The Turkish Online Journal of Educational Technology – January 2010, volume 9 Issue 1
Copyright The Turkish Online Journal of Educational Technology 117
Table 2 shows the frequencies related to the theme “technology development” with problem, purpose and application policies dimensions in the development plans.
Table 2. Frequencies related to involving the theme “technology development” in the development plans Frequencies related to the theme “technology development” Development Plans
Problem Purpose Application Policies
1. Five Year Development Plan (1963-1967) - - - 2. Five Year Development Plan (1968-1972) - - - 3. Five Year Development Plan (1973-1977) 1 3 - 4. Five Year Development Plan (1979-1983) - 1 3 5. Five Year Development Plan (1985-1989) - 2 - 6. Five Year Development Plan (1990-1994) 2 3 - 7. Five Year Development Plan (1996-2000) 3 1 2 8. Five Year Development Plan (2001-2005) - 2 2 9. Five Year Development Plan (2007-2013) 1 2 3
As seen in Table 2, the theme “technology development” is not mentioned in the first and second development plans in terms of problem, purpose and application policies. In the 3rd development plan, there is one expression of problem and 3 expressions of purpose related to the theme “technology development”. In this period, “the most advanced technologies can not be chosen, technology can not be developed and adapted to the conditions of the country” expression stresses the problem dimension while “…endeavors of technology development in private industry will be supported.” expression stresses the purpose dimension. In the 4th Development Plan, there is an expression in purpose dimension and 3 expressions in the application policies dimension. As for the 5th Development Plan, there are 2 expressions about the purpose dimension which can be exemplified with “…technology development activities will be carried out under a specific principle.” expression. In the 6th Development Plan, there are 2 expressions as problem and 3 expressions as purpose with regard to the theme “technology development”. The purpose dimension can be illustrated with the expression “Scientific research and technology development endeavors will be given importance.” In the 7th Development Plan, there are 3 expressions as problem, 1 as purpose and 2 as application policies with regard to the theme “technology development. The 8th Development Plan includes 2 expressions as purpose and 2 expressions as application policies. In the 7th and 8th Development periods, “establishing technology development regions” is given emphasis as a purpose. Last, 9th Development Plan contains 1 expression as problem, 2 as purpose and 3 as application policy related to the theme. “Promoting technology development purposed entrepreneurships” expression stresses the “technology development” theme. According to the findings, it is noticeable that among the development plans problem dimension is mostly mentioned in the 7th Five Year Development Plan, purpose dimension is mostly mentioned in the 3rd and 6th five Year Development Plans and application policy is mostly mentioned in the 4th and 9th Five Year Development Plans in terms of the theme “technology development”. Besides, it can be claimed that the theme “technology development” is not focused on in the development plans. Findings of the theme “Technology Policy” Table 3 shows the frequencies related to the theme “technology policy” with problem, purpose and application policies dimensions in the development plans.
Table 3. Frequencies related to involving the theme “technology policy” in the development plans. Frequencies related to the theme “technology policy” Development Plans
Problem Purpose Application Policies
1. Five Year Development Plan (1963-1967) - - - 2. Five Year Development Plan (1968-1972) - - - 3. Five Year Development Plan (1973-1977) - 3 2 4. Five Year Development Plan (1979-1983) 5 1 1 5. Five Year Development Plan (1985-1989) - - 2 6. Five Year Development Plan (1990-1994) - - - 7. Five Year Development Plan (1996-2000) 2 1 - 8. Five Year Development Plan (2001-2005) 2 - 1 9. Five Year Development Plan (2007-2013) - 1 2
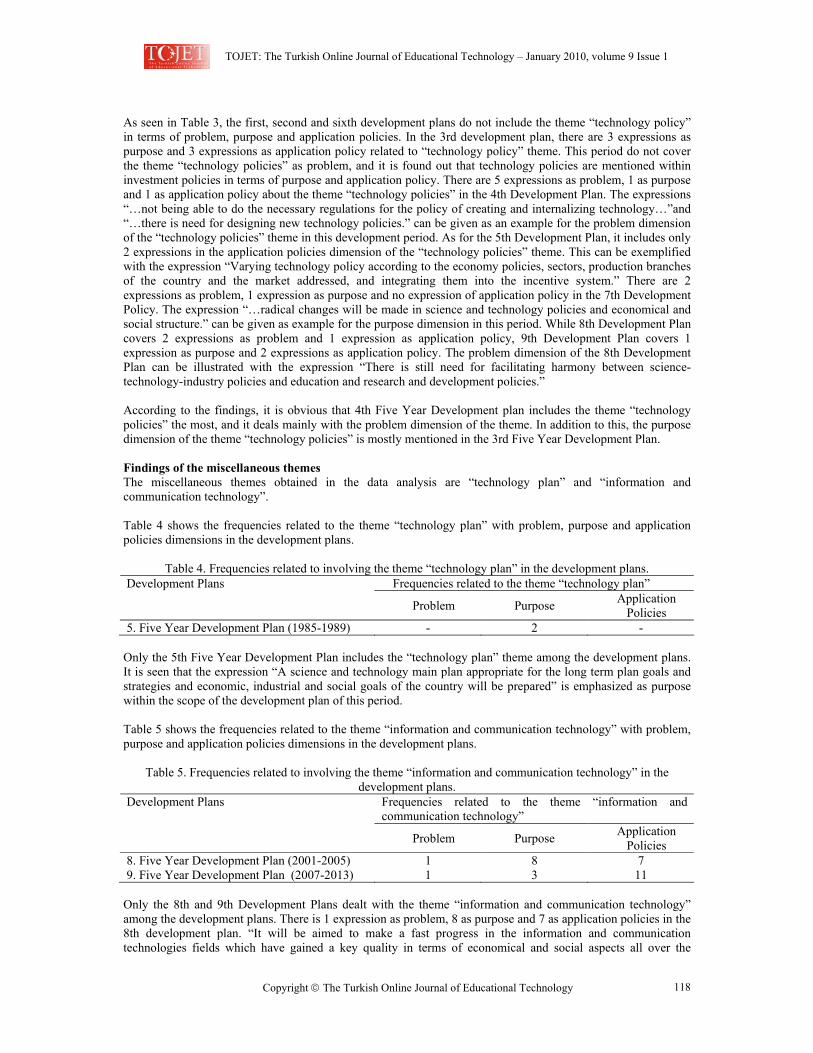
TOJET: The Turkish Online Journal of Educational Technology – January 2010, volume 9 Issue 1
Copyright The Turkish Online Journal of Educational Technology 118
As seen in Table 3, the first, second and sixth development plans do not include the theme “technology policy” in terms of problem, purpose and application policies. In the 3rd development plan, there are 3 expressions as purpose and 3 expressions as application policy related to “technology policy” theme. This period do not cover the theme “technology policies” as problem, and it is found out that technology policies are mentioned within investment policies in terms of purpose and application policy. There are 5 expressions as problem, 1 as purpose and 1 as application policy about the theme “technology policies” in the 4th Development Plan. The expressions “…not being able to do the necessary regulations for the policy of creating and internalizing technology…”and “…there is need for designing new technology policies.” can be given as an example for the problem dimension of the “technology policies” theme in this development period. As for the 5th Development Plan, it includes only 2 expressions in the application policies dimension of the “technology policies” theme. This can be exemplified with the expression “Varying technology policy according to the economy policies, sectors, production branches of the country and the market addressed, and integrating them into the incentive system.” There are 2 expressions as problem, 1 expression as purpose and no expression of application policy in the 7th Development Policy. The expression “…radical changes will be made in science and technology policies and economical and social structure.” can be given as example for the purpose dimension in this period. While 8th Development Plan covers 2 expressions as problem and 1 expression as application policy, 9th Development Plan covers 1 expression as purpose and 2 expressions as application policy. The problem dimension of the 8th Development Plan can be illustrated with the expression “There is still need for facilitating harmony between science-technology-industry policies and education and research and development policies.” According to the findings, it is obvious that 4th Five Year Development plan includes the theme “technology policies” the most, and it deals mainly with the problem dimension of the theme. In addition to this, the purpose dimension of the theme “technology policies” is mostly mentioned in the 3rd Five Year Development Plan. Findings of the miscellaneous themes The miscellaneous themes obtained in the data analysis are “technology plan” and “information and communication technology”. Table 4 shows the frequencies related to the theme “technology plan” with problem, purpose and application policies dimensions in the development plans.
Table 4. Frequencies related to involving the theme “technology plan” in the development plans. Frequencies related to the theme “technology plan” Development Plans
Problem Purpose Application Policies
5. Five Year Development Plan (1985-1989) - 2 - Only the 5th Five Year Development Plan includes the “technology plan” theme among the development plans. It is seen that the expression “A science and technology main plan appropriate for the long term plan goals and strategies and economic, industrial and social goals of the country will be prepared” is emphasized as purpose within the scope of the development plan of this period. Table 5 shows the frequencies related to the theme “information and communication technology” with problem, purpose and application policies dimensions in the development plans.
Table 5. Frequencies related to involving the theme “information and communication technology” in the development plans.
Frequencies related to the theme “information and communication technology”
Development Plans
Problem Purpose Application Policies
8. Five Year Development Plan (2001-2005) 1 8 7 9. Five Year Development Plan (2007-2013) 1 3 11
Only the 8th and 9th Development Plans dealt with the theme “information and communication technology” among the development plans. There is 1 expression as problem, 8 as purpose and 7 as application policies in the 8th development plan. “It will be aimed to make a fast progress in the information and communication technologies fields which have gained a key quality in terms of economical and social aspects all over the
TOJET: The Turkish Online Journal of Educational Technology – January 2010, volume 9 Issue 1
Copyright The Turkish Online Journal of Educational Technology 119
world.” expression can be given as an example for purpose, and application policy can be exemplified with the expression “The necessary legal and institutional regulations will be made and the infrastructure of information and communication technologies will be rapidly developed in order to ease the access to information in national and international level and to spread the use of information. ”. As for the 9th Development Plan, it includes 1 expression as problem, 3 as purpose, and 11 as application policies with regard to the theme “information and communication technologies”. In this development plan, the expression “…especially benefiting from the information and communication technologies in the highest level will be given importance and priority.” can be given as an example for the purpose dimension of the theme. According to the findings, it is found out that only the 5th Development plan includes the theme “technology plan” in terms of just the purpose level. Apart from this, the theme “technology plan” is not included in any of the periods. In other words, “technology plan” first appeared in the 5th Development Plan in the purpose dimension. Another theme, “information and communication technologies”, was first included in the 8th Development Plan in terms of problem, purpose and application policies This theme is also included in the 9th Development Plan especially in terms of application policies. Moreover, it can be alleged that both development plans emphasize the widespread use of information and communication technologies in the purpose dimension. CONCLUSION AND SUGGESTIONS This research which was conducted to explore the predictions and decisions with regard to the information and communication technologies (ICT) in the development plans of Turkey in terms of problem, purpose and application policies, and make a situation analysis found out that the 1st and 2nd Five Year Development Plans did not include the themes “technology production”, “technology development”, “technology policy”, “information and communication technology” and “technology plan” in terms of problem, purpose and application policies. Moreover, in the 1st plan (1963-1967), use of high technology, and necessity and importance of increasing the level of research and technical information are mentioned roughly, but no policy with regard to it was proposed (Tigrel, 1990). The most important step for preparing policies for technology use and research and development activities, and practicing them was taken in 1963 with the foundation of The Scientific and Technological Research Council of Turkey (TUBITAK), the first institutional structure apart from universities. In the second plan (1968-1972), regulations with regard to the maintenance of the goals in the first plan were done, and a unique section was devoted to the science and research issue. In 1972, Marmara Scientific and Industrial Research Center was founded within the body of TUBITAK (Tigrel, 1990). The main policy followed in the field of science and technology in 1960s and 1970s was supporting the basic and applied research in natural sciences without getting any national priority with regard to obtaining an economic and social benefit (Goker, 2002). In the 3rd Plan, mostly “technology production” was emphasized in terms of application policy while “technology development” and “technology policies” were stressed especially in the purpose dimension. Besides, in the third plan (1973-1977), although Science and Technology Chamber was founded in Ministry of Industry and Technology to practice the Technology Policy in parallel with the plan’s goals, it was not a great success at all (Tigrel, 1990). As for 4th Development Plan, it included “technology production” in terms of problem, purpose and application policies, but “technology development” and “technology policies” were mentioned only in terms of purpose and application policies. Although “technology production” was emphasized especially in terms of application policies in 3rd Development Plan, it can be asserted that adequate success was not achieved and application policies did not do well enough in 4th Development plan. In the 4th plan (1979-1983), important diagnoses about the insufficient success of Technology Policies were performed, and a report titled “Turkish Science Policy: 1983-2003” and prepared with the urge of M. Nimet Ozdas, the minister of state responsible from TUBITAK and TAEK (Turkish Atomic Energy Authority) that time, cooperation of State Planning Organization (DPT) and TUBITAK, and the participation of about 300 scientists and experts was submitted to the prime ministry due to the problems caused by the structural features of the country (Ministry of State, 1983; Göker, 2002). This report was followed by “Preliminary Report of Turkish Advanced Technologies Incentive Project” prepared by ITU in 1985, and “Science and Technology Policy” submitted by that time’s minister of state, Tinaz Titiz in 1987. The goals proposed in these reports were also not realized (Özdas, 1990). Within the scope of the fourth plan, TURDOK (Turkish Scientific & Technical Documentation Centre) under the body of TUBITAK was founded in order to develop national information delivery system and the Supreme Council for Science and Technology (BTYK) was formed on October 4, 1983 with the legislative decree.
TOJET: The Turkish Online Journal of Educational Technology – January 2010, volume 9 Issue 1
Copyright The Turkish Online Journal of Educational Technology 120
It was found out that 5th Development Plan included “technology development” as purpose, and “technology production” and “technology policies” only in terms of application policies. Further, 5th Development Plan was the first plan to deal with “technology plan” as purpose. It can be said that in the 5th Development Plan (1985-1989), the priority sectors and fields in terms of research-development, adaptation of technology and use of advanced technologies were identified, the opportunities focused on these, and policies were determined to apply the policies and precautions about encouraging private sector organizations for technology adaptation in order to adapt the new and advanced technologies according to the conditions of the country in technology production rapidly. When we look at this period, we see some positive progresses; for example, some KITs (state economic enterprises) and private sector organizations started to found research and development centers, and the Network of Universities and Research Institutions (TUVEKA) joined European Universities and Research Institutions Network (EARN). In this plan period, we witness an important progress which is the establishment of “Science-Research-Technology Main Plan Specialization Commission” under the body of DPT. The commission has made important diagnoses and suggestions about the science and technology policy of Turkey in its studies. However, it can be claimed that the economic and political problems Turkish economy faced in 1990 and after hindered the desired level of success in science and technology policies. As known, 1980s were the years when Turkish economy got far from the planned growth. In these years which witnessed an economic structuring from importing to exporting, important and striking developments were seen in the fields of transportation, communication and energy infrastructure. However, this positive change did not bring together the desired success in topics such as encouraging and widening of research and development activities, and taking precautions about technical education and the cooperation of university and industry. Although “technology production” is not mentioned in terms of problem, purpose and application policies in 6th Development Plan, it was seen that “technology development” was included just in problem and purpose dimensions. However, in this period’s development plan, “technology policies” was not included at all. In the 6th plan (1990-1994), concrete goals were set in science and technology field. For example, for the first time in this plan, the number of researchers working in the research and development activities was aimed to be increased to 15 for each 10.000-people- employment (DPT, 1990). Moreover, in this period, Turkish Sciences Academy (TUBA) was founded, and Turkish Patent Institute’s foundation and responsibilities came into force with a decree. Supreme Council for Science and Technology which was established in 1983 held its first meeting in 1989 and did not conduct a concrete study until its second meeting in 1993. In the second meeting of 1993, the document of 1983 was revised and the Turkish Science and Technology Policy turned into its 1993-2003 version. This document became the main document of Turkish Science and Technology Policy. All the indications, goals, preferences and precautions with regard to science and technology in Turkey are stated here. It was concluded that 7th Development Plan included “technology production” especially in problem dimension while including “technology development” and “technology policies” in terms of problem, purpose and application policies. It can be said that 7th Development Plan (1996-2000) indicated the sixth plan did not reach concrete goals especially in terms of technology development. In this period, a program called “Progress Project in Science and Technology” was put into force. This project included what could be done in the field of science and technology in Turkey and the necessary things for establishing the national innovation system. These decisions were concerned with many policy fields such as education policies, research and development policies and infrastructure investment policies. Therefore, success depended on handling the issue in a systematic unity. However, practice could not yield this unity, and this project could not succeed, too (Göker, 2002). BTYK held its third meeting on August, 1997, and accepted the report titled “Turkey’s science and technology policy”. Among the topics of this meeting were accelerating “National Academic Information Center” project, spreading the internet cafes, forming national research and development budget, founding “University-Industry Joint Research Centers”. “National Academic Network and Information Center ULAKBIM” which is a unit of TUBITAK was founded in 1998. In the 8th Development Plan, “technology production”, “technology development”, and “technology policies” were included in terms of problem, purpose and application policies. Moreover, this period’s plan was the first development plan to emphasize “information and communication technologies”. Further, in the 9th Development Plan, “information and communication technologies” was emphasized especially in terms of application policies. In this manner, the long term strategy and eighth five-year development plan (2001-2005) aimed at providing the technologic development which would increase Turkey’s competition power and accelerate its transfer to
TOJET: The Turkish Online Journal of Educational Technology – January 2010, volume 9 Issue 1
Copyright The Turkish Online Journal of Educational Technology 121
information society; therefore, it proposed strengthening the national innovation system, increasing the public support for research and development endeavors, encouraging the practice of risk capital in technoparks (DPT, 2000). This plan also aimed at re-regulation of TUBITAK Law according to the conditions of that time, making the legal regulations for founding Turkish Meteorology Institution, founding national aviation and space organization, and making the necessary legal and institutional regulations for forming Bio-Technology Supreme Council. The concept of national innovation system began to be used widely especially in 1990s for the development of technology and innovation policies. This concept was very efficient since it covered technology and all the institutions affecting the development, and put on the agenda the nation’s international competition power and its position within the international cooperation (Göker, 2002). Moreover, in this period, TUBITAK was held responsible for preparing the document of Turkey’s Science and Technology Strategies for 2003-2023 in the meeting of BTYK in 2001. In this project named “Vision 2023” it is aimed at identifying a vision for the anniversary of the republic. In accordance with the results of “Vision 2023” study, “primary technologic activity topic” and “priority capability development technology fields” forming the basis of these activities were accepted in the 11. BTYK meeting held on March, 2005. In order to focus on these topics, a Turkish research area (TARAL) which can comply with European Research Area was defined. In the previous meeting (September 2004), the definition of Turkish research area was identified as “cooperation of all the institutions and foundations which perform research and development activities (universities, research centers, industry organizations and bases), demand results of these (private and public organizations, NGOs and bases), and provide resource for these activities (public and private sectors) in our country and all the relations it will have through strategic focusing (IX. Kalkınma Planı, 2006). In Turkey, the development plans are mandatory for the public and guiding for the private sector. However, it can be alleged that these plans moved away from an extensive and detailed model after 1980 and moved toward a strategic approach model. In Turkey, precautions are taken to accelerate the forming process of new economy, but some difficulties are experienced in practice in this issue. When the development plans in Turkey are analyzed, it is remarkable that almost all of them include goals, realization numbers and policies for them under the heading of science, technology and research (Türkcan, 1981). However, an accurate policy can not be followed in science, technology and innovation topics in Turkey and public support can not be successfully taken, and these bring up some negative points at this topic in turn (Arslan, 2007). Turkey has latched on the policies still valid today in the field of Technology and Research since the very beginning, but failed to practice them in real life. The problem is not about creating projects or making plans and programs; it is about not being able to put them into practice and not practicing properly. Science and technology issues have never been given the deserved importance in the political agenda in Turkey. Acknowledgement: The author would like to thank to Dr. Işıl Kabakçı for her rigorous work with reliability and trustworthiness. REFERENCES Arslan,S. (2007). Türkiye’de bilgiye dayalı iktisadi büyümeye geçiş. Yayınlanmamış Doktora Tezi. Eskişehir:
Anadolu Üniversitesi Sosyal Bilimler Enstitüsü. Barışık, S. & Yirmibeşcik, O. (2006). Türkiye’de yeni ekonominin oluşum sürecine hızlandırmaya yönelik uyum
çabaları. Zonguldak Karaelmas Üniversitesi Sosyal Bilimler Dergisi, 2(4), 39-62. Bennahum, S. D., Biggs B. S. ve diğerleri. (1998). Technorealism. Nation. 266 (12), 19-23. Creswell, J. W. (2005). Educational Research: Planning, Conducting, and Evaluating Quantitative And
Qualitative Research. (Second Edition). New Jersey: Pearson Education, Inc. Ministry of State (Devlet Bakanlığı), (1983). Türk Bilim Politikası 1983-2003, Ankara. DPT (State Planning Organization) (1990). Türkiye’nin Altıncı Beş Yıllık Kalkınma Planı: 1990-1994, Ankara. DPT (State Planning Organization) (2000). Uzun Vadeli Strateji ve Sekizinci Beş Yıllık Kalkınma Planı: 2001-
2005, Ankara. Göker, A. (2002). Türkiye’de 1960’lar ve sonrasındaki bilim ve teknoloji politikası tasarımları niçin tam
uygulayamadık?. ODTÜ Öğretim Elemanları Derneği Ulusal Bilim Politikası Paneli, Ankara: ODTÜ. Kabakçı, I & Odabaşı, F.(2004). Teknolojiyi kullanmak ve teknogerçekçi olabilmek. Anadolu Üniversitesi
Sosyal Bilimler Dergisi, Anadolu Üniversitesi Yayınları, No: 1601, 4/1. Odyakmaz , N. (2000). Bilgi teknolojileri, küreselleşme ve kalkınma. Dış Ticaret Dergisi, 18.
TOJET: The Turkish Online Journal of Educational Technology – January 2010, volume 9 Issue 1
Copyright The Turkish Online Journal of Educational Technology 122
Özdaş, M.N. (1990). Dünya perspektifinde Türkiye’nin bilim ve teknoloji boyutu. Birinci Bilim ve Teknoloji Şurası, TÜBİTAK Yayını.
Pak, N.K. (2001). Bilgi Teknolojileri Ve Yeni Ekonomi. 10 Nisan 2001 TUBİTAK konuşması. Patton, M. Q. (2002). Qualitative research and evaluation methods. (3rd ed.). Thousand Oaks, Calif.: Sage
Publications. Smith, K. (2002). What is the knowledge economy? Knowledge intensity and distributed knowledge bases.
Discussion Papers 06, United Nations University, Institute for New Technologies, 77-86. Tigrel, A. (1990). Kalkınma Planlalarında Bilim Teknoloji ve Dünyadaki Gelişmeler. Ankara: DPT Yayınları. Türkcan, E. (1981), Teknolojinin Ekonomik Politiği, Ankara: Ankara İktisadi ve Ticari İlimler Akademisi. IX. Kalkınma Planı (Development Plan) (2007-2013). (2006). Bölgesel Gelişmede Temel Araçlar ve
Koordinasyon Özel İhtisas Komisyonu Raporu, Ankara.
TOJET: The Turkish Online Journal of Educational Technology – January 2010, volume 9 Issue 1
Copyright © The Turkish Online Journal of Educational Technology 123
META ANALYSIS OF THE COMPUTER ASSISTED STUDIES IN SCIENCE AND MATHEMATICS: A SAMPLE OF TURKEY
Asst. Prof. Dr. Mustafa YEŞİLYURT YYU Educational Faculty
ABSTRACT Because of being a developed country which is a phenomenon among the countries in the world, this desire inevitably has contributed the scientific and technological developments in educational areas as well. The expectation of these scientific and technological changes reflections in teaching areas to form permanent learning has developed the use technology in education. The use of computer in educational areas increases in our country together with the developed countries. Computer assisted instruction is mostly used in academic studies that investigate the success of difference and it is known to use control and experimental groups in these experimental studies. Meta-analysis summarizes the results of various studies in the fields of science and aims at reaching common judgment by combining the conclusions. The purpose of this study is to obtain a general opinion about effectiveness of taught courses which are carried out by using Computer-Assisted Instruction in Science and Mathematics in our country by using meta-analysis method. That is, meta-analysis method was used to combine the similar studies and to determine the mean effect of the Computer Assisted Instruction (CAI). The most important result of this study is that the Computer Assisted Instruction has an important level of superiority.
INTRODUCTION It has been a prerequisite for countries to become a more developed country in all areas than other countries in the world. Therefore, competition of production and consumption among the countries is an important area of activity which should be regulated not to damage the quality of social life. Providing of the dizzy technological development in the world to improve people’s life quality in fast and permanent way should be the most important activity area of the countries. Moreover, it’s thought that there are important contributions of results and suggestions of scientific researches in Science and Mathematics being integrated into the life of the communities on the basis of technological growth (Karalar and Sarı, 2007). The expectation of these scientific and technological changes reflections in teaching areas to form permanent learning has developed the use technology in education.
Contributions of technology to educational areas are increasing to use of equipments and provide scientific researches to achieve positive results more quickly. It develops to use of technology in education that the expectation of this scientific and technological change’s reflections in teaching areas which are aimed at making up more permanent learning. Similar developments are recorded in our country.
Therefore, the use of equipment, laboratory and computer in education is quickly replicated because of triggered developments in educational technology. Using computer in educational areas is growing up together with developed countries and it can be observed by looking at classrooms virtually in our country. Technological applications in education have improved in various ways. The computer-use software in Science and Mathematics, computer use animations, computer use integrated experiment simulations are leading technological applications of performing important and permanent learning. Therefore, the use of computers provides significant contributions in Science and Mathematics. Apart from these, it has been seen that computers create statistical differences in experimental works which computers are involved as technology of providing support teaching areas.
In that case, Computer assisted instruction is a teaching method that has consisted of self-learning principles. Hence computer is used as a platform of learning to occur, to strengthen the process of teaching and student motivation. So, students can benefit from considering speeding up their learning by using computer technology. Computer assisted instruction can be defined as activities during which students are interacted with the courses that are conducted in computer. During the process teacher assumes the role of the guide and the computer assumes the role of the platform (Sünbül et al. 2002). Computer assisted instruction is mostly used in studies which use control and experimental groups and looked at the difference of academic achievement.
Meta-analysis can be described as analysis of analyses in the literature studies. Meta-analysis is a method analysis of analyses that combines the results of multiple studies which are made in a specific case and independent from each other. In so doing the statistical analysis findings obtained from studies are compared and combined. Meta-analysis summarizes the results of various studies in the fields of science and provides to reach
TOJET: The Turkish Online Journal of Educational Technology – January 2010, volume 9 Issue 1
Copyright © The Turkish Online Journal of Educational Technology 124
common judgments by combining the conclusions (Çağatay 1994; Abramson 1994; Akgöz et al, 2004). Therefore, meta-analysis is the method of combining the results of different studies.
Meta-analysis makes analysis of analyses of different studies which give statistical results in a similar way and in the same area in education. In other words, meta-analysis combines the results of studies which give quantitative results and makes analysis statistical results which are reached in these studies.
Various experimental researches in meta-analysis studies are being done in education. Teaching in many fields, especially in the studies which investigate academic achievement meaningful differences are found among groups. Important studies which are searched for meaningful differences between Computer-Assisted Instruction and traditional teaching are being carried out in our country in the fields of science and mathematics like other countries in the world. Meta-analysis of computer-assisted instruction applications and its effectiveness was calculated by Bayraktar (2000) in USA.
Problem of the Study Is there statistical meaningful difference between two methods when Computer-Assisted Instruction applications in Science and Mathematics and experimental studies to measure effectiveness of traditional teaching which carried out between 2002–2008 in our country? This question composes the problem sentence of the research.
Purpose The purpose of this study is to obtain a general opinion about effectiveness of taught courses with meta-analysis method which is carried out using Computer-Assisted Instruction in Science and Mathematics in our country. In addition, it’s aimed to investigate whether or not a meaningful difference between Computer Assisted Instruction in Science and Mathematics and traditional teaching in our country when the experimental researches which are performed to consider academic achievement are considered.
Importance of Study This study is important to determine the reason for doing the Computer-Assisted Instruction researches in academic achievement in literature. Also, doing meta-analysis of related researches and to be example of literature studies as being an analysis of analyses is important.
Limit of Study In general, this study is limited to its own characteristics of meta-analysis method which is a method of literature research. The studies which are carried out Computer-Assisted Instruction application with experimental methods in Science and Mathematics between 2002–2008 in our country constitute the boundaries of this research.
METHODOLOGY Chosen for this research and conducted in Turkey some Computer-Assisted Science and Mathematics studies have been examined. Review of these studies meta-analysis has been done to determine the mean effect of the Computer Assisted Instruction (CAI) in academic achievement. Shortly, meta-analytical screening method which allows to combine the results of similar studies in research and to calculate common effect sizes has been used (Ergene, 1999; Akgöz et al, 2004; Şahin, 2005).
Data Collection Firstly, it’s seen that the most important search criteria is CAI when considering the type of studies which may be related to this research. Therefore, the Computer- Assisted and Computer-Based content of the studies in Science and Mathematics has been collected to be used in research. In these studies, CAI is usually seen like activities prepared for correcting misconception, instead of laboratory simulation experiments and instead of basic expression of any unit various computer-based presentations which are supported by various visual. In teaching of Biology, Science and Technology, Physics, Chemistry and Mathematics areas, 155 studies whose content is CAI were compared between experimental and control groups. The collection of these studies has also been examined in term of whether or not CAI method contributes to students' academic achievement.
Process Order It has regarded that experimental or quasi-experimental related studies have to be compared to determine academic success of students in terms of CAI. It has been decided that totally 25 studies are included in research having ‘t’ or 'F' test findings. 2 of the studies are master thesis, 4 of them are academic paper and 19 of them are articles published in scientific journals. In addition, two different 't' findings in three studies and three different 't'
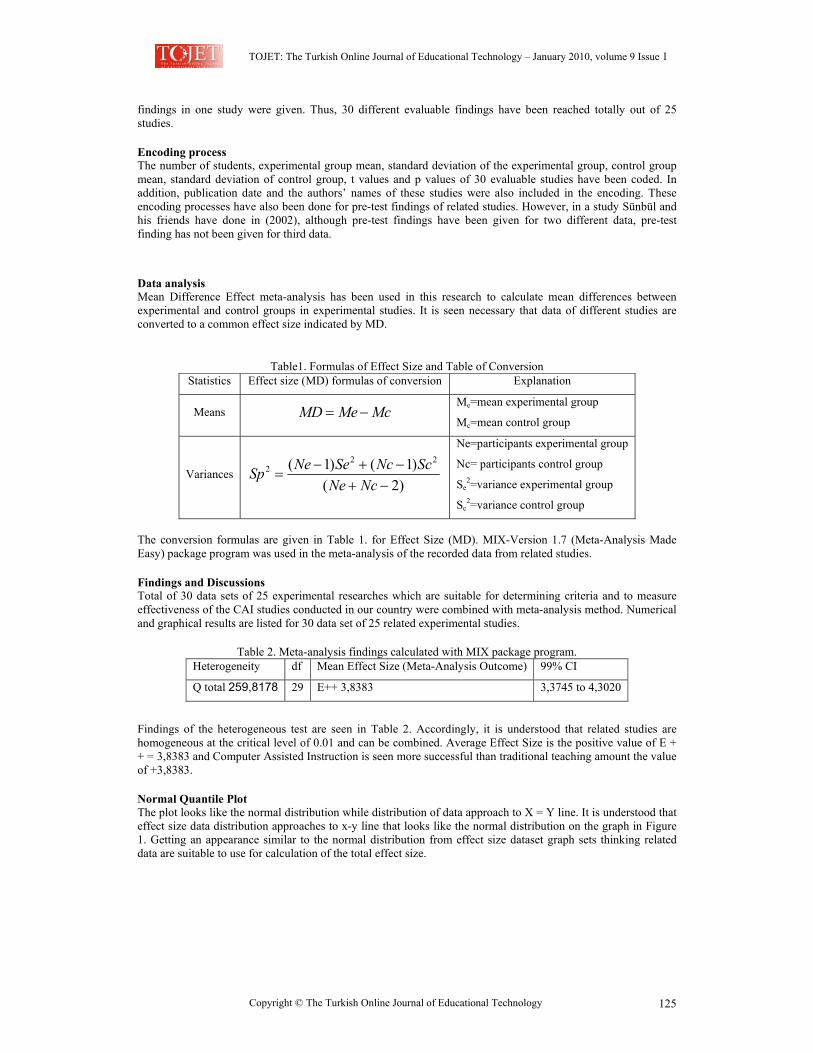
TOJET: The Turkish Online Journal of Educational Technology – January 2010, volume 9 Issue 1
Copyright © The Turkish Online Journal of Educational Technology 125
findings in one study were given. Thus, 30 different evaluable findings have been reached totally out of 25 studies.
Encoding process The number of students, experimental group mean, standard deviation of the experimental group, control group mean, standard deviation of control group, t values and p values of 30 evaluable studies have been coded. In addition, publication date and the authors’ names of these studies were also included in the encoding. These encoding processes have also been done for pre-test findings of related studies. However, in a study Sünbül and his friends have done in (2002), although pre-test findings have been given for two different data, pre-test finding has not been given for third data.
Data analysis Mean Difference Effect meta-analysis has been used in this research to calculate mean differences between experimental and control groups in experimental studies. It is seen necessary that data of different studies are converted to a common effect size indicated by MD.
Table1. Formulas of Effect Size and Table of Conversion
Statistics Effect size (MD) formulas of conversion Explanation
Means McMeMD −= Me=mean experimental group
Mc=mean control group
Variances )2(
)1()1( 222
−+−+−
=NcNe
ScNcSeNeSp
Ne=participants experimental group
Nc= participants control group
Se2=variance experimental group
Sc2=variance control group
The conversion formulas are given in Table 1. for Effect Size (MD). MIX-Version 1.7 (Meta-Analysis Made Easy) package program was used in the meta-analysis of the recorded data from related studies.
Findings and Discussions Total of 30 data sets of 25 experimental researches which are suitable for determining criteria and to measure effectiveness of the CAI studies conducted in our country were combined with meta-analysis method. Numerical and graphical results are listed for 30 data set of 25 related experimental studies.
Table 2. Meta-analysis findings calculated with MIX package program. Heterogeneity df Mean Effect Size (Meta-Analysis Outcome) 99% CI
Q total 259,8178 29 E++ 3,8383 3,3745 to 4,3020
Findings of the heterogeneous test are seen in Table 2. Accordingly, it is understood that related studies are homogeneous at the critical level of 0.01 and can be combined. Average Effect Size is the positive value of E + + = 3,8383 and Computer Assisted Instruction is seen more successful than traditional teaching amount the value of +3,8383.
Normal Quantile Plot The plot looks like the normal distribution while distribution of data approach to X = Y line. It is understood that effect size data distribution approaches to x-y line that looks like the normal distribution on the graph in Figure 1. Getting an appearance similar to the normal distribution from effect size dataset graph sets thinking related data are suitable to use for calculation of the total effect size.
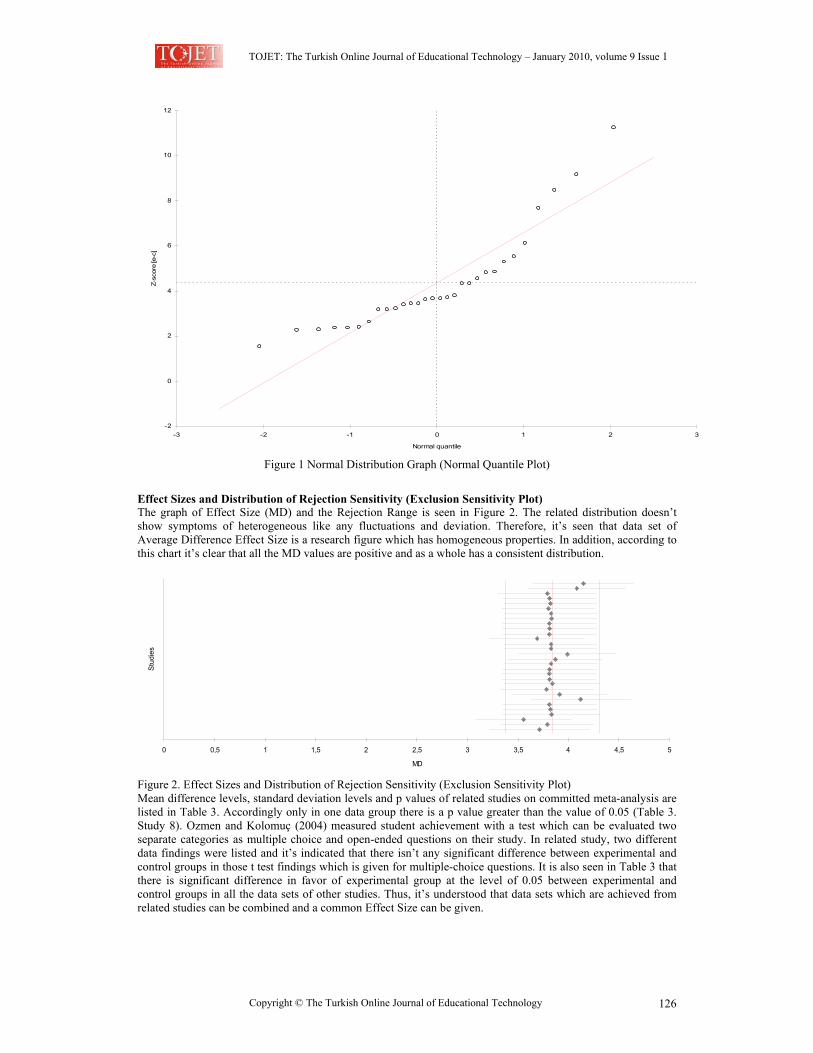
TOJET: The Turkish Online Journal of Educational Technology – January 2010, volume 9 Issue 1
Copyright © The Turkish Online Journal of Educational Technology 126
-2
0
2
4
6
8
10
12
-3 -2 -1 0 1 2 3
Normal quantile
Z-sc
ore
[e-c
]
Figure 1 Normal Distribution Graph (Normal Quantile Plot)
Effect Sizes and Distribution of Rejection Sensitivity (Exclusion Sensitivity Plot) The graph of Effect Size (MD) and the Rejection Range is seen in Figure 2. The related distribution doesn’t show symptoms of heterogeneous like any fluctuations and deviation. Therefore, it’s seen that data set of Average Difference Effect Size is a research figure which has homogeneous properties. In addition, according to this chart it’s clear that all the MD values are positive and as a whole has a consistent distribution.
0 0,5 1 1,5 2 2,5 3 3,5 4 4,5 5
MD
Stud
ies
Figure 2. Effect Sizes and Distribution of Rejection Sensitivity (Exclusion Sensitivity Plot) Mean difference levels, standard deviation levels and p values of related studies on committed meta-analysis are listed in Table 3. Accordingly only in one data group there is a p value greater than the value of 0.05 (Table 3. Study 8). Ozmen and Kolomuç (2004) measured student achievement with a test which can be evaluated two separate categories as multiple choice and open-ended questions on their study. In related study, two different data findings were listed and it’s indicated that there isn’t any significant difference between experimental and control groups in those t test findings which is given for multiple-choice questions. It is also seen in Table 3 that there is significant difference in favor of experimental group at the level of 0.05 between experimental and control groups in all the data sets of other studies. Thus, it’s understood that data sets which are achieved from related studies can be combined and a common Effect Size can be given.
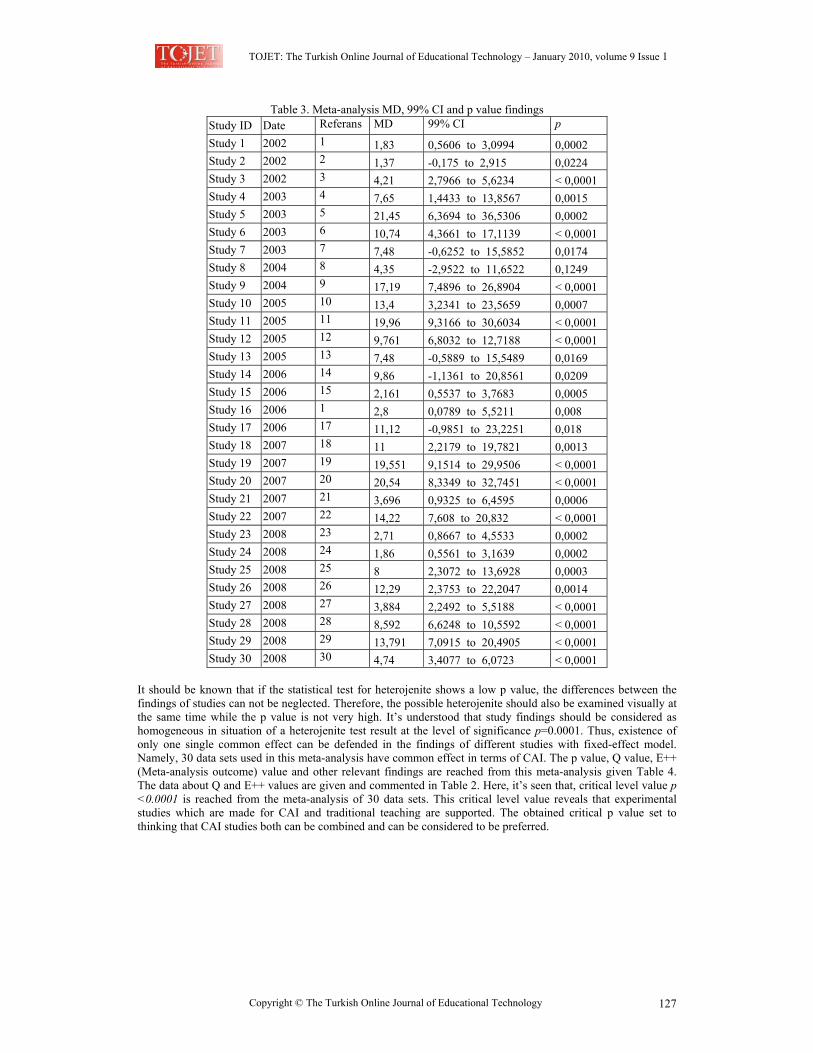
TOJET: The Turkish Online Journal of Educational Technology – January 2010, volume 9 Issue 1
Copyright © The Turkish Online Journal of Educational Technology 127
Table 3. Meta-analysis MD, 99% CI and p value findings Study ID Date Referans MD 99% CI p Study 1 2002 1 1,83 0,5606 to 3,0994 0,0002 Study 2 2002 2 1,37 -0,175 to 2,915 0,0224 Study 3 2002 3 4,21 2,7966 to 5,6234 < 0,0001 Study 4 2003 4 7,65 1,4433 to 13,8567 0,0015 Study 5 2003 5 21,45 6,3694 to 36,5306 0,0002 Study 6 2003 6 10,74 4,3661 to 17,1139 < 0,0001 Study 7 2003 7 7,48 -0,6252 to 15,5852 0,0174 Study 8 2004 8 4,35 -2,9522 to 11,6522 0,1249 Study 9 2004 9 17,19 7,4896 to 26,8904 < 0,0001 Study 10 2005 10 13,4 3,2341 to 23,5659 0,0007 Study 11 2005 11 19,96 9,3166 to 30,6034 < 0,0001 Study 12 2005 12 9,761 6,8032 to 12,7188 < 0,0001 Study 13 2005 13 7,48 -0,5889 to 15,5489 0,0169 Study 14 2006 14 9,86 -1,1361 to 20,8561 0,0209 Study 15 2006 15 2,161 0,5537 to 3,7683 0,0005 Study 16 2006 1 2,8 0,0789 to 5,5211 0,008 Study 17 2006 17 11,12 -0,9851 to 23,2251 0,018 Study 18 2007 18 11 2,2179 to 19,7821 0,0013 Study 19 2007 19 19,551 9,1514 to 29,9506 < 0,0001 Study 20 2007 20 20,54 8,3349 to 32,7451 < 0,0001 Study 21 2007 21 3,696 0,9325 to 6,4595 0,0006 Study 22 2007 22 14,22 7,608 to 20,832 < 0,0001 Study 23 2008 23 2,71 0,8667 to 4,5533 0,0002 Study 24 2008 24 1,86 0,5561 to 3,1639 0,0002 Study 25 2008 25 8 2,3072 to 13,6928 0,0003 Study 26 2008 26 12,29 2,3753 to 22,2047 0,0014 Study 27 2008 27 3,884 2,2492 to 5,5188 < 0,0001 Study 28 2008 28 8,592 6,6248 to 10,5592 < 0,0001 Study 29 2008 29 13,791 7,0915 to 20,4905 < 0,0001 Study 30 2008 30 4,74 3,4077 to 6,0723 < 0,0001
It should be known that if the statistical test for heterojenite shows a low p value, the differences between the findings of studies can not be neglected. Therefore, the possible heterojenite should also be examined visually at the same time while the p value is not very high. It’s understood that study findings should be considered as homogeneous in situation of a heterojenite test result at the level of significance p=0.0001. Thus, existence of only one single common effect can be defended in the findings of different studies with fixed-effect model. Namely, 30 data sets used in this meta-analysis have common effect in terms of CAI. The p value, Q value, E++ (Meta-analysis outcome) value and other relevant findings are reached from this meta-analysis given Table 4. The data about Q and E++ values are given and commented in Table 2. Here, it’s seen that, critical level value p <0.0001 is reached from the meta-analysis of 30 data sets. This critical level value reveals that experimental studies which are made for CAI and traditional teaching are supported. The obtained critical p value set to thinking that CAI studies both can be combined and can be considered to be preferred.
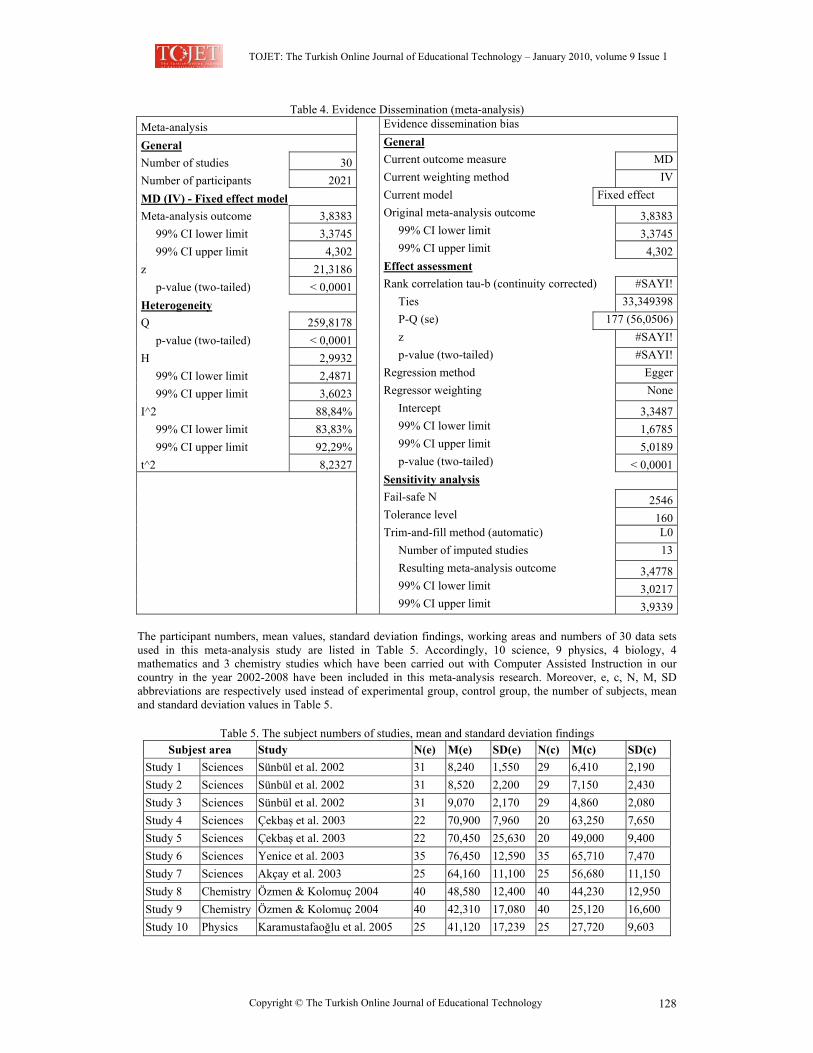
TOJET: The Turkish Online Journal of Educational Technology – January 2010, volume 9 Issue 1
Copyright © The Turkish Online Journal of Educational Technology 128
Table 4. Evidence Dissemination (meta-analysis) Meta-analysis Evidence dissemination bias
General General
Number of studies 30 Current outcome measure MD
Number of participants 2021 Current weighting method IV
MD (IV) - Fixed effect model Current model Fixed effect
Meta-analysis outcome 3,8383 Original meta-analysis outcome 3,8383 99% CI lower limit 3,3745 99% CI lower limit 3,3745 99% CI upper limit 4,302 99% CI upper limit 4,302z 21,3186 Effect assessment
p-value (two-tailed) < 0,0001 Rank correlation tau-b (continuity corrected) #SAYI!
Heterogeneity Ties 33,349398
Q 259,8178 P-Q (se) 177 (56,0506)
p-value (two-tailed) < 0,0001 z #SAYI!
H 2,9932 p-value (two-tailed) #SAYI!
99% CI lower limit 2,4871 Regression method Egger
99% CI upper limit 3,6023 Regressor weighting None
I^2 88,84% Intercept 3,3487 99% CI lower limit 83,83% 99% CI lower limit 1,6785 99% CI upper limit 92,29% 99% CI upper limit 5,0189t^2 8,2327 p-value (two-tailed) < 0,0001
Sensitivity analysis Fail-safe N 2546Tolerance level 160Trim-and-fill method (automatic) L0 Number of imputed studies 13 Resulting meta-analysis outcome 3,4778 99% CI lower limit 3,0217
99% CI upper limit 3,9339
The participant numbers, mean values, standard deviation findings, working areas and numbers of 30 data sets used in this meta-analysis study are listed in Table 5. Accordingly, 10 science, 9 physics, 4 biology, 4 mathematics and 3 chemistry studies which have been carried out with Computer Assisted Instruction in our country in the year 2002-2008 have been included in this meta-analysis research. Moreover, e, c, N, M, SD abbreviations are respectively used instead of experimental group, control group, the number of subjects, mean and standard deviation values in Table 5.
Table 5. The subject numbers of studies, mean and standard deviation findings Subjest area Study N(e) M(e) SD(e) N(c) M(c) SD(c)
Study 1 Sciences Sünbül et al. 2002 31 8,240 1,550 29 6,410 2,190 Study 2 Sciences Sünbül et al. 2002 31 8,520 2,200 29 7,150 2,430 Study 3 Sciences Sünbül et al. 2002 31 9,070 2,170 29 4,860 2,080 Study 4 Sciences Çekbaş et al. 2003 22 70,900 7,960 20 63,250 7,650 Study 5 Sciences Çekbaş et al. 2003 22 70,450 25,630 20 49,000 9,400 Study 6 Sciences Yenice et al. 2003 35 76,450 12,590 35 65,710 7,470 Study 7 Sciences Akçay et al. 2003 25 64,160 11,100 25 56,680 11,150 Study 8 Chemistry Özmen & Kolomuç 2004 40 48,580 12,400 40 44,230 12,950 Study 9 Chemistry Özmen & Kolomuç 2004 40 42,310 17,080 40 25,120 16,600 Study 10 Physics Karamustafaoğlu et al. 2005 25 41,120 17,239 25 27,720 9,603
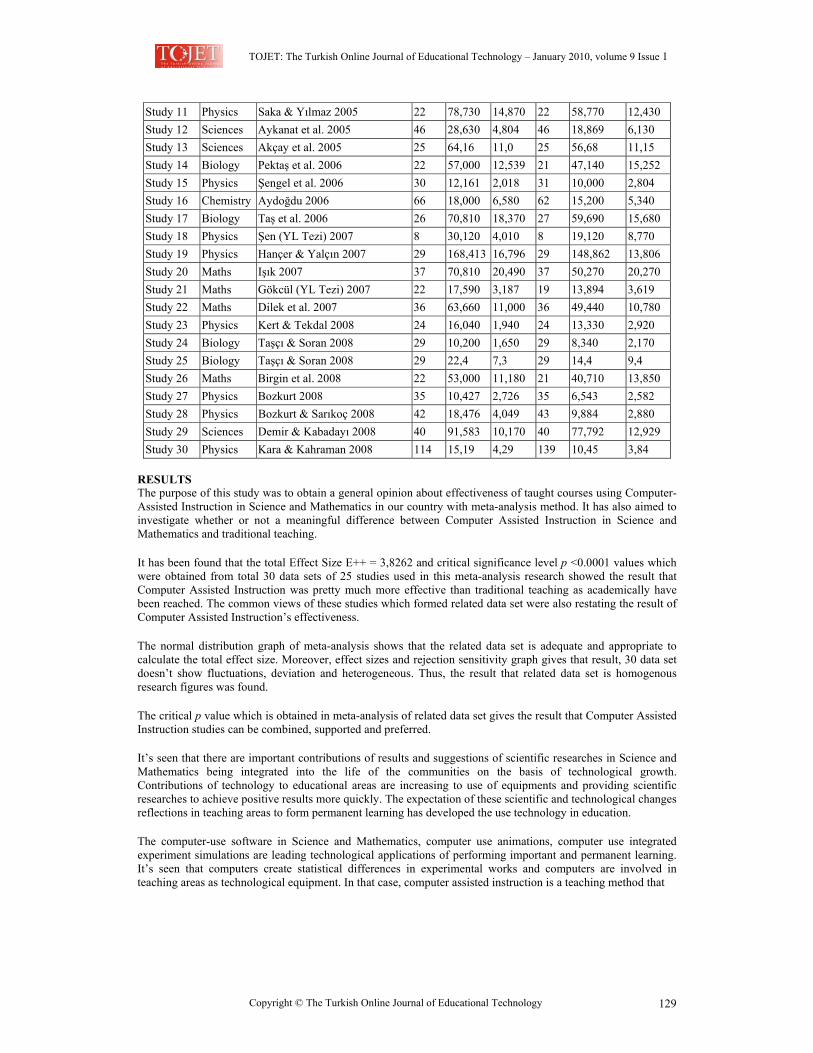
TOJET: The Turkish Online Journal of Educational Technology – January 2010, volume 9 Issue 1
Copyright © The Turkish Online Journal of Educational Technology 129
Study 11 Physics Saka & Yılmaz 2005 22 78,730 14,870 22 58,770 12,430 Study 12 Sciences Aykanat et al. 2005 46 28,630 4,804 46 18,869 6,130 Study 13 Sciences Akçay et al. 2005 25 64,16 11,0 25 56,68 11,15 Study 14 Biology Pektaş et al. 2006 22 57,000 12,539 21 47,140 15,252 Study 15 Physics Şengel et al. 2006 30 12,161 2,018 31 10,000 2,804 Study 16 Chemistry Aydoğdu 2006 66 18,000 6,580 62 15,200 5,340 Study 17 Biology Taş et al. 2006 26 70,810 18,370 27 59,690 15,680 Study 18 Physics Şen (YL Tezi) 2007 8 30,120 4,010 8 19,120 8,770 Study 19 Physics Hançer & Yalçın 2007 29 168,413 16,796 29 148,862 13,806 Study 20 Maths Işık 2007 37 70,810 20,490 37 50,270 20,270 Study 21 Maths Gökcül (YL Tezi) 2007 22 17,590 3,187 19 13,894 3,619 Study 22 Maths Dilek et al. 2007 36 63,660 11,000 36 49,440 10,780 Study 23 Physics Kert & Tekdal 2008 24 16,040 1,940 24 13,330 2,920 Study 24 Biology Taşçı & Soran 2008 29 10,200 1,650 29 8,340 2,170 Study 25 Biology Taşçı & Soran 2008 29 22,4 7,3 29 14,4 9,4 Study 26 Maths Birgin et al. 2008 22 53,000 11,180 21 40,710 13,850 Study 27 Physics Bozkurt 2008 35 10,427 2,726 35 6,543 2,582 Study 28 Physics Bozkurt & Sarıkoç 2008 42 18,476 4,049 43 9,884 2,880 Study 29 Sciences Demir & Kabadayı 2008 40 91,583 10,170 40 77,792 12,929 Study 30 Physics Kara & Kahraman 2008 114 15,19 4,29 139 10,45 3,84
RESULTS The purpose of this study was to obtain a general opinion about effectiveness of taught courses using Computer-Assisted Instruction in Science and Mathematics in our country with meta-analysis method. It has also aimed to investigate whether or not a meaningful difference between Computer Assisted Instruction in Science and Mathematics and traditional teaching.
It has been found that the total Effect Size E++ = 3,8262 and critical significance level p <0.0001 values which were obtained from total 30 data sets of 25 studies used in this meta-analysis research showed the result that Computer Assisted Instruction was pretty much more effective than traditional teaching as academically have been reached. The common views of these studies which formed related data set were also restating the result of Computer Assisted Instruction’s effectiveness.
The normal distribution graph of meta-analysis shows that the related data set is adequate and appropriate to calculate the total effect size. Moreover, effect sizes and rejection sensitivity graph gives that result, 30 data set doesn’t show fluctuations, deviation and heterogeneous. Thus, the result that related data set is homogenous research figures was found.
The critical p value which is obtained in meta-analysis of related data set gives the result that Computer Assisted Instruction studies can be combined, supported and preferred.
It’s seen that there are important contributions of results and suggestions of scientific researches in Science and Mathematics being integrated into the life of the communities on the basis of technological growth. Contributions of technology to educational areas are increasing to use of equipments and providing scientific researches to achieve positive results more quickly. The expectation of these scientific and technological changes reflections in teaching areas to form permanent learning has developed the use technology in education.
The computer-use software in Science and Mathematics, computer use animations, computer use integrated experiment simulations are leading technological applications of performing important and permanent learning. It’s seen that computers create statistical differences in experimental works and computers are involved in teaching areas as technological equipment. In that case, computer assisted instruction is a teaching method that
TOJET: The Turkish Online Journal of Educational Technology – January 2010, volume 9 Issue 1
Copyright © The Turkish Online Journal of Educational Technology 130
has consisted from self-learning principles. It is used as a platform of learning to strengthen the process of teaching and student motivation. So, students benefit from fast learning process with computer technology.
Computer Assisted Instruction is getting attention of the teachers and its use is increasing continuously in our country. Our training institutions are also enriched rapidly by Ministry of National Education in term of computer hardware. It can be estimated that much more studies involved Computer Assisted Instruction can be enriched to increase valid and reliable literature with interest and equipment richness.
It has been understood that the result of meta-analysis studies were more solid and generalised. The most important result reached with the meta-analysis in this research was that Computer Assisted Instruction has an important level of superiority. The result of meta-analytic superiority achieved from these experimental studies in Turkey in favor of CAI shows compatibility with the results of meta-analysis research made by Bayraktar (2000).
SUGGESTIONS In this meta-analysis research the result of Computer Assisted Instruction is more successful in academic term. However, it is not appropriate to make recommendations about all of the Computer Assisted Instruction because of especially ignoring qualitative research studies. Moreover, the post test findings can not be considered the only indicator of teaching. Thus, it has thought that supporting this meta-analysis in studies including qualitative researches can be useful. Moreover, it can be thought that much more use of the meta-analysis researches will contribute to science because it is a literature method which can review and combine or compare related individual studies. CAI can be suggested in situations of all educational institutions since it has been considered to have similar and useful results in these fields. It can also be thought that quality of education and teaching will increase if educational planners and curriculum developers use Computer Assisted Instruction materials which are consistent with lesson types and contents.
REFERENCES * indicates study included in meta-analysis Abramson, J. H. (1994). Making Sense of Data. 2nd edition. New York: Oxford University Press. *Akçay H., Tüysüz, C., & Feyzioğlu, B. (2003). A sample to Effect on Student Attitude and Success of
Computer Assisted Science Teaching: Mol Concept and Avogadro Number. The Turkish Online Journal of Educational Technology (TOJET). 2 (2) Article 9.
*Akçay, S., Aydoğdu, M., Yıldırım, H. İ. & Şensoy, Ö. (2005). The Effect of Computer Assisted Instruction in Flowery Plant Subject in 6th Grade Students in Science Education on The Success Of Students. Kastamonu Education Journal. 13 (1) 103-116.
Akgöz, S., Ercan, İ. & Kan, İ. (2004). Meta-Analysis. Uludag University. Faculty of Medical Journal. 30 (2) 107-112.
*Aykanat, F., Doğru, M., & Kalender, S. (2005). Effect on Student Success of Science Teaching with Computer Assisted Map Concepts Method. Kastamonu Education Journal. 13 (2) 391-400.
*Aydoğdu, C. (2006). Effect on Student Achievement of Computer Assisted Chemical Bonding Teaching. Bayburt Faculty of Education Journal. 1 (1) 80-90.
Bayraktar, S. (2000). A Meta Analysis Study on The Effectiveness of Computer Assisted Instruction in Science Education. Unpublished Doctoral Thesis. Ohio University, U.S.
*Birgin, O., Kutluca, T., & Gürbüz, R. (2008). The Effects Of Computer Assisted Instruction on The Students’ Achievement in Mathematics at Seventh Grade. 8th International Educational Technologies Conference. Anadolu University Faculty of Education. IETC2008/60. pp346-349. Downloaded from http://ietc2008.home.anadolu.edu.tr/ietc2008/170.doc web address on 12.11.2008.
*Bozkurt, E. (2008). Effect of a Virtual Laboratory Application Prepared in Physics Education Compared to Traditional Laboratory on Student Success: The Rc Circuit Sample in Direct Current. 8th International Educational Technologies Conference. Anadolu University Faculty of Education. IETC2008/60. pp346-349. Downloaded from http://ietc2008.home.anadolu.edu.tr/ietc2008/60.doc web address on 11.11.2008.
*Bozkurt, E. & Sarıkoç, A. (2008). Can The Virtual Laboratory Replace The Traditional Laboratory in Physics Education? Ahmet Keleşoğlu Faculty of Education Journal. (25) 89-100.
Çağatay, P. (1994). Meta-analysis and an application for Health Sciences. Unpublished Master’s Thesis. Istanbul University Institute of Health Sciences.
*Çekbaş, Y., Yakar, H., Yıldırım, B. & Savran, A. (2003). Effect on Students of Computer Assisted Instruction. The Turkish Online Journal of Educational Technology (TOJET). 2 (4) Article 11.
TOJET: The Turkish Online Journal of Educational Technology – January 2010, volume 9 Issue 1
Copyright © The Turkish Online Journal of Educational Technology 131
*Demir, N. & Kabadayı, A. (2008). Comparison of Traditional and Computer -Assisted Teaching Methods for Preschoolers’ Color Concept Acquisition. International Journal of Human Sciences. 5 (1) 1-18.
*Dilek, M., Tarımer, İ. & Sakal, M. (2007). Comparison of The Computer Aided Education Method with Conventional Method In The Training of SPSS Statistical Package Software. Dumlupınar University Academic Information Conference'07. Downloaded from http:// ab.org.tr/ab07/bildiri/48.doc web address on 21.12.2008.
Ergene, T. (1999). Effectiveness of Test Anxiety Reduction Program: A Meta-Analysis Review. Unpublished Doctoral Thesis. Ohio University.
*Gökcül, M. (2007). The Effects of Computer Software Based on Keller’s Arcs Motivational Model on The Academic Achievement and Retention at Teaching of Mathematics. Unpublished Master’s Thesis. Çukurova University Institute of Social Sciences.
*Hançer, A. H. & Yalçın, N. (2007). The Effects of ‘Computer Based Learning Based Upon Constructivist Approach in Science Education’ on Attitudes Toward Computers. Kastamonu Education Journal. 15 (2) 549-560.
* Işık, A. (2007). The Effect of Computer Visualization on Students Achievement in Teaching the Limit Concept of Two Variables Functions. Journal of Qafqaz University. (19) 132-141.
*Kara, İ. & Kahraman, Ö. (2008). The Effect of Computer Assisted Instruction on the Achievement of Student on the Instruction of Physics Topic of 7th Grade Science Course at a Primary School. Journal of Applied Sciences. 8 (6) 1067-1072.
Karalar, H. & Sarı, Y. (2007). The Usage of CAI in Instruction of Information Technologies and a Study about Application Results. Dumlupınar University Academic Information Conference'07. Downloaded from http://ab.org.tr/ab07/bildiri/1.pdf web address on 01.11.2008.
*Karamustafaoğlu, O., Aydın, M. & Özmen, H. (2005). Effect on Student Behaviors of Computer Assisted Physics Activities: Simple Harmonic Motion Example. The Turkish Online Journal of Educational Technology (TOJET) 4 (4) 67-81.
*Kert, S. B. & Tekdal, M. (2008). The Effects of Multimedia Based Courseware Prepared on the Basis of Design Principles from Literature on the Academic Achievement and Retention in High School Physics Instruction. Pamukkale University Faculty of Education Journal. (23) 120-131.
* Özmen, H. & Kolomuç, A. (2004). Effect of Computer-Based Teaching on Student Achievement in Solution Concept. Kastamonu Education Journal. 12 (1) 57-68.
*Pektaş, M., Türkmen, L. & Solak, K. (2006). The Effect of Computer Assisted Instruction in The Learning of Urinary System and Digestive System Units for the Science Teacher Candidates. Kastamonu Education Journal. 14 (2) 465-472.
*Saka, A. Z. & Yılmaz, M. (2005). Material Development and Implementation Based on Sheets of Computer Assisted Physics Teaching. The Turkish Online Journal of Educational Technology (TOJET). 4 (3) Article 17.
*Sünbül, A. M., Gündüz, Ş. & Yılmaz, Y. (2002). Effect of ‘Computer Assisted Instruction’ Prepared According to ‘Gagne’s Instruction Theory’ on Students’ Achievement. Selçuk University Faculty of Education Journal. 14, 379-404.
Şahin, M., C. (2005). The Effectiveness of Internet Based Distance Education: A Meta-Analysis. Unpublished Master’s Thesis. Çukurova University Institute of Social Sciences.
*Şen, S. (2007). The Effect of Proteus Simulation Software on Students’ Achievement in Teaching Electronics at Technical High Schools. Unpublished Master’s Thesis, Gazi University Institute of Social Sciences.
*Şengel, E., Özden, M. Y. & Geban, Ö. (2006). Effect on High School Students’ Understanding Replace and Speed Concepts of Experiments with Computer Simulation. The 5th National Sciences and Mathematics Training Congress Book. ODTÜ. Ankara. downloaded from http://www.fedu.metu.edu.tr/ufbmek-5/b_kitabi/PDF/Teknoloji/Bildiri/t330.pdf web address on 12.12.2009.
*Taş, E., Köse, S. & Çepni, S. (2006). The Effects of Computer-Assisted Instruction Material on Understanding Photosynthesis Subject. International Journal of Environmental and Science Education. 1 (2) 163–171.
**Taşçı, G. & Soran, H. (2008). The Effects of Multimedia Applications in Cell Division Subject on The Comprehension and Application Levels of Learning Achievement. Hacettepe University Journal of Education. 34, 233-243.
*Yenice, N., Sümer, Ş., Oktaylar, H. C. & Erbil, E. (2003). The Effect of Computer Assisted Teaching on Realizing the Objectives of Science Classes. Hacettepe University Journal of Education. 24, 152-158.
TOJET: The Turkish Online Journal of Educational Technology – January 2010, volume 9 Issue 1
Copyright The Turkish Online Journal of Educational Technology 132
NEW PERSPECTIVE TO EDUCATIONAL TECHNOLOGY: INTERDISCIPLINARY COOPERATION
“AN EXAMPLE OF FACULTIES OF EDUCATION AND ENGINEERING”1
Asist. Prof. Dr. Hasan KARAL Karadeniz Technical University, Fatih Faculty of Education,
Computer Education and Instructional Technologies [email protected]
Res. Asst. Tugba BAHÇEKAPILI
Rize University, Rize Faculty of Education, Elementary Education,
[email protected] ABSTRACT During the phase of developing new technologies and models to be used in education and for their integration, not only the technical studies and research but also the human factor which is a significant factor for the education system should be taken into consideration. Hence, a reflection concerning the answer to the question of “To what extent should the interdisciplinary studies complement each other?” should be made. The purpose of this research is to reflect on the importance of interdisciplinary cooperation between Faculties of Engineering and Education. The study was carried out during 2007-2008 academic year. Total 57 academicians of vaious universities of Turkey were participated in the study (22 of them were selected from Faculties of Engineering and 35 of them were selected from Faculties of Education). Survey method is employed and a likert type questionnaire which inclued open-ended questions, was used as data collection tool in the study. The data analyzed by calculating mean scores of responses. Findings illustrate that cooperation between two Faculties and its share in increasing the quality of current education is essential for interdisciplinary cooperation. In addition, the significance of combining theoretical information with implementation and evaluating the outputs of these practices has been emphasized in the study. It is suggested that both disciplines should go hand in hand paving the way for educational and technological innovations. KEYWORDS: Interdisciplinary Cooperation, Technology, Faculties, Academic Research 1. INTRODUCTION Rapid changes in technology have resulted in new approaches in education (Strommen & Lincoln, 1992). The fact that these new approaches have been initiated by technological developments passed through serious evaluations in terms of academic, technical, economic and psycho-social dimensions. The national implementation strategies are very important in terms of ensuring the reality of innovations in education. In order to ensure that these innovations are realistic, the process of reflection of technology on education should be well - known conceptually and practically (Karasar, 2004). Developments in society in last ten years have led the academicians and researchers to focus on concept of interdisciplinary co-operation. It has also acted as a catalyser in terms of reflection on these ever-expanding opinions (Cook-Sather & Shore, 2007). Mankind has often used the theoretical or practical innovations introduced a group of people or institutions. The way of using these has become the topic of social sciences and various theories have been developed in relation to these innovations. (Karasar, 2004). Technology in itself shall never be sufficient in terms of ensuring the necessary changes in education (Strommen & Lincoln, 1992). Therefore; researchers from various disciplines need to work together in order to conduct more qualified researches. In this way, “values” such as being open minded, tolerant against different points of view as well as the need for a communication which is based on a developed model rather than based on a single point of view shall be discussed. These views are already embedded in to nature of interdisciplinary studies but they are not stressed in single disciplines sufficiently. Interdisciplinary approach stresses the importance of integration generally, defined as the need to criticise and find a common basis when different disciplines collide with each other. Interdisciplinary studies require a process through which different understandings and approaches are integrated and composed of different methods and theories. Consequently, there is a need for a common platform in which the understanding of different disciplines shall be merged (Szostak, 2007). 1 This study was presented as full paper at the proceedings of XVII. Educational Sciences Conference (Sakarya University - Sakarya, 1-3Eylül 2008) .
TOJET: The Turkish Online Journal of Educational Technology – January 2010, volume 9 Issue 1
Copyright The Turkish Online Journal of Educational Technology 133
Since the information is rapidly disseminated and even worn-out in today’s world, interdisciplinary studies are also significant for renovation and development (Aslan, 2006). Interdisciplinary concepts state that the diversity of different disciplines paves the way for richness, that these various disciplines are interconnected, problems in real life may not always bear one single explanation but many. However, possessing solutions which are actually in opposite sides in terms of science, mathematics and linguistics shall give the priority to cognitive, emotive and creative capacity in order to better expressions of the ideas and thoughts (Ozkok, 2005).
That the disciplines are differentiated among themselves in to countless number of sub disciplines poses a great obstacle against assessing the scientific information in all aspects and reflecting on it in a broader way. Cries for “expanding the scope of social sciences; hence gaining a momentum in interdisciplinary studies, ensuring a dense communication between different disciplines” which arise from the Western culture, show that it is high time a change is realized not only in social sciences but also in many other disciplines (Dural, 2007). With the ever increasing significance of interdisciplinary communication, there is also need for individuals who are able to establish connections between different areas in order to find solutions to individual and collective problems and who are able to evaluate the problems through different angles. Interdisciplinary concept refers to a method in which the problems are defined and solved as independent from their original fields and in which the borders of that discipline are diminished. It requires the cooperation of more than one individual from different disciplines and gathering around a common objective (Kocak, Marsap & Ozsoy, 2004). In case academic research evolves in this direction, scientific research shall also be more efficient and qualified, acting as a significant factor in the generation of information and serving the society (Erdem, 2006). When related literature is examined, it shall be evident that; individuals from different disciplines work in coordination and bring along the approach of their own discipline towards a common objective. Indiana Speech Training Aid (ISTRA) (Kewley-Port, Watson, Maki & Reed, 1987), Speech Viewer (Adams, Crepy, Jameson & Thatcher 1989), Speech Illumina Mentor (SIM) (Soleymani, Mccutcheon & Southwood, 1997), Speech Training, Assessment and Remediation System (STAR) (Bunnell, Yarrington & Polikoff, 2000), BALDI (Massaro, 2004), Articulation Tutor (ARTUR) (Bälter, Engwall, Öster & Kjellström, 2005) could be given as examples. Studies aiming to improve the speaking and hearing abilities of individuals with hearing and speech defects as well as teaching of languages have made cooperation among very different areas of disciplines necessary. It has been determined that all these studies have required expertise in areas such as technical design, human – machine interaction, speech therapy, pedagogy and computer sciences (Engwall, 2004; Engwall, Wik, Beskow & Granström, 2004; Eriksson, Bälter, Engwall, Öster & Kjellström, 2005; Engwall, 2006; Engwall, Bälter, Öster & Kjellström, 2006; Engwall, Bälter, Öster & Kjellström, 2006; Engwall, Abdou & Bälter, 2007). Another example is new generation “Haptic” devices which are based on human – machine interaction and which enable a new approach in learning – through – feeling have been adapted in various ways into learning media. This has also been a considerable development (Williams II, Chen & Seaton, 2003). It becomes widespread that studies about which haptic devices influence for good in the area of natural sciences, medicine and special education through the quality of learning are determined (Karal & Reisoglu, 2007). Integrating these device into education can be described as an interdisciplinary study. There is also need for theoretical and practical studies in Turkey in order to adapt the changes in the technology to education environment (Karasar, 2004). Studies conducted in Education Faculties which aim to increase the quality in current education system have become eminent. A two-day workshop and evaluation meeting on “Current Problems of Education and Solution Alternatives Through the Point of Education Sciences” have been arranged within the scope of Ankara University, Faculty of Education Sciences on 10-11 February 2004 with the participation of deans of Faculties of Education throughout the country. As for the conclusion, it is stated that:
“Since the education science is a social science which generates interdisciplinary
information, problems of education system should be addressed collectively, education needs should be determined in accordance with collective needs, the sub educational sciences, their limits and borders, interaction with other disciplines should be discussed in academic platforms in order to ensure a multi dimensional academic approach and identity (MEB, 2004).”
Interdisciplinary studies to be conducted in universities through a multi faceted academicians approach shall have significant social and economical contributions; act as a significant factor in the solution of the problems and development of new systems. Therefore, the academicians coming from these two different disciplines shall unite the different approaches specific to their own areas of discipline hence facilitating the solutions of the problems, cooperating groups shall provide alternative approaches in terms of finding solutions to the problems. These studies shall make significant contribution in terms of improvement and renovation, since this shall also be reflected to other individuals receiving education in different disciplines; these individuals shall be able to think in
TOJET: The Turkish Online Journal of Educational Technology – January 2010, volume 9 Issue 1
Copyright The Turkish Online Journal of Educational Technology 134
a wider scope, free of academic prejudices. Since the life itself is an interdisciplinary adventure, any experience in the interdisciplinary area can be considered as a fine preparation against life by students. Programs which are successful in that sense, shall not only be beneficial to the students but also be of great help to universities preparing their students against a complicated life (Szostak, 2007). On the other hand, interdisciplinary concept refers to a more comprehensive duty which supports creative and free reflection on topics worth studying, creating an intellectual culture and ensuring its sustainability (Cook-Sather & Shore, 2007). In the light of existing literature and relevant studies, in this study it is aimed to determine the views of academicians from Faculties of Engineering and Education about interdisciplinary studies and also to determine contributions of possible interdisciplinary studies to the education system. 2. METHODOLOGY 2.1. Selection of Sample Group and Sample of Research Research sample comprises 57 academicians recruited in Faculties of Engineering and Education. Participants of the study were selected from Faculties of Engineering and Education of various universities of Turkey through random sample selection method. 22 academicians recruited in Faculties of Engineering whereas 35 academicians recruited in Faculties of Education have participated in the study. Table 1 below illustrates the distribution of participants:
Table 1. Distribution of Participants as per Departments and Divisions Departments FEn*
Number of Academicians
Departments FEd*
Number of Academicians
Dept. of Computer Eng. 4 Division of Biology Education 1 Dept. of Electrical – Electronics Eng. 4 Division of Physics Education 2
Dept. of Geodesy and Photogrametry Eng. 1 Division of Chemistry Education 1
Civil Engineering 4 Division of Mathematics Education 2 Mechanical Eng. 2 Division of Turkish Language Education 2 Dept. of Geology Eng. 2 Division of Social Sciences Education 2 Dept. of Industrial Eng. 1 Division of Pre-School Education 1
Dept. of Forestry Eng. 1 Division of Mathematics Teaching for Primary Education 3
Dept. of Forestry Industry Eng. 2 Dept. of Computer Education and Instructional
Technologies 9
Dept. of Environmental Eng. 1 Division of Science Education 4
Division of Psychological Counselling and Guidance 5 Division of Elementary Education 1 Dept. of Teaching for the Hearing Disabled 2
Dept. of Teaching for Mentally Retarded 1 *FEn: Faculty of Engineering FEd: Faculty of Education 2.2. Data Collection Tool Survey method is employed and a questionnaire is used as data collection tool in the research. Questionnaire, which is used as data collection tool in the research, has been prepared by the authors through examining relevant literature and previously conducted studies in order to determine the personal information and opinions of academicians in terms of interdisciplinary approach. The questionnaire has been divided into three main sections; first section consists of questions about background information of academicians, second section composed of quintet likert type items in order to specify the opinions of academicians on interdisciplinary approach and the final section in which the personal opinion of the academicians are taken through open ended questions. The alpha reliability coefficient of the questionnaire, which has been finalized by taking the opinion of relevant academicians, has been determined as .87. Also two open ended questions about “Contribution of a cooperation between the Faculties of Engineering and Education” and “Contribution of an interdisciplinary study to be conducted between Faculties of Education and Engineering to relevant parties and society” have been used to made it possible for the researcherers to support the opinion of the participants through qualitative data and to investigate the problems in a deeper way.
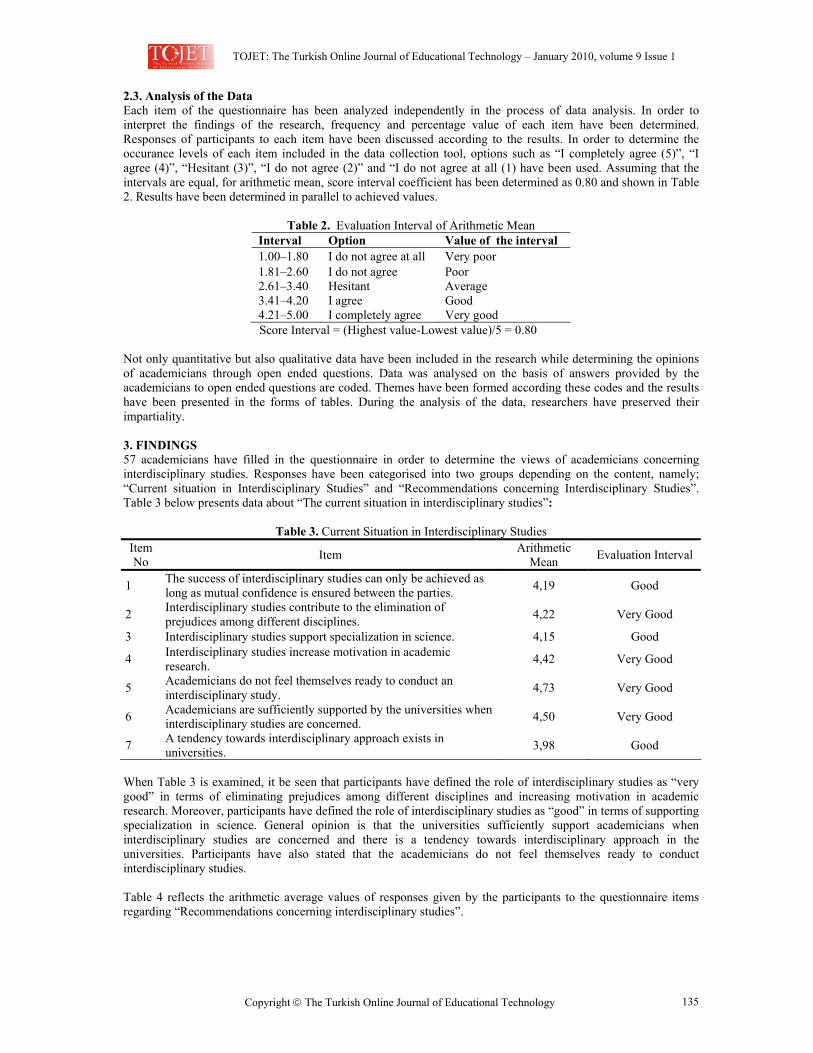
TOJET: The Turkish Online Journal of Educational Technology – January 2010, volume 9 Issue 1
Copyright The Turkish Online Journal of Educational Technology 135
2.3. Analysis of the Data Each item of the questionnaire has been analyzed independently in the process of data analysis. In order to interpret the findings of the research, frequency and percentage value of each item have been determined. Responses of participants to each item have been discussed according to the results. In order to determine the occurance levels of each item included in the data collection tool, options such as “I completely agree (5)”, “I agree (4)”, “Hesitant (3)”, “I do not agree (2)” and “I do not agree at all (1) have been used. Assuming that the intervals are equal, for arithmetic mean, score interval coefficient has been determined as 0.80 and shown in Table 2. Results have been determined in parallel to achieved values.
Table 2. Evaluation Interval of Arithmetic Mean
Interval Option Value of the interval 1.00–1.80 I do not agree at all Very poor 1.81–2.60 I do not agree Poor 2.61–3.40 Hesitant Average 3.41–4.20 I agree Good 4.21–5.00 I completely agree Very good Score Interval = (Highest value-Lowest value)/5 = 0.80
Not only quantitative but also qualitative data have been included in the research while determining the opinions of academicians through open ended questions. Data was analysed on the basis of answers provided by the academicians to open ended questions are coded. Themes have been formed according these codes and the results have been presented in the forms of tables. During the analysis of the data, researchers have preserved their impartiality. 3. FINDINGS 57 academicians have filled in the questionnaire in order to determine the views of academicians concerning interdisciplinary studies. Responses have been categorised into two groups depending on the content, namely; “Current situation in Interdisciplinary Studies” and “Recommendations concerning Interdisciplinary Studies”. Table 3 below presents data about “The current situation in interdisciplinary studies”:
Table 3. Current Situation in Interdisciplinary Studies Item No Item Arithmetic
Mean Evaluation Interval
1 The success of interdisciplinary studies can only be achieved as long as mutual confidence is ensured between the parties. 4,19 Good
2 Interdisciplinary studies contribute to the elimination of prejudices among different disciplines. 4,22 Very Good
3 Interdisciplinary studies support specialization in science. 4,15 Good
4 Interdisciplinary studies increase motivation in academic research. 4,42 Very Good
5 Academicians do not feel themselves ready to conduct an interdisciplinary study. 4,73 Very Good
6 Academicians are sufficiently supported by the universities when interdisciplinary studies are concerned. 4,50 Very Good
7 A tendency towards interdisciplinary approach exists in universities. 3,98 Good
When Table 3 is examined, it be seen that participants have defined the role of interdisciplinary studies as “very good” in terms of eliminating prejudices among different disciplines and increasing motivation in academic research. Moreover, participants have defined the role of interdisciplinary studies as “good” in terms of supporting specialization in science. General opinion is that the universities sufficiently support academicians when interdisciplinary studies are concerned and there is a tendency towards interdisciplinary approach in the universities. Participants have also stated that the academicians do not feel themselves ready to conduct interdisciplinary studies. Table 4 reflects the arithmetic average values of responses given by the participants to the questionnaire items regarding “Recommendations concerning interdisciplinary studies”.
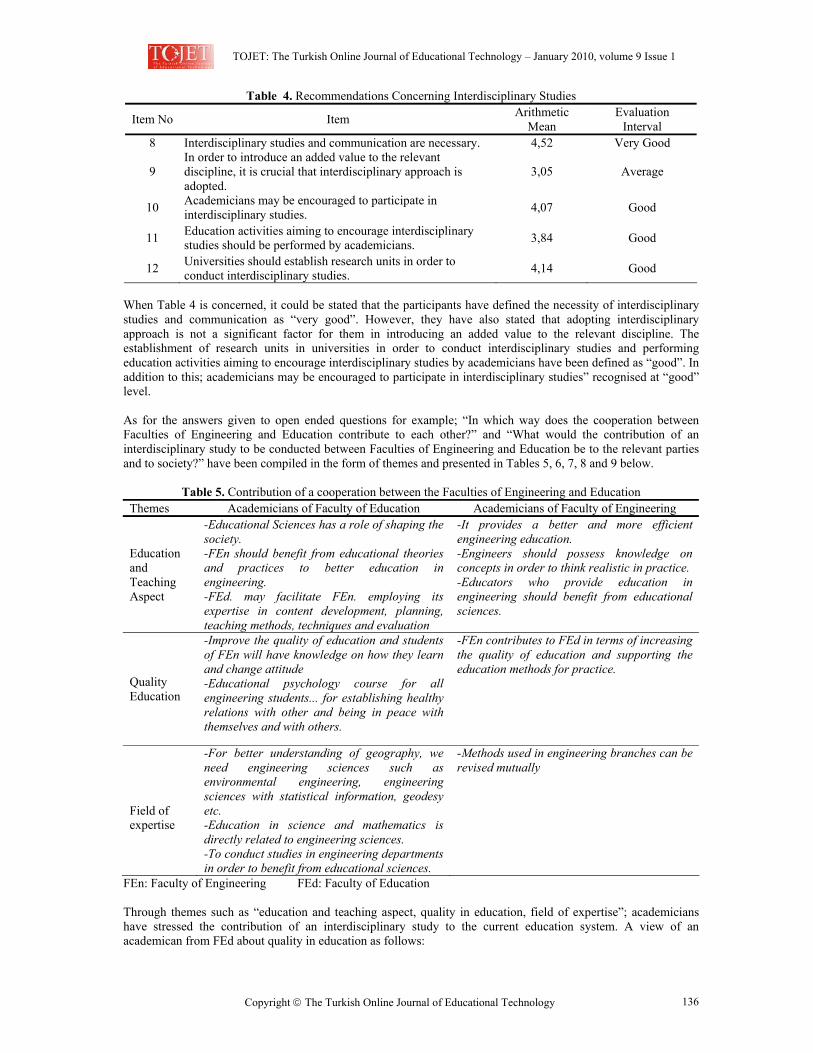
TOJET: The Turkish Online Journal of Educational Technology – January 2010, volume 9 Issue 1
Copyright The Turkish Online Journal of Educational Technology 136
Table 4. Recommendations Concerning Interdisciplinary Studies
Item No Item Arithmetic Mean
Evaluation Interval
8 Interdisciplinary studies and communication are necessary. 4,52 Very Good
9 In order to introduce an added value to the relevant discipline, it is crucial that interdisciplinary approach is adopted.
3,05 Average
10 Academicians may be encouraged to participate in interdisciplinary studies. 4,07 Good
11 Education activities aiming to encourage interdisciplinary studies should be performed by academicians. 3,84 Good
12 Universities should establish research units in order to conduct interdisciplinary studies. 4,14 Good
When Table 4 is concerned, it could be stated that the participants have defined the necessity of interdisciplinary studies and communication as “very good”. However, they have also stated that adopting interdisciplinary approach is not a significant factor for them in introducing an added value to the relevant discipline. The establishment of research units in universities in order to conduct interdisciplinary studies and performing education activities aiming to encourage interdisciplinary studies by academicians have been defined as “good”. In addition to this; academicians may be encouraged to participate in interdisciplinary studies” recognised at “good” level. As for the answers given to open ended questions for example; “In which way does the cooperation between Faculties of Engineering and Education contribute to each other?” and “What would the contribution of an interdisciplinary study to be conducted between Faculties of Engineering and Education be to the relevant parties and to society?” have been compiled in the form of themes and presented in Tables 5, 6, 7, 8 and 9 below.
Table 5. Contribution of a cooperation between the Faculties of Engineering and Education Themes Academicians of Faculty of Education Academicians of Faculty of Engineering
Education and Teaching Aspect
-Educational Sciences has a role of shaping the society. -FEn should benefit from educational theories and practices to better education in engineering. -FEd. may facilitate FEn. employing its expertise in content development, planning, teaching methods, techniques and evaluation
-It provides a better and more efficient engineering education. -Engineers should possess knowledge on concepts in order to think realistic in practice. -Educators who provide education in engineering should benefit from educational sciences.
Quality Education
-Improve the quality of education and students of FEn will have knowledge on how they learn and change attitude -Educational psychology course for all engineering students... for establishing healthy relations with other and being in peace with themselves and with others.
-FEn contributes to FEd in terms of increasing the quality of education and supporting the education methods for practice.
Field of expertise
-For better understanding of geography, we need engineering sciences such as environmental engineering, engineering sciences with statistical information, geodesy etc. -Education in science and mathematics is directly related to engineering sciences. -To conduct studies in engineering departments in order to benefit from educational sciences.
-Methods used in engineering branches can be revised mutually
FEn: Faculty of Engineering FEd: Faculty of Education Through themes such as “education and teaching aspect, quality in education, field of expertise”; academicians have stressed the contribution of an interdisciplinary study to the current education system. A view of an academican from FEd about quality in education as follows:
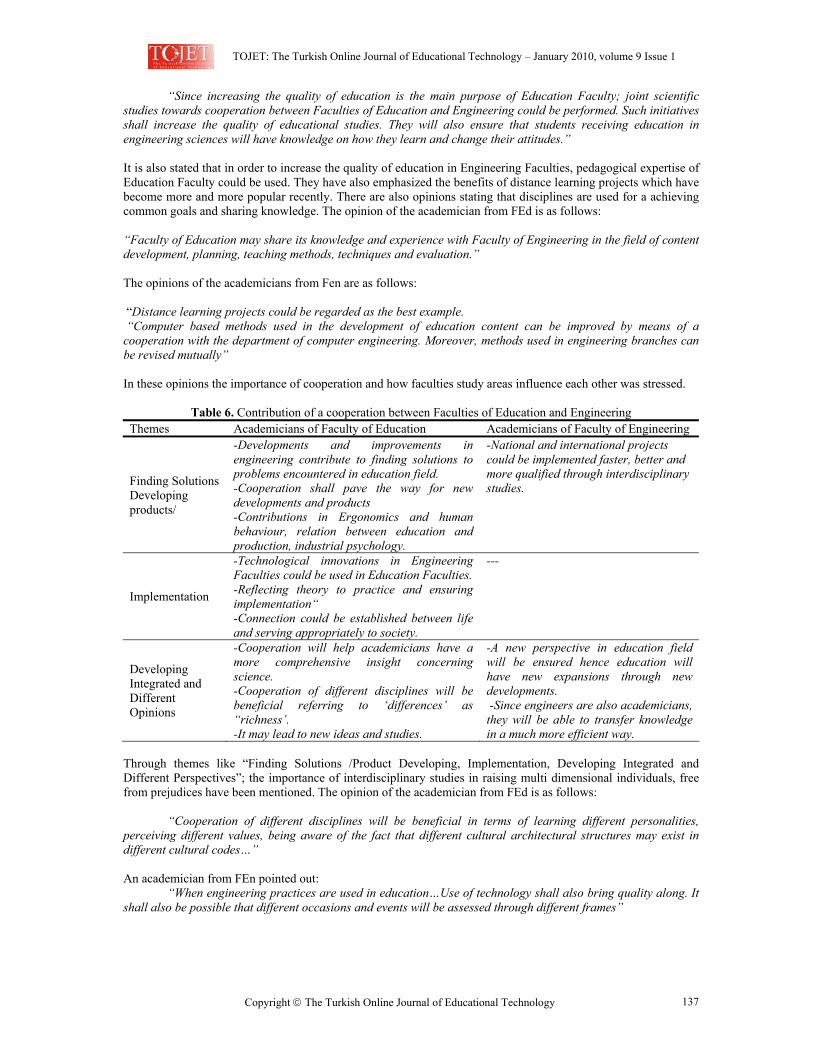
TOJET: The Turkish Online Journal of Educational Technology – January 2010, volume 9 Issue 1
Copyright The Turkish Online Journal of Educational Technology 137
“Since increasing the quality of education is the main purpose of Education Faculty; joint scientific studies towards cooperation between Faculties of Education and Engineering could be performed. Such initiatives shall increase the quality of educational studies. They will also ensure that students receiving education in engineering sciences will have knowledge on how they learn and change their attitudes.” It is also stated that in order to increase the quality of education in Engineering Faculties, pedagogical expertise of Education Faculty could be used. They have also emphasized the benefits of distance learning projects which have become more and more popular recently. There are also opinions stating that disciplines are used for a achieving common goals and sharing knowledge. The opinion of the academician from FEd is as follows: “Faculty of Education may share its knowledge and experience with Faculty of Engineering in the field of content development, planning, teaching methods, techniques and evaluation.” The opinions of the academicians from Fen are as follows: “Distance learning projects could be regarded as the best example. “Computer based methods used in the development of education content can be improved by means of a cooperation with the department of computer engineering. Moreover, methods used in engineering branches can be revised mutually” In these opinions the importance of cooperation and how faculties study areas influence each other was stressed.
Table 6. Contribution of a cooperation between Faculties of Education and Engineering Themes Academicians of Faculty of Education Academicians of Faculty of Engineering
Finding Solutions Developing products/
-Developments and improvements in engineering contribute to finding solutions to problems encountered in education field. -Cooperation shall pave the way for new developments and products -Contributions in Ergonomics and human behaviour, relation between education and production, industrial psychology.
-National and international projects could be implemented faster, better and more qualified through interdisciplinary studies.
Implementation
-Technological innovations in Engineering Faculties could be used in Education Faculties. -Reflecting theory to practice and ensuring implementation“ -Connection could be established between life and serving appropriately to society.
---
Developing Integrated and Different Opinions
-Cooperation will help academicians have a more comprehensive insight concerning science. -Cooperation of different disciplines will be beneficial referring to ‘differences’ as “richness’. -It may lead to new ideas and studies.
-A new perspective in education field will be ensured hence education will have new expansions through new developments. -Since engineers are also academicians, they will be able to transfer knowledge in a much more efficient way.
Through themes like “Finding Solutions /Product Developing, Implementation, Developing Integrated and Different Perspectives”; the importance of interdisciplinary studies in raising multi dimensional individuals, free from prejudices have been mentioned. The opinion of the academician from FEd is as follows:
“Cooperation of different disciplines will be beneficial in terms of learning different personalities, perceiving different values, being aware of the fact that different cultural architectural structures may exist in different cultural codes…”
An academician from FEn pointed out:
“When engineering practices are used in education…Use of technology shall also bring quality along. It shall also be possible that different occasions and events will be assessed through different frames”
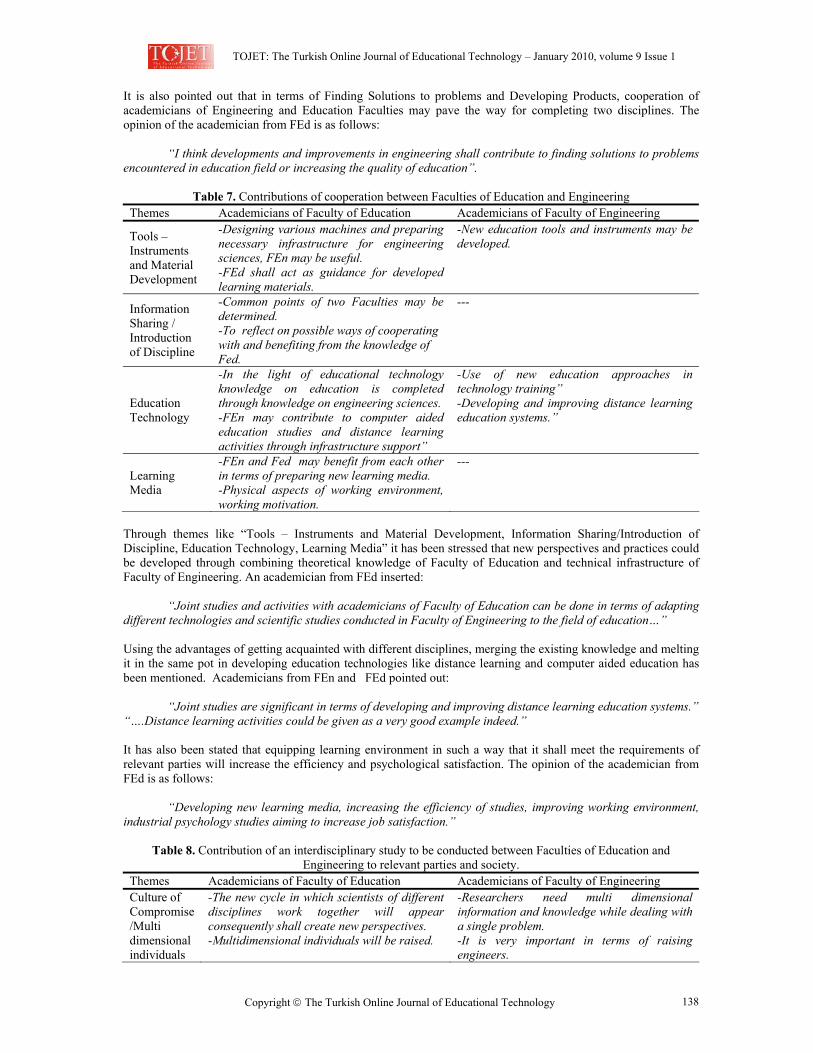
TOJET: The Turkish Online Journal of Educational Technology – January 2010, volume 9 Issue 1
Copyright The Turkish Online Journal of Educational Technology 138
It is also pointed out that in terms of Finding Solutions to problems and Developing Products, cooperation of academicians of Engineering and Education Faculties may pave the way for completing two disciplines. The opinion of the academician from FEd is as follows:
“I think developments and improvements in engineering shall contribute to finding solutions to problems encountered in education field or increasing the quality of education”.
Table 7. Contributions of cooperation between Faculties of Education and Engineering Themes Academicians of Faculty of Education Academicians of Faculty of Engineering
Tools – Instruments and Material Development
-Designing various machines and preparing necessary infrastructure for engineering sciences, FEn may be useful. -FEd shall act as guidance for developed learning materials.
-New education tools and instruments may be developed.
Information Sharing / Introduction of Discipline
-Common points of two Faculties may be determined. -To reflect on possible ways of cooperating with and benefiting from the knowledge of Fed.
---
Education Technology
-In the light of educational technology knowledge on education is completed through knowledge on engineering sciences. -FEn may contribute to computer aided education studies and distance learning activities through infrastructure support”
-Use of new education approaches in technology training” -Developing and improving distance learning education systems.”
Learning Media
-FEn and Fed may benefit from each other in terms of preparing new learning media. -Physical aspects of working environment, working motivation.
---
Through themes like “Tools – Instruments and Material Development, Information Sharing/Introduction of Discipline, Education Technology, Learning Media” it has been stressed that new perspectives and practices could be developed through combining theoretical knowledge of Faculty of Education and technical infrastructure of Faculty of Engineering. An academician from FEd inserted:
“Joint studies and activities with academicians of Faculty of Education can be done in terms of adapting
different technologies and scientific studies conducted in Faculty of Engineering to the field of education…” Using the advantages of getting acquainted with different disciplines, merging the existing knowledge and melting it in the same pot in developing education technologies like distance learning and computer aided education has been mentioned. Academicians from FEn and FEd pointed out:
“Joint studies are significant in terms of developing and improving distance learning education systems.”
“….Distance learning activities could be given as a very good example indeed.”
It has also been stated that equipping learning environment in such a way that it shall meet the requirements of relevant parties will increase the efficiency and psychological satisfaction. The opinion of the academician from FEd is as follows:
“Developing new learning media, increasing the efficiency of studies, improving working environment,
industrial psychology studies aiming to increase job satisfaction.”
Table 8. Contribution of an interdisciplinary study to be conducted between Faculties of Education and Engineering to relevant parties and society.
Themes Academicians of Faculty of Education Academicians of Faculty of Engineering Culture of Compromise/Multi dimensional individuals
-The new cycle in which scientists of different disciplines work together will appear consequently shall create new perspectives. -Multidimensional individuals will be raised.
-Researchers need multi dimensional information and knowledge while dealing with a single problem. -It is very important in terms of raising engineers.
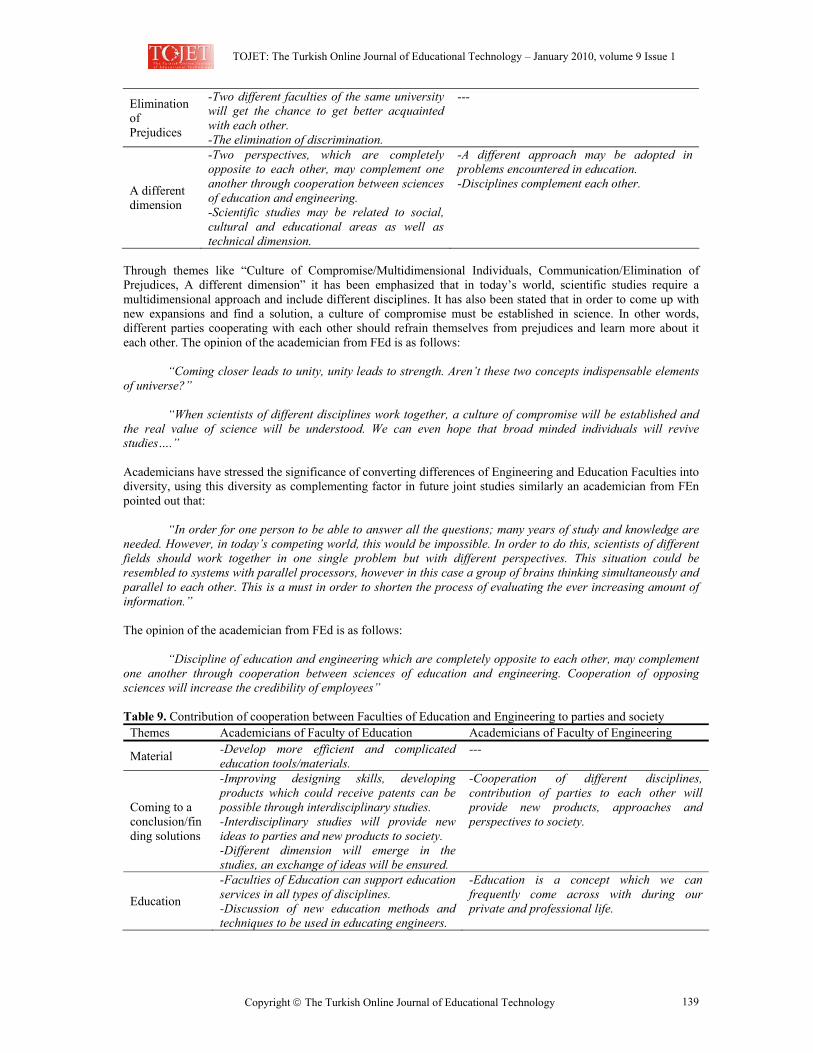
TOJET: The Turkish Online Journal of Educational Technology – January 2010, volume 9 Issue 1
Copyright The Turkish Online Journal of Educational Technology 139
Elimination of Prejudices
-Two different faculties of the same university will get the chance to get better acquainted with each other. -The elimination of discrimination.
---
A different dimension
-Two perspectives, which are completely opposite to each other, may complement one another through cooperation between sciences of education and engineering. -Scientific studies may be related to social, cultural and educational areas as well as technical dimension.
-A different approach may be adopted in problems encountered in education. -Disciplines complement each other.
Through themes like “Culture of Compromise/Multidimensional Individuals, Communication/Elimination of Prejudices, A different dimension” it has been emphasized that in today’s world, scientific studies require a multidimensional approach and include different disciplines. It has also been stated that in order to come up with new expansions and find a solution, a culture of compromise must be established in science. In other words, different parties cooperating with each other should refrain themselves from prejudices and learn more about it each other. The opinion of the academician from FEd is as follows:
“Coming closer leads to unity, unity leads to strength. Aren’t these two concepts indispensable elements of universe?”
“When scientists of different disciplines work together, a culture of compromise will be established and
the real value of science will be understood. We can even hope that broad minded individuals will revive studies….” Academicians have stressed the significance of converting differences of Engineering and Education Faculties into diversity, using this diversity as complementing factor in future joint studies similarly an academician from FEn pointed out that:
“In order for one person to be able to answer all the questions; many years of study and knowledge are
needed. However, in today’s competing world, this would be impossible. In order to do this, scientists of different fields should work together in one single problem but with different perspectives. This situation could be resembled to systems with parallel processors, however in this case a group of brains thinking simultaneously and parallel to each other. This is a must in order to shorten the process of evaluating the ever increasing amount of information.” The opinion of the academician from FEd is as follows:
“Discipline of education and engineering which are completely opposite to each other, may complement
one another through cooperation between sciences of education and engineering. Cooperation of opposing sciences will increase the credibility of employees” Table 9. Contribution of cooperation between Faculties of Education and Engineering to parties and society
Themes Academicians of Faculty of Education Academicians of Faculty of Engineering
Material -Develop more efficient and complicated education tools/materials.
---
Coming to a conclusion/finding solutions
-Improving designing skills, developing products which could receive patents can be possible through interdisciplinary studies. -Interdisciplinary studies will provide new ideas to parties and new products to society. -Different dimension will emerge in the studies, an exchange of ideas will be ensured.
-Cooperation of different disciplines, contribution of parties to each other will provide new products, approaches and perspectives to society.
Education
-Faculties of Education can support education services in all types of disciplines. -Discussion of new education methods and techniques to be used in educating engineers.
-Education is a concept which we can frequently come across with during our private and professional life.
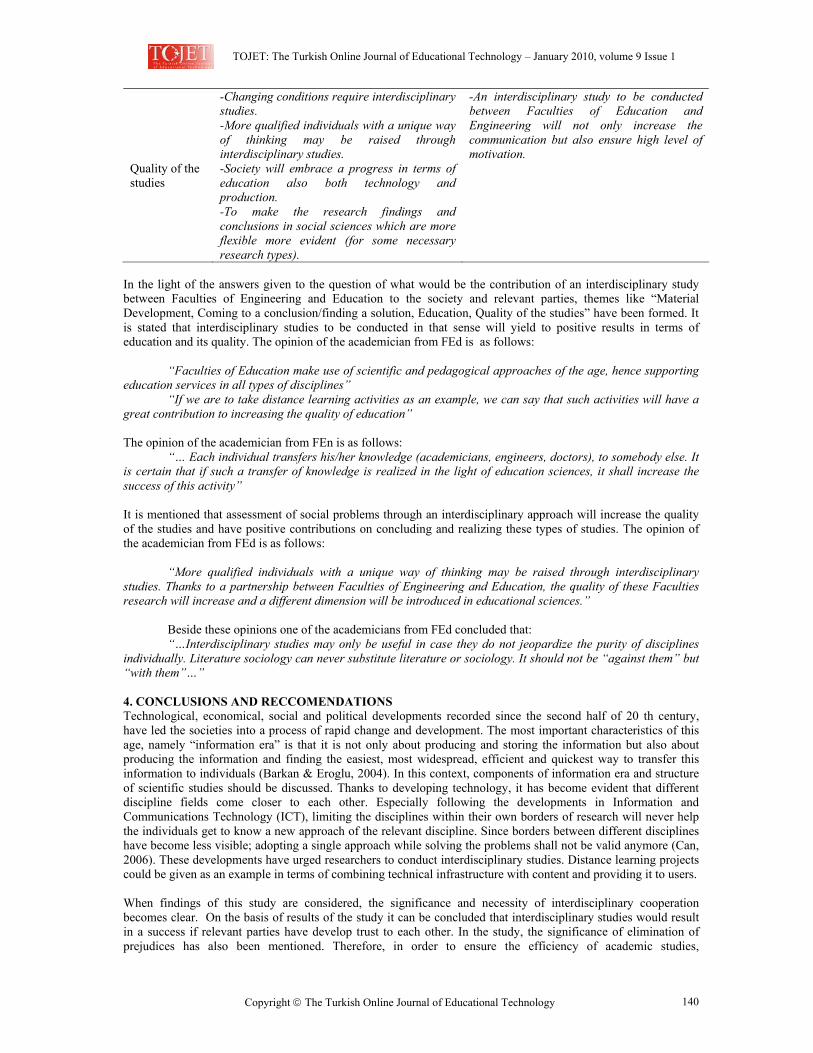
TOJET: The Turkish Online Journal of Educational Technology – January 2010, volume 9 Issue 1
Copyright The Turkish Online Journal of Educational Technology 140
Quality of the studies
-Changing conditions require interdisciplinary studies. -More qualified individuals with a unique way of thinking may be raised through interdisciplinary studies. -Society will embrace a progress in terms of education also both technology and production. -To make the research findings and conclusions in social sciences which are more flexible more evident (for some necessary research types).
-An interdisciplinary study to be conducted between Faculties of Education and Engineering will not only increase the communication but also ensure high level of motivation.
In the light of the answers given to the question of what would be the contribution of an interdisciplinary study between Faculties of Engineering and Education to the society and relevant parties, themes like “Material Development, Coming to a conclusion/finding a solution, Education, Quality of the studies” have been formed. It is stated that interdisciplinary studies to be conducted in that sense will yield to positive results in terms of education and its quality. The opinion of the academician from FEd is as follows:
“Faculties of Education make use of scientific and pedagogical approaches of the age, hence supporting education services in all types of disciplines”
“If we are to take distance learning activities as an example, we can say that such activities will have a great contribution to increasing the quality of education” The opinion of the academician from FEn is as follows:
“… Each individual transfers his/her knowledge (academicians, engineers, doctors), to somebody else. It is certain that if such a transfer of knowledge is realized in the light of education sciences, it shall increase the success of this activity” It is mentioned that assessment of social problems through an interdisciplinary approach will increase the quality of the studies and have positive contributions on concluding and realizing these types of studies. The opinion of the academician from FEd is as follows:
“More qualified individuals with a unique way of thinking may be raised through interdisciplinary
studies. Thanks to a partnership between Faculties of Engineering and Education, the quality of these Faculties research will increase and a different dimension will be introduced in educational sciences.”
Beside these opinions one of the academicians from FEd concluded that: “…Interdisciplinary studies may only be useful in case they do not jeopardize the purity of disciplines
individually. Literature sociology can never substitute literature or sociology. It should not be “against them” but “with them”…” 4. CONCLUSIONS AND RECCOMENDATIONS Technological, economical, social and political developments recorded since the second half of 20 th century, have led the societies into a process of rapid change and development. The most important characteristics of this age, namely “information era” is that it is not only about producing and storing the information but also about producing the information and finding the easiest, most widespread, efficient and quickest way to transfer this information to individuals (Barkan & Eroglu, 2004). In this context, components of information era and structure of scientific studies should be discussed. Thanks to developing technology, it has become evident that different discipline fields come closer to each other. Especially following the developments in Information and Communications Technology (ICT), limiting the disciplines within their own borders of research will never help the individuals get to know a new approach of the relevant discipline. Since borders between different disciplines have become less visible; adopting a single approach while solving the problems shall not be valid anymore (Can, 2006). These developments have urged researchers to conduct interdisciplinary studies. Distance learning projects could be given as an example in terms of combining technical infrastructure with content and providing it to users. When findings of this study are considered, the significance and necessity of interdisciplinary cooperation becomes clear. On the basis of results of the study it can be concluded that interdisciplinary studies would result in a success if relevant parties have develop trust to each other. In the study, the significance of elimination of prejudices has also been mentioned. Therefore, in order to ensure the efficiency of academic studies,
TOJET: The Turkish Online Journal of Educational Technology – January 2010, volume 9 Issue 1
Copyright The Turkish Online Journal of Educational Technology 141
interdisciplinary studies should help eliminate prejudices among different disciplines, encourage to develop new ideas and dimensions for the colleagues and personnel who are in contact with experts of other disciplines. If the case is examined in terms of Faculties of Education and Engineering, diversity and richness arising from different perspectives of two disciplines shall have a complementing effect in these studies and for finding solutions to societal problems. What is even more important here is to determine that the points of intersection and unification of two study area of these faculties correctly, hence conducting a planned interdisciplinary study. Academicians have also reflected on the significance of planning and implementation of a scientific interdisciplinary study. It is clarified that this can only be achieved through developing scientific research education and culture. In terms of education technologies; while integrating widespread practices like distance learning activities to education system, cooperation of academicians of Engineering an Education Faculties will facilitate combining theoretical information with technical infrastructure. In addition to this, the quality of the system, which has been developed through multi dimensional perspective, will increase. Richness and diversity provided by this multi dimensional perspective will be benefited while finding solutions to problems. Arranging learning media, developing materials, and computer aided education could be given as examples. Another result achieved through qualitative data of the study focuses on how to provide more efficient education by academicians recruited in Faculties of Engineering. Academicians of Faculties of Engineering and Education have pointed out that Faculty of Engineering could benefit from the knowledge of Faculty of Education in topics like; planning of the education, teaching methods and techniques, time management and evaluation. Hence, cooperation between two Faculties and its share in increasing the quality of current education system have been stressed. Moreover, regarding technological systems and models designed to increase the effectiveness in learning process, the significance of combining theoretical information with implementation and evaluating the outputs of these practices have been emphasized. Determination of areas in which Faculties of Engineering and Education can cooperate as well as conducting joint studies will be a positive step in the universities in order to increase the quality of higher education. Hence; open minded scientists equipped with more integrated approach will be raised. In this way sharing of knowledge between different disciplines can be possible. For instance, in the case that M.A. and PhD degree theses are prepared with the support of two advisers from both disciplines, would be much more unique. A similar approach can be adopted in projects implemented by researchers. As a consequence participants which are from faculties of education and engineering have a considerably point of view about interdisciplinary studies. Especially the one of the important contribution of interdisciplinary studies between these two faculties is integration of new technologies into the education. It is suggested that there will be new approaches that pale to gain in the process of integrating technology into the education by sharing knowledge. It is important to emphasize the importance of introducing interdisciplinary cooperation in B.A. degrees or even during earlier stages of education life. 5. REFERENCES Adams, F. R., Crepy, H., Jameson, D. & Thatcher, J. (1989). IBM Products for Persons with Disabilities. IEEE,
Vol. 2, 980 – 984. Aslan, D. (2006). Disiplinler arası isbirligi, Cumhuriyet Bilim Teknik Dergisi. Barkan, M., & Eroglu, E. (2004). Uzaktan Ogretimde Kalite: “Sayisal Buyuklukler Doyuma Ulasti.. Ya simdi?”.
The Turkish Online Journal of Educational Technology, 3, 4. Bälter, O., Engwall, O., Öster, A-M., & Kjellström, H. (2005). Wizard-of-Oz Test of ARTUR - a Computer-Based
Speech Training System with Articulation Correction. In Proceedings of the Seventh International ACM SIGACCESS Conference on Computers and Accessibility, Baltimore, 36-43. doi: 10.1145/1090785.1090795].
Bunnell, H.T., Yarrington, D.M. and Polikoff, J.B., (2000). STAR: articulation training for young children. In Proceedings of the 6th International Conference on Spoken Language Processing, Beijing, China, Vol. 4, pp. 85-88.
Can, S. (2006). Turkiye’de Sosyal Bilimler Uzerine Duşunmek. Bilim ve Aklin Aydinliginda Egitim Dergisi, 75. Cook-Sather, A., & Shore, E. (2007). Breaking the rule of discipline in interdisciplinarity: Redefining professors,
students, and staff as faculty. Journal of Research Practice, 3(2), Article M15. Dural, A. B. (2007). Piyasa Ilişkileri Baglamında Bilimsel Bilginin Yeniden Uretimi ve Turkiye’de Sosyal
Bilimlerin Yakın Gelecegi. Universite ve Toplum, 7, 4. Engwall, O. (2004). From real-time MRI to 3D tongue movements. In Kim, S. H. &. Y. (Eds.), Proc ICSLP 2004,
Jeju Island, Korea, 1109-1112.
TOJET: The Turkish Online Journal of Educational Technology – January 2010, volume 9 Issue 1
Copyright The Turkish Online Journal of Educational Technology 142
Engwall, O., Wik, P., Beskow, J., & Granström, G. (2004). Design strategies for a virtual language tutor. In Kim, S. H. &. Y. (Eds.), Proc ICSLP 2004, Jeju Island, Korea, 1693-1696.
Engwall, O. (2006). Assessing MRI measurements: Effects of sustenation, gravitation and coarticulation. In Harrington, J., & Tabain, M. (Eds.), Speech production: Models, Phonetic Processes and Techniques. New York: Psychology Press, 301-314.
Engwall, O. (2006). Feedback strategies of human and virtual tutors in pronunciation training. TMH-QPSR, 48(1), 011-034.
Engwall, O., Bälter, O., Öster, A-M., & Kjellström, H. (2006). Designing the user interface of the computer-based speech training system ARTUR based on early user tests. Journal of Behavioural and Information Technology, 25(4), 353-365.
Engwall, O., Bälter, O., Öster, A-M., & Kjellström, H. (2006). Feedback management in the pronunciation training system ARTUR. In Proceedings of CHI 2006, Montreal, 231-234.
Engwall, O., Abdou, S., & Bälter, O. (2007). Audio-visual phoneme classification for pronunciation training applications. In Proceedings of Interspeech, Antwerpen, Belgium, 702-705.
Erdem, A. R. (2006).Dunyada Yuksekogretimin Degisimi. Selcuk Universitesi Sosyal Bilimler Enstitusu Dergisi, 15, 299–314.
Eriksson, E., Bälter, O., Engwall, O., Öster, A-M., & Kjellström, H. (2005). Design Recommendations for a Computer-Based Speech Training System Based on End-User Interviews. In Proceedings of the Tenth International Conference on Speech and Computers, Patras, Greece, 483-486.
Karal,H., & Reisoglu, I. (2008). A New Education Tool for Physical and Hearing Disabled Students: Haptic. 2nd In Proceedings of International Conference on Special Education. Mugla-Turkey.
Karasar, S. (2004). Egitimde Yeni Iletisim Teknolojileri -Internet ve Sanal Yuksek Egitim. The Turkish Online Journal of Educational Technology, 3, 4, 16.
Kewley-Port, D., Watson, C. S., Maki, D. & Reed D., (1987). Speaker-dependent speech recognition as the basis for a speech training aid. IEEE, 372-375.
Ma, Q. & Kelly, P. (2006). Computer Assisted Vocabulary Learning: Design and evaluation. Computer Assisted Language Learning, 19(1), 15 – 45.
Marsap, A., Ozsoy N., & Koçak, Z. F. (2004). Işletme ve Matematik Egitiminde Disiplinler Arası Egitimin Onemi. In Proceedings of International IV. Educational Technology Conference, Sakarya-Turkey, 636-639.
Massaro, D. W. (2004). Symbiotic Value of an Embodied Agent in Language Learning. Proceedings of the 37th Hawaii International Conference on System Sciences.
Milli Egitim Bakanlıgı (MEB). (2004). Egitim Bilimleri Bakış Açısıyla Egitimin Güncel Sorunları ve Cozum Onerileri Konulu Calıştay Ve Degerlendirme Toplantısı Sonuc Bildirgesi. Resource document. Republic of Turkey Ministry of National Education. http://mete.meb.gov.tr/genelguncelsorunlar/genelguncel. htm.
Ozkok, A. (2005). Disiplinlerarasi Yaklasima Dayali Yaratici Problem Cozme Ogretim Programinin Yaratici problem Cozme Becerisine Etkisi (The Influence of the Creative Problem Solving Teaching Curriculum Based on Interdisciplinary Approach To The Ability Of Creative Problem Solving) . H.U. Egitim Fakultesi Dergisi. 28 (159-167).
Strommen, E. F., & Lincoln, B. (1992). Constructivism, Technology, and the Future of Classroom Learning. Education and Urban Society, 24(4), 466-476.
Szostak, R. (2007). How and why to teach interdisciplinary research practice. Journal of Research Practice, 3(2), Article M17.
Soleymanı, A.J.A., Mccutcheon, M.J. & Southwood, M.H., (1997). Design of speech mentor (SIM) for teaching speech to the hearing impaired. In Proceedings of the Sixteenth Southern Biomedical Engineering Conference, Biloxi, MS, 425 – 428.
Williams II, R. L., Chen, M. & Seaton, J. M. (2003). Haptics-Augmented Simple-Machine Educational Tools. Journal of Science Education and Technology, 12, 1.
TOJET: The Turkish Online Journal of Educational Technology – January 2010, volume 9 Issue 1
Copyright The Turkish Online Journal of Educational Technology 143
PRE-SERVICE ENGLISH LANGUAGE TEACHERS’ PERCEPTIONS OF COMPUTER SELF-EFFICACY AND GENERAL SELF-EFFICACY
Ece ZEHİR TOPKAYA
Çanakkale Onsekiz Mart University [email protected]
ABSTRACT The primary aim of this study is to investigate pre-service English language teachers’ perceptions of computer self-efficacy in relation to different variables. Secondarily, the study also explores the relationship between pre-service English language teachers’ perceptions of computer self-efficacy and their perceptions of general self-efficacy. To this end, in 2007-2008 Academic Year Fall Term a sample of 288 pre-service English language teachers at Çanakkale Onsekiz Mart University was surveyed. Three basic research instruments were used to collect data: The Computer Self-Efficacy Scale (Aşkar and Umay, 2001), The General Self-Efficacy Scale (Schwarzer and Jerusalem, 1995), and a survey questionnaire designed to obtain personal information and previous computer experience from the participants. The data were analyzed with the use of descriptive statistics. Frequencies and percentages were calculated and t-test, one-way ANOVA, and correlation analyses were used in the analysis of the data. The significant level was taken as .05. The findings indicated that pre-service English teachers had a moderate level of computer self-efficacy perceptions. Computer experience, frequency of use and gender were identified to create a significant difference in the perception of computer self-efficacy (p< .05). Concerning grade levels, only between 1st and 4th ones a significant difference was found (p<.05). The correlation analysis between general sense of self-efficacy and computer self-efficacy revealed a moderate and a positive correlation between the two psychological constructs. Finally, the regression analysis showed that computer experience was the variable that affected the computer self-efficacy beliefs of pre-service English teachers most. Key words: Computer self-efficacy, general self-efficacy, pre-service English teachers
INTRODUCTION The rise in computer technology in recent years has given way to its use as an instructional tool in educational settings. Both teachers and learners greatly benefit from using it. While it enables teachers to address to different learning styles, helps provide effective instruction by assisting them in every activity in the teaching process, it increases learner motivation, minimizes pressure and fear, and enhances social development of learners (Şahin and Yıldırım, 1999; Akkoyunlu, 2002; Demirel, 2002; Yalın, 2004; Koç, 2005). The successful use of technologies in the classroom depends on several factors such as funding, dynamic lesson plans, decisions concerning hardware, software, and so forth (Bitner and Bitner, 2002: 95). Yet, whether all these factors will yield the wanted learning outcomes or not is usually determined by one individual, the teacher since it is the teacher’s skills, beliefs, attitudes, perceptions, opinions, personality, knowledge, among many other factors, that affect the choices she makes about what, when, and how to teach through using computer technologies (Nespor, 1987; Bitner and Bitner, 2002). Among these factors, however, computer affect “such as attitudes, values, and self-judgments can exert a profound effect on behaviors” (Milbrath and Kinzie, 2000: 373). Therefore, if teachers are expected to be effective users of computer technologies, it is essential that they have positive attitudes and high self-efficacy perceptions in using them. As in other subject areas, there is a strong interest in technology use in foreign language teaching and learning as well. Two decades ago while the researchers were more concerned about describing and examining computer technology, today the focus is on investigating how to use it to teach and learn languages more effectively (Liu et al., 2002). Several studies have proved that the use of computer technologies have a positive effect on the achievement level of language learners (Lai and Kristonis, 2006: 1). Promoting learners’ motivation (Lee, 2000; Hamerstorm et al., 1985) and self-esteem (Dunkel, 1990), providing experiential learning (Lee, 2000), enhancing specific language skills such as reading (Chun and Plass, 1996; Tozcu and Coady, 2004), writing (Al-Jarf, 2004) and vocabulary learning (Liu, 1994; Tozcu and Coady, 2004) are all among the benefits of computer technology use in foreign language classrooms. Apart from these advantages, using computer technologies in language classrooms also prepare learners for today’s information society because through the authentic tasks like keeping electronic portfolios, writing e-mails, conducting on-line chats, doing online research can help them learn not only the foreign language but also the use of computers (Wang, 2005).
TOJET: The Turkish Online Journal of Educational Technology – January 2010, volume 9 Issue 1
Copyright The Turkish Online Journal of Educational Technology 144
Despite these advantages, however, integration of computer technologies in classroom teaching still bears some problems. Financial and technical problems are certainly beyond what teachers can handle in their own classrooms, yet those problems related to affect, that is self-efficacy beliefs, values, judgments, can be solved through support and education and it should start with pre-service teacher education. The concept of self-efficacy Self-efficacy, a psychological construct first proposed by Bandura in 1977, can be described as “a belief about one’s own capability to organize and complete a course of action required to accomplish a specific task” (Eggen and Kauchak, 2007: 310). As can be understood from the definition, self-efficacy “is concerned ... with judgments of what one can do with whatever skills they possess” (Bandura, 1986: 391). It consists of two components, efficacy expectations, which are related to belief in personal capacity to affect behavior, and outcome expectations, which is a belief that the behavior will result in a particular outcome (Albion, 1999). Several research studies indicate that depending on these sources of judgments, individuals have negative or positive ideas about a behavior before they undertake it and these ideas affect their course of action (Bandura, 1986; Albion, 2001). People’s beliefs about their capability of succeeding on particular tasks are influenced by four main factors: past performance, modeling, verbal persuasion, and psychological state (Bandura, 1986). Of these, successful past performance on similar tasks, in other words “enactive experience”, is the most important factor influencing self-efficacy (Eggen and Kauchack, 2007). The second factor is modeling in which self-efficacy for a behavior is increased by observing similar people performing the behavior successfully. A third factor is verbal persuasion, which can encourage individuals to do tasks. Finally, different psychological states such as anxiety, stress, fatigue, hunger can influence self-efficacy beliefs and thus individuals can feel incapable of handling a task (Albion, 1999; Scholz et al., 2002). As mentioned above, the most significant effect of self-efficacy beliefs on human behavior is their influence on “people’s decisions, goals, their amount of effort in conducting a task, and the length of time they would preserve through obstacles and difficulties” (Khorrami-Arani, 2001: 18). Therefore, it is commonly associated with motivation and academic success. People with high self-efficacy set themselves higher goals, stick to them, and undertake the action. They invest more effort, time and energy than those low in self-efficacy. If they fail, they recover more quickly and seek ways to accomplish their goals (Scholz et al., 2002). Self-efficacy has been found to be domain specific. In other words, an individual can have high self- efficacy in one domain or situation, for instance physical activities, while he has low self-efficacy perceptions in another, for instance mathematics. It is for this reason that self-efficacy as a psychological construct and its relationship with behavior have been investigated in different disciplines such as business, psychology, medicine, sports, and career development in relation to different variables including gender, experience, age and so forth. Similarly, in the field of education, research studies that have been carried out to understand self-efficacy beliefs of teachers and learners shed light on the effects of these beliefs on their behavior (Hazır Bıkmaz, 2004: 289). In recent years, however, the idea that self-efficacy could be a universal construct has attracted attention and several researchers have started studying it (Sherer et al., 1982; Schwarzer and Jerusalem, 1995; Chen et al., 2001; Scholtz et al. 2002). As a result, a generalized sense of self-efficacy (GSE), which can be defined as “situation-independent competence belief”, that is, a global confidence in one’s abilities in different situations, has been conceptualized (Scherbaum, 2006: 1048). There have been many criticisms of GSE, most of which have been specifically related to its measurement. However, several psychometric studies have proved that it is a unidimensional, universal and measurable construct (Sherer et al., 1982; Schwarzer and Jerusalem, 1995; Chen et al., 2001; Scholtz et al., 2002; Scherbaum, 2006).
Computer self-efficacy Computer self-efficacy is also based upon Bandura’s self-efficacy theory. It is defined as “a judgment of one’s capability to use a computer” (Compeau and Higgins, 1995: 192). In general, it is believed that people who have high self-efficacy in the use of computers will invest more time and be more willing to learn and do new things with computers (Kinzie, Delcourt and Powers, 1994). Computer self-efficacy has been investigated in several contexts including business (eg. Compeau and Higgins, 1995) and education with students at all levels (eg. Summers, 1990, Kinzie, Delcourt and Powers, 1994; Karsten and Roth, 1998; Aşkar and Umay, 2001; Akkoyunlu and Kurbanoğlu, 2003) as well as teachers (eg; Marcinkiewicz, 1994, Yusuf, 2005; Özçelik and Kurt, 2007).
TOJET: The Turkish Online Journal of Educational Technology – January 2010, volume 9 Issue 1
Copyright The Turkish Online Journal of Educational Technology 145
The findings of these studies show that owning a computer, previous successful experience and the frequency of access to computers have high correlation with computer self-efficacy (Karsten and Roth, 1998, Hakverdi et al., 2007; Torkzadeh and Koufterous, 1994, Houle, 1996). Another study by Kinzie, Delcourt and Powers (1994) indicates that positive attitudes toward computer technologies are significantly related to computer self-efficacy. In several other studies perceived computer self-efficacy has been found to be significantly correlated with the decisions about using them (Hill, Smith and Mann, 1987; Marcinkiewicz, 1994). Likewise, many studies conducted in Turkey also reveal similar results (see Aşkar and Umay, 2001; Akkoyunlu and Orhan, 2003; Yılmaz et al., 2006; Hakverdi et al., 2007). As for the measurement of computer self-efficacy, many instruments have been developed. One of the most popular of these is a scale developed by Murphy et al. (1989 cited in Khorrami-Arani, 2001). In Turkey, the computer-self efficacy scale, which was developed by Aşkar and Umay (2001), is a well known and frequently used one in the field of computer self-efficacy of pre-service teachers.
Teachers and computer self-efficacy As the pedagogical effectiveness of using computers is widely recognized, all teachers are expected to use them as teaching and learning tools in their classrooms. To do this, however, teachers themselves should be willing to use them. Different studies investigating the relationship between teachers’ use of computer technologies and different variables such as self-efficacy beliefs, attitudes towards and knowledge about computer technologies, perceptions of computers as educational tools so and so forth have revealed that there is a significant correlation between all these variables (Koç, 2005). In other words, the acceptance of computers and their use in the teaching and learning processes as a tool is largely determined by the beliefs, perceptions, and attitudes of teachers (Bitner and Bitner, 2002; Aşkar and Umay, 2001; Milbrath and Kinzie, 2000; Albion, 1999). Therefore, not only should all these psychological constructs be investigated closely but also ways to improve them should be sought. Several research studies show that teachers who have high self-efficacy use computer technologies in their classes more (Aşkar and Umay, 2001, Özçelik and Kurt, 2007). However, to develop such self-efficacy, teachers need to be introduced to computer technologies systematically and be engaged in activities that will provide them with positive experiences with regard to computer use (Valanides and Angeli, 2008). To this end, starting from 1998 in Turkey, Computer I and II and Instructional Technologies and Material Development compulsory courses have been integrated into teacher education programs. Thus, pre-service teachers are expected to posses both skills in the use of computer technologies and positive belief in their capacity to integrate them into their teaching (Albion, 1999). In this context, self-efficacy beliefs appear to forecast the likely use of computers by pre-service teachers in their future work settings, since people’s beliefs about their capabilities are so central and pervasive in human action (Bandura, 1989). Both in Turkey and abroad several studies have been conducted to investigate the computer self-efficacy perceptions of teachers as cited above. The literature on foreign language teachers’ perceptions are, however, scarce. This particular study, therefore, sets out to contribute to the understanding of computer-self efficacy perceptions of pre-service English teachers.
PURPOSE OF THE STUDY This study investigated the computer self-efficacy of pre-service English teachers with regard to different variables such as gender and grade differences, the frequent use of computers, and computer experience. Also, this study examined the likely relationship between the computer self-efficacy perceptions and general self-efficacy perceptions of pre-service teachers. With these purposes in mind, the present study tried to answer the following research questions:
1. What are the computer self-efficacy perceptions of pre-service English teachers? 2. Is there a difference between the computer self-efficacy perceptions of pre-service English teachers
and their gender, grade level, the frequency of computer use, and computer experience? 3. Is there a correlation between computer self-efficacy perceptions and general self-efficacy
perceptions? 4. Which variable is the most important predictor of computer self-efficacy?
METHODOLOGY Method In this study survey methodology design was used to describe pre-service English teachers’ computer self-efficacy perceptions as well as general self-efficacy perceptions.
TOJET: The Turkish Online Journal of Educational Technology – January 2010, volume 9 Issue 1
Copyright The Turkish Online Journal of Educational Technology 146
Setting and Participants The study was conducted at Çanakkale Onsekiz Mart University in 2007-2008 academic year. 286 pre-service teachers at the Faculty of Education, English Language Teaching (ELT) Department participated in the study. The distribution of the sample in relation to gender and grade level is given in Table 1 below.
Table 1: Demographic information about the participants
Category Level f % Gender
Male Female
232 56
80.6 19.4
Grade Preparation 1st year 2nd year 3rd year 4th year
63 61 48 57 59
21.9 21.2 16.7 19.8 20.5
Of the 288 pre-service teachers who participated in the study, 232 of them (80.6 %) were female while 56 of them (19.4 %) were male. The difference in the numbers is not surprising because teaching departments are mostly preferred by female students in Turkey. Also when the number of students enrolled in the ELT Department at the time of the study is taken into account, which is 600, it is seen that almost half of the students were reached, which indicates a high degree of representativeness. The participants in the study were also asked to answer three questions in order to reveal their relation to computers. Table 2 provides information that describes the pre-service teachers’ computer experience, frequency of access to computers and possessing a computer.
Table 2: Participants’ characteristics in relation to computers
Category Level f % Possessing a computer (N=288) Yes
No 184 104
63.9 36.1
Experience (N=284)
No experience at all Limited experience Some experience Quite a lot of experience A lot of experience
6 32 90
132 24
2.1 11.3 31.7 46.5 8.5
Frequency of use (N= 285)
Everyday continuously A couple of hours a day A couple of hours a week A couple of days a week A couple of hours a month Never
42 98 68 62 14 1
14.7 34.4 23.9 21.8 4.9 .4
184 student teachers (63.9 %) reported that they had computers, while 104 of them (36.1 %) stated that they did not have any computers. The relatively high percentage of the pre-service teachers’ possessing a computer can be taken as an indicator of their familiarity with computers. As informally observed, every year the number of student teachers having computers is increasing, which may be the sign that they will, as teachers in the future, integrate computers more in their teaching since different research findings show that familiarity is an important factor in the use of computers while teaching (Aşan, 2003; Edwards, 2005). The answers given to the question related to computer experience revealed that a majority of students were experienced in their use of computers while only 6 student teachers (2.1 %) reported that they had no experience at all. To the question about the frequency of use, pre-service teachers’ answers varied. Nearly half of the students reported using computers every day continuously (42; 14.7 %) or a couple of hours a day (98; 34.4 %). Only a small number of students reported using them a couple of hours a month (14; 4.9 %) or never (1; .4 %).
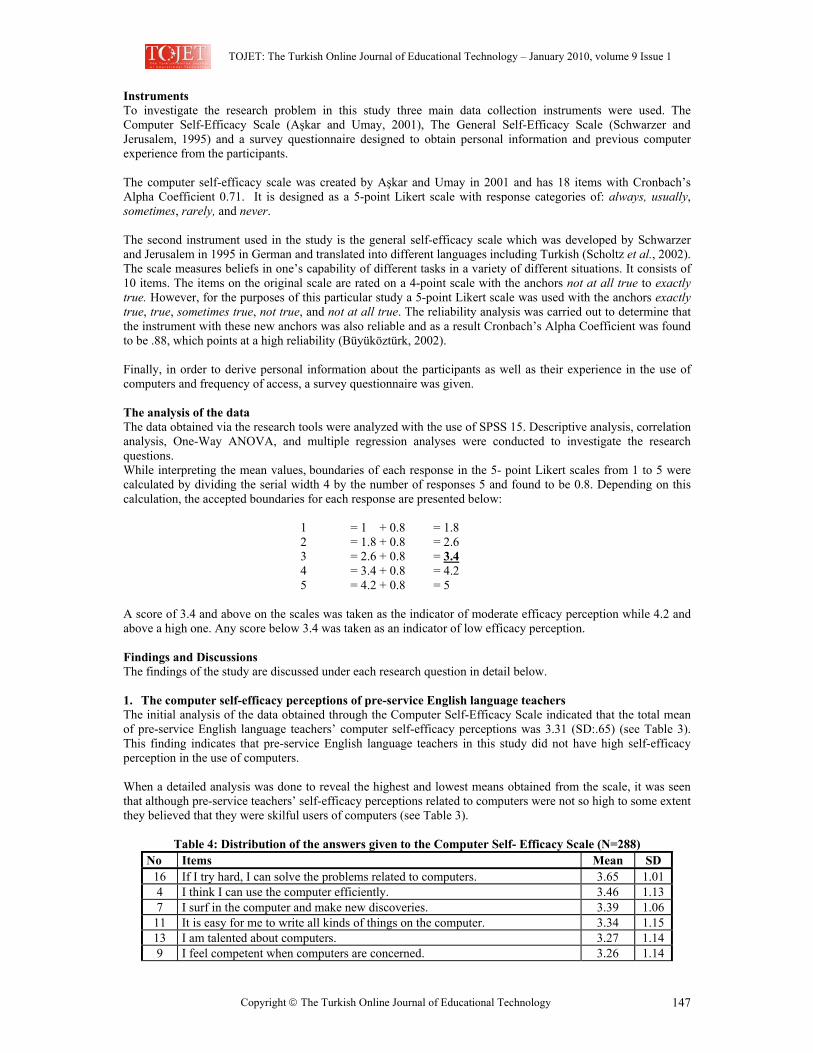
TOJET: The Turkish Online Journal of Educational Technology – January 2010, volume 9 Issue 1
Copyright The Turkish Online Journal of Educational Technology 147
Instruments To investigate the research problem in this study three main data collection instruments were used. The Computer Self-Efficacy Scale (Aşkar and Umay, 2001), The General Self-Efficacy Scale (Schwarzer and Jerusalem, 1995) and a survey questionnaire designed to obtain personal information and previous computer experience from the participants. The computer self-efficacy scale was created by Aşkar and Umay in 2001 and has 18 items with Cronbach’s Alpha Coefficient 0.71. It is designed as a 5-point Likert scale with response categories of: always, usually, sometimes, rarely, and never. The second instrument used in the study is the general self-efficacy scale which was developed by Schwarzer and Jerusalem in 1995 in German and translated into different languages including Turkish (Scholtz et al., 2002). The scale measures beliefs in one’s capability of different tasks in a variety of different situations. It consists of 10 items. The items on the original scale are rated on a 4-point scale with the anchors not at all true to exactly true. However, for the purposes of this particular study a 5-point Likert scale was used with the anchors exactly true, true, sometimes true, not true, and not at all true. The reliability analysis was carried out to determine that the instrument with these new anchors was also reliable and as a result Cronbach’s Alpha Coefficient was found to be .88, which points at a high reliability (Büyüköztürk, 2002). Finally, in order to derive personal information about the participants as well as their experience in the use of computers and frequency of access, a survey questionnaire was given. The analysis of the data The data obtained via the research tools were analyzed with the use of SPSS 15. Descriptive analysis, correlation analysis, One-Way ANOVA, and multiple regression analyses were conducted to investigate the research questions. While interpreting the mean values, boundaries of each response in the 5- point Likert scales from 1 to 5 were calculated by dividing the serial width 4 by the number of responses 5 and found to be 0.8. Depending on this calculation, the accepted boundaries for each response are presented below:
1 = 1 + 0.8 = 1.8 2 = 1.8 + 0.8 = 2.6 3 = 2.6 + 0.8 = 3.4 4 = 3.4 + 0.8 = 4.2 5 = 4.2 + 0.8 = 5
A score of 3.4 and above on the scales was taken as the indicator of moderate efficacy perception while 4.2 and above a high one. Any score below 3.4 was taken as an indicator of low efficacy perception. Findings and Discussions The findings of the study are discussed under each research question in detail below.
1. The computer self-efficacy perceptions of pre-service English language teachers The initial analysis of the data obtained through the Computer Self-Efficacy Scale indicated that the total mean of pre-service English language teachers’ computer self-efficacy perceptions was 3.31 (SD:.65) (see Table 3). This finding indicates that pre-service English language teachers in this study did not have high self-efficacy perception in the use of computers. When a detailed analysis was done to reveal the highest and lowest means obtained from the scale, it was seen that although pre-service teachers’ self-efficacy perceptions related to computers were not so high to some extent they believed that they were skilful users of computers (see Table 3).
Table 4: Distribution of the answers given to the Computer Self- Efficacy Scale (N=288)
No Items Mean SD 16 If I try hard, I can solve the problems related to computers. 3.65 1.01 4 I think I can use the computer efficiently. 3.46 1.13 7 I surf in the computer and make new discoveries. 3.39 1.06
11 It is easy for me to write all kinds of things on the computer. 3.34 1.15 13 I am talented about computers. 3.27 1.14 9 I feel competent when computers are concerned. 3.26 1.14
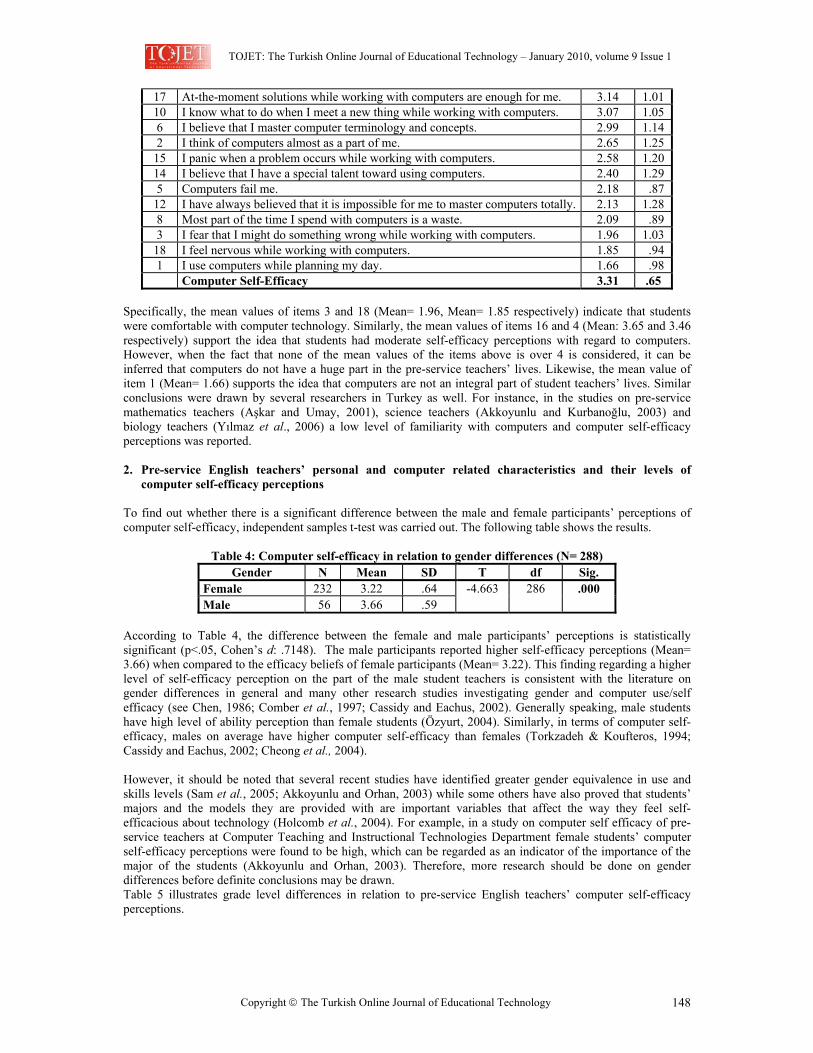
TOJET: The Turkish Online Journal of Educational Technology – January 2010, volume 9 Issue 1
Copyright The Turkish Online Journal of Educational Technology 148
17 At-the-moment solutions while working with computers are enough for me. 3.14 1.01 10 I know what to do when I meet a new thing while working with computers. 3.07 1.05 6 I believe that I master computer terminology and concepts. 2.99 1.14 2 I think of computers almost as a part of me. 2.65 1.25
15 I panic when a problem occurs while working with computers. 2.58 1.20 14 I believe that I have a special talent toward using computers. 2.40 1.29 5 Computers fail me. 2.18 .87
12 I have always believed that it is impossible for me to master computers totally. 2.13 1.28 8 Most part of the time I spend with computers is a waste. 2.09 .89 3 I fear that I might do something wrong while working with computers. 1.96 1.03
18 I feel nervous while working with computers. 1.85 .94 1 I use computers while planning my day. 1.66 .98
Computer Self-Efficacy 3.31 .65 Specifically, the mean values of items 3 and 18 (Mean= 1.96, Mean= 1.85 respectively) indicate that students were comfortable with computer technology. Similarly, the mean values of items 16 and 4 (Mean: 3.65 and 3.46 respectively) support the idea that students had moderate self-efficacy perceptions with regard to computers. However, when the fact that none of the mean values of the items above is over 4 is considered, it can be inferred that computers do not have a huge part in the pre-service teachers’ lives. Likewise, the mean value of item 1 (Mean= 1.66) supports the idea that computers are not an integral part of student teachers’ lives. Similar conclusions were drawn by several researchers in Turkey as well. For instance, in the studies on pre-service mathematics teachers (Aşkar and Umay, 2001), science teachers (Akkoyunlu and Kurbanoğlu, 2003) and biology teachers (Yılmaz et al., 2006) a low level of familiarity with computers and computer self-efficacy perceptions was reported.
2. Pre-service English teachers’ personal and computer related characteristics and their levels of
computer self-efficacy perceptions
To find out whether there is a significant difference between the male and female participants’ perceptions of computer self-efficacy, independent samples t-test was carried out. The following table shows the results.
Table 4: Computer self-efficacy in relation to gender differences (N= 288)
Gender N Mean SD T df Sig. Female 232 3.22 .64 Male 56 3.66 .59
-4.663 286 .000
According to Table 4, the difference between the female and male participants’ perceptions is statistically significant (p<.05, Cohen’s d: .7148). The male participants reported higher self-efficacy perceptions (Mean= 3.66) when compared to the efficacy beliefs of female participants (Mean= 3.22). This finding regarding a higher level of self-efficacy perception on the part of the male student teachers is consistent with the literature on gender differences in general and many other research studies investigating gender and computer use/self efficacy (see Chen, 1986; Comber et al., 1997; Cassidy and Eachus, 2002). Generally speaking, male students have high level of ability perception than female students (Özyurt, 2004). Similarly, in terms of computer self-efficacy, males on average have higher computer self-efficacy than females (Torkzadeh & Koufteros, 1994; Cassidy and Eachus, 2002; Cheong et al., 2004). However, it should be noted that several recent studies have identified greater gender equivalence in use and skills levels (Sam et al., 2005; Akkoyunlu and Orhan, 2003) while some others have also proved that students’ majors and the models they are provided with are important variables that affect the way they feel self-efficacious about technology (Holcomb et al., 2004). For example, in a study on computer self efficacy of pre-service teachers at Computer Teaching and Instructional Technologies Department female students’ computer self-efficacy perceptions were found to be high, which can be regarded as an indicator of the importance of the major of the students (Akkoyunlu and Orhan, 2003). Therefore, more research should be done on gender differences before definite conclusions may be drawn. Table 5 illustrates grade level differences in relation to pre-service English teachers’ computer self-efficacy perceptions.
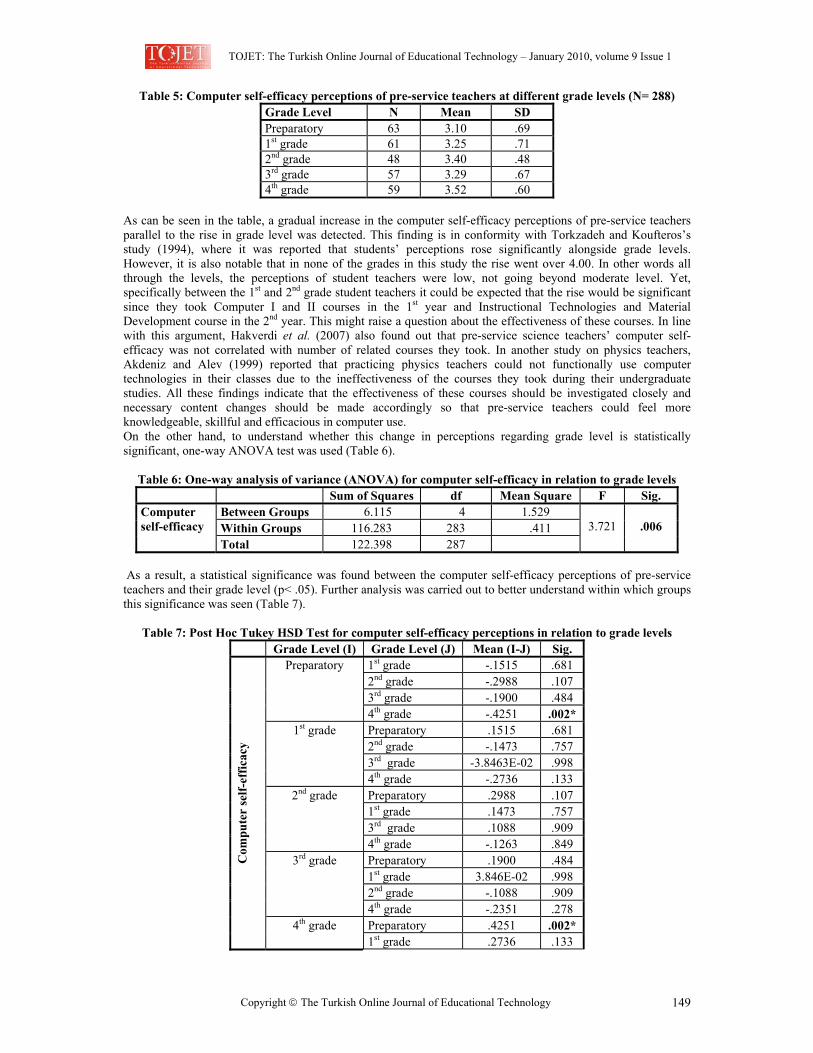
TOJET: The Turkish Online Journal of Educational Technology – January 2010, volume 9 Issue 1
Copyright The Turkish Online Journal of Educational Technology 149
Table 5: Computer self-efficacy perceptions of pre-service teachers at different grade levels (N= 288) Grade Level N Mean SD Preparatory 63 3.10 .69 1st grade 61 3.25 .71 2nd grade 48 3.40 .48 3rd grade 57 3.29 .67 4th grade 59 3.52 .60
As can be seen in the table, a gradual increase in the computer self-efficacy perceptions of pre-service teachers parallel to the rise in grade level was detected. This finding is in conformity with Torkzadeh and Koufteros’s study (1994), where it was reported that students’ perceptions rose significantly alongside grade levels. However, it is also notable that in none of the grades in this study the rise went over 4.00. In other words all through the levels, the perceptions of student teachers were low, not going beyond moderate level. Yet, specifically between the 1st and 2nd grade student teachers it could be expected that the rise would be significant since they took Computer I and II courses in the 1st year and Instructional Technologies and Material Development course in the 2nd year. This might raise a question about the effectiveness of these courses. In line with this argument, Hakverdi et al. (2007) also found out that pre-service science teachers’ computer self-efficacy was not correlated with number of related courses they took. In another study on physics teachers, Akdeniz and Alev (1999) reported that practicing physics teachers could not functionally use computer technologies in their classes due to the ineffectiveness of the courses they took during their undergraduate studies. All these findings indicate that the effectiveness of these courses should be investigated closely and necessary content changes should be made accordingly so that pre-service teachers could feel more knowledgeable, skillful and efficacious in computer use. On the other hand, to understand whether this change in perceptions regarding grade level is statistically significant, one-way ANOVA test was used (Table 6).
Table 6: One-way analysis of variance (ANOVA) for computer self-efficacy in relation to grade levels Sum of Squares df Mean Square F Sig.
Between Groups 6.115 4 1.529 Within Groups 116.283 283 .411
Computer self-efficacy
Total 122.398 287
3.721
.006
As a result, a statistical significance was found between the computer self-efficacy perceptions of pre-service teachers and their grade level (p< .05). Further analysis was carried out to better understand within which groups this significance was seen (Table 7).
Table 7: Post Hoc Tukey HSD Test for computer self-efficacy perceptions in relation to grade levels Grade Level (I) Grade Level (J) Mean (I-J) Sig.
1st grade -.1515 .681 2nd grade -.2988 .107 3rd grade -.1900 .484
Preparatory
4th grade -.4251 .002* Preparatory .1515 .681 2nd grade -.1473 .757 3rd grade -3.8463E-02 .998
1st grade
4th grade -.2736 .133 Preparatory .2988 .107 1st grade .1473 .757 3rd grade .1088 .909
2nd grade
4th grade -.1263 .849 Preparatory .1900 .484 1st grade 3.846E-02 .998 2nd grade -.1088 .909
3rd grade
4th grade -.2351 .278 Preparatory .4251 .002*
Com
pute
r se
lf-ef
ficac
y
4th grade 1st grade .2736 .133

TOJET: The Turkish Online Journal of Educational Technology – January 2010, volume 9 Issue 1
Copyright The Turkish Online Journal of Educational Technology 150
2nd grade .1263 .849 3rd grade .2351 .278
As is evident in Table 7, Post Hoc Tukey HSD test revealed a significant difference only between the computer efficacy perceptions of the 1st and 4th grade student teachers (p< .05). However, it should be noted that the significance found here may be in support of the significance of experience on computer self-efficacy perceptions rather than grade levels. That is, naturally through the years student teachers spend more time working with computers due to certain course requirements and this may affect their self-efficacy perceptions. As for the variable, possessing a computer, again the statistical analysis showed a significant difference (p<.01) (Table 8).
Table 8: Computer self-efficacy in relation to possessing a computer Possessing a computer N Mean SD t df Sig.
Yes 184 3.52 .57 No 104 2.93 .62
8.276 286 .000
At this point, however, it would not be wrong to claim that owning computers also means more time spent on them, which leads to greater experience. From this perspective, therefore, this result might also contribute to the fact that computer self-efficacy is more related to experience. In literature one of the factors influencing computer self-efficacy has been identified to be the frequency of computer use. A similar conclusion was reached in this study as well (see Table 9).
Table 9: Mean values for computer self-efficacy perceptions in relation to frequency of use Frequency of computer use N Mean SD Everyday continuously 42 3.72 .62 A couple of hours a day 98 3.64 .45 A couple of days a week 62 3.12 .60 A couple of hours a week 68 2.93 .58 A couple of hours a month 14 2.50 .42 Never 1 2.17 . Total 285 3.31 .66
As the table illustrates, those student teachers who reported to use computers every day either continuously or a couple of hours appeared to have higher perceptions of computer self-efficacy (Mean= 3.72; Mean=3.64 respectively). To further detect whether the differences in means observed at different levels was a significant one, one- way ANOVA test together with Post Hoc Tukey HSD test were carried out (Table 10 and 11).
Table 10: One-way analysis of variance (ANOVA) for computer self-efficacy in relation to frequency of computer use
Sum of Squares df Mean Square F Sig. Between Groups 38.756 4 9.689 Within Groups 81.923 279 .294
Computer self-efficacy
Total 120.679 283
32.998
.000
The ANOVA test revealed a significant difference between the computer self-efficacy perceptions of student teachers and their frequency of computer use (p<.01). The Post Hoc Tukey HSD, similarly, revealed significant relationships between different frequency levels of computer use.
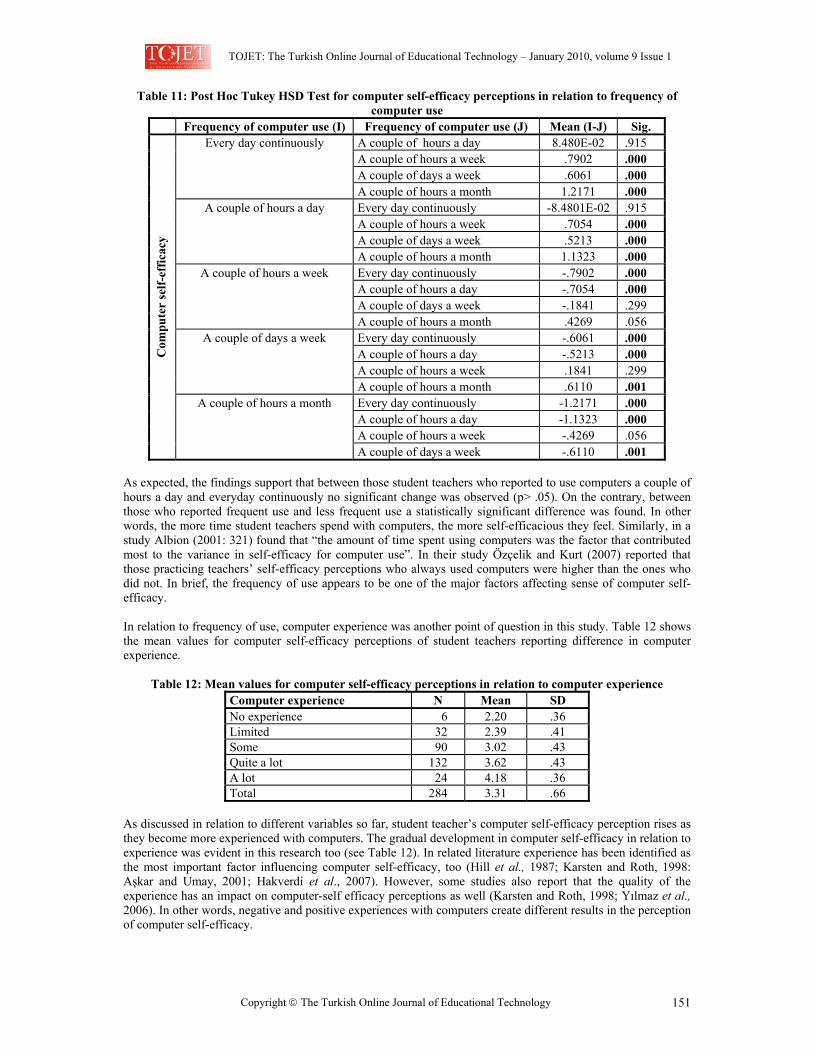
TOJET: The Turkish Online Journal of Educational Technology – January 2010, volume 9 Issue 1
Copyright The Turkish Online Journal of Educational Technology 151
Table 11: Post Hoc Tukey HSD Test for computer self-efficacy perceptions in relation to frequency of computer use
Frequency of computer use (I) Frequency of computer use (J) Mean (I-J) Sig. A couple of hours a day 8.480E-02 .915 A couple of hours a week .7902 .000 A couple of days a week .6061 .000
Every day continuously
A couple of hours a month 1.2171 .000 Every day continuously -8.4801E-02 .915 A couple of hours a week .7054 .000 A couple of days a week .5213 .000
A couple of hours a day
A couple of hours a month 1.1323 .000 Every day continuously -.7902 .000 A couple of hours a day -.7054 .000 A couple of days a week -.1841 .299
A couple of hours a week
A couple of hours a month .4269 .056 Every day continuously -.6061 .000 A couple of hours a day -.5213 .000 A couple of hours a week .1841 .299
A couple of days a week
A couple of hours a month .6110 .001 Every day continuously -1.2171 .000 A couple of hours a day -1.1323 .000 A couple of hours a week -.4269 .056
Com
pute
r se
lf-ef
ficac
y
A couple of hours a month
A couple of days a week -.6110 .001 As expected, the findings support that between those student teachers who reported to use computers a couple of hours a day and everyday continuously no significant change was observed (p> .05). On the contrary, between those who reported frequent use and less frequent use a statistically significant difference was found. In other words, the more time student teachers spend with computers, the more self-efficacious they feel. Similarly, in a study Albion (2001: 321) found that “the amount of time spent using computers was the factor that contributed most to the variance in self-efficacy for computer use”. In their study Özçelik and Kurt (2007) reported that those practicing teachers’ self-efficacy perceptions who always used computers were higher than the ones who did not. In brief, the frequency of use appears to be one of the major factors affecting sense of computer self-efficacy. In relation to frequency of use, computer experience was another point of question in this study. Table 12 shows the mean values for computer self-efficacy perceptions of student teachers reporting difference in computer experience.
Table 12: Mean values for computer self-efficacy perceptions in relation to computer experience Computer experience N Mean SD No experience 6 2.20 .36 Limited 32 2.39 .41 Some 90 3.02 .43 Quite a lot 132 3.62 .43 A lot 24 4.18 .36 Total 284 3.31 .66
As discussed in relation to different variables so far, student teacher’s computer self-efficacy perception rises as they become more experienced with computers. The gradual development in computer self-efficacy in relation to experience was evident in this research too (see Table 12). In related literature experience has been identified as the most important factor influencing computer self-efficacy, too (Hill et al., 1987; Karsten and Roth, 1998: Aşkar and Umay, 2001; Hakverdi et al., 2007). However, some studies also report that the quality of the experience has an impact on computer-self efficacy perceptions as well (Karsten and Roth, 1998; Yılmaz et al., 2006). In other words, negative and positive experiences with computers create different results in the perception of computer self-efficacy.
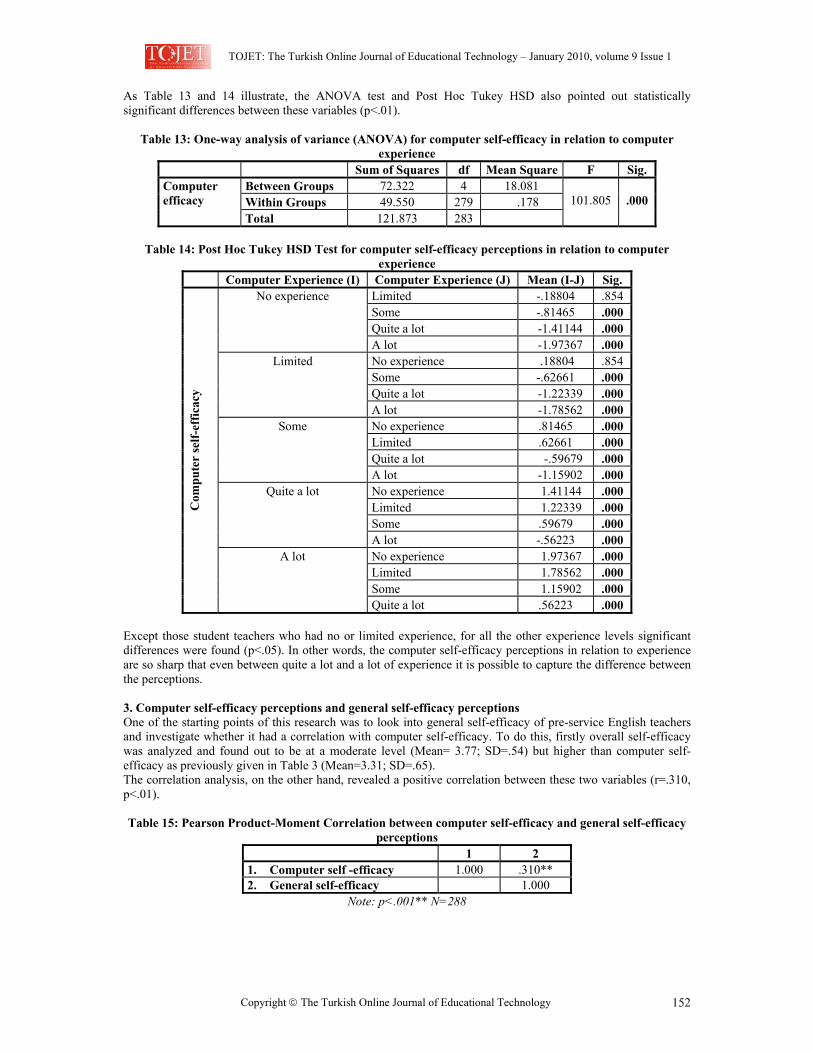
TOJET: The Turkish Online Journal of Educational Technology – January 2010, volume 9 Issue 1
Copyright The Turkish Online Journal of Educational Technology 152
As Table 13 and 14 illustrate, the ANOVA test and Post Hoc Tukey HSD also pointed out statistically significant differences between these variables (p<.01).
Table 13: One-way analysis of variance (ANOVA) for computer self-efficacy in relation to computer experience
Sum of Squares df Mean Square F Sig. Between Groups 72.322 4 18.081 Within Groups 49.550 279 .178
Computer efficacy
Total 121.873 283
101.805
.000
Table 14: Post Hoc Tukey HSD Test for computer self-efficacy perceptions in relation to computer
experience Computer Experience (I) Computer Experience (J) Mean (I-J) Sig.
Limited -.18804 .854 Some -.81465 .000 Quite a lot -1.41144 .000
No experience
A lot -1.97367 .000 No experience .18804 .854 Some -.62661 .000 Quite a lot -1.22339 .000
Limited
A lot -1.78562 .000 No experience .81465 .000 Limited .62661 .000 Quite a lot -.59679 .000
Some
A lot -1.15902 .000 No experience 1.41144 .000 Limited 1.22339 .000 Some .59679 .000
Quite a lot
A lot -.56223 .000 No experience 1.97367 .000 Limited 1.78562 .000 Some 1.15902 .000
Com
pute
r se
lf-ef
ficac
y
A lot
Quite a lot .56223 .000 Except those student teachers who had no or limited experience, for all the other experience levels significant differences were found (p<.05). In other words, the computer self-efficacy perceptions in relation to experience are so sharp that even between quite a lot and a lot of experience it is possible to capture the difference between the perceptions.
3. Computer self-efficacy perceptions and general self-efficacy perceptions One of the starting points of this research was to look into general self-efficacy of pre-service English teachers and investigate whether it had a correlation with computer self-efficacy. To do this, firstly overall self-efficacy was analyzed and found out to be at a moderate level (Mean= 3.77; SD=.54) but higher than computer self-efficacy as previously given in Table 3 (Mean=3.31; SD=.65). The correlation analysis, on the other hand, revealed a positive correlation between these two variables (r=.310, p<.01). Table 15: Pearson Product-Moment Correlation between computer self-efficacy and general self-efficacy
perceptions 1 2
1. Computer self -efficacy 1.000 .310** 2. General self-efficacy 1.000
Note: p<.001** N=288
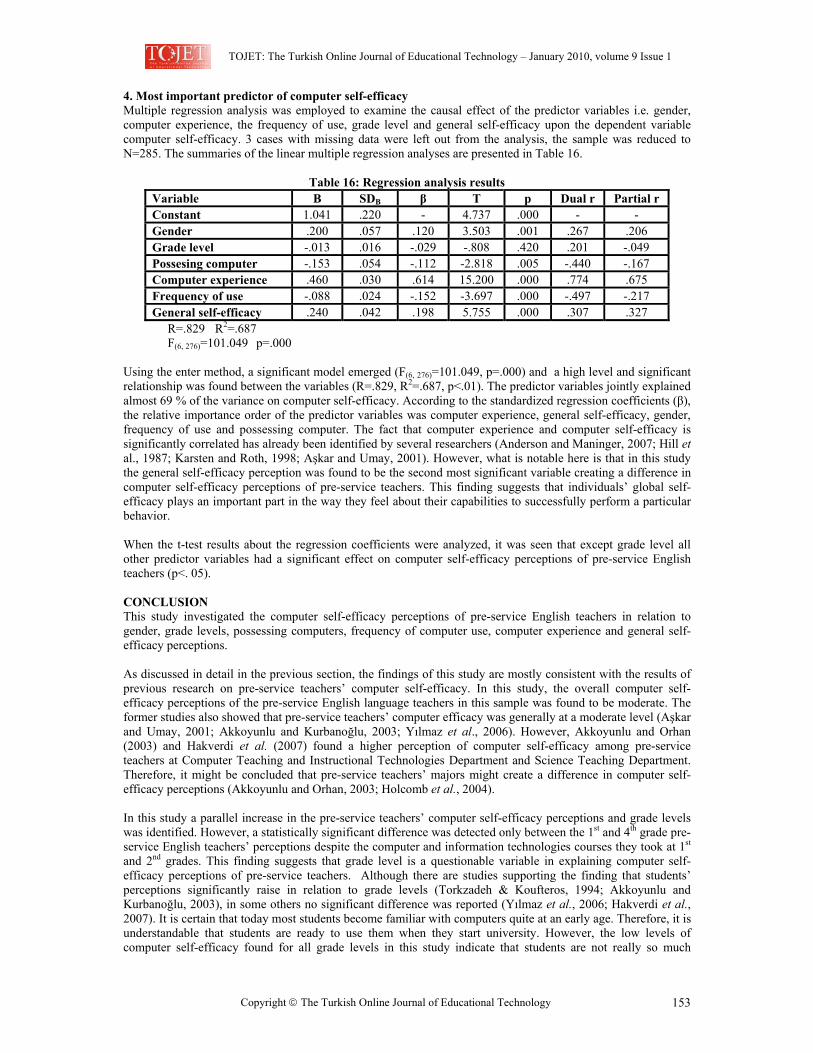
TOJET: The Turkish Online Journal of Educational Technology – January 2010, volume 9 Issue 1
Copyright The Turkish Online Journal of Educational Technology 153
4. Most important predictor of computer self-efficacy Multiple regression analysis was employed to examine the causal effect of the predictor variables i.e. gender, computer experience, the frequency of use, grade level and general self-efficacy upon the dependent variable computer self-efficacy. 3 cases with missing data were left out from the analysis, the sample was reduced to N=285. The summaries of the linear multiple regression analyses are presented in Table 16.
Table 16: Regression analysis results Variable B SDB β T p Dual r Partial r Constant 1.041 .220 - 4.737 .000 - - Gender .200 .057 .120 3.503 .001 .267 .206 Grade level -.013 .016 -.029 -.808 .420 .201 -.049 Possesing computer -.153 .054 -.112 -2.818 .005 -.440 -.167 Computer experience .460 .030 .614 15.200 .000 .774 .675 Frequency of use -.088 .024 -.152 -3.697 .000 -.497 -.217 General self-efficacy .240 .042 .198 5.755 .000 .307 .327
R=.829 R2=.687 F(6, 276)=101.049 p=.000
Using the enter method, a significant model emerged (F(6, 276)=101.049, p=.000) and a high level and significant relationship was found between the variables (R=.829, R2=.687, p<.01). The predictor variables jointly explained almost 69 % of the variance on computer self-efficacy. According to the standardized regression coefficients (β), the relative importance order of the predictor variables was computer experience, general self-efficacy, gender, frequency of use and possessing computer. The fact that computer experience and computer self-efficacy is significantly correlated has already been identified by several researchers (Anderson and Maninger, 2007; Hill et al., 1987; Karsten and Roth, 1998; Aşkar and Umay, 2001). However, what is notable here is that in this study the general self-efficacy perception was found to be the second most significant variable creating a difference in computer self-efficacy perceptions of pre-service teachers. This finding suggests that individuals’ global self-efficacy plays an important part in the way they feel about their capabilities to successfully perform a particular behavior. When the t-test results about the regression coefficients were analyzed, it was seen that except grade level all other predictor variables had a significant effect on computer self-efficacy perceptions of pre-service English teachers (p<. 05). CONCLUSION This study investigated the computer self-efficacy perceptions of pre-service English teachers in relation to gender, grade levels, possessing computers, frequency of computer use, computer experience and general self-efficacy perceptions. As discussed in detail in the previous section, the findings of this study are mostly consistent with the results of previous research on pre-service teachers’ computer self-efficacy. In this study, the overall computer self-efficacy perceptions of the pre-service English language teachers in this sample was found to be moderate. The former studies also showed that pre-service teachers’ computer efficacy was generally at a moderate level (Aşkar and Umay, 2001; Akkoyunlu and Kurbanoğlu, 2003; Yılmaz et al., 2006). However, Akkoyunlu and Orhan (2003) and Hakverdi et al. (2007) found a higher perception of computer self-efficacy among pre-service teachers at Computer Teaching and Instructional Technologies Department and Science Teaching Department. Therefore, it might be concluded that pre-service teachers’ majors might create a difference in computer self-efficacy perceptions (Akkoyunlu and Orhan, 2003; Holcomb et al., 2004). In this study a parallel increase in the pre-service teachers’ computer self-efficacy perceptions and grade levels was identified. However, a statistically significant difference was detected only between the 1st and 4th grade pre-service English teachers’ perceptions despite the computer and information technologies courses they took at 1st and 2nd grades. This finding suggests that grade level is a questionable variable in explaining computer self-efficacy perceptions of pre-service teachers. Although there are studies supporting the finding that students’ perceptions significantly raise in relation to grade levels (Torkzadeh & Koufteros, 1994; Akkoyunlu and Kurbanoğlu, 2003), in some others no significant difference was reported (Yılmaz et al., 2006; Hakverdi et al., 2007). It is certain that today most students become familiar with computers quite at an early age. Therefore, it is understandable that students are ready to use them when they start university. However, the low levels of computer self-efficacy found for all grade levels in this study indicate that students are not really so much
TOJET: The Turkish Online Journal of Educational Technology – January 2010, volume 9 Issue 1
Copyright The Turkish Online Journal of Educational Technology 154
familiar with computers. Moreover, it could be inferred that the courses taken during teacher education related to computers and the use of them as educational tools fall short in providing pre-service teachers with the necessary knowledge, skills, and sense of efficacy that they should have in order to integrate computer technologies in their future teaching successfully. On the other hand, the findings of this research further verified that those variables, i.e. computer experience, general self-efficacy, frequency of use, possessing a computer, gender create significant differences in computer self-efficacy perceptions of pre-service teachers. In the literature several studies also indicate that these variables are related to one another (Anderson and Maninger, 2007). This study also showed that there was a positive correlation between the pre-service English teachers’ computer self-efficacy and general self-efficacy perceptions. The general self-efficacy was identified to be at a moderate level but higher than computer self-efficacy. This finding suggests that general self-efficacy can indeed be regarded as situation-free but the correlation between the two psychological constructs further suggests that it might be difficult to raise an individual’s domain specific self-efficacy perception without increasing the global one initially. Certainly this idea calls for further research. Lastly, the multi regression analysis revealed that among the variables considered in this research, computer experience was the most important predictor of computer self efficacy. This finding is in line with the findings of several other research studies (Hill et al., 1987; Karsten and Roth, 1998; Aşkar and Umay, 2001), pointing out the importance of providing pre-service teachers with the necessary experience and knowledge during their education. (Albion, 1999). IMPLICATIONS The results of this study have some significant implications for teacher educators. Firstly, those specific courses that aim to equip pre-service teachers with knowledge, skill and confidence regarding computer use should be reconsidered in the light of the research done in this field. Content and procedural renovations could be made and implemented which could then be followed by research to determine whether the intended behavioral, cognitive and affective changes have taken place. However, it should be borne in mind that helping student teachers’ build high level of computer self-efficacy is a collective endeavor. That is, secondly, all educators regardless of the courses they teach should seek ways to contribute to the training of pre-service teachers in computer use. They can do it, in the first place, by modeling good manipulation of computers in their own teaching. As Bandura states (1986) one of the sources of self-efficacy beliefs is observing others performing the behavior successfully. And next, they can encourage pre-service teachers to integrate more computer work in the tasks they assign since positive past experience helps increase high self-efficacy beliefs. Well-thought, well-structured tasks accompanied with good examples can assist student teachers during this process. In conclusion, it should not be forgotten that self-efficacy is closely related to motivation, success and is a predictor of future behavior. For this reason, during their education if pre-service teachers are not encouraged to build high level of computer self-efficacy, the likely integration of computers in their future teaching will be at risk. REFERENCES Akdeniz, A.R. and Alev, N. (1999). Bilgisayar Destekli Fizik Öğretimi İçin Öğretmen Eğitimi. 4. Ulusal Eğitim
Bilimleri Kongresi Bildirileri 2 Kitabı, 172-185. Akkoyunlu, B. (2002). Educational Technology in Turkey: Past, Present and Future. Educational Media
International, Vol. 39, No. 2, 165-174. Akkoyunlu, B., Kurbanoğlu, S. (2003). Öğretmen Adaylarının Bilgi Okuryazarlığı ve Bilgisayar Öz-Yeterlik
Algıları Üzerine Bir Çalışma. Hacettepe Üniversitesi Eğitim Fakültesi Dergisi, 24, 1-10. Akkoyunlu, B., Orhan, F. (2003). Bilgisayar ve Öğretim Teknolojileri Bölümü (BÖTE) Öğrencilerinin
Bilgisayar Kullanma Özyertlik İnancı ile Demografik Özellikleri Arasındaki İlişki. The Turkish Online Journal of educational technology- TOJET, Vol.2, Issue3, Article 11 [Online]:http://www.tojet.net.articles/2311.htm
Albion, P. (1999). Self-efficacy beliefs as an indication of teachers preparedness of teaching with technology. Association for Advancement of Computing in Education. http://www.usq.edu.au/users/albion/papers/site99/1345.html
Albion, P. (2001). Some factors in the development of self-efficacy beliefs for computer use among teacher education students. Journal of Technology and Teacher Education, 9 (3), 321-347.
TOJET: The Turkish Online Journal of Educational Technology – January 2010, volume 9 Issue 1
Copyright The Turkish Online Journal of Educational Technology 155
Al-Jarf, R. (2004). The Effects of Web-based Learning on Struggling EFL College Writers. Foreign Language Annals, Volume 37 (1), 49-57.
Anderson, S.E., Maninger, R.M. (2007). Preservice Teachers’ Abilities, Beliefs, and Intentions regarding technology Integration. Educational Computing Research, Vol. 37(2), 151-172.
Aşan, A. (2003). Computer Technology Awareness by Elementary School Teachers: A Case Study from Turkey. Journal of Information Technology Education. Volume 2, 153-164.
Valanides, N. and Angeli. C. (2008) Professional Development for Computer-Enhanced Learning: A Case Study with Science Teachers. Research in Science & Technological Education, 26/1, 3-12.
Aşkar, P., Umay, A. (2001). İlköğretim Matematik Öğretmenliği Öğrencilerinin Bilgisayarla İlgili Öz-Yetrelik Algısı. Hacettepe Üniversitesi Eğitim Fakültesi Dergisi, 21, 1-8.
Bandura, A. (1986). Social foundations of thought and action: A social cognitive theory, Englewood Cliffs, NJ: Prentice-Hall.
Bandura, A. (1989). Human Agency in Social Cognitive Theory. American Psychologist, Vol.44, No. 9, p. 1175-1184.
Bitner, N. and Bitner, J. (2002). Integrating Technology into the Classroom: Eight Keys to Success. Journal of Technology and Teacher Education, Vol. 10, Number 1, 95-100.
Büyüköztürk, Ş. (2002). Sosyal Bilimler İçin Veri Analizi El Kitabı. PegemA Yayıncılık: Ankara. Cassidy, S. and Eachus, P. (2002). Developing the Computer User Self-Efficacy (CUSE) Scale: Investigating the
Relationship between Computer Self-Efficacy, Gender and Experience with Computers. Journal of Educational Computing Research, Vol. 26(2), p. 133-153.
Chen, M. (1986). Gender and computers: The beneficial effects of experience on attitudes. Journal of Educational Computing Research, 2(3), 265-282.
Chen, G., Gully, S.M., Eden, D. (2001). Validation of a new general self-efficacy scale. Organizational Research Methods, 4, 62-83.
Cheong, Y.F, Pajares, F., Oberman, P.S (2004). Motivation and Academic Help-Seeking in High School Computer Science, Computer Science Education, Vol. 14(1), p. 3-19.
Chun, D. and J. Plass. (1996). Facilitating Reading Comprehension with Multimedia. System, 24 (4), 503-519. Comber, C., Colley, A., Hargreaves, D. J., & Dorn, L. (1997). The effects of age, gender, and computer
experience upon computer attitudes. Educational Research, 39, 123-133. Compeau, D. and Higgins, C. (1995). Computer self-efficacy: Development of a measure and initial test. MIS
Quarterly, 19 (2), 1989-211. Demirel, Ö. (2002). Planlamadan Değerlendirmeye Öğretme Sanatı. PegemA Yayıncılık: Ankara. Dunkel, P. (1990). Implications of the CAI effectiveness for limited English proficient learners. Computers in
the Schools, 7(1/2), 31-52. Edwards, S. (2005). Identifying the factors that influence computer use in the early childhood classroom.
Australasian Journal of Educational Technology, 21(2), 192-210. Eggen, P., Kauchak, D. (2007). Educational Psychology. (7th Edt.) Pearson Prentice Hall: New Jersey. Hakverdi, M., Gücüm, B., and Korkmaz, H. (2007). Factors Influencing Pre-service Science Teachers’
Perception of Computer Self-efficacy. Asia-Pacific Forum on Science Learning and Teaching, Vol. 8, Issue 1, Article 13 (June) [Online]: http://www. ied.edu.hk/apfslt
Hamerstorm, H., Lipton, G., Suter, S. (1985). Computers in The Foreign Language Classroom: No Longer A Question. CALICO Journal, Vol.3, Number 1.
Hazır Bıkmaz, F. (2004). Özyeterlik İnançları. Kuzgun, Y and Deryakulu, D. (edts) Eğitimde Bireysel Farklılıklar. Nobel: Ankara.
Hill, T., Smith, N.D., and Mann, M.F. (1987). Role of efficacy expectations in predicting the decision to use advanced Technologies: Case of computers, Journal of Applied Psychology, 72 (2), 307-313.
Holcomb, L.B., King, F.B., Brown, S.W. (2004) Student Traits and Attributes Contributing to Success in Online Courses: Evaluation of University Online Courses, The Journal of Interactive Online Learning, Volume 2, Number 3, Winter.
Houle, P. (1996). Toward understanding student differences in a computer skills course. Journal of Educational Computing Research, 14(1), 25-48.
Karsten, R. and Roth, R. (1998). The relationship of computer experience and computer self-efficacy to performance in introductory computer literacy courses, Journal of Research on Computing in Education, 31 (1), 14-22.
Khorrami-Arani, O. (2001). Researching computer self-efficacy. International Education Journal, Vol. 2, No. 4, 17-25.
Kinzie, M.B., Delcourt, M.A.B., Powers, S.M. (1994). Computer technologies: Attitudes and self-efficacy across undergraduate disciplines. Research in Higher Education, Vol. 35, Number 6, 745-768.
Koç, M. (2005). Implications of Learning Theories for Effective Technology Integration and pre-service Teacher Training: A Critical Literature Review. Journal of Turkish Science Education, Vol. 2, Issue 1, 2-18.
TOJET: The Turkish Online Journal of Educational Technology – January 2010, volume 9 Issue 1
Copyright The Turkish Online Journal of Educational Technology 156
Lee, K.W. (2000). English teachers’ barriers to the use of computer assisted language learning. The Internet TESL Journal, [Online]: http://iteslj.org/Articles/Lee-CALLbarriers.html.
Lai, C.C. and Kristonis, W.A. (2006). The Advantages and Disadvantages of Computer Technology on Second Language Acquisition. Doctoral Forum: National Journal of Publishing and Mentoring Doctoral Student Research, Vol. 3, Number 1. [Online]: http://www.nationalforum.com/Journals/OJPMDSR/OJPMDSR/OJPMDSR.htm.
Liu, M., Moore, Z., Graham, L. and Lee, S. (2002). A Look at the Research on Computer-Based Technology Use in Second Language Learning: A Review of the Literature from 1990–2000. Journal of Research on Technology in Education, Vol. 34, Number 3, 250-273.
Liu, M. (1994). Hypermedia assisted instruction and second language learning: A semantic-network-based approach. Computers in the Schools, 10(3/4), 293-312.
Marcinkiewicz, H.R. (1994). Computers and teachers: Factors influencing computer use in the classroom. Journal of Research on Computing in Education, 26 (2), 220-237.
Milbrath, Y.C.L. and Kinzie, M.B. (2000). Computer Technology Training for Prospective Teachers: Computer Attitudes and Perceived Self-Efficacy. Journal of Technology and Teacher Education, Vol. 8, Number 4, 373-396.
Murphy, C.A., Coover, D., Owen, S.V. (1989). Development and validation of computer self-efficacy scale. In O. Khorrami-Arani (2001). Researching computer self-efficacy. International Education Journal, Vol. 2, No. 4, 17-25.
Nespor, J. (1987). The role of beliefs in the practice of teaching. Journal of Curriculum Studies, 19 (4), 317 - 328.
Özçelik, H., Kurt, A.A. (2007). Primary School Teachers’ Computer Self Efficacies: Sample of Balıkesir. İlköğretim Online, 6(3), 441-451 [Online]: http://ilkogretim-online.org.tr
Özyurt, B.E.(2004). Özyeterlik İnançları. In: Kuzgun, Y. and D. Deryakulu (eds) Eğitimde Bireysel Farklılıklar. p. 289-314, Ankara: Nobel Yayın Dağıtım.
Sam, H. K., Othman, A. E. A., & Nordin, Z. S. (2005). Computer Self-Efficacy, Computer Anxiety, and Attitudes toward the Internet: A Study among Undergraduates in Unimas. Educational Technology & Society, 8 (4), 205-219.
Scherbaum, C., Cohen-Charash, Y. and Kern, M.J. (2006). Measuring General Self-Efficacy: A Comparison of Three Measures Using Item Response Theory. Educational and Psychological Measurement, 66, 1047-1063.
Sherer, M., Maddux, J.E., Mercandante, B., Prentice-Dunn, S., Jacobs, B., Rogers, R. (1982). The self-Efficacy Scale: Construction and validation. Psychological reports. 51, 663-671.
Scholz, U., Dona, B.G., Sud, S., Schwarzer, R. (2002). Cross- Cultural Assessment of Coping Resources: The General Perceived Self-Efficacy Scale. European Journal of Psychological Assessment, Vol. 18 (3), 242-251.
Schwarzer, R. and Jerusalem, M. (1995). Generalized Self-Efficacy Scale. In: Weinman, J, S. Wright, and M. Johnson (eds.) Measures in health psychology: A user's portfolio, Causal and control beliefs. p. 35-37, Windsor England: NFER-NELSON.
Summers, M. (1990). New student teachers and computers: An investigation of experience and feelings. Educational Review, 42 (3), 261-271.
Şahin, T.Y. and Yıldırım, S. (1999). Student teachers’ perceptions of instructional technology: developing materials based on a constructivist approach. British Journal of Educational Technology, Vol. 34, no:1, 67-74.
Torkzadeh, G. & Koufteros, X. (1994). Factorial validity of a computer self-efficacy scale and the impact of computer training. Educational and Psychological Measurement, 54 (3), 813-921.
Tozcu, A. and J. Coady. (2004). Successful Learning of Frequent Vocabulary through CALL also Benefits Reading Comprehension and Speed. Computer Assisted Language Learning, 17 (5), 473-495.
Wang, L. (2005). The Advantages of Using Technology in Second Language Education. Technology Horizons in
Education Journal, 5(1), p.38-41. Yalın, H.İ. (2004). Öğretim Teknolojileri ve Materyal Geliştirme. Nobel Yayın Dağıtım: Ankara. Yılmaz, M., Gerçek, C., Köseoğlu, P., Soran, H. (2006). Hacettepe Üniversitesi Biyoloji Öğretmen Adaylarının
Bilgisayarla İlgili Öz-Yeterlik İnançlarının İncelenmesi. Hacettepe Üniversitesi Eğitim Fakültesi Dergisi, 30, 278-287.
Yusuf, M.O. (2005). An Investigation into Teachers’ Self-Efficacy in Implementing Computer Education in Nigerian Secondary Schools. Meridian: A Middle School Computer Technologies Journal, Volume 8, Issue 2.
TOJET: The Turkish Online Journal of Educational Technology – January 2010, volume 9 Issue 1
Copyright The Turkish Online Journal of Educational Technology 157
PRE-SERVICE ENGLISH TEACHERS IN BLENDED LEARNING ENVIRONMENT IN RESPECT TO THEIR LEARNING APPROACHES
M.Betül YILMAZ
Yıldız Technical University, Turkey [email protected]
Feza ORHAN
Yıldız Technical University, Turkey [email protected]
ABSTRACT Blended learning environment (BLE) is increasingly used in the world, especially in university degrees and it is based on integrating web-based learning and face-to-face (FTF) learning environments. Besides integrating different learning environments, BLE also addresses to students with different learning approaches. The ‘learning approach’ categorizes individuals as ‘surface learners’ and ‘deep learners’. This study investigated whether the academic performance and the satisfaction levels of the pre-service English teachers varied in respect to their learning approaches in a blended learning environment. At the end of the study it was found that a) academic performance scores of the students in the BLE did not show statistically significant difference between deep and surface learners, b) the average satisfaction level with the BLE of deep learner students was statistically significantly higher than the average of surface learner students. Based on these findings, it can be concluded that pre-service English Language teachers were in general highly satisfied with the BLE. In addition, it can be stated that the courses which are designed for the BLE contribute to the achievement of the students with surface learning approach. Based on these conclusions, BLE is advised for training of pre-service English Language teachers with different learning approaches. Keywords: Blended learning, Learning approach, Teacher training 1. INTRODUCTION In recent years, with their continuously developing technologies, computers have been one of the most dominant devices in the development and delivery of audio-visual products, multimedia presentations, visual materials and end-user software. Opportunities such as internet access, distance learning capabilities, and applications software are tools of the new millennium and they are often used to make the educational environment more relevant, rich, and rewarding (Ennis-Cole & Lawhon, 2004). Thanks to this, it is possible to prepare a varied learning environment which will address to the individual differences of the students. Riley (2000) stressed that teaching and learning that use technology effectively can lead to greater academic achievement and make a real difference in the lives of the students. In the literature there are many terms describing the environments where computers have a role in the learning process. These terms include computer assisted learning, computer assisted instruction, computer based instruction, etc. Each of these concepts differs according to computers’ role in the education environment. Additionally, various terms are used to describe situations where the teacher and the students are not physically together in terms of time, place and where they communicate through technology. In this context, the concepts of distance learning, web-based learning, e-learning are widely used. A common and important point in the concepts of distance learning, web-based learning and e-learning is that the teacher and the students are located in different spaces for a significant part of the learning process. Keegan (1986, as cited in Guri-Rosenblit, 2005) defines the quasi-permanent separation of the teacher and the learner throughout the learning process, as well as the quasi-permanent absence of a learning group throughout the learning process, as two of the major characteristics of distance education. So, learning is predominantly based on the design of the instructional material rather than the interaction in the usual face to face environment (European Commission, 1991). On the other hand, Laurillard (1996) reports that a mixed used of teaching and learning methods will always be the most efficient way to support student learning, because only then it is possible to embrace all the activities of discussion, interaction, adaptation, and reflection, which are essential for academic learning. The difficulties arise in the full realization of these activities, which are based on interaction in the distance learning environment; the most profound deficiency being reported as the lack of necessary interaction between the students and the teacher in the learning system (Haefner, 2000) The way to meet and overcome the deficiencies and difficulties has been to blend distance learning with the conventional learning environment.
TOJET: The Turkish Online Journal of Educational Technology – January 2010, volume 9 Issue 1
Copyright The Turkish Online Journal of Educational Technology 158
1.1 Blended Learning Blended Learning (BL) is a method to organize the learning environment that is facilitated by the effective combination of different modes of delivery, models of teaching and styles of learning, and is founded on transparent communication amongst all parties involved in a course (Heinze and Procter, 2006). Garnham and Kaleta (2002) define BL as ‘courses in which a significant portion of the learning activities have been moved online, and time traditionally spent in the classroom is reduced but not eliminated’. Young (2002) and Sands (2002) also use similar definitions. One of the most widely accepted definitions in the literature is that of Osguthorpe and Graham (2003, 227): “BL environment is used to try to maximize the benefits of both FTF and online methods- using the web for what it does best, and using class time for what it does best”. The integration or combination of different learning/teaching methods is of profound importance for the achievement of the BLE. Reay (2001) stresses that BL is not just adding online materials to a conventional training environment; BL must be relevant, and demand a holistic strategy leveraging the best characteristics of all learning interventions. The selected methods/techniques should be appropriate to the subject. The successful implementation and use of BL requires understanding of the strengths of different mediums; how learners engage in this type of learning process; how they use information from each different medium and how they can handle online and the traditional (face-to-face) teaching methods in a combined form (Mortera-Gutierrez, 2006). Three major components of BL that can be blended/mixed in FTF and online environments are learning activities, the students, and the teacher. As reported by Osguthorpe and Graham (2003, p.229), “If balance and harmony are the qualities that are sought for in blended environment, one must first identify precisely what is to be mixed together”. This identification depends on the content of a course and characteristics of student mass as well as composition, needs, individual differences, etc. 1.2 Individual Differences in Learning In the field of educational sciences, how learning takes place has been the subject of much research and debate and no consensus has yet been reached on this. The fact that learning has many cognitive and affective aspects, such as age, maturity, the environment, degree of interest in the course, expectations from the course, the quality of the education, the quality of the interaction between the teacher and other learners, and whether the student likes/dislikes the instructional methods/teacher/course makes it impossible to produce a teaching formula agreed by everyone and which can be used while planning instruction. Yet, the researchers continue to study on how each above-listed aspect of learning is effective on learning itself. Studies on how an individual learns mainly concentrate on two aspects: “how the learners learn (how they are organized)?” and “why do they learn?” (Ramsden, 1991). The first aspect relates to how learners organize or configure new information during learning activities. The second aspect is whether or not the students exert effort to attain the meaning of the material they interact with or of the phenomenon/issue they study during learning process. While the students who seek to find a meaning use a “deep” approach, the students who use a “surface” approach focus on the titles which they believe will explain the content of the subject (Ramsden, 1991). The concept of “learning approach” was first used by Marton and Säljö (1976). This concept divides the individuals into two categories: ‘surface learners’ and ‘deep learners’. Surface learners mainly choose to rehearse and memorize the course material they work on and they acquire the information they need to learn in a disconnected way, by memorization. Marton and Säljö (1976) underlined that surface learning university students tended to memorize the material temporarily in such a way to transform it to performance later in examinations etc. On the other hand, deep learners want to grasp the meaning of the course material (Boekaerts, 1996). In the literature it is emphasized that deep learning students tend to dominate the material they work on and combine it with their existing knowledge (Marton and Säljö, 1976). A deep approach involves the use of study strategies that are directed towards understanding the concepts presented in the study material. When the students use a deep approach they relate concepts to each other and to their previous knowledge, and they evaluate the evidence and logic behind arguments (Prosser & Trigwell, 1999). A surface approach, on the other hand, directs attention to disconnected pieces of information. (Minbashian, Huon, Bird, 2004). Trigwell, Prosser and Waterhouse (1999, 58) suggested that studies have consistently showed that deeper approaches to learning are related to higher quality learning outcomes. In parallel, surface approach was found to be negatively correlated with academic performance in various researches (Duff et all., 2004; Mayya, Rao & Ramnarayan, 2004; Burton & Nelson, 2006). On the other hand, Dart et all. (2000) give notice to teachers that it is possible to promote deep approaches to learning through the creation of learning environments that students perceive as safe, supportive, and that offer helpful relationships. Diseth (2007a) stresses that, it seems important to focus on how the students evaluate and perceive their learning environment, because it affects students
TOJET: The Turkish Online Journal of Educational Technology – January 2010, volume 9 Issue 1
Copyright The Turkish Online Journal of Educational Technology 159
approach to learning, which ultimately affect examination performance. More specifically, if the goal is to increase deep approaches and to decrease surface approaches to learning, it seems important to alter the student-perceived effect of teaching (in terms of challenge, value, and stimulation) (Diseth, 2007a). In other words; various learning approaches emphasize that there are differences between the learning approaches of individuals and that knowing these differences will help the teachers find more effective and creative ways (Entwistle, 1997; Biggs, 1999) for the learners with different learning approaches. From this point of view, BLE can be a good solution by offering different learning environments to the students who have individual differences as well as approaches to learning. BLE offers the advantage of both distance learning, such as studying the course material in any place, at any time and for any duration, and studying as an opportunity for immediate feedback/correction/reinforcement of the material, as well as the advantages of FTF learning, such as discussion in the classroom environment, direct interaction with the teacher and students, and allowing the teachers to see and analyze the individual differences. In literature review, although there are many studies on BLE across the world, among these studies, the researchers found only one study that examined learning approaches of the students in the BLE. The results of this study (Ellis, Goodyear, Prosser, O'Hara, 2006) suggested that there is no significant difference between students’ academic performance in terms of their learning approaches. In the present study, an answer has been sought for the question whether the pre-service English teachers with different learning approaches vary in their achievement and in their satisfaction of the course which is given in blended learning environment. Within this framework, this study tried to answer the below questions:
1. Is there a significant difference between the pre-service English teachers’ achievement in respect to their learning approach?
2. Is there a significant difference between the pre-service English teachers’ satisfaction with the BLE in respect to their learning approach?
2. METHOD A descriptive model was used in this study. 2.1 Subjects The participants in this study were the students from the Department of Foreign Language Education at the Yıldız Technical University, Faculty of Education who took the “Instructional Technologies and Material Development” course in the 2006-2007 academic year. A total of 53 students were included in the study, 87% (n=46) of whom were female and 13% (n=7) of whom were male. None of the students had previously participated in a BLE or in a web-based learning environment. 2.2 The Course The “Instructional Technology and Material Development” is a 4-hour core course for the undergraduate students of the Educational Faculty. The pre-service English teachers are enrolled in this course in their 4th semester each year. The course has two main objectives. The first is that the student should be able to understand the basic instructional principles of material development and the second is that the student should be able to apply these principles while developing the materials. The course was designed in accordance with these objectives. The course content was developed by the instructor of the course and consisted of 9 modules. The web material was designed and developed by a team comprised of the course instructor, an instructional design specialist, a program development specialist and graphic artists, and was supported by the Yıldız Technical University e-learning support unit. Web material included the course content, course texts, a library, a dictionary and follow-up quizzes. In online materials, animations, graphics, pictures and tables were used as visual stimulants. The web site consisted of four sections, namely, course information, course content, follow-up quizzes, and the learning management system. In the BLE, the students advised to spend at least two hours in the online learning environment before every FTF class hours. Web material was opened to access from any computer connected to Internet. This means that the students had the opportunity to access online material any where and any time they wanted. For this application, a computer lab was also scheduled for the students who are not available to connect Internet from their houses. The FTF class hours consisted of a 2 hours lecture and discussion session each week. The students were informed that they should do the appropriate preparatory online work for the module, with any required
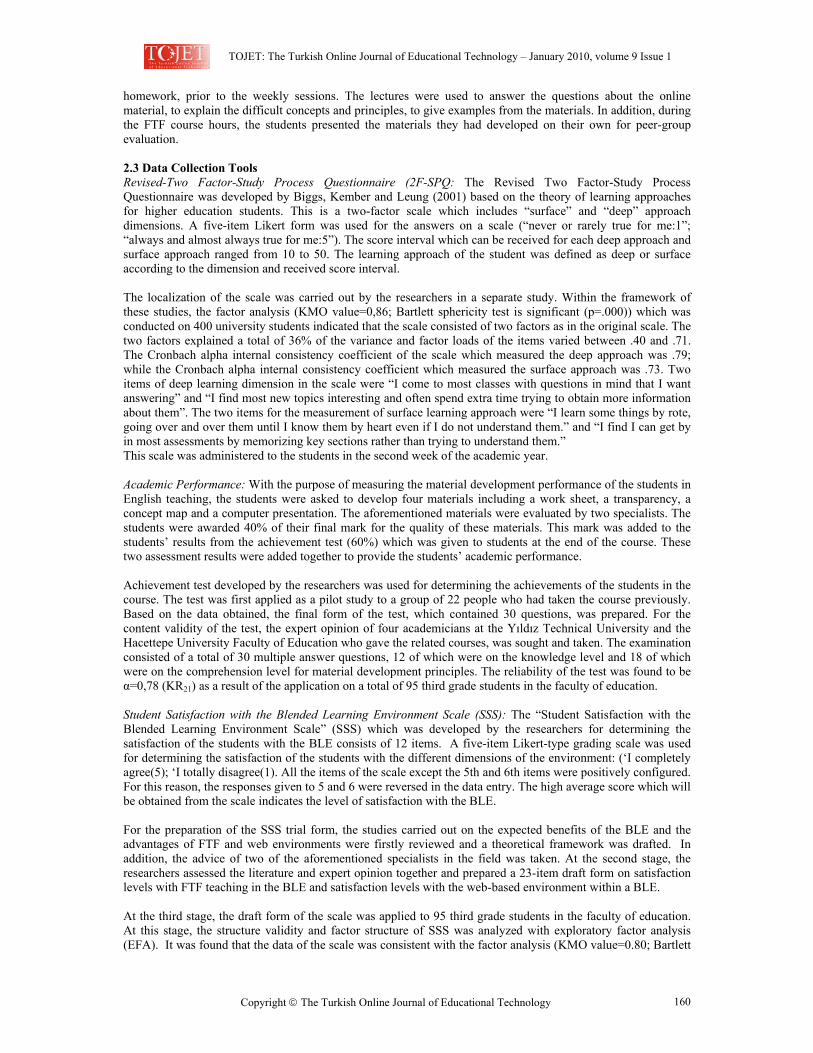
TOJET: The Turkish Online Journal of Educational Technology – January 2010, volume 9 Issue 1
Copyright The Turkish Online Journal of Educational Technology 160
homework, prior to the weekly sessions. The lectures were used to answer the questions about the online material, to explain the difficult concepts and principles, to give examples from the materials. In addition, during the FTF course hours, the students presented the materials they had developed on their own for peer-group evaluation. 2.3 Data Collection Tools Revised-Two Factor-Study Process Questionnaire (2F-SPQ: The Revised Two Factor-Study Process Questionnaire was developed by Biggs, Kember and Leung (2001) based on the theory of learning approaches for higher education students. This is a two-factor scale which includes “surface” and “deep” approach dimensions. A five-item Likert form was used for the answers on a scale (“never or rarely true for me:1”; “always and almost always true for me:5”). The score interval which can be received for each deep approach and surface approach ranged from 10 to 50. The learning approach of the student was defined as deep or surface according to the dimension and received score interval. The localization of the scale was carried out by the researchers in a separate study. Within the framework of these studies, the factor analysis (KMO value=0,86; Bartlett sphericity test is significant (p=.000)) which was conducted on 400 university students indicated that the scale consisted of two factors as in the original scale. The two factors explained a total of 36% of the variance and factor loads of the items varied between .40 and .71. The Cronbach alpha internal consistency coefficient of the scale which measured the deep approach was .79; while the Cronbach alpha internal consistency coefficient which measured the surface approach was .73. Two items of deep learning dimension in the scale were “I come to most classes with questions in mind that I want answering” and “I find most new topics interesting and often spend extra time trying to obtain more information about them”. The two items for the measurement of surface learning approach were “I learn some things by rote, going over and over them until I know them by heart even if I do not understand them.” and “I find I can get by in most assessments by memorizing key sections rather than trying to understand them.” This scale was administered to the students in the second week of the academic year. Academic Performance: With the purpose of measuring the material development performance of the students in English teaching, the students were asked to develop four materials including a work sheet, a transparency, a concept map and a computer presentation. The aforementioned materials were evaluated by two specialists. The students were awarded 40% of their final mark for the quality of these materials. This mark was added to the students’ results from the achievement test (60%) which was given to students at the end of the course. These two assessment results were added together to provide the students’ academic performance. Achievement test developed by the researchers was used for determining the achievements of the students in the course. The test was first applied as a pilot study to a group of 22 people who had taken the course previously. Based on the data obtained, the final form of the test, which contained 30 questions, was prepared. For the content validity of the test, the expert opinion of four academicians at the Yıldız Technical University and the Hacettepe University Faculty of Education who gave the related courses, was sought and taken. The examination consisted of a total of 30 multiple answer questions, 12 of which were on the knowledge level and 18 of which were on the comprehension level for material development principles. The reliability of the test was found to be α=0,78 (KR21) as a result of the application on a total of 95 third grade students in the faculty of education. Student Satisfaction with the Blended Learning Environment Scale (SSS): The “Student Satisfaction with the Blended Learning Environment Scale” (SSS) which was developed by the researchers for determining the satisfaction of the students with the BLE consists of 12 items. A five-item Likert-type grading scale was used for determining the satisfaction of the students with the different dimensions of the environment: (‘I completely agree(5); ‘I totally disagree(1). All the items of the scale except the 5th and 6th items were positively configured. For this reason, the responses given to 5 and 6 were reversed in the data entry. The high average score which will be obtained from the scale indicates the level of satisfaction with the BLE. For the preparation of the SSS trial form, the studies carried out on the expected benefits of the BLE and the advantages of FTF and web environments were firstly reviewed and a theoretical framework was drafted. In addition, the advice of two of the aforementioned specialists in the field was taken. At the second stage, the researchers assessed the literature and expert opinion together and prepared a 23-item draft form on satisfaction levels with FTF teaching in the BLE and satisfaction levels with the web-based environment within a BLE. At the third stage, the draft form of the scale was applied to 95 third grade students in the faculty of education. At this stage, the structure validity and factor structure of SSS was analyzed with exploratory factor analysis (EFA). It was found that the data of the scale was consistent with the factor analysis (KMO value=0.80; Bartlett
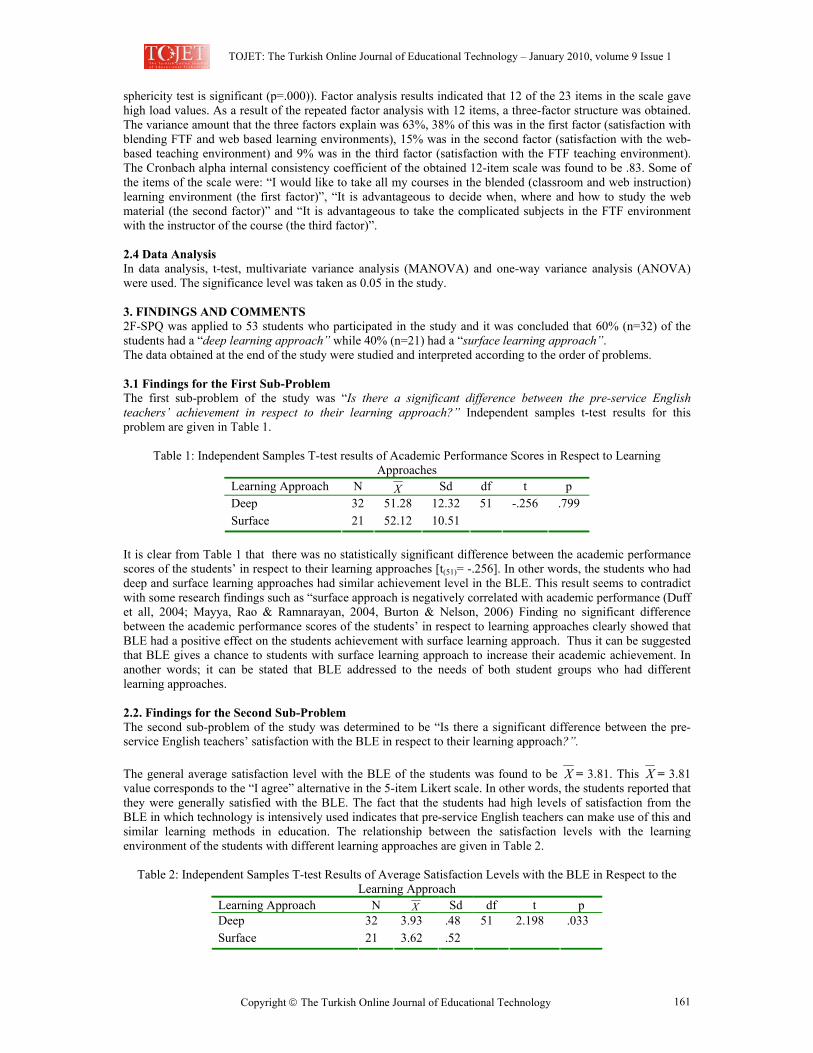
TOJET: The Turkish Online Journal of Educational Technology – January 2010, volume 9 Issue 1
Copyright The Turkish Online Journal of Educational Technology 161
sphericity test is significant (p=.000)). Factor analysis results indicated that 12 of the 23 items in the scale gave high load values. As a result of the repeated factor analysis with 12 items, a three-factor structure was obtained. The variance amount that the three factors explain was 63%, 38% of this was in the first factor (satisfaction with blending FTF and web based learning environments), 15% was in the second factor (satisfaction with the web-based teaching environment) and 9% was in the third factor (satisfaction with the FTF teaching environment). The Cronbach alpha internal consistency coefficient of the obtained 12-item scale was found to be .83. Some of the items of the scale were: “I would like to take all my courses in the blended (classroom and web instruction) learning environment (the first factor)”, “It is advantageous to decide when, where and how to study the web material (the second factor)” and “It is advantageous to take the complicated subjects in the FTF environment with the instructor of the course (the third factor)”. 2.4 Data Analysis In data analysis, t-test, multivariate variance analysis (MANOVA) and one-way variance analysis (ANOVA) were used. The significance level was taken as 0.05 in the study. 3. FINDINGS AND COMMENTS 2F-SPQ was applied to 53 students who participated in the study and it was concluded that 60% (n=32) of the students had a “deep learning approach” while 40% (n=21) had a “surface learning approach”. The data obtained at the end of the study were studied and interpreted according to the order of problems. 3.1 Findings for the First Sub-Problem The first sub-problem of the study was “Is there a significant difference between the pre-service English teachers’ achievement in respect to their learning approach?” Independent samples t-test results for this problem are given in Table 1.
Table 1: Independent Samples T-test results of Academic Performance Scores in Respect to Learning Approaches
Learning Approach N X Sd df t p Deep 32 51.28 12.32 Surface 21 52.12 10.51
51 -.256 .799
It is clear from Table 1 that there was no statistically significant difference between the academic performance scores of the students’ in respect to their learning approaches [t(51)= -.256]. In other words, the students who had deep and surface learning approaches had similar achievement level in the BLE. This result seems to contradict with some research findings such as “surface approach is negatively correlated with academic performance (Duff et all, 2004; Mayya, Rao & Ramnarayan, 2004, Burton & Nelson, 2006) Finding no significant difference between the academic performance scores of the students’ in respect to learning approaches clearly showed that BLE had a positive effect on the students achievement with surface learning approach. Thus it can be suggested that BLE gives a chance to students with surface learning approach to increase their academic achievement. In another words; it can be stated that BLE addressed to the needs of both student groups who had different learning approaches. 2.2. Findings for the Second Sub-Problem The second sub-problem of the study was determined to be “Is there a significant difference between the pre-service English teachers’ satisfaction with the BLE in respect to their learning approach?”. The general average satisfaction level with the BLE of the students was found to be X = 3.81. This X = 3.81 value corresponds to the “I agree” alternative in the 5-item Likert scale. In other words, the students reported that they were generally satisfied with the BLE. The fact that the students had high levels of satisfaction from the BLE in which technology is intensively used indicates that pre-service English teachers can make use of this and similar learning methods in education. The relationship between the satisfaction levels with the learning environment of the students with different learning approaches are given in Table 2.
Table 2: Independent Samples T-test Results of Average Satisfaction Levels with the BLE in Respect to the Learning Approach
Learning Approach N X Sd df t p Deep 32 3.93 .48 Surface 21 3.62 .52
51 2.198 .033
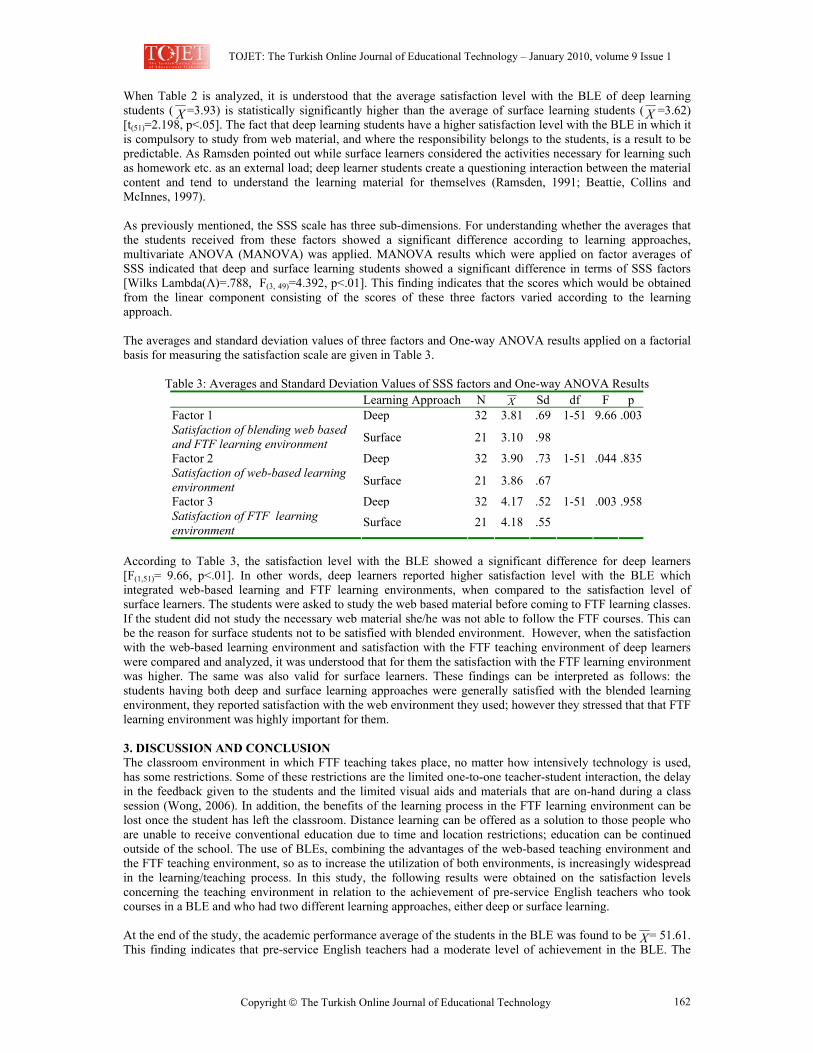
TOJET: The Turkish Online Journal of Educational Technology – January 2010, volume 9 Issue 1
Copyright The Turkish Online Journal of Educational Technology 162
When Table 2 is analyzed, it is understood that the average satisfaction level with the BLE of deep learning students ( =3.93) is statistically significantly higher than the average of surface learning students ( =3.62) [t(51)=2.198, p<.05]. The fact that deep learning students have a higher satisfaction level with the BLE in which it is compulsory to study from web material, and where the responsibility belongs to the students, is a result to be predictable. As Ramsden pointed out while surface learners considered the activities necessary for learning such as homework etc. as an external load; deep learner students create a questioning interaction between the material content and tend to understand the learning material for themselves (Ramsden, 1991; Beattie, Collins and McInnes, 1997). As previously mentioned, the SSS scale has three sub-dimensions. For understanding whether the averages that the students received from these factors showed a significant difference according to learning approaches, multivariate ANOVA (MANOVA) was applied. MANOVA results which were applied on factor averages of SSS indicated that deep and surface learning students showed a significant difference in terms of SSS factors [Wilks Lambda(Λ)=.788, F(3, 49)=4.392, p<.01]. This finding indicates that the scores which would be obtained from the linear component consisting of the scores of these three factors varied according to the learning approach. The averages and standard deviation values of three factors and One-way ANOVA results applied on a factorial basis for measuring the satisfaction scale are given in Table 3.
Table 3: Averages and Standard Deviation Values of SSS factors and One-way ANOVA Results Learning Approach N X Sd df F p
Deep 32 3.81 .69Factor 1 Satisfaction of blending web based and FTF learning environment Surface 21 3.10 .98
1-51 9.66 .003
Deep 32 3.90 .73Factor 2 Satisfaction of web-based learning environment Surface 21 3.86 .67
1-51 .044 .835
Deep 32 4.17 .52Factor 3 Satisfaction of FTF learning environment
Surface 21 4.18 .55
1-51 .003 .958
According to Table 3, the satisfaction level with the BLE showed a significant difference for deep learners [F(1,51)= 9.66, p<.01]. In other words, deep learners reported higher satisfaction level with the BLE which integrated web-based learning and FTF learning environments, when compared to the satisfaction level of surface learners. The students were asked to study the web based material before coming to FTF learning classes. If the student did not study the necessary web material she/he was not able to follow the FTF courses. This can be the reason for surface students not to be satisfied with blended environment. However, when the satisfaction with the web-based learning environment and satisfaction with the FTF teaching environment of deep learners were compared and analyzed, it was understood that for them the satisfaction with the FTF learning environment was higher. The same was also valid for surface learners. These findings can be interpreted as follows: the students having both deep and surface learning approaches were generally satisfied with the blended learning environment, they reported satisfaction with the web environment they used; however they stressed that that FTF learning environment was highly important for them. 3. DISCUSSION AND CONCLUSION The classroom environment in which FTF teaching takes place, no matter how intensively technology is used, has some restrictions. Some of these restrictions are the limited one-to-one teacher-student interaction, the delay in the feedback given to the students and the limited visual aids and materials that are on-hand during a class session (Wong, 2006). In addition, the benefits of the learning process in the FTF learning environment can be lost once the student has left the classroom. Distance learning can be offered as a solution to those people who are unable to receive conventional education due to time and location restrictions; education can be continued outside of the school. The use of BLEs, combining the advantages of the web-based teaching environment and the FTF teaching environment, so as to increase the utilization of both environments, is increasingly widespread in the learning/teaching process. In this study, the following results were obtained on the satisfaction levels concerning the teaching environment in relation to the achievement of pre-service English teachers who took courses in a BLE and who had two different learning approaches, either deep or surface learning. At the end of the study, the academic performance average of the students in the BLE was found to be = 51.61. This finding indicates that pre-service English teachers had a moderate level of achievement in the BLE. The
X X
X
TOJET: The Turkish Online Journal of Educational Technology – January 2010, volume 9 Issue 1
Copyright The Turkish Online Journal of Educational Technology 163
fact that the achievement average was moderate could result from the fact that the aforementioned students were taking courses based in the BLE for the first time. Yet their satisfaction level with the BLE ( = 3.81) indicates a quite high level of satisfaction. Considering that although the web-based learning environment which made up of almost 50% of the course was experienced by the students for the first time, this would appear to be a highly realistic result. If the number of courses in which this, and similar internet-based applications are widely used are increased; it is undeniable that the perspectives of the students who will be the English teachers of the future will be changed for the positive. For this reason, based on the results obtained, it is suggested that the number of the environments in which computer technologies are used in English teaching departments should be increased. The fact that the academic performance scores of deep and surface learner students in terms of learning approach did not show a statistically significant difference can mean that the BLE addresses the needs of both student groups in spite of their different learning approaches. However, this finding differs from the findings of Marton and Säljö (1976) in which they measured the reading comprehension skills of university students. Marton and Säljö (1976) found that the marks of surface learners were lower than those of deep learners in the learning process. In one respect, the fact that the BLE eliminated this achievement difference between the deep learners and surface learners resulted in a positive situation for the surface learners. The fact that the academic performance scores in the BLE did not show statistically significant differences between deep and surface learners could mean that the aforementioned environment positively effected the achievement of the surface learners as well as deep learners. As Diseth (2007b) reported, learning approaches may in turn be affected by course experience, and this is a positive message to lecturers who are concerned about monitoring how (…) course design may have an effect on the quality of learning and student performance. As a result, it can be stated that the courses which are designed for BLE contribute to the achievement of the students with surface learning approach. REFERENCES Beattie, V., Collins, B., & McInnes, B. (1997, March). Deep and surface learning: a simple or simplistic
dichotomy? Accounting Education , 6 (1), pp. 1-12. Biggs, J. (1999). What the student does: teaching for enhanced learning. Higher Education, 18 (1), pp.57-75. Biggs, J., Kember, D., & Leung, D. Y. (2001, March). The revised two-factor study process questionnaire:R-
SPQ-2F. British Journal of Educational Psycology , 71 (1), pp. 133-149. Boekaerts, M. (1996). Personality and the psychology of learning. European Journal of Personality, 10 (5), pp.
377-404. Burton, L. J. and Nelson, L. (2006). The relationships between personality, approaches to learning, and academic
success in first-year psychology distance education students. In: 2006 Higher Education Research and Development Society of Australasia Annual Conference, Perth, Australia. Online: http://eprints.usq.edu.au/3210/1/Burton_Nelson.pdf
Dart, B. C., Burnett, P. C., Purdie, N., Boulton-Lewis, G., Campbell, J. & Smith, D. (2000). Students' conceptions of learning, the classroom environment, and approaches to learning. Journal of Educational Research, 93 (4), pp. 262-270.
Diseth, Å. (2007a). Students' evaluation of teaching, approaches to learning, and academic achievement. Scandinavian Journal of Educational Research, 51 (2), pp. 185-204.
Diseth, Å. (2007b). Approaches to learning, course experience and examination grade among undergraduate psychology students: testing of mediator effects and construct validity. Studies in Higher Education, 32 (3), pp. 373-388.
Duff, A., Boyle, E., Dunleavy, K., & Ferguson, J. (2004). The relationship between personality, approach to learning and academic performance. Personality and Individual Differences, 36, pp. 1907–1920
Ellis, R. A., Goodyear, P., Prosser, M., & O'Hara. (2006). How and what university students learn through online and face-to-face discussion: conceptions, intentions and approaches. Journal of Computer Assisted Learning , 22 (4), pp. 244-256.
Ennis-Cole, D. L., & Lawhon, T. (2004). Teaching, Technology and Support in the New Millennium: A Guide for New Community College Teachers. Community College Journal of Research and Practice, 28 (7), pp. 583-592.
Entwistle, N. (1997). Reconstituting approaches to learning: A response to Webb. Higher Education, 33 (2), pp. 213-218.
European Commission. (1991). Memorandum on open distance learning in the European Community. Memorandum.
Garnham, C., & Kaleta, R. (2002). Introduction to Hybrid Courses. Teaching with Technology Today, 8(6). Guri-Rosenblit, S. (2005). ‘Distance education’ and ‘e-learning’: Not the same thing. Higher Education, 49 (4),
pp. 467-493.
X
TOJET: The Turkish Online Journal of Educational Technology – January 2010, volume 9 Issue 1
Copyright The Turkish Online Journal of Educational Technology 164
Haefner, J. (2000). Opinion: the importance of being synchronous. Academic Writing. Available at: http://wac.colostate.edu/aw/teaching/haefner2000.htm. Accessed October 12, 2006.
Heinze, A., & Procter, C. (2006). Online communication and information technology education. Journal of Information Technology Education, 5, pp. 235-249.
Laurillard, D. (1996). The changing university. A Forum for the Instructional Technology Community http://itech1.coe.uga.edu/itforum/paper13/paper13.html Accessed October 12, 2006.
Marton, F., & Säljö, R. (1976). On qualitative differences in learning: I – Outcome and process. British Journal of Educational Psychology, 46, pp. 4-11.
Mayya,S.S., Rao, A.K.,& Ramnarayan, K. (2004). Learning approaches, learning difficulties and academic performance of undergraduate students of physiotherapy. The Internet Journal of Allied Health Science and Practice. 2 (4). http://ijahsp.nova.edu
Minbashian, A., Huon, G. F., & Bird, D. K. (2004). Approaches to studying and academic performance in short-essay exams. Higher Education, 47, pp. 161-176.
Mortera-Gutiérrez, F. (2006). Faculty Best Practices Using Blended Learning in E-Learning and Face-to-Face Instruction. International Journal on E-Learning, 5 (3), pp. 313-337.
Osguthorpe, R. T., & Graham, C. R. (2003). Blended learning environments. Quarterly Review of Distance Education , 4 (3), pp. 227-233.
Prosser, M., & Trigwell, K. (1999). Relational perspectives on higher education teaching and learning in the science. Studies in Science Education, 33 (1), pp. 31-60.
Prosser, M., & Trigwell, K., & Waterhouse, F. (1999). Relations between teachers‘ approaches to teaching and students‘ approaches to learning. Higher Education, 37, pp. 57-70.
Ramsden, P. (1991). Learning to Teach in Higher Education. London: RoutledgeFalmer. Reay, J. (2001). Blended Learning-a fusion for the future. Knowledge Management Review, 4 (3), p.6. Riley, R. (2000). Intel® Teach to the Future Brings Together Microsoft and Other Industry Leaders in Half-
Billion Dollar Commitment to Improve Student Learning. Available at: http://www.csrwire.com/News/58.html Accessed October 12, 2006
Sands, P. (2002). Inside outside, upside downside strategies for connecting online and face-to-face instruction in hybrid courses. Teaching with Technology Today, 8 (6).
Wong, J. J. (2006). Traditional versus hybrid courses. International Journal of Learning 13 (8), pp. 163-170. Young, J. R. (2002). 'Hybrid' teaching seeks to end the divide between traditional and online instruction. The
Chronicle of Higher Education, 48 (28), p. 33.
TOJET: The Turkish Online Journal of Educational Technology – January 2010, volume 9 Issue 1
Copyright The Turkish Online Journal of Educational Technology 165
STUDENTS’ OPINIONS ON USING CLASSROOM TECHNOLOGY IN SCIENCE AND TECHNOLOGY LESSONS - A CASE STUDY FOR TURKEY (KILIS CITY)
Murat ESKİL, Habib ÖZGAN, Betül BALKAR
*Kilis 7 Aralık University, Muallim Rıfat Education Faculty– 79000 Kilis / TURKEY Gaziantep University, Education Faculty – 27000 Gaziantep / TURKEY
ABSTRACT This paper intendes to explore the opinions of 9-13 year old students’ perspective regarding the interaction with classroom technology (CT) in Science and Technology (S&T) lessons in Kilis city of Turkey. The issues discussed here can provide some ideas for educators to improve their teaching. Two types of students are used from private schools: from schools with high levels of teaching resources (HLTR), and from schools with low levels of teaching resources (LLTR). The students are surveyed in five general areas related to CT. The population of the study is 263 students (4. and 5 class) which belongs to four different primary schools in Kilis city. Subjects (participants) were chosen through random sampling. “Personal Data Form” and “Survey About Students’ Opinions on Using CT in S&T Lessons” which were improved by the researchers were used as data collection tools. From this research, Some differences have been found in students’ point of view on which it leads support on learning, drawing attention, increasing the research opportunities and the effects of computers on learning according to the school types by using CT in S&T lessons. Key Words: Classroom Technology, Science and Technology lesson 1. INTRODUCTION A newly integrated curriculum was implemented in primary and secondary schools of Turkey in 2004. This new curriculum reform explains not only how the curriculum should be changed and modified, but also how teachers would implement innovative teaching in their classrooms. Such reform will inevitably affect the design and instruction of teacher education courses in universities. New science teachers should be equipped with the ability to integrate and design the curriculum and aim for innovative teaching (Syh-Jong, 2008) Educational Technologies and Materials, which offer additional opportunities for learning and putting what you know forward, provides different learning enviroments and maintains permanent and interactive learning.Especially with abstract concept lessons like Science and Technology, the usage of educational technologies anad materials are very currucial (Serin et all, 2009). Technology in the classroom emerged as an issue for both teachers and students in the early 1980s. Since then, a number of studies have been done on how technology is used in the classroom, what advantages technology in the classroom may hold for teachers and students, and how technology is implemented in the classroom. (Plumm, 2008). Many schools around the world have adopted different computer related technologies in learning and education, e.g., the use of multimedia in the classroom (Schmid, 2008) altough some researchers have defended that biases that have been pointed out and studied within the educational system have not been solved by the use of technology (as some had hoped) (Plumm, 2008). Creating effective learning environments with technology remains a challenge for teachers. Despite the tremendous push for educators to integrate technology into their classrooms, many have yet to do so and struggle to find consistent success with technology-based instruction (Groff and Mouza, 2008). Harlen (2000) identifies three main aspects of the teacher's role: (1) setting up the learning environment, (2) organizing classroom activities, and (3) interacting with students. Among these three aspects, the most important aspect is teachers' interaction with students during their teaching. A teacher has to help students in engaging them to think while performing the tasks given. Johnson (1997) also found that the teacher's role during his study on a technology-based learning environment was crucial (Saat and Bakar, 2005). In today’s world, when the usage of technology in education is mentioned, the first thing that comes to mind is the usage of technologies related to computer. Thus, it is clear that computers cannot replace teachers since teachers are the key to whether technology is used appropriately and effectively (Kumar, Rose and D’Silva, 2008). At this point, the most important thing to do is to change the wrong thoughts of the educators about CT.
TOJET: The Turkish Online Journal of Educational Technology – January 2010, volume 9 Issue 1
Copyright The Turkish Online Journal of Educational Technology 166
Information technology (IT) has opened wide opportunities for educators to integrate technology-supported materials in the teaching-learning process and to improve the achievement of students (Jonassen, 1995). As computer costs decreased some classes began to be taught in computer labs where computers are available to students during class teaching (Harms 2007). The use of computer-aided technology in the classroom will, no doubt, inspire the teachers to approach their tasks with a greater sense of purpose and, more importantly, a sense of play to make the learning process fun for students. Using computer-based technology such as data-logging and simulations is important for modeling subjects such as science and mathematics. Furthermore, the availability of vast amounts of up-to-date information in the teaching and learning of different subjects are found on the World Wide Web. The internet provides far more up-to-date information than text books. Besides, looking for books and go in search for them and then discovering that it is not the one that has the kind of information you want can be time consuming and frustrating. The Net, on the other hand is very efficient. Up and above that, textbook can become obsolete with out off date information that could misguide students into believing that there is no further development after that discovery. It is also an undeniable fact that the multimedia and interactive nature of software programmes on CD-roms and on the World Wide Web assist with students’ learning. The computer motivates and caters for different learning abilities. Students generally enjoy using the computer and with enjoyment come motivation. In particular, the presence of computer-based technology changes the way subjects such as science and mathematics is being taught. It is believed that the current era relate to computers as part of their up-bringing and being relevant in a technologically oriented society. In the homes of increasing number of students, computers play an essential role in students’ recreation and learning (Kumar, Rose and D’Silva, 2008). Recognizing the paramount of importance of CT, many countries including Turkey have formulated special projects to enhance the usage of information technology. Turkey is a developing country between Europa and Asia. In last years, Turkish schools have experienced a dramatic growth in the use of computer-based technology for education purposes. Moreover, the Turkish Governments had also allocated special budget for making computer technology classes to schools. For Example, the National Ministry of Education bought 12,000 computers (tought to be one of the CT tool) for middle and secondary schools, but no preparations were made to understand how to use these computers in an effective way. As a consequence the majority of the schools used computers for reasons other than education – such as keeping records and registration of enrolments (Alyaz & Gürsoy, 2002; Özmen, 2008). In new Turkish Curriculum the teaching must be Student-centered and Turkish teachers have difficulty on changing their traditional teaching methods. This concern often centers on the perception that teaching across computers and other technological instruments might decrease the frequency of one-on-one student-teacher communication or increase the amount of time that teachers spend at their workstation. Recent research, however, indicates that the adoption of technology in the classroom can lead to qualitative and quantitative improvements in teacher-student interaction. Undoubtedly the recent advancement in information technology innovations and computer usage is rapidly transforming work culture and teachers cannot escape the fact that today’s classrooms must provide technology-supported learning (Angers & Machtmes, 2005). It is a widely held belief that many Turkish school teachers do not have a strong background with regard to using education technologies in daily-life, and especially in science education. In order for technology to be successfully integrated into the science curriculum, there are several factors that need to be in place. For example, teacher training is crucial for successful technology integration (Vrasidas & McIsaac, 2001; Şimşek, 2007). According to Papanastasiou, Zembylas, and Vrasidas (2003), it is only when teachers have the knowledge, skills, resources, and support available that they will be able to integrate technology in the science curriculum in order to maximize its effects on teaching and learning. The preparation of teachers to use technology continues to be a basic concern of teachers’ educators in Turkey (Altun, 1996; Baki, 2000). Baki (2000) reports that when pre-service teachers complete their teacher education programs, they are often faced with the reality that their education did not prepare them to use technology in their teaching. Therefore, learning to teach science with technology is an important concern, and should be integrated into the teacher education curriculum. This means that technology teaching experiences should become an integral part of the pre-service curriculum (Özmen, 2008). It is noted in the literature that a technology-based learning environment is complex and demanding for teachers for the following reasons (Fishman, Marx, Best, & Tal, 2003; Ladewski, Krajcik, & Harvey, 1994; Williams et al., 2004; Özmen, 2008): (i) teachers need to understand the discipline or content well enough to allow students to ask difficult-questions,
TOJET: The Turkish Online Journal of Educational Technology – January 2010, volume 9 Issue 1
Copyright The Turkish Online Journal of Educational Technology 167
(ii) they need to be familiar with the use of new representations of science content as a result of computers, such as using graphs, (iii) understanding of technological and computer-related issues, (iv) Although teachers are sent in courses for training to gain knowledge and skills in the actual usage of computer and technological equipments, many have returned only to fall back onto their traditional mode of teaching. It is possible to benefit from CT effectively in S&T lessons to reach the objectives which have been determined. S&T lessons are rich in content in terms of its usage of CT. If the content of the lesson is supported by CT meaningful learning will be achieved. S&T lessons are applied lessons in terms of content. If these lessons are taught verbally, it can not be possible to achieve meaningful learning. In S&T lessons where the lessons are taught in an applied way and visually, students will be able to concretize what they have already learned in their minds and send them to their long-term memory. For this reason, it will be useful to get use of CT to make learners more creative and have a positive attitude towards S&T lessons. CT is not, and never will be, transformative on its own - it requires teachers who can integrate technology into curriculum and use it to improve student (Kumar, Rose and D’Silva, 2008). 2. METHODS The aim of this research is to assign the views of 4. and 5. class students about using the CT in Science and Technology Lessons. Groff and Mousa (2008) reported that school level is a factor which influences the use of classroom technology. Therefore; the result of “The ratio of the students’ opinions about the following problems or items using CT according to the school type in S&T Lessons” tried to find: (a) Support on learning (b) Expanding the research facilities (c) Effects of the enhancement of the attention to the lesson (d) Effects of the computer which is one of the important instrument (e) Expanding the success 2. 1. Population The research was conducted in four primary schools between the education years 2008-2009 in the city of Kilis in Turkey. The population of the study comprised 263 students which are 4. and 5 classes. Subjects (participants) were chosen through random sampling. 2. 2. Collecting The Data “Personal Data Form” and “Survey About Students’ Opinions on Using CT in Science and Technology Lessons” which were improved by the researcher were used as data collection tools. In order to determine the questions which were used in the research, the students who study in primary schools are informed about the CT. Students were informed about the term of "technology" used in the questionnaire means the technologies including portable computers, probeware, projectors, digital cameras, VCDs, DVDs multimedia programs, and other specialized equipments. Their opinions on using CT in S&T Lessons were asked. In accordance with these opinions, question sentences are determined. To examine the cultural differences in students’ perception of the classroom technology, 2 private school and 2 state schools which one of them has high level teaching facilities (HLTR) and the other one has low level teaching facilities (LLTR) have been choosen. To collect the data, a questionnaire which have two segment is used. In the first section, there is an individual information form which has 10 items. The individual information form is for measuring their thoughts about using the CT in S&T lessons. The actual survey questions are included in appendix. 3. RESULTS AND ANALYSIS OF DATA A. Individual informations about the students There are 149 female students (%56.65) and 114 male students (%43.34) in the research. Their ages are between 9 and 13. It has been seen that 38 students have high financial conditions (%14.44), 76 students have good financial conditions (%28.89), 81 students have middle financial conditions (%30.79) and 68 students have bad financial conditions (%25.85). Between these students, 69 students have their own personal computer (%26.23). It has been seen that 74 students have high success (%28.13), 99 students have good success (%37.64), 65 students have middle success (%24.71) and 25 students have bad success (%9.50) in S&T lessons. 223 of them
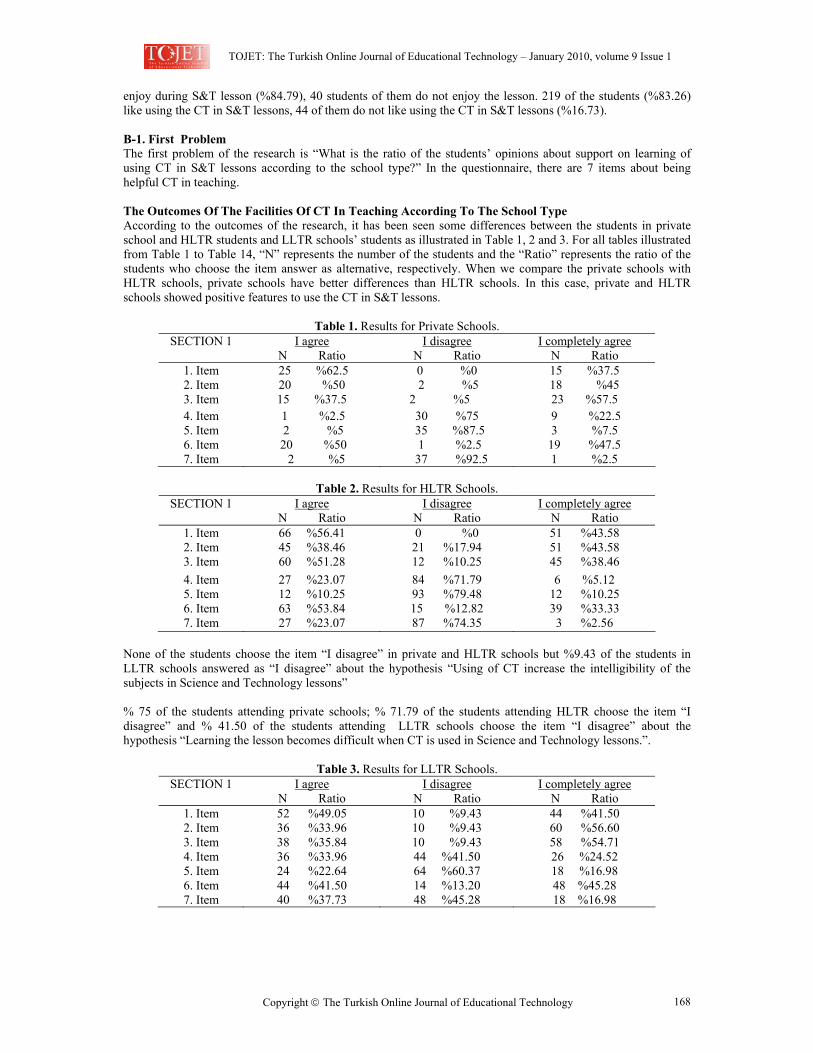
TOJET: The Turkish Online Journal of Educational Technology – January 2010, volume 9 Issue 1
Copyright The Turkish Online Journal of Educational Technology 168
enjoy during S&T lesson (%84.79), 40 students of them do not enjoy the lesson. 219 of the students (%83.26) like using the CT in S&T lessons, 44 of them do not like using the CT in S&T lessons (%16.73). B-1. First Problem The first problem of the research is “What is the ratio of the students’ opinions about support on learning of using CT in S&T lessons according to the school type?” In the questionnaire, there are 7 items about being helpful CT in teaching. The Outcomes Of The Facilities Of CT In Teaching According To The School Type According to the outcomes of the research, it has been seen some differences between the students in private school and HLTR students and LLTR schools’ students as illustrated in Table 1, 2 and 3. For all tables illustrated from Table 1 to Table 14, “N” represents the number of the students and the “Ratio” represents the ratio of the students who choose the item answer as alternative, respectively. When we compare the private schools with HLTR schools, private schools have better differences than HLTR schools. In this case, private and HLTR schools showed positive features to use the CT in S&T lessons.
Table 1. Results for Private Schools. SECTION 1 I agree
N Ratio I disagree
N Ratio I completely agree
N Ratio 1. Item 25 %62.5 0 %0 15 %37.5 2. Item 20 %50 2 %5 18 %45 3. Item 15 %37.5 2 %5 23 %57.5 4. Item 1 %2.5 30 %75 9 %22.5 5. Item 2 %5 35 %87.5 3 %7.5 6. Item 20 %50 1 %2.5 19 %47.5 7. Item 2 %5 37 %92.5 1 %2.5
Table 2. Results for HLTR Schools.
SECTION 1 I agree N Ratio
I disagree N Ratio
I completely agree N Ratio
1. Item 66 %56.41 0 %0 51 %43.58 2. Item 45 %38.46 21 %17.94 51 %43.58 3. Item 60 %51.28 12 %10.25 45 %38.46 4. Item 27 %23.07 84 %71.79 6 %5.12 5. Item 12 %10.25 93 %79.48 12 %10.25 6. Item 63 %53.84 15 %12.82 39 %33.33 7. Item 27 %23.07 87 %74.35 3 %2.56
None of the students choose the item “I disagree” in private and HLTR schools but %9.43 of the students in LLTR schools answered as “I disagree” about the hypothesis “Using of CT increase the intelligibility of the subjects in Science and Technology lessons” % 75 of the students attending private schools; % 71.79 of the students attending HLTR choose the item “I disagree” and % 41.50 of the students attending LLTR schools choose the item “I disagree” about the hypothesis “Learning the lesson becomes difficult when CT is used in Science and Technology lessons.”.
Table 3. Results for LLTR Schools. SECTION 1 I agree
N Ratio I disagree
N Ratio I completely agree
N Ratio 1. Item 52 %49.05 10 %9.43 44 %41.50 2. Item 36 %33.96 10 %9.43 60 %56.60 3. Item 38 %35.84 10 %9.43 58 %54.71 4. Item 36 %33.96 44 %41.50 26 %24.52 5. Item 24 %22.64 64 %60.37 18 %16.98 6. Item 44 %41.50 14 %13.20 48 %45.28 7. Item 40 %37.73 48 %45.28 18 %16.98
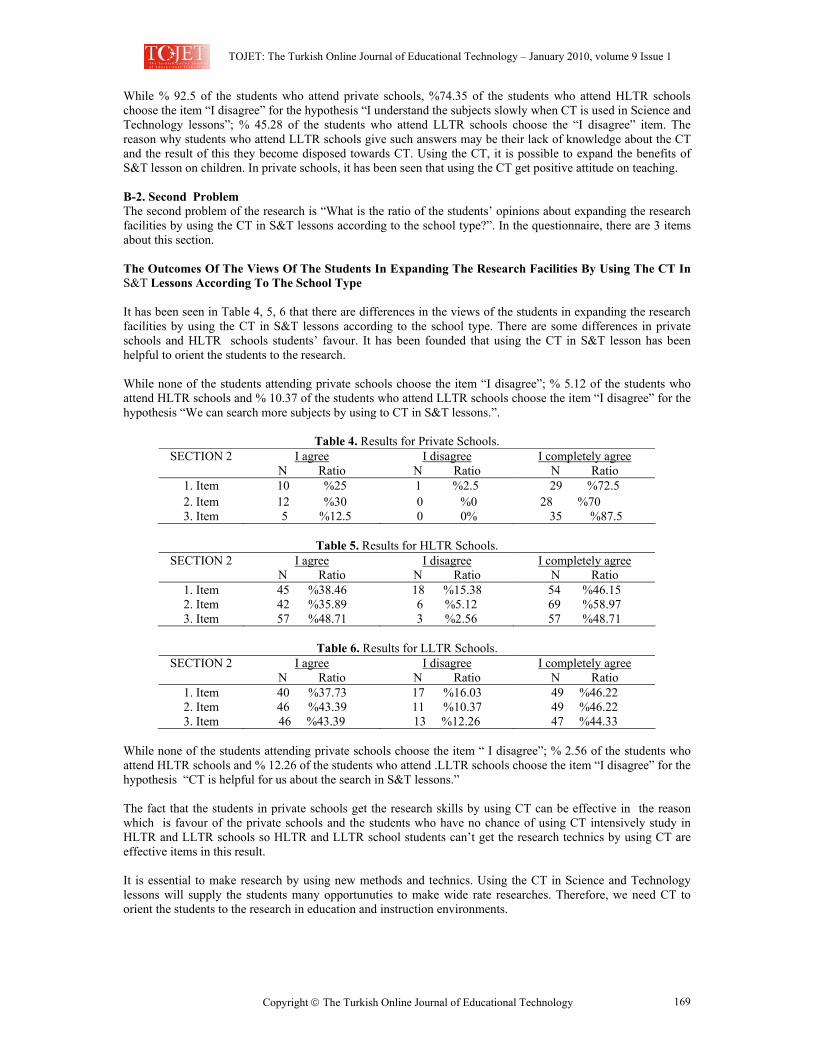
TOJET: The Turkish Online Journal of Educational Technology – January 2010, volume 9 Issue 1
Copyright The Turkish Online Journal of Educational Technology 169
While % 92.5 of the students who attend private schools, %74.35 of the students who attend HLTR schools choose the item “I disagree” for the hypothesis “I understand the subjects slowly when CT is used in Science and Technology lessons”; % 45.28 of the students who attend LLTR schools choose the “I disagree” item. The reason why students who attend LLTR schools give such answers may be their lack of knowledge about the CT and the result of this they become disposed towards CT. Using the CT, it is possible to expand the benefits of S&T lesson on children. In private schools, it has been seen that using the CT get positive attitude on teaching. B-2. Second Problem The second problem of the research is “What is the ratio of the students’ opinions about expanding the research facilities by using the CT in S&T lessons according to the school type?”. In the questionnaire, there are 3 items about this section. The Outcomes Of The Views Of The Students In Expanding The Research Facilities By Using The CT In S&T Lessons According To The School Type It has been seen in Table 4, 5, 6 that there are differences in the views of the students in expanding the research facilities by using the CT in S&T lessons according to the school type. There are some differences in private schools and HLTR schools students’ favour. It has been founded that using the CT in S&T lesson has been helpful to orient the students to the research. While none of the students attending private schools choose the item “I disagree”; % 5.12 of the students who attend HLTR schools and % 10.37 of the students who attend LLTR schools choose the item “I disagree” for the hypothesis “We can search more subjects by using to CT in S&T lessons.”.
Table 4. Results for Private Schools. SECTION 2 I agree
N Ratio I disagree
N Ratio I completely agree
N Ratio 1. Item 10 %25 1 %2.5 29 %72.5 2. Item 12 %30 0 %0 28 %70 3. Item 5 %12.5 0 0% 35 %87.5
Table 5. Results for HLTR Schools.
SECTION 2 I agree N Ratio
I disagree N Ratio
I completely agree N Ratio
1. Item 45 %38.46 18 %15.38 54 %46.15 2. Item 42 %35.89 6 %5.12 69 %58.97 3. Item 57 %48.71 3 %2.56 57 %48.71
Table 6. Results for LLTR Schools.
SECTION 2 I agree N Ratio
I disagree N Ratio
I completely agree N Ratio
1. Item 40 %37.73 17 %16.03 49 %46.22 2. Item 46 %43.39 11 %10.37 49 %46.22 3. Item 46 %43.39 13 %12.26 47 %44.33
While none of the students attending private schools choose the item “ I disagree”; % 2.56 of the students who attend HLTR schools and % 12.26 of the students who attend .LLTR schools choose the item “I disagree” for the hypothesis “CT is helpful for us about the search in S&T lessons.” The fact that the students in private schools get the research skills by using CT can be effective in the reason which is favour of the private schools and the students who have no chance of using CT intensively study in HLTR and LLTR schools so HLTR and LLTR school students can’t get the research technics by using CT are effective items in this result. It is essential to make research by using new methods and technics. Using the CT in Science and Technology lessons will supply the students many opportunuties to make wide rate researches. Therefore, we need CT to orient the students to the research in education and instruction environments.
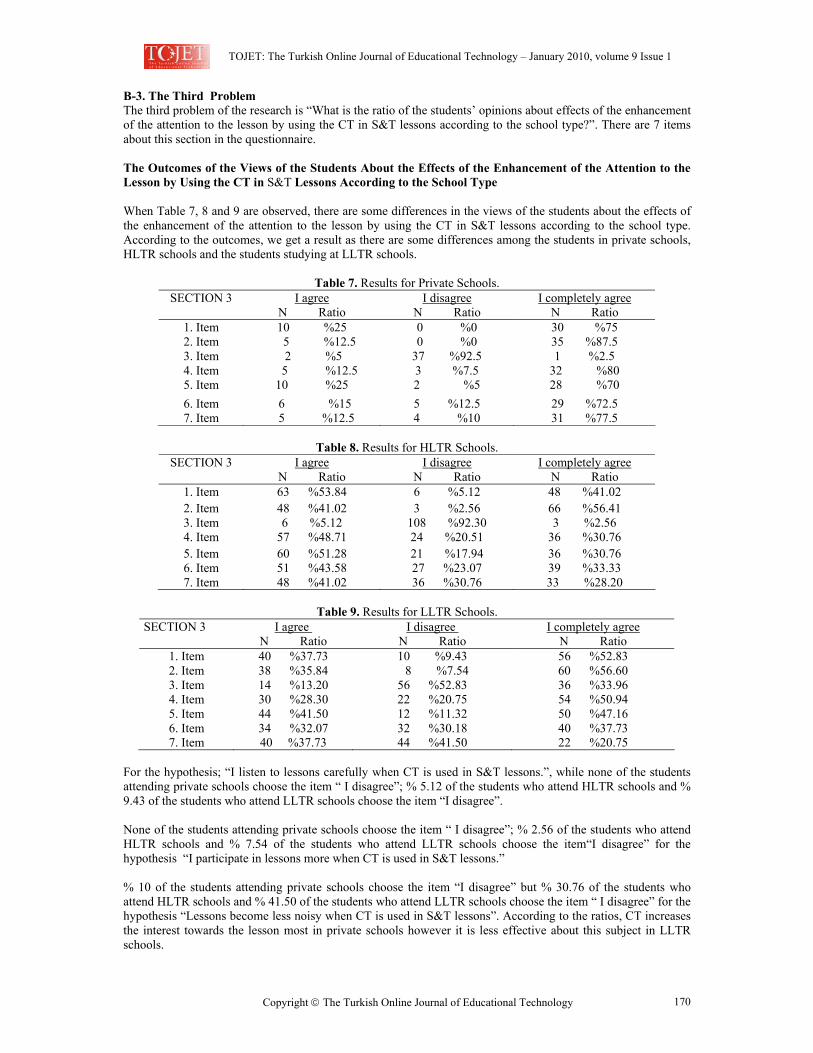
TOJET: The Turkish Online Journal of Educational Technology – January 2010, volume 9 Issue 1
Copyright The Turkish Online Journal of Educational Technology 170
B-3. The Third Problem The third problem of the research is “What is the ratio of the students’ opinions about effects of the enhancement of the attention to the lesson by using the CT in S&T lessons according to the school type?”. There are 7 items about this section in the questionnaire. The Outcomes of the Views of the Students About the Effects of the Enhancement of the Attention to the Lesson by Using the CT in S&T Lessons According to the School Type When Table 7, 8 and 9 are observed, there are some differences in the views of the students about the effects of the enhancement of the attention to the lesson by using the CT in S&T lessons according to the school type. According to the outcomes, we get a result as there are some differences among the students in private schools, HLTR schools and the students studying at LLTR schools.
Table 7. Results for Private Schools. SECTION 3 I agree
N Ratio I disagree
N Ratio I completely agree
N Ratio 1. Item 10 %25 0 %0 30 %75 2. Item 5 %12.5 0 %0 35 %87.5 3. Item 2 %5 37 %92.5 1 %2.5 4. Item 5 %12.5 3 %7.5 32 %80 5. Item 10 %25 2 %5 28 %70 6. Item 6 %15 5 %12.5 29 %72.5 7. Item 5 %12.5 4 %10 31 %77.5
Table 8. Results for HLTR Schools.
SECTION 3 I agree N Ratio
I disagree N Ratio
I completely agree N Ratio
1. Item 63 %53.84 6 %5.12 48 %41.02 2. Item 48 %41.02 3 %2.56 66 %56.41 3. Item 6 %5.12 108 %92.30 3 %2.56 4. Item 57 %48.71 24 %20.51 36 %30.76 5. Item 60 %51.28 21 %17.94 36 %30.76 6. Item 51 %43.58 27 %23.07 39 %33.33 7. Item 48 %41.02 36 %30.76 33 %28.20
Table 9. Results for LLTR Schools.
SECTION 3 I agree N Ratio
I disagree N Ratio
I completely agree N Ratio
1. Item 40 %37.73 10 %9.43 56 %52.83 2. Item 38 %35.84 8 %7.54 60 %56.60 3. Item 14 %13.20 56 %52.83 36 %33.96 4. Item 30 %28.30 22 %20.75 54 %50.94 5. Item 44 %41.50 12 %11.32 50 %47.16 6. Item 34 %32.07 32 %30.18 40 %37.73 7. Item 40 %37.73 44 %41.50 22 %20.75
For the hypothesis; “I listen to lessons carefully when CT is used in S&T lessons.”, while none of the students attending private schools choose the item “ I disagree”; % 5.12 of the students who attend HLTR schools and % 9.43 of the students who attend LLTR schools choose the item “I disagree”. None of the students attending private schools choose the item “ I disagree”; % 2.56 of the students who attend HLTR schools and % 7.54 of the students who attend LLTR schools choose the item“I disagree” for the hypothesis “I participate in lessons more when CT is used in S&T lessons.” % 10 of the students attending private schools choose the item “I disagree” but % 30.76 of the students who attend HLTR schools and % 41.50 of the students who attend LLTR schools choose the item “ I disagree” for the hypothesis “Lessons become less noisy when CT is used in S&T lessons”. According to the ratios, CT increases the interest towards the lesson most in private schools however it is less effective about this subject in LLTR schools.
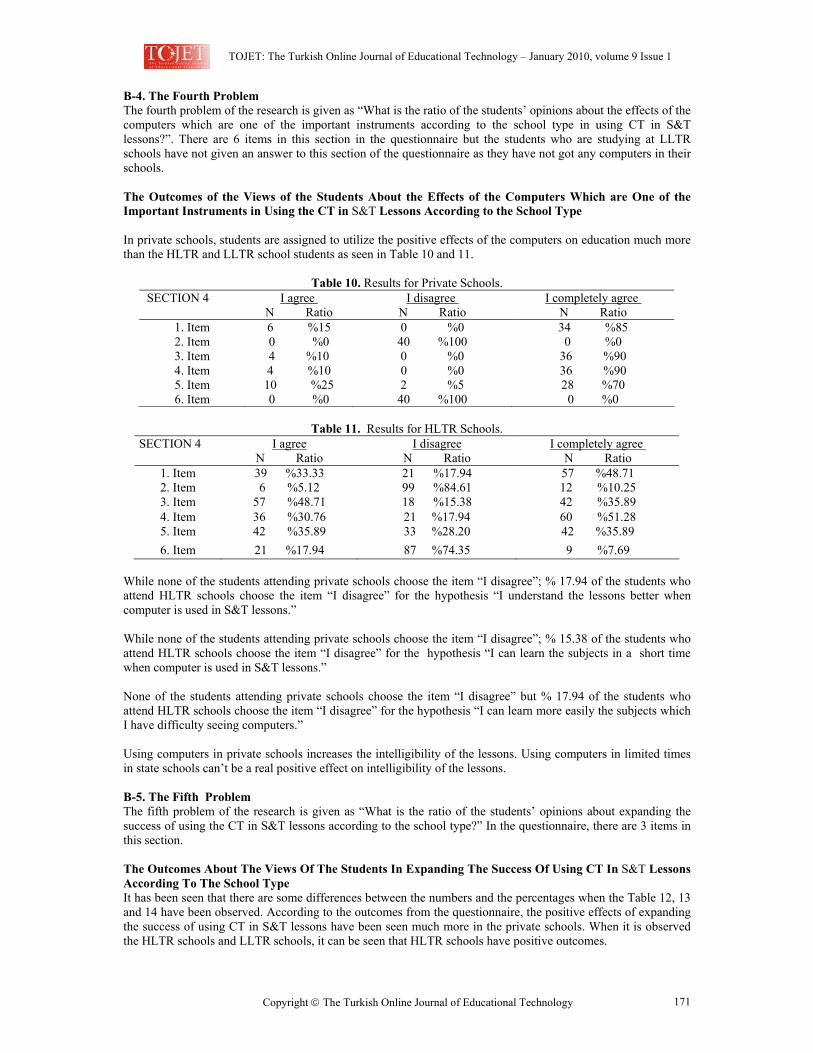
TOJET: The Turkish Online Journal of Educational Technology – January 2010, volume 9 Issue 1
Copyright The Turkish Online Journal of Educational Technology 171
B-4. The Fourth Problem The fourth problem of the research is given as “What is the ratio of the students’ opinions about the effects of the computers which are one of the important instruments according to the school type in using CT in S&T lessons?”. There are 6 items in this section in the questionnaire but the students who are studying at LLTR schools have not given an answer to this section of the questionnaire as they have not got any computers in their schools. The Outcomes of the Views of the Students About the Effects of the Computers Which are One of the Important Instruments in Using the CT in S&T Lessons According to the School Type In private schools, students are assigned to utilize the positive effects of the computers on education much more than the HLTR and LLTR school students as seen in Table 10 and 11.
Table 10. Results for Private Schools. SECTION 4 I agree
N Ratio I disagree
N Ratio I completely agree
N Ratio 1. Item 6 %15 0 %0 34 %85 2. Item 0 %0 40 %100 0 %0 3. Item 4 %10 0 %0 36 %90 4. Item 4 %10 0 %0 36 %90 5. Item 10 %25 2 %5 28 %70 6. Item 0 %0 40 %100 0 %0
Table 11. Results for HLTR Schools.
SECTION 4 I agree N Ratio
I disagree N Ratio
I completely agree N Ratio
1. Item 39 %33.33 21 %17.94 57 %48.71 2. Item 6 %5.12 99 %84.61 12 %10.25 3. Item 57 %48.71 18 %15.38 42 %35.89 4. Item 36 %30.76 21 %17.94 60 %51.28 5. Item 42 %35.89 33 %28.20 42 %35.89 6. Item 21 %17.94 87 %74.35 9 %7.69
While none of the students attending private schools choose the item “I disagree”; % 17.94 of the students who attend HLTR schools choose the item “I disagree” for the hypothesis “I understand the lessons better when computer is used in S&T lessons.” While none of the students attending private schools choose the item “I disagree”; % 15.38 of the students who attend HLTR schools choose the item “I disagree” for the hypothesis “I can learn the subjects in a short time when computer is used in S&T lessons.” None of the students attending private schools choose the item “I disagree” but % 17.94 of the students who attend HLTR schools choose the item “I disagree” for the hypothesis “I can learn more easily the subjects which I have difficulty seeing computers.” Using computers in private schools increases the intelligibility of the lessons. Using computers in limited times in state schools can’t be a real positive effect on intelligibility of the lessons. B-5. The Fifth Problem The fifth problem of the research is given as “What is the ratio of the students’ opinions about expanding the success of using the CT in S&T lessons according to the school type?” In the questionnaire, there are 3 items in this section. The Outcomes About The Views Of The Students In Expanding The Success Of Using CT In S&T Lessons According To The School Type It has been seen that there are some differences between the numbers and the percentages when the Table 12, 13 and 14 have been observed. According to the outcomes from the questionnaire, the positive effects of expanding the success of using CT in S&T lessons have been seen much more in the private schools. When it is observed the HLTR schools and LLTR schools, it can be seen that HLTR schools have positive outcomes.
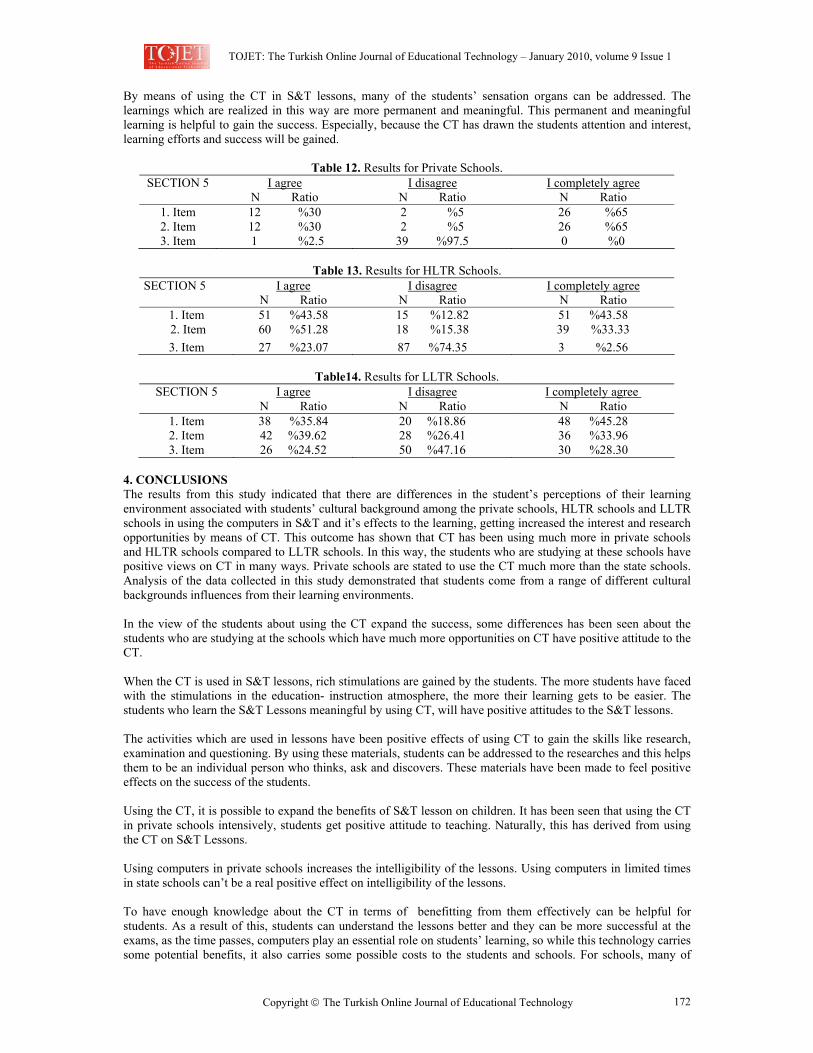
TOJET: The Turkish Online Journal of Educational Technology – January 2010, volume 9 Issue 1
Copyright The Turkish Online Journal of Educational Technology 172
By means of using the CT in S&T lessons, many of the students’ sensation organs can be addressed. The learnings which are realized in this way are more permanent and meaningful. This permanent and meaningful learning is helpful to gain the success. Especially, because the CT has drawn the students attention and interest, learning efforts and success will be gained.
Table 12. Results for Private Schools. SECTION 5 I agree
N Ratio I disagree
N Ratio I completely agree
N Ratio 1. Item 12 %30 2 %5 26 %65 2. Item 12 %30 2 %5 26 %65 3. Item 1 %2.5 39 %97.5 0 %0
Table 13. Results for HLTR Schools.
SECTION 5 I agree N Ratio
I disagree N Ratio
I completely agree N Ratio
1. Item 51 %43.58 15 %12.82 51 %43.58 2. Item 60 %51.28 18 %15.38 39 %33.33 3. Item 27 %23.07 87 %74.35 3 %2.56
Table14. Results for LLTR Schools.
SECTION 5 I agree N Ratio
I disagree N Ratio
I completely agree N Ratio
1. Item 38 %35.84 20 %18.86 48 %45.28 2. Item 42 %39.62 28 %26.41 36 %33.96 3. Item 26 %24.52 50 %47.16 30 %28.30
4. CONCLUSIONS The results from this study indicated that there are differences in the student’s perceptions of their learning environment associated with students’ cultural background among the private schools, HLTR schools and LLTR schools in using the computers in S&T and it’s effects to the learning, getting increased the interest and research opportunities by means of CT. This outcome has shown that CT has been using much more in private schools and HLTR schools compared to LLTR schools. In this way, the students who are studying at these schools have positive views on CT in many ways. Private schools are stated to use the CT much more than the state schools. Analysis of the data collected in this study demonstrated that students come from a range of different cultural backgrounds influences from their learning environments. In the view of the students about using the CT expand the success, some differences has been seen about the students who are studying at the schools which have much more opportunities on CT have positive attitude to the CT. When the CT is used in S&T lessons, rich stimulations are gained by the students. The more students have faced with the stimulations in the education- instruction atmosphere, the more their learning gets to be easier. The students who learn the S&T Lessons meaningful by using CT, will have positive attitudes to the S&T lessons. The activities which are used in lessons have been positive effects of using CT to gain the skills like research, examination and questioning. By using these materials, students can be addressed to the researches and this helps them to be an individual person who thinks, ask and discovers. These materials have been made to feel positive effects on the success of the students. Using the CT, it is possible to expand the benefits of S&T lesson on children. It has been seen that using the CT in private schools intensively, students get positive attitude to teaching. Naturally, this has derived from using the CT on S&T Lessons. Using computers in private schools increases the intelligibility of the lessons. Using computers in limited times in state schools can’t be a real positive effect on intelligibility of the lessons. To have enough knowledge about the CT in terms of benefitting from them effectively can be helpful for students. As a result of this, students can understand the lessons better and they can be more successful at the exams, as the time passes, computers play an essential role on students’ learning, so while this technology carries some potential benefits, it also carries some possible costs to the students and schools. For schools, many of
TOJET: The Turkish Online Journal of Educational Technology – January 2010, volume 9 Issue 1
Copyright The Turkish Online Journal of Educational Technology 173
these costs are associated with the up-front time required to develop proficiency with the systems and the revision or development of materials to support pedagogical use of the system. As a part of this investigation and other researches (Pedretti, Smith and Woodrow, 1999), with teachers using technologies in their classroom, provides a different picture. We have found that when technologies are thoughtfully integrated with a sound pedagogical vision, students’ views of teaching and approaches to learning can be positively affected. 5. SUGGESTIONS
• As an instructional tool, as well as background in the new roles associated with student-centered classroom technology based S&T projects should be informed about using CT.
• Original softwares should be produced and developed for S&T course topics and this softwares should be used in all government and private schools to gain the meaningful learning in education process.
• Inadequate school culture must be changed in positive way to cultivate technology-based science lessons.
• Without knowledge and skills of CT, one would feel uncomfortable of learning with CT, or even feel intimidated by it so to benefit from CT, the students’ attitutes, concerns, and experiences with technology should be iproved.
• Schools should be ornamented within CT with enough level to benefit from its’ positive effects in education.
Acknowledgement The authors are pleased to acknowledge and thank to Prof. Dr. Ömer ERGİN for the permission about using research problems. 6. REFERENCES Altun, E. H. (1996). Information technology in developing nations: A study of lecturers’ attitudes and expertise
with reference to Turkish education. Journal of Information Technology for Teacher Education, 5, 185–205.
Alyaz, Y., & Gürsoy, E. (2002). Computer-based instruction and computer assisted language learning in schools in Bursa. Uludağ University Journal of Education Faculty, 15, 1–13.
Angers, J., & Machtmes, K. (2005). An ethnographic-case study of beliefs, context factors, and practices of teachers integrating technology. The Qualitative Report, 10 (4), 771-794.
Baki, A. (2000). Preparing student teachers to use computers in mathematics classrooms through a long-term pre-service course in Turkey. Journal of Information Technology for Teacher Education, 9 (3), 343–362.
Chong, C.K., Sharaf, H., & Jacob, D. (2005). A study on the use of ICT in mathematics teaching. Malaysian Online Journal of Instructional Technology, 2 (3), 43-51
Douglas H., (2007), A Brief Comparison of Technologies Available in the Computer Science Classroom, International Conference on Computer Systems and Technologies - CompSysTech’07, University of Rousse, Bulgaria.
Fishman, B., Marx, R., Best, S., & Tal, R. (2003). Linking teacher and student learning to improve professional development in systemic reform. Teaching and Teacher Education, 19 (6), 643–658.
Groff and Mouza, (2008). A Framework for Addressing Challenges to Classroom Technology Use, AACE Journal, 16 (1), 21-46.
Harlen, W. (2000). Teaching, learning and assessing science, 5–12 (3rd ed.). London: Paul Chapman Publishing.
Johnson, R. (1997). How can computers be used to promote metacognition in primary school students? Unpublished Ph.D. thesis, Monash University, Australia.
Jonassen, D. (1995). Supporting communities of learners with technology: A vision for integrating technology with learning in schools. CT, 35(4), 60-63.
Kumar, N., Raduan Che Rose, Jeffrey Lawrence D’Silva, (2008). Teachers’ Readiness to Use Technology in the Classroom: An Empirical Study, European Journal of Scientific Research, Vol.21 No.4, pp.603-616.
Ladewski, B. G., Krajcik, J. S., & Harvey, C. L. (1994). A middle grade science teacher’s emerging understanding of project-based instruction. Elementary School Journal, 94, 499–515.
Özmen H., (2008). The influence of computer-assisted instruction on students’ conceptual understanding of chemical bonding and attitude toward chemistry: A case for Turkey Computers & Education, 51, 423–438.
Pedrettı, E., Jolıe Mayer-Smıth And Janıce Woodrow (1999), Teaming Technology Enhanced Instruction in the Science Classroom and Teacher Professional Development, Jl. of Technology and Teacher Education, 7(2), 131-143.
TOJET: The Turkish Online Journal of Educational Technology – January 2010, volume 9 Issue 1
Copyright The Turkish Online Journal of Educational Technology 174
Plumm, K., (2008) ,Technology in the classroom: Burning the bridges to the gaps in gender-biased education?, Computers & Education 50, 1052–1068.
Rohaida Mohd. Saat, Kamariah Abu Bakar, (2005), Technology-Based Scıence Classroom: What Factors Facılıtate Learnıng?, Jurnal Pendidik dan Pendidikan, Jil. 20, 1–19.
Schmid, E. C. (2008). Potential pedagogical benefits and drawbacks of multimedia use in the English language classroom equipped with interactive whiteboard technology, Computers & Education, 51, 1553–1568.
Serin Oğuz; Bulut Serin, Nergüz & Saygılı, Gizem (2009), The effect of educational technologies and material supported science and technology teaching on the problem solving skills of 5th grade primary school student, Procedia Social and Behavioral Sciences, 1, 665–670
Syh-Jong, J., (2008), Innovations in science teacher education: Effects of integrating technology and team-teaching strategies, Computers & Education 51, 646–659.
Şimşek N., (2007). The influence of applications and activities based on GIS in the teaching of social studies on student's success and attitudes to the socail studies, PhD Thesis, Gazi University, Turkey, 1-14.
Vrasidas, C., & McIsaac, M. (2001). Integrating technology in teaching and teacher education: Implications for policy and curriculum reform. Educational Media International, 38, 127–132.
Williams, M., Linn, M. C., Ammon, P., & Gearhart, M. (2004). Learning to teach inquiry science in a technology-based environment: A case study. Journal of Science Education and Technology, 13 (2), 189–206.
TOJET: The Turkish Online Journal of Educational Technology – January 2010, volume 9 Issue 1
Copyright The Turkish Online Journal of Educational Technology 175
APPENDIX. A1. SECTION 1 Using of CT in S&T Lessons 1) Increase the intelligibility of the subjects. 2) I like Science and Technology Lessons. 3) The lessons are more enjoyable. 4) Learning the lesson becomes difficult. 5) I get bored. 6) I can learn the subjects quickly. 7) I understand the subjects slowly. A2. SECTION 2 In S&T lessons, 1) We can determine the different research problems about the learning subject when CT is used. 2) We can search more subjects by means of CT. 3) CT is helpful for us about searching the knowledge. A3. SECTION 3 When CT is used in S&T lessons: 1) I listen lessons carefully. 2) I participate in lessons more. 3) I am not interested in lessons. 4) I become unaware of effluxion of time. 5) I look forward to having lessons impatiently. 6) All of my friends listen to lessons curiosly. 7) Lessons become less noisy. A4. SECTION 4 When computer is used in S&T lessons, 1) I understand the lessons better. 2) I have difficulty on learning the lessons. 3) I can learn the subjects in a short time. 4) I can learn the subjects more easily which I have difficulty in learning while studying on computers. 5) I learn the subjects better by using computer, therefore my success in the exams increases. 6) I do not understand the lessons when computer is used. For this reason I get bad marks in the exams. A5. SECTION 5 When CT is used in S&T lessons, 1) I can answer the questions quickly and correctly. 2) I understand the subjects better, as a result I have good marks. 3) It is hard to understand the lessons so I am unsuccessful at exams.
TOJET: The Turkish Online Journal of Educational Technology – January 2010, volume 9 Issue 1
Copyright The Turkish Online Journal of Educational Technology 176
STUDENTS’ PERCEPTIONS IN DEVELOPING A MULTIMEDIA PROJECT WITHIN A CONSTRUCTIVIST LEARNING ENVIRONMENT: A MALAYSIAN
EXPERIENCE
Dr. Mai NEO & Dr. Tse-Kian NEO (Ken) Faculty of Creative Multimedia
Multimedia University, Cyberjaya, Malaysia
Dr. Mai Neo
Senior Lecturer Faculty of Creative Multimedia
Multimedia University 1, Jalan Multimedia, Cyberjaya, Malaysia
Email: [email protected]
ABSTRACT This paper presents a research study that was conducted in the Faculty of Creative Multimedia, Multimedia University, Malaysia, to investigate students’ perceptions in developing a multimedia project within a constructivist-based learning environment. Students worked in groups to create an interactive multimedia application using an authoring tool, and were solely responsible for every project development decision. They were then given a survey and asked for their comments and feedback to elicit their perceptions and attitudes towards this learning environment. A factorial analysis was performed on the survey and results showed that 5 factors influenced students’ perceptions in developing a multimedia project within a constructivist learning environment. Multiple regression analysis further showed that motivation played a significant role in students’ perception towards developing a multimedia project in this learning environment. These results were further supported by their survey comments and feedback.
Results of the study showed that by setting an authentic task, via a multimedia project, into a constructivist learning environment, students became highly motivated learners and active in their learning process and provided strong support and encouragement for Malaysian educators to incorporate multimedia technology and constructivist learning into their classrooms. Keywords: constructivism, multimedia, Malaysia, projects INTRODUCTION The infusion of Information Communication Technology (ICT) and, in particular, multimedia technology into education, has created a significant impact on the instructional content development and the methods of communicating information to the learners. It is leading to the evolution of new concepts and innovative teaching techniques in the instruction-learning process. This changing landscape of education focusses on learning, rather than on teaching and pedagogy, curriculum and instruction. It seeks to create a generation of learners whose learning is defined as "the ability to retain, synthesize, and apply conceptually complex information in meaningful ways" (Lambert & McCombs, 1998) to encourage better student learning through the learning objectives of project-based learning or learning by doing (Schank, Berman & Macpherson, 1999) and to enable problem-solving, analysis, creativity and communication to take place in the classroom (Bates, 2000). In addition to this, multimedia technology has been shown to affect students’ motivation and self-esteem levels, as well as allow them to be creative and self-directed thinkers (Agnew, Kellerman & Meyer, 1996; Yildirim, 2006). In Malaysia, the traditional mode of learning is still being used in many institutions of learning. However, in the context of introducing technology and multimedia in learning, the Malaysian Government is echoing this learner-centred learning initiative with a call for Malaysian institutions of higher learning to integrate ICT into their classrooms (Mat, 2000). Institutions of higher learning in Malaysia have begun to incorporate multimedia materials in problem-based learning and storytelling environments (Hong, Lai & Holton, 2003), in developing e-learning methods (Lee, 2005; Norhayati & Siew, 2004) and in web-based courses (Rohaida & Kamariah, 2000; Neo, 2005). Research in Malaysia has shown that using constructivism and multimedia technology is becoming increasingly important in teaching and learning in higher education in order to promote and enhance the teaching and learning process (Wong, Kamariah & Tang, 2003; Lee, 2005), to allow learning to take place in authentic contexts (Herrington, Reeves, Oliver & Woo, 2004) and to enablee teachers to better communicate knowledge to their students in the classrooms (Wong et. al, 2003). As such, this study was developed to
TOJET: The Turkish Online Journal of Educational Technology – January 2010, volume 9 Issue 1
Copyright The Turkish Online Journal of Educational Technology 177
investigate students’ perceptions in using a multimedia project embedded within a constructivist learning environment and its impact on their learning process. This study was designed to show that, through their perceptions and feedback on the project, students would be able to reveal their ability to acquire skills integral to the meeting the demands of the workplace, such as collaborative and teamwork skills, problem-solving, learning motivation, critical thinking and understanding of a topic area, and see the real-world relevance of their work. The constructivist-based learning environment A constructivist learning environment is “a place where learners may work together and support each other as they use a variety of tools and information resources in their pursuit of learning goals and problem-solving activities" (Wilson, 1995), and that learning is a personal interpretation of the world, where learners create interpretations of the world based on their past experience and interpretations (Jonassen, 1994; Perkins, 1991; Cunningham, 1991; Wilson, 1995; Duffy & Cunningham, 1996; Jonassen & Henning, 1999). In constructivism, the teacher is no longer perceived as the sole authority of the knowledge, but rather as the facilitator of learning, guiding and supporting learners in the process of constructing knowledge (Berg, 1999) and providing the students with experiences that allow them to develop problem-solving, critical-thinking and creative skills, and apply them in a meaningful manner. The learning activities in a constructivist learning environment call for students to become active participants in their own learning processes, learn to solve problems and work collaboratively (Heath, 2001; Land & Hannafin, 1996). The learning environment is set in a meaningful, authentic context that allows for learner-centred activities to take place. These activities are social and collaborative in nature, where peers play an important role in encouraging the student’s learning process and will expose students to multiple perspectives and solutions to their problems, enabling them to consider “…varying and discrepant points of view with which to consider the merits of his or her own mental models” (Oliver, 2000). By working in a group situation, students will have to tap into their group skills and use a variety of activities to accomplish the project's overall objectives. The group would be responsible for their goals and, thus, a collaborative learning experience can be gained. As such, constructivist learning environments are designed so that students will be able to become active participants in their learning process and develop skills that would allow them to think critically, function well as a member of a team, develop collaborative abilities and deepen their understanding of their task and improve student learning. Current research shows that many graduates today are ill-equipped with problem-solving and communication skills needed to meet the demands of the IT industries (Teo & Wong, 2000; Tan 2000). This mismatch has prompted Malaysian educators to seek new ways to inculcate the appropriate skills and knowledge into the students in order to meet the rising expectations of the IT society. As such this study was designed to investigate the perceptions of students when a multimedia project is embedded within a constructivist learning environment, whereby they would experience learning skills such as problem-solving, critical and creative thinking, collaboration and teamwork, and presentation, oral and reflection skills. Jonassen (1999) proposed several important components to be incorporated when designing a constructivist learning environment (CLE):
• Conception of the problem for the students to begin their learning development. • Interpretation develops solutions to their problems. • Information sources to support the understanding of the problem. • Cognitive tools to help learners interpret and manipulate aspects of the problem. • Conversation and collaboration tools to enable the learners to form communities to negotiate and co-
construct meaning for the problem. Herrington et. al (2004) extended the design of the constructivist learning environment by including an authentic learning setting within the problem structure. This had enabled students to see the relevance of the problem to them and thus became more active in seeking solutions to their problems. Learning took place in a meaningful, authentic context and developed into a social, collaborative activity. Therefore, this study sought to design a constructivist learning environment that would incorporate the components of Jonassen (1999) as well as set it in an authentic learning setting, as proposed by Herrington et. al (2004). This learning environment would incorporate multimedia technology with an authentic task via the development of a multimedia project, where students would become active participants in their learning process and construct new knowledge.
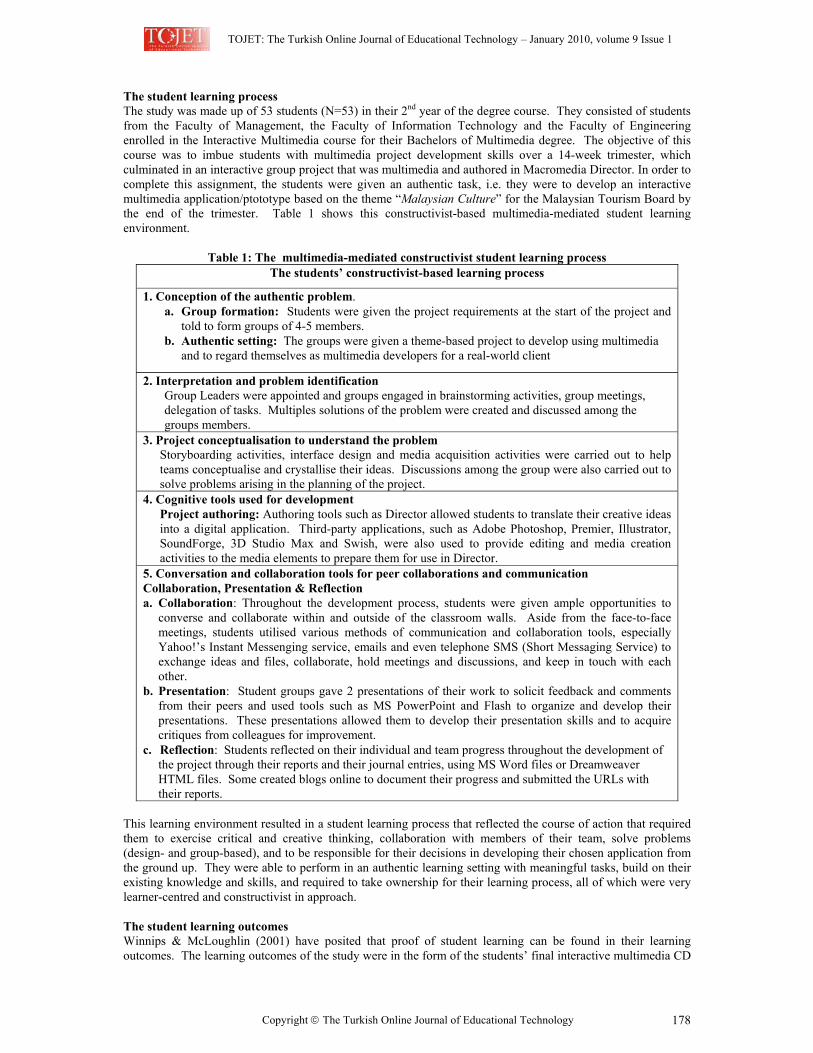
TOJET: The Turkish Online Journal of Educational Technology – January 2010, volume 9 Issue 1
Copyright The Turkish Online Journal of Educational Technology 178
The student learning process The study was made up of 53 students (N=53) in their 2nd year of the degree course. They consisted of students from the Faculty of Management, the Faculty of Information Technology and the Faculty of Engineering enrolled in the Interactive Multimedia course for their Bachelors of Multimedia degree. The objective of this course was to imbue students with multimedia project development skills over a 14-week trimester, which culminated in an interactive group project that was multimedia and authored in Macromedia Director. In order to complete this assignment, the students were given an authentic task, i.e. they were to develop an interactive multimedia application/ptototype based on the theme “Malaysian Culture” for the Malaysian Tourism Board by the end of the trimester. Table 1 shows this constructivist-based multimedia-mediated student learning environment.
Table 1: The multimedia-mediated constructivist student learning process
The students’ constructivist-based learning process
1. Conception of the authentic problem. a. Group formation: Students were given the project requirements at the start of the project and
told to form groups of 4-5 members. b. Authentic setting: The groups were given a theme-based project to develop using multimedia
and to regard themselves as multimedia developers for a real-world client
2. Interpretation and problem identification Group Leaders were appointed and groups engaged in brainstorming activities, group meetings, delegation of tasks. Multiples solutions of the problem were created and discussed among the groups members.
3. Project conceptualisation to understand the problem Storyboarding activities, interface design and media acquisition activities were carried out to help teams conceptualise and crystallise their ideas. Discussions among the group were also carried out to solve problems arising in the planning of the project.
4. Cognitive tools used for development Project authoring: Authoring tools such as Director allowed students to translate their creative ideas into a digital application. Third-party applications, such as Adobe Photoshop, Premier, Illustrator, SoundForge, 3D Studio Max and Swish, were also used to provide editing and media creation activities to the media elements to prepare them for use in Director.
5. Conversation and collaboration tools for peer collaborations and communication Collaboration, Presentation & Reflection a. Collaboration: Throughout the development process, students were given ample opportunities to
converse and collaborate within and outside of the classroom walls. Aside from the face-to-face meetings, students utilised various methods of communication and collaboration tools, especially Yahoo!’s Instant Messenging service, emails and even telephone SMS (Short Messaging Service) to exchange ideas and files, collaborate, hold meetings and discussions, and keep in touch with each other.
b. Presentation: Student groups gave 2 presentations of their work to solicit feedback and comments from their peers and used tools such as MS PowerPoint and Flash to organize and develop their presentations. These presentations allowed them to develop their presentation skills and to acquire critiques from colleagues for improvement.
c. Reflection: Students reflected on their individual and team progress throughout the development of the project through their reports and their journal entries, using MS Word files or Dreamweaver HTML files. Some created blogs online to document their progress and submitted the URLs with their reports.
This learning environment resulted in a student learning process that reflected the course of action that required them to exercise critical and creative thinking, collaboration with members of their team, solve problems (design- and group-based), and to be responsible for their decisions in developing their chosen application from the ground up. They were able to perform in an authentic learning setting with meaningful tasks, build on their existing knowledge and skills, and required to take ownership for their learning process, all of which were very learner-centred and constructivist in approach. The student learning outcomes Winnips & McLoughlin (2001) have posited that proof of student learning can be found in their learning outcomes. The learning outcomes of the study were in the form of the students’ final interactive multimedia CD
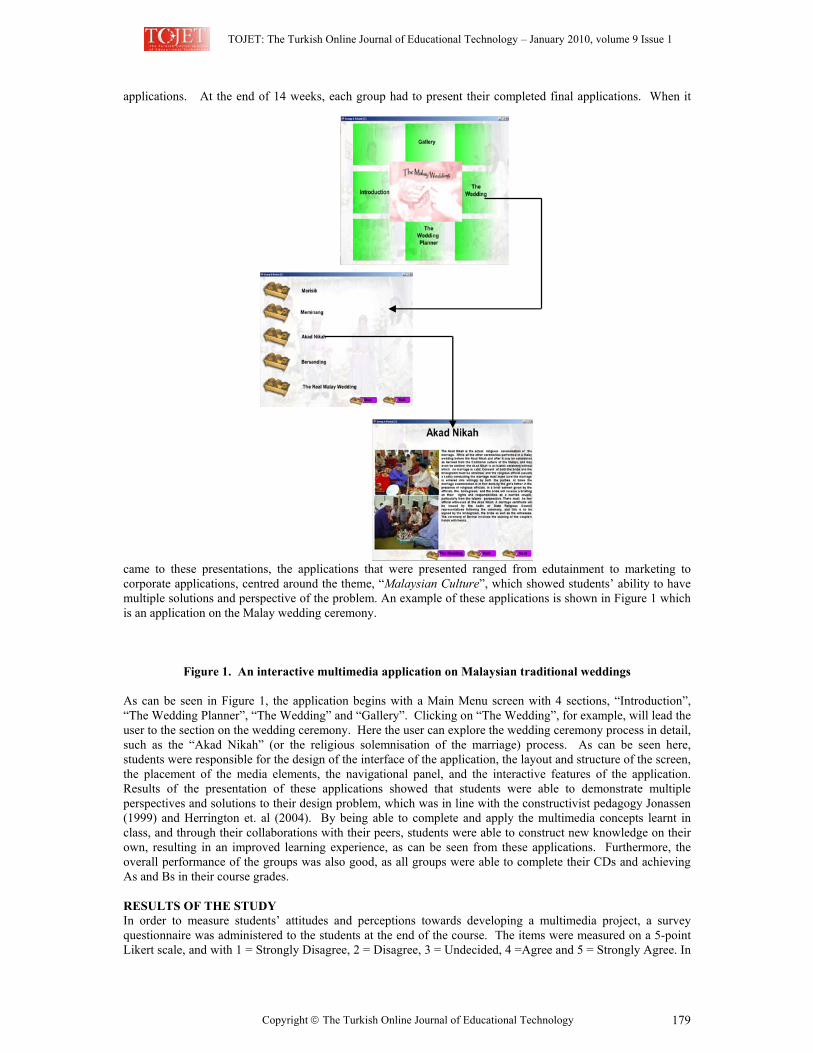
TOJET: The Turkish Online Journal of Educational Technology – January 2010, volume 9 Issue 1
Copyright The Turkish Online Journal of Educational Technology 179
applications. At the end of 14 weeks, each group had to present their completed final applications. When it
came to these presentations, the applications that were presented ranged from edutainment to marketing to corporate applications, centred around the theme, “Malaysian Culture”, which showed students’ ability to have multiple solutions and perspective of the problem. An example of these applications is shown in Figure 1 which is an application on the Malay wedding ceremony.
Figure 1. An interactive multimedia application on Malaysian traditional weddings
As can be seen in Figure 1, the application begins with a Main Menu screen with 4 sections, “Introduction”, “The Wedding Planner”, “The Wedding” and “Gallery”. Clicking on “The Wedding”, for example, will lead the user to the section on the wedding ceremony. Here the user can explore the wedding ceremony process in detail, such as the “Akad Nikah” (or the religious solemnisation of the marriage) process. As can be seen here, students were responsible for the design of the interface of the application, the layout and structure of the screen, the placement of the media elements, the navigational panel, and the interactive features of the application. Results of the presentation of these applications showed that students were able to demonstrate multiple perspectives and solutions to their design problem, which was in line with the constructivist pedagogy Jonassen (1999) and Herrington et. al (2004). By being able to complete and apply the multimedia concepts learnt in class, and through their collaborations with their peers, students were able to construct new knowledge on their own, resulting in an improved learning experience, as can be seen from these applications. Furthermore, the overall performance of the groups was also good, as all groups were able to complete their CDs and achieving As and Bs in their course grades. RESULTS OF THE STUDY In order to measure students’ attitudes and perceptions towards developing a multimedia project, a survey questionnaire was administered to the students at the end of the course. The items were measured on a 5-point Likert scale, and with 1 = Strongly Disagree, 2 = Disagree, 3 = Undecided, 4 =Agree and 5 = Strongly Agree. In
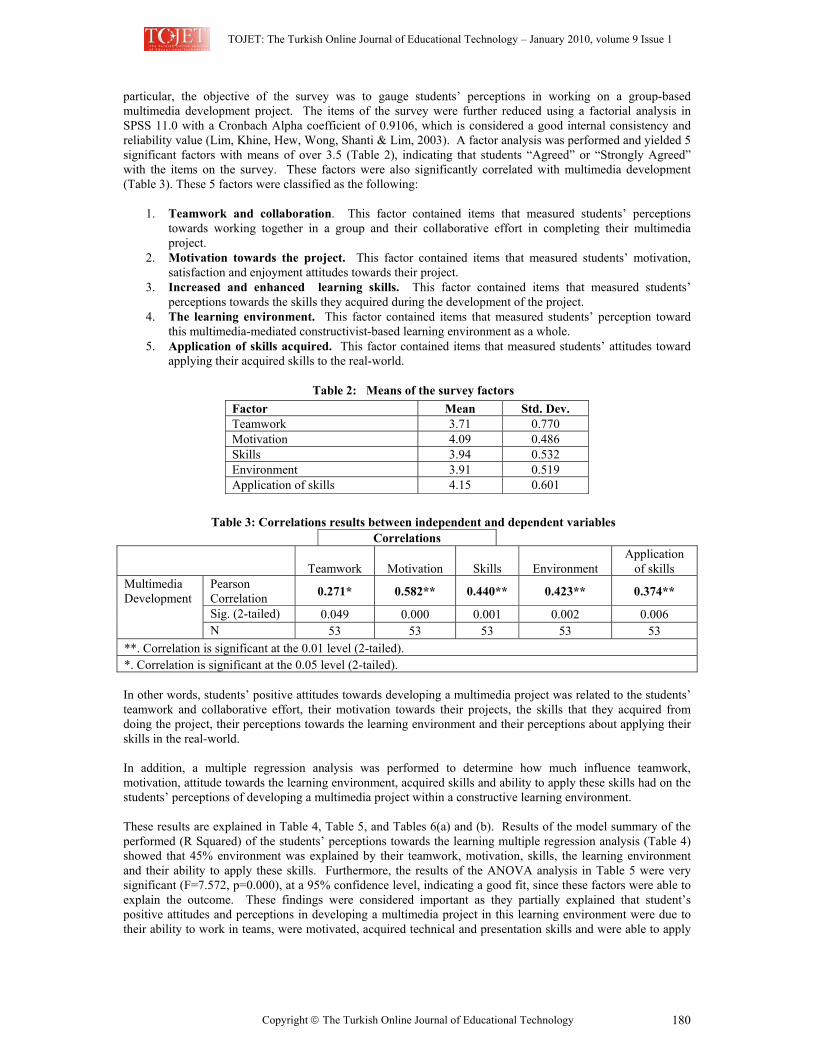
TOJET: The Turkish Online Journal of Educational Technology – January 2010, volume 9 Issue 1
Copyright The Turkish Online Journal of Educational Technology 180
particular, the objective of the survey was to gauge students’ perceptions in working on a group-based multimedia development project. The items of the survey were further reduced using a factorial analysis in SPSS 11.0 with a Cronbach Alpha coefficient of 0.9106, which is considered a good internal consistency and reliability value (Lim, Khine, Hew, Wong, Shanti & Lim, 2003). A factor analysis was performed and yielded 5 significant factors with means of over 3.5 (Table 2), indicating that students “Agreed” or “Strongly Agreed” with the items on the survey. These factors were also significantly correlated with multimedia development (Table 3). These 5 factors were classified as the following:
1. Teamwork and collaboration. This factor contained items that measured students’ perceptions towards working together in a group and their collaborative effort in completing their multimedia project.
2. Motivation towards the project. This factor contained items that measured students’ motivation, satisfaction and enjoyment attitudes towards their project.
3. Increased and enhanced learning skills. This factor contained items that measured students’ perceptions towards the skills they acquired during the development of the project.
4. The learning environment. This factor contained items that measured students’ perception toward this multimedia-mediated constructivist-based learning environment as a whole.
5. Application of skills acquired. This factor contained items that measured students’ attitudes toward applying their acquired skills to the real-world.
Table 2: Means of the survey factors
Table 3: Correlations results between independent and dependent variables
Correlations
Teamwork Motivation Skills Environment Application
of skills Pearson Correlation 0.271* 0.582** 0.440** 0.423** 0.374**
Sig. (2-tailed) 0.049 0.000 0.001 0.002 0.006
Multimedia Development
N 53 53 53 53 53 **. Correlation is significant at the 0.01 level (2-tailed). *. Correlation is significant at the 0.05 level (2-tailed). In other words, students’ positive attitudes towards developing a multimedia project was related to the students’ teamwork and collaborative effort, their motivation towards their projects, the skills that they acquired from doing the project, their perceptions towards the learning environment and their perceptions about applying their skills in the real-world. In addition, a multiple regression analysis was performed to determine how much influence teamwork, motivation, attitude towards the learning environment, acquired skills and ability to apply these skills had on the students’ perceptions of developing a multimedia project within a constructive learning environment. These results are explained in Table 4, Table 5, and Tables 6(a) and (b). Results of the model summary of the performed (R Squared) of the students’ perceptions towards the learning multiple regression analysis (Table 4) showed that 45% environment was explained by their teamwork, motivation, skills, the learning environment and their ability to apply these skills. Furthermore, the results of the ANOVA analysis in Table 5 were very significant (F=7.572, p=0.000), at a 95% confidence level, indicating a good fit, since these factors were able to explain the outcome. These findings were considered important as they partially explained that student’s positive attitudes and perceptions in developing a multimedia project in this learning environment were due to their ability to work in teams, were motivated, acquired technical and presentation skills and were able to apply
Factor Mean Std. Dev. Teamwork 3.71 0.770 Motivation 4.09 0.486 Skills 3.94 0.532 Environment 3.91 0.519 Application of skills 4.15 0.601
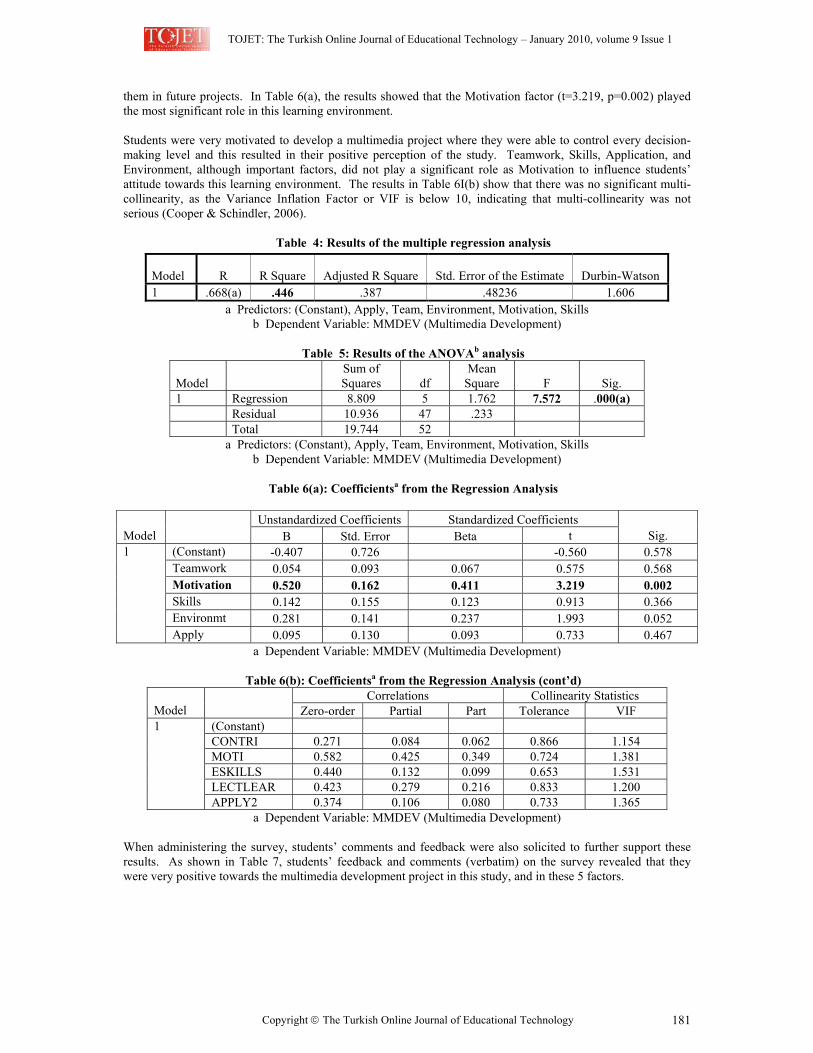
TOJET: The Turkish Online Journal of Educational Technology – January 2010, volume 9 Issue 1
Copyright The Turkish Online Journal of Educational Technology 181
them in future projects. In Table 6(a), the results showed that the Motivation factor (t=3.219, p=0.002) played the most significant role in this learning environment. Students were very motivated to develop a multimedia project where they were able to control every decision-making level and this resulted in their positive perception of the study. Teamwork, Skills, Application, and Environment, although important factors, did not play a significant role as Motivation to influence students’ attitude towards this learning environment. The results in Table 6I(b) show that there was no significant multi-collinearity, as the Variance Inflation Factor or VIF is below 10, indicating that multi-collinearity was not serious (Cooper & Schindler, 2006).
Table 4: Results of the multiple regression analysis
a Predictors: (Constant), Apply, Team, Environment, Motivation, Skills b Dependent Variable: MMDEV (Multimedia Development)
Table 5: Results of the ANOVAb analysis
Model Sum of Squares df
Mean Square F Sig.
1 Regression 8.809 5 1.762 7.572 .000(a) Residual 10.936 47 .233 Total 19.744 52
a Predictors: (Constant), Apply, Team, Environment, Motivation, Skills b Dependent Variable: MMDEV (Multimedia Development)
Table 6(a): Coefficientsa from the Regression Analysis
Unstandardized Coefficients Standardized Coefficients
Model B Std. Error Beta t Sig. (Constant) -0.407 0.726 -0.560 0.578 Teamwork 0.054 0.093 0.067 0.575 0.568 Motivation 0.520 0.162 0.411 3.219 0.002 Skills 0.142 0.155 0.123 0.913 0.366 Environmt 0.281 0.141 0.237 1.993 0.052
1
Apply 0.095 0.130 0.093 0.733 0.467 a Dependent Variable: MMDEV (Multimedia Development)
Table 6(b): Coefficientsa from the Regression Analysis (cont’d)
Correlations Collinearity Statistics Model Zero-order Partial Part Tolerance VIF
(Constant) CONTRI 0.271 0.084 0.062 0.866 1.154 MOTI 0.582 0.425 0.349 0.724 1.381 ESKILLS 0.440 0.132 0.099 0.653 1.531 LECTLEAR 0.423 0.279 0.216 0.833 1.200
1
APPLY2 0.374 0.106 0.080 0.733 1.365 a Dependent Variable: MMDEV (Multimedia Development)
When administering the survey, students’ comments and feedback were also solicited to further support these results. As shown in Table 7, students’ feedback and comments (verbatim) on the survey revealed that they were very positive towards the multimedia development project in this study, and in these 5 factors.
Model R R Square Adjusted R Square Std. Error of the Estimate Durbin-Watson 1 .668(a) .446 .387 .48236 1.606
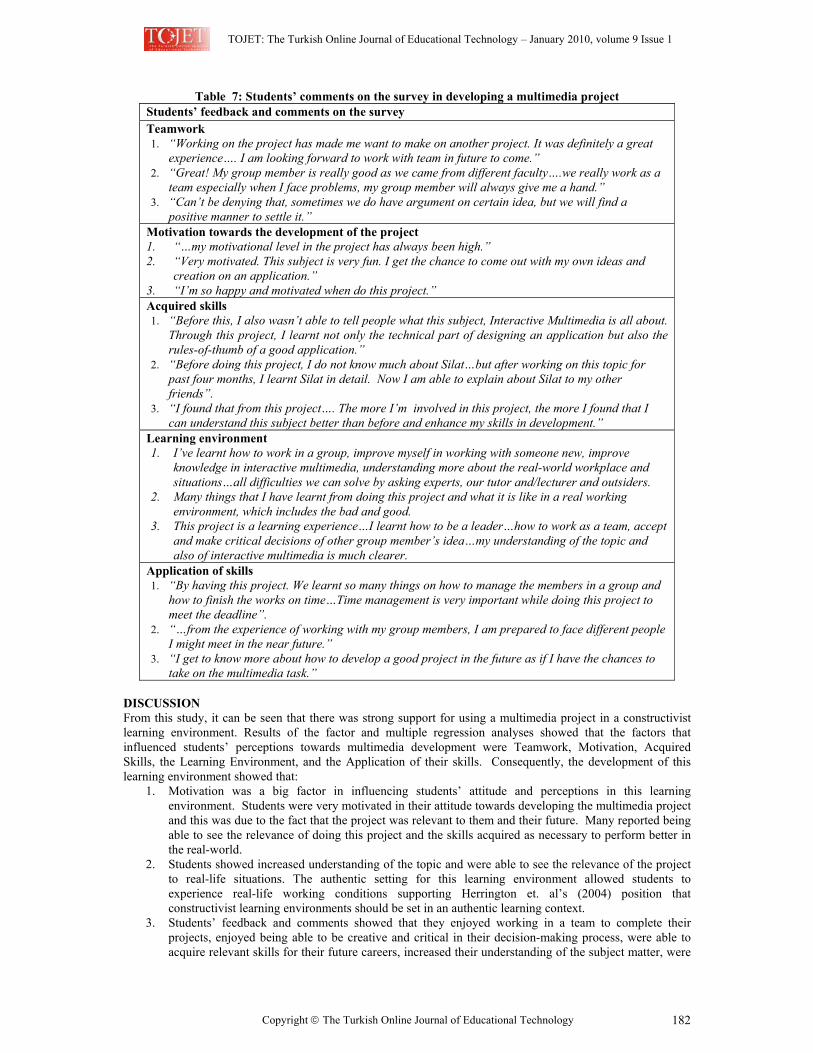
TOJET: The Turkish Online Journal of Educational Technology – January 2010, volume 9 Issue 1
Copyright The Turkish Online Journal of Educational Technology 182
Table 7: Students’ comments on the survey in developing a multimedia project Students’ feedback and comments on the survey Teamwork 1. “Working on the project has made me want to make on another project. It was definitely a great
experience…. I am looking forward to work with team in future to come.” 2. “Great! My group member is really good as we came from different faculty….we really work as a
team especially when I face problems, my group member will always give me a hand.” 3. “Can’t be denying that, sometimes we do have argument on certain idea, but we will find a
positive manner to settle it.” Motivation towards the development of the project 1. “…my motivational level in the project has always been high.” 2. “Very motivated. This subject is very fun. I get the chance to come out with my own ideas and
creation on an application.” 3. “I’m so happy and motivated when do this project.” Acquired skills 1. “Before this, I also wasn’t able to tell people what this subject, Interactive Multimedia is all about.
Through this project, I learnt not only the technical part of designing an application but also the rules-of-thumb of a good application.”
2. “Before doing this project, I do not know much about Silat…but after working on this topic for past four months, I learnt Silat in detail. Now I am able to explain about Silat to my other friends”.
3. “I found that from this project…. The more I’m involved in this project, the more I found that I can understand this subject better than before and enhance my skills in development.”
Learning environment 1. I’ve learnt how to work in a group, improve myself in working with someone new, improve
knowledge in interactive multimedia, understanding more about the real-world workplace and situations…all difficulties we can solve by asking experts, our tutor and/lecturer and outsiders.
2. Many things that I have learnt from doing this project and what it is like in a real working environment, which includes the bad and good.
3. This project is a learning experience…I learnt how to be a leader…how to work as a team, accept and make critical decisions of other group member’s idea…my understanding of the topic and also of interactive multimedia is much clearer.
Application of skills 1. “By having this project. We learnt so many things on how to manage the members in a group and
how to finish the works on time…Time management is very important while doing this project to meet the deadline”.
2. “…from the experience of working with my group members, I am prepared to face different people I might meet in the near future.”
3. “I get to know more about how to develop a good project in the future as if I have the chances to take on the multimedia task.”
DISCUSSION From this study, it can be seen that there was strong support for using a multimedia project in a constructivist learning environment. Results of the factor and multiple regression analyses showed that the factors that influenced students’ perceptions towards multimedia development were Teamwork, Motivation, Acquired Skills, the Learning Environment, and the Application of their skills. Consequently, the development of this learning environment showed that:
1. Motivation was a big factor in influencing students’ attitude and perceptions in this learning environment. Students were very motivated in their attitude towards developing the multimedia project and this was due to the fact that the project was relevant to them and their future. Many reported being able to see the relevance of doing this project and the skills acquired as necessary to perform better in the real-world.
2. Students showed increased understanding of the topic and were able to see the relevance of the project to real-life situations. The authentic setting for this learning environment allowed students to experience real-life working conditions supporting Herrington et. al’s (2004) position that constructivist learning environments should be set in an authentic learning context.
3. Students’ feedback and comments showed that they enjoyed working in a team to complete their projects, enjoyed being able to be creative and critical in their decision-making process, were able to acquire relevant skills for their future careers, increased their understanding of the subject matter, were
TOJET: The Turkish Online Journal of Educational Technology – January 2010, volume 9 Issue 1
Copyright The Turkish Online Journal of Educational Technology 183
satisfied with their contributions to their projects. These experiences showed strong support for developing a constructivist learning environment as suggested by Jonassen (1999).
4. The incorporation of a multimedia project into this constructivist learning environment enabled students to use multimedia technology to apply their creativity and to enable them to solve their design problems. Students became the designers of their multimedia applications and were able to experience critical-thinking, presentation and communication skills, and be creative in their thinking, with the teacher becoming the facilitator and guide in the class. This experience only served to increase their motivation and confidence levels throughout the project duration. By being able to create a multimedia project that was challenging yet fun to do, active learning was present in the environment, as students remained engaged in their learning process, and were able to construct and build upon their knowledge and understanding of the subject domain. Therefore, by being able to complete their projects, students were able to engage in knowledge construction using multimedia technology, which served to enhance their learning (Yildirim, 2006). Multimedia technology thus became an enabler for them to successfully complete their projects, and solve their problems, which further enhanced their engagement in the learning process.
CONCLUSION A study was designed to investigate students’ perceptions and attitudes towards a multimedia-mediated constructivist learning environment via developing a multimedia project. A constructivist learning environment that incorporated Jonassen’s (1999) model was extended to include Herrington et. al’s (2004) suggestion of setting constructivist learning environment within an authentic setting. A multimedia project with real-world implications were given to students, who worked in groups, to complete. Results showed that students were very motivated and active in their learning process, and reported positive perceptions and attitudes towards this learning environment. Therefore, this research study was successful in showing that incorporating multimedia technology into a constructivist learning environment can result in an innovative teaching and learning environment for students to acquire key learning outcomes that would better prepare them for their future in the workplace. REFERENCES Agnew, P. W., A. S. Kellerman, and J. Meyer, (1996). Multimedia in the Classroom. Boston: Allyn and Bacon. Bates, A. W. (Tony) (2000). Managing Technological Change. San Francisco: Jossey-Bass: Berge, Z. L. (1999). Interaction in Post-Secondary Web-Based Learning. Educational Technology,
January/February, 5-11. Cooper, D.R and P.S. Schindler, (2006). Business research methods (9th Edition). NY:McGraw-Hill Cunningham, D. J. (1991). Assessing construction & constructing assessments: A Dialogue, Educational
Technology 31, no.15: 13-17. Duffy, T.M. & Cunningham, D. J. (1996). Constructivism: Implications for the design & delivery of
instruction. In Jonassen, D. H. (Ed.). Handbook of research for educational communication & technology. NY:Simon & Schuster MacMillan.
Heath, M. (2001). Creating Constructivist Learning Environments Supported by Technology: Six Case Studies. In Montogomerie, C. & Vitelli, J. (Eds.). Proceedings of Ed-Media 2001. World Conference on Educational Multimedia and Hypermedia, July 25-30, in Tampere, Finland, 706-707.
Herrington, J., T.C. Reeves, R. Oliver, and Y. Woo, (2004). Designing authentic activities in web-based courses. Journal of Computing and Higher Education 16, no. 1: 3-29.
Jonassen, D. H. (1994). ‘Thinking Technology: Towards A Constructivist Design Model”. Educational Technology, April :34-37.
Jonassen, D. H. (1999). Designing Constructivist Learning Environments. In C. M. Reigeluth (Ed.), Instructional theories and models: A New Paradigm of Instructional Theory (2nd edition) Mahwah, NJ:Lawrence Erlbaum, 215-239.
Jonassen, D. H. and P. Henning, (1999). Mental Models: Knowledge in the head & knowledge in the world. Educational Technology 39, no. 3:37-42.
Lambert, N. M. and B. J. McCombs,. (1998). Introduction: Learner-Centered Schools and Classrooms as a Direction for School Reform. In Lambert, N.M. and McCombs, B. L. (Eds.), How Students Learn: Reforming Schools Through Learner-Centered Education. Washington, D.C.,:American Psychological Association, 1-22.
Land, S. M. and M. J. Hannafin, (1996). Student-centred Learning Environments: Foundations, Assumptions and Implications. In Proceedings of Selected Research and Development Presentations at the 1996 National Convention of the Association for Educational Communications and Technology, Indianapolis: IN, 395-400.
TOJET: The Turkish Online Journal of Educational Technology – January 2010, volume 9 Issue 1
Copyright The Turkish Online Journal of Educational Technology 184
Lee Y. L (2005). Integrating Constructivist approaches in e-learning to enhance mathematical self-study. Paper presented at The Mathematics Education into the 21st Century Project, Universiti Teknologi Malaysia: Reform, Revolution and Paradigm Shifts in Mathematics Education, Nov 25th – Dec 1st 2005, in Johor Bahru, Malaysia.
Lim, C. P., M.S. Khine, T. Hew, P. Wong, D., Shanti, and B. Lim, (2003). Exploring critical aspects of information technologies integration in Singapore schools. Australian Journal of Educational Technology (AJET) 19, no. 1:1-24.
Mat, J. (2000). Technology in the Malaysian Education System. Opening address at the E-Learning conference, May 25 2000, in Kuala Lumpur, Malaysia.
Hong, K. S., K. W. Lai, and D. Holton (2003). Students’ Satisfaction and Perceived Learning with a Web-based Course. Educational Technology & Society 6, no. 1: 116-124.
Neo, M. (2005). Web-enhanced learning: Engaging students in constructivist learning. Campus-Wide Information Systems 22, no. 1: 4-14.
Norhayati, A. M. and P. H. Siew (2004). Malaysian Perspective: Designing Interactive Multimedia Learning Environment for Moral Values Education. Educational Technology & Society 7, no. 4:143-152.
Oliver, K. M. (2000). Methods for Developing Constructivist Learning on the Web, Educational Technology, November-December:5-18.
Perkins, D. N. (1991). What constructivism demands of the learner. Educational Technology 31, no. 9:19-21. Rohaida, M. S. and A. B. Kamariah (2000). A Development of a Web-based Instruction for Primary School:
SPICE. In Proceedings of the International Conference: Education & ICT in the New Millenium, 27th October, 2000, in Kuala Lumpur, Malaysia, 164-185.
Schank, R.C., T.R, Berman, and K.A. Macpherson (1999). Learning by Doing. In C. M. Reigeluth (Ed.), Instructional theories and models: A New Paradigm of Instructional Theory (2nd edition) Mahwah, NJ:Lawrence Erlbaum, 161-181.
Tan, O.S. (2000). Thinking Skills, Creativity and Problem-Based Learning. Paper presented at the 2nd Asia Pacific Conference on Problem-Based Learning: Education Across Disciplines, December 4-7, in Singapore, 47-55.
Teo, R. and A. Wong (2000). Does Problem Based Learning Create A Better Student: A Reflection? Paper presented at the 2nd Asia Pacific Conference on Problem-Based Learning: Education Across Disciplines, December 4-7, in Singapore.
Wilson, B. G. (1995). Metaphors for instruction: Why we talk about learning environments. Educational Technology 35, no. 5:25-30.
Winnips, K. and C. McLoughlin (2001). Six WWW Based Learner Supports You Can Build. In Montgomerie, C. & Viteli, J. (Eds.). Paper presented at Ed-Media 2001: World Conference on Educational Multimedia and Hypermedia, June 25-30, 2001, in Tampere, Finland, 2062-2067.
Wong, S. L., A. B. Kamariah, and S. H. Tang, (2003). Differences in Anxiety Between IT Competent And Incompetent Malaysian Pre-Service Teachers: Can a Discrete IT Course Taught in a Constructivist Learning Environment Solve This Problem? Turkish Online Journal of Educational Technology (TOJET) 2, no. 4:21-26.
Yildirim, Z. (2005). Hypermedia as a Cognitive Tool: Student Teachers' Experiences in Learning by Doing. Educational Technology & Society, 8, no.2:107-117.
TOJET: The Turkish Online Journal of Educational Technology – January 2010, volume 9 Issue 1
Copyright The Turkish Online Journal of Educational Technology 185
STUDENTS’ PERCEPTIONS TO USE TECHNOLOGY FOR LEARNING: MEASUREMENT INTEGRITY OF THE MODIFIED FENNEMA-SHERMAN
ATTITUDES SCALES
Murat KAHVECI Department of Secondary Science and Mathematics Education, Faculty of Education, Anafartalar Campus, C2-
110, Canakkale Onsekiz Mart University, 17100 Canakkale, Turkey Email: [email protected]; Phone: +90-286-217-1303; Fax: +90-286-212-0751
ABSTRACT The purpose of this study was in two-fold: (1) to provide the evidence for the reliability of the modified Fennema-Sherman Mathematics Attitude Scales (FSMAS), as translated to Turkish language and transformed to the educational technology context, and (2) to investigate high school students’ motivation to use technology for learning by a comparative analysis with respect to varying personal characteristics such as gender, grade level, content area of interest (i.e. science and mathematics, mathematics and social science), and previous experience in using technology for learning. The modified version of FSMAS was administered to 9th-12th grade students at a gifted boarding high school in Istanbul, Turkey. The FSMAS instrument was highly reliable (Cronbach-α, from .942 to .777). The factor analysis showed that there were eight different thematic categories among the items. Overall, findings indicated that students had positive attitudes towards the use of technology for learning, regardless of their various personal characteristics such as gender, age, grade level, previous experience, and content area of interest. In addition, students at lower grades tended to have more satisfaction in using technology compared to the higher graders. Interestingly, more experienced students were less confident in using technology compared to less experienced students. Although female students did not have a negative attitude towards the use computers for learning, they felt less confident in using technology compared to male students. Finally, students good at science and mathematics were more positive about their ability to use technology as compared to their social science counterparts. 1. INTRODUCTION Motivation plays an important role in learning and therefore its effects are frequently emphasized in various fields of education. Extensive research related to students’ motivation for learning, and instructional strategies affecting students’ motivation have received continuous attention in educational literature (Angeli, Valanides, & Bonk, 2003; Cronin & Cronin, 1992; Jayaratne, Thomas, & Trautmann, 2003; Keller, 1983; Keller & Kopp, 1987; Ofori & Charlton, 2002; Oliver & Reeves, 1996; Pajares & Graham, 1999; Romano & Brna, 2001; Stevens, Olivarez, Lan, & Tallent-Runnels, 2004; Stoney & Wild, 1998; Wolters & Pintrich, 1998). However, research on students’ perceptions on the use of educational technology for learning seems to be lacking, especially in the Turkish educational context. In response to this need, this study was developed and conducted in two phases: (a) instrument adaptation and integrity analysis and (b) actual data collection and analysis to depict the Turkish students’ attitudes on the topic in a large urban setting. This study focused on the educational technology that may be seen in everyday face-to-face classroom settings or at the distance education systems in the following means: graphics-based calculators, educational software, the Internet, video and other telecommunication devices allowing one to deliver instruction at a distance synchronously or asynchronously. Moreover, according to the relevant literature, the prevalent factors that played role on students' motivation of using technology for learning are gender, previous experience, grade level, and content area of interest. The effects of these factors on students’ technology use are discussed in the following sections. Independent Variables and Relevant Literature 1.1. Gender Difference in Using Technology Gender comprises a range of differences in characteristics between men and women, which infers not only biological but social. The participants of the current study were opted to reveal their gender as either Male or Female in regards to their participation in this study. Research on the role of gender differences has contradictory results on students' motivation to use technology. While Comber and Colley (2003; 1997), Kadijevich (2000), and Li and Kirkup (2007) indicated that using computer is a male dominant activity and males have more positive attitudes towards the use of technology as opposed to females, Hurley and Vosburg (1997), Kaino and Salani (2004), and Kay (2006) reported that there is no significant difference between female and male students’ attitudes towards the use of technology. In either
TOJET: The Turkish Online Journal of Educational Technology – January 2010, volume 9 Issue 1
Copyright The Turkish Online Journal of Educational Technology 186
case, gender difference becomes an important indicator for attitude-oriented studies and therefore gender became one of the independent variables in this study. 1.2. Previous Experience in Using Technology Previous experience is another personal characteristic that is related with students' familiarity with the use of technology. Previous experience was determined by the participants’ responses to the relevant survey item. Naturally, experienced students in using technology have more positive attitudes towards the use of technology for learning and they perform better than their counter peers in technology related tasks (Comber & Colley, 1997; Kay, 2006; Mercier, Barron, & O'connor, 2006). Contradictorily, it has also been reported that negative experiences and experiencing problems in the use of technology make students more motivated and skilled in the future tasks (Holt & Crocker, 2000; Russell, Mattson, Devlin, & Atwater, 1990). 1.3. Grade Level Difference in Using Technology As for the effect of grade level, the studies by Comber and Colley (1997) and Kay (2006) reveal that students in the lower grade levels have more positive attitudes compared to the students in the higher grade levels. Another study conducted by Hurley and Vosburg (1997) indicated no significant difference in the use of technology with respect to grade level differences, in the case of a comparison done between 7th and 8th graders. 1.4. Content Area of Interest in Using Technology In the literature review, technology usage emerged in different ways in different courses. So, “content area of interest” of students was thought as another critical dimension while investigating students’ motivation to use technology for learning. There were two content areas of interest that students had opted for their high school education, which were (a) science and mathematics, and (b) mathematics and social science. With this self-reporting variable, differences between the two groups in their perceptions on the use of technology for learning were investigated. 2. THEORETICAL FRAMEWORK 2.1. ARCS Motivational Categories Keller (1987) defines motivational categories as attention, relevance, confidence, and satisfaction (ARCS) (See Table 1). Each of these categories also has subcategories. The first part of Keller’s ARCS motivational category is getting and keeping the attention of the learners. According to this model, there are three main ways to gain attention which are perceptual arouse, inquiry arousal, and variability. Getting attention is important but not enough to motivate the students. Students need to see the relevance of the topic. ARCS model’s strategy for relevance includes goal orientation, motive matching, and familiarity. When the students have a positive expectation for success in learning then they will be more motivated. Confidence category of the model is achieved by three strategies, which are learning requirements, success opportunities, and personal control. Learners should experience satisfaction or reward from their learning. According to this model the forms of inducing satisfaction in students are natural consequences, positive consequences, and equity. The ARCS model of motivational categories contributed to the analysis of this research while labeling the factor solutions and discussing the results of the analytic data of the FSMAS.
Table 1 Key concepts in ARCS Motivational Categories Perceptual Arouse: “Create curiosity, wonderment by using novel approaches, injecting personal and/or emotional material” Inquiry Arousal: “Increase curiosity by asking questions, creating paradoxes, generating inquiry, and nurturing thinking challenges” Attention
Variability: “Sustain interest with variations in presentation style, concrete analogies, human interest examples, and unexpected events” Goal Orientation: “Provide statements or examples of the utility of the instruction, and either present goals or have learners define them” Motive Matching: “Make instruction responsive to learner motives and values by providing personal achievement opportunities, cooperative activities, leadership responsibilities, and positive role models”
Relevance
Familiarity: “Make the materials and concepts familiar by providing concrete examples and analogies related to the learners' work” Learning Requirements: “Establish trust and positive expectations by explaining the requirements for success and the evaluative criteria” Confidence
Success Opportunities: “Increase belief in competence by providing many, varied, and
TOJET: The Turkish Online Journal of Educational Technology – January 2010, volume 9 Issue 1
Copyright The Turkish Online Journal of Educational Technology 187
Table 1 Key concepts in ARCS Motivational Categories challenging experiences which increase learning success” Personal Control: “Use techniques that offer personal control (whenever possible), and provide feedback that attributes success to personal effort” Natural Consequences: “Provide problems, simulations, or work samples that allow students to see how they can now solve -"real-world problems” Positive Consequences: “Use verbal praise, real or symbolic rewards, and incentives, or let students present the results of their efforts ('show and tell') to reward success” Satisfaction
Equity: “Make performance requirements consistent with stated expectations, and provide consistent measurement standards for all learner's tasks and accomplishments”
2.2. Effects of Technology in Instruction Research on the use of technology in instruction in various fields of education such as science education, social science education, and mathematics education shows that there is a positive relationship with students’ level of learning of the content and with students’ motivation to learn the content material. Ellington (2003, 2006) indicated that while teaching mathematics at K-12, using calculators in testing and instructions resulted in students developing the necessary operational skills in understanding mathematical concepts. In addition, installation of computers into a secondary school showed that there is a relation between use of computers in the classrooms and the students’ positive attitudes towards learning (i.e. enjoying the subject, having motivation to learn more) (Wishart & Blease, 1999). Using videodiscs in classes is another type of educational technology. Bransford, Sherwood, Hasselbring, Kinzer, and Williams (1990) reported that video-based instruction in mathematics courses increased students’ memorization and application process in mathematics. Similar to videodisks, in a number of studies it was reported that use of computers provided better learning experiences (Kulik, 1994; Rieber, 1993; Wenglinsky, 1998). Integrating computers to science curricula is advantageous such as saving time, teaching more effectively, interpreting data, organizing the experimental data in a more meaningful manner, and developing problem-solving skills. Despite these positive effects, it is vital to cautiously integrate technology into instruction. If the learning objectives are unclear and if the technological tool that students use does not require enough guidance to learn; then, there will be confusion and it affects the outcomes (Wenglinsky, 1998). In a course design, where and when to use technology is a crucial decision for the instructor. Consequently, students’ motivation to use technology becomes a critical parameter to think of. Proper use of technology also helps project-based learning in social science courses. In one of the studies that was carried out by Yang (2003), it was reported that having computer assisted projects helped students’ deeper understanding of history. Students could achieve complex tasks with the help of technology. During the project work, their motivation was high because technological tools helped them elicit their attentions. After the project, they were motivated to do other projects. Doppen (2004) investigated student self-efficacy about the use of technology. He reported that a computer-assisted social study instruction helped high school students develop more interactions among themselves and that it grasped students’ interest during the course. Similarly, Saye and Brush (2004) noted that technology-assisted learning environments “can support more disciplined inquiry into ill-structured problems” (p. 352), which implies that the use of technology fosters students’ interactions among them and with the curriculum material in order to make inquiry happen. Using computers in instruction fosters students’ critical and higher order thinking skills (Lancy, 1990; Ryba & Anderson, 1990). When it comes to motivation Glasser (1986) suggests that students are motivated when the computer-assisted instruction is provided through guided-teaching. At the university level, in general, faculty members teaching online courses found the experience positive one in spite of its limited amount of interaction with the students compared to the face-to-face instruction, as reported by Fish and Gill (2009). Interaction and interactivity are seen the key component of any instruction. Both terms are used interchangeably for some contexts but there are no settled views of these terms. Please see (Kahveci, 2007a, 2007b, 2009) for extended discussions.
TOJET: The Turkish Online Journal of Educational Technology – January 2010, volume 9 Issue 1
Copyright The Turkish Online Journal of Educational Technology 188
2.3. The Status Quo: Educational Technology in Turkey In response to the question “Are the companies in Turkey ready for e-learning?”, Aydin and Tasci (2005) report their findings of the first 100 companies listed by the 2001 Turkey’s Top 500 Major Industrial Enterprises List of the Istanbul Chamber of Industry: (1) companies in Turkey are overall ready for e-learning although they need a few improvements, (2) there is a lack of human resources in the companies, (3) there are not enough e-learning vendors and/or consultants in Turkey, or companies are not aware of the external resources available to them. Although, as quoted by Aydin and Tasci, Turkey invests around $1 billion per year on educational technology, it seems there is more research needed on the effects of these investments on students’ learning. Cavas et. al. (2009) reported in a study that more than half of the teachers were using technology products in their courses. The study was conducted across Turkey, in seven regions and among varying socio-economic regions. So, again the effects of these efforts as perceived by students need to be investigated. 3. PURPOSE The expected positive effects of the use of technology in instruction strongly depend on students’ self-perceptions about their motivation to use technology. This is a critical issue for the implementation of technology into classes of science and social science disciplines under the assumption that proper technologically oriented materials are developed and teachers are ready to use them in classrooms. This study was intended to provide research-based evidence on how students perceive their own use of technology for learning. In other words, the purpose of this study was to investigate students’ perceptions about their motivation to use technology for learning by a comparative analysis with respect to varying personal characteristics such as gender, grade level, content area of interest, and previous experience in using technologies for learning such as the Internet, educational software, and calculators. Secondly, a modified version of the Fennema-Sherman Mathematics Attitude Scales (FSMAS) (Fennema & Sherman, 1976) was adapted in this study. The adaptation refers to two modifications, which were (a) the items were translated to Turkish language, and (b) “mathematics” as a subject were reworded by “technology” in the items. In consequence, the integrity of the newly adapted instrument was re-established via elaborate factorial and reliability analyses. Please note that although the instrument was administered in Turkish language, all of the instrument items as given in Table 2 were provided bi-lingual, in English and Turkish languages. Thus, readers have the option for using either version of the instrument in their future work. 4. METHOD 4.1. Sample and Context of Study This is a survey research (Jaeger, 1988, p.254-77), having the accessible population (Fraenkel & Wallen, 2003, p.97) of 9th through 11th graders in Istanbul, in Turkey; therefore, the sample was constituted of 9th , 10th, and 11th grade students attending to a private boarding high school for gifted pupils. The selection of the school and the sample was random in nature. As a result, of the total number (N=165) of gifted students registered at the school, 158 students participated to this study, yielding a response rate of 95.8%. Students were almost equal in number with respect to their gender (females, N=68, or 43.0% of the total sample; males, N=90, or 57.0%) but not with respect to grade level (9th
grade, N=101, or 66.0% of the total sample; 10th grade, N=27, or 17.6%; 11th grade, N=25, or 16.3%). Students attending this high school were high achievers. In Turkey, to be admitted to some public high schools like Anatolian High School and Science High School, students are selected through a national aptitude test. This private high school requires very high score in the national aptitude test as well as a committee of the school teachers conduct interviews with students before their admissions. The interviewing process aims to determine students’ social adaptation ability and intellectual curiosity. In addition, students’ middle school GPA scores are considered in the selection. Thus, the school is regarded for gifted students across Turkey. In general, students are diligent, highly motivated, and interested in extracurricular activities. In response to the need of the students, there are activity hours organized by teachers after normal school hours. Students know English in advanced level and the courses are taught in English language. Upon graduation, the adolescents usually go on with their undergraduate education at highly prestigious universities not only in Turkey but also at abroad. 4.2. Measures Fennama-Sherman’s Mathematics Attitude Scale (FSMAS) (Fennema & Sherman, 1976) was re-worded and translated to Turkish language. FSMAS was the only instrument to gather data in this study. By its nature, the instrument consists of positive and negative statements (i.e. items). Items are rated by a conventional Likert-scale, ranging from strongly agree (scale value = 1) to strongly disagree (scale value = 5). The original FSMAS
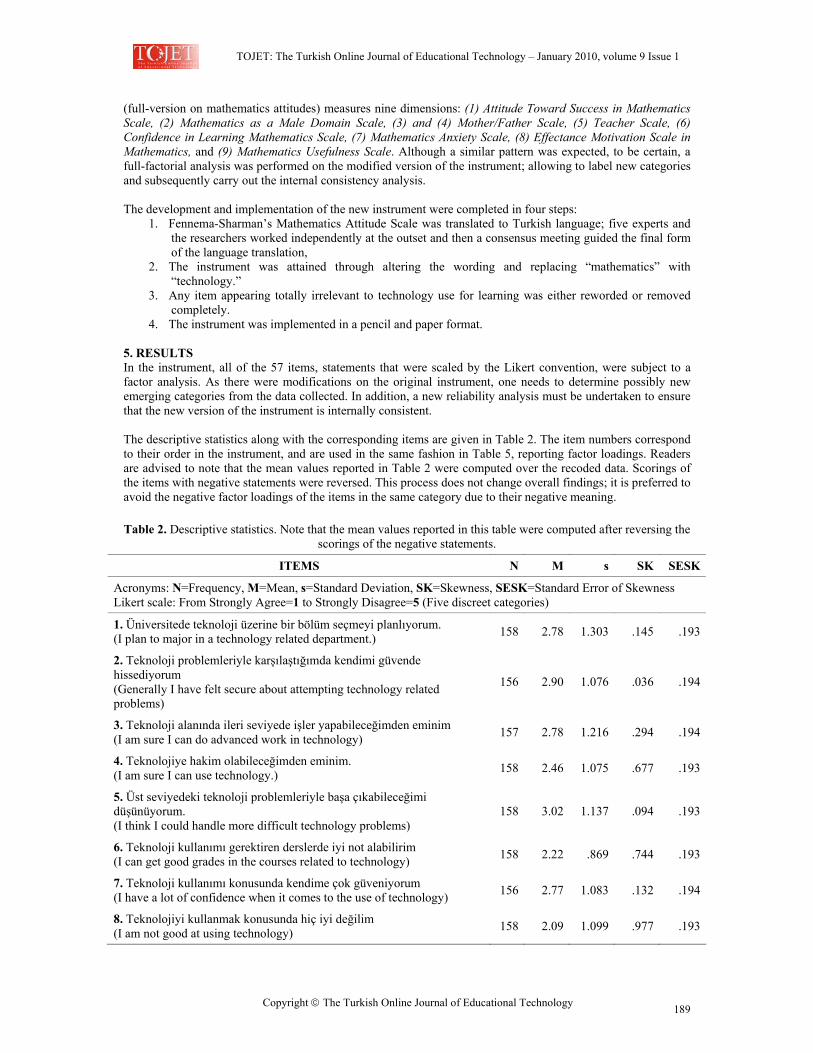
TOJET: The Turkish Online Journal of Educational Technology – January 2010, volume 9 Issue 1
Copyright The Turkish Online Journal of Educational Technology 189
(full-version on mathematics attitudes) measures nine dimensions: (1) Attitude Toward Success in Mathematics Scale, (2) Mathematics as a Male Domain Scale, (3) and (4) Mother/Father Scale, (5) Teacher Scale, (6) Confidence in Learning Mathematics Scale, (7) Mathematics Anxiety Scale, (8) Effectance Motivation Scale in Mathematics, and (9) Mathematics Usefulness Scale. Although a similar pattern was expected, to be certain, a full-factorial analysis was performed on the modified version of the instrument; allowing to label new categories and subsequently carry out the internal consistency analysis. The development and implementation of the new instrument were completed in four steps:
1. Fennema-Sharman’s Mathematics Attitude Scale was translated to Turkish language; five experts and the researchers worked independently at the outset and then a consensus meeting guided the final form of the language translation,
2. The instrument was attained through altering the wording and replacing “mathematics” with “technology.”
3. Any item appearing totally irrelevant to technology use for learning was either reworded or removed completely.
4. The instrument was implemented in a pencil and paper format.
5. RESULTS In the instrument, all of the 57 items, statements that were scaled by the Likert convention, were subject to a factor analysis. As there were modifications on the original instrument, one needs to determine possibly new emerging categories from the data collected. In addition, a new reliability analysis must be undertaken to ensure that the new version of the instrument is internally consistent. The descriptive statistics along with the corresponding items are given in Table 2. The item numbers correspond to their order in the instrument, and are used in the same fashion in Table 5, reporting factor loadings. Readers are advised to note that the mean values reported in Table 2 were computed over the recoded data. Scorings of the items with negative statements were reversed. This process does not change overall findings; it is preferred to avoid the negative factor loadings of the items in the same category due to their negative meaning. Table 2. Descriptive statistics. Note that the mean values reported in this table were computed after reversing the
scorings of the negative statements.
ITEMS N M s SK SESK
Acronyms: N=Frequency, M=Mean, s=Standard Deviation, SK=Skewness, SESK=Standard Error of Skewness Likert scale: From Strongly Agree=1 to Strongly Disagree=5 (Five discreet categories)
1. Üniversitede teknoloji üzerine bir bölüm seçmeyi planlıyorum. (I plan to major in a technology related department.) 158 2.78 1.303 .145 .193
2. Teknoloji problemleriyle karşılaştığımda kendimi güvende hissediyorum (Generally I have felt secure about attempting technology related problems)
156 2.90 1.076 .036 .194
3. Teknoloji alanında ileri seviyede işler yapabileceğimden eminim (I am sure I can do advanced work in technology) 157 2.78 1.216 .294 .194
4. Teknolojiye hakim olabileceğimden eminim. (I am sure I can use technology.) 158 2.46 1.075 .677 .193
5. Üst seviyedeki teknoloji problemleriyle başa çıkabileceğimi düşünüyorum. (I think I could handle more difficult technology problems)
158 3.02 1.137 .094 .193
6. Teknoloji kullanımı gerektiren derslerde iyi not alabilirim (I can get good grades in the courses related to technology) 158 2.22 .869 .744 .193
7. Teknoloji kullanımı konusunda kendime çok güveniyorum (I have a lot of confidence when it comes to the use of technology) 156 2.77 1.083 .132 .194
8. Teknolojiyi kullanmak konusunda hiç iyi değilim (I am not good at using technology) 158 2.09 1.099 .977 .193
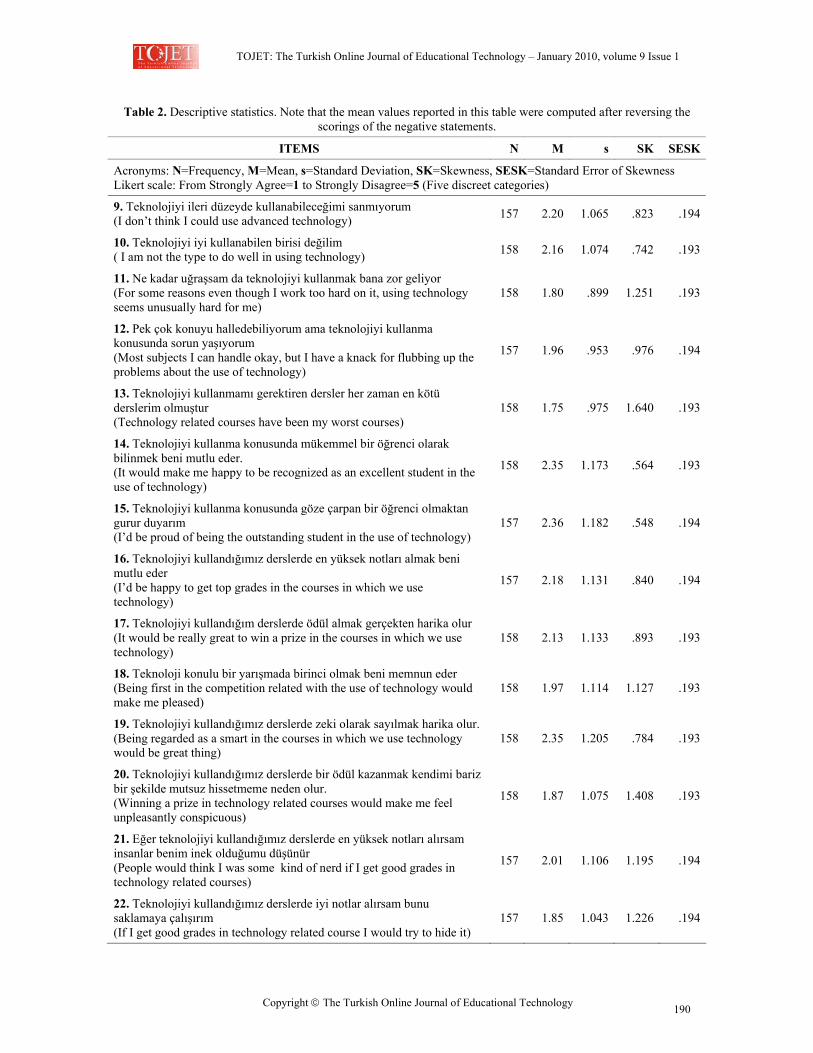
TOJET: The Turkish Online Journal of Educational Technology – January 2010, volume 9 Issue 1
Copyright The Turkish Online Journal of Educational Technology 190
Table 2. Descriptive statistics. Note that the mean values reported in this table were computed after reversing the scorings of the negative statements.
ITEMS N M s SK SESK
Acronyms: N=Frequency, M=Mean, s=Standard Deviation, SK=Skewness, SESK=Standard Error of Skewness Likert scale: From Strongly Agree=1 to Strongly Disagree=5 (Five discreet categories)
9. Teknolojiyi ileri düzeyde kullanabileceğimi sanmıyorum (I don’t think I could use advanced technology) 157 2.20 1.065 .823 .194
10. Teknolojiyi iyi kullanabilen birisi değilim ( I am not the type to do well in using technology) 158 2.16 1.074 .742 .193
11. Ne kadar uğraşsam da teknolojiyi kullanmak bana zor geliyor (For some reasons even though I work too hard on it, using technology seems unusually hard for me)
158 1.80 .899 1.251 .193
12. Pek çok konuyu halledebiliyorum ama teknolojiyi kullanma konusunda sorun yaşıyorum (Most subjects I can handle okay, but I have a knack for flubbing up the problems about the use of technology)
157 1.96 .953 .976 .194
13. Teknolojiyi kullanmamı gerektiren dersler her zaman en kötü derslerim olmuştur (Technology related courses have been my worst courses)
158 1.75 .975 1.640 .193
14. Teknolojiyi kullanma konusunda mükemmel bir öğrenci olarak bilinmek beni mutlu eder. (It would make me happy to be recognized as an excellent student in the use of technology)
158 2.35 1.173 .564 .193
15. Teknolojiyi kullanma konusunda göze çarpan bir öğrenci olmaktan gurur duyarım (I’d be proud of being the outstanding student in the use of technology)
157 2.36 1.182 .548 .194
16. Teknolojiyi kullandığımız derslerde en yüksek notları almak beni mutlu eder (I’d be happy to get top grades in the courses in which we use technology)
157 2.18 1.131 .840 .194
17. Teknolojiyi kullandığım derslerde ödül almak gerçekten harika olur (It would be really great to win a prize in the courses in which we use technology)
158 2.13 1.133 .893 .193
18. Teknoloji konulu bir yarışmada birinci olmak beni memnun eder (Being first in the competition related with the use of technology would make me pleased)
158 1.97 1.114 1.127 .193
19. Teknolojiyi kullandığımız derslerde zeki olarak sayılmak harika olur. (Being regarded as a smart in the courses in which we use technology would be great thing)
158 2.35 1.205 .784 .193
20. Teknolojiyi kullandığımız derslerde bir ödül kazanmak kendimi bariz bir şekilde mutsuz hissetmeme neden olur. (Winning a prize in technology related courses would make me feel unpleasantly conspicuous)
158 1.87 1.075 1.408 .193
21. Eğer teknolojiyi kullandığımız derslerde en yüksek notları alırsam insanlar benim inek olduğumu düşünür (People would think I was some kind of nerd if I get good grades in technology related courses)
157 2.01 1.106 1.195 .194
22. Teknolojiyi kullandığımız derslerde iyi notlar alırsam bunu saklamaya çalışırım (If I get good grades in technology related course I would try to hide it)
157 1.85 1.043 1.226 .194
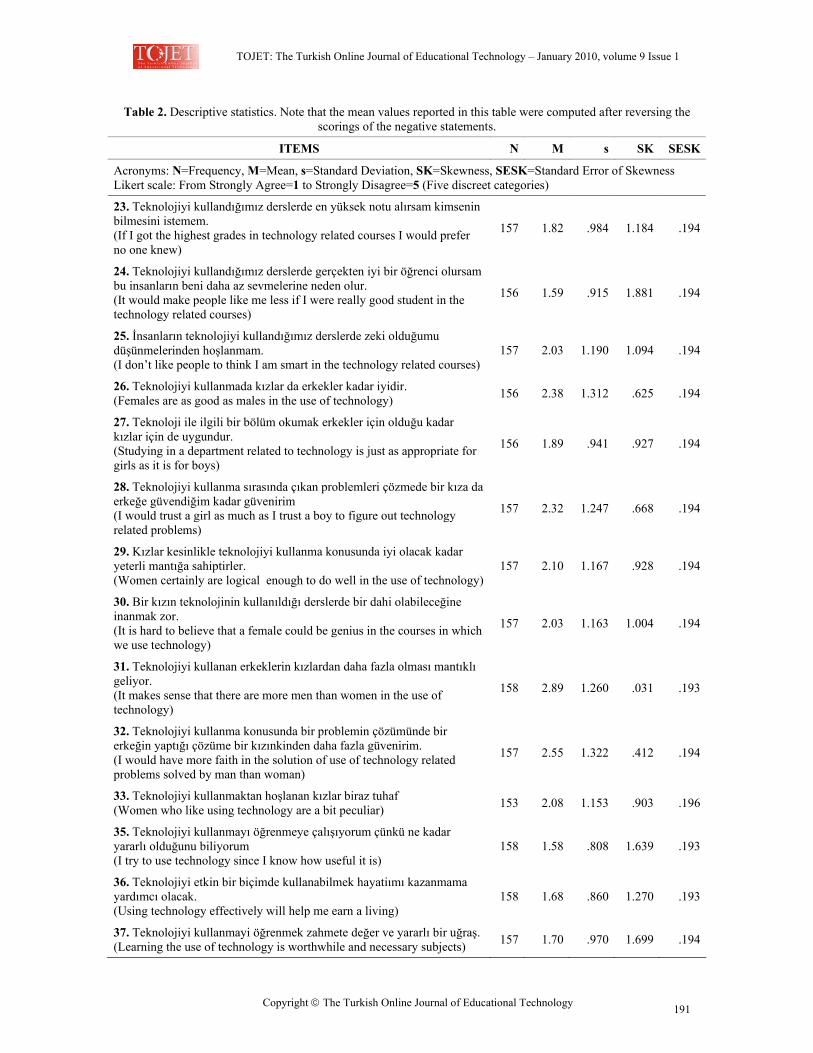
TOJET: The Turkish Online Journal of Educational Technology – January 2010, volume 9 Issue 1
Copyright The Turkish Online Journal of Educational Technology 191
Table 2. Descriptive statistics. Note that the mean values reported in this table were computed after reversing the scorings of the negative statements.
ITEMS N M s SK SESK
Acronyms: N=Frequency, M=Mean, s=Standard Deviation, SK=Skewness, SESK=Standard Error of Skewness Likert scale: From Strongly Agree=1 to Strongly Disagree=5 (Five discreet categories)
23. Teknolojiyi kullandığımız derslerde en yüksek notu alırsam kimsenin bilmesini istemem. (If I got the highest grades in technology related courses I would prefer no one knew)
157 1.82 .984 1.184 .194
24. Teknolojiyi kullandığımız derslerde gerçekten iyi bir öğrenci olursam bu insanların beni daha az sevmelerine neden olur. (It would make people like me less if I were really good student in the technology related courses)
156 1.59 .915 1.881 .194
25. İnsanların teknolojiyi kullandığımız derslerde zeki olduğumu düşünmelerinden hoşlanmam. (I don’t like people to think I am smart in the technology related courses)
157 2.03 1.190 1.094 .194
26. Teknolojiyi kullanmada kızlar da erkekler kadar iyidir. (Females are as good as males in the use of technology) 156 2.38 1.312 .625 .194
27. Teknoloji ile ilgili bir bölüm okumak erkekler için olduğu kadar kızlar için de uygundur. (Studying in a department related to technology is just as appropriate for girls as it is for boys)
156 1.89 .941 .927 .194
28. Teknolojiyi kullanma sırasında çıkan problemleri çözmede bir kıza da erkeğe güvendiğim kadar güvenirim (I would trust a girl as much as I trust a boy to figure out technology related problems)
157 2.32 1.247 .668 .194
29. Kızlar kesinlikle teknolojiyi kullanma konusunda iyi olacak kadar yeterli mantığa sahiptirler. (Women certainly are logical enough to do well in the use of technology)
157 2.10 1.167 .928 .194
30. Bir kızın teknolojinin kullanıldığı derslerde bir dahi olabileceğine inanmak zor. (It is hard to believe that a female could be genius in the courses in which we use technology)
157 2.03 1.163 1.004 .194
31. Teknolojiyi kullanan erkeklerin kızlardan daha fazla olması mantıklı geliyor. (It makes sense that there are more men than women in the use of technology)
158 2.89 1.260 .031 .193
32. Teknolojiyi kullanma konusunda bir problemin çözümünde bir erkeğin yaptığı çözüme bir kızınkinden daha fazla güvenirim. (I would have more faith in the solution of use of technology related problems solved by man than woman)
157 2.55 1.322 .412 .194
33. Teknolojiyi kullanmaktan hoşlanan kızlar biraz tuhaf (Women who like using technology are a bit peculiar) 153 2.08 1.153 .903 .196
35. Teknolojiyi kullanmayı öğrenmeye çalışıyorum çünkü ne kadar yararlı olduğunu biliyorum (I try to use technology since I know how useful it is)
158 1.58 .808 1.639 .193
36. Teknolojiyi etkin bir biçimde kullanabilmek hayatiımı kazanmama yardımcı olacak. (Using technology effectively will help me earn a living)
158 1.68 .860 1.270 .193
37. Teknolojiyi kullanmayi öğrenmek zahmete değer ve yararlı bir uğraş. (Learning the use of technology is worthwhile and necessary subjects) 157 1.70 .970 1.699 .194
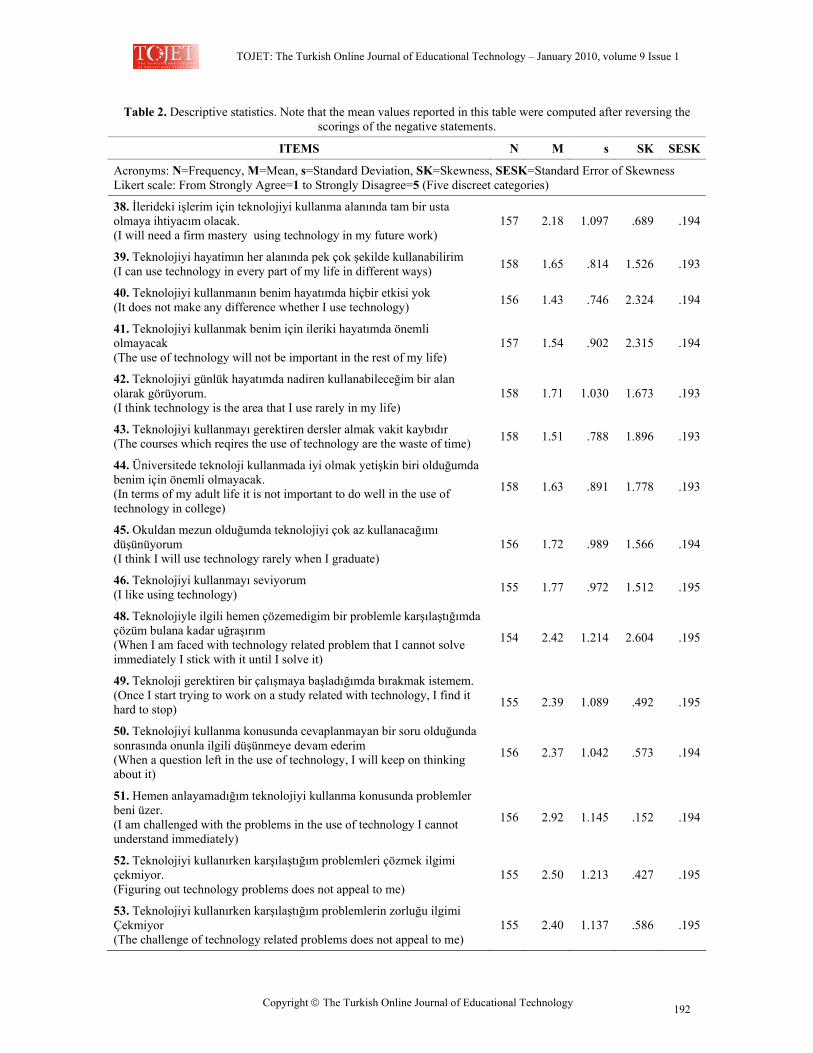
TOJET: The Turkish Online Journal of Educational Technology – January 2010, volume 9 Issue 1
Copyright The Turkish Online Journal of Educational Technology 192
Table 2. Descriptive statistics. Note that the mean values reported in this table were computed after reversing the scorings of the negative statements.
ITEMS N M s SK SESK
Acronyms: N=Frequency, M=Mean, s=Standard Deviation, SK=Skewness, SESK=Standard Error of Skewness Likert scale: From Strongly Agree=1 to Strongly Disagree=5 (Five discreet categories)
38. İlerideki işlerim için teknolojiyi kullanma alanında tam bir usta olmaya ihtiyacım olacak. (I will need a firm mastery using technology in my future work)
157 2.18 1.097 .689 .194
39. Teknolojiyi hayatimın her alanında pek çok şekilde kullanabilirim (I can use technology in every part of my life in different ways) 158 1.65 .814 1.526 .193
40. Teknolojiyi kullanmanın benim hayatımda hiçbir etkisi yok (It does not make any difference whether I use technology) 156 1.43 .746 2.324 .194
41. Teknolojiyi kullanmak benim için ileriki hayatımda önemli olmayacak (The use of technology will not be important in the rest of my life)
157 1.54 .902 2.315 .194
42. Teknolojiyi günlük hayatımda nadiren kullanabileceğim bir alan olarak görüyorum. (I think technology is the area that I use rarely in my life)
158 1.71 1.030 1.673 .193
43. Teknolojiyi kullanmayı gerektiren dersler almak vakit kaybıdır (The courses which reqires the use of technology are the waste of time) 158 1.51 .788 1.896 .193
44. Üniversitede teknoloji kullanmada iyi olmak yetişkin biri olduğumda benim için önemli olmayacak. (In terms of my adult life it is not important to do well in the use of technology in college)
158 1.63 .891 1.778 .193
45. Okuldan mezun olduğumda teknolojiyi çok az kullanacağımı düşünüyorum (I think I will use technology rarely when I graduate)
156 1.72 .989 1.566 .194
46. Teknolojiyi kullanmayı seviyorum (I like using technology) 155 1.77 .972 1.512 .195
48. Teknolojiyle ilgili hemen çözemedigim bir problemle karşılaştığımda çözüm bulana kadar uğraşırım (When I am faced with technology related problem that I cannot solve immediately I stick with it until I solve it)
154 2.42 1.214 2.604 .195
49. Teknoloji gerektiren bir çalışmaya başladığımda bırakmak istemem. (Once I start trying to work on a study related with technology, I find it hard to stop)
155
2.39
1.089
.492
.195
50. Teknolojiyi kullanma konusunda cevaplanmayan bir soru olduğunda sonrasında onunla ilgili düşünmeye devam ederim (When a question left in the use of technology, I will keep on thinking about it)
156 2.37 1.042 .573 .194
51. Hemen anlayamadığım teknolojiyi kullanma konusunda problemler beni üzer. (I am challenged with the problems in the use of technology I cannot understand immediately)
156 2.92 1.145 .152 .194
52. Teknolojiyi kullanırken karşılaştığım problemleri çözmek ilgimi çekmiyor. (Figuring out technology problems does not appeal to me)
155 2.50 1.213 .427 .195
53. Teknolojiyi kullanırken karşılaştığım problemlerin zorluğu ilgimi Çekmiyor (The challenge of technology related problems does not appeal to me)
155 2.40 1.137 .586 .195
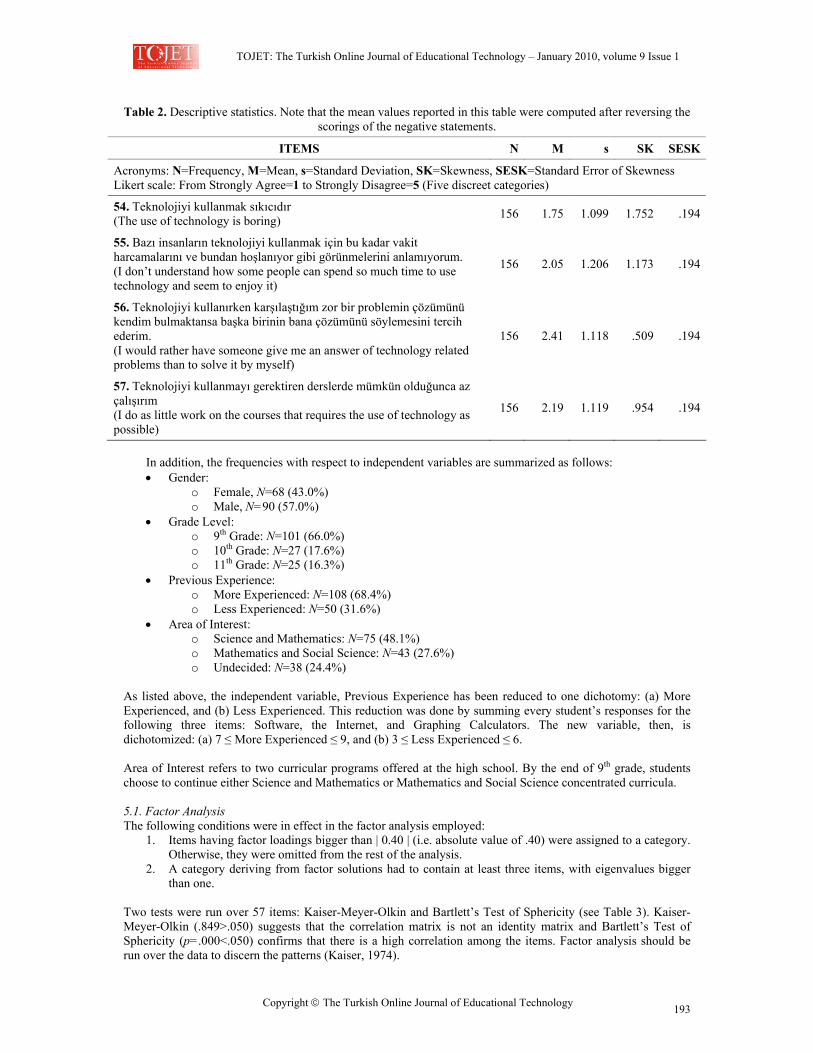
TOJET: The Turkish Online Journal of Educational Technology – January 2010, volume 9 Issue 1
Copyright The Turkish Online Journal of Educational Technology 193
Table 2. Descriptive statistics. Note that the mean values reported in this table were computed after reversing the scorings of the negative statements.
ITEMS N M s SK SESK
Acronyms: N=Frequency, M=Mean, s=Standard Deviation, SK=Skewness, SESK=Standard Error of Skewness Likert scale: From Strongly Agree=1 to Strongly Disagree=5 (Five discreet categories)
54. Teknolojiyi kullanmak sıkıcıdır (The use of technology is boring) 156 1.75 1.099 1.752 .194
55. Bazı insanların teknolojiyi kullanmak için bu kadar vakit harcamalarını ve bundan hoşlanıyor gibi görünmelerini anlamıyorum. (I don’t understand how some people can spend so much time to use technology and seem to enjoy it)
156 2.05 1.206 1.173 .194
56. Teknolojiyi kullanırken karşılaştığım zor bir problemin çözümünü kendim bulmaktansa başka birinin bana çözümünü söylemesini tercih ederim. (I would rather have someone give me an answer of technology related problems than to solve it by myself)
156 2.41 1.118 .509 .194
57. Teknolojiyi kullanmayı gerektiren derslerde mümkün olduğunca az çalışırım (I do as little work on the courses that requires the use of technology as possible)
156 2.19 1.119 .954 .194
In addition, the frequencies with respect to independent variables are summarized as follows: • Gender:
o Female, N=68 (43.0%) o Male, N=90 (57.0%)
• Grade Level: o 9th Grade: N=101 (66.0%) o 10th Grade: N=27 (17.6%) o 11th Grade: N=25 (16.3%)
• Previous Experience: o More Experienced: N=108 (68.4%) o Less Experienced: N=50 (31.6%)
• Area of Interest: o Science and Mathematics: N=75 (48.1%) o Mathematics and Social Science: N=43 (27.6%) o Undecided: N=38 (24.4%)
As listed above, the independent variable, Previous Experience has been reduced to one dichotomy: (a) More Experienced, and (b) Less Experienced. This reduction was done by summing every student’s responses for the following three items: Software, the Internet, and Graphing Calculators. The new variable, then, is dichotomized: (a) 7 ≤ More Experienced ≤ 9, and (b) 3 ≤ Less Experienced ≤ 6. Area of Interest refers to two curricular programs offered at the high school. By the end of 9th grade, students choose to continue either Science and Mathematics or Mathematics and Social Science concentrated curricula. 5.1. Factor Analysis The following conditions were in effect in the factor analysis employed:
1. Items having factor loadings bigger than | 0.40 | (i.e. absolute value of .40) were assigned to a category. Otherwise, they were omitted from the rest of the analysis.
2. A category deriving from factor solutions had to contain at least three items, with eigenvalues bigger than one.
Two tests were run over 57 items: Kaiser-Meyer-Olkin and Bartlett’s Test of Sphericity (see Table 3). Kaiser-Meyer-Olkin (.849>.050) suggests that the correlation matrix is not an identity matrix and Bartlett’s Test of Sphericity (p=.000<.050) confirms that there is a high correlation among the items. Factor analysis should be run over the data to discern the patterns (Kaiser, 1974).
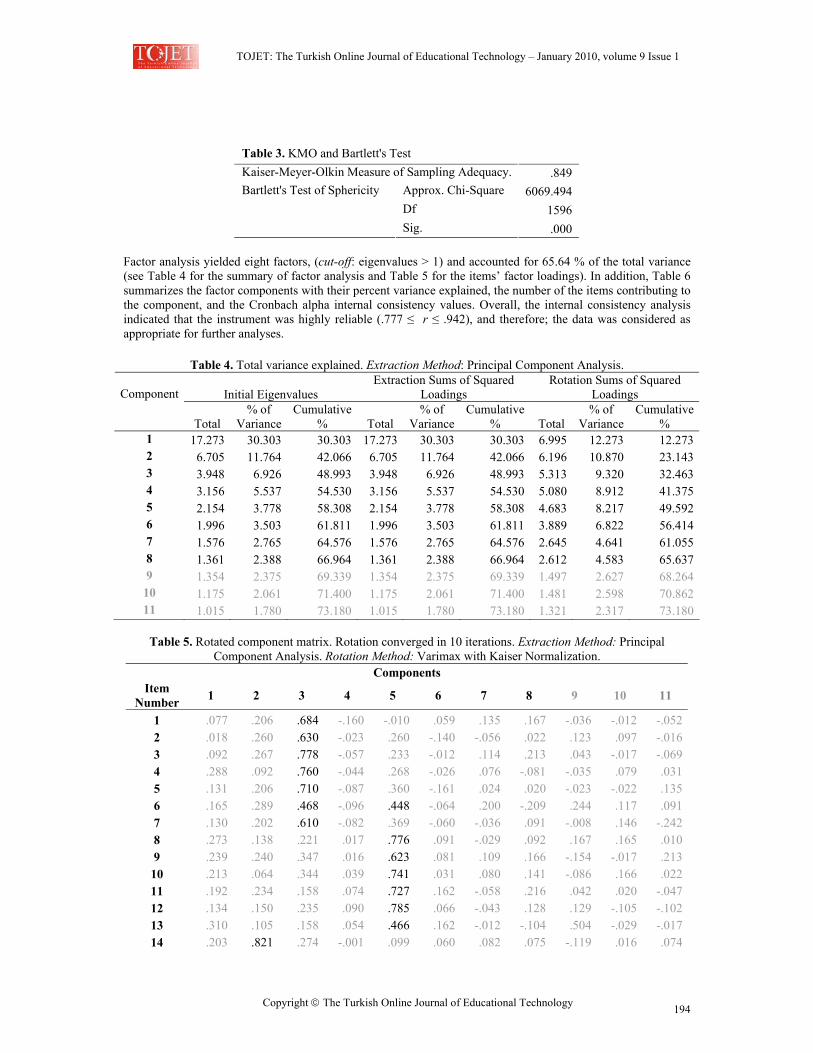
TOJET: The Turkish Online Journal of Educational Technology – January 2010, volume 9 Issue 1
Copyright The Turkish Online Journal of Educational Technology 194
Table 3. KMO and Bartlett's Test Kaiser-Meyer-Olkin Measure of Sampling Adequacy. .849
Approx. Chi-Square 6069.494 Df 1596
Bartlett's Test of Sphericity
Sig. .000 Factor analysis yielded eight factors, (cut-off: eigenvalues > 1) and accounted for 65.64 % of the total variance (see Table 4 for the summary of factor analysis and Table 5 for the items’ factor loadings). In addition, Table 6 summarizes the factor components with their percent variance explained, the number of the items contributing to the component, and the Cronbach alpha internal consistency values. Overall, the internal consistency analysis indicated that the instrument was highly reliable (.777 ≤ r ≤ .942), and therefore; the data was considered as appropriate for further analyses.
Table 4. Total variance explained. Extraction Method: Principal Component Analysis.
Component Initial Eigenvalues Extraction Sums of Squared
Loadings Rotation Sums of Squared
Loadings
Total % of
Variance Cumulative
% Total % of
VarianceCumulative
% Total % of
Variance Cumulative
% 1 17.273 30.303 30.303 17.273 30.303 30.303 6.995 12.273 12.2732 6.705 11.764 42.066 6.705 11.764 42.066 6.196 10.870 23.1433 3.948 6.926 48.993 3.948 6.926 48.993 5.313 9.320 32.4634 3.156 5.537 54.530 3.156 5.537 54.530 5.080 8.912 41.3755 2.154 3.778 58.308 2.154 3.778 58.308 4.683 8.217 49.5926 1.996 3.503 61.811 1.996 3.503 61.811 3.889 6.822 56.4147 1.576 2.765 64.576 1.576 2.765 64.576 2.645 4.641 61.0558 1.361 2.388 66.964 1.361 2.388 66.964 2.612 4.583 65.6379 1.354 2.375 69.339 1.354 2.375 69.339 1.497 2.627 68.26410 1.175 2.061 71.400 1.175 2.061 71.400 1.481 2.598 70.86211 1.015 1.780 73.180 1.015 1.780 73.180 1.321 2.317 73.180
Table 5. Rotated component matrix. Rotation converged in 10 iterations. Extraction Method: Principal
Component Analysis. Rotation Method: Varimax with Kaiser Normalization. Components
Item Number 1 2 3 4 5 6 7 8 9 10 11
1 .077 .206 .684 -.160 -.010 .059 .135 .167 -.036 -.012 -.0522 .018 .260 .630 -.023 .260 -.140 -.056 .022 .123 .097 -.0163 .092 .267 .778 -.057 .233 -.012 .114 .213 .043 -.017 -.0694 .288 .092 .760 -.044 .268 -.026 .076 -.081 -.035 .079 .0315 .131 .206 .710 -.087 .360 -.161 .024 .020 -.023 -.022 .1356 .165 .289 .468 -.096 .448 -.064 .200 -.209 .244 .117 .0917 .130 .202 .610 -.082 .369 -.060 -.036 .091 -.008 .146 -.2428 .273 .138 .221 .017 .776 .091 -.029 .092 .167 .165 .0109 .239 .240 .347 .016 .623 .081 .109 .166 -.154 -.017 .21310 .213 .064 .344 .039 .741 .031 .080 .141 -.086 .166 .02211 .192 .234 .158 .074 .727 .162 -.058 .216 .042 .020 -.04712 .134 .150 .235 .090 .785 .066 -.043 .128 .129 -.105 -.10213 .310 .105 .158 .054 .466 .162 -.012 -.104 .504 -.029 -.01714 .203 .821 .274 -.001 .099 .060 .082 .075 -.119 .016 .074
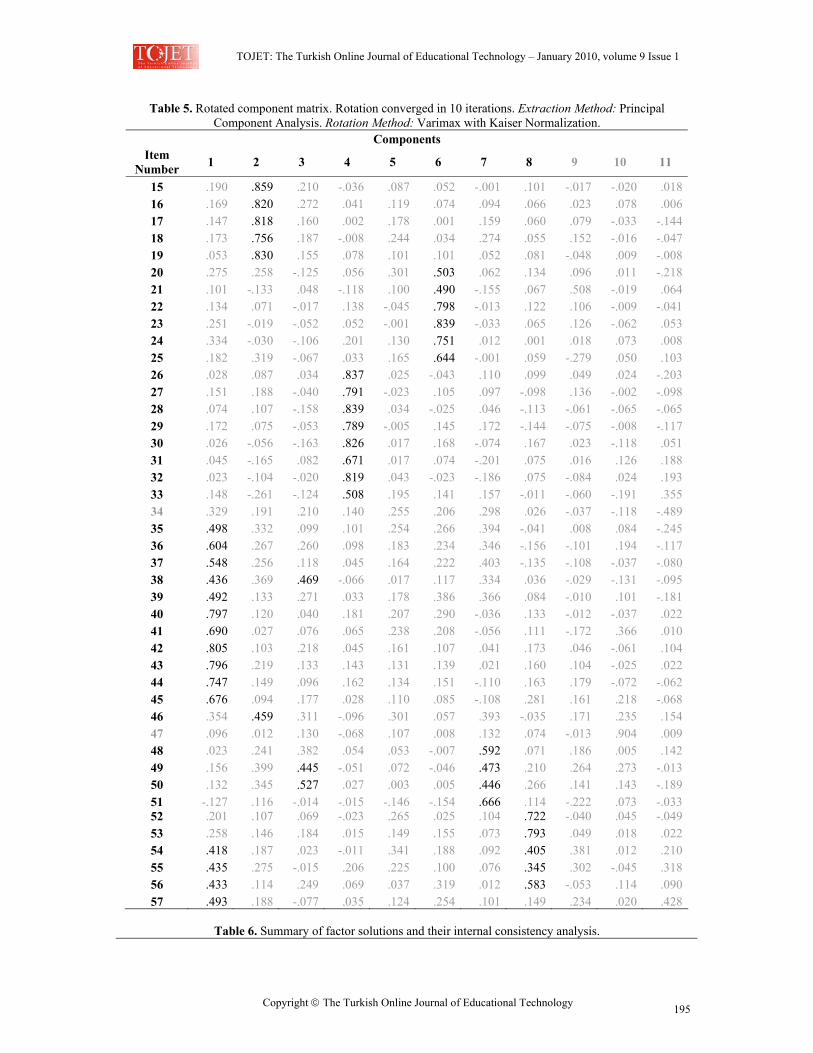
TOJET: The Turkish Online Journal of Educational Technology – January 2010, volume 9 Issue 1
Copyright The Turkish Online Journal of Educational Technology 195
Table 5. Rotated component matrix. Rotation converged in 10 iterations. Extraction Method: Principal Component Analysis. Rotation Method: Varimax with Kaiser Normalization.
Components Item
Number 1 2 3 4 5 6 7 8 9 10 11
15 .190 .859 .210 -.036 .087 .052 -.001 .101 -.017 -.020 .01816 .169 .820 .272 .041 .119 .074 .094 .066 .023 .078 .00617 .147 .818 .160 .002 .178 .001 .159 .060 .079 -.033 -.14418 .173 .756 .187 -.008 .244 .034 .274 .055 .152 -.016 -.04719 .053 .830 .155 .078 .101 .101 .052 .081 -.048 .009 -.00820 .275 .258 -.125 .056 .301 .503 .062 .134 .096 .011 -.21821 .101 -.133 .048 -.118 .100 .490 -.155 .067 .508 -.019 .06422 .134 .071 -.017 .138 -.045 .798 -.013 .122 .106 -.009 -.04123 .251 -.019 -.052 .052 -.001 .839 -.033 .065 .126 -.062 .05324 .334 -.030 -.106 .201 .130 .751 .012 .001 .018 .073 .00825 .182 .319 -.067 .033 .165 .644 -.001 .059 -.279 .050 .10326 .028 .087 .034 .837 .025 -.043 .110 .099 .049 .024 -.20327 .151 .188 -.040 .791 -.023 .105 .097 -.098 .136 -.002 -.09828 .074 .107 -.158 .839 .034 -.025 .046 -.113 -.061 -.065 -.06529 .172 .075 -.053 .789 -.005 .145 .172 -.144 -.075 -.008 -.11730 .026 -.056 -.163 .826 .017 .168 -.074 .167 .023 -.118 .05131 .045 -.165 .082 .671 .017 .074 -.201 .075 .016 .126 .18832 .023 -.104 -.020 .819 .043 -.023 -.186 .075 -.084 .024 .19333 .148 -.261 -.124 .508 .195 .141 .157 -.011 -.060 -.191 .35534 .329 .191 .210 .140 .255 .206 .298 .026 -.037 -.118 -.48935 .498 .332 .099 .101 .254 .266 .394 -.041 .008 .084 -.24536 .604 .267 .260 .098 .183 .234 .346 -.156 -.101 .194 -.11737 .548 .256 .118 .045 .164 .222 .403 -.135 -.108 -.037 -.08038 .436 .369 .469 -.066 .017 .117 .334 .036 -.029 -.131 -.09539 .492 .133 .271 .033 .178 .386 .366 .084 -.010 .101 -.18140 .797 .120 .040 .181 .207 .290 -.036 .133 -.012 -.037 .02241 .690 .027 .076 .065 .238 .208 -.056 .111 -.172 .366 .01042 .805 .103 .218 .045 .161 .107 .041 .173 .046 -.061 .10443 .796 .219 .133 .143 .131 .139 .021 .160 .104 -.025 .02244 .747 .149 .096 .162 .134 .151 -.110 .163 .179 -.072 -.06245 .676 .094 .177 .028 .110 .085 -.108 .281 .161 .218 -.06846 .354 .459 .311 -.096 .301 .057 .393 -.035 .171 .235 .15447 .096 .012 .130 -.068 .107 .008 .132 .074 -.013 .904 .00948 .023 .241 .382 .054 .053 -.007 .592 .071 .186 .005 .14249 .156 .399 .445 -.051 .072 -.046 .473 .210 .264 .273 -.01350 .132 .345 .527 .027 .003 .005 .446 .266 .141 .143 -.18951 -.127 .116 -.014 -.015 -.146 -.154 .666 .114 -.222 .073 -.03352 .201 .107 .069 -.023 .265 .025 .104 .722 -.040 .045 -.04953 .258 .146 .184 .015 .149 .155 .073 .793 .049 .018 .02254 .418 .187 .023 -.011 .341 .188 .092 .405 .381 .012 .21055 .435 .275 -.015 .206 .225 .100 .076 .345 .302 -.045 .31856 .433 .114 .249 .069 .037 .319 .012 .583 -.053 .114 .09057 .493 .188 -.077 .035 .124 .254 .101 .149 .234 .020 .428
Table 6. Summary of factor solutions and their internal consistency analysis.
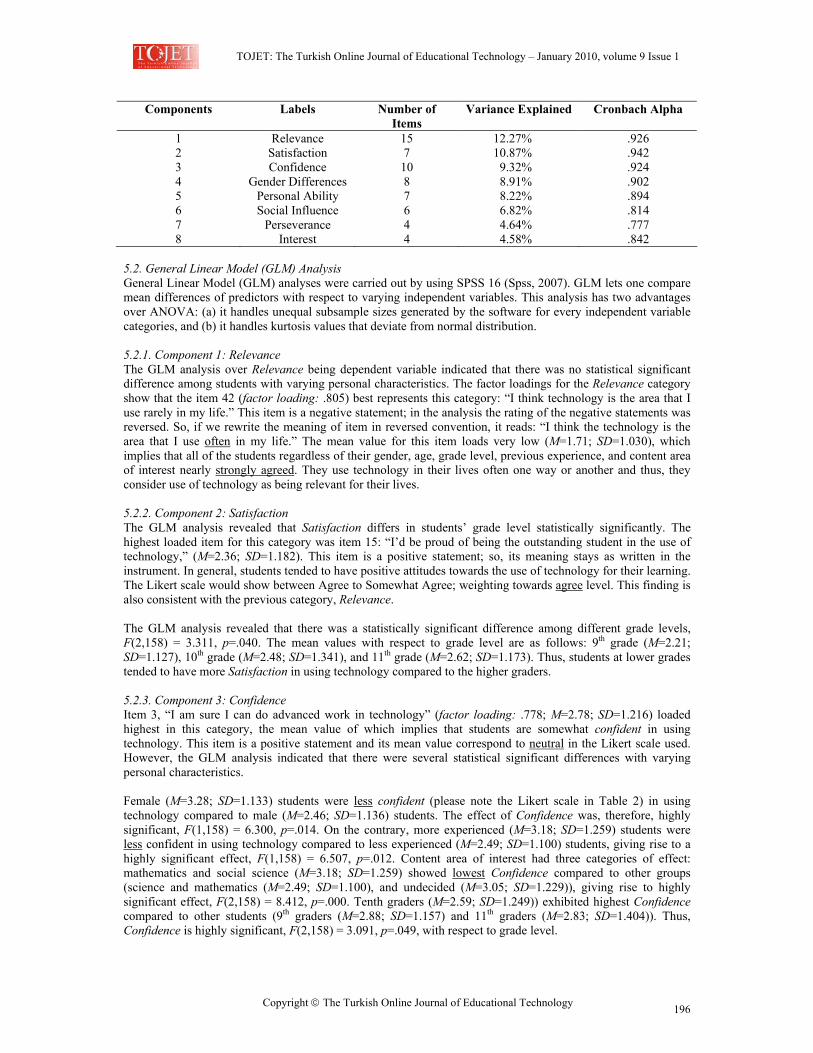
TOJET: The Turkish Online Journal of Educational Technology – January 2010, volume 9 Issue 1
Copyright The Turkish Online Journal of Educational Technology 196
Components Labels Number of Items
Variance Explained Cronbach Alpha
1 Relevance 15 12.27% .926 2 Satisfaction 7 10.87% .942 3 Confidence 10 9.32% .924 4 Gender Differences 8 8.91% .902 5 Personal Ability 7 8.22% .894 6 Social Influence 6 6.82% .814 7 Perseverance 4 4.64% .777 8 Interest 4 4.58% .842
5.2. General Linear Model (GLM) Analysis General Linear Model (GLM) analyses were carried out by using SPSS 16 (Spss, 2007). GLM lets one compare mean differences of predictors with respect to varying independent variables. This analysis has two advantages over ANOVA: (a) it handles unequal subsample sizes generated by the software for every independent variable categories, and (b) it handles kurtosis values that deviate from normal distribution. 5.2.1. Component 1: Relevance The GLM analysis over Relevance being dependent variable indicated that there was no statistical significant difference among students with varying personal characteristics. The factor loadings for the Relevance category show that the item 42 (factor loading: .805) best represents this category: “I think technology is the area that I use rarely in my life.” This item is a negative statement; in the analysis the rating of the negative statements was reversed. So, if we rewrite the meaning of item in reversed convention, it reads: “I think the technology is the area that I use often in my life.” The mean value for this item loads very low (M=1.71; SD=1.030), which implies that all of the students regardless of their gender, age, grade level, previous experience, and content area of interest nearly strongly agreed. They use technology in their lives often one way or another and thus, they consider use of technology as being relevant for their lives. 5.2.2. Component 2: Satisfaction The GLM analysis revealed that Satisfaction differs in students’ grade level statistically significantly. The highest loaded item for this category was item 15: “I’d be proud of being the outstanding student in the use of technology,” (M=2.36; SD=1.182). This item is a positive statement; so, its meaning stays as written in the instrument. In general, students tended to have positive attitudes towards the use of technology for their learning. The Likert scale would show between Agree to Somewhat Agree; weighting towards agree level. This finding is also consistent with the previous category, Relevance. The GLM analysis revealed that there was a statistically significant difference among different grade levels, F(2,158) = 3.311, p=.040. The mean values with respect to grade level are as follows: 9th grade (M=2.21; SD=1.127), 10th grade (M=2.48; SD=1.341), and 11th grade (M=2.62; SD=1.173). Thus, students at lower grades tended to have more Satisfaction in using technology compared to the higher graders. 5.2.3. Component 3: Confidence Item 3, “I am sure I can do advanced work in technology” (factor loading: .778; M=2.78; SD=1.216) loaded highest in this category, the mean value of which implies that students are somewhat confident in using technology. This item is a positive statement and its mean value correspond to neutral in the Likert scale used. However, the GLM analysis indicated that there were several statistical significant differences with varying personal characteristics. Female (M=3.28; SD=1.133) students were less confident (please note the Likert scale in Table 2) in using technology compared to male (M=2.46; SD=1.136) students. The effect of Confidence was, therefore, highly significant, F(1,158) = 6.300, p=.014. On the contrary, more experienced (M=3.18; SD=1.259) students were less confident in using technology compared to less experienced (M=2.49; SD=1.100) students, giving rise to a highly significant effect, F(1,158) = 6.507, p=.012. Content area of interest had three categories of effect: mathematics and social science (M=3.18; SD=1.259) showed lowest Confidence compared to other groups (science and mathematics (M=2.49; SD=1.100), and undecided (M=3.05; SD=1.229)), giving rise to highly significant effect, F(2,158) = 8.412, p=.000. Tenth graders (M=2.59; SD=1.249)) exhibited highest Confidence compared to other students (9th graders (M=2.88; SD=1.157) and 11th graders (M=2.83; SD=1.404)). Thus, Confidence is highly significant, F(2,158) = 3.091, p=.049, with respect to grade level.
TOJET: The Turkish Online Journal of Educational Technology – January 2010, volume 9 Issue 1
Copyright The Turkish Online Journal of Educational Technology 197
5.2.4. Component 4: Gender Differences Item 28, “Women certainly are logical enough to do well in the use of technology” (factor loading: .839; M=2.10; SD=1.167) loaded highest in Gender Differences category. The low mean value implies that students have positive attitudes towards women in using technology. In other words, in general students tend to think that women do have a socially constructed support in their success of using technology. However, the GLM analysis indicated that participants’ gender made a statistical significant difference in the responses. Female (M=1.89; SD=1.071) students agreed more with women’s use of technology compared to male (M=2.68; SD=1.272) students. The effect of Gender Differences, therefore, is highly significant, F(1,158) = 24.612, p=.000. 5.2.5. Component 5: Perceived Personal Ability Item 12, “Most subjects I can handle okay, but I have a knack for flubbing up the problems about the use of technology.” This statement refers to a negative attitude in the instrument. When it is reverse coded for the analysis; the item reads: “Most subjects I can handle okay, but I do not have a knack for flubbing up the problems about the use of technology,” (factor loading: .785; M=1.96; SD=.953) loaded highest in Perceived Personal Ability category. Readers are advised to note that the directionally reworded statement is not grammatically quite compelling; however, it is used here to merely warn the reader regarding the meaning of the mean values. In general, all of the students tended to perceive that they were able to use technology for learning tasks. In spite of this general tendency, gender and content area of interest loaded statistically significant difference among their categories. Male (M=1.83; SD=.889) students agreed more in terms of their Perceived Personal Ability of using technology compared to female (M=2.14; SD=1.037) students. The effect of Perceived Personal Ability, therefore, is statistically significant, F(1,158) = 4.023, p=.047. As for content area of interest; mathematics and social science (M=2.08; SD=1.023) demonstrated the lowest Perceived Personal Ability compared to other groups (science and mathematics (M=1.9; SD=1.034), and undecided (M=1.86; SD=.751)), giving rise to a highly significant effect, F(2,158) = 5.671, p=.005. 5.2.6. Component 6: Social Influence Item 23, “If I got the highest grades in technology related courses I would prefer no one knew.” This statement refers to a negative attitude in the instrument. When it is reverse coded for the analysis; the item reads: “If I got the highest grades in technology related courses I would prefer everyone knew,” (factor loading: .839; M=1.82; SD=.984) loaded highest in Social Influence category. All of the students agreed that they would be comfortable in letting others know about their use of technology. Thus, the use of technology for learning was not perceived by the students to be socially discouraging. There are no statistically significant differences in this category with varying personal characteristics. 5.2.7. Component 7: Perseverance Item 51, “I am challenged with the problems in the use of technology I cannot understand immediately” (factor loading: .666; M=2.92 SD=1.145) loaded highest in Perseverance category. The mean value implies that students have neutral attitudes towards Perseverance in the use of technology. The GLM analysis indicated that students do not have different positions in the category with respect to their varying personal characteristics. 5.2.8. Component 8: Interest Item 53, “The challenge of technology related problems does not appeal to me.” This statement refers to a negative attitude in the instrument. When it is reverse coded for the analysis; the item reads: “The challenge of technology related problems does appeal to me,” (factor loading: .793; M=2.40; SD=1.137) loaded highest in Interest category. All of the students agreed that they would be interested in problems related to the use of technology. There are no statistically significant differences in this category with varying personal characteristics. 6. DISCUSSION AND CONCLUSION The findings of the motivation to use technology for learning survey indicated that students perceive the use technology in their lives as a need for learning, regardless of their various personal characteristics such as gender, age, grade level, previous experience, and content area of interest. This conclusion can be evidently
TOJET: The Turkish Online Journal of Educational Technology – January 2010, volume 9 Issue 1
Copyright The Turkish Online Journal of Educational Technology 198
affirmed by looking at the mean values1 of eight factors: Relevance (M=1.71; SD=1.030), Satisfaction (M=2.36; SD=1.182), Confidence (M=2.78; SD=1.216), Gender Differences (M=2.10; SD=1.167), Perceived Personal Ability (M=1.96; SD=.953), Social Influence (M=1.82; SD=.984), Perseverance (M=2.92 SD=1.145), and Interest (M=2.40; SD=1.137). In addition, one can conclude that students are motivated to use technology for learning and expect that their courses in all areas of education like science, mathematics, and social science include components of technology to enhance their learning. One important question then arises for educators is: how can we understand what makes a good technological innovation in education? In addressing the roles of pedagogy and people (innovators, educators, and learners) in technology innovations, Ferdig (2005) summarizes the quality criteria of pedagogy: (1) the innovation must be imbued with authentic, interesting, and challenging academic content, (2) participants must have a sense of ownership, (3) there must be opportunities for active participation, (4) the curriculum and technological tools must provide chances for the creation of artifacts in a variety of ways, (5) publication, reflection, and feedback play a key role throughout the project; and that of good people: (1) innovators who recognize the dialogic nature of innovation implementation, (2) innovators who interact with teachers and students in genuine ways, (3) innovators and teachers who understand the flexible nature of both teaching and technology, (4) innovators who provide opportunities for legitimate participation. Of course, this is one standpoint on the matter, however one should be skeptical about how many technology offers we have at the K-12 level in the various content areas, which are qualified by these pedagogy and good people principles. The attitudes of Turkish prospective teachers towards the use of computers in education Turkey is very promising, considering the qualities described above. For example, the study by Can and Cagiltay (2006) regarding the use of computer games indicates that:
The results of the questionnaire show that the participants favored the use of computer games with educational features as a teaching aid in courses (98%) and as a reward (78%) rather than as a main instructional tool (60% disagreed). They responded that games with educational features can be effective for learning when they provide cooperative (85%) learning environments. Similarly, 70% of the participants agreed with the effectiveness of using games when they provide competitive learning environments. (p. 317)
In addition, the motivation to use technology for learning survey revealed that students at lower grades tended to have more satisfaction in using technology compared to the higher graders. Another finding indicated that more experienced students were less confident in using technology compared to less experienced students. When these two findings come together and assuming that higher graders at the same school had been exposed more to technology-oriented curricula, it may be the fact that the higher graders’ technology experiences were not completely supportive of a positive attitude. Although female students did not have a negative attitude towards the use computers for their education, they felt less confident in using technology compared to male students. This finding agrees with numerous research reports (Colley & Comber, 2003; Comber, et al., 1997; Isman & Celikli, 2009; Kadijevich, 2000; Li & Kirkup, 2007) in the sense that male students were more dominant in using technology. However, this inference should be cautiously taken into account as opposing findings such as the ones in the current study emerge. None of the tests conducted in the present study with the data collected via the modified FSMAS provided evidence on female students being less competent than their male counterparts. In fact, the category Gender Differences measured that students have positive attitudes in favor of female students in using technology. In addition, as a common sense both male and female students were moderately willing to tackle with problems when they face in using technology for their learning experiences. In a recent study, Dabaj (2009) reports that female students have better perceptions of distance education compared to male students. By its nature, distance education involves technology adaptation to the instruction. Then, although female students may limit themselves in the mechanical use of technology, they still have a good mental adaptation to utilize technology for learning. Students good at science and mathematics were more positive about their ability to use technology compared to their social science counterparts. This differentiation was not seen in their feeling about confidence in using technology. So, perhaps students at social science fields do not get enough practice of technology applications
1 Please note that all mean values are directionally ensured to be equivalent. i.e. Regardless of positive and negative
statements in the original instrument, the Likert scale is valid in all categories as follows: 1-Strongly Agree; 2-Agree; 3-Neutral; 4-Disagree; 5-Strongly Disagree.
TOJET: The Turkish Online Journal of Educational Technology – January 2010, volume 9 Issue 1
Copyright The Turkish Online Journal of Educational Technology 199
for their learning as much as the other group. Hence, their perceptions about the usefulness of technology for learning may not be as developed as the other group in science and mathematics. There is a need for further research on this issue. The data shows that the modified FSMAS is reliable and hence, its data is valid for further analysis. The internal consistency analysis reveals that the instrument has the Cronbach alpha values ranging from .942 to .777, referred as highly reliable. The instrument consisted of 57 items in total. The factor analysis showed that there were eight different thematic categories among the items, agreeing with Melancon, Thompson, and Becnel’s (1994) on their reliability analysis of FSMAS. The overall meaning deduced to category label was established on the basis of the group of items loaded on a particular category. The category labels turned out to be: Relevance, Satisfaction, Confidence, Gender Differences, Personal Ability, Social Influence, Perseverance, and Interest. While coding the factor components, the ARCS model of motivational categories guided the analysis of the data. Three factor components were labeled as Relevance, Satisfaction, and Confidence to make inferences about students’ motivation to use technology for learning. These three components inform that students had high motivation to use technology for learning regardless their varying personal characteristics. In conclusion, this study suggests that students have positive attitudes towards the use of technology for their learning. This finding was derived from student perceptions of varying personal characteristics such as gender, grade level, previous experience, and content area of interest. While designing the new high school curricula in science, mathematics, and social science fields, educators should integrate technological components to foster student learning and motivation to learn. 7. ACKNOWLEDGEMENT I would like to my students Sirin Coskun and R. Didem Taylan for their help in the data collection process and its manual entry to spreadsheets. Finally, I am very thankful to Ajda Kahveci for her time in reviewing this paper and giving her valuable comments. REFERENCES Angeli, C., Valanides, N., & Bonk, C. J. (2003). Communication in a web-based conferencing system: The
quality of computer-mediated interactions. British Journal of Educational Technology, 34(1), 31-43. Aydin, C. H., & Tasci, D. (2005). Measuring readiness for e-learning: Reflections from an emerging country.
Educational Technology & Society, 8(4), 244-257. Bransford, J. D., Sherwood, R. D., Hasselbring, T. S., Kinzer, C. K., & Williams, S. (1990). Anchored
instruction: Why we need it and how technology can help. In D. Nix & R. Spiro (Eds.), Cognition, education and multimedia: Exploring ideas in high technology. Hillsdale, NJ: Lawrence Erlbaum Associates.
Can, G., & Cagiltay, K. (2006). Turkish prospective teachers' perceptions regarding the use of computer games with educational features. Educational Technology & Society, 9(1), 308-321.
Cavas, B., Cavas, P., Karaoglan, B., & Kisla, T. (2009). A study on science teachers' attitudes toward information and communication technologies in education. The Turkish Online Journal of Educational Technology, 8(2), 20-32.
Colley, A., & Comber, C. (2003). Age and gender differences in computer use and attitudes among secondary school students: What has changed? Educational Research, 45(2), 155-165.
Comber, C., & Colley, A. (1997). The effects of age, gender and computer experience upon computer attitudes the effects of age, gender and computer experience upon computer attitudes. Educational Research, 39(2), 123. Comber, C., Colley, A., Hargreaves, D. J., & Dorn, L. (1997). The effects of age, gender and computer
experience upon computer attitudes. Educational Research, 39(2), 123. Cronin, M. W., & Cronin, K. A. (1992). A critical analysis of the theoretic foundations of interactive video
instruction. Journal of Computer-Based Instruction, 19(2), 37-41. Dabaj, F. (2009). The role of gender and age on students’’ perceptions towards online education case study:
Sakarya university, vocational high school. The Turkish Online Journal of Educational Technology, 8(2), 120-123.
Doppen, F. H. (2004). Beginning social studies teachers' integration of technology in the history classroom. Theory and Research in Social Education, 32(2), 248-279.
Ellington, J. (2003). A meta-analysis of the effects of calculators on students’ achievement and attitude levels in precollege mathematical classes. Journal for Research in Mathematics, 34(5), 433-463.
Ellington, J. (2006). The effects of non-cas graphing calculators on student achievement and attitude levels in mathematics: A meta-analysis. School Science and Mathematics, 106(1), 16-25.
TOJET: The Turkish Online Journal of Educational Technology – January 2010, volume 9 Issue 1
Copyright The Turkish Online Journal of Educational Technology 200
Fennema, E., & Sherman, J. A. (1976). Fennema-sherman mathematics attitude scales. Instruments designed to measure the attitudes toward the learning of mathematics by females and males. JSAS: Catalog of Selected Documents in Psychology, 6(Ms. No. 1225), 31.
Ferdig, R. E. (2005). Towards implementing technologies in education: Exploring the pedagogy and people of good innovations. The Turkish Online Journal of Educational Technology, 4(2), http://www.tojet.net/articles/425.htm.
Fish, W. W., & Gill, P. B. (2009). Perceptions of online instruction. The Turkish Online Journal of Educational Technology, 8(1), 53-64.
Fraenkel, J. R., & Wallen, N. E. (2003). How to design and evaluate research in education (5 ed.). New York: NY: McGraw-Hill Companies.
Glasser, W. (1986). Control theory in the classroom. New York, NY, US: Perennial Library/Harper & Row Publishers.
Holt, D. T., & Crocker, M. (2000). Prior negative experiences: Their impact on computer training outcomes. Computers & Education, 35(4), 295-308.
Hurley, N. P., & Vosburg, J. D. (1997). Modern technology: The relationship between student attitudes toward technology and their attitudes toward learning using modern technology in an everyday setting (Publication no. ED415841). Retrieved 10/24/2007, from ERIC (Educational Resources Information Center) database:
Isman, A., & Celikli, G. l. n. E. (2009). How does student ability and self-efficacy affect the usage of computer technology? The Turkish Online Journal of Educational Technology, 8(1), 33-38.
Jaeger, R. M. (1988). Survey research methods in education. In R. M. Jaeger (Ed.), Complementary methods for research in education (pp. 303-330). Washington, DC: American Educational Research Association.
Jayaratne, T. E., Thomas, N. G., & Trautmann, M. (2003). Intervention program to keep girls in the science pipeline: Outcome differences by ethnic status. Journal of Research in Science Teaching, 40(4), 393-414.
Kadijevich, D. (2000). Gender differences in computer attitude among ninth-grade students. Journal of Educational Computing Research, 22(2), 145-154.
Kahveci, M. (2007a). An instrument development: The interactivity survey (is). Educational Technology & Society, 10(3), 163-174.
Kahveci, M. (2007b). Investigating the existence of interactivity in various instructional settings. Paper presented at the National Association for Research in Science Teaching International Conference (NARST), New Orleans, USA.
Kahveci, M. (2009). Shared perceptions of professors about instructional interactivity. Saarbrücken, Germany: VDM Verlag Dr. Müller.
Kaino, L. M., & Salani, E. B. (2004). Students' gender attitudes towards the use of calculators in mathematics instruction. Paper presented at the 28th Conference of the International Group for the Psychology of Mathematics Education, 2004.
Kaiser, H. F. (1974). An index of factorial simplicity. Psychometrika, 39, 31-36. Kay, R. (2006). A systematic evaluation of learning objects for secondary school students. Journal of
Educational Technology Systems, 35(4), 411-448. Keller, J. M. (1983). Motivational design of instruction. In C. M. Reigeluth (Ed.), Instructional-design theories
and models. NJ: Erlbaum: Hillsdale. Keller, J. M. (1987). Strategies for stimulating the motivation to learn. Performance and Instruction, 26(8), 1-7. Keller, J. M., & Kopp, T. W. (1987). Application of the arcs model of motivational design. In C. M. Reigeluth
(Ed.), Instructional theories in action: Lessons illustrating selected theories and models. Hillsdale, NJ: Lawrance Earlbaum Associates.
Kulik, J. A. (1994). Meta-analytic studies and findings on computer based instruction. In E. L. Baker & H. F. O’Neil (Eds.), Technology assessment in education and training. Hillsdale NJ: Lawrence Erlbaum.
Lancy, D. F. (1990). Microcomputers and the social studies. OCSS Review, 26(1), 30. Li, N., & Kirkup, G. (2007). Gender and cultural differences in internet use: A study of china and the uk.
Computers & Education, 48(2), 301. Melancon, J., Thompson, B., & Becnel, S. (1994). Measurement integrity of scores from the fennema-sherman
mathematics attitudes scales: The attitudes of public school teachers. Educational and Psychological Measurement, 54(1), 187-192.
Mercier, E. M., Barron, B., & O'Connor, K. M. (2006). Images of self and others as computer users: The role of gender and experience. Journal of Computer Assisted Learning, 22(5), 335.
Ofori, R., & Charlton, J. P. (2002). A path model of factors influencing the academic performance of nursing students. Journal of Advanced Nursing, 38(5), 507-515.
Oliver, R., & Reeves, T. C. (1996). Dimensions of effective interactive learning with telematics for distance education. Educational Technology Research and Development, 44(4), 45-56.
TOJET: The Turkish Online Journal of Educational Technology – January 2010, volume 9 Issue 1
Copyright The Turkish Online Journal of Educational Technology 201
Pajares, F., & Graham, L. (1999). Self-efficacy, motivation constructs, and mathematics performance of entering middle school students. Contemporary Educational Psychology, 24, 124-139.
Rieber, L. P. (1993). A pargmatic view of instructional technology. In K. Tobin (Ed.), The practice of constructivism in science education. Hillsdale, NJ: Lawrance Erlbaum Associates.
Romano, D. M., & Brna, P. (2001). Presence and reflection in training: Support for learning to improve quality decision-making skills under time limitations. Cyberpsychology & Behavior, 4(2), 265-277.
Russell, C. J., Mattson, J., Devlin, S. E., & Atwater, D. (1990). Predictive validity of biodata items generated from retrospective life experience essays. Journal of Applied Psychology, 75(5), 569-580.
Ryba, K., & Anderson, B. (1990). Learning with computers: Effective teaching strategies: ISTE Publications. Saye, J. W., & Brush, T. (2004). Scaffolding problem-based teaching in a traditional social studies classroom.
Theory and Research in Social Education, 32(3), 349-378. SPSS. (2007). The statistical package of social sciences (Version 16.0.1 (Nov 15, 2007)): SPSS Inc. Stevens, T., Olivarez, A. J., Lan, W. Y., & Tallent-Runnels, M. K. (2004). Role of mathematics self efficacy and
motivation in mathematics performance across ethnicity. Journal of Educational Research, 97(4), 208-221.
Stoney, S., & Wild, M. (1998). Motivation and interface design: Maximising learning opportunities. Journal of Computer Assisted Learning, 14(1), 40-50.
Wenglinsky, H. (1998). Does it compute? The relationship between educational technology and student achievement in mathematics. from http://www.sbceo.k12.ca.us/~ims/techcen/EETT/ImpactofET.pdf
Wishart, J., & Blease, D. (1999). Theories underlying perceived changes in teaching and learning after installing a computer network in a secondary school. British journal of Educational Technology, 30(1), 25-41.
Wolters, C. A., & Pintrich, P. R. (1998). Contextual differences in student motivation and self-regulated learning in mathematics, english, and social studies classrooms. Instructional Science, 26, 27-47.
Yang, S. C. (2003). Computer-mediated history learning: Spanning three centuries project. Computers in Human Behavior, 19(3), 299-318.
TOJET: The Turkish Online Journal of Educational Technology – January 2010, volume 9 Issue 1
Copyright The Turkish Online Journal of Educational Technology 202
TEACHER EDUCATION FROM E-LEARNER TO E-TEACHER: MASTER CURRICULUM
Associate professor dr Dragana BJEKIĆ
Kragujevac University – Technical faculty Čačak, Serbia Department of educational sciences and technology education
e-mail: [email protected]
Associate professor dr Radojka KRNETA Kragujevac University – Technical faculty Čačak, Serbia
Department of computer science, telecommunication and automatization e-mail: [email protected]
Assistant professor dr Danijela MILOŠEVIĆ
Kragujevac University – Technical faculty Čačak, Serbia Department of information technologies
e-mail: [email protected]
ABSTRACT E-learning and e-teaching systems are involved in teachers’ professional activities and development in several ways: (a) If e-learning/e-teaching is the technology which supports the process of teachers’ learning of university courses, the teacher is in the position of e-learner; (b) If e-learning/e-teaching is the content of the teachers’ university curricula in order to be applied in the teaching process, the teacher switches from the position of e-learner to the one of e-teacher in blended or total e-learning systems. Systematic formal teacher education concerning e-learning/e-teaching implementation, and the structure of teachers’ ICT competencies and e-competencies, as well as the reasonss for their occurance, are considered in the paper. The Master curriculum of e-learning and an example of the programme realization are presented. The university curriculum of e-learning at Kragujevac University - Technical Faculty in Čačak (Serbia) was developed as a part of the international project (TEMPUS JEP-41016-2006). The curriculum focuses on the development of different e-roles for teachers and e-teachers: e-creator, e-designer, e-facilitator, e-tutor, e-moderator, etc. This master programme is a part of teacher in-service formal education for primary and secondary school teachers. In addition, the curriculum is adaptable to teachers’ pre-service education. However, it is more effective as a part of in-service education than as a part of pre-service undergraduate education, because the active teachers recognize their professional roles better than prospective teachers. Key words: e-teacher, e-learning, e-teaching, curriculum of e-learning.
1. NEW EDUCATIONAL CONTEXT FOR TEACHERS’ PROFESSIONAL DEVELOPMENT IN THE KNOWLEDGE SOCIETY Teaching and learning discourse has been changed. According to Benson and Brack (2009), discourse on teaching and learning scholarship has been focused on passing knowledge derived from teaching practice in the context of other forms of scholarship, as well as in the context of considering of the role of teaching in society. New roles of the teaching process have been derived from the concept of “knowledge society” at all educational levels. On the other side, the strategy of lifelong learning as “a continual process where each human being could expand and adjust their knowledge and skills, capacities of judgement and action” (Knežević-Florić, 2008: 201), should enable people to develop their professional roles. According to Olivera Kneževic-Florić (2008: 202), the first step in mobilizing the lifelong learning strategy is more flexible comprehension, evaluation and development of different forms of education and teaching. In the context of the information and/or knowledge societies and lifelong learning strategy, a new frame of the pre-service and in-service teacher education has been defined. The current level of the learning technology development provides opportunities for (Benson and Brack, 2009: 74): collaborative engagement, access to information, interaction with content, and individual empowerment. Nowadays, rapid changes in communication technologies enable teachers to move from traditional face-to-face classroom activities to online classrooms, or online activities in the traditional classrooms.
TOJET: The Turkish Online Journal of Educational Technology – January 2010, volume 9 Issue 1
Copyright The Turkish Online Journal of Educational Technology 203
Educational systems worldwide insist on using information and communication technologies (ICT) to teach students who gain the knowledge and skills needed for the future knowledge society (Jimoyiannis and Komis, 2007: 149-150). Both the students-prospective teachers (pre-service teachers) and in-service teachers develop a positive attitudes toward e-learning and using computers in their (future) classrooms (Akpinar and Bayramoglu, 2008; Gray and Souter, 2002; Gulbahar, 2008; Stevanovic et al. 2009; Tearle and Golder, 2008). The majority of authors (Benson and Brack, 2009; Schertler, 2006) emphasise that the constructivist and social constructivist concepts are the foundation of e-learning technologies. Current teaching, being social interactive process, is based on the social constructivist and constructivist concepts, too. Constructivist learning theory, especially socio-constructivism in education and higher education (Carnell, 2007), is the formative part of e-teaching and e-learning design. This means that successful learning depends on individual activities and experience in collaborative environment. According to the constructivist principles, e-teaching “means to guide the students to construct their own knowledge and to be aware of the situational context this construction takes places” (Schertler, 2006), thereby using modern ICT. The concept of cooperative teaching is the fundamental construct to develop e-teaching scenarios. What is relation between e-learning and e-teaching? Conceptual frameworks for e-learning and e-teaching are different. E-learning focuses on the learner and the learning process. The term “teaching” is used in two ways: teaching as the teacher activities and teaching as the system of instructional activities (teachers activities are incorporated in the teaching activities as the system of instructional activities). Then, there are two meanings of the “e-teaching” concept. According to Nakajima, e-teaching is “the system designed to improve teachers’ performance, and their self-regulation and motivation. Its service designs are aimed at supporting teachers to teach effectively in an e-learning environment” (Nakajima, 2006). The architecture of e-learning is centred on learner. The architecture of e-teaching “needs to be centred on teachers” (Nakajima, 2006). E-teaching is not just prerequisite to e-learning, but it can be a great innovation in education. However, in this paper the term e-teaching is used in a broader sense. E-teaching is the instructional system of processes and activities designed according to the ICT development, characteristics, and models of e-learning, principles of formal communication, principles of e-education, principles of competence-based education system etc. (Krneta et al, 2007). Instructional systems, according to Petrina (2007), involve relationships, conditions, processes, causes, effects, and feedback. Development of e-learning systems and e-teaching modalities makes possibilities to involve them in teachers’ professional activities and development in several ways:
If e-learning/e-teaching is the technology which supports the process of teachers’ learning of university courses, the teacher is in the position of e-learner;
If e-learning/e-teaching is the content of the teachers’ university curricula in order to be applied in the teaching process, the teacher switches from the position of e-learner to the one of e-teacher in blended or total e-learning systems.
In this structure of teachers’ activities, there are differences between three modalities of e-support of teaching (Krneta et al. 2007):
(1) using attainment of the information-communication technology at the instruction; infotechnological system and computer in that system are the instructional tools;
(2) realization of e-learning as autonomous educational procedure; (3) realization of e-teaching as a developmental instructional (didactic) system...
Effects of e-learning/e-teaching in the student-teacher and active teacher education have been rarely investigated so far; however, systematic teacher education for complex e-teacher profession has not been investigated. 2. TEACHERS’ COMPETENCE IN THE KNOWLEDGE SOCIETY All actors in educational process agree that “high quality teachers are the most important factors in a children and adolescence’s education” (Kleiman, 2004). Teacher’s professional competence is the system of knowledge, skills, abilities, and motivational disposition that provides the effective realization of the professional teaching activities. The structure of teachers’ professional competence becomes more complex. Teachers’ competence includes the three fundamental professional competencies (Bjekić and Zlatić, 2006):
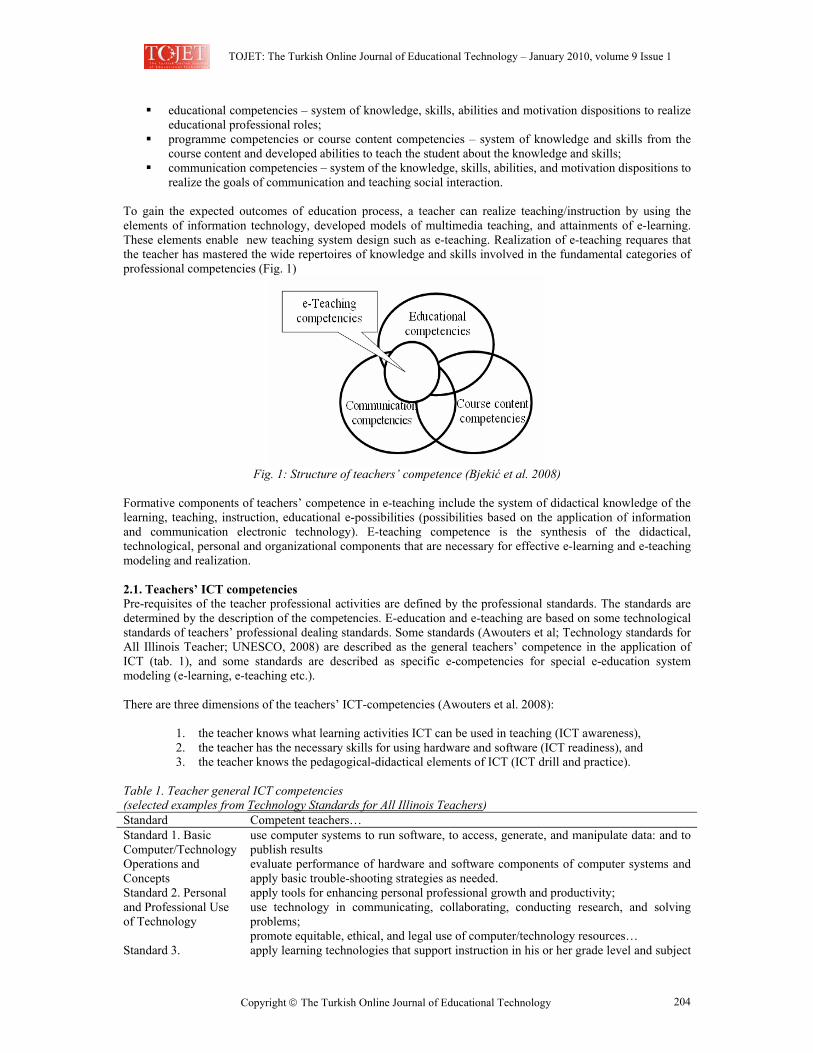
TOJET: The Turkish Online Journal of Educational Technology – January 2010, volume 9 Issue 1
Copyright The Turkish Online Journal of Educational Technology 204
educational competencies – system of knowledge, skills, abilities and motivation dispositions to realize
educational professional roles; programme competencies or course content competencies – system of knowledge and skills from the
course content and developed abilities to teach the student about the knowledge and skills; communication competencies – system of the knowledge, skills, abilities, and motivation dispositions to
realize the goals of communication and teaching social interaction. To gain the expected outcomes of education process, a teacher can realize teaching/instruction by using the elements of information technology, developed models of multimedia teaching, and attainments of e-learning. These elements enable new teaching system design such as e-teaching. Realization of e-teaching requares that the teacher has mastered the wide repertoires of knowledge and skills involved in the fundamental categories of professional competencies (Fig. 1)
Fig. 1: Structure of teachers’ competence (Bjekić et al. 2008)
Formative components of teachers’ competence in e-teaching include the system of didactical knowledge of the learning, teaching, instruction, educational e-possibilities (possibilities based on the application of information and communication electronic technology). E-teaching competence is the synthesis of the didactical, technological, personal and organizational components that are necessary for effective e-learning and e-teaching modeling and realization. 2.1. Teachers’ ICT competencies Pre-requisites of the teacher professional activities are defined by the professional standards. The standards are determined by the description of the competencies. E-education and e-teaching are based on some technological standards of teachers’ professional dealing standards. Some standards (Awouters et al; Technology standards for All Illinois Teacher; UNESCO, 2008) are described as the general teachers’ competence in the application of ICT (tab. 1), and some standards are described as specific e-competencies for special e-education system modeling (e-learning, e-teaching etc.). There are three dimensions of the teachers’ ICT-competencies (Awouters et al. 2008):
1. the teacher knows what learning activities ICT can be used in teaching (ICT awareness), 2. the teacher has the necessary skills for using hardware and software (ICT readiness), and 3. the teacher knows the pedagogical-didactical elements of ICT (ICT drill and practice).
Table 1. Teacher general ICT competencies (selected examples from Technology Standards for All Illinois Teachers) Standard Competent teachers… Standard 1. Basic Computer/Technology Operations and Concepts
use computer systems to run software, to access, generate, and manipulate data: and to publish results evaluate performance of hardware and software components of computer systems and apply basic trouble-shooting strategies as needed.
Standard 2. Personal and Professional Use of Technology
apply tools for enhancing personal professional growth and productivity; use technology in communicating, collaborating, conducting research, and solving problems; promote equitable, ethical, and legal use of computer/technology resources…
Standard 3. apply learning technologies that support instruction in his or her grade level and subject
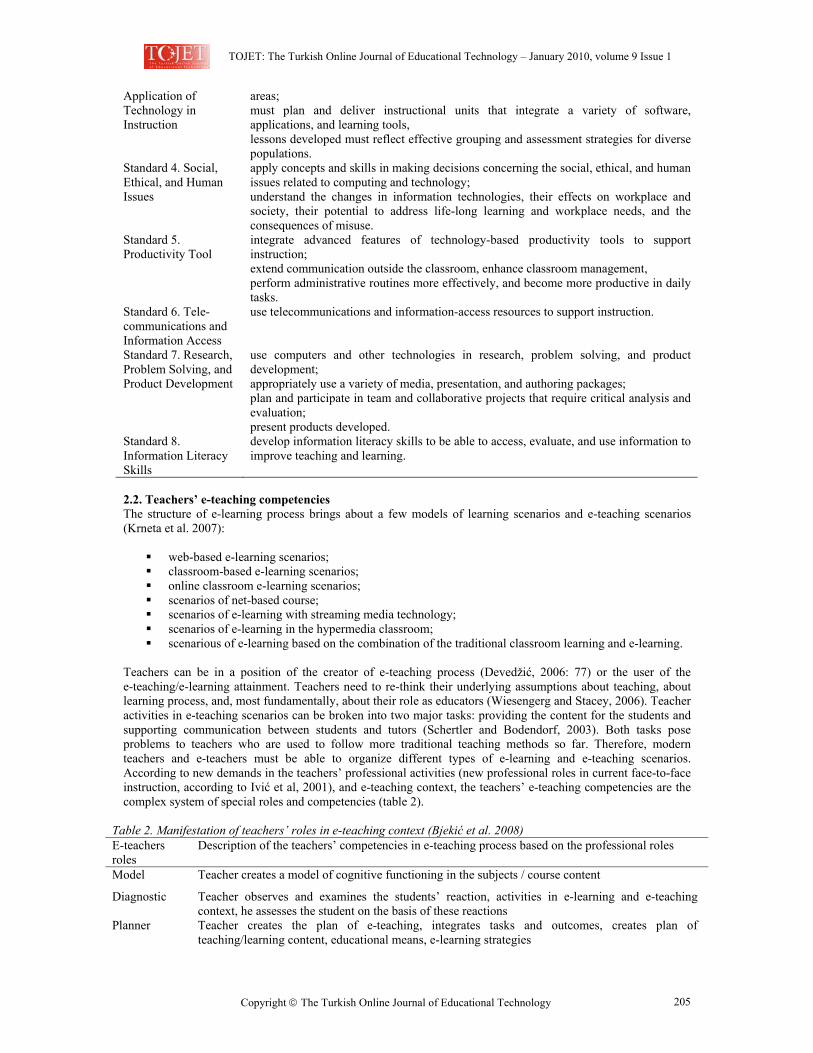
TOJET: The Turkish Online Journal of Educational Technology – January 2010, volume 9 Issue 1
Copyright The Turkish Online Journal of Educational Technology 205
Application of Technology in Instruction
areas; must plan and deliver instructional units that integrate a variety of software, applications, and learning tools, lessons developed must reflect effective grouping and assessment strategies for diverse populations.
Standard 4. Social, Ethical, and Human Issues
apply concepts and skills in making decisions concerning the social, ethical, and human issues related to computing and technology; understand the changes in information technologies, their effects on workplace and society, their potential to address life-long learning and workplace needs, and the consequences of misuse.
Standard 5. Productivity Tool
integrate advanced features of technology-based productivity tools to support instruction; extend communication outside the classroom, enhance classroom management, perform administrative routines more effectively, and become more productive in daily tasks.
Standard 6. Tele-communications and Information Access
use telecommunications and information-access resources to support instruction.
Standard 7. Research, Problem Solving, and Product Development
use computers and other technologies in research, problem solving, and product development; appropriately use a variety of media, presentation, and authoring packages; plan and participate in team and collaborative projects that require critical analysis and evaluation; present products developed.
Standard 8. Information Literacy Skills
develop information literacy skills to be able to access, evaluate, and use information to improve teaching and learning.
2.2. Teachers’ e-teaching competencies The structure of e-learning process brings about a few models of learning scenarios and e-teaching scenarios (Krneta et al. 2007):
web-based e-learning scenarios; classroom-based e-learning scenarios; online classroom e-learning scenarios; scenarios of net-based course; scenarios of e-learning with streaming media technology; scenarios of e-learning in the hypermedia classroom; scenarious of e-learning based on the combination of the traditional classroom learning and e-learning.
Teachers can be in a position of the creator of e-teaching process (Devedžić, 2006: 77) or the user of the e-teaching/e-learning attainment. Teachers need to re-think their underlying assumptions about teaching, about learning process, and, most fundamentally, about their role as educators (Wiesengerg and Stacey, 2006). Teacher activities in e-teaching scenarios can be broken into two major tasks: providing the content for the students and supporting communication between students and tutors (Schertler and Bodendorf, 2003). Both tasks pose problems to teachers who are used to follow more traditional teaching methods so far. Therefore, modern teachers and e-teachers must be able to organize different types of e-learning and e-teaching scenarios. According to new demands in the teachers’ professional activities (new professional roles in current face-to-face instruction, according to Ivić et al, 2001), and e-teaching context, the teachers’ e-teaching competencies are the complex system of special roles and competencies (table 2).
Table 2. Manifestation of teachers’ roles in e-teaching context (Bjekić et al. 2008) E-teachers roles
Description of the teachers’ competencies in e-teaching process based on the professional roles
Model Teacher creates a model of cognitive functioning in the subjects / course content
Diagnostic Teacher observes and examines the students’ reaction, activities in e-learning and e-teaching context, he assesses the student on the basis of these reactions
Planner Teacher creates the plan of e-teaching, integrates tasks and outcomes, creates plan of teaching/learning content, educational means, e-learning strategies
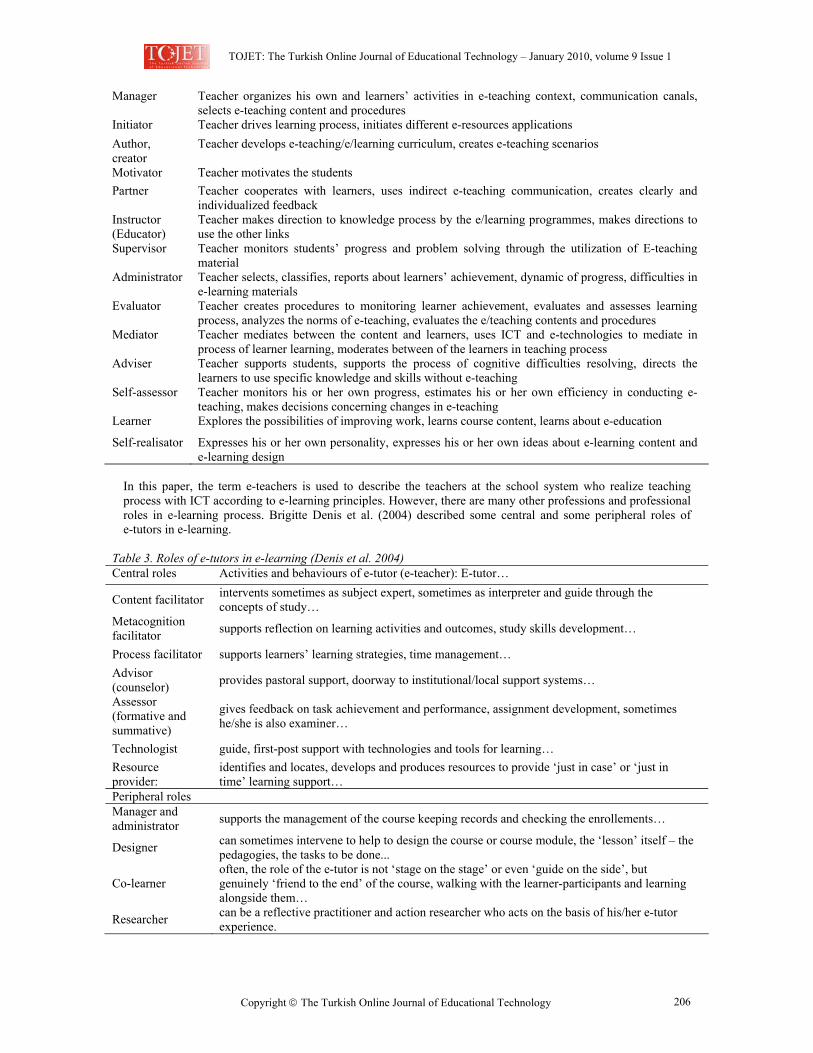
TOJET: The Turkish Online Journal of Educational Technology – January 2010, volume 9 Issue 1
Copyright The Turkish Online Journal of Educational Technology 206
Manager Teacher organizes his own and learners’ activities in e-teaching context, communication canals, selects e-teaching content and procedures
Initiator Teacher drives learning process, initiates different e-resources applications Author, creator
Teacher develops e-teaching/e/learning curriculum, creates e-teaching scenarios
Motivator Teacher motivates the students Partner Teacher cooperates with learners, uses indirect e-teaching communication, creates clearly and
individualized feedback Instructor (Educator)
Teacher makes direction to knowledge process by the e/learning programmes, makes directions to use the other links
Supervisor Teacher monitors students’ progress and problem solving through the utilization of E-teaching material
Administrator Teacher selects, classifies, reports about learners’ achievement, dynamic of progress, difficulties in e-learning materials
Evaluator Teacher creates procedures to monitoring learner achievement, evaluates and assesses learning process, analyzes the norms of e-teaching, evaluates the e/teaching contents and procedures
Mediator Teacher mediates between the content and learners, uses ICT and e-technologies to mediate in process of learner learning, moderates between of the learners in teaching process
Adviser Teacher supports students, supports the process of cognitive difficulties resolving, directs the learners to use specific knowledge and skills without e-teaching
Self-assessor Teacher monitors his or her own progress, estimates his or her own efficiency in conducting e-teaching, makes decisions concerning changes in e-teaching
Learner Explores the possibilities of improving work, learns course content, learns about e-education
Self-realisator Expresses his or her own personality, expresses his or her own ideas about e-learning content and e-learning design
In this paper, the term e-teachers is used to describe the teachers at the school system who realize teaching process with ICT according to e-learning principles. However, there are many other professions and professional roles in e-learning process. Brigitte Denis et al. (2004) described some central and some peripheral roles of e-tutors in e-learning.
Table 3. Roles of e-tutors in e-learning (Denis et al. 2004) Central roles Activities and behaviours of e-tutor (e-teacher): E-tutor…
Content facilitator intervents sometimes as subject expert, sometimes as interpreter and guide through the concepts of study…
Metacognition facilitator supports reflection on learning activities and outcomes, study skills development…
Process facilitator supports learners’ learning strategies, time management… Advisor (counselor) provides pastoral support, doorway to institutional/local support systems…
Assessor (formative and summative)
gives feedback on task achievement and performance, assignment development, sometimes he/she is also examiner…
Technologist guide, first-post support with technologies and tools for learning… Resource provider:
identifies and locates, develops and produces resources to provide ‘just in case’ or ‘just in time’ learning support…
Peripheral roles Manager and administrator supports the management of the course keeping records and checking the enrollements…
Designer can sometimes intervene to help to design the course or course module, the ‘lesson’ itself – the pedagogies, the tasks to be done...
Co-learner often, the role of the e-tutor is not ‘stage on the stage’ or even ‘guide on the side’, but genuinely ‘friend to the end’ of the course, walking with the learner-participants and learning alongside them…
Researcher can be a reflective practitioner and action researcher who acts on the basis of his/her e-tutor experience.
TOJET: The Turkish Online Journal of Educational Technology – January 2010, volume 9 Issue 1
Copyright The Turkish Online Journal of Educational Technology 207
Gilly Salmon (2007) emphasizes the importance of e-moderation in different teaching situations supported by the ICT. Thus, e-moderator is one of the teachers’ roles in (e)teaching. Teachers’ activities in e-learning process and e-teaching activities in the class instruction organization, include the wide range of e-roles and introject the previous professionals and roles in e-learning and distance learning. Teachers in current (e)teaching context are not only e-tutors, however they integrate e-tutors’, e-moderators’ roles and activities, as a part of their professional dealings. 3. PROFESSIONAL DEVELOPMENT FROM E-LEARNER TO E-TEACHER New strategies of teachers’ education for new professional roles and competencies in the knowledge society have been developed. According to the continuality of the teachers’ professional/vocational development, the teachers’ professional improvement regards the development of three fundamental professional competencies: educational (pedagogic), programme or course content competencies as well as communication competencies. This paper examines the reasons for systematic formal teacher education in e-learning/e-teaching implementation, in professional dealings as an e-teacher in different courses and e-teaching manager as well as in teacher’s ICT and e-competencies. During past decade, “a large number of initiatives, coming from both the research community and educational policy authorities, have been directed towards the preparation of teachers in order to enable them to integrate ICT in their everyday educational practice” (Jimoyiannis and Komis, 2007: 150) and to develop teachers’ skills in the pedagogical application of ICT in teaching and learning processes. The investigations of e-teaching and teacher in e-teaching system represent a new field of research. Then, teachers’ competence for e-teaching is a new part of teacher’s pre-service and in-service professional education. The investigations of e-education competencies development in the pre-service education (Barton and Haydn, 2006; Beckett et al. 2003; Kadijevich, 2006; Tearless and Golder, 2008) are more frequently conducted than investigations of the in-service development of e-education teaching competencies. Teachers intentions to use ICT in their instruction are significantly determinated by the teachers’ perceptions of ICT usefulness. Investigation of the influence on teachers’ perceptions of technology and professional development, which is aimed to integrating ICT in instruction, derives five determinated factors (Jimoyiannis and Komis, 2007: 152):
continuous ICT support and coordination; ICT pedagogical development enabling teachers to use technology in everyday classroom practice; Partnership (collaboration with specialist teachers and colleagues in the school); Availability of sophisticated educational software in schools; ICT infrastructure development in schools.
Mishra and Koehler (according to Jimoyiannis and Komis, 2007: 153) developed the Model of Technological Pedagogical Content Knowledge. ICT integration in everyday teaching and learning system is defined by three key components: knowledge of the pedagogy that is applicable to the specific content; knowledge of how subject matter is transformed by the application of technology; knowledge of how technology can support pedagogical goals. 4. MASTER CURRICULUM OF E-TEACHING COMPETENCE DEVELOPMENT The development of competencies for online teaching should lead to the associated training development for online teachers and (in some cases) to the certification of online or/and e-teachers . Development and application of the e-education (e-teaching and e-learning) involve development and establishment of technological support and intensive training for teachers and students so that they could acquire IT skills needed for implementation and application of IT in e-teaching and e-learning. It is the uses of e-learning as a vehicle for delivering professional development targeted to teacher specific needs, and as a content of professional activities, that is emphasized in the information society context. E-technology integration in the classroom is becoming the significant priority of national educational systems. Teacher education is becoming an important part of the education system. Context of development of the teacher education includes the global European teacher education policy and national policies (Ash and Burges, 2008č Zgaga, 2006, 2008).
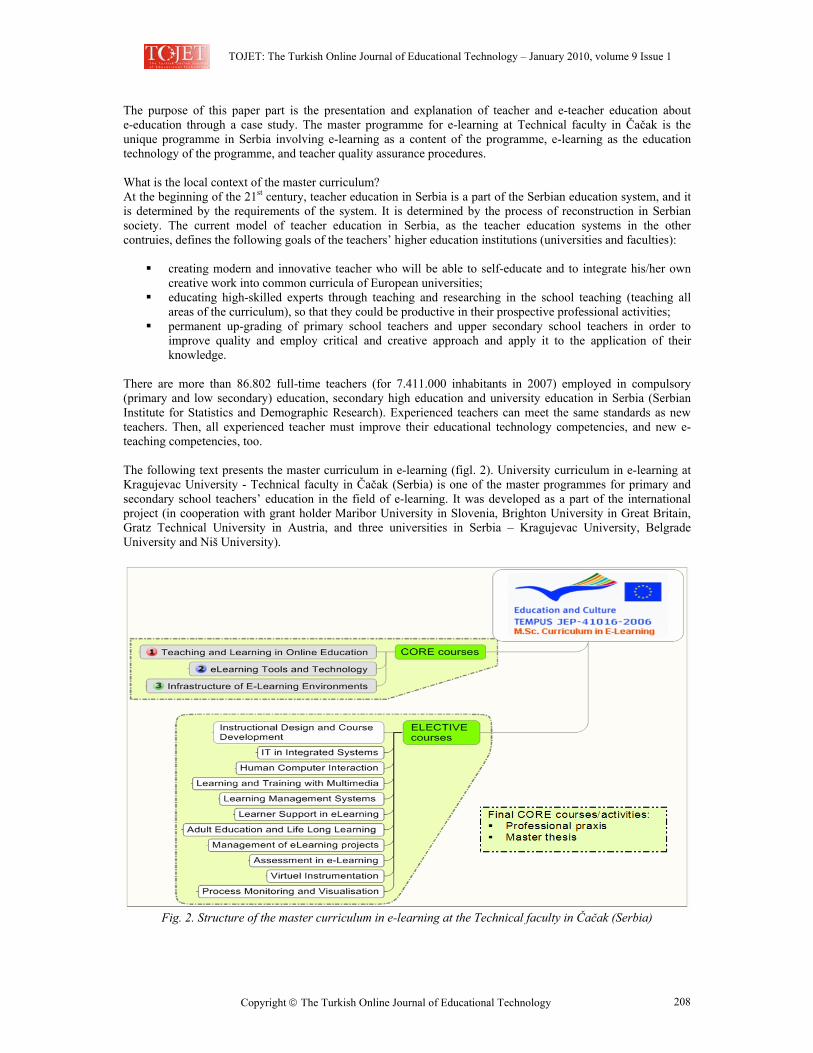
TOJET: The Turkish Online Journal of Educational Technology – January 2010, volume 9 Issue 1
Copyright The Turkish Online Journal of Educational Technology 208
The purpose of this paper part is the presentation and explanation of teacher and e-teacher education about e-education through a case study. The master programme for e-learning at Technical faculty in Čačak is the unique programme in Serbia involving e-learning as a content of the programme, e-learning as the education technology of the programme, and teacher quality assurance procedures. What is the local context of the master curriculum? At the beginning of the 21st century, teacher education in Serbia is a part of the Serbian education system, and it is determined by the requirements of the system. It is determined by the process of reconstruction in Serbian society. The current model of teacher education in Serbia, as the teacher education systems in the other contruies, defines the following goals of the teachers’ higher education institutions (universities and faculties):
creating modern and innovative teacher who will be able to self-educate and to integrate his/her own creative work into common curricula of European universities;
educating high-skilled experts through teaching and researching in the school teaching (teaching all areas of the curriculum), so that they could be productive in their prospective professional activities;
permanent up-grading of primary school teachers and upper secondary school teachers in order to improve quality and employ critical and creative approach and apply it to the application of their knowledge.
There are more than 86.802 full-time teachers (for 7.411.000 inhabitants in 2007) employed in compulsory (primary and low secondary) education, secondary high education and university education in Serbia (Serbian Institute for Statistics and Demographic Research). Experienced teachers can meet the same standards as new teachers. Then, all experienced teacher must improve their educational technology competencies, and new e-teaching competencies, too. The following text presents the master curriculum in e-learning (figl. 2). University curriculum in e-learning at Kragujevac University - Technical faculty in Čačak (Serbia) is one of the master programmes for primary and secondary school teachers’ education in the field of e-learning. It was developed as a part of the international project (in cooperation with grant holder Maribor University in Slovenia, Brighton University in Great Britain, Gratz Technical University in Austria, and three universities in Serbia – Kragujevac University, Belgrade University and Niš University).
Fig. 2. Structure of the master curriculum in e-learning at the Technical faculty in Čačak (Serbia)
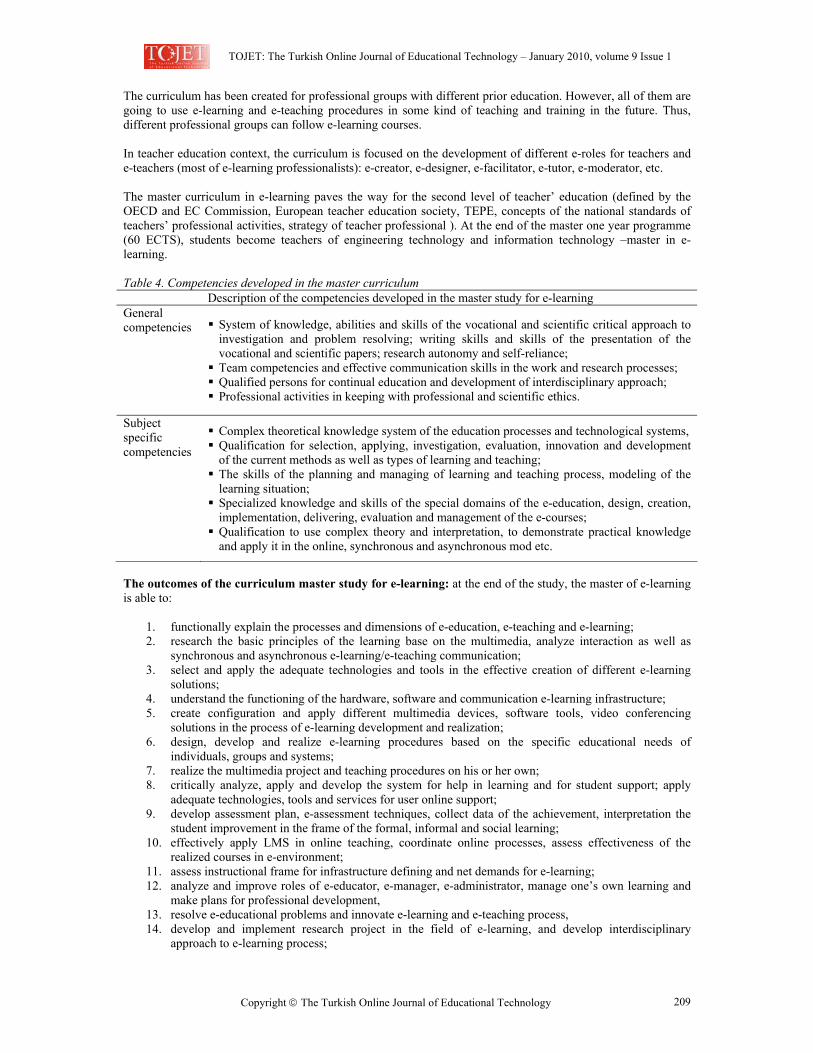
TOJET: The Turkish Online Journal of Educational Technology – January 2010, volume 9 Issue 1
Copyright The Turkish Online Journal of Educational Technology 209
The curriculum has been created for professional groups with different prior education. However, all of them are going to use e-learning and e-teaching procedures in some kind of teaching and training in the future. Thus, different professional groups can follow e-learning courses. In teacher education context, the curriculum is focused on the development of different e-roles for teachers and e-teachers (most of e-learning professionalists): e-creator, e-designer, e-facilitator, e-tutor, e-moderator, etc. The master curriculum in e-learning paves the way for the second level of teacher’ education (defined by the OECD and EC Commission, European teacher education society, TEPE, concepts of the national standards of teachers’ professional activities, strategy of teacher professional ). At the end of the master one year programme (60 ECTS), students become teachers of engineering technology and information technology –master in e-learning. Table 4. Competencies developed in the master curriculum Description of the competencies developed in the master study for e-learning General competencies System of knowledge, abilities and skills of the vocational and scientific critical approach to
investigation and problem resolving; writing skills and skills of the presentation of the vocational and scientific papers; research autonomy and self-reliance;
Team competencies and effective communication skills in the work and research processes; Qualified persons for continual education and development of interdisciplinary approach; Professional activities in keeping with professional and scientific ethics.
Subject specific competencies
Complex theoretical knowledge system of the education processes and technological systems, Qualification for selection, applying, investigation, evaluation, innovation and development of the current methods as well as types of learning and teaching;
The skills of the planning and managing of learning and teaching process, modeling of the learning situation;
Specialized knowledge and skills of the special domains of the e-education, design, creation, implementation, delivering, evaluation and management of the e-courses;
Qualification to use complex theory and interpretation, to demonstrate practical knowledge and apply it in the online, synchronous and asynchronous mod etc.
The outcomes of the curriculum master study for e-learning: at the end of the study, the master of e-learning is able to:
1. functionally explain the processes and dimensions of e-education, e-teaching and e-learning; 2. research the basic principles of the learning base on the multimedia, analyze interaction as well as
synchronous and asynchronous e-learning/e-teaching communication; 3. select and apply the adequate technologies and tools in the effective creation of different e-learning
solutions; 4. understand the functioning of the hardware, software and communication e-learning infrastructure; 5. create configuration and apply different multimedia devices, software tools, video conferencing
solutions in the process of e-learning development and realization; 6. design, develop and realize e-learning procedures based on the specific educational needs of
individuals, groups and systems; 7. realize the multimedia project and teaching procedures on his or her own; 8. critically analyze, apply and develop the system for help in learning and for student support; apply
adequate technologies, tools and services for user online support; 9. develop assessment plan, e-assessment techniques, collect data of the achievement, interpretation the
student improvement in the frame of the formal, informal and social learning; 10. effectively apply LMS in online teaching, coordinate online processes, assess effectiveness of the
realized courses in e-environment; 11. assess instructional frame for infrastructure defining and net demands for e-learning; 12. analyze and improve roles of e-educator, e-manager, e-administrator, manage one’s own learning and
make plans for professional development, 13. resolve e-educational problems and innovate e-learning and e-teaching process, 14. develop and implement research project in the field of e-learning, and develop interdisciplinary
approach to e-learning process;
TOJET: The Turkish Online Journal of Educational Technology – January 2010, volume 9 Issue 1
Copyright The Turkish Online Journal of Educational Technology 210
15. manage and transform work or study context that are complex, unpredictable and require strategic approach in e-learning fields;
16. take responsibility for contributing to professional knowledge and practice and/or reviewing the strategic performance of e-learning teams.
There are many forms of e-learning courses (Milošević et al. 2009). Most of these forms are used in these master programmes:
e -learning activities in online professional learning community: graduated students – active teachers participate in a series of learning activities, exchanging ideas with other students and teachers; this form uses web-based technologies, asynchronous discussions, participation in school-based activities (implementation lessons, assessment procedures, class visiting, etc.),
e-learning programmes use broadcast formats, lectures reviewing, classes demonstration, reviewing other online materials; this form uses multiple sites, interaction via video conferencing, online text messaging; video conference-based teaching approach is important part of the (presented) curriculum;
individualized self-paced instructional procedures: series of online learning activities which are delivered between e-teacher and teacher-participants who are the e-learners in the curriculum; it includes some forms of the self-study without interaction, some interactions with instructor through online discussion, e-mail, Skype;
hybrid teaching models: this form uses integrative onsite meetings, classroom visits, face-to-face workshops, coaching and mentoring programmes, small study groups;
e-learning based on the extend communication in distance situation and without immediate connection. The instruction is realized by the Moodle platform for e-learning which is selected on the base of the top university’s experience. Moodle platform support the creating and delivering of the different teaching materials and activities: e-book, multimedia interactive lessons, vocabulary, forum, wiki pages, chat, test, quizzes, homework, workshop, etc. Hypermedia laboratory (e-lab) at Technical faculty in Čačak is equipped with the videoconferencing system to teaching activities of visiting professors. The modern conception of the programmes content gives direction to students’ activities (there are week guides to learning) and learning plan development. The evidence of student activities, automatic monitoring of student advancement, realization of pre-exam activities etc. The Moodle supports different students, but it supports the teachers and faculty staff, too. In 2008/2009, the first generation of master students for e-learning attends the courses. At the end of the courses, they evaluated curriculum and courses on the scale from 1 – the lowest grade to 5 – the best grade (Milosevic et al. 2009: 266): evaluation of the curriculum structure and content – 4.40; evaluation of the goals and outcomes – 4.27; evaluation of the teaching organization – 4.21; evaluation of the process of student evaluation, grading and testing – 4.45; evaluation of the e-content organization – 4.68; evaluation of the LMS and technical support – 4.69; general impression – 4.54; evaluation of teachers – 4.59; composite curriculum grade – sum of grades – 4.44. 5. CONCLUSION E-teaching requires a wide spectrum of e-roles. It is necessary for teachers in e-education environment to aquire sufficient knowledge about e-teaching and e-learning. According to Kleiman, “e-learning can contribute to addressing each challenge by enhancing the preparation of new teachers, providing high quality and readily accessible professional development opportunities for active teachers, and making the teaching profession more attractive (e.g., by providing online resources for teachers and new connections to colleagues and mentors) to help address the teacher recruitment and retention problem.” (Kleiman, 2004). Different e-learning master programmes are implemented in the teacher pre-service and in-service education. E-learning master programme at Technical Faculty Čačak is realized in 2008/2009 school year as a part of teacher in-service formal education. The programme is focused on the differentation and development of e-teachers’ roles and application in Serbian school environment. The curriculum is adaptable to teachers’ initial education, too. However, it is more effective as a part of the in-service education than as a part of the pre-service undergraduate education. There are differences between student-teachers and active teachers in terms of their educational needs. Active teachers recognize their professional roles better than prospective teachers.
TOJET: The Turkish Online Journal of Educational Technology – January 2010, volume 9 Issue 1
Copyright The Turkish Online Journal of Educational Technology 211
The paper suggests that e-learning potential is a powerful tool for directing the teachers’ quality challenges and obtaining e-teaching competencies. E-learning for teachers must reflect the principles of effective teachers’ professional development. What is so unique in the teachers’ master curriculum for e-learning? What is the difference between the teacher education for e-teachers/e-learning experts and the other e-learning experts from different professional groups? There are many questions and new research topics regarding teacher education in the future. 6. REFERENCE Akpinar, Y., Bayramoglu, Y. (2008). Promoting teachers’ positive attitude towards web use: a study in web site
development, The Turkish Online Journal of Educational Technology – TOJET, 7(3), Article 5, Available on http://www.tojet.net/articles/735.doc
Ash, A., Burgess, L. (2008). Transition and Translation: Increasing Teacher mobility and extending the European Dimension in Education, in: Hudson, B., Zgaga, P. (eds.). Teacher Education Policy in Europe: A Voice of Higher Education Institutions, Monograph of Journal of Research in Teacher Education, Umea: Faculty of Teacher Education - University of Umea, 85-108. Available on http://www.educ.umu.se/presentation/publikationer/monographs/teacher_education_policy.pdf
Awouters, V., Jans, R., Jans, S. (2008). E-Learning Competencies for Teachers in Secondary and Higher Education, Conferencia International e-Learning, Zaragoza, Abril 2008, EcoMEDIAeurope, Retrieved April 29, 2009 from, Available on http://edict.khlim.be/edict/documenten/Paper_Zaragoza_Valere_Awouters.pdf
Barton, R., Haydn, T. (2006). Trainee teachers’ views on what helps them to use information and communication technology effectively in their subject teaching, Journal of Computer Assisted Learning 22 (4), 257–272
Beckett, E. C., Marques-Chisholm, I., Wetzel, K. (2003). Preparing Technology-Competent Teachers, Technological Horisons in Education Journal ONLINE, Retrieved August 2003, http://www.thejournal.com/magazine
Benson, R., Brack, C. (2009). Developing the scholarship of teaching: What is the role of e-teaching and learning? Teaching in Higher Education, 14(1), 71-80.
Bjekić, D., Krneta, R., Milošević, D. (2008). Kompetencije za e-nastavu u sistemu profesionalnih kompetencija nastavnika osnovne škole, (E-teaching competencies in the system of the primary school teachers’ competencies), Inovacije u nastavi 21(2), 7-20, Available on http://www.uf.bg.ac.rs/inovacije/broj_2_8/1.htm
Carnell, E. (2007). Conceptions of effective teaching in higher education, Teaching in Higher Education, 12(1), 25-40.
Cartelli, A. (2006). Teaching in the Knowledge Society – New Skills and Instruments for Teachers, Hershey-London-Melbourne-Singapore: Information Science Publishing
Cornu, B. (2008). Being a Teacher in the Knowledge Society, TEPE 2008, Ljubljana, Available on http://www.pef.uni-lj.si/tepe2008/ppt/Cornu.ppt
Denis, B., Watland, P., Pirotte, S., Verday, N. (2004). Roles and Competencies of the e-Tutor, NLC 2004, Available on http://www.networkedlearningconference.org.uk/past/nlc2004/proceeding/symposia/symposium6/denis_et_al.htm
Devedžić, V. (2006): Semantic WEB and education, New York, NY, USA: Springer’s Integrated Series in Information Systems.
Dondi, C., Mancinelli, E., Moretti, M. (2006): Adapting Existing Competence Frameworks to Higher Education Environments, Scienter, Bologna, Italy, Available on http://www.ecompetence.info/uploads/media/ch2.pdf
eTeaching Certificate Program, Available on http://anywhere.tennessee.edu/iei/eteaching/eTeaching_outline.pdf Gray, D. S., Souter, N. (2002?), Secondary Science Teachers Use Of, and Attitudes Towards, ICT In Scotland,
Glasgow, University of Strathclyde, Available on http://www.iubs.org/cbe/papers/souter_Secondary.html Gulbahar, Y. (2008). Improving the technology integration skills of prospective teachers through practice: A
case study, The Turkish Online Journal of Educational Technology – TOJET, 7(4), Article 8, Available on http://www.tojet.net/articles/748.doc
Hipermedial e-lab at the Technical faculty in Cacak, Available on http://e-lab.tfc.kg.ac.rs Ivić, I., Pešikan, A., Janković, S. (2001). Aktivno učenje nastava (Active Learning Teaching), Beograd:
Filozofski fakultet, Institut za psihologiju. Jimoyiannis, A., Komis, V. (2007). Examing teachers’ belifs about ICT in education: implication of a teacher
preparation program, Teacher Development, 11(2), 149/173.
TOJET: The Turkish Online Journal of Educational Technology – January 2010, volume 9 Issue 1
Copyright The Turkish Online Journal of Educational Technology 212
Kadijevich, Dj. (2006): Achieving educational technology standards: the relationship between student teacher’s interest and institutional support offered, Journal of Computer Assisted Learning 22 (6), 437-443.
Kleiman, G. M. (2004). Meeting the Need for High Quality Teachers: e-Learning Solutions, White Paper, Available on http://www.ed.gov/about/offices/list/os/technology/plan/2004/site/documents/Kleiman-MeetingtheNeed.pdf
Knežević-Florić, O. (2008). Lifelong Leaning as a Basis of the Sustainable Development concept, in: Popov, N., Wolhuter, C., Leutwyler, B., Kysilka, M., Ogunleye, J. (eds). Comparatire Education, Teacher Training, education Policy and Social Inclusion, Vol. 6, Bulgarian Comparative Education Society, 199-203.
Krneta, R., Bjekić, D., Milošević, D. (2007). Competencies of e-Teaching in the System of Teachers’ Competence, ETAI 2007, September, Ohrid- Macedonia, Book of Abstract, 29, CD Proceeding, Available on http://www1.etf.ukim.edu.mk/SCM_C021A06/conference/E3-2.pdf
Loomis, S., Rodriguez, J., Tillman, R. (2008). Developing into similarity: global teacher education in the twenty-first century, European Journal of Teacher Education, 31(3), 233-245.
LSN (2008). A professional development framework for e-learning, Retrieved 2008 from http://www.LSNeducation.org.uk, http://www.learningtechnologies.ac.uk/files/0627161Framework.pdf Available on http://www.eric.ed.gov/ERICDocs/data/ericdocs2sql/content_storage_01/0000019b/80/34/e0/a9.pdf
Master study for e-learning, TEMPUS-JEP-41016-2006, Čačak: Technical faculty, http://www.tfc.kg.ac.rs/tempus-jep-41016-2006
Milosevic, D., Bjekic, D., Krneta, R. (2009). Evaluation of master study of e-learning: Case study from Serbia, 5th International Conference on Open and Distance Learning ICODL 2009, Open and Distance Education for Global Collaboration & Educational Development, Athens, Greese, November 27-29., Proceeding on CD, 260-269.
Milošević, D., Debevc, M., Krneta, R., Brković, M. (2006). Building e-Learning Curriculum through analyzing necessary competences, Scientific Bulletin of Politehnica University of Timisquara, Transactions on automatic control and computer science, 51(3): 43-48.
Nakajima, K. (2006): Is “e-Teaching” Web Zero or Potentially Web 2.1?, Retrieved April 2007, http://www.cccties.org/access/toukou/nakajima_20061117_2.pdf
Petrina, S. (2007): Advanced Teaching Methods for the Technology Classroom, Hershey-London-Melbourne-Singapore: Information Science Publishing.
Salmon, G. (2007). E-Moderating: The Key To Teaching And Learning Online, London-New York: RoutledgeFalmer.
Schertler, M. (2006). E-Teaching Scenarios, in: Carteli, A. (ed). Teaching in the Knowledge Society – New Skills and Instruments for Teachers, Hershey-London-Melbourne-Singapore: Information Science Publishing, 221-240.
Schertler, M., Bodendorf, F. (2003): Supporting the Teacher’s Role in Web-Based Learning Environments, ICOOL 2003, Retireved April 2007, http://icool.uom.ac.mu/2003/papers/file/Bodendorf.pdf
Stevanovic, V., Stevanovic, M., Pejcic, B. (2009). Spremnost nastavnika na razlicitim nivoima obrazovanja za e-ucenje (Readiness of the teachers on different school levels for e-learning), XIV congress JISA DICG, Herceg Novi, http://www.jisa.rs
Tearle, P., Golder, G. (2008). The use of ICT in the teaching and learning physical education in compulsory education: how do we prepare the workforce of the future? European Journal of Teacher Education, 31(1), 55-72.
Technology Standards for All Illinois Teachers [24.120], Available on http://www.isbe.state.il.us/profprep/CASCDVr/pdfs/24120_coretechnology.pdf and http://www.itps.ilstu.edu/PDFs/ISU_tech_standards.pdf
The Role of eTutor, Retrived April 2009, Available on http://www.le.ac.uk/cc/rjm1/etutor/etutor/etutorrole.html UNESCO (2008). ICT Competency Standards for Teachers, Available on
http://www.unesco.org/en/competency-standards-teachers Vrielink, R. (2008). Implementation and students’ acceptance of web-based technology as learning and teaching
tool, Available on http://www.reindervrielink.nl/Implementation%20march%202008.pdf Zgaga, P. (2006). The Modernisation of Study Programes in Teacher Education in an International context:
Themes, Contexts and Open Questions, Available on http://www.pef.uni-lj.si/strani/bologna/dokumenti/posvet-zgaga-sinopsis.pdf
Zgaga, P. (2008). Mobility and European Dimension in Teacher Education, in: Hudson, B., Zgaga, P. (eds.). Teacher Education Policy in Europe: A Voice of Higher Education Institutions, Monograph of Journal of Research in Teacher Education, Umea: Faculty of Teacher Education - University of Umea, 17-42. Available on http://www.educ.umu.se/presentation/publikationer/monographs/teacher_education_policy.pdf
TOJET: The Turkish Online Journal of Educational Technology – January 2010, volume 9 Issue 1
Copyright The Turkish Online Journal of Educational Technology 213
THE ATTITUDES OF THE PROSPECTIVE MATHEMATICS TEACHERS TOWARDS INSTRUCTIONAL TECHNOLOGIES AND MATERIAL
DEVELOPMENT COURSE
Yrd. Doç. Dr. Sevinç Mert UYANGÖR Department of Secondary Mathematics Education
Necatibey Faculty of Education, Balıkesir University, Balıkesir, Turkey 10100 e-mail: [email protected]
Öğr. Gör. Denizhan Karaca ECE
Department of Secondary Mathematics Education Necatibey Faculty of Education, Balıkesir University, Balıkesir, Turkey 10100
e-mail: [email protected]
ABSTRACT This study aims to determine the attitudes of prospective teachers of Secondary Mathematics Education toward Instructional Technologies and Material Development (ITMD) Course. The participants of this descriptive research include 44 students, who take ITMD Course at Department of Secondary Mathematics at Necatibey Faculty of Education in Balıkesir University. The questionnaire developed by researchers was conducted before and after the course at 2007-2008 fall semesters. The accuracy of the difference in the attitudes of the prospective math teachers before and after the course was tested by t test and it was seen to be statically significant in the level of p=0.05. Moreover, according to results of the interviews, the prospective teachers emphasized that ITMD Course aims to provide permanent learning and to prepare materials that are appropriate to the teaching methods through an effective teaching process. At the end of the semester, the attitudes of the prospective teachers toward the course developed in a positive way. Besides, it was observed that the instructor’s positive attitudes toward the course, and group works contributed both to that development and to the success of the prospective teachers in the teaching and learning activities. Key words: Instructional technology, Material development, Mathematics education
INTRODUCTION Learning means an individual’s developing a new knowledge, skill or attitude as a result of his/her interaction with his /her knowledge and environment. Learning may happen at any time. However what concerns the educators is the purposive learning realized through instructional efforts. The way we plan the instruction has an effect both on what has been learnt and on how an individual will use the things he/she has learnt. For this reason, teaching-learning process includes selection, arrangement transferring knowledge in a proper environment and interaction between this information and the individual. Learning environment means not only the place that instruction will occur but also the methods, instruments, equipments, and materials which will be used in transferring the knowledge and guiding the works of individuals in learning process (Demirel, Yağcı, Seferoğlu, 2003). Instructional Technology can be defined as a process including creation and organization of necessary environments to realize the learning, guiding the educators through the solutions to the problems which will come out, enabling a proper selection, arrangement and preparation of instruments, equipments. When the studies in the field of Instructional Technology were analyzed; Hu, Clark and Ma (2003) have stated that teachers at schools are resistant to instructional technologies and one of the reasons may stem from pre service teacher trainings. Betrus and Malenda (2002) explained that in institutions where teachers are educated, prospective teachers have been given instructional technology courses for a long time, but incongruity has been observed between the things taught in this course and implementations of teachers. Gökdaş’s (1998) research has showed that in transition process of integrating technology with instructional processes, the institutions training teachers do not have enough courses and the existing courses are not directed toward that goal. Demetriatis and et al (2003) have stated that teacher can not carry out computer assisted implementations in their professional life through they have taken courses related to computer in pre service period, and the reason of that results from the fact that courses they have had are not enough. According to results of Akdeniz and Alev (1999), teachers stressed that although they took courses about computers during their preservice education, they could not use computer supported implementations in their teaching activities. The reason is
TOJET: The Turkish Online Journal of Educational Technology – January 2010, volume 9 Issue 1
Copyright The Turkish Online Journal of Educational Technology 214
that there are not enough courses about using computer in their university education. In the study carried out by Namlu and Ceyhan (2002), it has been said that anxiety level of prospective teachers about computer has been accumulated around middle and below it and that situation may be an indication of potential problems in their utilizing technology in their future classes. Imer’s study (2000) has stated that the number and hour of courses which are necessary for integrating technology with education in undergraduate programs at Faculties of Education in Turkey are not enough and they need to be raised. Within the framework of Instructional Technology and Material Development course, skills of developing instructional materials and utilizing the existing ones need to be acquired to prospective teachers. Generally, instructional materials are used to perform a more permanent and effective teaching by facilitating learning in teaching-learning process. According to Akkoyunlu (2002), instructional materials motivate students, and encourage them to study lesson providing them with opportunity to have an access to information and to evaluate it. Instructional materials are a significant element in raising the quality of education. Şahin and Yıldırım (1999), have stated that some efficiently prepared instructional materials may show all activities presented by teacher (drawing attention, conveying information, cue, participation, drill and practice, providing feedback, error correction and evaluation) in teaching environment. Although instructional materials do not offer an alternative which is to replace a teacher, it serves like assistance for teachers to convey the subject to students. Demirel (2005) states that utilization of instructional technology in teaching-learning processes provides a more effective presentation of subject, moreover, makes instruction more meaningful and enjoyable. After all, teachers should acquire the quality of technology literacy for them to offer students rich learning environments integrated with new technologies. And then, they should learn how to integrate with learning environments. These successive courses have been given compulsorily and gradually at the faculties of education training prospective teachers in Turkey. (YOK, 1998). In the research of Gündüz and Odabaşı (2004), called “The importance of Instructional Technology and Material Development course in training prospective teachers in information area”, these conclusions have been reached: today, teachers are expected both to develop skills of utilizing of technology and to integrate technology which is the requirement of contemporary education with learning environments. The aim of “ITMD” course at the faculties of education in Turkey is to enable the prospective teachers to integrate technology with their lessons. What is important here is to teach a lesson in an effective, efficient and enjoyable way. To achieve the goals of a lesson, a lesson should be carried out in a way of planned content including 2 hours of theory and 2 hours of practice. It is expected that cognitive, affective and psychomotor skills developed in prospective teachers in the course of ITMD, will help prospective teachers to integrate technology into teaching in their professional experiences, which is to assist effective and efficient functioning of our education system and contribute to educate qualified individuals. The purpose of the research conducted by Özgen and Obay (2008) is to investigate, within the range of various variables, the attitudes of prospective teachers of secondary mathematics towards educational technology. The study took place in 2007-2008 academic year in Dicle University Faculty of Education and 162 prospective teachers attended the study. According to the results, it was determined that the attitudes of prospective teachers towards educational technology didn’t change according to the sex variable, but it changed according to the class and related lesson variables. In addition to this, it was determined that prospective secondary mathematics teachers had positive attitudes towards educational technology. The findings of Şekerci and et al (2008) establish that most students in faculties of education use information and communication technologies for learning purposes, but they also think that the use of these aids by their lecturers in the class is insufficient. The results also show that the students have a positive attitude towards the use of technology in the class, and that they especially welcome the use of the technology through which they can become more active during the lessons and have easy access to resources. Mathematics Education & Utilizing Materials Usage of symbols, shapes, mental images, concrete models and such kind of demonstrations in expression of concepts in mathematics, is highly significant in terms of learning process. In teaching, utilizing just one or two of these types of demonstrations and ignoring the others will not support the process of children’s having the concepts of mathematics sufficiently. Providing diversity in types of demonstrations and utilizing concrete models, notably in teaching towards children, will facilitate the meaningful instruction of mathematics on a large scale.
TOJET: The Turkish Online Journal of Educational Technology – January 2010, volume 9 Issue 1
Copyright The Turkish Online Journal of Educational Technology 215
In this respect, it is thought that material supported mathematics education will be able to concretize most of mathematical concepts for students and help them to comprehend these concepts more easily. The importance of material supported mathematics education is realized better when the studies in this area are examined: the study carried out by Öztürel (1987) and Sezer (1989) has put forward that computer supported mathematics teaching makes a significant difference on student’s success in mathematics. The study conducted by Asfuroğlu (1990) on students at primary schools has indicated that material supported geometry teaching has a positive effect upon developing concepts of triangle, circle and square in students and increases their success. The study conducted by Dündar (1997) has shown that education with supplementary materials in fourth year at primary schools has significantly enhanced the comprehension of mathematics. The study carried out by Toluk, Olkun and Durmuş (2002) has analyzed the effects of problem oriented and visual model supported geometry teaching upon the geometrically thinking levels of pre service class teachers and has shown that there has been a significant development in the geometrically thinking levels of students. These results have shown that if the attention of students who have implemented the activities concerning the classification of quadrangles and triangles which are suitable for first and second levels, is not drawn to the relations between shapes and characteristics, students can not establish these connections themselves; besides, it has been helpful for students to establish such relations in forming their own definitions. It has been observed that dynamic models such as master ruler have been effective in student’s creating those definitions. It has been provided that success in mathematics has been high when materials are utilized. The importance of material supported education in mathematics has increased the need for well equipped and well informed teachers in this area. Arousing interest among students, teaching in accordance with their interest and wishes, showing them how to gain information and enabling them to transfer the gained knowledge to the areas necessary for them and to share them, should be the objectives of educational system. Teachers in the system of education are thought to be the most important factors to realize those goals. Besides having enough knowledge and skills in this area, the teachers who will realized the material supported education using educational technologies, should also believe in the benefits of utilizing material in lessons and should be interested, willing towards this area and develop a positive attitude towards it. Within this context, the aim of this study is to determine the attitudes of prospective secondary school mathematics teachers towards ITMD course. It is believed that this will be able to give us an idea about prospective teacher’s integrating their future lessons with technology. For this reason, in this study, the following questions and sub questions were examined;
Problem: what are the attitudes of prospective secondary school mathematics teachers toward ITMD
lesson? 1. Is there any significant difference in the attitudes of prospective secondary school mathematics teachers’
pre and post ITMD lesson? 2. What kinds of things affect the attitudes of prospective secondary school mathematics teachers towards
ITMD lesson?
METHOD The model of research, study group Study group of this descriptive research consists of 44 students taking ITMD lesson at the Department of Secondary School Mathematics Teaching at Necatibey Faculty of Education at Balıkesir University.
Development of data collection instrument First of all, the literature has been reviewed to develop a scale; but, as no scale directly related to the subject is found, a pool of items has been created from the studies concerned with similar studies by researchers. Moreover, the researchers have made use of the form of scale constituted for another course. A draft questionnaire has been prepared by arranging the attitude sentences created from the pool by taking expert’s view in harmony with “likert” type of 5 degrees. Data collection means consisting of 26 items has been applied as a pilot study to 65 prospective teachers at the department of Computer Education and Instructional Technology and to 47 prospective teachers at the department of secondary school mathematics teaching who have taken ITMD course at Necatibey Faculty of Education at Balıkesir University during 2006- 2007 fall-semester. After necessary validity and reliability study has been conducted and expert’s views have been taken, 8 items are omitted from the scale on the basis of findings. Moreover, Cronbach alpha reliability coefficient of the scale developed has been found 0. 94.
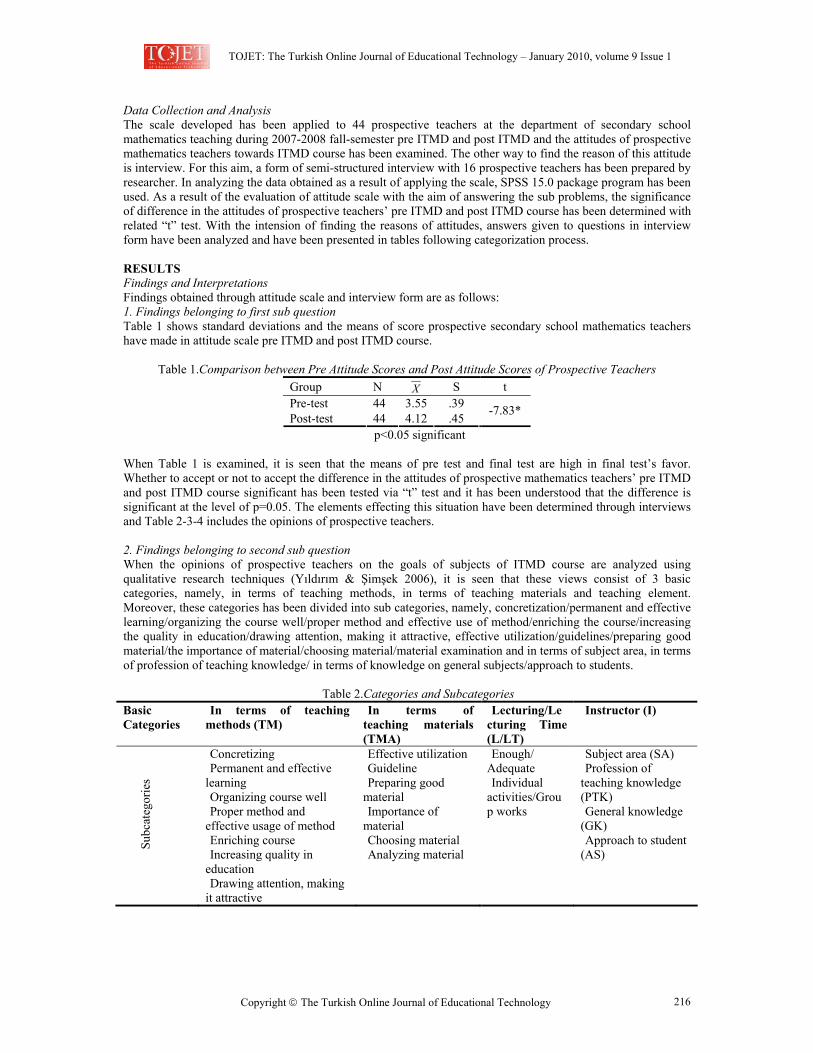
TOJET: The Turkish Online Journal of Educational Technology – January 2010, volume 9 Issue 1
Copyright The Turkish Online Journal of Educational Technology 216
Data Collection and Analysis The scale developed has been applied to 44 prospective teachers at the department of secondary school mathematics teaching during 2007-2008 fall-semester pre ITMD and post ITMD and the attitudes of prospective mathematics teachers towards ITMD course has been examined. The other way to find the reason of this attitude is interview. For this aim, a form of semi-structured interview with 16 prospective teachers has been prepared by researcher. In analyzing the data obtained as a result of applying the scale, SPSS 15.0 package program has been used. As a result of the evaluation of attitude scale with the aim of answering the sub problems, the significance of difference in the attitudes of prospective teachers’ pre ITMD and post ITMD course has been determined with related “t” test. With the intension of finding the reasons of attitudes, answers given to questions in interview form have been analyzed and have been presented in tables following categorization process.
RESULTS Findings and Interpretations Findings obtained through attitude scale and interview form are as follows: 1. Findings belonging to first sub question Table 1 shows standard deviations and the means of score prospective secondary school mathematics teachers have made in attitude scale pre ITMD and post ITMD course.
Table 1.Comparison between Pre Attitude Scores and Post Attitude Scores of Prospective Teachers
Group N X S t Pre-test 44 3.55 .39 Post-test 44 4.12 .45 -7.83*
p<0.05 significant When Table 1 is examined, it is seen that the means of pre test and final test are high in final test’s favor. Whether to accept or not to accept the difference in the attitudes of prospective mathematics teachers’ pre ITMD and post ITMD course significant has been tested via “t” test and it has been understood that the difference is significant at the level of p=0.05. The elements effecting this situation have been determined through interviews and Table 2-3-4 includes the opinions of prospective teachers. 2. Findings belonging to second sub question When the opinions of prospective teachers on the goals of subjects of ITMD course are analyzed using qualitative research techniques (Yıldırım & Şimşek 2006), it is seen that these views consist of 3 basic categories, namely, in terms of teaching methods, in terms of teaching materials and teaching element. Moreover, these categories has been divided into sub categories, namely, concretization/permanent and effective learning/organizing the course well/proper method and effective use of method/enriching the course/increasing the quality in education/drawing attention, making it attractive, effective utilization/guidelines/preparing good material/the importance of material/choosing material/material examination and in terms of subject area, in terms of profession of teaching knowledge/ in terms of knowledge on general subjects/approach to students.
Table 2.Categories and Subcategories Basic Categories
In terms of teaching methods (TM)
In terms of teaching materials (TMA)
Lecturing/Lecturing Time (L/LT)
Instructor (I)
Su
bcat
egor
ies
Concretizing Permanent and effective
learning Organizing course well Proper method and
effective usage of method Enriching course Increasing quality in
education Drawing attention, making
it attractive
Effective utilization Guideline Preparing good
material Importance of
material Choosing material Analyzing material
Enough/ Adequate Individual
activities/Group works
Subject area (SA) Profession of
teaching knowledge (PTK) General knowledge
(GK) Approach to student
(AS)
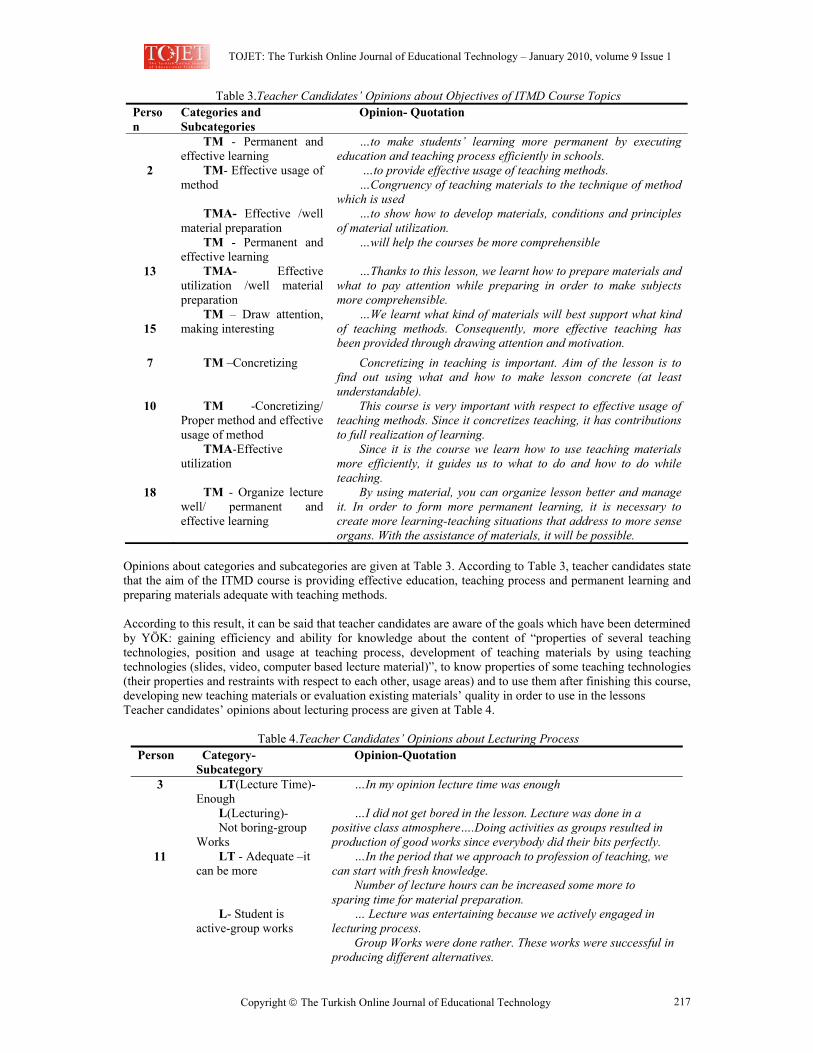
TOJET: The Turkish Online Journal of Educational Technology – January 2010, volume 9 Issue 1
Copyright The Turkish Online Journal of Educational Technology 217
Table 3.Teacher Candidates’ Opinions about Objectives of ITMD Course Topics Person
Categories and Subcategories
Opinion- Quotation
2
TM - Permanent and effective learning
TM- Effective usage of method
TMA- Effective /well
material preparation
…to make students’ learning more permanent by executing education and teaching process efficiently in schools.
…to provide effective usage of teaching methods. …Congruency of teaching materials to the technique of method
which is used …to show how to develop materials, conditions and principles
of material utilization.
13
TM - Permanent and effective learning
TMA- Effective utilization /well material preparation
…will help the courses be more comprehensible …Thanks to this lesson, we learnt how to prepare materials and
what to pay attention while preparing in order to make subjects more comprehensible.
15
TM – Draw attention, making interesting
…We learnt what kind of materials will best support what kind of teaching methods. Consequently, more effective teaching has been provided through drawing attention and motivation.
7 TM –Concretizing Concretizing in teaching is important. Aim of the lesson is to find out using what and how to make lesson concrete (at least understandable).
10 TM -Concretizing/ Proper method and effective usage of method
TMA-Effective utilization
This course is very important with respect to effective usage of teaching methods. Since it concretizes teaching, it has contributions to full realization of learning.
Since it is the course we learn how to use teaching materials more efficiently, it guides us to what to do and how to do while teaching.
18 TM - Organize lecture well/ permanent and effective learning
By using material, you can organize lesson better and manage it. In order to form more permanent learning, it is necessary to create more learning-teaching situations that address to more sense organs. With the assistance of materials, it will be possible.
Opinions about categories and subcategories are given at Table 3. According to Table 3, teacher candidates state that the aim of the ITMD course is providing effective education, teaching process and permanent learning and preparing materials adequate with teaching methods. According to this result, it can be said that teacher candidates are aware of the goals which have been determined by YÖK: gaining efficiency and ability for knowledge about the content of “properties of several teaching technologies, position and usage at teaching process, development of teaching materials by using teaching technologies (slides, video, computer based lecture material)”, to know properties of some teaching technologies (their properties and restraints with respect to each other, usage areas) and to use them after finishing this course, developing new teaching materials or evaluation existing materials’ quality in order to use in the lessons Teacher candidates’ opinions about lecturing process are given at Table 4.
Table 4.Teacher Candidates’ Opinions about Lecturing Process
Person Category-Subcategory
Opinion-Quotation
3 LT(Lecture Time)-Enough
L(Lecturing)- Not boring-group
Works
…In my opinion lecture time was enough …I did not get bored in the lesson. Lecture was done in a
positive class atmosphere….Doing activities as groups resulted in production of good works since everybody did their bits perfectly.
11 LT - Adequate –it can be more
L- Student is
active-group works
…In the period that we approach to profession of teaching, we can start with fresh knowledge.
Number of lecture hours can be increased some more to sparing time for material preparation.
… Lecture was entertaining because we actively engaged in lecturing process.
Group Works were done rather. These works were successful in producing different alternatives.
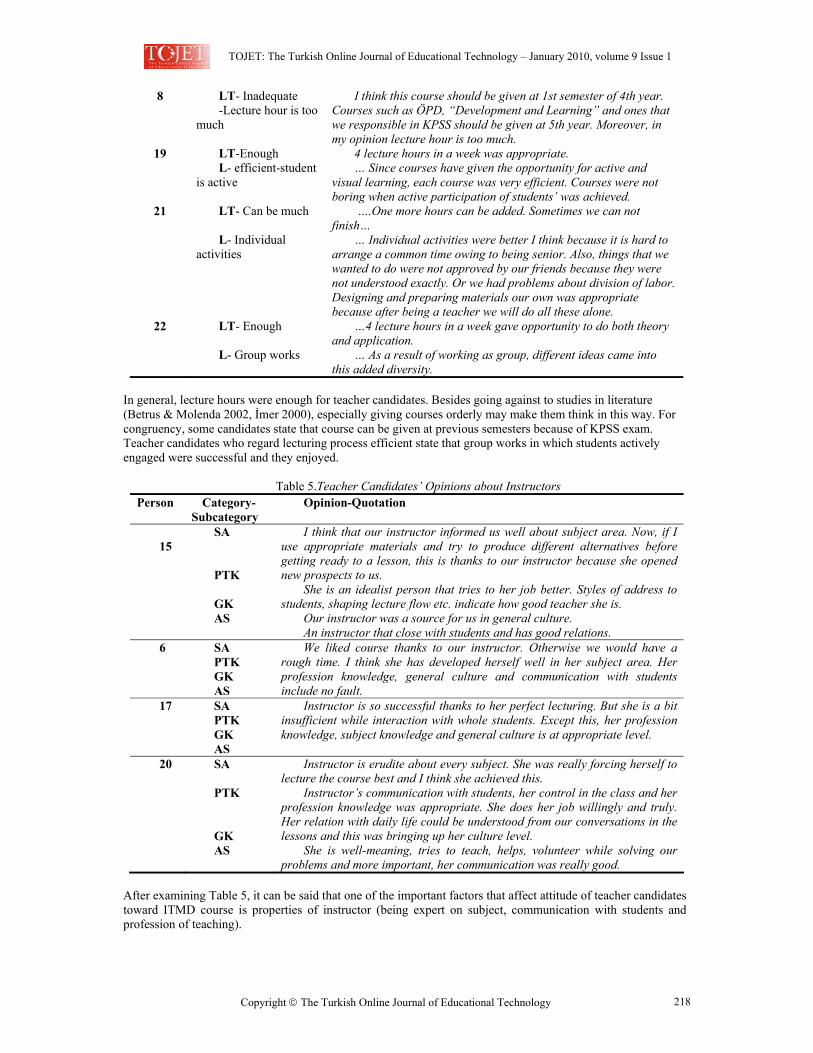
TOJET: The Turkish Online Journal of Educational Technology – January 2010, volume 9 Issue 1
Copyright The Turkish Online Journal of Educational Technology 218
8 LT- Inadequate -Lecture hour is too
much
I think this course should be given at 1st semester of 4th year. Courses such as ÖPD, “Development and Learning” and ones that we responsible in KPSS should be given at 5th year. Moreover, in my opinion lecture hour is too much.
19 LT-Enough L- efficient-student
is active
4 lecture hours in a week was appropriate. … Since courses have given the opportunity for active and
visual learning, each course was very efficient. Courses were not boring when active participation of students’ was achieved.
21 LT- Can be much L- Individual
activities
….One more hours can be added. Sometimes we can not finish…
… Individual activities were better I think because it is hard to arrange a common time owing to being senior. Also, things that we wanted to do were not approved by our friends because they were not understood exactly. Or we had problems about division of labor. Designing and preparing materials our own was appropriate because after being a teacher we will do all these alone.
22 LT- Enough L- Group works
…4 lecture hours in a week gave opportunity to do both theory and application.
… As a result of working as group, different ideas came into this added diversity.
In general, lecture hours were enough for teacher candidates. Besides going against to studies in literature (Betrus & Molenda 2002, İmer 2000), especially giving courses orderly may make them think in this way. For congruency, some candidates state that course can be given at previous semesters because of KPSS exam. Teacher candidates who regard lecturing process efficient state that group works in which students actively engaged were successful and they enjoyed.
Table 5.Teacher Candidates’ Opinions about Instructors Person Category-
Subcategory Opinion-Quotation
15
SA PTK GK AS
I think that our instructor informed us well about subject area. Now, if I use appropriate materials and try to produce different alternatives before getting ready to a lesson, this is thanks to our instructor because she opened new prospects to us.
She is an idealist person that tries to her job better. Styles of address to students, shaping lecture flow etc. indicate how good teacher she is.
Our instructor was a source for us in general culture. An instructor that close with students and has good relations.
6 SA PTK GK AS
We liked course thanks to our instructor. Otherwise we would have a rough time. I think she has developed herself well in her subject area. Her profession knowledge, general culture and communication with students include no fault.
17 SA PTK GK AS
Instructor is so successful thanks to her perfect lecturing. But she is a bit insufficient while interaction with whole students. Except this, her profession knowledge, subject knowledge and general culture is at appropriate level.
20 SA PTK GK AS
Instructor is erudite about every subject. She was really forcing herself to lecture the course best and I think she achieved this.
Instructor’s communication with students, her control in the class and her profession knowledge was appropriate. She does her job willingly and truly. Her relation with daily life could be understood from our conversations in the lessons and this was bringing up her culture level.
She is well-meaning, tries to teach, helps, volunteer while solving our problems and more important, her communication was really good.
After examining Table 5, it can be said that one of the important factors that affect attitude of teacher candidates toward ITMD course is properties of instructor (being expert on subject, communication with students and profession of teaching).
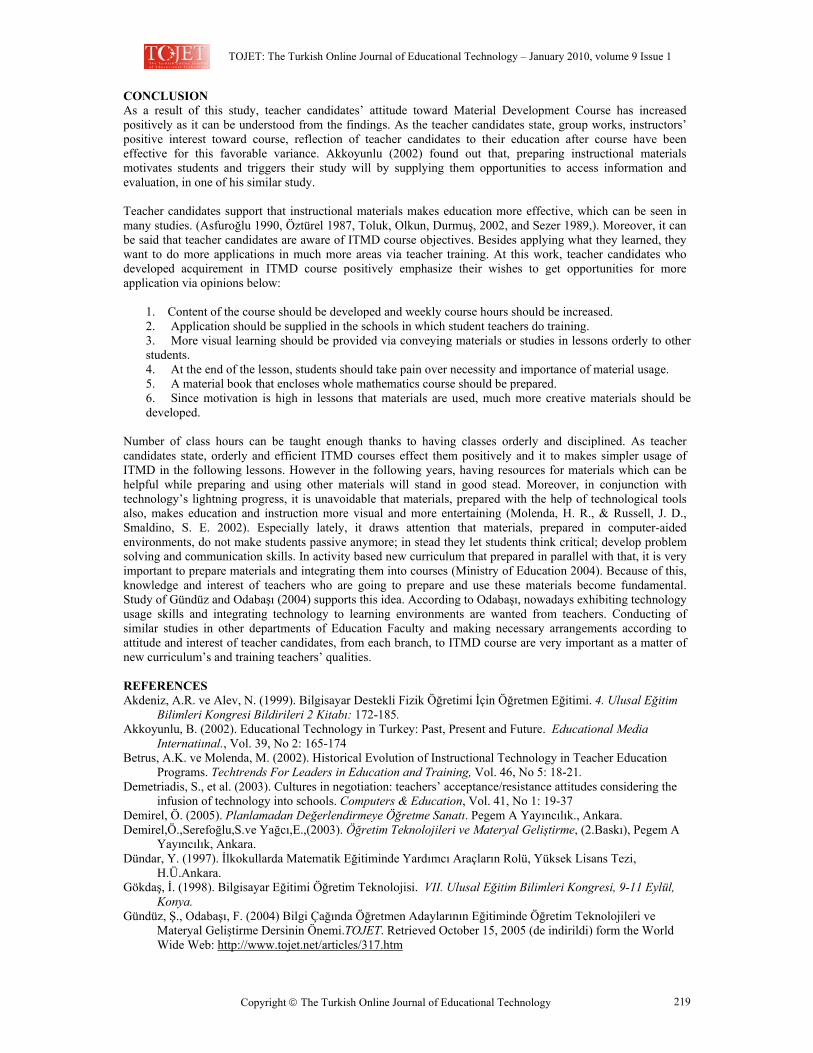
TOJET: The Turkish Online Journal of Educational Technology – January 2010, volume 9 Issue 1
Copyright The Turkish Online Journal of Educational Technology 219
CONCLUSION As a result of this study, teacher candidates’ attitude toward Material Development Course has increased positively as it can be understood from the findings. As the teacher candidates state, group works, instructors’ positive interest toward course, reflection of teacher candidates to their education after course have been effective for this favorable variance. Akkoyunlu (2002) found out that, preparing instructional materials motivates students and triggers their study will by supplying them opportunities to access information and evaluation, in one of his similar study. Teacher candidates support that instructional materials makes education more effective, which can be seen in many studies. (Asfuroğlu 1990, Öztürel 1987, Toluk, Olkun, Durmuş, 2002, and Sezer 1989,). Moreover, it can be said that teacher candidates are aware of ITMD course objectives. Besides applying what they learned, they want to do more applications in much more areas via teacher training. At this work, teacher candidates who developed acquirement in ITMD course positively emphasize their wishes to get opportunities for more application via opinions below:
1. Content of the course should be developed and weekly course hours should be increased. 2. Application should be supplied in the schools in which student teachers do training. 3. More visual learning should be provided via conveying materials or studies in lessons orderly to other students. 4. At the end of the lesson, students should take pain over necessity and importance of material usage. 5. A material book that encloses whole mathematics course should be prepared. 6. Since motivation is high in lessons that materials are used, much more creative materials should be developed.
Number of class hours can be taught enough thanks to having classes orderly and disciplined. As teacher candidates state, orderly and efficient ITMD courses effect them positively and it to makes simpler usage of ITMD in the following lessons. However in the following years, having resources for materials which can be helpful while preparing and using other materials will stand in good stead. Moreover, in conjunction with technology’s lightning progress, it is unavoidable that materials, prepared with the help of technological tools also, makes education and instruction more visual and more entertaining (Molenda, H. R., & Russell, J. D., Smaldino, S. E. 2002). Especially lately, it draws attention that materials, prepared in computer-aided environments, do not make students passive anymore; in stead they let students think critical; develop problem solving and communication skills. In activity based new curriculum that prepared in parallel with that, it is very important to prepare materials and integrating them into courses (Ministry of Education 2004). Because of this, knowledge and interest of teachers who are going to prepare and use these materials become fundamental. Study of Gündüz and Odabaşı (2004) supports this idea. According to Odabaşı, nowadays exhibiting technology usage skills and integrating technology to learning environments are wanted from teachers. Conducting of similar studies in other departments of Education Faculty and making necessary arrangements according to attitude and interest of teacher candidates, from each branch, to ITMD course are very important as a matter of new curriculum’s and training teachers’ qualities. REFERENCES Akdeniz, A.R. ve Alev, N. (1999). Bilgisayar Destekli Fizik Öğretimi İçin Öğretmen Eğitimi. 4. Ulusal Eğitim
Bilimleri Kongresi Bildirileri 2 Kitabı: 172-185. Akkoyunlu, B. (2002). Educational Technology in Turkey: Past, Present and Future. Educational Media
Internatiınal., Vol. 39, No 2: 165-174 Betrus, A.K. ve Molenda, M. (2002). Historical Evolution of Instructional Technology in Teacher Education
Programs. Techtrends For Leaders in Education and Training, Vol. 46, No 5: 18-21. Demetriadis, S., et al. (2003). Cultures in negotiation: teachers’ acceptance/resistance attitudes considering the
infusion of technology into schools. Computers & Education, Vol. 41, No 1: 19-37 Demirel, Ö. (2005). Planlamadan Değerlendirmeye Öğretme Sanatı. Pegem A Yayıncılık., Ankara. Demirel,Ö.,Serefoğlu,S.ve Yağcı,E.,(2003). Öğretim Teknolojileri ve Materyal Geliştirme, (2.Baskı), Pegem A
Yayıncılık, Ankara. Dündar, Y. (1997). İlkokullarda Matematik Eğitiminde Yardımcı Araçların Rolü, Yüksek Lisans Tezi,
H.Ü.Ankara. Gökdaş, İ. (1998). Bilgisayar Eğitimi Öğretim Teknolojisi. VII. Ulusal Eğitim Bilimleri Kongresi, 9-11 Eylül,
Konya. Gündüz, Ş., Odabaşı, F. (2004) Bilgi Çağında Öğretmen Adaylarının Eğitiminde Öğretim Teknolojileri ve
Materyal Geliştirme Dersinin Önemi.TOJET. Retrieved October 15, 2005 (de indirildi) form the World Wide Web: http://www.tojet.net/articles/317.htm
TOJET: The Turkish Online Journal of Educational Technology – January 2010, volume 9 Issue 1
Copyright The Turkish Online Journal of Educational Technology 220
Hu, P.J., Clark, T.H.K. ve Ma, W.W. (2003). Examining technology acceptance by school teachers: a longitudial study. Information & Management, Vol. 41, No 2: 227-241.
İmer, G. (2000). Eğitim Fakültelerinde Öğretmen Adaylarının Bilgisayara ve Bilgisayarı Eğitimde Kullanmaya Yönelik Nitelikleri. Eskişehir, Anadolu Üniversitesi Eğitim Fakültesi Yayınları.
MEB Komisyon (2004). Fen ve Teknoloji 4-5 Sınıflar Dersi Programı Klavuzu. Milli Eğitim Bakanlığı Talim ve Terbiye Kurulu Başkanlığı Fen Dersleri Özel İhtisas Komisyonu. MEB, Ankara.
Molenda, H. R., & Russell, J. D., Smaldino, S. E. (2002) Instructional Media and Technologies For Learning , New Jersey: Merrill Prentice Hall.
Namlu, A.G. ve Ceyhan, E. (2002). Bilgisayar Kaygısı (Üniversite Öğrencileri Üzerinde Bir Çalışma). Eskişehir, T.C. Anadolu Üniversitesi Yayınları; No 1353.
Öztürel,L.(1987). Bilgisayarla Öğretimin Matematik Erişisine Etkisi. Yüksek Lisans Tezi. Hacettepe Üniversitesi, Ankara.
Ozgen K. ve Obay,M.(2008). OrtaöğretimMatematik Öğretmen Adaylarının Eğitim Teknolojisine İlişkin Tutumlar, IETC 2008, Anadolu University Faculty of Education Department of Computer Education & Instructional Technologies Eskişehir.
Sezer, N. (1989). Bilgisayarlı Öğretimin İlkokul 5. Sınıf Öğrencilerinin Matematik Erişisine Etkisi Yayımlanmamış Yüksek Lisans Tezi. Hacettepe Üniversitesi, Ankara.
Asfuroğlu, B. (1990). Anasınıfına Devam Eden 5-6 Yaş Çocuklarına Üçgen, Daire ve Kare Kavramlarının Kazandırılması. Çukurova Üniversitesi, Sosyal Bilimler Enstitüsü, Yayımlanmamış Yüksek Lisans Tezi, Adana.
Şahin, T.Y. (2003). Student teacher’s perceptions of instructional technology: developing materials based on a constructivist approach. British Journal of Educational Technology, Vol. 34, No 1: 67-74.
Şekerci and et al (2008). Öğretim Teknolojilerinin Eğitim Fakültelerindeki Durumu:Öğrenci Görüşleri. IETC 2008, Anadolu University Faculty of Education Department of Computer Education & Instructional Technologies Eskişehir.
Toluk, Z., Olkun, S., Durmuş, S. (2002). Problem Merkezli ve Görsel Modellerle Destekli Geometri Öğretiminin Hizmet Öncesi Sınıf Öğretmenlerinin Geometrik Düşünme Düzeylerine Etkisi. V. Ulusal Fen Bilimleri Ve Matematik Eğitim Kongresi Kitapçığı.
Yıldırım A., Şimşek H. (2006) Sosyal Bilimlerde Nitel Araştırma Yöntemleri. Seçkin Yayıncılık A.Ş., Ankara YÖK (2003b). Bilgisayar ve Öğretim Teknolojileri Öğretmenliği Lisans Programı. Retrieved November 02,
2005 from the World Wide Web: http://www.yok.gov.tr/egitim/ogretmen/ogretmen_yetistirme_lisans/bilgisay.doc
TOJET: The Turkish Online Journal of Educational Technology – January 2010, volume 9 Issue 1
Copyright The Turkish Online Journal of Educational Technology 221
THE EFFECTS OF CBI LESSON SEQUENCE TYPE AND FIELD DEPENDENCE ON LEARNING FROM COMPUTER-BASED COOPERATIVE INSTRUCTION IN
WEB
Ismail IPEK, Ed.D. Bilkent University, Faculty of Engineering
Department of Computer Engineering, 06800 Bilkent, Ankara, Turkey Tel: +90 312-290 23 51 Fax: +90 312-266 40 47
E-mail: [email protected] ABSTRACT The purpose of this study was to investigate the effects of CBI lesson sequence type and cognitive style of field dependence on learning from Computer-Based Cooperative Instruction (CBCI) in WEB on the dependent measures, achievement, reading comprehension and reading rate. Eighty-seven college undergraduate students were randomly assigned to lesson sequence type levels, after assigning into three cognitive style group: field dependent (FD), field neutral (FN) and field independent (FI), based on the Group Embedded Figure Test (GEFT) scores. Instruction was delivered by means of two types of sequence of lessons for CBCI in WEB, linear lesson (LL) and branching lesson (BL). A two-way analysis of covariance was used to investigate whether there are main effects and interactions between cognitive style of field dependence and lesson sequence types. In order to control statistical power and to equate the treatment groups, Nelson-Denny Reading Comprehension Test scores were used as a covariate. The analysis of regression coefficients between lesson sequence type and dependent variables and between field dependence and dependent variables was shown in tables. Although the findings show non-significance in formal tests of hypotheses, the interaction effects between field dependence and lesson sequence types on dependent measures were clarified. Four research questions converted to statistical hypotheses were tested according to the factorial design model. Specifically, the tests of hypotheses generated discussion and conclusions were given at the end of the study. Keywords: CBI Lesson sequence type, Field dependence, Computer based cooperative instruction, Web based learning INTRODUCTION In the past thirty-five years, computer-based instruction (CBI) has been in improving both learner performance and achievement with different instructional and learning environments (Alessi & Trollip, 1991, 2001; C. Kulik & Kulik, 1986; Ipek, 2001; J. Kulik & Kulik, 1987, 1991; J. A. Kulik, Kulik & Cohen, 1980; J. A. Kulik, Bangert & Williams, 1983). Instructional setting environments are defined such as cooperative, competitive, and individual setting (Johnson and Johnson, 1985; Malheiro, Morgado & Mendes, 2008; Slavin, 1980a, 1980b). In cooperative learning, students work together, the actions of each student affect the others in the group. Each student takes a mutual goal. Students in cooperative learning situations celebrate each other's successes, encourage each other to complete the assigned work, help each other, learn to work together regardless of individual differences. Recently, CBI process requires new instructional design links to learning for providing new ways in the development of instructional software or instructional courseware. The ways are delivering information, providing performance computation and including multimedia in the course (Schitai, 1998). As a new application or a part of multimedia, adaptive hypermedia (AH) has been used for web-based teaching and learning from its origins until nowadays. Aplications of AH for education will be described as individual guidance, adaptation in colloborative applications, adaptive asessment, vizualization, mobile learning and evaluation (Carro, 2008). The student characteristcs are important for adaptations in instruction and learning design process. One of the user characteristics can be defined in the cognitive style as field dependent, field neutral and field independent. Individual learning based on cognitive style can be prety effective, but it is well know that the involvement of students in cooperative activities contributes to knowledge acquisition which is related to learning skills and computer supported collaborative learning (Bravo, 2008; Carr, Lally, De Laat & Cox, 2006; Carro, 2008). Cooperative learning in CBI and Web-based instruction (WBI) provide some benefits for the students and schools. For example, new technologies, high equipment and material costs, limited access to computers for instruction in many schools, and the success of cooperative learning strategies in traditional classroom instruction have motivated researchers to examine the potential of cooperative computer-based instruction (CBI) (Rysavy & Sales, 1991). Learner-centered Web instruction can be used effectively for a teamwork in cooperative learning (Bonk & Reynolds, 1997; Grabe & Grabe, 2007; Morgado, Pereira & Mendes, 2008). In addition, a number of cooperative learning methods are available for Web. They are group investigation, project-based
TOJET: The Turkish Online Journal of Educational Technology – January 2010, volume 9 Issue 1
Copyright The Turkish Online Journal of Educational Technology 222
learning, problem-based learning, learning by design, partner activities, round tables and electronic conferences techniques (Bravo, 2008; Grabe & Grabe, 2007). All these cooperative learning techniques are available for the Web. Learning setting environments are dealing with learner's characteristics. For this reason, cooperative learning activities in CBI and Web based instruction have focused on achievement, ability, social interchange, motivation, attitudes and gender comparisons. The learning situation is based on cognitive styles and learning styles. The learner's cognitive style of field dependence indicates how, when, and what learners intent to learn.. The interaction between the levels of field dependence and sequencing strategies such as linear and branching lessons provide important cues to develop an effective CBI program, tasks, adaptation rules, adaptation capabilities of courses, learning strategies (Carro, 2008) and a lesson in WEB-Based Instruction (WBI) and multimedia and hypermedia in the delivery of CBI (Grabe & Grabe, 2007; Ipek, 2001). These limitations suggested that research was needed to investigate how learners in different cognitive style were affected from different CBI lesson sequences in a WEB site according to their reading, comprehension, and perception skills. To develop effective CBI lessons, we need to recognize basic factors and new links for WBI, and a lesson designer should be aware of evaluating instructional programs offered by WEB sites, and multimedia systems for the future software and instructional designers. This study may bring an acceptable contribution of lesson sequence segments and computer-supported cooperative learning for the future research, instructional and technological environments with new technologies. Types of Lesson Sequences in CBI The simplest type of lesson sequence in CBI programs is the linear sequence. This type of lesson sequence has one topic or concept for presenting information and then asking questions. All students go through the presentation and questions in this order (Alessi & Trollip, 1991; Grabe & Grabe, 2007; Ipek, 2001). In addition, hierarchical sequence, familiarity and difficulty sequence in a linear lesson design are determined by the author. In the linear form of instruction the learner is presented with instructional sequences consisting of text presentations, which are combined with different visuals, questions and feedback. Although there are several instructional structures and sequences, all learners follow same path and format (Grabe & Grabe, 2007; Ipek, 2001; Price, 1991). Linear lesson is a single sequence of instruction that is presented to all learners (Jonassen, 1988). Linear approach permits no choices and no remediation based on learning assessment (Price, 1991). Another type of sequence in CBI programs is the branching sequence. Branching is the technique for using different ways to learn any content in the program. There are different types of branching, such as forward branch, backward branch, and sideways branchs. In addition, learner-directed branching, review branching, single and multiple remediation branching may be used in CBI. The amount of branching in a CBI program is a continuous variable, ranging from occasional branch points to branching after every student response. Branching does not occur after every question, but it does occur frequently (Alessi & Trollip, 1991, 2001; Ipek, 2001). It also pretest the learner to see how much of the information to be presented in a given sequence is already known (Grabe & Grabe, 2007; Price, 1991). When we talk about branching lessons, amount of branching, criteria for branching and direction of branching should be mentioned. These functions occur based on individual performances, cumulative performance, or student choice. When we apply the rules for a WBI, it is necessary to make a decision about learner's performances and their cognitive style of fielddependence. Branching programs are more complex than linear programs but allow for greater individualization of instruction (Grabe & Grabe, 2007; Ipek, 2001). Cooperative Learning and Achievement In cooperative learning groups, group ability composition on achievement has been discussed to show advantages of cooperative settings over competitive or individual setting (Slavin, 1980a, 1980b, 1991, 1995, 1996; Webb, 1980a, 1980b; Sharon, 1980). The effectiveness of cooperative CBI has focused on achievement of students working cooperatively with different lesson sequence groups. Cooperative learning, as an instructional methodology, affects students’ needs and their achievements in heterogeneous groups. Because cooperative learning, as mentioned above, was constructed in order to develop learner performance between or within learning groups. Typically, cooperative learning groups consist of two to five students. They are mixed with respect to ability, cognitive style, learner style gender, and ethnic groups. Cooperative learning techniques are hardly new. Cooperative groups provide a way to include students with special needs and cooperation in CBI (Grabe & Grabe, 2007).
TOJET: The Turkish Online Journal of Educational Technology – January 2010, volume 9 Issue 1
Copyright The Turkish Online Journal of Educational Technology 223
Knowing the effects of CBI on student achievement provides benefits for adapting of instruction in different lesson type groups. The process provides us to develop effective instructional strategies for WBI or CBI program (Carro, 2008; Grabe & Grabe, 2007). In addition, effectiveness of CBCI deals with applying instructional methods, creating effective conditions, and considering the type of learning outcomes. These procedures are based on instructional design theories in order to conduct unique instructional strategies for CBI and WBI.(Grabe & Grabe, 2007). The WBI can be designed to ignore or develop cooperative learning. During this time, given an appropriate instructional design, learners in a small group working together to gain shared goals (Reeves & Reeves, 1997). Cooperative learning in colloborative systems can be worked as instructional method in the process and WBI process provides structures and interactions between learners and computer (Bravo, 2008; Carr et al.. 2006; Carro, 2008). The process gives learners instructional and social benefits for collaborative learning. Here, the WBI components and procedures were indicated and discussed effectively. The procedures on Web learning are also well discussed to create effective instructional Web sites and cooperative learning (Khan, 1997). In the last decade, the web instruction was released to use in our classroom as an instructional technology tool (Grabe & Grabe, 2007; Crossman, 1997). Today, the web has unique potential to create more creative learning environments for students and schools. Human Information Processing and Cognitive Styles One of the most important aspects of visual communication is perception. Perception deals with awareness of objects in learning environment. The human information processing in psychology provides a foundation for interface design. The human-computer interface is a communications channel between the user and the computer. The interface includes both physical and conceptual components. Physical components include input devices such as mice and touch panels; and output devices such as visual displays and sound. Conceptual components include selection methods such as menus or direct manipulation; and representation schemes such as screen layout and graphics/text mixed (Marchionini, 1991). For the information processing, (1) learners have a working memory limited to information, (2) learners must have their attention refreshed frequently, and (3) recalling information requires more cognitive effort than recognizing information. While working on the Web, the information processing procedures affect human performance for meaningful learning on the WEB. As a learner-centered web instruction, there are alternative strategies such as critical, creative and cooperative learning on the web (Clark & Mayer, 2003; Grabe & Grabe, 2007) In addition, there are several techniques for learning on the web. For example, creative thinking techniques indicate students’ willingness to take risks, broad interests, originality, artistic ability, problem finding, commitment to task, elaboration of ideas, and other group performances for creative people. Critical learning techniques provide students with selecting effective methods and ideas. Cooperative learning on the web provide students’ teamwork skills to develop ideal strategies for projects. As a result, with WBI processing, students have new learning partners and materials for discovering, producing, and synthesizing knowledge (Bonk & Reynolds, 1997; Mendes, Pereira, & Costa, 2008). Atkinson & Shiffrin (1968) developed a model for memory involving sensory store, short term memory (STM) and long term memory (LTM) which may be utilized to describe information processing in human-computer interaction. Visual sensory (perception), as a part of sensory store, in information processing provides structures and processes that support learning. When learners witness an event, it is likely that each learner will describe a somewhat different experience. Their responses are a result of their individual perceptions which are influenced by differences in gender, cognitive styles, social interactions, interests, achievements, learning styles, and abilities (Witkin, 1976). The individual differences in the ways in which information is organized and processed are known as cognitive styles. Messick (1976) identified more than 20 cognitive styles. This study will deal with only one style, field dependence. According to Messick (1976), the field independent person tends to articulate figures as discrete from their backgrounds and can more easily differentiate objects from the embedding context, whereas the field dependent person tends to experience events globally. Similarly, Jonassen (1989) indicated that the field dependent learner views information on the computer screen globally. Definitions of terms Cognitive Styles: Messick (1976) described cognitive styles as "information processing habits representing the learner's typical mode of perceiving, thinking, problem solving, and remembering" (p. 14). Moreover, "they are conceptualized as stable attitudes, preferences, or habitual strategies determining a person's typical modes of perceiving, remembering, thinking and problem solving" (Messick, 1976, P. 5). This study is concerned with the cognitive style of field dependence.
TOJET: The Turkish Online Journal of Educational Technology – January 2010, volume 9 Issue 1
Copyright The Turkish Online Journal of Educational Technology 224
Field Dependence (FD): According to Goodenough & Witkin (1977), field dependence is “the tendency to rely on external referents”, whereas field-independence is “the tendency to rely upon internal referents” (p. 189). Field dependence is marked by a propensity for making intuitive responses that are affected by contextual factors, without determining the relevance of these factors. For this study, field dependence levels were determined as field dependent (FD), field neutral (FN), and field independence (FI), based on GEFT scores. Students who achieved one-half standard deviation below the mean were classified as field dependent, and those in the middle were classified as field neutral (FN) (Dwyer & Moore, 1991, 1992, 1994; Ipek, 1995; Lee, 1994; Moore & Dwyer, 1991). Field Independence (FI) is marked by a propensity for distinguishing and coordinating items extracted from complex backgrounds that may be confusing to others. For this study, students who achieved one half standard deviation above the mean were considered to be field independent (FI). Linear Lesson (LL) is a single sequence of instruction that is presented to all learners (Jonassen, 1988). They follow same path in the instruction. Branching Lesson (BL) is the technique for moving from one place to another in the program or software applications (structure). Achievement: level of knowledge or skill assessed by individual pretest and posttest scores on a WBI lesson, reading comprehension and rate. Web-Based Instruction (WBI) is can be viewed as an innovative approach for delivering instruction to a remote audience, using the Web as the medium (Khan, 1997). RESEARCH METHODOLOGY Purpose: The purposes of this study are to determine if a main effect exists between variations in lesson sequence types on achievement in a WBI lesson, and on reading comprehension and reading rate scores. And if an interaction exists between lesson sequence types and cognitive style of field dependence (1) on achievement levels in a WBI lesson, (2) on reading comprehension and reading rate. Research Questions This study focuses on how to design a lesson sequence on the computer and WEB screen for providing contributions into the lesson sequence display in terms of learner characteristics and perception, and human computer interaction (HCI). The study determined the effects of lesson sequence approaches in CBI and cognitive style of field dependence on the dependent variables, the achievement on learning from a Computer-Based Cooperative Instruction (CBCI) in WEB, and reading abilities such as reading comprehension, reading rate. The research questions are:
1. Is there a significant main effect between lesson sequence type (linear lessons versus branching lessons) on achievement in a WEB-Based Instruction?
2. Is there a significant main effect between lesson sequence type (linear lessons versus branching lessons) on the reading comprehension scores?
3. Is there a significant interaction between lesson sequence type (linear lessons versus branching lessons) and the cognitive style of field dependence (FD) measured by achievement in a WEB-Based Instruction ?
4. Is there a significant interaction between lesson sequence type (linear lessons versus branching lessons) and the cognitive style of field dependence (FD) in terms of reading comprehension scores?
Research Design Procedures: This study utilizes a (2X3) ANCOVA factorial design. Each research question was analyzed by factorial experiments and correlations. To accomplish this, a design model was used to test hypotheses, without which the analysis may not be controlled between parameters. A two factor experimental research design was employed (Freed, Ryan & Hess, 1991). In this case, one factor is the treatment variable of lesson sequence types, which includes linear lesson (LL) and branching lesson (BL). The second factor is the level of cognitive style. The cognitive style levels were identified as field independent (high), field neutral-FN, and field dependent (low). Field dependence (low) is demonstrated by achieving scores
(low scores ( ( . )scores < −7 05Χ σ ) on the group embedded figure test, and field independence (high) is
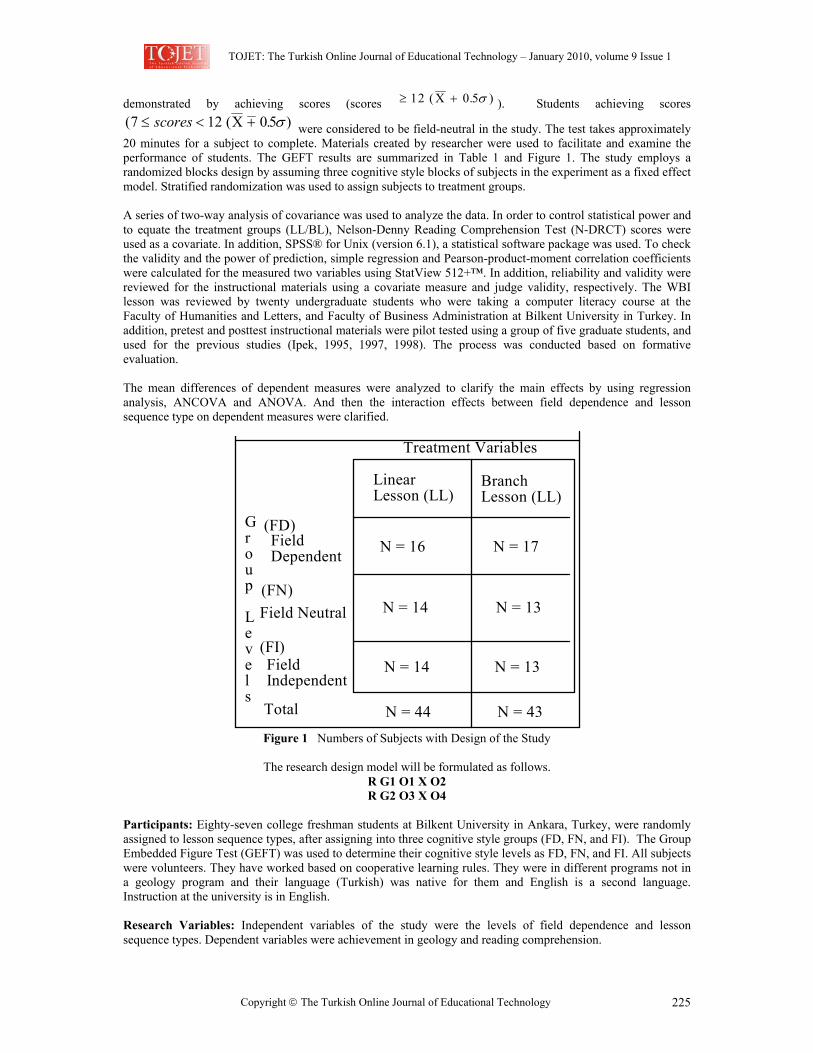
TOJET: The Turkish Online Journal of Educational Technology – January 2010, volume 9 Issue 1
Copyright The Turkish Online Journal of Educational Technology 225
demonstrated by achieving scores (scores ≥ +12 0 5( . )Χ σ ). Students achieving scores ( ( . )7 12 05≤ < +scores Χ σ were considered to be field-neutral in the study. The test takes approximately 20 minutes for a subject to complete. Materials created by researcher were used to facilitate and examine the performance of students. The GEFT results are summarized in Table 1 and Figure 1. The study employs a randomized blocks design by assuming three cognitive style blocks of subjects in the experiment as a fixed effect model. Stratified randomization was used to assign subjects to treatment groups. A series of two-way analysis of covariance was used to analyze the data. In order to control statistical power and to equate the treatment groups (LL/BL), Nelson-Denny Reading Comprehension Test (N-DRCT) scores were used as a covariate. In addition, SPSS® for Unix (version 6.1), a statistical software package was used. To check the validity and the power of prediction, simple regression and Pearson-product-moment correlation coefficients were calculated for the measured two variables using StatView 512+™. In addition, reliability and validity were reviewed for the instructional materials using a covariate measure and judge validity, respectively. The WBI lesson was reviewed by twenty undergraduate students who were taking a computer literacy course at the Faculty of Humanities and Letters, and Faculty of Business Administration at Bilkent University in Turkey. In addition, pretest and posttest instructional materials were pilot tested using a group of five graduate students, and used for the previous studies (Ipek, 1995, 1997, 1998). The process was conducted based on formative evaluation. The mean differences of dependent measures were analyzed to clarify the main effects by using regression analysis, ANCOVA and ANOVA. And then the interaction effects between field dependence and lesson sequence type on dependent measures were clarified.
Treatment Variables
LinearLesson (LL)
BranchLesson (LL)
Field Dependent
Field Independent
G r o u p L e v e l s
Field Neutral
N = 16 N = 17
N = 14 N = 13
N = 14 N = 13
Total
(FI)
(FD)
N = 44 N = 43
(FN)
Figure 1 Numbers of Subjects with Design of the Study
The research design model will be formulated as follows.
R G1 O1 X O2 R G2 O3 X O4
Participants: Eighty-seven college freshman students at Bilkent University in Ankara, Turkey, were randomly assigned to lesson sequence types, after assigning into three cognitive style groups (FD, FN, and FI). The Group Embedded Figure Test (GEFT) was used to determine their cognitive style levels as FD, FN, and FI. All subjects were volunteers. They have worked based on cooperative learning rules. They were in different programs not in a geology program and their language (Turkish) was native for them and English is a second language. Instruction at the university is in English. Research Variables: Independent variables of the study were the levels of field dependence and lesson sequence types. Dependent variables were achievement in geology and reading comprehension.
TOJET: The Turkish Online Journal of Educational Technology – January 2010, volume 9 Issue 1
Copyright The Turkish Online Journal of Educational Technology 226
Research Materials (Instruments) Group Embedded Figure Test (GEFT): This is a version of the Embedded Figures Test (EFT). It can be used for group administration to measure of FD students (Witkin, Oltman, Raskin, & Karp, 1971; Goldstein & Blackman, 1978). For this study, GEFT will be administered in a 20-minute testing session. The test contains three sections: the first section, which contains 7 simple items, and second and third sections, each of which contains 9 more difficult items. The reliability is r= .82. The validity with criterion variable has been found the range of .63 to .82. WBI Versions of Lessons: WBI versions of the linear (LL) and branching lessons (BL) were selected directly from the WEB site which are used to teaching fundamentals of geology course for students on the Internet. For this research, the unit in geology WEB includes three lessons covering the volcano, types of volcanoes, and volcanic eruptions. The WBI lesson which is named volcanoes at http: //volcano.und.nodak.edu/vw.html was used to teach volcanoes in the Internet. Based on this WEB site, directions for linear and branching lesson groups were given. To use the WEB site, the characteristics of linear and branching lessons were defined and distributed as a manual to learners and users to follow them during the WBI. Each lesson has subcategories to elaborate instruction menu. The WBI lessons were used to measure dependent variables and their effects for this study. Pretest: A pretest was given to determine the learner's experience in the fundamentals of geology. To provide additional support for this, learners’ backgrounds and experiences with related courses were used to ascertain their knowledge about the subject. The pretest and other criteria were used to control and eliminate these negative effects between treatment groups. The test consisted of ten items. These items are considered to test prior knowledge and incoming information about a text. As a result, the internal consistency reliability of the test was calculated by the KR-20 formula and reached this result: (rxy=.52). Reading Test: The Nelson-Denny Reading test (form E or F) (Brown, 1981) was administered to assess student reading comprehension and reading rate. Posttest: A posttest was used to define improvements and achievement levels in geology for text density in the CBI tutorial. Field dependent learners have different achievement scores in class, according to the literature. There is a factor that is defined such as text density levels. The posttest results were evaluated to define the effects of lesson sequence types in learning for field dependent learners. There were a number of indications for the content, text style, objectives, and cognitive effects in the instructional process. Additionally, the posttest questions were written and adapted from the test banks of fundamental geology textbooks for the general studies program. For this reason, test items for this study had high reliability and validity. KR-20 Internal consistency reliabilities of the total test were calculated. The reliability of the posttest was found to be rxy=.65. The total test consisted of 15 items. To prepare the posttest, the crosstabulation table was conducted in two dimensions for objectives and content. After writing objectives, the researcher decided how many test items were necessary to control for objectives reached for a text in Web. In accordance with the testing literature, each objective was examined by at least one or more test items to support lesson sequence types approach.
Table 1 □ Means and standard deviations on GEFT scores (n = 87) n Mean Std. Dev. Std. Error Min. Max. Sex male 30 11.4 5.4 .993 1 18 female 57 7.9 4.0 .535 3 18 LT LL 44 9.2 5.0 .747 1 18 BL 43 9.1 4.8 .724 1 18 FDI FD 33 4.3 1.7 .287 1 6 FN 27 8.9 1.5 .287 7 11 FI 27 15.3 1.7 .327 12 18 Data Gathering Procedures Learners were provided with either a linear lesson (LL) type or a branching lesson (HD) type presentation. A computer lab at Bilkent University was used to complete the study and gather information. Before beginning the lessons, participants were given the GEFT to define their cognitive styles. This test has a firm research base, is inexpensive, and is usable for group administration. Researchers have found high validity and reliability scores on the GEFT (Witkin et al., 1971). Participants were then randomly assigned to treatment groups, as seen in
TOJET: The Turkish Online Journal of Educational Technology – January 2010, volume 9 Issue 1
Copyright The Turkish Online Journal of Educational Technology 227
Figure 1. The pretest was administrated before presenting the Web lessons. The Web lessons were then presented and taught for an hour in a week at the computer lab using computers. The lesson time varied across participants. No time limitation was imposed for studying with either Web version. The reading comprehension tests were given to determine student reading comprehension and reading rates. Upon completion of the Web lessons, participants took an achievement test in the CBI tutorial. The computer program automatically recorded the scores of the posttest achievement on each multiple-choice item. Data Analysis The first step in analyzing the results of a factorial experiment is usually to gather complete descriptive statistics for a group representing each combination of factors. The mean score of the students on problems representing each of the four combinations (cells) of factors are shown. In addition, correlations between variables and treatment groups were calculated by the Pearson-product-moment correlation matrix. The next step in analyzing the results of this experiment was to perform an analysis of covariance (ANCOVA) and-using the Nelson-Denny Reading Comprehension Test (N-DRCT) score as a covariate-regression analysis to determine whether the differences between mean scores were statistically significant. If there were differences between at least two groups, according to F ratios, the t test was used to compare treatment groups. As a result, all null hypotheses were tested by F tests to consider the effectiveness or effects of independent variables on dependent variables in the study. Based on these considerations, a series of two-way analysis of covariance (ANCOVA) was used to test the mean differences of achievement, reading comprehension, reading rate, and lesson completion time for the cognitive style of field dependence (FD/FN/FI) and the lesson sequence types (LL/BL) as two independent factors. In order to control statistical power and to equate the treatment groups (LL/BL), the Nelson-Denny Reading Comprehension Test (N-DRCT) scores were used as a covariate. The correlation between the N-DRCT and achievement scores and the GEFT scores were used to interpret reading comprehension scores for predicting the scores of dependent variables and the effectiveness of independent variables on dependent variables. For the present study, all statistical analyses were done using a statistical package for Social Sciences (SPSS for Unix version 6.1) on the mainframe, at the Bilkent University Computer Center. To check the validity and the power of prediction, simple regression and Pearson-product-moment correlation coefficients were calculated for the two measured variables using StatView 512+™. In addition, reliability and validity were reviewed for the instructional materials using a covariate measure and judge validity, respectively. The mean differences of dependent measures were analyzed to clarify the main effects by using regression analysis, ANCOVA, and ANOVA. Next, the interaction effects between field dependence and lesson sequence types on dependent measures were clarified. The four research questions converted to statistical hypotheses were tested according to the factorial design model. Results and Findings The purpose of the study was to investigate the effects of lesson sequence type and the cognitive style of field dependence on learning from a Web site, based on the dependent measures of achievement, reading comprehension and reading rate. Materials created by the researcher were used to facilitate and examine the performance of students. The independent variables were the levels of cognitive styles (FD/FN/FI) and lesson sequence type (LL/BL). Table 2 presents the means and standard deviations achieved by students in the different treatment categories on the criterion measures such as pretest-posttest (gain) and reading comprehension. According to the results of the analysis, a Pearson correlation coefficient of .05 between N-DRCT and achievement test scores was obtained. The regression equation for relating the dependent variable is indicating a very low positive relationship between N-DRCT and achievement scores (rx = .17). The regression equation for relating pre-posttest difference (gaining) scores to the N-DRCT score is indicating a negative relationship between the gaining score and N-DRCT score (rx = -.05). The correlation is not meaningful enough to explain information for N-DRCT scores and GEFT scores. Because no interaction was found between factors, I preferred to compare relationships among variables using the posttest achievements of the Web geology site. The main effects can be interpreted directly. The regression equation for relating the N-DRCT and GEFT scores is indicating a positive relationship between N-DRCT and GEFT scores (rx = .29).
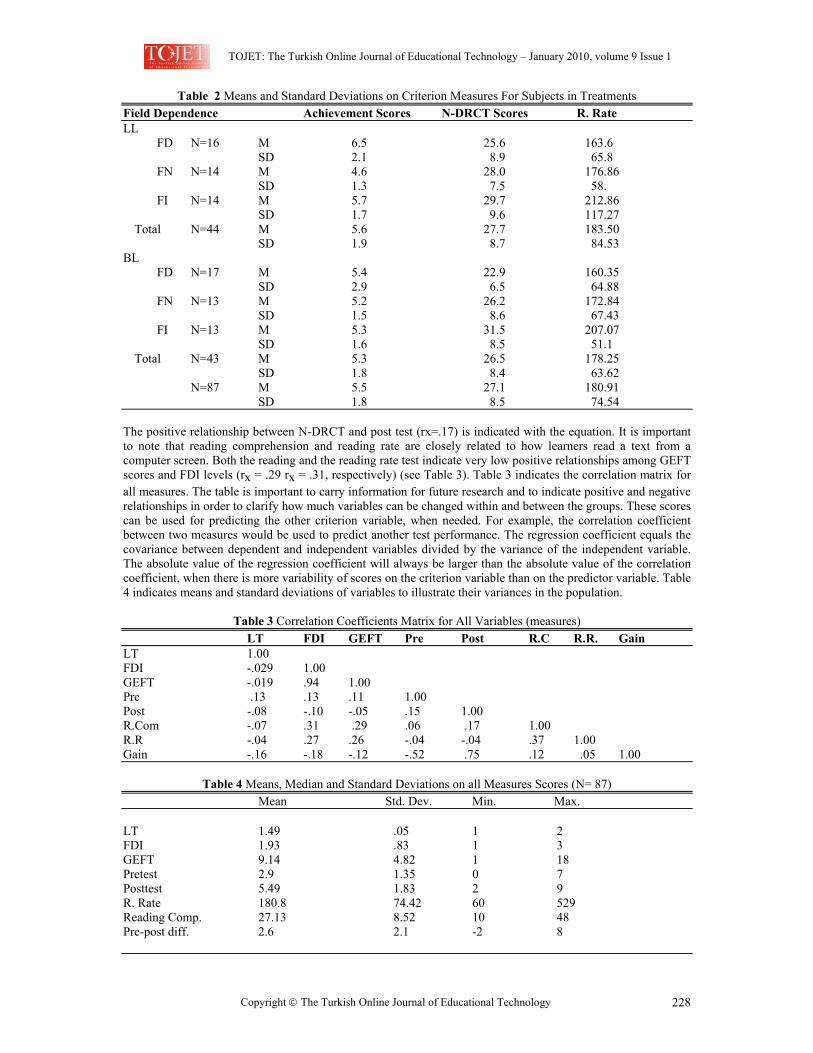
TOJET: The Turkish Online Journal of Educational Technology – January 2010, volume 9 Issue 1
Copyright The Turkish Online Journal of Educational Technology 228
Table 2 Means and Standard Deviations on Criterion Measures For Subjects in Treatments Field Dependence Achievement Scores N-DRCT Scores R. Rate LL FD N=16 M 6.5 25.6 163.6 SD 2.1 8.9 65.8 FN N=14 M 4.6 28.0 176.86 SD 1.3 7.5 58. FI N=14 M 5.7 29.7 212.86 SD 1.7 9.6 117.27 Total N=44 M 5.6 27.7 183.50 SD 1.9 8.7 84.53 BL FD N=17 M 5.4 22.9 160.35 SD 2.9 6.5 64.88 FN N=13 M 5.2 26.2 172.84 SD 1.5 8.6 67.43 FI N=13 M 5.3 31.5 207.07 SD 1.6 8.5 51.1 Total N=43 M 5.3 26.5 178.25 SD 1.8 8.4 63.62 N=87 M 5.5 27.1 180.91 SD 1.8 8.5 74.54 The positive relationship between N-DRCT and post test (rx=.17) is indicated with the equation. It is important to note that reading comprehension and reading rate are closely related to how learners read a text from a computer screen. Both the reading and the reading rate test indicate very low positive relationships among GEFT scores and FDI levels (rx = .29 rx = .31, respectively) (see Table 3). Table 3 indicates the correlation matrix for all measures. The table is important to carry information for future research and to indicate positive and negative relationships in order to clarify how much variables can be changed within and between the groups. These scores can be used for predicting the other criterion variable, when needed. For example, the correlation coefficient between two measures would be used to predict another test performance. The regression coefficient equals the covariance between dependent and independent variables divided by the variance of the independent variable. The absolute value of the regression coefficient will always be larger than the absolute value of the correlation coefficient, when there is more variability of scores on the criterion variable than on the predictor variable. Table 4 indicates means and standard deviations of variables to illustrate their variances in the population.
Table 3 Correlation Coefficients Matrix for All Variables (measures) LT FDI GEFT Pre Post R.C R.R. Gain LT 1.00 FDI -.029 1.00 GEFT -.019 .94 1.00 Pre .13 .13 .11 1.00 Post -.08 -.10 -.05 .15 1.00 R.Com -.07 .31 .29 .06 .17 1.00 R.R -.04 .27 .26 -.04 -.04 .37 1.00 Gain -.16 -.18 -.12 -.52 .75 .12 .05 1.00
Table 4 Means, Median and Standard Deviations on all Measures Scores (N= 87)
Mean Std. Dev. Min. Max. LT 1.49 .05 1 2 FDI 1.93 .83 1 3 GEFT 9.14 4.82 1 18 Pretest 2.9 1.35 0 7 Posttest 5.49 1.83 2 9 R. Rate 180.8 74.42 60 529 Reading Comp. 27.13 8.52 10 48 Pre-post diff. 2.6 2.1 -2 8
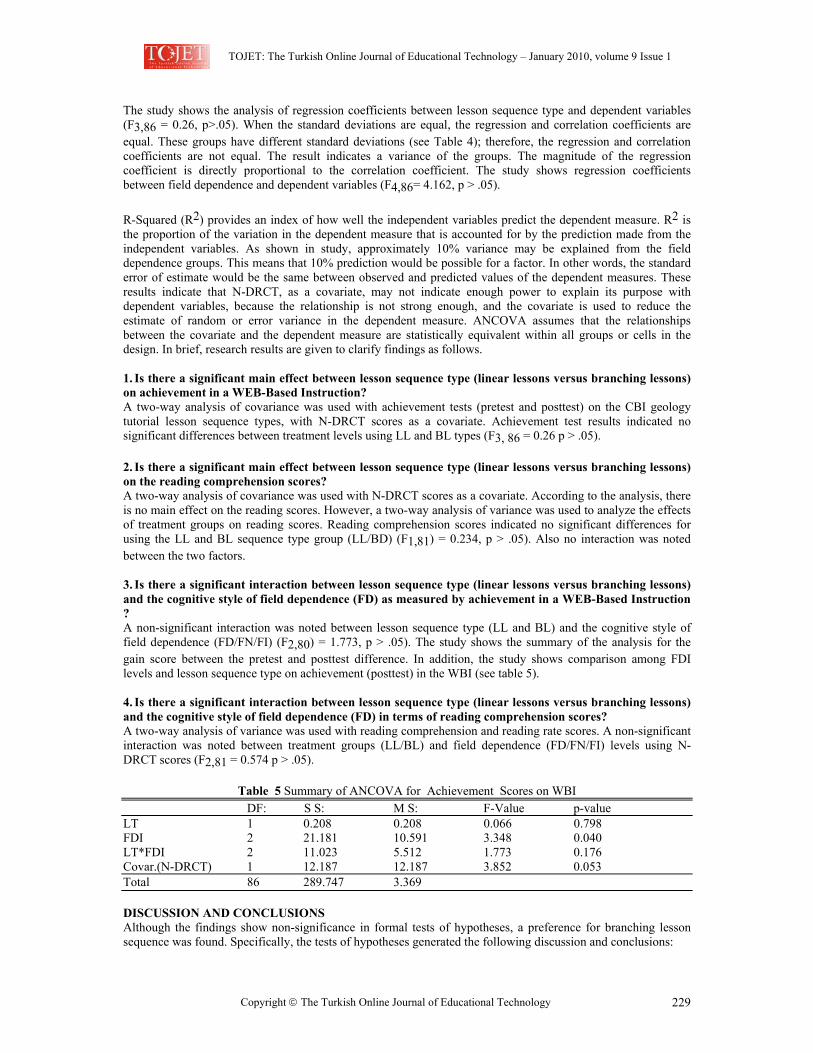
TOJET: The Turkish Online Journal of Educational Technology – January 2010, volume 9 Issue 1
Copyright The Turkish Online Journal of Educational Technology 229
The study shows the analysis of regression coefficients between lesson sequence type and dependent variables (F3,86 = 0.26, p>.05). When the standard deviations are equal, the regression and correlation coefficients are equal. These groups have different standard deviations (see Table 4); therefore, the regression and correlation coefficients are not equal. The result indicates a variance of the groups. The magnitude of the regression coefficient is directly proportional to the correlation coefficient. The study shows regression coefficients between field dependence and dependent variables (F4,86= 4.162, p > .05). R-Squared (R2) provides an index of how well the independent variables predict the dependent measure. R2 is the proportion of the variation in the dependent measure that is accounted for by the prediction made from the independent variables. As shown in study, approximately 10% variance may be explained from the field dependence groups. This means that 10% prediction would be possible for a factor. In other words, the standard error of estimate would be the same between observed and predicted values of the dependent measures. These results indicate that N-DRCT, as a covariate, may not indicate enough power to explain its purpose with dependent variables, because the relationship is not strong enough, and the covariate is used to reduce the estimate of random or error variance in the dependent measure. ANCOVA assumes that the relationships between the covariate and the dependent measure are statistically equivalent within all groups or cells in the design. In brief, research results are given to clarify findings as follows. 1. Is there a significant main effect between lesson sequence type (linear lessons versus branching lessons) on achievement in a WEB-Based Instruction? A two-way analysis of covariance was used with achievement tests (pretest and posttest) on the CBI geology tutorial lesson sequence types, with N-DRCT scores as a covariate. Achievement test results indicated no significant differences between treatment levels using LL and BL types (F3, 86 = 0.26 p > .05). 2. Is there a significant main effect between lesson sequence type (linear lessons versus branching lessons) on the reading comprehension scores? A two-way analysis of covariance was used with N-DRCT scores as a covariate. According to the analysis, there is no main effect on the reading scores. However, a two-way analysis of variance was used to analyze the effects of treatment groups on reading scores. Reading comprehension scores indicated no significant differences for using the LL and BL sequence type group (LL/BD) (F1,81) = 0.234, p > .05). Also no interaction was noted between the two factors. 3. Is there a significant interaction between lesson sequence type (linear lessons versus branching lessons) and the cognitive style of field dependence (FD) as measured by achievement in a WEB-Based Instruction ? A non-significant interaction was noted between lesson sequence type (LL and BL) and the cognitive style of field dependence (FD/FN/FI) (F2,80) = 1.773, p > .05). The study shows the summary of the analysis for the gain score between the pretest and posttest difference. In addition, the study shows comparison among FDI levels and lesson sequence type on achievement (posttest) in the WBI (see table 5). 4. Is there a significant interaction between lesson sequence type (linear lessons versus branching lessons) and the cognitive style of field dependence (FD) in terms of reading comprehension scores? A two-way analysis of variance was used with reading comprehension and reading rate scores. A non-significant interaction was noted between treatment groups (LL/BL) and field dependence (FD/FN/FI) levels using N-DRCT scores (F2,81 = 0.574 p > .05).
Table 5 Summary of ANCOVA for Achievement Scores on WBI DF: S S: M S: F-Value p-value LT 1 0.208 0.208 0.066 0.798 FDI 2 21.181 10.591 3.348 0.040 LT*FDI 2 11.023 5.512 1.773 0.176 Covar.(N-DRCT) 1 12.187 12.187 3.852 0.053 Total 86 289.747 3.369 DISCUSSION AND CONCLUSIONS Although the findings show non-significance in formal tests of hypotheses, a preference for branching lesson sequence was found. Specifically, the tests of hypotheses generated the following discussion and conclusions:
TOJET: The Turkish Online Journal of Educational Technology – January 2010, volume 9 Issue 1
Copyright The Turkish Online Journal of Educational Technology 230
1. No significant differences occurred between students receiving the different lesson sequence type (LL and BL) on the achievement and learning scores from the WBI. The values for LL students ( Χ = 5.64 Std Dev. = 1.90 and BL students ( Χ = 5.34 Std. Dev. = 1.77) are without significance. Participants displayed preferences while working. Movement within the WBI screens is different and is based on learners' experiences in using computer and technology. Branching lesson type (BL) takes more time and effort than linear lesson type (LL) in WBI. The finding indicates that we needed research to indicate preferences for the variations of lesson sequence levels in the CBI tutorial and CBI lessons on the Web system. It is important to note that subjects' learning achievement, defined as a pretest and posttest difference score, shows some learning from the Web geology instruction although no significant main effect is indicated statistically. Results, according to descriptive statistics, indicate meaningful relationships in perceptual processes for the learners (see for the correlation matrix). For instance, human factors such as simplicity, student-computer dialogue, social amenities, spaciousness and relevance (Rambally & Rambally, 1987), and experience using computers seem to be important factors for recognizing students' learning in CBCI and WBI lessons (Bang & Dalsgard, 2006; Grabe & Grabe, 2007, Sorensen & Ó Murchú, 2006).
On the achievement test, students using LL sequence type ( Χ = 5.64) achieved scores close to those of students using BL text type ( Χ = 5.34). These results indicate that there are no significant differences between two lesson sequence types. This present study is consistent with the previous reviews of the literature. In other situations, because of a lack of main effects and interaction, the achievement score (posttest) in the WBI was taken as a criterion measure to compare the effectiveness of the mean values of dependent measures. Gain score, learning from CBCI in WEB, indicates same result as well as achievement (post) score. It would be possible that the majority of students prefers to work with branching sequence lessons based on a lack of their computer experience and reading globally. A lack of computer experience may cause loss of attention and recognition for the lesson when subjects use WBI and technology. Visual movement for variations of text density levels would be complex in human information processing as a perception and human memory system. The situation in this study considers experience in computer use, in that all classes of subjects were taking their first technology and computer applications course at the university at the same time. That reason suggests a problem from one perspective in that receiving BL students focused on the WBI lessons for learning better than receiving LL students. 2. Reading comprehension from the computer screen was expected to be theoretically different for the cognitive styles and lesson sequence types. As indicated by Baker & Anderson (1982) and Garner & Reis (1981) comprehension may be related to cognitive style. Cognitive styles have predictive power to delineate comprehension abilities (Pitts & Thompson, 1984). For example, monitoring abilities such as schema-familiar and schema-unfamiliar text may have important implications for instruction and for the development of WBI computer screen (Pitts & Thompson, 1984). Moreover, as indicated by Spiro & Tirre (1980), field dependent students do not use prior knowledge as efficiently as do field independent students. There was no significant main effect between lesson sequence types on reading comprehension scores, monitoring and operating abilities for successful reading from the computer screen in WBI. If students have difficulties with application of general rules for screen interface, they may not display high scores in their WBI lessons. From the correlation matrix, the negative relationship between lesson sequence types and reading comprehension scores was shown (r = -.07). As shown in the findings, however, both LL and BL lesson sequence types, relative to reading scores, were not found to be significantly different in reading comprehension (F1,86= 0.375, p> .05). However, a correlation between GEFT and reading comprehension was indicated (r = .29). The low correlation would be based on a lack of reading comprehension because of students' second language. For this reason, the situation does not indicate expected findings. It was assumed that FI learning style is better than others at the college education. As noted previously from the literature FI students gained higher scores than FD and FN students (Dwyer & Moore, 1991, 1992, 1994; Ipek, 1995, Ipek, 1997, 1998; Ipek & Bayram, 1996; Lee, 1994; Moore & Bedient, 1986; Moore & Dwyer, 1991). A non-significant interaction was noted between lesson sequence types and field dependence on achievement in a WBI geology lesson. It would be possible to see an interaction between two factors working with a large sample and a different content area, grade, and providing visual attention for the students (Grabe & Grabe, 2007; Henderson, 1992; Kintsch, 1980).
TOJET: The Turkish Online Journal of Educational Technology – January 2010, volume 9 Issue 1
Copyright The Turkish Online Journal of Educational Technology 231
Further investigation of the various lesson sequence levels in WBI development and applications should be performed to review mean differences and their distributions for the effective screen design and cooperative learning strategies. The study was limited to investigating only two types of lesson sequence and levels. We need a clear definition of the lesson sequence strategies and their preferred styles for using WBI and Web design. The performance provides strategies for how perceptual behaviors, cognitive, and technological factors effectively support to create an instructionally effective WBI screen design with various lesson sequences. There was still lack of experimental information to support and clarify the effects of cognitive styles by means of perception, cognition and learners characteristics. We need to know how lesson sequence types may be able to effect teaching and learning processes for the different grades, levels, and disability learners according to their cognitive style of field dependence. Second, human characteristics such as intelligence, cognitive styles and interests, interface design, and a combination of the effects of designer, user, and system should be checked to develop effective instructional strategies in CBCI in Web (Carr et al., 2006; Carro, 2008; Eysenck, 1993; Grabe & Grabe, 2007; Kintsch, 1980; Rayner, 1992; Reinking, 1988). Further research should focus on variations of lesson sequence strategies and cognitive styles in psychological foundations that combine the effects of learners characteristics, technological factors and instructional design systems to achieve high scores with success in our classrooms via WBI. 3. In the present study, no significant interaction was observed between cognitive style of field dependence and lesson sequence types on the reading comprehension scores. However, it was expected that instructional conditions with visual effects would have been affected by level of study, reading speed, reading comprehension and students' performance. There are significant differences in treatment of both LL and BL. There is no significance on the reading test separately. Notably, there is no interaction between the two main factors. However, reading comprehension scores for both lesson sequence type (LL/BL) were found to be no significant. Both reading comprehension abilities and perceptions to find a hidden figure may be related to the effects of eye-movement. We must combine technical, language, contextual, and programming factors to influence a learner's ability of perception, learning, and memory. We must see and understand the message to learn from it (Petterson, 1989). All processes may be presented as a perceptual cycle (Gale, 1993; Grabinger & Amedeo, 1988; Neisser, 1976; Woods, 1984). In addition, FI learners achieved higher reading scores than FD/FN learners in treatments and field dependence levels (LL/FI, BL/FI). It is considered to be a result of the distribution of subjects in the each category. For the LL/BL category, the high min and max scores were observed and the findings indicate reading abilities and perceptual processing for the each level on the two factors. Recommendations for future reseach Previous research results consistently showed field independent students scored significantly higher than field dependent students in similar treatment groups. As noted in previous chapters, field dependence is a continuum between two ends (Dwyer & Moore 1991; 1992; 1994; Moore & Dwyer, 1991; Oltman, 1968). On one end of the continuum, field dependence levels represent different perceptions for creating schema, information and sample by human visual sense. The result of this study showed no significant differences among FDI groups on dependent measures, achievement in WBI, reading comprehension, and reading rate in WBI. There were no significant main effects for the main factors according to Analysis of Covariance (ANCOVA). However, the study found out there was no significant difference on reading comprehension scores using two-way variance analysis (ANOVA) among field dependence levels and lesson types. The result of this study shows there are no significant interactions between factors on dependent measures, achievement on the Web, reading comprehension scores, and reading rate in Web lessons. To develop lesson sequence strategies and types on the CBI or WBI design, we need clear definition and international agreement for creating user friendly interface design which is based on social and international issues. In addition, human factors in the future software and WEB design should be defined to create new information techniques for presenting in content learning. For this reason, software designers and instructional designers should be aware of differences among learners based on cognitive effects and technological effects to avoid making more mistakes in CBI programs and WEB screens. As a result, this study may provide considerations for field dependence levels and lesson sequence strategies in the WEB lesson design and CBI lesson design strategies. Lesson sequence design approaches on the computer screen design or Computer-Based Cooperative Instruction (CBCI) systems in WEB design may be important considerations for field dependence, and learning from a WEB program. The study may provide a linking or an interaction for using WEB systems in instructional design process with multimedia lesson design systems for cooperative learning.
TOJET: The Turkish Online Journal of Educational Technology – January 2010, volume 9 Issue 1
Copyright The Turkish Online Journal of Educational Technology 232
Summary of the Study This study investigated the effectiveness of variations of lesson sequence types and cognitive style of field dependence on the dependent variables, the achievement on learning from WBI program, and N-DRCT scores which includes reading rate of college students at the undergraduate levels. Eighty-seven college freshman students were randomly assigned to the lesson sequence type, after being assigned into three cognitive style groups (FD, FN, and FI). The GEFT was used to determine their cognitive style levels as FD, FN, and FI. cognitive style levels were set as fixed effect factor levels. Treatment groups called linear lesson (LL) and branching lesson (BL) were set as random effect factor levels. With this design, the research analysis was completed according to a fixed effects model of ANOVA and ANCOVA. The study employed a randomized blocks design by assuming three cognitive style blocks of subjects in the experiment as a fixed effect model. The independent variables (two factors) for the study were the use of lesson sequence types and cognitive style. The reading comprehension scores of the N-DRCT (The Nelson-Denny Reading Comprehension Test) were used as a covariate. Reading scores in computer screen design studies were indicated as a powerful prediction for the students' performance of novice and experienced learners. There was a positive relationship between students' reading scores and GEFT scores and FDI levels, respectively (r= .29; r = .31). The mean differences of dependent measures were analyzed to clarify the main effects by using regression analysis, ANCOVA, and ANOVA. For the prediction model, no interaction parameters for factorial design were checked because of lack of interaction between two factors. Research analysis was done based on these assumptions in a model. REFERENCES Alessi, S. M., & Trollip, S. R. (1991). Computer-based instruction: methods and development. Englewood
Cliffs, NJ: Prentice-Hall, Inc. Alessi, S. M., & Trollip, S. R. (2001). Multimedia for learning: methods and development. (2nd Ed.) Boston:
Allyn and Bacon. Atkinson, R. C. & Shiffrin, R. M. (1968). Human memory: A proposed system and its control processes. In K.
W. Spence & J. T. Spence (Eds.) The Psychology of Learning and Motivation, London: Academic Press. Baker, L., & Anderson, R. I. (1982). Effects of inconsistent information on test processing: Evidence for
comprehension monitoring. Reading Research Quarterly, 17, 281-294. Bang, J. & Dalsgard, C. (2006). Rethinking E-learning shifting the focus to learning activities. In E. K. Sorensen,
& D. Ó Murchú (Eds.). Enhancing Learning Through Technology, London, UK: Information Science Publishing.
Bonk, C. J. & Reynolds, T. H. (1997). Learner-centered web instruction for higher-order thinking, Teamwork and Apprenticeship. In B. H. Khan (Ed.) Web-Based Instruction. Englewood Cliffs, NJ: Educational Technology Publications, Inc.
Bravo, C. (2008). Protocols of coordination and structured communication in synchronous CSCL environments. In A. J. Mendes, I. Pereira, & R. Costa (Eds.). Computers in Education: Towards Educational Change and Innovation. UK; Springer-Verlag London Limited.
Brown, J. I. (1981). Examiner's Manual: The Nelson-Denny Reading Test. Chicago, IL: The Riverside Publishing Company.
Carr, T., Lally, V., De Laat, & Cox. G. (2006). Computer-supported collaborative learning and central research questions: Two illustrative vignettes, In E. K. Sorensen, & D. Ó Murchú (Eds.). Enhancing Learning Through Technology, London, UK: Information Science Publishing.
Carro, R. M. (2008). Applications of adaptive hypermedia in education. In A. J. Mendes, I. Pereira, & R. Costa (Eds.). Computers in Education: Towards Educational Change and Innovation. UK; Springer-Verlag London Limited.
Clark, R. C. & Mayer, R. E. (2003). E-learning and the science of instruction: proven guidelines for consumers and designers of multimedia learning. San Francisco, CA: Pfeiffer.
Crossman, D. M. (1997). The evolution of the world wide web as an emerging instructional tool. In B. H. Khan (Ed.) Web-Based Instruction. Englewood Cliffs, NJ: Educational Technology Publications, Inc.
Dwyer, F. M., & Moore, D. M. (1991). Effect of color coding on visually oriented tests with students of different cognitive styles. The Journal of Psychology, 125(6), 677-680.
Dwyer, F. M., & Moore, D. M. (1992). Effect of color coding on visually and verbally oriented and tests with students of different field dependence levels. Journal of Educational Technology Systems, 20(4), 311-320.
Dwyer, F. M., & Moore, D. M. (1994). Effect of color coding and test type (visual/verbal) on students identified as possessing different field dependence levels. Paper presented at the International Visual Literacy Association Annual Meeting, Tempe, AZ.
Eysenck, M. W. (1993). Principles of cognitive psychology. Hillsdale: Lawrence Erlbaum Associates Ltd., Publishers.
TOJET: The Turkish Online Journal of Educational Technology – January 2010, volume 9 Issue 1
Copyright The Turkish Online Journal of Educational Technology 233
Freed. M. N., Ryan, J. M. & Hess, R. K. (1991). Handbook of statistical procedures and their computer applications to education and the behavioral sciences. New York: American Council on Education and Macmillan Publishing, Inc.
Gale, A. G. (1993). Human response to visual stimuli. In W. R. Hendee & P. N. T. Wells (Eds.), The Perception of Visual Information. (pp. 115-133). Springer-Verlag New York, Inc.
Garner, R., & Reis, R. (1981). Monitoring and resolving comprehension obstacles: An investigation of spontaneous text look backs among upper-grade good and poor comprehenders. Reading Research Quarterly, 16, 569-582.
Goldstein, K. M. & Blackman, S. (1978). Cognitive styles: five approaches and relevant research. New York: Wiley, Inc.
Goodenough, D. K. & Witkin, H. A. (1977). Origins of the field-dependent and field-independent cognitive styles. Educational Testing Services, Princeton, New Jersey, July. (ERIC Documentation Reproduction Service No. ED 150155).
Grabe, M..& Grabe, C. (2007). Integrating technology for meaningful learning. Boston, MA: Houghton Mifflin Company. Grabinger, R. S. & Amedeo, D. (1988). CRT text layout: perceptions of viewers. Computers in Human
Behavior. 4, 189-205. Henderson, J. M. (1992). Visual attention and eye movement control during reading and picture viewing. In K.
Rayner (Ed.), Eye movements and visual cognition: Scene perception and reading (pp. 260-283). New York: Springer-Verlag, Inc.
Ipek, I. (1995). The Effects of window presentation type and field dependence on learning from a CBI geology tutorial, Dissertations Abstracts International,(University Microfilms No. UMI DAO 72699)
Ipek. I. (1997, October). Considerations for CBI screen design with respect to field dependence and computer window presentation type. Paper presented at the annual meeting of International Visual Literacy Association, University Park, PA.
Ipek, I. (1998, February). The effects of text density levels and cognitive style of field dependence on learning from a CBI tutorial. Paper presented at the meeting of Association for Educational Communications and Technology, St. Louis, Missouri.
Ipek, I. (2001). Bilgisayarla öğretim: Tasarım, geliştirme ve yöntemler (Computer-Based Instruction: Design, development and methods). (Pelikan) Tıp-Teknik Kitapcılık Ltd. Sti. Ankara, Turkey.
Ipek, I. & Bayram, S. (1996, February). The effectiveness of window presentation type and cognitive style of field dependence on learning from a CBI tutorial. Paper presented at the meeting of Association for Educational Communications and Technology, Indianapolis, IN. USA.
Johnson, D. W & Johnson, R. T. (1985, October). Cooperative learning: one key to computer assisted learning, The Computer Teacher. 11-15.
Jonassen, D. H. (1985). Interactive lesson design: A taxonomy, Educational Technology, 25(6), 7-17. Jonassen, D. H . (Ed.). (1988). Instructional designs for microcomputer courseware. Hillsdale, New Jersey:
Lawrence Erlbaum Associates, Inc. Jonassen, D. H. (1989). Functions, Applications, and Design guidelines for multiple window environments.
Computers in Human Behavior. 5, 185-194. Khan, B. H. (1997) Web-Based Instruction (WBI): What Is It and Why Is It? In B. H. Khan (Ed.) Web-Based
Instruction. Englewood Cliffs, NJ: Educational Technology Publications, Inc. Kintsch, W. (1980). Learning from text, levels of comprehension, or: Why anyone would read a story anyway.
Poetics, 9, 87-98. Kulik, C.,& Kulik, J. (1986).Effectiveness of computer-based education in colleges, Association for Educational
Data Systems Journal, 19, 81-108. Kulik, J. , & Kulik, C. (1987). Review of recent research literature on computer-based instruction.
Contemporary Educational Psychology, 12, 222-230. Kulik, J. , & Kulik, C. (1991). Effectiveness of CBI: An updated analysis. Computers in Human Behaviors, 7,
75-94. Kulik, J. A. , Bangert, R. L. & Williams, G. W. (1983). Effects of computer-based teaching on secondary school
students. Journal of Educational Psychology, 75(1), 19-26. Kulik, J. A., Kulik, C. C. , & Cohen, P. A. (1980). Effectiveness of computer-based college teaching: a meta-
analysis of findings. Review of Educational Research, 50(4), 525-544. Lee, C. H. (1994). The effects of auditory cues in interactive multimedia and cognitive style on reading skills of
third graders. Unpublished doctoral dissertation, University of Pittsburgh, Pittsburgh, PA. Malheiro, S., Morgado, L. & Mendes, A.Q. (2008). Analysis of engaged online coloborative discourse: A
methodological approach. In A. J. Mendes, I. Pereira, & R. Costa (Eds.). Computers in Education: Towards Educational Change And Innovation. UK; Springer-Verlag London Limited.
TOJET: The Turkish Online Journal of Educational Technology – January 2010, volume 9 Issue 1
Copyright The Turkish Online Journal of Educational Technology 234
Marchionini, G. (1991). Psychological Dimensions of User-Computer Interfaces. ERIC Clearinghouse on Information Resources, Syracuse, NY: (ERIC Documentation Reproduction Service No. ED 337 203)
Mendes, A. J., Pereira, I. & Costa, R. (Eds.) (2008). Computers in education: Towards educational change and innovation. UK; Springer-Verlag London Limited.
Messick, S. (1976). Personality Consistencies in cognition and creativity. In S. Messick and Associates. Individuality in Learning. Jossey-Bass., Inc. Publishers, San Francisco, CA. 94111.
Moore, D. M., & Bedient, D. (1986). Effects of presentation mode and visual characteristics on cognitive style. Journal of Instructional Psychology, 13, 19-24.
Morgado, L., Pereira, A., & Mendes, A. Q. (2008). The contract as a pedagogical tool in e-learning. In A. J. Mendes, I. Pereira, & R. Costa (Eds.). Computers in Education: Towards Educational Change And Innovation. UK; Springer-Verlag London Limited.
Moore, D. M., & Dwyer, F. M. (1991). Effect of color coded information on students' levels of field dependence. Perceptual and Motor Skills, 72, 611-616
Neisser, U. (1976). Cognition and Reality: Principles and implications of cognitive psychology. San Francisco : W. H. Freeman, p. 230.
Oltman, P. K. (1968). A portable rod-and-frame apparatus. Perceptual and Motor Skills, 26, 503-506. Pettersson, R. (1989). Visuals for information: research and practice. Englewood Cliffs, New Jersey:
Educational Technology Publications, Inc. Pitts, M. M. & Thompson, B. (1984). Cognitive style as mediating variables inferential comprehension. Reading
Research Quarterly, 29(4), 426. Price, R. V. (1991). Computer-aided instruction: a guide for authors. Belmont, CA: Wasworth, Inc. Rambally, G. K. & Rambally, R. S. (1987). Human factors in CAI design, Computer Education. 11(2), 149-153. Rayner, K. (1992). Eye movements and visual cognition: Introduction. In K. Rayner (Ed.), Eye Movements and
Visual Cognition: Scene Perception and Reading (pp.1-7). New York: Springer-Verlag, Inc. Reeves, T. C. & Reeves, P. M. (1997). Effective Dimentions of Interactive Learning on the World Wide Web. In
B. H. Khan (Ed.) Web-Based Instruction. Englewood Cliffs, NJ: Educational Technology Publications, Inc.
Reinking, D. (1988, Fall). Computer-mediated text and comprehension differences: The role of reading time, reader preference, and estimation of learning. Reading Research Quarterly, 23(4), 484-498.
Rysavy, S. D. M. & Sales, G. C. (1991). Cooperative learning in computer based instruction, Educational Technology Research and Development. 39(2), 70-79.
Schitai, A. (1998). Educational courseware: Instructional design links to learning. Online Journal of Distance Learning Administration, State University of West Georgia, Distance Education, Vol. 1, IV, Winter, 1998. Retrieved August 27, 2009, from http://www.westga.edu/~distance/schitai14.html.
Sharon, S. (1980). Cooperative learning in small groups recent methods and effects on achievement, attitudes and ethnic relations, Review of Educational Research. 50, 241-272.
Slavin, R. E. (1980a). Cooperative learning in teams: state of the art. Educational Psychologist. 15(2). 93-11. Slavin, R. E. (1980b). Cooperative learning, Review of Educational Research, 50, 315-342. Slavin, R.. (1991). Student team learning: A prectical guide to cooperative learning (3rd ed.). Washington, DC:
National Education Association. Slavin, R.. (1995). Cooperative learning: Theory, research, and practice (2nd ed.). New York: Merrill. Slavin, R. (1996). Research on cooperative leraning and achievement. Contemporary Educational Psychology,
21(1), 43-69. Sorensen, E. K. & Ó Murchú, D. (Eds.). (2006) Enhancing learning through technology, London, UK:
Information Science Publishing. Spiro, R. J. & Tirre, W. C. (1980). Individual differences in schema utilization during discourse processing.
Journal of Educational Psychology, 72, 204-208. Webb, N. M. (1980a). A process-outcome analysis of learning in group and individual settings, Educational
Psychologist, 74(4), 475-484. Webb, N. M. (1980b). An analysis of group interaction and mathematical errors in heterogeneous ability groups,
British Journal of Educational Psychology. 50, 1-11. Witkin, H. A. (1976) Cognitive styles and teaching. In S. Messick and Associates. Individuality in Learning.
Jossey-Bass, Inc., Publishers San Francisco, CA. 94111 Witkin, H. A., Oltman, E., Raskin, D., & Karp, S. A. (1971). A manual for the embedded figures test. Palo Alto,
CA: Consulting Psychologist Press. Woods, D. D. (1984). Visual momentum: a concept to improve the cognitive coupling of person and computer.
International Journal Man-Machine Studies, 21, 229-244.
TOJET: The Turkish Online Journal of Educational Technology – January 2010, volume 9 Issue 1
Copyright The Turkish Online Journal of Educational Technology 235
TURKISH UNIVERSITY STUDENTS’ TECHNOLOGY USE PROFILES AND THEIR THOUGHTS ABOUT DISTANCE EDUCATION
Bahar BARAN,
Dokuz Eylul University, İzmir, Turkey bahar.baran (at) deu.edu.tr
Eylem KİLİC,
Middle East Technical University, Ankara, Turkey ekilic (at) metu.edu.tr
Aysegul BAKAR ÇÖREZ,
Middle East Technical University, Ankara, Turkey abakar (at) metu.edu.tr
Kursat CAGİLTAY
Middle East Technical University, Ankara, Turkey ekilic (at) metu.edu.tr
ABSTRACT This study presents the results of a survey implemented to investigate Turkish university students’ technology use profile and their thoughts about distance education. The sample of the study is 6504 students from four universities in Turkey. The results of the study are reported in five main sections: 1) demographic information of the students, 2) students’ Internet and computer-use opportunities, 3) students’ computer skills, 4) studying styles of the students, and 5) thoughts concerning Internet-based distance education. The results of this study show that 38% of the students have home computer with an Internet connection, and 64%, 53%, and 30% of the students connect to the Internet for communication, newsgroups, and web searches, respectively. In addition, the findings show that the students prefer to access the Internet from either Internet cafes or their homes. Blended learning is the most favorite learning environment among these students. Keywords: distance education, computer ownership, technology use survey.
INTRODUCTION Distance education can be defined as a type of education in which learners and the instructor are apart from each other in terms of time and place (Gunawardena, 2003). In addition, Simonson, Smaldino, Albright and Zvacek (2009) use the term “intellectual distance” in order to define distance education environments (p.9). They also state that new and innovative technologies change the definition of distance education. Early applications of distance education programs included correspondence courses, in which a long period of time was required for the learners and instructor to interact. Recent developments in technology have allowed Internet technologies to be applied to conventional courses in higher education. Accordingly, many higher education institutions have increased the number of their students by providing distance education programs in addition to traditional ones. Educational institutions now make themselves reachable to people who can not attend classes on campus because of factors such as geographic distance or physical disabilities (Molenda & Sullivan, 2003; Molenda & Bichelmeyer, 2005). A recent survey of 2,500 U.S. colleges and universities by the Sloan Consortium found that the 12.9% growth rate for online enrollments far exceeds the 1.2% growth of the overall higher education student population (Allen & Seaman, 2008, p.1). Because of web-facilitated, blended or online education opportunities, the number of students in distance education continues to grow all over the world. A short history of distance education (DE) in Turkey Following the establishment of the Turkish Republic, the educational system has experienced radical changes as a result of politics and cultural fluxes. Administrators were directed toward new educational approaches. The establishment of the Correspondence Course Center (CCC) in 1958 was a noteworthy event in the development of distance education in Turkey (Alkan, 1987). The CCC offered courses such as technical knowledge courses for adults and preparation courses for those taking external exams. Also in 1958, the Instructional Film Center (IFC) began to produce educational movies. The Education with Radio Unit was established under the IFC, and its name was then modified to the “Film, Radio & Graphics Center.” This center initiated educational broadcasting in 1968 (Egitek, 2006; Agaoglu, Imer & Kurubacak, 2002). In 1982, the Open Education Faculty (OEF) was established by Anadolu University; this was later included in the list of Mega Universities by Sir Daniel (Daniel, 1996). The OEF has a significant place in the history of distance education in Turkey, since it made a name for itself not only in Turkey and but also in the world in relation to its multitude of students (Picciano, 2001; Simonson, Smaldino, Albright and Zvacek, 2009). The OEF started to offer courses through printed materials and broadcasting by enrolling 29,445 students. Then, radio programs, video education centers,
TOJET: The Turkish Online Journal of Educational Technology – January 2010, volume 9 Issue 1
Copyright The Turkish Online Journal of Educational Technology 236
computer centers, CD-ROMs, other technological developments, and the Internet have also been used to transmit courses offered by the OEF (Demiray, 2002; 2005). Today, the OEF continues to provide higher education for more than 600,000 students. According to Asgun et al. (2007) the most effective way to become an information society is to benefit from distance education. Distance education is often used for lifelong learning. It provides a solution for the limitations of geographical conditions, and it is the most effective way to obtain more qualified labor. The importance of a qualified workforce in the country was emphasized by the Vision 2023 report of the Turkish Scientific and Technical Research Council (Tubitak, 2004). The report proposed a reconstruction of the Turkish Higher Education system to bring it up to date with the advances of the information era. According to this report, the aim of the new educational system should be “to develop individual creativeness, to create new learning opportunities to improve individuals’ skills at the highest level by taking into consideration their individual differences, to provide flexible time and space to learners for learning and to focus on an educational approach which emphasizes learning and human values” (Tubitak, 2004, p.11). Since there is currently a high demand for university educated professionals in Turkey, it is obvious that educators will desire new methods to educate greater numbers of university students. Integrating technological innovations into conventional education effectively is one of the most promising ways to create new opportunities for the youth population. There are learners at the core of learning therefore they are one of the most important components of educational systems. Therefore, learners’ characteristics, their thoughts and existing opportunities in a learning environment have a great value to researchers. In addition, before any radical changes are made to the existing educational system completely, the present conditions should be examined in order to prevent possible failures. For these reasons, it is important that a detailed analysis should be conducted for both target learners and the current educational environment before educators attempt to create a distance education program. In this study, the target group was comprised of students from four Turkish universities in different parts of the country. The aim of the study was to investigate Turkish students’ Internet and computer-use opportunities, their level of computer use, their studying styles, and their preference for learning environments. In general, the purpose of the study was to define Turkish students’ profiles and thoughts related to web-based education. The results will provide valuable information to interested developers of new distance education programs in Turkey.
METHODOLOGY Knupfer and Mclellan (1996) emphasized the importance of descriptive research methodology in educational researches. This type of research is essential to understand the points of view of large populations. In this study, descriptive research methodology was used to reveal Turkish university students’ profiles and their thoughts of web-based education. The context The data were collected in the needs analysis stage of the “e-campus project” managed by Middle East Technical University. The e-campus project was designed to create a heightened student capacity for higher education through the use of information and communication technologies. The project aims to support both lifelong learning opportunities and undergraduate education via the Internet (Yalabık, 2004). Data collection and data analysis The data collection instrument was a survey including multiple choice and likert type items. The survey was developed and distributed by Informatics Institute of Middle East Technical University. The survey had three main parts, including thirty-five questions in total. In the first part, the questions were designed to acquire demographical information about the students. The second part included questions about perceived computer literacy levels. The third part was about preferences of the students for learning environments. Sampling The data were collected from four universities in Turkey: 1) Kocaeli University, 2) Mersin University, 3) Zonguldak Karaelmas University, and 4) Middle East Technical University. For each university, the number of students in the population and in the sample is shown in Table 1 (The Council of Higher Education, 2004). The number of returned surveys was 6,504 from the total of 107,403 students in the overall student population. Specifically, the percentages of returned surveys were 70.9% from Kocaeli University, 15.8% from Middle East Technical University, 8.1% from Mersin University, and 5.2% from Zonguldak Karaelmas University.
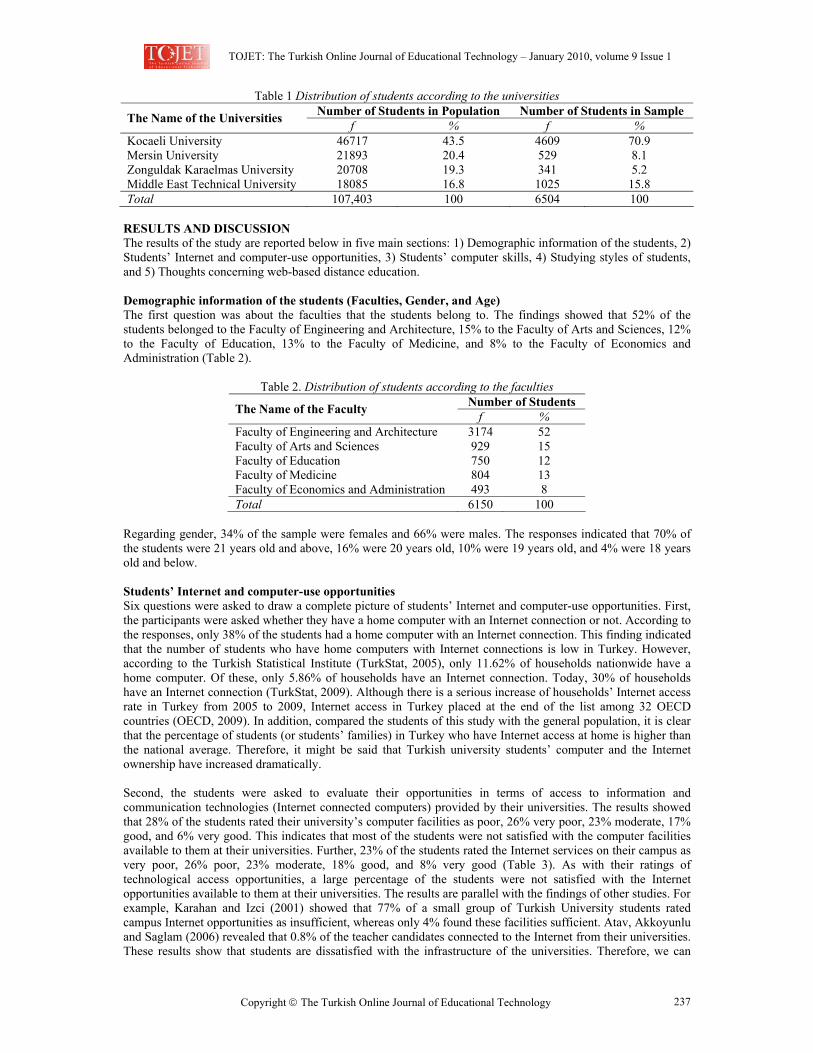
TOJET: The Turkish Online Journal of Educational Technology – January 2010, volume 9 Issue 1
Copyright The Turkish Online Journal of Educational Technology 237
Table 1 Distribution of students according to the universities Number of Students in Population Number of Students in Sample The Name of the Universities f % f %
Kocaeli University 46717 43.5 4609 70.9 Mersin University 21893 20.4 529 8.1 Zonguldak Karaelmas University 20708 19.3 341 5.2 Middle East Technical University 18085 16.8 1025 15.8 Total 107,403 100 6504 100
RESULTS AND DISCUSSION The results of the study are reported below in five main sections: 1) Demographic information of the students, 2) Students’ Internet and computer-use opportunities, 3) Students’ computer skills, 4) Studying styles of students, and 5) Thoughts concerning web-based distance education.
Demographic information of the students (Faculties, Gender, and Age) The first question was about the faculties that the students belong to. The findings showed that 52% of the students belonged to the Faculty of Engineering and Architecture, 15% to the Faculty of Arts and Sciences, 12% to the Faculty of Education, 13% to the Faculty of Medicine, and 8% to the Faculty of Economics and Administration (Table 2).
Table 2. Distribution of students according to the faculties
Number of Students The Name of the Faculty f % Faculty of Engineering and Architecture 3174 52 Faculty of Arts and Sciences 929 15 Faculty of Education 750 12 Faculty of Medicine 804 13 Faculty of Economics and Administration 493 8 Total 6150 100
Regarding gender, 34% of the sample were females and 66% were males. The responses indicated that 70% of the students were 21 years old and above, 16% were 20 years old, 10% were 19 years old, and 4% were 18 years old and below. Students’ Internet and computer-use opportunities Six questions were asked to draw a complete picture of students’ Internet and computer-use opportunities. First, the participants were asked whether they have a home computer with an Internet connection or not. According to the responses, only 38% of the students had a home computer with an Internet connection. This finding indicated that the number of students who have home computers with Internet connections is low in Turkey. However, according to the Turkish Statistical Institute (TurkStat, 2005), only 11.62% of households nationwide have a home computer. Of these, only 5.86% of households have an Internet connection. Today, 30% of households have an Internet connection (TurkStat, 2009). Although there is a serious increase of households’ Internet access rate in Turkey from 2005 to 2009, Internet access in Turkey placed at the end of the list among 32 OECD countries (OECD, 2009). In addition, compared the students of this study with the general population, it is clear that the percentage of students (or students’ families) in Turkey who have Internet access at home is higher than the national average. Therefore, it might be said that Turkish university students’ computer and the Internet ownership have increased dramatically. Second, the students were asked to evaluate their opportunities in terms of access to information and communication technologies (Internet connected computers) provided by their universities. The results showed that 28% of the students rated their university’s computer facilities as poor, 26% very poor, 23% moderate, 17% good, and 6% very good. This indicates that most of the students were not satisfied with the computer facilities available to them at their universities. Further, 23% of the students rated the Internet services on their campus as very poor, 26% poor, 23% moderate, 18% good, and 8% very good (Table 3). As with their ratings of technological access opportunities, a large percentage of the students were not satisfied with the Internet opportunities available to them at their universities. The results are parallel with the findings of other studies. For example, Karahan and Izci (2001) showed that 77% of a small group of Turkish University students rated campus Internet opportunities as insufficient, whereas only 4% found these facilities sufficient. Atav, Akkoyunlu and Saglam (2006) revealed that 0.8% of the teacher candidates connected to the Internet from their universities. These results show that students are dissatisfied with the infrastructure of the universities. Therefore, we can
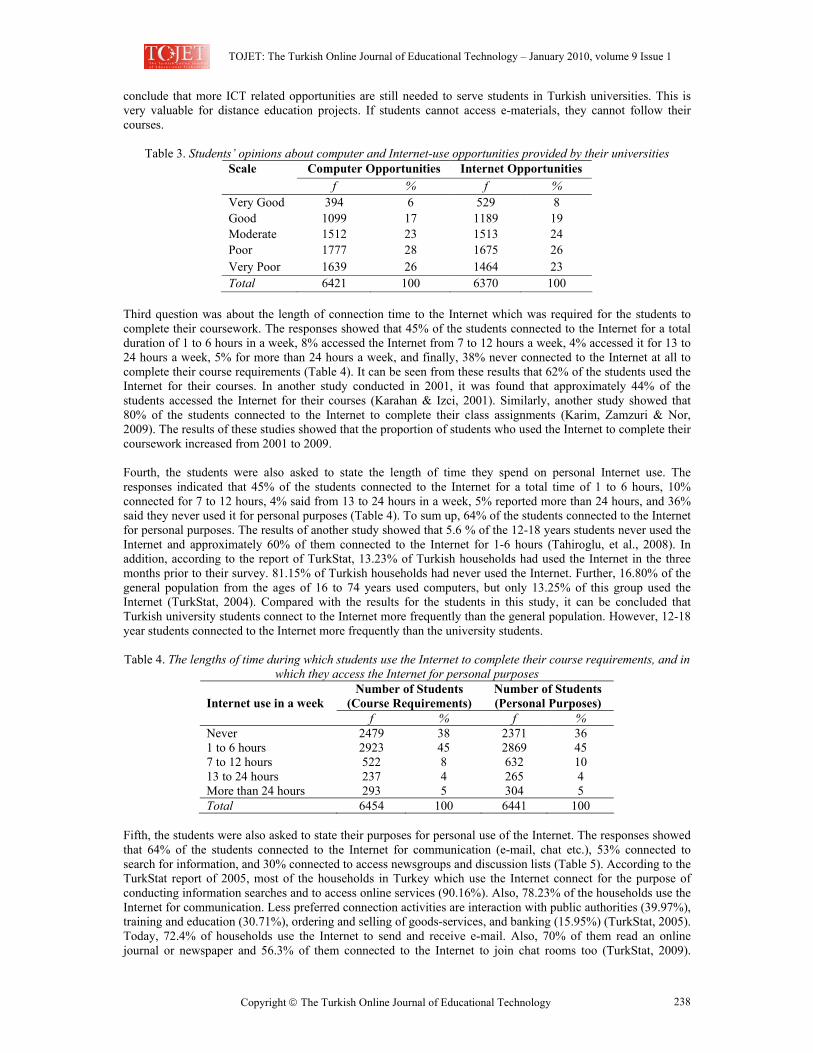
TOJET: The Turkish Online Journal of Educational Technology – January 2010, volume 9 Issue 1
Copyright The Turkish Online Journal of Educational Technology 238
conclude that more ICT related opportunities are still needed to serve students in Turkish universities. This is very valuable for distance education projects. If students cannot access e-materials, they cannot follow their courses.
Table 3. Students’ opinions about computer and Internet-use opportunities provided by their universities Computer Opportunities Internet Opportunities Scale
f % f % Very Good 394 6 529 8 Good 1099 17 1189 19 Moderate 1512 23 1513 24 Poor 1777 28 1675 26 Very Poor 1639 26 1464 23 Total 6421 100 6370 100
Third question was about the length of connection time to the Internet which was required for the students to complete their coursework. The responses showed that 45% of the students connected to the Internet for a total duration of 1 to 6 hours in a week, 8% accessed the Internet from 7 to 12 hours a week, 4% accessed it for 13 to 24 hours a week, 5% for more than 24 hours a week, and finally, 38% never connected to the Internet at all to complete their course requirements (Table 4). It can be seen from these results that 62% of the students used the Internet for their courses. In another study conducted in 2001, it was found that approximately 44% of the students accessed the Internet for their courses (Karahan & Izci, 2001). Similarly, another study showed that 80% of the students connected to the Internet to complete their class assignments (Karim, Zamzuri & Nor, 2009). The results of these studies showed that the proportion of students who used the Internet to complete their coursework increased from 2001 to 2009. Fourth, the students were also asked to state the length of time they spend on personal Internet use. The responses indicated that 45% of the students connected to the Internet for a total time of 1 to 6 hours, 10% connected for 7 to 12 hours, 4% said from 13 to 24 hours in a week, 5% reported more than 24 hours, and 36% said they never used it for personal purposes (Table 4). To sum up, 64% of the students connected to the Internet for personal purposes. The results of another study showed that 5.6 % of the 12-18 years students never used the Internet and approximately 60% of them connected to the Internet for 1-6 hours (Tahiroglu, et al., 2008). In addition, according to the report of TurkStat, 13.23% of Turkish households had used the Internet in the three months prior to their survey. 81.15% of Turkish households had never used the Internet. Further, 16.80% of the general population from the ages of 16 to 74 years used computers, but only 13.25% of this group used the Internet (TurkStat, 2004). Compared with the results for the students in this study, it can be concluded that Turkish university students connect to the Internet more frequently than the general population. However, 12-18 year students connected to the Internet more frequently than the university students.
Table 4. The lengths of time during which students use the Internet to complete their course requirements, and in
which they access the Internet for personal purposes Number of Students
(Course Requirements) Number of Students (Personal Purposes) Internet use in a week
f % f % Never 2479 38 2371 36 1 to 6 hours 2923 45 2869 45 7 to 12 hours 522 8 632 10 13 to 24 hours 237 4 265 4 More than 24 hours 293 5 304 5 Total 6454 100 6441 100
Fifth, the students were also asked to state their purposes for personal use of the Internet. The responses showed that 64% of the students connected to the Internet for communication (e-mail, chat etc.), 53% connected to search for information, and 30% connected to access newsgroups and discussion lists (Table 5). According to the TurkStat report of 2005, most of the households in Turkey which use the Internet connect for the purpose of conducting information searches and to access online services (90.16%). Also, 78.23% of the households use the Internet for communication. Less preferred connection activities are interaction with public authorities (39.97%), training and education (30.71%), ordering and selling of goods-services, and banking (15.95%) (TurkStat, 2005). Today, 72.4% of households use the Internet to send and receive e-mail. Also, 70% of them read an online journal or newspaper and 56.3% of them connected to the Internet to join chat rooms too (TurkStat, 2009).
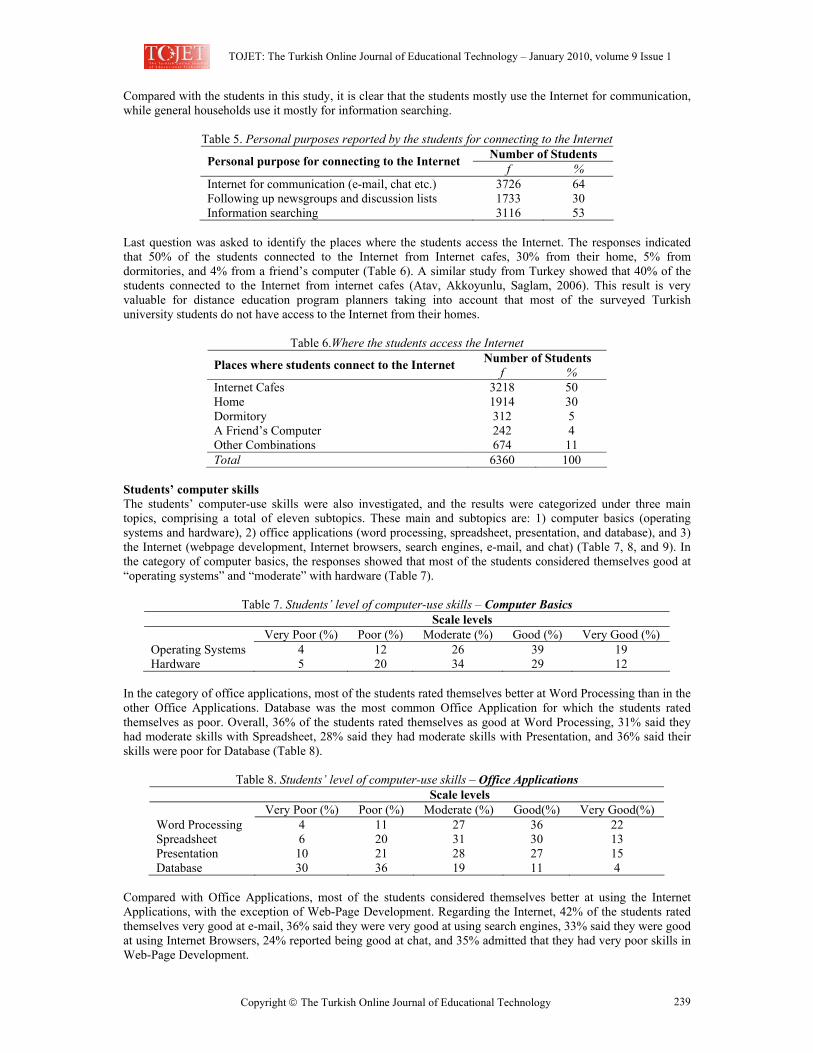
TOJET: The Turkish Online Journal of Educational Technology – January 2010, volume 9 Issue 1
Copyright The Turkish Online Journal of Educational Technology 239
Compared with the students in this study, it is clear that the students mostly use the Internet for communication, while general households use it mostly for information searching.
Table 5. Personal purposes reported by the students for connecting to the Internet
Number of Students Personal purpose for connecting to the Internet f % Internet for communication (e-mail, chat etc.) 3726 64 Following up newsgroups and discussion lists 1733 30 Information searching 3116 53
Last question was asked to identify the places where the students access the Internet. The responses indicated that 50% of the students connected to the Internet from Internet cafes, 30% from their home, 5% from dormitories, and 4% from a friend’s computer (Table 6). A similar study from Turkey showed that 40% of the students connected to the Internet from internet cafes (Atav, Akkoyunlu, Saglam, 2006). This result is very valuable for distance education program planners taking into account that most of the surveyed Turkish university students do not have access to the Internet from their homes.
Table 6.Where the students access the Internet
Number of Students Places where students connect to the Internet f % Internet Cafes 3218 50 Home 1914 30 Dormitory 312 5 A Friend’s Computer 242 4 Other Combinations 674 11 Total 6360 100
Students’ computer skills The students’ computer-use skills were also investigated, and the results were categorized under three main topics, comprising a total of eleven subtopics. These main and subtopics are: 1) computer basics (operating systems and hardware), 2) office applications (word processing, spreadsheet, presentation, and database), and 3) the Internet (webpage development, Internet browsers, search engines, e-mail, and chat) (Table 7, 8, and 9). In the category of computer basics, the responses showed that most of the students considered themselves good at “operating systems” and “moderate” with hardware (Table 7).
Table 7. Students’ level of computer-use skills – Computer Basics Scale levels Very Poor (%) Poor (%) Moderate (%) Good (%) Very Good (%) Operating Systems 4 12 26 39 19 Hardware 5 20 34 29 12
In the category of office applications, most of the students rated themselves better at Word Processing than in the other Office Applications. Database was the most common Office Application for which the students rated themselves as poor. Overall, 36% of the students rated themselves as good at Word Processing, 31% said they had moderate skills with Spreadsheet, 28% said they had moderate skills with Presentation, and 36% said their skills were poor for Database (Table 8).
Table 8. Students’ level of computer-use skills – Office Applications Scale levels Very Poor (%) Poor (%) Moderate (%) Good(%) Very Good(%) Word Processing 4 11 27 36 22 Spreadsheet 6 20 31 30 13 Presentation 10 21 28 27 15 Database 30 36 19 11 4
Compared with Office Applications, most of the students considered themselves better at using the Internet Applications, with the exception of Web-Page Development. Regarding the Internet, 42% of the students rated themselves very good at e-mail, 36% said they were very good at using search engines, 33% said they were good at using Internet Browsers, 24% reported being good at chat, and 35% admitted that they had very poor skills in Web-Page Development.
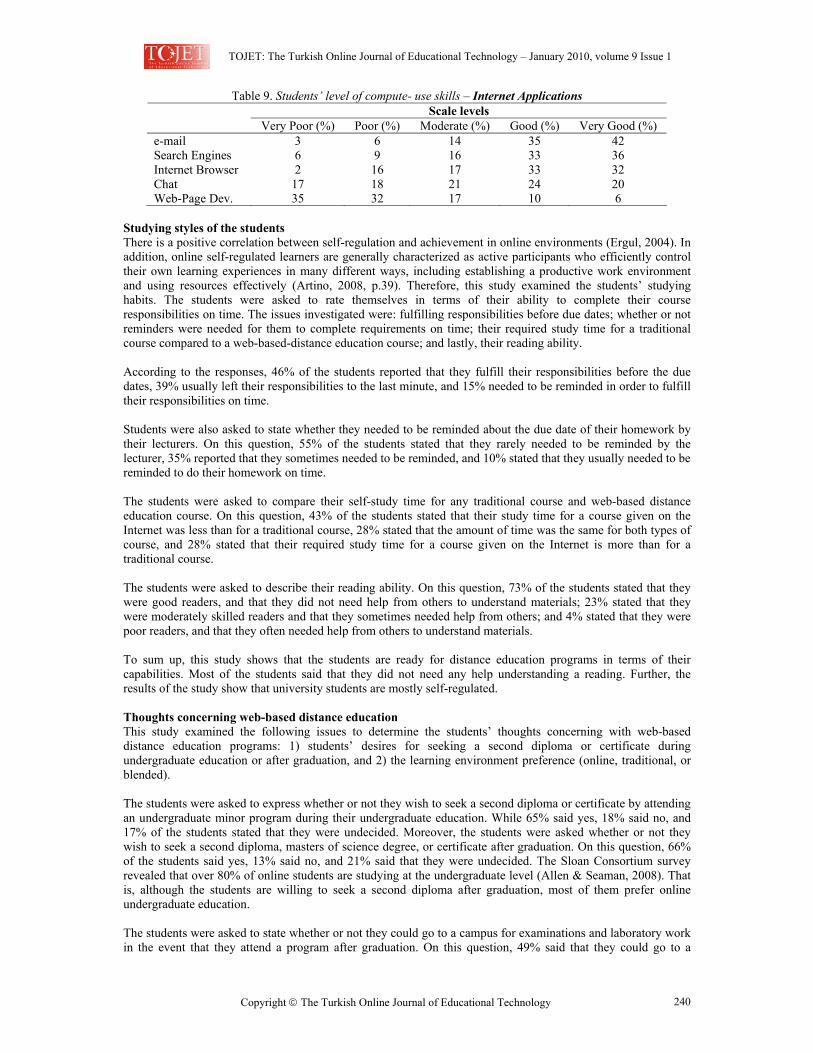
TOJET: The Turkish Online Journal of Educational Technology – January 2010, volume 9 Issue 1
Copyright The Turkish Online Journal of Educational Technology 240
Table 9. Students’ level of compute- use skills – Internet Applications Scale levels
Very Poor (%) Poor (%) Moderate (%) Good (%) Very Good (%) e-mail 3 6 14 35 42 Search Engines 6 9 16 33 36 Internet Browser 2 16 17 33 32 Chat 17 18 21 24 20 Web-Page Dev. 35 32 17 10 6
Studying styles of the students There is a positive correlation between self-regulation and achievement in online environments (Ergul, 2004). In addition, online self-regulated learners are generally characterized as active participants who efficiently control their own learning experiences in many different ways, including establishing a productive work environment and using resources effectively (Artino, 2008, p.39). Therefore, this study examined the students’ studying habits. The students were asked to rate themselves in terms of their ability to complete their course responsibilities on time. The issues investigated were: fulfilling responsibilities before due dates; whether or not reminders were needed for them to complete requirements on time; their required study time for a traditional course compared to a web-based-distance education course; and lastly, their reading ability. According to the responses, 46% of the students reported that they fulfill their responsibilities before the due dates, 39% usually left their responsibilities to the last minute, and 15% needed to be reminded in order to fulfill their responsibilities on time. Students were also asked to state whether they needed to be reminded about the due date of their homework by their lecturers. On this question, 55% of the students stated that they rarely needed to be reminded by the lecturer, 35% reported that they sometimes needed to be reminded, and 10% stated that they usually needed to be reminded to do their homework on time. The students were asked to compare their self-study time for any traditional course and web-based distance education course. On this question, 43% of the students stated that their study time for a course given on the Internet was less than for a traditional course, 28% stated that the amount of time was the same for both types of course, and 28% stated that their required study time for a course given on the Internet is more than for a traditional course. The students were asked to describe their reading ability. On this question, 73% of the students stated that they were good readers, and that they did not need help from others to understand materials; 23% stated that they were moderately skilled readers and that they sometimes needed help from others; and 4% stated that they were poor readers, and that they often needed help from others to understand materials. To sum up, this study shows that the students are ready for distance education programs in terms of their capabilities. Most of the students said that they did not need any help understanding a reading. Further, the results of the study show that university students are mostly self-regulated. Thoughts concerning web-based distance education This study examined the following issues to determine the students’ thoughts concerning with web-based distance education programs: 1) students’ desires for seeking a second diploma or certificate during undergraduate education or after graduation, and 2) the learning environment preference (online, traditional, or blended). The students were asked to express whether or not they wish to seek a second diploma or certificate by attending an undergraduate minor program during their undergraduate education. While 65% said yes, 18% said no, and 17% of the students stated that they were undecided. Moreover, the students were asked whether or not they wish to seek a second diploma, masters of science degree, or certificate after graduation. On this question, 66% of the students said yes, 13% said no, and 21% said that they were undecided. The Sloan Consortium survey revealed that over 80% of online students are studying at the undergraduate level (Allen & Seaman, 2008). That is, although the students are willing to seek a second diploma after graduation, most of them prefer online undergraduate education. The students were asked to state whether or not they could go to a campus for examinations and laboratory work in the event that they attend a program after graduation. On this question, 49% said that they could go to a
TOJET: The Turkish Online Journal of Educational Technology – January 2010, volume 9 Issue 1
Copyright The Turkish Online Journal of Educational Technology 241
campus at anytime, 26% stated that they could participate in examinations and laboratory work if the campus or laboratory was open during weekends or nights, and 25% said that they would have difficulty coming to a campus even on weekends or at night. The students were asked to state the type of learning environment they prefer when attending any graduate program. On this question, 56% said that they prefer blended programs, 32% prefer traditional programs, and 12% prefer online programs. Thus, the majority of students prefer a mixture of conventional and online methods (blended) for additional education after their graduation. This finding agrees with an earlier study which also concluded that Turkish University students do not want to solely attend pure online education programs (Kocak & Kalender, 2002). Together, these studies indicate that potential distance education students prefer blended learning programs. CONCLUSIONS Most of the studies in the field of web-based education focus on comparison of conventional education and online education (Artino, 2008). However, learner characteristics and expectations directly affect the success of distance education programs. The best learner-learner, learner-content, learner-teacher interactions are accomplished if educators know their learners closer. Therefore, this study revealed university students’ Internet and computer use opportunities, their level of computer use, studying styles and their thoughts about e-learning, and compared the results of the study with the literature. Moreover, in the past, studies on Turkish university students and their online education preferences provided limited knowledge because they had small sample sizes or the sample of the studies were very specific student groups. However, this study has high numbers of undergraduate students from four major universities in Turkey. So, this study presents need analysis knowledge, which is the first step of design, to educators or to designers before they develop a distance education program. Latchem et al. (2009) concluded that distance learners’ competence with ICT, access to broadband or dial-up, age, and gender, influence their attitudes towards distance learning. The results of this study showed that distance education planners have positive signs to offer new programs for Turkish university students. First, this study revealed that the majority of the university students did not have personal home computers with an Internet access. Indeed, lack of learners’ technology ownership is the major obstacle in any planned initiation of a web-based distance program. However, the trend shows that this rate has increased fast in Turkey (Turkstat, 2005, 2009). Second, learners in distance education programs should use technology effectively in order to learn course content which is delivered by technology instead of teachers. The results of this study showed that Turkish students have basic ICT literacy skills to follow web based distance courses. Third, the students in the study did express a strong desire to take web-based distance courses. Experiences showed that learners should feel a need to participate to a new learning environment before they actively involved in the program. On the contrary, distance education programs will not be successful. Finally, the results provide a more complete picture of the self-expressed profiles and desires of Turkish university students. Based on this data, policy members can initiate new, large-scale web-based distance education programs in Turkey. As a focus for future studies, we suggest that researchers should repeat this study using the same format, as student profiles will continue to change along with the development of new technologies and socio-economical improvements in Turkey.
REFERENCES Agaoglu, E., Imer, G. & Kurubacak, G. (2002). A case study of organizing distance education: Anadolu
University. The Turkish Online Journal of Distance Education, 3(1). Retrieved May 20, 2006, from http://tojde.anadolu.edu.tr/tojde5/pdf/4.pdf.
Alkan, C. (1987). Açıköğretim: uzaktan eğitim sistemlerinin karsılaştırılmalı olarak incelenmesi [Openeducation: an investigation of distance education systems]. Ankara Üniversitesi Eğitim Bilimleri Fakültesi Yayınları, Ankara.
Allen, I. E. & Seaman, J. (2008). Staying the Course: Online Education in the United States, 2008. Retrieved Novamber 5, 2009, from http://www.sloanconsortium.org/publications/survey/pdf/staying_the_course.pdf.
Artino, A., Jr. (2008). Promoting Academic Motivation and Self-Regulation: Practical Guidelines for Online Instructors. TechTrends, 52(3), 37-45.
Asgun, S. et al. (2007). Egitimin değisen yüzü: E-öğrenme [E-learning: a new face of education], Ankara, ODTU Mezunlar Derneği.
Atav, E., Akkoyunlu, B. & Saglam, N (2006). Ögretmen adaylarının İnternete erişim olanakları ve kullanım amaçları [Prospective Teachers' Internet Access Facilities and Their Internet Usage]. Hacettepe Eğitim Dergisi, 30, pp.37-44.
TOJET: The Turkish Online Journal of Educational Technology – January 2010, volume 9 Issue 1
Copyright The Turkish Online Journal of Educational Technology 242
Daniel, J. S. (1996). Mega Universities and knowledge media: Technology strategies for higher education. Sterling, VA: Stylus Publishing.
Demiray, U. (ed.) (2002). A review of the literature on the open education faculty in Turkey (4th ed.). Eskisehir. Retrieved March 2, 2006, from http://www.tojet.net/books.htm.
Demiray, U. (2005). Trends and issues in the development of distance education in Turkey. In Y. L. Visser (Ed.). Trends and issues in distance education: International perspectives, (pp. 163-170). Greenwich, Information Age Publishing.
Egitek (2006). Eğitim teknolojileri genel müdürlüğü: Tarihçesi. Retrieved August 10, 2006, from http://egitek.meb.gov.tr/Egitek/tanitim.html.
Ergul, H. (2004). Relationship between student characteristics and academic achievement in distance education and application on students of Anadolu Universtiy. Turkish Online Journal of Distance Education 5(2), pp.80-89. Retrieved February 8, 2006, from http://tojde.anadolu.edu.tr/tojde21/left.htm.
Gunawardena, C. N. (2003). Distance Education. Ch 14 in David H. Jonassen (Ed.). Handbook of Research for Educational Communications and Technology. NewYork: Macmillan. pp. 355-395.
Karahan, M. & Izci, E. (2001). Üniversite öğrencilerinin internet kullanım düzeyleri ve beklentilerinin değerlendirilmesi [The Internet use level of university students and evaluation of their expectations], Milli Egitim Dergisi, 150. Retrieved February 24, 2006, from http://yayim.meb.gov.tr/dergiler/150/karahan_izci.htm.
Karim, N. S. A. L, Zamzuri, N. H. A. & Nor, Y, M, (2009). Exploring the relationship between Internet ethics in university students and the big five model of personality, Computers & Education, 53, pp.86 -93.
Knupfer, N. & Mclellan, H. (1996). Descriptive research methodologies. In D. Jonassen (Ed.), Handbook of research for educational communications and technology. NY: Macmillan.
Kocak, A. & Kalender, A. (2002). Distance education within a campus: Case of Selcuk University. Turkish Online Journal of Distance Education, 3 (3). Retrieved February 8, 2006, from http://tojde.anadolu.edu.tr/tojde7/articles/selcukuniversity.htm.
Latchem, C., Simsek, N., Cakir Balta, O., Torkul, O., Cedimoglu, I. H. & Altunkopru, A. (2009). Are We There Yet? A Progress Report from Three Turkish University Pioneers in Distance Education and E-Learning. The International Review of Research in Open and Distance Learning, 10 (2).
Molenda, M. & Bichelmeyer, B. (2006). Issues and trends in instructional technology: Slow growth as economy recovers. Educational Media and Technology Yearbook. Westport, CT: Libraries Unlimited.
Molenda, M. & Sullivan, M. (2002). Issues and trends in instructional technology: Hitting the plateau. In M. A. Fitzgerald, M. Orey, & R. M. Branch (Eds.), Educational media and technology yearbook 2002 (Vol. 27, pp. 3–18). Englewood, CO: Libraries Unlimited.
OECD (2009). OECD Key ICT Indicators. Retrieved October 29, 2009, from http://www.oecd.org/dataoecd/19/45/34083073.xls.
Picciano, A. G. (2001). Distance Learning: Making Connection Across Virtual Space and Time. Prentice Hall, Inc. Upper Saddle River, NJ.
Simonson, M., Smaldino, S., Albright, M. & Zvacek, S. (2009). Teaching and learning at a distance: Foundations of distance education (4th ed.). Ally & Bacon. Pearson.
Tahiroglu, A. Y., Celik, G. G., Uzel, M., Ozcan, N. & Avci, A. (2008). Internet use among Turkish adolescents, Cyberpsychology & Behavior, 11(5), pp.537-543.
The Council of Higher Education (2004). Student Statistics. Retrieved February 8, 2006, from http://www.yok.gov.tr/hakkinda/2003-2004os.xls.
Tubitak (2004). National science and technology politics: 2003-2023 strategy document. Retrieved January 29, 2005, from http://vizyon2023.tubitak.gov.tr/strateji_belgesi-v211.Pdf.
TurkStat (2004). ICT use in households. Retrieved February 8, 2006, from http://www.tuik.gov.tr. TurkStat (2005). ICT use in households. Retrieved July 27, 2006, from http://www.tuik.gov.tr. TurkStat (2009). ICT use in households. Retrieved October 27, 2009, from http://www.tuik.gov.tr. Yalabık, N. (2004). E-campus project. Distance education workshop, Mersin University, Turkey.
TOJET: The Turkish Online Journal of Educational Technology – January 2010, volume 9 Issue 1
Copyright The Turkish Online Journal of Educational Technology
243
USABILITY LEVEL OF DISTANCE EDUCATION WEBSITE (SAKARYA UNIVERSITY SAMPLE)
Prof. Dr. Aytekin İŞMAN – Sakarya University Res. Ass. Onur İŞBULAN – Sakarya University
ABSTRACT The main goal of this research is to determine the usability of Sakarya University Adapazarı Vocational Two-Year Community College’s Web Site. A scale was developed to the evaluation and applied to 1512 students. From the applied questionnaire only appropriate ones were selected to be evaluated and 1229 questionnaire were analysed. Finally, usability level of distance education’s web site was analysed according to the comments of the students of Sakarya University Adapazarı Vocational Two-Year Community College and was analyzed whether there is a meaningful difference in based on their genders, ages, departments, university years and geographical conditions or not. Results of the research revealed that students feel contented with usability of distance education’s web site. In the analysis done according to the gender variable, when compared to the male students , female students; according to the age variable, when compared to the old students , the young students; according to the department variable, when compared to the students of other departments, the students of Mechatronics and Business Management Department; according to the university years variable, when compared to the senior students, the freshmen; according to the geographical conditions variable, when compared to the students of other regions, the students living in Mediterranean region are not content with usability of web site in some factors.
INTRODUCTION The telecommunications technologies have affected the education and instruction processes. The fact that these new technologies are in a race against time has culminated in the evolution of certain issues such as all of the existing learning-instruction theories, instruction methods, environmental design in parallel to the technology. One of the concepts triggered by these evolving theories is usability. Usable websites enable the user to get the most efficiency from the websites by increasing the level of user-website interaction. Usability is an important concept for distance education sites as well because usable websites allow students to learn more effectively and attractively. The learning level will be enhanced in proportion to how efficiently the students use the website and how well the student-website interaction occurs. Then we ask, how usable are the distance education websites? In recent years, there has been an increasing volume of literature about usability in distance education but there has been little research into the usability. The purpose of the present study was to analyze what relationship occurred between students’ perception of distance education in relation to gender, age, department, geographic region of living and years spent in the university variable and was to determine the usability level of a website that is used for instruction purposes by an institution with a distance education division. Problem Statement
Using the current literature as a guide, this study attempted to answer the following questions: 1. Do the students that receive the distance education services find the website useful? 2. Is there a meaningful difference based on gender variable? 3. Is there a meaningful difference based on age variable? 4. Is there a meaningful difference based on department variable? 5. Is there a meaningful difference based on geographic region of living variable? 6. Is there a meaningful difference based on years spent in the university variable?
Significance of the Study The results can be used by distance educators to determine the benefit of the usability in distance education website systems. Several studies such as Ahlstrom & Longo (2001); Hutchinson (2002); Nielsen (2000; 2008), Mobrand & Spyridakis (2002) have stated that there may be differences in using web sites if the web sites designed in the terms of usability.
TOJET: The Turkish Online Journal of Educational Technology – January 2010, volume 9 Issue 1
Copyright The Turkish Online Journal of Educational Technology
244
Inferences In order to draw the outline of the study, various inferences have been made, which we can list as follows:
1. We think that distance education method will be the educational system of the future and is going to keep up with the advancing world.
2. We believe that distance education websites created with respect to the usability concepts will be beneficial to the students learning efforts.
3. We believe that the prepared distance education websites should be tailored to conform to the usability concepts by analyzing them with various methods.
4. We believe that the “gaining experience at the website” principle can be materialized when the existing distance education websites are habilitated to comply with the usability concepts.
Scope & Limitations In this study, a sample size of 1512 students was used. These students were selected from 5,028 students who enrolled in Adapazarı Vocational Two-Year Community College Distance Education Department of Sakarya University in the province of Sakarya during the academic year 2006–2007. The study is subject to the following limitations:
1. The data was collected through the distribution and collection of a survey and was therefore limited by distance education provided by respond.
2. The study assumed truthful candid responses by respondents who understood the survey questions and directions and were not fearful of reprisal for their completion of the survey instrument.
3. The responses to the survey items by the respondents were subject to unknown personal biases and perceptions.
4. The study was non-experimental in that the investigator doesn't have manipulative control of the independent variables; therefore, no explicit cause and effect relationship can be determined.
5. It is also must be assumed that the students enrolled in a class delivered via the internet during winter quarter 2006 were representative of university students taking distance education courses.
METHOD The study has been based on the descriptive and relational survey. In the course of conducting the study, descriptive survey has been used for the purpose of defining the existing situation as completely and carefully as possible. In this survey method, the perceptions of the students receiving distance education from Sakarya University Adapazarı Vocational School of Higher Education regarding the distance education website have been examined. On the other hand, in the relational survey method, the study attempts to find out if there is any significant differences between the answers given to the student surveys and the students’ genders, departments, ages, years of enrollment at the university and the regions of living.
Sample The universe of the study is constituted by all the students enrolled at Sakarya University Adapazarı Vocational School of Higher Education during the 2006-2007 educational year. All of the 5,028 students enrolling at Sakarya University Adapazarı Vocational School of Higher Education have been asked to fill in the survey, but only 1,512 of them had filled it. At the outset of the study, literary review had been held and topics such as the internet, the internet’s history, its utilization in education, distance education, history of distance education, principles of website design, usability and preparation of usable websites have been researched. Afterwards, the elaborated survey has been carried out on the distance education receiving students at Sakarya University Adapazarı Vocational School of Higher Education. The data collected by the surveys have been reported by employing the descriptive statistics method, t-test and ANOVA. Instrument The survey used in the study to measure the usability level of the distance education websites had been prepared by the researcher by consulting professional advisors. During the preparation of the survey, the website usability surveys existing in the literature have been examined and 41 questions were carved out. These questions had been collected under 6 factors and then were presented for expert opinion. The survey that was evaluated in accordance with the expert opinions comprised of the following factors; “controllability”, “learnability”, “helping”, “appearance”, “effectiveness” and “satisfaction”. 5 questions measure controllability factor, 5 of them measure learnability, 5 of them measure helping, 5 of them measure appearance, 13 of them measure effectiveness and 8 of them measure overall satisfaction.
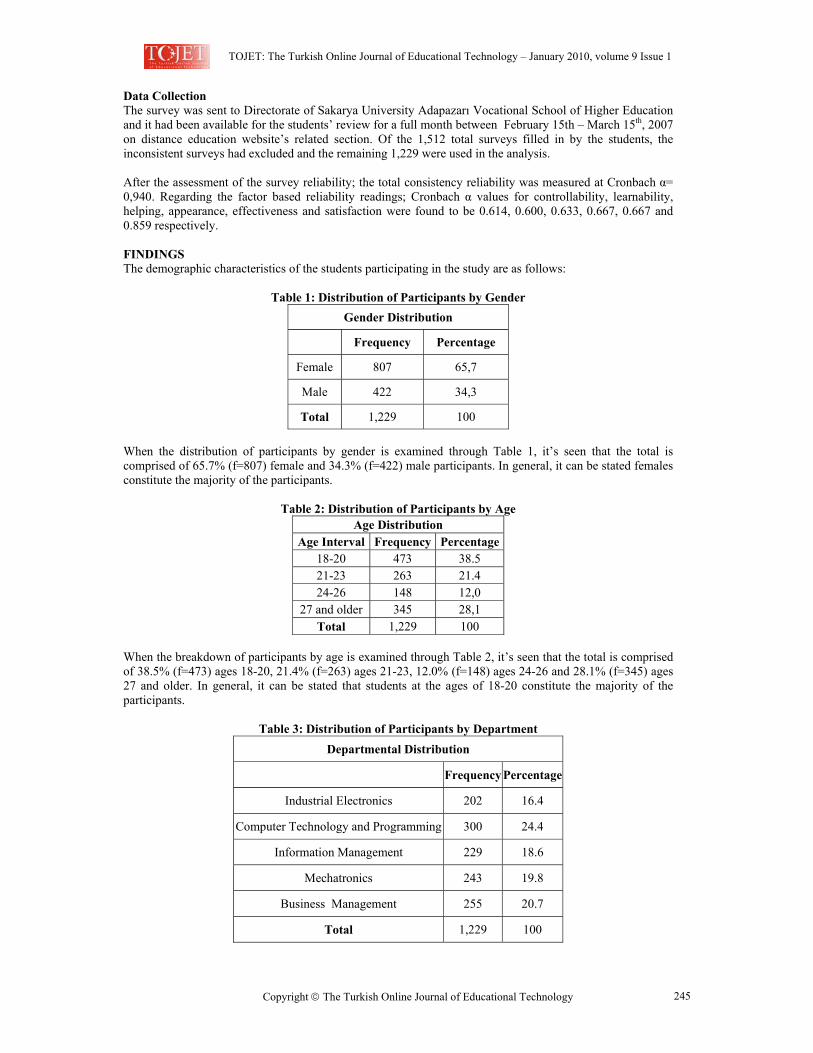
TOJET: The Turkish Online Journal of Educational Technology – January 2010, volume 9 Issue 1
Copyright The Turkish Online Journal of Educational Technology
245
Data Collection The survey was sent to Directorate of Sakarya University Adapazarı Vocational School of Higher Education and it had been available for the students’ review for a full month between February 15th – March 15th, 2007 on distance education website’s related section. Of the 1,512 total surveys filled in by the students, the inconsistent surveys had excluded and the remaining 1,229 were used in the analysis. After the assessment of the survey reliability; the total consistency reliability was measured at Cronbach α= 0,940. Regarding the factor based reliability readings; Cronbach α values for controllability, learnability, helping, appearance, effectiveness and satisfaction were found to be 0.614, 0.600, 0.633, 0.667, 0.667 and 0.859 respectively.
FINDINGS The demographic characteristics of the students participating in the study are as follows:
Table 1: Distribution of Participants by Gender Gender Distribution
Frequency Percentage
Female 807 65,7
Male 422 34,3
Total 1,229 100
When the distribution of participants by gender is examined through Table 1, it’s seen that the total is comprised of 65.7% (f=807) female and 34.3% (f=422) male participants. In general, it can be stated females constitute the majority of the participants.
Table 2: Distribution of Participants by Age Age Distribution
Age Interval Frequency Percentage18-20 473 38.5 21-23 263 21.4 24-26 148 12,0
27 and older 345 28,1 Total 1,229 100
When the breakdown of participants by age is examined through Table 2, it’s seen that the total is comprised of 38.5% (f=473) ages 18-20, 21.4% (f=263) ages 21-23, 12.0% (f=148) ages 24-26 and 28.1% (f=345) ages 27 and older. In general, it can be stated that students at the ages of 18-20 constitute the majority of the participants.
Table 3: Distribution of Participants by Department Departmental Distribution
Frequency Percentage
Industrial Electronics 202 16.4
Computer Technology and Programming 300 24.4
Information Management 229 18.6
Mechatronics 243 19.8
Business Management 255 20.7
Total 1,229 100
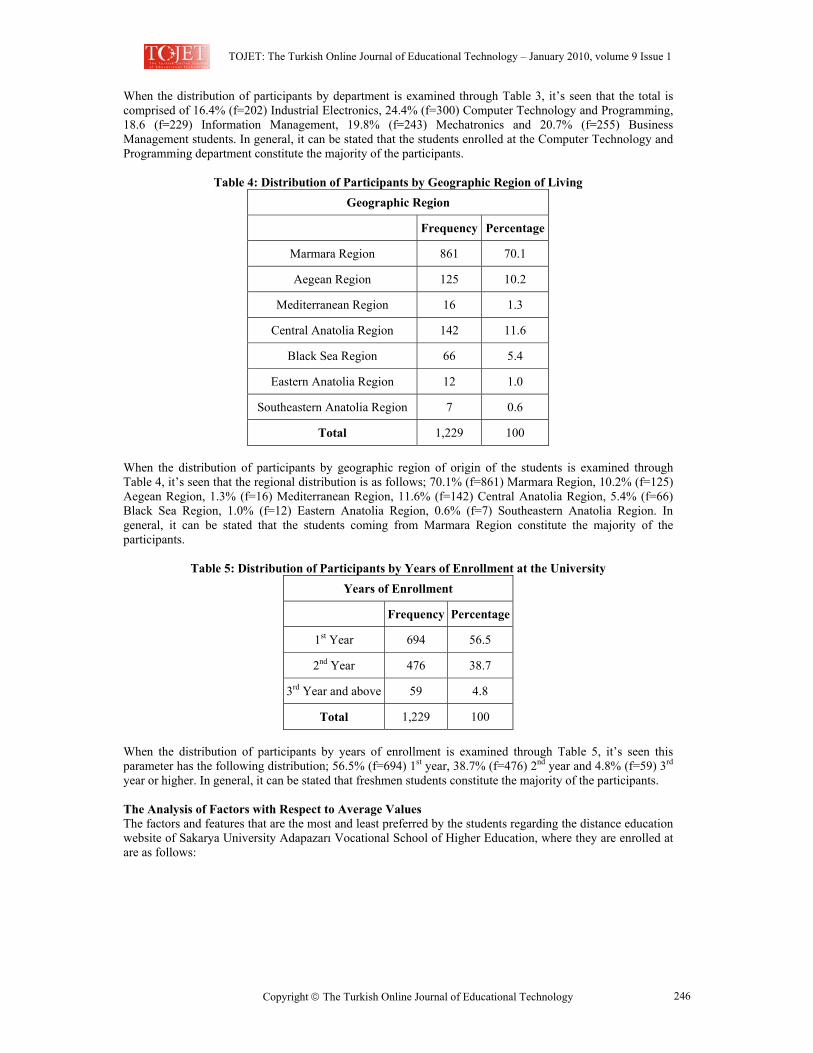
TOJET: The Turkish Online Journal of Educational Technology – January 2010, volume 9 Issue 1
Copyright The Turkish Online Journal of Educational Technology
246
When the distribution of participants by department is examined through Table 3, it’s seen that the total is comprised of 16.4% (f=202) Industrial Electronics, 24.4% (f=300) Computer Technology and Programming, 18.6 (f=229) Information Management, 19.8% (f=243) Mechatronics and 20.7% (f=255) Business Management students. In general, it can be stated that the students enrolled at the Computer Technology and Programming department constitute the majority of the participants.
Table 4: Distribution of Participants by Geographic Region of Living Geographic Region
Frequency Percentage
Marmara Region 861 70.1
Aegean Region 125 10.2
Mediterranean Region 16 1.3
Central Anatolia Region 142 11.6
Black Sea Region 66 5.4
Eastern Anatolia Region 12 1.0
Southeastern Anatolia Region 7 0.6
Total 1,229 100 When the distribution of participants by geographic region of origin of the students is examined through Table 4, it’s seen that the regional distribution is as follows; 70.1% (f=861) Marmara Region, 10.2% (f=125) Aegean Region, 1.3% (f=16) Mediterranean Region, 11.6% (f=142) Central Anatolia Region, 5.4% (f=66) Black Sea Region, 1.0% (f=12) Eastern Anatolia Region, 0.6% (f=7) Southeastern Anatolia Region. In general, it can be stated that the students coming from Marmara Region constitute the majority of the participants.
Table 5: Distribution of Participants by Years of Enrollment at the University Years of Enrollment
Frequency Percentage
1st Year 694 56.5
2nd Year 476 38.7
3rd Year and above 59 4.8
Total 1,229 100 When the distribution of participants by years of enrollment is examined through Table 5, it’s seen this parameter has the following distribution; 56.5% (f=694) 1st year, 38.7% (f=476) 2nd year and 4.8% (f=59) 3rd year or higher. In general, it can be stated that freshmen students constitute the majority of the participants. The Analysis of Factors with Respect to Average Values The factors and features that are the most and least preferred by the students regarding the distance education website of Sakarya University Adapazarı Vocational School of Higher Education, where they are enrolled at are as follows:
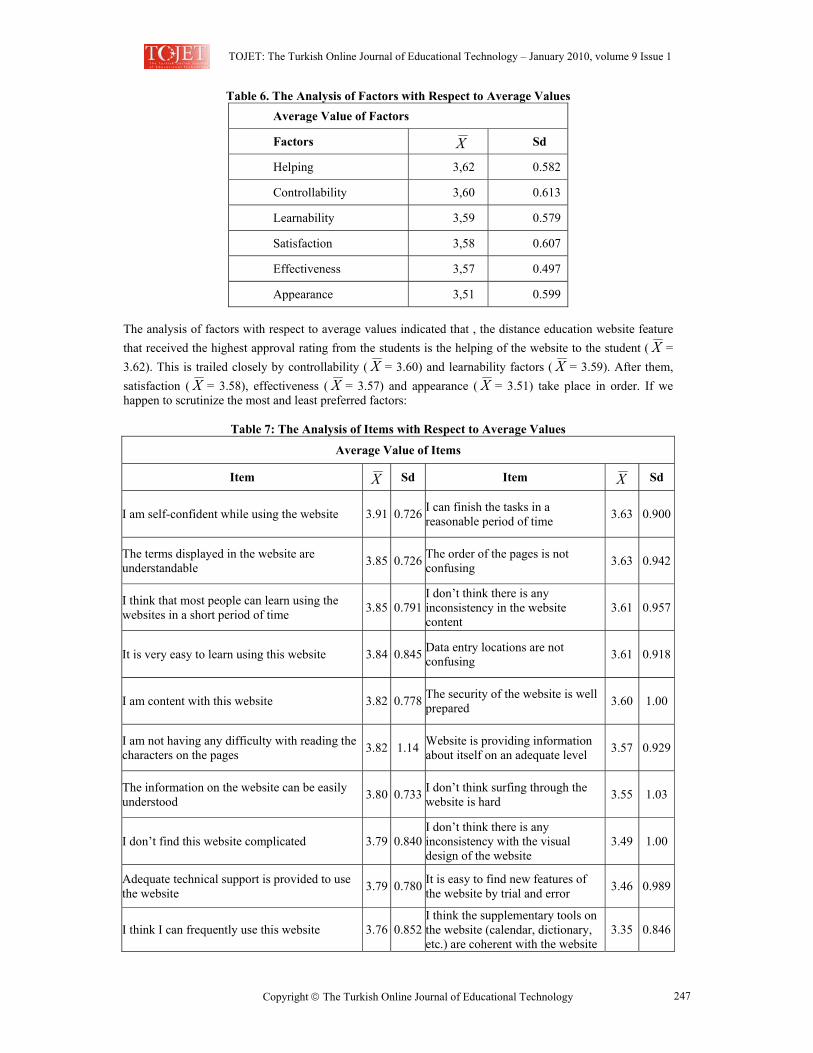
TOJET: The Turkish Online Journal of Educational Technology – January 2010, volume 9 Issue 1
Copyright The Turkish Online Journal of Educational Technology
247
Table 6. The Analysis of Factors with Respect to Average Values Average Value of Factors
Factors X Sd
Helping 3,62 0.582
Controllability 3,60 0.613
Learnability 3,59 0.579
Satisfaction 3,58 0.607
Effectiveness 3,57 0.497
Appearance 3,51 0.599 The analysis of factors with respect to average values indicated that , the distance education website feature that received the highest approval rating from the students is the helping of the website to the student ( X = 3.62). This is trailed closely by controllability ( X = 3.60) and learnability factors ( X = 3.59). After them, satisfaction ( X = 3.58), effectiveness ( X = 3.57) and appearance ( X = 3.51) take place in order. If we happen to scrutinize the most and least preferred factors:
Table 7: The Analysis of Items with Respect to Average Values
Average Value of Items
Item X Sd Item X Sd
I am self-confident while using the website 3.91 0.726 I can finish the tasks in a reasonable period of time 3.63 0.900
The terms displayed in the website are understandable 3.85 0.726 The order of the pages is not
confusing 3.63 0.942
I think that most people can learn using the websites in a short period of time 3.85 0.791
I don’t think there is any inconsistency in the website content
3.61 0.957
It is very easy to learn using this website 3.84 0.845 Data entry locations are not confusing 3.61 0.918
I am content with this website 3.82 0.778 The security of the website is well prepared 3.60 1.00
I am not having any difficulty with reading the characters on the pages 3.82 1.14 Website is providing information
about itself on an adequate level 3.57 0.929
The information on the website can be easily understood 3.80 0.733 I don’t think surfing through the
website is hard 3.55 1.03
I don’t find this website complicated 3.79 0.840I don’t think there is any inconsistency with the visual design of the website
3.49 1.00
Adequate technical support is provided to use the website 3.79 0.780 It is easy to find new features of
the website by trial and error 3.46 0.989
I think I can frequently use this website 3.76 0.852I think the supplementary tools on the website (calendar, dictionary, etc.) are coherent with the website
3.35 0.846
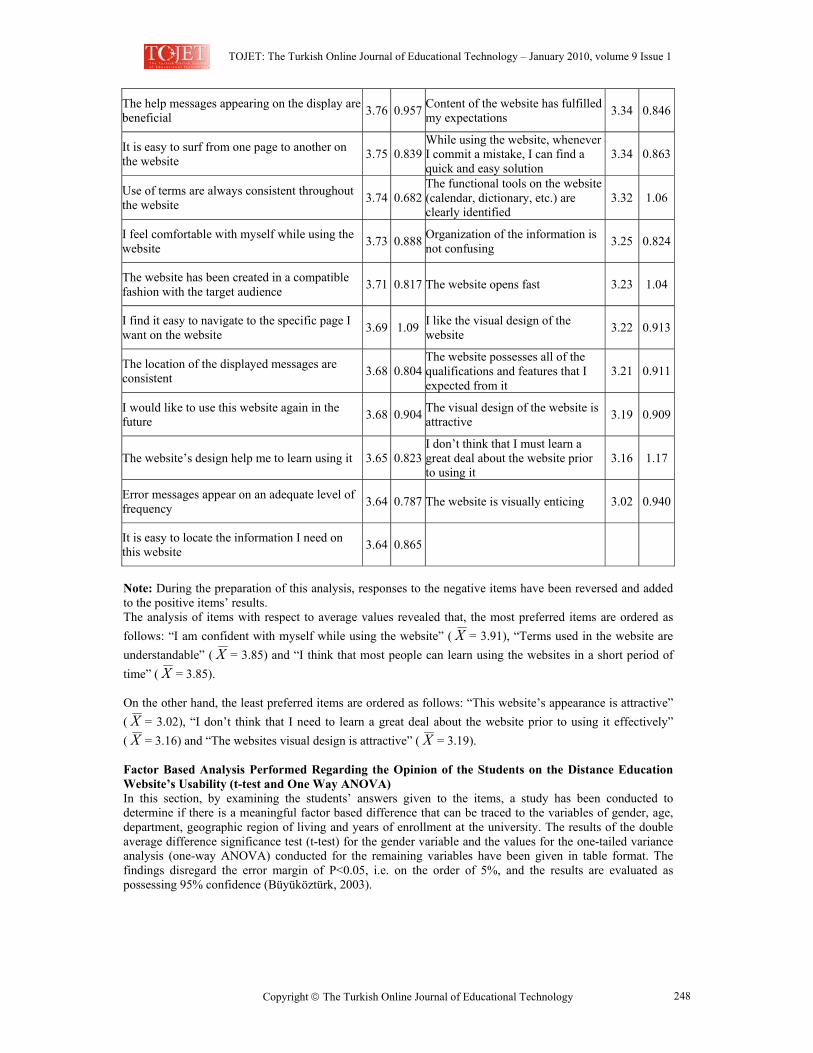
TOJET: The Turkish Online Journal of Educational Technology – January 2010, volume 9 Issue 1
Copyright The Turkish Online Journal of Educational Technology
248
The help messages appearing on the display are beneficial 3.76 0.957 Content of the website has fulfilled
my expectations 3.34 0.846
It is easy to surf from one page to another on the website 3.75 0.839
While using the website, whenever I commit a mistake, I can find a quick and easy solution
3.34 0.863
Use of terms are always consistent throughout the website 3.74 0.682
The functional tools on the website (calendar, dictionary, etc.) are clearly identified
3.32 1.06
I feel comfortable with myself while using the website 3.73 0.888 Organization of the information is
not confusing 3.25 0.824
The website has been created in a compatible fashion with the target audience 3.71 0.817 The website opens fast 3.23 1.04
I find it easy to navigate to the specific page I want on the website 3.69 1.09 I like the visual design of the
website 3.22 0.913
The location of the displayed messages are consistent 3.68 0.804
The website possesses all of the qualifications and features that I expected from it
3.21 0.911
I would like to use this website again in the future 3.68 0.904 The visual design of the website is
attractive 3.19 0.909
The website’s design help me to learn using it 3.65 0.823I don’t think that I must learn a great deal about the website prior to using it
3.16 1.17
Error messages appear on an adequate level of frequency 3.64 0.787 The website is visually enticing 3.02 0.940
It is easy to locate the information I need on this website 3.64 0.865
Note: During the preparation of this analysis, responses to the negative items have been reversed and added to the positive items’ results. The analysis of items with respect to average values revealed that, the most preferred items are ordered as follows: “I am confident with myself while using the website” ( X = 3.91), “Terms used in the website are understandable” ( X = 3.85) and “I think that most people can learn using the websites in a short period of time” ( X = 3.85). On the other hand, the least preferred items are ordered as follows: “This website’s appearance is attractive” ( X = 3.02), “I don’t think that I need to learn a great deal about the website prior to using it effectively” ( X = 3.16) and “The websites visual design is attractive” ( X = 3.19). Factor Based Analysis Performed Regarding the Opinion of the Students on the Distance Education Website’s Usability (t-test and One Way ANOVA) In this section, by examining the students’ answers given to the items, a study has been conducted to determine if there is a meaningful factor based difference that can be traced to the variables of gender, age, department, geographic region of living and years of enrollment at the university. The results of the double average difference significance test (t-test) for the gender variable and the values for the one-tailed variance analysis (one-way ANOVA) conducted for the remaining variables have been given in table format. The findings disregard the error margin of P<0.05, i.e. on the order of 5%, and the results are evaluated as possessing 95% confidence (Büyüköztürk, 2003).
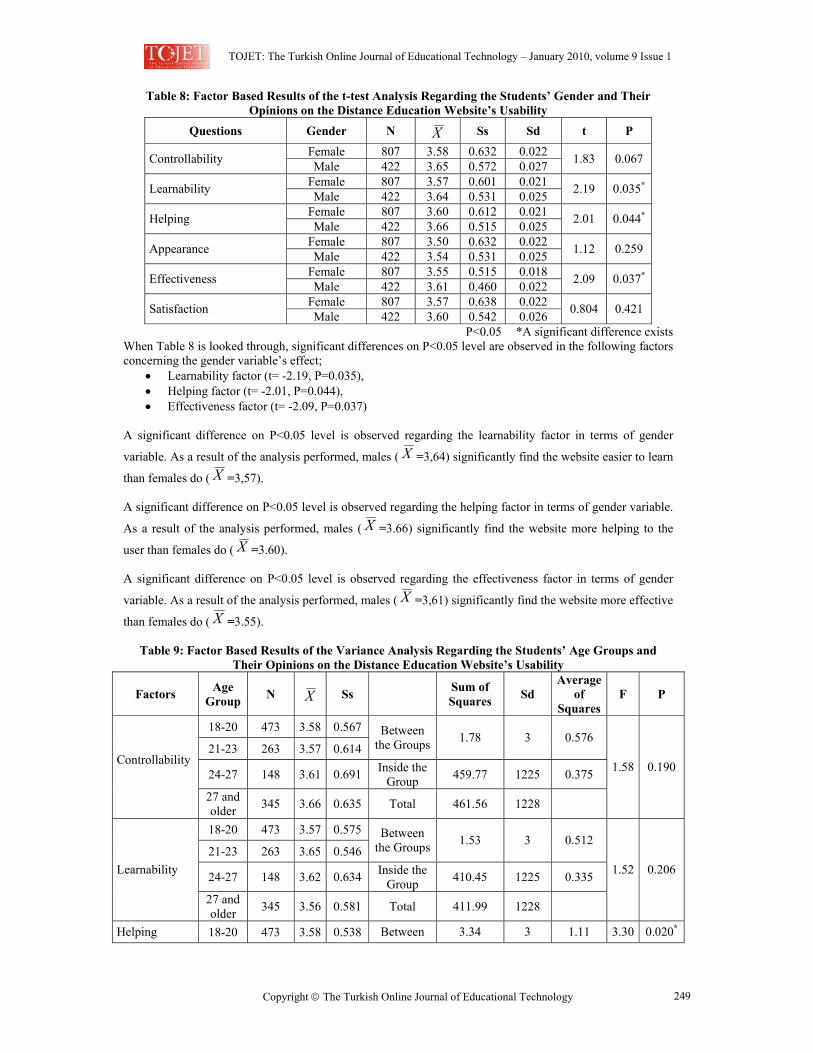
TOJET: The Turkish Online Journal of Educational Technology – January 2010, volume 9 Issue 1
Copyright The Turkish Online Journal of Educational Technology
249
Table 8: Factor Based Results of the t-test Analysis Regarding the Students’ Gender and Their Opinions on the Distance Education Website’s Usability
Questions Gender N X Ss Sd t P Female 807 3.58 0.632 0.022 Controllability Male 422 3.65 0.572 0.027 1.83 0.067
Female 807 3.57 0.601 0.021 Learnability Male 422 3.64 0.531 0.025 2.19 0.035*
Female 807 3.60 0.612 0.021 Helping Male 422 3.66 0.515 0.025 2.01 0.044*
Female 807 3.50 0.632 0.022 Appearance Male 422 3.54 0.531 0.025 1.12 0.259
Female 807 3.55 0.515 0.018 Effectiveness Male 422 3.61 0.460 0.022 2.09 0.037*
Female 807 3.57 0.638 0.022 Satisfaction Male 422 3.60 0.542 0.026 0.804 0.421
P<0.05 *A significant difference exists When Table 8 is looked through, significant differences on P<0.05 level are observed in the following factors concerning the gender variable’s effect;
• Learnability factor (t= -2.19, P=0.035), • Helping factor (t= -2.01, P=0.044), • Effectiveness factor (t= -2.09, P=0.037)
A significant difference on P<0.05 level is observed regarding the learnability factor in terms of gender
variable. As a result of the analysis performed, males ( X =3,64) significantly find the website easier to learn
than females do ( X =3,57). A significant difference on P<0.05 level is observed regarding the helping factor in terms of gender variable.
As a result of the analysis performed, males ( X =3.66) significantly find the website more helping to the
user than females do ( X =3.60). A significant difference on P<0.05 level is observed regarding the effectiveness factor in terms of gender
variable. As a result of the analysis performed, males ( X =3,61) significantly find the website more effective
than females do ( X =3.55).
Table 9: Factor Based Results of the Variance Analysis Regarding the Students’ Age Groups and Their Opinions on the Distance Education Website’s Usability
Factors Age Group N X Ss Sum of
Squares Sd Average
of Squares
F P
18-20 473 3.58 0.567
21-23 263 3.57 0.614 Between
the Groups 1.78 3 0.576
24-27 148 3.61 0.691 Inside the Group 459.77 1225 0.375
Controllability
27 and older 345 3.66 0.635 Total 461.56 1228
1.58 0.190
18-20 473 3.57 0.575
21-23 263 3.65 0.546 Between
the Groups 1.53 3 0.512
24-27 148 3.62 0.634 Inside the Group 410.45 1225 0.335 Learnability
27 and older 345 3.56 0.581 Total 411.99 1228
1.52 0.206
Helping 18-20 473 3.58 0.538 Between 3.34 3 1.11 3.30 0.020*
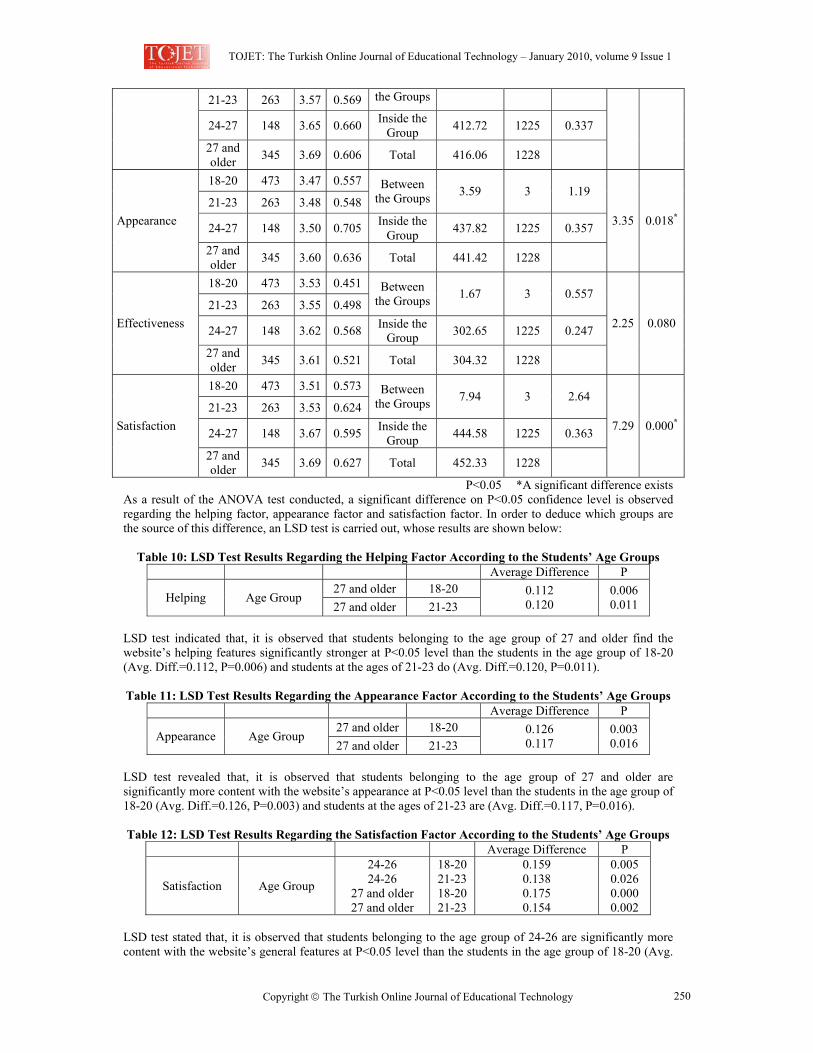
TOJET: The Turkish Online Journal of Educational Technology – January 2010, volume 9 Issue 1
Copyright The Turkish Online Journal of Educational Technology
250
21-23 263 3.57 0.569 the Groups
24-27 148 3.65 0.660 Inside the Group 412.72 1225 0.337
27 and older 345 3.69 0.606 Total 416.06 1228
18-20 473 3.47 0.557
21-23 263 3.48 0.548 Between
the Groups 3.59 3 1.19
24-27 148 3.50 0.705 Inside the Group 437.82 1225 0.357 Appearance
27 and older 345 3.60 0.636 Total 441.42 1228
3.35 0.018*
18-20 473 3.53 0.451
21-23 263 3.55 0.498 Between
the Groups 1.67 3 0.557
24-27 148 3.62 0.568 Inside the Group 302.65 1225 0.247 Effectiveness
27 and older 345 3.61 0.521 Total 304.32 1228
2.25 0.080
18-20 473 3.51 0.573
21-23 263 3.53 0.624 Between
the Groups 7.94 3 2.64
24-27 148 3.67 0.595 Inside the Group 444.58 1225 0.363 Satisfaction
27 and older 345 3.69 0.627 Total 452.33 1228
7.29 0.000*
P<0.05 *A significant difference exists As a result of the ANOVA test conducted, a significant difference on P<0.05 confidence level is observed regarding the helping factor, appearance factor and satisfaction factor. In order to deduce which groups are the source of this difference, an LSD test is carried out, whose results are shown below:
Table 10: LSD Test Results Regarding the Helping Factor According to the Students’ Age Groups Average Difference P
27 and older 18-20 Helping Age Group
27 and older 21-23 0.112 0.120
0.006 0.011
LSD test indicated that, it is observed that students belonging to the age group of 27 and older find the website’s helping features significantly stronger at P<0.05 level than the students in the age group of 18-20 (Avg. Diff.=0.112, P=0.006) and students at the ages of 21-23 do (Avg. Diff.=0.120, P=0.011). Table 11: LSD Test Results Regarding the Appearance Factor According to the Students’ Age Groups
Average Difference P 27 and older 18-20
Appearance Age Group 27 and older 21-23
0.126 0.117
0.003 0.016
LSD test revealed that, it is observed that students belonging to the age group of 27 and older are significantly more content with the website’s appearance at P<0.05 level than the students in the age group of 18-20 (Avg. Diff.=0.126, P=0.003) and students at the ages of 21-23 are (Avg. Diff.=0.117, P=0.016). Table 12: LSD Test Results Regarding the Satisfaction Factor According to the Students’ Age Groups
Average Difference P
Satisfaction Age Group
24-26 24-26
27 and older 27 and older
18-2021-23 18-2021-23
0.159 0.138 0.175 0.154
0.005 0.026 0.000 0.002
LSD test stated that, it is observed that students belonging to the age group of 24-26 are significantly more content with the website’s general features at P<0.05 level than the students in the age group of 18-20 (Avg.
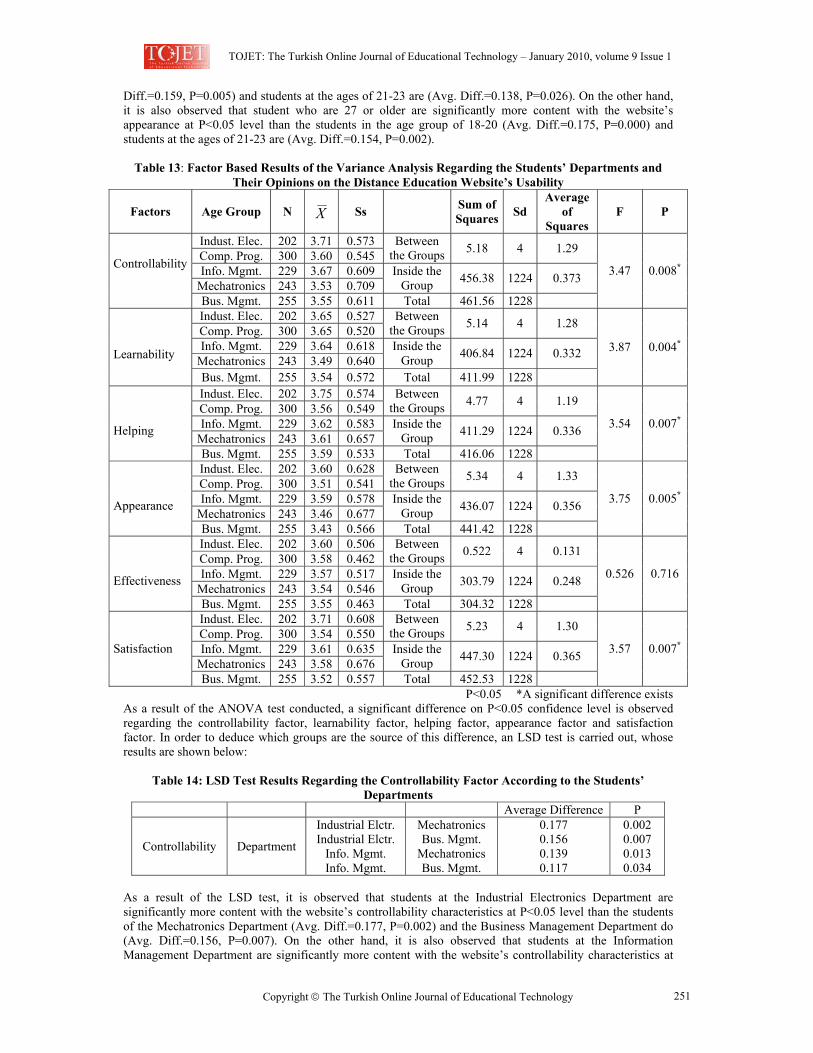
TOJET: The Turkish Online Journal of Educational Technology – January 2010, volume 9 Issue 1
Copyright The Turkish Online Journal of Educational Technology
251
Diff.=0.159, P=0.005) and students at the ages of 21-23 are (Avg. Diff.=0.138, P=0.026). On the other hand, it is also observed that student who are 27 or older are significantly more content with the website’s appearance at P<0.05 level than the students in the age group of 18-20 (Avg. Diff.=0.175, P=0.000) and students at the ages of 21-23 are (Avg. Diff.=0.154, P=0.002).
Table 13: Factor Based Results of the Variance Analysis Regarding the Students’ Departments and Their Opinions on the Distance Education Website’s Usability
Factors Age Group N X Ss Sum of Squares Sd
Average of
Squares F P
Indust. Elec. 202 3.71 0.573 Comp. Prog. 300 3.60 0.545
Between the Groups 5.18 4 1.29
Info. Mgmt. 229 3.67 0.609 Mechatronics 243 3.53 0.709
Inside the Group 456.38 1224 0.373
Controllability
Bus. Mgmt. 255 3.55 0.611 Total 461.56 1228
3.47 0.008*
Indust. Elec. 202 3.65 0.527 Comp. Prog. 300 3.65 0.520
Between the Groups 5.14 4 1.28
Info. Mgmt. 229 3.64 0.618 Mechatronics 243 3.49 0.640
Inside the Group 406.84 1224 0.332
Learnability
Bus. Mgmt. 255 3.54 0.572 Total 411.99 1228
3.87 0.004*
Indust. Elec. 202 3.75 0.574 Comp. Prog. 300 3.56 0.549
Between the Groups 4.77 4 1.19
Info. Mgmt. 229 3.62 0.583 Mechatronics 243 3.61 0.657
Inside the Group 411.29 1224 0.336
Helping
Bus. Mgmt. 255 3.59 0.533 Total 416.06 1228
3.54 0.007*
Indust. Elec. 202 3.60 0.628 Comp. Prog. 300 3.51 0.541
Between the Groups 5.34 4 1.33
Info. Mgmt. 229 3.59 0.578 Mechatronics 243 3.46 0.677
Inside the Group 436.07 1224 0.356
Appearance
Bus. Mgmt. 255 3.43 0.566 Total 441.42 1228
3.75 0.005*
Indust. Elec. 202 3.60 0.506 Comp. Prog. 300 3.58 0.462
Between the Groups 0.522 4 0.131
Info. Mgmt. 229 3.57 0.517 Mechatronics 243 3.54 0.546
Inside the Group 303.79 1224 0.248
Effectiveness
Bus. Mgmt. 255 3.55 0.463 Total 304.32 1228
0.526 0.716
Indust. Elec. 202 3.71 0.608 Comp. Prog. 300 3.54 0.550
Between the Groups 5.23 4 1.30
Info. Mgmt. 229 3.61 0.635 Mechatronics 243 3.58 0.676
Inside the Group 447.30 1224 0.365 Satisfaction
Bus. Mgmt. 255 3.52 0.557 Total 452.53 1228
3.57 0.007*
P<0.05 *A significant difference exists As a result of the ANOVA test conducted, a significant difference on P<0.05 confidence level is observed regarding the controllability factor, learnability factor, helping factor, appearance factor and satisfaction factor. In order to deduce which groups are the source of this difference, an LSD test is carried out, whose results are shown below:
Table 14: LSD Test Results Regarding the Controllability Factor According to the Students’ Departments
Average Difference P
Controllability Department
Industrial Elctr. Industrial Elctr.
Info. Mgmt. Info. Mgmt.
Mechatronics Bus. Mgmt.
Mechatronics Bus. Mgmt.
0.177 0.156 0.139 0.117
0.002 0.007 0.013 0.034
As a result of the LSD test, it is observed that students at the Industrial Electronics Department are significantly more content with the website’s controllability characteristics at P<0.05 level than the students of the Mechatronics Department (Avg. Diff.=0.177, P=0.002) and the Business Management Department do (Avg. Diff.=0.156, P=0.007). On the other hand, it is also observed that students at the Information Management Department are significantly more content with the website’s controllability characteristics at
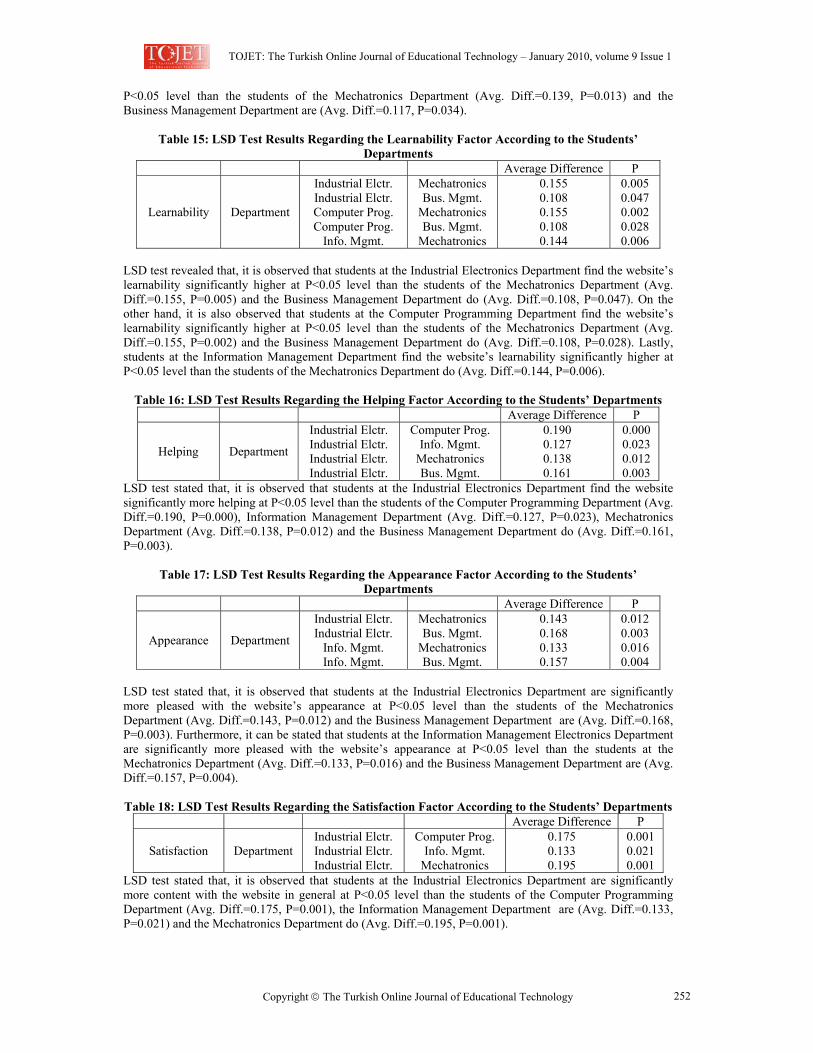
TOJET: The Turkish Online Journal of Educational Technology – January 2010, volume 9 Issue 1
Copyright The Turkish Online Journal of Educational Technology
252
P<0.05 level than the students of the Mechatronics Department (Avg. Diff.=0.139, P=0.013) and the Business Management Department are (Avg. Diff.=0.117, P=0.034).
Table 15: LSD Test Results Regarding the Learnability Factor According to the Students’ Departments
Average Difference P
Learnability Department
Industrial Elctr. Industrial Elctr. Computer Prog. Computer Prog.
Info. Mgmt.
MechatronicsBus. Mgmt.
Mechatronics Bus. Mgmt.
Mechatronics
0.155 0.108 0.155 0.108 0.144
0.005 0.047 0.002 0.028 0.006
LSD test revealed that, it is observed that students at the Industrial Electronics Department find the website’s learnability significantly higher at P<0.05 level than the students of the Mechatronics Department (Avg. Diff.=0.155, P=0.005) and the Business Management Department do (Avg. Diff.=0.108, P=0.047). On the other hand, it is also observed that students at the Computer Programming Department find the website’s learnability significantly higher at P<0.05 level than the students of the Mechatronics Department (Avg. Diff.=0.155, P=0.002) and the Business Management Department do (Avg. Diff.=0.108, P=0.028). Lastly, students at the Information Management Department find the website’s learnability significantly higher at P<0.05 level than the students of the Mechatronics Department do (Avg. Diff.=0.144, P=0.006).
Table 16: LSD Test Results Regarding the Helping Factor According to the Students’ Departments Average Difference P
Helping Department
Industrial Elctr. Industrial Elctr. Industrial Elctr. Industrial Elctr.
Computer Prog.Info. Mgmt.
Mechatronics Bus. Mgmt.
0.190 0.127 0.138 0.161
0.000 0.023 0.012 0.003
LSD test stated that, it is observed that students at the Industrial Electronics Department find the website significantly more helping at P<0.05 level than the students of the Computer Programming Department (Avg. Diff.=0.190, P=0.000), Information Management Department (Avg. Diff.=0.127, P=0.023), Mechatronics Department (Avg. Diff.=0.138, P=0.012) and the Business Management Department do (Avg. Diff.=0.161, P=0.003).
Table 17: LSD Test Results Regarding the Appearance Factor According to the Students’ Departments
Average Difference P
Appearance Department
Industrial Elctr. Industrial Elctr.
Info. Mgmt. Info. Mgmt.
MechatronicsBus. Mgmt.
MechatronicsBus. Mgmt.
0.143 0.168 0.133 0.157
0.012 0.003 0.016 0.004
LSD test stated that, it is observed that students at the Industrial Electronics Department are significantly more pleased with the website’s appearance at P<0.05 level than the students of the Mechatronics Department (Avg. Diff.=0.143, P=0.012) and the Business Management Department are (Avg. Diff.=0.168, P=0.003). Furthermore, it can be stated that students at the Information Management Electronics Department are significantly more pleased with the website’s appearance at P<0.05 level than the students at the Mechatronics Department (Avg. Diff.=0.133, P=0.016) and the Business Management Department are (Avg. Diff.=0.157, P=0.004). Table 18: LSD Test Results Regarding the Satisfaction Factor According to the Students’ Departments
Average Difference P
Satisfaction Department Industrial Elctr. Industrial Elctr. Industrial Elctr.
Computer Prog. Info. Mgmt.
Mechatronics
0.175 0.133 0.195
0.001 0.021 0.001
LSD test stated that, it is observed that students at the Industrial Electronics Department are significantly more content with the website in general at P<0.05 level than the students of the Computer Programming Department (Avg. Diff.=0.175, P=0.001), the Information Management Department are (Avg. Diff.=0.133, P=0.021) and the Mechatronics Department do (Avg. Diff.=0.195, P=0.001).
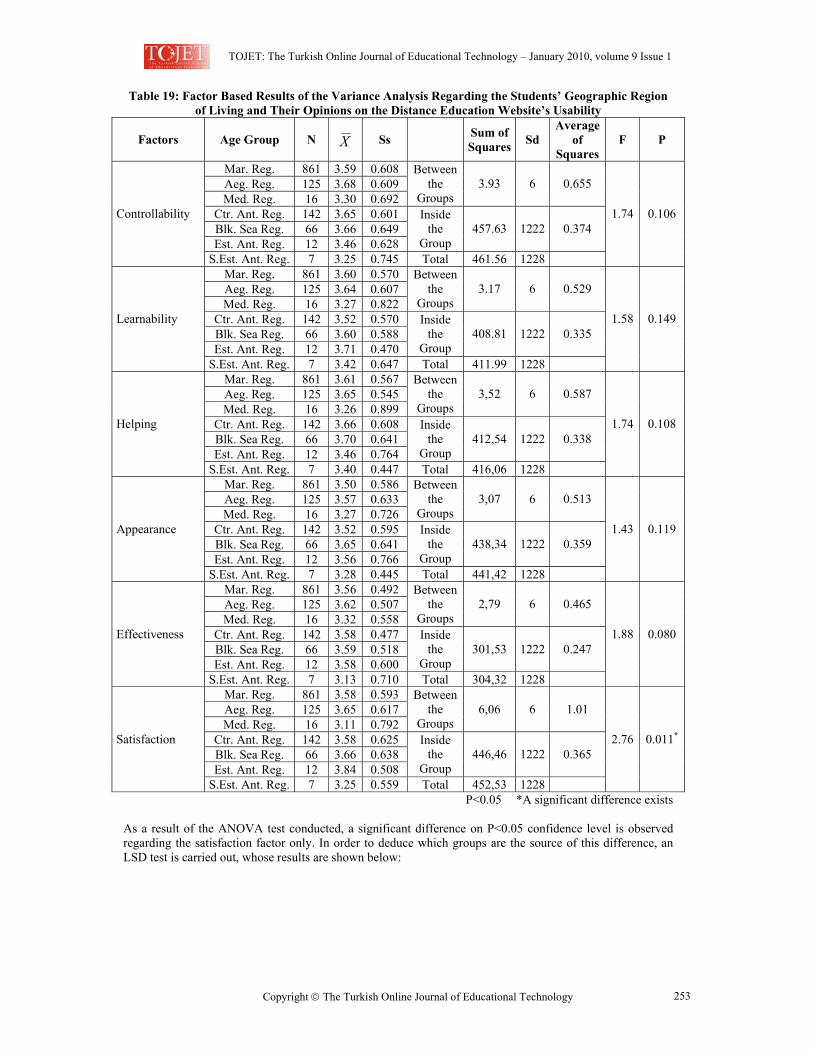
TOJET: The Turkish Online Journal of Educational Technology – January 2010, volume 9 Issue 1
Copyright The Turkish Online Journal of Educational Technology
253
Table 19: Factor Based Results of the Variance Analysis Regarding the Students’ Geographic Region of Living and Their Opinions on the Distance Education Website’s Usability
Factors Age Group N X Ss Sum of Squares Sd
Average of
Squares F P
Mar. Reg. 861 3.59 0.608 Aeg. Reg. 125 3.68 0.609 Med. Reg. 16 3.30 0.692
Between the
Groups 3.93 6 0.655
Ctr. Ant. Reg. 142 3.65 0.601 Blk. Sea Reg. 66 3.66 0.649 Est. Ant. Reg. 12 3.46 0.628
Inside the
Group 457.63 1222 0.374
Controllability
S.Est. Ant. Reg. 7 3.25 0.745 Total 461.56 1228
1.74 0.106
Mar. Reg. 861 3.60 0.570 Aeg. Reg. 125 3.64 0.607 Med. Reg. 16 3.27 0.822
Between the
Groups 3.17 6 0.529
Ctr. Ant. Reg. 142 3.52 0.570 Blk. Sea Reg. 66 3.60 0.588 Est. Ant. Reg. 12 3.71 0.470
Inside the
Group 408.81 1222 0.335
Learnability
S.Est. Ant. Reg. 7 3.42 0.647 Total 411.99 1228
1.58 0.149
Mar. Reg. 861 3.61 0.567 Aeg. Reg. 125 3.65 0.545 Med. Reg. 16 3.26 0.899
Between the
Groups 3,52 6 0.587
Ctr. Ant. Reg. 142 3.66 0.608 Blk. Sea Reg. 66 3.70 0.641 Est. Ant. Reg. 12 3.46 0.764
Inside the
Group 412,54 1222 0.338
Helping
S.Est. Ant. Reg. 7 3.40 0.447 Total 416,06 1228
1.74 0.108
Mar. Reg. 861 3.50 0.586 Aeg. Reg. 125 3.57 0.633 Med. Reg. 16 3.27 0.726
Between the
Groups 3,07 6 0.513
Ctr. Ant. Reg. 142 3.52 0.595 Blk. Sea Reg. 66 3.65 0.641 Est. Ant. Reg. 12 3.56 0.766
Inside the
Group 438,34 1222 0.359
Appearance
S.Est. Ant. Reg. 7 3.28 0.445 Total 441,42 1228
1.43 0.119
Mar. Reg. 861 3.56 0.492 Aeg. Reg. 125 3.62 0.507 Med. Reg. 16 3.32 0.558
Between the
Groups 2,79 6 0.465
Ctr. Ant. Reg. 142 3.58 0.477 Blk. Sea Reg. 66 3.59 0.518 Est. Ant. Reg. 12 3.58 0.600
Inside the
Group 301,53 1222 0.247
Effectiveness
S.Est. Ant. Reg. 7 3.13 0.710 Total 304,32 1228
1.88 0.080
Mar. Reg. 861 3.58 0.593 Aeg. Reg. 125 3.65 0.617 Med. Reg. 16 3.11 0.792
Between the
Groups 6,06 6 1.01
Ctr. Ant. Reg. 142 3.58 0.625 Blk. Sea Reg. 66 3.66 0.638 Est. Ant. Reg. 12 3.84 0.508
Inside the
Group 446,46 1222 0.365
Satisfaction
S.Est. Ant. Reg. 7 3.25 0.559 Total 452,53 1228
2.76 0.011*
P<0.05 *A significant difference exists As a result of the ANOVA test conducted, a significant difference on P<0.05 confidence level is observed regarding the satisfaction factor only. In order to deduce which groups are the source of this difference, an LSD test is carried out, whose results are shown below:
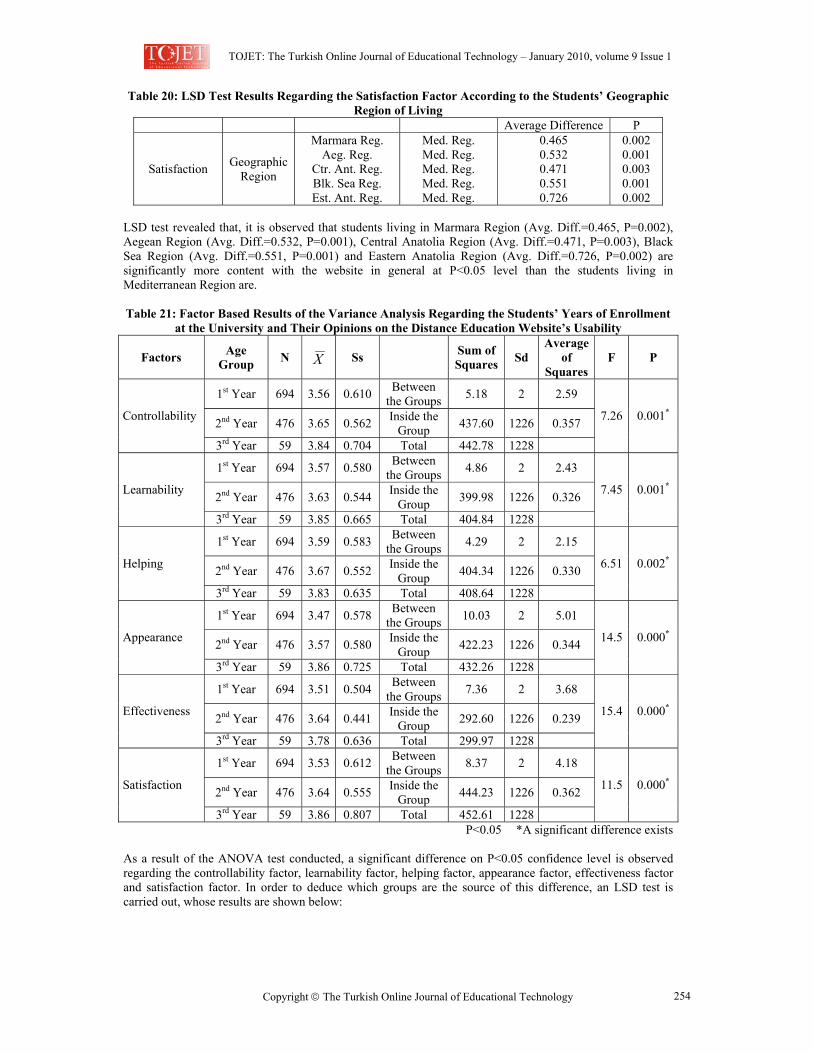
TOJET: The Turkish Online Journal of Educational Technology – January 2010, volume 9 Issue 1
Copyright The Turkish Online Journal of Educational Technology
254
Table 20: LSD Test Results Regarding the Satisfaction Factor According to the Students’ Geographic Region of Living
Average Difference P
Satisfaction Geographic Region
Marmara Reg. Aeg. Reg.
Ctr. Ant. Reg. Blk. Sea Reg. Est. Ant. Reg.
Med. Reg. Med. Reg. Med. Reg. Med. Reg. Med. Reg.
0.465 0.532 0.471 0.551 0.726
0.002 0.001 0.003 0.001 0.002
LSD test revealed that, it is observed that students living in Marmara Region (Avg. Diff.=0.465, P=0.002), Aegean Region (Avg. Diff.=0.532, P=0.001), Central Anatolia Region (Avg. Diff.=0.471, P=0.003), Black Sea Region (Avg. Diff.=0.551, P=0.001) and Eastern Anatolia Region (Avg. Diff.=0.726, P=0.002) are significantly more content with the website in general at P<0.05 level than the students living in Mediterranean Region are. Table 21: Factor Based Results of the Variance Analysis Regarding the Students’ Years of Enrollment
at the University and Their Opinions on the Distance Education Website’s Usability
Factors Age Group N X Ss Sum of
Squares Sd Average
of Squares
F P
1st Year 694 3.56 0.610 Between the Groups 5.18 2 2.59
2nd Year 476 3.65 0.562 Inside the Group 437.60 1226 0.357 Controllability
3rd Year 59 3.84 0.704 Total 442.78 1228
7.26 0.001*
1st Year 694 3.57 0.580 Between the Groups 4.86 2 2.43
2nd Year 476 3.63 0.544 Inside the Group 399.98 1226 0.326 Learnability
3rd Year 59 3.85 0.665 Total 404.84 1228
7.45 0.001*
1st Year 694 3.59 0.583 Between the Groups 4.29 2 2.15
2nd Year 476 3.67 0.552 Inside the Group 404.34 1226 0.330 Helping
3rd Year 59 3.83 0.635 Total 408.64 1228
6.51 0.002*
1st Year 694 3.47 0.578 Between the Groups 10.03 2 5.01
2nd Year 476 3.57 0.580 Inside the Group 422.23 1226 0.344 Appearance
3rd Year 59 3.86 0.725 Total 432.26 1228
14.5 0.000*
1st Year 694 3.51 0.504 Between the Groups 7.36 2 3.68
2nd Year 476 3.64 0.441 Inside the Group 292.60 1226 0.239 Effectiveness
3rd Year 59 3.78 0.636 Total 299.97 1228
15.4 0.000*
1st Year 694 3.53 0.612 Between the Groups 8.37 2 4.18
2nd Year 476 3.64 0.555 Inside the Group 444.23 1226 0.362 Satisfaction
3rd Year 59 3.86 0.807 Total 452.61 1228
11.5 0.000*
P<0.05 *A significant difference exists As a result of the ANOVA test conducted, a significant difference on P<0.05 confidence level is observed regarding the controllability factor, learnability factor, helping factor, appearance factor, effectiveness factor and satisfaction factor. In order to deduce which groups are the source of this difference, an LSD test is carried out, whose results are shown below:

TOJET: The Turkish Online Journal of Educational Technology – January 2010, volume 9 Issue 1
Copyright The Turkish Online Journal of Educational Technology
255
Table 22: LSD Test Results Regarding the Controllability Factor According to the Students’ Years of Enrollment at the University
Average Difference P
Controllability Years in the University
3rd Year 3rd Year
1st Year 2nd Year
0.272 0.187
0.001 0.023
LSD test stated that, it is observed that students in their 3rd year at the university are significantly more content with the website’s controllability characteristics at P<0.05 level than the students in their 1st year (Avg. Diff.=0.272, P=0.001) and in their 2nd year are (Avg. Diff.=0.187, P=0.023).
Table 23: LSD Test Results Regarding the Learnability Factor According to the Students’ Years of Enrollment at the University
Average Difference P
Learnability Years in the University
3rd Year 3rd Year
1st Year 2nd Year
0.280 0.214
0.000 0.007
LSD test revealed that, it is observed that students in their 3rd year at the university find the website’s learnability significantly higher at P<0.05 level than the students in their 1st year (Avg. Diff.=0.280, P=0.000) and in their 2nd year do (Avg. Diff.=0.214, P=0.007).
Table 24: LSD Test Results Regarding the Helping Factor According to the Students’ Years of Enrollment at the University
Average Difference P
Helping Years in the University
3rd Year 3rd Year
1st Year 2nd Year
0.236 0.151
0.014 0.002
As a result of the LSD test, it is observed that students in their 3rd year at the university find the website’s helping features significantly better at P<0.05 level than the students in their 1st year (Avg. Diff.=0.236, P=0.014) and in their 2nd year do (Avg. Diff.=0.151, P=0.002).
Table 25: LSD Test Results Regarding the Appearance Factor According to the Students’ Years of Enrollment at the University
Average Difference P
Appearance Years in the University
3rd Year 3rd Year 2nd Year
1st Year 2nd Year 1st Year
0.393 0.288 0.105
0.000 0.000 0.003
LSD test stated that, it is observed that students in their 3rd year at the university are significantly more pleased with the website’s appearance at P<0.05 level than the students in their 1st year (Avg. Diff.=0.393, P=0.000) and in their 2nd year are (Avg. Diff.=0.288, P=0.000). Also it can be stated that students in their 2nd year at the university are significantly more pleased with the website’s appearance at P<0.05 level than the students in their 1st year (Avg. Diff.=0.105, P=0.003).
Table 26: LSD Test Results Regarding the Effectiveness Factor According to the Students’ Years of Enrollment at the University
Average Difference P
Effectiveness Years in the University
3rd Year 3rd Year 2nd Year
1st Year 2nd Year 1st Year
0.273 0.145 0.127
0.000 0.031 0.000
LSD test revealed that, it is observed that students in their 3rd year at the university find the website significantly more effective at P<0.05 level than the students in their 1st year (Avg. Diff.=0.273, P=0.000) and in their 2nd year do (Avg. Diff.=0.145, P=0.031). Also it can be stated that students in their 2nd year at the university find the website significantly more effective with the at P<0.05 level than the students in their 1st year do (Avg. Diff.=0.127, P=0.000).
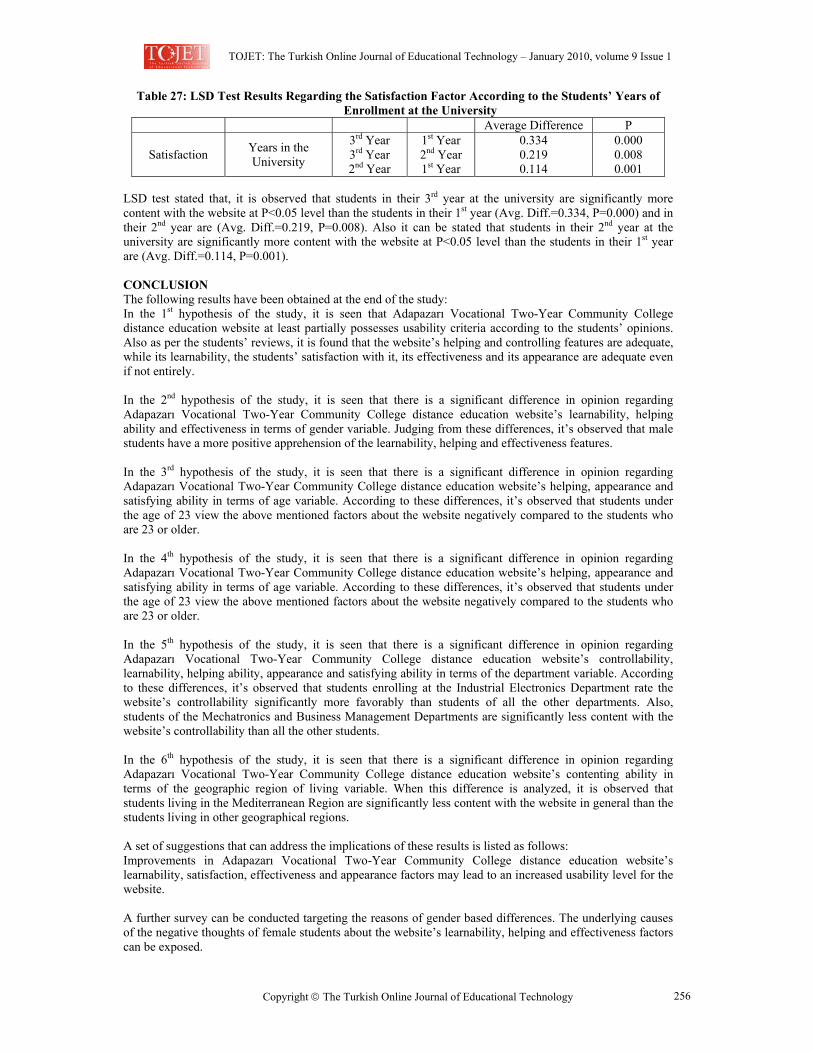
TOJET: The Turkish Online Journal of Educational Technology – January 2010, volume 9 Issue 1
Copyright The Turkish Online Journal of Educational Technology
256
Table 27: LSD Test Results Regarding the Satisfaction Factor According to the Students’ Years of Enrollment at the University
Average Difference P
Satisfaction Years in the University
3rd Year 3rd Year 2nd Year
1st Year 2nd Year 1st Year
0.334 0.219 0.114
0.000 0.008 0.001
LSD test stated that, it is observed that students in their 3rd year at the university are significantly more content with the website at P<0.05 level than the students in their 1st year (Avg. Diff.=0.334, P=0.000) and in their 2nd year are (Avg. Diff.=0.219, P=0.008). Also it can be stated that students in their 2nd year at the university are significantly more content with the website at P<0.05 level than the students in their 1st year are (Avg. Diff.=0.114, P=0.001). CONCLUSION The following results have been obtained at the end of the study: In the 1st hypothesis of the study, it is seen that Adapazarı Vocational Two-Year Community College distance education website at least partially possesses usability criteria according to the students’ opinions. Also as per the students’ reviews, it is found that the website’s helping and controlling features are adequate, while its learnability, the students’ satisfaction with it, its effectiveness and its appearance are adequate even if not entirely. In the 2nd hypothesis of the study, it is seen that there is a significant difference in opinion regarding Adapazarı Vocational Two-Year Community College distance education website’s learnability, helping ability and effectiveness in terms of gender variable. Judging from these differences, it’s observed that male students have a more positive apprehension of the learnability, helping and effectiveness features. In the 3rd hypothesis of the study, it is seen that there is a significant difference in opinion regarding Adapazarı Vocational Two-Year Community College distance education website’s helping, appearance and satisfying ability in terms of age variable. According to these differences, it’s observed that students under the age of 23 view the above mentioned factors about the website negatively compared to the students who are 23 or older. In the 4th hypothesis of the study, it is seen that there is a significant difference in opinion regarding Adapazarı Vocational Two-Year Community College distance education website’s helping, appearance and satisfying ability in terms of age variable. According to these differences, it’s observed that students under the age of 23 view the above mentioned factors about the website negatively compared to the students who are 23 or older. In the 5th hypothesis of the study, it is seen that there is a significant difference in opinion regarding Adapazarı Vocational Two-Year Community College distance education website’s controllability, learnability, helping ability, appearance and satisfying ability in terms of the department variable. According to these differences, it’s observed that students enrolling at the Industrial Electronics Department rate the website’s controllability significantly more favorably than students of all the other departments. Also, students of the Mechatronics and Business Management Departments are significantly less content with the website’s controllability than all the other students. In the 6th hypothesis of the study, it is seen that there is a significant difference in opinion regarding Adapazarı Vocational Two-Year Community College distance education website’s contenting ability in terms of the geographic region of living variable. When this difference is analyzed, it is observed that students living in the Mediterranean Region are significantly less content with the website in general than the students living in other geographical regions. A set of suggestions that can address the implications of these results is listed as follows: Improvements in Adapazarı Vocational Two-Year Community College distance education website’s learnability, satisfaction, effectiveness and appearance factors may lead to an increased usability level for the website. A further survey can be conducted targeting the reasons of gender based differences. The underlying causes of the negative thoughts of female students about the website’s learnability, helping and effectiveness factors can be exposed.
TOJET: The Turkish Online Journal of Educational Technology – January 2010, volume 9 Issue 1
Copyright The Turkish Online Journal of Educational Technology
257
A comparison study regarding the level of expectations of the younger students and the older students about Adapazarı Vocational Two-Year Community College distance education website can be carried out. The motive for such a study is the assertion that the internet is a rapidly developing phenomenon leading to younger students being more interested in it and also more occupied with it, which in turn means their expectation about the website are higher. A survey can be carried out regarding why students enrolling at the Mechatronics and Business Management Departments are dissatisfied with Adapazarı Vocational Two-Year Community College distance education website’s controllability. The web pages associated with the Industrial Electronics Department and the Mechatronics and Business Management Departments can be compared and contrasted in order to detect possible deficiencies regarding controlling features in the latter group. The reasons of why students living in the Mediterranean Region are have this very low satisfaction about the website can be searched. In order to increase their satisfaction level, a set of activities targeting to motivate specifically the students from this region can be carried out. In addition, analysis based on the survey items is in line with the analysis based on the factors. The item based analysis showed that females compared to males, younger students compared to older students, freshmen students compared to senior students, students of Business Management and Mechatronics Departments compared to students in other departments and students living in the Mediterranean Region compared to students living in other regions have rated various items more negatively. The survey has been applied only on the students enrolled at the distance education program of Sakarya University Adapazarı Vocational School of Higher Education. The survey can also be conducted on students enrolled at other distance education programs and that survey can be compared to the results of this study and be assessed for the purpose of enhancing the usability level of distance education websites. REFERENCES Ahlstrom, V. & Longo, K. (2001), “Human factors design guide update (Report number DOT/FAA/CT-
96/01): A revision to chapter 8”, Computer Human Interface Guidelines, http://acb220.tc.faa.gov/technotes/dot_faa_ct-01_08.pdf (date: 10.03.2008)
Badre, A.N. (2002), Shaping Web Usability: Interaction Design in Context, Addison Wesley Professional, Boston.
Booth, P.A., & Marshall, C.J. (1989). “An introduction to human-computer interaction”, chapter 5. Lawrence Erlbaum Associates, Publishers, London.
Butler, K. (1996), “Usability Engineering Turns 10”, Interactions, 3(1), 58-75. Chaparro, B.S. & Bernard, M.L. (2001). Finding information on the Web: Does the amount of whitespace
really matter? Proceedings of the Tenth Annual Usability Professionals’ Association Conference. Galitz, W.O. (2002). The Essential Guide to User Interface Design. New York: John Wiley & Sons. Glatter, R. & Wedell, E. G. (1971), Study by Correpondence, Longman, UK. Holmberg, B. (1990), Perspectives of Research on Distance Education, 2nd Update and Expanded Edition,
Fernuniversiat, Hage, Germany. Hughes, K. (1994), Entering the World-Wide Web: A guide to cyberspace, Enterprise Integration
Technologies. Hutchinson, T., et. al. (2002), “Using Eye Tracking Technology For Web Site Usability Analysis: The
Application Of Erica To Gefanuc.Com” IEEE Systems and Information Design Symposium, University of Virginia, ABD.
Jakob Nielsen's Usable Information Technology. (2008). http://www.useit.com. (datei: 24.03.2008) Kenworthy, B. (1991). “Old Technology, New Solutions: The Potential of Educational Radio for
Development in Mongolia”, Ed Journal, vol.9, num.1, USA Mackenzie, C., Edward, L., ve Rigby, P. (1968), Correpondence Instruction in the United States, Mcgraw
Hill Book Company, Nweyork, USA. Mackenzie, C., Edward, L. (1971), The Changing World of Correspondence Study, The Pennsylvania State
University Pres, University Park, London, UK. MARANGRAPHICS (1996), Creating Web Pages Simplified, IDG Boks, Ontario,Canada. Mobrand, K.A. & Spyridakis, J.H. (2002). A web-based study of user performance with enhanced local
navigational cues. Proceedings of the IEEE International Professional Communication Conference, 500-508.

TOJET: The Turkish Online Journal of Educational Technology – January 2010, volume 9 Issue 1
Copyright The Turkish Online Journal of Educational Technology
258
Moore, M. (1990), Background and Overwiev of Contemporary American Distance Education, Contemporary Issues in American Distance Education, Pergamon Pres, USA
Nielsen, J. (2000), Designing Web Usability, New Riders, Indianapolis. Nielsen, J. & NORMAN, D. (2000), “Web Site Usability: Usability On The Web Isn’t A Luxury,
http://www.informationweek.com/773/web.htm (erişim tarihi: 20.05.2008) W3C. (2008), “Clean Up Your Web Pages with HTML Tidy”, http://www.w3.org/People/Raggett/tidy/
(date: 01.02.2008)
Related Documents