Tuberculosis in England 2019 report: Executive Summary Presenting data to end of 2018

Welcome message from author
This document is posted to help you gain knowledge. Please leave a comment to let me know what you think about it! Share it to your friends and learn new things together.
Transcript
Tuberculosis in England 2019 report: Executive Summary
Presenting data to end of 2018
Tuberculosis in England 2019 report: Executive Summary
2
About Public Health England
Public Health England exists to protect and improve the nation’s health and wellbeing,
and reduce health inequalities. We do this through world-class science, knowledge and
intelligence, advocacy, partnerships and the delivery of specialist public health
services. We are an executive agency of the Department of Health, and are a distinct
delivery organisation with operational autonomy to advise and support government,
local authorities and the NHS in a professionally independent manner.
Public Health England
Wellington House
133-155 Waterloo Road
London SE1 8UG
Tel: 020 7654 8000
www.gov.uk/phe
Twitter: @PHE_uk
Facebook: www.facebook.com/PublicHealthEngland
Prepared by: Tuberculosis Unit, National Infection Service, PHE
For queries relating to this document, please contact: [email protected]
© Crown copyright 2019
You may re-use this information (excluding logos) free of charge in any format or
medium, under the terms of the Open Government Licence v3.0. To view this licence,
visit OGL. Where we have identified any third party copyright information you will need
to obtain permission from the copyright holders concerned.
Published July 2019
PHE publications PHE supports the UN
gateway number: GW-594 Sustainable Development Goals

Tuberculosis in England 2019 report: Executive Summary
3
Contents
Contents 3
Background 4
Executive summary 5
TB notifications and incidence 6
Laboratory confirmation of TB 6
TB Transmission 7
Delay from symptom onset to treatment start 7
TB outcomes in the drug sensitive cohort 8
Drug resistant TB and outcomes in the drug resistant cohort 8
TB in under-served populations 9
TB-HIV co-infection and HIV testing among TB cases 10
BCG vaccination 10
Latent TB infection testing and treatment 10
United Kingdom TB pre-entry screening programme 11
Conclusions 11
References 12

Tuberculosis in England 2019 report: Executive Summary
4
Background
This is an Executive Summary of data on tuberculosis (TB) notifications made to the
Enhanced Tuberculosis Surveillance system (ETS) in England to the end of 2018.
Detailed results for 2018 are published in the annual report ‘Tuberculosis in England:
2019 report’, available here.
This summary includes the main points of note in the report supported by important
figures and aims to provide a readily accessible summary for individuals and
organisations working in the field of TB.

Tuberculosis in England 2019 report: Executive Summary
5
Executive summary
The number of people with TB in England has fallen from a peak of 8,280 in 2011 to
4,655 in 2018 – a reduction of approximately 44%. The incidence of TB in 2018 (8.3 per
100,000 population) was the lowest TB rate ever recorded in England. However, if we
are to reach the World Health Organisation’s (WHO) End TB Strategy target of a 90%
reduction in new notifications by 2035 [1], considerable efforts and new, innovative
approaches will be needed to eliminate TB in England. Some of the important
challenges include:
• understanding that variation in TB incidence and patient profiles faced across the
country means no single approach will be sufficient – even within a single city or area
• the need to focus on addressing the needs of people with social risk factors (SRFs)
such as alcohol misuse, drug misuse, homelessness and/or imprisonment
• focusing on reducing transmission of TB in the UK using techniques such as Whole
Genome Sequencing (WGS) to better understand transmission pathways and
networks
• ensuring excellence in MDR-TB management including through referral of people
with MDR-TB to the British Thoracic Society MDR-TB Clinical Advice Service
• maintaining latent TB infection (LTBI) testing and treatment to prevent reactivation of
TB and further transmission
• build on the work of the Collaborative TB Strategy for England 2015-2020 by
developing a 5-year action beyond 2020 to further drive down TB numbers
It is also important to recognise the work that has been undertaken to date and which
forms a good foundation for future work:
1. The well developed and mature relationships developed by local TB Control Boards
(TBCBs) that enable the multi-disciplinary approach will continue to be essential to
addressing the complex problems TB control presents.
2. As part of development of the new National TB Surveillance System (NTBS), a suite
of reports has been released that allow local teams to have improved access to
data. These reports can be used to monitor progress, assess the effectiveness of
local interventions and identify problems at an early stage. Further work to replace
the legacy systems (ETS and LTBR) will introduce functionality to streamline the
process of notifying new TB patients.
Tuberculosis in England 2019 report: Executive Summary
6
This summary now presents the main points of note from the annual ‘Tuberculosis in
England: 2019 report’, supported by important figures, in a readily accessible summary
for individuals and organisations working in the field of TB.
TB notifications and incidence
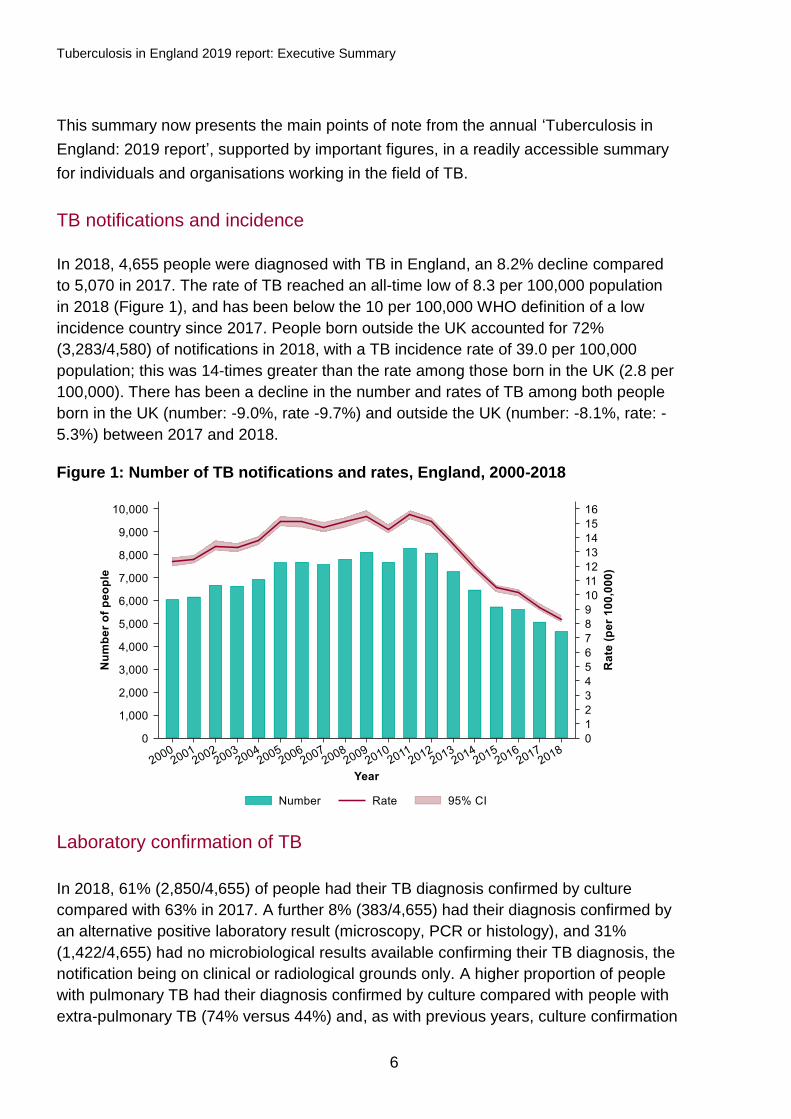
In 2018, 4,655 people were diagnosed with TB in England, an 8.2% decline compared
to 5,070 in 2017. The rate of TB reached an all-time low of 8.3 per 100,000 population
in 2018 (Figure 1), and has been below the 10 per 100,000 WHO definition of a low
incidence country since 2017. People born outside the UK accounted for 72%
(3,283/4,580) of notifications in 2018, with a TB incidence rate of 39.0 per 100,000
population; this was 14-times greater than the rate among those born in the UK (2.8 per
100,000). There has been a decline in the number and rates of TB among both people
born in the UK (number: -9.0%, rate -9.7%) and outside the UK (number: -8.1%, rate: -
5.3%) between 2017 and 2018.
Figure 1: Number of TB notifications and rates, England, 2000-2018
Laboratory confirmation of TB
In 2018, 61% (2,850/4,655) of people had their TB diagnosis confirmed by culture
compared with 63% in 2017. A further 8% (383/4,655) had their diagnosis confirmed by
an alternative positive laboratory result (microscopy, PCR or histology), and 31%
(1,422/4,655) had no microbiological results available confirming their TB diagnosis, the
notification being on clinical or radiological grounds only. A higher proportion of people
with pulmonary TB had their diagnosis confirmed by culture compared with people with
extra-pulmonary TB (74% versus 44%) and, as with previous years, culture confirmation
Tuberculosis in England 2019 report: Executive Summary
7
was lowest (31%; 47/151) among children (<15 years). Only 65% of people with
pulmonary TB had a recorded sputum smear result, of which 56% were positive. As of
the beginning of 2018, all new isolates of mycobacteria in England were examined by
whole genome sequencing (WGS), providing species identification, drug resistance
prediction and assessment of relatedness.
TB Transmission
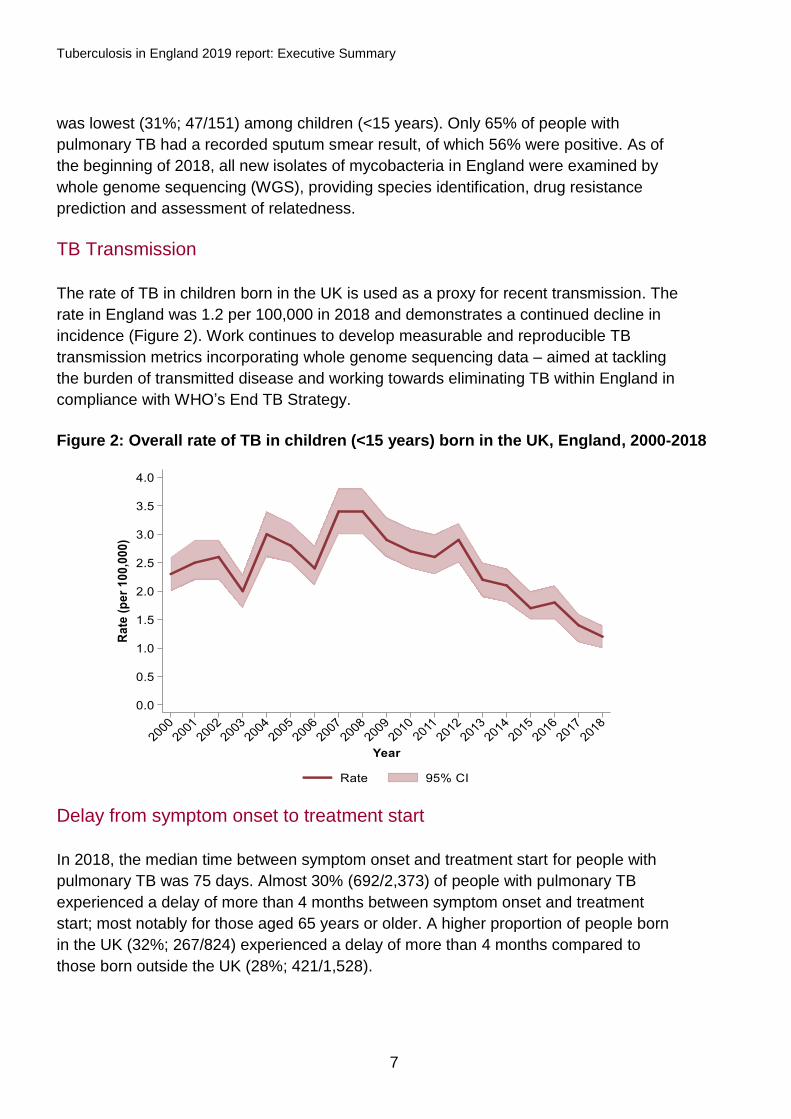
The rate of TB in children born in the UK is used as a proxy for recent transmission. The
rate in England was 1.2 per 100,000 in 2018 and demonstrates a continued decline in
incidence (Figure 2). Work continues to develop measurable and reproducible TB
transmission metrics incorporating whole genome sequencing data – aimed at tackling
the burden of transmitted disease and working towards eliminating TB within England in
compliance with WHO’s End TB Strategy.
Figure 2: Overall rate of TB in children (<15 years) born in the UK, England, 2000-2018
Delay from symptom onset to treatment start
In 2018, the median time between symptom onset and treatment start for people with
pulmonary TB was 75 days. Almost 30% (692/2,373) of people with pulmonary TB
experienced a delay of more than 4 months between symptom onset and treatment
start; most notably for those aged 65 years or older. A higher proportion of people born
in the UK (32%; 267/824) experienced a delay of more than 4 months compared to
those born outside the UK (28%; 421/1,528).
Tuberculosis in England 2019 report: Executive Summary
8
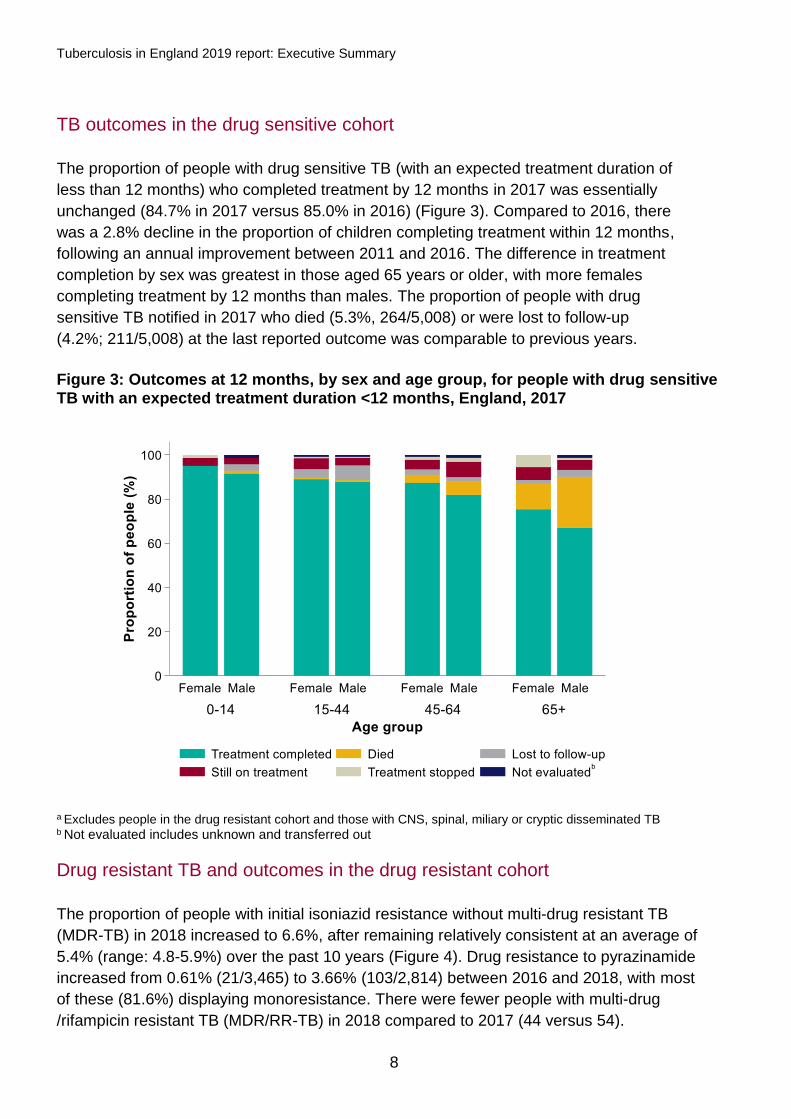
TB outcomes in the drug sensitive cohort
The proportion of people with drug sensitive TB (with an expected treatment duration of
less than 12 months) who completed treatment by 12 months in 2017 was essentially
unchanged (84.7% in 2017 versus 85.0% in 2016) (Figure 3). Compared to 2016, there
was a 2.8% decline in the proportion of children completing treatment within 12 months,
following an annual improvement between 2011 and 2016. The difference in treatment
completion by sex was greatest in those aged 65 years or older, with more females
completing treatment by 12 months than males. The proportion of people with drug
sensitive TB notified in 2017 who died (5.3%, 264/5,008) or were lost to follow-up
(4.2%; 211/5,008) at the last reported outcome was comparable to previous years.
Figure 3: Outcomes at 12 months, by sex and age group, for people with drug sensitive TB with an expected treatment duration <12 months, England, 2017
a Excludes people in the drug resistant cohort and those with CNS, spinal, miliary or cryptic disseminated TB b Not evaluated includes unknown and transferred out
Drug resistant TB and outcomes in the drug resistant cohort
The proportion of people with initial isoniazid resistance without multi-drug resistant TB
(MDR-TB) in 2018 increased to 6.6%, after remaining relatively consistent at an average of
5.4% (range: 4.8-5.9%) over the past 10 years (Figure 4). Drug resistance to pyrazinamide
increased from 0.61% (21/3,465) to 3.66% (103/2,814) between 2016 and 2018, with most
of these (81.6%) displaying monoresistance. There were fewer people with multi-drug
/rifampicin resistant TB (MDR/RR-TB) in 2018 compared to 2017 (44 versus 54).

Tuberculosis in England 2019 report: Executive Summary
9
Of these, 4 had confirmed initial extensively-drug resistant TB. The number of people in
the drug resistant cohort (confirmed or treated as MDR/RR-TB) decreased between 2017
and 2018 (62 versus 47). Of people in the 2016 drug resistant cohort, 65.2% (45/69) had
completed treatment by 24 months, and 10.1% (7/69) remained lost to follow-up by the last
recorded outcome.
Figure 4: Number and proportion of people notified with TB with initial drug resistance, England, 2000-2018
a People with culture confirmed TB with a result (DST or WGS) for at least isoniazid and rifampicin
TB in under-served populations
In 2018, 13.3% (539/4,062) of people diagnosed with TB who were aged 15 years or
older had a social risk factor (SRF; current alcohol misuse, current or history of drug
misuse, homelessness and/or imprisonment) – the highest proportion since data
collection began in 2010. Of these, 77% (417/539) had pulmonary disease. Among
people born in the UK, 20.7% (222/1,075) had a SRF compared to 10.6% (314/2,961)
among those born outside the UK. The rate of TB in the most deprived 10% of the
population was 16.6 per 100,000 compared to 3.0 per 100,000 in the least deprived
10%. MDR/RR-TB rates were similar for people with and without a SRF (1.2% versus
1.7%, respectively). Among people with drug sensitive TB, treatment completion was
however lower for those who had a SRF (78.7%; 418/531), compared to those without a
SRF (89.1%; 3,399/3,816). A higher proportion of people with a SRF died at their last
recorded outcome compared to people without a SRF (6.2% versus 4.0%, respectively),
and people with a SRF that were lost to follow-up (9.2%) was also 3-times greater than
those without a SRF (3.1%).

Tuberculosis in England 2019 report: Executive Summary
10
TB-HIV co-infection and HIV testing among TB cases
In 2018, 2.7% (120/4,504) of people with TB were co-infected with HIV – the lowest
proportion of co-infection since data became available in 2001 (Figure 5). The median
age of people with TB-HIV co-infection increased from 34 to 46 years old between 2001
and 2018, respectively. Most of these people (81.7%; 94/115) were born outside the
UK, most notably in sub-Saharan African countries (73.4%; 69/94).
Figure 5: Number and proportion of people with TB who have HIV co-infection,
England, 2001-2018
a Includes people with TB-HIV co-infection aged 15 years and older. b Proportion is calculated using the number of TB notifications with HIV co-infection plus the number who are un-notified with an MTBC isolate which matched to a person with HIV as the numerator, and the number of all TB notifications (with or without HIV co-infection) plus the number of un-notified TB isolates which matched to a person with HIV as the denominator.
BCG vaccination
There were 5 local authorities, all in London, that offered a universal BCG vaccination
programme in 2018 to 2019, compared with 6 in 2017/18. Among the 5 areas, BCG
coverage ranged from 36.8% in Brent to 68.9% in Newham. BCG vaccination coverage
increased in 3 of the 5 areas (Brent, Ealing and Redbridge) compared to 2017 to 2018.
Latent TB infection testing and treatment
There was a 3.5% increase in the number of LTBI tests received between 2017
(15,343) and 2018 (15,883). The LTBI test positivity rate declined to 15.8% in 2018,
compared to 17.0% in 2017 and 18.1% in 2016. A higher proportion of men tested
0
1
2
3
4
5
6
7
8
9
0
100
200
300
400
500
600
700
YearP
rop
ort
ion
of
peo
ple
(%
)
Nu
mb
er
of
peo
ple
Notified TB Unnotified TB Proportionᵇ
Tuberculosis in England 2019 report: Executive Summary
11
positive for LTBI than women across all age groups. People born in India and Pakistan
have been the most represented groups since 2016. Overall, LTBI treatment completion
has increased annually from 65.1% (358/550) in 2016 to 76.5% (349/456) in 2018.
United Kingdom TB pre-entry screening programme
In 2018, there were 304,234 screening episodes and 318 people with active TB were
detected. The number of prevalent people notified with pulmonary TB in the UK (within
1 year of entry to the UK) from countries within the pre-entry scheme decreased from
154 in 2014 (when the implementation of the scheme was completed) to 69 in 2018.
Conclusions
TB notifications and rates in England have declined for the seventh consecutive year.
Since 2014, the last year before the launch of the Collaborative TB Strategy for England
2015 to 2020 [2], England has seen an almost 28% reduction in TB incidence. The
number of TB notifications and rates in 2018 are the lowest recorded and England has
been classified as a low incidence country by the WHO since 2017 (defined as a rate of
less than 10 per 100,000 population). However, further work is needed to improve the
outcomes for those most at risk of TB, reduce in-country TB transmission and maintain
the decline in TB incidence and numbers. Key recommendations based on the findings
of the ‘Tuberculosis in England: 2019 report’ are available in the full text version of the
annual report. Wider recommendations on improving TB control in England are
available in the Strategy.
Work is now focusing on preparing a 5-year TB Action Plan (2020 to 2025) to move
England towards TB elimination. This TB Action Plan will build on the work carried out
during the current Strategy period, refocus this to deliver any outstanding areas-for-
action, consider new ideas, technologies and research and build on co-ordinated, multi-
stakeholder working to deliver improved TB control across England. We must now work
collectively to maintain and extend the downward trend in TB incidence and move
England toward TB elimination by 2035.

Tuberculosis in England 2019 report: Executive Summary
12
References
1. World Health Organization. Implementing the end TB strategy: the essentials. World
Health Organization; 2015.
2. Public Health England (2015). Collaborative tuberculosis strategy for England: 2015-
2020. https://www.gov.uk/government/publications/collaborative-tuberculosis-
strategy-for-england
Related Documents