Truck Rollover Warning Systems Evaluation Transportation Research Conference Thursday, November 3, 2016 Tom Sohrweide, PE, PTOE SEH Inc.

Welcome message from author
This document is posted to help you gain knowledge. Please leave a comment to let me know what you think about it! Share it to your friends and learn new things together.
Transcript

Truck Rollover Warning Systems Evaluation
Transportation Research Conference
Thursday, November 3, 2016
Tom Sohrweide, PE, PTOE
SEH Inc.

Acknowledgements
• MnDOT
– Dan Rowe
– Terry Haukom
• Contributors
– Image Sensing Systems (ISS), Inc.
– International Road Dynamics (IRD) Corp.
– American Transportation Research Institute (ATRI)

Agenda
• Project Purpose
• Problem Definition
• System Descriptions
• System Data
• System Comparisons
• Summary
• Questions

Project Purpose
Evaluation of two different systems aimed at preventing commercial truck rollover accidents.

The Problem

The 2 Systems
• System 1 – Truck Rollover Warning System (TROWS)
• System 2 – Traffic Management System Improvements
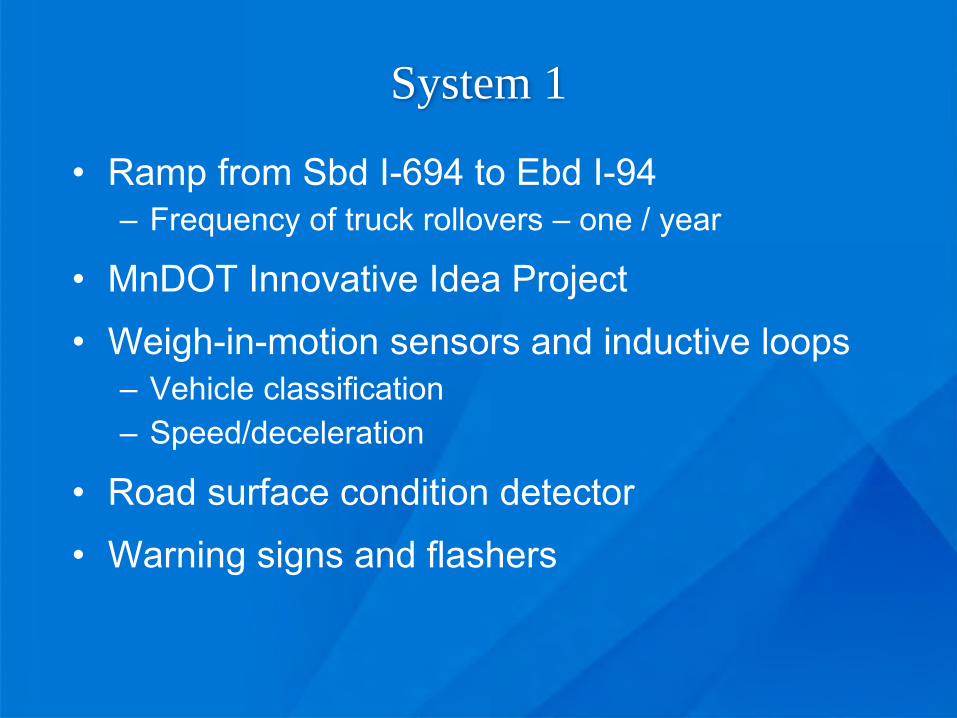
System 1
• Ramp from Sbd I-694 to Ebd I-94– Frequency of truck rollovers – one / year
• MnDOT Innovative Idea Project
• Weigh-in-motion sensors and inductive loops– Vehicle classification– Speed/deceleration
• Road surface condition detector
• Warning signs and flashers
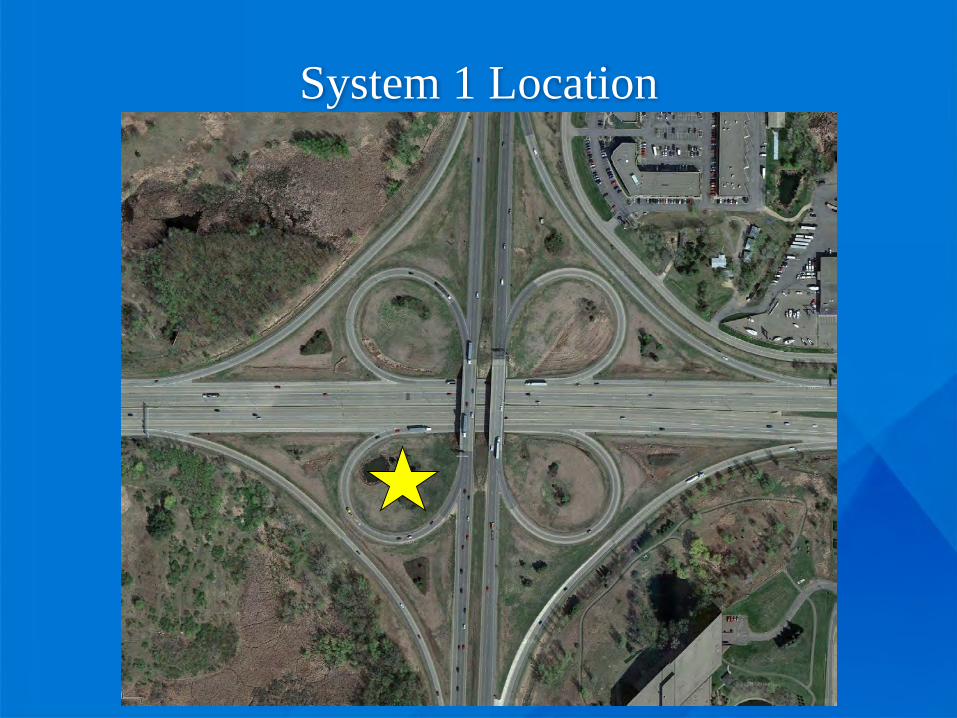
System 1 Location

System 1
• September 2012 – MnDOT upgraded signing
• August 2014 – Shadow testing
• September 2014 – Began operation
• July 2015 – Turned over to MnDOT

Signing

Function
Activation Point
Shut Off Point
Sign
Entry/Classification


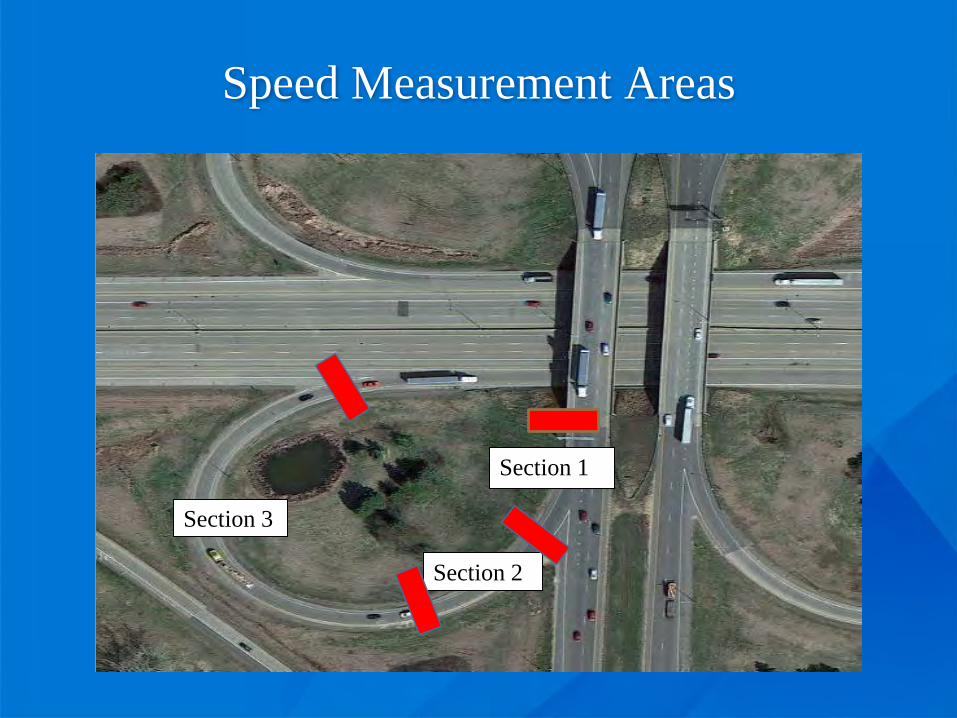
Speed Measurement Areas
Section 2
Section 3
Section 1

TROWS Speed Comparison
20
22
24
26
28
30
32
34
36
Sect 1 Avg 85th Sect 2 Avg 85th Sect 3 Avg 85th
ATRI Speed Data (mph)
Aug-12 Aug-13 Sep-14 Oct-14 May-15
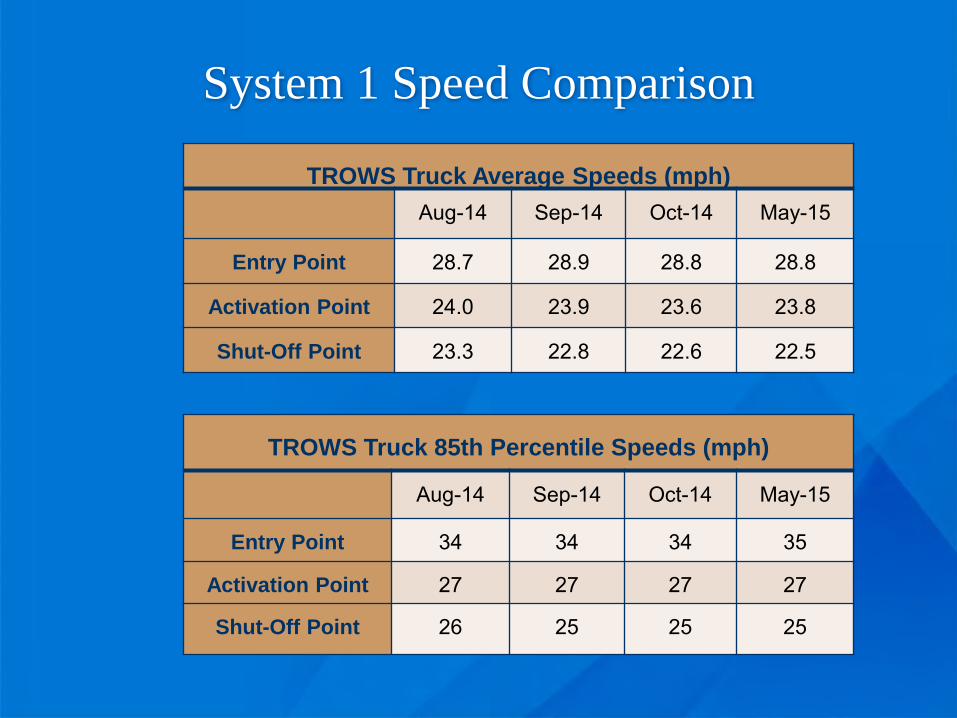
System 1 Speed Comparison
TROWS Truck Average Speeds (mph)
Aug-14 Sep-14 Oct-14 May-15
Entry Point 28.7 28.9 28.8 28.8
Activation Point 24.0 23.9 23.6 23.8
Shut-Off Point 23.3 22.8 22.6 22.5
TROWS Truck 85th Percentile Speeds (mph)
Aug-14 Sep-14 Oct-14 May-15
Entry Point 34 34 34 35
Activation Point 27 27 27 27
Shut-Off Point 26 25 25 25

System 1 Sign Activations
TROWS Sign Activation Data
30 Day
Time Period
# of Trucks
# of Sign Activations
% Trucks Activating Sign
Shadow Test 64,211 50,407 79%
Sept. 2014 70,280 52,371 75%
Oct. 2014 71,237 52,270 73%
May 2015 62,729 48,224 77%

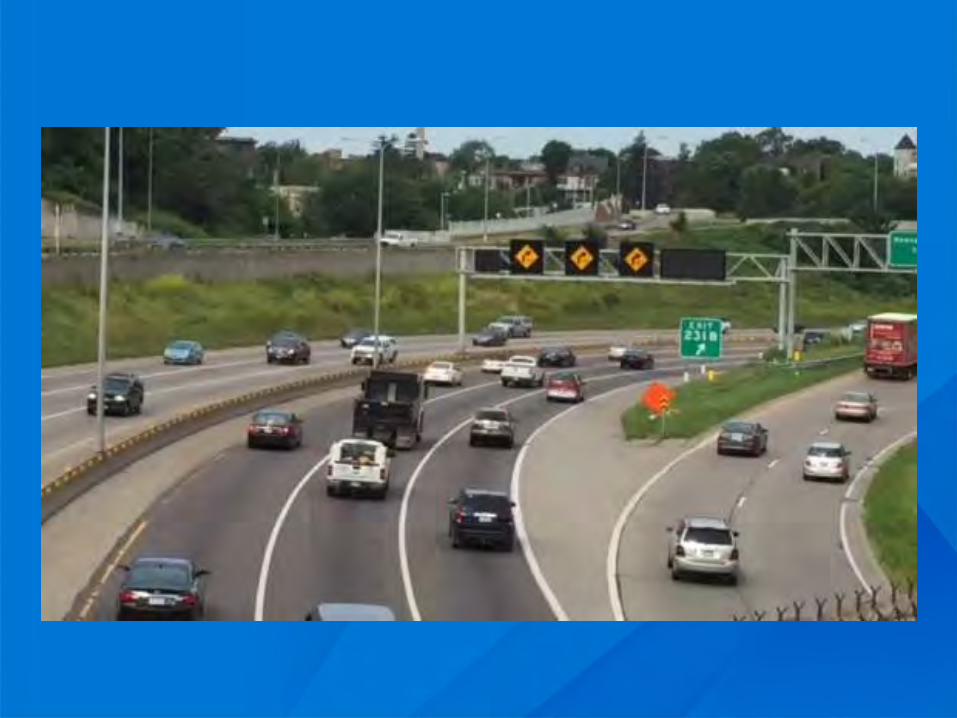
System 2
• Wbd I-94 prior to the Lowry Tunnel– Frequency of truck rollovers – 3 in the past 5 years
• RTMC design which included a micro surface overlay
• Vehicle classification by height and speed by lane
• Warning signs and LED flashing borders
• July 2015 – Began operation

System 2 Location

Signing


System 2 Speed Comparison

Speed Comparison
Summary of System 1 & 2 Truck Speed Changes
System 1System 2
System Data ATRI DataAverage Speed
- Before 23.3 22 45.25- After 22.5 21 43.50
MPH Change 0.8 1 1.75% Change 3.4% 4.5% 3.9%
85th Percentile Speed
- Before 26 25 48- After 25 24 46
MPH Change 1 1 2% Change 3.8% 4.0% 4.2%
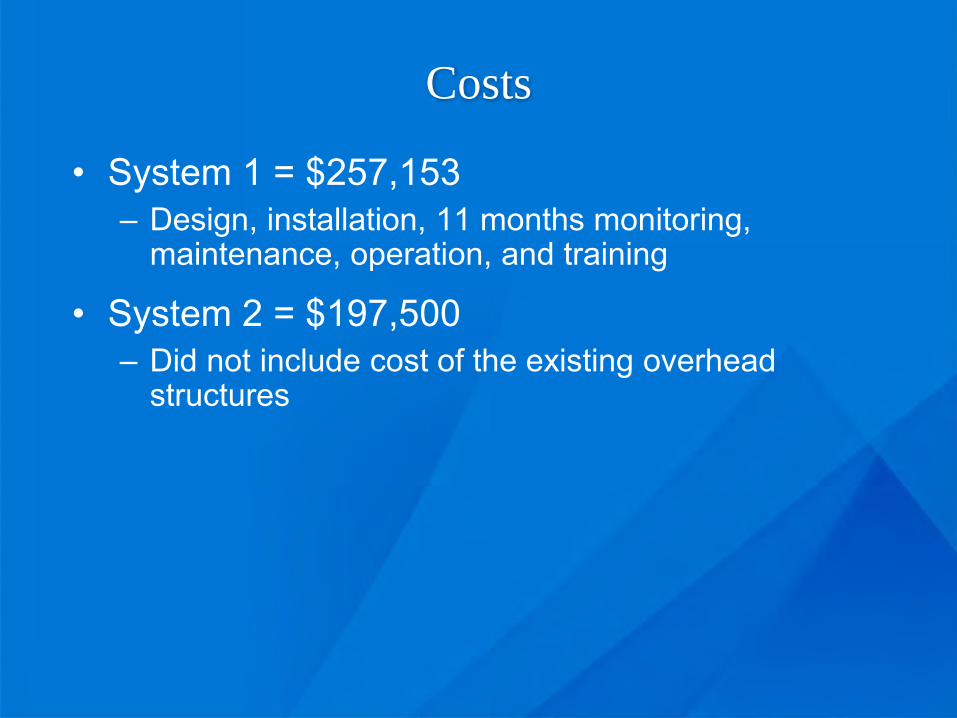
Costs
• System 1 = $257,153– Design, installation, 11 months monitoring,
maintenance, operation, and training
• System 2 = $197,500– Did not include cost of the existing overhead
structures
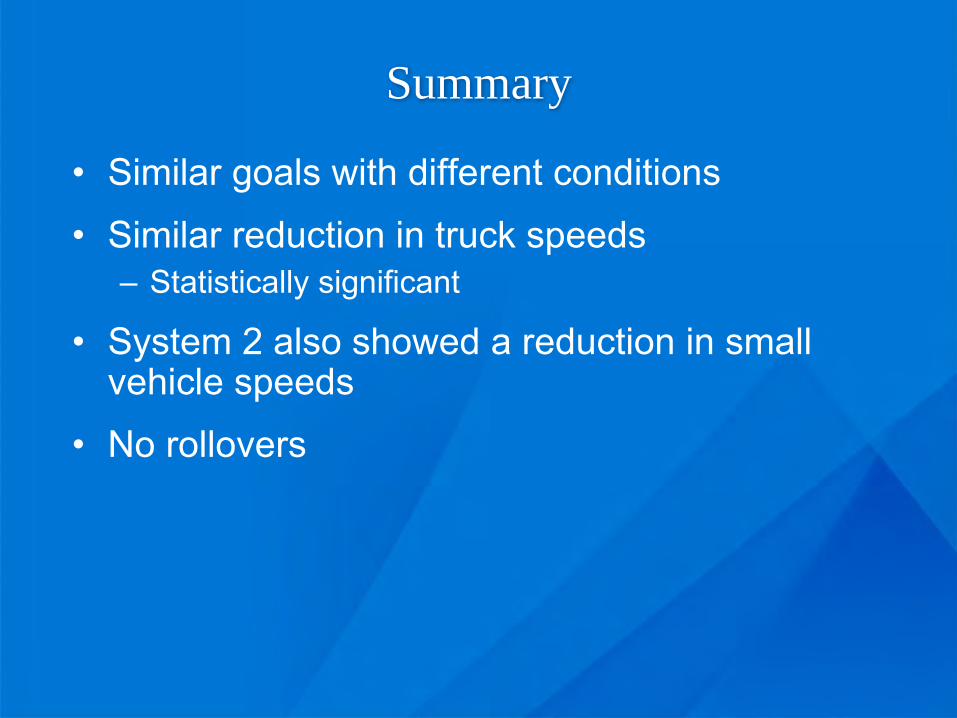
Summary
• Similar goals with different conditions
• Similar reduction in truck speeds – Statistically significant
• System 2 also showed a reduction in small vehicle speeds
• No rollovers

Questions?
Related Documents