Evaluation of the TAPCO Sequential Dynamic Curve Warning System Publication No. FHWA-HIF-13-040 June 2013

Welcome message from author
This document is posted to help you gain knowledge. Please leave a comment to let me know what you think about it! Share it to your friends and learn new things together.
Transcript
Evaluation of the TAPCO Sequential Dynamic Curve Warning System
Publication No. FHWA-HIF-13-040 June 2013
Notice
This document is disseminated under the sponsorship of the U.S. Department of Transportation in the interest of information exchange. The U.S. Government assumes no liability for the use of the information contained in this document.
The U.S. Government does not endorse products or manufacturers. Trademarks or manufacturers’ names appear in this report only because they are considered essential to the objective of the document.
Quality Assurance Statement
The Federal Highway Administration (FHWA) provides high-quality information to serve Government, industry, and the public in a manner that promotes public understanding. Standards and policies are used to ensure and maximize the quality, objectivity, utility, and integrity of its information. FHWA periodically reviews quality issues and adjusts its programs and processes to ensure continuous quality improvement.
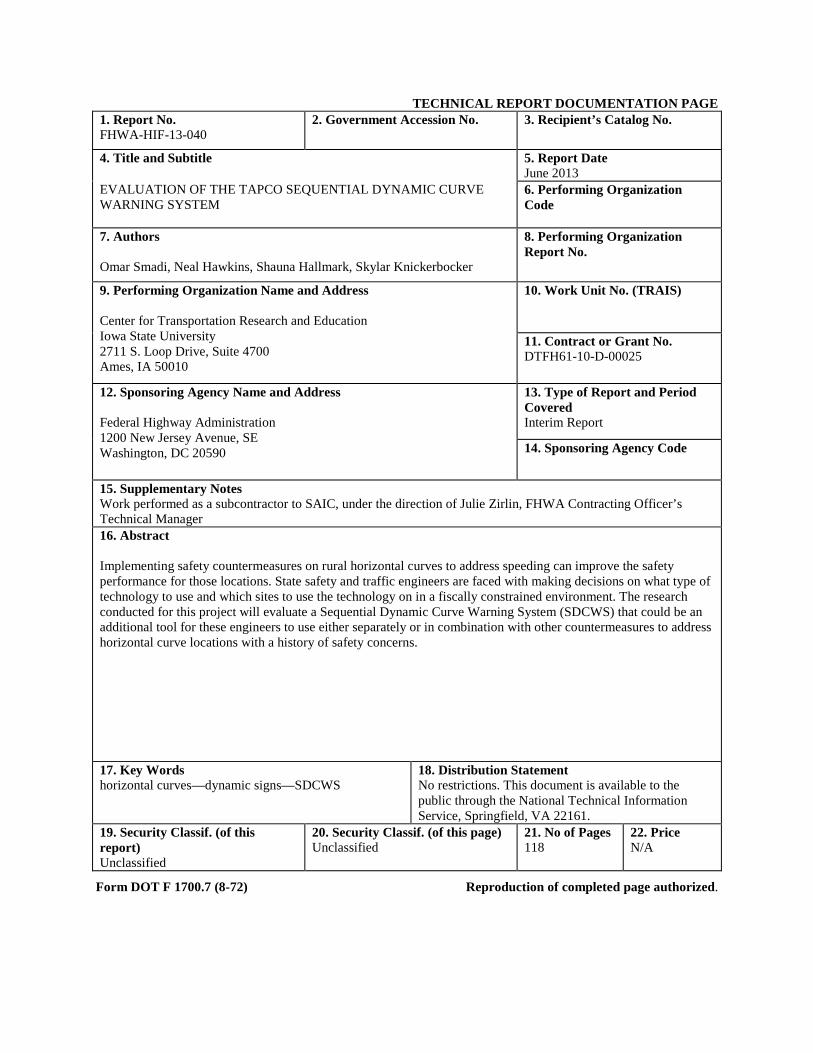
TECHNICAL REPORT DOCUMENTATION PAGE 1. Report No. FHWA-HIF-13-040
2. Government Accession No.
3. Recipient’s Catalog No.
4. Title and Subtitle 5. Report Date June 2013
EVALUATION OF THE TAPCO SEQUENTIAL DYNAMIC CURVE WARNING SYSTEM
6. Performing Organization Code
7. Authors Omar Smadi, Neal Hawkins, Shauna Hallmark, Skylar Knickerbocker
8. Performing Organization Report No.
9. Performing Organization Name and Address Center for Transportation Research and Education Iowa State University 2711 S. Loop Drive, Suite 4700 Ames, IA 50010
10. Work Unit No. (TRAIS)
11. Contract or Grant No. DTFH61-10-D-00025
12. Sponsoring Agency Name and Address Federal Highway Administration 1200 New Jersey Avenue, SE Washington, DC 20590
13. Type of Report and Period Covered Interim Report
14. Sponsoring Agency Code
15. Supplementary Notes Work performed as a subcontractor to SAIC, under the direction of Julie Zirlin, FHWA Contracting Officer’s Technical Manager 16. Abstract Implementing safety countermeasures on rural horizontal curves to address speeding can improve the safety performance for those locations. State safety and traffic engineers are faced with making decisions on what type of technology to use and which sites to use the technology on in a fiscally constrained environment. The research conducted for this project will evaluate a Sequential Dynamic Curve Warning System (SDCWS) that could be an additional tool for these engineers to use either separately or in combination with other countermeasures to address horizontal curve locations with a history of safety concerns.
17. Key Words horizontal curves—dynamic signs—SDCWS
18. Distribution Statement No restrictions. This document is available to the public through the National Technical Information Service, Springfield, VA 22161.
19. Security Classif. (of this report) Unclassified
20. Security Classif. (of this page) Unclassified
21. No of Pages 118
22. Price N/A
Form DOT F 1700.7 (8-72) Reproduction of completed page authorized.
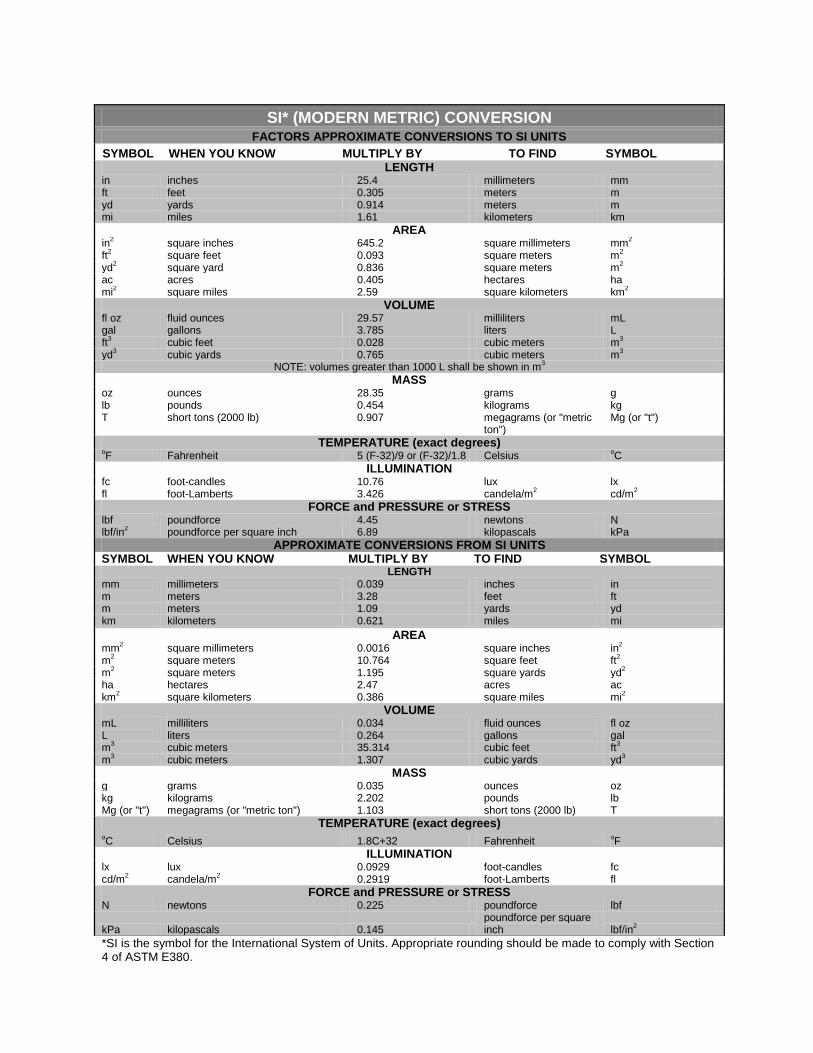
SI* (MODERN METRIC) CONVERSION
FACTORS APPROXIMATE CONVERSIONS TO SI UNITS SYMBOL WHEN YOU KNOW MULTIPLY BY TO FIND SYMBOL
LENGTH in inches 25.4 millimeters mm ft feet 0.305 meters m yd yards 0.914 meters m mi miles 1.61 kilometers km
AREA in2 square inches 645.2 square millimeters mm2 ft2 square feet 0.093 square meters m2 yd2 square yard 0.836 square meters m2 ac acres 0.405 hectares ha mi2 square miles 2.59 square kilometers km2
VOLUME fl oz fluid ounces 29.57 milliliters mL gal gallons 3.785 liters L ft3 cubic feet 0.028 cubic meters m3 yd3 cubic yards 0.765 cubic meters m3
NOTE: volumes greater than 1000 L shall be shown in m3 MASS
oz ounces 28.35 grams g lb pounds 0.454 kilograms kg T short tons (2000 lb) 0.907 megagrams (or "metric
ton") Mg (or "t")
TEMPERATURE (exact degrees) oF Fahrenheit 5 (F-32)/9 or (F-32)/1.8 Celsius oC
ILLUMINATION fc foot-candles 10.76 lux lx fl foot-Lamberts 3.426 candela/m2 cd/m2
FORCE and PRESSURE or STRESS lbf poundforce 4.45 newtons N lbf/in2 poundforce per square inch 6.89 kilopascals kPa
APPROXIMATE CONVERSIONS FROM SI UNITS SYMBOL WHEN YOU KNOW MULTIPLY BY TO FIND SYMBOL
LENGTH mm millimeters 0.039 inches in m meters 3.28 feet ft m meters 1.09 yards yd km kilometers 0.621 miles mi
AREA mm2 square millimeters 0.0016 square inches in2 m2 square meters 10.764 square feet ft2 m2 square meters 1.195 square yards yd2 ha hectares 2.47 acres ac km2 square kilometers 0.386 square miles mi2
VOLUME mL milliliters 0.034 fluid ounces fl oz L liters 0.264 gallons gal m3 cubic meters 35.314 cubic feet ft3 m3 cubic meters 1.307 cubic yards yd3
MASS g grams 0.035 ounces oz kg kilograms 2.202 pounds lb Mg (or "t") megagrams (or "metric ton") 1.103 short tons (2000 lb) T
TEMPERATURE (exact degrees) oC Celsius 1.8C+32 Fahrenheit oF
ILLUMINATION lx lux 0.0929 foot-candles fc cd/m2 candela/m2 0.2919 foot-Lamberts fl
FORCE and PRESSURE or STRESS N newtons 0.225 poundforce lbf
kPa kilopascals 0.145 poundforce per square inch lbf/in2
*SI is the symbol for the International System of Units. Appropriate rounding should be made to comply with Section 4 of ASTM E380.
iii
TABLE OF CONTENTS INTRODUCTION ...........................................................................................................................1
Project Scope .......................................................................................................................1
Project Objectives ................................................................................................................1
Report Overview ..................................................................................................................1
LITERATURE REVIEW ................................................................................................................3
Relationship between Curve Crash Rate and Geometry ......................................................3
Relationship between Curve Crash Rate and Speed of Curve Negotiation .........................4
Effectiveness of DSFS Systems ...........................................................................................6
Tracking Vehicles for Data Reduction ..............................................................................12
SELECTION OF TEST SITES FOR SDCWS ..............................................................................15
Initial Review .....................................................................................................................15
Site Visits ...........................................................................................................................17
Selection of Final Sites ......................................................................................................19
Selection of Study Direction ..............................................................................................19
Final Site Information by State ..........................................................................................19
INSTALLATION ..........................................................................................................................21
Technology Description .....................................................................................................21
METHODOLOGY FOR SPEED DATA COLLECTION ............................................................25
Equipment ..........................................................................................................................25
Data Collection Periods .....................................................................................................25
Data Collection Protocol and Quality Assurance ..............................................................25
SPEED ANALYSIS.......................................................................................................................27
Speed Metrics.....................................................................................................................27
Results to Date ...................................................................................................................27
APPENDIX A. BASELINE DATA FOR EACH TEST SECTION .............................................31
APPENDIX B. SITE DATA TABLES AND FIGURES ..............................................................61
Iowa Highway 144 .............................................................................................................62
Missouri Highway 221 .......................................................................................................66
Washington SR 7 ...............................................................................................................70
Washington SR 9 ...............................................................................................................74
Washington SR 203 ...........................................................................................................78
iv
Wisconsin Highway 20 ......................................................................................................82
Wisconsin Highway 67 ......................................................................................................86
Wisconsin Highway 213 ....................................................................................................90
Texas FM 109 ....................................................................................................................94
Texas FM 407 ....................................................................................................................97
Texas FM 530 ..................................................................................................................100
Texas FM 1148 ................................................................................................................103
REFERENCES ............................................................................................................................107
v
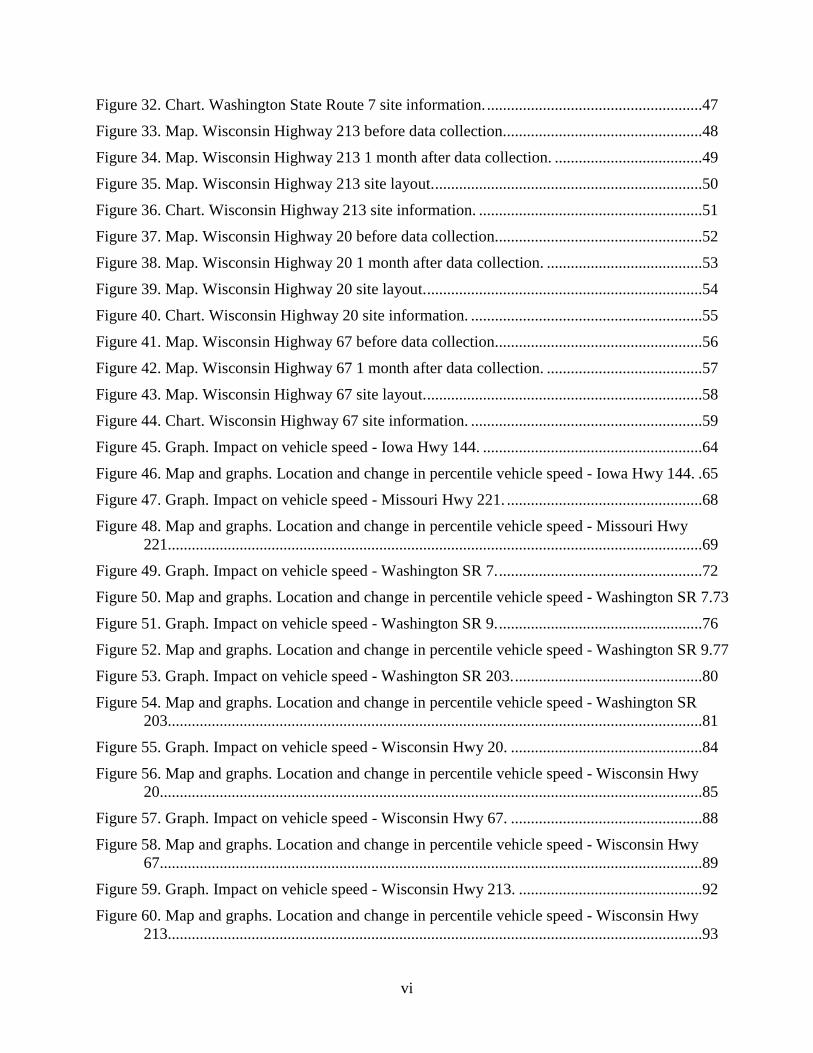
LIST OF FIGURES Figure 1. Photo. Northbound Interstate 5 DSFS systems in Oregon.(22) ..........................................7
Figure 2. Photo. Southbound Interstate 5 DSFS systems in Oregon.(22) ..........................................7
Figure 3. Photo. DSFS system in Norfolk.(23) ..................................................................................8
Figure 4. Photo. DSFS system in Bellevue, Washington.(24) ...........................................................9
Figure 5. Photo. Speed warning sign in the Sacramento River Canyon.(26)...................................10
Figure 6. Photo. Comparison of curve warning sign (left) and speed feedback sign (right).(30)....11
Figure 7. Equation. True effect. .....................................................................................................13
Figure 8. Map. Washington State DOT candidate sites. ................................................................16
Figure 9. Photo. Candidate curve site in Washington State. ..........................................................17
Figure 10. Chart. Example site visit speed data collection form. ..................................................18
Figure 11. Photo. Example field report from initial visit. ..............................................................18
Figure 12. Map. Final test site locations. .......................................................................................19
Figure 13. Photos. Installation of the SDCWS. .............................................................................21
Figure 14. Photo. SDCWS activation sequence. ............................................................................23
Figure 15. Diagram. Typical traffic counter placement. ................................................................26
Figure 16. Photo. Iowa Highway 144 before data collection. .......................................................31
Figure 17. Photo. Iowa Highway 144 1 month after data collection. ............................................32
Figure 18. Photo. Iowa Highway 144 site layout...........................................................................33
Figure 19. Chart. Iowa Highway 144 site information. .................................................................34
Figure 20. Photo. Missouri Highway 221 before data collection. .................................................35
Figure 21. Photo. Missouri Highway 221 1 month after data collection. ......................................36
Figure 22. Photo. Missouri Highway 221 site layout. ...................................................................37
Figure 23. Chart. Missouri Highway 221 site information. ...........................................................38
Figure 24. Map. Washington State Route 9 before data collection. ..............................................39
Figure 25. Map. Washington State Route 9 1 month after data collection. ...................................40
Figure 26. Chart. Washington State Route 9 site information. ......................................................41
Figure 27. Map. Washington State Route 203 before data collection. ..........................................42
Figure 28. Map. Washington State Route 203 1 month after data collection. ...............................43
Figure 29. Chart. Washington State Route 203 site information. ..................................................44
Figure 30. Map. Washington State Route 7 before data collection. ..............................................45
Figure 31. Photo. Washington State Route 7 1 month after data collection. .................................46
vi
Figure 32. Chart. Washington State Route 7 site information. ......................................................47
Figure 33. Map. Wisconsin Highway 213 before data collection..................................................48
Figure 34. Map. Wisconsin Highway 213 1 month after data collection. .....................................49
Figure 35. Map. Wisconsin Highway 213 site layout. ...................................................................50
Figure 36. Chart. Wisconsin Highway 213 site information. ........................................................51
Figure 37. Map. Wisconsin Highway 20 before data collection....................................................52
Figure 38. Map. Wisconsin Highway 20 1 month after data collection. .......................................53
Figure 39. Map. Wisconsin Highway 20 site layout. .....................................................................54
Figure 40. Chart. Wisconsin Highway 20 site information. ..........................................................55
Figure 41. Map. Wisconsin Highway 67 before data collection....................................................56
Figure 42. Map. Wisconsin Highway 67 1 month after data collection. .......................................57
Figure 43. Map. Wisconsin Highway 67 site layout. .....................................................................58
Figure 44. Chart. Wisconsin Highway 67 site information. ..........................................................59
Figure 45. Graph. Impact on vehicle speed - Iowa Hwy 144. .......................................................64
Figure 46. Map and graphs. Location and change in percentile vehicle speed - Iowa Hwy 144. .65
Figure 47. Graph. Impact on vehicle speed - Missouri Hwy 221. .................................................68
Figure 48. Map and graphs. Location and change in percentile vehicle speed - Missouri Hwy 221......................................................................................................................................69
Figure 49. Graph. Impact on vehicle speed - Washington SR 7. ...................................................72
Figure 50. Map and graphs. Location and change in percentile vehicle speed - Washington SR 7.73
Figure 51. Graph. Impact on vehicle speed - Washington SR 9. ...................................................76
Figure 52. Map and graphs. Location and change in percentile vehicle speed - Washington SR 9.77
Figure 53. Graph. Impact on vehicle speed - Washington SR 203. ...............................................80
Figure 54. Map and graphs. Location and change in percentile vehicle speed - Washington SR 203......................................................................................................................................81
Figure 55. Graph. Impact on vehicle speed - Wisconsin Hwy 20. ................................................84
Figure 56. Map and graphs. Location and change in percentile vehicle speed - Wisconsin Hwy 20........................................................................................................................................85
Figure 57. Graph. Impact on vehicle speed - Wisconsin Hwy 67. ................................................88
Figure 58. Map and graphs. Location and change in percentile vehicle speed - Wisconsin Hwy 67........................................................................................................................................89
Figure 59. Graph. Impact on vehicle speed - Wisconsin Hwy 213. ..............................................92
Figure 60. Map and graphs. Location and change in percentile vehicle speed - Wisconsin Hwy 213......................................................................................................................................93
vii
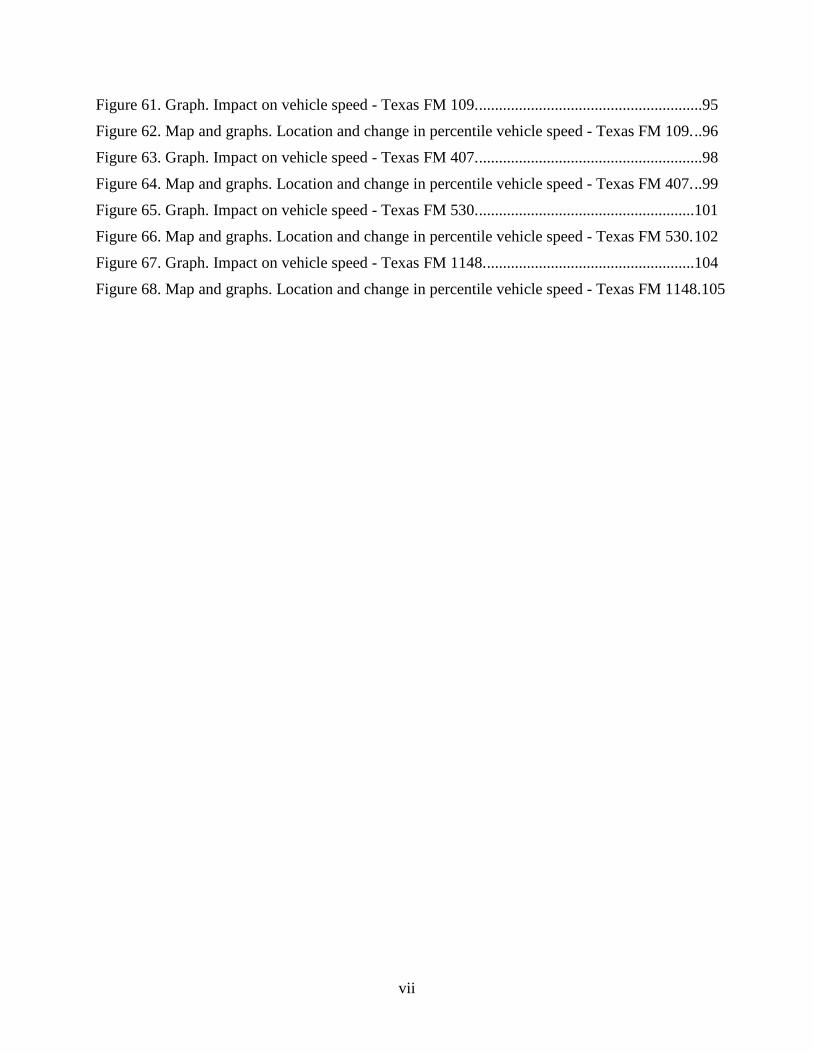
Figure 61. Graph. Impact on vehicle speed - Texas FM 109. ........................................................95
Figure 62. Map and graphs. Location and change in percentile vehicle speed - Texas FM 109. ..96
Figure 63. Graph. Impact on vehicle speed - Texas FM 407. ........................................................98
Figure 64. Map and graphs. Location and change in percentile vehicle speed - Texas FM 407. ..99
Figure 65. Graph. Impact on vehicle speed - Texas FM 530. ......................................................101
Figure 66. Map and graphs. Location and change in percentile vehicle speed - Texas FM 530. 102
Figure 67. Graph. Impact on vehicle speed - Texas FM 1148. ....................................................104
Figure 68. Map and graphs. Location and change in percentile vehicle speed - Texas FM 1148.105
viii
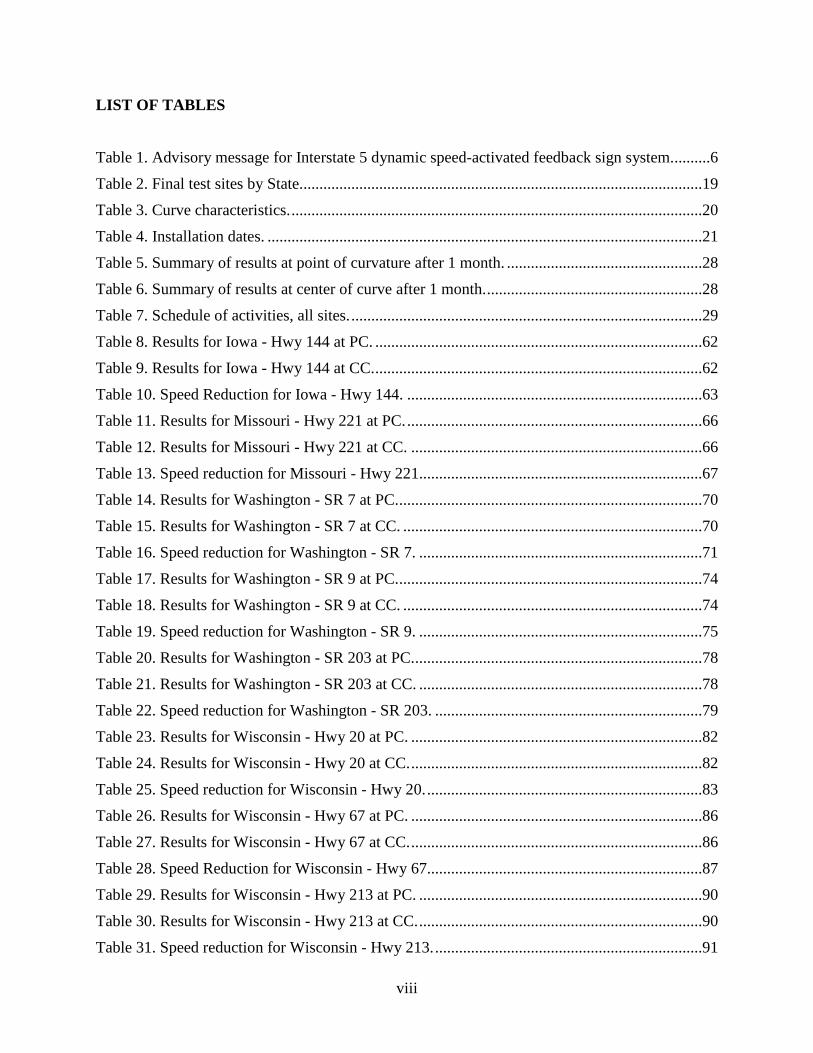
LIST OF TABLES Table 1. Advisory message for Interstate 5 dynamic speed-activated feedback sign system. .........6
Table 2. Final test sites by State.....................................................................................................19
Table 3. Curve characteristics. .......................................................................................................20
Table 4. Installation dates. .............................................................................................................21
Table 5. Summary of results at point of curvature after 1 month. .................................................28
Table 6. Summary of results at center of curve after 1 month. ......................................................28
Table 7. Schedule of activities, all sites. ........................................................................................29
Table 8. Results for Iowa - Hwy 144 at PC. ..................................................................................62
Table 9. Results for Iowa - Hwy 144 at CC. ..................................................................................62
Table 10. Speed Reduction for Iowa - Hwy 144. ..........................................................................63
Table 11. Results for Missouri - Hwy 221 at PC. ..........................................................................66
Table 12. Results for Missouri - Hwy 221 at CC. .........................................................................66
Table 13. Speed reduction for Missouri - Hwy 221.......................................................................67
Table 14. Results for Washington - SR 7 at PC. ............................................................................70
Table 15. Results for Washington - SR 7 at CC. ...........................................................................70
Table 16. Speed reduction for Washington - SR 7. .......................................................................71
Table 17. Results for Washington - SR 9 at PC. ............................................................................74
Table 18. Results for Washington - SR 9 at CC. ...........................................................................74
Table 19. Speed reduction for Washington - SR 9. .......................................................................75
Table 20. Results for Washington - SR 203 at PC. ........................................................................78
Table 21. Results for Washington - SR 203 at CC. .......................................................................78
Table 22. Speed reduction for Washington - SR 203. ...................................................................79
Table 23. Results for Wisconsin - Hwy 20 at PC. .........................................................................82
Table 24. Results for Wisconsin - Hwy 20 at CC. .........................................................................82
Table 25. Speed reduction for Wisconsin - Hwy 20. .....................................................................83
Table 26. Results for Wisconsin - Hwy 67 at PC. .........................................................................86
Table 27. Results for Wisconsin - Hwy 67 at CC. .........................................................................86
Table 28. Speed Reduction for Wisconsin - Hwy 67.....................................................................87
Table 29. Results for Wisconsin - Hwy 213 at PC. .......................................................................90
Table 30. Results for Wisconsin - Hwy 213 at CC. .......................................................................90
Table 31. Speed reduction for Wisconsin - Hwy 213. ...................................................................91
ix
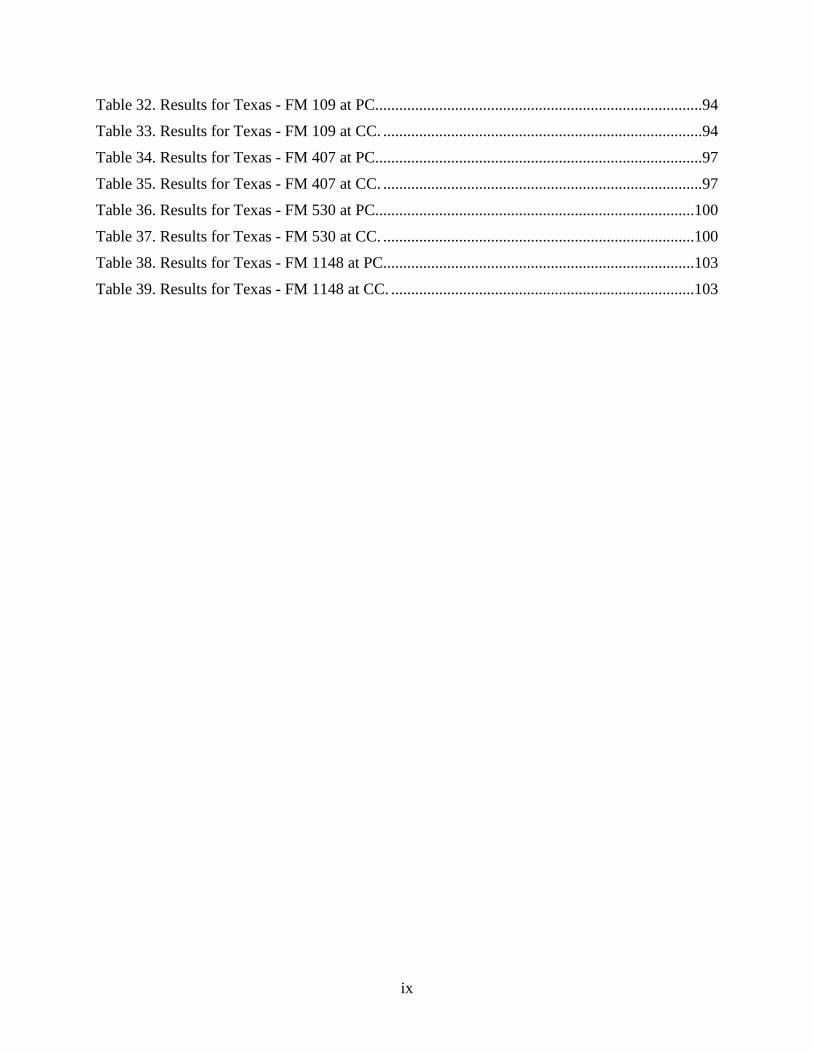
Table 32. Results for Texas - FM 109 at PC..................................................................................94
Table 33. Results for Texas - FM 109 at CC. ................................................................................94
Table 34. Results for Texas - FM 407 at PC..................................................................................97
Table 35. Results for Texas - FM 407 at CC. ................................................................................97
Table 36. Results for Texas - FM 530 at PC................................................................................100
Table 37. Results for Texas - FM 530 at CC. ..............................................................................100
Table 38. Results for Texas - FM 1148 at PC..............................................................................103
Table 39. Results for Texas - FM 1148 at CC. ............................................................................103
x
LIST OF ABBREVIATIONS AND ACRONYMS AADT Annual average daily traffic
Caltrans California Department of Transportation
CC Center of curve
DOT Department of Transportation
DSFS Dynamic speed feedback sign
FARS Fatality Analysis Reporting System
GES General Estimates System
HSIS Highway Safety Information System
LIDAR Light detection and ranging
MUTCD Manual on Uniform Traffic Control Devices
PC Point of curvature
SD Standard deviation
SDCWS Sequential Dynamic Curve Warning System
TE True effect
vpd Vehicles per day
1
INTRODUCTION
Horizontal curves make up a small percentage of total road miles, yet account for one-quarter of all highway fatalities. The majority of curve-related crashes are attributed to speeding and driver error and involve lane departures. There are a number of low-cost countermeasures traditionally used to help keep vehicles on the road and in their lane; however, the impacts of their application can be limited, which leads to the need for additional research and testing on more dynamic devices to assist traffic engineers in managing speed and safety across their diverse roadway network.
Project Scope
More than 25 percent of fatal crashes are associated with a horizontal curve, and the vast majority of these crashes involve a roadway departure. The average crash rate for horizontal curves is about three times that of other highways segments. About three-quarters of curve-related fatal crashes involve a single vehicle leaving the roadway and striking trees, utility poles, rocks, or other fixed objects, or overturning. The majority of these crashes are speed related.
Implementing safety countermeasures on rural horizontal curves to address speeding can improve the safety performance for those locations. State safety and traffic engineers are faced with making decisions on what type of technology to use and which sites to use the technology on in a fiscally constrained environment. The research conducted for this project will evaluate a Sequential Dynamic Curve Warning System (SDCWS) that could be an additional tool for these engineers to use either separately or in combination with other countermeasures to address horizontal curve locations with a history of safety concerns.
Project Objectives
The objective of this project is to test and evaluate the effectiveness of TAPCO’s SDCWS in reducing vehicle speed as well as the frequency and severity of speed-related crashes on horizontal curves on rural roadways. With 12 treatment sites and 24 control sites having been identified in Missouri, Texas, Washington, and Wisconsin, speed data will be collected before and immediately after the installation, as well as at 12 and 18 months post installation.
Report Overview
The information in this interim report includes a summary of the literature on speed-activated display practices, details on the locations of existing treatments, site selection methodology, a list of potential and final new treatment sites, the type and amount of data to be collected, data collection procedures and equipment, and the schedule for analyses to be performed. The report also includes a summary of baseline data including roadway, traffic, and crash data and data analysis and results from the 1-month post installation data collection effort. Guidelines and recommendations for implementing SDCWS displays for curves will be included in the final report.

2
3
LITERATURE REVIEW
This section discusses the relationship between roadway geometry, vehicle speeds, and crashes on horizontal curves and reviews the effectiveness of various applications of Dynamic Speed Feedback Sign (DSFS) systems installed to date. This research effort will test the effectiveness of the SDCWS and its impact on safety. Even though several dynamic curve sign systems have been tested in the past, this system is unique in terms of including guidance not just before or at the curve, but also throughout the curve with the blinking chevrons. The results from this research will add to the body of knowledge and provide safety engineers with another tool to address curve crashes.
Relationship between Curve Crash Rate and Geometry
Curves have about three times the crash rate of tangent sections.(1) Preston and Schoenecker reported that 25 to 50 percent of the severe road departure crashes in Minnesota occurred on curves, even though curves account for only 10 percent of the total system mileage.(2) Shankar et al. evaluated divided State highways without median barriers in Washington State and found a relationship between the number of horizontal curves per kilometer and median crossover crashes.(3) Farmer and Lund evaluated single-vehicle fatal and injury rollover crashes using Fatality Analysis Reporting System (FARS) data and data from Florida, Pennsylvania, and Texas.(4) Using logistic regression, they found that the odds of having a rollover on a curved section were 1.42 to 2.15 times the odds of having a rollover on a straight section.
The majority of crashes on curves involve lane departures. A total of 76 percent of curve-related fatal crashes are single vehicles leaving the roadway and striking a fixed object or overturning. Another 11 percent of curve-related crashes are head-on collisions.(5)
The frequency and severity of curve-related crashes have been correlated to a number of geometric factors, including radius, degree of curve, length of curve, type of curve transition, lane and shoulder widths, preceding tangent length, and required speed reduction.
Luediger et al. found that crash rates increase as the degree of curve increases, even when traffic warning devices are used to warn drivers of the curve.(6) Miaou and Lum found that truck crash involvement increases as horizontal curvature increases, depending on the length of curve.(7) Council found that the presence of spirals on horizontal curves reduced crash probability on level terrain but did not find the same effect for hilly or mountainous terrain.(8) Vogt and Bared evaluated two-lane rural road segments in Minnesota and Washington State using Highway Safety Information System (HSIS) data and found a positive correlation between injury crashes and degree of horizontal curve.(9)
Zegeer et al. evaluated curves on two-lane roads in Washington State using a linear regression model.(10) The researchers found that the degree of curve was positively correlated with crashes, while total surface width and presence of spirals were negatively correlated. They also evaluated 10,900 horizontal curves on two-lane roads in Washington State using a weighted linear regression model and found that crash likelihood increases as the degree and length of curve increases.(10) Mohamedshah et al., however, found a negative correlation between crashes and degree of curve for two-lane roadways.(11)
4
Preston and Schoenecker examined severe roadway departure crashes and found that 90 percent of fatal crashes and 75 percent of injury crashes occurred on curves with a radius of less than 1,500 ft.(2) Milton and Mannering evaluated 2,725 miles of highway in Washington State using a negative binomial model and reported that an increase in radius was associated with decreases in crash frequency.(12) They also found that a shorter tangent length between horizontal curves was associated with decreases in crash frequency. They speculated that drivers may be traveling at lower speeds and are therefore more likely to be paying attention when tangent lengths between curves are short.
In contrast, Deng et al. evaluated head-on crashes on 729 segments of two-lane roads in Connecticut using an ordered probit model.(13) They included geometric characteristics in the analysis but did not find that the presence of horizontal or vertical curves was significant.
Taylor et al. evaluated the relationship between speed and crashes on rural single-carriageway roads in England.(14) The authors collected data from 174 road sections with 60 mph speed limits with a wide range of conditions. Data collected included injury crash data, traffic volume, speed data, and roadway geometry. Speed and flow were measured at each site for 1 or 2 days, and various speed metrics were calculated, including mean speed, 85th percentile speed, and standard deviation of speed. The authors found that crashes were more highly correlated with mean speed than any other speed metric. They also found that crash frequency increased with mean speed. In general, a 10 percent increase in mean speed resulted in a 26 percent increase in the frequency of injury crashes.
More recently, Khan et al. analyzed curves in Wisconsin to determine the relationship between safety, horizontal curve signs, and geometry.(15) Compared to previous research, a larger data set with greater detail was used to develop a model showing the relationship of the horizontal curves. The data showed that crashes increased with an increase in annual average daily traffic (AADT), posted speed, and curve length; they also increased with a decrease in curve radius. In addition, an analysis of traffic control signs indicated that sites with curve signs (W1-2) had fewer crashes than sites with turn signs (W1-1). Sharper curves, however, showed no significant correlation to sign type in reducing crashes because of other, more substantial influencing factors.
Relationship between Curve Crash Rate and Speed of Curve Negotiation
Although curve-related crashes are correlated to geometric factors, driver factors such as speed selection also contribute to curve-crash frequency and outcome. Driver factors include driver workload, driver expectancy, and speed selection.
Speeding, defined by FHWA as “exceeding the posted speed limit or driving too fast for conditions,” is generally problematic. Council et al. evaluated FARS, General Estimates System (GES), and HSIS data to assess the impact of speeding on fatal crashes.(16) Using 2005 FARS data, they found that 29.5 percent of fatal crashes were speed-related. They conducted several different types of analyses and found the single-vehicle run-off-road crashes are more likely to be speed-related than are multi-vehicle crashes. Crashes on curves were more likely to be speed-related as compared to tangent sections and nighttime crashes. Additionally, FARS data indicated that 54 percent of speed-related rollover/overturn, jackknife, or fixed object crashes were on curves.(16)
5
FHWA estimates that approximately 56 percent of run-off-road fatal crashes on curves are speed-related.(6) The vehicle speed reduction from the tangent section required for traversing a curve has an impact on the frequency and severity of crashes in curves. Abrupt changes in operating speed resulting from changes in horizontal alignment are suggested to be a major cause of crashes on rural two-lane roadways.(6)
Anderson and Krammes developed a model comparing mean speed reduction and mean crash rate for 1,126 horizontal curves on rural two-lane roadways.(17) They reported that the relationship between mean crash rate and required speed reduction to negotiate the curve is roughly linear. This finding is also supported by Fink and Krammes, who indicated that curves requiring no speed reduction did not have significantly different mean crash rates than their preceding roadway tangent.(18)
Driver errors on horizontal curves are often due to the inappropriate selection of speed and the inability to maintain lane position. Drivers’ speed selection at curves depends on both explicit attentional cues and implicit perceptual cues.(19) A driver’s speed prior to entering a curve has a significant effect on his or her ability to negotiate the curve successfully.(2) Inappropriate speed selection and lane positioning can be a result of a driver failing to notice an upcoming curve or misperceiving the roadway curvature.
Driver workload plays an important role in driver speed maintenance. Distracting tasks such as radio-tuning or cell phone conversations can draw a driver’s attention away from speed monitoring, detection of headway changes, lane keeping, and detection of potential hazards.(19) Other factors include sight distance issues, fatigue, or complexity of the driving situation.(19,20)
Preston and Shoenecker evaluated vehicle paths through a curve on a two-lane rural roadway as part of an evaluation of a dynamic curve message sign.(2) The roadway had a posted speed limit of 55 mph and AADT of 3,250 vehicles per day (vpd). The researchers collected data over a 4-day period and randomly selected and evaluated 589 vehicles. A total of 340 of the vehicles (58 percent) were traveling over 55 mph, and the rest were traveling at or below the speed limit. The authors evaluated whether each vehicle successfully negotiated the curve. Vehicles that crossed a left or right lane line on one or more occasions were defined as “not successfully navigating the curve.”
A logistic regression model was developed to determine the relationship between initial speed and the probability of a vehicle unsuccessfully navigating the curve. The researchers found that there was a 20 percent better chance for vehicles that were traveling at or below the speed limit to successfully navigate the curve than for vehicles that were traveling over the speed limit, with the difference being statistically significant at 99 percent. They found that 45 percent of vehicles traveling at or above 65 mph were unable to negotiate the curve compared to 30 percent for vehicles that were traveling under 65 mph, with the difference being statistically significant at the 90 percent confidence interval. Hassan and Easa found that driver misperception of curvature was greatest when vertical curvature was combined with horizontal curvature.(21) This was particularly a problem when a crest vertical curve was superimposed on a severe horizontal curve, or when a sag vertical curve was combined with a horizontal curve, causing the horizontal curve to appear less severe and resulting in drivers underestimating the curve.
6
Charlton conducted a simulator study and evaluated driver speed adjustments on several types of curves with several types of signing.(20) Charlton found that, in general, drivers approached and entered curves at higher speeds when engaged in cell phone tasks than when in non-distraction scenarios.
Effectiveness of DSFS Systems
DSFS systems have been used in only a few cases to reduce speeds and warn drivers of upcoming curves. They have been used more extensively for a number of other related applications. A summary of information about the application of DSFS on curves and in related situations is provided below.
Bertini et al. studied the effectiveness of a DSFS system on Interstate 5 near Myrtle Creek, Oregon.(22) The system consisted of two displays that provided different messages to drivers based on the speed detected, as shown in table 1.
Table 1. Advisory message for Interstate 5 dynamic speed-activated feedback sign system.
Sign Panel
Sign Messages
Detected Vehicle Speeds Less than 50 mph
Detected Vehicle Speeds 50–70 mph
Detected Vehicle Speeds over 70 mph
1 CAUTION SLOW DOWN SLOW DOWN
2 SHARP CURVES AHEAD YOUR SPEED IS XX MPH YOUR SPEED IS OVER 70 MPH
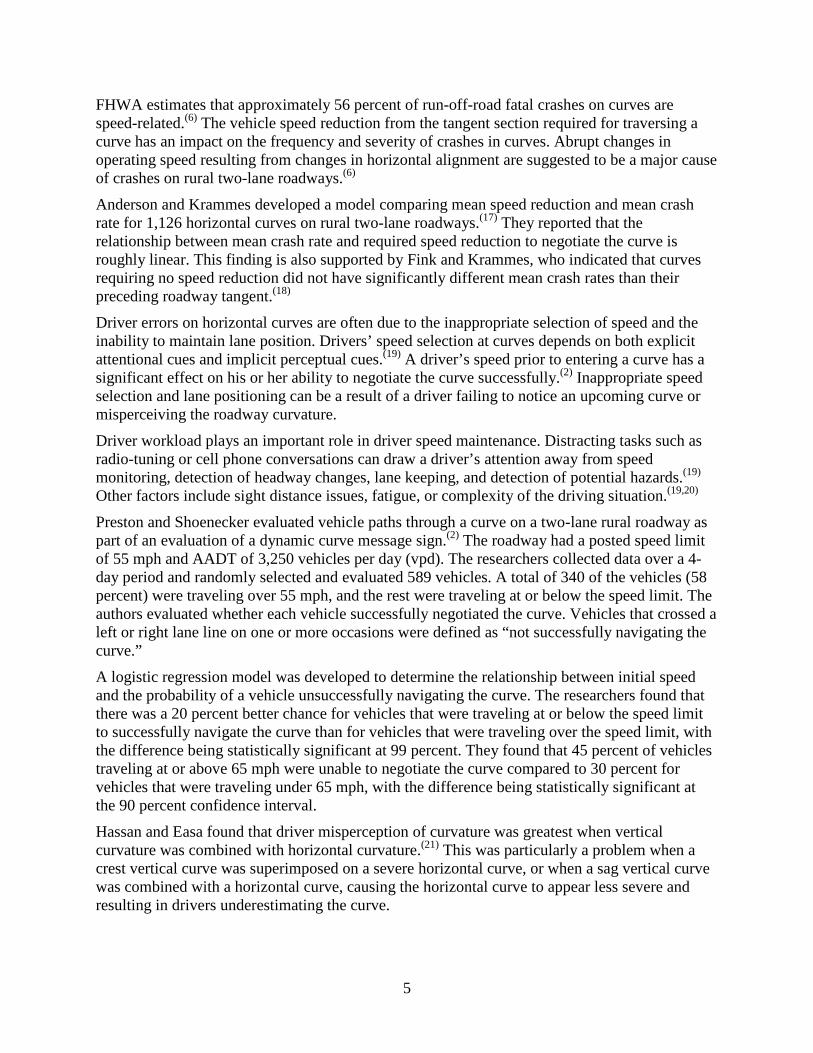
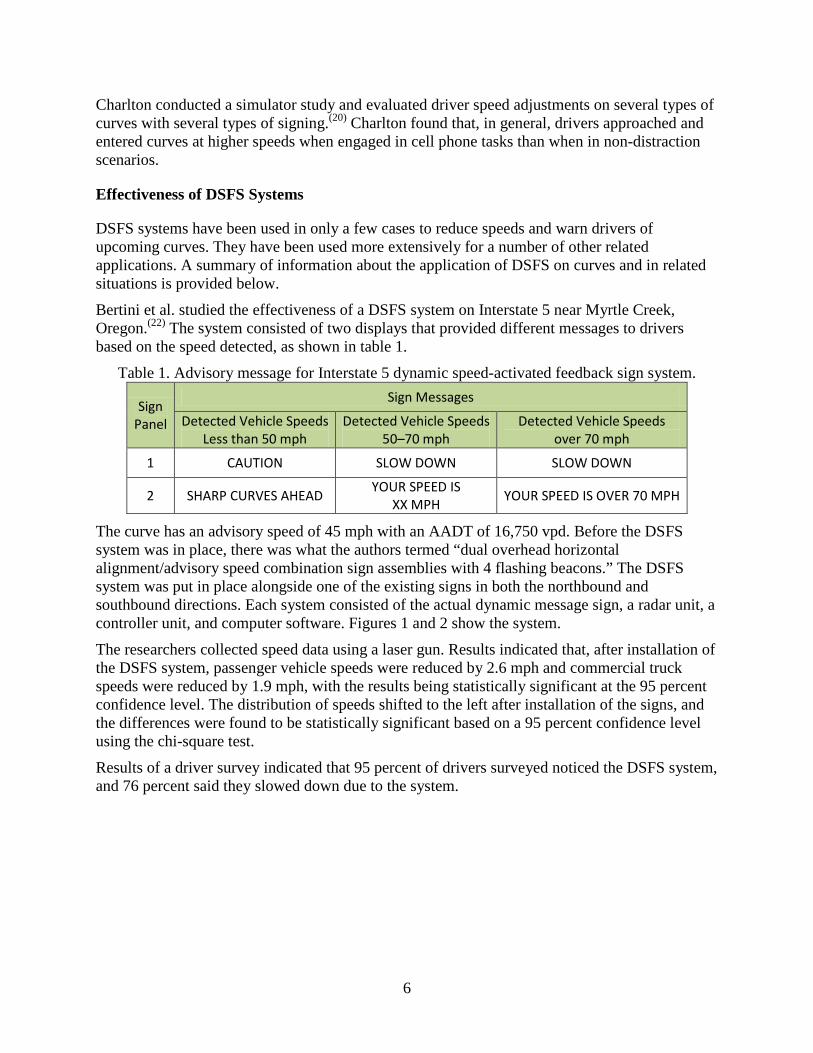
The curve has an advisory speed of 45 mph with an AADT of 16,750 vpd. Before the DSFS system was in place, there was what the authors termed “dual overhead horizontal alignment/advisory speed combination sign assemblies with 4 flashing beacons.” The DSFS system was put in place alongside one of the existing signs in both the northbound and southbound directions. Each system consisted of the actual dynamic message sign, a radar unit, a controller unit, and computer software. Figures 1 and 2 show the system.
The researchers collected speed data using a laser gun. Results indicated that, after installation of the DSFS system, passenger vehicle speeds were reduced by 2.6 mph and commercial truck speeds were reduced by 1.9 mph, with the results being statistically significant at the 95 percent confidence level. The distribution of speeds shifted to the left after installation of the signs, and the differences were found to be statistically significant based on a 95 percent confidence level using the chi-square test.
Results of a driver survey indicated that 95 percent of drivers surveyed noticed the DSFS system, and 76 percent said they slowed down due to the system.
7
Figure 1. Photo. Northbound Interstate 5 DSFS systems in Oregon.(22)
Figure 2. Photo. Southbound Interstate 5 DSFS systems in Oregon.(22)
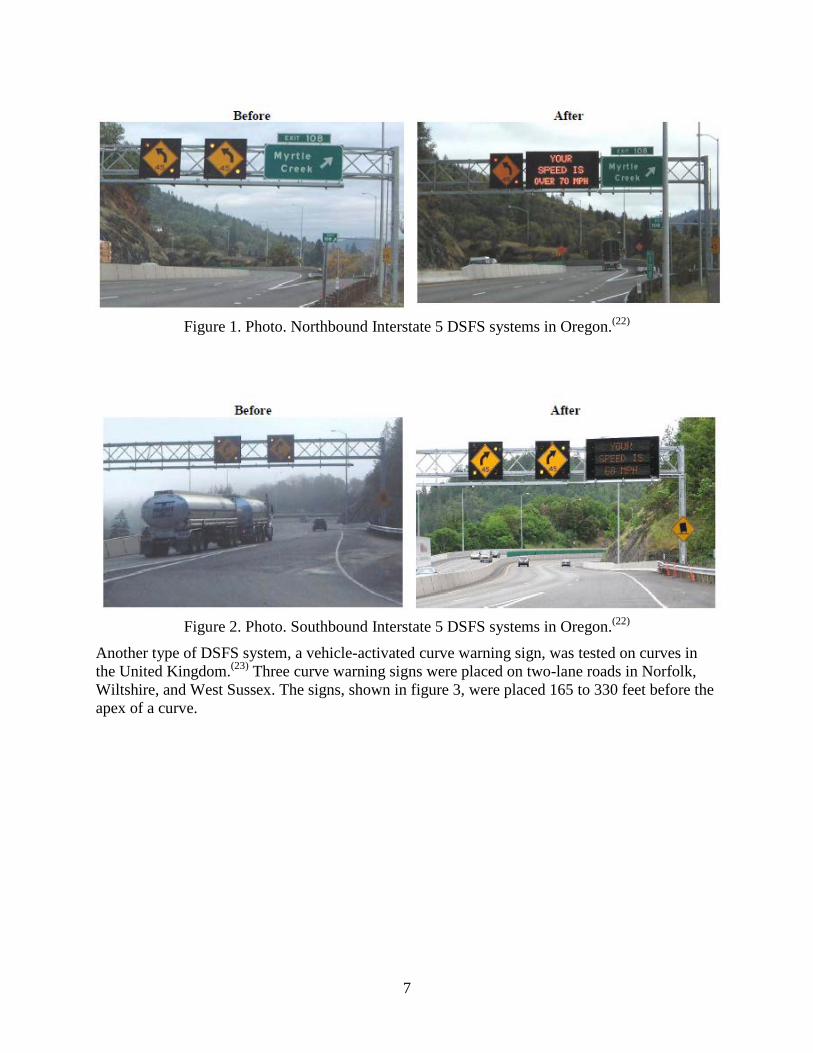
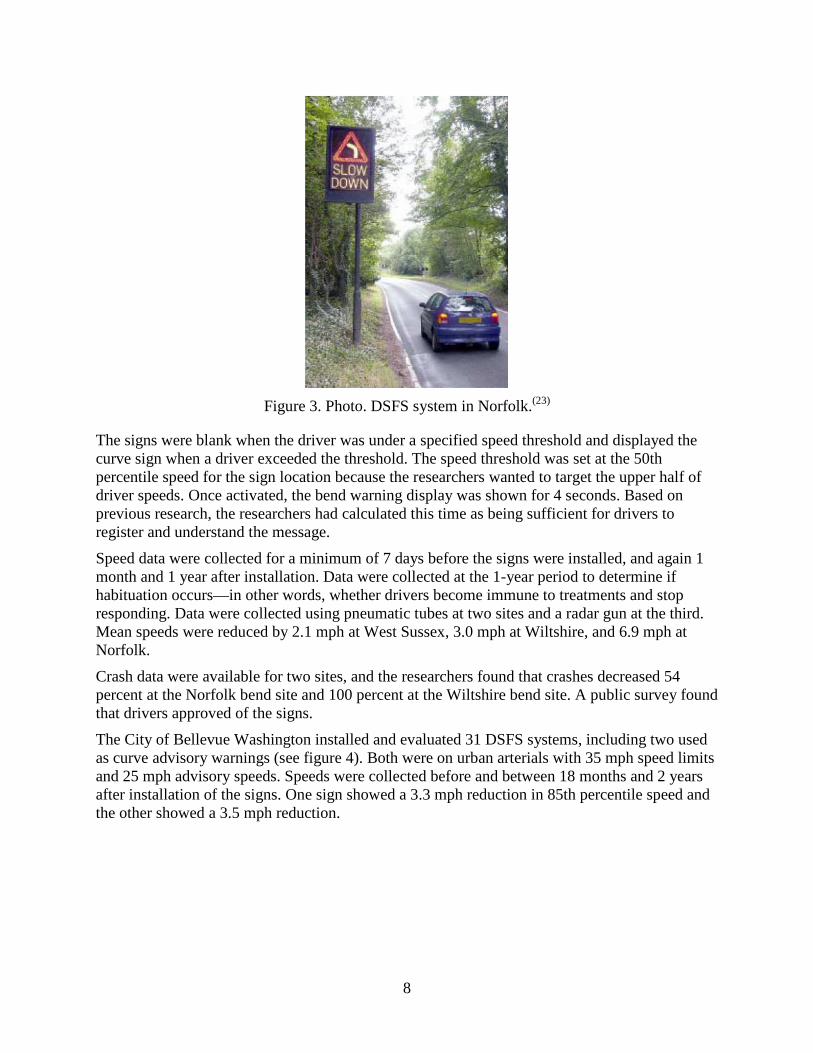
Another type of DSFS system, a vehicle-activated curve warning sign, was tested on curves in the United Kingdom.(23) Three curve warning signs were placed on two-lane roads in Norfolk, Wiltshire, and West Sussex. The signs, shown in figure 3, were placed 165 to 330 feet before the apex of a curve.
8
Figure 3. Photo. DSFS system in Norfolk.(23)
The signs were blank when the driver was under a specified speed threshold and displayed the curve sign when a driver exceeded the threshold. The speed threshold was set at the 50th percentile speed for the sign location because the researchers wanted to target the upper half of driver speeds. Once activated, the bend warning display was shown for 4 seconds. Based on previous research, the researchers had calculated this time as being sufficient for drivers to register and understand the message.
Speed data were collected for a minimum of 7 days before the signs were installed, and again 1 month and 1 year after installation. Data were collected at the 1-year period to determine if habituation occurs—in other words, whether drivers become immune to treatments and stop responding. Data were collected using pneumatic tubes at two sites and a radar gun at the third. Mean speeds were reduced by 2.1 mph at West Sussex, 3.0 mph at Wiltshire, and 6.9 mph at Norfolk.
Crash data were available for two sites, and the researchers found that crashes decreased 54 percent at the Norfolk bend site and 100 percent at the Wiltshire bend site. A public survey found that drivers approved of the signs.
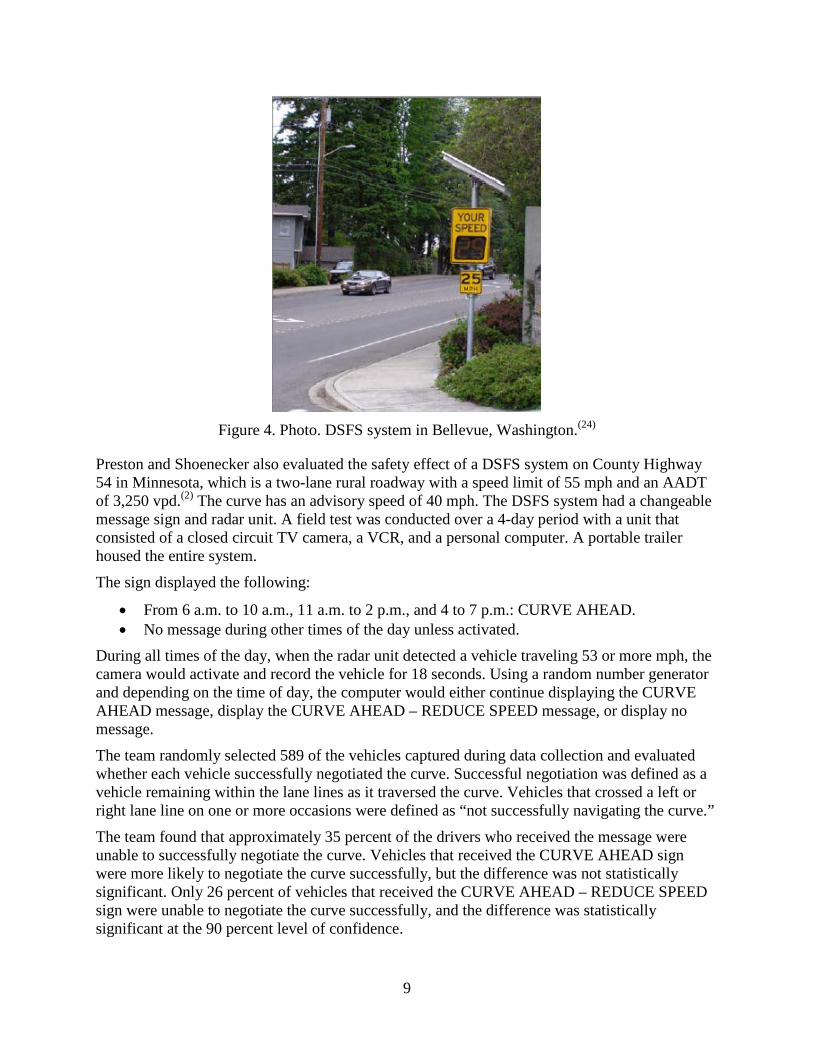
The City of Bellevue Washington installed and evaluated 31 DSFS systems, including two used as curve advisory warnings (see figure 4). Both were on urban arterials with 35 mph speed limits and 25 mph advisory speeds. Speeds were collected before and between 18 months and 2 years after installation of the signs. One sign showed a 3.3 mph reduction in 85th percentile speed and the other showed a 3.5 mph reduction.
9
Figure 4. Photo. DSFS system in Bellevue, Washington.(24)
Preston and Shoenecker also evaluated the safety effect of a DSFS system on County Highway 54 in Minnesota, which is a two-lane rural roadway with a speed limit of 55 mph and an AADT of 3,250 vpd.(2) The curve has an advisory speed of 40 mph. The DSFS system had a changeable message sign and radar unit. A field test was conducted over a 4-day period with a unit that consisted of a closed circuit TV camera, a VCR, and a personal computer. A portable trailer housed the entire system.
The sign displayed the following:
• From 6 a.m. to 10 a.m., 11 a.m. to 2 p.m., and 4 to 7 p.m.: CURVE AHEAD. • No message during other times of the day unless activated.
During all times of the day, when the radar unit detected a vehicle traveling 53 or more mph, the camera would activate and record the vehicle for 18 seconds. Using a random number generator and depending on the time of day, the computer would either continue displaying the CURVE AHEAD message, display the CURVE AHEAD – REDUCE SPEED message, or display no message.
The team randomly selected 589 of the vehicles captured during data collection and evaluated whether each vehicle successfully negotiated the curve. Successful negotiation was defined as a vehicle remaining within the lane lines as it traversed the curve. Vehicles that crossed a left or right lane line on one or more occasions were defined as “not successfully navigating the curve.”
The team found that approximately 35 percent of the drivers who received the message were unable to successfully negotiate the curve. Vehicles that received the CURVE AHEAD sign were more likely to negotiate the curve successfully, but the difference was not statistically significant. Only 26 percent of vehicles that received the CURVE AHEAD – REDUCE SPEED sign were unable to negotiate the curve successfully, and the difference was statistically significant at the 90 percent level of confidence.
10
Mattox et al. looked at the effectiveness of a DSFS system on secondary highways in South Carolina.(25) This system consisted of a radar device and a 4-ft by 4-ft yellow sign with 6-inch lettering reading YOU ARE SPEEDING IF FLASHING. In addition, there were two 1-ft by 1-ft orange flags and a type B flashing beacon light. Teams collected data in a before-and-after study upstream of the sign, at the sign, and then downstream of the sign. Results showed a significant reduction in speed at the sign and downstream of the sign. Overall mean speed and 85th percentile speeds were reduced by approximately 3 mph.
A report by the California Department of Transportation (Caltrans) provided a summary of the effectiveness of safety treatments in one California district.(26) A changeable message sign was installed at five locations along Interstate 5 to reduce truck collisions. Caltrans reported that truck crashes decreased from 71 percent to 91 percent at four of the sites, while truck crashes increased by 140 percent at one site.
A study by the 3M Company evaluated driver speed feedback signs, which display the approaching drivers’ speeds, in the United Kingdom. Signs were tested at various locations in Doncaster, including semi-rural roadways. The sites had speed limits of 40 mph, and reductions up to 7 mph in 85th percentile speeds were noted.(27)
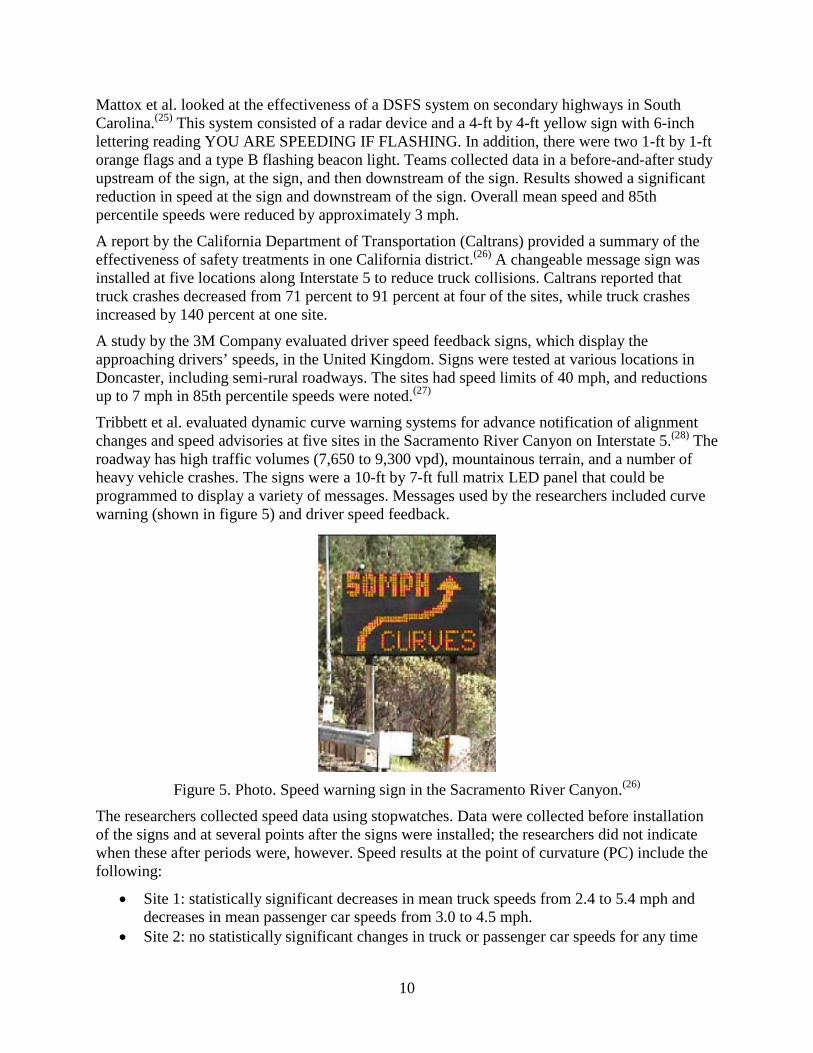
Tribbett et al. evaluated dynamic curve warning systems for advance notification of alignment changes and speed advisories at five sites in the Sacramento River Canyon on Interstate 5.(28) The roadway has high traffic volumes (7,650 to 9,300 vpd), mountainous terrain, and a number of heavy vehicle crashes. The signs were a 10-ft by 7-ft full matrix LED panel that could be programmed to display a variety of messages. Messages used by the researchers included curve warning (shown in figure 5) and driver speed feedback.
Figure 5. Photo. Speed warning sign in the Sacramento River Canyon.(26)
The researchers collected speed data using stopwatches. Data were collected before installation of the signs and at several points after the signs were installed; the researchers did not indicate when these after periods were, however. Speed results at the point of curvature (PC) include the following:
• Site 1: statistically significant decreases in mean truck speeds from 2.4 to 5.4 mph and decreases in mean passenger car speeds from 3.0 to 4.5 mph.
• Site 2: no statistically significant changes in truck or passenger car speeds for any time
11
periods. • Site 3: statistically significant decreases in mean truck speeds from 1.9 to 3.7 mph and
increases in passenger cars from 5.2 to 7.8 mph. • Site 4: no statistically significant change in mean truck speed and a 1.4 mph decrease for
passenger cars for one time period that was statistically significant. • Site 5: a statistically significant change in mean truck speed of 4.5 for one time period
and decrease in mean passenger car speeds from 2 to 3 mph.
The researchers also compared 5 years of crash data before installation of the signs and 6 months after. However, due to the very short after period, the results were determined to be unreliable.
The Texas Transportation Institute evaluated the use of a portable speed display trailer in work zones.(29) They found that passenger vehicle speeds were reduced by 7 to 9 mph at one site and 2 to 3 mph at another. Truck speeds were reduced 3 to 10 mph at both sites.
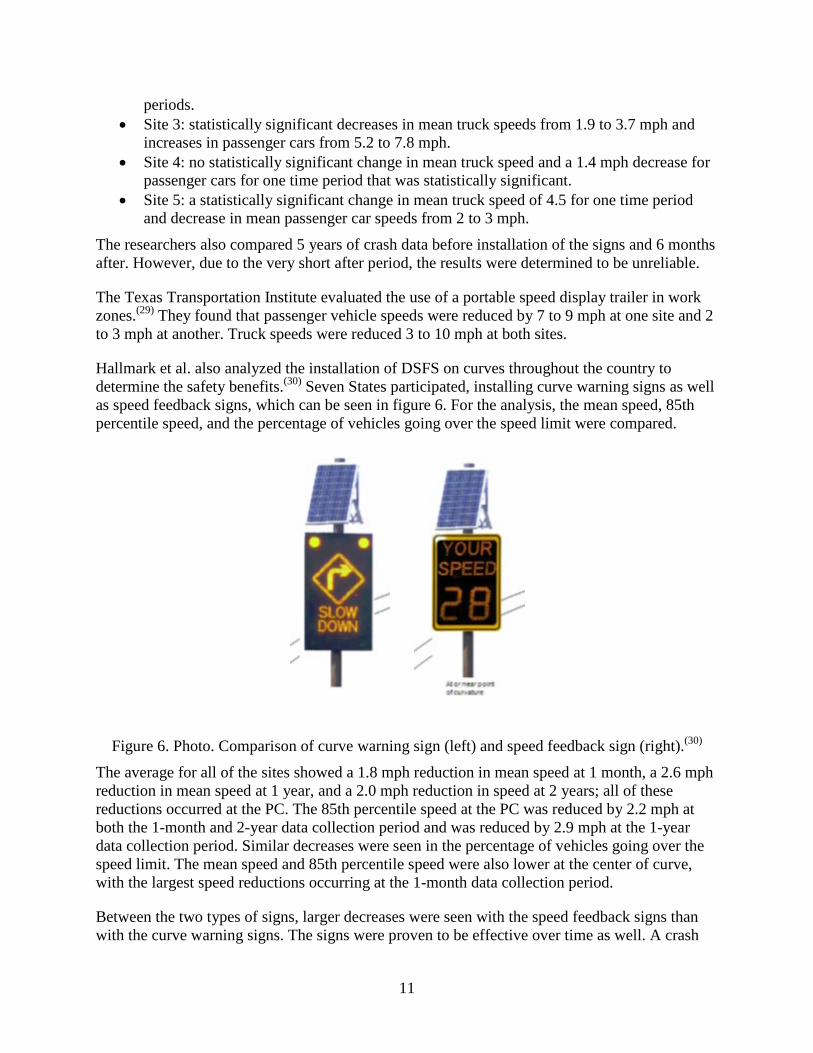
Hallmark et al. also analyzed the installation of DSFS on curves throughout the country to determine the safety benefits.(30) Seven States participated, installing curve warning signs as well as speed feedback signs, which can be seen in figure 6. For the analysis, the mean speed, 85th percentile speed, and the percentage of vehicles going over the speed limit were compared.
Figure 6. Photo. Comparison of curve warning sign (left) and speed feedback sign (right).(30)
The average for all of the sites showed a 1.8 mph reduction in mean speed at 1 month, a 2.6 mph reduction in mean speed at 1 year, and a 2.0 mph reduction in speed at 2 years; all of these reductions occurred at the PC. The 85th percentile speed at the PC was reduced by 2.2 mph at both the 1-month and 2-year data collection period and was reduced by 2.9 mph at the 1-year data collection period. Similar decreases were seen in the percentage of vehicles going over the speed limit. The mean speed and 85th percentile speed were also lower at the center of curve, with the largest speed reductions occurring at the 1-month data collection period.
Between the two types of signs, larger decreases were seen with the speed feedback signs than with the curve warning signs. The signs were proven to be effective over time as well. A crash
12
analysis was also performed for the direction of travel for the DSFS and for both directions combined. The analysis showed that, compared to control sites, crashes were reduced 2 to 4 times more for both directions and in the direction of travel by 1.7 to 6.0 times per quarter. Crash modification factors developed using a full Bayes model were .85 for both directions and .97 for the direction of the DSFS.
Sun et al. researched the effectiveness of sequential warning lights as a method to better define the beginning and taper into nighttime work zones.(31) The sequential lights were evaluated in Missouri along Interstate 70 with a right lane closure. Vehicle speeds at the closure were compared in addition to speeds at the point where the vehicle merged and at the lateral position in the taper. Decreases were seen in the mean speed of 2.2 mph and by 1 mph in the 85th percentile speeds, both of which were statistically significant. The lateral position of vehicles in the closed lane increased from 6.2 percent without sequential lights to 7.8 percent with sequential lights. The sequential lights had a negative effect, which could be due to drivers being more aggressive because the taper is illuminated better. The location where vehicles merged was split into eight zones with zone 8 being the zone closest to the taper. With the sequential lights, the total vehicles merging in zones 5 through 7 decreased while the vehicles merging in zones 1 through 4 increased. The exception that occurred was an increase in vehicles merging in zone 8, which further supports the aggressive driver assumption given the lateral position of the driver. Overall, vehicles were merging 20 ft earlier with the sequential lights.
Santiago-Chaparro et al. evaluated the spatial effectiveness of speed feedback signs at a single location along State Highway 164 in Wisconsin.(32) Vehicles were tracked while approaching and receding from the speed feedback signs, and the speeds were monitored to determine when vehicles were slowing down and whether the speed reductions were sustained. The research found that vehicles were reducing their speed the most between 1,200 and 1,400 ft upstream of the speed feedback sign. Speeds began to increase again between 300 to 500 ft downstream of the speed feedback sign, and some vehicles increased speed before even passing the speed feedback sign. The results of the study showed that the speed feedback signs are not adequate for speed reductions at a corridor level but only at the location where the desired speed reduction should occur.
Tracking Vehicles for Data Reduction
Tracking involves monitoring individual vehicles as they traverse multiple data collection points. Limited research has been completed in this area; the literature search revealed only one study that used tracking to reduce data down to only affected vehicles.(33) In this study, tracking was used to determine how much vehicles were slowing down when approaching the sign. This aligns very well with curves, as the speeds of vehicles can be tracked while approaching and through the curve. Vehicles were tracked so that only free-flow passenger vehicles would be analyzed, eliminating vehicles that were influenced by a turning movement. To track the vehicles, the vehicle speed, vehicle length, and time headway were compared at each data collection location.
The standard method was used by determining the mean speed, 85th percentile speed, and percentage of vehicles exceeding the posted speed first in their analysis, but it was not used in determining the effectiveness. Instead, a true effect (TE) was calculated by tracking vehicles and
13
then determining the speed reduction for each vehicle before and after implementation. TE was calculated as shown in figure 7.
True Effect=ΔV1-2, during-ΔV1-2, before
Figure 7. Equation. True effect.
The tracked data were used to determine the statistics ΔV1-2, during, which is the mean speed reduction between sensors 1 and 2 during the study and ΔV1-2, before, which is the mean speed reduction between sensors 1 and 2 before implementation. Cruzado and Donnell briefly discussed that, depending on the upstream data collection, the data may be over- or underestimated by using only the mean speed reduction at the treatment location.(34) TE better reflects any changes in speeds while approaching the curve.
Another form of tracking was performed by McFadden and Elefteriadou, who determined whether calculating the difference of 85th percentile speeds between two points was significantly different than calculating the 85th percentile of speed reduction between the two points.(33) The 85th percentile of the speed reduction requires that individual vehicles be tracked to determine the speed reduction between the two points. This was achieved using light detection and a light detection and ranging (LIDAR) gun. With the tracked data, the 85th percentile speed reduction was significantly different than the change in 85th percentile speed. The change in the 85th percentile speed underestimated the speed reduction of the vehicles traversing the curve. Hirsh (1987) accounted for this with the differences of the distributions of the two locations.(35)
Misaghi and Hassan expanded on this research in Canada, but instead of using LIDAR guns they used counters.(36) The counters were tracked successfully if three criteria were met at both locations: number of axles, wheel base, and the expected time gap between the two locations. Tolerances were used in the tracking because of variance with the counter clock and inconsistencies with the data collected. Once complete, the speed reduction could be calculated between the points and the 85th percentile speed.

14
15
SELECTION OF TEST SITES FOR SDCWS
The intent of this project was to evaluate the TAPCO SDCWS in five participant States (Iowa, Missouri, Texas, Washington, and Wisconsin). The research team developed site selection criteria for each and worked with each State to develop a list of candidate locations. The site selection criteria included the following:
• Two-lane rural paved roads. • Posted speed limit of 50 mph or above. • Existing chevrons. • No unusual conditions within the curve (e.g., railroad crossing or major access). • High crash location (10 or more crashes in the last 5 years, not including animal
collisions); speed-related crashes preferred. • No major rehabilitation/changes in alignment/operations in the last 3 years. • No major rehabilitation/changes in alignment/operations planned for the next 2 years.
Specific information requested for each candidate site included:
• Curve location (Google map, latitude/longitude, etc.). • Crash data including the location, direction, type, date, causation, etc. • Posted speed limit (mph). • Advisory curve speed, if present (mph). • AADT. • Truck traffic data, if available. • Presence of passing lanes.
After reviewing the information from each State, the team developed a finalized list of potential sites and then conducted site visits. Final test sites were then selected in each State. The general methodology used to select sites in each State is described in the following sections.
Initial Review
A request for initial data was made to each State. The States were asked to provide data on multiple high-crash curve sites on rural two-lane roadways. It was left up to the discretion of each agency to determine what they thought were high-crash locations. Rural was defined as being at least 1 mile outside an incorporated area. Each curve was required to meet the following criteria:
• No rehabilitation or reconstruction activities that change the geometry of the roadway scheduled during the 2-year assessment.
• No geometric or cross-section changes made for 3 years prior to the study. • Posted speed limit on tangent section 50 mph or greater.
Each State was also asked to provide the following information about the potential sites:
• Crash frequency. • Traffic volume (AADT and percent trucks).
16
• Geometry (lane width, shoulder width, and type). • Speed limit (posted or advisory) in mph.
The research team spatially located each site using Google Earth or the aerial images provided by the agency. The suitability of each curve location was evaluated, and locations that had major developments, railroads, or major points of access, including intersections other than low-volume intersections, were eliminated. Following this, additional information about the remaining sites was requested from each State, including:
• Presence of posted speed advisory on curve. • Information about crashes (speed-related, severity, etc.). • Expert opinion about safety and speed problems. • Existence of unusual traffic or other conditions.
Based on the information received, the sites were ranked in terms of number of crashes with a threshold of at least 5 crashes over a 5-year period being used to define a high-crash location.
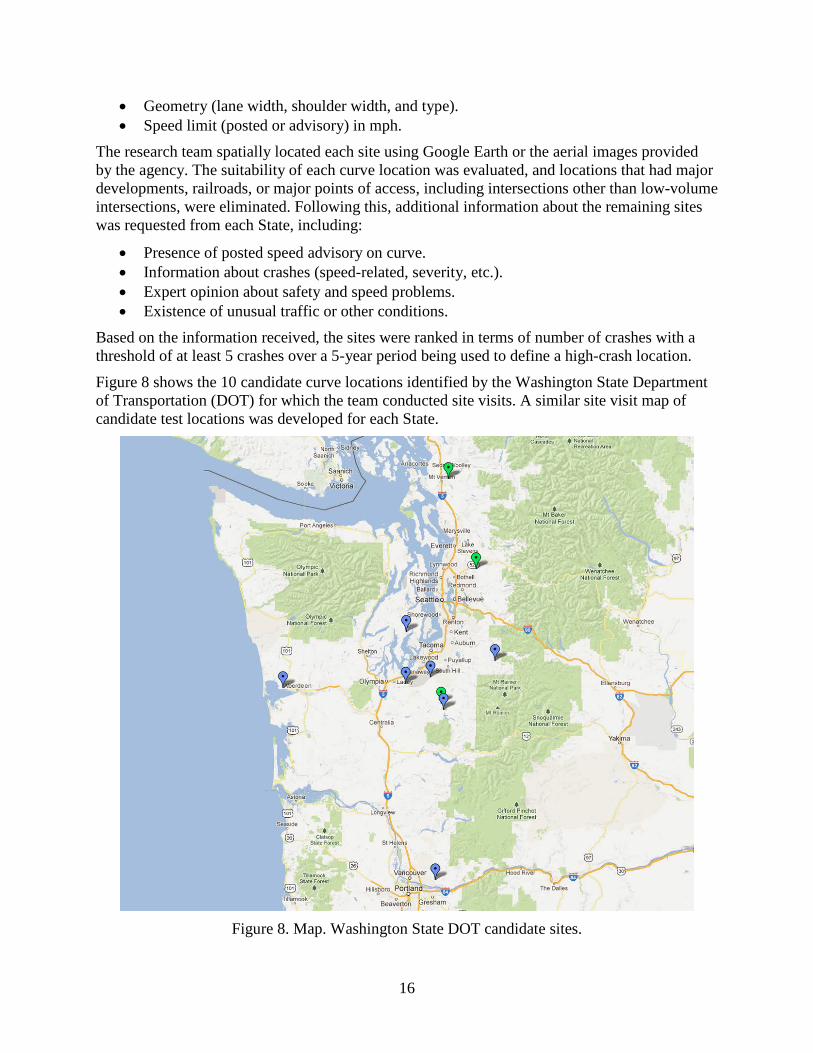
Figure 8 shows the 10 candidate curve locations identified by the Washington State Department of Transportation (DOT) for which the team conducted site visits. A similar site visit map of candidate test locations was developed for each State.
Figure 8. Map. Washington State DOT candidate sites.
17
Site Visits
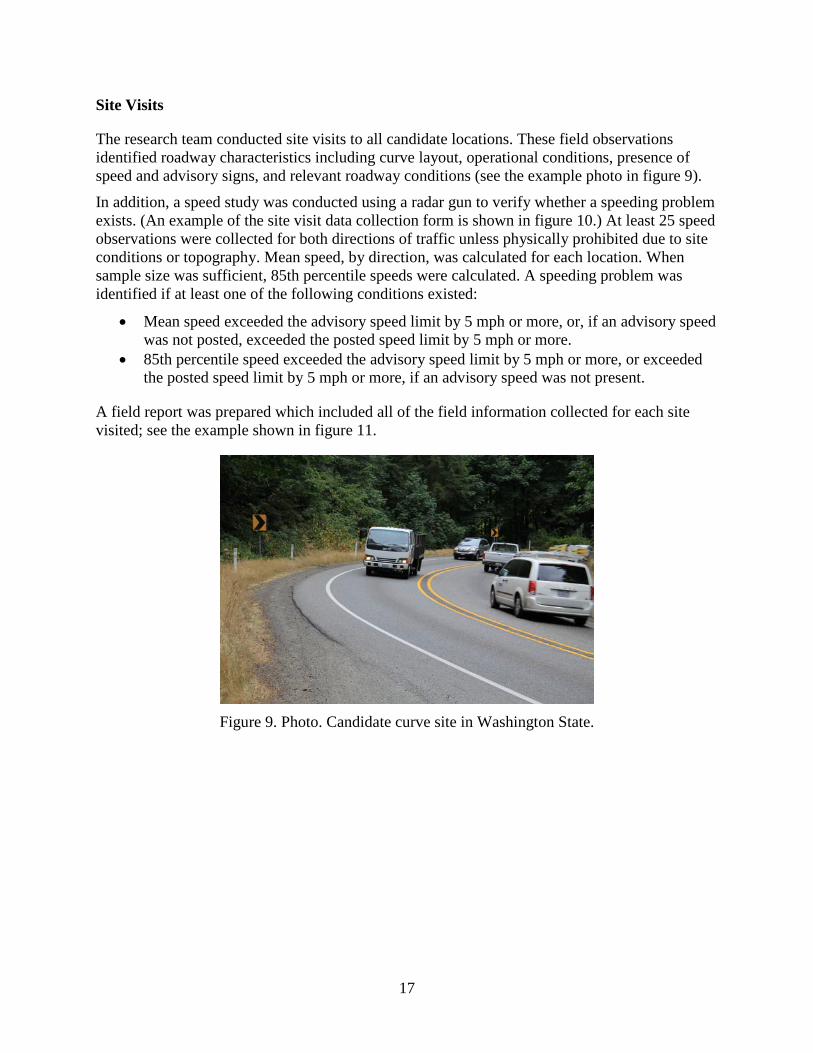
The research team conducted site visits to all candidate locations. These field observations identified roadway characteristics including curve layout, operational conditions, presence of speed and advisory signs, and relevant roadway conditions (see the example photo in figure 9).
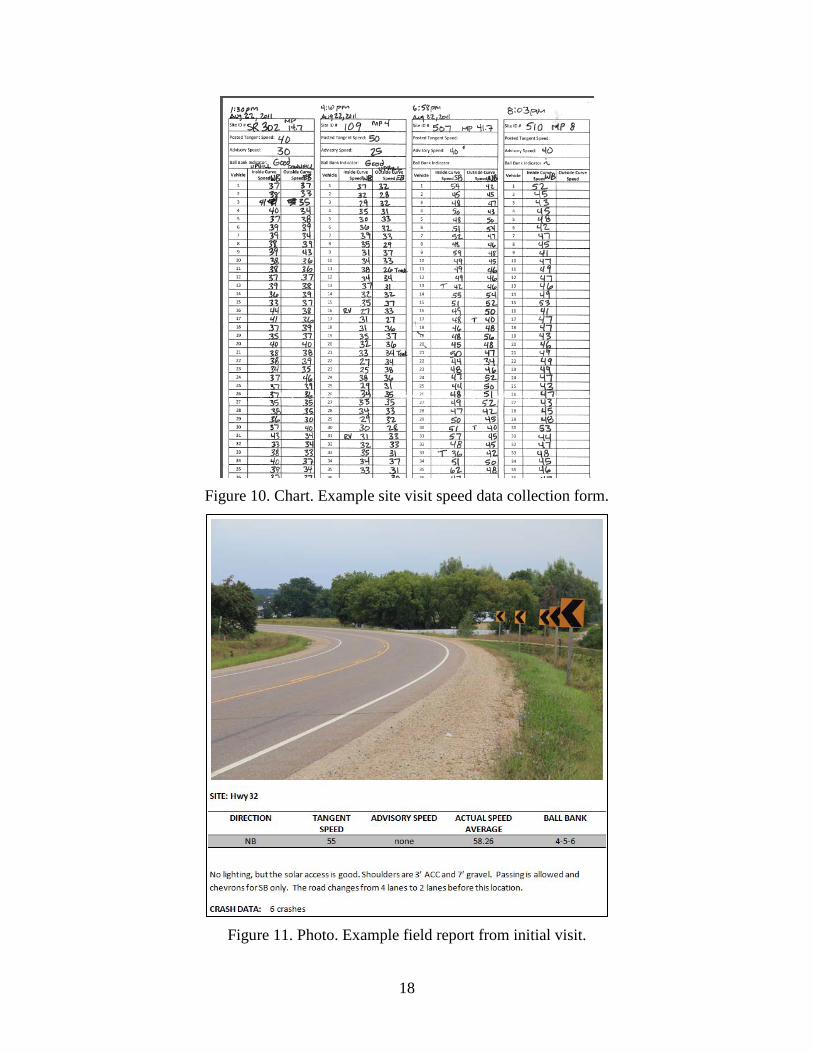
In addition, a speed study was conducted using a radar gun to verify whether a speeding problem exists. (An example of the site visit data collection form is shown in figure 10.) At least 25 speed observations were collected for both directions of traffic unless physically prohibited due to site conditions or topography. Mean speed, by direction, was calculated for each location. When sample size was sufficient, 85th percentile speeds were calculated. A speeding problem was identified if at least one of the following conditions existed:
• Mean speed exceeded the advisory speed limit by 5 mph or more, or, if an advisory speed was not posted, exceeded the posted speed limit by 5 mph or more.
• 85th percentile speed exceeded the advisory speed limit by 5 mph or more, or exceeded the posted speed limit by 5 mph or more, if an advisory speed was not present.
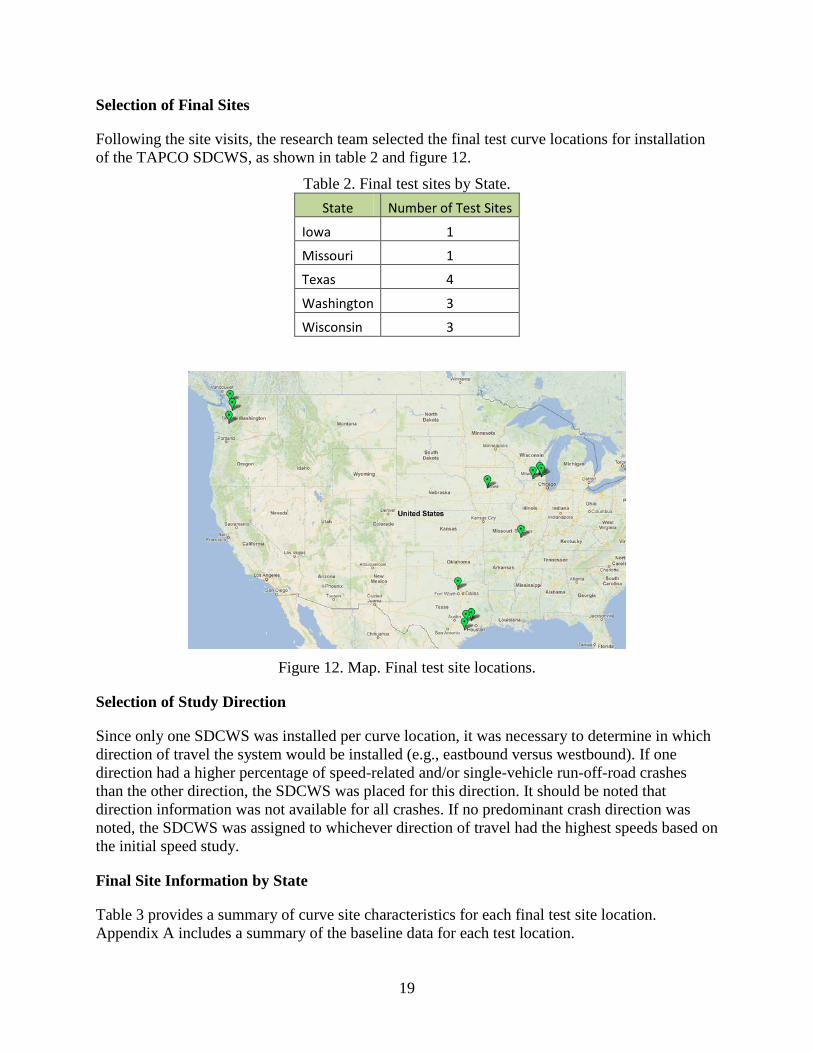
A field report was prepared which included all of the field information collected for each site visited; see the example shown in figure 11.
Figure 9. Photo. Candidate curve site in Washington State.
18
Figure 10. Chart. Example site visit speed data collection form.
Figure 11. Photo. Example field report from initial visit.
19
Selection of Final Sites
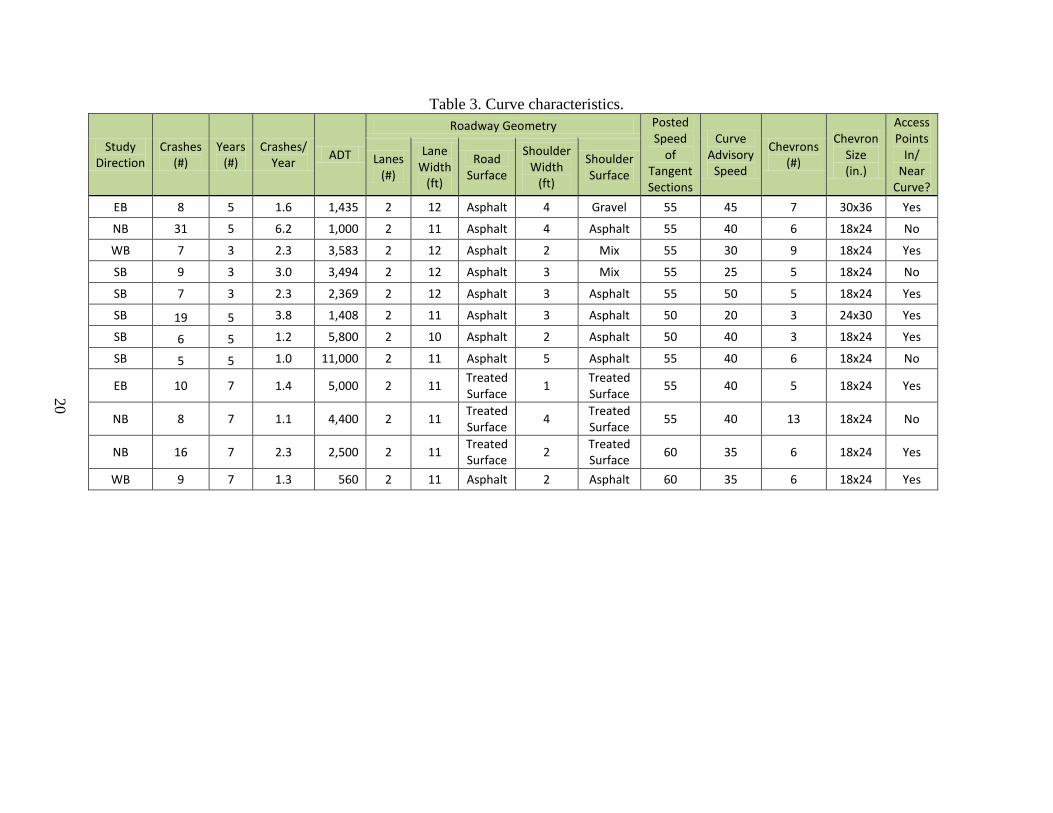
Following the site visits, the research team selected the final test curve locations for installation of the TAPCO SDCWS, as shown in table 2 and figure 12.
Table 2. Final test sites by State. State Number of Test Sites
Iowa 1
Missouri 1
Texas 4
Washington 3
Wisconsin 3
Figure 12. Map. Final test site locations.
Selection of Study Direction
Since only one SDCWS was installed per curve location, it was necessary to determine in which direction of travel the system would be installed (e.g., eastbound versus westbound). If one direction had a higher percentage of speed-related and/or single-vehicle run-off-road crashes than the other direction, the SDCWS was placed for this direction. It should be noted that direction information was not available for all crashes. If no predominant crash direction was noted, the SDCWS was assigned to whichever direction of travel had the highest speeds based on the initial speed study.
Final Site Information by State
Table 3 provides a summary of curve site characteristics for each final test site location. Appendix A includes a summary of the baseline data for each test location.
20
Table 3. Curve characteristics.
Study Direction
Crashes (#)
Years (#)
Crashes/ Year ADT
Roadway Geometry Posted Speed
of Tangent Sections
Curve Advisory
Speed
Chevrons (#)
Chevron Size (in.)
Access Points
In/ Near
Curve?
Lanes (#)
Lane Width
(ft)
Road Surface
Shoulder Width
(ft)
Shoulder Surface
EB 8 5 1.6 1,435 2 12 Asphalt 4 Gravel 55 45 7 30x36 Yes
NB 31 5 6.2 1,000 2 11 Asphalt 4 Asphalt 55 40 6 18x24 No
WB 7 3 2.3 3,583 2 12 Asphalt 2 Mix 55 30 9 18x24 Yes
SB 9 3 3.0 3,494 2 12 Asphalt 3 Mix 55 25 5 18x24 No
SB 7 3 2.3 2,369 2 12 Asphalt 3 Asphalt 55 50 5 18x24 Yes
SB 19 5 3.8 1,408 2 11 Asphalt 3 Asphalt 50 20 3 24x30 Yes
SB 6 5 1.2 5,800 2 10 Asphalt 2 Asphalt 50 40 3 18x24 Yes
SB 5 5 1.0 11,000 2 11 Asphalt 5 Asphalt 55 40 6 18x24 No
EB 10 7 1.4 5,000 2 11 Treated Surface 1 Treated
Surface 55 40 5 18x24 Yes
NB 8 7 1.1 4,400 2 11 Treated Surface 4 Treated
Surface 55 40 13 18x24 No
NB 16 7 2.3 2,500 2 11 Treated Surface 2 Treated
Surface 60 35 6 18x24 Yes
WB 9 7 1.3 560 2 11 Asphalt 2 Asphalt 60 35 6 18x24 Yes
21
INSTALLATION
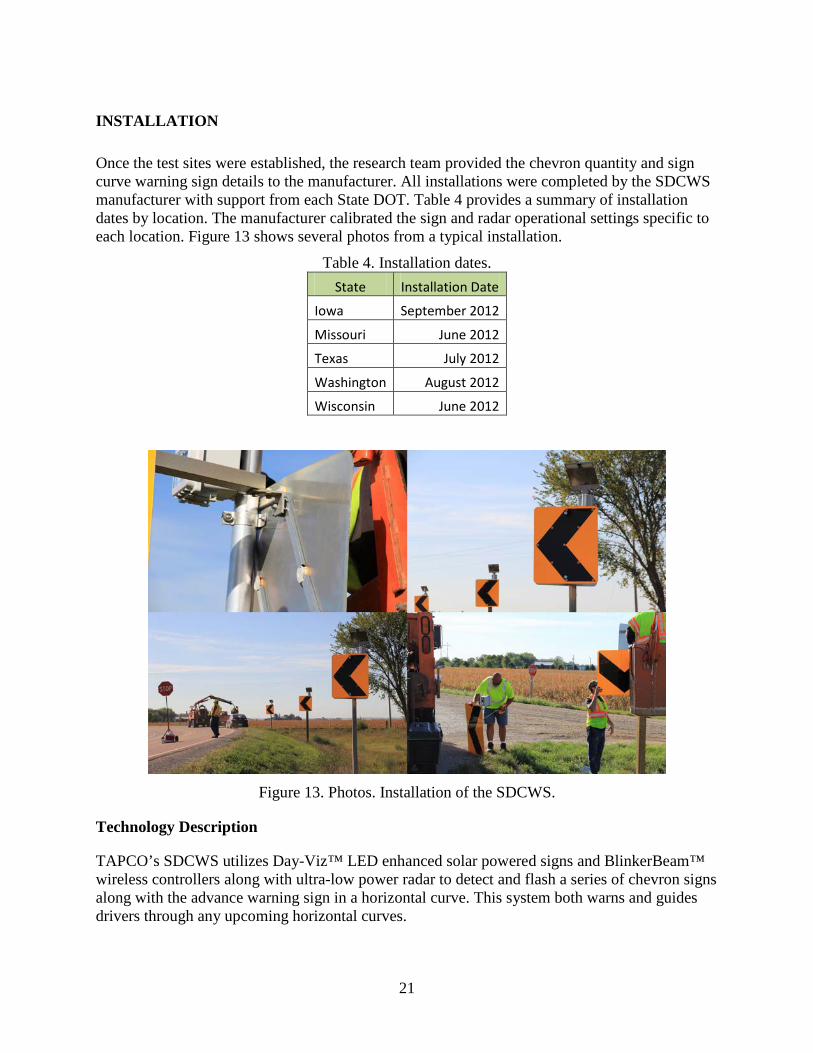
Once the test sites were established, the research team provided the chevron quantity and sign curve warning sign details to the manufacturer. All installations were completed by the SDCWS manufacturer with support from each State DOT. Table 4 provides a summary of installation dates by location. The manufacturer calibrated the sign and radar operational settings specific to each location. Figure 13 shows several photos from a typical installation.
Table 4. Installation dates. State Installation Date
Iowa September 2012
Missouri June 2012
Texas July 2012
Washington August 2012
Wisconsin June 2012
Figure 13. Photos. Installation of the SDCWS.
Technology Description
TAPCO’s SDCWS utilizes Day-Viz™ LED enhanced solar powered signs and BlinkerBeam™ wireless controllers along with ultra-low power radar to detect and flash a series of chevron signs along with the advance warning sign in a horizontal curve. This system both warns and guides drivers through any upcoming horizontal curves.

22
The SDCWS is meant to replace existing W1-8 and advance warning signage or be used in the design of a new curve as a low-cost warning system. Chapter 2C of the Manual on Uniform Traffic Control Devices (MUTCD) and engineering judgment should be applied when determining appropriate sign layouts and locations.
Using the length and speed of the curve, the user can set each of the W1-8 chevron signs to flash in a specific sequence or time interval. Each curve design will have different sign placement and geometry for consideration when determining the appropriate flash sequence.
Typically, each sign will flash at least once per second according to MUTCD guidelines, with a minimum flash “ON” time of 100 milliseconds. When the quantity of chevrons exceeds nine, chevrons are commonly divided into two separate sequentially flashing systems in which the first and fifth sign will start flashing at the same time, followed by the second and sixth, and so on. This gives the effect of the system guiding or pulling the driver through the curve and highlights the geometry while still meeting the MUTCD guidelines.
The speed of the sequence and flash duration are determined based on the quantity of signs and speed of the curve. For example, when the speed of the curve is 45 mph and the curve distance from the start of the advance warning sign to the last chevron is 1,000 ft, the flash duration can be set to 15 seconds (1,000 ft ÷ 66 ft/sec = 15 seconds). This time will vary based on existing sign locations, driver speed, and other factors noticed during installation.
The radar can detect up to 300 ft in advance of the curve sign and will commonly be set to flash at or just below the advisory speed of the curve. Once this speed threshold is exceeded, the radar will trigger the flash of the advance warning sign and sequential chevron signs using TAPCO’s 900-Mhz BlinkerBeam™ wireless network. This wireless network is constantly communicating with each sign and providing a synchronization pulse throughout the network. This synchronization pulse is what each sign controller will use to keep the proper flash time and sequence.
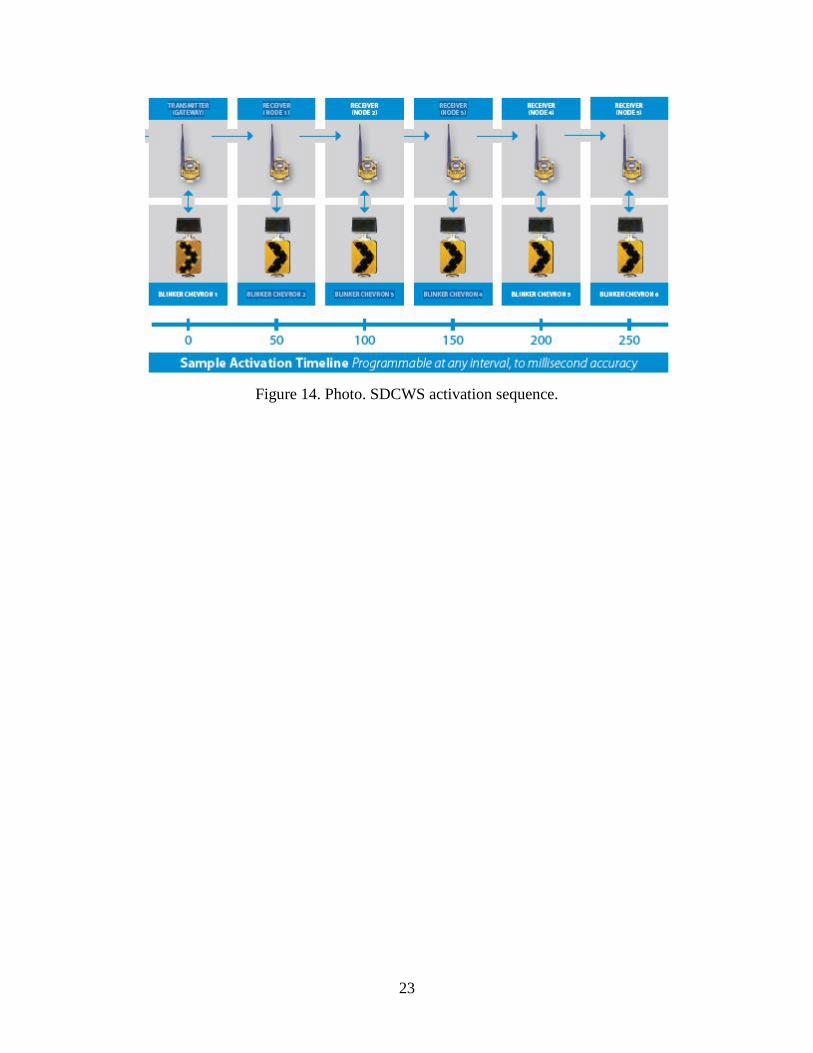
During setup, the user can program when the sign LEDs should turn on (called “Beacon Start”) and the duration they should stay on (called “Beacon Stop”). The Beacon Stop will become the duty cycle, which is typically no less than 100 milliseconds. This allows many options for configuring the flash sequence and speed of the flash for each horizontal curve. The system in its entirety can be seen in figure 14.
23
Figure 14. Photo. SDCWS activation sequence.

24
25
METHODOLOGY FOR SPEED DATA COLLECTION
The collection of traffic speed and volume data was integral to this project because these data provide the before-and-after contrast necessary to assess the effectiveness of the SDCWS.
Equipment
Pneumatic road tubes and counters were used to collect speed and volume data. The advantage of the road tubes is that they are reasonably accurate, can collect individual vehicle speeds (allowing for spot-checking of the data), are low-cost, and are nondestructive to the existing roadway surface. The counters used were Trax I automatic traffic recorders manufactured by JAMAR Technologies, Inc. The units can collect individual vehicle speeds, headways, vehicle class, and volume.
For each data collection period, the counters were set up to record time, vehicle speed, and vehicle class for individual vehicles. Other metrics such as volume, headway, average speed, etc., can be calculated from these data. Since time on the counter can drift the counters, clocks were checked and reset each time they were used.
Data Collection Periods
Speed and volume data were collected at each test location using the pneumatic road tubes. Data collected about 1 month before installation are referred to as “before” data. Data collected about 1 month after installation are referred to as “1 month after” data. In all States, data will be collected again at about 12 and 18 months after installation (referred to as “1 year” and “18 months” data).
Data Collection Protocol and Quality Assurance
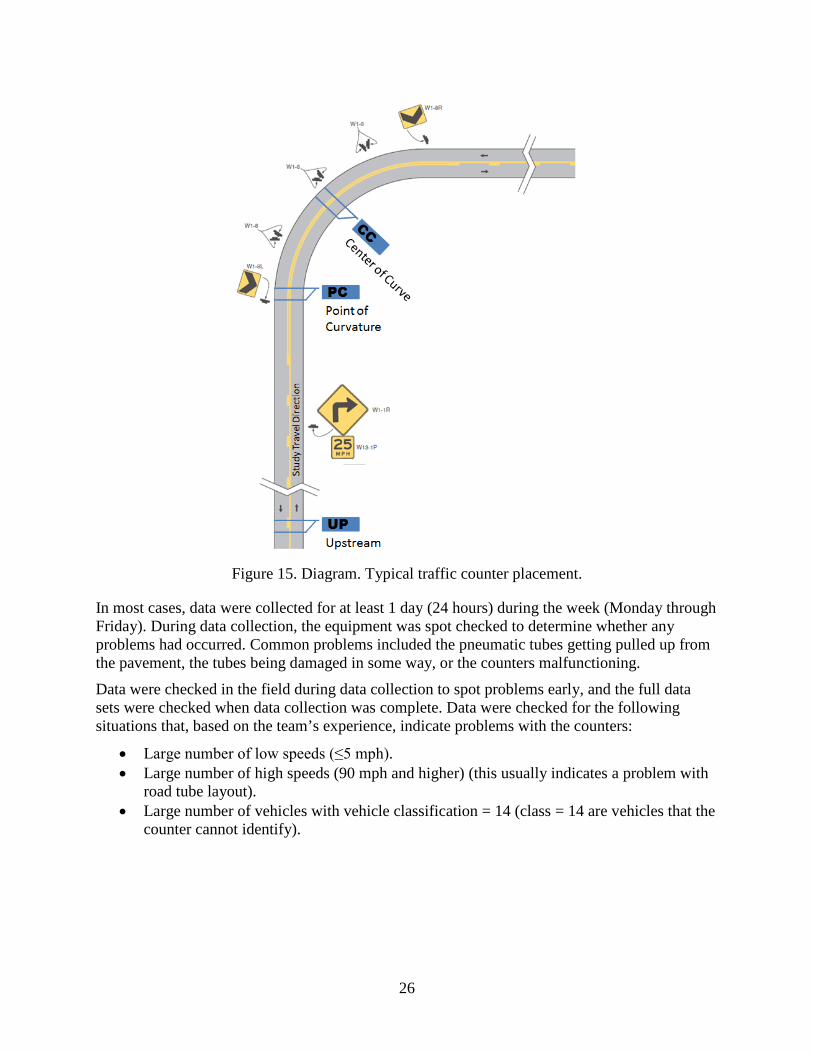
Speed and volume data were collected at three locations per test site. The goal was to understand driver speed selection in advance, at the beginning of the curve, and within the curve. These three locations are described below and shown in figure 15:
• Upstream – Road tubes were placed approximately 500 ft before the advanced curve warning sign (just in advance of being detected by the radar within the advance curve warning sign).
• PC – These tubes were placed at the point of curvature or beginning point of the curve. • CC – Tubes placed within the center of the curve.
26
Figure 15. Diagram. Typical traffic counter placement.
In most cases, data were collected for at least 1 day (24 hours) during the week (Monday through Friday). During data collection, the equipment was spot checked to determine whether any problems had occurred. Common problems included the pneumatic tubes getting pulled up from the pavement, the tubes being damaged in some way, or the counters malfunctioning.
Data were checked in the field during data collection to spot problems early, and the full data sets were checked when data collection was complete. Data were checked for the following situations that, based on the team’s experience, indicate problems with the counters:
• Large number of low speeds (≤5 mph). • Large number of high speeds (90 mph and higher) (this usually indicates a problem with
road tube layout). • Large number of vehicles with vehicle classification = 14 (class = 14 are vehicles that the
counter cannot identify).
27
SPEED ANALYSIS
This chapter describes the speed metrics used to assess the effectiveness of the SDCWS. Since data were collected at three locations per curve, results for individual sites are summarized.
Speed Metrics
The change in speed from the before period was compared to each after period. A negative result indicates that speeds were reduced from the before period to the after period. A positive value indicates that speed increased from the before period to the after period. Mean and 85th percentile speeds are shown using a trend line. This is shown for graphical purposes only and should not be interpreted to indicate that speeds can be interpolated between data collection periods.
The change in mean and 85th percentile speed from the before period speed to specific after period speed are shown in miles per hour (mph). The percentage change in the fraction of vehicles exceeding the posted or advisory speed is also presented. A number of speed metrics were calculated for the direction of travel towards the signs. They include average speed, standard deviation (SD) of speed, 50th percentile speed, 85th percentile speed, and number of vehicles traveling 5, 10, 15, or 20 mph over the posted or advisory speed limit. For simplicity in setting up the pneumatic road tubes, the traffic counters were set up to record both directions of traffic on the two-way roadway. Results were reduced by lane and are only presented for traffic traveling in the direction of the SDCWS.
Results to Date
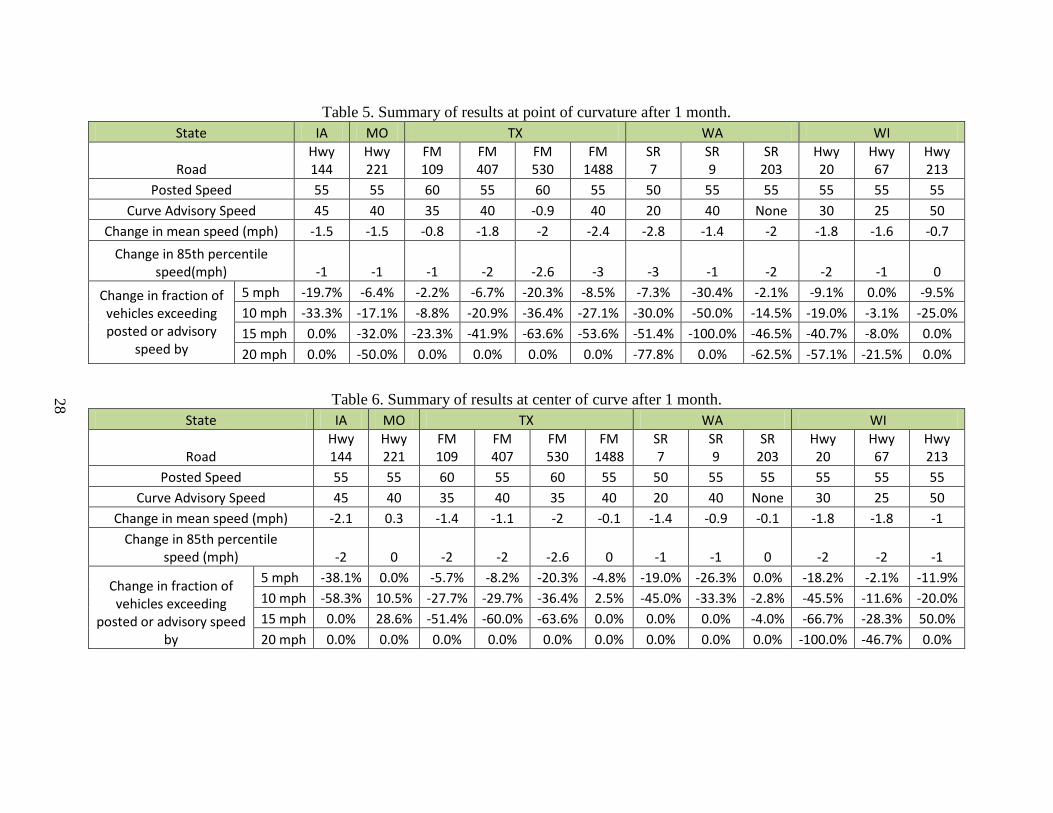
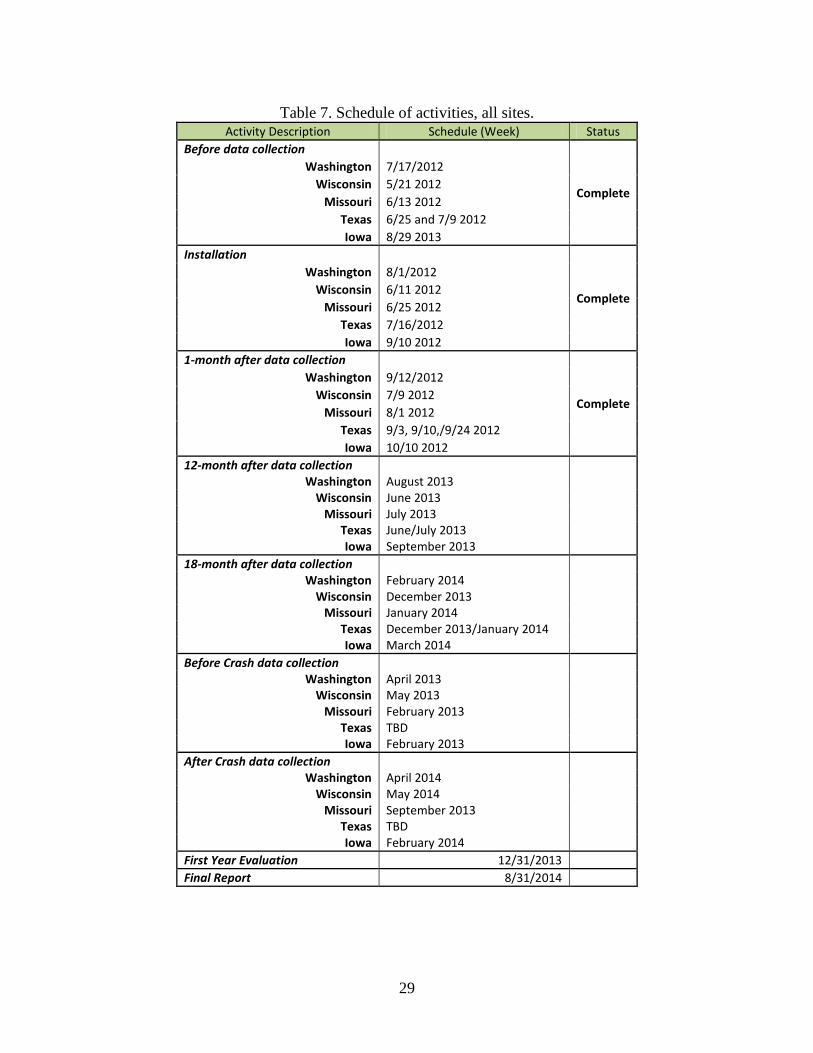
This interim report does not provide a commentary on the results to date. Tables 5 and 6 provide a summary of speed statistics across all sites at both PC and CC. The table shows the changes from before to 1 month after, with a negative sign showing a reduction in speed or percentage. Appendix contains the full data set collected before installation and 1 month after installation, in both tabular and graphic formats. The schedule of the data collection for each State is provided in table 7. This shows both data that have been collected and what will be collected in the future.
28
Table 5. Summary of results at point of curvature after 1 month. State IA MO TX WA WI
Road Hwy 144
Hwy 221
FM 109
FM 407
FM 530
FM 1488
SR 7
SR 9
SR 203
Hwy 20
Hwy 67
Hwy 213
Posted Speed 55 55 60 55 60 55 50 55 55 55 55 55 Curve Advisory Speed 45 40 35 40 -0.9 40 20 40 None 30 25 50
Change in mean speed (mph) -1.5 -1.5 -0.8 -1.8 -2 -2.4 -2.8 -1.4 -2 -1.8 -1.6 -0.7 Change in 85th percentile
speed(mph) -1 -1 -1 -2 -2.6 -3 -3 -1 -2 -2 -1 0
Change in fraction of vehicles exceeding posted or advisory
speed by
5 mph -19.7% -6.4% -2.2% -6.7% -20.3% -8.5% -7.3% -30.4% -2.1% -9.1% 0.0% -9.5% 10 mph -33.3% -17.1% -8.8% -20.9% -36.4% -27.1% -30.0% -50.0% -14.5% -19.0% -3.1% -25.0% 15 mph 0.0% -32.0% -23.3% -41.9% -63.6% -53.6% -51.4% -100.0% -46.5% -40.7% -8.0% 0.0% 20 mph 0.0% -50.0% 0.0% 0.0% 0.0% 0.0% -77.8% 0.0% -62.5% -57.1% -21.5% 0.0%
Table 6. Summary of results at center of curve after 1 month.
State IA MO TX WA WI
Road Hwy 144
Hwy 221
FM 109
FM 407
FM 530
FM 1488
SR 7
SR 9
SR 203
Hwy 20
Hwy 67
Hwy 213
Posted Speed 55 55 60 55 60 55 50 55 55 55 55 55 Curve Advisory Speed 45 40 35 40 35 40 20 40 None 30 25 50
Change in mean speed (mph) -2.1 0.3 -1.4 -1.1 -2 -0.1 -1.4 -0.9 -0.1 -1.8 -1.8 -1 Change in 85th percentile
speed (mph) -2 0 -2 -2 -2.6 0 -1 -1 0 -2 -2 -1
Change in fraction of vehicles exceeding
posted or advisory speed by
5 mph -38.1% 0.0% -5.7% -8.2% -20.3% -4.8% -19.0% -26.3% 0.0% -18.2% -2.1% -11.9% 10 mph -58.3% 10.5% -27.7% -29.7% -36.4% 2.5% -45.0% -33.3% -2.8% -45.5% -11.6% -20.0% 15 mph 0.0% 28.6% -51.4% -60.0% -63.6% 0.0% 0.0% 0.0% -4.0% -66.7% -28.3% 50.0% 20 mph 0.0% 0.0% 0.0% 0.0% 0.0% 0.0% 0.0% 0.0% 0.0% -100.0% -46.7% 0.0%
29
Table 7. Schedule of activities, all sites. Activity Description Schedule (Week) Status
Before data collection
Complete
Washington 7/17/2012 Wisconsin 5/21 2012
Missouri 6/13 2012 Texas 6/25 and 7/9 2012 Iowa 8/29 2013
Installation
Complete
Washington 8/1/2012 Wisconsin 6/11 2012
Missouri 6/25 2012 Texas 7/16/2012 Iowa 9/10 2012
1-month after data collection
Complete
Washington 9/12/2012 Wisconsin 7/9 2012
Missouri 8/1 2012 Texas 9/3, 9/10,/9/24 2012 Iowa 10/10 2012
12-month after data collection Washington August 2013
Wisconsin June 2013 Missouri July 2013
Texas June/July 2013 Iowa September 2013
18-month after data collection Washington February 2014
Wisconsin December 2013 Missouri January 2014
Texas December 2013/January 2014 Iowa March 2014
Before Crash data collection Washington April 2013
Wisconsin May 2013 Missouri February 2013
Texas TBD Iowa February 2013
After Crash data collection Washington April 2014
Wisconsin May 2014 Missouri September 2013
Texas TBD Iowa February 2014
First Year Evaluation 12/31/2013 Final Report 8/31/2014

30
31
APPE
ND
IX A
. BA
SEL
INE
DA
TA
FOR
EA
CH
TE
ST SE
CT
ION
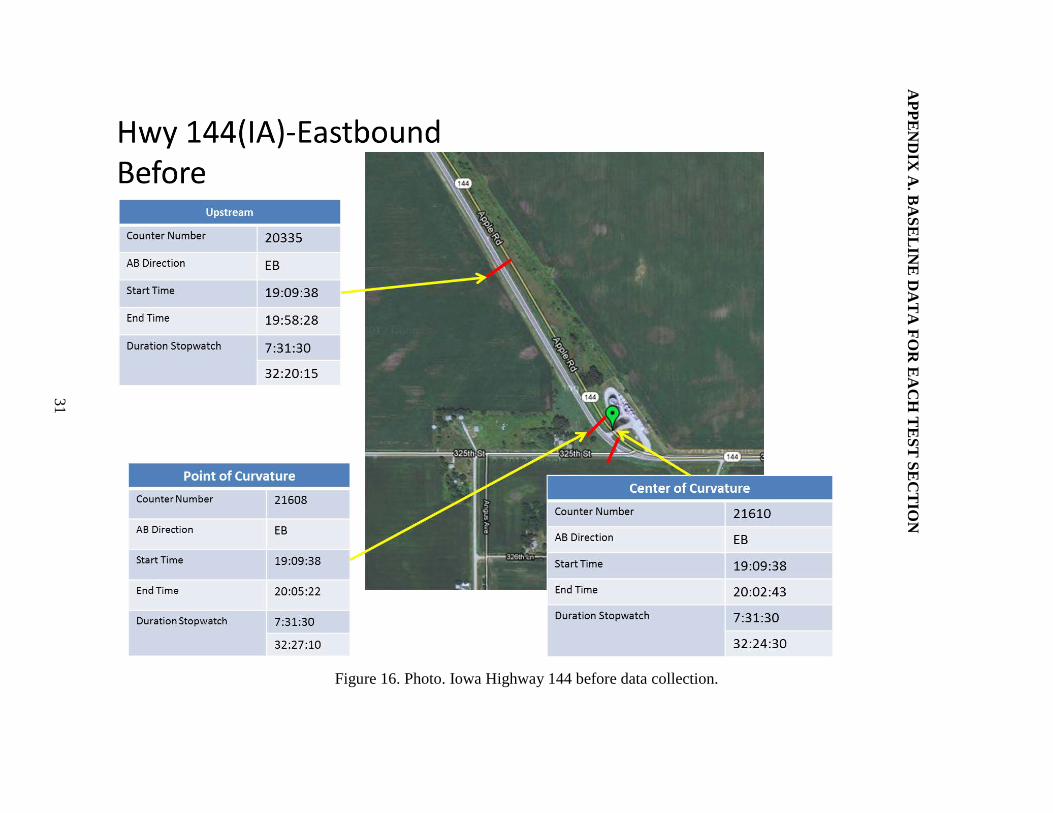
Figure 16. Photo. Iowa Highway 144 before data collection.
32
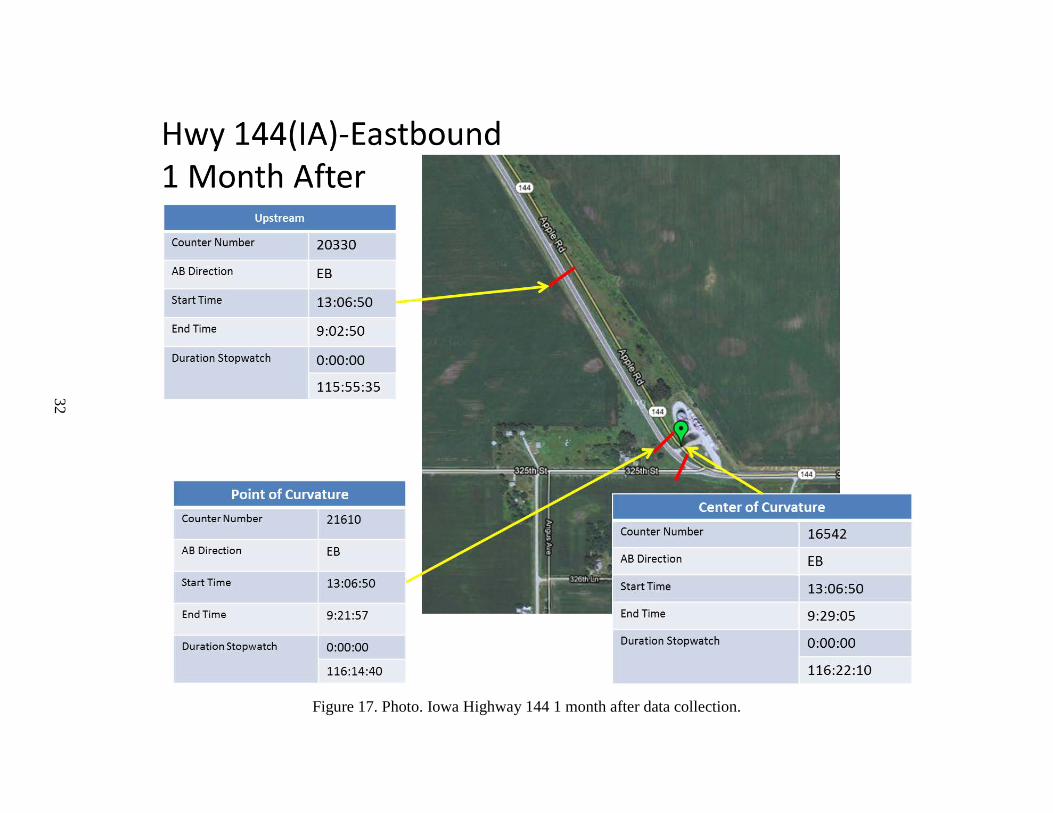
Figure 17. Photo. Iowa Highway 144 1 month after data collection.
33
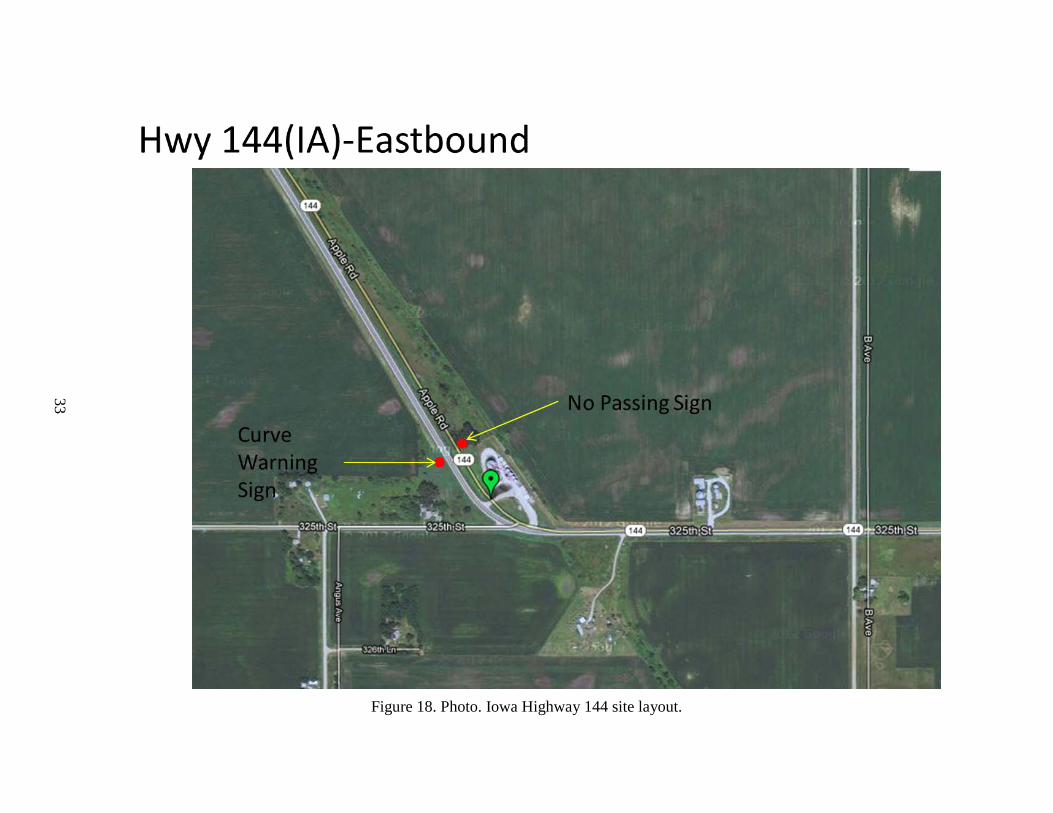
Figure 18. Photo. Iowa Highway 144 site layout.
34
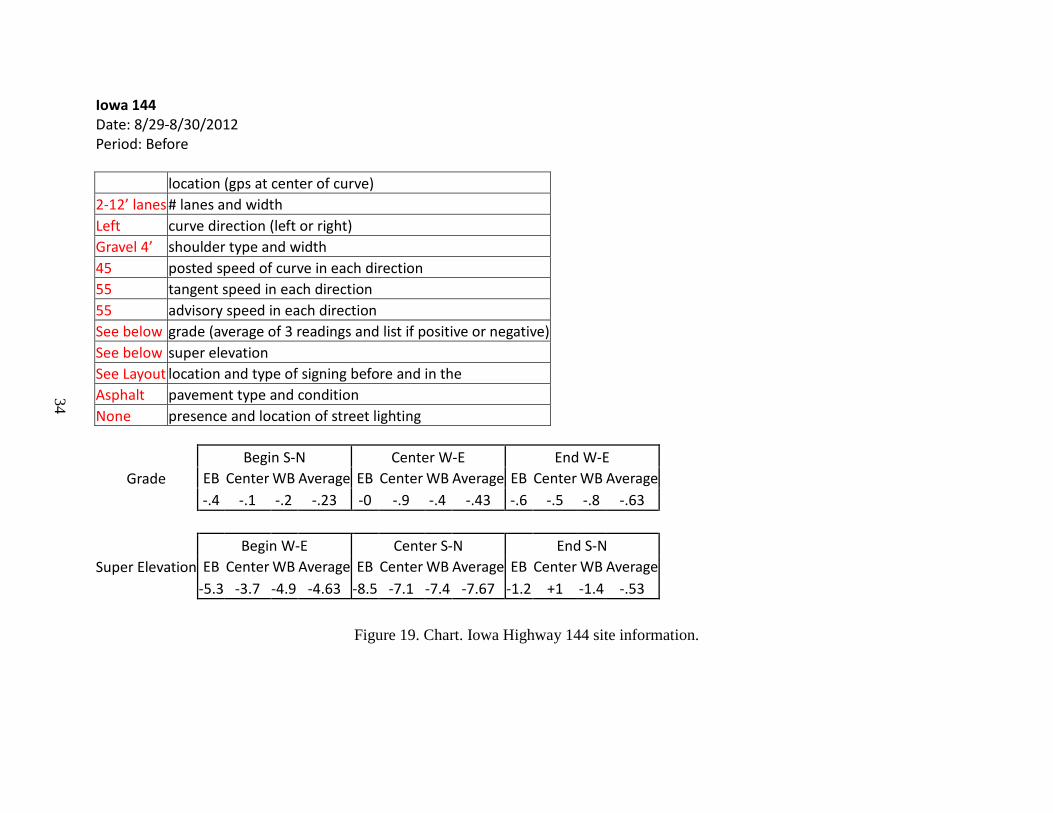
Iowa 144 Date: 8/29-8/30/2012 Period: Before
location (gps at center of curve)
2-12’ lanes # lanes and width Left curve direction (left or right) Gravel 4’ shoulder type and width 45 posted speed of curve in each direction 55 tangent speed in each direction 55 advisory speed in each direction See below grade (average of 3 readings and list if positive or negative) See below super elevation See Layout location and type of signing before and in the Asphalt pavement type and condition None presence and location of street lighting
Grade Begin S-N Center W-E End W-E
EB Center WB Average EB Center WB Average EB Center WB Average -.4 -.1 -.2 -.23 -0 -.9 -.4 -.43 -.6 -.5 -.8 -.63
Super Elevation
Begin W-E Center S-N End S-N EB Center WB Average EB Center WB Average EB Center WB Average
-5.3 -3.7 -4.9 -4.63 -8.5 -7.1 -7.4 -7.67 -1.2 +1 -1.4 -.53
Figure 19. Chart. Iowa Highway 144 site information.
35
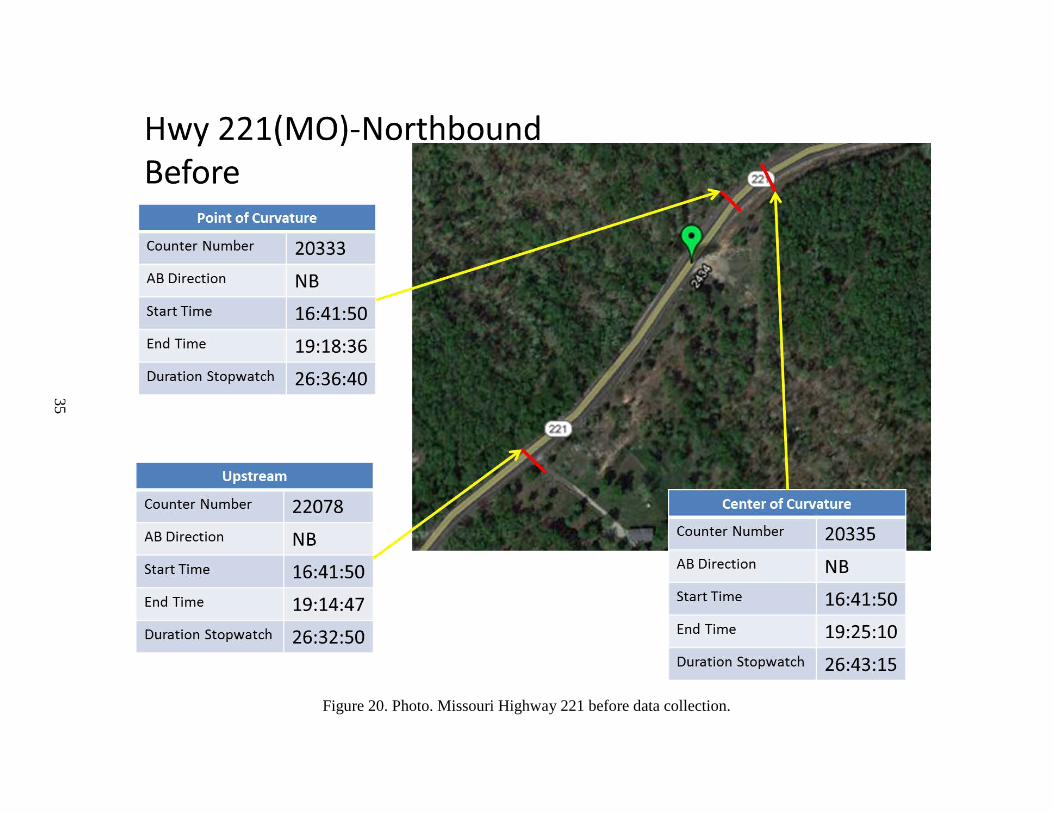
Figure 20. Photo. Missouri Highway 221 before data collection.
36
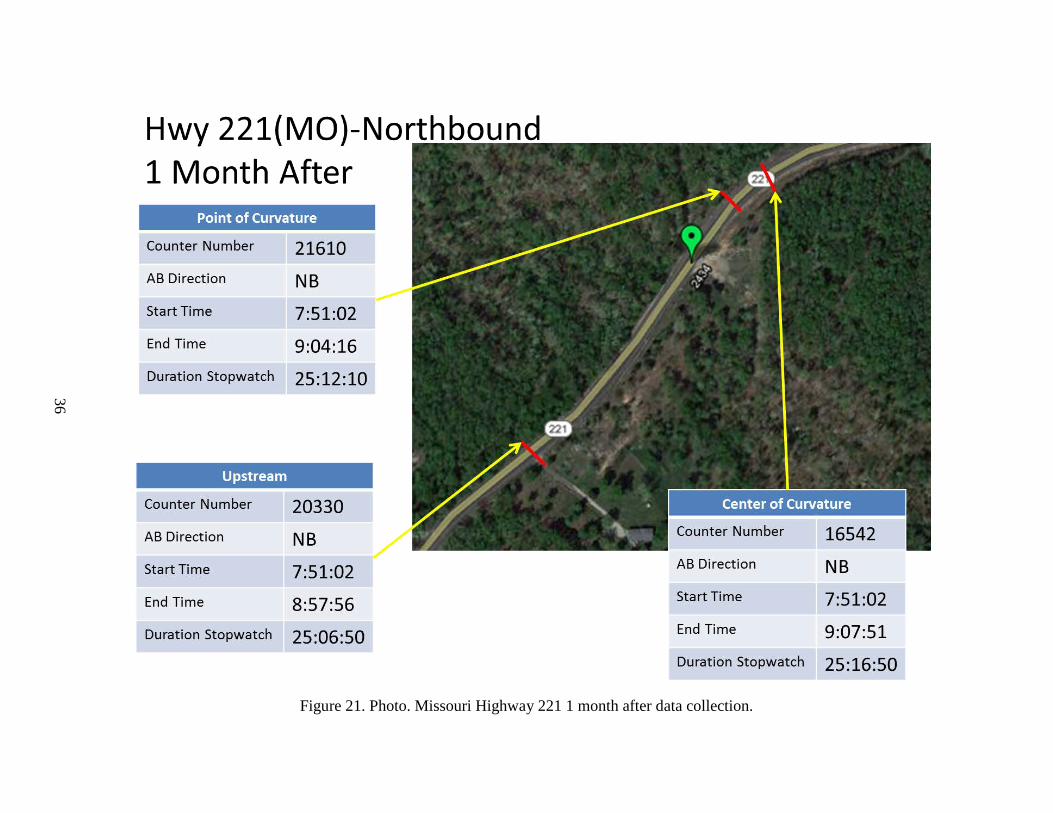
Figure 21. Photo. Missouri Highway 221 1 month after data collection.
37
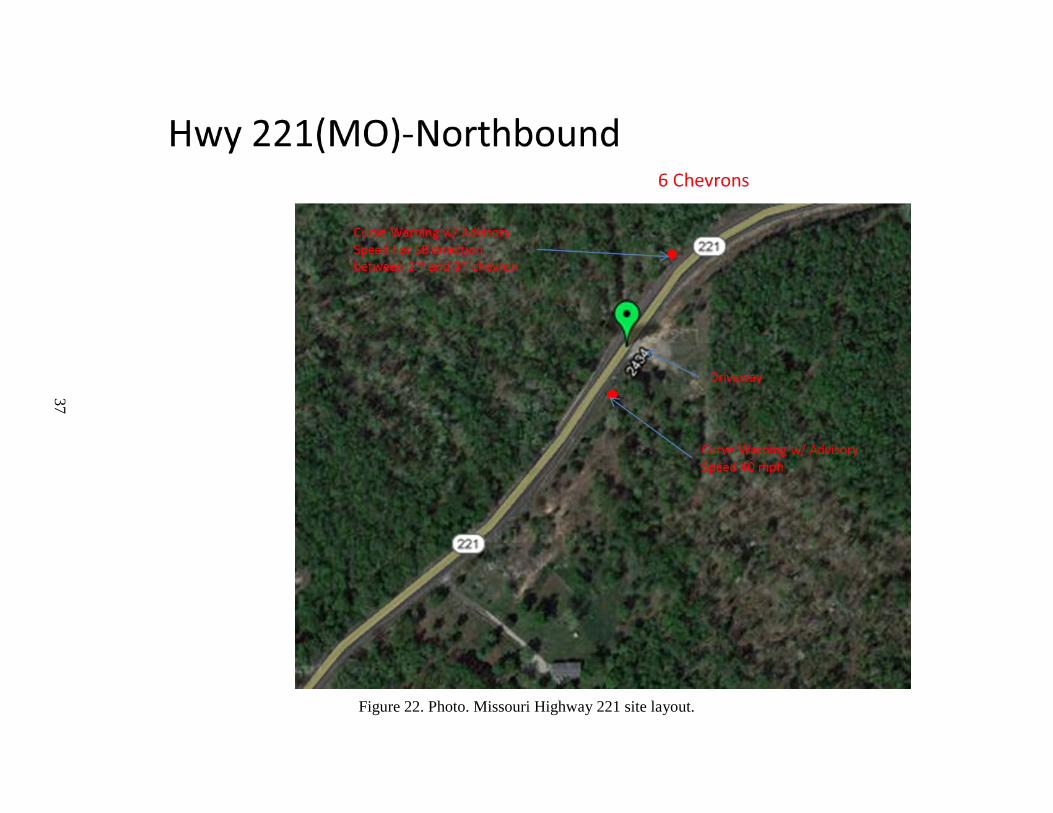
Figure 22. Photo. Missouri Highway 221 site layout.
38
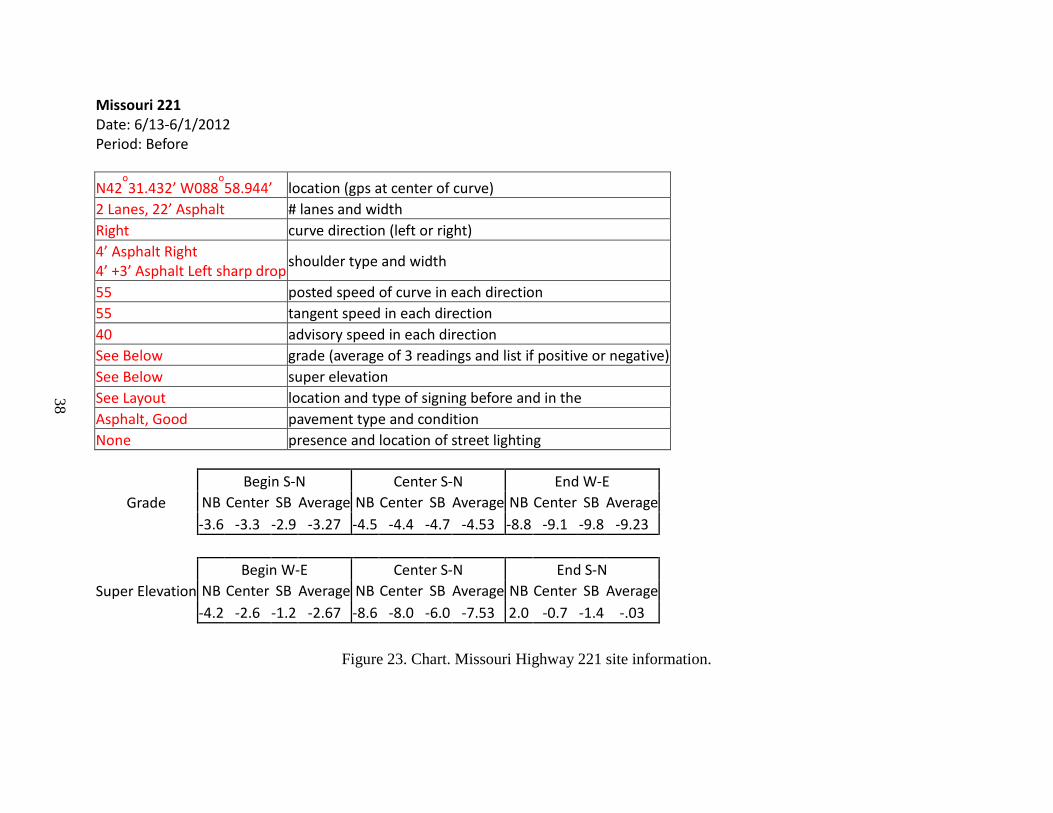
Missouri 221 Date: 6/13-6/1/2012 Period: Before N42
o31.432’ W088
o58.944’ location (gps at center of curve)
2 Lanes, 22’ Asphalt # lanes and width Right curve direction (left or right) 4’ Asphalt Right 4’ +3’ Asphalt Left sharp drop shoulder type and width 55 posted speed of curve in each direction 55 tangent speed in each direction 40 advisory speed in each direction See Below grade (average of 3 readings and list if positive or negative) See Below super elevation See Layout location and type of signing before and in the Asphalt, Good pavement type and condition None presence and location of street lighting
Grade Begin S-N Center S-N End W-E
NB Center SB Average NB Center SB Average NB Center SB Average -3.6 -3.3 -2.9 -3.27 -4.5 -4.4 -4.7 -4.53 -8.8 -9.1 -9.8 -9.23
Super Elevation
Begin W-E Center S-N End S-N NB Center SB Average NB Center SB Average NB Center SB Average -4.2 -2.6 -1.2 -2.67 -8.6 -8.0 -6.0 -7.53 2.0 -0.7 -1.4 -.03
Figure 23. Chart. Missouri Highway 221 site information.
39
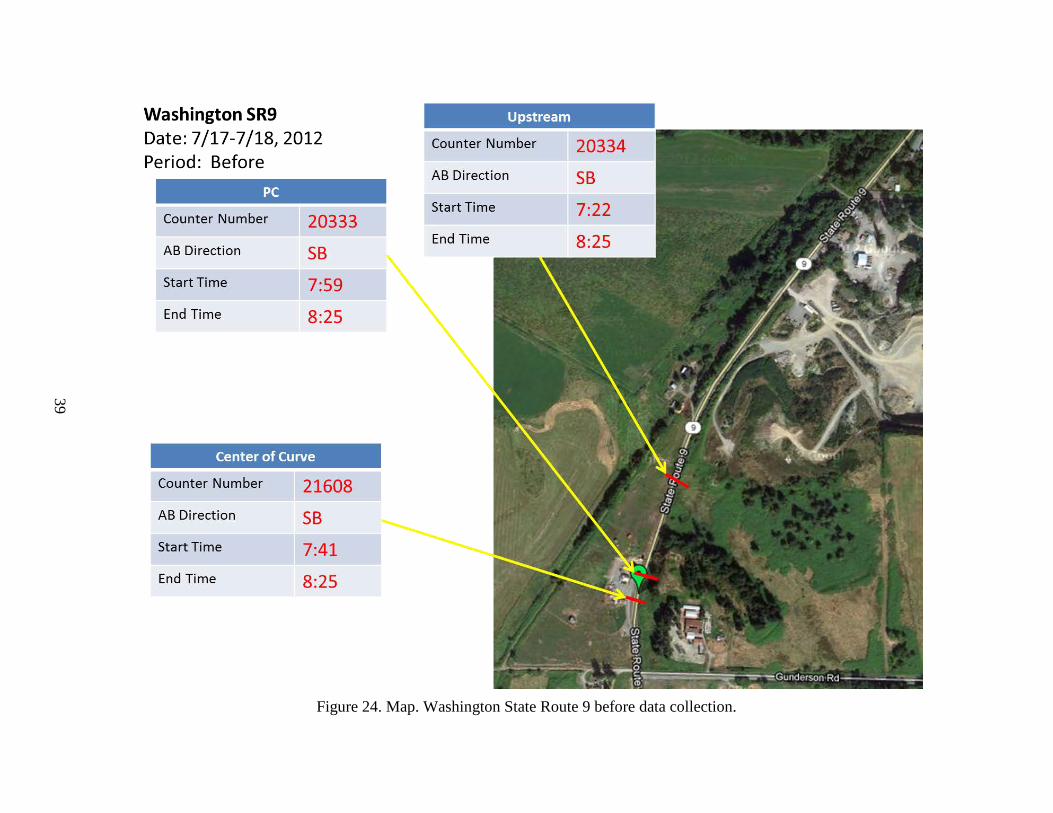
Figure 24. Map. Washington State Route 9 before data collection.

40
Figure 25. Map. Washington State Route 9 1 month after data collection.
41
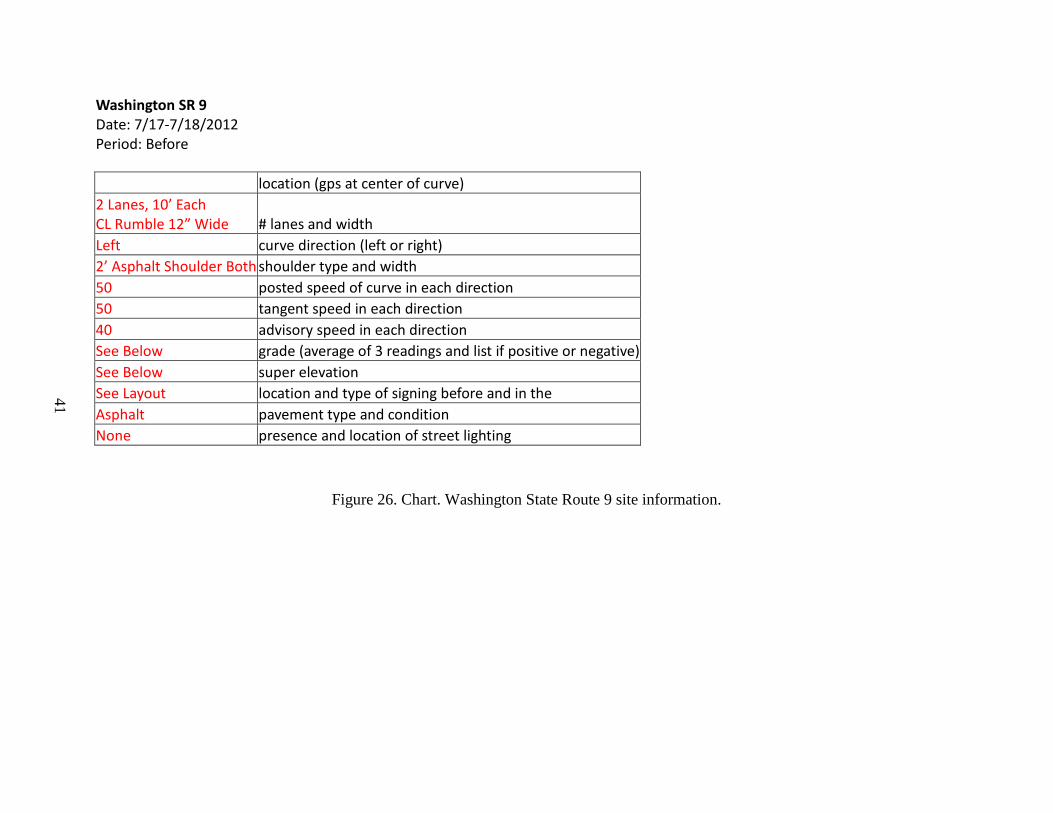
Washington SR 9 Date: 7/17-7/18/2012 Period: Before
location (gps at center of curve)
2 Lanes, 10’ Each CL Rumble 12” Wide # lanes and width Left curve direction (left or right) 2’ Asphalt Shoulder Both shoulder type and width 50 posted speed of curve in each direction 50 tangent speed in each direction 40 advisory speed in each direction See Below grade (average of 3 readings and list if positive or negative) See Below super elevation See Layout location and type of signing before and in the Asphalt pavement type and condition None presence and location of street lighting
Figure 26. Chart. Washington State Route 9 site information.
42
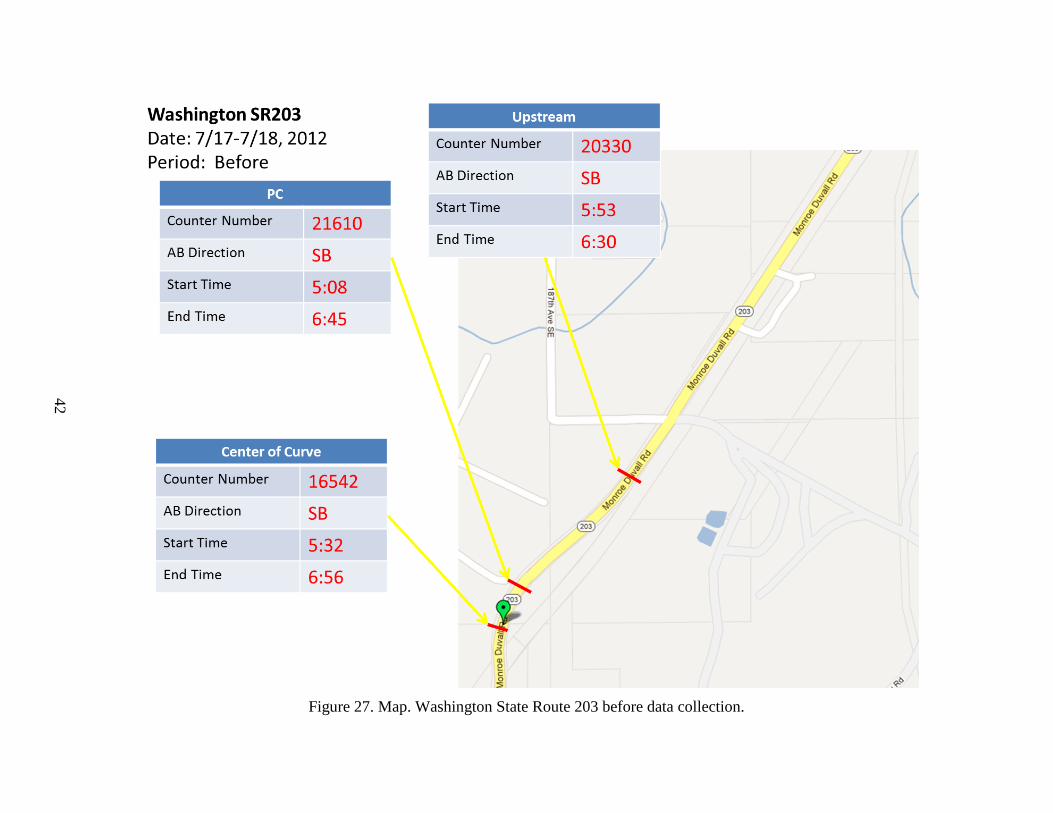
Figure 27. Map. Washington State Route 203 before data collection.
43
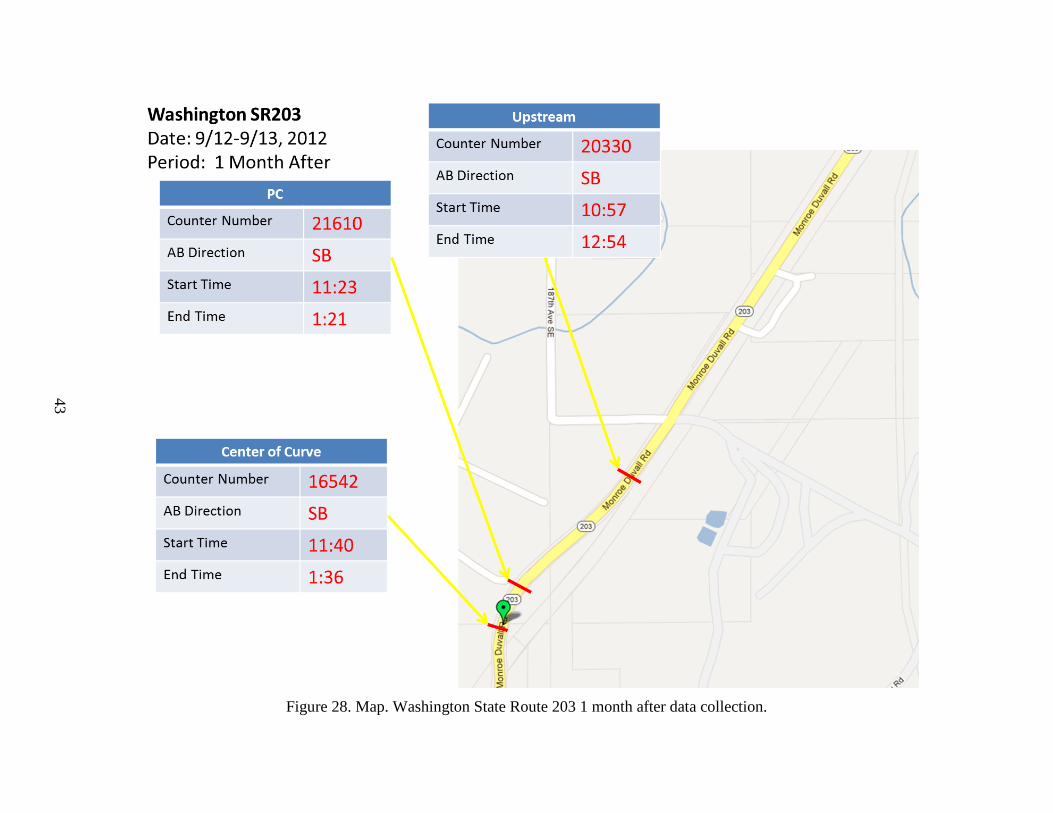
Figure 28. Map. Washington State Route 203 1 month after data collection.
44
Washington SR 203 Date: 7/17-7/18/2012 Period: Before
location (gps at center of curve)
2 lanes with 12” CL Rumble, 11’ NB Lane;10.5’ SB Lane # lanes and width Left curve direction (left or right) NB-4.5’ Asphalt Shld SB-8’ Asphalt w/ 12” Rumble shoulder type and width 55 posted speed of curve in each direction 55 tangent speed in each direction None advisory speed in each direction See Below grade (avg. of 3 readings and list if positive or negative) See Below super elevation See Layout location and type of signing before and in the Asphalt pavement type and condition None presence and location of street lighting
Figure 29. Chart. Washington State Route 203 site information.
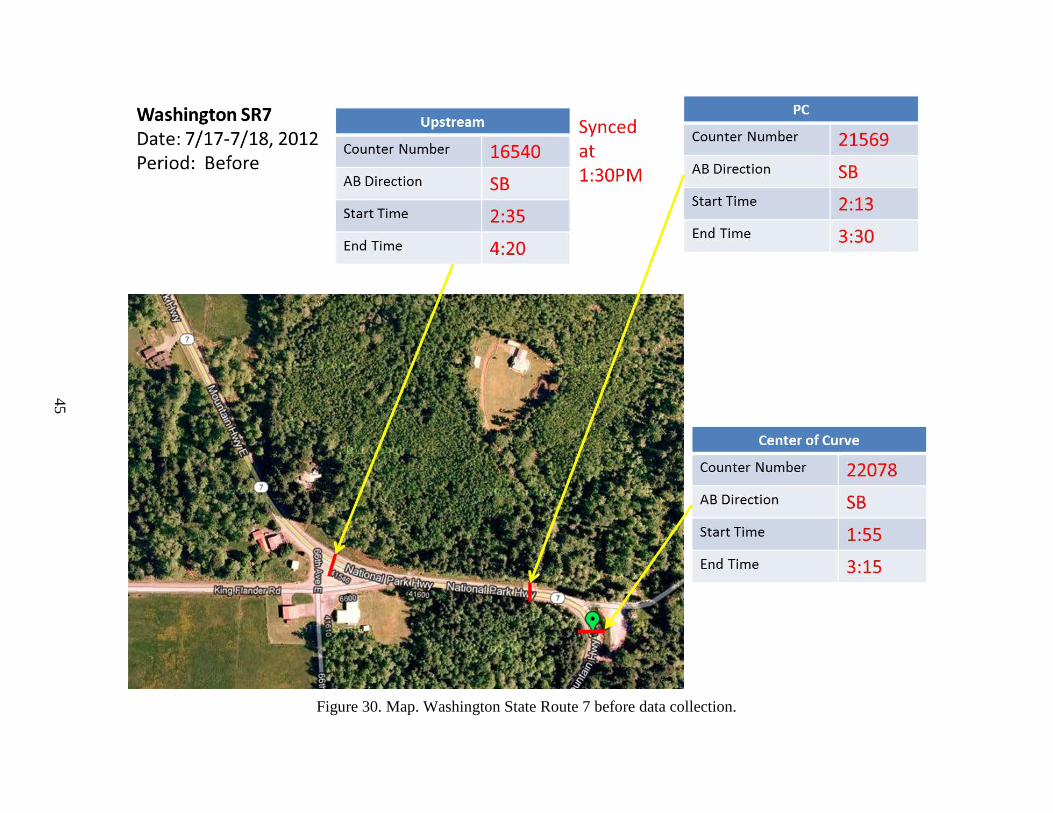
45
Figure 30. Map. Washington State Route 7 before data collection.
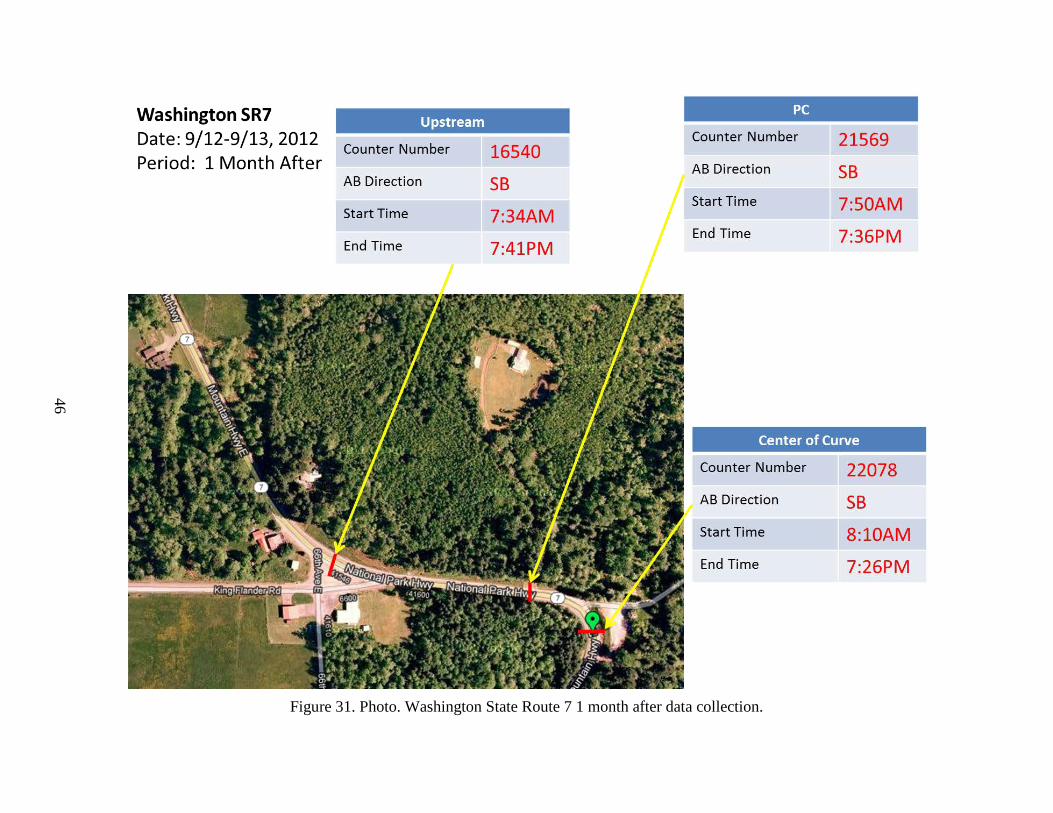
46
Figure 31. Photo. Washington State Route 7 1 month after data collection.
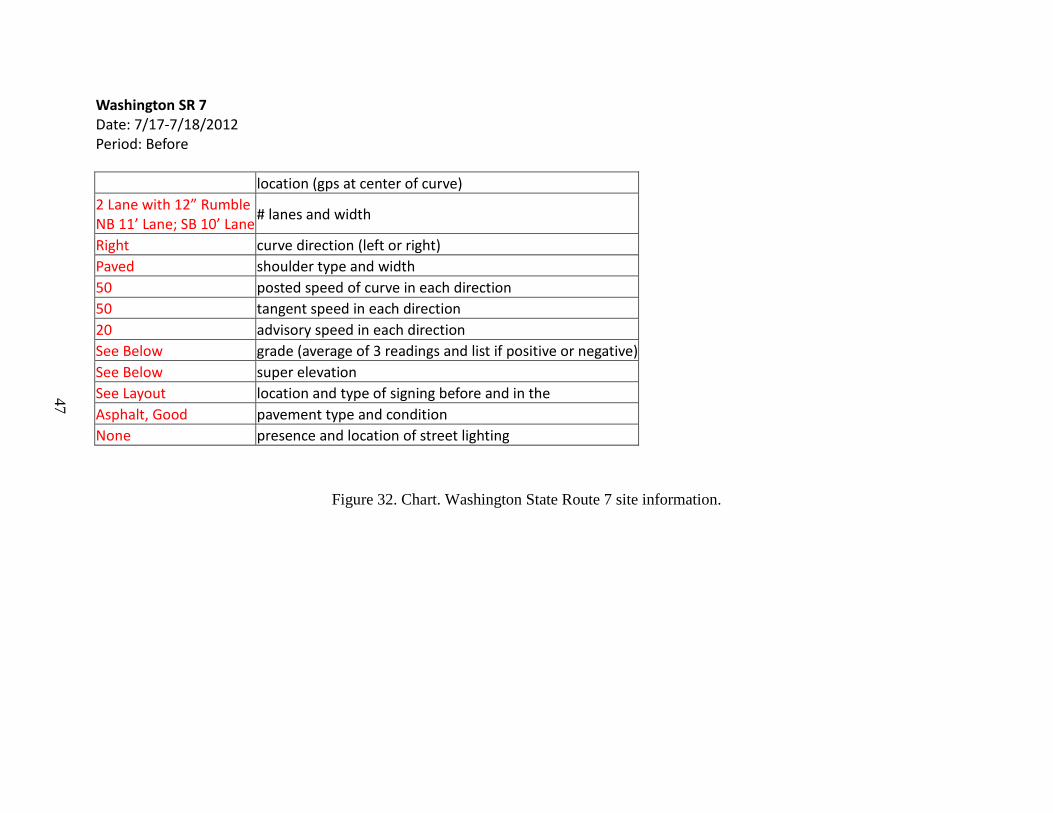
47
Washington SR 7 Date: 7/17-7/18/2012 Period: Before
location (gps at center of curve) 2 Lane with 12” Rumble NB 11’ Lane; SB 10’ Lane # lanes and width Right curve direction (left or right) Paved shoulder type and width 50 posted speed of curve in each direction 50 tangent speed in each direction 20 advisory speed in each direction See Below grade (average of 3 readings and list if positive or negative) See Below super elevation See Layout location and type of signing before and in the Asphalt, Good pavement type and condition None presence and location of street lighting
Figure 32. Chart. Washington State Route 7 site information.
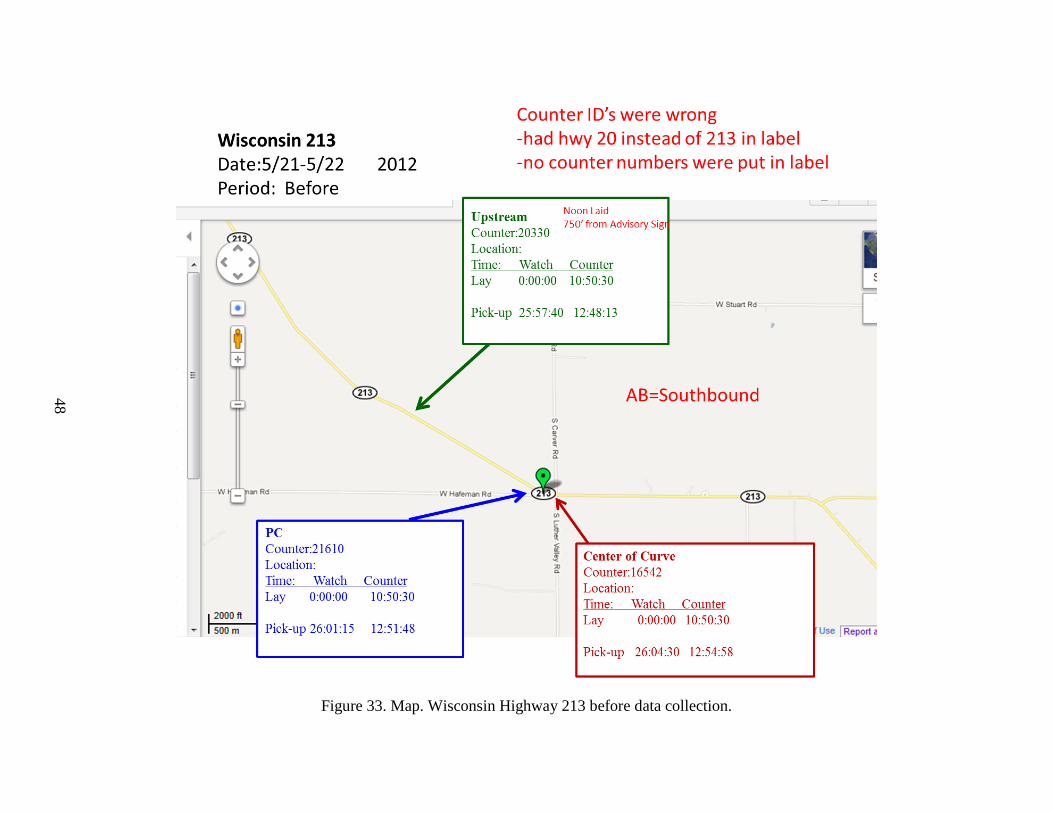
48
Figure 33. Map. Wisconsin Highway 213 before data collection.
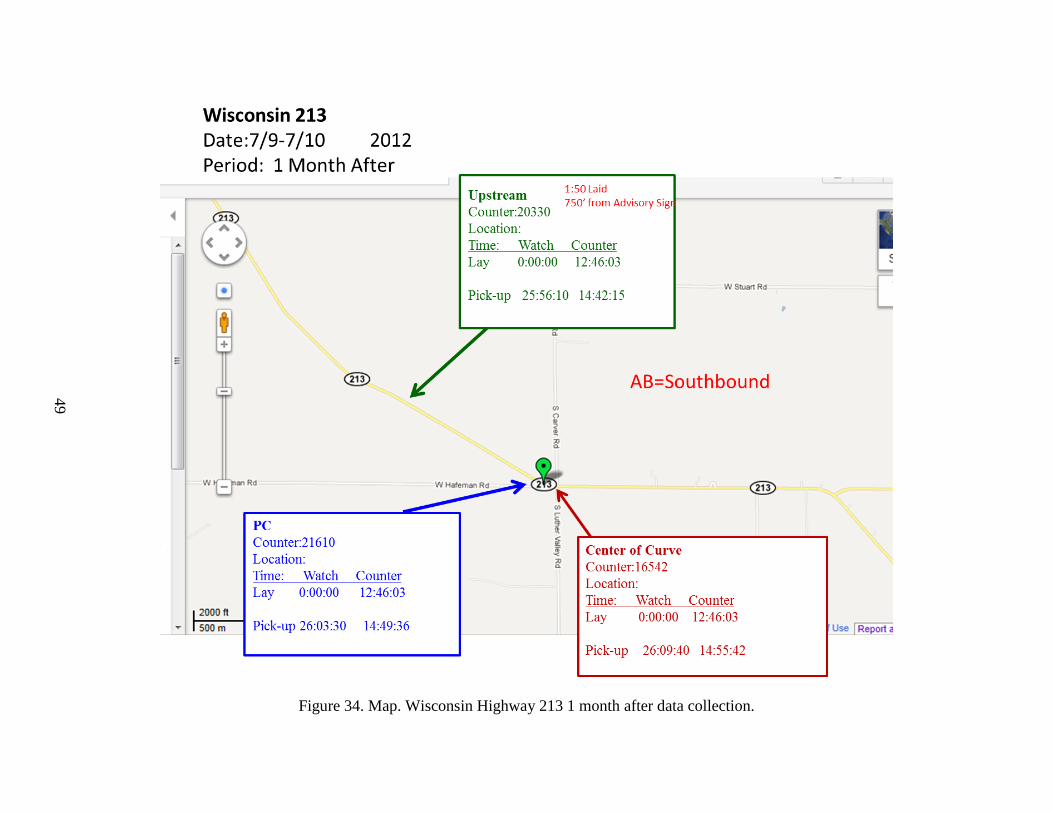
49
Figure 34. Map. Wisconsin Highway 213 1 month after data collection.
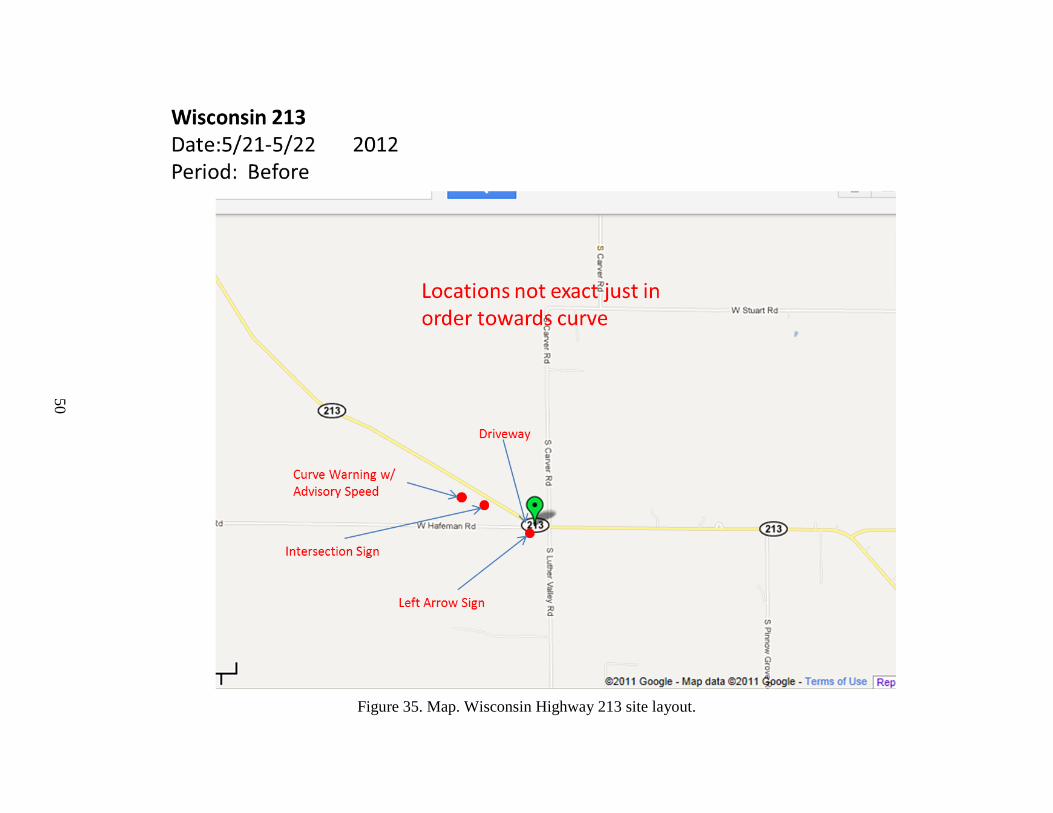
50
Figure 35. Map. Wisconsin Highway 213 site layout.
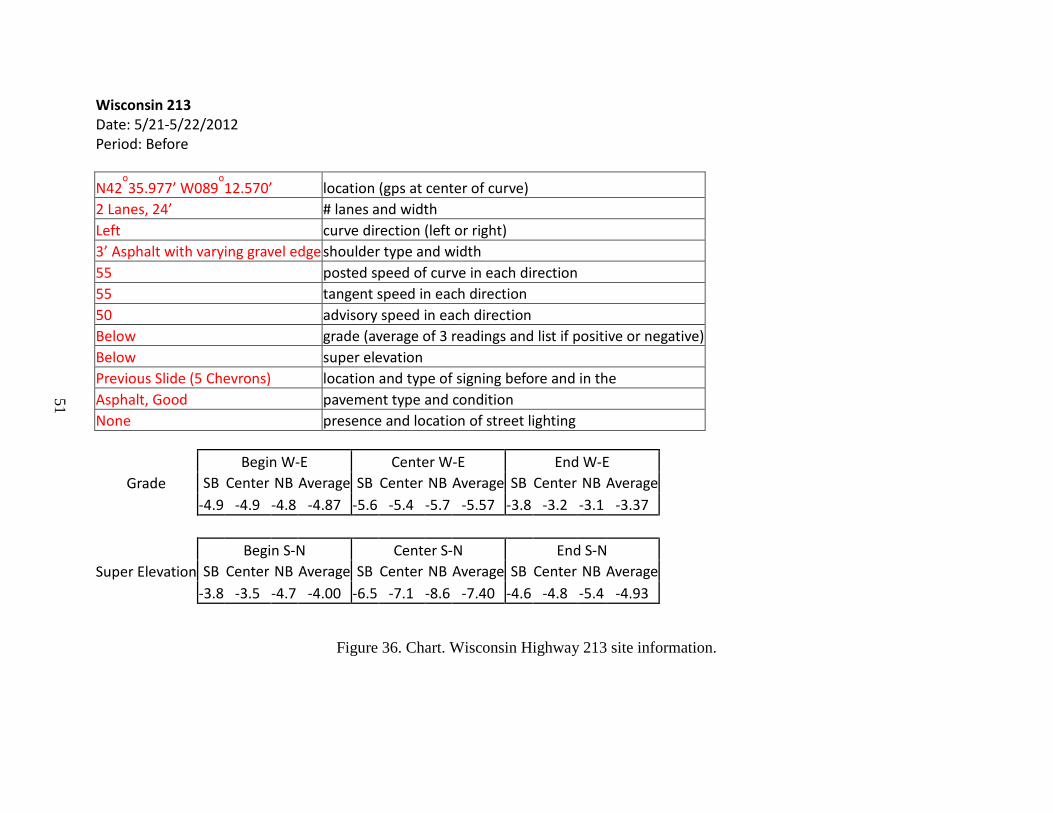
51
Wisconsin 213 Date: 5/21-5/22/2012 Period: Before N42
o35.977’ W089
o12.570’ location (gps at center of curve)
2 Lanes, 24’ # lanes and width Left curve direction (left or right) 3’ Asphalt with varying gravel edge shoulder type and width 55 posted speed of curve in each direction 55 tangent speed in each direction 50 advisory speed in each direction Below grade (average of 3 readings and list if positive or negative) Below super elevation Previous Slide (5 Chevrons) location and type of signing before and in the Asphalt, Good pavement type and condition None presence and location of street lighting
Grade Begin W-E Center W-E End W-E
SB Center NB Average SB Center NB Average SB Center NB Average -4.9 -4.9 -4.8 -4.87 -5.6 -5.4 -5.7 -5.57 -3.8 -3.2 -3.1 -3.37
Super Elevation
Begin S-N Center S-N End S-N SB Center NB Average SB Center NB Average SB Center NB Average
-3.8 -3.5 -4.7 -4.00 -6.5 -7.1 -8.6 -7.40 -4.6 -4.8 -5.4 -4.93
Figure 36. Chart. Wisconsin Highway 213 site information.
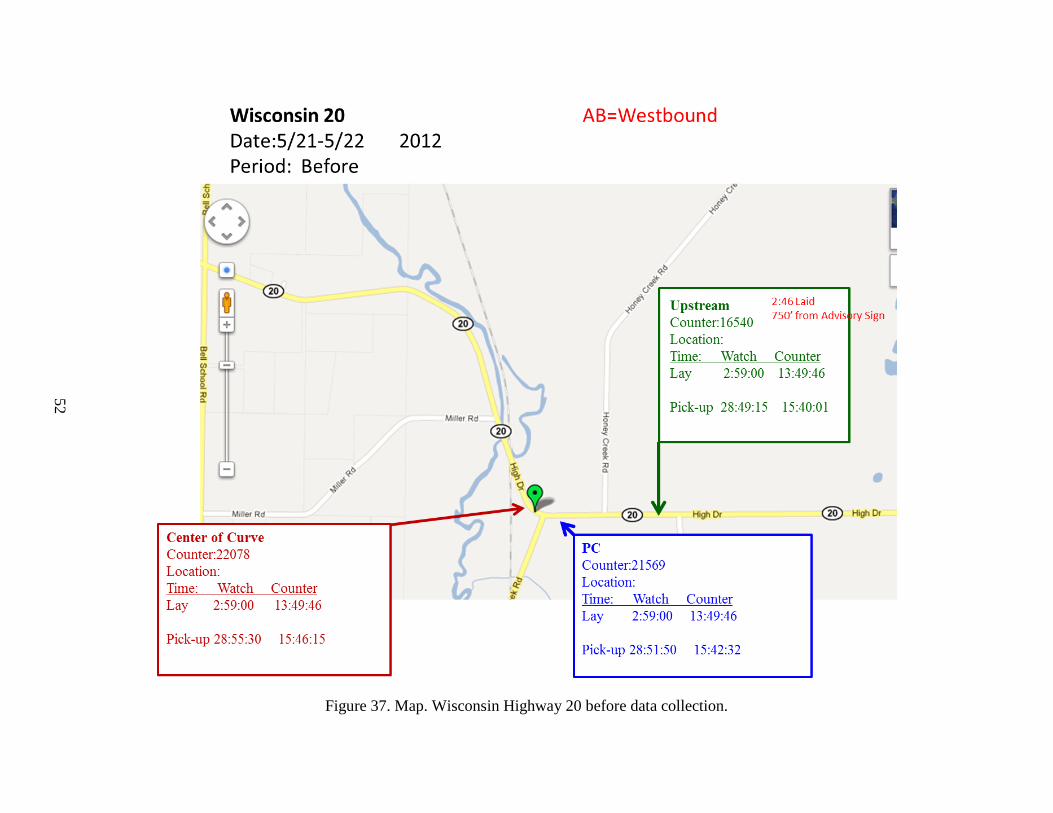
52
Figure 37. Map. Wisconsin Highway 20 before data collection.
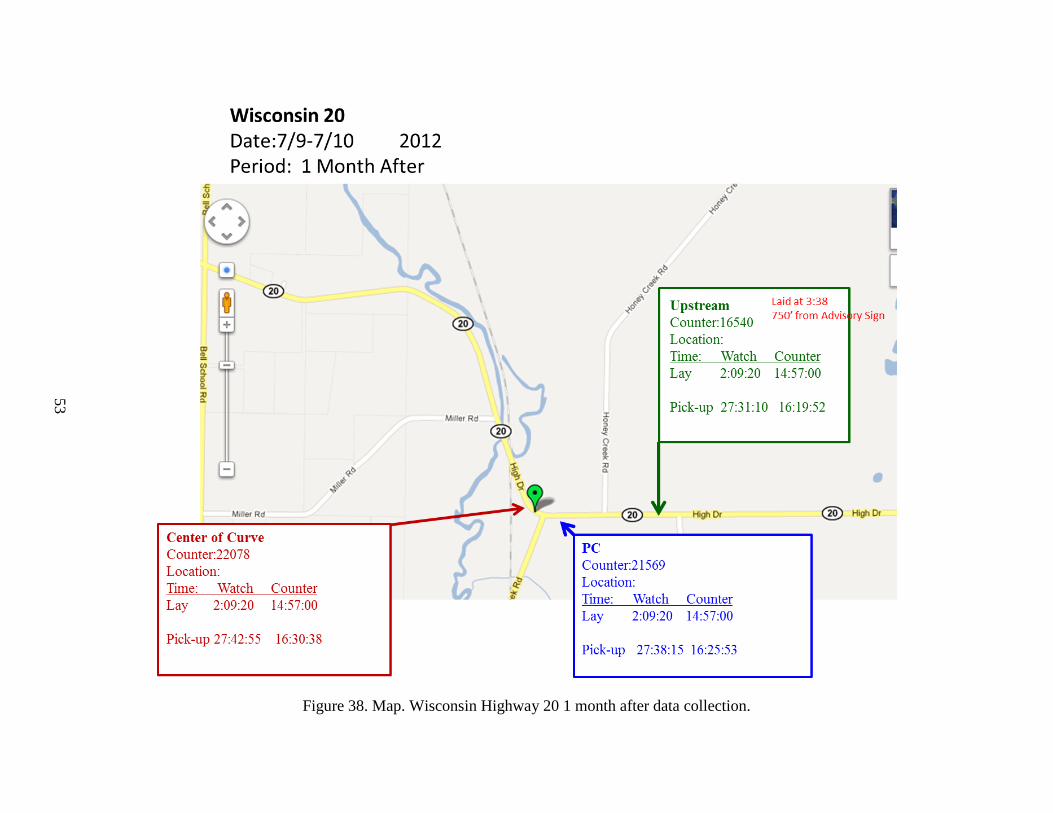
53
Figure 38. Map. Wisconsin Highway 20 1 month after data collection.
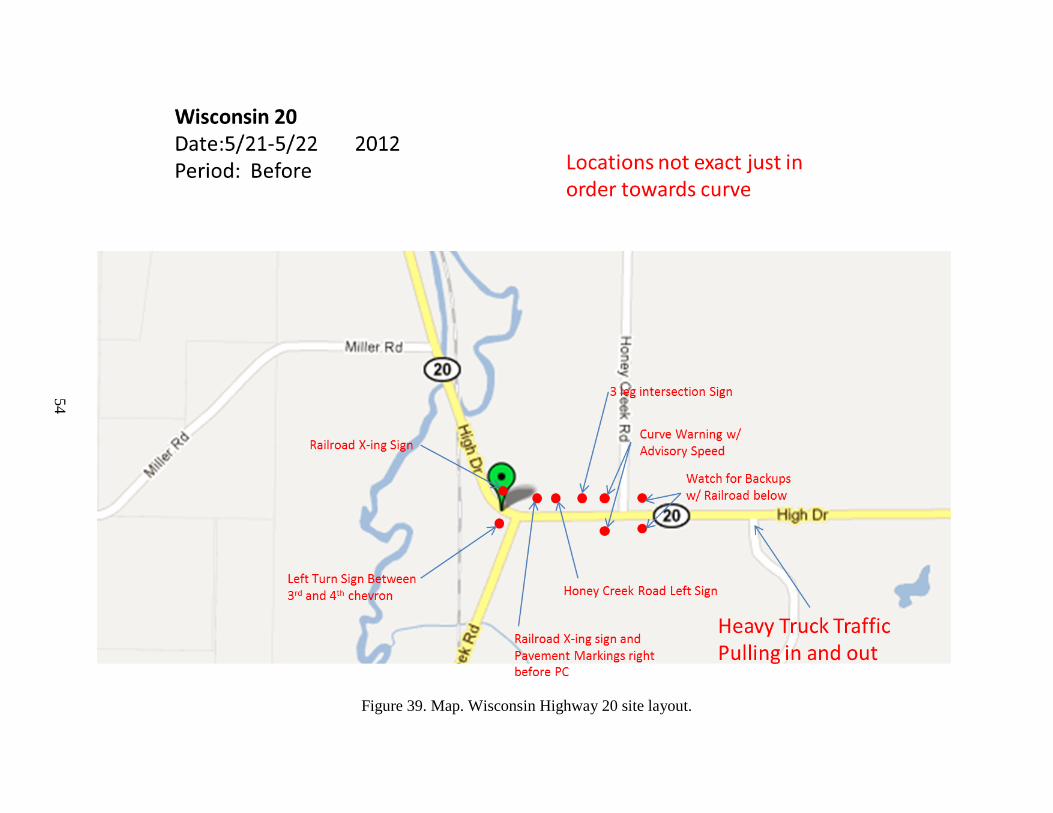
54
Figure 39. Map. Wisconsin Highway 20 site layout.
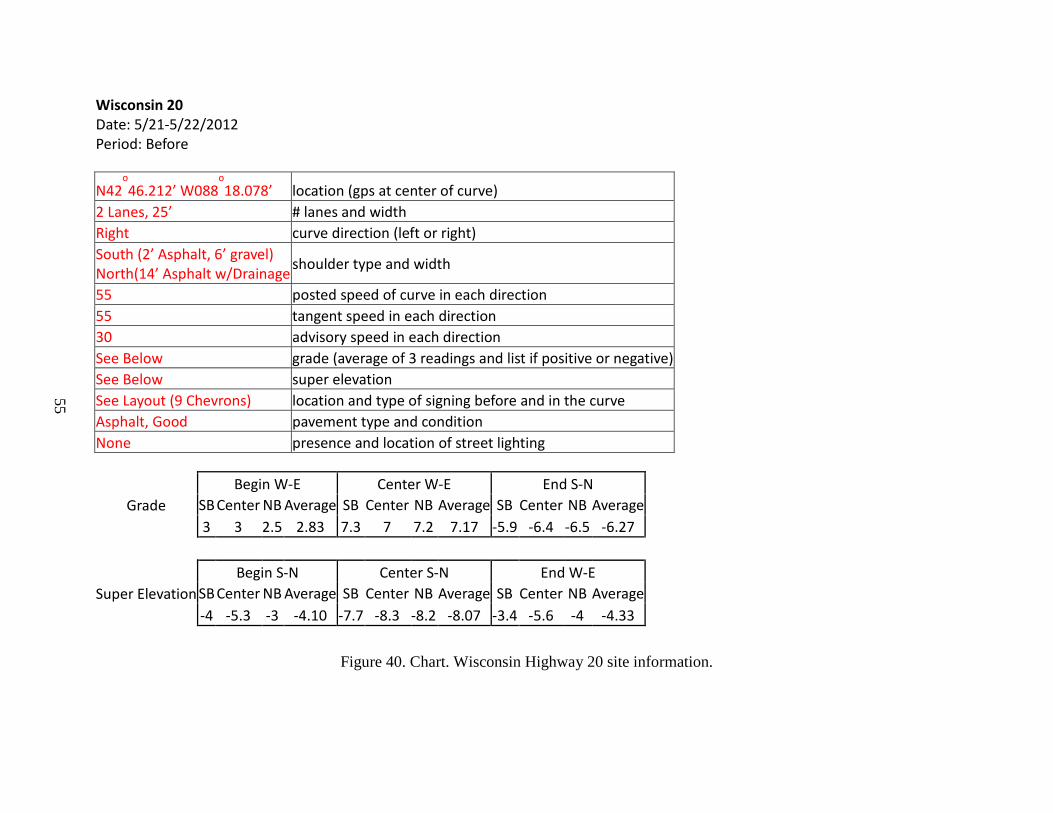
55
Wisconsin 20 Date: 5/21-5/22/2012 Period: Before
N42o46.212’ W088
o18.078’ location (gps at center of curve)
2 Lanes, 25’ # lanes and width Right curve direction (left or right) South (2’ Asphalt, 6’ gravel) North(14’ Asphalt w/Drainage shoulder type and width
55 posted speed of curve in each direction 55 tangent speed in each direction 30 advisory speed in each direction See Below grade (average of 3 readings and list if positive or negative) See Below super elevation See Layout (9 Chevrons) location and type of signing before and in the curve Asphalt, Good pavement type and condition None presence and location of street lighting
Grade Begin W-E Center W-E End S-N
SB Center NB Average SB Center NB Average SB Center NB Average 3 3 2.5 2.83 7.3 7 7.2 7.17 -5.9 -6.4 -6.5 -6.27
Super Elevation
Begin S-N Center S-N End W-E SB Center NB Average SB Center NB Average SB Center NB Average -4 -5.3 -3 -4.10 -7.7 -8.3 -8.2 -8.07 -3.4 -5.6 -4 -4.33
Figure 40. Chart. Wisconsin Highway 20 site information.
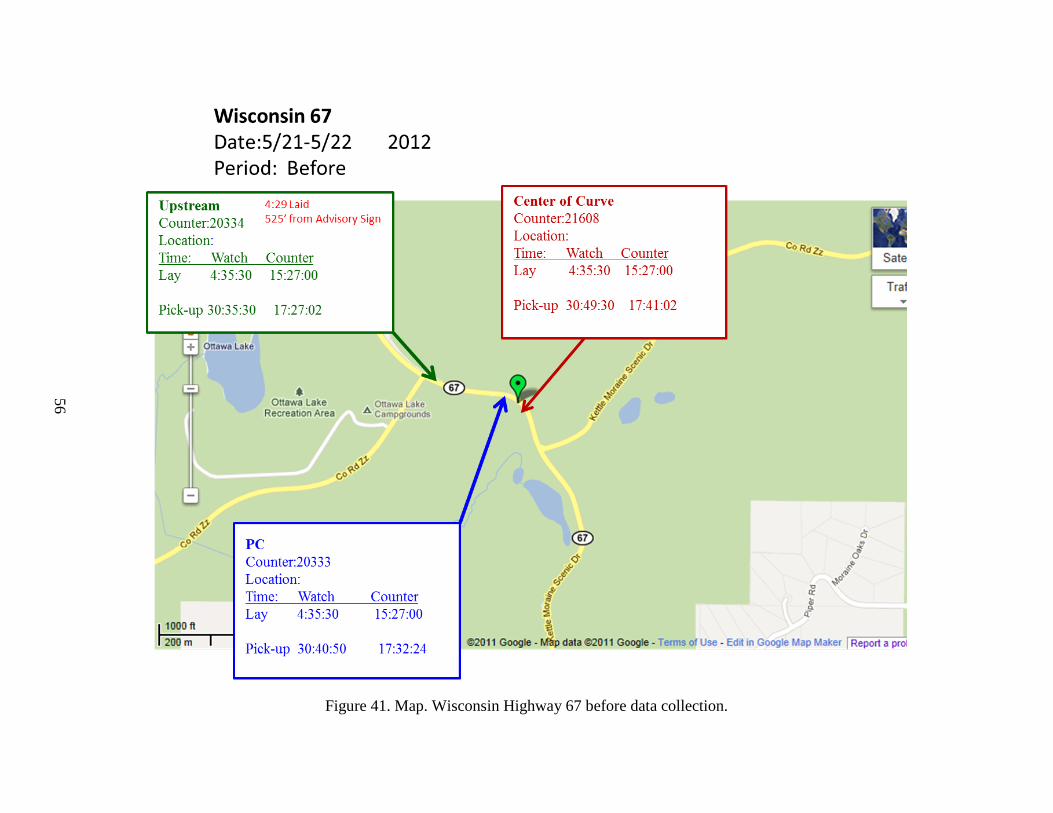
56
Figure 41. Map. Wisconsin Highway 67 before data collection.
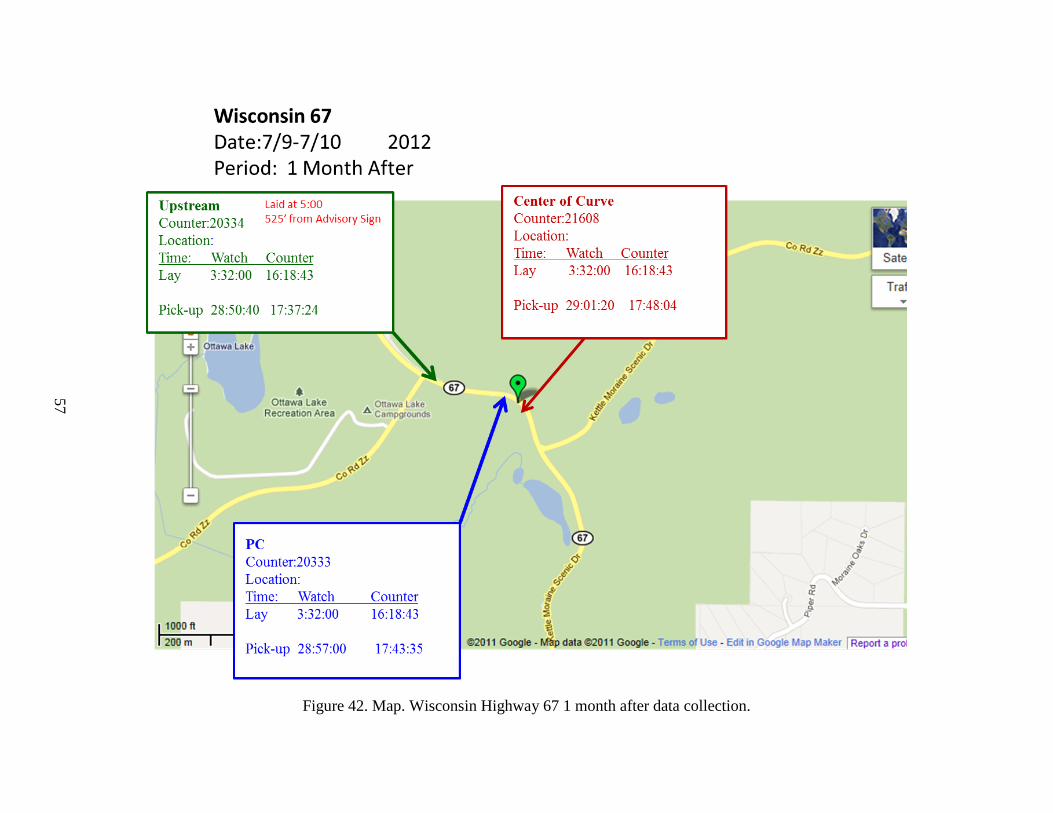
57
Figure 42. Map. Wisconsin Highway 67 1 month after data collection.
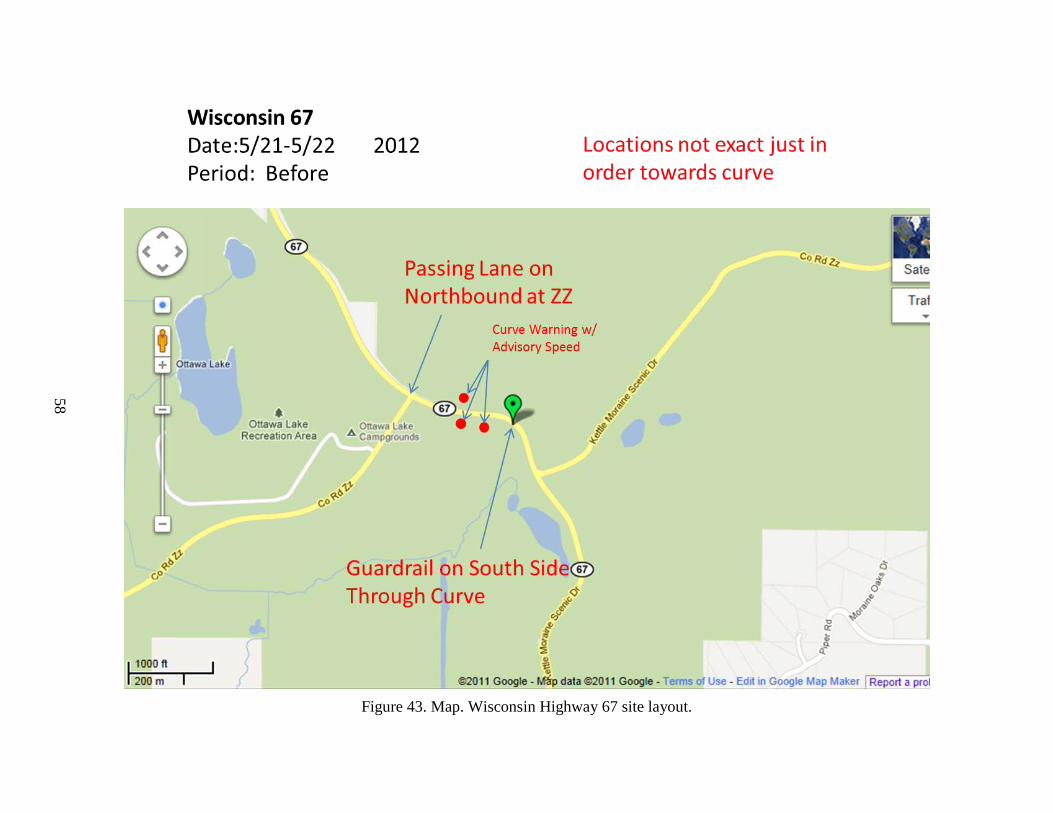
58
Figure 43. Map. Wisconsin Highway 67 site layout.
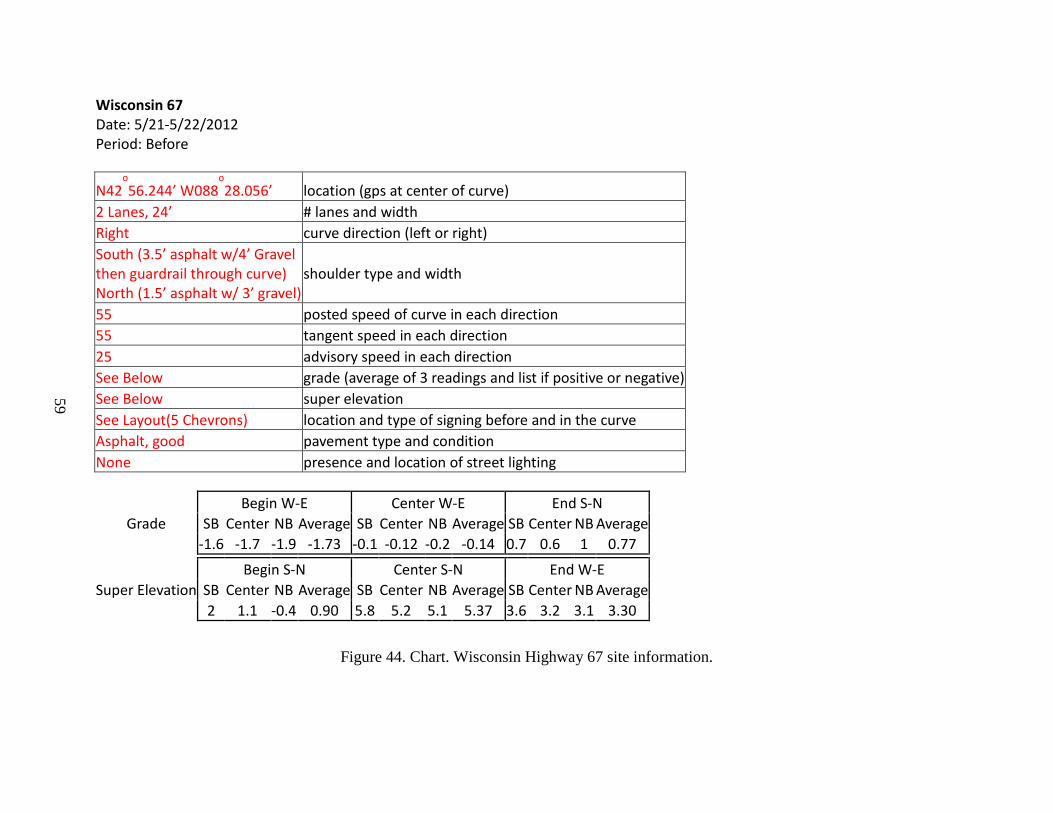
59
Wisconsin 67 Date: 5/21-5/22/2012 Period: Before
N42o56.244’ W088
o28.056’ location (gps at center of curve)
2 Lanes, 24’ # lanes and width Right curve direction (left or right) South (3.5’ asphalt w/4’ Gravel then guardrail through curve) North (1.5’ asphalt w/ 3’ gravel)
shoulder type and width
55 posted speed of curve in each direction 55 tangent speed in each direction 25 advisory speed in each direction See Below grade (average of 3 readings and list if positive or negative) See Below super elevation See Layout(5 Chevrons) location and type of signing before and in the curve Asphalt, good pavement type and condition None presence and location of street lighting
Grade Begin W-E Center W-E End S-N
SB Center NB Average SB Center NB Average SB Center NB Average -1.6 -1.7 -1.9 -1.73 -0.1 -0.12 -0.2 -0.14 0.7 0.6 1 0.77
Super Elevation
Begin S-N Center S-N End W-E SB Center NB Average SB Center NB Average SB Center NB Average 2 1.1 -0.4 0.90 5.8 5.2 5.1 5.37 3.6 3.2 3.1 3.30
Figure 44. Chart. Wisconsin Highway 67 site information.

60
61
APPENDIX B. SITE DATA TABLES AND FIGURES
In this appendix are the data tables and figures for each site. Each curve has three tables and two figures representing the data collected during the “before” and “1 month after” periods. The first two tables are the speed statistics collected at the PC and CC. The statistics compare the before data to 1 month after, with a negative change representing a reduction. The fraction of vehicles exceeding the speed limit change shows a percentage change in the vehicles exceeding the speed limit between the data collection periods. Also in those tables are speed statistics using the tracking methodology described in the literature review. The third table contains the statistics collected from the tracking methodology and shows the speed reductions that occurred from upstream to the respective point in the curve.
The figures are graphical representations of the data shown in the tables. One figure shows the vehicles mean and 85th percentile speeds at the data collection points, while the other figure shows the change in vehicles exceeding the speed limit at the data collection points.
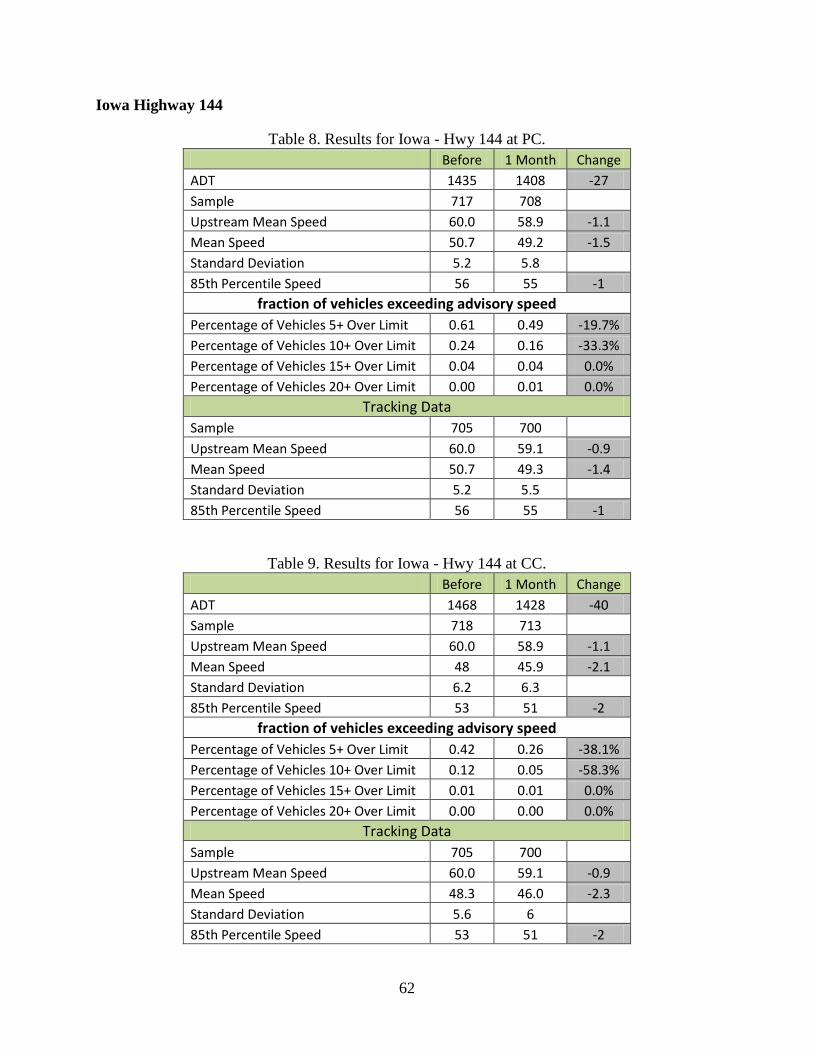
62
Iowa Highway 144
Table 8. Results for Iowa - Hwy 144 at PC. Before 1 Month Change ADT 1435 1408 -27 Sample 717 708
Upstream Mean Speed 60.0 58.9 -1.1 Mean Speed 50.7 49.2 -1.5 Standard Deviation 5.2 5.8
85th Percentile Speed 56 55 -1 fraction of vehicles exceeding advisory speed
Percentage of Vehicles 5+ Over Limit 0.61 0.49 -19.7% Percentage of Vehicles 10+ Over Limit 0.24 0.16 -33.3% Percentage of Vehicles 15+ Over Limit 0.04 0.04 0.0% Percentage of Vehicles 20+ Over Limit 0.00 0.01 0.0%
Tracking Data Sample 705 700
Upstream Mean Speed 60.0 59.1 -0.9 Mean Speed 50.7 49.3 -1.4 Standard Deviation 5.2 5.5
85th Percentile Speed 56 55 -1
Table 9. Results for Iowa - Hwy 144 at CC. Before 1 Month Change ADT 1468 1428 -40 Sample 718 713
Upstream Mean Speed 60.0 58.9 -1.1 Mean Speed 48 45.9 -2.1 Standard Deviation 6.2 6.3
85th Percentile Speed 53 51 -2 fraction of vehicles exceeding advisory speed
Percentage of Vehicles 5+ Over Limit 0.42 0.26 -38.1% Percentage of Vehicles 10+ Over Limit 0.12 0.05 -58.3% Percentage of Vehicles 15+ Over Limit 0.01 0.01 0.0% Percentage of Vehicles 20+ Over Limit 0.00 0.00 0.0%
Tracking Data Sample 705 700
Upstream Mean Speed 60.0 59.1 -0.9 Mean Speed 48.3 46.0 -2.3 Standard Deviation 5.6 6
85th Percentile Speed 53 51 -2

63
Table 10. Speed Reduction for Iowa - Hwy 144. Before 1 Month Change
Mean Speed Reduction Upstream to PC 9 9.7 0.5 Mean Speed Reduction Upstream to CC 11.7 13.0 1.3 Mean Speed Reduction PC to CC 2.5 3.3 0.8 85th Percentile Speed Reduction Upstream to PC 14 15 1 85th Percentile Speed Reduction Upstream to CC 17 18 1 85th Percentile Speed Reduction PC to CC 5 5 0
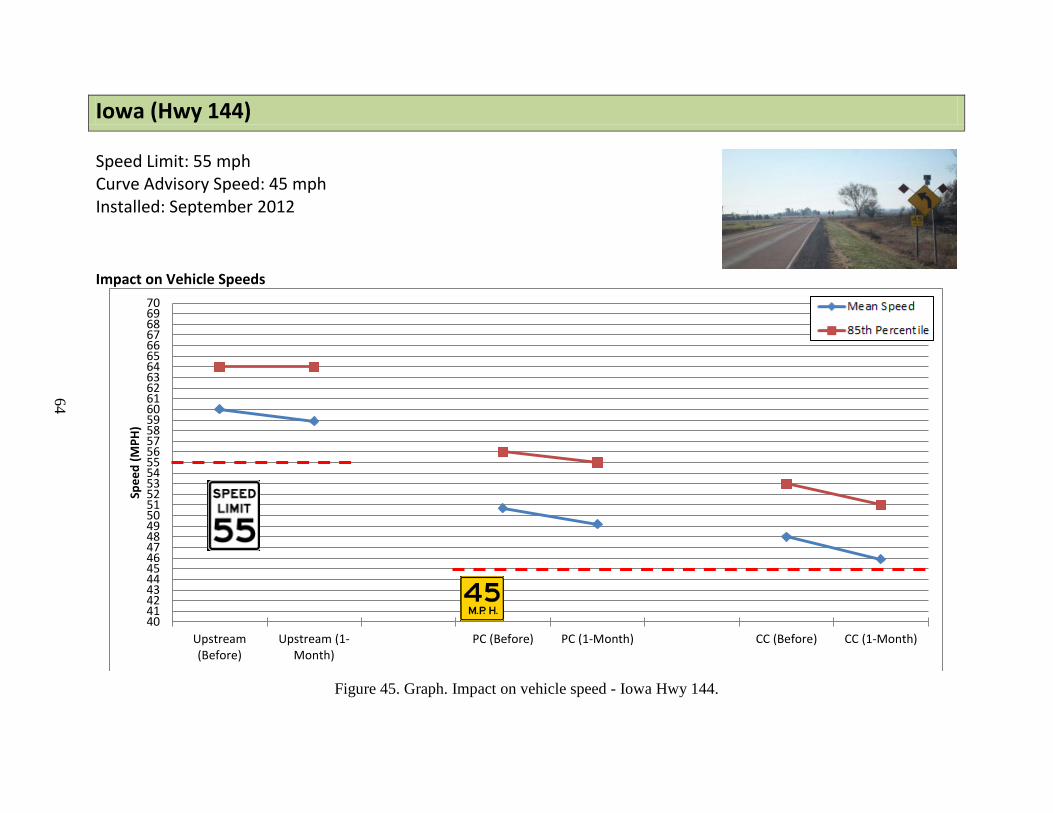
64
Iowa (Hwy 144)
Speed Limit: 55 mph Curve Advisory Speed: 45 mph Installed: September 2012
Impact on Vehicle Speeds
Figure 45. Graph. Impact on vehicle speed - Iowa Hwy 144.
40414243444546474849505152535455565758596061626364656667686970
Upstream(Before)
Upstream (1-Month)
PC (Before) PC (1-Month) CC (Before) CC (1-Month)
Spee
d (M
PH)
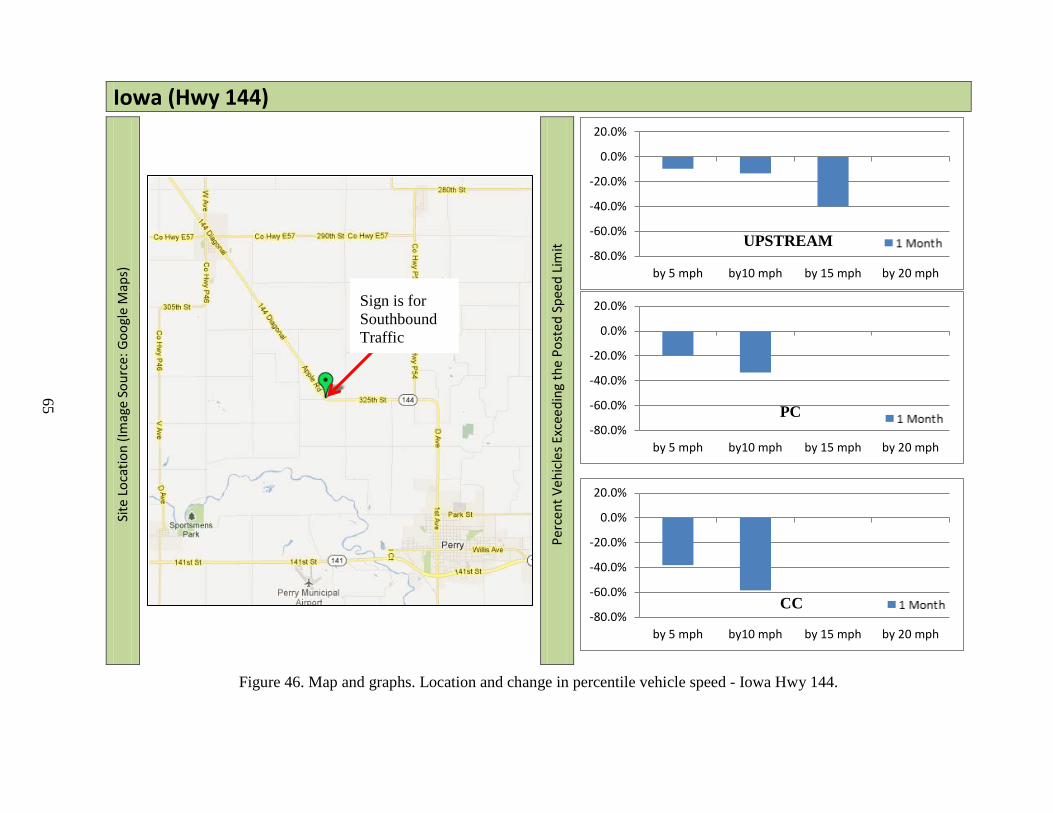
65
Iowa (Hwy 144)
Site
Loc
atio
n (Im
age
Sour
ce: G
oogl
e M
aps)
Perc
ent V
ehic
les E
xcee
ding
the
Post
ed S
peed
Lim
it
Figure 46. Map and graphs. Location and change in percentile vehicle speed - Iowa Hwy 144.
-80.0%
-60.0%
-40.0%
-20.0%
0.0%
20.0%
by 5 mph by10 mph by 15 mph by 20 mph
-80.0%
-60.0%
-40.0%
-20.0%
0.0%
20.0%
by 5 mph by10 mph by 15 mph by 20 mph
-80.0%
-60.0%
-40.0%
-20.0%
0.0%
20.0%
by 5 mph by10 mph by 15 mph by 20 mph
Sign is for Southbound Traffic
PC
UPSTREAM
CC

66
Missouri Highway 221
Table 11. Results for Missouri - Hwy 221 at PC. Before 1 Month Change ADT 5277 5158 -119 Sample 2566 2523
Upstream Mean Speed 52.2 52.8 0.6 Mean Speed 51.7 50.2 -1.5 Standard Deviation 4.7 4.8
85th Percentile Speed 56 55 -1 fraction of vehicles exceeding advisory speed
Percentage of Vehicles 5+ Over Limit 0.94 0.88 -6.4% Percentage of Vehicles 10+ Over Limit 0.70 0.58 -17.1% Percentage of Vehicles 15+ Over Limit 0.25 0.17 -32.0% Percentage of Vehicles 20+ Over Limit 0.04 0.02 -50.0%
Tracking Data Sample 2501 2459
Upstream Mean Speed 52.2 52.8 0.6 Mean Speed 51.7 50.2 -1.5 Standard Deviation 4.7 4.8
85th Percentile Speed 57 55 -2
Table 12. Results for Missouri - Hwy 221 at CC. Before 1 Month Change ADT 5274 5169 -105 Sample 2559 2522
Upstream Mean Speed 52.2 52.8 0.6 Mean Speed 48.3 48.6 0.3 Standard Deviation 4.4 4.6
85th Percentile Speed 53 53 0 fraction of vehicles exceeding advisory speed
Percentage of Vehicles 5+ Over Limit 0.82 0.82 0.0% Percentage of Vehicles 10+ Over Limit 0.38 0.42 10.5% Percentage of Vehicles 15+ Over Limit 0.07 0.09 28.6% Percentage of Vehicles 20+ Over Limit 0.01 0.01 0.0%
Tracking Data Sample 2501 2459
Upstream Mean Speed 52.2 52.8 0.6 Mean Speed 48.3 48.6 0.3 Standard Deviation 4.4 4.6
85th Percentile Speed 53 53 0

67
Table 13. Speed reduction for Missouri - Hwy 221. Before 1 Month Change
Mean Speed Reduction Upstream to PC 0.6 2.6 2 Mean Speed Reduction Upstream to CC 3.9 4.3 0.4 Mean Speed Reduction PC to CC 3.4 1.7 -1.7 85th Percentile Speed Reduction Upstream to PC 3 6 3 85th Percentile Speed Reduction Upstream to CC 7 8 1 85th Percentile Speed Reduction PC to CC 5 3 -2
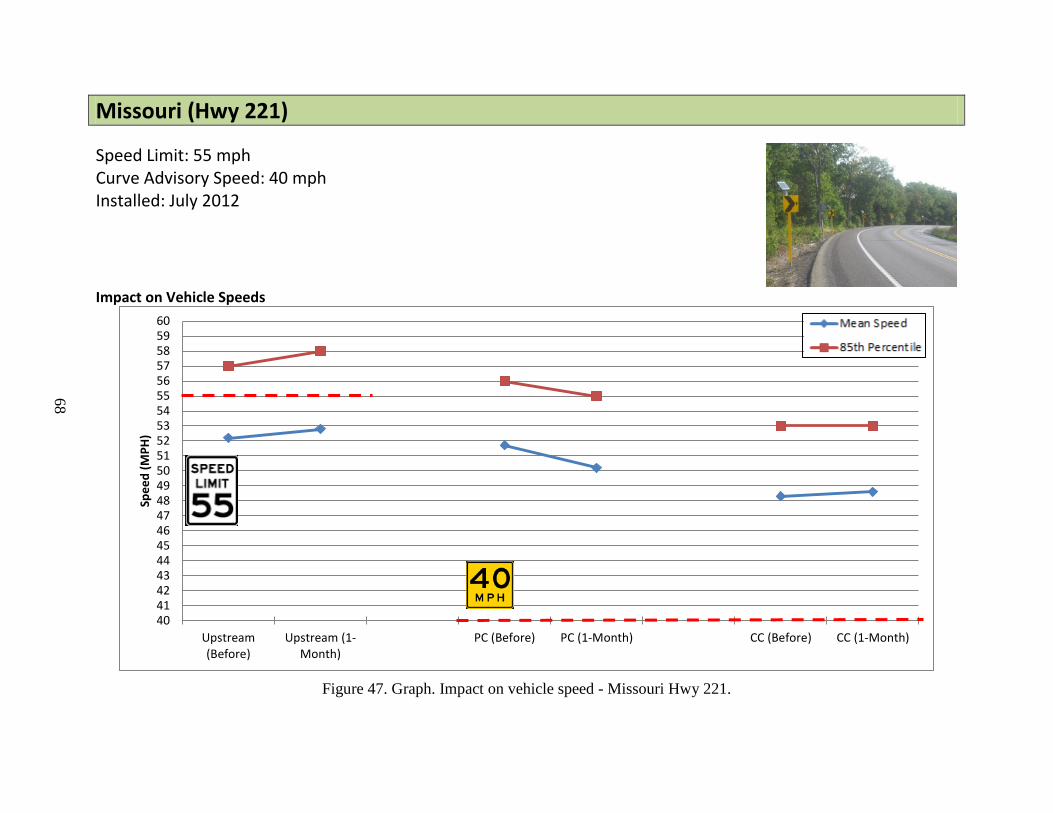
68
Missouri (Hwy 221) Speed Limit: 55 mph Curve Advisory Speed: 40 mph Installed: July 2012
Impact on Vehicle Speeds
Figure 47. Graph. Impact on vehicle speed - Missouri Hwy 221.
404142434445464748495051525354555657585960
Upstream(Before)
Upstream (1-Month)
PC (Before) PC (1-Month) CC (Before) CC (1-Month)
Spee
d (M
PH)
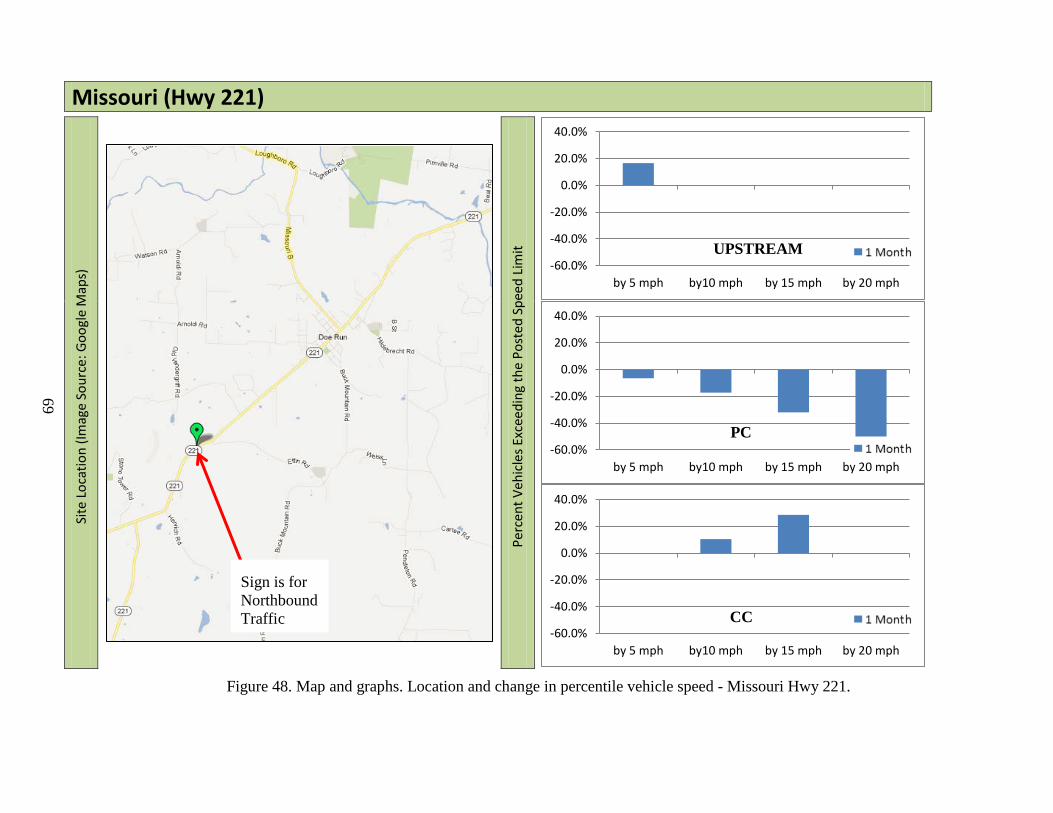
69
Missouri (Hwy 221)
Site
Loc
atio
n (Im
age
Sour
ce: G
oogl
e M
aps)
Perc
ent V
ehic
les E
xcee
ding
the
Post
ed S
peed
Lim
it
Figure 48. Map and graphs. Location and change in percentile vehicle speed - Missouri Hwy 221.
-60.0%
-40.0%
-20.0%
0.0%
20.0%
40.0%
by 5 mph by10 mph by 15 mph by 20 mph
-60.0%
-40.0%
-20.0%
0.0%
20.0%
40.0%
by 5 mph by10 mph by 15 mph by 20 mph
-60.0%
-40.0%
-20.0%
0.0%
20.0%
40.0%
by 5 mph by10 mph by 15 mph by 20 mph
Sign is for Northbound Traffic
PC
UPSTREAM
CC
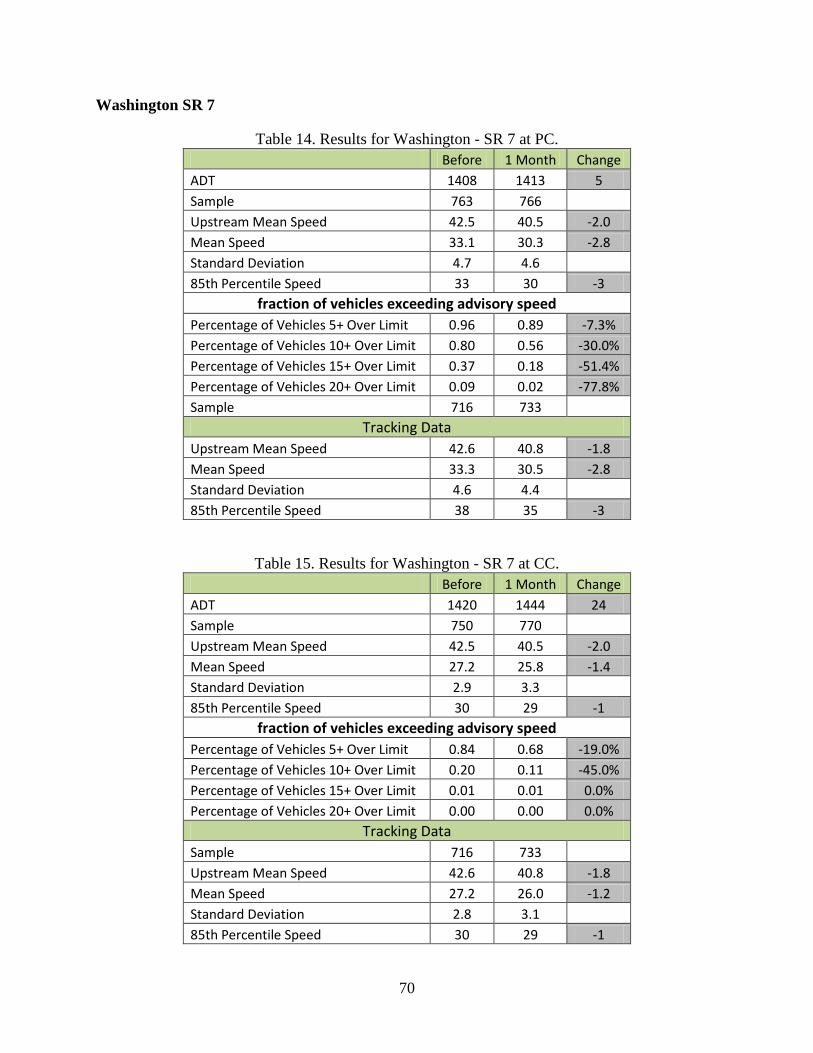
70
Washington SR 7
Table 14. Results for Washington - SR 7 at PC. Before 1 Month Change ADT 1408 1413 5 Sample 763 766
Upstream Mean Speed 42.5 40.5 -2.0 Mean Speed 33.1 30.3 -2.8 Standard Deviation 4.7 4.6
85th Percentile Speed 33 30 -3 fraction of vehicles exceeding advisory speed
Percentage of Vehicles 5+ Over Limit 0.96 0.89 -7.3% Percentage of Vehicles 10+ Over Limit 0.80 0.56 -30.0% Percentage of Vehicles 15+ Over Limit 0.37 0.18 -51.4% Percentage of Vehicles 20+ Over Limit 0.09 0.02 -77.8% Sample 716 733
Tracking Data Upstream Mean Speed 42.6 40.8 -1.8 Mean Speed 33.3 30.5 -2.8 Standard Deviation 4.6 4.4
85th Percentile Speed 38 35 -3
Table 15. Results for Washington - SR 7 at CC. Before 1 Month Change ADT 1420 1444 24 Sample 750 770
Upstream Mean Speed 42.5 40.5 -2.0 Mean Speed 27.2 25.8 -1.4 Standard Deviation 2.9 3.3
85th Percentile Speed 30 29 -1 fraction of vehicles exceeding advisory speed
Percentage of Vehicles 5+ Over Limit 0.84 0.68 -19.0% Percentage of Vehicles 10+ Over Limit 0.20 0.11 -45.0% Percentage of Vehicles 15+ Over Limit 0.01 0.01 0.0% Percentage of Vehicles 20+ Over Limit 0.00 0.00 0.0%
Tracking Data Sample 716 733
Upstream Mean Speed 42.6 40.8 -1.8 Mean Speed 27.2 26.0 -1.2 Standard Deviation 2.8 3.1
85th Percentile Speed 30 29 -1

71
Table 16. Speed reduction for Washington - SR 7. Before 1 Month Change
Mean Speed Reduction Upstream to PC 9.3 10.3 1 Mean Speed Reduction Upstream to CC 15.4 14.8 -0.6 Mean Speed Reduction PC to CC 6.1 4.5 -1.6 85th Percentile Speed Reduction Upstream to PC 14 15.2 1.2 85th Percentile Speed Reduction Upstream to CC 20 21 1 85th Percentile Speed Reduction PC to CC 9 7 -2
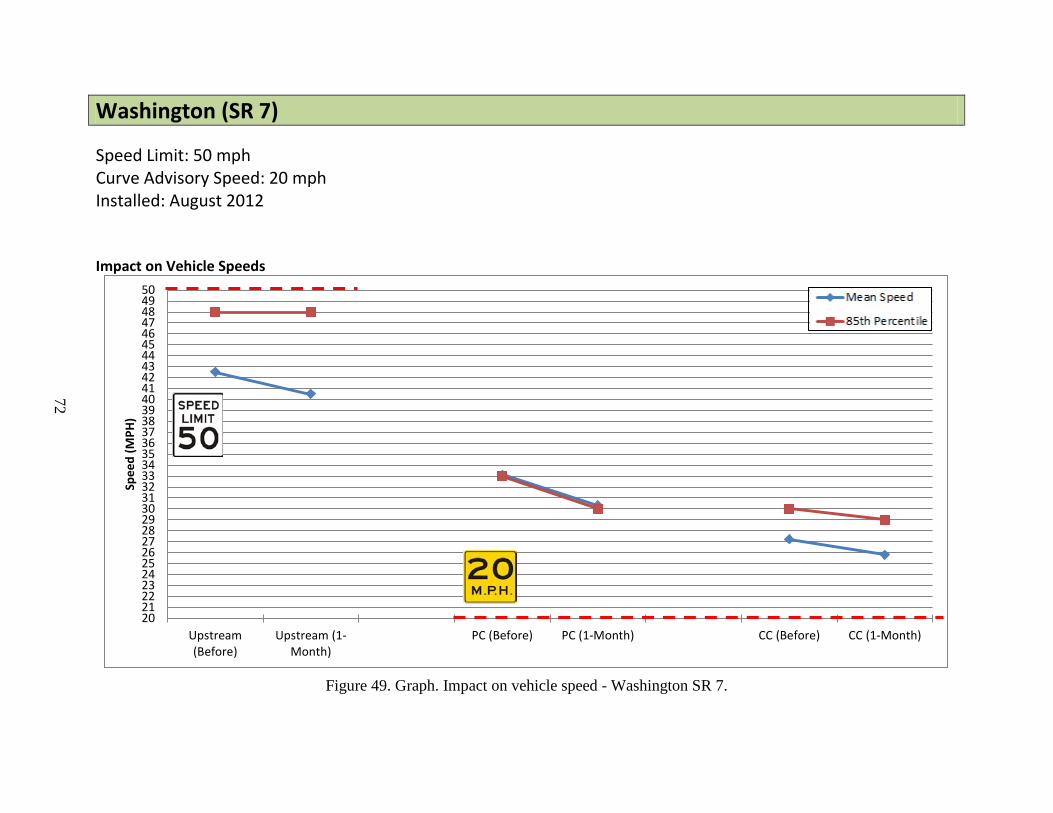
72
Washington (SR 7) Speed Limit: 50 mph Curve Advisory Speed: 20 mph Installed: August 2012
Impact on Vehicle Speeds
Figure 49. Graph. Impact on vehicle speed - Washington SR 7.
20212223242526272829303132333435363738394041424344454647484950
Upstream(Before)
Upstream (1-Month)
PC (Before) PC (1-Month) CC (Before) CC (1-Month)
Spee
d (M
PH)

73
Washington (SR 7)
Site
Loc
atio
n (Im
age
Sour
ce: G
oogl
e M
aps)
Perc
ent V
ehic
les E
xcee
ding
the
Post
ed S
peed
Lim
it
Figure 50. Map and graphs. Location and change in percentile vehicle speed - Washington SR 7.
-100.0%
-80.0%
-60.0%
-40.0%
-20.0%
0.0%
20.0%
by 5 mph by10 mph by 15 mph by 20 mph
-100.0%
-80.0%
-60.0%
-40.0%
-20.0%
0.0%
20.0%
by 5 mph by10 mph by 15 mph by 20 mph
-100.0%
-80.0%
-60.0%
-40.0%
-20.0%
0.0%
20.0%
by 5 mph by10 mph by 15 mph by 20 mph
Sign is for Southbound Traffic PC
UPSTREAM
CC

74
Washington SR 9
Table 17. Results for Washington - SR 9 at PC. Before 1 Month Change ADT 5533 6212 679 Sample 2702 3062
Upstream Mean Speed 46.9 48.7 1.8 Mean Speed 41 39.6 -1.4 Standard Deviation 5.0 5.0
85th Percentile Speed 46 45.0 -1 fraction of vehicles exceeding advisory speed
Percentage of Vehicles 5+ Over Limit 0.23 0.16 -30.4% Percentage of Vehicles 10+ Over Limit 0.04 0.02 -50.0% Percentage of Vehicles 15+ Over Limit 0.01 0.00 -100.0% Percentage of Vehicles 20+ Over Limit 0.00 0.00 0.0%
Tracking Data Sample 2598 2957
Upstream Mean Speed 47.1 48.8 1.7 Mean Speed 41.1 39.7 -1.4 Standard Deviation 4.9 4.9
85th Percentile Speed 46 44 -2
Table 18. Results for Washington - SR 9 at CC. Before 1 Month Change ADT 5523 6227 704 Sample 2688 3081
Upstream Mean Speed 46.9 48.7 1.8 Mean Speed 40.2 39.3 -0.9 Standard Deviation 5.0 5.0
85th Percentile Speed 45 44 -1 fraction of vehicles exceeding advisory speed
Percentage of Vehicles 5+ Over Limit 0.19 0.14 -26.3% Percentage of Vehicles 10+ Over Limit 0.03 0.02 -33.3% Percentage of Vehicles 15+ Over Limit 0.00 0.00 0.0% Percentage of Vehicles 20+ Over Limit 0.00 0.00 0.0%
Tracking Data Sample 2598 2957
Upstream Mean Speed 47.1 48.8 1.7 Mean Speed 40.3 39.3 -1 Standard Deviation 5.0 4.9
85th Percentile Speed 45 44 -1
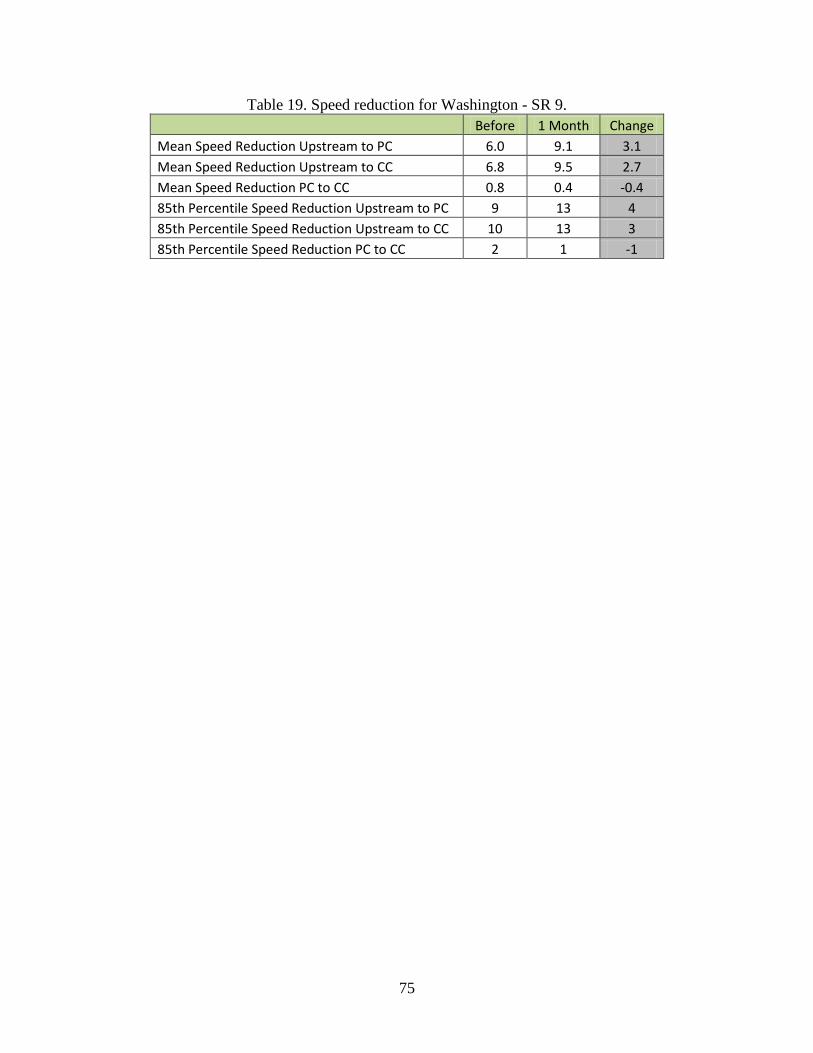
75
Table 19. Speed reduction for Washington - SR 9.
Before 1 Month Change Mean Speed Reduction Upstream to PC 6.0 9.1 3.1 Mean Speed Reduction Upstream to CC 6.8 9.5 2.7 Mean Speed Reduction PC to CC 0.8 0.4 -0.4 85th Percentile Speed Reduction Upstream to PC 9 13 4 85th Percentile Speed Reduction Upstream to CC 10 13 3 85th Percentile Speed Reduction PC to CC 2 1 -1
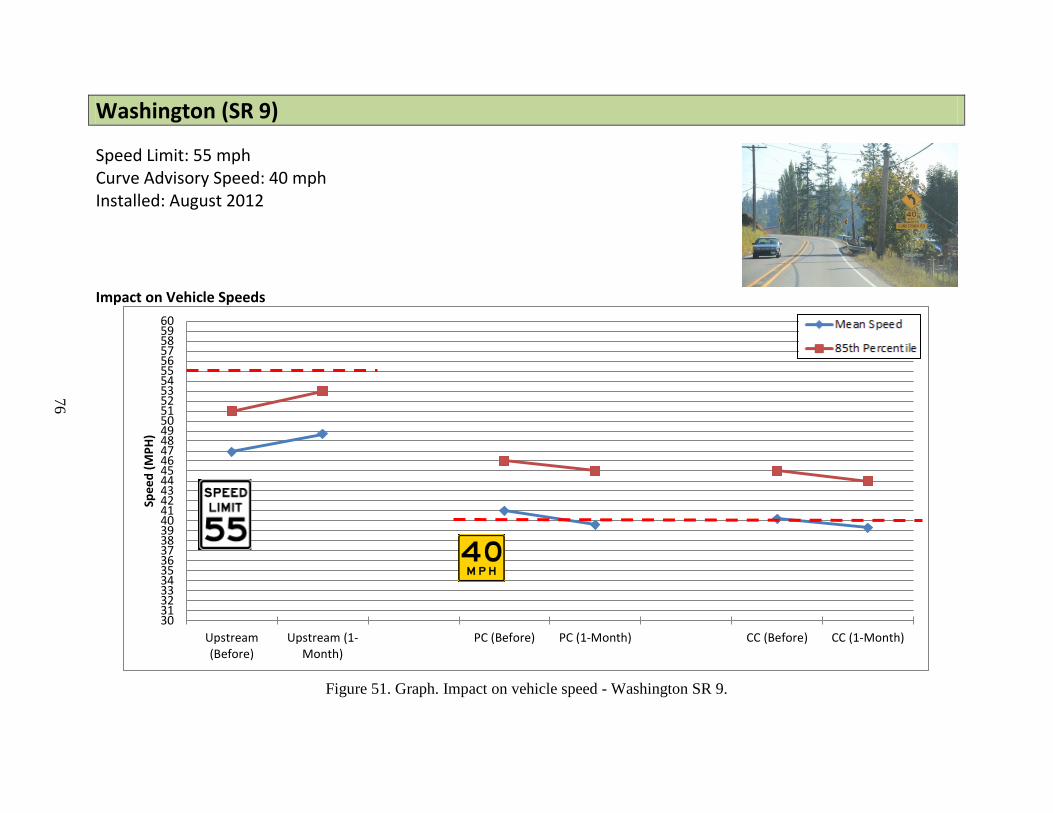
76
Washington (SR 9) Speed Limit: 55 mph Curve Advisory Speed: 40 mph Installed: August 2012
Impact on Vehicle Speeds
Figure 51. Graph. Impact on vehicle speed - Washington SR 9.
30313233343536373839404142434445464748495051525354555657585960
Upstream(Before)
Upstream (1-Month)
PC (Before) PC (1-Month) CC (Before) CC (1-Month)
Spee
d (M
PH)
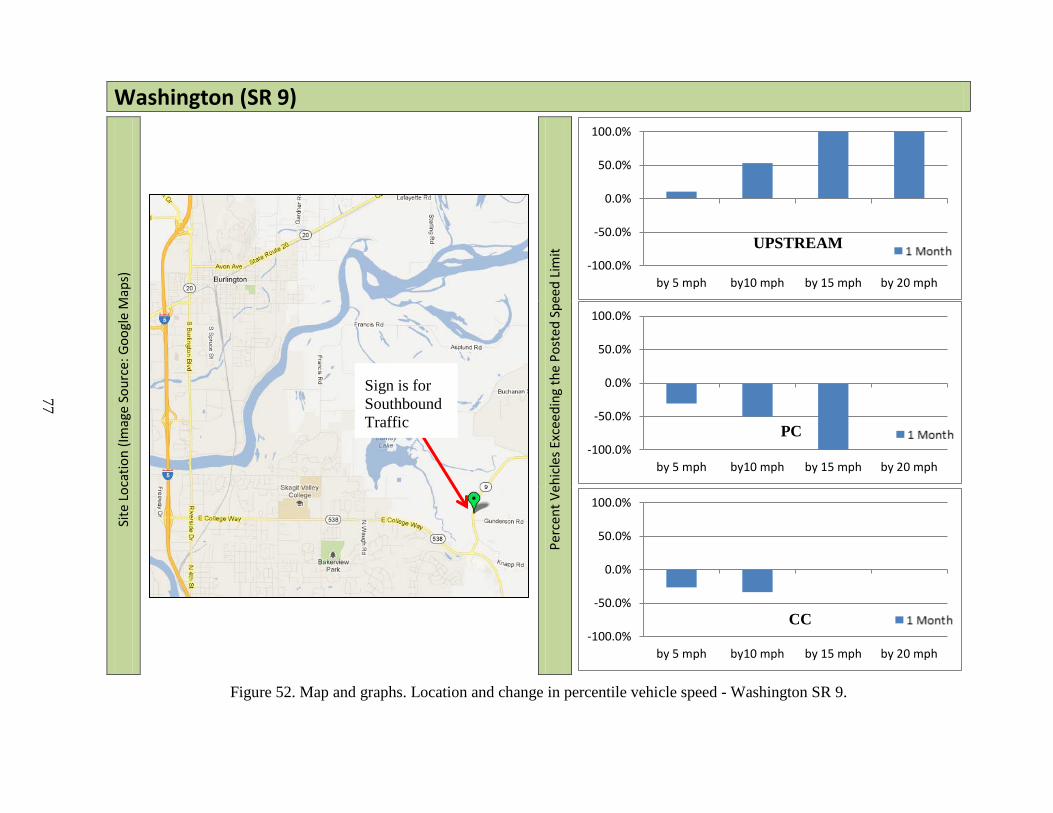
77
Washington (SR 9)
Site
Loc
atio
n (Im
age
Sour
ce: G
oogl
e M
aps)
Perc
ent V
ehic
les E
xcee
ding
the
Post
ed S
peed
Lim
it
Figure 52. Map and graphs. Location and change in percentile vehicle speed - Washington SR 9.
-100.0%
-50.0%
0.0%
50.0%
100.0%
by 5 mph by10 mph by 15 mph by 20 mph
-100.0%
-50.0%
0.0%
50.0%
100.0%
by 5 mph by10 mph by 15 mph by 20 mph
-100.0%
-50.0%
0.0%
50.0%
100.0%
by 5 mph by10 mph by 15 mph by 20 mph
PC
UPSTREAM
CC
Sign is for Southbound Traffic
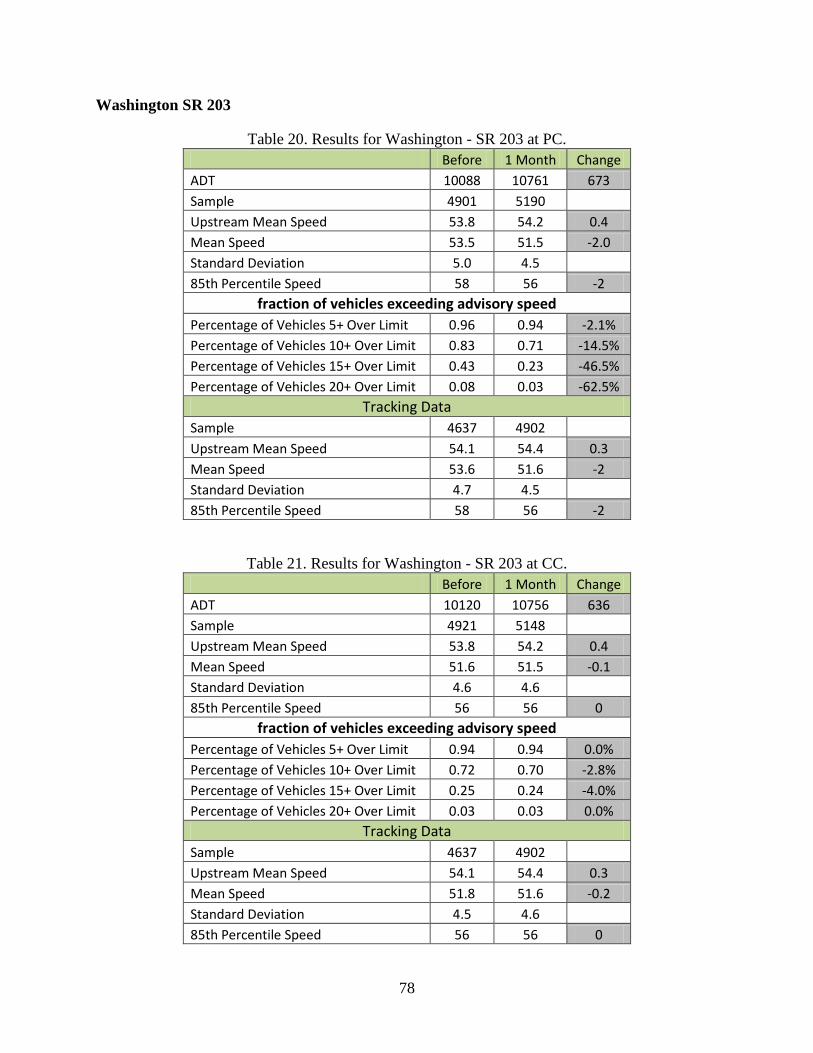
78
Washington SR 203
Table 20. Results for Washington - SR 203 at PC. Before 1 Month Change ADT 10088 10761 673 Sample 4901 5190
Upstream Mean Speed 53.8 54.2 0.4 Mean Speed 53.5 51.5 -2.0 Standard Deviation 5.0 4.5
85th Percentile Speed 58 56 -2 fraction of vehicles exceeding advisory speed
Percentage of Vehicles 5+ Over Limit 0.96 0.94 -2.1% Percentage of Vehicles 10+ Over Limit 0.83 0.71 -14.5% Percentage of Vehicles 15+ Over Limit 0.43 0.23 -46.5% Percentage of Vehicles 20+ Over Limit 0.08 0.03 -62.5%
Tracking Data Sample 4637 4902
Upstream Mean Speed 54.1 54.4 0.3 Mean Speed 53.6 51.6 -2 Standard Deviation 4.7 4.5
85th Percentile Speed 58 56 -2
Table 21. Results for Washington - SR 203 at CC. Before 1 Month Change ADT 10120 10756 636 Sample 4921 5148
Upstream Mean Speed 53.8 54.2 0.4 Mean Speed 51.6 51.5 -0.1 Standard Deviation 4.6 4.6
85th Percentile Speed 56 56 0 fraction of vehicles exceeding advisory speed
Percentage of Vehicles 5+ Over Limit 0.94 0.94 0.0% Percentage of Vehicles 10+ Over Limit 0.72 0.70 -2.8% Percentage of Vehicles 15+ Over Limit 0.25 0.24 -4.0% Percentage of Vehicles 20+ Over Limit 0.03 0.03 0.0%
Tracking Data Sample 4637 4902
Upstream Mean Speed 54.1 54.4 0.3 Mean Speed 51.8 51.6 -0.2 Standard Deviation 4.5 4.6
85th Percentile Speed 56 56 0

79
Table 22. Speed reduction for Washington - SR 203. Before 1 Month Change
Mean Speed Reduction Upstream to PC 0.5 2.8 2.3 Mean Speed Reduction Upstream to CC 2.4 2.8 0.4 Mean Speed Reduction PC to CC 1.8 0 -1.8 85th Percentile Speed Reduction Upstream to PC 3 6 3 85th Percentile Speed Reduction Upstream to CC 6 7 1 85th Percentile Speed Reduction PC to CC 3 2 -1
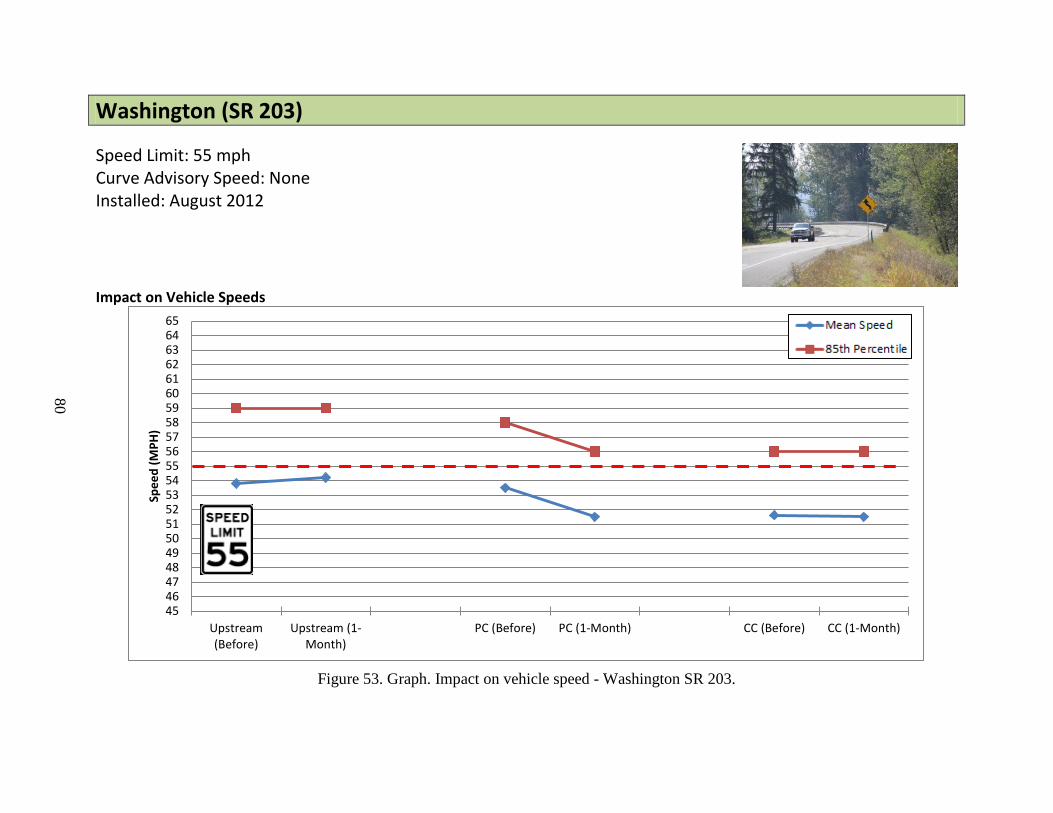
80
Washington (SR 203) Speed Limit: 55 mph Curve Advisory Speed: None Installed: August 2012
Impact on Vehicle Speeds
Figure 53. Graph. Impact on vehicle speed - Washington SR 203.
454647484950515253545556575859606162636465
Upstream(Before)
Upstream (1-Month)
PC (Before) PC (1-Month) CC (Before) CC (1-Month)
Spee
d (M
PH)
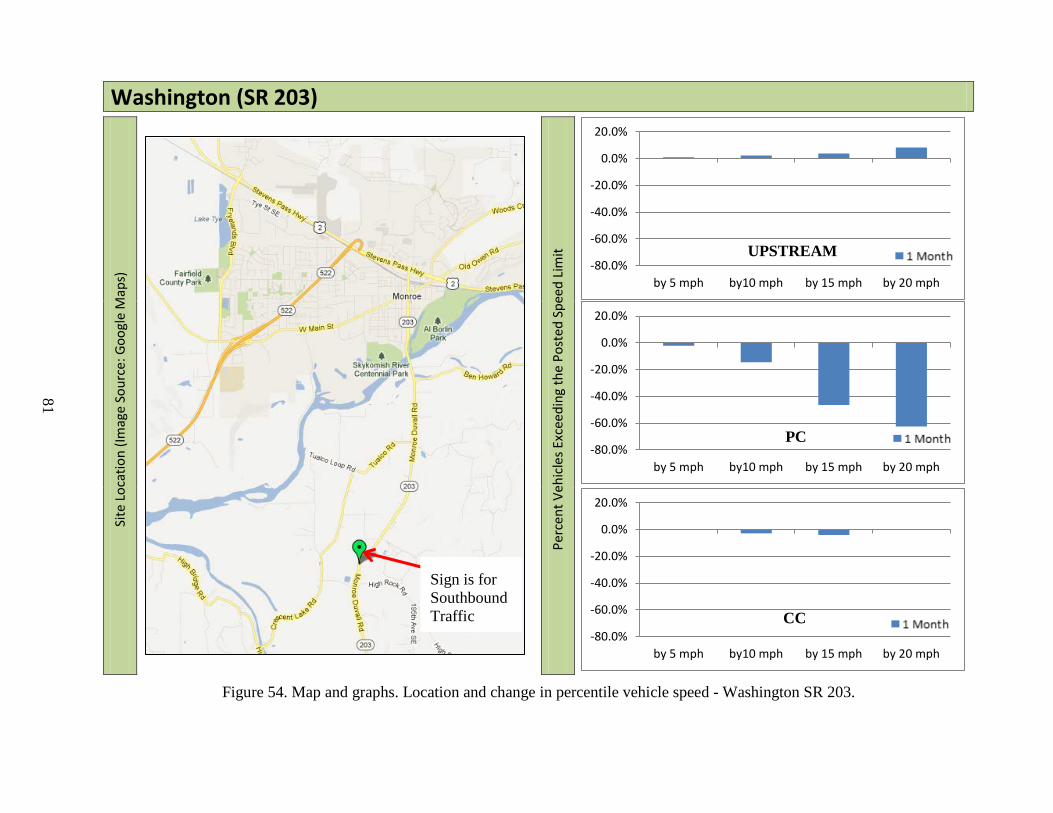
81
Washington (SR 203)
Site
Loc
atio
n (Im
age
Sour
ce: G
oogl
e M
aps)
Perc
ent V
ehic
les E
xcee
ding
the
Post
ed S
peed
Lim
it
Figure 54. Map and graphs. Location and change in percentile vehicle speed - Washington SR 203.
-80.0%
-60.0%
-40.0%
-20.0%
0.0%
20.0%
by 5 mph by10 mph by 15 mph by 20 mph
-80.0%
-60.0%
-40.0%
-20.0%
0.0%
20.0%
by 5 mph by10 mph by 15 mph by 20 mph
-80.0%
-60.0%
-40.0%
-20.0%
0.0%
20.0%
by 5 mph by10 mph by 15 mph by 20 mph
PC
UPSTREAM
CC
Sign is for Southbound Traffic
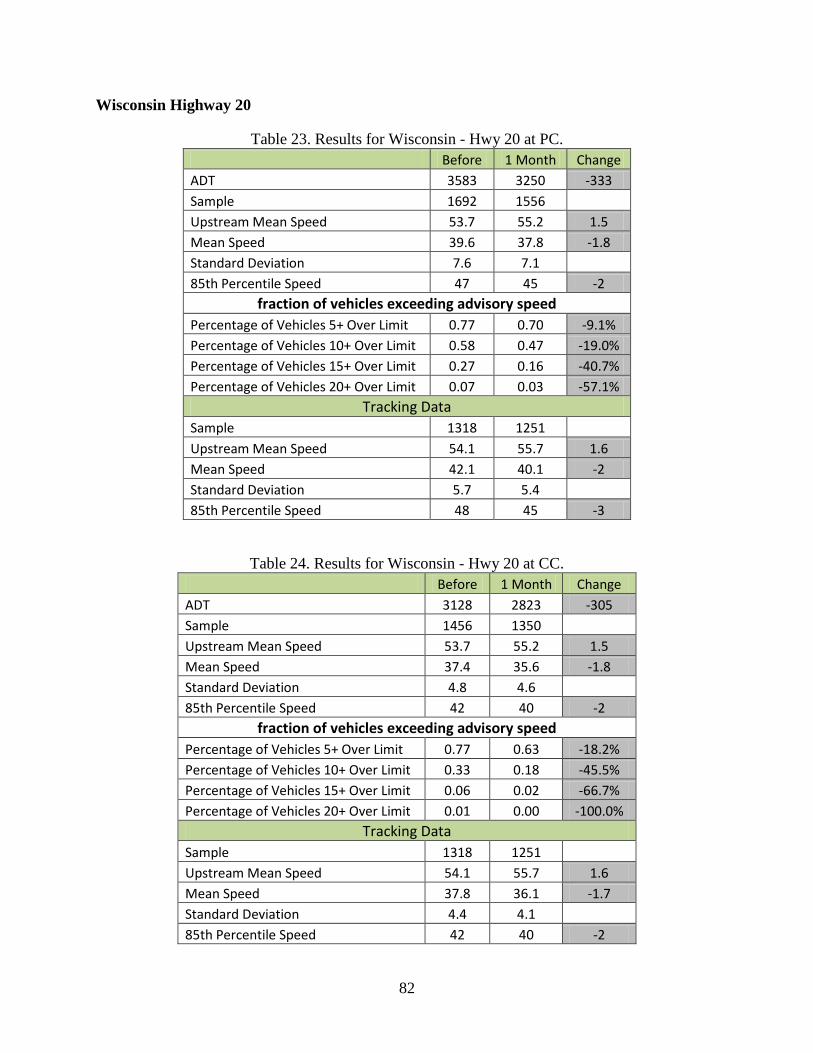
82
Wisconsin Highway 20
Table 23. Results for Wisconsin - Hwy 20 at PC. Before 1 Month Change ADT 3583 3250 -333 Sample 1692 1556
Upstream Mean Speed 53.7 55.2 1.5 Mean Speed 39.6 37.8 -1.8 Standard Deviation 7.6 7.1
85th Percentile Speed 47 45 -2 fraction of vehicles exceeding advisory speed
Percentage of Vehicles 5+ Over Limit 0.77 0.70 -9.1% Percentage of Vehicles 10+ Over Limit 0.58 0.47 -19.0% Percentage of Vehicles 15+ Over Limit 0.27 0.16 -40.7% Percentage of Vehicles 20+ Over Limit 0.07 0.03 -57.1%
Tracking Data Sample 1318 1251
Upstream Mean Speed 54.1 55.7 1.6 Mean Speed 42.1 40.1 -2 Standard Deviation 5.7 5.4
85th Percentile Speed 48 45 -3
Table 24. Results for Wisconsin - Hwy 20 at CC. Before 1 Month Change ADT 3128 2823 -305 Sample 1456 1350
Upstream Mean Speed 53.7 55.2 1.5 Mean Speed 37.4 35.6 -1.8 Standard Deviation 4.8 4.6
85th Percentile Speed 42 40 -2 fraction of vehicles exceeding advisory speed
Percentage of Vehicles 5+ Over Limit 0.77 0.63 -18.2% Percentage of Vehicles 10+ Over Limit 0.33 0.18 -45.5% Percentage of Vehicles 15+ Over Limit 0.06 0.02 -66.7% Percentage of Vehicles 20+ Over Limit 0.01 0.00 -100.0%
Tracking Data Sample 1318 1251
Upstream Mean Speed 54.1 55.7 1.6 Mean Speed 37.8 36.1 -1.7 Standard Deviation 4.4 4.1
85th Percentile Speed 42 40 -2
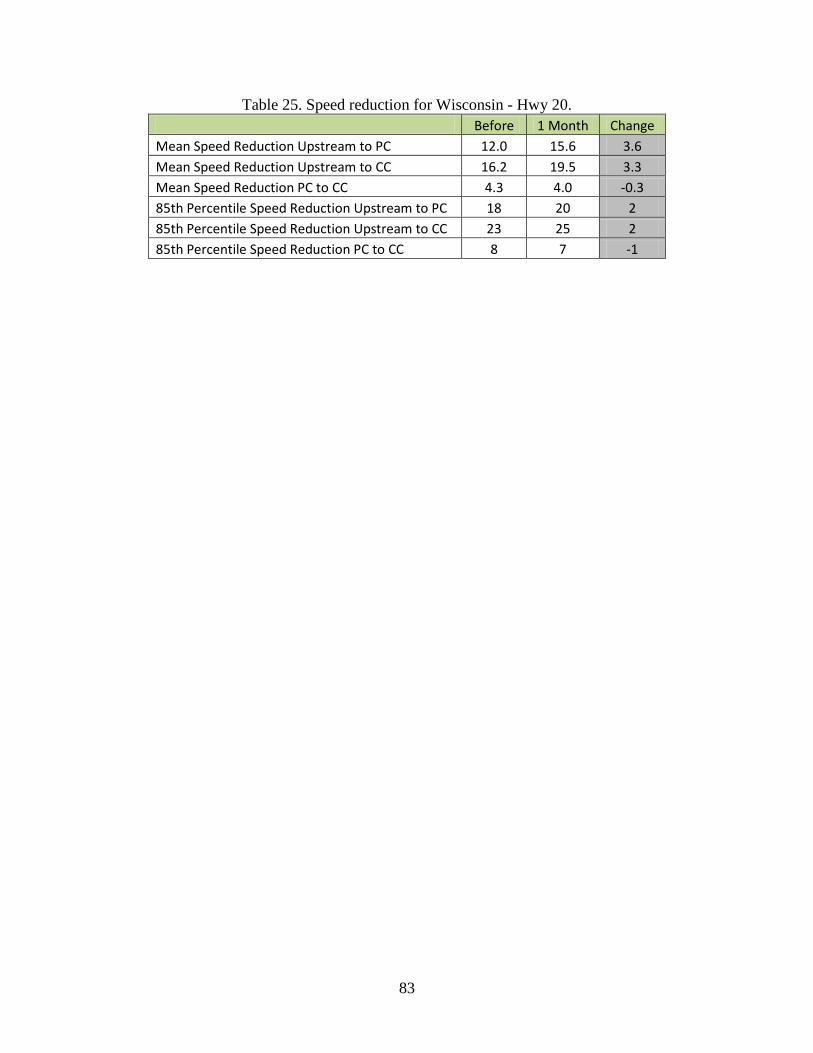
83
Table 25. Speed reduction for Wisconsin - Hwy 20. Before 1 Month Change
Mean Speed Reduction Upstream to PC 12.0 15.6 3.6 Mean Speed Reduction Upstream to CC 16.2 19.5 3.3 Mean Speed Reduction PC to CC 4.3 4.0 -0.3 85th Percentile Speed Reduction Upstream to PC 18 20 2 85th Percentile Speed Reduction Upstream to CC 23 25 2 85th Percentile Speed Reduction PC to CC 8 7 -1
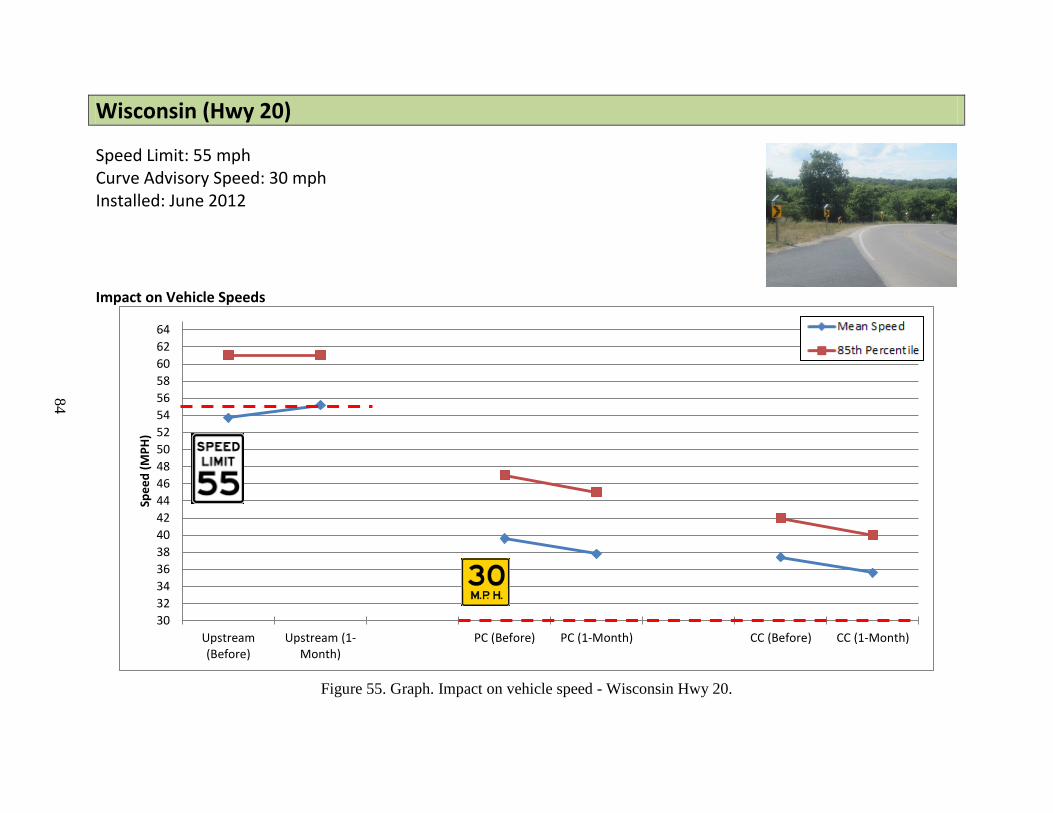
84
Wisconsin (Hwy 20) Speed Limit: 55 mph Curve Advisory Speed: 30 mph Installed: June 2012
Impact on Vehicle Speeds
Figure 55. Graph. Impact on vehicle speed - Wisconsin Hwy 20.
303234363840424446485052545658606264
Upstream(Before)
Upstream (1-Month)
PC (Before) PC (1-Month) CC (Before) CC (1-Month)
Spee
d (M
PH)
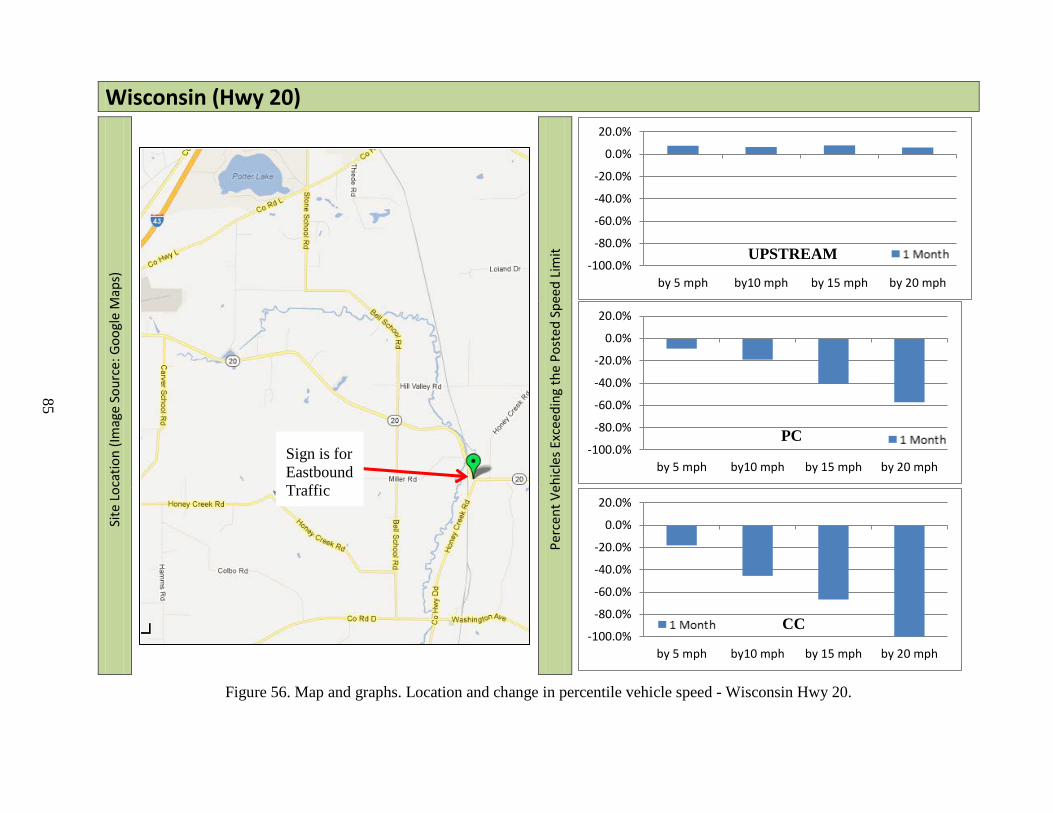
85
Wisconsin (Hwy 20)
Site
Loc
atio
n (Im
age
Sour
ce: G
oogl
e M
aps)
Perc
ent V
ehic
les E
xcee
ding
the
Post
ed S
peed
Lim
it
Figure 56. Map and graphs. Location and change in percentile vehicle speed - Wisconsin Hwy 20.
-100.0%
-80.0%
-60.0%
-40.0%
-20.0%
0.0%
20.0%
by 5 mph by10 mph by 15 mph by 20 mph
-100.0%
-80.0%
-60.0%
-40.0%
-20.0%
0.0%
20.0%
by 5 mph by10 mph by 15 mph by 20 mph
-100.0%
-80.0%
-60.0%
-40.0%
-20.0%
0.0%
20.0%
by 5 mph by10 mph by 15 mph by 20 mph
Sign is for Eastbound Traffic
PC
UPSTREAM
CC
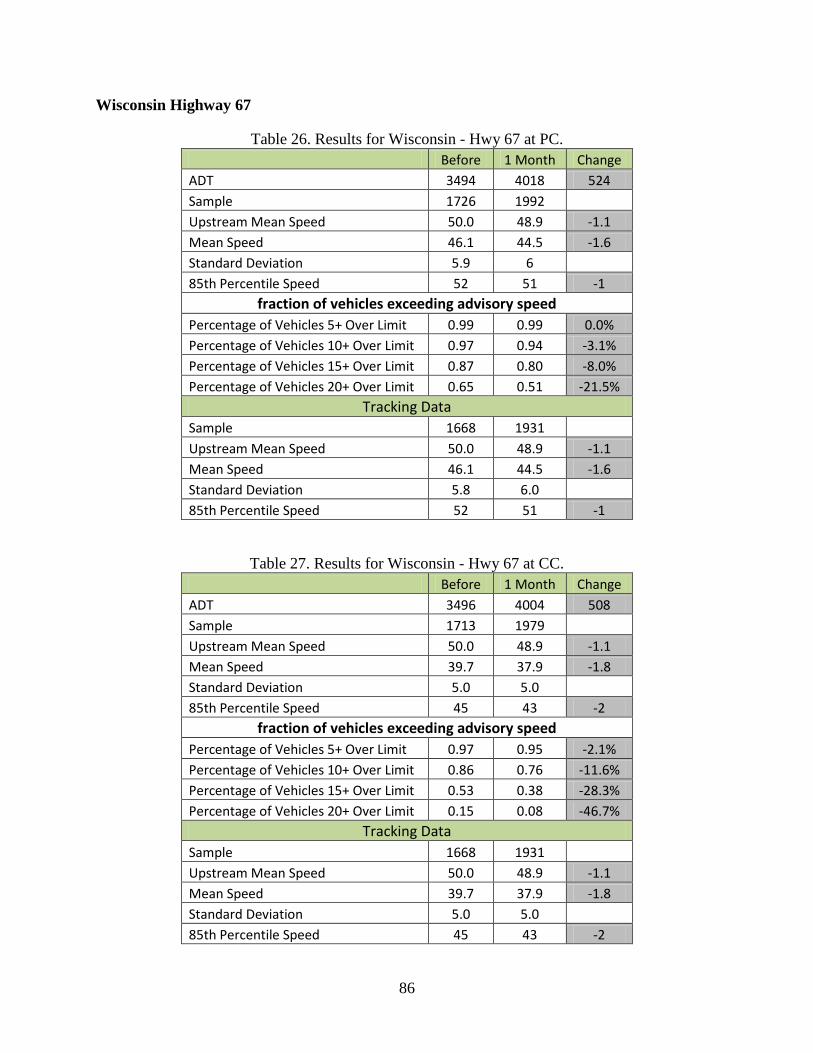
86
Wisconsin Highway 67
Table 26. Results for Wisconsin - Hwy 67 at PC. Before 1 Month Change ADT 3494 4018 524 Sample 1726 1992
Upstream Mean Speed 50.0 48.9 -1.1 Mean Speed 46.1 44.5 -1.6 Standard Deviation 5.9 6
85th Percentile Speed 52 51 -1 fraction of vehicles exceeding advisory speed
Percentage of Vehicles 5+ Over Limit 0.99 0.99 0.0% Percentage of Vehicles 10+ Over Limit 0.97 0.94 -3.1% Percentage of Vehicles 15+ Over Limit 0.87 0.80 -8.0% Percentage of Vehicles 20+ Over Limit 0.65 0.51 -21.5%
Tracking Data Sample 1668 1931
Upstream Mean Speed 50.0 48.9 -1.1 Mean Speed 46.1 44.5 -1.6 Standard Deviation 5.8 6.0
85th Percentile Speed 52 51 -1
Table 27. Results for Wisconsin - Hwy 67 at CC. Before 1 Month Change ADT 3496 4004 508 Sample 1713 1979
Upstream Mean Speed 50.0 48.9 -1.1 Mean Speed 39.7 37.9 -1.8 Standard Deviation 5.0 5.0
85th Percentile Speed 45 43 -2 fraction of vehicles exceeding advisory speed
Percentage of Vehicles 5+ Over Limit 0.97 0.95 -2.1% Percentage of Vehicles 10+ Over Limit 0.86 0.76 -11.6% Percentage of Vehicles 15+ Over Limit 0.53 0.38 -28.3% Percentage of Vehicles 20+ Over Limit 0.15 0.08 -46.7%
Tracking Data Sample 1668 1931
Upstream Mean Speed 50.0 48.9 -1.1 Mean Speed 39.7 37.9 -1.8 Standard Deviation 5.0 5.0
85th Percentile Speed 45 43 -2

87
Table 28. Speed Reduction for Wisconsin - Hwy 67. Before 1 Month Change
Mean Speed Reduction Upstream to PC 3.9 4.40 0.5 Mean Speed Reduction Upstream to CC 10.2 11.0 0.8 Mean Speed Reduction PC to CC 6.4 6.6 0.2 85th Percentile Speed Reduction Upstream to PC 11 13 2 85th Percentile Speed Reduction Upstream to CC 19 20 1 85th Percentile Speed Reduction PC to CC 9 9 0
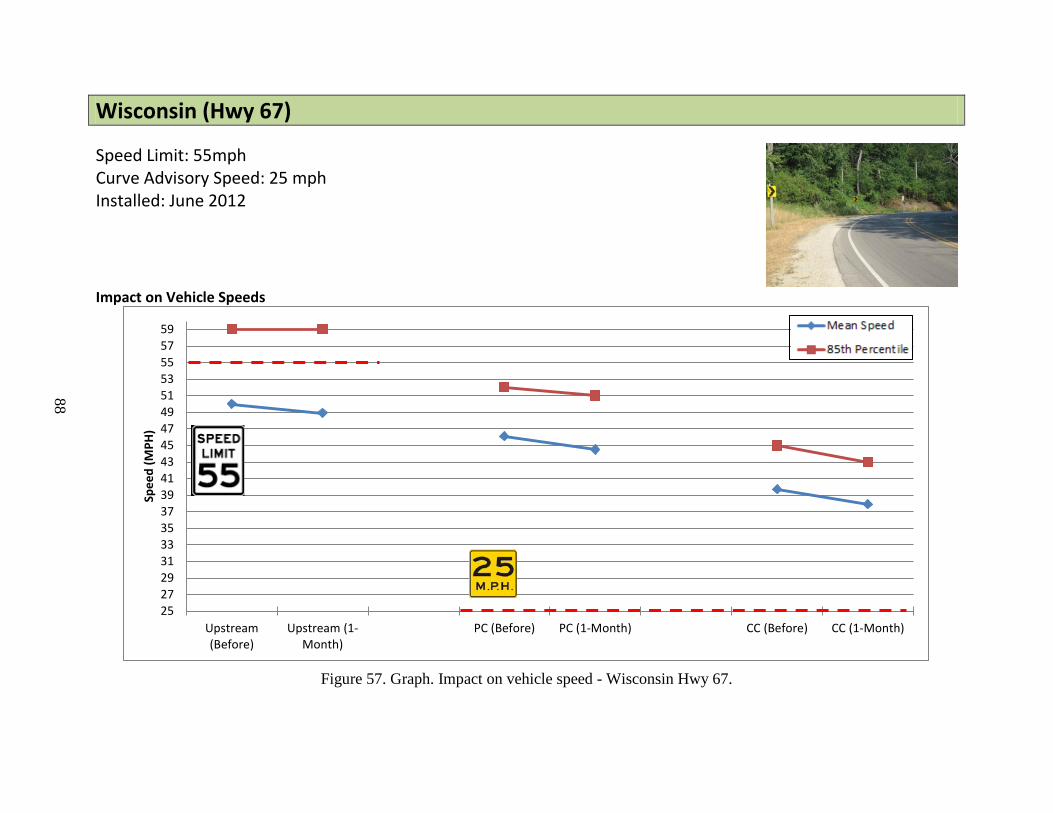
88
Wisconsin (Hwy 67) Speed Limit: 55mph Curve Advisory Speed: 25 mph Installed: June 2012
Impact on Vehicle Speeds
Figure 57. Graph. Impact on vehicle speed - Wisconsin Hwy 67.
252729313335373941434547495153555759
Upstream(Before)
Upstream (1-Month)
PC (Before) PC (1-Month) CC (Before) CC (1-Month)
Spee
d (M
PH)
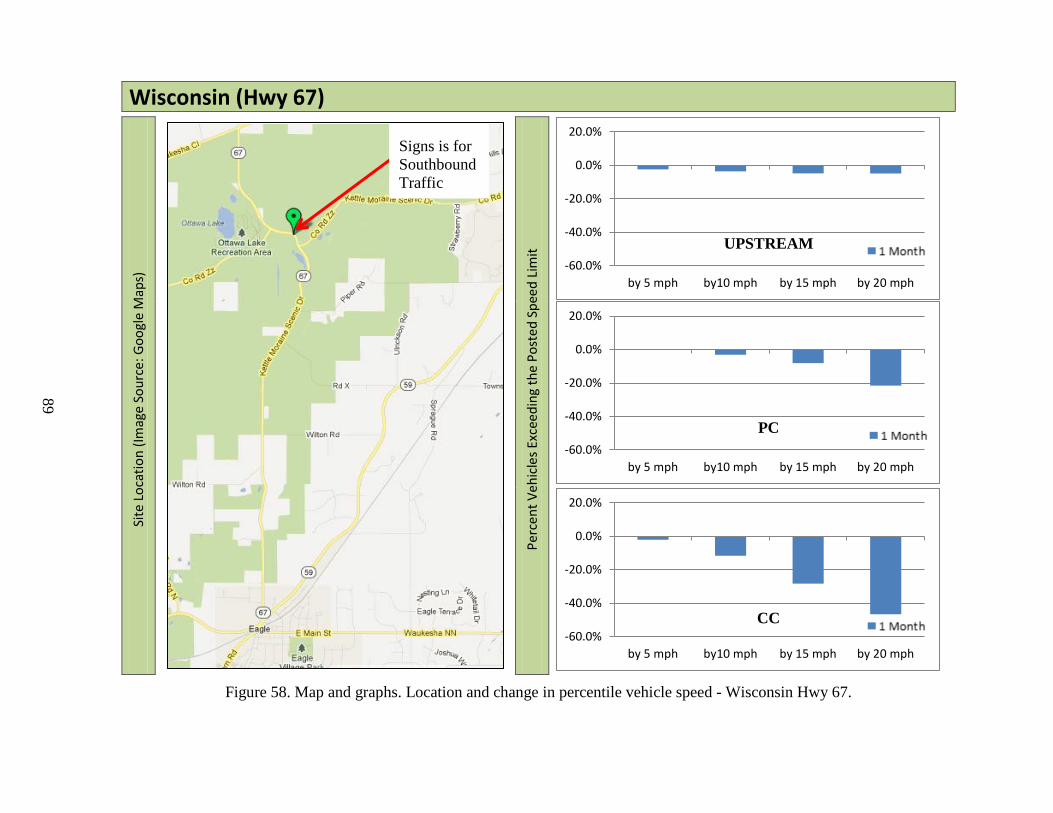
89
Wisconsin (Hwy 67)
Site
Loc
atio
n (Im
age
Sour
ce: G
oogl
e M
aps)
Perc
ent V
ehic
les E
xcee
ding
the
Post
ed S
peed
Lim
it
Figure 58. Map and graphs. Location and change in percentile vehicle speed - Wisconsin Hwy 67.
-60.0%
-40.0%
-20.0%
0.0%
20.0%
by 5 mph by10 mph by 15 mph by 20 mph
-60.0%
-40.0%
-20.0%
0.0%
20.0%
by 5 mph by10 mph by 15 mph by 20 mph
-60.0%
-40.0%
-20.0%
0.0%
20.0%
by 5 mph by10 mph by 15 mph by 20 mph
Signs is for Southbound Traffic
PC
UPSTREAM
CC

90
Wisconsin Highway 213
Table 29. Results for Wisconsin - Hwy 213 at PC. Before 1 Month Change ADT 2369 2249 -120 Sample 1156 1119
Upstream Mean Speed 58.8 59.8 1.0 Mean Speed 55.3 54.6 -0.7 Standard Deviation 7 6.6
85th Percentile Speed 61 61 0 fraction of vehicles exceeding advisory speed
Percentage of Vehicles 5+ Over Limit 0.63 0.57 -9.5% Percentage of Vehicles 10+ Over Limit 0.28 0.21 -25.0% Percentage of Vehicles 15+ Over Limit 0.03 0.03 0.0% Percentage of Vehicles 20+ Over Limit 0.00 0.00 0.0%
Tracking Data Sample 1134 1098
Upstream Mean Speed 58.9 59.9 1 Mean Speed 55.5 54.8 -0.7 Standard Deviation 6.5 6.2
85th Percentile Speed 61 61 0
Table 30. Results for Wisconsin - Hwy 213 at CC. Before 1 Month Change ADT 2552 2428 -124 Sample 1220 1193
Upstream Mean Speed 58.8 59.8 1.0 Mean Speed 53.2 52.2 -1.0 Standard Deviation 9.7 9.8
85th Percentile Speed 61 60 -1 fraction of vehicles exceeding advisory speed
Percentage of Vehicles 5+ Over Limit 0.59 0.52 -11.9% Percentage of Vehicles 10+ Over Limit 0.25 0.20 -20.0% Percentage of Vehicles 15+ Over Limit 0.02 0.03 50.0% Percentage of Vehicles 20+ Over Limit 0.00 0.00 0.0%
Tracking Data Sample 1134 1098
Upstream Mean Speed 58.9 59.9 1 Mean Speed 54.7 54.0 -0.7 Standard Deviation 7.7 7.5
85th Percentile Speed 61 61 0
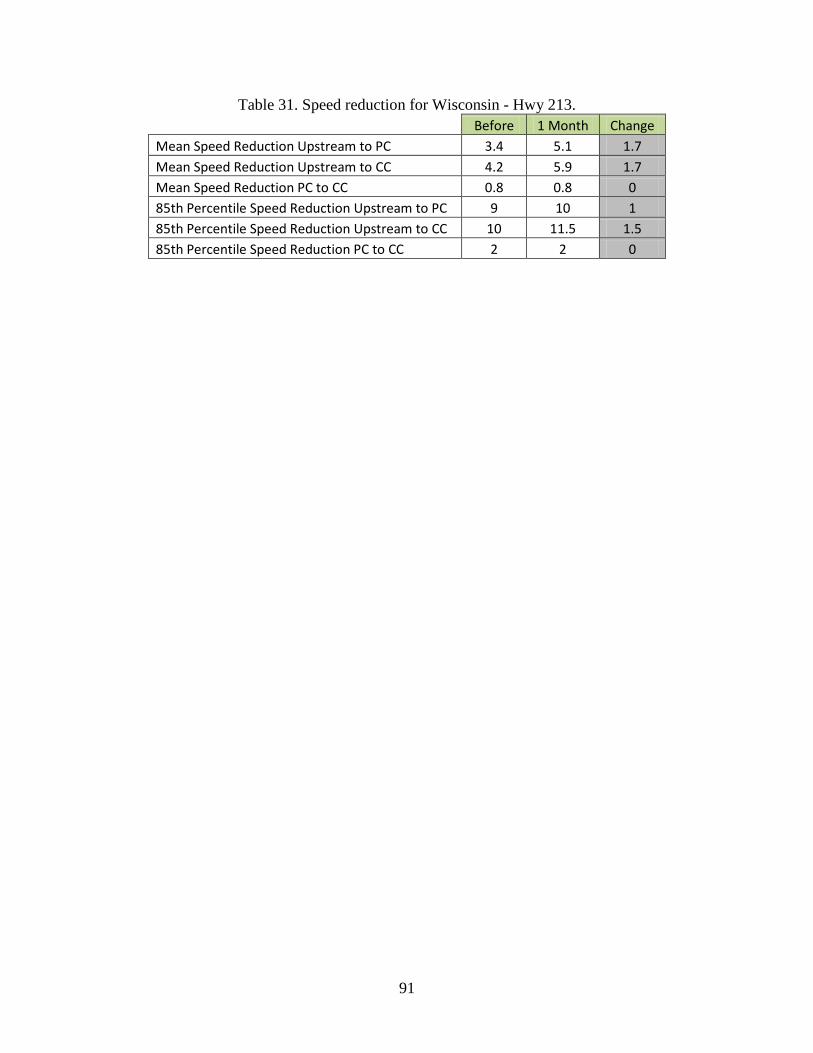
91
Table 31. Speed reduction for Wisconsin - Hwy 213. Before 1 Month Change
Mean Speed Reduction Upstream to PC 3.4 5.1 1.7 Mean Speed Reduction Upstream to CC 4.2 5.9 1.7 Mean Speed Reduction PC to CC 0.8 0.8 0 85th Percentile Speed Reduction Upstream to PC 9 10 1 85th Percentile Speed Reduction Upstream to CC 10 11.5 1.5 85th Percentile Speed Reduction PC to CC 2 2 0
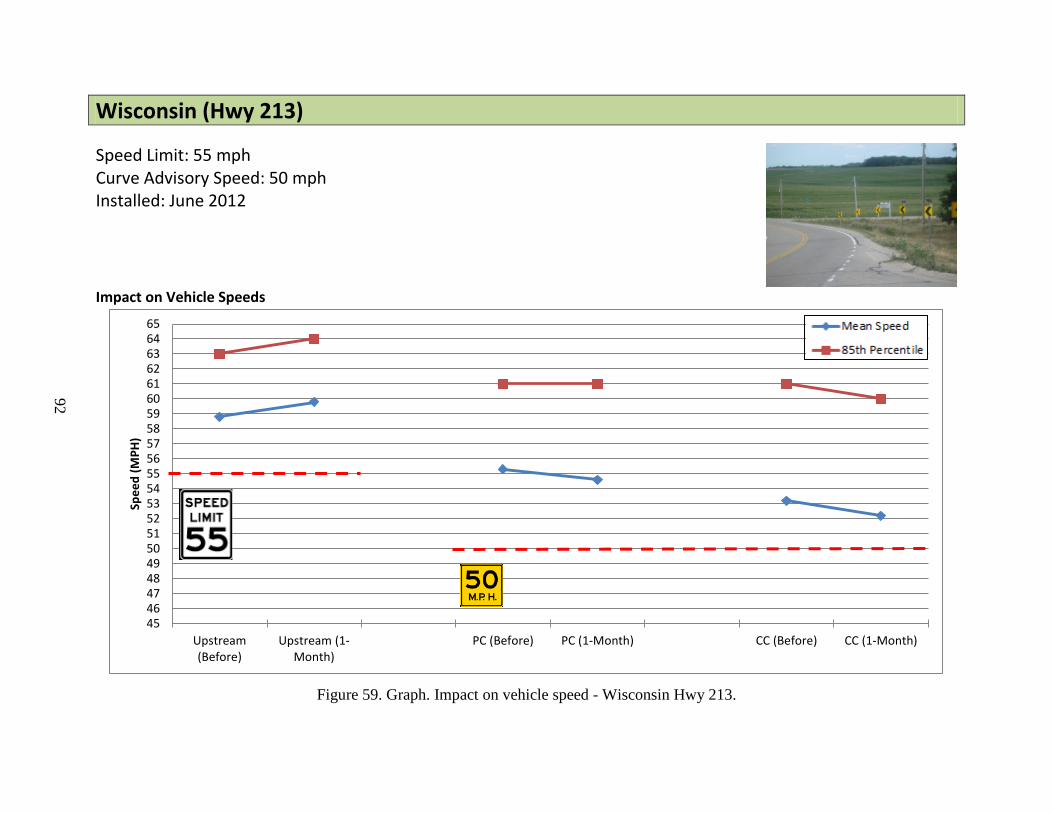
92
Wisconsin (Hwy 213) Speed Limit: 55 mph Curve Advisory Speed: 50 mph Installed: June 2012
Impact on Vehicle Speeds
Figure 59. Graph. Impact on vehicle speed - Wisconsin Hwy 213.
454647484950515253545556575859606162636465
Upstream(Before)
Upstream (1-Month)
PC (Before) PC (1-Month) CC (Before) CC (1-Month)
Spee
d (M
PH)
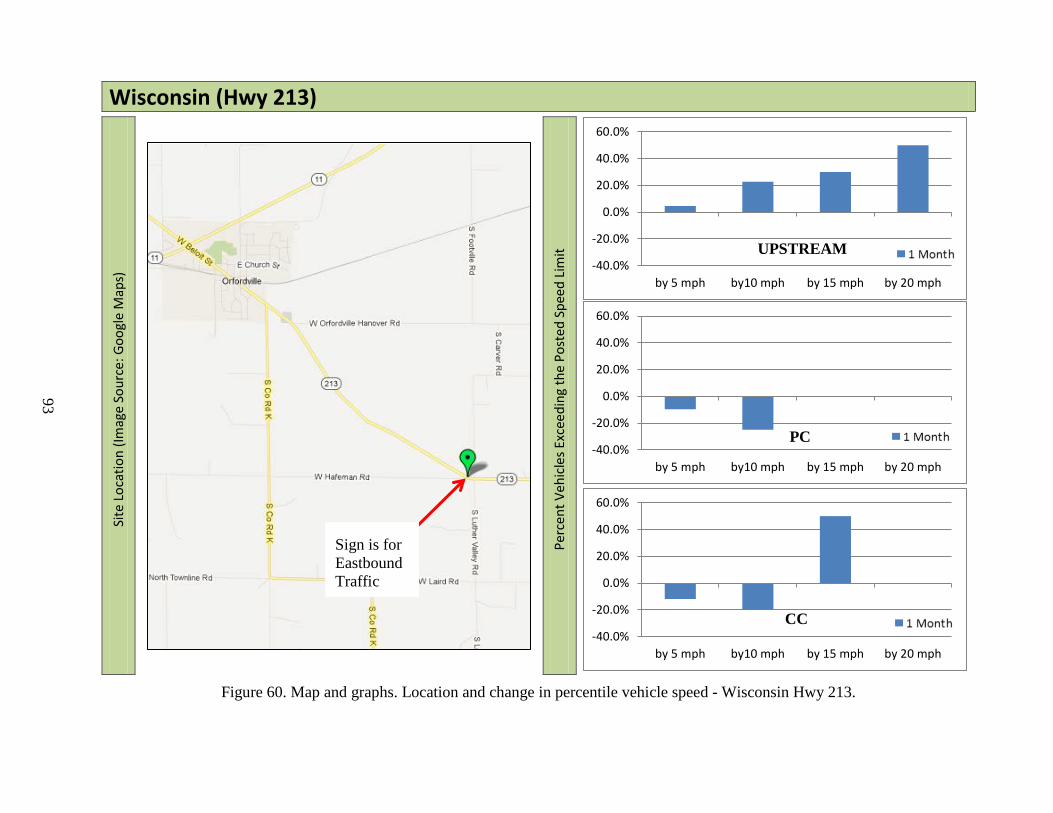
93
Wisconsin (Hwy 213)
Site
Loc
atio
n (Im
age
Sour
ce: G
oogl
e M
aps)
Perc
ent V
ehic
les E
xcee
ding
the
Post
ed S
peed
Lim
it
Figure 60. Map and graphs. Location and change in percentile vehicle speed - Wisconsin Hwy 213.
-40.0%
-20.0%
0.0%
20.0%
40.0%
60.0%
by 5 mph by10 mph by 15 mph by 20 mph
-40.0%
-20.0%
0.0%
20.0%
40.0%
60.0%
by 5 mph by10 mph by 15 mph by 20 mph
-40.0%
-20.0%
0.0%
20.0%
40.0%
60.0%
by 5 mph by10 mph by 15 mph by 20 mph
CC
Sign is for Eastbound Traffic
PC
UPSTREAM

94
Texas FM 109
Table 32. Results for Texas - FM 109 at PC. Before 1 Month Change ADT 2187 2031 -156 Sample 1036 954 Upstream Mean Speed 58.2 59.6 1.4 Mean Speed 46.6 45.8 -0.8 Standard Deviation 5.7 5.4 85th Percentile Speed 52 51 -1
fraction of vehicles exceeding advisory speed Percentage of Vehicles 5+ Over Limit 0.92 0.90 -2.2% Percentage of Vehicles 10+ Over Limit 0.68 0.62 -8.8% Percentage of Vehicles 15+ Over Limit 0.30 0.23 -23.3% Percentage of Vehicles 20+ Over Limit 0.07 0.04 0.0%
Table 33. Results for Texas - FM 109 at CC. Before 1 Month Change ADT 2129 1991 -138 Sample 1017 938 Upstream Mean Speed 58.2 59.6 1.4 Mean Speed 45.2 43.8 -1.4 Standard Deviation 5.2 4.7 85th Percentile Speed 50 48 -2
fraction of vehicles exceeding advisory speed Percentage of Vehicles 5+ Over Limit 0.90 0.85 -5.7% Percentage of Vehicles 10+ Over Limit 0.60 0.43 -27.7% Percentage of Vehicles 15+ Over Limit 0.18 0.09 -51.4% Percentage of Vehicles 20+ Over Limit 0.02 0.01 0.0%
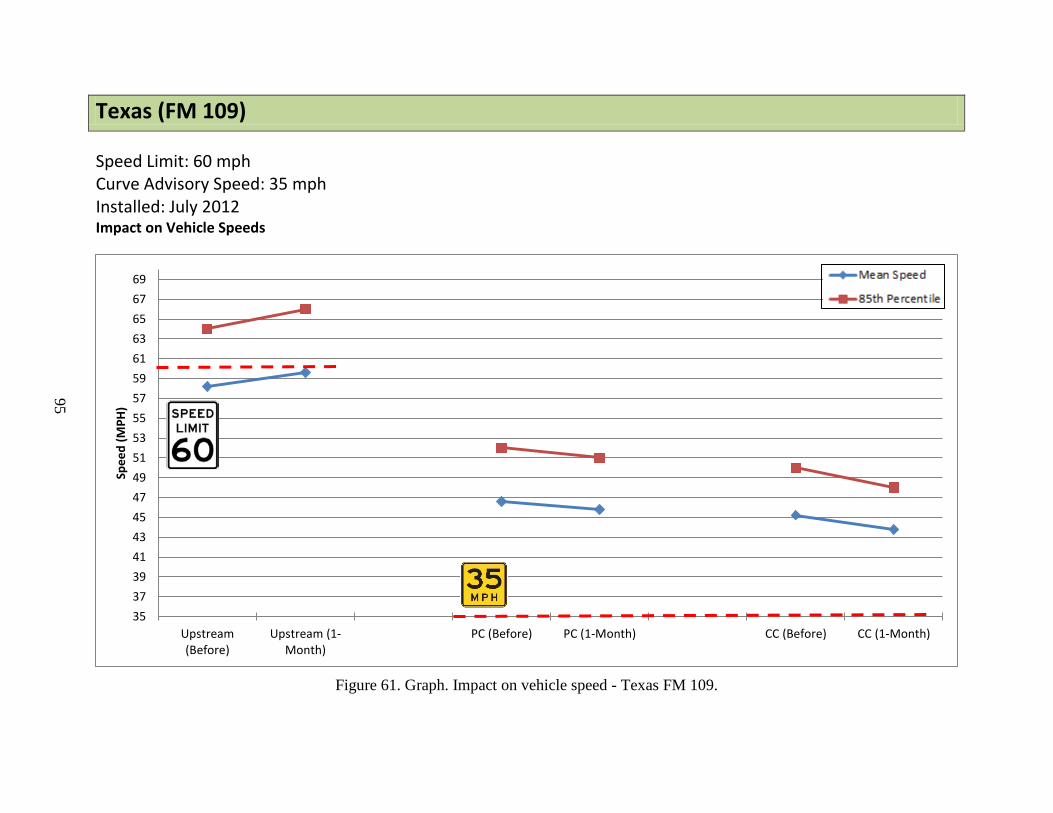
95
Texas (FM 109)
Speed Limit: 60 mph Curve Advisory Speed: 35 mph Installed: July 2012
Impact on Vehicle Speeds
Figure 61. Graph. Impact on vehicle speed - Texas FM 109.
353739414345474951535557596163656769
Upstream(Before)
Upstream (1-Month)
PC (Before) PC (1-Month) CC (Before) CC (1-Month)
Spee
d (M
PH)
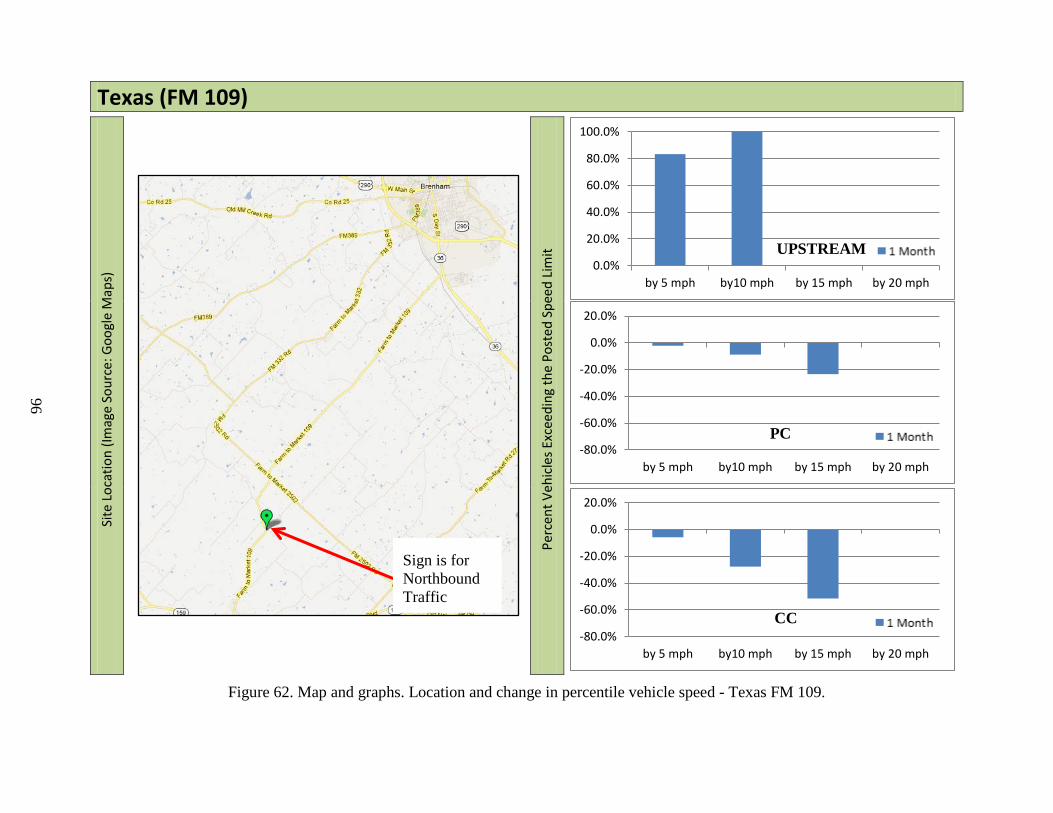
96
Texas (FM 109)
Site
Loc
atio
n (Im
age
Sour
ce: G
oogl
e M
aps)
Perc
ent V
ehic
les E
xcee
ding
the
Post
ed S
peed
Lim
it
Figure 62. Map and graphs. Location and change in percentile vehicle speed - Texas FM 109.
0.0%
20.0%
40.0%
60.0%
80.0%
100.0%
by 5 mph by10 mph by 15 mph by 20 mph
-80.0%
-60.0%
-40.0%
-20.0%
0.0%
20.0%
by 5 mph by10 mph by 15 mph by 20 mph
-80.0%
-60.0%
-40.0%
-20.0%
0.0%
20.0%
by 5 mph by10 mph by 15 mph by 20 mph
Sign is for Northbound Traffic
PC
UPSTREAM
CC
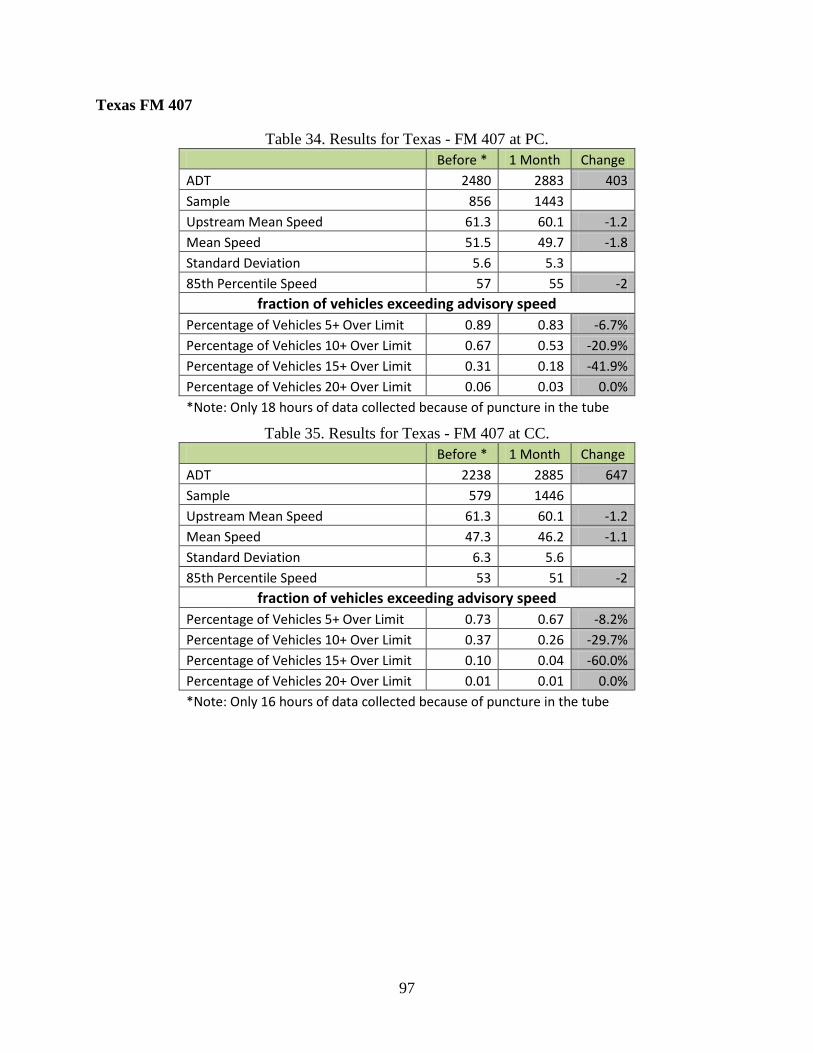
97
Texas FM 407
Table 34. Results for Texas - FM 407 at PC. Before * 1 Month Change ADT 2480 2883 403 Sample 856 1443 Upstream Mean Speed 61.3 60.1 -1.2 Mean Speed 51.5 49.7 -1.8 Standard Deviation 5.6 5.3 85th Percentile Speed 57 55 -2
fraction of vehicles exceeding advisory speed Percentage of Vehicles 5+ Over Limit 0.89 0.83 -6.7% Percentage of Vehicles 10+ Over Limit 0.67 0.53 -20.9% Percentage of Vehicles 15+ Over Limit 0.31 0.18 -41.9% Percentage of Vehicles 20+ Over Limit 0.06 0.03 0.0% *Note: Only 18 hours of data collected because of puncture in the tube
Table 35. Results for Texas - FM 407 at CC. Before * 1 Month Change ADT 2238 2885 647 Sample 579 1446 Upstream Mean Speed 61.3 60.1 -1.2 Mean Speed 47.3 46.2 -1.1 Standard Deviation 6.3 5.6 85th Percentile Speed 53 51 -2
fraction of vehicles exceeding advisory speed Percentage of Vehicles 5+ Over Limit 0.73 0.67 -8.2% Percentage of Vehicles 10+ Over Limit 0.37 0.26 -29.7% Percentage of Vehicles 15+ Over Limit 0.10 0.04 -60.0% Percentage of Vehicles 20+ Over Limit 0.01 0.01 0.0% *Note: Only 16 hours of data collected because of puncture in the tube
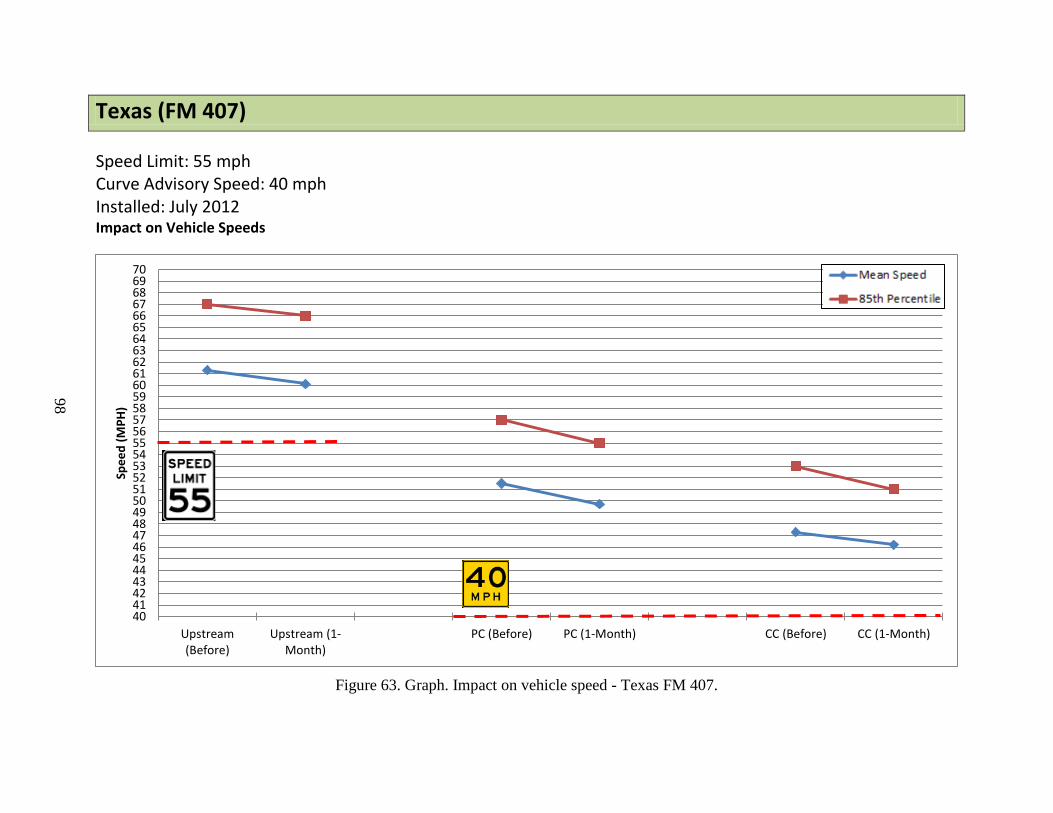
98
Texas (FM 407)
Speed Limit: 55 mph Curve Advisory Speed: 40 mph Installed: July 2012
Impact on Vehicle Speeds
Figure 63. Graph. Impact on vehicle speed - Texas FM 407.
40414243444546474849505152535455565758596061626364656667686970
Upstream(Before)
Upstream (1-Month)
PC (Before) PC (1-Month) CC (Before) CC (1-Month)
Spee
d (M
PH)
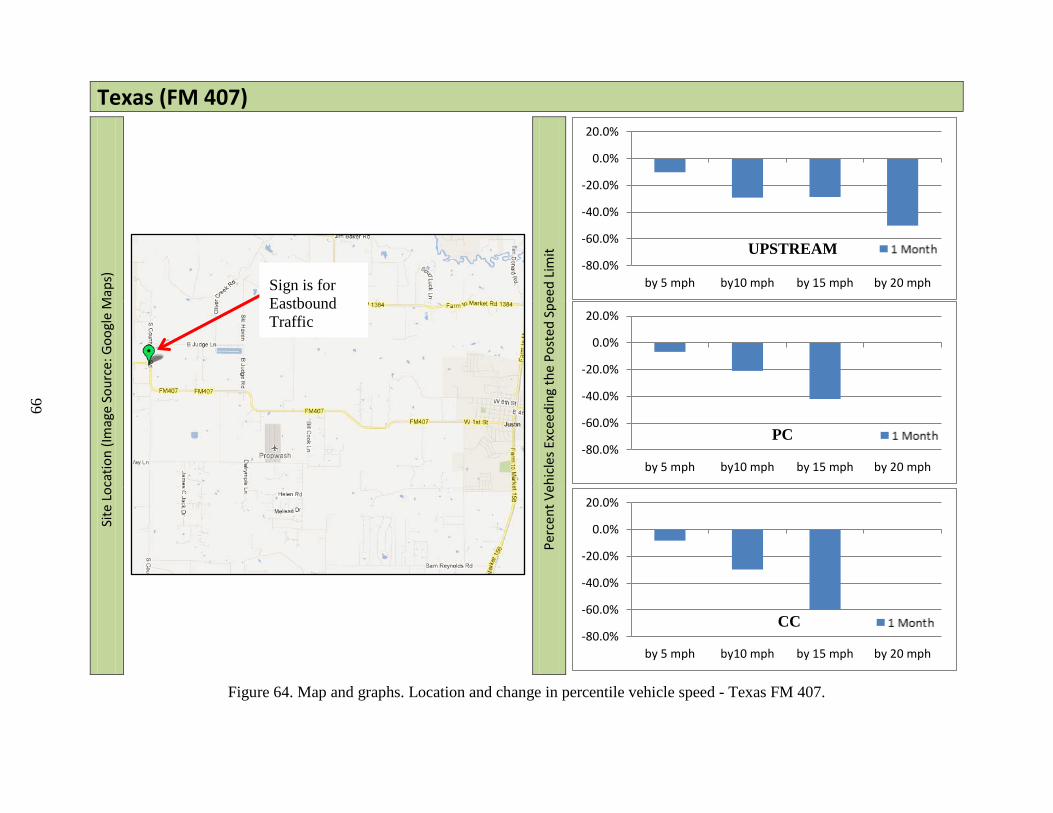
99
Texas (FM 407)
Site
Loc
atio
n (Im
age
Sour
ce: G
oogl
e M
aps)
Perc
ent V
ehic
les E
xcee
ding
the
Post
ed S
peed
Lim
it
Figure 64. Map and graphs. Location and change in percentile vehicle speed - Texas FM 407.
-80.0%
-60.0%
-40.0%
-20.0%
0.0%
20.0%
by 5 mph by10 mph by 15 mph by 20 mph
-80.0%
-60.0%
-40.0%
-20.0%
0.0%
20.0%
by 5 mph by10 mph by 15 mph by 20 mph
-80.0%
-60.0%
-40.0%
-20.0%
0.0%
20.0%
by 5 mph by10 mph by 15 mph by 20 mph
Sign is for Eastbound Traffic
PC
UPSTREAM
CC
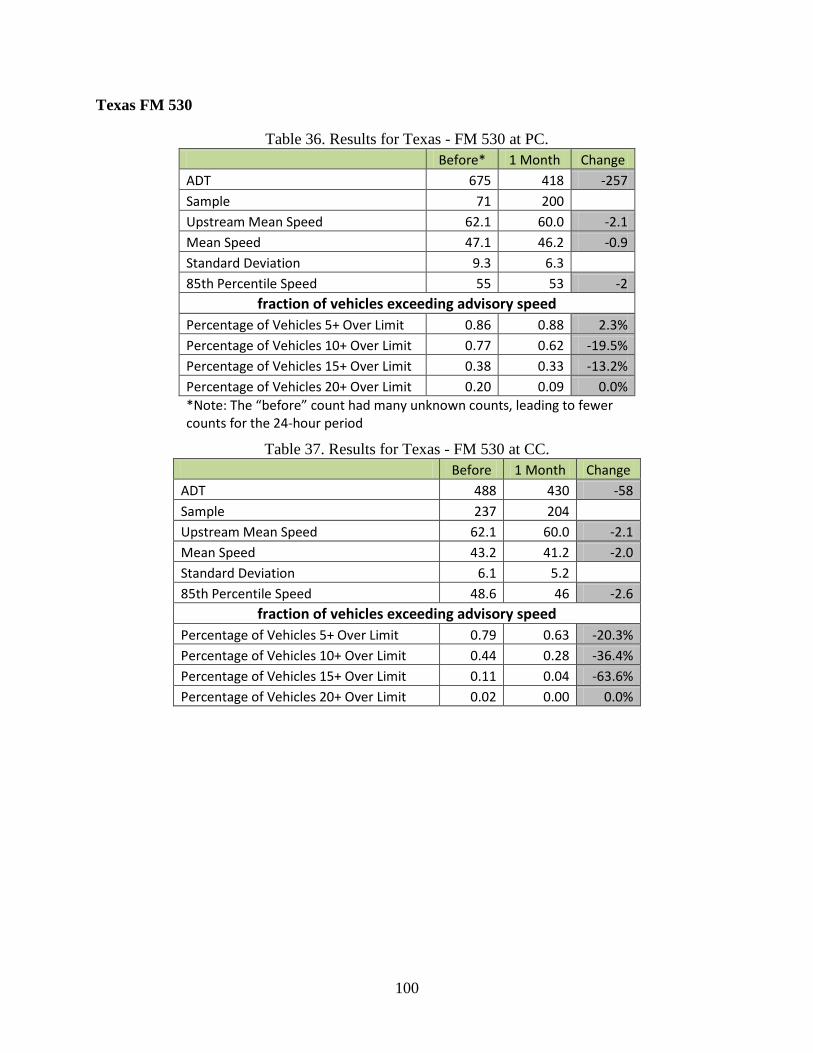
100
Texas FM 530
Table 36. Results for Texas - FM 530 at PC. Before* 1 Month Change ADT 675 418 -257 Sample 71 200 Upstream Mean Speed 62.1 60.0 -2.1 Mean Speed 47.1 46.2 -0.9 Standard Deviation 9.3 6.3 85th Percentile Speed 55 53 -2
fraction of vehicles exceeding advisory speed Percentage of Vehicles 5+ Over Limit 0.86 0.88 2.3% Percentage of Vehicles 10+ Over Limit 0.77 0.62 -19.5% Percentage of Vehicles 15+ Over Limit 0.38 0.33 -13.2% Percentage of Vehicles 20+ Over Limit 0.20 0.09 0.0% *Note: The “before” count had many unknown counts, leading to fewer counts for the 24-hour period
Table 37. Results for Texas - FM 530 at CC. Before 1 Month Change ADT 488 430 -58 Sample 237 204 Upstream Mean Speed 62.1 60.0 -2.1 Mean Speed 43.2 41.2 -2.0 Standard Deviation 6.1 5.2 85th Percentile Speed 48.6 46 -2.6
fraction of vehicles exceeding advisory speed Percentage of Vehicles 5+ Over Limit 0.79 0.63 -20.3% Percentage of Vehicles 10+ Over Limit 0.44 0.28 -36.4% Percentage of Vehicles 15+ Over Limit 0.11 0.04 -63.6% Percentage of Vehicles 20+ Over Limit 0.02 0.00 0.0%
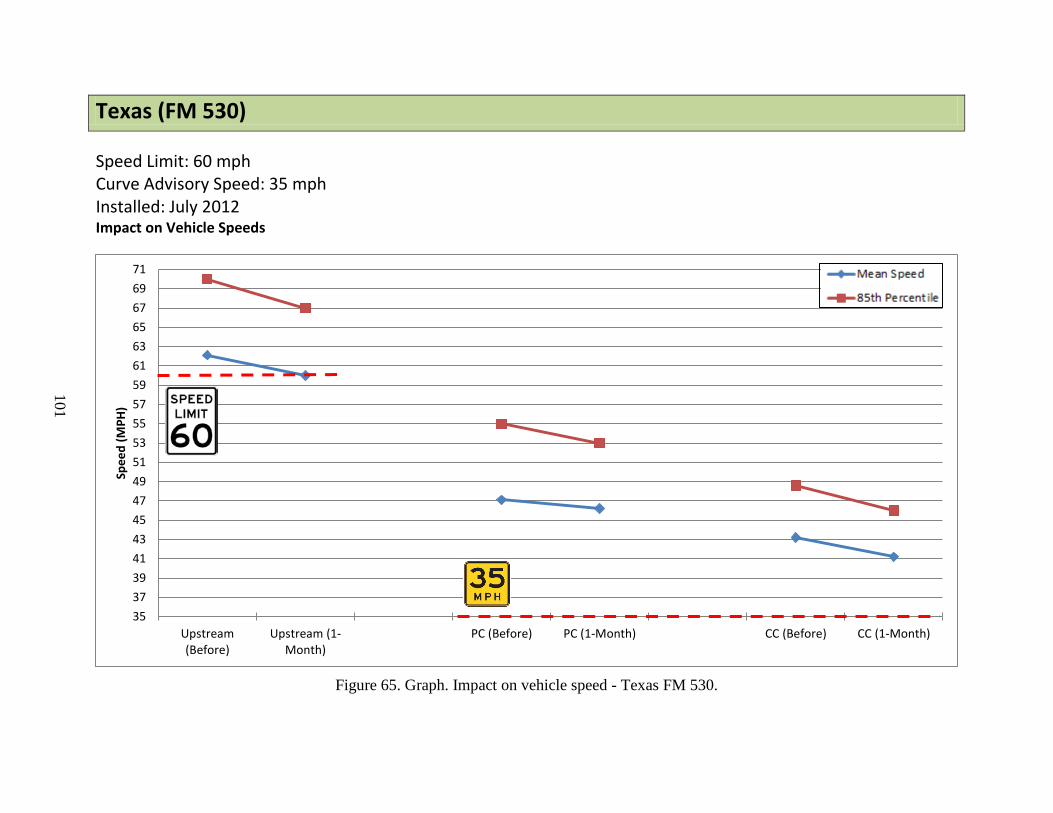
101
Texas (FM 530)
Speed Limit: 60 mph Curve Advisory Speed: 35 mph Installed: July 2012
Impact on Vehicle Speeds
Figure 65. Graph. Impact on vehicle speed - Texas FM 530.
35373941434547495153555759616365676971
Upstream(Before)
Upstream (1-Month)
PC (Before) PC (1-Month) CC (Before) CC (1-Month)
Spee
d (M
PH)
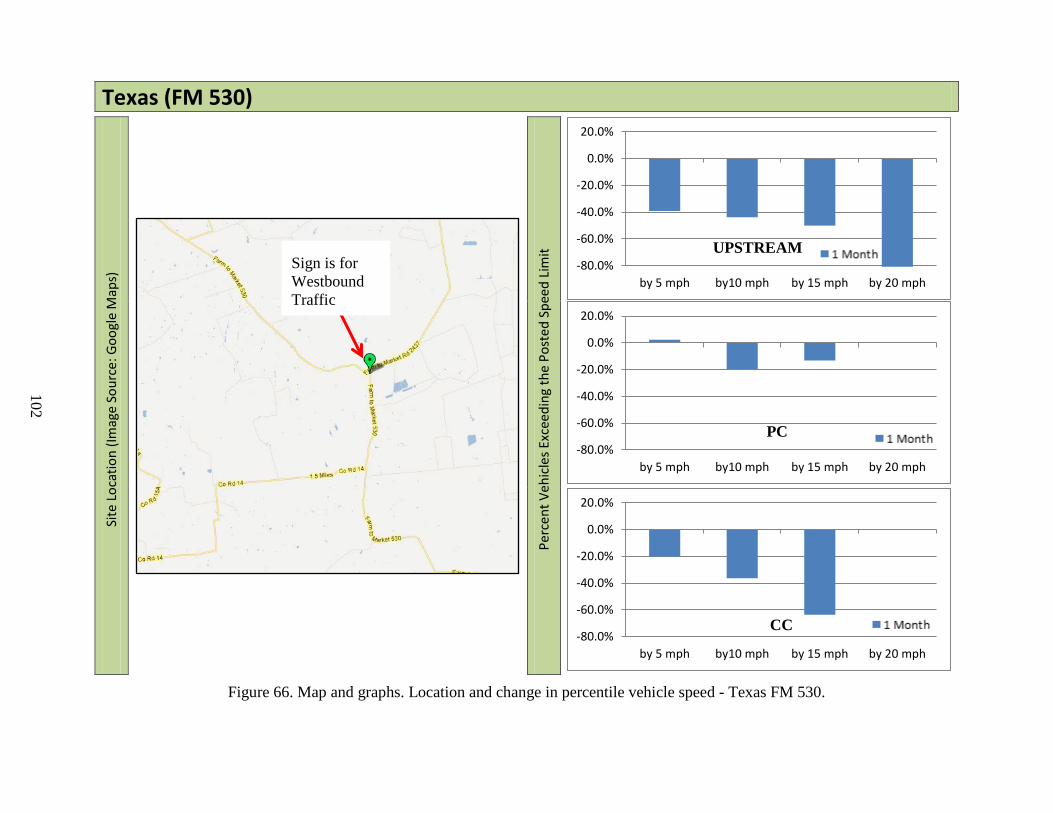
102
Texas (FM 530)
Site
Loc
atio
n (Im
age
Sour
ce: G
oogl
e M
aps)
Perc
ent V
ehic
les E
xcee
ding
the
Post
ed S
peed
Lim
it
Figure 66. Map and graphs. Location and change in percentile vehicle speed - Texas FM 530.
-80.0%
-60.0%
-40.0%
-20.0%
0.0%
20.0%
by 5 mph by10 mph by 15 mph by 20 mph
-80.0%
-60.0%
-40.0%
-20.0%
0.0%
20.0%
by 5 mph by10 mph by 15 mph by 20 mph
-80.0%
-60.0%
-40.0%
-20.0%
0.0%
20.0%
by 5 mph by10 mph by 15 mph by 20 mph
Sign is for Westbound Traffic
PC
UPSTREAM
CC
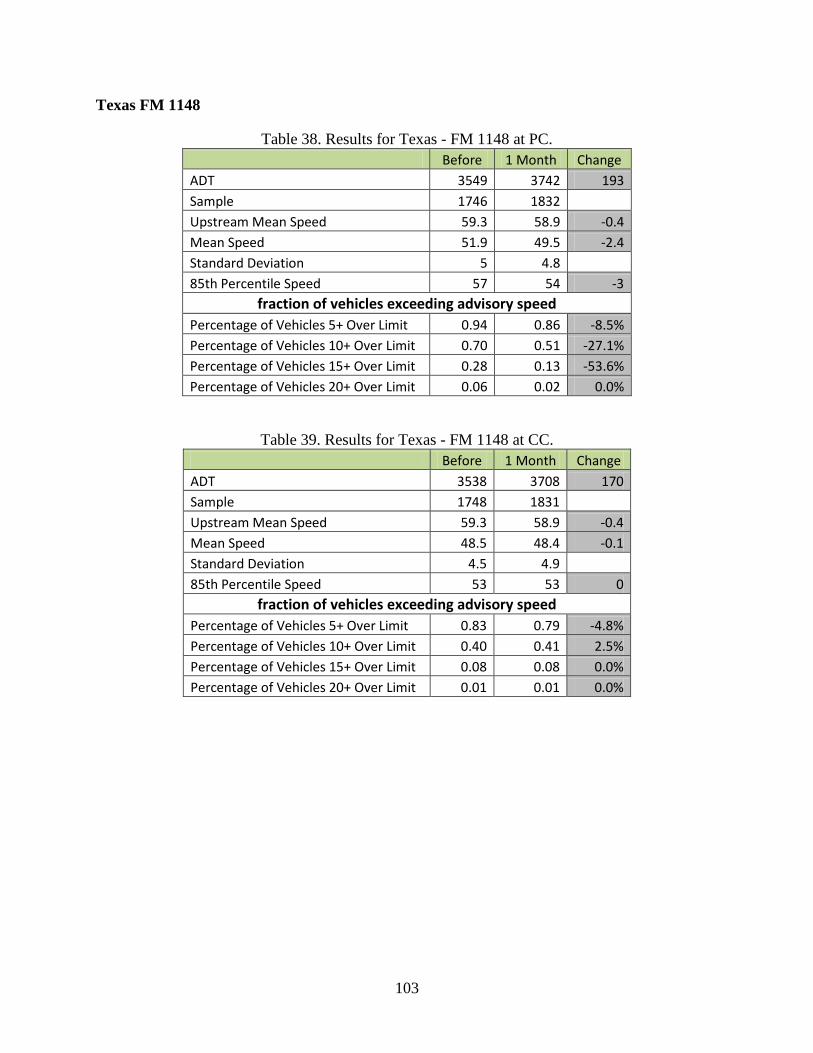
103
Texas FM 1148
Table 38. Results for Texas - FM 1148 at PC. Before 1 Month Change ADT 3549 3742 193 Sample 1746 1832 Upstream Mean Speed 59.3 58.9 -0.4 Mean Speed 51.9 49.5 -2.4 Standard Deviation 5 4.8 85th Percentile Speed 57 54 -3
fraction of vehicles exceeding advisory speed Percentage of Vehicles 5+ Over Limit 0.94 0.86 -8.5% Percentage of Vehicles 10+ Over Limit 0.70 0.51 -27.1% Percentage of Vehicles 15+ Over Limit 0.28 0.13 -53.6% Percentage of Vehicles 20+ Over Limit 0.06 0.02 0.0%
Table 39. Results for Texas - FM 1148 at CC. Before 1 Month Change ADT 3538 3708 170 Sample 1748 1831 Upstream Mean Speed 59.3 58.9 -0.4 Mean Speed 48.5 48.4 -0.1 Standard Deviation 4.5 4.9 85th Percentile Speed 53 53 0
fraction of vehicles exceeding advisory speed Percentage of Vehicles 5+ Over Limit 0.83 0.79 -4.8% Percentage of Vehicles 10+ Over Limit 0.40 0.41 2.5% Percentage of Vehicles 15+ Over Limit 0.08 0.08 0.0% Percentage of Vehicles 20+ Over Limit 0.01 0.01 0.0%
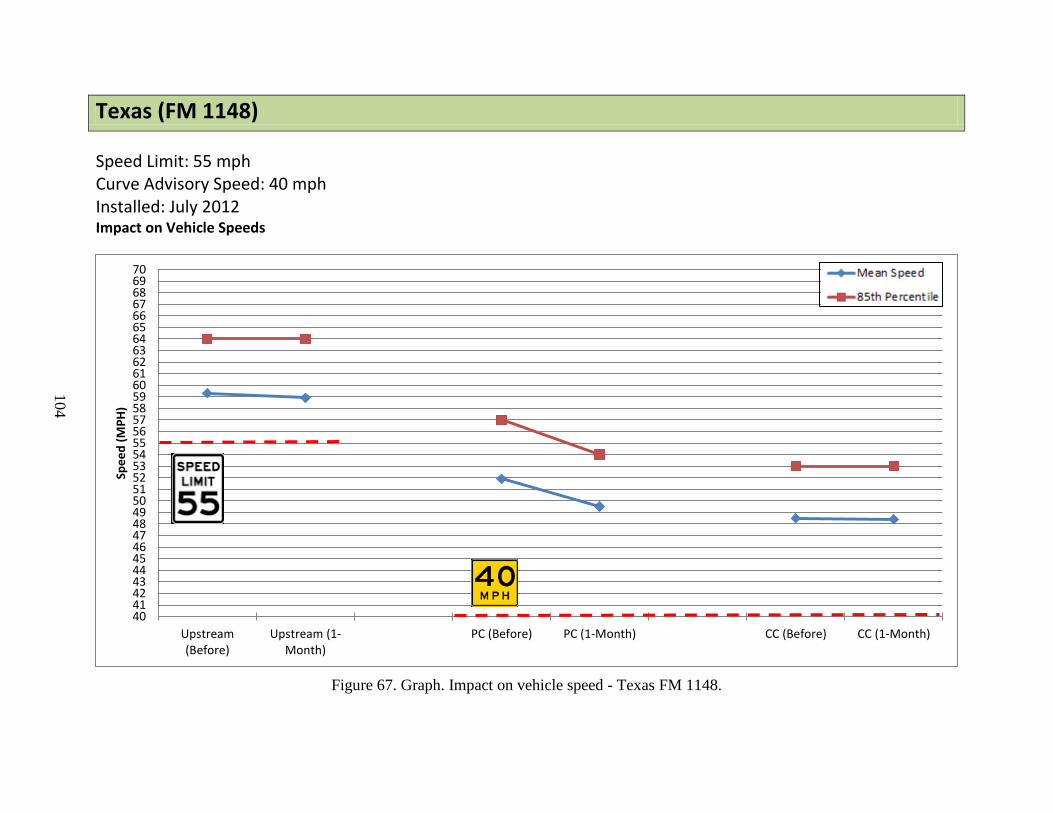
104
Texas (FM 1148)
Speed Limit: 55 mph Curve Advisory Speed: 40 mph Installed: July 2012
Impact on Vehicle Speeds
Figure 67. Graph. Impact on vehicle speed - Texas FM 1148.
40414243444546474849505152535455565758596061626364656667686970
Upstream(Before)
Upstream (1-Month)
PC (Before) PC (1-Month) CC (Before) CC (1-Month)
Spee
d (M
PH)
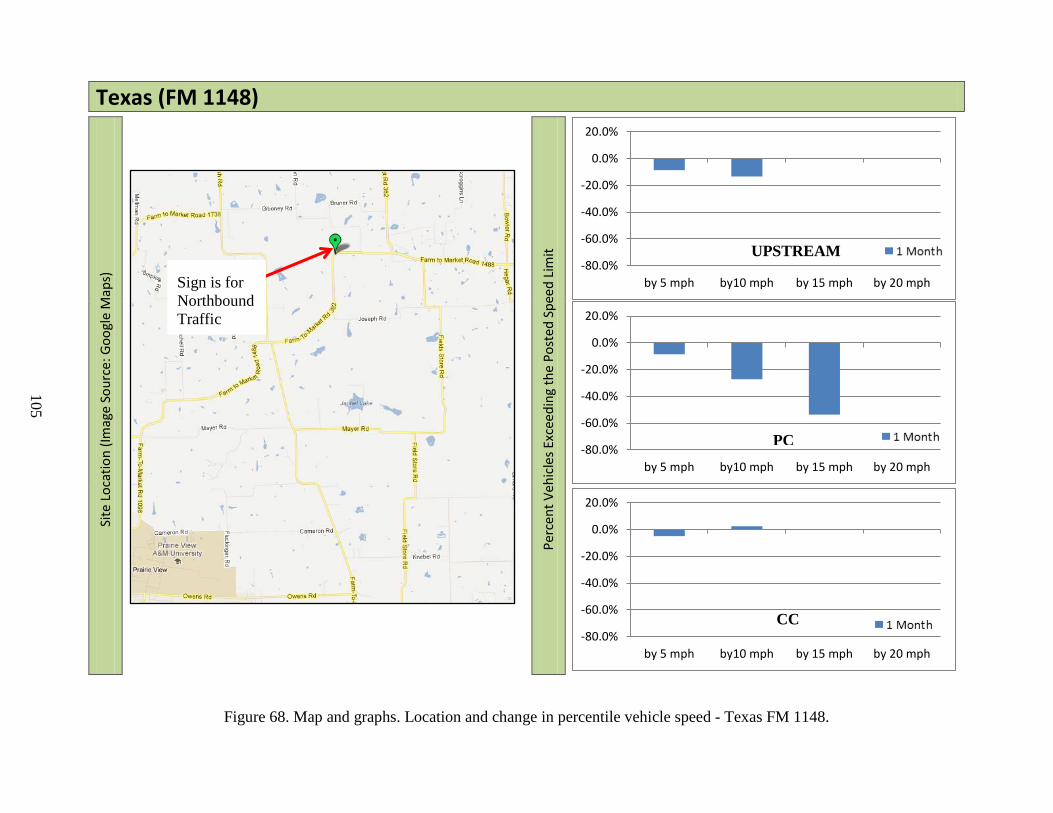
105
Texas (FM 1148)
Site
Loc
atio
n (Im
age
Sour
ce: G
oogl
e M
aps)
Perc
ent V
ehic
les E
xcee
ding
the
Post
ed S
peed
Lim
it
Figure 68. Map and graphs. Location and change in percentile vehicle speed - Texas FM 1148.
-80.0%
-60.0%
-40.0%
-20.0%
0.0%
20.0%
by 5 mph by10 mph by 15 mph by 20 mph
-80.0%
-60.0%
-40.0%
-20.0%
0.0%
20.0%
by 5 mph by10 mph by 15 mph by 20 mph
-80.0%
-60.0%
-40.0%
-20.0%
0.0%
20.0%
by 5 mph by10 mph by 15 mph by 20 mph
Sign is for Northbound Traffic
PC
UPSTREAM
CC

106
107
REFERENCES
1. Glennon, J. C., T. R. Neuman, and J. E. Leisch. Safety and Operational Considerations for Design of Rural Highway Curves. FHWA/RD-86-035. Federal Highway Administration. McLean, VA. December 1985.
2. Preston, H., and T. Schoenecker. Potential Safety Effects of Dynamic Signing at Rural Horizontal Curves. Minnesota Local Road Research Board. St. Paul, MN. December 1999.
3. Shankar, V. N., R. B. Albin, J. C. Milton, and F. L. Mannering. “Evaluating Median Crossover Likelihoods with Clustered Accident Counts: An Empirical Inquiry Using the Random Effects Negative Binomial Model.” Transportation Research Record: Journal of the Transportation Research Board No. 1635. Transportation Research Board of the National Academies, Washington, D.C. 1998. pp. 44–57.
4. Farmer, C. M., and A. K. Lund. “Rollover Risk of Cars and Light Trucks after Accounting for Driver and Environmental Factors.” Accident Analysis and Prevention. Vol. 34. 2002. pp. 163–173.
5. American Association of State Highway and Transportation Officials (AASHTO). Driving Down Lane-Departure Crashes: A National Priority. American Association of State Highway and Transportation Officials. Washington, D.C. April 2008.
6. Luediger L., E. M. Choueiri, J. C. Hayward, and A. Paluri. “Possible Design Procedure to Promote Design Consistency in Highway Geometric Design on Two-Lane Rural Roads.” Transportation Research Record: Journal of the Transportation Research Board No. 1195. Transportation Research Board of the National Academies, Washington, D.C. 1988. pp. 111–122.
7. Miaou, S., and H. Lum. “Statistical Evaluation of the Effects of Highway Geometric Design on Truck Accident Involvements.” Transportation Research Record: Journal of the Transportation Research Board No. 1407. Transportation Research Board of the National Academies, Washington, D.C. 1993. pp. 11–24.
8. Council, F. M., “Safety Benefits of Spiral Transitions on Horizontal Curves on Two-Lane Rural Roads.” Transportation Research Record: Journal of the Transportation Research Board No. 1635. Transportation Research Board of the National Academies, Washington, D.C. 1998. pp. 10–17.
9. Vogt, A., and J. Bared. “Accident Models for Two-Lane Rural Segments and Intersections.” Transportation Research Record: Journal of the Transportation Research Board No. 1635. Transportation Research Board of the National Academies, Washington, D.C. 1998. pp. 18–29.
10. Zegeer, C. V., R. Stewart, F. M. Council, D. W. Reinfurt, and E. Hamilton. “Safety Effects of Geometric Improvements on Horizontal Curves.” Transportation Research Record: Journal of the Transportation Research Board No. 1356. Transportation Research Board of the National Academies, Washington, D.C. 1992. pp. 11–19.
11. Mohamedshah, Y. M., F. F. Paniatie, and A. G. Hobeika. “Truck Accident Models for Interstates and Two-Lane Rural Roads.” Transportation Research Record: Journal of the
108
Transportation Research Board No. 1407. Transportation Research Board of the National Academies, Washington, D.C. 1993. pp. 35–41.
12. Milton, J., and F. Mannering. “The Relationship among Highway Geometric, Traffic-Related Elements, and Motor-Vehicle Accident Frequencies.” Transportation. Vol. 25. 1998. pp. 395–413.
13. Deng, Z., J. N. Ivan, and P. Garder. “Analysis of Factors Affecting the Severity of Head-On Crashes.” Transportation Research Record: Journal of the Transportation Research Board No. 1953. Transportation Research Board of the National Academies, Washington, D.C. 2006. pp. 137–146.
14. Taylor, M. C., A. Baruya, and J. V. Kennedy. The Relationship between Speed and Accidents on Rural Single-Carriageway Roads. TRL Report TRL511. Road Safety Division, Department for Transport, Local Government and the Regions. Wokingham, Berkshire, UK. 2002.
15. Khan, G., A. R. Bill, M. Chittur, and D. Noyce. “Horizontal Curves, Signs and Safety” Transportation Research Record: Journal of the Transportation Research Board No. 2279 Transportation Research Board of the National Academies, Washington, D.C. 2012.
16. Council, F. M., R. Srinivasan, S. Masten, D. Carter, and M. Reurings. Development of a Speeding-Related Crash Typology: Summary Report. FHWA-HRT-10-039. Federal Highway Administration. McLean, VA. 2005.
17. Anderson, I. B. and R. A. Krammes. “Speed Reduction as a Surrogate for Accident Experience at Horizontal Curves on Rural Two-lane Highways.” Transportation Research Record: Journal of the Transportation Research Board No. 1701. Transportation Research Board of the National Academies, Washington, D.C. 2000. pp. 86–94.
18. Fink, K. L., and R. A. Krammes. “Tangent Length and Sight Distance Effects on Accident Rates at Horizontal Curves on Rural Two-Lane Highways.” Transportation Research Record: Journal of the Transportation Research Board No. 1500. Transportation Research Board of the National Academies, Washington, D.C. 1995. pp. 162–168.
19. Charlton, S .G., and J. J. DePont. Curve Speed Management. Land Transport New Zealand Research Report 323. July 2007.
20. Charlton, S. G. “The Role of Attention in Horizontal Curves: A Comparison of Advance Warning, Delineation, and Road Marking Treatments.” Accident Analysis and Prevention. Volume 39. 2007. pp. 873–885.
21. Hassan, Y., and S. M. Easa. “Effect of Vertical Alignment on Driver Perception of Horizontal Curves.” Journal of Transportation Engineering. Vol. 129, No. 4. 2003. pp. 399–407.
22. Bertini, R. L., C. Monsere, C. Nolan, P. Bosa, and T. Abou El-Seoud. Field Evaluation of the Myrtle Creek Advance Curve Warning System. SPR 352. FHWA-OR-RD-05_13. Portland State University. June 2006.
23. Winnett, M. A., and A. H. Wheeler. Vehicle Activated Signs—A Large Scale Evaluation. TRL548. Road Safety Division, Department for Transport. Wokingham, Berkshire, UK. 2002.
109
24. City of Bellevue Transportation Department, Washington. Stationary Radar Sign Program: 2009 Report.
25. Mattox, J. H., W. A. Sarasua, J. H. Ogle, R. T. Eckenrode, and A. Dunning. “Development and Evaluation of a Speed Activated Sign to Reduce Speeds in Work Zones.” Paper presented at the 2007 Annual Meeting of the Transportation Research Board. January 2007.
26. Caltrans. District 2 Safety Report. California Department of Transportation. Draft. January 2010.
27. 3M. A Before and After Study of 3M Driver Feedback Signs. Traffic Safety Systems, 3M United Kingdom PLC. Berkshire. 2006.
28. Tribbett, L., P. McGowen, and J. Mounce. An Evaluation of Dynamic Curve Warning Systems in the Sacramento River Canyon. www.coe.montana.edu/wti/wti/pdf/ 42861_Final.pdf. Western Transportation Institute. April 2000.
29. Fontaine, M., P. Carlson, and G. Hawkins. Evaluation of Traffic Control Devices for Rural High-Speed Maintenance Work Zones: Second Year Activities and Final Recommendations. FHWA/TX-01/1879-2. Texas Transportation Institute. Texas Department of Transportation. 2000.
30. Hallmark, S., N. Hawkins, and O. Smadi. Evaluation of Dynamic Speed Feedback Signs on Curves: A National Demonstration Project. Draft Final Report. FHWA Project DTFH61-07-H-00022. September 2012.
31. Sun, C., P. Edara, Y. Hou, and A. Robertson. “Safety Evaluation of Sequential Warning Lights in Tapers at Nighttime Work Zones” Transportation Research Record: Journal of the Transportation Research Board No. 2272. Transportation Research Board, Washington, D.C. 2012. pp. 1–8.
32. Santiago-Chaparro, K. R., M. Chitturi, A. Bill, and D. A. Noyce. “Spatial Effectiveness of Speed Feedback Signs” Transportation Research Record: Journal of the Transportation Research Board No. 2281. Transportation Research Board, Washington, D.C. 2012. pp. 8–15.
33. Cruzado, I., and E. T. Donell. “Evaluating the Effectiveness of Dynamic Speed Display Signs in Transition Zones of Two-Lane, Rural Highways in Pennsylvania” Transportation Research Record: Journal of the Transportation Research Board No. 2122. 2009. pp. 1–8.
34. McFadden, J., and L. Elefteriadou, “Evaluating Horizontal Alignment Design Consistency of Two-lane Rural Highways: Development of New Procedure.” Transportation Research Record: Journal of the Transportation Research Board No. 1737. Transportation Research Board, Washington, D.C. 2000. pp. 9-17.
35. Hirsh, M. “Probabilistic Approach to Consistency in Geometric Design.” Journal of Transportation Engineering, Vol. 113, No. 3, May 1987.
36. Misaghi, P., and Y. Hassan. “Modeling Operating Speed and Speed Differential on Two-Lane Rural Roads” Journal of Transportation Engineering, Vol. 131, No. 6, June 2005.
Related Documents