ENTSO-E AISBL • Avenue de Cortenbergh, 100 • 1000 Brussels • Belgium • Tel +32 2 741 09 50 • Fax +32 2 741 09 51 • info@entsoe.eu • www.entsoe.eu European Network of Transmission System Operators for Electricity 1 THE INTRODUCTION OF DIFFERENT TIME SERIES POSSIBILITIES (CURVETYPE) WITHIN ENTSO-E ELECTRONIC DOCUMENTS 28-03-2019 VERSION 1.2

Welcome message from author
This document is posted to help you gain knowledge. Please leave a comment to let me know what you think about it! Share it to your friends and learn new things together.
Transcript

ENTSO-E AISBL • Avenue de Cortenbergh, 100 • 1000 Brussels • Belgium • Tel +32 2 741 09 50 • Fax +32 2 741 09 51 • [email protected] • www.entsoe.eu
European Network of Transmission System Operators
for Electricity
1
THE INTRODUCTION OF DIFFERENT TIME SERIES
POSSIBILITIES (CURVETYPE) WITHIN ENTSO-E ELECTRONIC
DOCUMENTS
28-03-2019
VERSION 1.2
Page 2 of 21
ENTSO-E AISBL • Avenue de Cortenbergh, 100 • 1000 Brussels • Belgium • Tel +32 2 741 09 50 • Fax +32 2 741 09 51 • [email protected] • www.entsoe.eu
European Network of Transmission System Operators
for Electricity
THE INTRODUCTION OF DIFFERENT TIME SERIES
POSSIBILITIES WITHIN ETSO ELECTRONIC DOCUMENTS
VERSION 1.2
TABLE OF CONTENTS 2
1 INTRODUCTION ........................................................................................................ 5 3
2 ENTSO-E TIME SERIES USE .................................................................................... 6 4
3 CALCULATION OF THE POSITION OF AN INTERVAL IN TIME ........................................... 7 5
4 CURVETYPE ............................................................................................................ 8 6
4.1 A01 – SEQUENTIAL FIXED SIZE BLOCKS (DEFAULT) ........................................................................... 9 7
4.2 A02 – POINT ................................................................................................................................ 11 8
4.3 A03 – VARIABLE SIZED BLOCK ...................................................................................................... 13 9
4.4 A04 – OVERLAPPING BREAKPOINT ................................................................................................. 15 10
4.5 A05 – NON-OVERLAPPING BREAKPOINT ......................................................................................... 18 11
5 THE HANDLING OF GAPS ........................................................................................ 20 12
13
TABLE OF FIGURES 14
FIGURE 1: BASIC TIME SERIES LAYOUT................................................................................ 6 15
FIGURE 2: SEQUENTIAL FIXED SIZE BLOCKS ........................................................................ 9 16
FIGURE 3: POINTS ............................................................................................................ 11 17
FIGURE 4: VARIABLE SIZED BLOCKS .................................................................................. 13 18
FIGURE 5: OVERLAPPING BREAKPOINTS ............................................................................ 15 19
FIGURE 6: NON-OVERLAPPING BREAKPOINTS .................................................................... 18 20
FIGURE 7: TIMESERIES GAP EXAMPLE ............................................................................... 20 21
FIGURE 8: TIMESERIES GAP AND OVERLAP EXAMPLE ......................................................... 21 22
FIGURE 9: TIMESERIES GAP AND OVERLAP DESCRIPTION ................................................... 21 23
24

Page 3 of 21
ENTSO-E AISBL • Avenue de Cortenbergh, 100 • 1000 Brussels • Belgium • Tel +32 2 741 09 50 • Fax +32 2 741 09 51 • [email protected] • www.entsoe.eu
European Network of Transmission System Operators
for Electricity
THE INTRODUCTION OF DIFFERENT TIME SERIES
POSSIBILITIES WITHIN ETSO ELECTRONIC DOCUMENTS
VERSION 1.2
Copyright notice: 25
Copyright © ENTSO-E. All Rights Reserved. 26
This document and its whole translations may be copied and furnished to others, and 27
derivative works that comment on or otherwise explain it or assist in its implementation may 28
be prepared, copied, published and distributed, in whole or in part, without restriction of any 29
kind, provided that the above copyright notice and this paragraph are included on all such 30
copies and derivative works. However, this document itself may not be modified in any way, 31
except for literal and whole translation into languages other than English and under all 32
circumstances, the copyright notice or references to ENTSO-E may not be removed. 33
This document and the information contained herein is provided on an "as is" basis. 34
ENTSO-E DISCLAIMS ALL WARRANTIES, EXPRESS OR IMPLIED, INCLUDING BUT 35
NOT LIMITED TO ANY WARRANTY THAT THE USE OF THE INFORMATION HEREIN 36
WILL NOT INFRINGE ANY RIGHTS OR ANY IMPLIED WARRANTIES OF 37
MERCHANTABILITY OR FITNESS FOR A PARTICULAR PURPOSE. 38
Maintenance notice: 39
THIS DOCUMENT IS MAINTAINED BY ENTSO-E CIM EG. COMMENTS OR REMARKS 40
ARE TO BE PROVIDED AT [email protected] 41

Page 4 of 21
ENTSO-E AISBL • Avenue de Cortenbergh, 100 • 1000 Brussels • Belgium • Tel +32 2 741 09 50 • Fax +32 2 741 09 51 • [email protected] • www.entsoe.eu
European Network of Transmission System Operators
for Electricity
THE INTRODUCTION OF DIFFERENT TIME SERIES
POSSIBILITIES WITHIN ETSO ELECTRONIC DOCUMENTS
VERSION 1.2
Revision History 42
Version Release Date Paragraph Comments
0 0 2009/09/30 Document release
1 0 2009/11/20 Comments from EDI WG members. Document approved by ENTSO-E Market Committee on 2009/12/11.
1 1 2011/05/05 Precision on the use of gaps and typing errors corrections.
Approved by Market Committee on 2011-05-17.
1 2 2019/03/28 Updates in chapters 2 and 3 to have into account the current ESMP CIM standards.
Approved by MC.
43

Page 5 of 21
ENTSO-E AISBL • Avenue de Cortenbergh, 100 • 1000 Brussels • Belgium • Tel +32 2 741 09 50 • Fax +32 2 741 09 51 • [email protected] • www.entsoe.eu
European Network of Transmission System Operators
for Electricity
THE INTRODUCTION OF DIFFERENT TIME SERIES
POSSIBILITIES WITHIN ETSO ELECTRONIC DOCUMENTS
VERSION 1.2
1 INTRODUCTION 44
In 2001, ETSO Task Force Electronic Data Interchange (EDI) identified a requirement to 45
handle time series for electricity transactions. These transactions concerned exchange of 46
energy/power blocks with a constant time interval. For each time interval, the quantity value 47
in the class “Interval” of the time series was either: 48
• A constant power in MW on the time interval [t0, t1[1 49
• An energy value in MWh for the time interval [t0, t1[ 50
These are only examples and the quantity value is depending upon the business process 51
requirements, energy, power, water flow, temperature, price, etc. The same applies also for 52
the data type, e.g. integer value, real with a given number of decimal, etc. 53
Since this first definition, new business requirements have appeared requiring time series 54
capable of handling: 55
• Variable time intervals; 56
• The transmission of unrelated information for points in time; 57
• Ramping; 58
• Variable sized blocks. 59
In order to satisfy these new business requirements and not to disrupt the current method of 60
handling time series information a study was carried out which not only kept in mind the 61
original philosophy of handling time series but also addressed the new requirements. 62
The results of the study concluded that the existing time series method could optimally 63
answer all the identified cases with the simple addition of an attribute to identify to sort of 64
curve that was being provided. 65
This document outlines how the addition of a type of curve can address the requirements 66
initially requested. 67
ENTSO-E recommends having a constant resolution when different Period classes are 68
provided within one time series. 69
This implementation ensures the compatibility with all the existing documents developed 70
within ENTSO-E CIM EG, ENTSO-E WG-EDI and the former organisation ETSO TF EDI. 71
1 Notation convention:
• [t0, t1] means that the period is such that t0 ≤ t ≤ t1
• [t0, t1[ means that the period is such that t0 ≤ t < t1
• ]t0, t1] means that the period is such that t0 < t ≤ t1
• ]t0, t1[ means that the period is such that t0 < t < t1
Page 6 of 21
ENTSO-E AISBL • Avenue de Cortenbergh, 100 • 1000 Brussels • Belgium • Tel +32 2 741 09 50 • Fax +32 2 741 09 51 • [email protected] • www.entsoe.eu
European Network of Transmission System Operators
for Electricity
THE INTRODUCTION OF DIFFERENT TIME SERIES
POSSIBILITIES WITHIN ETSO ELECTRONIC DOCUMENTS
VERSION 1.2
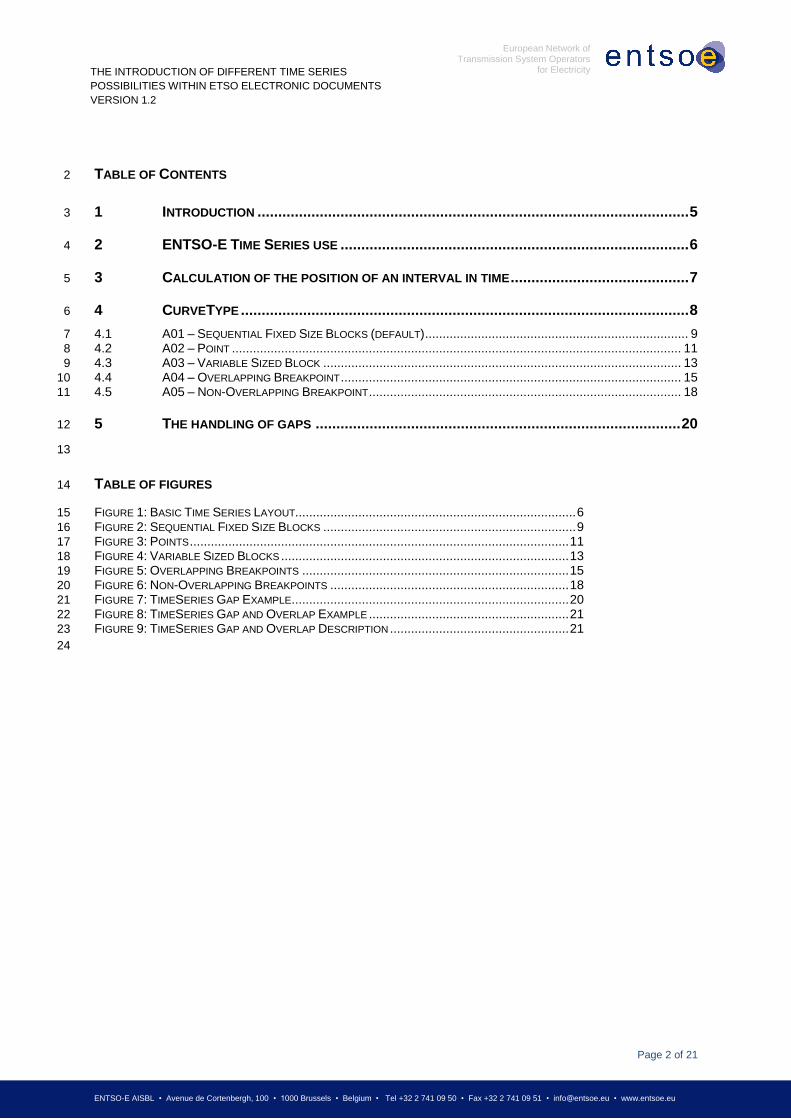
2 ENTSO-E TIME SERIES USE 72
ENTSO-E usesa standardised set of ESMP CIM (IEC 62325-351) classes to provide time 73
series information. This layout takes basic form outlined in figure 1. 74
75
76
FIGURE 1: BASIC TIME SERIES LAYOUT 77
All time intervals for the
time series in the document
must be within the total time
interval for the schedule.
The receiver will discard
any time intervals outside
the schedule period.
The receiver will discard
any time intervals outside
the schedule period.
Describes the time
interval and the
resolution that the
curve covers.
Describes the points or changes in the
curve. A position is always determined
by the formula:
TimeStepPosition = (start Datetime of
timeInterval) + ((Position-1) * Resolution)
Describes the type of curve
that is defined in the
Series_Period class.

Page 7 of 21
ENTSO-E AISBL • Avenue de Cortenbergh, 100 • 1000 Brussels • Belgium • Tel +32 2 741 09 50 • Fax +32 2 741 09 51 • [email protected] • www.entsoe.eu
European Network of Transmission System Operators
for Electricity
THE INTRODUCTION OF DIFFERENT TIME SERIES
POSSIBILITIES WITHIN ETSO ELECTRONIC DOCUMENTS
VERSION 1.2
It’s needed to associate a timeInterval attribute to the MarketDocument class to specify the 78
total time interval covered by the document. All time intervals for the time series in the 79
document must be within the total time interval associated to the MarketDocument class. 80
The Time Series class contains all the details describing what the time series represents. 81
Amongst all the time series descriptive information there is an attribute called “CurveType”. 82
This attribute is used to describe the type of curve that is being provided for the Time Series 83
in question. 84
If the “CurveType” attribute is omitted in the XML instance a default value of “sequential fixed 85
size blocks” shall be understood. This ensures that compatibility is maintained with existing 86
implementations. 87
The Series_Period class provides the information defining the time interval that is covered 88
and the resolution of the time step within the Period. 89
The Point class provides all the content for a given time step which is identified by the 90
attribute “Position”. The attribute “Position” always begins at the value “1”. The maximum 91
number of repetitions of the Point class is determined assuming that all variables are 92
expressed as an integer number of Resolution units by the formula: 93
solutionRe
imeStartDateTeEndDateTim −. 94
However, the effective number of Intervals depends on the CurveType element contents. 95
3 CALCULATION OF THE POSITION OF AN INTERVAL IN TIME 96
The exact time position within a Series_Period class shall be calculated in the following 97
manner: 98
))1(*( −+= PossolutionRentervalimeofTimeIStartDateTsitionTimeStepPo 99
with Pos being the Position value of the Point class. 100
For example: if there was a Time Interval with 2009-01-01T22:00/2009-01-02T22:00 and a 101
Resolution of PT30M, The TimeStepPosition for a Pos with the value of 9 would be 2009-01-102
02T02:00, i.e. the interval [02:00, 02:30[ for a sequential fixed size blocks “CurveType”. 103
This formula is true in all cases of the use of the ENTSO-E Time Series principles. 104
It must be borne in mind that by convention the start date and time is included whereas the 105
end date and time is excluded, i.e. [start date and time, end date and time[. For CurveType 106
“A04” and CurveType “A05”, the end date and time although excluded must be included to 107
define the possible ramp. This will be defined within the detailed description of the time 108
series. 109
The time is always represented as the horizontal axe of the curve whereas the vertical axe is 110
represented by the quantity. 111

Page 8 of 21
ENTSO-E AISBL • Avenue de Cortenbergh, 100 • 1000 Brussels • Belgium • Tel +32 2 741 09 50 • Fax +32 2 741 09 51 • [email protected] • www.entsoe.eu
European Network of Transmission System Operators
for Electricity
THE INTRODUCTION OF DIFFERENT TIME SERIES
POSSIBILITIES WITHIN ETSO ELECTRONIC DOCUMENTS
VERSION 1.2
4 CURVETYPE 112
In all five different types of curve have been identified to date. These are: 113
1. Sequential fixed size blocks (A01): The curve is made of successive Intervals of 114
time (Blocks) of constant duration (size), where the size of the Blocks is equal to the 115
Resolution of the Period. The TimeStepPosition of each Interval is equal to: 116
))1(*( −+= PossolutionRentervalimeofTimeIStartDateTsitionTimeStepPo 117
with Pos being the Position attribute value of the Point class. 118
The number of Intervals of a Period must be equal to: solutionRe
imeStartDateTeEndDateTim − 119
All Intervals to cover the TimeInterval of a Period must be present. 120
The value of the Qty remains constant within each Block. 121
2. Points (A02): The curve is made of successive instants of time (Points). Each Point 122
is determined as follows: 123
))1(*( −+= PossolutionRentervalimeofTimeIStartDateTsitionTimeStepPo 124
with Pos being the Position attribute value of the Point class. 125
All Points must be within the Period TimeInterval. 126
The Qty of each Interval corresponds only to the value at the . 127
3. Variable sized Blocks (A03): The curve is made of successive Intervals of time 128
(Blocks) of variable duration (size), where the end date and end time of each Block 129
are equal to the start date and start time of the next Interval. For the last Block the 130
end date and end time of the last Interval would be equal to EndDateTime of 131
TimeInterval. The TimeStepPosition of each Interval is equal to: 132
))1(*( −+= PossolutionRentervalimeofTimeIStartDateTsitionTimeStepPo 133
with Pos being the Position attribute value of the Point class. 134
All Intervals to cover the TimeInterval of a Period must be present. 135
The value of the Qty remains constant within each Block. 136
4. Overlapping Breakpoints (A04): The curve is made of successive Intervals of time 137
of variable duration (size), where the end date and end time of each interval are equal 138
to the start date and start time of the next Interval. The TimeStepPosition of each 139
Interval is equal to: 140
))1(*( −+= PossolutionRentervalimeofTimeIStartDateTsitionTimeStepPo 141
with Pos being the Position attribute value of the Point class. 142
All Intervals to cover the TimeInterval of a Period must be present. 143
The value of the Qty at instant t evolves linearly with the time within a TimeInterval as 144
follows: 145
startstart
startend
startend QtysitionTimeStepPotsitionTimeStepPositionTimeStepPo
QtyQtytQty +−
−
−= )(*)( 146

Page 9 of 21
ENTSO-E AISBL • Avenue de Cortenbergh, 100 • 1000 Brussels • Belgium • Tel +32 2 741 09 50 • Fax +32 2 741 09 51 • [email protected] • www.entsoe.eu
European Network of Transmission System Operators
for Electricity
THE INTRODUCTION OF DIFFERENT TIME SERIES
POSSIBILITIES WITHIN ETSO ELECTRONIC DOCUMENTS
VERSION 1.2
where the “start” and “end” index refers respectively to the current Position and to the 147
next Position provided in the Timeseries. This formula is to be applied only for the 148
time inside a given Period (the TimeStepPositionend and the TimeStepPositionstart 149
cannot be the same), overlapping breakpoints are identified by a change of period. 150
For the last interval, the TimeStepPositionend must be equal to the EndDateTime of 151
TimeInterval. 152
5. Non-overlapping Breakpoints (A05): This curve is a restriction of the previous one, 153
i.e. overlapping breakpoints; the restriction is that a single Period is allowed. Thus, 154
the TimeStepPositionend of a TimeInterval and the TimeStepPositionstart of a 155
TimeInterval cannot be the same. All the other conditions apply. 156
These are described in the following paragraphs.2 157
4.1 A01 – SEQUENTIAL FIXED SIZE BLOCKS (DEFAULT) 158
Resolution
Period covered (end excluded)Block 1
Position 1
Block 2
Position 2
Block 3
Position 3
Block 4
Position 4
Block 5
Position 5
Block 6
Position 6
0h 4h 8h 12h 16h 20h0
50
100
150
24h
Convention start included/end excluded
159
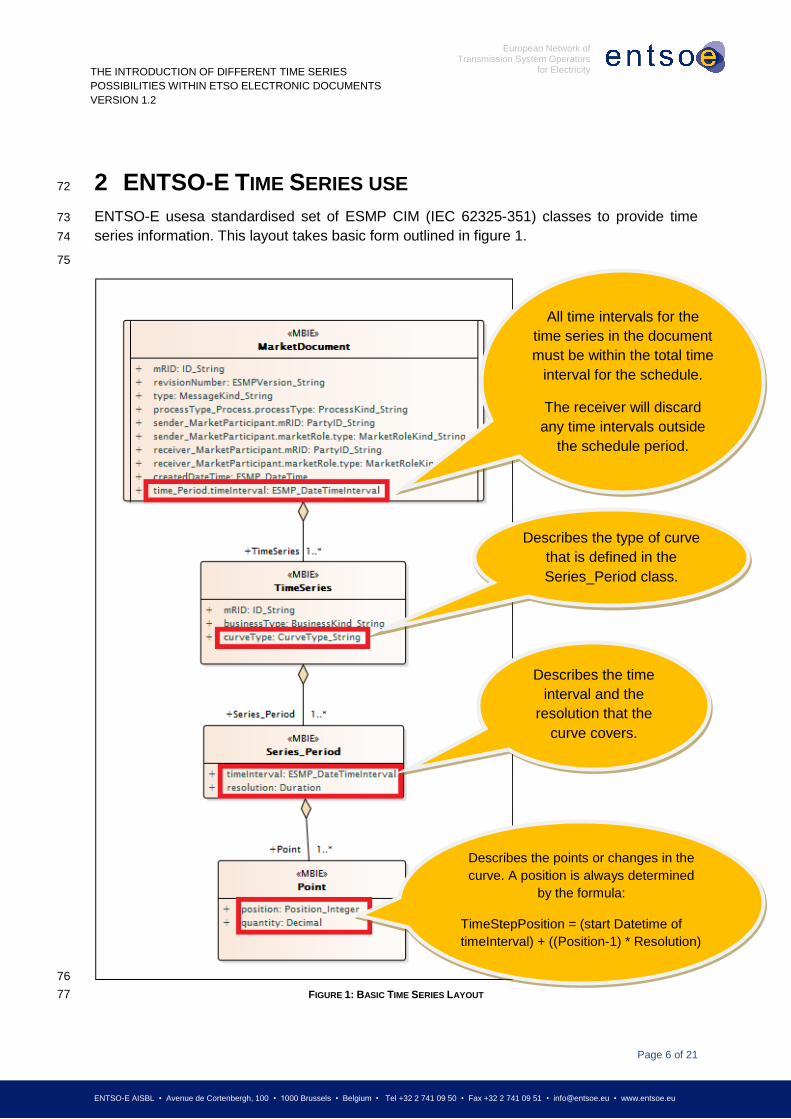
FIGURE 2: SEQUENTIAL FIXED SIZE BLOCKS 160
2 The examples, hereafter enclosed, are for a UTC time period of one day 2009-09-09T00:00/2009-09-
10T00:00Z, depending upon the local time to be considered, the expression of the day may vary with
the time saving periods. Moreover, the time period may vary depending upon the business
requirements (such as for intraday processes, etc.).
Page 10 of 21
ENTSO-E AISBL • Avenue de Cortenbergh, 100 • 1000 Brussels • Belgium • Tel +32 2 741 09 50 • Fax +32 2 741 09 51 • [email protected] • www.entsoe.eu
European Network of Transmission System Operators
for Electricity
THE INTRODUCTION OF DIFFERENT TIME SERIES
POSSIBILITIES WITHIN ETSO ELECTRONIC DOCUMENTS
VERSION 1.2
The CurveType A01 corresponds to a Period where all the interval positions are present 161
within the TimeInterval. The resolution corresponds to the interval. Consequently the number 162
of intervals must be equal tosolutionRe
imeStartDateTeEndDateTim −. 163
This corresponds to the current use of the TimeSeries for the ENTSO-E ESS, ESP, ERRP 164
and ECAN uses. It is consequently considered as the default value for the CurveType should 165
the element not be present. 166
In the example shown in Figure 2, there is a 24 hour day with a 4 hour resolution. 167
Applying the formula for a TimeInterval 2009-09-09T00:00/2009-09-10T00:00Z 168
))1(*( −+= PossolutionRentervalimeofTimeIStartDateTsitionTimeStepPo 169
The following positions are obtained: 170
1 = (2009-09-09T00:00 + ((1-1) * PT4H) = 00:00 + ((0) *4) 171
2 = (2009-09-09T00:00 + ((2-1) * PT4H) = 00:00 + ((1) *4) 172
3 = (2009-09-09T00:00 + ((3-1) * PT4H) = 00:00 + ((2) *4) 173
4 = (2009-09-09T00:00 + ((4-1) * PT4H) = 00:00 + ((3) *4) 174
5 = (2009-09-09T00:00 + ((5-1) * PT4H) = 00:00 + ((4) *4) 175
6 = (2009-09-09T00:00 + ((6-1) * PT4H) = 00:00 + ((5) *4) 176
Consequently there are 6 intervals: 177
1) Covering the interval [0h00, 04h00[ for a constant block of 50MW; 178
2) Covering the interval [4h00, 08h00[ for a constant block of 100MW; 179
3) Covering the interval [08h00, 12h00[ for a constant block of 100MW; 180
4) Covering the interval [12h00, 16h00[ for a constant block of 150MW; 181
5) Covering the interval [16h00, 20h00[ for a constant block of 150MW; 182
6) Covering the interval [20h00, 24h00[ for a constant block of 0MW. 183
This induces the following rules: 184
✓ Each position identifies the start of a block; 185
✓ All positions must be provided, i.e. all intervals covering the TimeInterval of a Period 186
shall be present; 187
✓ The value of the Qty remains constant within each block; 188
✓ The block is represented by the position on the horizontal axe and the quantity on the 189
vertical axe; 190
✓ This corresponds to the current time series method and shall be considered as the 191
default value. 192

Page 11 of 21
ENTSO-E AISBL • Avenue de Cortenbergh, 100 • 1000 Brussels • Belgium • Tel +32 2 741 09 50 • Fax +32 2 741 09 51 • [email protected] • www.entsoe.eu
European Network of Transmission System Operators
for Electricity
THE INTRODUCTION OF DIFFERENT TIME SERIES
POSSIBILITIES WITHIN ETSO ELECTRONIC DOCUMENTS
VERSION 1.2
4.2 A02 – POINT 193
194
FIGURE 3: POINTS 195
The CurveType A02 corresponds to a Period where only the Interval positions that have data 196
are present within Time Interval. The resolution corresponds to the smallest expected interval 197
between two Points. In the case of meter readings it could be for example 1 hour. There is no 198
direct relation between 1 Point and the Next. Only the Interval position where the Point is 199
represented shall be provided. The number of Points possible is not directly defined, but 200
must be inferior to solutionRe
imeStartDateTeEndDateTim −. 201
In the example in Figure 3, the smallest resolution has been defined as 4 hours. This 202
indicates that a reading is not expected in an interval less than 4 hours. The position 203
provides the exact time of the reading. In the example it can be seen that there are 5 204
readings corresponding to positions 1, 2, 3, 5 and 6. 205
Applying the formula for a TimeInterval 2009-09-09T00:00/2009-09-10T00:00Z 206
))1(*( −+= PossolutionRentervalimeofTimeIStartDateTsitionTimeStepPo 207
The following positions are obtained: 208
1 = (2009-09-09T00:00 + ((1-1) * PT4H) = 00:00 + ((0) *4) 209
2 = (2009-09-09T00:00 + ((2-1) * PT4H) = 00:00 + ((1) *4) 210

Page 12 of 21
ENTSO-E AISBL • Avenue de Cortenbergh, 100 • 1000 Brussels • Belgium • Tel +32 2 741 09 50 • Fax +32 2 741 09 51 • [email protected] • www.entsoe.eu
European Network of Transmission System Operators
for Electricity
THE INTRODUCTION OF DIFFERENT TIME SERIES
POSSIBILITIES WITHIN ETSO ELECTRONIC DOCUMENTS
VERSION 1.2
3 = (2009-09-09T00:00 + ((3-1) * PT4H) = 00:00 + ((2) *4) 211
5 = (2009-09-09T00:00 + ((5-1) * PT4H) = 00:00 + ((4) *4) 212
6 = (2009-09-09T00:00 + ((6-1) * PT4H) = 00:00 + ((5) *4) 213
Consequently there are 5 interval elements that represent the time of the readings (a reading 214
every 4 hours). The fourth reading is absent from the electronic document which signifies 215
that no reading took place. 216
1) At 0h00- where the reading value was 50MW; 217
2) At 4h00 where the reading value was 100MW; 218
3) At 08h00 where the reading value was 100MW; 219
5) At 16h00 where the reading value was 150MW; 220
6) At 20h00 where the reading value was 0MW. 221
There is no relational significance between each reading other than the relation induced by 222
the resolution This consequently induces the following rules: 223
✓ Each position represents a point defined by the quantity on the vertical axe and the 224
position time on the horizontal axe; 225
✓ The quantity is the value at a given point in time, it is the business rules that have to 226
define the meaning of this quantity; 227
✓ Only points with a value are provided. 228

Page 13 of 21
ENTSO-E AISBL • Avenue de Cortenbergh, 100 • 1000 Brussels • Belgium • Tel +32 2 741 09 50 • Fax +32 2 741 09 51 • [email protected] • www.entsoe.eu
European Network of Transmission System Operators
for Electricity
THE INTRODUCTION OF DIFFERENT TIME SERIES
POSSIBILITIES WITHIN ETSO ELECTRONIC DOCUMENTS
VERSION 1.2
4.3 A03 – VARIABLE SIZED BLOCK 229
230
FIGURE 4: VARIABLE SIZED BLOCKS 231
The CurveType A03 differs from A01 in that only the position where a block change occurs is 232
provided. Consequently all positions are not provided. This is useful in cases where the 233
quantity is stable over a long period of time. 234
In the example in Figure 4, the first block begins at 00h00 for 50 megawatts. The second 235
block begins at 04h00 for 100 megawatts. This also implies that the first block terminates at 236
04h00. The third block begins at 12h00 for150 megawatts. This also implies that the second 237
block terminates at 12h00. The fourth block begins at 16h00 for 50 megawatts and since 238
there is no other block presented it carries right through to the end of the day 239
Applying the formula for a TimeInterval 2009-09-09T00:00/2009-09-10T00:00Z 240
))1(*( −+= PossolutionRentervalimeofTimeIStartDateTsitionTimeStepPo 241
The following positions are obtained: 242
1 = (2009-09-09T00:00 + ((1-1) * PT4H) = 00:00 + ((0) *4) 243
2 = (2009-09-09T00:00 + ((2-1) * PT4H) = 00:00 + ((1) *4) 244
4 = (2009-09-09T00:00 + ((4-1) * PT4H) = 00:00 + ((3) *4) 245
5 = (2009-09-09T00:00 + ((5-1) * PT4H) = 00:00 + ((4) *4) 246
1) Covering the interval [0h00, 04h00[ with a value of 50MW; 247
2) Covering the interval [4h00, 12h00[ with a value of 100MW; 248
4) Covering the interval [12h00, 16h00[ with a value of 150MW; 249

Page 14 of 21
ENTSO-E AISBL • Avenue de Cortenbergh, 100 • 1000 Brussels • Belgium • Tel +32 2 741 09 50 • Fax +32 2 741 09 51 • [email protected] • www.entsoe.eu
European Network of Transmission System Operators
for Electricity
THE INTRODUCTION OF DIFFERENT TIME SERIES
POSSIBILITIES WITHIN ETSO ELECTRONIC DOCUMENTS
VERSION 1.2
5) Covering the interval [16h00, 24h00[ with a value of 50MW. 250
This induces the following rules: 251
✓ Each position identifies the start of a block; 252
✓ The end of the block is the start of the next block (except for the last one); 253
✓ The last block extends to the end of the TimeInterval; 254
✓ Only positions where a block change occurs are provided; 255
✓ The value of the Qty remains constant within each block; 256
✓ The block represents the start position on the horizontal axe and the quantity on the 257
vertical axe. 258
Page 15 of 21
ENTSO-E AISBL • Avenue de Cortenbergh, 100 • 1000 Brussels • Belgium • Tel +32 2 741 09 50 • Fax +32 2 741 09 51 • [email protected] • www.entsoe.eu
European Network of Transmission System Operators
for Electricity
THE INTRODUCTION OF DIFFERENT TIME SERIES
POSSIBILITIES WITHIN ETSO ELECTRONIC DOCUMENTS
VERSION 1.2
4.4 A04 – OVERLAPPING BREAKPOINT 259
0
50
100
150
2 positions at the same instant
0h 11h 12h 18h 22h 0h
First Period covering first overlap
Position 1
Position 12
Position 13
Position 19
Position 1
Position 5
Position 7
Resolution
Second Period after first overlap
0
50
100
150
2 positions at the same instant
0h 11h 12h 18h 22h 0h
First Period covering first overlap
Position 1
Position 12
Position 13
Position 19
Position 1
Position 5
Position 7
Resolution
Second Period after first overlap
260
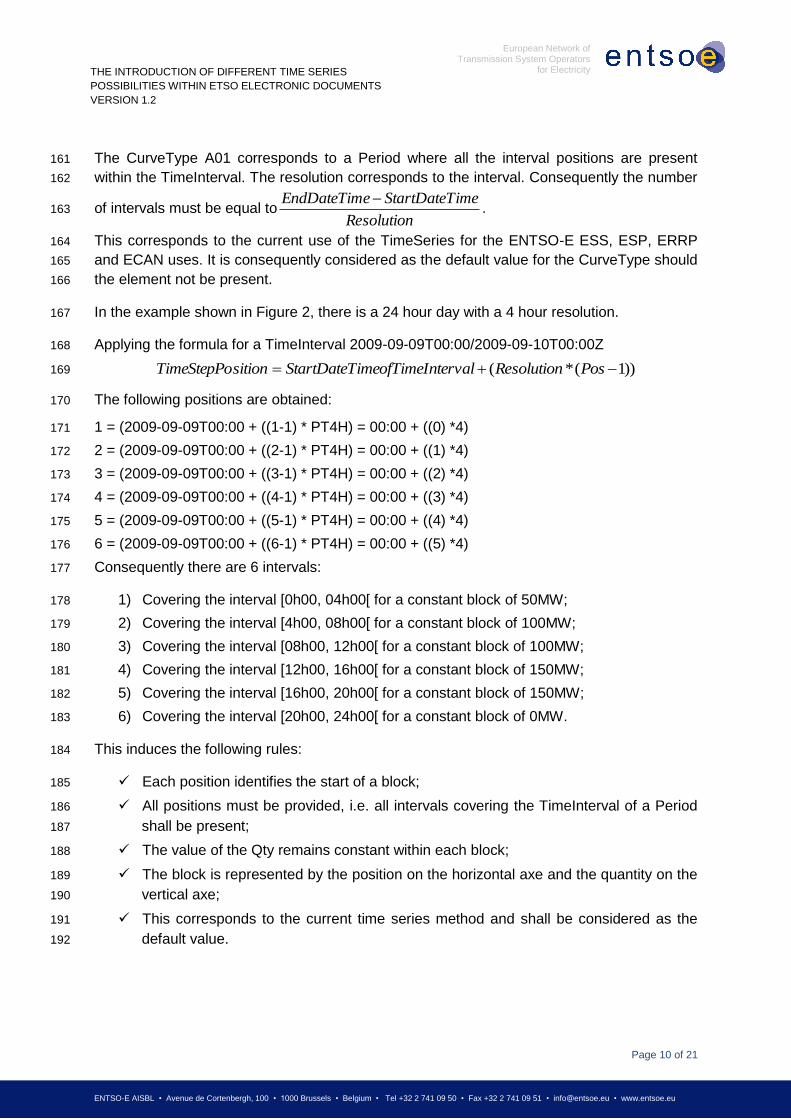
FIGURE 5: OVERLAPPING BREAKPOINTS 261
The CurveType A04 corresponds to the definition of breakpoints which differs from the 262
CurveType A02, “Points”, insofar as there is a direct relation between a point, its predecessor 263
and its successor. 264
Between one point and the next a straight line shall be drawn representing the evolution of 265
the use of a quantity over time. The value of the Qty at instant t evolves linearly with the time 266
within a TimeInterval as follows: 267
startstart
startend
startend QtysitionTimeStepPotsitionTimeStepPositionTimeStepPo
QtyQtytQty +−
−
−= )(*)( 268
where the “start” and “end” index refers respectively to the current Position and to the next 269
Position provided in the Timeseries. This formula is to be applied only for the time inside a 270
given Period (the TimeStepPositionend and the TimeStepPositionstart cannot be the same), 271
overlapping breakpoints are identified by a change of period. 272
Only the points where there is a change in ramp (breakpoint) are provided. 273
The resolution granularity should be equal to the smallest granularity expected. 274
In the example in Figure 5, the initial position of the period is at 00h00 for 50 megawatts. The 275
resolution represents 1 hour. The first breakpoint occurs at 11h00 for 100 megawatts which 276
Page 16 of 21
ENTSO-E AISBL • Avenue de Cortenbergh, 100 • 1000 Brussels • Belgium • Tel +32 2 741 09 50 • Fax +32 2 741 09 51 • [email protected] • www.entsoe.eu
European Network of Transmission System Operators
for Electricity
THE INTRODUCTION OF DIFFERENT TIME SERIES
POSSIBILITIES WITHIN ETSO ELECTRONIC DOCUMENTS
VERSION 1.2
is represented by position 12. This signifies that there is a line drawn between the two points 277
representing a slope going from 50 megawatts to 100 megawatts. There are no positions 278
between the 1st position and the 12th position. The second breakpoint occurs at 12h00 279
(position 13) with a change to 150 megawatts. The third breakpoint occurs at 18h00 280
(occurrence of an overlap for this time, position 19 of the first Series_Period class) with a 281
change to 100 megawatts. There immediately follows at 18h00 (the second occurrence for 282
this time, position 1 of the following Series_Period class) a reduction down to 0 megawatts. 283
The next breakpoint occurs at 22h00 (position 5 of the second Series_Period class) with the 284
start of an increase in quantity. The last breakpoint occurs at 24h00 (position 7 of the second 285
Series_Period class) where at the end of the period the quantity has moved to 50 286
megawatts. 287
Applying the formula for the first TimeInterval 2009-09-09T00:00/2009-09-10T18:00Z and 288
assuming a resolution of 1 hour. 289
))1(*( −+= PossolutionRentervalimeofTimeIStartDateTsitionTimeStepPo 290
The following positions are obtained: 291
1 = (2009-09-09T00:00 + ((1-1) * PT1H) = 00:00 + ((0) *1) 292
12 = (2009-09-09T00:00 + ((12-1) * PT1H) = 00:00 + ((11) *1) 293
13 = (2009-09-09T00:00 + ((13-1) * PT1H) = 00:00 + ((12) *1) 294
19 = (2009-09-09T00:00 + ((19-1) * PT1H) = 00:00 + ((18) *1) 295
1) At 0h00 the value is 50MW; 296
12) At 11h00 the value is 100MW (indicating that between 00:00 and 11:00 there is an 297
increasing value going from 50 to 100MW); 298
13) At 12h00 the value is 150MW (indicating that between 11:00 and 12:00 there is an 299
increasing value going from 100 to 150MW); 300
19) At 18h00 the value is 100MW (indicating that between 12:00 and 18:00 there is a 301
decreasing value going from 150 to 100MW); 302
Applying the formula for the second TimeInterval 2009-09-09T18:00/2009-09-10T00:00Z and 303
assuming a resolution of 1 hour. 304
))1(*( −+= PossolutionRentervalimeofTimeIStartDateTsitionTimeStepPo 305
The following positions are obtained: 306
1 = (2009-09-18T00:00 + ((1-1) * PT1H) = 18:00 + ((0) *1) 307
5 = (2009-09-18T00:00 + ((5-1) * PT1H) = 18:00 + ((4) *1) 308
7 = (2009-09-18T00:00 + ((7-1) * PT1H) = 18:00 + ((6) *1) 309
1) At 18h00 the value is 0MW; the change of period indicates that there is an overlap 310
and that the last value of the previous period provides indication on the ramp; 311
5) At 22h00 the value is 0MW (indicating that between 18h00 and 22:00 the value 312
remained at 0MW); 313
7) At 00h00 the value is 50MW (indicating that between 22:00 and 00:00 there is an 314
increasing value going from 0 to 50MW); 315
316

Page 17 of 21
ENTSO-E AISBL • Avenue de Cortenbergh, 100 • 1000 Brussels • Belgium • Tel +32 2 741 09 50 • Fax +32 2 741 09 51 • [email protected] • www.entsoe.eu
European Network of Transmission System Operators
for Electricity
THE INTRODUCTION OF DIFFERENT TIME SERIES
POSSIBILITIES WITHIN ETSO ELECTRONIC DOCUMENTS
VERSION 1.2
This induces the following rules: 317
✓ Each position identifies a breakpoint; 318
✓ Each breakpoint is tied to the next breakpoint with a straight line; 319
✓ Only positions where a breakpoint occurs are provided; 320
✓ The breakpoint is represented by time on the horizontal axe and the quantity on the 321
vertical axe; 322
✓ When there are overlapping breakpoint, consecutive Series_Period classes must be 323
used and the end date and time of the first period must equal the start date and time 324
of the following overlapping period; 325
✓ For each TimeInterval, the position value of the EndDateTime shall be provided, i.e. 326
the time interval includes the end date and time. 327

Page 18 of 21
ENTSO-E AISBL • Avenue de Cortenbergh, 100 • 1000 Brussels • Belgium • Tel +32 2 741 09 50 • Fax +32 2 741 09 51 • [email protected] • www.entsoe.eu
European Network of Transmission System Operators
for Electricity
THE INTRODUCTION OF DIFFERENT TIME SERIES
POSSIBILITIES WITHIN ETSO ELECTRONIC DOCUMENTS
VERSION 1.2
4.5 A05 – NON-OVERLAPPING BREAKPOINT 328
Period covered (end excluded)
Resolution
0h 4h 8h 12h 16h 20h0
50
100
150
24h
Position 1Position 2
Position 4
Position 5
Position 6
Position 7
Same as preceding value
329
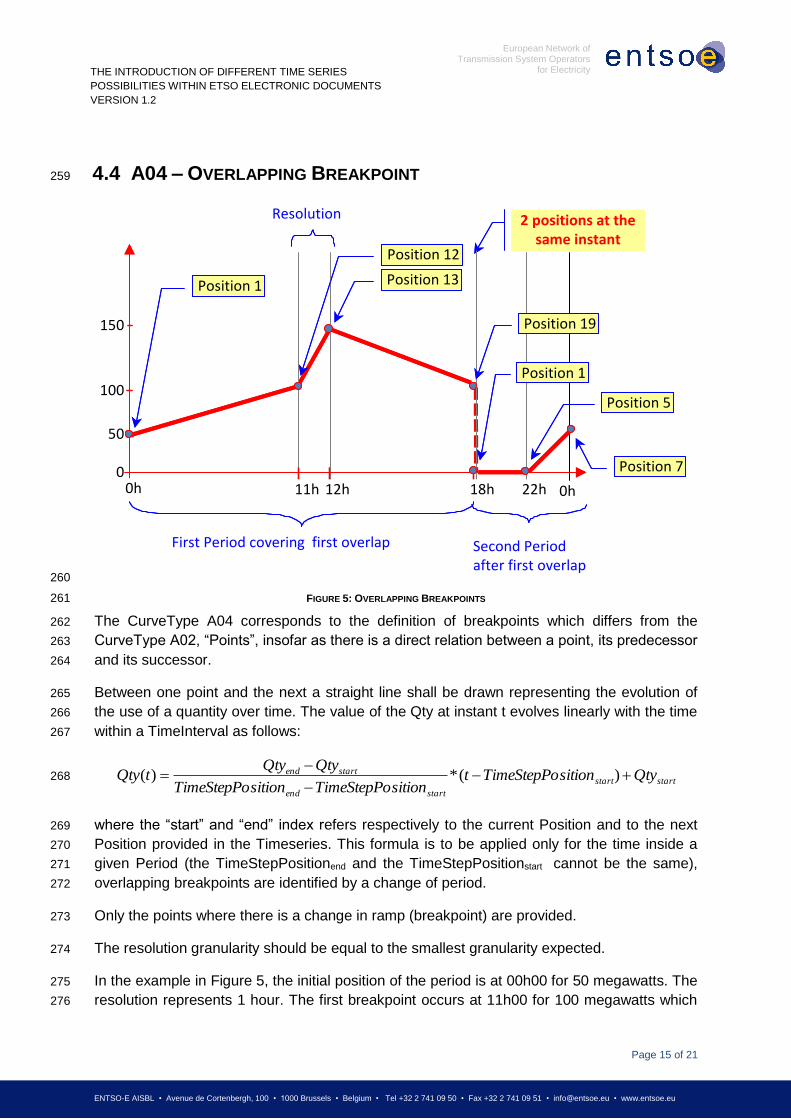
FIGURE 6: NON-OVERLAPPING BREAKPOINTS 330
The CurveType A05 corresponds to a Period where only the breakpoint positions are 331
present. Only the points representing a power value level change are present within Interval 332
for the Period. Each Breakpoint marks the end of the previous breakpoint. The resolution 333
corresponds to the smallest interval where a power level change may occur. This is a similar 334
curve type to the CurveType A04 except that overlapping breakpoints are not allowed. 335
The value of the Qty at instant t evolves linearly with the time as follows: 336
startstart
startend
startend QtysitionTimeStepPotsitionTimeStepPositionTimeStepPo
QtyQtytQty +−
−
−= )(*)( 337
where the “start” and “end” index refers respectively to the current Position and to the next 338
Position provided in the Timeseries. The TimeStepPositionend of a TimeInterval and the 339
TimeStepPositionstart of a TimeInterval cannot be the same. 340
Applying the formula for a TimeInterval 2009-09-09T00:00/2009-09-10T00:00Z and 341
assuming a resolution of 4 hours. 342
))1(*( −+= PossolutionRentervalimeofTimeIStartDateTsitionTimeStepPo 343
The following positions are obtained: 344
1 = (2009-09-09T00:00 + ((1-1) * PT4H) = 00:00 + ((0) *4) 345
2 = (2009-09-09T00:00 + ((2-1) * PT4H) = 00:00 + ((1) *4) 346
4 = (2009-09-09T00:00 + ((4-1) * PT4H) = 00:00 + ((3) *4) 347

Page 19 of 21
ENTSO-E AISBL • Avenue de Cortenbergh, 100 • 1000 Brussels • Belgium • Tel +32 2 741 09 50 • Fax +32 2 741 09 51 • [email protected] • www.entsoe.eu
European Network of Transmission System Operators
for Electricity
THE INTRODUCTION OF DIFFERENT TIME SERIES
POSSIBILITIES WITHIN ETSO ELECTRONIC DOCUMENTS
VERSION 1.2
5 = (2009-09-09T00:00 + ((5-1) * PT4H) = 00:00 + ((4) *4) 348
6 = (2009-09-09T00:00 + ((6-1) * PT4H) = 00:00 + ((5) *4) 349
7 = (2009-09-09T00:00 + ((7-1) * PT4H) = 00:00 + ((6) *4) 350
1) At 0h00 the value is 50MW; 351
2) At 04h00 the value is 100MW (indicating that between 00:00 and 04:00 there is an 352
increasing value going from 50 to 100MW); 353
4) At 12h00 the value is 100MW (indicating that between 04:00 and 12:00 the value is 354
stable at 100MW); 355
5) At 16h00 the value is 150MW (indicating that between 12:00 and 16:00 there is an 356
increasing value going from 100 to 150MW); 357
6) At 20h00 the value is 150MW (indicating that between 16h00 and 20:00 the value is 358
stable at 150MW); 359
7) At 24h00 the value is 0MW (indicating that between 20h00 and 00:00 there is a 360
decreasing value going from 150 to 0MW); 361
This induces the following rules: 362
✓ Each position identifies a breakpoint; 363
✓ Each breakpoint is related to the next with a straight line; 364
✓ Only positions where a breakpoint occurs are provided; 365
✓ The point is represented by time on the horizontal axe and the quantity on the vertical 366
axe; 367
✓ The position value of the EndDateTime shall be provided, i.e. the time interval 368
includes the end date and time. 369

Page 20 of 21
ENTSO-E AISBL • Avenue de Cortenbergh, 100 • 1000 Brussels • Belgium • Tel +32 2 741 09 50 • Fax +32 2 741 09 51 • [email protected] • www.entsoe.eu
European Network of Transmission System Operators
for Electricity
THE INTRODUCTION OF DIFFERENT TIME SERIES
POSSIBILITIES WITHIN ETSO ELECTRONIC DOCUMENTS
VERSION 1.2
5 THE HANDLING OF GAPS 370
Gaps represent a period in time where no information of the time variable Qty is sent. The 371
exact meaning, in physical terms, of this lack of information depends upon the rules agreed 372
for the business process where the time variable is used. In particular it must not be 373
assumed, unless specifically agreed, that the lack of information is equivalent to assign the 374
value "zero" to the Qty element. 375
It can concern only certain CurveTypes, i.e. A03, A04 and A05. 376
Gap shall not be used with CurveType A01 in order to ensure compatibility with the previous 377
implementation. 378
When using CurveType A02, only the positions having values are provided, thus implicitly 379
gaps are managed. 380
A gap is represented by the presence of at least two disjoint Series_Period classes within a 381
given time series, i.e. the end date and time of the first period is different from the start date 382
and time of the following period. The end date and time of the Period shall be considered as 383
the start date and time for the gap and the start date and time of the following Period shall be 384
considered as the end date and time for the gap. 385
386
FIGURE 7: TIMESERIES GAP EXAMPLE 387
In the example in Figure 7, it can be seen that the first Period goes from 22h00 on the 7th of 388
July to 10h00 on the 8th of July. The second Period goes from 12h00 on the 8th of July to 389
22h00 on the 8th of July. Consequently it can be seen that the gap goes from 10h00 on the 390
8th of July to 12h00 on the 8th of July. 391
The gap itself therefore can be expressed as 2009-07-08T10:00Z/2009-07-08T12:00Z. 392
During the whole of this Period no information is being provided. 393

Page 21 of 21
ENTSO-E AISBL • Avenue de Cortenbergh, 100 • 1000 Brussels • Belgium • Tel +32 2 741 09 50 • Fax +32 2 741 09 51 • [email protected] • www.entsoe.eu
European Network of Transmission System Operators
for Electricity
THE INTRODUCTION OF DIFFERENT TIME SERIES
POSSIBILITIES WITHIN ETSO ELECTRONIC DOCUMENTS
VERSION 1.2
In addition, hereafter is included an example with gap and overlapping points using the 394
CurveType A04: 395
t0 t1 t2 t3 t4 t5 t6 t7 t8 t9 t10 t11
50
100
150
200
t0 t1 t2 t3 t4 t5 t6 t7 t8 t9 t10 t11
50
100
150
200
396
FIGURE 8: TIMESERIES GAP AND OVERLAP EXAMPLE 397
TimeSerie with CurveType “A04”• TimeInterval [t0, t3[
– Pos 1: 100
– Pos 2: 50
– Pos 3: 50
– Pos 4: 150
• TimeInterval [t3, t4[– Pos 1: 50
– Pos 2: 50
• TimeInterval [t6, t9[– Pos 1: 150
– Pos 2: 100
– Pos 4: 100
• TimeInterval [t9, t11+1[– Pos 1: 50
– Pos 2: 100
– Pos 3: 100
Intervals with (end) = (start)
thus overlap
Intervals with (end) = (start)
thus overlap
Intervals with (end) # (start)
thus gap
398
FIGURE 9: TIMESERIES GAP AND OVERLAP DESCRIPTION 399
Related Documents


