Climate smart cattle farming – management and systems aspects Troels Kristensen & Lisbeth Mogensen Aarhus University Department of agroecology Denmark EAAP 2015 – Session 01 Monday

Welcome message from author
This document is posted to help you gain knowledge. Please leave a comment to let me know what you think about it! Share it to your friends and learn new things together.
Transcript
Climate smart cattle farming – management and systems aspects
Troels Kristensen & Lisbeth Mogensen Aarhus University Department of agroecology Denmark
EAAP 2015 – Session 01 Monday

Content Introduction - What is the problem? - Climate smart – how to measure?
Emission from dairy and beef cattle Dairy cattle - Historic development - Mitigation through productivity and technologies
Beef cattle - Different systems Conclusions

Climate smart cattle farming – why it is an issue
1: Livestock responsible for about 18 % of total global emission
2: Cattle responsible for 65 % of total emission from livestock 3: Global demand for livestock based food will increase by up to 50%

Meat
CheeseEggMilk
Vegetables
Fruit
Bread and
cereals
Fat
Sugar
DrinksMeat
Cheese
Eggs
Milk
Vegetables
Fruit
Bread,
grain
Fats
Sugar and
sweets
Drinks
Sources of energy in a Danish person’s food (% of total MJ)
Carbon footprint of a Danish person’s food (% of CO2 eq)
Animal products in the diet contributes more to global warming than to calories
Hermansen & Olesen, 2009

Climate smart – how to measure?
System definition Animal level Farm level Consumer level
Unit Per livestock unit Per kg product Per MJ energi Per kg protein Per intake Per area used
Method LCA National
Allocation Economic Mass Biological

Illustration of a dairy system – input and output and important internal flows used in a LCA approach
A. Flysjö et al. / Agricultural Systems 104 (2011) 459–469

Emission from livestock (EU 27) – which sources are important
CO2 e. per kg 1.3 22.6 3.5 1.6 1.7

Dairy production – emissions in the supply chain
The 3 big ones
Farm level Consumer level
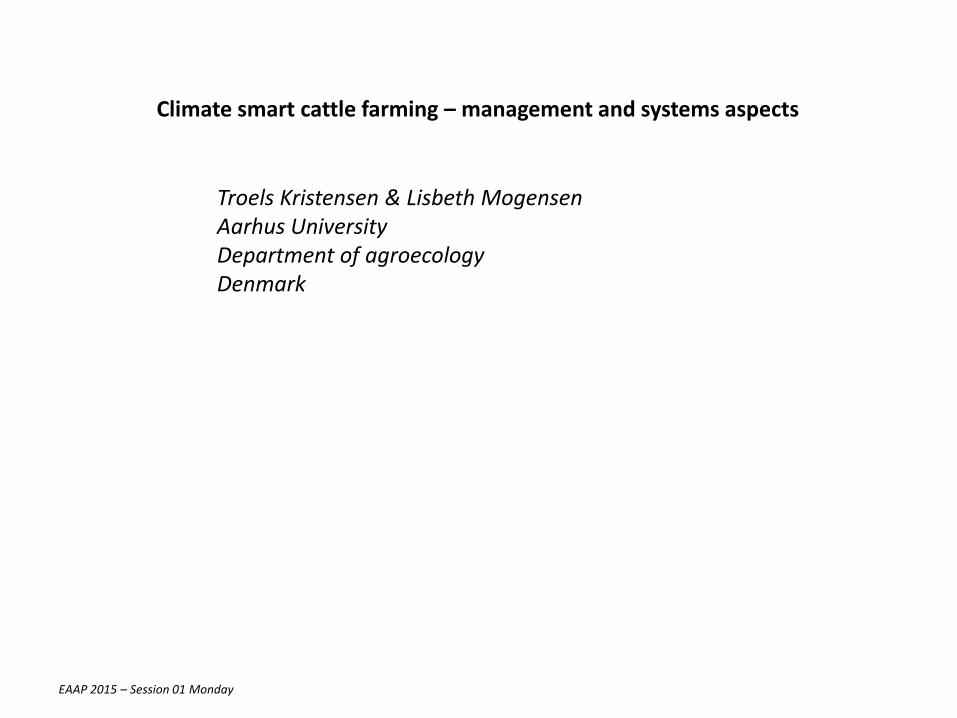
Three big ones – combined effect on GHG, two examples
A: Increased feed efficiency - Less emission crop production - Less emission enteric - Less emission from manure
B: Increased concentrate - More emission from crop production - Less emission from enteric - More emission from manure
Large effect on emission Low or even negative effect on emission

The three big ones – relative emissions dairy, veal and beef cattle production
Mogensen et al., 2015
33%
55%
12%
57%
22%
21%
Dairy Veal Beef cattle
17%
55%
28%
feedproduction
feed digestion
manuremanagement

Dairy production GHG from cow, heifer and bulls Historic perspective
Effect of productivity
Effect of technology
Effect of system
Effect of management

Emissions from each group of animals and breed DK standard herd data
Riva et al. 2013
0
1000
2000
3000
4000
5000
6000
7000
8000
cows heifers males cows heifers
Holstein Jersey
CO2 eq, kg per aimal
Straw
N2O - Indirect
N2O - Direct
CH4 - Manure
CH4 - Enteric
Feed
CO2 eq, % of herd 67 24 9 75 25 CO2 eq. per kg ECM 0.82 0.86 CO2 eq. per kg LWG 6.83 5,08

Typical dairy farms 1920 – representing local production and marketing 1950 – representing the period with emerging mechanization and introduction of new technologies and a more global marked 1980 – representing a period with heavily use of external resources like fertilizer and protein 2010 – today with focus on balancing production and risk of environmental damage.
Kristensen et al. 2015

Year 1920 1950 1980 2010
Yield, kg ECM / cow / year 1804 3435 5058 8994
Meat, kg / 1000 kg ECM 42 29 46 23
Fertilizer, kg N / ha 5 22 129 74
Protein, g crude protein / kg DM 142 137 180 157
Feed efficiency, kg ECM / kg DMI 0.39 0.62 0.62 0.90
Total emission, kg CO2 eq. 4392 5088 9830 10761
Per kg ECM 2.43 1.48 1.94 1.20
Allocation
Per kg ECM 1.27 0.92 1.02 0.81
Per kg meat 25 18 20 16
Dairy - historical development Key figures typical dairy farms 1920 – 2010 in Denmark.
Kristensen et al., 2015

0%
10%
20%
30%
40%
50%
60%
70%
1920 1950 1980 2010
CO2 eq., %
CH4 enteric
CH4 manure
N2O
Import feed & fertilizer
Import fossil energy
Sources to emission in the dairy system ab farm

Herd production in 2040 ????
Kristensen & Weisbjerg, 2015
Optimistic = reality?? - Genomic selection - Feed ration evaluation - Cow specific information - Housing facilities - Health management
0
2000
4000
6000
8000
10000
12000
14000
16000
Milk, kg per cow per year
optimistic (170kg per year)
conservative(100 kg / year)
realized
Milk recording Holstein in Denmark 1950-2010
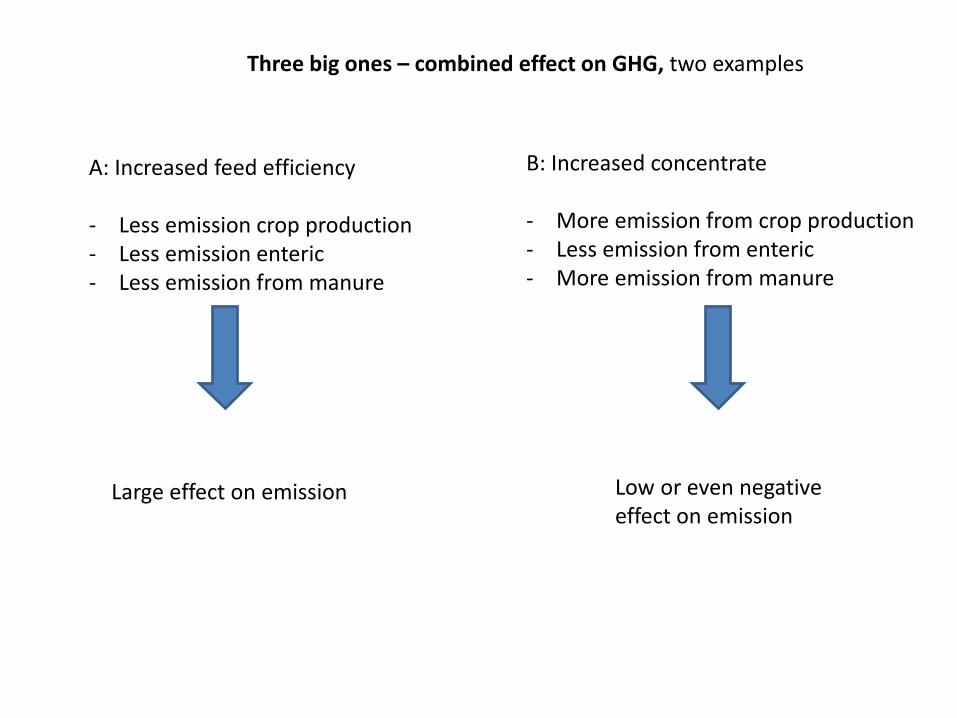
1) 3 %-units
Emission in 2040 – different scenarios
Present (2010)
I: Conservative
II: Optimist
III: II + High herd efficiency 1)
IV: III + increased crop production (20%)
Year 2010 2040
Yield per cow 9000 12500 14500 14500 14500
Efficiency - ECM / DMI (herd)
0.89 1.09 1.18 1.21 1.21
Stocking rate, kg ECM / ha (farm)
7372 8781 9494 9705 11630
CO2 eq. per kg ECM (no allocation)
1.20 1.01 0.94 0.92 0.87

Potential reduction in GHG per kg milk in 2040 compared to 2010 Dairy productivity and different technologies
0 5 10 15 20 25 30
12500 kg ECM
14500 kg ECM
14500 + eff
14500 + crop
feeding
genetic
biogas
manure
pro
du
ctio
nte
chn
olo
gie
s
Reduction in GHG, % of 2010

More milk – less meat effect on GHG
Present (2010)
I: Conservative
II: Optimist
Year 2010 2040
Yield per cow 9000 12500 14500
Meat per 1000 kg ECM 23.4 16.4 14.1
Beef from suckler cows, kg 0 7.0 9.3
CO2 from suckler cows (22 kg
CO2 / kg meat)
0 160 213
CO2 eq. per kg 1000 kg ECM and 23.4 kg beef
1200 1170 1153

Potential reduction in GHG per kg milk in 2040 compared to 2010 Dairy productivity, beef balance and different technologies
0 5 10 15 20 25 30
12500 kg ECM
14500 kg ECM
14500 + eff
14500 + crop
feeding
genetic
biogas
manurep
rod
uct
ion
tech
no
logi
es
Reduction in GHG, % of 2010
beef balance
dairy

Pasture (New Zealand – 4100 kg ECM) vs confinement (Sweden – 8800 kg ECM)
A. Flysjö et al. / Agricultural Systems 104 (2011) 459–469
Total CO2 eq NZ 1.00 S 1.16
ECM / DMI NZ: 0.87 S: 1.01

Production system
Conventional Organic
Emission, kg CO2 eq. / kg ECM 1.20 1.27
- farm level, % 88 98
Milk, kg ECM per cow 8201 7175
Feed efficiency (herd), ECM / DMI 0.95 0.82
Fertilizer, kg N per ha 68 0
Manure, kg N per ha 168 130
Landuse, m2 per kg ECM 1.78 2.37
(Kristensen et al, 2011)
Organic vs. conventional dairy production (data from 67 farms, Denmark, year 2001-2003 )

Variation in CF of milk explained by different farming strategies
Kristensen et al, 2011
27%
17%
7%5%4%
40%
Herd efficiency
Farming intensity
N yield crop
Grassland
Combined milk and meat
Not accounted for
Farming strategy

Mitigations options
B: Longevity – lower replacement + Sexed semen
+ Extended lactation
A: Increased feed efficiency More milk per DMI (herd)
C: Higher milk yield
D: High proportion of home grown feed
Herd level Farm level
E: Higher proportion of grassland
F: Increased manure utilization
Will we be able to move dairy
production in these
direction???

Beef and landuse

Land use per kg protein, m²
Westhoek et al 2011

Danish beef production
Suckler system Dairy system
Type Age at slaughter
Extensive Intensive Steer 25 m
Bull 11 m
Bull 9 m
Daily gain (male) g/day
600 1300 750 1280 1320
Feed use (herd) Kg DM/kg gain
15.8 11.5 7.3 4.7 4.3
Roughage, % of DMI
97 85 88 9 10
Carbon footprint Kg CO2 eq, kg carcass
30.7 22.9 16.8 9.0 8.9
Landuse, m2 per kg - Rotation
14.2 19.7 17.3 11.5 10.3
- Permanent 141 26.4 0 0 0
Mogensen et al., 2015

growth-enhancing technology yes no no Feed intake 5.4 6.7 10.6 kg DM / kg gain Emission, GHG 16.0 18.8 26.8 kg CO2 eq. / kg carcass
Feedlot – with or without growth enhancing technology and grassland based beef production in US – Capper, 2012. Animals

Effect of feed efficiency on GHG per kg product (beef) – three studies
0
5
10
15
20
25
30
35
40
0 5 10 15 20
GHG, CO2 eq. per kg carcass
Feed use, kg DMI / kg LWG
DK-S
EU
US

Conclusions A: No production system or type of management is superior B: Climate smart production has to look for - High feed efficiency (herd or chain level)
- Reduced manure N output
- Increased use of low emission feed (grass, byproducts)
- A system approach to include all inputs and outputs and internal relations at farm level

Hristov, A.N., Oh, J., Lee, C., Meinen, R., Montes, F., Ott, T., Firkins, J., Rotz, A., Dell, C., Adesogan, A., Yang, W., Tricarico, J., Kebreab, E., Waghorn, G., Dijkstra, J. & Oosting, S. 2013. Mitigation of greenhouse gas emissions in livestock production – A review of technical options for non-CO2 emissions. Edited by Pierre J. Gerber, Benjamin Henderson and Harinder P.S. Makkar. FAO Animal Production and Health Paper No. 177. FAO, Rome, Italy.
Thank you for your attention
Hristov et al. 2013
Related Documents