Journal of Trust Management Sänger and Pernul Journal of Trust Management (2016) 3:5 DOI 10.1186/s40493-016-0026-8 RESEARCH Open Access TRIVIA: visualizing reputation profiles to detect malicious sellers in electronic marketplaces Johannes Sänger * and Günther Pernul *Correspondence: [email protected] regensburg.de Department of Information Systems, University of Regensburg, Universitätsstraße 31, 93047 Regensburg, Germany Abstract Reputation systems are an essential part of electronic marketplaces that provide a valuable method to identify honest sellers and punish malicious actors. Due to the continuous improvement of the computation models applied, advanced reputation systems have become non-transparent and incomprehensible to the end-user. As a consequence, users become skeptical and lose their trust toward the reputation system. In this work, we are taking a step to increase the transparency of reputation systems by means of providing interactive visual representations of seller reputation profiles. We thereto propose TRIVIA - a visual analytics tool to evaluate seller reputation. Besides enhancing transparency, our results show that through incorporating the visual-cognitive capabilities of a human analyst and the computing power of a machine in TRIVIA, malicious sellers can be reliably identified. In this way we provide a new perspective on how the problem of robustness could be addressed. Keywords: Reputation systems, Robustness, Attacks, Visual analytics Introduction Trust is an important mechanism to reduce risk perception and has therefore been identi- fied to be a key factor for the success of electronic marketplaces [1]. As such environments usually involve strangers whose trustworthiness is unknown, reputation systems have become an integral part providing a valuable method to identify honest sellers and pun- ish malicious actors. Typically, transaction partners are encouraged to leave feedback (numerical ratings or textual reviews) after each transaction denoting their satisfaction. Reputation systems collect all evidence, aggregate the referrals and give an overview of past behavior in a reputation profile. In a recent study, Diekmann et al. [2] could show that sellers with better reputation have an increased number of sales and obtain higher prices. Thus, reputation systems not only support buyers in deciding whom to trust, but also encourage trustworthy participation. However, these reputational incentives do not always lead to honest behavior. One rea- son in focus of this work are multiple vulnerabilities current reputation systems suffer from. Malicious sellers who exploit the weaknesses can perform effective cheating such as providing unfair ratings or taking advantage of missing context data. Considering these © The Author(s). 2016 Open Access This article is distributed under the terms of the Creative Commons Attribution 4.0 International License (http://creativecommons.org/licenses/by/4.0/), which permits unrestricted use, distribution, and reproduction in any medium, provided you give appropriate credit to the original author(s) and the source, provide a link to the Creative Commons license, and indicate if changes were made.

Welcome message from author
This document is posted to help you gain knowledge. Please leave a comment to let me know what you think about it! Share it to your friends and learn new things together.
Transcript

Journal of Trust ManagementSänger and Pernul Journal of Trust Management (2016) 3:5 DOI 10.1186/s40493-016-0026-8
RESEARCH Open Access
TRIVIA: visualizing reputation profiles todetect malicious sellers in electronicmarketplacesJohannes Sänger* and Günther Pernul
*Correspondence:[email protected] of InformationSystems, University of Regensburg,Universitätsstraße 31, 93047Regensburg, Germany
Abstract
Reputation systems are an essential part of electronic marketplaces that provide avaluable method to identify honest sellers and punish malicious actors. Due to thecontinuous improvement of the computation models applied, advanced reputationsystems have become non-transparent and incomprehensible to the end-user. As aconsequence, users become skeptical and lose their trust toward the reputationsystem. In this work, we are taking a step to increase the transparency of reputationsystems by means of providing interactive visual representations of seller reputationprofiles. We thereto propose TRIVIA - a visual analytics tool to evaluate seller reputation.Besides enhancing transparency, our results show that through incorporating thevisual-cognitive capabilities of a human analyst and the computing power of amachine in TRIVIA, malicious sellers can be reliably identified. In this way we provide anew perspective on how the problem of robustness could be addressed.
Keywords: Reputation systems, Robustness, Attacks, Visual analytics
IntroductionTrust is an important mechanism to reduce risk perception and has therefore been identi-fied to be a key factor for the success of electronic marketplaces [1]. As such environmentsusually involve strangers whose trustworthiness is unknown, reputation systems havebecome an integral part providing a valuable method to identify honest sellers and pun-ish malicious actors. Typically, transaction partners are encouraged to leave feedback(numerical ratings or textual reviews) after each transaction denoting their satisfaction.Reputation systems collect all evidence, aggregate the referrals and give an overview ofpast behavior in a reputation profile. In a recent study, Diekmann et al. [2] could showthat sellers with better reputation have an increased number of sales and obtain higherprices. Thus, reputation systems not only support buyers in deciding whom to trust, butalso encourage trustworthy participation.However, these reputational incentives do not always lead to honest behavior. One rea-
son in focus of this work are multiple vulnerabilities current reputation systems sufferfrom. Malicious sellers who exploit the weaknesses can perform effective cheating suchas providing unfair ratings or taking advantage of missing context data. Considering these
© The Author(s). 2016 Open Access This article is distributed under the terms of the Creative Commons Attribution 4.0International License (http://creativecommons.org/licenses/by/4.0/), which permits unrestricted use, distribution, andreproduction in any medium, provided you give appropriate credit to the original author(s) and the source, provide a link to theCreative Commons license, and indicate if changes were made.
Sänger and Pernul Journal of Trust Management (2016) 3:5 Page 2 of 22
security gaps, cheating is much more profitable than acting honest [3]. For that reason,the security and robustness of reputation system has become a strongly discussed topicthat many works focus on [3–7].
The red queen and the increasing non-transparency
In 1973, Leigh van Valen proposed the Red Queen Hypothesis denoting the idea of aconstant arms race between co-evolving species [8]. He argued that an organism mustconstantly adapt and evolve to survive in an ever changing environment. This phe-nomenon’s name was derived from Lewis Carroll’s “Through the Looking-Glass” [9]where the Red Queen tells Alice that “It takes all the running you can do to keep in place!”.This effect can also be noticed in IT security. Security systems in general or trust and
reputation systems in specific must constantly adapt themselves to get at the threatsarising from the changing environment. While most early reputation systems could beeasily manipulated, current systems have been gradually improved to cope with a varietyof attacks. As a consequence of this constant improvement, reputation systems (partic-ularly in research) have become quite sophisticated. Especially statistical solutions andmachine learning solutions are highly complex. These advanced computation methods,however, are non-transparent and incomprehensible to the end-user as a recent studycould demonstrate [10]. A numerical value as only outcome of the reputation assessmentdoes in fact not reveal many details about the content of the input data (which reviewswere considered, which not? To what extent do they affect the final reputation value?).Particularly, if the computation process is not replicable, many users become skeptical.Higher transparency could therefore notably increase the user experience as well as theusers’ trust toward the reputation system.
Approach andmethodology
In this work, we are taking a step to enhance transparency of reputation systems andinvolve the user in the computation process by providing an interactive visual representa-tion of seller reputation profiles. For this reason, we make use of visual analytics [11]. Wedevelop different techniques to visually detect malicious sellers. As the robustness againstattacks plays an important role in the trust management research community, this workprovides a promising perspective on an alternative approach of how this problem couldbe addressed.The remainder of this paper is organized as follows: first, we describe the research back-
ground and the related work relevant with respect to our approach (“Section Backgroundand related work”). We thereby identify the challenges and motivate our work. Atthe same time, the research gap and objectives are clarified. In the following “SectionPreliminary considerations for designing TRIVIA”, we discuss preliminary considerationsfor designing TRIVIA (Trust and ReputatIon VIsual Analytics) - a visual analytics cockpitto depict seller reputation profiles. Here, we introduce a range of visualization and inter-action techniques suitable for reputation data. Based on this, we propose the conceptionaldesign of TRIVIA and describe how this concept was implemented in a software tool in“Section TRIVIA: a visual analytics tool to detect malicious sellers in electronic market-places”. To demonstrate the proper functioning of TRIVIA, we provide three case studiesin which the interactive visualization of a seller profile is used to detect malicious behav-ior (“Section Case studies”). We set up a test-bed and simulated different seller attacks.

Sänger and Pernul Journal of Trust Management (2016) 3:5 Page 3 of 22
Results show that using TRIVIA, all simulated attacks can be reliably and transparentlyidentified. Finally, we discuss the benefits and shortcomings of our approach, sum up ourfindings and provide our plans for future work in “Section Discussion and conclusion”.
Background and related workOnline trust and reputation systems
The literature on online trust and reputation systems (TRS) has been growing rapidlywithin the last two decades. Since the early work of Stephen Marsh [12] on the formal-ization of trust as a computational concept and the paper of Resnick et al. [13] on the useof reputation systems to facilitate trust in internet transactions, lots of works have beenpublished in this context.Although the computation models have notably changed since, the generic process
of reputation systems stayed the same. According to [14], it can be divided into threephases, namely “collection”, “computation” and “presentation” as depicted on Fig. 1. In thefirst phase, the reputation system gathers evidence about the past behavior of a trusteeand prepares it for subsequent computing. While personal experience is the most reli-able source of evidence, it is usually not sufficiently available. Thus, data from otheractors needs to be collected. In the computation phase the collected evidence is filtered,weighted and aggregated to calculate a single or several reputation values. The computa-tion is considered being the heart of the reputation system. The output values are finallypresented in a reputation profile in the third phase.Most of the work proposed in the last years focuses on the improvement of the compu-
tation phase. The primary objective is to increase the robustness and accuracy of existingapproaches by introducing novel methods to filter, weight or aggregate referrals. Only lit-tle research has been carried out regarding the presentation of reputation profiles. Theoutput of most reputation systems is still a numerical value. Obviously, a numerical valueas sole output cannot convey any information about the input data (e.g. which reviewswere used? How do single reviews affect the final value?), thus leading to a cognitive gap.Hammer et al. [10] conducted a user-centric study of reputation metrics in which theyshow that more than half of the participants criticized the lack of transparency. Marshet al. [15] also criticized the resulting complexity in a recent article: “There is a notice-able trend to more and more complex models, using deeper mathematical techniques and
Fig. 1 Generic process of a reputation system (Compared to [14] the naming of the phases has been slightlyadapted)
Sänger and Pernul Journal of Trust Management (2016) 3:5 Page 4 of 22
constructs [...] the increasing complexity of the models does not advance the field or itsunderstanding or applicability in systems where it can be at its best”.In this work, we try to take another path by not developing an even more sophisticated
computation model, but by enhancing the presentation of reputation profiles. In order toincrease the overall transparency we involve the user in the evaluation process and let theuser detect coherence and reveal attacks. Through his continuously increasing experienceand cognitive capabilities, a human analyst might have an advantage over analyses carriedout by machines only. Marsh et al. [15] even argue that “Humans, however, are muchbetter at spotting anomalies in trust reasoning and reputation”. Nevertheless, the supportthrough automated computer analyses will be indispensable. For that purpose, we makeuse of a field that has emerged in the recent years called visual analytics.
Visual analytics
Visual Analytics (VA) is an interdisciplinary, fast-growing research area combiningautomated analysis techniques with interactive visualizations. Incorporating the visual-cognitive capabilities of a human analyst and the computing power of a machine, aneffective understanding, reasoning and decision making is achieved [11].Thus far, VA has not played a role in trust and reputation except two works that address
the interactive visual detection of context-based attacks on reputation systems [16] as wellas unfair ratings [17]. Approaches making use of visual representations only created staticvisualizations of relationship graphs or reputation scores [18, 19]. Further work regardingthe visual communicating of information trustworthiness and quality was proposed byNurse et al. [20].Besides enhanced transparency, we think that advanced presentation might also
increase the robustness by clearly depicting the underlying evidence and involving theuser in the evaluation process. To elaborate on this idea, we need to take a look at attacksand robustness of reputation systems first.
Attacks and robustness of reputation systems
Common vulnerabilities of reputation systems as well as attacks to exploit these weak-nesses have been identified and analyzed in multiple works. Most early papers onthis topic introduced single attacks or vulnerabilities and at the same time proposedmechanisms to cope with those problems. Dellarocas [4], for instance, analyzed unfairratings by buyers such as unfairly high ratings (“ballot stuffing”) and unfairly low ratings(“bad-mouthing”) as well as discriminatory seller behavior. He furthermore introducedtechniques to reduce the effects of these attacks on reputation values and thus increasedthe robustness of reputation systems towards these attacks.More detailed surveys of attacks and extensive studies on the robustness of common
reputation systems are still young. One important work that analyzed the vulnerabilitiesof reputation systems in electronic marketplaces was proposed by Kerr and Cohen [21].They identified several problems of the eBay reputation system such as value imbalance,reputation lag and re-entry. Based on these findings, they later derived a list of attackson reputation systems in electronic marketplaces [3]. They could show that all theseattacks and their combinations are very practical since every system tested was vulnerableto multiple attacks. In their scenario, cheating was much more profitable than honesty.Later, Jøsang and Goldbeck [5] revealed further seller attacks that had been described in

Sänger and Pernul Journal of Trust Management (2016) 3:5 Page 5 of 22
literature and summarized all misbehavior of advisors (the party providing a rating) to anunfair rating attack. Additionally, they discussed the practical robustness of current repu-tation systems arguing that it is also important to consider the ease and complexity of anattack’s implementation since the identified attacks only give a theoretical perspective.A recent work of Zhang et al. [6] elaborated on the term of unfair ratings as a catchall
phrase for advisor misbehavior. They could identify seven classes of advisor attacks andevaluated the robustness of the existing trust models for handling unfair ratings. Equallyto Kerr and Cohen, they could demonstrate that there is no single trust model that isrobust against all the investigated attacks. Further recent studies did not only focus onthe robustness but set up a detailed catalog of security problems of reputation systems[1, 7, 22, 23].Based on the literature above, we identified the most suitable attacks for sellers in elec-
tronic markets. Table 1 gives an overview of selected seller attacks. Here, we excludedall kinds of unfair rating attacks (e.g. ballot stuffing, bad mouthing) which are commonexamples for advisor attacks. Collusion and Sybil Attack have been listed as potentialseller attacks for the sake of completeness, although mainly being implemented as advisor
Table 1 Overview of selected seller attacks in electronic marketplaces
Attack Description
Playbook Playbooks are sequences of actions that allow the maximum outcome/profit for theplayer under specific auxiliary conditions. A simple example would be an on-off attackwhere a seller acts honestly to build high reputation by selling high quality products.After a particular time the seller changes his behavior and starts selling low qualityproducts (under low production costs) and “milks” the high reputation. This sequencecan be run through again and again. Overall, the seller stays unsuspicious [42]. Thisattack is particularly effective if the reputation metric “forgets” negative ratings.
Value Imbalance Attack Sellers making use of the value imbalance problem build up high reputation sellingcheap products while cheating on the expensive ones. In contrast to playbooks, thisattack is non periodical but the malicious seller has to keep a balance between goodand bad behavior to keep his reputation at a certain level for the whole time. Zhanget al. [43] extended the term of value imbalance to transaction context imbalancewhere not only the value but also the product type or the time can be used forasymmetrical allocation of good service.
Reputation Lag Attack Usually, there is a time-lag between the advance payment and the delivery. Sincereferrals or ratings are normally made after the product is received, a malicious sellercan exploit that time-frame by selling many low quality products before being ratedbadly for the first time.
Proliferation Attack In a proliferation attack, the seller offers the same product from several accounts orchannels to increase the probability that a buyer chooses his product instead of buyingfrom a different seller offering the same product. Although often named as an attackon reputation systems, the “malicious” sellers do not really cheat on their buyers nordo they manipulate the reputation system. However, they get an advantage of theircompetitors. (The proliferation attack can be considered as a subset of the Sybil attack)
Re-entry Attack Performing a re-entry attack (often referred to as whitewashing or newcomer attack),the malicious seller opens an account, cheats on the buyers and leaves the communityto open a new account whenever his reputation is damaged. In re-entry attacks, theactor does never have to behave good. This type of attacks particularly exploits systemswhere a registration without any proof of identity is possible.
Collusion If multiple actors coordinate their behavior to gain an advantage over the rest,this is called collusion. The purpose of collusions can be various, e.g. unfairlyincrease/decrease the reputation of an actor, discriminate groups or run coordinatedplaybooks.
Sybil Attack In contrast to collusions where the accounts are created by multiple individuals,the Sybil attack is performed by one attacker who creates a number of accounts(pseudonyms). Due to the greater influence, the attacker can easily manipulatereputation values.

Sänger and Pernul Journal of Trust Management (2016) 3:5 Page 6 of 22
attacks. To get a holistic view on security problems, please refer to the aforementionedworks.
Research gap: interactively visualizing seller reputation profiles to detect attacks
As the robustness of reputation systems is still a topical issue and current approaches lacka certain degree of transparency, the objectives of this work are as follows:
• We want to increase the transparency of reputation systems through depicting allinput data in integrated visual representations of the reputation profile (in TRIVIA)
• We want to enhance the robustness of reputation systems through involving the userin the evaluation process (in TRIVIA)
Due to the variety of different application areas and attacks on reputation systems, wehere focus on malicious sellers in eBay-like electronic marketplaces. The insights gainedfrom this work might also be transferred to advisor attacks and other application areas.
Preliminary considerations for designing TRIVIABefore describing the conceptual design of TRIVIA in the following section, we here givea basic overview of preliminary considerations we made. Adapting the visual analyticsprocess, the conceptual design of a visual analytics software can be described within twoessential blocks – namely “models” that are created using automated data analysis and“visualization & interaction techniques” provided for the user. The selection of appro-priate models and visualizations, however, cannot be made ex ante but depends on thestructure of the data provided. Thus, the first step designing TRIVIA was to range the rawdata according to data types. At the same time, generic logical information blocks withinthe raw data had to be determined. The outcomes of these analyses represent the basisfor the choice of suitable models and visualization techniques in the subsequent step.
Data classification
Depending on the application area, the input data of reputation systems can vary strongly.Figure 2 depicts a generic transaction and review process in electronic marketplaces. Toderive information blocks that are representative for such environments, we analyzed thisprocess by the example of an eBay-like reputation system.Starting point is a transaction between a buyer and a seller (most systems do not
allow feedback without a prior transaction). This transaction is carried out under a
Fig. 2 Generic transaction and review process in eBay-like electronic marketplaces

Sänger and Pernul Journal of Trust Management (2016) 3:5 Page 7 of 22
transaction-specific context including, for instance, the product type, the price, the pay-ment method or the transaction time. In the second step, the buyer fills the role of therater or advisor who provides feedback toward the ratee (seller). This feedback refers tothe same transaction context. For this scenario, we identified the three information blocks“feedback”, “transaction context” and “actors”.As the selection of a suitable visualization technique depends on the data type of the
input, the attributes of each information block need to be further analyzed. A meaning-ful classification of data types for visual analytics is still under discussion in literature.Based on the taxonomies of Shneiderman [24] and Keim [25], we distinguish the classes1-dimensional, 2-dimensional, multi-dimensional, text/hypertext, networks, hierarchies,and software and algorithms. Table 2 depicts the resulting data classification.
Visualization techniques
The best choice of visualization techniques for specific data types is hard to measureand a quite subjective estimate. In this work, we considered some of the most suitablevisualization techniques commonly used to illustrate data of the identified types. We herepoint out why each visualization is beneficial for reputation assessment and how theyneed to be adapted to perfectly fit our requirements.As we address the visual detection of seller attacks using TRIVIA, we assume all
advisors to be honest. Thus, we only focused on the information blocks feedback andtransaction context in this work.
Feedback: rating
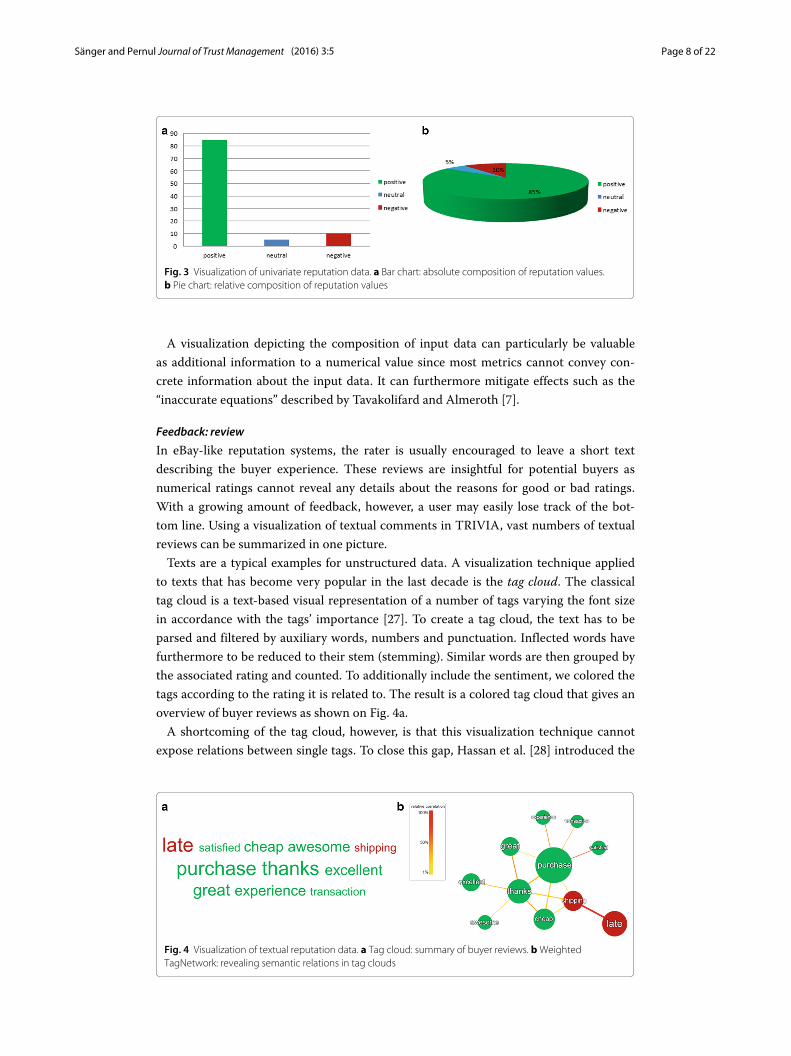
The 1-dimensional rating can be considered being the most important information of areferral. Data is called 1-dimensional or univariate, if only one attribute changes in regardto one or several independent attributes [26]. There aremany broadly known visualizationtechniques to depict univariate data. A very intuitive and easy to understand visualizationthat gives an overview of aggregated values is a simple bar chart revealing the absolutecomposition of positive (green), neutral (blue) and negative (red) ratings as depicted onFig. 3a. A second well-known example to depict the relative composition is a pie chart asshown on Fig. 3b.
Table 2 Classification of common reputation data in electronic marketplaces
Information block Data Data type Comment
Feedback Multi-dimensional Typical feedback in electronicmarketplaces involves both arating and a textual review
Rating 1-dimensional
Review Text
Time 1-dimensional
Transaction context Multi-dimensional Product type, price and time ascontext attributes are exemplarychosen
Product type 1-dimensional
Price 1-dimensional
Time 1-dimensional
Actors Network Through direct ratings, a uni-directed referral graph is created
Rater/advisor Multi-dimensional
Ratee Multi-dimensional
Sänger and Pernul Journal of Trust Management (2016) 3:5 Page 8 of 22
Fig. 3 Visualization of univariate reputation data. a Bar chart: absolute composition of reputation values.b Pie chart: relative composition of reputation values
A visualization depicting the composition of input data can particularly be valuableas additional information to a numerical value since most metrics cannot convey con-crete information about the input data. It can furthermore mitigate effects such as the“inaccurate equations” described by Tavakolifard and Almeroth [7].
Feedback: review
In eBay-like reputation systems, the rater is usually encouraged to leave a short textdescribing the buyer experience. These reviews are insightful for potential buyers asnumerical ratings cannot reveal any details about the reasons for good or bad ratings.With a growing amount of feedback, however, a user may easily lose track of the bot-tom line. Using a visualization of textual comments in TRIVIA, vast numbers of textualreviews can be summarized in one picture.Texts are a typical examples for unstructured data. A visualization technique applied
to texts that has become very popular in the last decade is the tag cloud. The classicaltag cloud is a text-based visual representation of a number of tags varying the font sizein accordance with the tags’ importance [27]. To create a tag cloud, the text has to beparsed and filtered by auxiliary words, numbers and punctuation. Inflected words havefurthermore to be reduced to their stem (stemming). Similar words are then grouped bythe associated rating and counted. To additionally include the sentiment, we colored thetags according to the rating it is related to. The result is a colored tag cloud that gives anoverview of buyer reviews as shown on Fig. 4a.A shortcoming of the tag cloud, however, is that this visualization technique cannot
expose relations between single tags. To close this gap, Hassan et al. [28] introduced the
Fig. 4 Visualization of textual reputation data. a Tag cloud: summary of buyer reviews. bWeightedTagNetwork: revealing semantic relations in tag clouds

Sänger and Pernul Journal of Trust Management (2016) 3:5 Page 9 of 22
weighted TagNetwork as a combination of the classical tag cloud and a weighted node-edge graph. Thereby, the size of a node grows according to the tags importance. By thismeans, significant tags can be identified immediately. An edge is created whenever twotags are used in the same review. While the width of an edge indicates the absolute fre-quency of an association, the color of an edge illustrates the relative frequency. In thisway, the semantic context can easily be deducted. Figure 4b illustrates a weighted Tag-Network. Here it becomes obvious that “shipping” is strongly related to “late”. The colormoreover indicated the sentiment the review is associated with. For further informationon techniques for visual text analytics please refer to Alencar et al. [29].
Feedback: time
Due to the dynamic nature of trust, it has been widely recognized that time is a crucialfactor for the importance of feedback. Old referrals might not be as relevant for reputationscoring as new referrals [30]. Though many computation models include a “forgettingfactor”, it is still an open challenge to find the ideal trade-off between unlimited memoryand a too small scope [7]. Both settings can lay the reputation system open to attacks.Visualizing the progress of feedback over time in TRIVIA, however, this problem can bealleviated through letting the user decide.A common technique to depict multiple time-dependent variables over time is a stacked
graph [31]. In stacked graphs, the development graphs of the single rating values r ={-1,0,1} are placed on top of each other. In this manner, both the history of the entire activ-ities and the composition of positive, neutral and negative ratings can be clearly depicted(Fig. 5a).Besides the time-dependent visualization of ratings, changes in textual reviews should
also be noticed. Referring to the tag cloud, a more advanced visualization technique thatdepicts the evolution of texts over the course of time is the SparkCloud introduced by Leeet al. [32] (Fig. 5b). In contrast to the tag cloud, the SparkCloud can reveal time-sensitiverelations such as decreasing quality (e.g. the word “late” has lately become important).Here again, we colored the tags according to the rating the review is attributed to. To findmore details on visualizing time-orientated data, please refer to Aigner et al. [31].
Transaction context: product type, price & time
The second information block we wanted to visualize in TRIVIA denotes the prod-uct type, price and time of the transaction the feedback refers to. Although transactioncontext has been recognized to play an important role for trust evaluation in literature[33, 34], only a very limited number of trust models formalizes the influence of context
Fig. 5 Visualization of time-based reputation data. a Stacked graph: progress of aggregated ratings overtime. b SparkCloud: depicting the summary of buyer reviews over time

Sänger and Pernul Journal of Trust Management (2016) 3:5 Page 10 of 22
Fig. 6 Visualization of multivariate reputation data. a Parallel coordinates: revealing relationship betweensingle attributes [16]. b Starplot: revealing relationship between single attributes
for reputation assessment [35]. The non-consideration of the transaction context, how-ever, might lead to the value imbalance problem, where a malicious seller can build a highreputation selling cheap products while cheating on the expensive ones [16]. To cope withthis problem, an interactive visualization of transaction context can provide a remedy.There is wide a range of visualization techniques suitable for multi-dimensional data
sets. Here, we considered two techniques that have become quite popular due to their easyto understand and intuitive presentation. The first one - parallel coordinates - projectsn dimensions to a 2-dimensional visualization space. Thereto, n axes are laid out in par-allel side-by-side. A point in the n-dimensional space is then represented as a polylinewith vertices on the parallel axes [36]. Parallel coordinates have proven themselves to be aperfect tool for revealing correlations between single attributes. Here, we provide an inte-grated view on ratings and its corresponding context as depicted on Fig. 6a. For a detaileddescription of parallel coordinates as a technique to depict transaction context in trustand reputation systems including case studies based on real-life data, please refer to [16].A second visualization technique to depict multivariate data is the star plot (Fig. 6b). Incontrast to parallel coordinates, the axes are laid out in a star pattern.Comparing the two information blocks feedback and transaction context, it is apparent
that both blocks contain a timestamp. The relation of these attributes led us to the idea ofincluding not yet rated transactions.
Not yet rated transactions (reputation lag)
There is usually a time frame between the payment, the service provision and the provid-ing of feedback. This “reputation lag” has been identified as a problem in many works (see“Reputation Lag Attack” - Table 1). Sellers could misuse this period by selling many lowquality products or even not deliver before being rated badly for the first time. To copewith this issue, transactions that have not yet been rated could be involved in TRIVIA.For sake of simplicity, we assumed the delivery and the provision of feedback to happenat the same time. Since this is a quite specific application case, we here designed a chartfor this particular scenario.To get an idea of how long it usually takes to rate a transaction, the mean time to rating
for the specific seller is of interest. Malicious sellers could try to increase this time-frameto maximize their payoff. Furthermore, it is helpful to know if there are many customerscurrently waiting for their delivery. This number of transactions per (transaction) day isthe second lever to maximize the profit. Thus, we depict the number of transactions per

Sänger and Pernul Journal of Trust Management (2016) 3:5 Page 11 of 22
Fig. 7 Visualization of not yet rated transactions. a Risk matrix: Applying the mean time to rating and themean transactions per (transaction) day as threshold values a four-field risk matrix is create. b Transactiontime vs. feedback time: Revealing high risk profiles
day on the number of days since the begin of the transaction for yet unrated transactionsby means of a bar chart. The visualization is additionally extended by the mean timeto rating and the mean transactions per (transaction) day leading to a four-field matrix(Fig. 7a). Figure 7b depicts the resulting bar chart.
Interaction techniques
Visual analytics is characterized through interactive user exploration of visual data rep-resentations. Interaction techniques therefore played a crucial role for the design of aTRIVIA. Heer and Shneidermann [37] classify interactive dynamics for visual analysis in“data and view specification”, “view manipulation” and “process and provenance”. We hereconsidered a range of these basic interaction techniques and denote how they could beapplied to evaluate reputation data.
Data and view specification
The first class “data and view specification” comprises basic interaction techniques suchas selecting proper visualizations, ordering the output to expose patterns, deriving modelsfrom the source data or filtering all input data to focus on interesting aspects [37]. Whilethis class provides quite fundamental tools, filtering seems to be particularly suitable forvisually evaluating reputation data, since Sänger and Pernul [14] identified filtering to beone of the basic operations in the computation process of a common reputation system. Ifthe user is particularly interested in feedback for one product type, for instance, he shouldbe able to filter all other referrals. eBay, for example, has already implemented such aninteractive filter to focus on positive, neutral or negative ratings in specific time-frames.
Viewmanipulation
Once the input data and views have been specified, the human analyst should be ableto “dive” into the data through manipulating TRIVIA’s visualizations. Here, commonmanipulation techniques can be subclassified to selection, navigation, coordination andorganization [37]. Selection features support a user in pointing at specific parts of a visu-alization, highlighting them and in this way revealing relation between single attributes.These techniques are particularly helpful for the integrated visualization of ratings andcorresponding context attributes to reveal relation (Fig. 8).

Sänger and Pernul Journal of Trust Management (2016) 3:5 Page 12 of 22
Fig. 8 View Manipulation: Select; revealing relation between negative ratings and the product category“DVDs & Movies”
According to Shneiderman’s [24] often referred to navigation mantra “Overview first,zoom and filter, then details-on-demand.”, a visual investigation should furthermore sup-port the navigation through the data. This also holds good for reputation assessment.One example is the time-frame considered. Though the most actual feedback might bethe most valuable, the whole history as well as single segments should be contemplated toavoid attacks based on time. A zooming feature could enable the user to analyze periodsof varying length. Coordination as the third subclass of features addresses the integrationof multiple views to reveal correlations between attributes and information blocks. Oneexample for coordination is the interaction techniques “link & brush”. The idea of link& brush is to combine various visualizations to overcome the shortcomings of a singletechnique. Interactive changes made in one visualization (highlighting of specific partsor filtering) are then automatically reflected in the other visualizations [38] (Fig. 9). Inthis way, a human analyst can gain more information than evaluating the visualizationsindependently.The fourth subclass organization concerns the challenge of managing different views.
With trust being a quite subjective mechanism, it strongly depends on the user, whichinformation of the provided feedback is considered to be the most important. Thus, an
Fig. 9 View Manipulation: Coordinate; Selecting negative ratings in one view also reduces the data tonegative ratings in another view

Sänger and Pernul Journal of Trust Management (2016) 3:5 Page 13 of 22
analyst using TRIVIA should be able to organize the multiple views to meet his per-sonal requirements. Focusing on textual reviews, for instance, all other views could beminimized.
Process and provenance
State-of-the-art visual analytics software is not only limited to visualizing and manipu-lating, it also supports an iterative process of knowledge discovery and interpretation.Thereto, findings can be recorded, annotated and shared. Furthermore, a human analystshould be guided through the application [37]. As these techniques mostly relate to thegeneral analysis processes, we have not considered any of these for TRIVIA.
TRIVIA: a visual analytics tool to detect malicious sellers in electronicmarketplacesBased on the preliminary considerations made, we firstly propose the conceptual designof TRIVIA in this section. Secondly, we show how the concept was implemented in asoftware tool.
Conceptual design
According to the visual analytics process, the conceptual design of a visual analytics toolcan be described within the two central building blocks “models” and “visualizations andinteractions techniques”. Based on the data classification of a generic transaction andreview process made above (Section “Data classification”), we selected five visualizationtechniques (and their inherent models) for TRIVIA, namely a bar chart to depict the dis-tribution of positive, neutral and negative ratings, a tag cloud to sum up the content of alltextual reviews, a stacked graph to illustrate the progression of all ratings over time, a par-allel coordinates visualization to reveal correlation between ratings and context attributesas well as the visualization of not yet rated transactions to prevent the reputation lag.For the sake of completeness, we furthermore provide a list of all feedback to addition-ally increase the transparency. Besides, we added four interaction techniques to involvethe user in the reputation assessment. As the parallel coordinates visualization combinesdata of both information blocks transaction context and feedback (rating), it constitutesthe central part of our software. Figure 10 gives an overview of the schematic concept.
Fig. 10 Schematic view of TRIVIA’s conceptual design
Sänger and Pernul Journal of Trust Management (2016) 3:5 Page 14 of 22
Thereby, the grey boxes illustrate the single visualization windows (as arranged in oursoftware), whereas the arrows describe the interaction techniques applied. To connect allviews to the parallel coordinates, we selected the interaction technique link & filter. We,moreover, allow to select and zoom into the visualizations as well as to organize the singlewindows.Since our aim is to demonstrate the value added through a visual exploration of reputa-
tion data, the selected techniques can be considered to be an exemplary case. The choiceof different and further techniques would also have been possible.
Implementation
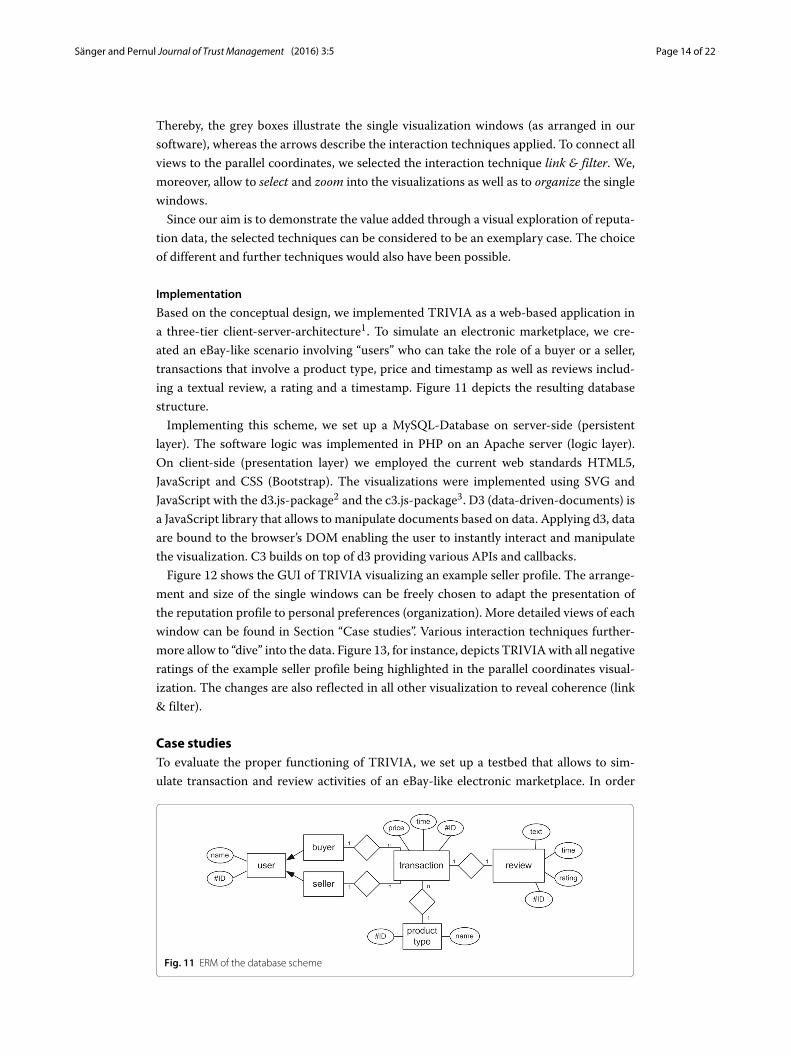
Based on the conceptual design, we implemented TRIVIA as a web-based application ina three-tier client-server-architecture1. To simulate an electronic marketplace, we cre-ated an eBay-like scenario involving “users” who can take the role of a buyer or a seller,transactions that involve a product type, price and timestamp as well as reviews includ-ing a textual review, a rating and a timestamp. Figure 11 depicts the resulting databasestructure.Implementing this scheme, we set up a MySQL-Database on server-side (persistent
layer). The software logic was implemented in PHP on an Apache server (logic layer).On client-side (presentation layer) we employed the current web standards HTML5,JavaScript and CSS (Bootstrap). The visualizations were implemented using SVG andJavaScript with the d3.js-package2 and the c3.js-package3. D3 (data-driven-documents) isa JavaScript library that allows to manipulate documents based on data. Applying d3, dataare bound to the browser’s DOM enabling the user to instantly interact and manipulatethe visualization. C3 builds on top of d3 providing various APIs and callbacks.Figure 12 shows the GUI of TRIVIA visualizing an example seller profile. The arrange-
ment and size of the single windows can be freely chosen to adapt the presentation ofthe reputation profile to personal preferences (organization). More detailed views of eachwindow can be found in Section “Case studies”. Various interaction techniques further-more allow to “dive” into the data. Figure 13, for instance, depicts TRIVIAwith all negativeratings of the example seller profile being highlighted in the parallel coordinates visual-ization. The changes are also reflected in all other visualization to reveal coherence (link& filter).
Case studiesTo evaluate the proper functioning of TRIVIA, we set up a testbed that allows to sim-ulate transaction and review activities of an eBay-like electronic marketplace. In order
Fig. 11 ERM of the database scheme

Sänger and Pernul Journal of Trust Management (2016) 3:5 Page 15 of 22
Fig. 12 TRIVIA: Visualization of an example seller reputation profile
to demonstrate how value is added through a visual representation of seller reputationprofiles in this environment, we simulated three seller attacks. The resulting reputationvalues are on the one hand calculated by two common reputation systems namely the BetaReputation System [30] and a system computing a simple average of positive and negativeratings. On the other hand, we interactively visualize themalicious sellers’ reputation pro-files and point out its merit compared to presenting a numerical value only. Note that theprimary objective of this evaluation is not to compare the reputation values of differentsystems and measure their effectiveness, but to demonstrate an alternative approach ofhow the problem of robustness andmalicious seller detection could be addressed throughuser interaction while maintaining transparency. Thus, we did not use any of the testbedsintroduced in literature such as the Agent Reputation and Trust (ART) [39] testbed or theTrust and Reputation Experimentation and Evaluation Testbed (TREET) [40] that weredesigned to evaluating the performance of agents or measuring payoffs in a game-basedmanner. Instead, we created a simple simulation data set that is visualized at one specificpoint in time.All visualized reputation profiles illustrated here, can also be inspected online4.
The electronic market testbed
To carry out experiments in an eBay-like environment as described in Section“Implementation”, we set up an electronicmarket testbed.We simulated transaction activ-ities for one honest seller (see Figs. 12 and 13), three malicious sellers and n = 100.000
Fig. 13 TRIVIA: Visualization of an example seller reputation profile with negative ratings being highlighted

Sänger and Pernul Journal of Trust Management (2016) 3:5 Page 16 of 22
buyers (n is large enough that buyers do not learn from their experience). Each maliciousseller implements one of the three attacks playbook, value imbalance attack and repu-tation lag attack. The proliferation attack and the re-entry attack were not consideredas these problems need to be solved through registration policies which are beyond thescope of reputation systems. Collusion and sybil attacks are usually implemented as advi-sor attacks. Since we focus on seller attacks and assume every review to be honest, we didnot regard these types of attacks either. To simulate the reputation lag, the time to deliv-ery (ttd) for usual transactions was set to an interval of ttd = {4, 5} days. We assume thattransactions are directly rated on delivery.This setting was simulated for 100 days. After this period, we compared the output of
two common reputation systems - the Beta Reputation System and a reputation systemcomputing a simple average - to the visual representation of our software. The Beta Rep-utation System (BRS) uses the beta probability density function (beta PDF) to derive areputation value. Result is a reputation score that is described in a beta PDF parametertuple (α, β), where α represents positive and β represents negative ratings [30]. In con-trast to the simple average, the BRS includes a forgetting factor that discounts referralsbased on their age. This difference makes the selection of those two systems particularlyinteresting, since both computationmodels have their weaknesses which can bemitigatedby a visual representation. For the forgetting factor we set λ = 0.95 and chose a weight ofw = 1 for each referral. The resulting reputation values were normalized to the intervalof [−1; 1] to make them comparable.
Case 1: The Playbook
A malicious seller implementing a Playbook tries to maximize his profit by employing acheating strategy that bases on a sequence of actions (see Table 1). Attackers would have a“book” of different plays which allows them to dynamically decide which actions to apply[3]. Though playbooks are an attack toward reputation systems, they are not necessarilyunethical as pointed out in [5]. Generating oscillation in a company’s reputation is oftenalso used by commercial players.To demonstrate a Playbook, we simulated a simple attack where themalicious seller first
acts honestly to build a high reputation. After a specific time, he “milks” his high reputa-tion by providing low quality products or services under low production costs. Exceedinga defined threshold value or time-frame, he changes his behavior and acts honest again.This sequence of actions could be implemented in an infinite loop [5]. In our simula-tion, the malicious seller acts honest for 20 days, then he starts cheating for four days.Due to a reputation lag of four to five days, he will act honest again before buyers rec-ognize him to cheat. This sequence is repeated over the entire time. In each period, thetransactions were randomly spread with an average of 10 transactions per day. Table 3shows the reputation values calculated for this profile after 100 days.The main difference between both metrics is obvious. Due to the forgetting factor, the
BRS quickly adapts its output to the current situation while the simple average allows to
Table 3 Reputation values calculated by the BRS and the simple average
Reputation system/model Reputation value (after 100 days)
BRS 0.91
Simple average 0.6875 (84 % positive ratings)

Sänger and Pernul Journal of Trust Management (2016) 3:5 Page 17 of 22
Fig. 14 TRIVIA: Visualization of ratings over time in a stacked graph
profit from a high reputation for a longer time. Because of the simple average’s persis-tence, its reputation value is significantly lower after 100 days. However, both systemscompute only one reputation value (at every point in time) that serves as basis for a deci-sion. Providing numerical values only, the reputation system completely neglects the factthat the ratings have been changing periodically. Although the quality of sold productsmight currently be good it can rapidly change. Additionally visualizing the progressionin a stacked graph, users will get an idea of this coherence. Through allowing the user tofocus on single parts of the entire timeline, they can become aware of the current situa-tion and understand the malicious seller behavior as depicted on Fig. 14. Buyers that set agreat value on high quality products or services should avoid to buy from this seller. Par-ticularly, if a service is subscribed or leased for a longer time-frame oscillation might beundesirable.
Case 2: value imbalance attack
The value imbalance attack is currently a quite powerful exploit, since most common rep-utation systems used in practice do not involve transaction context in their computationmechanism. Sellers benefiting from the value imbalance problem build a high reputationselling cheap products while cheating on the expensive ones (see Table 1). In this way, ACalifornian seller managed to deceive victims for over $300.000 [43].To demonstrate the value imbalance attack, we again simulated amalicious seller profile
over a time-frame of 100 days. In this time he randomly accomplishes 1000 transactions- 950 selling low price items (honest) and 50 selling high price items (dishonest). Theidea is to maintain a reasonably high level reputation over the whole time. Table 4 showsthe resulting reputation values calculated. After 100 days, the BRS provided a reputationvalue of 0.86 (ranges between 0.7 and 0.99 after bootstrapping). The simple average, incontrast, converges to 0.90 after 100 days.Since the analyzed metrics do not consider transaction context as a computation
parameter, the attack remains mostly undetected. Both provide a quite high reputation
Table 4 Numerical reputation values over time for the value imbalance attack
Reputation system/model Reputation value (after 100 days)
BRS 0.86
Simple average 0.90 (84 % positive ratings)

Sänger and Pernul Journal of Trust Management (2016) 3:5 Page 18 of 22
Fig. 15 TRIVIA: Reputation data depicted in a parallel coordinates view
value throughout the entire experiment. Depicting all context attributes in a parallel coor-dinates visualization, instead, the relation between negative ratings and the price caneasily be revealed by the human analyst. While Fig. 15 gives an overview of all reviews inone picture, the correlation becomes obvious when highlighting the price range from 300to 900 (see Fig. 16). For this price range the malicious actor received 47 negative ratings.The merit of the visualization compared to metrics that include transaction context suchas recently proposed by Zhang et al. [43] is that all relevant data is transparently depictedand absolutely replicable to the user.Besides the price, a differentmanifestation of this attack could be a discrimination based
on different product categories. Further examples of using a parallel coordinates visual-ization to detect context-based attacks can be found in a recent work [16]. Thereby, theycarry out case studies by means of real-life data.
Case study 3: reputation lag attack
Exploiting the reputation lag problem, a malicious seller behaves honestly to build a highreputation. After some time, he changes his behavior to maximize his profit by cheatingon as many customers as possible before he is rated badly (depending on the market thatmight take quite a few days; here we assume 15 days). This weakness theoretically facili-tates unlimited cheating [21]. Though the reputation lag attack is broadly known, there isnearly no approach to cope with this challenge.
Fig. 16 TRIVIA: Reputation data depicted in a parallel coordinates view with high price transactions selected
Sänger and Pernul Journal of Trust Management (2016) 3:5 Page 19 of 22
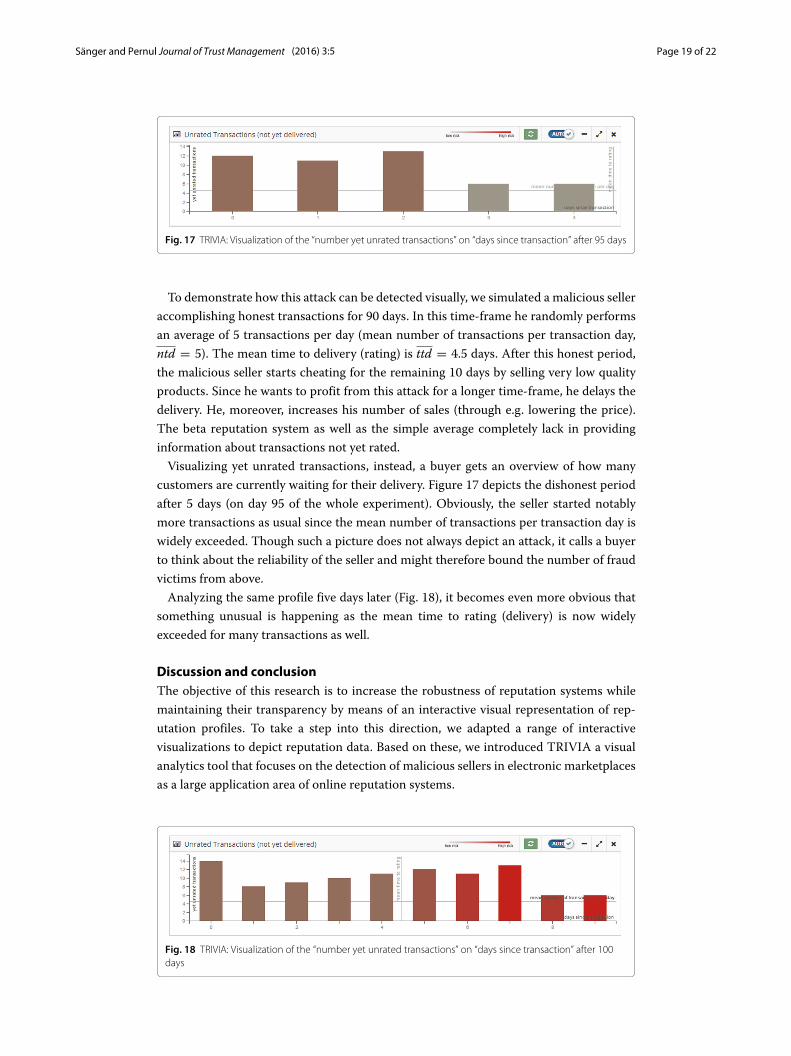
Fig. 17 TRIVIA: Visualization of the “number yet unrated transactions” on “days since transaction” after 95 days
To demonstrate how this attack can be detected visually, we simulated a malicious selleraccomplishing honest transactions for 90 days. In this time-frame he randomly performsan average of 5 transactions per day (mean number of transactions per transaction day,ntd = 5). The mean time to delivery (rating) is ttd = 4.5 days. After this honest period,the malicious seller starts cheating for the remaining 10 days by selling very low qualityproducts. Since he wants to profit from this attack for a longer time-frame, he delays thedelivery. He, moreover, increases his number of sales (through e.g. lowering the price).The beta reputation system as well as the simple average completely lack in providinginformation about transactions not yet rated.Visualizing yet unrated transactions, instead, a buyer gets an overview of how many
customers are currently waiting for their delivery. Figure 17 depicts the dishonest periodafter 5 days (on day 95 of the whole experiment). Obviously, the seller started notablymore transactions as usual since the mean number of transactions per transaction day iswidely exceeded. Though such a picture does not always depict an attack, it calls a buyerto think about the reliability of the seller and might therefore bound the number of fraudvictims from above.Analyzing the same profile five days later (Fig. 18), it becomes even more obvious that
something unusual is happening as the mean time to rating (delivery) is now widelyexceeded for many transactions as well.
Discussion and conclusionThe objective of this research is to increase the robustness of reputation systems whilemaintaining their transparency by means of an interactive visual representation of rep-utation profiles. To take a step into this direction, we adapted a range of interactivevisualizations to depict reputation data. Based on these, we introduced TRIVIA a visualanalytics tool that focuses on the detection of malicious sellers in electronic marketplacesas a large application area of online reputation systems.
Fig. 18 TRIVIA: Visualization of the “number yet unrated transactions” on “days since transaction” after 100days

Sänger and Pernul Journal of Trust Management (2016) 3:5 Page 20 of 22
As demonstrated above, we could show that an interactive visual representation cannotably contribute to a transparent presentation of reputation data, as all input data isdepicted in one integrated view. The interaction techniques implemented in TRIVIAallow the users to gain insights by themselves and “dive” into the data. As a consequence,a higher level of trust toward the reputation system could be achieved, because it does notonly provide a pre-calculated reputation value but rather allows to evaluate the referralsand derive one’s reputation. The visualization techniques we adapted have proven to beadequate for the specific cases.We furthermore found that an interactive visualization can contribute to the robustness
of current reputation systems against three major attacks. In contrast to most advancedcomputation models that have become quite complex, presenting the share of positive,neutral and negative ratings combined with interactive visualizations has shown to besufficient to detect malicious sellers and even obtain better results. While most sys-tems compute a static reputation value, we found that involving the user in reputationassessment and letting him dynamically change the parameter used for the computation,malicious behavior can reliably be identified.One counter-argument a reader could forward is that although we criticized the high
complexity of computation models, the models our visualizations are based on are at leastas complex. Here, we are on the same page with Marsh et al. [15] who argue that “Mostespecially, if complex models are used in the background for whatever reason, the userinterface has a role to make the model understandable without losing any of its predictivepower”. Obviously, a proper visualization of a model can provide much more informationthan the numerical outcome of a metric. Nevertheless, as this is one of few proposals try-ing to involve the user in reputation assessment through interactive visualizations, thereis vital necessity for further research on finding and evaluating the ideal presentation.Also, please note that the objective of this work is not to propose a visual analytics soft-ware that can directly be used in practice, but to point out the benefits of transparentlyand interactively presenting different facets of reputation data using visual analytics.Reviewing the evaluation of TRIVIA in this paper, there are some limitations that
should be addressed in future research. It remains to show (1) whether an average end-user is able to use the single visualizations and the visualization cockpit for detectingattacks, (2) whether this approach indeed increases the understandability of reputationdata for end-users, and (3) whether such visualizations will be adopted by end-usersquickly (with regard to perceived usefulness and usability). To this end, we will conducta user study that analyses and compares the participants’ usage of the single visualiza-tion and interaction techniques as well as their combination. An exemplary internationaluser study, that compared the usage of an eBay-like feedback profile versus a new inter-face involving an interactive parallel coordinates visualization was already conducted ina recent work [41]. During the study, participants had to solve four cases. In each case,they were asked to buy a specific item, compare two seller profiles offering the respectiveitem and give a preference for one of both sellers. In each case, one seller was maliciouswhereas the other seller was honest. Results of the study show that the detection abilityand robustness against context-based attacks could notably be increased through usingthe new interface including a parallel coordinates visualization compared to the eBay-likeinterface. Also, the understanding of malicious behavior could be significantly enhanced.During the study participants had to describe why they made a decision. Measuring the

Sänger and Pernul Journal of Trust Management (2016) 3:5 Page 21 of 22
perceived usability, no trade-offs between using the eBay-like interface compared to theinteractive interface were detected. Furthermore, users of the novel interface denotedthat they would use such an interactive visualization if it was available. Based on theseoutcomes, we feel confident that a user study analyzing TRIVIA may also provide somevaluable insights.Overall, we believe that our results provide a promising perspective on an alternative
approach for reputation assessment and detecting malicious actors. We thus motivateto carry out further research in enhancing presentation and making use of the user’scognitive capabilities in online reputation systems.
Endnotes1 http://trust.bayforsec.de/visualrepcockpit/2 http://d3js.org/3 http://c3js.org/4 http://trust.bayforsec.de/visualrepcockpit/
Authors’ contributionsJS proposed the initial idea of this paper. He developed TRIVIA and conducted the evaluation of the proposed ideas. GPsupervised the research, contributed to the paper writing and made suggestions. Both authors read and approved thefinal manuscript.
Competing interestsThe authors declare that they have no competing interests.
Received: 9 October 2015 Accepted: 8 October 2016
References1. Yao Y, Ruohomaa S, Xu F (2012) Addressing common vulnerabilities of reputation systems for electronic commerce.
J Theor Appl Electron Commer Res 7(1):1–202. Diekmann A, Jann B, Przepiorka W, Wehrli S (2014) Reputation formation and the evolution of cooperation in
anonymous online markets. Am Sociol Rev 79(1):65–853. Kerr R, Cohen R (2009) Smart cheaters do prosper: Defeating trust and reputation systems. In: Proceedings of The
8th International Conference on Autonomous Agents and Multiagent Systems - Volume 2. AAMAS ’09. InternationalFoundation for Autonomous Agents and Multiagent Systems, Richland. pp 993–1000
4. Dellarocas C (2000) Immunizing online reputation reporting systems against unfair ratings and discriminatorybehavior. In: Proceedings of the 2nd ACM Conference on Electronic Commerce. ACM, New York. pp 150–157
5. Jøsang A, Golbeck J (2009) Challenges for robust of trust and reputation systems. Saint Malo6. Zhang L, Jiang S, Zhang J, Ng WK (2012) Robustness of trust models and combinations for handling unfair ratings. In:
Dimitrakos T, Moona R, Patel D, McKnight DH (eds). Trust Management VI. IFIP advances in information andcommunication technology. Springer, Berlin and Heidelberg Vol. 374. pp 36–51
7. Tavakolifard M, Almeroth KC (2012) A taxonomy to express open challenges in trust and reputation systems.J Commun 7(7):538–551
8. van Valen L (1973) A new evolutionary law. Evol Theory 1:1–309. Carroll L, Tenniel J (1897) Through the Looking Glass: And What Alice Found There. Altemus’ illustrated young
people’s library. Henry Altemus, Philadelphia10. Hammer S, Kiefhaber R, Redlin M, Andre E, Ungerer T (2013) A user-centric study of reputation metrics in online
communities. CEUR Workshop Proceedings 997, CEUR-WS.org, Rome11. Keim DA, Kohlhammer J, Ellis G, Mansmann F (2010) Mastering the Information Age - Solving Problems with Visual
Analytics. Eurographics Association, Geneve. http://books.google.de/books?id=vdv5wZM8ioIC. Accessed 19 Oct2016
12. Marsh SP (1994) Formalising trust as a computational concept. PhD thesis. http://www.cs.stir.ac.uk/research/publications/techreps/pdf/TR133.pdf. Accessed 19 Oct 2016
13. Resnick P, Kuwabara K, Zeckhauser R, Friedman E (2000) Reputation systems. Commun ACM 43(12):45–4814. Sänger J, Pernul G (2014) Reusability for trust and reputation systems. In: Zhou J, Gal-Oz N, Zhang J, Gudes E (eds).
Trust Management VIII. IFIP advances in information and communication technology. Springer, Berlin HeidelbergVol. 430. pp 28–43
15. Marsh S, Basu A, Dwyer N (2012) Rendering unto cæsar the things that are cæsar’s: Complex trust models andhuman understanding. In: Dimitrakos T, Moona R, Patel D, McKnight DH (eds). Trust Management VI. IFIP Advancesin Information and Communication Technology. Springer, Berlin and Heidelberg Vol. 374. pp 191–200
16. Sänger J, Pernul G (2014) Visualizing transaction context in trust and reputation systems. In: Proceedings of the 9thInternational Conference on Availability, Reliability and Security (ARES)

Sänger and Pernul Journal of Trust Management (2016) 3:5 Page 22 of 22
17. Sänger J, Richthammer C, Kunz M, Meier S, Pernul G (2015) Visualizing unfair ratings in online reputation systems. In:ECIS 2015 Completed Research Papers. Paper 159. IFIP Advances in Information and Communication Technology.AISeL, AIS Electronic Library. pp 1–15
18. O’Donovan J, Smyth B, Evrim V, McLeod D (2007) Extracting and visualizing trust relationships from online auctionfeedback comments. In: Proceedings of the 20th International Joint Conference on Artifical Intelligence. IJCAI’07.Morgan Kaufmann Publishers Inc, San Francisco. pp 2826–2831
19. Hansson K, Karlström P, Larsson A, Verhagen H (2011) Actory?: A tool for visualizing reputation as a means toformalize informal social behavior., Montpellier
20. Nurse JRC, Agrafiotis I, Goldsmith M, Creese S, Lamberts K (2014) Two sides of the coin: measuring andcommunicating the trustworthiness of online information. J Trust Manag 1(5)
21. Kerr R, Cohen R (2006) Modeling trust using transactional, numerical units. In: Proceedings of the 2006 InternationalConference on Privacy, Security and Trust: Bridge the Gap Between PST Technologies and Business Services. PST ’06.ACM, New York. pp 21–12111
22. Hoffman K, Zage D, Nita-Rotaru C (2009) A survey of attack and defense techniques for reputation systems. ACMComput Surv 42(1):1–31
23. Fraga D, Bankovic Z, Moya JM (2012) A taxonomy of trust and reputation system attacks. In: Proceedings of the 2012IEEE 11th International Conference on Trust, Security and Privacy in Computing and Communications. TRUSTCOM’12. IEEE Computer Society, Washington DC. pp 41–50
24. Shneiderman B (1996) The eyes have it: A task by data type taxonomy for information visualizations. In: Proceedingsof the 1996 IEEE Symposium on Visual Languages. VL ’96. IEEE Computer Society, Washington DC. pp 336–343.http://dl.acm.org/citation.cfm?id=832277.834354. Accessed 19 Oct 2016
25. Keim DA (2001) Visual exploration of large data sets. Commun ACM 44(8):38–4426. Mazza R (2009) Introduction to Information Visualization. 1st. Springer27. Seifert C, Kump B, Kienreich W, Granitzer G, Granitzer M (2008) On the beauty and usability of tag clouds. In:
Proceedings of the 2008 12th International Conference Information Visualisation. IV ’08. IEEE Computer Society.pp 17–25
28. Hassan S, Sänger J, Pernul G (2014) Soda: Dynamic visual analytics of big social data. In: Proceedings of theInternational Conference on Big Data and Smart Computing (BIGCOMP). pp 183–188
29. Alencar AB, de Oliveira Maria Cristina F, Paulovich FV (2012) Seeing beyond reading: a survey on visual text analytics.Wiley Interdisc Rev Data Mining Knowl Discov 2(6):476–492
30. Jøsang A, Ismail R (2002) The beta reputation system, Bled Slovenia31. Aigner W, Miksch S, Schumann H, Tominski C (2011) Survey of visualization techniques. In: Visualization of
Time-Oriented Data. Human-Computer Interaction Series. Springer, London. pp 147–25432. Lee B, Riche NH, Karlson AK, Carpendale S (2010) Sparkclouds: Visualizing trends in tag clouds. IEEE Trans Vis Comput
Graph 16(6):1182–118933. Riegelsberger J, Sasse MA, McCarthy JD (2005) The mechanics of trust: A framework for research and design. Int J
Hum-Comput Stud 62(3):381–422. doi:10.1016/j.ijhcs.2005.01.00134. Buntain C, Golbeck J (2015) Trust transfer between contexts. J Trust Manag 2(1):1–16. doi:10.1186/s40493-015-0017-135. Rehak M, Gregor M, Pechoucek M, Bradshaw J (2006) Representing context for multiagent trust modeling, Hongkong36. Wegman EJ (1987) Hyperdimensional Data Analysis Using Parallel Coordinates37. Heer J, Shneiderman B (2012) Interactive dynamics for visual analysis. Commun ACM 55(4):45–5438. Keim DA (2002) Information visualization and visual data mining. IEEE Trans Vis Comput Graph 8(1):1–839. Fullam K, Klos T, Muller G, Sabater-Mir J, Barber KS, Vercouter L (2006) The agent reputation and trust (art) testbed. In:
Stølen K, Winsborough W, Martinelli F, Massacci F (eds). Trust Management. Lecture Notes in Computer Science.Springer, Berlin Heidelberg Vol. 3986. pp 439–442
40. Kerr R, Cohen R (2010) Treet: the trust and reputation experimentation and evaluation testbed. Electron CommerRes 10(3-4):271–290
41. Sänger J, Hänsch N, Glass B, Benenson Z, Landwirth R, Sasse MA (2016) Look before you leap: Improving the users’ability to detect fraud in electronic marketplaces. In: Proceedings of the 2016 CHI Conference on Human Factors inComputing Systems. CHI ’16. ACM, New York. pp 3870–3882. doi:10.1145/2858036.2858555, http://doi.acm.org/10.1145/2858036.2858555
42. Spitz S, Tüchelmann Y (2011) A survey of security issues in trust and reputation systems for e-commerce. In: CaleroJA, Yang L, Mármol F, García Villalba L, Li A, Wang Y (eds). Autonomic and Trusted Computing. Lecture Notes inComputer Science. Springer, Berlin Heidelberg Vol. 6906. pp 203–214
43. Zhang H, Wang Y, Zhang X (2012) A trust vector approach to transaction context-aware trust evaluation ine-commerce and e-service environments. In: Proceedings of the 5th IEEE International Conference onService-Oriented Computing and Applications, Taipei Vol. SOCA. pp 1–8
Related Documents