1 Trends in the U.S. Rail Network Mike McClellan Vice President – Industrial Products Southeast Association of Rail Shippers – Fall Meeting September 23, 2015 Orlando, FL

Welcome message from author
This document is posted to help you gain knowledge. Please leave a comment to let me know what you think about it! Share it to your friends and learn new things together.
Transcript

1
Trends in the U.S. Rail Network
Mike McClellan Vice President – Industrial Products
Southeast Association of Rail Shippers – Fall Meeting September 23, 2015
Orlando, FL

2
• The Dynamics in US Rail Freight Traffic
• Update on NS Efforts to Enhance the Network
• Other Key Issues

3
AAR Data – Total Train Speed
As reported publicly to the AAR

4
AAR Data – Dwell
As reported publicly to the AAR

5
So What’s Going On Here?
• Volume Growth?
• Conveyance Shifts?
• Commodity Shifts?
• Geographical Shifts?
• Regulation?
• All of the Above?

6
Volume Trends – Carloads – Originated (in millions)
Data are Class I railroad originations. Source: AAR Freight Commodity Statistics
Class I carload originations are up 11% in the same period.
16
18
20
22
24
26
28
30
32
34
'01 '02 '03 '04 '05 '06 '07 '08 '09 '10 '11 '12 '13 '14

7
Volume Performance By Big 4 US Railroads
Class I Financial Reports
10,637 10,275
9,852 9,625
7,901 7,675 7,358
6,922
-
2,000
4,000
6,000
8,000
10,000
12,000
2006 2007 2008 2009 2010 2011 2012 2013 2014
Units (000s)
Class I Volume Since 2006
BNSF UP NS CSX

8
Volume Trends Class I Ton Miles (Trillions)
Data for Class I railroads. Source: AAR
Total Class I U.S. ton-miles are up 24% since 2001, and in 2014 set a new annual record.
1.0
1.1
1.2
1.3
1.4
1.5
1.6
1.7
1.8
1.9
'01 '02 '03 '04 '05 '06 '07 '08 '09 '10 '11 '12 '13 '14

9
Class 1 Traffic – First 2 Quarters of 2015
Traffic Type 1Q 2015
vs. 1Q 2014
2Q 2015 vs.
2Q 2014
YTD 2015 vs.
YTD 2014
Eastern RRs
IM 3% 4% 3%
Carload (1%) (6%) (3%)
Total 1% (1%) --
Western RRs
IM (4%) 3% --
Carload 2% (7%) (3%)
Total (1%) (3%) (2%)
AAR weekly carload reports

10
Geographic and Commodity Shifts in the U.S. Rail Network

11
Intermodal Volume This Century Shipments originated (in Millions)
Intermodal volumes set an annual record in 2014.
0
1
2
3
4
5
6
7
8
9
10
11
12
13
14
15
'01 '02 '03 '04 '05 '06 '07 '08 '09 '10 '11 '12 '13 '14
Containers
Trailers
Source: AAR Weekly Railroad Traffic

12
Intermodal Volumes – East vs West
8,977 8,631
5,435
6,573
-
1,000
2,000
3,000
4,000
5,000
6,000
7,000
8,000
9,000
10,000
2006 2007 2008 2009 2010 2011 2012 2013 2014
Units (000s)
Intermodal Volume Since 2006
IM-West IM-East
Class I Financial Reports

13
Originated Carloads of Crude Oil on US Class I Railroads
Class I Railroads: Source: AAR
0
20,000
40,000
60,000
80,000
100,000
120,000
140,000
2009 2010 2011 2012 2013 2014 2015

14 Class I Carloads - Source: AAR
Crude Oil as a % of Total Originated
0.0% 0.0% 0.0% 0.0% 0.1%
0.2%
0.8%
1.4%
1.6% 1.5%
2006 2007 2008 2009 2010 2011 2012 2013 2014 2015*
*First half of the year

15
0
20,000
40,000
60,000
80,000
100,000
120,000
140,000
160,000
2009 2010 2011 2012 2013 2014 2015*
Originated Carloads of Industrial Sand on US Class I Railroads
Class I Railroads: Source: AAR
Frac sand is a major component of industrial sand and is considered responsible for the recent growth in industrial sand.
*First half of the year

16
95,000
100,000
105,000
110,000
115,000
120,000
125,000
130,000
135,000
140,000
145,000
150,000
U.S. Rail Coal Traffic
(weekly carloads originated, 52-week moving average)
2007 2008 2009 2010 2011 2012 2013 2014 2015
Excludes U.S. operations of Canadian railroads. Source: AAR Weekly Railroad Traffic

17
Shifts in Eastern and Western Coal Traffic
4,754
4,038 3,652
2,546
-
1,000
2,000
3,000
4,000
5,000
6,000
2006 2007 2008 2009 2010 2011 2012 2013 2014
Units (000s)
Coal Volume Since 2006
Coal-West Coal-East
Class I Financial Reports

18
12,000
14,000
16,000
18,000
20,000
22,000
24,000
26,000
U.S. Rail Grain Traffic
(weekly carloads originated, 52-week moving average)
2007 2008 2009 2010 2011 2012 2013 2014 2015
Excludes U.S. operations of Canadian railroads. Source: AAR Weekly Railroad Traffic

19
Other Commodity & Geographic Shifts This Century
• Declines in Forest Product
Volumes
• Declines in Automotive Traffic
• Declines in Steel and Metals
Businesses
• Flattening Shale Related
Volumes
AAR Data

20
Despite fundamental shifts in the composition of rail traffic, Chicago’s role continues to grow
*Includes traffic which had more than one event in Chicago
Terminal Classification of Movement Originated Terminated Interchanged Other* Total
Loaded Freight Cars 493,274 546,983 1,475,239 395,848 2,911,344
Empty Freight Cars 105,033 61,385 1,137,423 362,060 1,665,901
Total Freight Cars 598,307 608,368 2,612,662 757,908 4,577,245
Loaded Intermodal Units 1,854,250 1,683,448 713,350 37,130 4,288,178
Empty Intermodal Units 107,387 387,139 57,197 41,039 592,762
Total Intermodal Units 1,961,637 2,070,587 770,547 78,169 4,880,940
CHICAGO
Source: AAR, NS Data
0.60
0.80
1.00
1.20
2006 2007 2008 2009 2010 2011 2012 2013
Total NS Volume and Volume through Illinois Indexed to 2006
Illinois Volume Total NS Volume

21
So what are the railroads doing to address these changes?
Pic of Track work (does not need to be this size)

22
Railroad Spending on Infrastructure and Equipment* ($ billions, current dollars)
$575 Billion Back Into the Network Since 1980
*AAR: Data in chart for Class I railroads only

23
CREATE Program Partnership – $3.8 Billion to fix the Chicago rail network - $1.3 pledged so far
24
What is NS Doing To Address These Changes?
• Crews
• Locomotives
• Strategic Capacity Additions

25
Resource Update
Crews During the first half of 2015, NS increased the
number of qualified Train & Engine employees by over 460.
Locomotives The NS locomotive fleet is at record levels.
75 new SD70Ace locomotives were received in 2014
100 used SD90MACs to be received by end of 2015

26
Chicago 47th Street Expansion Will reduce interference between NS Intermodal operations and other operations on NS’ Chicago line
Echo Wye & Connection
Englewood Flyover
• Prevents intermodal trains from backing in and backing out of one side of the 47th Street intermodal facility
• Allows multiple intermodal train movements to occur at the same time • Reduces impact to the mainline from intermodal trains entering and exiting
Chicago 47th Street • Complements the improvement in the mainline fluidity benefits gained from
the Englewood flyover.

27
NS Chicago Line
(46 Daily Freight Trains)
(14 Daily Amtrak Trains)
Proposed Overhead Bridge
Metra Rock Island District
(78 Daily Commuter Trains)
NS Park Manor
Intermodal Yard
Englewood Interlocking
Milepost CD-515.7
(Controlled by Metra)
Englewood Flyover
• Metra flyover operation Now fully operational
• Total Project Cost $140 M
• Eliminates at grade train interference between at least 78 north-south Metra trains per day and at least 60 east-west NS/Amtrak trains.
28
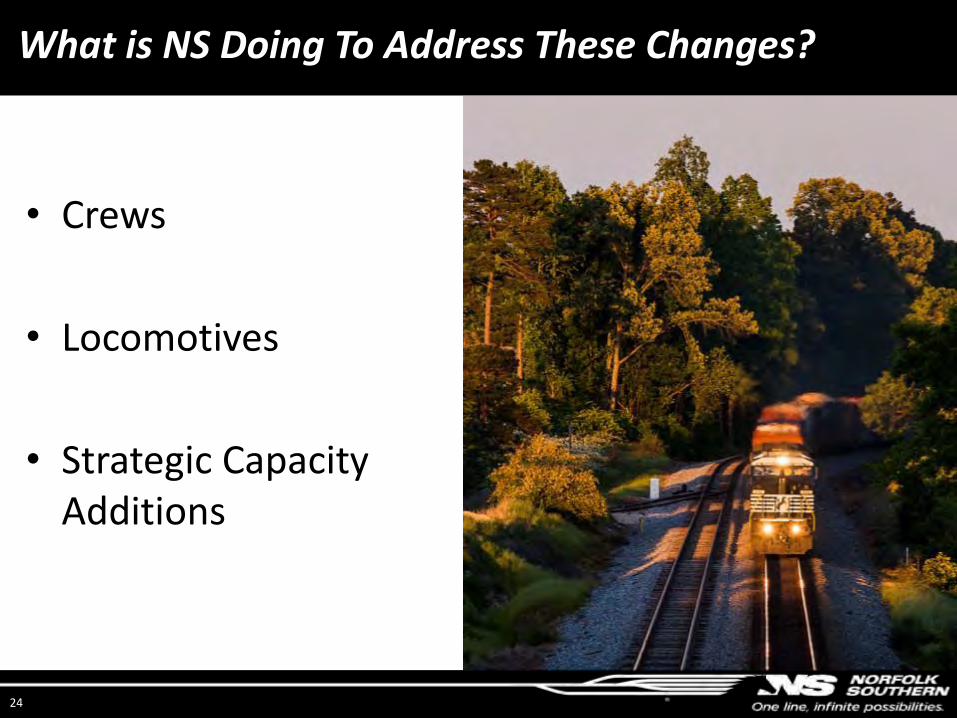
Bellevue Yard Expansion
Bellevue Yard
Bellevue Yard in Ohio is at the crossroads of NS’ key Northern route structure.

29
Bellevue Expansion

30
Bellevue Expansion
Additions: New Track - 38.5 Miles Class Tracks - 35 Turnouts - 149 Buildings (3) – 11,340 sq ft. Service Roads – 10.4 Miles Power Switches – 162 Hump Control System Processing Capacity increase from 1,800 to up to 3,500 cars daily.

31
Norfolk Southern’s Corridor Strategy
31
•Completed 2008
•Cost: $300M MERIDIAN
•Completed 2012
•Cost: $630M CRESCENT
•Completed 2010
•Cost: $191M HEARTLAND
•Completed 2010
•Cost: $165M PAN AM
32
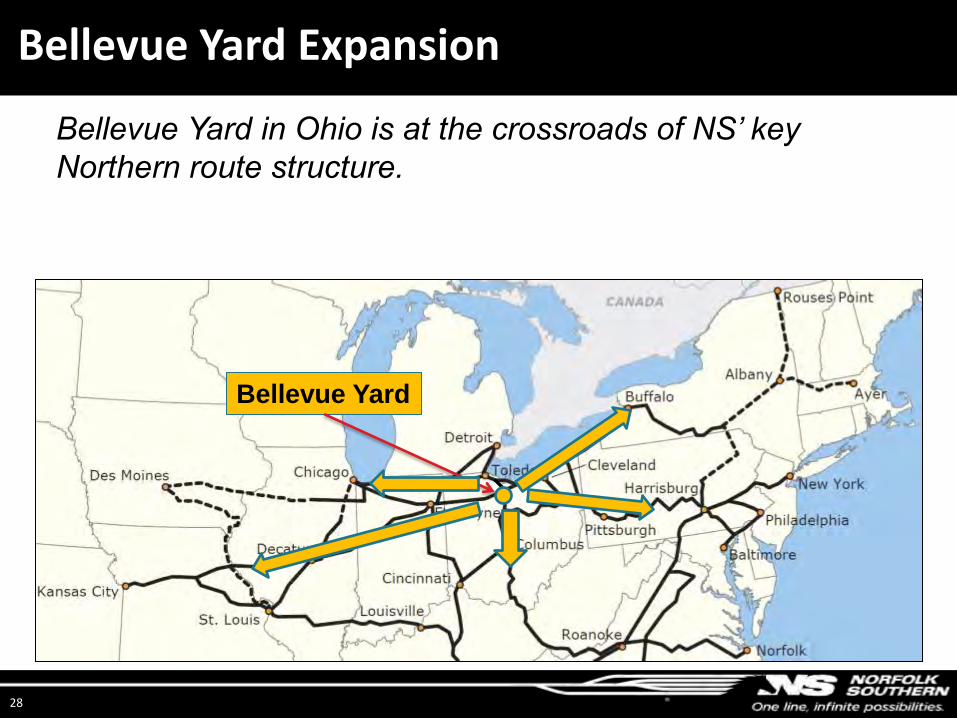
New Crescent Terminals
32
Memphis
Greencastle
Birmingham
Charlotte
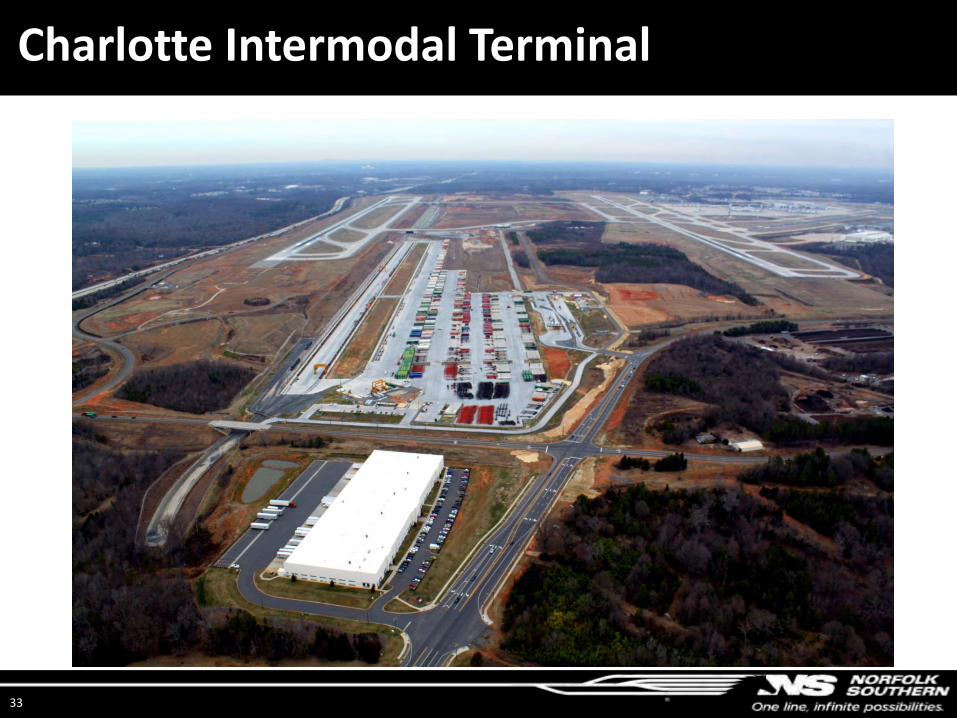
33
Charlotte Intermodal Terminal

34
South Carolina Inland Port One Model for Shorthaul Intermodal
• Joint project between South Carolina State Ports Authority and NS
• 236 rail miles from Port of Charleston
• Operational Date: September 2013
Greer,
SC
Charleston
236 Rail
Miles

35
D&H Acquisition – Expanding our New England and New York Competitive position
35

36
Other Things We, as a Shipping Community, Need to Think About
Other Issues

37
Conveyance Shifts Although not quantifiable across US Railroads, there has been a shift to more unit trains
Source – NS Internal Data

38
Regulation Could have meaningful service impact in the future
• PTC
• Tank Car and Hazardous Material Regulations

39
60’ High Roof
50’ 100-ton low roof
Box Conveyances Moving towards standard equipment
53’ EMP container

40
Closing Thoughts
• The strain that we have seen in the U.S. Rail Network in 2014 and 2015 is abating
• Structural changes in the commodity and geographic composition of rail freight have imposed additional stress on some parts of the rail network
• All the railroads have demonstrated their commitment to providing the tactical resources and strategic investments to address these shifts in freight
– The issue is more one of timing
• Regulatory threats are real and potentially immediate
• NS continues to make tactical and infrastructure investments to drive service improvements

41
Thank You!
Related Documents