Journal of Management Research and Analysis 2021;8(4):159–169 Content available at: https://www.ipinnovative.com/open-access-journals Journal of Management Research and Analysis Journal homepage: https://www.jmra.in/ Original Research Article Trend identification with the relative strength index (RSI) technical indicator –A conceptual study Ashok Kumar Panigrahi 1, *, Kushal Vachhani 1 , Suman Kalyan Chaudhury 2 1 Dept. of Technology Management, Narsee Monjee Institute of Management Studies, Shirpur, Dhule, Maharashtra, India 2 Dept. of Business Administration, Berhampur University, Brahmapur, Odisha, India ARTICLE INFO Article history: Received 22-11-2021 Accepted 29-11-2021 Available online 15-12-2021 Keywords: Trading Strategy RSI Technical Indicator Momentum Trading Technical Analysis ABSTRACT We all must agree that the word "trend" is now the buzzword of the stock market. As a part of investment strategy and analysis, it is always suggested that the investors should keep an eye on medium-term and short-term changes in addition to longer-term (secular) patterns. Traders and investors use the RSI as a momentum indicator. Overbought and oversold situations are indicated by RSI values between 70 and 30. Over the past two decades, several techniques have been developed to analyze NIFTY 50 data for investment purposes. In this paper, we have estimated the returns by looking at the two trends i.e., 50- 50 and 60-40. In addition to this, how to trade and back-test our strategy is also explained. Applying these two RSI strategies to the NIFTY 50 chart revealed that 50-50 offers a higher long-term return, while 60-40 provides a superior short-term return. Finally, the strategies’ returns F-statistics and P-values were calculated and analyzed to determine their significance level and acceptability. This is an Open Access (OA) journal, and articles are distributed under the terms of the Creative Commons Attribution-NonCommercial-ShareAlike 4.0 License, which allows others to remix, tweak, and build upon the work non-commercially, as long as appropriate credit is given and the new creations are licensed under the identical terms. For reprints contact: [email protected] 1. Introduction 1.1. Introduction to RSI technical indicator The Relative Strength Index (RSI) is a J. Wilder-invented momentum oscillator that estimates price changes by measuring how quickly and in which direction prices move. The RSI may be anything between 0 and 100. According to author Donald J. Wilder, RSI is overbought when it rises over 70, and oversold when it falls below 30. There are several ways to use swinging points, divergences, and crossing the centreline to produce signals. Furthermore, the RSI is often utilized to detect the unfolding trend. It is very important to pay attention to the main trend to guarantee those indicator findings are correctly interpreted. According to Constance Brown, CMT, a well-known market analyst, a reading of the RSI that is much higher than the historical * Corresponding author. E-mail address: [email protected] (A. K. Panigrahi). average would indicate a bullish trend, while a reading that is significantly lower than the historical average would signal a bearish trend. 1 1.2. Calculation of RSI To make things simpler, RSI has been broken down into its basic components: RS, Average Gain, and Average Loss. Wilder suggested the 14 periods in his book as the default period lengths. If there are no losses, there are no positive values to reflect them. To get initial estimates of average gain and average loss, simple 14-period averaging is employed: 1. FAG= Sum of Gains over the past 14 periods / 14 2. FAL= Sum of Losses over the past 14 periods / 14 Where FAG=first average gain and FAL=first average loss In the second part of calculations, it is based on the prior averages and the current gain loss: https://doi.org/10.18231/j.jmra.2021.033 2394-2762/© 2021 Innovative Publication, All rights reserved. 159

Welcome message from author
This document is posted to help you gain knowledge. Please leave a comment to let me know what you think about it! Share it to your friends and learn new things together.
Transcript
Journal of Management Research and Analysis 2021;8(4):159–169
Content available at: https://www.ipinnovative.com/open-access-journals
Journal of Management Research and Analysis
Journal homepage: https://www.jmra.in/
Original Research Article
Trend identification with the relative strength index (RSI) technical indicator –Aconceptual study
Ashok Kumar Panigrahi1,*, Kushal Vachhani1, Suman Kalyan Chaudhury2
1Dept. of Technology Management, Narsee Monjee Institute of Management Studies, Shirpur, Dhule, Maharashtra, India2Dept. of Business Administration, Berhampur University, Brahmapur, Odisha, India
A R T I C L E I N F O
Article history:Received 22-11-2021Accepted 29-11-2021Available online 15-12-2021
Keywords:Trading StrategyRSITechnical IndicatorMomentum TradingTechnical Analysis
A B S T R A C T
We all must agree that the word "trend" is now the buzzword of the stock market. As a part of investmentstrategy and analysis, it is always suggested that the investors should keep an eye on medium-term andshort-term changes in addition to longer-term (secular) patterns. Traders and investors use the RSI as amomentum indicator. Overbought and oversold situations are indicated by RSI values between 70 and30. Over the past two decades, several techniques have been developed to analyze NIFTY 50 data forinvestment purposes. In this paper, we have estimated the returns by looking at the two trends i.e., 50-50 and 60-40. In addition to this, how to trade and back-test our strategy is also explained. Applyingthese two RSI strategies to the NIFTY 50 chart revealed that 50-50 offers a higher long-term return, while60-40 provides a superior short-term return. Finally, the strategies’ returns F-statistics and P-values werecalculated and analyzed to determine their significance level and acceptability.
This is an Open Access (OA) journal, and articles are distributed under the terms of the Creative CommonsAttribution-NonCommercial-ShareAlike 4.0 License, which allows others to remix, tweak, and build uponthe work non-commercially, as long as appropriate credit is given and the new creations are licensed underthe identical terms.
For reprints contact: [email protected]
1. Introduction
1.1. Introduction to RSI technical indicator
The Relative Strength Index (RSI) is a J. Wilder-inventedmomentum oscillator that estimates price changes bymeasuring how quickly and in which direction prices move.The RSI may be anything between 0 and 100. Accordingto author Donald J. Wilder, RSI is overbought when itrises over 70, and oversold when it falls below 30. Thereare several ways to use swinging points, divergences, andcrossing the centreline to produce signals. Furthermore, theRSI is often utilized to detect the unfolding trend. It is veryimportant to pay attention to the main trend to guaranteethose indicator findings are correctly interpreted. Accordingto Constance Brown, CMT, a well-known market analyst, areading of the RSI that is much higher than the historical
* Corresponding author.E-mail address: [email protected] (A. K. Panigrahi).
average would indicate a bullish trend, while a readingthat is significantly lower than the historical average wouldsignal a bearish trend.1
1.2. Calculation of RSI
To make things simpler, RSI has been broken down intoits basic components: RS, Average Gain, and AverageLoss. Wilder suggested the 14 periods in his book as thedefault period lengths. If there are no losses, there are nopositive values to reflect them. To get initial estimates ofaverage gain and average loss, simple 14-period averagingis employed:
1. FAG= Sum of Gains over the past 14 periods / 142. FAL= Sum of Losses over the past 14 periods / 14
Where FAG=first average gain and FAL=first average lossIn the second part of calculations, it is based on the prior
averages and the current gain loss:
https://doi.org/10.18231/j.jmra.2021.0332394-2762/© 2021 Innovative Publication, All rights reserved. 159
160 Panigrahi, Vachhani and Chaudhury / Journal of Management Research and Analysis 2021;8(4):159–169
1. AG= [(previous Average Gain) x 13 + current Gain] /14.
2. AL= [(previous Average Loss) x 13 + current Loss] /14.
Where, AG=average gain and AL=average lossSmoothing techniques comparable to those used to build
an exponential moving average are utilized in this case.In addition to being more precise as computation timeincreases, RSI readings also become more consistent.2
1.3. Scope of research
Despite the vast amount of information available aboutstock trading and investing, new traders and investorsoften lose money in the stock market owing to a lackof knowledge about trading and investing in stocks usingtechnical indicators. The RSI technical indicator and twostrategies for modifying the RSI’s default parameters werethe subjects of our paper. By presenting knowledge ofmarket trends and by utilizing the RSI indicator, thesepapers demonstrate how to find particular market trends.These two strategies have also been applied to the NIFTY 50index chart, and the resulting trend has been studied usingtwo modified RSI strategies mentioned in the paper.3
1.4. Research methodology
Trends and the RSI technical indicator were two of themost significant topics we discussed in this paper. Weutilized trading view.com, a website that allows traders andinvestors to analyze charts and apply technical indicatorsto them.4 I gathered all the secondary data from theYahoo Finance website to determine the NIFTY 50 indexs’closing price. Excel is used to compute RSI readings,and the resulting calculations are generated. BecauseTradingView.com offers free charting, these new RSIstrategies may be used in observational research. We havedescribed how to apply the RSI technical indicator to a chartand then how to analyze a trend using a new RSI techniquein the paper that follows. To compute the F-test, we firstestimated the return in a particular year of both strategiesand then calculated the F- statistical value and P-value inexcel.
2. Literature Review
The currency market served as a platform for Bing Andersonand Shuyun Li to explore market efficiency (2015). If themarket is efficient, there will be no profitability for the RSI,which implies that the market is not efficient. Conversely, ifthe market is not efficient, then it must have profitability,which implies that the market is efficient. While theseresearchers found that over the last decade when an RSIequal to 30 is used to indicate a buying opportunity and an
RSI of over 70 is used to signal a selling opportunity,RSI does not provide profitable trading but rather resultsin small losses. According to the paper, they note thatthe profitability of an indicator diminishes when well-known technical indicators and conventional parameterconfigurations are used by practitioners. As well, the study’sadvice was also passed on to practitioners, who wereadvised to pursue the "unpaved" route, and to academics,who found the study’s conclusions to apply to the marketefficiency theory.5
Murtadha Alhilfi (2019) said in his study that one methodto assist speculators in making sound trading decisions isto use technical analysis through the RSI. His objectiveis to show the value of technical analysis by using theRSI in generating speculations, forecasting future marketchanges, and contributing to the process of making criticaldecisions by providing suggestions. Using the RelativeStrength Index (RSI) enables the Bank of Baghdad tomaintain a steady position on the Iraqi Stock Exchange. Byoffering a proactive suggestion, the RSI helped speculatorsat the Bank of Baghdad on the Iraqi Stock Exchange. Hecomputed and used RSI analysis to the Bank of Baghdad’sstocks and found that RSI is a useful and effective techniquefor doing technical analysis on the bank’s equities. RSIallows traders at the Iraq Stock Exchange’s bank of Baghdadto anticipate market trends and forecast future prices.6
Dr. Yogesh D Mahajan and Dr. Krishnamurthy Inumula(2015) used the RSI AND MACD technical indicators toanalyze companies in the information technology, financial,automotive, and fast-moving consumer goods (FMCG)sectors listed on Indian stock exchanges such as the NSE.To increase the effectiveness of the MACD and RSIindicators, they were simulated; the simulations changed theparameters of both indicators. This research demonstratesempirically that both the optimum MACD and optimalRSI indicators are advantageous for creating a successfulinvesting strategy and accepts the concept that optimizedMACD and RSI indicators are much more lucrative than theconventional buy-and-hold strategy. The findings indicatethat optimizing the MACD and RSI indicators significantlyreduced the number of trading sessions.7
Giner Alor-Hernandez, Rubén Posada-Gomez,Guillermo Cortes-Robles, Alejandro Rodrguez- González,Fernando Guldrs-Iglesias, Ricardo Colomo-Palacios, JuanMiguel Gomez-Berbis, and Enrique Jimenez-Domingo(2010) conducted RSI-based research intending to developsystems capable of investing automatically This stockmarket simulation was built entirely using RSI financialindicators and heuristic methods since the formulawas derived using these techniques. Additionally, theresearchers recommended four additional studies that mightbe conducted based on the current results.8
Adrian Taran-Morosan (2011) examined the same setof data using both traditional and modified RSI. He also
Panigrahi, Vachhani and Chaudhury / Journal of Management Research and Analysis 2021;8(4):159–169 161
incorporated trading volume in the method’s calculatingformula. Finally, findings acquired using the indicator’straditional form will be compared to those obtained usingthe modified version. He found that, in comparison to theoriginal form, his version resulted in a greater advantagewhen a different, even opposing interpretation was used.And, in the alternative case, it resulted in much largerlosses. This implies that the study indicates that short-term trends will persist, at least temporarily. It seems asif the conventional view is incorrect, while the alternativeunderstanding produces beneficial results. Using the RSIversion that we suggest yields the best results.
Dr. Bhargavi. R, Dr. Srinivas Gumparthi, and Anith.R (2017) evaluated short-term investment performance bycomputing the 14-day RSI for chosen short-term investmentstocks and determining if the 14-day RSI is equal toor greater than the original 14-day RSI. They noticedthat investors suffered as a result of portfolio securitiesbeing mismanaged. Selecting inappropriate securities mayresult in investor losses. And to address this issue, theyrecommended using the RSI tool and incorporating it intothe stock-picking process. They discovered that RSI can beutilized to construct portfolios and make short- and long-term investment choices. It predicts the buy and sells signalsfor a variety of stocks accurately. The P/E ratio is a moreaccurate indicator of profitability than earnings per share.Their study emphasized the short- and long-term investmentpotential of the twenty companies. They concluded as aresult of their study.
Firuz Kamalov and Ikhlaas Gurrib (2019) use animproved version of the Relative Strength Index (RSI)model to forecast currency pairs where one of theinstruments is the US dollar. A new model (AdRSI) wasconstructed and implemented by taking daily data spanning2001– 2015 into consideration. When it comes to energymarkets, their results show that the risk was considerable; incontrast, the annualized risk for the Chinese yuan was quitelow. AdRSI’s new model provided an impressive increase inannualized returns, a decrease in the number of transactions,and a significant increase in annualized risk. Concerningreward-to-volatility, the buy-and-hold investment strategycame out on top.1,9
3. Need of research
When we conducted a literature analysis of many papers,we found that similar types of studies had been conductedon the RSI subject. Various authors have addressed theuse of RSI indicators on stock charts and conducted acomparative study. Additionally, the authors utilized otherindicators within RSI and conducted a research study. RSIis a momentum indicator that provides insight into markettrends. However, no study on the subject of trend analysisusing RSI has been performed. As a result, we chose to writea research paper on trend analysis utilizing RSI.
Many traders and investors lose money in the stockmarket by using technical indicators. When it comes totrading, new traders make one common mistake: they do notfollow the market’s trend. To put it another way, whenevera trader wants to enter a trade, traders must first determineif the market is trending upward or downward. If there is anuptrend, traders should take a long position, and if there isa downtrend, traders should take a short position. Similarly,when it comes to short-term trends, investors make mistakesas well. By analyzing the NIFTY 50 index chart over thepast 20 years, we were able to develop two methods foridentifying market trends.
4. Steps To Add Rsi Indicator On Chart
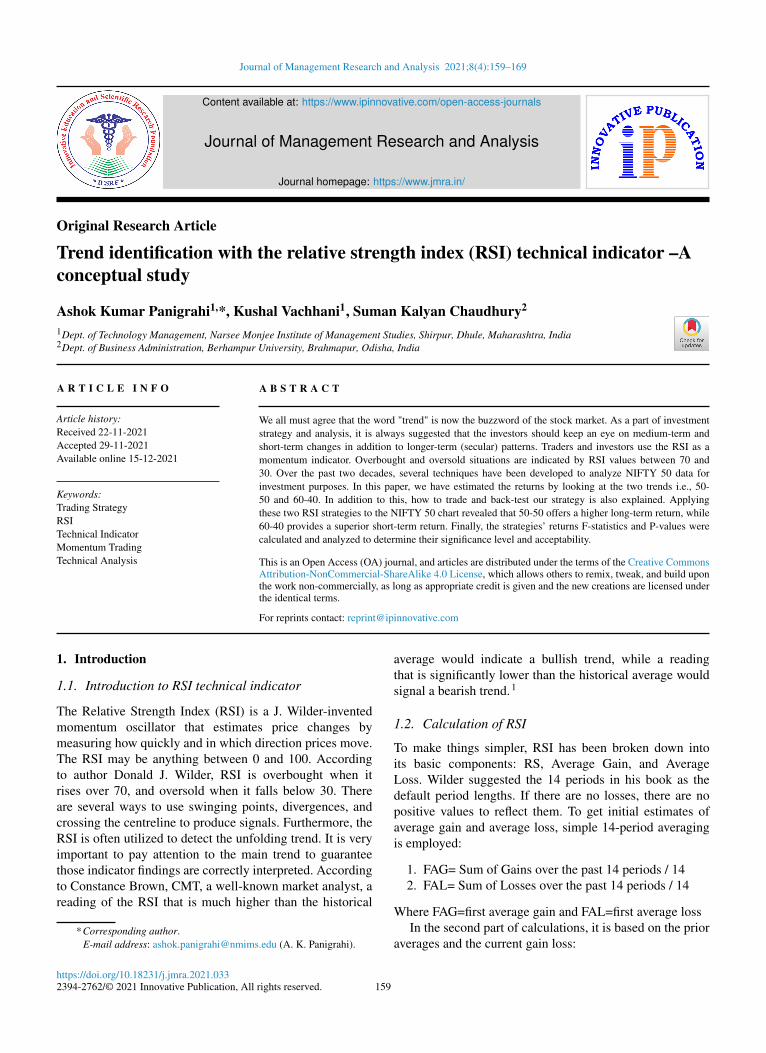
STEP-1: We have explained both strategies using a weeklytime frame so a selection of weekly time frames isnecessary.
Fig. 1: (Selection of weekly time frame) (https://in.tradingview.com/)
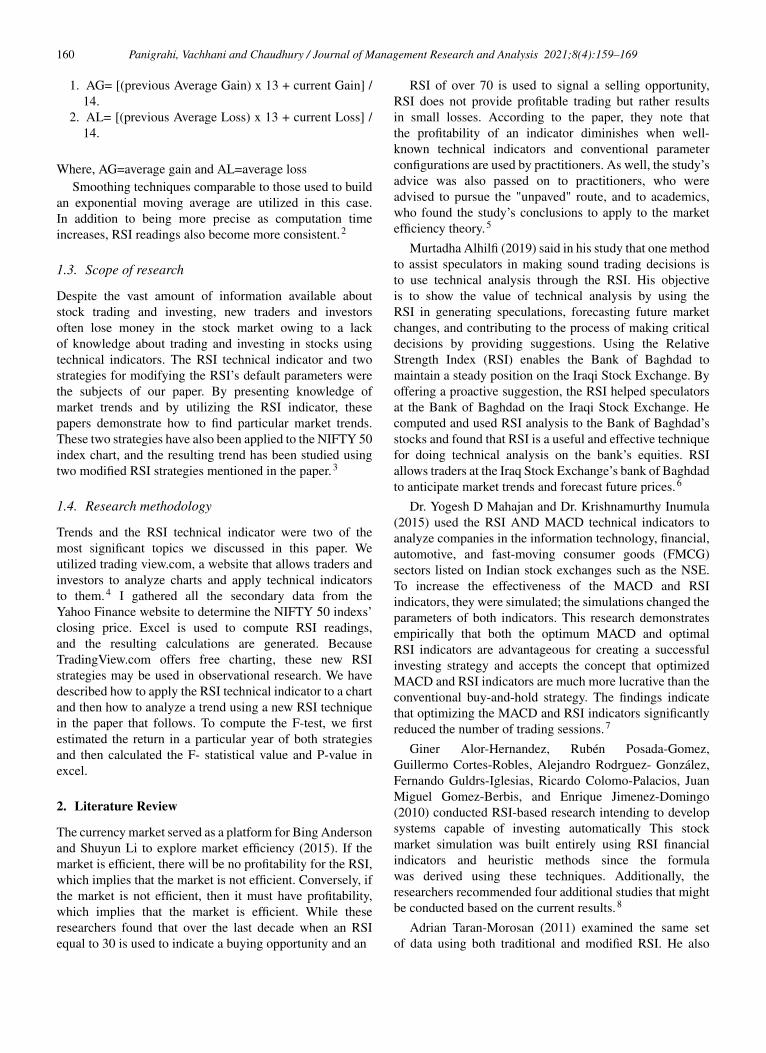
Step-2: In this step, we have to click the indicatorssection to add RSI to the chart.
Fig. 2: (Adding RSI indicator to chart) (https://in.tradingview.com/)
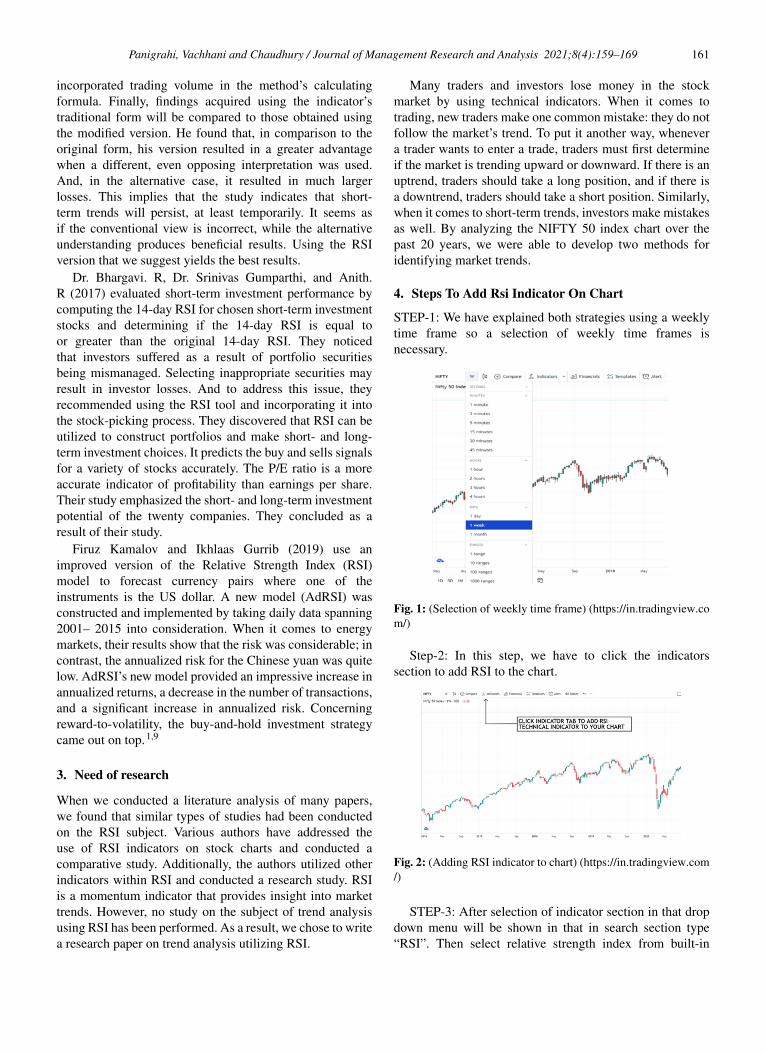
STEP-3: After selection of indicator section in that dropdown menu will be shown in that in search section type“RSI”. Then select relative strength index from built-in
162 Panigrahi, Vachhani and Chaudhury / Journal of Management Research and Analysis 2021;8(4):159–169
sections. Then RSI will be added to the chart.
Fig. 3: (Searching and selection of RSI indicator in indicator tab)(https://in.tradingview.com/)
After applying all the three steps one can see Figure 4will appear.
Fig. 4: (Chart after applying RSI on the chart) (https://in.tradingview.com/)
Fig. 5: (Default RSI on the chart) (https://in.tradingview.com/)
5. Default RSI
To help investors/traders in dealing with a variety ofcircumstances, one should establish RSI parameters inadvance to achieve your analytical goals for the situation.The default RSI period is 14 days. But we may utilizethe RSI to detect overbought and oversold conditions for alimited period. Since the RSI rises, it is better at identifyingwide market changes. Price changes affect the RSI’s range-bound behavior (0-100). The upper/lower bars denote
Fig. 6: (Default setting of RSI length) (https://in.tradingview.com/)
Fig. 7: (Default setting of RSI bands (https://in.tradingview.com/)
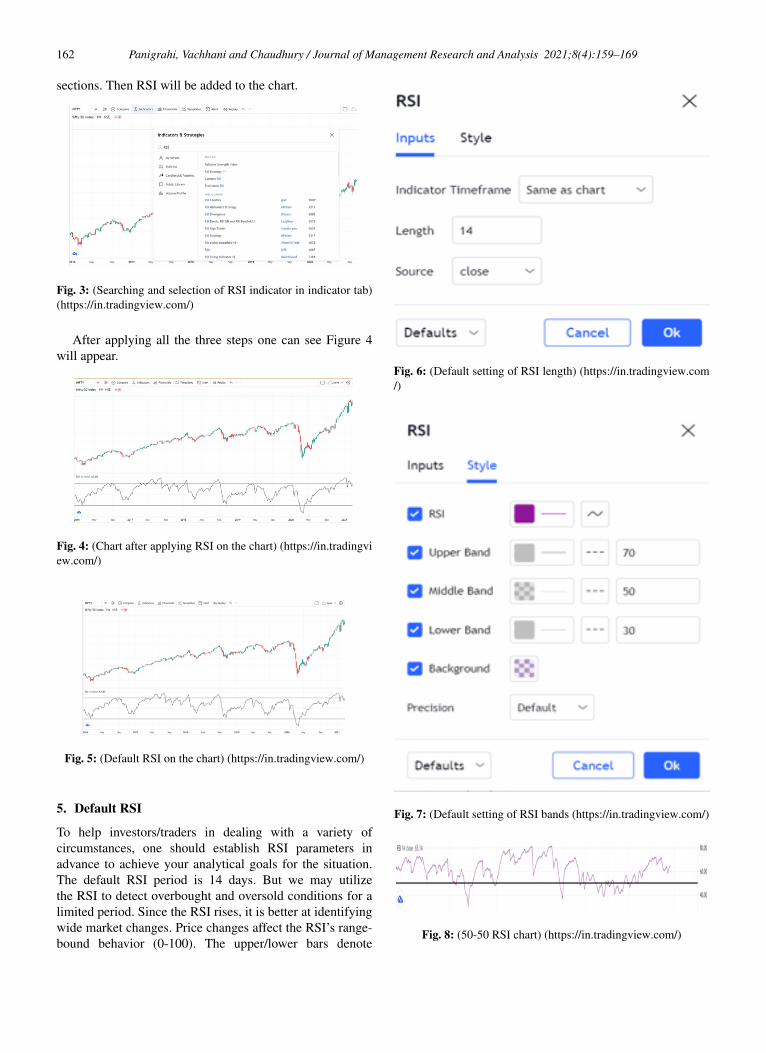
Fig. 8: (50-50 RSI chart) (https://in.tradingview.com/)
Panigrahi, Vachhani and Chaudhury / Journal of Management Research and Analysis 2021;8(4):159–169 163
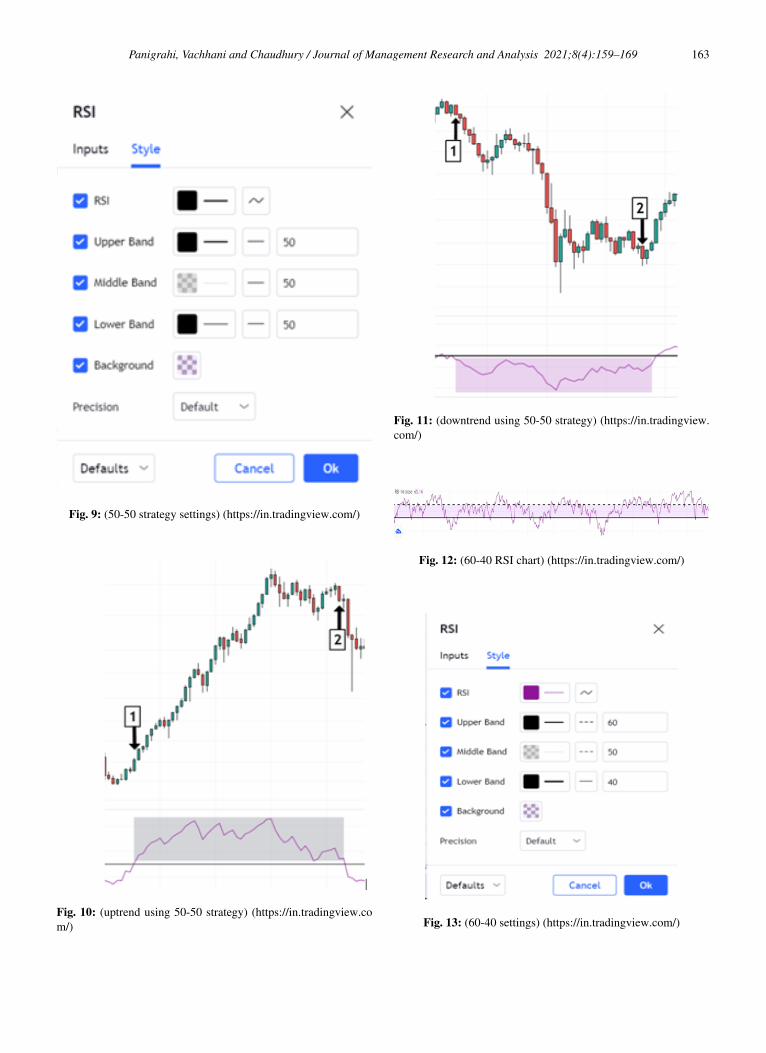
Fig. 9: (50-50 strategy settings) (https://in.tradingview.com/)
Fig. 10: (uptrend using 50-50 strategy) (https://in.tradingview.com/)
Fig. 11: (downtrend using 50-50 strategy) (https://in.tradingview.com/)
Fig. 12: (60-40 RSI chart) (https://in.tradingview.com/)
Fig. 13: (60-40 settings) (https://in.tradingview.com/)
164 Panigrahi, Vachhani and Chaudhury / Journal of Management Research and Analysis 2021;8(4):159–169
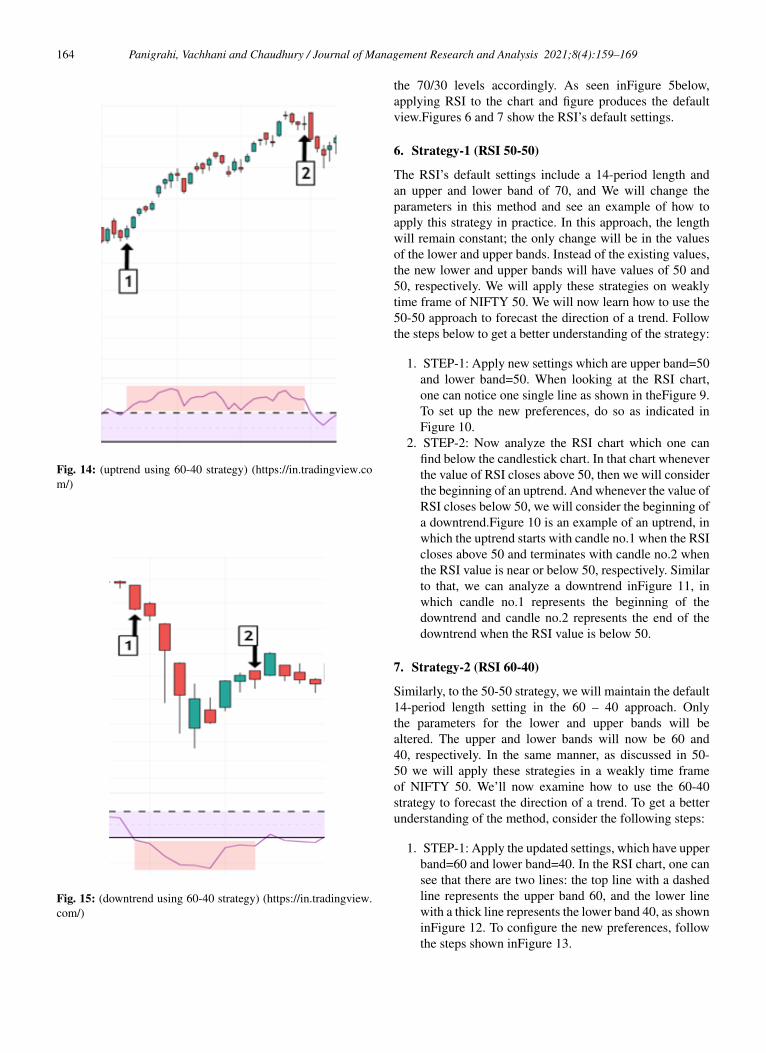
Fig. 14: (uptrend using 60-40 strategy) (https://in.tradingview.com/)
Fig. 15: (downtrend using 60-40 strategy) (https://in.tradingview.com/)
the 70/30 levels accordingly. As seen inFigure 5below,applying RSI to the chart and figure produces the defaultview.Figures 6 and 7 show the RSI’s default settings.
6. Strategy-1 (RSI 50-50)
The RSI’s default settings include a 14-period length andan upper and lower band of 70, and We will change theparameters in this method and see an example of how toapply this strategy in practice. In this approach, the lengthwill remain constant; the only change will be in the valuesof the lower and upper bands. Instead of the existing values,the new lower and upper bands will have values of 50 and50, respectively. We will apply these strategies on weaklytime frame of NIFTY 50. We will now learn how to use the50-50 approach to forecast the direction of a trend. Followthe steps below to get a better understanding of the strategy:
1. STEP-1: Apply new settings which are upper band=50and lower band=50. When looking at the RSI chart,one can notice one single line as shown in theFigure 9.To set up the new preferences, do so as indicated inFigure 10.
2. STEP-2: Now analyze the RSI chart which one canfind below the candlestick chart. In that chart wheneverthe value of RSI closes above 50, then we will considerthe beginning of an uptrend. And whenever the value ofRSI closes below 50, we will consider the beginning ofa downtrend.Figure 10 is an example of an uptrend, inwhich the uptrend starts with candle no.1 when the RSIcloses above 50 and terminates with candle no.2 whenthe RSI value is near or below 50, respectively. Similarto that, we can analyze a downtrend inFigure 11, inwhich candle no.1 represents the beginning of thedowntrend and candle no.2 represents the end of thedowntrend when the RSI value is below 50.
7. Strategy-2 (RSI 60-40)
Similarly, to the 50-50 strategy, we will maintain the default14-period length setting in the 60 – 40 approach. Onlythe parameters for the lower and upper bands will bealtered. The upper and lower bands will now be 60 and40, respectively. In the same manner, as discussed in 50-50 we will apply these strategies in a weakly time frameof NIFTY 50. We’ll now examine how to use the 60-40strategy to forecast the direction of a trend. To get a betterunderstanding of the method, consider the following steps:
1. STEP-1: Apply the updated settings, which have upperband=60 and lower band=40. In the RSI chart, one cansee that there are two lines: the top line with a dashedline represents the upper band 60, and the lower linewith a thick line represents the lower band 40, as showninFigure 12. To configure the new preferences, followthe steps shown inFigure 13.
Panigrahi, Vachhani and Chaudhury / Journal of Management Research and Analysis 2021;8(4):159–169 165
2. STEP-2: As with the 50-50 strategy, one can find theRSI chart below the candlestick chart. When the RSIvalue closes above 60, we believe that a new uptrendhas started; when the RSI value closes below 40, weconsider that a new downtrend has begun.Figure 14illustrates an uptrend in which the uptrend beginswith candle no.1 as the RSI value closes above 60and ends with candle no.2 as the RSI value closesbelow or around 60. Similarly, as shown inFigure 15,a downtrend begins with candle no.1 as the RSI valuecloses below 40 and ends with candle no.2 as the RSIvalue closes above or around 40.
8. How To Trade Using 50-50 And 60-40 Strategy
1. As previously stated, if the RSI closes above 50 duringan uptrend, the trader or investor must enter the trade;however, how long the trader or investor must remainin the trade is determined by the risk-reward ratio andother criteria listed below in this section; similarly, the60-40 strategy follows the same rules.
2. When a trader or investor enters a downtrend when theRSI falls below 50, the trader or investor must decidehow long to remain in the trade. Likewise, the 60-40strategy is applicable.
3. Concerning our findings, we have estimated returnsbased on historical data, and although looking at thenumber of returns, it appears that this had an ambitiousreturn, yet it produced that high of a return. When itcomes to trading, one must establish a set of tradingcriteria in advance.
4. Several specific rules that traders should followinclude: controlling one’s emotions, not over trading,always accepting profits, managing trade risk (the risk-reward ratio), trusting one’s analysis, monitoring one’strades, homering stop losses, and preparing one’s trade,time frame for trading, and target
9. How To Back-Test Any Strategy
Back-testing any strategy may be accomplished byfollowing the procedures outlined below:
1. Define a specific parameter for testing purposes.2. Specify the time frame for testing the approach on the
chart.3. Historical price charts may be used to find potential
trades.4. Analyze and record the trade following the specified
entry and exit points.5. Risk to reward and net return of back-tested data
should be evaluated.
10. Findings
To comprehend the findings sections, we must firstunderstand the table of findings, as illustrated inTables 1and 2. The titles in the table are as follows, and they arethe same for both tables:
1. TREND FROM: This is the date on which an uptrendor downtrend begins.
2. TREND TO: This column indicates the end of anuptrend or downturn.
3. TOTAL NO. OF TRENDS: This column indicates thetotal number of days that the NIFTY 50 has been in aspecific trend.
4. TYPE OF TREND: These indicate the direction of thetrend, either upward or downward.
5. TREND FROM CLOSING PRICE: This is the closingprice on the day the trend began.
6. TREND TO CLOSING PRICE: This is the closingprice on the day the trend ended.
7. RETURN (%): This column indicates the total numberof returns generated by a given trend.
Both strategies may be utilized observation ally in naturesince they do not need a great deal of computation. To learnthis technique, one must do back-testing on any stock orindex chart. One must also examine many charts to masterthis strategy. The steps for doing a back-test on any strategyare detailed above.
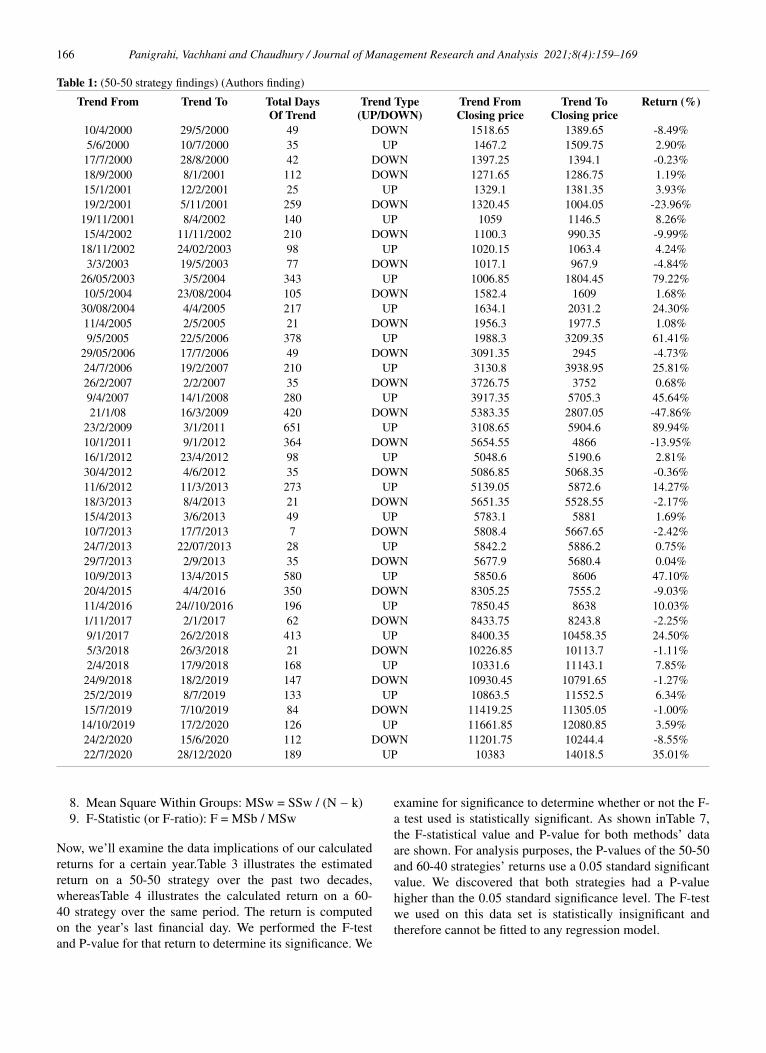
In terms of the 50-50 approach’s findings, we havediscovered that this technique offers the best long-termreturn. As shown in Table 1, the larger the duration of thetrend, the higher the return. The trend may be down orrising.
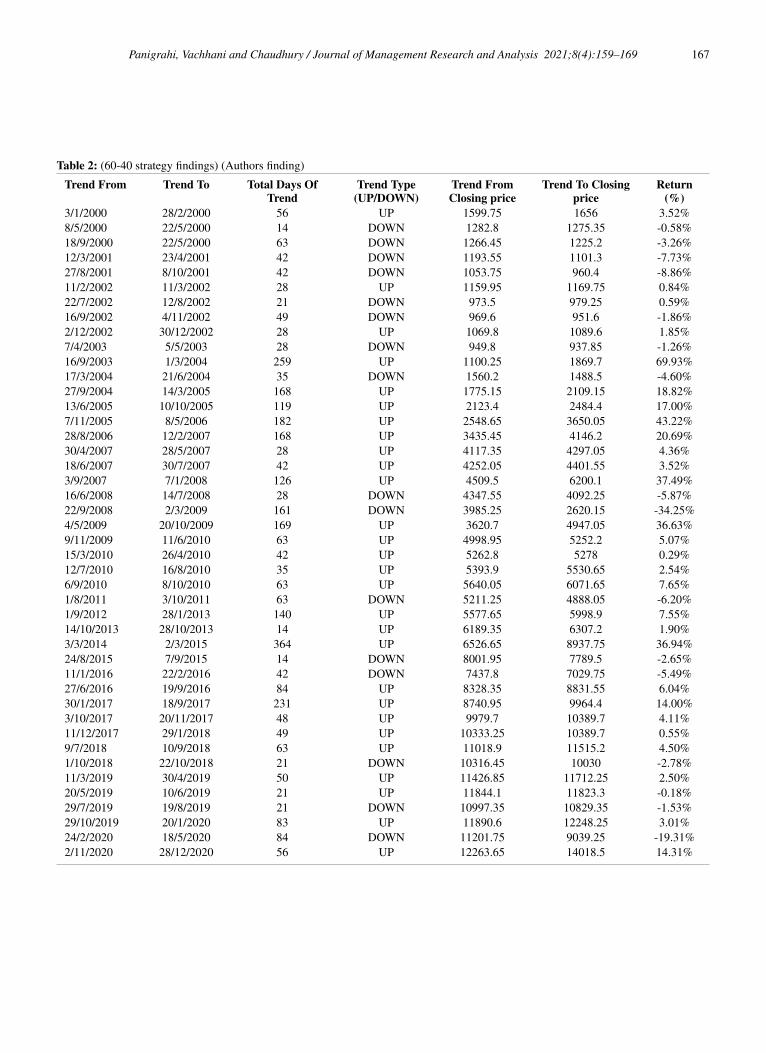
We noticed that the 60-40 approach generates a very highrate of return during a short-term trend. As shown inTable 2,a trend that lasted about two months (approximately 60days) generated a very high rate of return in the short term.
Below shownTable 1 is the formula for the statisticalmodel and Table 2 and Table 3 are actual calculated valuesfor the model.
Were,
1. Between Groups Degrees of Freedom: DF = k − 1,where k is the number of groups
2. Within Groups Degrees of Freedom: DF = N − k,where N is the total number of subjects
3. Total Degrees of Freedom: DF = N — 14. Sum of Squares Between Groups: SSb =∑
k i=1 ni (xi− x)2, where ni is the number ofsubjects in the i-th group
5. Sum of Squares Within Groups: SSw =∑k i=1 (ni−1) Si2, where Si is the standard deviation
of the i-th group6. Total Sum of Squares: SSt = SSb + SSw7. Mean Square Between Groups: MSb = SSb / (k − 1)
166 Panigrahi, Vachhani and Chaudhury / Journal of Management Research and Analysis 2021;8(4):159–169
Table 1: (50-50 strategy findings) (Authors finding)
Trend From Trend To Total DaysOf Trend
Trend Type(UP/DOWN)
Trend FromClosing price
Trend ToClosing price
Return (%)
10/4/2000 29/5/2000 49 DOWN 1518.65 1389.65 -8.49%5/6/2000 10/7/2000 35 UP 1467.2 1509.75 2.90%17/7/2000 28/8/2000 42 DOWN 1397.25 1394.1 -0.23%18/9/2000 8/1/2001 112 DOWN 1271.65 1286.75 1.19%15/1/2001 12/2/2001 25 UP 1329.1 1381.35 3.93%19/2/2001 5/11/2001 259 DOWN 1320.45 1004.05 -23.96%19/11/2001 8/4/2002 140 UP 1059 1146.5 8.26%15/4/2002 11/11/2002 210 DOWN 1100.3 990.35 -9.99%18/11/2002 24/02/2003 98 UP 1020.15 1063.4 4.24%3/3/2003 19/5/2003 77 DOWN 1017.1 967.9 -4.84%
26/05/2003 3/5/2004 343 UP 1006.85 1804.45 79.22%10/5/2004 23/08/2004 105 DOWN 1582.4 1609 1.68%30/08/2004 4/4/2005 217 UP 1634.1 2031.2 24.30%11/4/2005 2/5/2005 21 DOWN 1956.3 1977.5 1.08%9/5/2005 22/5/2006 378 UP 1988.3 3209.35 61.41%
29/05/2006 17/7/2006 49 DOWN 3091.35 2945 -4.73%24/7/2006 19/2/2007 210 UP 3130.8 3938.95 25.81%26/2/2007 2/2/2007 35 DOWN 3726.75 3752 0.68%9/4/2007 14/1/2008 280 UP 3917.35 5705.3 45.64%21/1/08 16/3/2009 420 DOWN 5383.35 2807.05 -47.86%
23/2/2009 3/1/2011 651 UP 3108.65 5904.6 89.94%10/1/2011 9/1/2012 364 DOWN 5654.55 4866 -13.95%16/1/2012 23/4/2012 98 UP 5048.6 5190.6 2.81%30/4/2012 4/6/2012 35 DOWN 5086.85 5068.35 -0.36%11/6/2012 11/3/2013 273 UP 5139.05 5872.6 14.27%18/3/2013 8/4/2013 21 DOWN 5651.35 5528.55 -2.17%15/4/2013 3/6/2013 49 UP 5783.1 5881 1.69%10/7/2013 17/7/2013 7 DOWN 5808.4 5667.65 -2.42%24/7/2013 22/07/2013 28 UP 5842.2 5886.2 0.75%29/7/2013 2/9/2013 35 DOWN 5677.9 5680.4 0.04%10/9/2013 13/4/2015 580 UP 5850.6 8606 47.10%20/4/2015 4/4/2016 350 DOWN 8305.25 7555.2 -9.03%11/4/2016 24//10/2016 196 UP 7850.45 8638 10.03%1/11/2017 2/1/2017 62 DOWN 8433.75 8243.8 -2.25%9/1/2017 26/2/2018 413 UP 8400.35 10458.35 24.50%5/3/2018 26/3/2018 21 DOWN 10226.85 10113.7 -1.11%2/4/2018 17/9/2018 168 UP 10331.6 11143.1 7.85%24/9/2018 18/2/2019 147 DOWN 10930.45 10791.65 -1.27%25/2/2019 8/7/2019 133 UP 10863.5 11552.5 6.34%15/7/2019 7/10/2019 84 DOWN 11419.25 11305.05 -1.00%14/10/2019 17/2/2020 126 UP 11661.85 12080.85 3.59%24/2/2020 15/6/2020 112 DOWN 11201.75 10244.4 -8.55%22/7/2020 28/12/2020 189 UP 10383 14018.5 35.01%
8. Mean Square Within Groups: MSw = SSw / (N − k)9. F-Statistic (or F-ratio): F = MSb / MSw
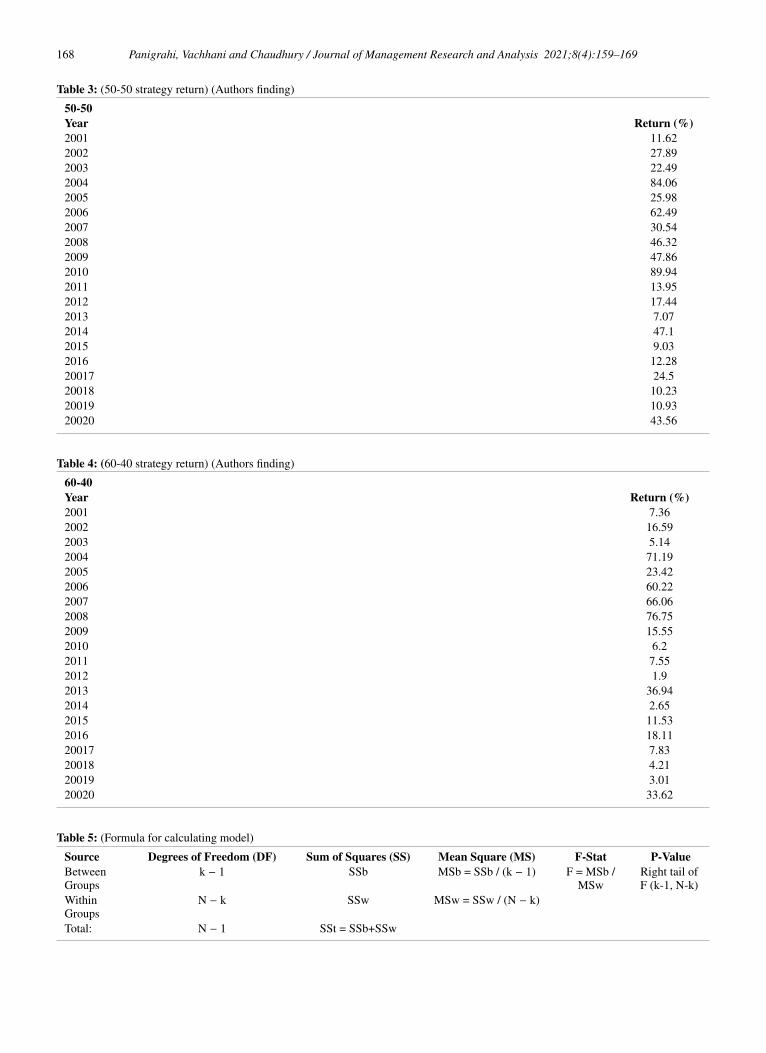
Now, we’ll examine the data implications of our calculatedreturns for a certain year.Table 3 illustrates the estimatedreturn on a 50-50 strategy over the past two decades,whereasTable 4 illustrates the calculated return on a 60-40 strategy over the same period. The return is computedon the year’s last financial day. We performed the F-testand P-value for that return to determine its significance. We
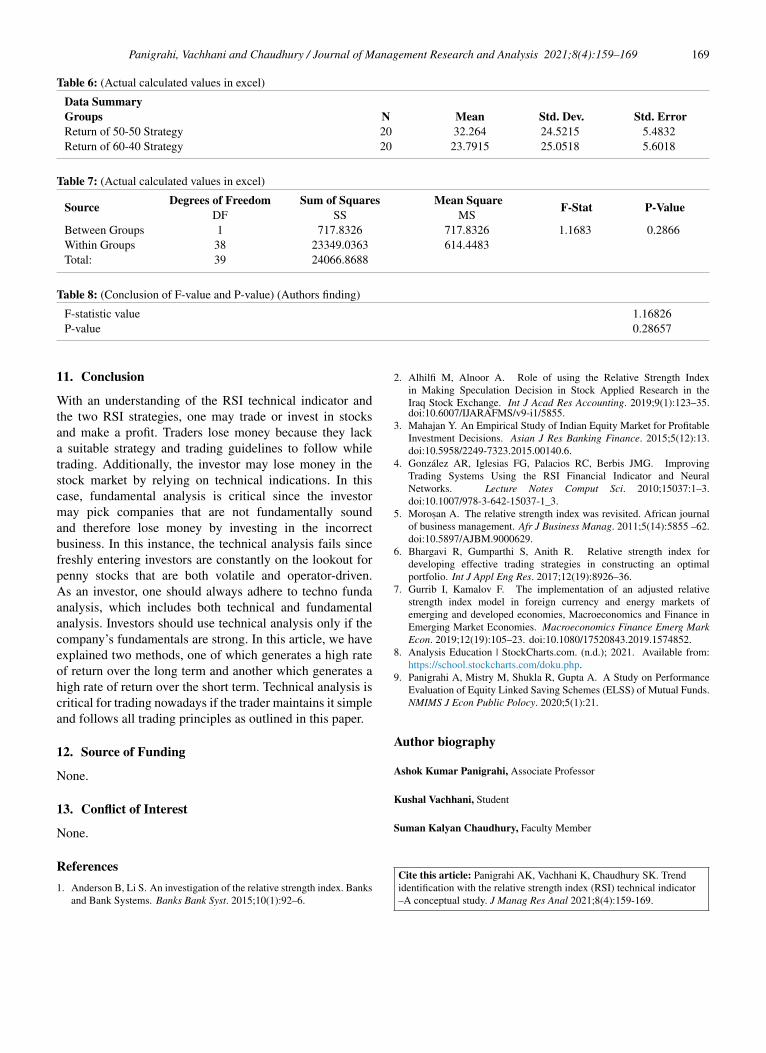
examine for significance to determine whether or not the F-a test used is statistically significant. As shown inTable 7,the F-statistical value and P-value for both methods’ dataare shown. For analysis purposes, the P-values of the 50-50and 60-40 strategies’ returns use a 0.05 standard significantvalue. We discovered that both strategies had a P-valuehigher than the 0.05 standard significance level. The F-testwe used on this data set is statistically insignificant andtherefore cannot be fitted to any regression model.
Panigrahi, Vachhani and Chaudhury / Journal of Management Research and Analysis 2021;8(4):159–169 167
Table 2: (60-40 strategy findings) (Authors finding)
Trend From Trend To Total Days OfTrend
Trend Type(UP/DOWN)
Trend FromClosing price
Trend To Closingprice
Return(%)
3/1/2000 28/2/2000 56 UP 1599.75 1656 3.52%8/5/2000 22/5/2000 14 DOWN 1282.8 1275.35 -0.58%18/9/2000 22/5/2000 63 DOWN 1266.45 1225.2 -3.26%12/3/2001 23/4/2001 42 DOWN 1193.55 1101.3 -7.73%27/8/2001 8/10/2001 42 DOWN 1053.75 960.4 -8.86%11/2/2002 11/3/2002 28 UP 1159.95 1169.75 0.84%22/7/2002 12/8/2002 21 DOWN 973.5 979.25 0.59%16/9/2002 4/11/2002 49 DOWN 969.6 951.6 -1.86%2/12/2002 30/12/2002 28 UP 1069.8 1089.6 1.85%7/4/2003 5/5/2003 28 DOWN 949.8 937.85 -1.26%16/9/2003 1/3/2004 259 UP 1100.25 1869.7 69.93%17/3/2004 21/6/2004 35 DOWN 1560.2 1488.5 -4.60%27/9/2004 14/3/2005 168 UP 1775.15 2109.15 18.82%13/6/2005 10/10/2005 119 UP 2123.4 2484.4 17.00%7/11/2005 8/5/2006 182 UP 2548.65 3650.05 43.22%28/8/2006 12/2/2007 168 UP 3435.45 4146.2 20.69%30/4/2007 28/5/2007 28 UP 4117.35 4297.05 4.36%18/6/2007 30/7/2007 42 UP 4252.05 4401.55 3.52%3/9/2007 7/1/2008 126 UP 4509.5 6200.1 37.49%16/6/2008 14/7/2008 28 DOWN 4347.55 4092.25 -5.87%22/9/2008 2/3/2009 161 DOWN 3985.25 2620.15 -34.25%4/5/2009 20/10/2009 169 UP 3620.7 4947.05 36.63%9/11/2009 11/6/2010 63 UP 4998.95 5252.2 5.07%15/3/2010 26/4/2010 42 UP 5262.8 5278 0.29%12/7/2010 16/8/2010 35 UP 5393.9 5530.65 2.54%6/9/2010 8/10/2010 63 UP 5640.05 6071.65 7.65%1/8/2011 3/10/2011 63 DOWN 5211.25 4888.05 -6.20%1/9/2012 28/1/2013 140 UP 5577.65 5998.9 7.55%14/10/2013 28/10/2013 14 UP 6189.35 6307.2 1.90%3/3/2014 2/3/2015 364 UP 6526.65 8937.75 36.94%24/8/2015 7/9/2015 14 DOWN 8001.95 7789.5 -2.65%11/1/2016 22/2/2016 42 DOWN 7437.8 7029.75 -5.49%27/6/2016 19/9/2016 84 UP 8328.35 8831.55 6.04%30/1/2017 18/9/2017 231 UP 8740.95 9964.4 14.00%3/10/2017 20/11/2017 48 UP 9979.7 10389.7 4.11%11/12/2017 29/1/2018 49 UP 10333.25 10389.7 0.55%9/7/2018 10/9/2018 63 UP 11018.9 11515.2 4.50%1/10/2018 22/10/2018 21 DOWN 10316.45 10030 -2.78%11/3/2019 30/4/2019 50 UP 11426.85 11712.25 2.50%20/5/2019 10/6/2019 21 UP 11844.1 11823.3 -0.18%29/7/2019 19/8/2019 21 DOWN 10997.35 10829.35 -1.53%29/10/2019 20/1/2020 83 UP 11890.6 12248.25 3.01%24/2/2020 18/5/2020 84 DOWN 11201.75 9039.25 -19.31%2/11/2020 28/12/2020 56 UP 12263.65 14018.5 14.31%
168 Panigrahi, Vachhani and Chaudhury / Journal of Management Research and Analysis 2021;8(4):159–169
Table 3: (50-50 strategy return) (Authors finding)
50-50Year Return (%)2001 11.622002 27.892003 22.492004 84.062005 25.982006 62.492007 30.542008 46.322009 47.862010 89.942011 13.952012 17.442013 7.072014 47.12015 9.032016 12.2820017 24.520018 10.2320019 10.9320020 43.56
Table 4: (60-40 strategy return) (Authors finding)
60-40Year Return (%)2001 7.362002 16.592003 5.142004 71.192005 23.422006 60.222007 66.062008 76.752009 15.552010 6.22011 7.552012 1.92013 36.942014 2.652015 11.532016 18.1120017 7.8320018 4.2120019 3.0120020 33.62
Table 5: (Formula for calculating model)
Source Degrees of Freedom (DF) Sum of Squares (SS) Mean Square (MS) F-Stat P-ValueBetweenGroups
k − 1 SSb MSb = SSb / (k − 1) F = MSb /MSw
Right tail ofF (k-1, N-k)
WithinGroups
N − k SSw MSw = SSw / (N − k)
Total: N − 1 SSt = SSb+SSw
Panigrahi, Vachhani and Chaudhury / Journal of Management Research and Analysis 2021;8(4):159–169 169
Table 6: (Actual calculated values in excel)
Data SummaryGroups N Mean Std. Dev. Std. ErrorReturn of 50-50 Strategy 20 32.264 24.5215 5.4832Return of 60-40 Strategy 20 23.7915 25.0518 5.6018
Table 7: (Actual calculated values in excel)
Source Degrees of Freedom Sum of Squares Mean Square F-Stat P-ValueDF SS MS
Between Groups 1 717.8326 717.8326 1.1683 0.2866Within Groups 38 23349.0363 614.4483Total: 39 24066.8688
Table 8: (Conclusion of F-value and P-value) (Authors finding)
F-statistic value 1.16826P-value 0.28657
11. Conclusion
With an understanding of the RSI technical indicator andthe two RSI strategies, one may trade or invest in stocksand make a profit. Traders lose money because they lacka suitable strategy and trading guidelines to follow whiletrading. Additionally, the investor may lose money in thestock market by relying on technical indications. In thiscase, fundamental analysis is critical since the investormay pick companies that are not fundamentally soundand therefore lose money by investing in the incorrectbusiness. In this instance, the technical analysis fails sincefreshly entering investors are constantly on the lookout forpenny stocks that are both volatile and operator-driven.As an investor, one should always adhere to techno fundaanalysis, which includes both technical and fundamentalanalysis. Investors should use technical analysis only if thecompany’s fundamentals are strong. In this article, we haveexplained two methods, one of which generates a high rateof return over the long term and another which generates ahigh rate of return over the short term. Technical analysis iscritical for trading nowadays if the trader maintains it simpleand follows all trading principles as outlined in this paper.
12. Source of Funding
None.
13. Conflict of Interest
None.
References1. Anderson B, Li S. An investigation of the relative strength index. Banks
and Bank Systems. Banks Bank Syst. 2015;10(1):92–6.
2. Alhilfi M, Alnoor A. Role of using the Relative Strength Indexin Making Speculation Decision in Stock Applied Research in theIraq Stock Exchange. Int J Acad Res Accounting. 2019;9(1):123–35.doi:10.6007/IJARAFMS/v9-i1/5855.
3. Mahajan Y. An Empirical Study of Indian Equity Market for ProfitableInvestment Decisions. Asian J Res Banking Finance. 2015;5(12):13.doi:10.5958/2249-7323.2015.00140.6.
4. González AR, Iglesias FG, Palacios RC, Berbis JMG. ImprovingTrading Systems Using the RSI Financial Indicator and NeuralNetworks. Lecture Notes Comput Sci. 2010;15037:1–3.doi:10.1007/978-3-642-15037-1_3.
5. Moros,an A. The relative strength index was revisited. African journalof business management. Afr J Business Manag. 2011;5(14):5855 –62.doi:10.5897/AJBM.9000629.
6. Bhargavi R, Gumparthi S, Anith R. Relative strength index fordeveloping effective trading strategies in constructing an optimalportfolio. Int J Appl Eng Res. 2017;12(19):8926–36.
7. Gurrib I, Kamalov F. The implementation of an adjusted relativestrength index model in foreign currency and energy markets ofemerging and developed economies, Macroeconomics and Finance inEmerging Market Economies. Macroeconomics Finance Emerg MarkEcon. 2019;12(19):105–23. doi:10.1080/17520843.2019.1574852.
8. Analysis Education | StockCharts.com. (n.d.); 2021. Available from:https://school.stockcharts.com/doku.php.
9. Panigrahi A, Mistry M, Shukla R, Gupta A. A Study on PerformanceEvaluation of Equity Linked Saving Schemes (ELSS) of Mutual Funds.NMIMS J Econ Public Polocy. 2020;5(1):21.
Author biography
Ashok Kumar Panigrahi, Associate Professor
Kushal Vachhani, Student
Suman Kalyan Chaudhury, Faculty Member
Cite this article: Panigrahi AK, Vachhani K, Chaudhury SK. Trendidentification with the relative strength index (RSI) technical indicator–A conceptual study. J Manag Res Anal 2021;8(4):159-169.
Related Documents