PHYSICS CONTRIBUTION TREATMENT PLANNING TO IMPROVE DELIVERYACCURACYAND PATIENT THROUGHPUT IN HELICAL TOMOTHERAPY DAVID C. WESTERLY, M.SC.,* EMILIE SOISSON, M.SC., y QUAN CHEN,PH.D., z KATHERINE WOCH, M.SC., y LEAH SCHUBERT, M.SC.,* GUSTAVO OLIVERA,PH.D.,* z AND THOMAS R. MACKIE,PH.D.* yz * Departments of Medical Physics and y Human Oncology, University of Wisconsin, School of Medicine and Public Health, Madison, WI; and z TomoTherapy, Inc., Madison, WI Purpose: To investigate delivery quality assurance (DQA) discrepancies observed for a subset of helical tomother- apy patients. Methods and Materials: Six tomotherapy patient plans were selected for analysis. Three had passing DQA ion chamber (IC) measurements, whereas 3 had measurements deviating from the expected dose by more than 3.0%. All plans used similar parameters, including: 2.5 cm field-width, 15-s gantry period, and pitch values rang- ing from 0.143 to 0.215. Preliminary analysis suggested discrepancies were associated with plans having predom- inantly small leaf open times (LOTs). To test this, patients with failing DQA measurements were replanned using an increased pitch of 0.287. New DQA plans were generated and IC measurements performed. Exit fluence data were also collected during DQA delivery for dose reconstruction purposes. Results: Sinogram analysis showed increases in mean LOTs ranging from 29.8% to 83.1% for the increased pitch replans. IC measurements for these plans showed a reduction in dose discrepancies, bringing all measurements within ±3.0%. The replans were also more efficient to deliver, resulting in reduced treatment times. Dose recon- struction results were in excellent agreement with IC measurements, illustrating the impact of leaf-timing inaccur- acies on plans having predominantly small LOTs. Conclusions: The impact of leaf-timing inaccuracies on plans with small mean LOTs can be considerable. These inaccuracies result from deviations in multileaf collimator latency from the linear approximation used by the treat- ment planning system and can be important for plans having a 15-s gantry period. The ability to reduce this effect while improving delivery efficiency by increasing the pitch is demonstrated. Ó 2009 Elsevier Inc. Tomotherapy, Treatment planning, Delivery accuracy, Patient throughput, Leaf latency. INTRODUCTION The incorporation of inverse planning and intensity modula- tion techniques into radiotherapy has resulted in the improved ability to conform planned dose distributions to clinically des- ignated target volumes. This in turn allows for the delivery of therapeutic doses to target lesions with increased sparing of adjacent critical structures (1, 2). Although such techniques can offer significant advantages as compared with conven- tional delivery paradigms, their implementation requires the use of more complex planning and delivery systems. The TomoTherapy Hi-Art II system uses a compact 6-MV linear accelerator (linac) placed on a computed tomography (CT) ring gantry to rotationally deliver intensity-modulated fan beams of radiation while the patient is translated through the gantry on a treatment couch (3, 4). Intensity modulation is performed via a pneumatically powered, binary multileaf col- limator (MLC). The Hi-Art II unit also contains a megavolt- age CT (MVCT) detector array (5), located opposite the radiation source, which can be used for pretreatment setup verification, delivery verification, and dose reconstruction (6, 7), as well as for machine commissioning and quality assurance purposes (8). Although numerous planning studies have demonstrated the dosimetric advantages of helical tomotherapy (9–11), the distinctive nature of the helical delivery pattern necessi- tates a different way of thinking about both treatment planning and quality assurance. From a treatment planning perspective, the ability to plan with 51 beam angles allows for tremendous Reprint requests to: David C. Westerly, University of Wisconsin School of Medicine and Public Health, Department of Medical Physics, 1005 Wisconsin Institutes for Medical Research, 1111 Highland Ave., Madison, WI 53705-2275. Tel: 001-608-469- 9662; Fax: 001-608-263-9947; E-mail: [email protected] Supported by NIH training grant T32-CA009206. A potential conflict of interest exists for Thomas R. Mackie, Ph.D., Gustavo Olivera, Ph.D., Quan Chen, Ph.D., and Emilie Soisson, M.Sc., who are employees of TomoTherapy, Inc., Madison, WI. Acknowledgment—The authors would like to offer special thanks to Tim Chapman, Ed Chao, and Eric Schnarr at TomoTherapy, Inc., for their invaluable help with this project. In addition, we would like to thank Wolfgang Tome ´ at the University of Wisconsin for his insightful comments and thoughtful discussions. Received Nov 2, 2008, and in revised form Jan 28, 2009. Accepted for publication Feb 3, 2009. 1290 Int. J. Radiation Oncology Biol. Phys., Vol. 74, No. 4, pp. 1290–1297, 2009 Copyright Ó 2009 Elsevier Inc. Printed in the USA. All rights reserved 0360-3016/09/$–see front matter doi:10.1016/j.ijrobp.2009.02.004

Welcome message from author
This document is posted to help you gain knowledge. Please leave a comment to let me know what you think about it! Share it to your friends and learn new things together.
Transcript
PHYSICS CONTRIBUTION
TREATMENT PLANNING TO IMPROVE DELIVERY ACCURACY AND PATIENTTHROUGHPUT IN HELICAL TOMOTHERAPY
DAVID C. WESTERLY, M.SC.,* EMILIE SOISSON, M.SC.,y QUAN CHEN, PH.D.,z KATHERINE WOCH, M.SC.,y
LEAH SCHUBERT, M.SC.,* GUSTAVO OLIVERA, PH.D.,*z AND THOMAS R. MACKIE, PH.D.*yz
*Departments of Medical Physics and yHuman Oncology, University of Wisconsin, School of Medicine and Public Health, Madison,WI; and zTomoTherapy, Inc., Madison, WI
Purpose: To investigate delivery quality assurance (DQA) discrepancies observed for a subset of helical tomother-apy patients.Methods and Materials: Six tomotherapy patient plans were selected for analysis. Three had passing DQA ionchamber (IC) measurements, whereas 3 had measurements deviating from the expected dose by more than3.0%. All plans used similar parameters, including: 2.5 cm field-width, 15-s gantry period, and pitch values rang-ing from 0.143 to 0.215. Preliminary analysis suggested discrepancies were associated with plans having predom-inantly small leaf open times (LOTs). To test this, patients with failing DQA measurements were replanned usingan increased pitch of 0.287. New DQA plans were generated and IC measurements performed. Exit fluence datawere also collected during DQA delivery for dose reconstruction purposes.Results: Sinogram analysis showed increases in mean LOTs ranging from 29.8% to 83.1% for the increased pitchreplans. IC measurements for these plans showed a reduction in dose discrepancies, bringing all measurementswithin ±3.0%. The replans were also more efficient to deliver, resulting in reduced treatment times. Dose recon-struction results were in excellent agreement with IC measurements, illustrating the impact of leaf-timing inaccur-acies on plans having predominantly small LOTs.Conclusions: The impact of leaf-timing inaccuracies on plans with small mean LOTs can be considerable. Theseinaccuracies result from deviations in multileaf collimator latency from the linear approximation used by the treat-ment planning system and can be important for plans having a 15-s gantry period. The ability to reduce this effectwhile improving delivery efficiency by increasing the pitch is demonstrated. � 2009 Elsevier Inc.
Tomotherapy, Treatment planning, Delivery accuracy, Patient throughput, Leaf latency.
Int. J. Radiation Oncology Biol. Phys., Vol. 74, No. 4, pp. 1290–1297, 2009Copyright � 2009 Elsevier Inc.
Printed in the USA. All rights reserved0360-3016/09/$–see front matter
doi:10.1016/j.ijrobp.2009.02.004
INTRODUCTION
The incorporation of inverse planning and intensity modula-
tion techniques into radiotherapy has resulted in the improved
ability to conform planned dose distributions to clinically des-
ignated target volumes. This in turn allows for the delivery of
therapeutic doses to target lesions with increased sparing of
adjacent critical structures (1, 2). Although such techniques
can offer significant advantages as compared with conven-
tional delivery paradigms, their implementation requires the
use of more complex planning and delivery systems.
The TomoTherapy Hi-Art II system uses a compact 6-MV
linear accelerator (linac) placed on a computed tomography
(CT) ring gantry to rotationally deliver intensity-modulated
fan beams of radiation while the patient is translated through
Reprint requests to: David C. Westerly, University of WisconsinSchool of Medicine and Public Health, Department of MedicalPhysics, 1005 Wisconsin Institutes for Medical Research, 1111Highland Ave., Madison, WI 53705-2275. Tel: 001-608-469-9662; Fax: 001-608-263-9947; E-mail: [email protected]
Supported by NIH training grant T32-CA009206.A potential conflict of interest exists for Thomas R. Mackie, Ph.D.,
Gustavo Olivera, Ph.D., Quan Chen, Ph.D., and Emilie Soisson,
12
the gantry on a treatment couch (3, 4). Intensity modulation is
performed via a pneumatically powered, binary multileaf col-
limator (MLC). The Hi-Art II unit also contains a megavolt-
age CT (MVCT) detector array (5), located opposite the
radiation source, which can be used for pretreatment setup
verification, delivery verification, and dose reconstruction
(6, 7), as well as for machine commissioning and quality
assurance purposes (8).
Although numerous planning studies have demonstrated
the dosimetric advantages of helical tomotherapy (9–11),
the distinctive nature of the helical delivery pattern necessi-
tates a different way of thinking about both treatment planning
and quality assurance. From a treatment planning perspective,
the ability to plan with 51 beam angles allows for tremendous
M.Sc., who are employees of TomoTherapy, Inc., Madison, WI.Acknowledgment—The authors would like to offer special thanks toTim Chapman, Ed Chao, and Eric Schnarr at TomoTherapy, Inc., fortheir invaluable help with this project. In addition, we would like tothank Wolfgang Tome at the University of Wisconsin for hisinsightful comments and thoughtful discussions.
Received Nov 2, 2008, and in revised form Jan 28, 2009.Accepted for publication Feb 3, 2009.
90
Improving accuracy and throughput in helical tomotherapy d D. C. WESTERLY et al. 1291
flexibility when prescribing to complicated target volumes,
often surrounded by critical structures. However, the helical
delivery pattern also requires the physicist or dosimetrist to
designate nonconventional treatment parameters including
the field width and pitch, which is the ratio of couch transla-
tion per rotation to the field width (12). Also, when optimiz-
ing, an upper limit on the modulation factor must be
selected. Failure to choose judicious values for these parame-
ters can compromise plan quality, needlessly increase the
treatment time, and produce plans that are more difficult for
the machine to accurately deliver.
From a quality assurance perspective, the dynamic proper-
ties of helical tomotherapy present new challenges; several
tests have been developed to assess the performance charac-
teristics of the treatment machine (13, 14). In addition, be-
cause every helical tomotherapy treatment is intensity
modulated, patient-specific delivery quality assurance
(DQA) must be performed on every patient plan. The proce-
dure for DQA is largely the same as for other film-based in-
tensity-modulated radiation therapy QA procedures; using
films or ion chamber measurements to verify the treatment
in a solid-water or other tissue-equivalent phantom (14,
15). The problem with these methods is that when a given
measurement fails to meet a specified criterion, it is often dif-
ficult to ascertain what went wrong. This problem is exacer-
bated in tomotherapy DQA because of the large number of
beam angles used and the inability to decouple and test indi-
vidual projections.
This work arose out of a clinical situation in which the
authors were faced with the problem described for patients
at the University of Wisconsin planned for treatment on the
TomoTherapy Hi-Art II system. For these patients, DQA
ion chamber measurements were systematically found to be
outside of the �3% acceptance criteria. The goals of this
study were to examine and compare various properties of
the failing treatment plans against similar patient plans with
passing DQAs to determine the underlying cause of the ob-
served discrepancies and to improve the accuracy of delivery
by using better choices of treatment planning parameters.
METHODS AND MATERIALS
Observed DQA discrepanciesAfter a helical tomotherapy plan has been completed and ap-
proved by the attending physicians, the treatment plan is verified
by performing a patient-specific DQA procedure. The DQA process
consists of three basic components: planning, delivery, and analy-
sis. In DQA planning, the TomoTherapy Hi-Art II treatment plan-
ning system (TPS) is used to calculate dose from the accepted
treatment beams in a cylindrical solid-water phantom. The phantom
position is adjusted before the calculation so that the target contour
is in a region of the phantom where film, thermoluminescent dosim-
eter, or ion chamber measurements can be made. After the dose cal-
culation is complete, treatment procedures are generated and the
DQA plan is delivered to the phantom.
Both film and ion chamber measurements are taken for each DQA
plan to obtain both relative planar dose profiles and absolute point
dose measurements. Analysis of these measurements is performed
using the TomoTherapy TPS and consists of comparing the mea-
sured and calculated point doses, as well as looking at planar isodose
and gamma distributions (16) computed between the measured film
dose and the expected dose calculated by the TPS. At the University
of Wisconsin (UW), the tolerances for a plan to be deemed accept-
able are �3% for measured point doses and a gamma value #1 for
all points on the film lying within the mid- to high-dose regions (typ-
ically points contained by the 30% isodose line) using search criteria
of 3% and 3 mm.
As mentioned previously, this work grew out of a clinical situa-
tion in which a number of patients being planned for treatment on
both tomotherapy units at UW had DQAs with point dose measure-
ments falling outside of the specified �3% tolerance. Relative dose
distributions and gamma maps calculated from film measurements
for these plans were deemed passing with respect to the stated crite-
ria. Typical sources of DQA discrepancy such as phantom misalign-
ment and machine output variation were eliminated from the list of
primary causes by using MVCT imaging for setup verification, and,
by alternating ion chamber measurements of failing DQA plans with
passing plans having similar plan parameters, always seeing the
same result with a near constant dose rate.
To diagnose this issue, 6 patients planned for treatment on tomo-
therapy machine #2 were selected for analysis. Three patients had
plans with passing DQA measurements, whereas 3 had plans with
DQA ion chamber measurements deviating from the expected
dose values by more than 3%. All plans had similar planning param-
eters including a 2.5-cm field width and 15-s gantry period. Pitch
values were also similar and ranged from 0.143 to 0.215. For each
patient plan, normalized leaf timing sinograms, which contain infor-
mation about the amount of time each leaf of the binary MLC is open
relative to the total projection time, were obtained from the TPS and
read into MATLAB (The MathWorks, Natick MA) for analysis.
Knowing the gantry period and the number of projections per rota-
tion, mean non-zero leaf open times were computed from these sino-
grams and are shown in Table 1 along with measured DQA point
dose results.
All DQA point dose measurements were performed in a 30-cm
diameter cylindrical solid water phantom using a calibrated A1SL
ion chamber (Standard Imaging Inc., Middleton WI) having a col-
lecting volume of 0.056 cm3. Measurements were repeated three
times for each plan to reduce uncertainties caused by potential out-
put fluctuations. In addition, to correct for day-to-day changes in the
machine output, dose measurements were scaled to a monitor unit
(MU) rate of 867 MU/min, which is the target MU rate for the ma-
chine in question based on output measurements and monitor cham-
ber calibrations made at the time of commissioning. Mean values are
reported for all ion chamber dose measurements. For DQA results
stated in Table 1, uncertainties calculated to the 95% confidence
level were less than the precision of the measured quantities and
so are not reported.
Replanning to increase mean leaf open timeAs seen from Table 1, all plans with failing DQA measurements
had considerably lower mean leaf open times. Based on this finding,
it was hypothesized that increasing the mean leaf open time for
Patients 1–3 in Table 1 would result in a reduction in delivery dis-
crepancies seen in the DQA measurements. To test this hypothesis,
Patients 1–3 were replanned using an increased pitch value. Increas-
ing the pitch effectively increases the mean leaf open time by forcing
the same prescription dose to be delivered in fewer gantry rotations.
At the UW, pitch values are typically chosen according to the
rule:
1292 I. J. Radiation Oncology d Biology d Physics Volume 74, Number 4, 2009
Table 1. Patient plan parameters and DQA measurement data
Patient data Plan parameters DQA point dose
Pt. no. Disease site Pitch Mean LOT (ms) Planned dose (Gy) Measured dose (Gy) Difference (%)
1 H & N 0.143 59 1.589 1.66 4.472 Thorax 0.215 90 1.448 1.50 3.593 Thyroid 0.215 84 1.391 1.46 4.964 Lung 0.215 153 2.651 2.64 �0.535 Prostate 0.172 132 2.877 2.86 �0.486 Pelvis 0.215 139 2.487 2.48 �0.16
Abbreviation: DQA = delivery quality assurance; LOT = leaf open times.
pitch ¼ 0:86
Nfor N ¼ 1; 2; 3; . (1)
This relation stems from a previous study (17), which showed that
the use of these ‘‘good’’ pitch values tends to minimize thread
effects seen in the dose distribution from helical field junctioning.
Although pitch values of 0.860 or 0.430 could have been used, con-
ventional thinking suggests that increasing the pitch may result in
a loss of longitudinal resolution in the dose distribution. For this
study, a pitch value of 0.287 (n = 3) was chosen for all three re-
planned cases because it was the next highest pitch value in the
series of good pitches relative to the original treatment plans.
Aside from changing the pitch, all 3 patients were replanned using
the same field width and similar optimization parameters in an effort
to reproduce similar dose distributions and DVHs. For Patients 1
and 2, this required that the planning modulation factor be increased
from 2.0 to 2.5 (the planning modulation factor prevents unwanted
high modulation by placing an upper limit on the actual modulation
factor, which is defined as the ratio of maximum leaf open to the av-
erage of all non-zero leaf open times). After replanning, new DQA
plans were generated and ion chamber dose measurements per-
formed for both the original and replanned treatments. Measure-
ments were performed three times for each DQA plan with each
individual measurement scaled to correspond with a monitor unit
rate of 867 MU/min.
Dose reconstructionIn addition to DQA ion chamber measurements, uncompressed
fluence data were collected with the onboard MVCT detectors dur-
ing delivery of both the original and replanned DQA procedures.
Tools developed by TomoTherapy, Inc., were used to reconstruct
delivered fluence sinograms from MVCT detector data by looking
at the signal profile of the individual detector channels taken over
the time of each projection. By examining the width of these signal
profiles, it is possible to determine the amount of time each leaf was
actually open during the delivery. Based on this and assuming the
same energy fluence rate used by the TomoTherapy TPS, delivered
fluence sinograms were created and then used to recalculate the dose
in the DQA phantom images for the six DQA plans.
After recalculation of the dose distributions, reconstructed dose
values at the location of the ion chamber measurements were ob-
tained for comparative purposes by noting the voxel locations of
the ion chamber collecting volume in the DQA phantom CT images
and averaging the reconstructed dose values in these voxels. For
consistency, all planned doses (quoted in Tables 1 and 4) were ob-
tained in the same fashion using the original planned DQA dose
grids. Independent measurements were performed three times for
each plan.
RESULTS
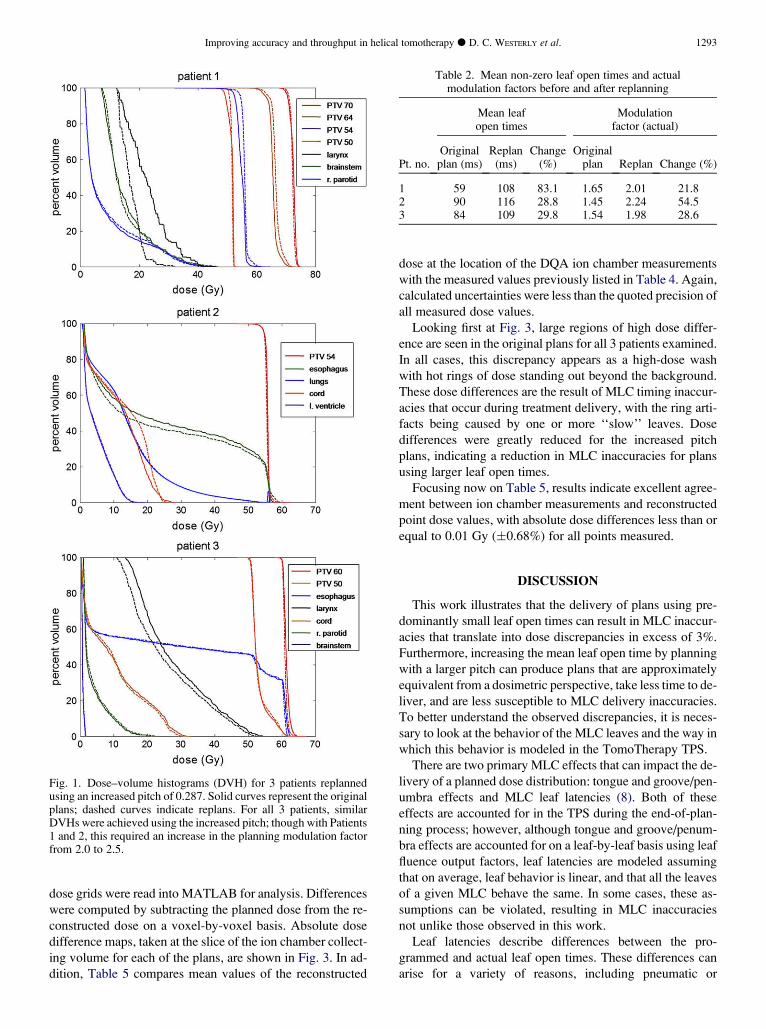
Increased pitch replanningDVH analysis. For each patient, DVHs corresponding to
both the original and replanned treatments were plotted to-
gether and are shown in Fig. 1. These plots illustrate that
for each of the three cases, similar DVHs could be obtained
when using an increased pitch. Physical dose distributions
for the replanned treatments were also similar, and in all three
cases were examined by the attending physicians and deemed
to be clinically acceptable.
Leaf timing sinogram comparison. After replanning, leaf
timing sinograms were read into MATLAB for analysis.
Table 2 lists the mean non-zero leaf open times as well as
the actual modulation factors for both the original and re-
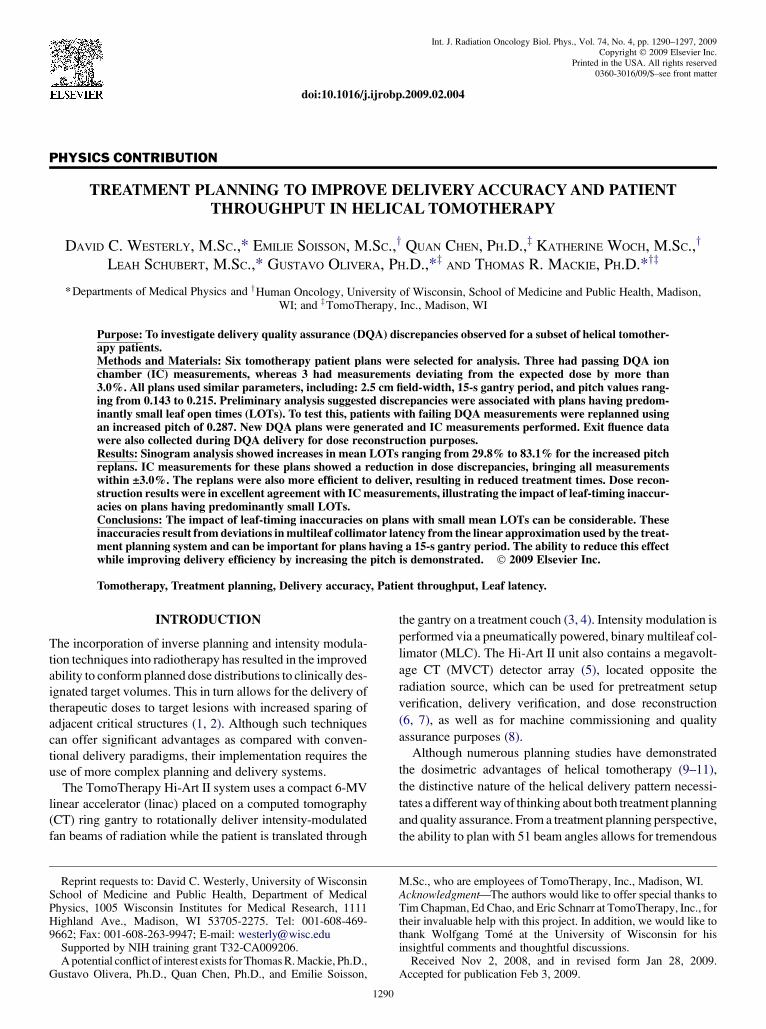
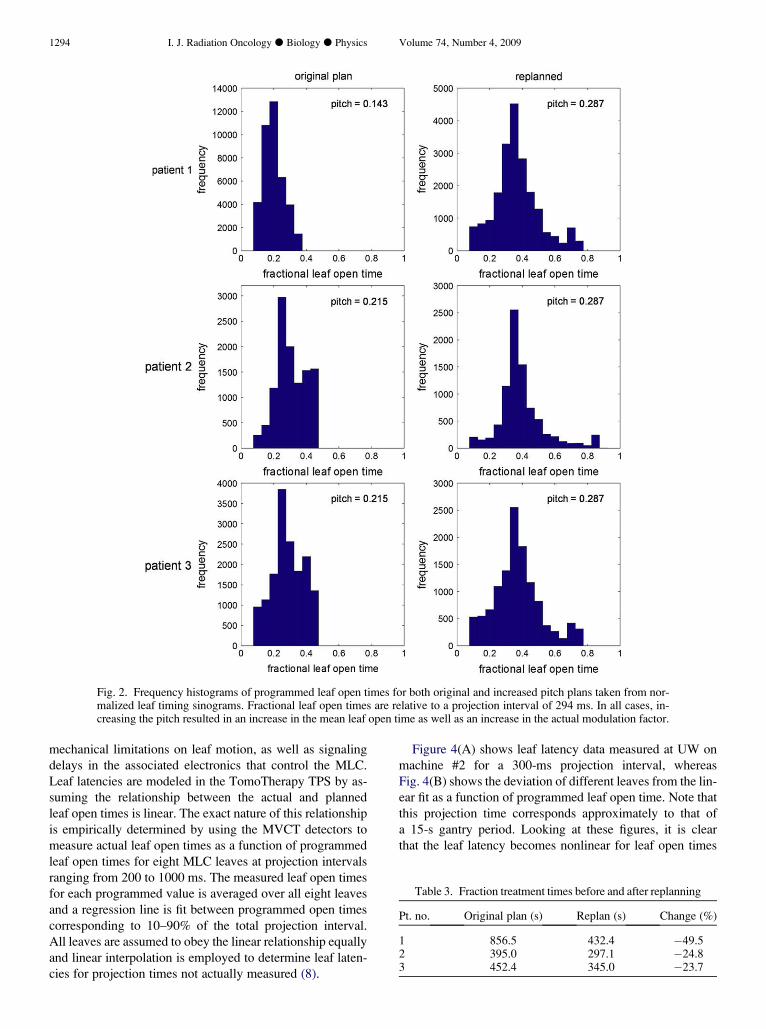
planned treatments. In addition, frequency histograms of
the non-zero leaf open times for the three sets of plans are
shown in Fig. 2. These results show that increasing the pitch
resulted in increases in the mean leaf open time of 29.8–
83.1% for the three cases studied. In addition, the actual mod-
ulation factor increased 21.8–54.5% relative to the original
plans; indicating that to achieve similar plan quality, a wider
range of intensity levels is required when using a larger pitch.
Treatment time comparison. The effects of increasing the
pitch on treatment time are shown in Table 3. These results
indicate reductions in treatment time of 23.7–49.5% were
achieved for the 3 patients replanned. For all replanned treat-
ments, the gantry period remained unchanged at 15 s; thus,
these reductions are due solely to the use of fewer rotations
to cover the treatment volume with the higher pitch plans.
Replanned DQA dose measurementsMean values from the DQA ion chamber dose measure-
ments made before and after replanning are listed in Table
4. Uncertainties calculated to the 95% confidence level
were less than the quoted precision of the measured values
and so are not reported. These results show that delivery of
the replanned treatments having increased mean leaf open
times resulted in a reduction in measured point dose discrep-
ancies so that DQA point dose measurements for all three
cases were brought within the set acceptance criteria of�3%.
Dose reconstruction measurementsAfter reconstructing the dose for both the original and re-
planned DQA deliveries, both the planned and reconstructed
Improving accuracy and throughput in helical tomotherapy d D. C. WESTERLY et al. 1293
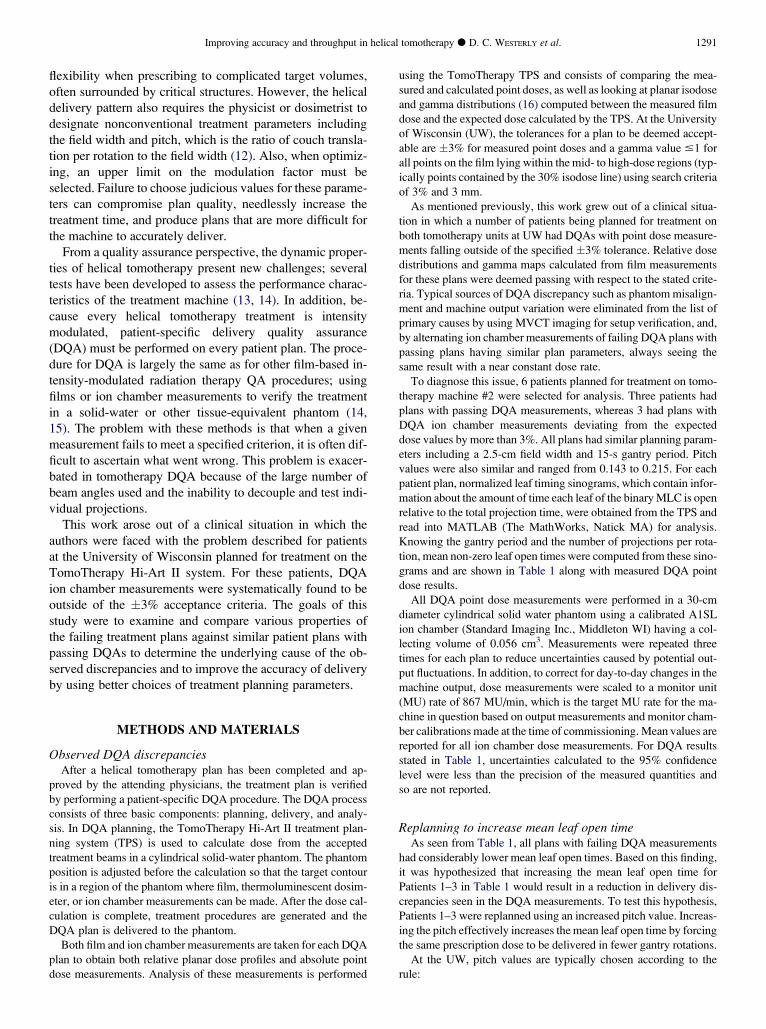
dose grids were read into MATLAB for analysis. Differences
were computed by subtracting the planned dose from the re-
constructed dose on a voxel-by-voxel basis. Absolute dose
difference maps, taken at the slice of the ion chamber collect-
ing volume for each of the plans, are shown in Fig. 3. In ad-
dition, Table 5 compares mean values of the reconstructed
Fig. 1. Dose–volume histograms (DVH) for 3 patients replannedusing an increased pitch of 0.287. Solid curves represent the originalplans; dashed curves indicate replans. For all 3 patients, similarDVHs were achieved using the increased pitch; though with Patients1 and 2, this required an increase in the planning modulation factorfrom 2.0 to 2.5.
dose at the location of the DQA ion chamber measurements
with the measured values previously listed in Table 4. Again,
calculated uncertainties were less than the quoted precision of
all measured dose values.
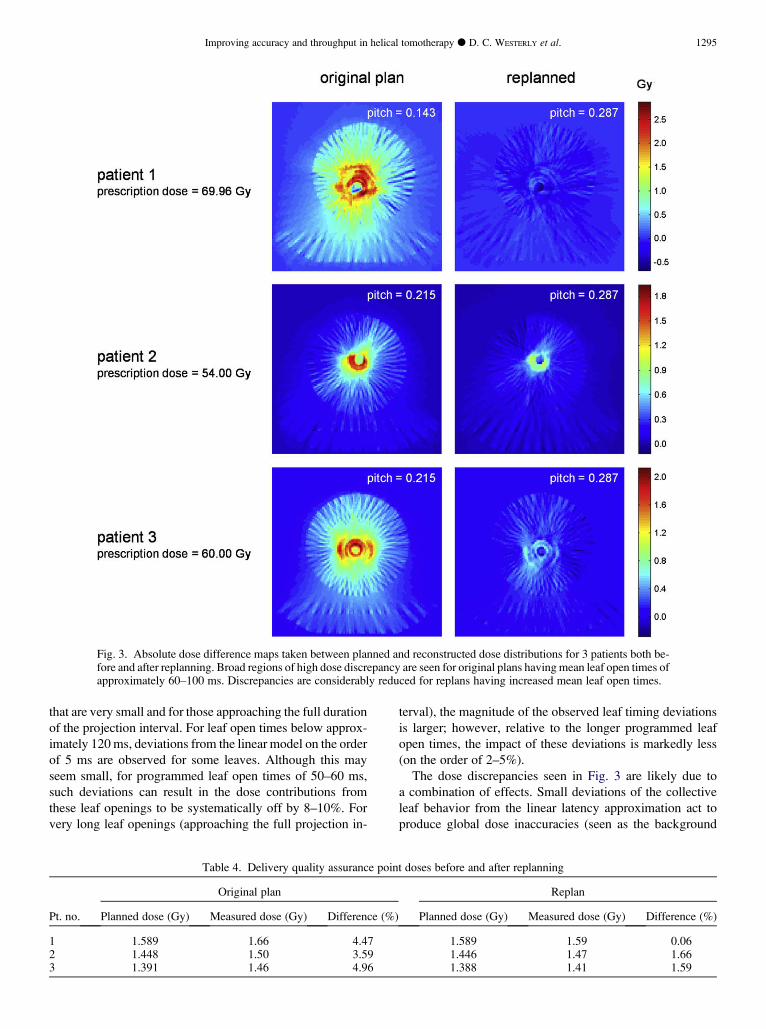
Looking first at Fig. 3, large regions of high dose differ-
ence are seen in the original plans for all 3 patients examined.
In all cases, this discrepancy appears as a high-dose wash
with hot rings of dose standing out beyond the background.
These dose differences are the result of MLC timing inaccur-
acies that occur during treatment delivery, with the ring arti-
facts being caused by one or more ‘‘slow’’ leaves. Dose
differences were greatly reduced for the increased pitch
plans, indicating a reduction in MLC inaccuracies for plans
using larger leaf open times.
Focusing now on Table 5, results indicate excellent agree-
ment between ion chamber measurements and reconstructed
point dose values, with absolute dose differences less than or
equal to 0.01 Gy (�0.68%) for all points measured.
DISCUSSION
This work illustrates that the delivery of plans using pre-
dominantly small leaf open times can result in MLC inaccur-
acies that translate into dose discrepancies in excess of 3%.
Furthermore, increasing the mean leaf open time by planning
with a larger pitch can produce plans that are approximately
equivalent from a dosimetric perspective, take less time to de-
liver, and are less susceptible to MLC delivery inaccuracies.
To better understand the observed discrepancies, it is neces-
sary to look at the behavior of the MLC leaves and the way in
which this behavior is modeled in the TomoTherapy TPS.
There are two primary MLC effects that can impact the de-
livery of a planned dose distribution: tongue and groove/pen-
umbra effects and MLC leaf latencies (8). Both of these
effects are accounted for in the TPS during the end-of-plan-
ning process; however, although tongue and groove/penum-
bra effects are accounted for on a leaf-by-leaf basis using leaf
fluence output factors, leaf latencies are modeled assuming
that on average, leaf behavior is linear, and that all the leaves
of a given MLC behave the same. In some cases, these as-
sumptions can be violated, resulting in MLC inaccuracies
not unlike those observed in this work.
Leaf latencies describe differences between the pro-
grammed and actual leaf open times. These differences can
arise for a variety of reasons, including pneumatic or
Table 2. Mean non-zero leaf open times and actualmodulation factors before and after replanning
Mean leafopen times
Modulationfactor (actual)
Pt. no.Originalplan (ms)
Replan(ms)
Change(%)
Originalplan Replan Change (%)
1 59 108 83.1 1.65 2.01 21.82 90 116 28.8 1.45 2.24 54.53 84 109 29.8 1.54 1.98 28.6
1294 I. J. Radiation Oncology d Biology d Physics Volume 74, Number 4, 2009
Fig. 2. Frequency histograms of programmed leaf open times for both original and increased pitch plans taken from nor-malized leaf timing sinograms. Fractional leaf open times are relative to a projection interval of 294 ms. In all cases, in-creasing the pitch resulted in an increase in the mean leaf open time as well as an increase in the actual modulation factor.
mechanical limitations on leaf motion, as well as signaling
delays in the associated electronics that control the MLC.
Leaf latencies are modeled in the TomoTherapy TPS by as-
suming the relationship between the actual and planned
leaf open times is linear. The exact nature of this relationship
is empirically determined by using the MVCT detectors to
measure actual leaf open times as a function of programmed
leaf open times for eight MLC leaves at projection intervals
ranging from 200 to 1000 ms. The measured leaf open times
for each programmed value is averaged over all eight leaves
and a regression line is fit between programmed open times
corresponding to 10–90% of the total projection interval.
All leaves are assumed to obey the linear relationship equally
and linear interpolation is employed to determine leaf laten-
cies for projection times not actually measured (8).
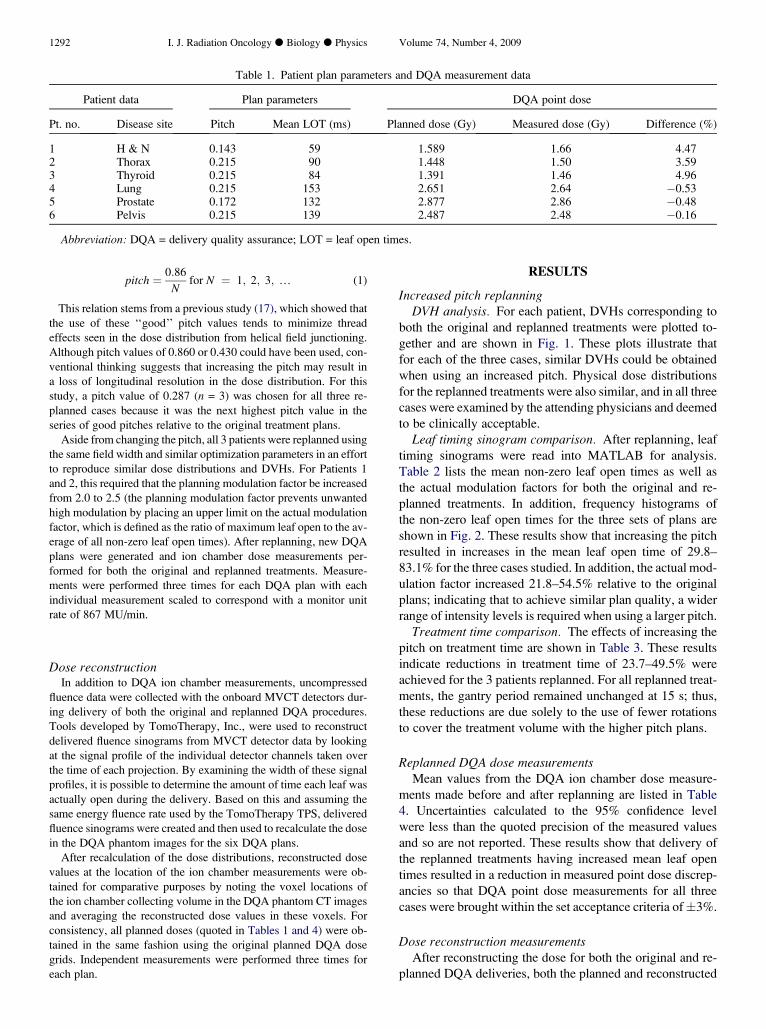
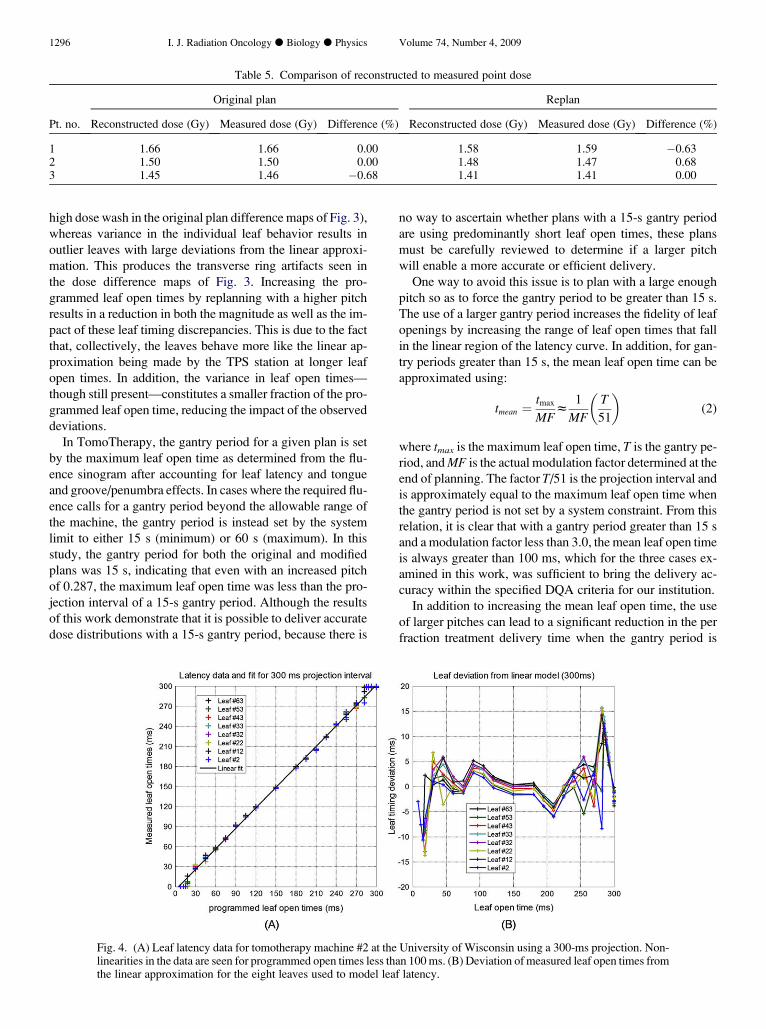
Figure 4(A) shows leaf latency data measured at UW on
machine #2 for a 300-ms projection interval, whereas
Fig. 4(B) shows the deviation of different leaves from the lin-
ear fit as a function of programmed leaf open time. Note that
this projection time corresponds approximately to that of
a 15-s gantry period. Looking at these figures, it is clear
that the leaf latency becomes nonlinear for leaf open times
Table 3. Fraction treatment times before and after replanning
Pt. no. Original plan (s) Replan (s) Change (%)
1 856.5 432.4 �49.52 395.0 297.1 �24.83 452.4 345.0 �23.7
Improving accuracy and throughput in helical tomotherapy d D. C. WESTERLY et al. 1295
Fig. 3. Absolute dose difference maps taken between planned and reconstructed dose distributions for 3 patients both be-fore and after replanning. Broad regions of high dose discrepancy are seen for original plans having mean leaf open times ofapproximately 60–100 ms. Discrepancies are considerably reduced for replans having increased mean leaf open times.
that are very small and for those approaching the full duration
of the projection interval. For leaf open times below approx-
imately 120 ms, deviations from the linear model on the order
of 5 ms are observed for some leaves. Although this may
seem small, for programmed leaf open times of 50–60 ms,
such deviations can result in the dose contributions from
these leaf openings to be systematically off by 8–10%. For
very long leaf openings (approaching the full projection in-
terval), the magnitude of the observed leaf timing deviations
is larger; however, relative to the longer programmed leaf
open times, the impact of these deviations is markedly less
(on the order of 2–5%).
The dose discrepancies seen in Fig. 3 are likely due to
a combination of effects. Small deviations of the collective
leaf behavior from the linear latency approximation act to
produce global dose inaccuracies (seen as the background
Table 4. Delivery quality assurance point doses before and after replanning
Original plan Replan
Pt. no. Planned dose (Gy) Measured dose (Gy) Difference (%) Planned dose (Gy) Measured dose (Gy) Difference (%)
1 1.589 1.66 4.47 1.589 1.59 0.062 1.448 1.50 3.59 1.446 1.47 1.663 1.391 1.46 4.96 1.388 1.41 1.59
1296 I. J. Radiation Oncology d Biology d Physics Volume 74, Number 4, 2009
Table 5. Comparison of reconstructed to measured point dose
Original plan Replan
Pt. no. Reconstructed dose (Gy) Measured dose (Gy) Difference (%) Reconstructed dose (Gy) Measured dose (Gy) Difference (%)
1 1.66 1.66 0.00 1.58 1.59 �0.632 1.50 1.50 0.00 1.48 1.47 0.683 1.45 1.46 �0.68 1.41 1.41 0.00
high dose wash in the original plan difference maps of Fig. 3),
whereas variance in the individual leaf behavior results in
outlier leaves with large deviations from the linear approxi-
mation. This produces the transverse ring artifacts seen in
the dose difference maps of Fig. 3. Increasing the pro-
grammed leaf open times by replanning with a higher pitch
results in a reduction in both the magnitude as well as the im-
pact of these leaf timing discrepancies. This is due to the fact
that, collectively, the leaves behave more like the linear ap-
proximation being made by the TPS station at longer leaf
open times. In addition, the variance in leaf open times—
though still present—constitutes a smaller fraction of the pro-
grammed leaf open time, reducing the impact of the observed
deviations.
In TomoTherapy, the gantry period for a given plan is set
by the maximum leaf open time as determined from the flu-
ence sinogram after accounting for leaf latency and tongue
and groove/penumbra effects. In cases where the required flu-
ence calls for a gantry period beyond the allowable range of
the machine, the gantry period is instead set by the system
limit to either 15 s (minimum) or 60 s (maximum). In this
study, the gantry period for both the original and modified
plans was 15 s, indicating that even with an increased pitch
of 0.287, the maximum leaf open time was less than the pro-
jection interval of a 15-s gantry period. Although the results
of this work demonstrate that it is possible to deliver accurate
dose distributions with a 15-s gantry period, because there is
no way to ascertain whether plans with a 15-s gantry period
are using predominantly short leaf open times, these plans
must be carefully reviewed to determine if a larger pitch
will enable a more accurate or efficient delivery.
One way to avoid this issue is to plan with a large enough
pitch so as to force the gantry period to be greater than 15 s.
The use of a larger gantry period increases the fidelity of leaf
openings by increasing the range of leaf open times that fall
in the linear region of the latency curve. In addition, for gan-
try periods greater than 15 s, the mean leaf open time can be
approximated using:
tmean ¼tmax
MFz
1
MF
�T
51
�(2)
where tmax is the maximum leaf open time, T is the gantry pe-
riod, and MF is the actual modulation factor determined at the
end of planning. The factor T/51 is the projection interval and
is approximately equal to the maximum leaf open time when
the gantry period is not set by a system constraint. From this
relation, it is clear that with a gantry period greater than 15 s
and a modulation factor less than 3.0, the mean leaf open time
is always greater than 100 ms, which for the three cases ex-
amined in this work, was sufficient to bring the delivery ac-
curacy within the specified DQA criteria for our institution.
In addition to increasing the mean leaf open time, the use
of larger pitches can lead to a significant reduction in the per
fraction treatment delivery time when the gantry period is
Fig. 4. (A) Leaf latency data for tomotherapy machine #2 at the University of Wisconsin using a 300-ms projection. Non-linearities in the data are seen for programmed open times less than 100 ms. (B) Deviation of measured leaf open times fromthe linear approximation for the eight leaves used to model leaf latency.

Improving accuracy and throughput in helical tomotherapy d D. C. WESTERLY et al. 1297
being set to the system minimum. This in turn allows for in-
creased patient throughput. Though conventional thinking
suggests that the use of larger pitches may result in reduced
longitudinal resolution of the dose distribution, this was not
evident for the three patients replanned in this study. Instead,
our results are consistent with those of Gutierrez et al., who
found the conformity of dose distributions to be relatively
insensitive to changes in pitch (18).
CONCLUSION
In this study, DQA discrepancies observed for a number of
patients planned for treatment on helical tomotherapy were in-
vestigated. An initial comparison of leaf timing sinograms for
6 patients indicated that failing DQAs were associated with
plans having small mean leaf open times. Three patients
with failing DQAs were replanned using an increased pitch
and the corresponding mean leaf open times were increased
29.8–83.1% relative to the original plans. Dosimetric analy-
ses showed nearly equivalent plans were achieved using the
increased pitch values. After replanning, new DQA plans
were created and ion chamber measurements showed a reduc-
tion in point dose discrepancies, bringing all measured doses
within the set clinical tolerance of �3%. In addition, MVCT
REFER
detector data were used for dose reconstruction purposes and
comparison between ion chamber measurements and recon-
structed point doses showed excellent agreement for all plans.
Dose difference maps taken between planned and recon-
structed dose distributions showed broad regions of high-
dose discrepancy, with transverse high dose ring artifacts
standing out beyond the background for all three of the orig-
inal plans with failing DQAs. Difference maps taken after re-
planning indicated these discrepancies were greatly reduced
for plans with larger mean leaf open times and were in agree-
ment with DQA results. Analysis of MLC leaf latency data
for the machine being used suggested these discrepancies
are due to a combination of effects; namely, collective non-
linearities in the leaf latency at leaf open times less than ap-
proximately 100 ms that are not accounted for in the TPS,
as well as variance in the behavior of individual leaves, which
is also unaccounted for.
To lessen the impact of MLC latency inaccuracies, it is rec-
ommended that the pitch value be chosen so that the gantry pe-
riod is greater than the minimum value of 15 s. Doing this will
not only improve the treatment accuracy by reducing the im-
pact of leaf latency inaccuracies, but will also improve the ef-
ficiency of the treatment, thereby reducing the delivery time.
1. Zelefsky MJ, Fuks Z, Hunt M, et al. High-dose intensity mod-ulated radiation therapy for prostate cancer: Early toxicity andbiochemical outcome in 772 patients. Int J Radiat Oncol BiolPhys 2002;53:1111–1116.
2. Chao KS, Deasy JO, Markman J, et al. A prospective study ofsalivary function sparing in patients with head-and-neck cancersreceiving intensity-modulated or three-dimensional radiationtherapy: initial results. Int J Radiat Oncol Biol Phys 2001;49:907–916.
3. Mackie TR, Holmes TW, Swerdloff S, et al. Tomotherapy: Anew concept in the delivery of dynamic conformal radiotherapy.Med Phys 1993;20:1709–1719.
4. Mackie TR, Balog J, Ruchala K, et al. Tomotherapy. SeminRadiat Oncol 1999;9:108–117.
5. Ruchala KJ, Olivera GH, Schloesser EA, et al. MegavoltageCT on a tomotherapy system. Phys Med Biol 1999;44:2597–2621.
6. Kapatoes JM, Olivera GH, Reckwerdt PJ, et al. Delivery verifi-cation in sequential and helical tomotherapy. Phys Med Biol1999;44:1815–1841.
7. Siebert RM, Ramsey CR, Garvey DR, et al. Verification of he-lical tomotherapy delivery using autoassociative kernel regres-sion. Med Phys 2007;34:3249–3262.
8. Balog J, Olivera G, Kapatoes J. Clinical helical tomotherapycommissioning dosimetry. Med Phys 2003;30:3097–3106.
9. Scrimger RA, Tome WA, Olivera GH, et al. Reduction in radi-ation dose to lung and other normal tissues using helical tomo-
ENCES
therapy to treat lung cancer, in comparison to conventional fieldarrangements. Am J Clin Oncol 2003;26:70–78.
10. Fiorno C, Dell’Oca I, Pierelli A, et al. Significant improvementin normal tissue sparing and target coverage for head and neckcancer by means of helical tomotherapy. Radiat Oncol 2006;78:276–282.
11. Aoyama H, Westerly D, Mackie T, et al. Integral radiation doseto normal structures with conformal external beam radiation. IntJ Radiat Oncol Biol Phys 2006;64:962–967.
12. Yang JN, Mackie TR, Reckwerdt P, et al. An investigation oftomotherapy beam delivery. Med Phys 1997;24:425–436.
13. Fenwick JD, Tome WA, Jaradat HA, et al. Quality assurance ofa helical tomotherapy machine. Phys Med Biol 2004;49:2933–2953.
14. Balog J, Soisson ET. Helical tomotherapy quality assurance. IntJ Radiat Oncol Biol Phys 2008;71:S113–S117.
15. Low DA. Quality assurance of intensity-modulated radiother-apy. Semin Radiat Oncol 2002;12:219–228.
16. Low DA, Harms WB, Mutic S, et al. A technique for the quan-titative evaluation of dose distributions. Med Phys 1998;25:656–661.
17. Kissick MW, Fenwick J, James JA, et al. The helical tomother-apy thread effect. Med Phys 2005;32:1414–1423.
18. Gutierrez AN, Westerly DC, Tome WA, et al. Whole brain ra-diotherapy with hippocampal avoidance and simultaneously in-tegrated brain metastases boost: A planning study. Int J RadiatOncol Biol Phys 2007;69:589–597.
Related Documents