Welcome message from author
This document is posted to help you gain knowledge. Please leave a comment to let me know what you think about it! Share it to your friends and learn new things together.
Transcript


FY 2016 AGENCY FINANCIAL REPORT
ABOUT THIS REPORT Our Agency Financial Report (AFR) for Fiscal Year (FY) 2016 presents the Department of the Treasury’s (Treasury, Department, or our) financial information relative to our vital mission and stewardship of the resources entrusted to us.
The AFR also highlights our priorities, accomplishments, and challenges implementing programs that promote conditions for sustaining economic growth and stability at home and abroad, protecting the integrity of our nation’s financial
system, and effectively managing the U.S. government’s finances and resources. In accordance with Office of Management and Budget’s (OMB) Circular A-136, Financial Reporting Requirements, we produce the following three reports: (i) an AFR issued on November 15, 2016 and (ii) an Annual Performance Report (APR) submitted with Treasury’s congressional budget justification to be issued by February 1, 2017. The AFR will be available online at http://www.treasury.gov/about/ budget-performance/annual-performance-plan/Pages/ default.aspx. The APR will be available online at http://www.treasury.gov/ about/budget-performance/Pages/cj-index.aspx.
HOW THIS REPORT IS ORGANIZED Our AFR provides financial and performance information for the FY beginning October 1, 2015, and ending on September 30, 2016, with comparative prior year data, where appropriate. The AFR demonstrates our commitment to our mission and accountability to
Congress and the American people. This report presents Treasury’s operations, accomplishments and challenges. The AFR begins with a message from the Secretary of the Treasury, Jacob J. Lew. This introduction is followed by three main sections.
Part 1: Management’s Discussion and Analysis Provides a high-level overview of our organizational structure, strategic framework, programmatic and financial performance, and management assurances related to Treasury’s internal controls.
Part 2: Financial Section Begins with a message from the Assistant Secretary for Management and Deputy Chief Financial Officer, followed by the Independent Auditors’ Report, audited financial statements and notes, and supplementary information.
Part 3: Other Information
Contains various information including Management and Performance Challenges identified by the Inspector General and the Secretary’s response, along with information related to tax gap and tax burden, improper payments, and other relevant information.
FY 2016 AGENCY FINANCIAL REPORT
TABLE OF CONTENTS
MESSAGE FROM THE SECRETARY OF THE TREASURY . . . . . . . . . . . . . . . . . . . . . . . . . . . . . . . . . . . . . . . . . . . . . . . . . . . . . . . . . . . . . . . . . . . . . . . . . . 4
PART 1: MANAGEMENT’S DISCUSSION AND ANALYSIS (UNAUDITED)
TREASURY AT A GLANCE . . . . . . . . . . . . . . . . . . . . . . . . . . . . . . . . . . . . . . . . . . . . . . . . . . . . . . . . . . . . . . . . . . . . . . . . . . . . . . . . . . . . . . . . . . . . . 9 ORGANIZATION . . . . . . . . . . . . . . . . . . . . . . . . . . . . . . . . . . . . . . . . . . . . . . . . . . . . . . . . . . . . . . . . . . . . . . . . . . . . . . . . . . . . . . . . . . . . . . . . . . . 11 TREASURY STRATEGIC FRAMEWORK . . . . . . . . . . . . . . . . . . . . . . . . . . . . . . . . . . . . . . . . . . . . . . . . . . . . . . . . . . . . . . . . . . . . . . . . . . . . . . . . 14 PERFORMANCE OVERVIEW . . . . . . . . . . . . . . . . . . . . . . . . . . . . . . . . . . . . . . . . . . . . . . . . . . . . . . . . . . . . . . . . . . . . . . . . . . . . . . . . . . . . . . . . 16 SUMMARY OF MANAGEMENT AND PERFORMANCE CHALLENGES . . . . . . . . . . . . . . . . . . . . . . . . . . . . . . . . . . . . . . . . . . . . . . . . . . . . 37 SUMMARY OF MATERIAL WEAKNESSES . . . . . . . . . . . . . . . . . . . . . . . . . . . . . . . . . . . . . . . . . . . . . . . . . . . . . . . . . . . . . . . . . . . . . . . . . . . . 38 FY 2017 OUTLOOK . . . . . . . . . . . . . . . . . . . . . . . . . . . . . . . . . . . . . . . . . . . . . . . . . . . . . . . . . . . . . . . . . . . . . . . . . . . . . . . . . . . . . . . . . . . . . . . 39 FINANCIAL HIGHLIGHTS . . . . . . . . . . . . . . . . . . . . . . . . . . . . . . . . . . . . . . . . . . . . . . . . . . . . . . . . . . . . . . . . . . . . . . . . . . . . . . . . . . . . . . . . . . . . 40 MANAGEMENT ASSURANCES . . . . . . . . . . . . . . . . . . . . . . . . . . . . . . . . . . . . . . . . . . . . . . . . . . . . . . . . . . . . . . . . . . . . . . . . . . . . . . . . . . . . . . 45 SYSTEMS, CONTROLS AND LEGAL COMPLIANCE . . . . . . . . . . . . . . . . . . . . . . . . . . . . . . . . . . . . . . . . . . . . . . . . . . . . . . . . . . . . . . . . . . . . . 46
PART 2: FINANCIAL SECTION
MESSAGE FROM THE ASSISTANT SECRETARY FOR MANAGEMENT AND DEPUTY CHIEF FINANCIAL OFFICER . . . . . . . . . . . . . 53 INSPECTOR GENERAL’S TRANSMITTAL LETTER . . . . . . . . . . . . . . . . . . . . . . . . . . . . . . . . . . . . . . . . . . . . . . . . . . . . . . . . . . . . . . . . . . . . . . . 55 INDEPENDENT AUDITORS’ REPORT ON THE DEPARTMENT’S FINANCIAL STATEMENTS . . . . . . . . . . . . . . . . . . . . . . . . . . . . . . . . . 57 MANAGEMENT’S RESPONSE TO INDEPENDENT AUDITORS’ REPORT . . . . . . . . . . . . . . . . . . . . . . . . . . . . . . . . . . . . . . . . . . . . . . . . . . 63 FINANCIAL STATEMENTS . . . . . . . . . . . . . . . . . . . . . . . . . . . . . . . . . . . . . . . . . . . . . . . . . . . . . . . . . . . . . . . . . . . . . . . . . . . . . . . . . . . . . . . . . . . 64 NOTES TO THE FINANCIAL STATEMENTS . . . . . . . . . . . . . . . . . . . . . . . . . . . . . . . . . . . . . . . . . . . . . . . . . . . . . . . . . . . . . . . . . . . . . . . . . . . . 71 REQUIRED SUPPLEMENTARY INFORMATION (UNAUDITED) . . . . . . . . . . . . . . . . . . . . . . . . . . . . . . . . . . . . . . . . . . . . . . . . . . . . . . . . .14 5
PART 3: OTHER INFORMATION (UNAUDITED)
SECTION A: COMBINED SCHEDULE OF SPENDING . . . . . . . . . . . . . . . . . . . . . . . . . . . . . . . . . . . . . . . . . . . . . . . . . . . . . . . . . . . . . . . . . 155 SECTION B: TAX GAP AND TAX BURDEN . . . . . . . . . . . . . . . . . . . . . . . . . . . . . . . . . . . . . . . . . . . . . . . . . . . . . . . . . . . . . . . . . . . . . . . . .1 56 SECTION C: FREEZE THE FOOTPRINT . . . . . . . . . . . . . . . . . . . . . . . . . . . . . . . . . . . . . . . . . . . . . . . . . . . . . . . . . . . . . . . . . . . . . . . . . . . . .1 64 SECTION D: MANAGEMENT AND PERFORMANCE CHALLENGES AND THE SECRETARY’S RESPONSES . . . . . . . . . . . . . . . . . . . . . . . . . . . . . . . . . . . . . . . . . . . . . . . . . . . . . . . . . . . . . . . . . .1 65 SECTION E: SUMMARY OF FINANCIAL STATEMENT AUDIT AND MANAGEMENT ASSURANCES . . . . . . . . . . . . . . . . . . . . . . .216 SECTION F: IPIA (AS AMENDED BY IPERA AND IPERIA) REPORTING DETAILS . . . . . . . . . . . . . . . . . . . . . . . . . . . . . . . . . . . .220 SECTION G: CIVIL MONETARY PENALTIES INFLATION ADJUSTMENT . . . . . . . . . . . . . . . . . . . . . . . . . . . . . . . . . . . . . . . . . . . . . . . .23 9 APPENDIX: GLOSSARY OF ACRONYMS . . . . . . . . . . . . . . . . . . . . . . . . . . . . . . . . . . . . . . . . . . . . . . . . . . . . . . . . . . . . . . . . . . . . . . . . . . .2 45
4 DEPARTMENT OF THE TREASURY
FY 2016 AGENCY FINANCIAL REPORT | MESSAGE FROM THE SECRETARY OF THE TREASURY
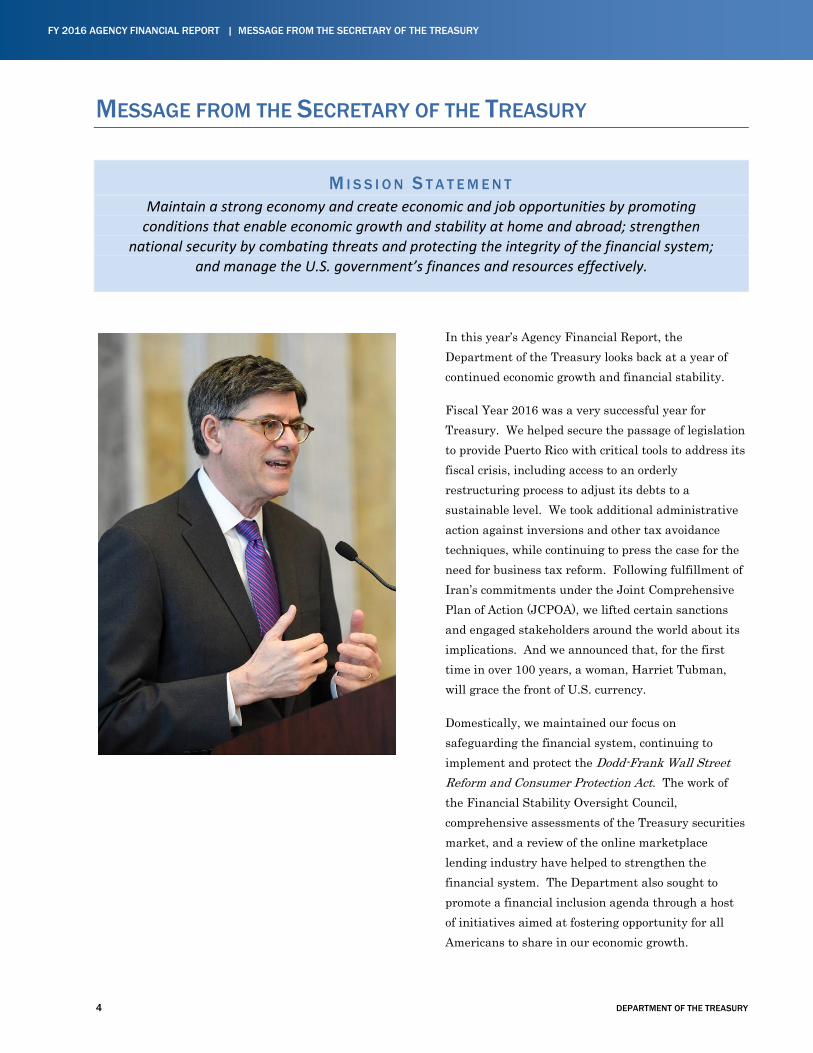
MESSAGE FROM THE SECRETARY OF THE TREASURY
M I S S I O N S T A T E M E N T Maintain a strong economy and create economic and job opportunities by promoting
conditions that enable economic growth and stability at home and abroad; strengthen national security by combating threats and protecting the integrity of the financial system;
and manage the U.S. government’s finances and resources effectively.
In this year’s Agency Financial Report, the Department of the Treasury looks back at a year of continued economic growth and financial stability.
Fiscal Year 2016 was a very successful year for Treasury. We helped secure the passage of legislation to provide Puerto Rico with critical tools to address its fiscal crisis, including access to an orderly restructuring process to adjust its debts to a sustainable level. We took additional administrative action against inversions and other tax avoidance techniques, while continuing to press the case for the need for business tax reform. Following fulfillment of Iran’s commitments under the Joint Comprehensive Plan of Action (JCPOA), we lifted certain sanctions and engaged stakeholders around the world about its implications. And we announced that, for the first time in over 100 years, a woman, Harriet Tubman, will grace the front of U.S. currency.
Domestically, we maintained our focus on safeguarding the financial system, continuing to implement and protect the Dodd-Frank Wall Street Reform and Consumer Protection Act. The work of the Financial Stability Oversight Council, comprehensive assessments of the Treasury securities market, and a review of the online marketplace lending industry have helped to strengthen the financial system. The Department also sought to promote a financial inclusion agenda through a host of initiatives aimed at fostering opportunity for all Americans to share in our economic growth.
DEPARTMENT OF THE TREASURY 5
MESSAGE FROM THE SECRETARY OF THE TREASURY | FY 2016 AGENCY FINANCIAL REPORT
The Treasury Department also conducted significant work with diplomatic partners to advance American interests abroad. Congressional authorization of the 2010 International Monetary Fund (IMF) Quota and Governance Reforms demonstrated U.S. economic leadership in the world at the beginning of the fiscal year. We also successfully advanced U.S. growth priorities with the Group of 20 (G-20), including reaching agreements on exchange rate policy, refraining from competitive devaluation, and employing all policy levers — monetary, fiscal, and structural reforms — in an effort to achieve more sustainable, inclusive growth. This important work resulted in outlining a new framework for financing development throughout the world.
As part of this report, Treasury received an unmodified audit opinion on its consolidated financial statements and validated its financial data as accurate, complete, and reliable. Treasury strengthened its management controls, made progress towards correcting the material weaknesses discussed in Part III of this report, and made progress toward achieving all U.S. financial systems and control objectives. We provide this report as a comprehensive review of the Department’s important work and finances.
The Treasury Department’s accomplishments are a credit to the many dedicated and committed employees in the Departmental Offices and Bureaus. Our persistent focus on core management priorities allows the Department to succeed in meeting its strategic goals, and I am confident that the steps we have taken will allow Treasury to continue to build on this work for many years to come.
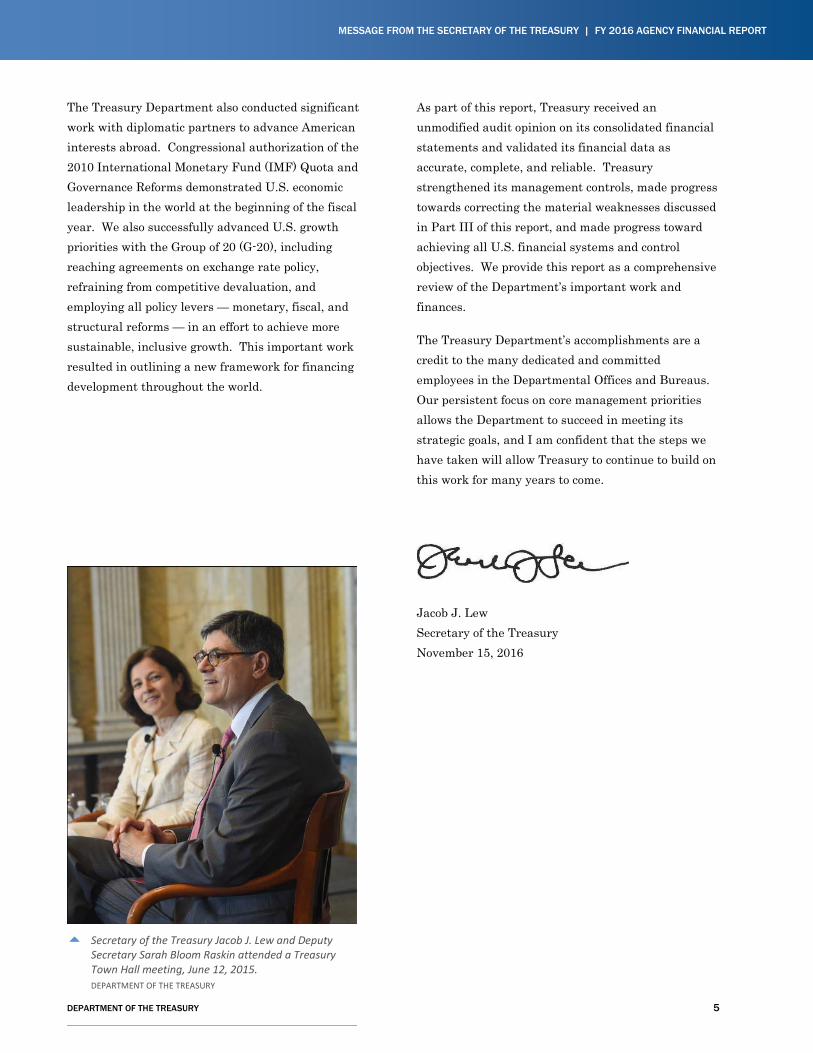
Jacob J. Lew Secretary of the Treasury November 15, 2016
Secretary of the Treasury Jacob J. Lew and Deputy
Secretary Sarah Bloom Raskin attended a Treasury Town Hall meeting, June 12, 2015. DEPARTMENT OF THE TREASURY

[Page intentionally left blank]
TREASURY AT A GLANCE ........................................... 9
ORGANIZATION ..................................................... 11
TREASURY STRATEGIC FRAMEWORK ......................... 14
PERFORMANCE OVERVIEW ...................................... 16
SUMMARY OF MANAGEMENT AND PERFORMANCE CHALLENGES ............................... 37
SUMMARY OF MATERIAL WEAKNESSES ..................... 38
FY 2017 OUTLOOK ............................................... 39
FINANCIAL HIGHLIGHTS .......................................... 40
MANAGEMENT ASSURANCES ................................... 45
SYSTEMS, CONTROLS AND LEGAL COMPLIANCE .......... 46

DEPARTMENT OF THE TREASURY 9
MANAGEMENT’S DISCUSSION AND ANALYSIS | FY 2016 AGENCY FINANCIAL REPORT
TREASURY AT A GLANCE
FOUNDATION
After the American Revolution, Congress realized that funding a war without proper infrastructure and financial discipline presented an enormous challenge to our country’s economic stability. Out of the sheer necessity and lack of authority to levy and collect taxes, Congress established the Department of the Treasury on September 2, 1789, for the primary purpose of managing the U.S. government’s finances. President George Washington appointed Alexander Hamilton as Treasury’s first Secretary. Just nine days after the Department originated, Secretary Hamilton took office. Since that time, we have served under 76 Treasury Secretaries.
Throughout history, Treasury was the foundation for other federal agencies. The U.S. Postal Service, U.S. Customs Service, Secret Service, Federal Law Enforcement Training Center, and U.S. Coast Guard – to name a few – were all, at one point, under Treasury’s jurisdiction.
TODAY’S TREASURY AND HOW WE SERVE THE NATION
Treasury remains the premier financial institution of the United States, responsible for managing our nation’s debt, cash, loans made to other federal agencies, tax collection, money production, and economic policy formulation. We are a trusted policy advisor to the President, formulating and recommending domestic and international financial, economic, and tax policy. We contribute to the development of key policies that shape our economic health and financial security, while simultaneously and seamlessly managing the public debt and monitoring the Nation’s surplus and deficit.
The Department also performs a critical and far-reaching role in enhancing national security and reducing our exposure to international terrorism by implementing
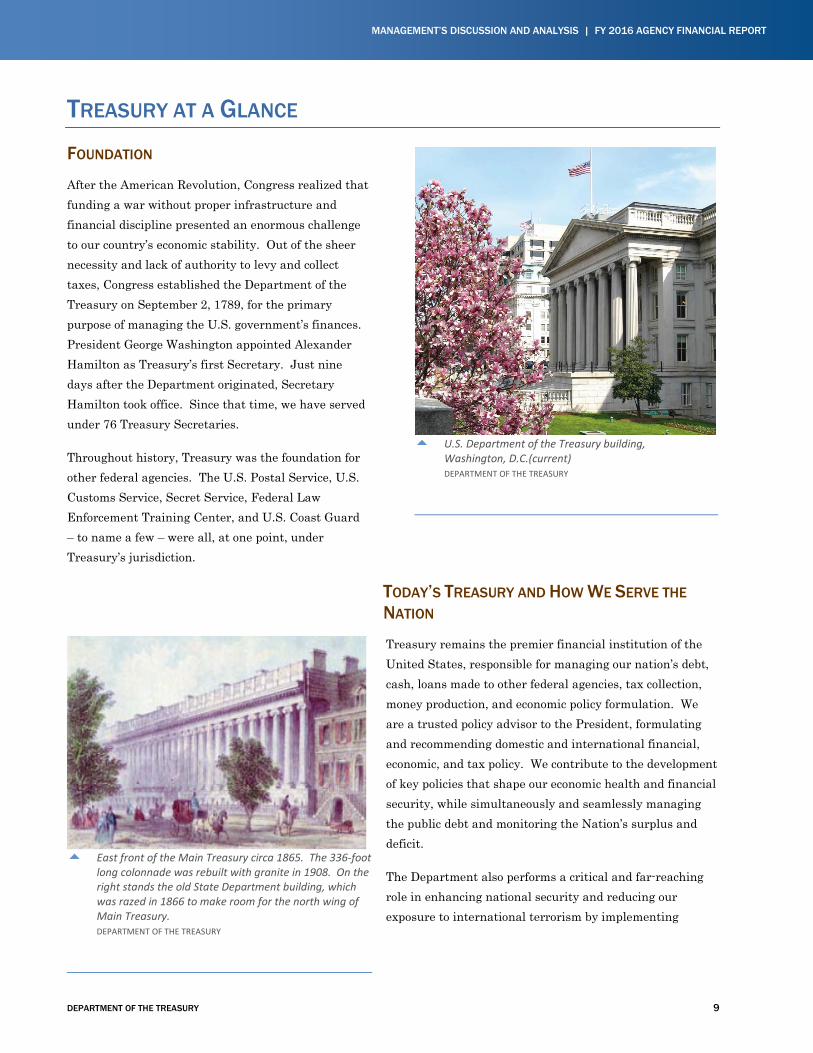
U.S. Department of the Treasury building, Washington, D.C.(current) DEPARTMENT OF THE TREASURY
East front of the Main Treasury circa 1865. The 336-foot
long colonnade was rebuilt with granite in 1908. On the right stands the old State Department building, which was razed in 1866 to make room for the north wing of Main Treasury. DEPARTMENT OF THE TREASURY
10 DEPARTMENT OF THE TREASURY
FY 2016 AGENCY FINANCIAL REPORT | MANAGEMENT’S DISCUSSION AND ANALYSIS
economic sanctions against foreign threats to the United States.
Additionally, we identify and target the financial support networks of national security threats to sever their funding streams. At the same time, we improve safeguards on U.S. financial systems to help combat cyber threats. We also leverage our relationships with our federal partners and the private sector to identify cutting-edge technologies to identify, detect, and prevent threats to our economic stability before occurring.
In recent years, we assisted the Administration in taking extraordinary steps to alleviate the effects of natural and man-made disasters in the Gulf of Mexico and other regions; worked to increase opportunities for small businesses, which are the backbone of our economy; helped to create jobs to improve the well-being of U.S. citizens; and led the safeguarding and growth of our national economy. Since 2008, we have held investments in two Government Sponsored Enterprises (GSEs) – Fannie Mae and Freddie Mac – and are committed to help maintain their solvency so they can continue fulfilling their vital roles in the home mortgage market. We have been a continuously influential part of the government’s service to the
American people, growing and developing to meet the Nation’s needs.
Globally, Treasury represents the U.S. in key economic forums and international financial institutions, including the Group of Seven (G-7) and the G-20, which hold annual summits with heads of state to discuss global foreign policy issues. Treasury plays a vital role in promoting stability and growth in the global economy via our leadership roles in the International Monetary Fund, the World Bank, the regional development banks, and other multilateral organizations like the Financial Stability Board and the Financial Actions Task Force.
Although Treasury has evolved to meet the Nation’s needs, our core mission has remained the same since 1789. Today, with approximately 100,000 employees, we remain steadfast in our commitment to promote conditions that enable economic growth and stability at home and abroad, protect the integrity of the financial system, and effectively manage the U.S. government’s finances and resources. We remain the principal steward of the U.S. economy — collecting revenue, meeting financial obligations, and, when appropriate, borrowing and investing public funds.
DEPARTMENT OF THE TREASURY 11
MANAGEMENT’S DISCUSSION AND ANALYSIS | FY 2016 AGENCY FINANCIAL REPORT
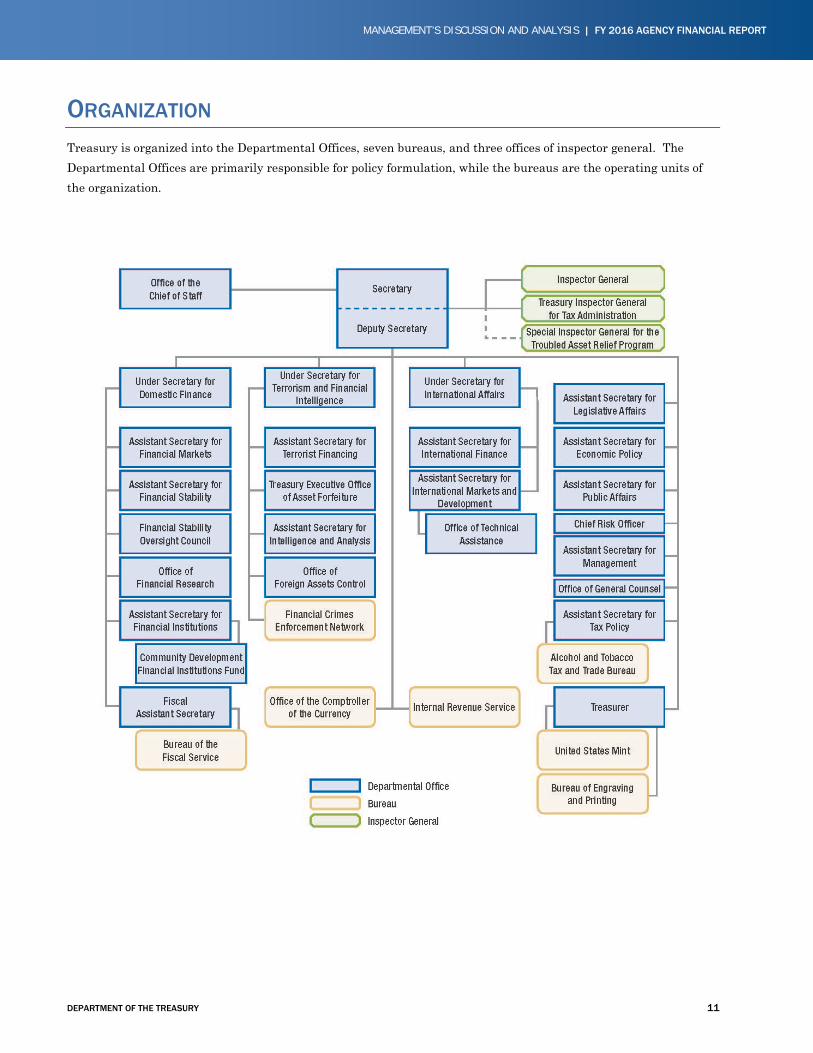
ORGANIZATION Treasury is organized into the Departmental Offices, seven bureaus, and three offices of inspector general. The Departmental Offices are primarily responsible for policy formulation, while the bureaus are the operating units of the organization.
12 DEPARTMENT OF THE TREASURY
FY 2016 AGENCY FINANCIAL REPORT | MANAGEMENT’S DISCUSSION AND ANALYSIS
DEPARTMENTAL OFFICES
Domestic Finance works to preserve confidence in the U.S. Treasury securities market, effectively manage federal fiscal operations, strengthen financial institutions and markets, promote access to credit, and improve financial access and education in service of America’s long-term economic strength and stability.
Terrorism and Financial Intelligence (TFI) uses Treasury’s unique financial intelligence, expertise, and authorities to disrupt and disable terrorists, criminals, and other national security and foreign policy threats to the United States and to protect the U.S. and international financial systems from abuse.
International Affairs protects and supports U.S. economic prosperity and national security by working to foster the most favorable external environment for sustained employment and economic growth.
Tax Policy develops and implements tax policies and programs, reviews regulations and rulings to administer the Internal Revenue Code, negotiates tax treaties, and provides economic and legal policy analysis for domestic and international tax policy decisions. Tax Policy also provides revenue estimates for the President’s Budget.
Other offices within Departmental Offices include General Counsel, Legislative Affairs, and Public Affairs.
Economic Policy reports on current and prospective economic developments and assists in the determination of appropriate economic policies. The office is responsible for the review and analysis of domestic economic issues and developments in the financial markets.
The Treasurer of the United States oversees the U.S. Mint and Bureau of Engraving and Printing, chairs the Advanced Counterfeit Deterrence Steering Committee, and is a key liaison with the Federal Reserve. In addition, the Treasurer serves as a senior advisor to the Secretary in the areas of community development and public engagement.
The Office of Management, including the Chief Financial Officer (CFO), manages the Department’s financial resources and oversees Treasury-wide programs, including human capital, information technology, acquisition, and diversity and inclusion.
INSPECTORS GENERAL
Three Inspectors General – the Office of Inspector General (OIG), the Treasury Inspector General for Tax Administration (TIGTA), and the Special Inspector General for the Troubled Asset Relief Program (SIGTARP) – provide independent audits, investigations, and oversight of Treasury and our programs.
DEPARTMENT OF THE TREASURY 13
MANAGEMENT’S DISCUSSION AND ANALYSIS | FY 2016 AGENCY FINANCIAL REPORT
BUREAUS
The Alcohol and Tobacco Tax and Trade Bureau (TTB) collects federal excise taxes on alcohol, tobacco, firearms, and ammunition and is responsible for enforcing and administering laws covering the production, use, and distribution of alcohol products.
The Bureau of Engraving and Printing (BEP) develops and produces U.S. currency notes that are trusted worldwide.
The Financial Crimes Enforcement Network (FinCEN) safeguards the financial system from illicit use, combats money laundering, and promotes national security through the collection, analysis, and dissemination of financial intelligence and strategic use of financial authorities.
The Bureau of the Fiscal Service (Fiscal Service) provides central payment services to federal program agencies, operates the U.S. government’s collections and deposit systems, delivers administrative shared services to federal agencies, provides government-wide accounting and reporting services, manages the collection of delinquent debt owed to the U.S. government, borrows the money needed to operate the U.S. government through the sale of marketable, savings, and special-purpose U.S. Treasury securities (including the state and local government series), and accounts for and services the public debt.
The Internal Revenue Service (IRS) is the largest of our bureaus and determines, assesses, and collects tax revenue in the United States.
The United States Mint (U.S. Mint) designs, mints, and issues U.S. circulating and bullion coins; prepares and distributes numismatic coins and other items; and strikes Congressional Gold Medals and other medals of national significance. The U.S. Mint maintains physical custody and protection of most of the Nation’s gold and all of its silver assets.
The Office of the Comptroller of the Currency (OCC) charters, regulates, and supervises national banks and federal savings associations (thrifts) to ensure that they operate in a safe and sound manner, provide fair access to financial services, treat customers fairly, and comply with applicable laws and regulations. The OCC also supervises federal branches and agencies of foreign banks and has rule-making authority for all savings associations.
14 DEPARTMENT OF THE TREASURY
FY 2016 AGENCY FINANCIAL REPORT | MANAGEMENT’S DISCUSSION AND ANALYSIS
TREASURY STRATEGIC FRAMEWORK The Government Performance and Results Act (GPRA) and the GPRA Modernization Act of 2010 establish the need for agencies to identify performance goals, report progress against targets, and conduct data-driven reviews. When done well, these practices serve two key purposes for stakeholders within and outside of the organization: to assess the organization’s health and impact and to inform decision-making and strategy, including effective resource allocation. In this spirit, we developed a strategic framework supported by using best-in-class organizational performance practices to ultimately help achieve our strategic goals.
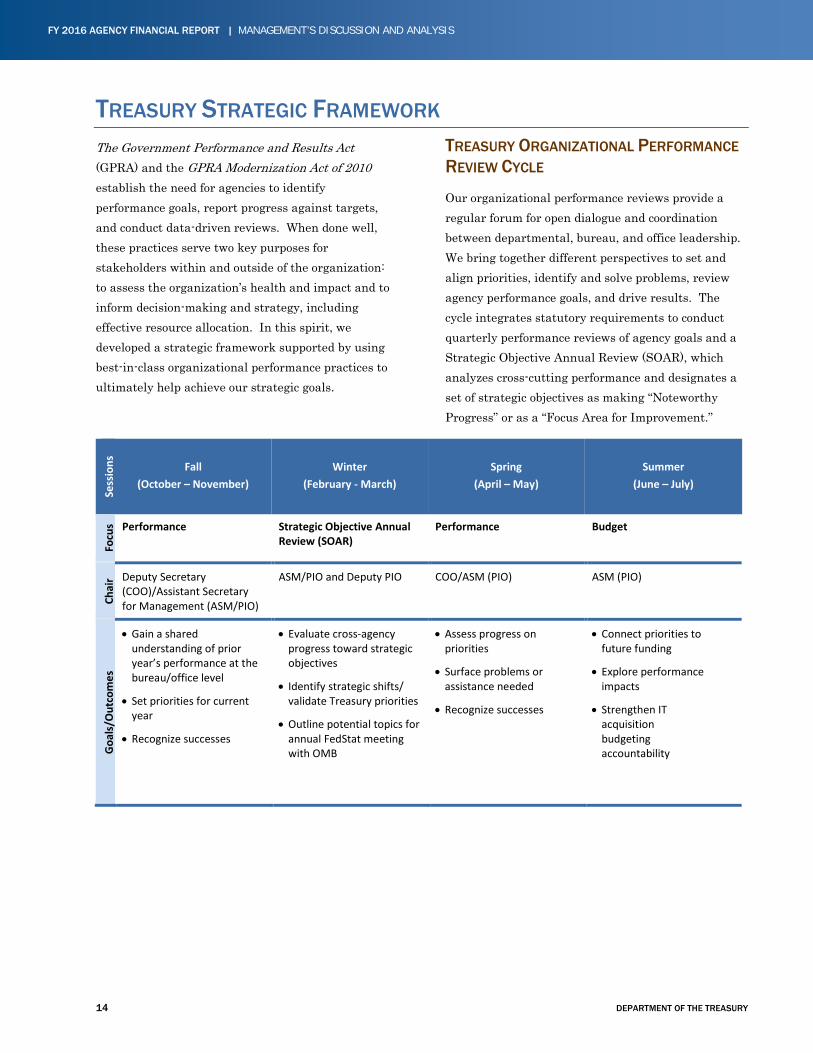
TREASURY ORGANIZATIONAL PERFORMANCE REVIEW CYCLE
Our organizational performance reviews provide a regular forum for open dialogue and coordination between departmental, bureau, and office leadership. We bring together different perspectives to set and align priorities, identify and solve problems, review agency performance goals, and drive results. The cycle integrates statutory requirements to conduct quarterly performance reviews of agency goals and a Strategic Objective Annual Review (SOAR), which analyzes cross-cutting performance and designates a set of strategic objectives as making “Noteworthy Progress” or as a “Focus Area for Improvement.”
Sess
ions
Fall (October – November)
Winter (February - March)
Spring (April – May)
Summer (June – July)
Focu
s Performance Strategic Objective Annual Review (SOAR)
Performance Budget
Chai
r Deputy Secretary (COO)/Assistant Secretary for Management (ASM/PIO)
ASM/PIO and Deputy PIO COO/ASM (PIO) ASM (PIO)
Goa
ls/O
utco
mes
• Gain a shared understanding of prior year’s performance at the bureau/office level
• Set priorities for current year
• Recognize successes
• Evaluate cross-agency progress toward strategic objectives
• Identify strategic shifts/ validate Treasury priorities
• Outline potential topics for annual FedStat meeting with OMB
• Assess progress on priorities
• Surface problems or assistance needed
• Recognize successes
• Connect priorities to future funding
• Explore performance impacts
• Strengthen IT acquisition budgeting accountability
DEPARTMENT OF THE TREASURY 15
MANAGEMENT’S DISCUSSION AND ANALYSIS | FY 2016 AGENCY FINANCIAL REPORT
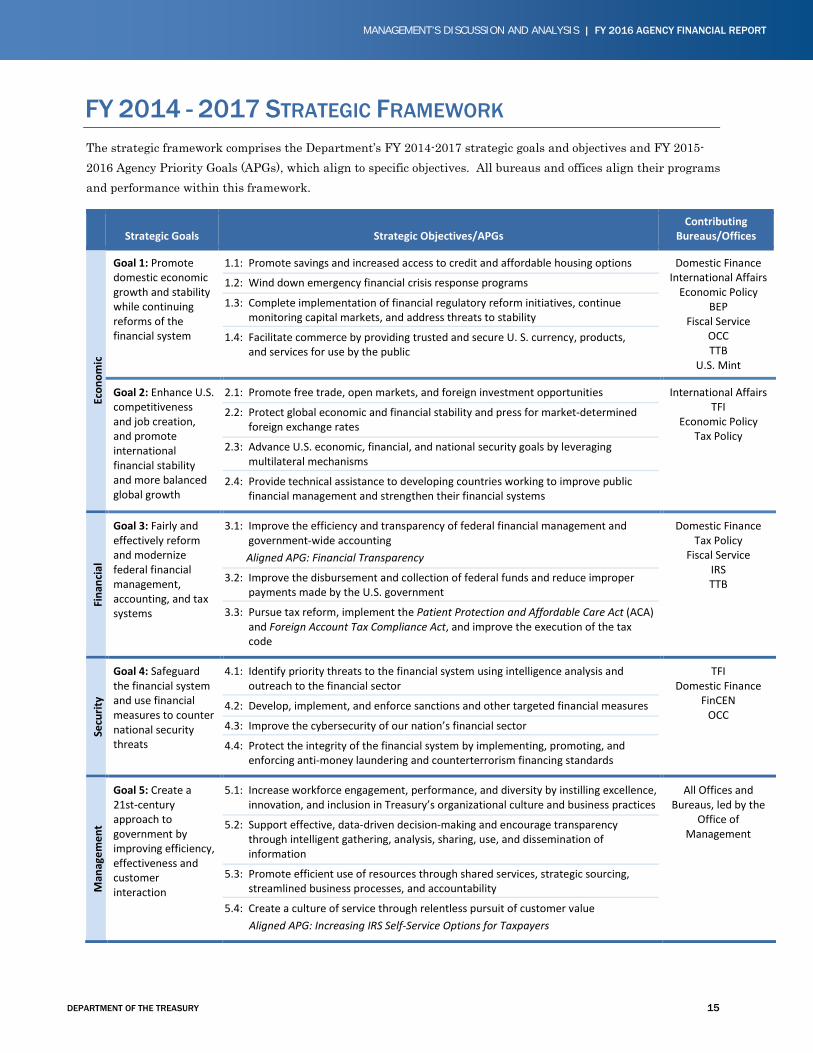
FY 2014 - 2017 STRATEGIC FRAMEWORK The strategic framework comprises the Department’s FY 2014-2017 strategic goals and objectives and FY 2015-2016 Agency Priority Goals (APGs), which align to specific objectives. All bureaus and offices align their programs and performance within this framework.
Strategic Goals Strategic Objectives/APGs Contributing
Bureaus/Offices
Econ
omic
Goal 1: Promote domestic economic growth and stability while continuing reforms of the financial system
1.1: Promote savings and increased access to credit and affordable housing options
1.2: Wind down emergency financial crisis response programs
1.3: Complete implementation of financial regulatory reform initiatives, continue monitoring capital markets, and address threats to stability
1.4: Facilitate commerce by providing trusted and secure U. S. currency, products, and services for use by the public
Domestic Finance International Affairs
Economic Policy BEP
Fiscal Service OCC TTB
U.S. Mint
Goal 2: Enhance U.S. competitiveness and job creation, and promote international financial stability and more balanced global growth
2.1: Promote free trade, open markets, and foreign investment opportunities
2.2: Protect global economic and financial stability and press for market-determined foreign exchange rates
2.3: Advance U.S. economic, financial, and national security goals by leveraging multilateral mechanisms
2.4: Provide technical assistance to developing countries working to improve public financial management and strengthen their financial systems
International Affairs TFI
Economic Policy Tax Policy
Fina
ncia
l
Goal 3: Fairly and effectively reform and modernize federal financial management, accounting, and tax systems
3.1: Improve the efficiency and transparency of federal financial management and government-wide accounting
Aligned APG: Financial Transparency
3.2: Improve the disbursement and collection of federal funds and reduce improper payments made by the U.S. government
3.3: Pursue tax reform, implement the Patient Protection and Affordable Care Act (ACA) and Foreign Account Tax Compliance Act, and improve the execution of the tax code
Domestic Finance Tax Policy
Fiscal Service IRS TTB
Secu
rity
Goal 4: Safeguard the financial system and use financial measures to counter national security threats
4.1: Identify priority threats to the financial system using intelligence analysis and outreach to the financial sector
4.2: Develop, implement, and enforce sanctions and other targeted financial measures
4.3: Improve the cybersecurity of our nation’s financial sector
4.4: Protect the integrity of the financial system by implementing, promoting, and enforcing anti-money laundering and counterterrorism financing standards
TFI Domestic Finance
FinCEN OCC
Man
agem
ent
Goal 5: Create a 21st-century approach to government by improving efficiency, effectiveness and customer interaction
5.1: Increase workforce engagement, performance, and diversity by instilling excellence, innovation, and inclusion in Treasury’s organizational culture and business practices
5.2: Support effective, data-driven decision-making and encourage transparency through intelligent gathering, analysis, sharing, use, and dissemination of information
5.3: Promote efficient use of resources through shared services, strategic sourcing, streamlined business processes, and accountability
5.4: Create a culture of service through relentless pursuit of customer value Aligned APG: Increasing IRS Self-Service Options for Taxpayers
All Offices and Bureaus, led by the
Office of Management
16 DEPARTMENT OF THE TREASURY
FY 2016 AGENCY FINANCIAL REPORT | MANAGEMENT’S DISCUSSION AND ANALYSIS
PERFORMANCE OVERVIEW Goal 1: Promote domestic growth and stability while continuing reforms of the financial system
Economic growth stimulates opportunity, mobility, and security for Americans – and allows citizens and businesses to have more confidence in the safety and soundness of the financial system. Strategic objectives for achieving our first goal are to: (i) promote savings and increased access to credit and affordable housing; (ii) wind down emergency financial crisis response programs; (iii) implement financial regulatory reform initiatives, continue monitoring capital markets, and address threats to stability; and (iv) facilitate commerce by providing trusted and secure U.S. currency, products, and services for use by the public.
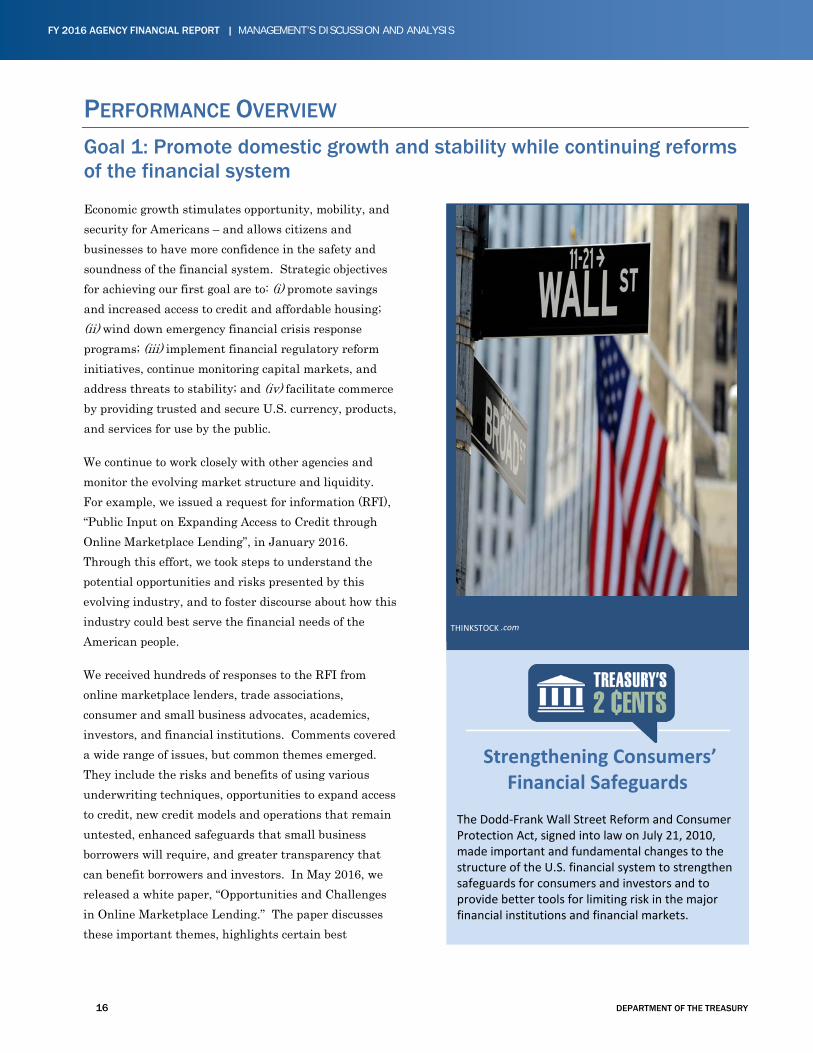
We continue to work closely with other agencies and monitor the evolving market structure and liquidity. For example, we issued a request for information (RFI), “Public Input on Expanding Access to Credit through Online Marketplace Lending”, in January 2016. Through this effort, we took steps to understand the potential opportunities and risks presented by this evolving industry, and to foster discourse about how this industry could best serve the financial needs of the American people.
We received hundreds of responses to the RFI from online marketplace lenders, trade associations, consumer and small business advocates, academics, investors, and financial institutions. Comments covered a wide range of issues, but common themes emerged. They include the risks and benefits of using various underwriting techniques, opportunities to expand access to credit, new credit models and operations that remain untested, enhanced safeguards that small business borrowers will require, and greater transparency that can benefit borrowers and investors. In May 2016, we released a white paper, “Opportunities and Challenges in Online Marketplace Lending.” The paper discusses these important themes, highlights certain best
THINKSTOCK .com
Strengthening Consumers’
Financial Safeguards
The Dodd-Frank Wall Street Reform and Consumer Protection Act, signed into law on July 21, 2010, made important and fundamental changes to the structure of the U.S. financial system to strengthen safeguards for consumers and investors and to provide better tools for limiting risk in the major financial institutions and financial markets.

DEPARTMENT OF THE TREASURY 17
MANAGEMENT’S DISCUSSION AND ANALYSIS | FY 2016 AGENCY FINANCIAL REPORT
practices, and provides policy recommendations. To follow up, we are facilitating interagency coordination through the creation of a standing working group on online marketplace lending with other federal agencies. Our partners include the Consumer Financial Protection Bureau, the Federal Deposit Insurance Corporation, the Federal Reserve Board, the Federal Trade Commission, the Securities and Exchange Commission, the Small Business Administration, a representative of a state bank supervisor, and the OCC. During 2016, the group met four times to discuss and share information on marketplace lending issues.
In addition, Treasury’s Office of Financial Stability (OFS) has undertaken efforts to effectuate a smooth wind-down of the Making Home Affordable program (MHA), which will close to new applications in December 2016. To this end, OFS initiated and continues to work with stakeholders to influence a framework for loss mitigation following the end of MHA. This included joint publication with the Department of Housing and Urban Development (HUD) and the Federal Housing Finance Agency in July of a white paper designed to serve as a guide for future loss mitigation programs that drew from the lessons learned
from the government’s crisis-era housing programs. At the same time, OFS continues to implement the Hardest Hit Fund (HHF) to help stabilize housing markets in 18 states and the District of Columbia. In April 2016, OFS concluded a process to allocate an additional $2 billion to HHF, enabling participating states to continue helping struggling homeowners avoid foreclosure and to stabilize their state housing markets.
In September 2016, our Community Development Financial Institutions Fund (CDFI Fund) awarded 32 organizations nearly $91.5 million in grants for the development of affordable housing and community facilities in low-income communities. These awards were made through the FY 2016 round of the Capital Magnet Fund (CMF). They will support financing for the preservation, rehabilitation, development or purchase of affordable housing for low-income communities. These grants will also support related economic development and community service facilities such as day care centers, workforce development centers, and health care clinics. Recipients are able to use CMF awards to create financing tools such as loan reserves, loan funds, risk sharing loans, and loan guarantees. CMF awards must be used to leverage
The front of the new $20 note will feature the portrait of
Harriet Tubman, whose life was dedicated to fighting for liberty. The reverse of the new $20 note will depict the White House and an image of President Andrew Jackson.
DEPARTMENT OF THE TREASURY
Introducing the New $20, $10,
and $5 Notes
America’s currency is a statement about who we are as a nation. Our modern money honors our history and celebrates our values. Building on tremendous feedback from Americans across our country about the theme of democracy, Treasury will create new design concepts for the $20, $10, and $5 dollar notes. For the first time in over a century, the front of our currency will feature the portrait of a woman — Harriet Tubman on the $20 note. Learn more about our currency redesign at https://modernmoney.treasury.gov/.
18 DEPARTMENT OF THE TREASURY
FY 2016 AGENCY FINANCIAL REPORT | MANAGEMENT’S DISCUSSION AND ANALYSIS
housing and economic development investments to achieve a leverage ratio of at least 10:1.
Also, the Small Business Jobs Act of 2010 created the CDFI Bond Guarantee Program, which is administered by the CDFI Fund. Bonds issued under the program support CDFI lending activity in underserved communities by providing a source of long-term, low-
cost capital. Since 2013, we have provided bond guarantees totaling $1.11 billion for financial institutions to finance small businesses, affordable rental housing, day care centers, senior living facilities, charter schools, and health care facilities. On September 28, 2016, we announced that an additional two bond issuances, totaling $265 million, were guaranteed in FY 2016.
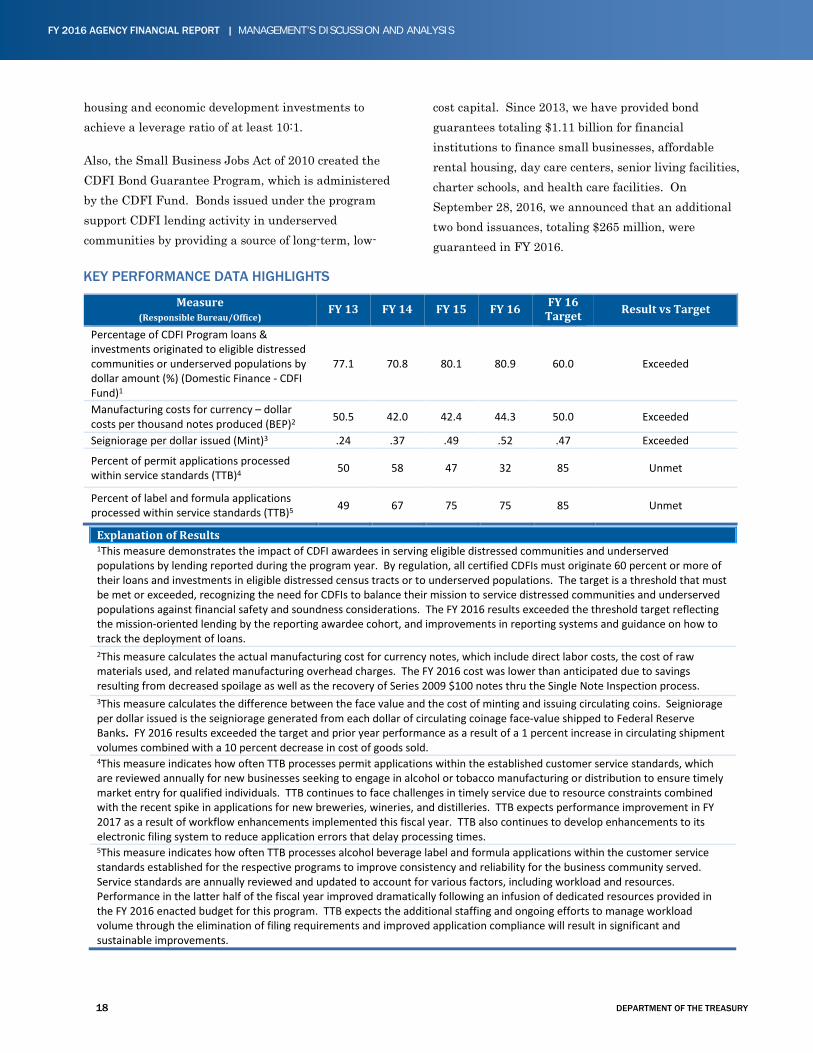
KEY PERFORMANCE DATA HIGHLIGHTS
Measure (Responsible Bureau/Office) FY 13 FY 14 FY 15 FY 16 FY 16
Target Result vs Target
Percentage of CDFI Program loans & investments originated to eligible distressed communities or underserved populations by dollar amount (%) (Domestic Finance - CDFI Fund)1
77.1 70.8 80.1 80.9 60.0 Exceeded
Manufacturing costs for currency – dollar costs per thousand notes produced (BEP)2 50.5 42.0 42.4 44.3 50.0 Exceeded
Seigniorage per dollar issued (Mint)3 .24 .37 .49 .52 .47 Exceeded
Percent of permit applications processed within service standards (TTB)4 50 58 47 32 85 Unmet
Percent of label and formula applications processed within service standards (TTB)5 49 67 75 75 85 Unmet Explanation of Results 1This measure demonstrates the impact of CDFI awardees in serving eligible distressed communities and underserved populations by lending reported during the program year. By regulation, all certified CDFIs must originate 60 percent or more of their loans and investments in eligible distressed census tracts or to underserved populations. The target is a threshold that must be met or exceeded, recognizing the need for CDFIs to balance their mission to service distressed communities and underserved populations against financial safety and soundness considerations. The FY 2016 results exceeded the threshold target reflecting the mission-oriented lending by the reporting awardee cohort, and improvements in reporting systems and guidance on how to track the deployment of loans. 2This measure calculates the actual manufacturing cost for currency notes, which include direct labor costs, the cost of raw materials used, and related manufacturing overhead charges. The FY 2016 cost was lower than anticipated due to savings resulting from decreased spoilage as well as the recovery of Series 2009 $100 notes thru the Single Note Inspection process. 3This measure calculates the difference between the face value and the cost of minting and issuing circulating coins. Seigniorage per dollar issued is the seigniorage generated from each dollar of circulating coinage face-value shipped to Federal Reserve Banks. FY 2016 results exceeded the target and prior year performance as a result of a 1 percent increase in circulating shipment volumes combined with a 10 percent decrease in cost of goods sold. 4This measure indicates how often TTB processes permit applications within the established customer service standards, which are reviewed annually for new businesses seeking to engage in alcohol or tobacco manufacturing or distribution to ensure timely market entry for qualified individuals. TTB continues to face challenges in timely service due to resource constraints combined with the recent spike in applications for new breweries, wineries, and distilleries. TTB expects performance improvement in FY 2017 as a result of workflow enhancements implemented this fiscal year. TTB also continues to develop enhancements to its electronic filing system to reduce application errors that delay processing times. 5This measure indicates how often TTB processes alcohol beverage label and formula applications within the customer service standards established for the respective programs to improve consistency and reliability for the business community served. Service standards are annually reviewed and updated to account for various factors, including workload and resources. Performance in the latter half of the fiscal year improved dramatically following an infusion of dedicated resources provided in the FY 2016 enacted budget for this program. TTB expects the additional staffing and ongoing efforts to manage workload volume through the elimination of filing requirements and improved application compliance will result in significant and sustainable improvements.
DEPARTMENT OF THE TREASURY 19
MANAGEMENT’S DISCUSSION AND ANALYSIS | FY 2016 AGENCY FINANCIAL REPORT
Goal 2: Enhance U.S. competitiveness and job creation, and promote international financial stability and more balanced global growth
We protect and support American economic prosperity by strengthening the external environment for U.S. growth, preventing and mitigating global financial instability, and managing key global challenges. Our strategic objectives for achieving our second goal are to: (i) promote free trade, open markets, and foreign investment opportunities; (ii) protect global economic and financial stability and press for market-determined foreign exchange rates; (iii) advance U.S. economic, financial, and national security goals by leveraging multilateral mechanisms; and (iv) provide technical assistance to developing countries working to improve public financial management and strengthen their financial systems. In FY 2016, we identified objective 2.3 as achieving noteworthy progress due to Congressional passage of the 2010 IMF Quota and Governance Reforms, which was a focus area for improvement in FYs 2014 and 2015.
EFFORTS TO PROMOTE GLOBAL STABILITY
In December 2015, Congress approved the IMF Quota and Governance Reforms to strengthen the IMF in its role of supporting global growth and financial stability. The reforms significantly increased the IMF's core resources, enabling swift and effective responses to crises, and also improved the IMF's governance by better reflecting the increasing role of dynamic emerging and developing countries in the global economy. Since the global financial crisis, the international financial regulatory community has taken important steps to foster a more resilient financial system through shoring up bank balance sheets, developing tools to resolve failing institutions, assessing risks from non-bank financial institutions, and strengthening derivatives markets and central counterparty clearing. We continue working with international partners, including the Financial Stability Board, Financial Action Task Force, IMF, and World Bank to address challenges related to a
decline in correspondent banking relationships, including by prioritizing technical assistance aimed at helping countries address deficiencies in their financial sector supervisory regime and by clarifying regulatory expectations.
We also leveraged strong multilateral institutions to make progress in supporting global growth and reinforcing norms against unfair currency practices. The G-20 members in Shanghai in February 2016 committed to using all policy tools—monetary, fiscal, and structural—to boost economic growth in a time of weak demand. The G-20 also committed to refrain from competitive devaluation and, for the first time, to consult on foreign exchange markets to avoid surprises that could threaten global financial stability.
In November 2015, Treasury and macroeconomic policy authorities of the 11 other Trans-Pacific Partnership (TPP) countries adopted provisions to address unfair currency practices in the context of the TPP free trade agreement. This first-ever Joint Declaration sets a high standard among TPP countries to prevent unfair currency practices, and calls for unprecedented transparency and accountability among countries that are entering into a trade agreement. All TPP countries committed to avoid unfair currency practices and refrain from competitive devaluation; to publicly report their foreign exchange intervention and foreign reserves data; and to consult regularly to address macroeconomic issues, including engaging on efforts to avoid unfair currency practices. We developed and negotiated the Joint Declaration, which addresses the principal negotiating objectives on currency that Congress included in the Trade Priorities and Accountability Act passed in June 2015.
20 DEPARTMENT OF THE TREASURY
FY 2016 AGENCY FINANCIAL REPORT | MANAGEMENT’S DISCUSSION AND ANALYSIS
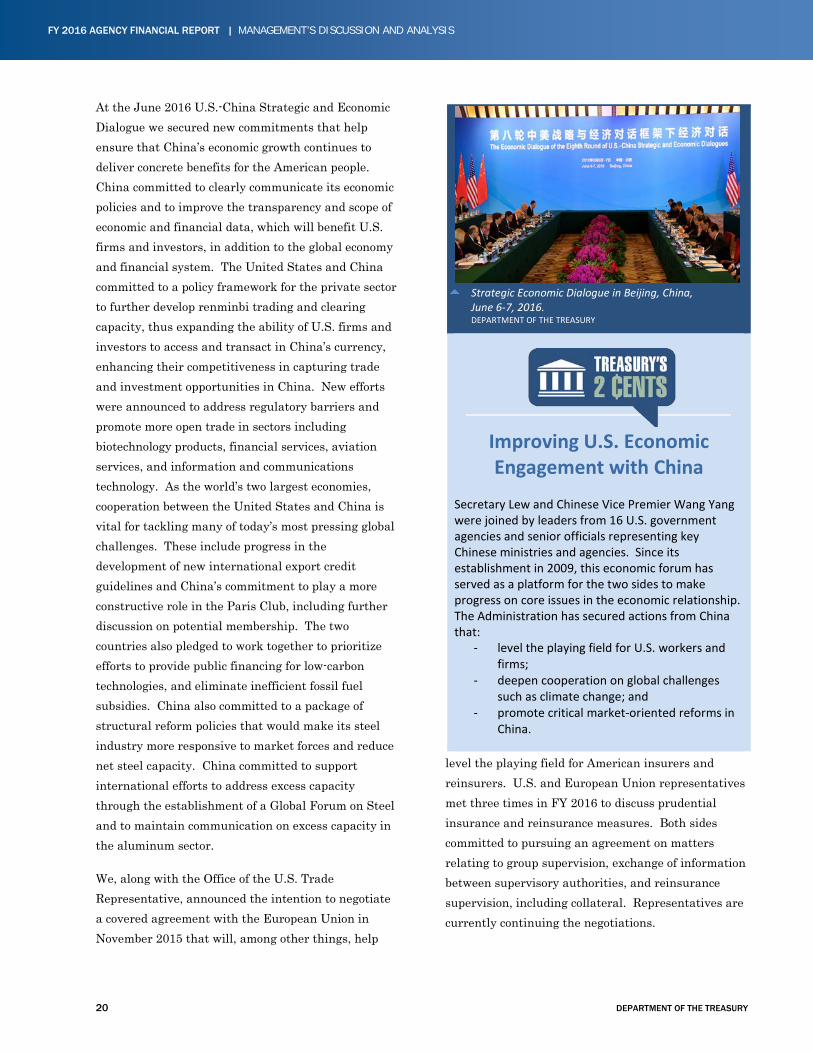
At the June 2016 U.S.-China Strategic and Economic Dialogue we secured new commitments that help ensure that China’s economic growth continues to deliver concrete benefits for the American people. China committed to clearly communicate its economic policies and to improve the transparency and scope of economic and financial data, which will benefit U.S. firms and investors, in addition to the global economy and financial system. The United States and China committed to a policy framework for the private sector to further develop renminbi trading and clearing capacity, thus expanding the ability of U.S. firms and investors to access and transact in China’s currency, enhancing their competitiveness in capturing trade and investment opportunities in China. New efforts were announced to address regulatory barriers and promote more open trade in sectors including biotechnology products, financial services, aviation services, and information and communications technology. As the world’s two largest economies, cooperation between the United States and China is vital for tackling many of today’s most pressing global challenges. These include progress in the development of new international export credit guidelines and China’s commitment to play a more constructive role in the Paris Club, including further discussion on potential membership. The two countries also pledged to work together to prioritize efforts to provide public financing for low-carbon technologies, and eliminate inefficient fossil fuel subsidies. China also committed to a package of structural reform policies that would make its steel industry more responsive to market forces and reduce net steel capacity. China committed to support international efforts to address excess capacity through the establishment of a Global Forum on Steel and to maintain communication on excess capacity in the aluminum sector.
We, along with the Office of the U.S. Trade Representative, announced the intention to negotiate a covered agreement with the European Union in November 2015 that will, among other things, help
level the playing field for American insurers and reinsurers. U.S. and European Union representatives met three times in FY 2016 to discuss prudential insurance and reinsurance measures. Both sides committed to pursuing an agreement on matters relating to group supervision, exchange of information between supervisory authorities, and reinsurance supervision, including collateral. Representatives are currently continuing the negotiations.
Strategic Economic Dialogue in Beijing, China,
June 6-7, 2016. DEPARTMENT OF THE TREASURY
Improving U.S. Economic Engagement with China
Secretary Lew and Chinese Vice Premier Wang Yang were joined by leaders from 16 U.S. government agencies and senior officials representing key Chinese ministries and agencies. Since its establishment in 2009, this economic forum has served as a platform for the two sides to make progress on core issues in the economic relationship. The Administration has secured actions from China that:
- level the playing field for U.S. workers and firms;
- deepen cooperation on global challenges such as climate change; and
- promote critical market-oriented reforms in China.
DEPARTMENT OF THE TREASURY 21
MANAGEMENT’S DISCUSSION AND ANALYSIS | FY 2016 AGENCY FINANCIAL REPORT
PROTECTING THE GLOBAL FINANCIAL SYSTEM
In November 2015, we announced further guidance to make it more difficult for companies to undertake an inversion and to reduce the economic benefits of doing so. A corporate inversion is a transaction in which a U.S.-parented multinational group changes its tax residence to reduce or avoid paying U.S. taxes. In April 2016, we released temporary regulations that incorporated rules from prior inversion guidance (i.e., two notices issued in 2014 and 2015). In addition, the temporary regulations served to further limit inversions by disregarding foreign parent stock attributable to certain prior acquisitions of U.S. companies. As part of the same package, we released proposed regulations addressing the issue of earnings stripping by targeting transactions that increase
related-party debt that does not finance new investment in the United States.
In May 2016, we finalized a customer due diligence rule that will require financial institutions to identify beneficial owners of companies that become their customers. Some bad actors have used shell companies and offshore accounts to evade taxes, launder money, or finance terrorist activity. We also took several steps to further increase transparency and disclosure requirements, including proposing a rule requiring certain foreign-owned companies to obtain a tax identification number from the IRS, thereby requiring these entities to report ownership and transaction information to the IRS. These steps serve to help combat money laundering and tax evasion, but additional tools are needed to promote transparency and strengthen law enforcement.
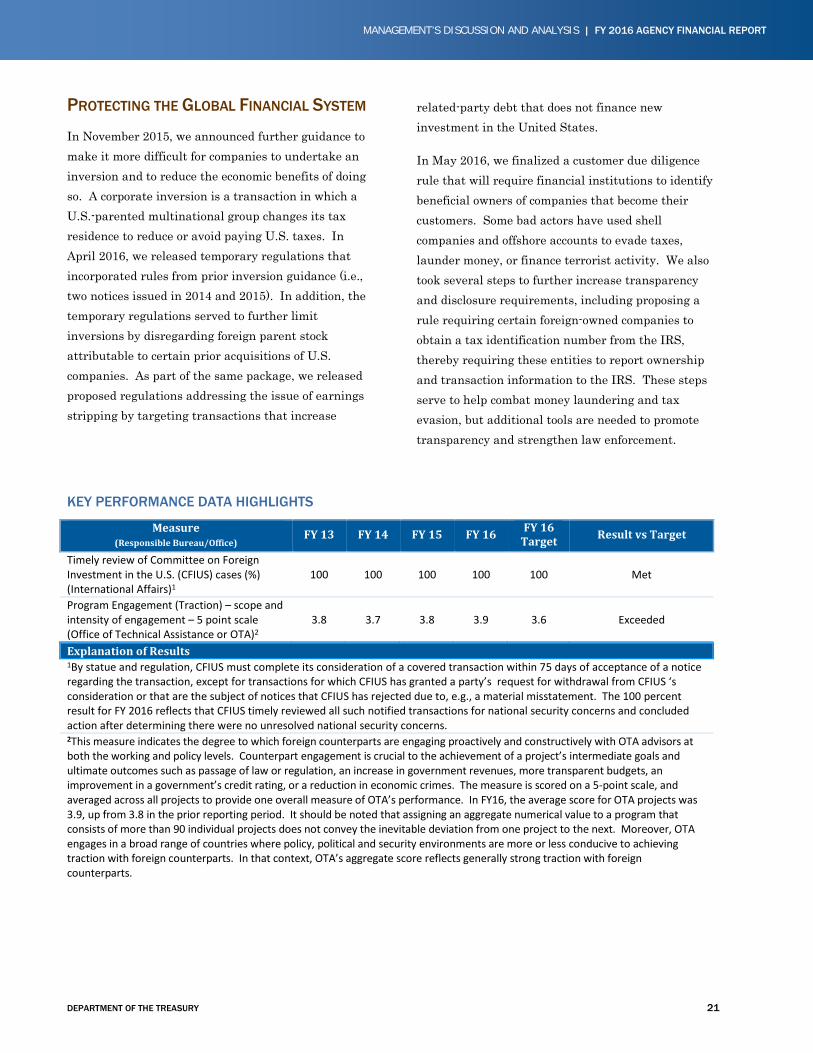
KEY PERFORMANCE DATA HIGHLIGHTS
Measure (Responsible Bureau/Office) FY 13 FY 14 FY 15 FY 16 FY 16
Target Result vs Target
Timely review of Committee on Foreign Investment in the U.S. (CFIUS) cases (%) (International Affairs)1
100 100 100 100 100 Met
Program Engagement (Traction) – scope and intensity of engagement – 5 point scale (Office of Technical Assistance or OTA)2
3.8 3.7 3.8 3.9 3.6 Exceeded
Explanation of Results 1By statue and regulation, CFIUS must complete its consideration of a covered transaction within 75 days of acceptance of a notice regarding the transaction, except for transactions for which CFIUS has granted a party’s request for withdrawal from CFIUS ‘s consideration or that are the subject of notices that CFIUS has rejected due to, e.g., a material misstatement. The 100 percent result for FY 2016 reflects that CFIUS timely reviewed all such notified transactions for national security concerns and concluded action after determining there were no unresolved national security concerns.
2This measure indicates the degree to which foreign counterparts are engaging proactively and constructively with OTA advisors at both the working and policy levels. Counterpart engagement is crucial to the achievement of a project’s intermediate goals and ultimate outcomes such as passage of law or regulation, an increase in government revenues, more transparent budgets, an improvement in a government’s credit rating, or a reduction in economic crimes. The measure is scored on a 5-point scale, and averaged across all projects to provide one overall measure of OTA’s performance. In FY16, the average score for OTA projects was 3.9, up from 3.8 in the prior reporting period. It should be noted that assigning an aggregate numerical value to a program that consists of more than 90 individual projects does not convey the inevitable deviation from one project to the next. Moreover, OTA engages in a broad range of countries where policy, political and security environments are more or less conducive to achieving traction with foreign counterparts. In that context, OTA’s aggregate score reflects generally strong traction with foreign counterparts.
22 DEPARTMENT OF THE TREASURY
FY 2016 AGENCY FINANCIAL REPORT | MANAGEMENT’S DISCUSSION AND ANALYSIS
Goal 3: Fairly and effectively reform and modernize federal financial management, accounting, and tax systems
Treasury is entrusted with managing the Nation’s finances. This includes collecting money due to the U.S. government, making payments owed by the United States, and financing the federal government by determining and executing a borrowing strategy that meets the federal government’s needs at the lowest cost. Strategic objectives for achieving this goal are to: (i) improve the efficiency and transparency of federal financial management and government-wide accounting; (ii) improve the disbursement and collection of federal funds and reduce improper payments made by the U.S. government; and (iii) pursue tax reform, implement the ACA and the Foreign Account Tax Compliance Act (FATCA), and improve the execution of the tax code.
DIGITAL ACCOUNTABILITY AND TRANSPARENCY ACT OF 2014 (DATA ACT)
Treasury continues our important role leading the government in modernizing federal financial management. As co-lead with the Office of Management and Budget (OMB), we designated implementation of the DATA Act as an APG for FYs 2016-2017. Through this initiative, we are engaging with other organizations and communities that create and use federal data to make it more transparent and available to the American people.
Last year, we worked with OMB to finalize data definition standards. In April 2016, we released the DATA Act Information Model Schema Version 1.0 (DAIMS v1.0), which defines the relationships between data elements and provides technical guidance for agencies on what data to report to us and what format to use. We reviewed hundreds of comments by the public and federal agencies before finalizing DAIMS v1.0.
In addition, we made progress in developing the DATA Act operating infrastructure, including
developing the DATA Act Broker. It is a web-based tool agencies will use to submit and validate their data for publication on USAspending.gov. Treasury also launched OpenBeta to obtain feedback from the public on future design of USAspending.gov. OpenBeta is a public interactive website where users can participate in the website’s development. Finally, Treasury and OMB developed recommendations for a future governance structure for expanding and maintaining the data exchange standards.
TAX ADMINISTRATION
Effective tax administration is a critical part of our mission. Ensuring the efficiency and transparency of financial management processes and the integrity and accuracy of government accounting of tax revenues is an ongoing area of focus for the Department. As part of this effort, we have continued to work to improve tax administration through the modernization of systems, and the strengthening of fraud and identity theft protections. To facilitate these efforts, the IRS received a funding increase of $290 million in FY 2016 specifically for the purpose of achieving "measurable improvements in the customer service representative level of service rate, to improve the identification and prevention of refund fraud and identity theft, and to enhance cybersecurity to safeguard taxpayer data." With these additional resources the IRS was able to increase the level of telephone service rate to 72.1 percent during the most recent filing season (January through April) as well as develop and deploy several new cybersecurity initiatives. Despite these improvements, the total FY 2016 IRS budget of $11.235 billion remains $911 million below the FY 2010 enacted level which, combined with inflationary growth in labor and non-labor expenses, has resulted in a reduction of more than 15,000 full-time employees.

DEPARTMENT OF THE TREASURY 23
MANAGEMENT’S DISCUSSION AND ANALYSIS | FY 2016 AGENCY FINANCIAL REPORT
These funding constraints continued to significantly affect the IRS’s ability to modernize and improve information technology systems. Without adequate funding to address the aging infrastructure, the IRS’s tax administration systems and cybersecurity infrastructure become increasingly vulnerable. Additionally, we will need to reduce hiring and defer infrastructure and technology investments. Since over 56 percent of the IRS workforce is fifty years of age or older, the lack of needed new hires prevents the transfer of knowledge from the IRS’s existing workforce, which is essential to prevent loss of critical knowledge and experience as retirements occur over the next several years. In order to manage the current funding situation, the IRS prioritized the allocation of resources toward areas of critical and immediate need, such as the delivery of a successful filing season in 2016 and the ongoing implementation of multiple legislative mandates.
Several key areas of focus for the IRS in FY 2016 were continuing the implementation of the ACA tax provisions and the FATCA, and administering the existing tax code fairly and effectively. For the ACA, the IRS improved education and outreach to taxpayers, employers, and tax professionals this year by developing and distributing materials such as webinars, social media broadcasts, and traditional media publications. The IRS also revised several forms, instructions, and notices in order to improve comprehension and readability and to ensure that taxpayers understood their tax filing responsibilities. In order to ensure compliance with ACA-related filing requirements, the IRS worked closely with the Centers for Medicare and Medicaid Services (CMS) to conduct outreach to uninsured people who paid the penalty or claimed an exemption, letting them know that tax credits are available for marketplace coverage and providing information about their health coverage options. In addition, during the course of the filing season, the IRS processed a significant number of ACA related documents.
THINKSTOCK .com
IRS’ Dirty Dozen Scam List:
Don’t be a Victim
Each year, individuals fall prey to tax scams. That’s why the IRS provides a list of its annual “Dirty Dozen.” Illegal scams can lead to significant penalties and interest and possible criminal prosecution. IRS Criminal Investigation works closely with the Department of Justice to shutdown scams and prosecutes the criminals behind them. Additional information about tax scams available on IRS social media sites provide in depth information on various types of scams such as identity theft, telephone scams, phishing, return preparer fraud, and fake charities. The best defense is to remain informed and alert.
24 DEPARTMENT OF THE TREASURY
FY 2016 AGENCY FINANCIAL REPORT | MANAGEMENT’S DISCUSSION AND ANALYSIS
The IRS is also continuing to implement FATCA. This legislation requires foreign financial institutions (FFIs) to report detailed information about foreign account holders to the IRS or face a 30 percent withholding tax. This program has an unprecedented impact on stakeholders worldwide, including the global financial industry, U.S. taxpayers domestically and overseas, and foreign tax administrations. The IRS has been continuing efforts to reach out to impacted entities and paid preparers in order to provide education on the FATCA filing and reporting requirements. IRS registration efforts support the program; in FY 2016 nearly 190,000 financial
institutions registered with the IRS, while over 5,000 financial institutions have enrolled in the International Data Exchange Service to submit FATCA returns to the IRS.
In order to support the FATCA program, the IRS continued to develop and deploy the FATCA registration system, which provided improved online services for FFIs, and enhanced the IRS's ability to capture, exchange, manage, and analyze data. By the end of FY 2016, more than 48,000 of the over 217,000 Financial Institutions and sponsored entities in the FATCA program with active Global Intermediary Identification numbers registered with the IRS. Finally, in the realm of tax enforcement, the IRS updated the FATCA Compliance Roadmap with additional approaches to identifying non-compliance by FFIs.
IDENTITY THEFT AND IMPROPER PAYMENTS
Identity theft continues to be a serious and evolving issue, which has a significant impact on tax administration. In FY 2016, the IRS stopped more than $4 billion in fraudulent refunds claimed by identity thieves on more than 787,000 tax returns. In March 2015, the IRS established a Security Summit, an unprecedented public-private partnership consisting of leaders from the IRS and state tax agencies and the private sector tax industry. One of the most important aspects of the Security Summit’s charge is to ensure that the IRS, tax administrators, and tax industry leaders share information with one another and among their work groups about what they are doing to combat identity theft and fraud. Since March 2015, Summit partners protected taxpayers from tax-related identity theft, stopped suspicious tax returns, and prevented fraudulent refunds from getting into criminals’ hands. Because of the safeguards enacted by this partnership, fewer people became victims of tax-related identity theft during the 2016 filing season.
DEPARTMENT OF THE TREASURY
Reducing Improper Payments
Fiscal Service – the primary disburser of payments to individuals and vendors on behalf of federal agencies – established the “Do Not Pay” portal to help federal agencies reduce improper payments. The portal helps identify ineligible recipients by verifying eligibility of a vendor, grantee, loan recipient, or beneficiary prior to award; and re-verifying eligibility before, during, and after payments are made. The Portal’s mission is to protect the integrity of the government’s payment process by assisting agencies in mitigating and eliminating improper payments in a cost-effective manner while safeguarding the privacy of individuals.
DEPARTMENT OF THE TREASURY 25
MANAGEMENT’S DISCUSSION AND ANALYSIS | FY 2016 AGENCY FINANCIAL REPORT
Because of Security Summit efforts, the number of anticipated taxpayer victims fell between 2015 and 2016. The number of refunds that banks and financial institutions returned to the IRS because they appeared suspicious dropped by 55 percent. Working together, Security Summit partners were able to warn the public – including the payroll industry, human resource personnel and tax preparers – of emerging scams in which criminals either posed as company executives to steal employee Form W-2 information or instances where criminals used technology to gain remote control of preparers’ office computers. The IRS also provided specialized outreach and education campaigns to help taxpayers avoid fraud and augmented staffing to assist taxpayers who have become victims of identity theft.
The IRS strengthened its ability to identify and respond to fraud by bolstering analytics capabilities, making full use of existing data sources and exploring potential new data sources and techniques that allow better identification of anomalies. The IRS deployed maintenance and enhancements for the Return Review Program system, which is used to evaluate and flag potentially fraudulent returns, in preparation for the 2016 filing season, which allowed for receipt of Forms W-2, Wage and Tax Statement, directly from reporting agents and other Form W-2 issuers earlier in the filing season in order to verify income and reduce fraud and anomalies. Receiving the Form W-2 information earlier allowed the IRS to release good returns sooner in the fraud detection process, which reduced burden to taxpayers.
In addition, addressing Improper Payments continues to be an area of focus for us. In FY 2016, we had one program identified as being high risk and high priority - the Earned Income Tax Credit (EITC) program. Reducing improper payments in the EITC program continues to be a significant challenge due to the nature of the credit. EITC allows eligible low- income filers to reduce tax liability by claiming credits for working and earning income. However, the
complexity of the program, the high rate of annual turnover in program participants, and the difficulty of verifying self-reported information from taxpayers claiming the credit make it difficult to reduce improper payment rates for EITC. We continue to propose legislative changes to the program and to the authority of the IRS to address errors and other anomalies on tax returns, and while Congress has enacted some of these proposals, the IRS must still use traditional approaches in attempting to cut down the number of improper payments. Education, outreach to the return preparer community, preemptive engagement with professional filers who have historically had high error rates on returns, pre-refund validation checks, and post-refund compliance activities are all tools employed to address EITC improper payments.
As part of the guidance from OMB, risk assessments are also conducted on all other refundable tax credit programs. In FY 2016, the IRS identified as medium risk the American Opportunity Tax Credit (AOTC) and the Child Tax Credit (CTC) programs. The IRS acknowledges concerns by auditors over the dollar value of improper payments from these programs: the challenges inherent in reducing these levels are similar to those associated with EITC. Internal controls over these programs are relatively strong, but in the absence of additional statutory authority, the IRS remains limited in its ability to mitigate improper payments.
Finally, we have continued to coordinate closely with the Department of Health and Human Services (HHS) and CMS on the refundable tax credit portion of the ACA. The advance part of this credit, known as the Advance Premium Tax Credit (APTC), is administered by CMS working with state Marketplaces, and is paid to insurance providers designated by eligible taxpayers. If a taxpayer receives APTC, they are required to file a tax return in order to reconcile the APTC amount against their income level in order to determine the proper tax
26 DEPARTMENT OF THE TREASURY
FY 2016 AGENCY FINANCIAL REPORT | MANAGEMENT’S DISCUSSION AND ANALYSIS
credit amount for the year. Taxpayers who received less in APTC than the Premium Tax Credit (PTC) for which they were eligible may claim additional PTC on their tax return. Taxpayers who received more APTC than the PTC for which they were eligible are required to repay the difference, up to a certain cap amount. HHS and Treasury completed risk
assessments for their portions of the program; we determined that the PTC program carries a medium risk of improper payments, and we will continue to accumulate data on tax returns and taxpayer behavior relative to this program in order to quantify the potential improper payments value.
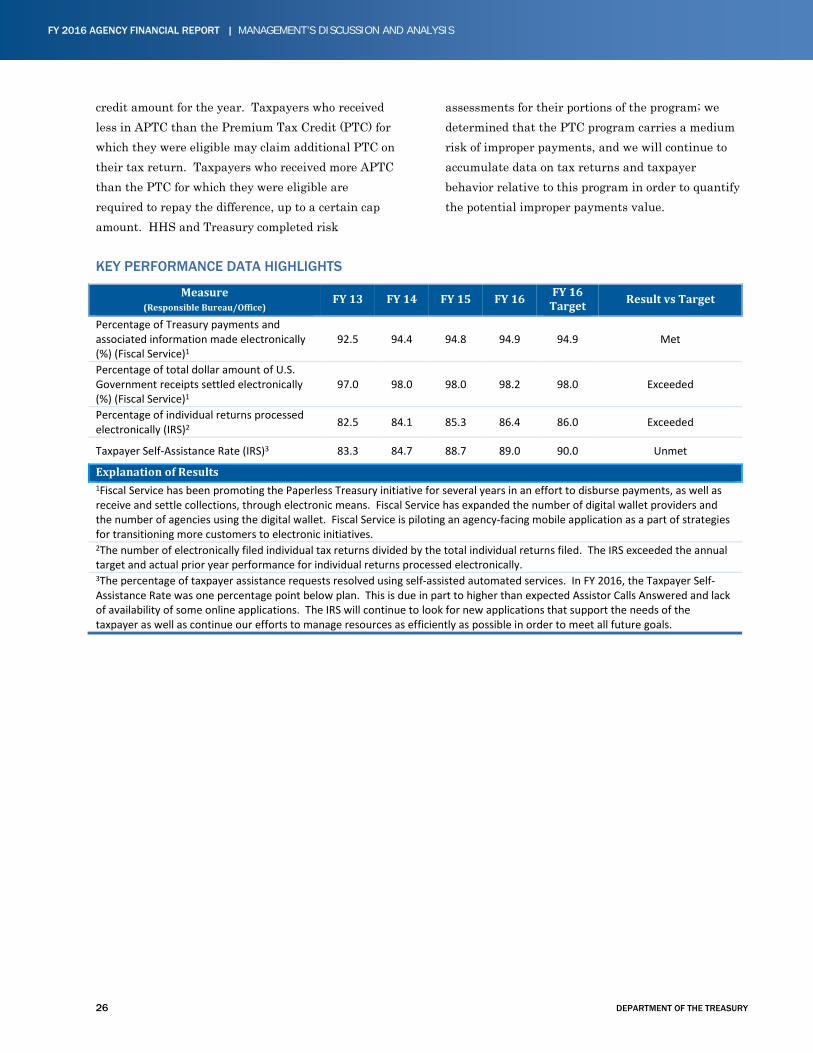
KEY PERFORMANCE DATA HIGHLIGHTS
Measure (Responsible Bureau/Office) FY 13 FY 14 FY 15 FY 16 FY 16
Target Result vs Target
Percentage of Treasury payments and associated information made electronically (%) (Fiscal Service)1
92.5 94.4 94.8 94.9 94.9 Met
Percentage of total dollar amount of U.S. Government receipts settled electronically (%) (Fiscal Service)1
97.0 98.0 98.0 98.2 98.0 Exceeded
Percentage of individual returns processed electronically (IRS)2 82.5 84.1 85.3 86.4 86.0 Exceeded
Taxpayer Self-Assistance Rate (IRS)3 83.3 84.7 88.7 89.0 90.0 Unmet
Explanation of Results 1Fiscal Service has been promoting the Paperless Treasury initiative for several years in an effort to disburse payments, as well as receive and settle collections, through electronic means. Fiscal Service has expanded the number of digital wallet providers and the number of agencies using the digital wallet. Fiscal Service is piloting an agency-facing mobile application as a part of strategies for transitioning more customers to electronic initiatives. 2The number of electronically filed individual tax returns divided by the total individual returns filed. The IRS exceeded the annual target and actual prior year performance for individual returns processed electronically. 3The percentage of taxpayer assistance requests resolved using self-assisted automated services. In FY 2016, the Taxpayer Self-Assistance Rate was one percentage point below plan. This is due in part to higher than expected Assistor Calls Answered and lack of availability of some online applications. The IRS will continue to look for new applications that support the needs of the taxpayer as well as continue our efforts to manage resources as efficiently as possible in order to meet all future goals.
DEPARTMENT OF THE TREASURY 27
MANAGEMENT’S DISCUSSION AND ANALYSIS | FY 2016 AGENCY FINANCIAL REPORT
Goal 4: Safeguard the financial system and use financial measures to counter national security threats
We work to protect the integrity of the financial system and advance key national security and foreign policy objectives through regulation, enforcement, financial intelligence analysis, outreach, and targeted financial measures. Strategic objectives for achieving our fourth goal are to: (i) identify priority threats to the financial system using intelligence analysis and outreach to the financial sector; (ii) develop, implement, and enforce sanctions and other targeted financial measures; (iii) improve the cybersecurity of our nation’s financial sector; and (iv) protect the integrity of the financial system by implementing, promoting, and enforcing anti-money laundering and counterterrorism financing standards. In our FY 2016 SOAR, we identified that objectives 4.1 and 4.3 achieved noteworthy progress as a result of coordinating the creation and sharing of actionable and targeted financial intelligence with stakeholders (4.1) and coordination with cybersecurity partners and the financial sector (4.3). Objective 4.3 was also identified as a focus area for improvement, as there are many challenges to achieving this objective, including the continued growth and increasing sophistication of cybersecurity threats.
EFFECTIVENESS OF SANCTIONS PROGRAMS
In January and March 2016, Treasury and the Department of Commerce announced amendments to regulations governing the Cuba embargo, further implementing the set of diplomatic and economic changes to Cuba relations laid out by President Obama in December 2014. These amendments further facilitate the normalization process between Cuba and the U.S. by increasing the ability of U.S. citizens to travel to Cuba to engage directly with the Cuban people, expanding Cuba’s access to U.S. financial institutions and the dollar, and enabling Cubans legally present in the U.S. to earn a salary or compensation.
The Joint Comprehensive Plan of Action reached in July 2015 was a landmark international achievement, removing the threat of a nuclear-armed Iran while illustrating the power of economic sanctions, coupled with tough diplomacy, to bring about a safer world. We are meeting commitments under the JCPOA by lifting nuclear-related secondary sanctions and by providing clear and timely guidance to government and private sector partners about engagement with Iran that is now permitted. The U.S. remains clear that the JCPOA did not resolve, nor was intended to resolve, concerns outside of the nuclear arena, including Iran’s support for terrorism and its ballistic missile program, and will continue to leverage various tools (including sanctions) to counter this behavior.
In April 2015, the President issued an executive order that authorizes the Secretary of the Treasury, in consultation with the Attorney General and the Secretary of State, to impose financial sanctions on individuals and entities whose malicious cyber-enabled activities have contributed to a significant threat to the national security, foreign policy, or economic health or financial stability of the United States. In establishing this new policy, the Administration is creating a means of imposing economic costs against not just those that conduct cyber-attacks, but those responsible for supporting, enabling, or ordering such attacks.
CONTINUED CYBERSECURITY PROGRESS
Cyber threats are vast and evolving. The sophistication, frequency, and severity of threats across U.S. corporations and government agencies continue to increase. The increased prevalence of cyber risks creates persistent and complex challenges for entities throughout the financial sector. The constantly changing risk landscape presents challenges to Treasury and financial regulatory agencies in their efforts to enhance the cybersecurity
28 DEPARTMENT OF THE TREASURY
FY 2016 AGENCY FINANCIAL REPORT | MANAGEMENT’S DISCUSSION AND ANALYSIS
and resiliency of both individual entities and the U.S. financial system.
Cyber-attacks can result in direct financial losses, as well as serious non-financial consequences. Implications from cyber-attacks can include the disruption of critical economic functions, loss of customer and market confidence in affected institutions, and loss of general consumer and market confidence in the financial sector.
Per Presidential Policy Directive 21 Critical Infrastructure Security and Resilience, Treasury is responsible for coordinating the federal government’s cybersecurity efforts in the financial sector. Treasury monitors reporting by intelligence community and law enforcement sources for information on threats to the financial sector, collaborates with other parts of the government in improving security and preparing response plans for major cyber incidents, and works closely with the private sector to enhance baseline protections, facilitate information sharing, and coordinate on incident response and recovery.
In December 2015, President Obama signed the Cybersecurity Act (CSA) into law. CSA establishes a system for cybersecurity information sharing within
the federal government, within the private sector, and between the federal government and the private sector, ultimately enabling firms to bolster their cyber defenses. As part of Treasury’s ongoing efforts to improve the quality and flow of cyber information, we engaged with members of the financial services sector, including trade associations and financial regulators, to encourage participation in CSA information sharing processes. Further, we worked to identify any legal, policy, or technical impediments to information sharing and assist in addressing them. Additionally, we helped craft the implementation documents called for in the CSA and established a direct link with the Department of Homeland Security’s Automatic Indicator Sharing Program. We also implemented new technology to begin participating in automated indicator exchange with DHS and the private financial sector.
Over the past year, we have also worked with partners in the financial sector to carry out public-private sector tabletop exercises designed to simulate plausible cyber incidents. These exercises help identify gaps in the preparedness of individual entities and in response and recovery coordination among the government and private sector.
DEPARTMENT OF THE TREASURY 29
MANAGEMENT’S DISCUSSION AND ANALYSIS | FY 2016 AGENCY FINANCIAL REPORT
In FY 2016, Treasury facilitated an exercise that brought together, for the first time, representatives of the cyber-focused Financial and Banking Information Infrastructure Committee and the Financial Stability Oversight Council, as well as representatives from key financial institutions and financial market utilities, to examine how to mitigate the effects of a significant cybersecurity incident on financial stability. Another first this year was a joint exercise with another critical infrastructure sector—the energy sector—which was coordinated with the Department of Energy.
Overall, this year, in collaboration with private-sector representatives and regulatory agencies in the financial services sector, Treasury has executed over 15 cybersecurity and resiliency exercises.
In addition, Treasury has responded to the evolving cyber risk landscape with increased resources, proposing a Cybersecurity Enhancement Account in the FY 2017 President’s Budget that is designed to bolster our cybersecurity posture and to better mitigate cybersecurity risks to the U.S. financial system. This dedicated funding source provides leadership with greater visibility into cybersecurity efforts and encourages information sharing across the Department.
Treasury has also sought to address cybersecurity risks globally, recognizing that cybersecurity incidents can generate negative consequences across sovereign borders through the interconnectedness of the international financial system. Starting in late 2015, the Deputy Secretary has co-chaired the G-7 Cyber Expert Group with the Bank of England, bringing together finance ministries, central banks, and financial supervisors from Canada, France, Germany, Italy, Japan, United States, United Kingdom, and the European Union to evaluate current approaches to cybersecurity in each country’s financial sector and to identify commonalities, differences, and potential gaps in those approaches. Through Treasury and the Bank of England’s leadership, the G-7 Cyber Expert Group
also began development of a concise set of principles on best practices in cybersecurity for public and private entities in the financial sector in an effort to promote convergence in entity-specific and sector-wide cyber frameworks and build mutual trust and
THINKSTOCK .com
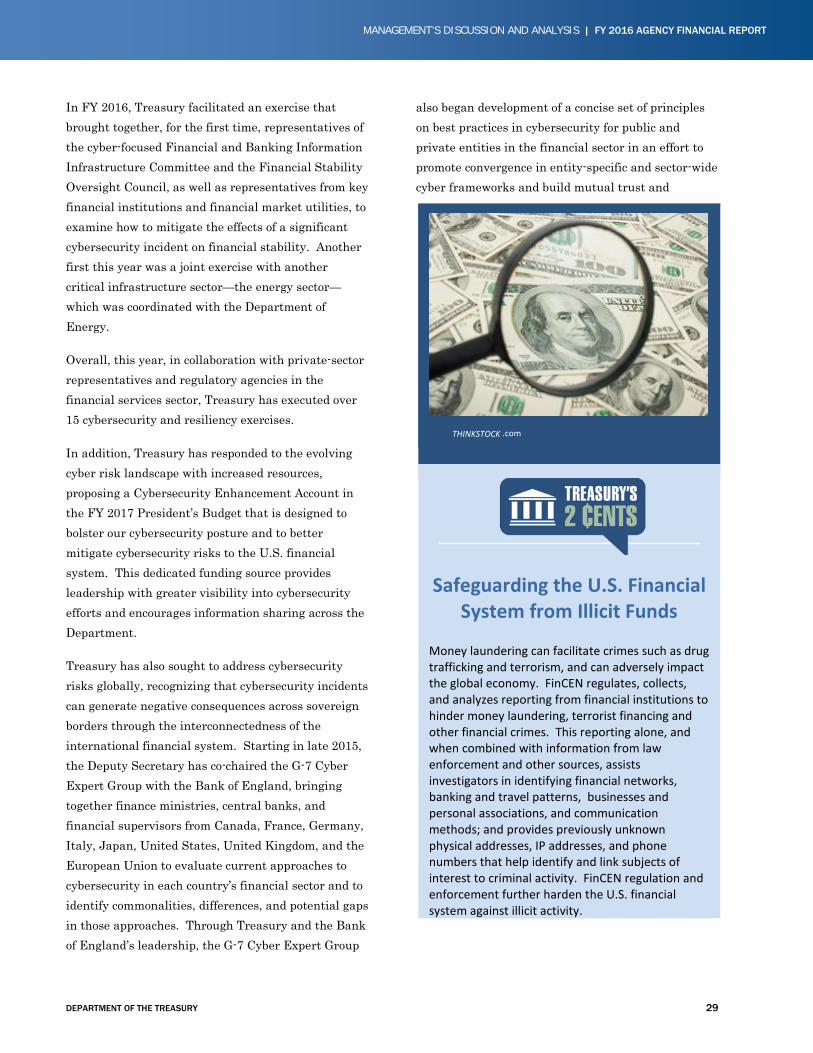
Safeguarding the U.S. Financial System from Illicit Funds
Money laundering can facilitate crimes such as drug trafficking and terrorism, and can adversely impact the global economy. FinCEN regulates, collects, and analyzes reporting from financial institutions to hinder money laundering, terrorist financing and other financial crimes. This reporting alone, and when combined with information from law enforcement and other sources, assists investigators in identifying financial networks, banking and travel patterns, businesses and personal associations, and communication methods; and provides previously unknown physical addresses, IP addresses, and phone numbers that help identify and link subjects of interest to criminal activity. FinCEN regulation and enforcement further harden the U.S. financial system against illicit activity.
30 DEPARTMENT OF THE TREASURY
FY 2016 AGENCY FINANCIAL REPORT | MANAGEMENT’S DISCUSSION AND ANALYSIS
cooperation among countries with closely linked financial systems.
We are equally dedicated to enhancing Treasury’s internal cybersecurity and resiliency. At the start of FY 2016, our Chief Information Officer (CIO) Council formally adopted an agency-wide Cybersecurity Strategy and Framework for 2016 implementing a unified defense for Treasury bureaus and offices. The primary objective of our 2016 Cybersecurity Strategy is for all bureaus to achieve all of the specified targets called for by the Administration under the President’s Management Council and Cybersecurity National Action Plan.
We have been recognized by OMB and DHS for our leadership in cyber incident response and analytical capabilities against advanced persistent threats. We continue to block threats on a weekly basis across the enterprise, sharing lessons learned and practices across government and the financial sector.
In September 2016, our Chief Information Security Officer (CISO) called the first quarterly Financial and Banking Information Infrastructure Committee CIO/CISO Subcommittee meeting. This meeting was established to facilitate information sharing and develop common risk-based approaches to managing internal cybersecurity risk at financial regulatory agencies.
Also in FY 2016, we developed the Cyber Cohort program to address concerns raised in OMB’s
Cybersecurity Strategy and Implementation Plan. A critical concern for Treasury included the lack of a pipeline of cybersecurity employees. This program aims to promote long-term Treasury needs by attracting, developing, and retaining cyber talent for long-term success. The pilot, launched in September 2016, provides enhanced developmental opportunities, including a cyber training curriculum designed by cyber professionals and focused on cyber certification, individualized mentoring, concentrated developmental plans, and six-month rotational assignments for participants at a Treasury bureau.
INCREASING THE USE OF FINANCIAL INTELLIGENCE
Strategic Objective 4.1 was identified as achieving noteworthy progress, as a result of the creation and sharing of actionable and targeted financial intelligence among stakeholders. In FY 2016, we experienced growing demand for our national security response efforts. The Office of Intelligence and Analysis and FinCEN continued to support the broader Treasury efforts against terrorism by identifying illicit sources of revenue and illegal attempts to access the international financial system. In support of this effort, FinCEN systems operate using more than 180 business rules daily to screen BSA filings and identify reports that merit further review for topics of national security concern, such as terrorist financing and cyber threats. These rules generated roughly 71,000 findings in FY 2016, compared to roughly 56,000 in FY 2015.
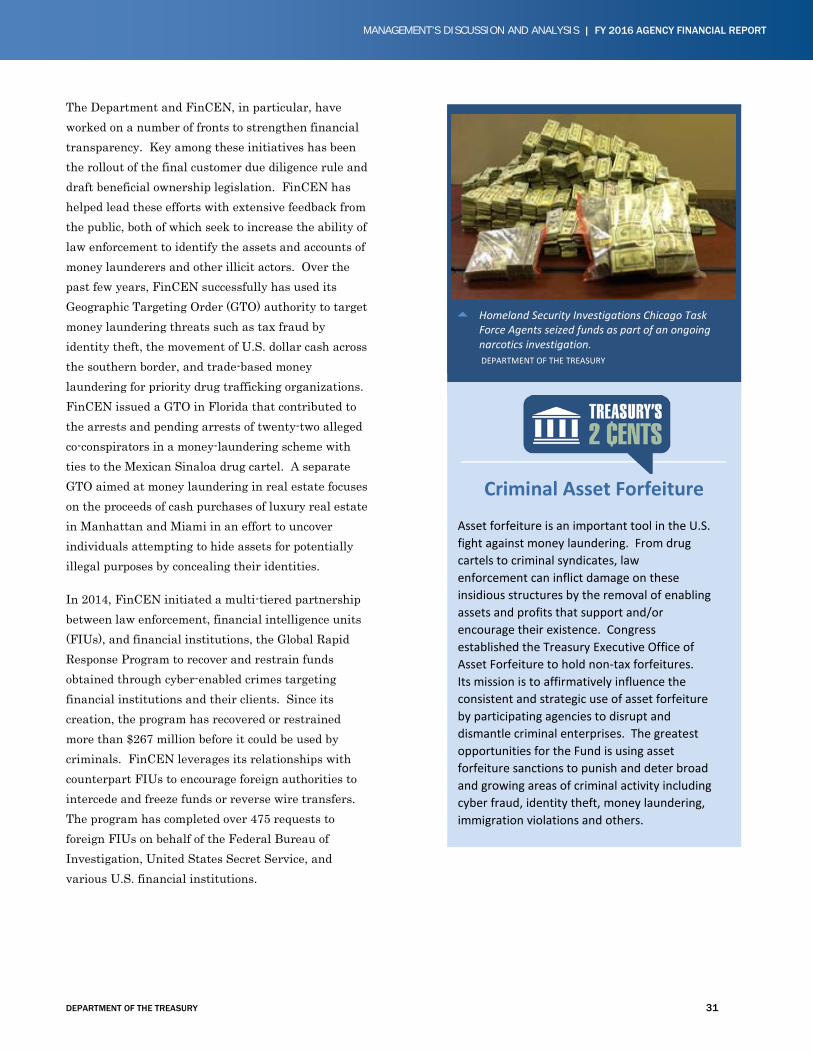
DEPARTMENT OF THE TREASURY 31
MANAGEMENT’S DISCUSSION AND ANALYSIS | FY 2016 AGENCY FINANCIAL REPORT
The Department and FinCEN, in particular, have worked on a number of fronts to strengthen financial transparency. Key among these initiatives has been the rollout of the final customer due diligence rule and draft beneficial ownership legislation. FinCEN has helped lead these efforts with extensive feedback from the public, both of which seek to increase the ability of law enforcement to identify the assets and accounts of money launderers and other illicit actors. Over the past few years, FinCEN successfully has used its Geographic Targeting Order (GTO) authority to target money laundering threats such as tax fraud by identity theft, the movement of U.S. dollar cash across the southern border, and trade-based money laundering for priority drug trafficking organizations. FinCEN issued a GTO in Florida that contributed to the arrests and pending arrests of twenty-two alleged co-conspirators in a money-laundering scheme with ties to the Mexican Sinaloa drug cartel. A separate GTO aimed at money laundering in real estate focuses on the proceeds of cash purchases of luxury real estate in Manhattan and Miami in an effort to uncover individuals attempting to hide assets for potentially illegal purposes by concealing their identities.
In 2014, FinCEN initiated a multi-tiered partnership between law enforcement, financial intelligence units (FIUs), and financial institutions, the Global Rapid Response Program to recover and restrain funds obtained through cyber-enabled crimes targeting financial institutions and their clients. Since its creation, the program has recovered or restrained more than $267 million before it could be used by criminals. FinCEN leverages its relationships with counterpart FIUs to encourage foreign authorities to intercede and freeze funds or reverse wire transfers. The program has completed over 475 requests to foreign FIUs on behalf of the Federal Bureau of Investigation, United States Secret Service, and various U.S. financial institutions.
Homeland Security Investigations Chicago Task
Force Agents seized funds as part of an ongoing narcotics investigation. DEPARTMENT OF THE TREASURY
Criminal Asset Forfeiture
Asset forfeiture is an important tool in the U.S. fight against money laundering. From drug cartels to criminal syndicates, law enforcement can inflict damage on these insidious structures by the removal of enabling assets and profits that support and/or encourage their existence. Congress established the Treasury Executive Office of Asset Forfeiture to hold non-tax forfeitures. Its mission is to affirmatively influence the consistent and strategic use of asset forfeiture by participating agencies to disrupt and dismantle criminal enterprises. The greatest opportunities for the Fund is using asset forfeiture sanctions to punish and deter broad and growing areas of criminal activity including cyber fraud, identity theft, money laundering, immigration violations and others.
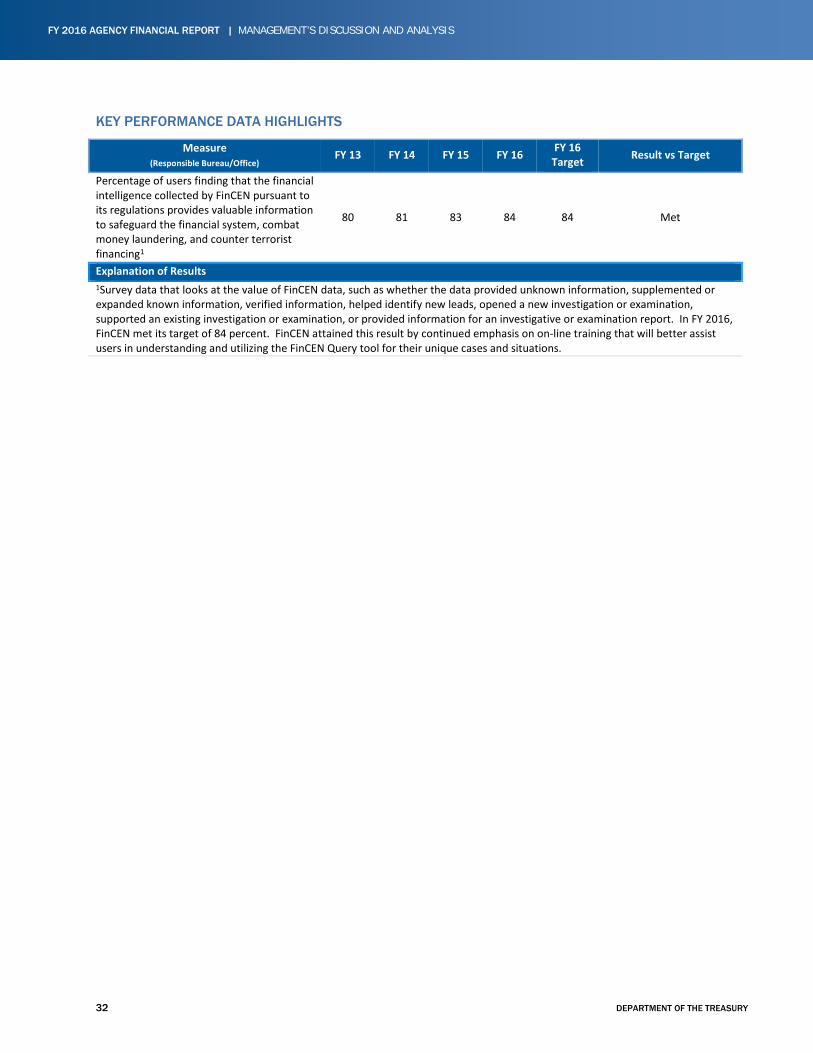
32 DEPARTMENT OF THE TREASURY
FY 2016 AGENCY FINANCIAL REPORT | MANAGEMENT’S DISCUSSION AND ANALYSIS
KEY PERFORMANCE DATA HIGHLIGHTS
Measure (Responsible Bureau/Office) FY 13 FY 14 FY 15 FY 16 FY 16
Target Result vs Target
Percentage of users finding that the financial intelligence collected by FinCEN pursuant to its regulations provides valuable information to safeguard the financial system, combat money laundering, and counter terrorist financing1
80 81 83 84 84 Met
Explanation of Results 1Survey data that looks at the value of FinCEN data, such as whether the data provided unknown information, supplemented or expanded known information, verified information, helped identify new leads, opened a new investigation or examination, supported an existing investigation or examination, or provided information for an investigative or examination report. In FY 2016, FinCEN met its target of 84 percent. FinCEN attained this result by continued emphasis on on-line training that will better assist users in understanding and utilizing the FinCEN Query tool for their unique cases and situations.
DEPARTMENT OF THE TREASURY 33
MANAGEMENT’S DISCUSSION AND ANALYSIS | FY 2016 AGENCY FINANCIAL REPORT
Goal 5: Create a 21st Century approach to government by improving efficiency, effectiveness, and customer interaction
We continuously strive to work better and smarter, recognizing that how we use our resources directly impacts our ability to deliver results to the American people. Our strategic objectives for achieving our fifth goal are to: (i) increase workforce engagement, performance, and diversity by instilling excellence, innovation, and inclusion in our organizational culture and business practices; (ii) support effective, data-driven decision-making and encourage transparency through intelligent gathering, analysis, sharing, use, and dissemination of information; (iii) promote efficient use of resources through shared services, strategic sourcing, streamlined business processes, and accountability; and (iv) create a culture of service through relentless pursuit of customer value.
We have an agency priority goal to increase self-service options for taxpayers, led by the IRS, which is aligned to Objective 5.4, which we identified in our FY 2016 SOAR as a focus area for improvement. Objective 5.4 was categorized as a focus area for improvement because the IRS and Fiscal Service, our key external-facing providers, began efforts in FY 2015 to improve their customers’ experience. Additionally, in keeping with Objective 5.3, we are working to implement the provisions of the Fixing America’s Surface Transportation (FAST) Act, which requires the use of private debt collection agencies to collect unpaid federal tax.
INFORMATION TECHNOLOGY CAPABILITIES
Our implementation of the Federal Information Technology Acquisition Reform Act (FITARA) improved a number of our processes, notably information technology (IT) procurement and budget coordination, and transparency for IT acquisitions across Treasury. We are dedicated to implementing FITARA in accordance with OMB’s guidelines and our needs. Our self-assessment against the common
baseline established by OMB demonstrates that we have achieved the highest rating (3 out of 3) in all but two of the 17 measurable categories. OMB requested that we present our FITARA implementation strategy to the Federal CIO Council. Our focus is sustainability, which means integrating the goals of FITARA into existing processes to reduce redundancies and ensure efficiencies over time.
Since 2010, we have closed 19 out of 59 tiered data centers and another 573 non-tiered data centers. Along with the closing of data centers, Treasury, over the last year, also has focused on changing the approach to how we spend our technology budget. We have focused more on enterprise-wide services, which has led to the Department moving more money into efforts to develop new or modernize existing systems, and away from legacy technology. We increased our spending on modernization and enhancements from 19 to 24 percent of our total IT budget over the last five years.
HIGH VALUE ASSETS
We have worked closely with bureaus to identify and prioritize high value assets (HVAs) of the Department based on mission criticality, amount and sensitivity of data stored, and external interconnections, among other factors. For each HVA, we performed an initial security review and are developing security controls tailored to each HVA; these controls will supplement existing baseline security controls that apply across the Department. Additionally, we have engaged with DHS to perform security assessments of select HVAs, and have begun to integrate HVA into the Corporate Planning and Investment process.
SERVICE TO TAXPAYERS
The IRS increased the filing season Customer Service Representative Level of Service (LOS) to 72.1 percent during the 2016 filing season (January through April),
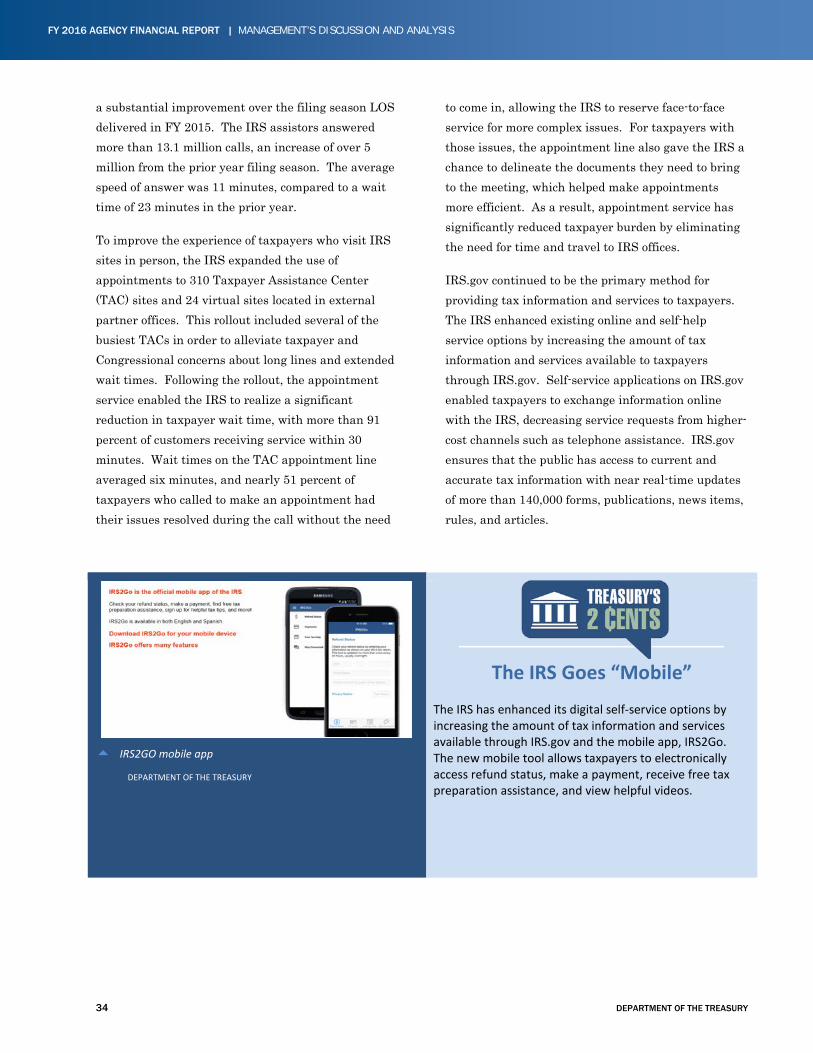
34 DEPARTMENT OF THE TREASURY
FY 2016 AGENCY FINANCIAL REPORT | MANAGEMENT’S DISCUSSION AND ANALYSIS
a substantial improvement over the filing season LOS delivered in FY 2015. The IRS assistors answered more than 13.1 million calls, an increase of over 5 million from the prior year filing season. The average speed of answer was 11 minutes, compared to a wait time of 23 minutes in the prior year.
To improve the experience of taxpayers who visit IRS sites in person, the IRS expanded the use of appointments to 310 Taxpayer Assistance Center (TAC) sites and 24 virtual sites located in external partner offices. This rollout included several of the busiest TACs in order to alleviate taxpayer and Congressional concerns about long lines and extended wait times. Following the rollout, the appointment service enabled the IRS to realize a significant reduction in taxpayer wait time, with more than 91 percent of customers receiving service within 30 minutes. Wait times on the TAC appointment line averaged six minutes, and nearly 51 percent of taxpayers who called to make an appointment had their issues resolved during the call without the need
to come in, allowing the IRS to reserve face-to-face service for more complex issues. For taxpayers with those issues, the appointment line also gave the IRS a chance to delineate the documents they need to bring to the meeting, which helped make appointments more efficient. As a result, appointment service has significantly reduced taxpayer burden by eliminating the need for time and travel to IRS offices.
IRS.gov continued to be the primary method for providing tax information and services to taxpayers. The IRS enhanced existing online and self-help service options by increasing the amount of tax information and services available to taxpayers through IRS.gov. Self-service applications on IRS.gov enabled taxpayers to exchange information online with the IRS, decreasing service requests from higher-cost channels such as telephone assistance. IRS.gov ensures that the public has access to current and accurate tax information with near real-time updates of more than 140,000 forms, publications, news items, rules, and articles.
IRS2GO mobile app
DEPARTMENT OF THE TREASURY
The IRS Goes “Mobile”
The IRS has enhanced its digital self-service options by increasing the amount of tax information and services available through IRS.gov and the mobile app, IRS2Go. The new mobile tool allows taxpayers to electronically access refund status, make a payment, receive free tax preparation assistance, and view helpful videos.
DEPARTMENT OF THE TREASURY 35
MANAGEMENT’S DISCUSSION AND ANALYSIS | FY 2016 AGENCY FINANCIAL REPORT
While staying ahead of continuously evolving cybercrime is a constant challenge and requires extreme vigilance, the IRS was able to continue to build robust programs to improve the identification and prevention of refund fraud and identity theft, and to enhance cybersecurity to safeguard taxpayer data. For example, the IRS completed the first release of its Short Messaging Service Platform, which allowed for the issuance of a one-time password to a taxpayer via text messaging services, paving the way for two-factor authentication for taxpayers trying to access their tax records.
In addition, the IRS implemented advanced security capabilities for all IRS.gov applications to provide protection from various, ever-expanding cyber threats and attacks. These capabilities will allow IRS to detect and block criminal access, as well as allow the bureau to perform analytics to identify and assess vulnerabilities leading to the development and implementation of risk mitigation strategies. In FY 2016, taxpayers viewed IRS.gov web pages more than 1.7 billion times, using the website to retrieve tax information and to gain access to applications and products. The IRS also developed and launched several web and mobile tools allowing taxpayers and third parties to communicate and transact with the IRS, such as the IRS Direct Pay application, PayNearMe, the Online Payment Agreement application, a Web Chat Feature for tax return preparers, and the Get Transcript re-launch.
In the summer of 2016, the IRS re-launched a more rigorous e-authentication system for taxpayers that is expected to significantly increase protection against identity thieves impersonating taxpayers to access tax return information through the Get Transcript online service. This new, more secure framework requires a multi-step authentication process, enabling citizens to access their information while helping defend against fraud.
RISK MANAGEMENT GOVERNANCE STRUCTURE
In July 2016, OMB released an updated Circular No. A-123 Management’s Responsibility for Enterprise Risk Management and Internal Control to ensure federal managers are effectively managing risks to achieve strategic objectives. Management, together with the Chief Risk Officer (CRO), is responsible for establishing a governance structure to effectively implement, direct and oversee implementation of the Circular and all the elements of a robust process of risk management and internal control. Successful implementation of this Circular requires us to establish and foster an open, transparent culture that encourages people to communicate information about potential risks and other concerns with their superiors. The Deputy Secretary and the CRO co-chair regular risk committee meetings of leaders from across the Department and routinely coordinate with OMB.
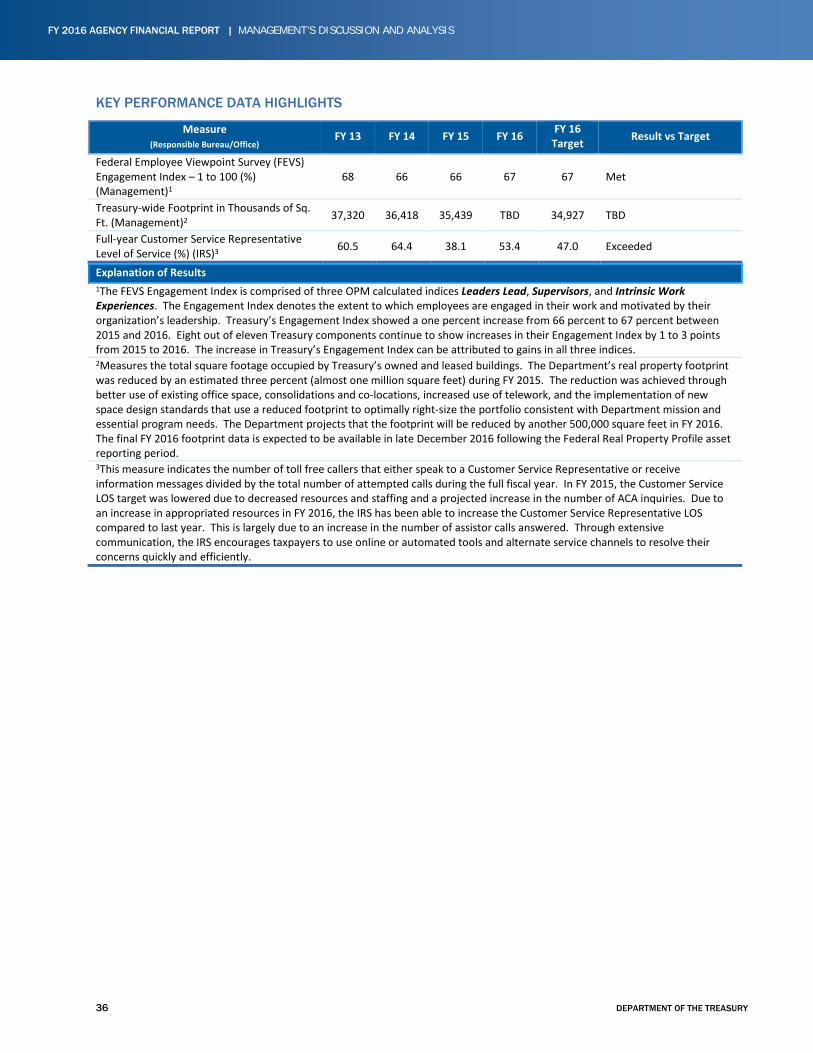
36 DEPARTMENT OF THE TREASURY
FY 2016 AGENCY FINANCIAL REPORT | MANAGEMENT’S DISCUSSION AND ANALYSIS
KEY PERFORMANCE DATA HIGHLIGHTS
Measure (Responsible Bureau/Office) FY 13 FY 14 FY 15 FY 16 FY 16
Target Result vs Target
Federal Employee Viewpoint Survey (FEVS) Engagement Index – 1 to 100 (%) (Management)1
68 66 66 67 67 Met
Treasury-wide Footprint in Thousands of Sq. Ft. (Management)2 37,320 36,418 35,439 TBD 34,927 TBD
Full-year Customer Service Representative Level of Service (%) (IRS)3 60.5 64.4 38.1 53.4 47.0 Exceeded
Explanation of Results 1The FEVS Engagement Index is comprised of three OPM calculated indices Leaders Lead, Supervisors, and Intrinsic Work Experiences. The Engagement Index denotes the extent to which employees are engaged in their work and motivated by their organization’s leadership. Treasury’s Engagement Index showed a one percent increase from 66 percent to 67 percent between 2015 and 2016. Eight out of eleven Treasury components continue to show increases in their Engagement Index by 1 to 3 points from 2015 to 2016. The increase in Treasury’s Engagement Index can be attributed to gains in all three indices. 2Measures the total square footage occupied by Treasury’s owned and leased buildings. The Department’s real property footprint was reduced by an estimated three percent (almost one million square feet) during FY 2015. The reduction was achieved through better use of existing office space, consolidations and co-locations, increased use of telework, and the implementation of new space design standards that use a reduced footprint to optimally right-size the portfolio consistent with Department mission and essential program needs. The Department projects that the footprint will be reduced by another 500,000 square feet in FY 2016. The final FY 2016 footprint data is expected to be available in late December 2016 following the Federal Real Property Profile asset reporting period. 3This measure indicates the number of toll free callers that either speak to a Customer Service Representative or receive information messages divided by the total number of attempted calls during the full fiscal year. In FY 2015, the Customer Service LOS target was lowered due to decreased resources and staffing and a projected increase in the number of ACA inquiries. Due to an increase in appropriated resources in FY 2016, the IRS has been able to increase the Customer Service Representative LOS compared to last year. This is largely due to an increase in the number of assistor calls answered. Through extensive communication, the IRS encourages taxpayers to use online or automated tools and alternate service channels to resolve their concerns quickly and efficiently.
DEPARTMENT OF THE TREASURY 37
MANAGEMENT’S DISCUSSION AND ANALYSIS | FY 2016 AGENCY FINANCIAL REPORT
SUMMARY OF MANAGEMENT AND PERFORMANCE CHALLENGES Several cross-cutting challenges were identified in our FY 2016 organizational performance reviews that affect efforts to achieve our strategic priorities:
Rapid Pace of Change: In many strategic objectives, programs face risks and challenges posed by continuously evolving threats or increasing sophistication of criminals, growth and change in key customer industries or work portfolios, and the need to modernize technology to support these changes.
Human Capital –Workforce Planning/Recruitment: Challenges within the human capital lifecycle (e.g., recruitment-development-retention) and the lengthy security clearance process are routinely referenced as challenges to mission success. Additionally, expanding the use of workforce planning and metrics to proactively forecast and meet workforce needs, particularly in the enforcement, analytics, and regulatory fields, proves challenging.
Need for Congressional Action: In a third of our strategic objectives, Congressional action on funding and authorizations is needed.
Cybersecurity: Continued growth of increasingly sophisticated threats requires constant vigilance through sophisticated monitoring, implementation of cyber hygiene, an insider threat program, and retention and recruitment of top talent (enabled by the use of strategic workforce planning) to ensure proper baseline protections.
In addition to the performance challenges discussed above and in the previous sections of this report, OIG and TIGTA have identified the most significant management and performance challenges facing the Department, in accordance with the Reports Consolidation Act of 2000. These challenges do not necessarily indicate deficiencies in performance; some represent inherent risks that require continuous monitoring. Refer to Section D of Part 3, Other Information, for detailed discussion of these challenges, including our progress toward addressing them.
OIG IDENTIFIED MANAGEMENT CHALLENGES • Cyber Threats
• Efforts to Promote Spending Transparency and to Prevent and Detect Improper
Payments
• Anti-Money Laundering and Terrorist
Financing/Bank Secrecy Act Enforcement
• Management of Treasury’s Authorities
Intended to Support and Improve the Economy
TIGTA IDENTIFIED MANAGEMENT CHALLENGES
• Security Over Taxpayer Data and Protection
of IRS Resources
• Identity Theft and Impersonation Fraud
• Implementing the Affordable Care Act and Other Tax Law Changes
• Improving Tax Compliance
• Reducing Fraudulent Claims and Improper
Payments
• Improving Tax Systems and Expanding
Online Services
• Providing Quality Taxpayer Services
Operations
• Impact of Global Economy on Tax Administration
• Protecting Taxpayer Rights
• Achieving Program Efficiencies and Cost
Savings
Additional details on the OIG and TIGTA identified Management and Performance Challenges can be found in Part 3, Section D, of this report.
38 DEPARTMENT OF THE TREASURY
FY 2016 AGENCY FINANCIAL REPORT | MANAGEMENT’S DISCUSSION AND ANALYSIS
SUMMARY OF MATERIAL WEAKNESSES FISCAL SERVICE CONSOLIDATED FINANCIAL STATEMENT PROCESS
The Fiscal Service material weakness for internal control over the preparation of the Consolidated Financial Statements of the U.S. government continued to exist in FY 2016. Effective internal controls are a challenge not only at the agency level, but also at the government-wide level. While progress is being made at many agencies and across the government in identifying and resolving internal control deficiencies, continued diligence and commitment are needed.
The Fiscal Service made progress on implementing corrective actions during FY 2016 that resolved certain control deficiencies, however, recommendations remained open. Fiscal Service has a robust remediation plan and we are committed towards improving federal financial reporting through continued collaboration with the U.S. Government Accountability Office, OMB, and the federal agency community to pursue mitigation and resolution of the remaining issues.
IRS UNPAID TAX ASSESSMENTS AND FINANCIAL REPORTING The IRS material weakness in internal control over unpaid tax assessments and significant deficiency in internal control over financial reporting systems continued to exist in FY 2016, and are collectively considered a material weakness at the Department level. The IRS has a robust remediation plan that is updated and reviewed by the IRS and Treasury Executives on a quarterly basis. Additionally, the progress of the remediation plan is reviewed annually by TIGTA. The outstanding corrective actions are scheduled to be completed by FY 2021.
Additional information on the material weaknesses can be found in Part 3, Section E, of this report.
DEPARTMENT OF THE TREASURY 39
MANAGEMENT’S DISCUSSION AND ANALYSIS | FY 2016 AGENCY FINANCIAL REPORT
FY 2017 OUTLOOK In considering the challenges and risks to successful mission delivery facing the Department, we identified several initiatives to pursue in FY 2017:
• Utilize Cybersecurity Enhancement Account to strengthen our cybersecurity posture and mitigate cybersecurity risks to improve the resilience of the nation’s financial sector.
• Build on the IRS efforts to identify opportunities for a more user-friendly and cost-effective customer service channel, improve the overall taxpayer experience, and gain operational efficiency and productivity. (FY 2016-2017 APG led by IRS)
• Secure FY 2017 State Small Business Credit Initiative and CDFI Bond Guarantee Reauthorization to continue programs that support small businesses, create and retain jobs, and assist disadvantaged communities.
• Issue notice of proposed rulemaking to clarify and consolidate federal labeling regulations.
• Continue to engage with G-20 members to leverage the Financial Stability Board (FSB) to collective advantage and support FSB objectives, and secure renewed G-20 commitments to refrain from competitive devaluation and consult on exchange rates.
• Maintain commitment to taking aggressive action against Islamic State of Islam and Levant and Al-Qaeda by imposing sanctions on designated financiers and facilitators.
• Continue increasing financial transparency through managing government-wide implementation of the DATA Act and completing major milestones to meet the statutory deadline of May 2017. (FY 2016-2017 APG led by OFAS/Fiscal Service)
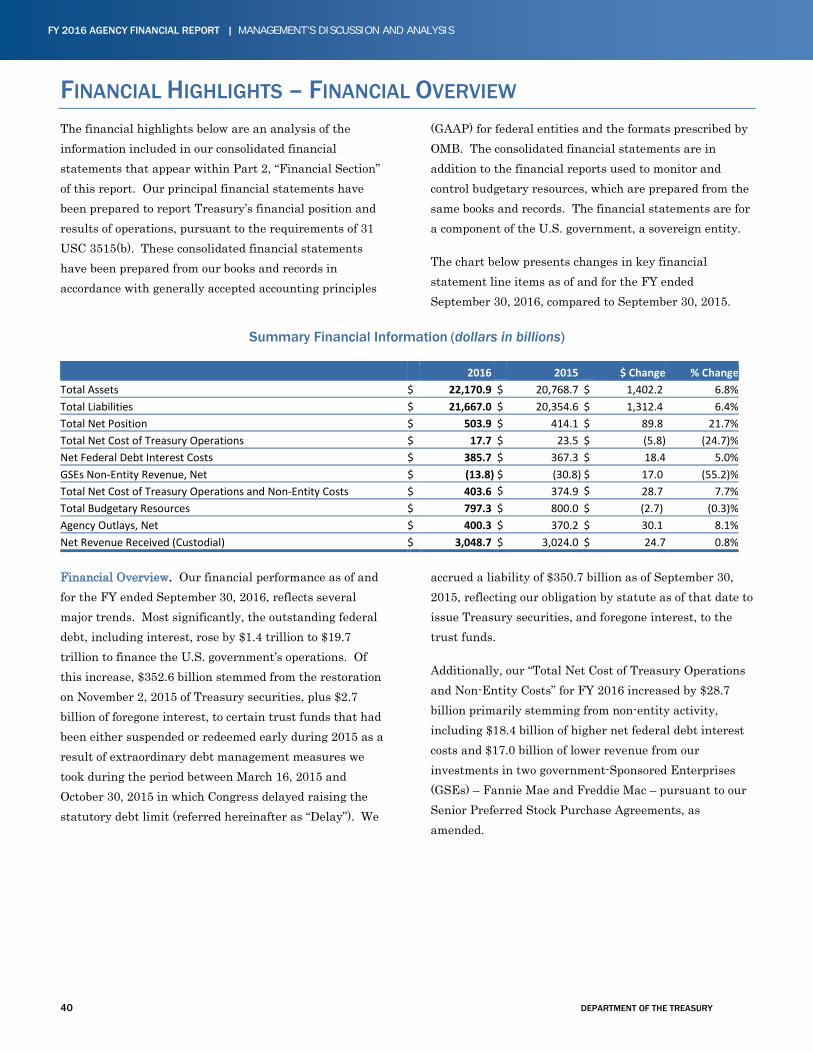
40 DEPARTMENT OF THE TREASURY
FY 2016 AGENCY FINANCIAL REPORT | MANAGEMENT’S DISCUSSION AND ANALYSIS
FINANCIAL HIGHLIGHTS – FINANCIAL OVERVIEW The financial highlights below are an analysis of the information included in our consolidated financial statements that appear within Part 2, “Financial Section” of this report. Our principal financial statements have been prepared to report Treasury’s financial position and results of operations, pursuant to the requirements of 31 USC 3515(b). These consolidated financial statements have been prepared from our books and records in accordance with generally accepted accounting principles
(GAAP) for federal entities and the formats prescribed by OMB. The consolidated financial statements are in addition to the financial reports used to monitor and control budgetary resources, which are prepared from the same books and records. The financial statements are for a component of the U.S. government, a sovereign entity.
The chart below presents changes in key financial statement line items as of and for the FY ended September 30, 2016, compared to September 30, 2015.
Summary Financial Information (dollars in billions)
2016 2015 $ Change % Change Total Assets $ 22,170.9 $ 20,768.7 $ 1,402.2 6.8% Total Liabilities $ 21,667.0 $ 20,354.6 $ 1,312.4 6.4% Total Net Position $ 503.9 $ 414.1 $ 89.8 21.7% Total Net Cost of Treasury Operations $ 17.7 $ 23.5 $ (5.8) (24.7)% Net Federal Debt Interest Costs $ 385.7 $ 367.3 $ 18.4 5.0% GSEs Non-Entity Revenue, Net $ (13.8) $ (30.8) $ 17.0 (55.2)% Total Net Cost of Treasury Operations and Non-Entity Costs $ 403.6 $ 374.9 $ 28.7 7.7% Total Budgetary Resources $ 797.3 $ 800.0 $ (2.7) (0.3)% Agency Outlays, Net $ 400.3 $ 370.2 $ 30.1 8.1% Net Revenue Received (Custodial) $ 3,048.7 $ 3,024.0 $ 24.7 0.8% Financial Overview. Our financial performance as of and for the FY ended September 30, 2016, reflects several major trends. Most significantly, the outstanding federal debt, including interest, rose by $1.4 trillion to $19.7 trillion to finance the U.S. government’s operations. Of this increase, $352.6 billion stemmed from the restoration on November 2, 2015 of Treasury securities, plus $2.7 billion of foregone interest, to certain trust funds that had been either suspended or redeemed early during 2015 as a result of extraordinary debt management measures we took during the period between March 16, 2015 and October 30, 2015 in which Congress delayed raising the statutory debt limit (referred hereinafter as “Delay”). We
accrued a liability of $350.7 billion as of September 30, 2015, reflecting our obligation by statute as of that date to issue Treasury securities, and foregone interest, to the trust funds.
Additionally, our “Total Net Cost of Treasury Operations and Non-Entity Costs” for FY 2016 increased by $28.7 billion primarily stemming from non-entity activity, including $18.4 billion of higher net federal debt interest costs and $17.0 billion of lower revenue from our investments in two government-Sponsored Enterprises (GSEs) – Fannie Mae and Freddie Mac – pursuant to our Senior Preferred Stock Purchase Agreements, as amended.
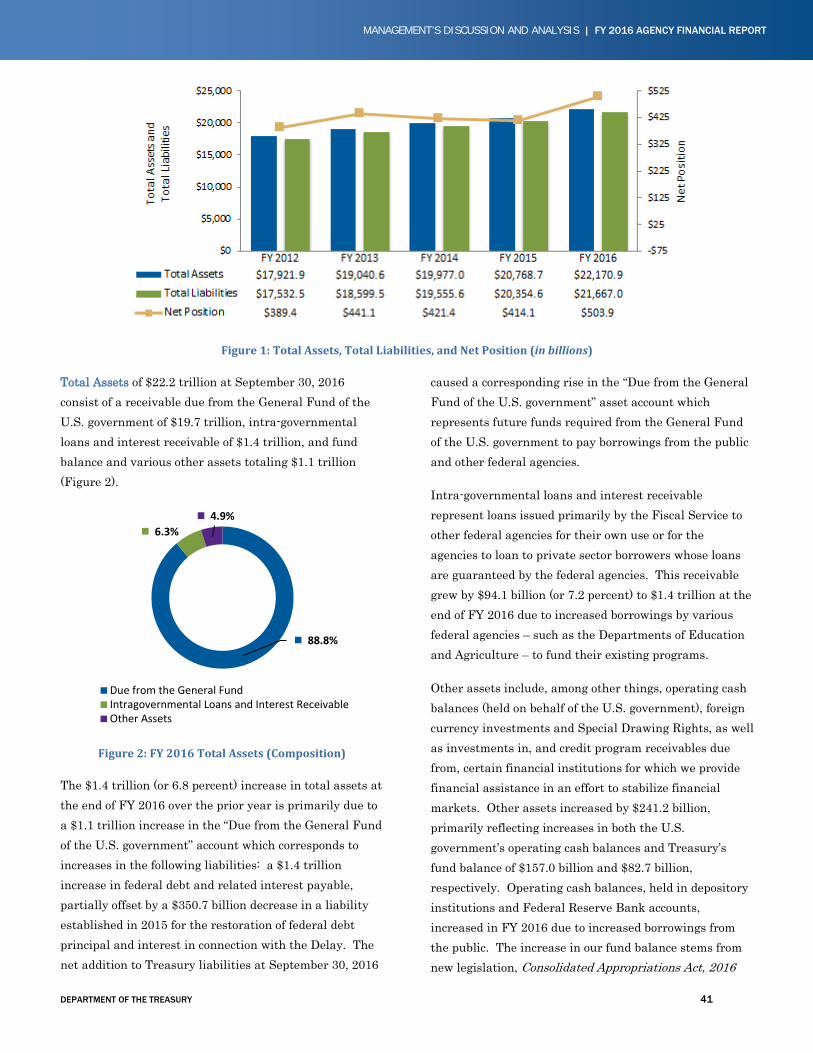
DEPARTMENT OF THE TREASURY 41
MANAGEMENT’S DISCUSSION AND ANALYSIS | FY 2016 AGENCY FINANCIAL REPORT
Figure 1: Total Assets, Total Liabilities, and Net Position (in billions)
Total Assets of $22.2 trillion at September 30, 2016 consist of a receivable due from the General Fund of the U.S. government of $19.7 trillion, intra-governmental loans and interest receivable of $1.4 trillion, and fund balance and various other assets totaling $1.1 trillion (Figure 2).
Figure 2: FY 2016 Total Assets (Composition)
The $1.4 trillion (or 6.8 percent) increase in total assets at the end of FY 2016 over the prior year is primarily due to a $1.1 trillion increase in the “Due from the General Fund of the U.S. government” account which corresponds to increases in the following liabilities: a $1.4 trillion increase in federal debt and related interest payable, partially offset by a $350.7 billion decrease in a liability established in 2015 for the restoration of federal debt principal and interest in connection with the Delay. The net addition to Treasury liabilities at September 30, 2016
caused a corresponding rise in the “Due from the General Fund of the U.S. government” asset account which represents future funds required from the General Fund of the U.S. government to pay borrowings from the public and other federal agencies.
Intra-governmental loans and interest receivable represent loans issued primarily by the Fiscal Service to other federal agencies for their own use or for the agencies to loan to private sector borrowers whose loans are guaranteed by the federal agencies. This receivable grew by $94.1 billion (or 7.2 percent) to $1.4 trillion at the end of FY 2016 due to increased borrowings by various federal agencies – such as the Departments of Education and Agriculture – to fund their existing programs.
Other assets include, among other things, operating cash balances (held on behalf of the U.S. government), foreign currency investments and Special Drawing Rights, as well as investments in, and credit program receivables due from, certain financial institutions for which we provide financial assistance in an effort to stabilize financial markets. Other assets increased by $241.2 billion, primarily reflecting increases in both the U.S. government’s operating cash balances and Treasury’s fund balance of $157.0 billion and $82.7 billion, respectively. Operating cash balances, held in depository institutions and Federal Reserve Bank accounts, increased in FY 2016 due to increased borrowings from the public. The increase in our fund balance stems from new legislation, Consolidated Appropriations Act, 2016
88.8%
6.3%4.9%
Due from the General FundIntragovernmental Loans and Interest ReceivableOther Assets
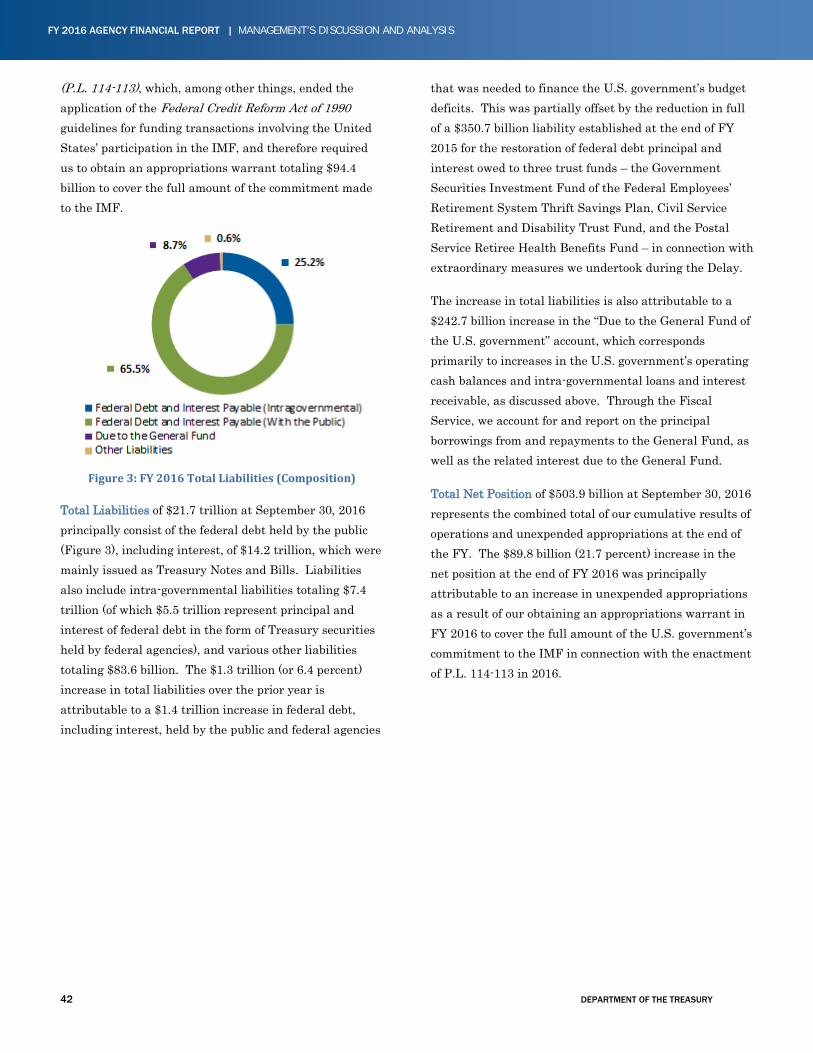
42 DEPARTMENT OF THE TREASURY
FY 2016 AGENCY FINANCIAL REPORT | MANAGEMENT’S DISCUSSION AND ANALYSIS
(P.L. 114-113), which, among other things, ended the application of the Federal Credit Reform Act of 1990 guidelines for funding transactions involving the United States’ participation in the IMF, and therefore required us to obtain an appropriations warrant totaling $94.4 billion to cover the full amount of the commitment made to the IMF.
Figure 3: FY 2016 Total Liabilities (Composition)
Total Liabilities of $21.7 trillion at September 30, 2016 principally consist of the federal debt held by the public (Figure 3), including interest, of $14.2 trillion, which were mainly issued as Treasury Notes and Bills. Liabilities also include intra-governmental liabilities totaling $7.4 trillion (of which $5.5 trillion represent principal and interest of federal debt in the form of Treasury securities held by federal agencies), and various other liabilities totaling $83.6 billion. The $1.3 trillion (or 6.4 percent) increase in total liabilities over the prior year is attributable to a $1.4 trillion increase in federal debt, including interest, held by the public and federal agencies
that was needed to finance the U.S. government’s budget deficits. This was partially offset by the reduction in full of a $350.7 billion liability established at the end of FY 2015 for the restoration of federal debt principal and interest owed to three trust funds – the Government Securities Investment Fund of the Federal Employees’ Retirement System Thrift Savings Plan, Civil Service Retirement and Disability Trust Fund, and the Postal Service Retiree Health Benefits Fund – in connection with extraordinary measures we undertook during the Delay.
The increase in total liabilities is also attributable to a $242.7 billion increase in the “Due to the General Fund of the U.S. government” account, which corresponds primarily to increases in the U.S. government’s operating cash balances and intra-governmental loans and interest receivable, as discussed above. Through the Fiscal Service, we account for and report on the principal borrowings from and repayments to the General Fund, as well as the related interest due to the General Fund.
Total Net Position of $503.9 billion at September 30, 2016 represents the combined total of our cumulative results of operations and unexpended appropriations at the end of the FY. The $89.8 billion (21.7 percent) increase in the net position at the end of FY 2016 was principally attributable to an increase in unexpended appropriations as a result of our obtaining an appropriations warrant in FY 2016 to cover the full amount of the U.S. government’s commitment to the IMF in connection with the enactment of P.L. 114-113 in 2016.
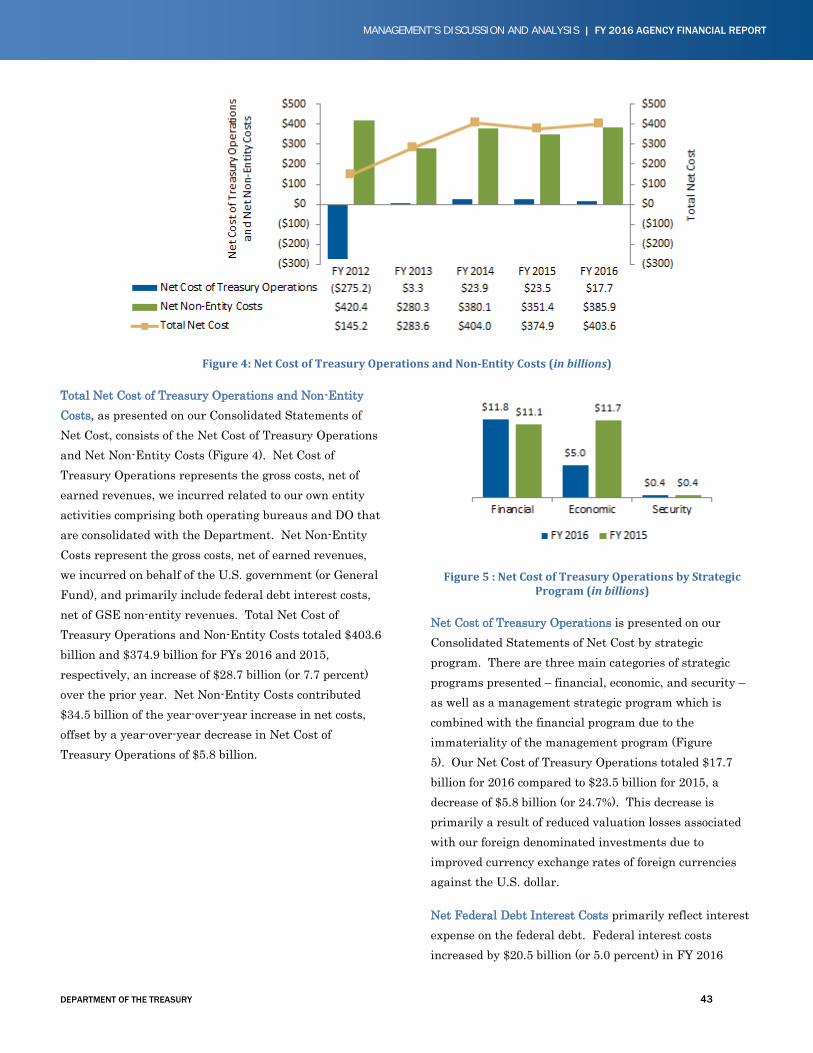
DEPARTMENT OF THE TREASURY 43
MANAGEMENT’S DISCUSSION AND ANALYSIS | FY 2016 AGENCY FINANCIAL REPORT
Figure 4: Net Cost of Treasury Operations and Non-Entity Costs (in billions)
Total Net Cost of Treasury Operations and Non-Entity Costs, as presented on our Consolidated Statements of Net Cost, consists of the Net Cost of Treasury Operations and Net Non-Entity Costs (Figure 4). Net Cost of Treasury Operations represents the gross costs, net of earned revenues, we incurred related to our own entity activities comprising both operating bureaus and DO that are consolidated with the Department. Net Non-Entity Costs represent the gross costs, net of earned revenues, we incurred on behalf of the U.S. government (or General Fund), and primarily include federal debt interest costs, net of GSE non-entity revenues. Total Net Cost of Treasury Operations and Non-Entity Costs totaled $403.6 billion and $374.9 billion for FYs 2016 and 2015, respectively, an increase of $28.7 billion (or 7.7 percent) over the prior year. Net Non-Entity Costs contributed $34.5 billion of the year-over-year increase in net costs, offset by a year-over-year decrease in Net Cost of Treasury Operations of $5.8 billion.
Figure 5 : Net Cost of Treasury Operations by Strategic Program (in billions)
Net Cost of Treasury Operations is presented on our Consolidated Statements of Net Cost by strategic program. There are three main categories of strategic programs presented – financial, economic, and security – as well as a management strategic program which is combined with the financial program due to the immateriality of the management program (Figure 5). Our Net Cost of Treasury Operations totaled $17.7 billion for 2016 compared to $23.5 billion for 2015, a decrease of $5.8 billion (or 24.7%). This decrease is primarily a result of reduced valuation losses associated with our foreign denominated investments due to improved currency exchange rates of foreign currencies against the U.S. dollar.
Net Federal Debt Interest Costs primarily reflect interest expense on the federal debt. Federal interest costs increased by $20.5 billion (or 5.0 percent) in FY 2016
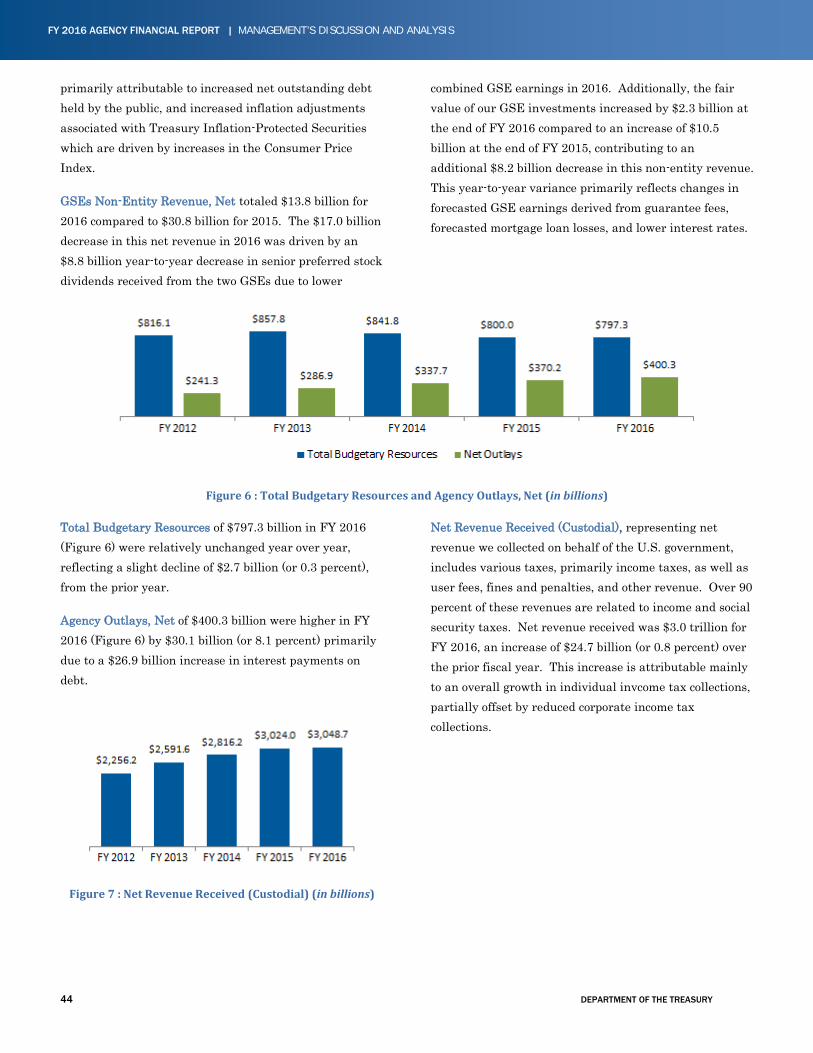
44 DEPARTMENT OF THE TREASURY
FY 2016 AGENCY FINANCIAL REPORT | MANAGEMENT’S DISCUSSION AND ANALYSIS
primarily attributable to increased net outstanding debt held by the public, and increased inflation adjustments associated with Treasury Inflation-Protected Securities which are driven by increases in the Consumer Price Index.
GSEs Non-Entity Revenue, Net totaled $13.8 billion for 2016 compared to $30.8 billion for 2015. The $17.0 billion decrease in this net revenue in 2016 was driven by an $8.8 billion year-to-year decrease in senior preferred stock dividends received from the two GSEs due to lower
combined GSE earnings in 2016. Additionally, the fair value of our GSE investments increased by $2.3 billion at the end of FY 2016 compared to an increase of $10.5 billion at the end of FY 2015, contributing to an additional $8.2 billion decrease in this non-entity revenue. This year-to-year variance primarily reflects changes in forecasted GSE earnings derived from guarantee fees, forecasted mortgage loan losses, and lower interest rates.
Figure 6 : Total Budgetary Resources and Agency Outlays, Net (in billions)
Total Budgetary Resources of $797.3 billion in FY 2016 (Figure 6) were relatively unchanged year over year, reflecting a slight decline of $2.7 billion (or 0.3 percent), from the prior year.
Agency Outlays, Net of $400.3 billion were higher in FY 2016 (Figure 6) by $30.1 billion (or 8.1 percent) primarily due to a $26.9 billion increase in interest payments on debt.
Figure 7 : Net Revenue Received (Custodial) (in billions)
Net Revenue Received (Custodial), representing net revenue we collected on behalf of the U.S. government, includes various taxes, primarily income taxes, as well as user fees, fines and penalties, and other revenue. Over 90 percent of these revenues are related to income and social security taxes. Net revenue received was $3.0 trillion for FY 2016, an increase of $24.7 billion (or 0.8 percent) over the prior fiscal year. This increase is attributable mainly to an overall growth in individual invcome tax collections, partially offset by reduced corporate income tax collections.
DEPARTMENT OF THE TREASURY 45
MANAGEMENT’S DISCUSSION AND ANALYSIS | FY 2016 AGENCY FINANCIAL REPORT
MANAGEMENT ASSURANCES THE SECRETARY’S ASSURANCE STATEMENT
The Department of the Treasury’s management is responsible for establishing and maintaining effective internal control and financial management systems that meet the objectives of the Federal Managers’ Financial Integrity Act (FMFIA). Treasury has evaluated its management controls, internal controls over financial reporting, and compliance with federal financial systems standards. As part of the evaluation process, Treasury considered results of extensive testing and assessment across the Department and independent audits.
Treasury provides assurance that the objectives of Section 2 of the FMFIA (Financial Reporting and Operations) have been achieved, except for the material weaknesses noted below. Treasury is in substantial conformance with Section 4 (Financial Management Systems) of the FMFIA. Also, in accordance with OMB Circular A-123, Management’s Responsibility for Enterprise Risk Management and Internal Control, Appendix A, Internal Control over Financial Reporting, Treasury provides modified assurance that internal control over financial reporting was operating effectively based on the results of the assessment as of June 30, 2016. Treasury’s financial management systems are not in substantial compliance with the Federal Financial Management Improvement Act (FFMIA) due to the IRS’s material weakness related to unpaid tax assessments.
As of September 30, 2016, Treasury had two FMFIA material weaknesses as follows (with origination/planned resolution timeframes indicated):
Operations:
• Bureau of the Fiscal Service – Control Deficiencies in the Processes used to Prepare the Consolidated Government-wide Financial Statements (Fiscal Years 2001/2018)
Financial Reporting:
• IRS – Unpaid Tax Assessments (Fiscal Year 1995/2021)
Treasury management remains dedicated to the resolution of these remaining weaknesses. Overall, Treasury continues to work to maintain high standards, eliminate internal control weaknesses, and meet federal financial management systems requirements. Additional information on the material weaknesses can be found in Part 3, Section E, of this report.
Jacob J. Lew
Secretary of the Treasury
November 15, 2016
46 DEPARTMENT OF THE TREASURY
FY 2016 AGENCY FINANCIAL REPORT | MANAGEMENT’S DISCUSSION AND ANALYSIS
SYSTEMS, CONTROL AND LEGAL COMPLIANCE
FMFIA
Background
The FMFIA requires Executive branch agencies to establish and maintain internal control to ensure that Federal programs operate efficiently, effectively, and in compliance with applicable laws. The management control objectives under FMFIA are to reasonably ensure that:
• Obligations and costs are in compliance with applicable laws
• Funds, property, and other assets are safeguarded against waste, loss, unauthorized use, or misappropriation
• Revenues and expenditures applicable to agency operations are properly recorded and accounted for to permit the preparation of accounts and reliable financial and statistical reports and to maintain accountability over the assets
FMFIA requires agencies to evaluate and report on the effectiveness of controls over financial and operational reporting (FMFIA Section 2), and conformance with financial management systems requirements (FMFIA Section 4 and FFMIA) that protect the integrity of federal programs. Deficiencies that seriously affect an agency’s ability to meet these objectives are deemed “material weaknesses.” We include resolution of material
weaknesses as a performance requirement for every executive, manager, and supervisor.
Internal Control over Reporting
We continue to strengthen and improve the execution of the Treasury mission through the application of sound internal controls over financial reporting. In accordance with Appendix A to OMB Circular A-123, Internal Control over Financial Reporting, we use an extensive annual testing and assessment methodology that identifies and documents internal controls over financial reporting at the transaction level integrated with the Government Accountability Office’s Standards for Internal Control in the Federal Government. Our bureaus and offices completed their testing and assessment of internal controls for material transactions as of June 30, 2016. Based on the results of this assessment, we can provide a modified statement of assurance that internal control over financial reporting was effective as of June 30, 2016, due to the IRS’s material weakness for unpaid tax assessments.
In conjunction with our OMB Circular A-123, Appendix A, FY 2016 Guidance and Implementation Plan, our bureaus and offices documented their compliance with applicable laws and regulations. Based on these results, we are in compliance with applicable laws and regulations with the exception of the FFMIA as addressed below and in Part 3, Section E, of this report.
DEPARTMENT OF THE TREASURY 47
MANAGEMENT’S DISCUSSION AND ANALYSIS | FY 2016 AGENCY FINANCIAL REPORT
FFMIA AND FINANCIAL MANAGEMENT SYSTEMS
FFMIA
The FFMIA requires federal agencies to implement and maintain financial management systems that substantially comply with federal financial management systems requirements, applicable federal accounting standards, and the United States Standard General Ledger at the transaction level. A financial management system includes an agency’s overall financial operation, reflecting the people, processes, and technology to capture, classify, summarize, and report data in a meaningful manner to support business decisions.
Section 803(c) (1) of the FFMIA requires us to make an annual determination of the agency’s substantial compliance with Section 803(a) of the Act based on review of relevant factors. We assess our financial management systems annually for conformance with the requirements of Appendix D to OMB Circular A-123, Compliance with the FFMIA, and other federal financial system requirements. Our assessment process includes the use of the FFMIA Compliance Determination Framework, which incorporates a risk model of risk levels against common goals and compliance indicators. OMB Circular A-123, Appendix D, contains an outcome-based approach to assess FFMIA compliance through a series of financial management goals that are common to all agencies.
In addition, we assess available information from audit reports and other relevant and appropriate sources, such as FISMA compliance activities, to determine whether our financial management systems substantially comply with FFMIA. We also assess improvements and ongoing efforts to strengthen financial management systems and the impact of instances of non-compliance on overall financial management system performance. Based on the results of our overall assessment, we concluded that our financial management systems are substantially compliant with the FFMIA requirements, with the exception of the IRS.
The IRS did not comply with federal financial management systems requirements or applicable federal accounting standards. The IRS has established a robust remediation plan to achieve compliance with the FFMIA requirements. The IRS received agreement from OMB that the current remediation plan satisfies the requirements of Appendix D to OMB Circular A-123, replacing the need for a waiver from OMB for remediating a material weakness taking longer than three years under FMFIA. The remediation plan is updated and reviewed by IRS and Treasury Executives on a quarterly basis. Additionally, the progress of the remediation plan is reviewed annually by TIGTA. Additional information on the IRS’s remediation plan can be found in IRS’s FY 2016 Annual Financial Report.
Financial Management Systems
Our financial management systems framework consists of two fundamental components: (1) financial and mixed systems maintained by the Treasury bureaus, and (2) the Department-wide Financial Analysis and Reporting System (FARS). The bureau systems process and record detailed financial transactions and submit summary-level data to the FARS, which maintains the key financial data necessary for Treasury-wide consolidated financial reporting. This framework satisfies the bureaus’ diverse financial operational and reporting needs, as well as our internal and external reporting requirements. The FARS framework provides essential support each year to our efforts to obtain an unmodified audit opinion.
The FARS includes the following financial applications:
• Treasury Information Executive Repository (TIER) – a financial data repository used to consolidate and validate bureau financial data
• TIER Financial Statements (TFS) – a reporting application used to produce monthly and annual financial statements, notes, and other supporting reports
Our bureaus submit summary-level financial data to TIER on a monthly basis. The TFS application uses the
48 DEPARTMENT OF THE TREASURY
FY 2016 AGENCY FINANCIAL REPORT | MANAGEMENT’S DISCUSSION AND ANALYSIS
bureau data to produce financial statements and reports on both a Department-wide and bureau-level basis, including Treasury’s annual audited financial statements and monthly management reports. Fifteen Treasury bureaus and offices use centralized financial operations, budget execution services, or IT support provided by the Fiscal Service’s Administrative Resource Center (ARC). This shared service approach enables bureaus and offices to have access to core financial systems without having to maintain the necessary technical and systems architectures. The ARC also provides administrative services in the areas of accounting, payroll, human resources, procurement, financial management of budget execution, fixed assets, inventory and order management, and travel to our bureaus and offices and to other federal entities to support core business activities. Using these services reduces the need for us to maintain duplicative financial management systems; enhances the quality, timeliness, and accuracy of financial management processes; and provides a more efficient and cost-effective business model.
In FY 2016 ARC began providing financial management and procurement system services to its first cabinet level customer agency (HUD). Additionally, ARC initiated three multi-year system enhancement efforts: 1) implementation of Service Oriented Architecture to standardize integration technology; 2) implementation of an automated financial statement tool; and 3) enhancement of the ad-hoc reporting tool.
Goals and Supporting Strategies
Our financial system goals and supporting strategies focus on improving and streamlining the current bureau financial management systems as well as the current FARS applications in order to support new financial requirements and continue to provide management with accurate and timely financial information. In FY 2016, we updated TIER to meet new and evolving reporting requirements, including the reporting of financial and award data to support compliance with the DATA Act.
We also enhanced FARS IT infrastructure by beginning the migration of FARS applications from their current location at the Main Treasury building to IRS data centers in Memphis, Tennessee, and Martinsburg, West Virginia. The migration will support our Data Center Consolidation Initiative and will incorporate new physical hardware for hosting the FARS. The migration should be completed during the first quarter of FY 2017.
Along with bureau financial systems, the TIER and TFS applications form a unified financial governance solution that focuses on improving financial processes and controls. These systems and applications help us reduce operating costs, provide assurance over the quality of our financial data, improve the timeliness and quality of financial management processes and reporting, enhance internal controls, and improve transparency in the entire reporting process.
DEPARTMENT OF THE TREASURY 49
MANAGEMENT’S DISCUSSION AND ANALYSIS | FY 2016 AGENCY FINANCIAL REPORT
IMPROPER PAYMENTS
Background
The Improper Payments Elimination and Recovery Improvement Act of 2012 (IPERIA) requires agencies to annually report on all programs and activities, identify those that may be susceptible to significant improper payments, estimate annual improper payments in the susceptible programs and activities, and report the results of their improper payment activities.
Improper payments occur when funds go to the wrong recipient, the recipient receives the incorrect amount of funds (including overpayments and underpayments), documentation is not available to support a payment, or the recipient uses funds in an improper manner. Appendix C to OMB Circular A-123, Requirements for Effective Estimation and Remediation of Improper Payments, defines “significant improper payments” as gross annual improper payments in a program exceeding both the threshold of 1.5 percent of program outlays and $10 million of all program or activity payments or $100 million regardless of the improper payment percentage. Appendix C also requires agencies with programs susceptible to significant improper payments to implement corrective action plans that include improper payment root cause identification, reduction targets, and identification of accountable officials.
Risk Assessments and Results
In FY 2016, we completed a full program inventory and performed risk assessments to identify programs that have a significant risk of improper payments. We performed our assessment of each program using the nine qualitative risk factors identified in OMB Circular A-123, Appendix C. We also performed quantitative risk assessments and assessed risks related to the amounts of payments processed relative to the OMB specified threshold amounts which define payment programs susceptible to improper payments.
As a result of the risk assessments, we determined that the agency’s programs and activities presented low and
medium risk of improper payments, except for the IRS’s EITC program. The EITC is a high risk program susceptible to significant improper payments.
EITC Program
The EITC is a refundable tax credit that offsets income tax owed by low-income taxpayers and, if the credit exceeds the amount of taxes due, provides a lump-sum payment in the form of a refund to those who qualify. The IRS estimates that for FY 2016, between 22.2 percent ($15.5 billion) and 25.9 percent ($18.1 billion) of the total EITC program payments of $69.8 billion were improper. The IRS has a robust enforcement program for the EITC which consists of examinations and audits, math error notices, and document matching. Additional information on the IRS’s EITC program can be found in Part 3, Section F, of this report.
Affordable Care Act
Treasury and HHS each have responsibilities for ensuring payment accuracy in Marketplace programs created under the ACA. Performing program-specific comprehensive risk assessments provides reasonable assurance of whether improper payments could exceed statutory thresholds and remains critical to evaluating and improving payment accuracy. HHS has conducted risk assessments to determine areas that might affect APTC, Cost-Sharing Reduction (CSR) and other programs’ payment accuracy, and Treasury has conducted a risk assessment to determine areas that might affect PTC payment accuracy. The Departments leveraged the same Federally Funded Research and Development Center to facilitate interagency coordination, information exchange, and risk analysis during the APTC and PTC program risk assessments.
50 DEPARTMENT OF THE TREASURY
FY 2016 AGENCY FINANCIAL REPORT | MANAGEMENT’S DISCUSSION AND ANALYSIS
Qualitative risk assessments of the Marketplace programs administered by the Departments were conducted in accordance with the risk factors listed in Appendix C to OMB Circular A-123, Part I.A.9.b. The risk assessments identified and evaluated potential improper payment risks.
Treasury has completed the risk assessment for the PTC program and has concluded that the program carries a medium risk of improper payments. HHS has completed risk assessments on the APTC and CSR programs (refer to the FY 2016 HHS AFR for details on the APTC and CSR risk assessment determination).
In addition to the work on the improper payment risk assessments, both Departments have established internal controls to provide for effective program operations, reliable financial reporting, and compliance with laws and regulations. Treasury and OMB will continue to monitor the PTC program and provide updated risk assessment results, program metrics, and corrective action plans consistent with existing guidance and regulatory and legislative requirements. Updated information on risk assessments and program measurement methodologies will be provided in each Department’s FY 2017 AFR.
Payment Recapture Audits
The Improper Payments Elimination and Recovery Act of 2010 (IPERA) requires agencies to conduct payment
recapture audits (also known as recovery audits) for each program and activity that expends $1 million or more annually, if conducting such audits would be cost-effective. We performed the payment recapture activities in accordance with OMB Circular A-123, Appendix C. Details on our improper payments and payment recapture program activities and results can be found in Section F of Part 3, Other Information.
Do Not Pay Initiative
Our Do Not Pay Working System (Working System) is the legislative mandated and OMB designated source of centralized data and analytic services to help agencies verify eligibility and to identify and prevent potential fraud, waste, and abuse associated with improper payments. The results of the checks against these data sources provide information that an agency should consider in pre-award or prepayment assessments to help prevent improper payments. Fiscal Service, our shared service provider, compares our payee records in the financial system with payee records in the Working System. We review potential matches on an on-going basis to prevent improper payments and incorporates a pre-award check on potential contractors against the Working System. Additional information on the Do Not Pay initiative can be found in Part 3, Section F, of this report.
MESSAGE FROM THE ASSISTANT SECRETARY FOR MANAGEMENT AND DEPUTY CHIEF FINANCIAL OFFICER ...................................... 53
INSPECTOR GENERAL’S TRANSMITTAL LETTER .......... 55
INDEPENDENT AUDITORS’ REPORT ON THE DEPARTMENT’S FINANCIAL STATEMENTS ........... 57
MANAGEMENT’S RESPONSE TO INDEPENDENT AUDITORS’ REPORT ................... 63
FINANCIAL STATEMENTS .................................... 64
NOTES TO THE FINANCIAL STATEMENTS ................. 71
REQUIRED SUPPLEMENTARY INFORMATION (UNAUDITED) ........................................... 145


DEPAR TMEN T OF THE TREASURY 53
FINANCIAL SECTION | FY 2016 AGENCY FINANCIAL REPORT
MESSAGE FROM THE ASSISTANT SECRETARY FOR MANAGEMENT AND DEPUTY CHIEF FINANCIAL OFFICER
In Fiscal Year 2016, Treasury pursued an aggressive set of management programs and initiatives designed to manage the U.S. government’s finances efficiently and responsibly. By focusing on a comprehensive set of management priorities, Treasury led and supported government-wide efforts to increase productivity, reduce waste and non-essential expenses, and modernize processes and systems. Treasury continued to build maturity into its Strategic Objective Annual Review (SOAR) and Quarterly Performance Review (QPR) processes, which form the basis for organizational performance management across every program in the Department.
As part of our ongoing effort to increase efficiency in Treasury’s acquisition methods and use of technology, the Department worked closely with the Office of Management and Budget (OMB) to implement requirements of the Federal Information Technology Acquisition Reform Act (FITARA) across government. In Fiscal Year 2016, Treasury also demonstrated leadership in the areas of fiscal prudence and management excellence by:
• Receiving an “A” on our small business report card for the sixth consecutive year; • Taking a renewed look at deferred investments, particularly in infrastructure and technology; • Continuing to strengthen our internal cybersecurity through critical review of our High Value Assets, expansion of our
education and awareness programs, and deploying insider threat detection more broadly; and • Using Federal Employee Viewpoint Survey results to design activities focused on increasing employee engagement, and
improving the alignment of individual performance to organizational results within the Department to achieve mission goals.
The Department received an unmodified audit opinion on its consolidated financial statements for the 17th consecutive year. Treasury continues to make steady progress toward resolving the two Federal Managers’ Financial Integrity Act material weaknesses remaining open as of September 30, 2016 (Internal Revenue Service – Unpaid Tax Assessments, and Bureau of the Fiscal Service – Systems, Controls, and Procedures to Prepare the Government-wide Financial Statements). Despite the complexity of Treasury’s financial systems contributing to these material weaknesses, we continue to make considerable progress towards closing the issues.
As we lead Treasury’s management programs and initiatives, we will continue to ensure that the Department can deliver its mission efficiently and provide the best value to the taxpayers.
Kody H. Kinsley Dorrice C. Roth
Assistant Secretary for Management Deputy Chief Financial Officer
November 15, 2016 November 15, 2016
Kody H. Kinsley Assistant Secretary
for Management
Dorrice C. Roth Deputy Chief Financial
Officer

[Page intentionally left blank]
DEPAR TMEN T OF THE TREASURY 55
FINANCIAL SECTION | FY 2016 AGENCY FINANCIAL REPORT
OFFICE OF INSPECTOR GENERAL
D E P AR T M E N T O F T H E T R E AS U R Y WASHINGTON, D.C. 20220
INSPECTOR GENERAL’S TRANSMITTAL LETTER
November 15, 2016
INFORMATION MEMORANDUM FOR SECRETARY LEW
FROM: Eric M. Thorson /s/ Inspector General SUBJECT: Audit of the Department of the Treasury’s Consolidated Financial Statements for
Fiscal Years 2016 and 2015 INTRODUCTION
The Chief Financial Officer’s Act, as amended, requires the Department of the Treasury’s (Treasury) Inspector General or an independent auditor, as determined by the Inspector General, to audit Treasury’s consolidated financial statements. We contracted with the independent certified public accounting firm of KPMG LLP (KPMG) to audit the consolidated financial statements of Treasury as of September 30, 2016 and 2015, and for the years then ended, to provide a report on internal control over financial reporting, to report instances in which Treasury’s financial management systems did not substantially comply with the requirements of the Federal Financial Management Improvement Act of 1996 (FFMIA), and to report any reportable noncompliance with laws, regulations, contracts, and grant agreements tested. The contract required that the audit be performed in accordance with U.S. generally accepted government auditing standards and Office of Management and Budget (OMB) Bulletin No. 15-02, Audit Requirements for Federal Financial Statements.
RESULTS OF INDEPENDENT AUDIT
In its audit of Treasury, KPMG found
• the consolidated financial statements were fairly presented, in all material respects, in accordance with U.S. generally accepted accounting principles;
• a material weakness in internal control over unpaid tax assessments and a significant deficiency in internal control over financial reporting systems identified by the auditor of the Internal Revenue Service, collectively representing a material weakness for Treasury as a whole;
• deficiencies in internal control over information systems at the Bureau of the Fiscal Service, representing a significant deficiency for Treasury as a whole;
FY 2016 AGENCY FINANCIAL REPORT | FINANCIAL SECTION
56 DEPARTMENT OF THE TREASURY
FY 2016 AGENCY FINANCIAL REPORT | FINANCIAL SECTION
• noncompliance with certain requirements of FFMIA related to Federal financial managementsystems requirements and Federal accounting standards; and
• no instances of reportable noncompliance with laws, regulations, contracts, and grant agreementstested.
EVALUATION OF AUDITORS’ PERFORMANCE
In connection with the contract, we reviewed KPMG’s report and related documentation and inquired of its representatives. Our review, as differentiated from an audit in accordance with U.S. generally accepted government auditing standards, was not intended to enable us to express, and we do not express, an opinion on Treasury’s consolidated financial statements or conclusions about the effectiveness of internal control; whether Treasury’s financial management systems substantially complied with FFMIA; and compliance with laws, regulations, contracts, and grant agreements. KPMG is responsible for the attached auditor’s report dated November 15, 2016, and the conclusions expressed in the report. However, our review disclosed no instances where KPMG did not comply, in all material respects, with U.S. generally accepted government auditing standards.
I appreciate the courtesy and cooperation extended to KPMG and my staff during the audit. Should you or your staff have questions, you may contact me at (202) 622-1090 or Deborah L. Harker, Assistant Inspector General for Audit, at (202) 927-5400.
Attachment
cc: Kody H. Kinsley Assistant Secretary for Management
Dorrice C. Roth Deputy Chief Financial Officer
Independent Auditors’ Report
Inspector General
Department of the Treasury:
Report on the Financial Statements
We have audited the accompanying consolidated financial statements of the Department of the Treasury (Department), which comprise the consolidated balance sheets as of September 30, 2016 and 2015, and the related consolidated statements of net cost, consolidated statements of changes in net position, combined statements of budgetary resources and statements of custodial activity for the years then ended, and the related notes to the consolidated financial statements (hereinafter referred to as “consolidated financial statements”).
Management’s Responsibility for the Financial Statements
Management is responsible for the preparation and fair presentation of these consolidated financial statements in accordance with U.S. generally accepted accounting principles; this includes the design, implementation, and maintenance of internal control relevant to the preparation and fair presentation of consolidated financial statements that are free from material misstatement, whether due to fraud or error.
Auditors’ Responsibility
Our responsibility is to express an opinion on these consolidated financial statements based on our audits. We
did not audit the financial statements of the Internal Revenue Service (IRS), a component entity of the
Department, which statements reflect total assets of $57.2 and $48.7 billion, net cost of operations of $12.0 and
$11.8 billion before applicable eliminating entries, budgetary resources of $12.8 and $12.5 billion, and custodial
activity of $3,341 and $3,304 billion, as of and for the years ended September 30, 2016 and September 30,
2015, respectively. Those statements were audited by other auditors, whose report has been furnished to us,
and our opinion, insofar as it relates to the amounts included for IRS, is based solely on the report of the other
auditors.
We also did not audit the financial statements of the Office of Financial Stability (OFS), a component entity of
the Department, which statements reflect total assets of $24.2 and $28.6 billion, net cost of operations of $4.1
and $4.4 billion before applicable eliminating entries, and budgetary resources of $3.9 and $10.2 billion, as of
and for the years ended September 30, 2016 and September 30, 2015, respectively. Those statements were
audited by other auditors, whose report has been furnished to us, and our opinion, insofar as it relates to the
amounts included for OFS, is based solely on the report of the other auditors.
We conducted our audits in accordance with auditing standards generally accepted in the United States of
America, in accordance with the standards applicable to financial audits contained in Government Auditing
Standards issued by the Comptroller General of the United States, and in accordance with Office of
Management and Budget (OMB) Bulletin No. 15-02, Audit Requirements for Federal Financial Statements.
Those standards and OMB Bulletin No. 15-02 require that we plan and perform the audit to obtain reasonable
assurance about whether the consolidated financial statements are free from material misstatement.
KPMG LLP is a Delaware limited liability partnership and the U.S. member firm of the KPMG network of independent member firms affiliated with KPMG International Cooperative (“KPMG International”), a Swiss entity.
KPMG LLPSuite 120001801 K Street, NWWashington, DC 20006
57
An audit involves performing procedures to obtain audit evidence about the amounts and disclosures in the
consolidated financial statements. The procedures selected depend on the auditors’ judgment, including the
assessment of the risks of material misstatement of the consolidated financial statements, whether due to fraud
or error. In making those risk assessments, the auditor considers internal control relevant to the entity’s
preparation and fair presentation of the consolidated financial statements in order to design audit procedures
that are appropriate in the circumstances, but not for the purpose of expressing an opinion on the effectiveness
of the entity’s internal control. Accordingly, we express no such opinion. An audit also includes evaluating the
appropriateness of accounting policies used and the reasonableness of significant accounting estimates made
by management, as well as evaluating the overall presentation of the consolidated financial statements.
We believe that the audit evidence we have obtained is sufficient and appropriate to provide a basis for our
audit opinion.
Opinion on the Financial Statements
In our opinion, based on our audits and the reports of the other auditors, the consolidated financial statements referred to above present fairly, in all material respects, the financial position of the Department of the Treasury as of September 30, 2016 and 2015, and its net costs, changes in net position, budgetary resources, and custodial activity for the years then ended in accordance with U.S. generally accepted accounting principles.
Emphasis of Matter
As discussed in Notes 1AC and 7, effective October 1, 2015 the Department changed its budgetary accounting
policy for transactions with the International Monetary Fund. Our opinion is not modified with respect to this
matter.
As discussed in Notes 9 and 10, the Department is a participant in significant legislation and transactions whose purpose is to assist in stabilizing the financial markets. Also as discussed in note 1A, the consolidated financial statements do not include the assets, liabilities, or results of operations of commercial entities in which the Department has a significant equity interest as it has determined that none of these entities meet the criteria for inclusion as a federal entity and are therefore not included in the consolidated financial statements. Furthermore, as discussed in notes 1V, 9, and 10, the value of certain investments, loans, and commitments is based on estimates. These estimates are inherently subject to substantial uncertainty arising from the likelihood of future changes in general economic, regulatory, and market conditions. In addition, there are significant uncertainties related to the amounts that the Department will realize from its investments. As such, there will likely be differences between the estimated value of these investments, loans, and commitments as of September 30, 2016 and 2015, and the amounts that may ultimately be realized from these assets or may be required to settle these commitments. Such differences may be material and will also affect the ultimate cost of these programs. Our opinion is not modified with respect to these matters.
Other Matters
Interactive Data
Management has elected to reference to information on websites or other forms of interactive data outside the Agency Financial Report to provide additional information for the users of its financial statements. Such information is not a required part of the basic consolidated financial statements or supplementary information required by the Federal Accounting Standards Advisory Board. The information on these websites or the other interactive data has not been subjected to any of our auditing procedures, and accordingly we do not express an opinion or provide any assurance on it.
Required Supplementary Information
U.S. generally accepted accounting principles require that the information in the Management’s Discussion and Analysis and Required Supplementary Information sections be presented to supplement the basic consolidated financial statements. Such information, although not a part of the basic consolidated financial statements, is required by the Federal Accounting Standards Advisory Board who considers it to be an essential part of financial reporting for placing the basic consolidated financial statements in an appropriate operational,
58
economic, or historical context. We, and the other auditors, have applied certain limited procedures to the required supplementary information in accordance with auditing standards generally accepted in the United States of America, which consisted of inquiries of management about the methods of preparing the information and comparing the information for consistency with management’s responses to our inquiries, the basic consolidated financial statements, and other knowledge we obtained during our audits of the basic consolidated financial statements. We do not express an opinion or provide any assurance on the information because the limited procedures do not provide us with sufficient evidence to express an opinion or provide any assurance.
Other Information
Our audits were conducted for the purpose of forming an opinion on the basic consolidated financial statements as a whole. The Message from the Secretary of the Treasury, the Message from the Assistant Secretary for Management and the Deputy Chief Financial Officer, and the Other Information sections are presented for purposes of additional analysis and are not a required part of the basic consolidated financial statements. Such information has not been subjected to the auditing procedures applied in the audits of the basic consolidated financial statements, and accordingly, we do not express an opinion or provide any assurance on it.
Other Reporting Required by Government Auditing Standards
Internal Control Over Financial Reporting
In planning and performing our audit of the consolidated financial statements as of and for the year ended September 30, 2016, we considered the Department’s internal control over financial reporting (internal control) to determine the audit procedures that are appropriate in the circumstances for the purpose of expressing our opinion on the consolidated financial statements, but not for the purpose of expressing an opinion on the effectiveness of the Department’s internal control. Accordingly, we do not express an opinion on the effectiveness of the Department’s internal control. This report includes our consideration of the results of the other auditors’ testing of internal control over financial reporting that was reported on separately by those auditors. However, this reporting, insofar as it relates to the results of the other auditors, is based solely on the reports of the other auditors. We, and the other auditors, did not test all internal controls relevant to operating objectives as broadly defined by the Federal Managers’ Financial Integrity Act of 1982.
Our consideration of internal control was for the limited purpose described in the preceding paragraph and was not designed to identify all deficiencies in internal control that might be material weaknesses or significant deficiencies and therefore, material weaknesses or significant deficiencies may exist that have not been identified. However, as described below, we and the other auditors identified certain deficiencies in internal control that we consider to be a material weakness and a significant deficiency.
A deficiency in internal control exists when the design or operation of a control does not allow management or employees, in the normal course of performing their assigned functions, to prevent, or detect and correct, misstatements on a timely basis. A material weakness is a deficiency, or a combination of deficiencies, in internal control such that there is a reasonable possibility that a material misstatement of the entity’s financial statements will not be prevented, or detected and corrected, on a timely basis. We consider the deficiency described below to be a material weakness.
A. Material Weakness in Internal Control Over Financial Reporting at IRS (Repeat Condition)
IRS needs to improve internal control over financial reporting and systems to ensure reliable and timely financial information is obtained, maintained, and reported in accordance with OMB Circular A-123, Management’s Responsibility for Enterprise Risk Management and Internal Control. The other auditors reported a material weakness in internal control over unpaid tax assessments and a significant deficiency in internal control over financial reporting systems that we collectively considered a material weakness at the Department level. The other auditors performed an audit of IRS’s internal control over financial reporting for the purpose of providing an opinion on the effectiveness of internal control. Because of the material weakness, the other auditors’ opinion on IRS’s internal control over financial reporting stated that IRS did not maintain, in all material respects, effective internal control over financial reporting as of September 30, 2016, and thus a reasonable possibility exists that a material misstatement of IRS’s financial statements could occur and not be prevented or detected and corrected on a timely basis. IRS internal control deficiencies are summarized as follows:
59
1. Unpaid Tax Assessments
IRS continued to have system deficiencies in its unpaid tax assessment subsidiary ledger and supportingfinancial systems that led to errors in tax payer accounts. In addition, IRS’s management and reporting ofunpaid tax assessments continued to be hindered by inaccurate tax records because IRS did notconsistently record information in tax payers’ accounts accurately and timely. As a result, IRS subsidiaryledger and supporting financial systems did not: (1) produce reliable and useful information for IRS tomanage unpaid tax assessments; and (2) provide accurate and complete transaction level financialinformation that IRS needed to properly report its federal tax receivables, compliance assessments, andwrite-offs in accordance with the federal accounting standards. IRS used a compensating estimationprocess to determine unpaid tax assessments and recorded multi-billion dollar adjustments to the year endbalances of unpaid tax assessments generated by its subsidiary ledger in order to produce reliableamounts for reporting its federal taxes receivables, compliance assessments, and write-offs.
2. Financial Reporting Systems
IRS made improvements in internal control over financial reporting systems; however, IRS continued tohave information security control deficiencies that increase the risk of inappropriate and undetected use,modification, or disclosure of IRS systems and data. Specifically, IRS did not (1) fully implement controls forlogging and monitoring audit trails of certain systems and update mainframe logging and monitoringpolicies; (2) limit access to a taxpayer database; (3) implement a secure method for managingadministrator passwords; (4) use strong encryption and safeguard media storage devices to preventunauthorized disclosure of and changes to information; (5) segregate incompatible responsibilities; (6)install security updates on certain databases and servers that support financial systems; and (7) effectivelymanage security risk of certain databases.
Recommendation
The other auditors separately provided IRS management a report detailing the conditions identified and their recommendations to address the above material weakness. We recommend that the Assistant Secretary for Management (ASM) and Deputy Chief Financial Officer (DCFO) ensure that IRS implements corrective actions to resolve this material weakness.
A significant deficiency is a deficiency, or a combination of deficiencies, in internal control that is less severe than a material weakness, yet important enough to merit attention by those charged with governance. We consider the deficiency described below to be a significant deficiency.
B. Significant Deficiency in Internal Control Over Information Systems at the Bureau of the Fiscal Service (Repeat Condition)
Effective information system controls and security programs over financial systems are essential to protecting
information resources in accordance with OMB Circular No. A-130, Management of Federal Information
Resources. The Bureau of the Fiscal Service (Fiscal Service) relies on an extensive array of information
technology systems to perform their primary missions. During fiscal year 2016, Fiscal Service made progress in
remediating the prior year significant deficiency; however, Fiscal Service's corrective action plans were not
effectively designed and implemented. Specifically, Fiscal Service’s general information technology controls
(GITCs) did not provide reasonable assurance that: (1) access to financial systems is protected against
unauthorized modification, loss, or disclosure; and (2) responsibilities are properly segregated; and (3)
contingency planning minimizes the risk of unplanned interruptions and provides for recovery of critical
operations should an interruption occur. Until these control deficiencies are fully addressed, there will be an
increased risk of inadequate security controls in financial systems; unauthorized access to, modification of, or
disclosure of sensitive financial data and programs; and disruption of critical financial operations.
Recommendation
Due to the sensitivity of the details of the deficiencies described above, we will issue a separate report detailing
the conditions identified and our recommendations for corrective action. We recommend that the ASM and
60
DCFO ensure that the Fiscal Service implement requisite corrective actions to resolve control deficiencies over
its information systems.
Compliance and Other Matters
As part of obtaining reasonable assurance about whether the Department’s consolidated financial statements are free from material misstatement, we, and the other auditors, performed tests of the Department’s compliance with certain provisions of laws, regulations, contracts, and grant agreements, noncompliance with which could have a direct and material effect on the determination of financial statement amounts. However, providing an opinion on compliance with those provisions was not an objective of our audit, and accordingly, we do not express such an opinion. The results of our, and the other auditors’, tests of compliance disclosed no instances of noncompliance or other matters that are required to be reported herein under Government Auditing Standards or OMB Bulletin No. 15-02.
We, and the other auditors, also performed tests of its compliance with certain provisions referred to in Section 803(a) of the Federal Financial Management Improvement Act of 1996 (FFMIA). Providing an opinion on compliance with FFMIA was not an objective of our audit, and accordingly, we do not express such an opinion. The results of our tests of FFMIA and those of the other auditors disclosed instances described below, in which the Department’s financial management systems did not substantially comply with the Federal financial management systems requirements and applicable Federal accounting standards. The results of our tests of FFMIA and those of the other auditors disclosed no instances in which the Department’s financial management systems did not substantially comply with the United States Government Standard General Ledger at the transaction level.
C. Noncompliance with Federal Financial Management Improvement Act of 1996 (Repeat Condition)
The Department’s financial management systems did not substantially comply with the following FFMIA
requirements:
1. Federal Financial Management Systems Requirements
As discussed in finding A. Material Weakness in Internal Control Over Financial Reporting at IRS (RepeatCondition), the Department continues to have deficiencies in IRS’s financial management systems.Specifically, IRS did not consistently design, implement, and operate information system controls andsecurity programs over its financial systems in accordance with the federal financial management systemrequirements.
2. Federal Accounting Standards
As discussed in finding A. Material Weakness in Internal Control Over Financial Reporting at IRS (RepeatCondition), the Department has a material weakness at IRS that affected the Department’s ability to prepareits financial statements in accordance with the federal accounting standards. Specifically, IRS subsidiaryrecords and supporting financial systems were unable to support the federal taxes receivable amount on theconsolidated balance sheet, and the compliance assessments and write-offs in the required supplementaryinformation disclosures, in accordance with the federal accounting standards.
Recommendation
The other auditors separately provided IRS management with recommendations to address the above noncompliance with FFMIA. We recommend that the ASM and DCFO ensure that IRS implements its remediation plan outlining actions to be taken to resolve noncompliance with the FFMIA requirements and the resources and responsible organizational units for such planned actions.
Department’s Response to Findings
The Department indicated in a separate letter immediately following this report that it concurs with the findings and recommendations presented in our report. Further, the Department responded that it will take necessary corrective actions to address each of the matters presented. The Department’s response was not subjected to the auditing procedures applied in the audit of the consolidated financial statements and, accordingly, we express no opinion on the response.
61
Purpose of the Other Reporting Required by Government Auditing Standards
The purpose of the communication described in the Other Reporting Required by Government Auditing Standards section is solely to describe the scope of our testing of internal control and compliance and the result of that testing, and not to provide an opinion on the effectiveness of the Department’s internal control or compliance. Accordingly, this communication is not suitable for any other purpose.
Washington D.C.
November 15, 2016
62
DEPAR TMEN T OF THE TREASURY 63
FINANCIAL SECTION | FY 2016 AGENCY FINANCIAL REPORT
MANAGEMENT’S RESPONSE TO INDEPENDENT AUDITORS’ REPORT
November 15, 2016
KPMG LLP 1801 K Street, NW Washington, DC 20006
Ladies and Gentlemen:
On behalf of Secretary Lew, we are responding to your audit report on the Department of the Treasury's fiscal year 2016 consolidated financial statements. Our bureaus and program offices are proud of the Department's success in achieving an unmodified audit opinion on the Department's financial statements for the seventeenth consecutive year.
The high level of professionalism, technical expertise, and integrity demonstrated by KPMG in conducting this year's audit contributed greatly to Treasury's successful fiscal year 2016 results. We also appreciate the expertise and commitment demonstrated by the other organizations involved in the audit process - the Office of the Inspector General, Government Accountability Office (GAO), and the firms that audited several of our bureaus.
We acknowledge the one material weakness and one significant deficiency at the Department level, and the one instance of noncompliance with laws and regulations described in your report. We agree with your recommendations, and will focus on necessary corrective actions to address each of the issues.
Overall, we have made strong progress in enhancing our internal control environment. We are very proud of our progress, and remain committed to ensuring high standards of integrity and transparency in reporting our financial performance.
Kody H. Kinsley Dorrice C. Roth Assistant Secretary for Management Deputy Chief Financial Officer
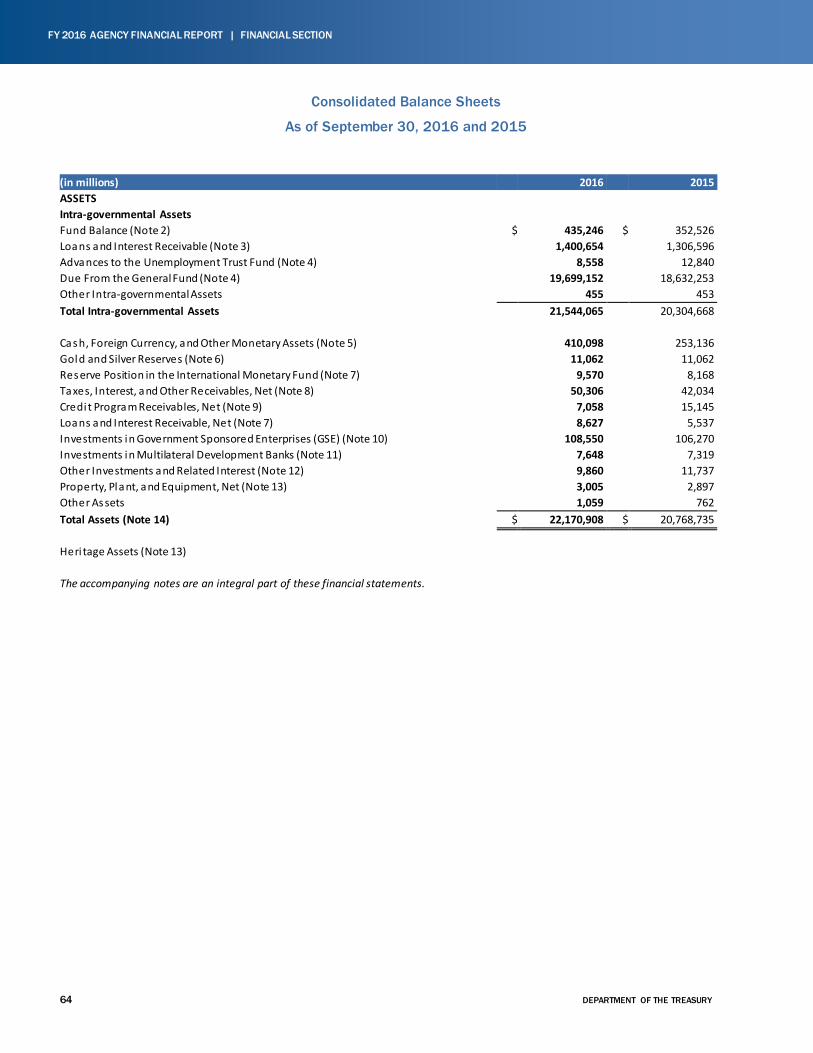
64 DEPARTMENT OF THE TREASURY
FY 2016 AGENCY FINANCIAL REPORT | FINANCIAL SECTION
Consolidated Balance Sheets
As of September 30, 2016 and 2015
(in millions) 2016 2015 ASSETS Intra-governmental Assets Fund Balance (Note 2) $ 435,246 $ 352,526 Loans and Interest Receivable (Note 3) 1,400,654 1,306,596 Advances to the Unemployment Trust Fund (Note 4) 8,558 12,840 Due From the General Fund (Note 4) 19,699,152 18,632,253 Other Intra-governmental Assets 455 453 Total Intra-governmental Assets 21,544,065 20,304,668
Cash, Foreign Currency, and Other Monetary Assets (Note 5) 410,098 253,136 Gold and Silver Reserves (Note 6) 11,062 11,062 Reserve Position in the International Monetary Fund (Note 7) 9,570 8,168 Taxes, Interest, and Other Receivables, Net (Note 8) 50,306 42,034 Credi t Program Receivables, Net (Note 9) 7,058 15,145 Loans and Interest Receivable, Net (Note 7) 8,627 5,537 Investments in Government Sponsored Enterprises (GSE) (Note 10) 108,550 106,270 Investments in Multilateral Development Banks (Note 11) 7,648 7,319 Other Investments and Related Interest (Note 12) 9,860 11,737 Property, Plant, and Equipment, Net (Note 13) 3,005 2,897 Other Assets 1,059 762 Total Assets (Note 14) $ 22,170,908 $ 20,768,735
Heri tage Assets (Note 13)
The accompanying notes are an integral part of these financial statements.
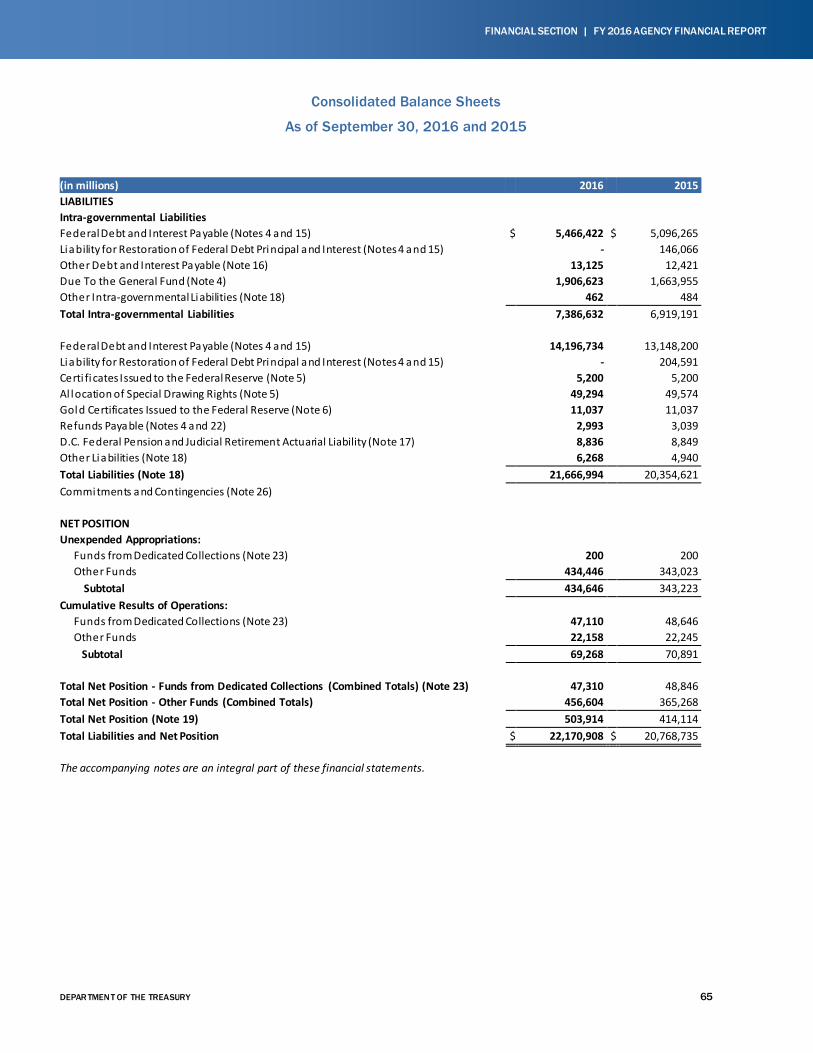
DEPAR TMEN T OF THE TREASURY 65
FINANCIAL SECTION | FY 2016 AGENCY FINANCIAL REPORT
Consolidated Balance Sheets
As of September 30, 2016 and 2015
(in millions) 2016 2015 LIABILITIES Intra-governmental Liabilities Federal Debt and Interest Payable (Notes 4 and 15) $ 5,466,422 $ 5,096,265 Liability for Restoration of Federal Debt Principal and Interest (Notes 4 and 15) - 146,066 Other Debt and Interest Payable (Note 16) 13,125 12,421 Due To the General Fund (Note 4) 1,906,623 1,663,955 Other Intra-governmental Liabilities (Note 18) 462 484 Total Intra-governmental Liabilities 7,386,632 6,919,191 Federal Debt and Interest Payable (Notes 4 and 15) 14,196,734 13,148,200 Liability for Restoration of Federal Debt Principal and Interest (Notes 4 and 15) - 204,591 Certi fi cates Issued to the Federal Reserve (Note 5) 5,200 5,200 Al location of Special Drawing Rights (Note 5) 49,294 49,574 Gold Certificates Issued to the Federal Reserve (Note 6) 11,037 11,037 Refunds Payable (Notes 4 and 22) 2,993 3,039 D.C. Federal Pension and Judicial Retirement Actuarial Liability (Note 17) 8,836 8,849 Other Liabilities (Note 18) 6,268 4,940 Total Liabilities (Note 18) 21,666,994 20,354,621 Commitments and Contingencies (Note 26) NET POSITION Unexpended Appropriations: Funds from Dedicated Collections (Note 23) 200 200 Other Funds 434,446 343,023 Subtotal 434,646 343,223 Cumulative Results of Operations: Funds from Dedicated Collections (Note 23) 47,110 48,646 Other Funds 22,158 22,245 Subtotal 69,268 70,891 Total Net Position - Funds from Dedicated Collections (Combined Totals) (Note 23) 47,310 48,846 Total Net Position - Other Funds (Combined Totals) 456,604 365,268 Total Net Position (Note 19) 503,914 414,114 Total Liabilities and Net Position $ 22,170,908 $ 20,768,735 The accompanying notes are an integral part of these financial statements.
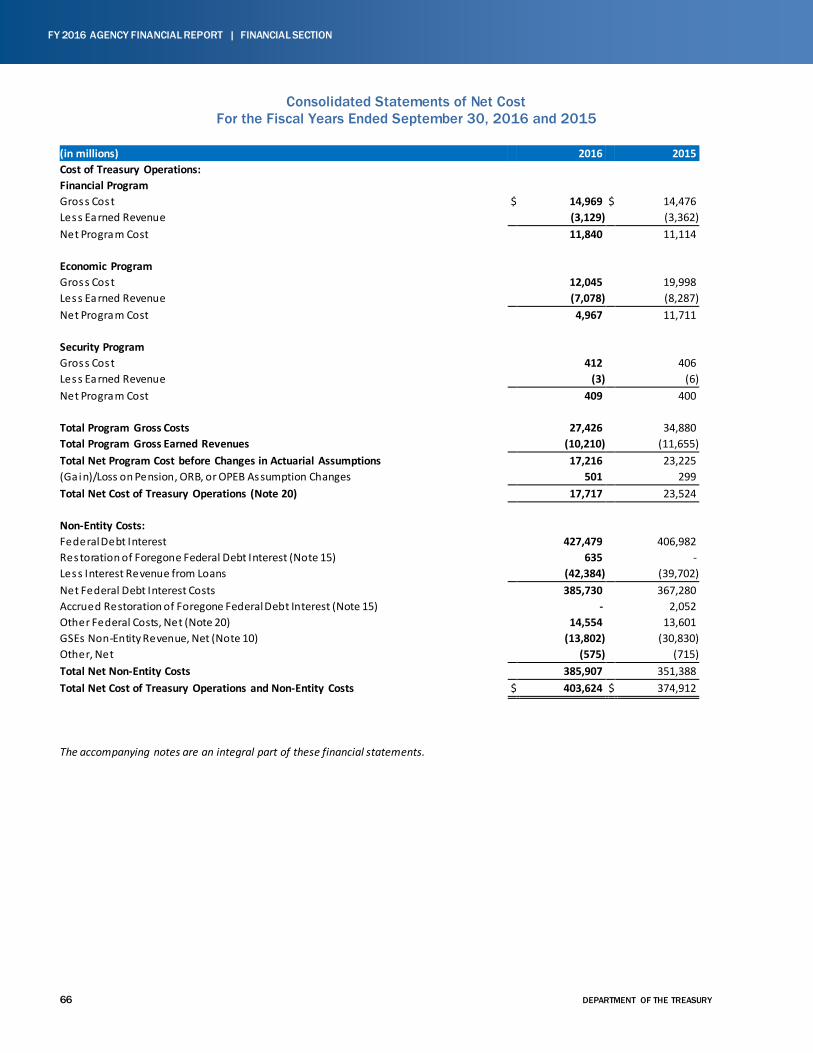
66 DEPARTMENT OF THE TREASURY
FY 2016 AGENCY FINANCIAL REPORT | FINANCIAL SECTION
Consolidated Statements of Net Cost For the Fiscal Years Ended September 30, 2016 and 2015
(in millions) 2016 2015 Cost of Treasury Operations: Financial Program Gross Cost $ 14,969 $ 14,476 Less Earned Revenue (3,129) (3,362) Net Program Cost 11,840 11,114 Economic Program Gross Cost 12,045 19,998 Less Earned Revenue (7,078) (8,287) Net Program Cost 4,967 11,711 Security Program Gross Cost 412 406 Less Earned Revenue (3) (6) Net Program Cost 409 400 Total Program Gross Costs 27,426 34,880 Total Program Gross Earned Revenues (10,210) (11,655) Total Net Program Cost before Changes in Actuarial Assumptions 17,216 23,225 (Gain)/Loss on Pension, ORB, or OPEB Assumption Changes 501 299 Total Net Cost of Treasury Operations (Note 20) 17,717 23,524 Non-Entity Costs: Federal Debt Interest 427,479 406,982 Restoration of Foregone Federal Debt Interest (Note 15) 635 - Less Interest Revenue from Loans (42,384) (39,702) Net Federal Debt Interest Costs 385,730 367,280 Accrued Restoration of Foregone Federal Debt Interest (Note 15) - 2,052 Other Federal Costs, Net (Note 20) 14,554 13,601 GSEs Non-Entity Revenue, Net (Note 10) (13,802) (30,830) Other, Net (575) (715) Total Net Non-Entity Costs 385,907 351,388 Total Net Cost of Treasury Operations and Non-Entity Costs $ 403,624 $ 374,912 The accompanying notes are an integral part of these financial statements.
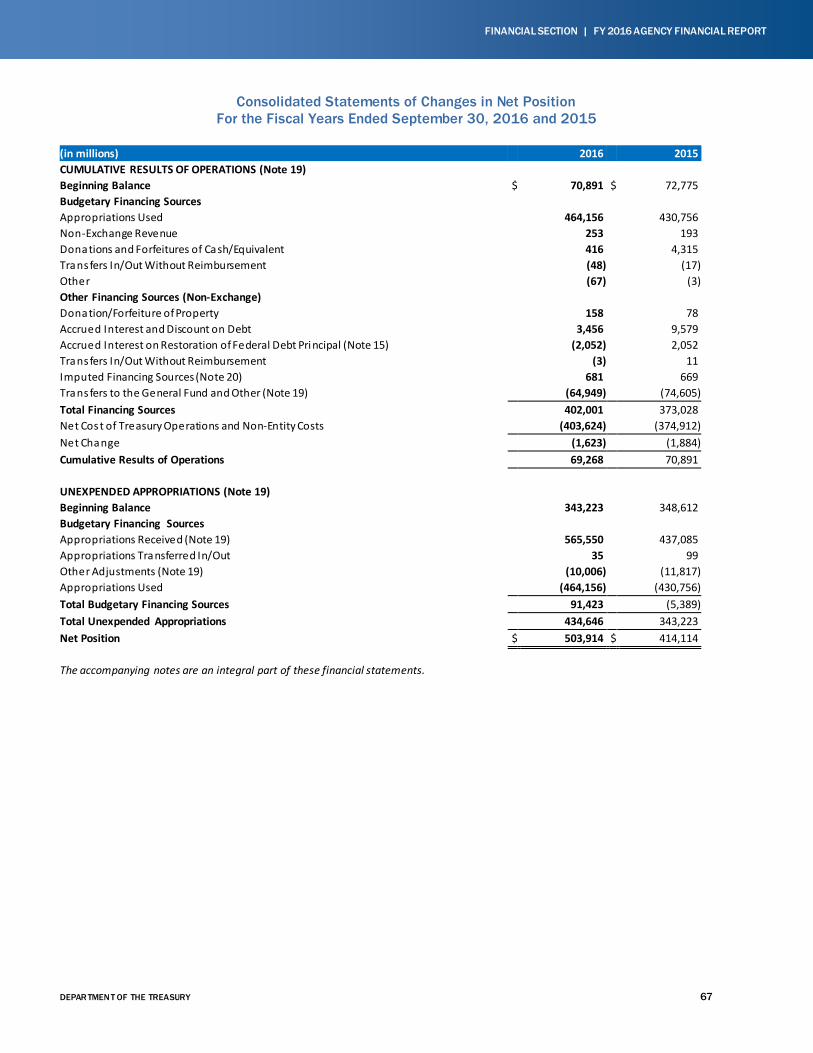
DEPAR TMEN T OF THE TREASURY 67
FINANCIAL SECTION | FY 2016 AGENCY FINANCIAL REPORT
Consolidated Statements of Changes in Net Position For the Fiscal Years Ended September 30, 2016 and 2015
(in millions) 2016 2015 CUMULATIVE RESULTS OF OPERATIONS (Note 19) Beginning Balance $ 70,891 $ 72,775 Budgetary Financing Sources Appropriations Used 464,156 430,756 Non-Exchange Revenue 253 193 Donations and Forfeitures of Cash/Equivalent 416 4,315 Transfers In/Out Without Reimbursement (48) (17) Other (67) (3) Other Financing Sources (Non-Exchange) Donation/Forfeiture of Property 158 78 Accrued Interest and Discount on Debt 3,456 9,579 Accrued Interest on Restoration of Federal Debt Principal (Note 15) (2,052) 2,052 Transfers In/Out Without Reimbursement (3) 11 Imputed Financing Sources (Note 20) 681 669 Transfers to the General Fund and Other (Note 19) (64,949) (74,605) Total Financing Sources 402,001 373,028 Net Cost of Treasury Operations and Non-Entity Costs (403,624) (374,912) Net Change (1,623) (1,884) Cumulative Results of Operations 69,268 70,891 UNEXPENDED APPROPRIATIONS (Note 19) Beginning Balance 343,223 348,612 Budgetary Financing Sources Appropriations Received (Note 19) 565,550 437,085 Appropriations Transferred In/Out 35 99 Other Adjustments (Note 19) (10,006) (11,817) Appropriations Used (464,156) (430,756) Total Budgetary Financing Sources 91,423 (5,389) Total Unexpended Appropriations 434,646 343,223 Net Position $ 503,914 $ 414,114 The accompanying notes are an integral part of these financial statements.
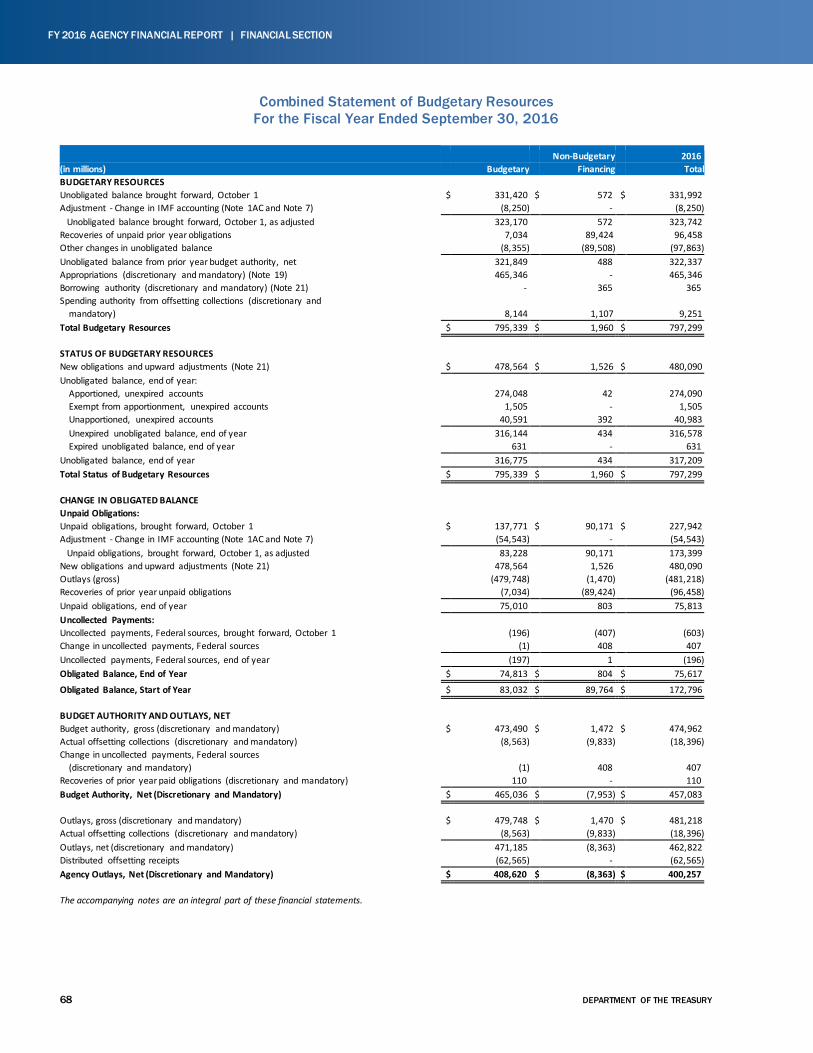
68 DEPARTMENT OF THE TREASURY
FY 2016 AGENCY FINANCIAL REPORT | FINANCIAL SECTION
Combined Statement of Budgetary Resources For the Fiscal Year Ended September 30, 2016
Non-Budgetary 2016 (in millions) Budgetary Financing Total BUDGETARY RESOURCES Unobligated balance brought forward, October 1 $ 331,420 $ 572 $ 331,992 Adjustment - Change in IMF accounting (Note 1AC and Note 7) (8,250) - (8,250) Unobligated balance brought forward, October 1, as adjusted 323,170 572 323,742 Recoveries of unpaid prior year obligations 7,034 89,424 96,458 Other changes in unobligated balance (8,355) (89,508) (97,863) Unobligated balance from prior year budget authority, net 321,849 488 322,337 Appropriations (discretionary and mandatory) (Note 19) 465,346 - 465,346 Borrowing authority (discretionary and mandatory) (Note 21) - 365 365 Spending authority from offsetting collections (discretionary and mandatory) 8,144 1,107 9,251 Total Budgetary Resources $ 795,339 $ 1,960 $ 797,299 STATUS OF BUDGETARY RESOURCES New obligations and upward adjustments (Note 21) $ 478,564 $ 1,526 $ 480,090 Unobligated balance, end of year: Apportioned, unexpired accounts 274,048 42 274,090 Exempt from apportionment, unexpired accounts 1,505 - 1,505 Unapportioned, unexpired accounts 40,591 392 40,983 Unexpired unobligated balance, end of year 316,144 434 316,578 Expired unobligated balance, end of year 631 - 631 Unobligated balance, end of year 316,775 434 317,209 Total Status of Budgetary Resources $ 795,339 $ 1,960 $ 797,299 CHANGE IN OBLIGATED BALANCE Unpaid Obligations: Unpaid obligations, brought forward, October 1 $ 137,771 $ 90,171 $ 227,942 Adjustment - Change in IMF accounting (Note 1AC and Note 7) (54,543) - (54,543) Unpaid obligations, brought forward, October 1, as adjusted 83,228 90,171 173,399 New obligations and upward adjustments (Note 21) 478,564 1,526 480,090 Outlays (gross) (479,748) (1,470) (481,218) Recoveries of prior year unpaid obligations (7,034) (89,424) (96,458) Unpaid obligations, end of year 75,010 803 75,813 Uncollected Payments: Uncollected payments, Federal sources, brought forward, October 1 (196) (407) (603) Change in uncollected payments, Federal sources (1) 408 407 Uncollected payments, Federal sources, end of year (197) 1 (196) Obligated Balance, End of Year $ 74,813 $ 804 $ 75,617
Obligated Balance, Start of Year $ 83,032 $ 89,764 $ 172,796 BUDGET AUTHORITY AND OUTLAYS, NET Budget authority, gross (discretionary and mandatory) $ 473,490 $ 1,472 $ 474,962 Actual offsetting collections (discretionary and mandatory) (8,563) (9,833) (18,396) Change in uncollected payments, Federal sources (discretionary and mandatory) (1) 408 407 Recoveries of prior year paid obligations (discretionary and mandatory) 110 - 110 Budget Authority, Net (Discretionary and Mandatory) $ 465,036 $ (7,953) $ 457,083 Outlays, gross (discretionary and mandatory) $ 479,748 $ 1,470 $ 481,218 Actual offsetting collections (discretionary and mandatory) (8,563) (9,833) (18,396) Outlays, net (discretionary and mandatory) 471,185 (8,363) 462,822 Distributed offsetting receipts (62,565) - (62,565) Agency Outlays, Net (Discretionary and Mandatory) $ 408,620 $ (8,363) $ 400,257 The accompanying notes are an integral part of these financial statements.
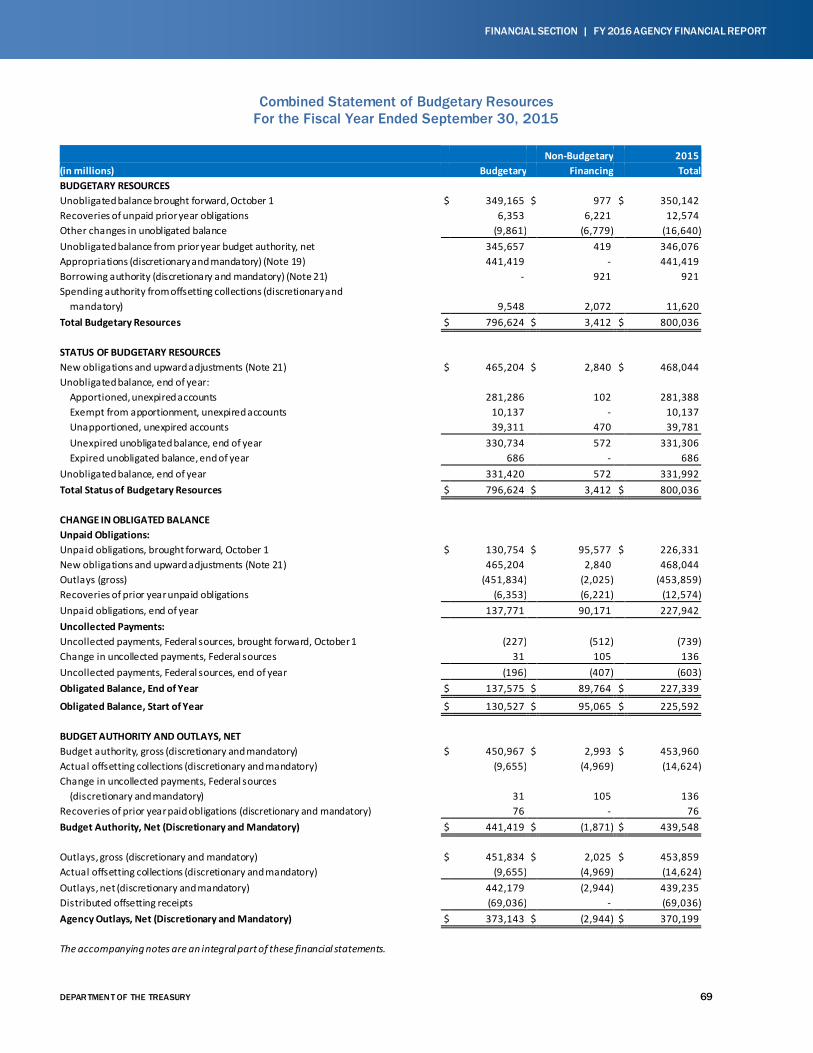
DEPAR TMEN T OF THE TREASURY 69
FINANCIAL SECTION | FY 2016 AGENCY FINANCIAL REPORT
Combined Statement of Budgetary Resources For the Fiscal Year Ended September 30, 2015
Non-Budgetary 2015 (in millions) Budgetary Financing Total BUDGETARY RESOURCES Unobligated balance brought forward, October 1 $ 349,165 $ 977 $ 350,142 Recoveries of unpaid prior year obligations 6,353 6,221 12,574 Other changes in unobligated balance (9,861) (6,779) (16,640) Unobligated balance from prior year budget authority, net 345,657 419 346,076 Appropriations (discretionary and mandatory) (Note 19) 441,419 - 441,419 Borrowing authority (discretionary and mandatory) (Note 21) - 921 921 Spending authority from offsetting collections (discretionary and mandatory) 9,548 2,072 11,620 Total Budgetary Resources $ 796,624 $ 3,412 $ 800,036 STATUS OF BUDGETARY RESOURCES New obligations and upward adjustments (Note 21) $ 465,204 $ 2,840 $ 468,044 Unobligated balance, end of year: Apportioned, unexpired accounts 281,286 102 281,388 Exempt from apportionment, unexpired accounts 10,137 - 10,137 Unapportioned, unexpired accounts 39,311 470 39,781 Unexpired unobligated balance, end of year 330,734 572 331,306 Expired unobligated balance, end of year 686 - 686 Unobligated balance, end of year 331,420 572 331,992 Total Status of Budgetary Resources $ 796,624 $ 3,412 $ 800,036 CHANGE IN OBLIGATED BALANCE Unpaid Obligations: Unpaid obligations, brought forward, October 1 $ 130,754 $ 95,577 $ 226,331 New obligations and upward adjustments (Note 21) 465,204 2,840 468,044 Outlays (gross) (451,834) (2,025) (453,859) Recoveries of prior year unpaid obligations (6,353) (6,221) (12,574) Unpaid obligations, end of year 137,771 90,171 227,942 Uncollected Payments: Uncollected payments, Federal sources, brought forward, October 1 (227) (512) (739) Change in uncollected payments, Federal sources 31 105 136 Uncollected payments, Federal sources, end of year (196) (407) (603) Obligated Balance, End of Year $ 137,575 $ 89,764 $ 227,339
Obligated Balance, Start of Year $ 130,527 $ 95,065 $ 225,592 BUDGET AUTHORITY AND OUTLAYS, NET Budget authority, gross (discretionary and mandatory) $ 450,967 $ 2,993 $ 453,960 Actual offsetting collections (discretionary and mandatory) (9,655) (4,969) (14,624) Change in uncollected payments, Federal sources (discretionary and mandatory) 31 105 136 Recoveries of prior year paid obligations (discretionary and mandatory) 76 - 76 Budget Authority, Net (Discretionary and Mandatory) $ 441,419 $ (1,871) $ 439,548 Outlays, gross (discretionary and mandatory) $ 451,834 $ 2,025 $ 453,859 Actual offsetting collections (discretionary and mandatory) (9,655) (4,969) (14,624) Outlays, net (discretionary and mandatory) 442,179 (2,944) 439,235 Distributed offsetting receipts (69,036) - (69,036) Agency Outlays, Net (Discretionary and Mandatory) $ 373,143 $ (2,944) $ 370,199 The accompanying notes are an integral part of these financial statements.
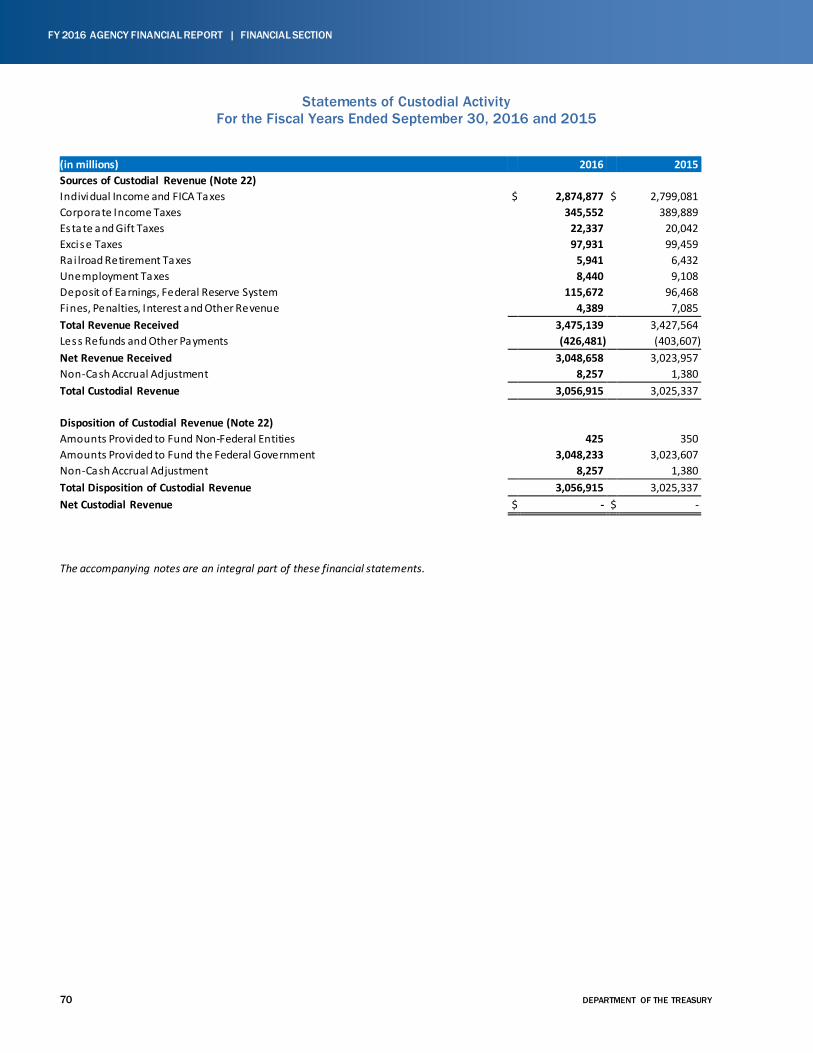
70 DEPARTMENT OF THE TREASURY
FY 2016 AGENCY FINANCIAL REPORT | FINANCIAL SECTION
Statements of Custodial Activity For the Fiscal Years Ended September 30, 2016 and 2015
(in millions) 2016 2015 Sources of Custodial Revenue (Note 22) Individual Income and FICA Taxes $ 2,874,877 $ 2,799,081 Corporate Income Taxes 345,552 389,889 Es tate and Gift Taxes 22,337 20,042 Excise Taxes 97,931 99,459 Ra i lroad Retirement Taxes 5,941 6,432 Unemployment Taxes 8,440 9,108 Deposit of Earnings, Federal Reserve System 115,672 96,468 Fines, Penalties, Interest and Other Revenue 4,389 7,085 Total Revenue Received 3,475,139 3,427,564 Less Refunds and Other Payments (426,481) (403,607) Net Revenue Received 3,048,658 3,023,957 Non-Cash Accrual Adjustment 8,257 1,380 Total Custodial Revenue 3,056,915 3,025,337 Disposition of Custodial Revenue (Note 22) Amounts Provided to Fund Non-Federal Entities 425 350 Amounts Provided to Fund the Federal Government 3,048,233 3,023,607 Non-Cash Accrual Adjustment 8,257 1,380 Total Disposition of Custodial Revenue 3,056,915 3,025,337 Net Custodial Revenue $ - $ - The accompanying notes are an integral part of these financial statements.
DEPAR TMEN T OF THE TREASURY 71
FINANCIAL SECTION | FY 2016 AGENCY FINANCIAL REPORT
NOTES TO THE FINANCIAL STATEMENTS TABLE OF CONTENTS
1. SUMMARY OF SIGNIFICANT ACCOUNTING POLICIES ............................................................................................................. 72 2. FUND BALANCE ..................................................................................................................................................................... 91 3. LOANS AND INTEREST RECEIVABLE – INTRA-GOVERNMENTAL .......................................................................................... 93 4. DUE FROM THE GENERAL FUND AND DUE TO THE GENERAL FUND ................................................................................... 95 5. CASH, FOREIGN CURRENCY, AND OTHER MONETARY ASSETS ............................................................................................. 97 6. GOLD AND SILVER RESERVES, AND GOLD CERTIFICATES ISSUED TO THE FEDERAL RESERVE BANKS ................................ 99 7. RESERVE POSITION IN THE INTERNATIONAL MONETARY FUND AND RELATED LOANS AND INTEREST RECEIVABLE......100 8. TAXES, INTEREST, AND OTHER RECEIVABLES, NET ...........................................................................................................102 9. CREDIT PROGRAM RECEIVABLES, NET ...............................................................................................................................103 10. INVESTMENTS IN GOVERNMENT SPONSORED ENTERPRISES .............................................................................................106 11. INVESTMENTS IN MULTILATERAL DEVELOPMENT BANKS.................................................................................................110 12. OTHER INVESTMENTS AND RELATED INTEREST ................................................................................................................110 13. PROPERTY, PLANT, AND EQUIPMENT, NET ........................................................................................................................111 14. NON-ENTITY VS. ENTITY ASSETS .......................................................................................................................................112 15. FEDERAL DEBT AND INTEREST PAYABLE AND RELATED LIABILITIES ...............................................................................113 16. OTHER DEBT AND INTEREST PAYABLE................................................................................................................................117 17. D.C. FEDERAL PENSION AND JUDICIAL RETIREMENT ACTUARIAL LIABILITY .....................................................................118 18. LIABILITIES...........................................................................................................................................................................120 19. NET POSITION ......................................................................................................................................................................121 20. CONSOLIDATED STATEMENTS OF NET COST AND NET COSTS OF TREASURY SUB-ORGANIZATIONS .................................122 21. ADDITIONAL INFORMATION RELATED TO THE COMBINED STATEMENTS OF BUDGETARY RESOURCES .............................128 22. COLLECTION AND DISPOSITION OF CUSTODIAL REVENUE...................................................................................................131 23. FUNDS FROM DEDICATED COLLECTIONS .............................................................................................................................133 24. RECONCILIATION OF NET COST OF TREASURY OPERATIONS AND NON-ENTITY COSTS TO BUDGET .................................138 25. SCHEDULE OF FIDUCIARY ACTIVITY .....................................................................................................................................139 26. COMMITMENTS AND CONTINGENCIES..................................................................................................................................140 REQUIRED SUPPLEMENTARY INFORMATION (UNAUDITED – SEE ACCOMPANYING AUDITORS’ REPORT)................................145
72 DEPARTMENT OF THE TREASURY
FY 2016 AGENCY FINANCIAL REPORT | FINANCIAL SECTION
1. SUMMARY OF SIGNIFICANT ACCOUNTING POLICIES A. REPORTING ENTITY
The accompanying financial statements include the operations of the Department of the Treasury, one of 24 Chief Financial Officers (CFO) Act agencies of the Executive Branch of the U.S. government, and certain custodial activities the Department manages on behalf of the entire U.S. government. Except where the content clearly indicates otherwise, the use of the terms “Department,” “Treasury,” “we,” “us,” or “our” refers to the Department of the Treasury, including its Departmental Offices (DO) and operating bureaus which are further discussed below. The following paragraphs describe the activities of the reporting entity.
We were established by an Act of Congress approved on September 2, 1789. Many subsequent acts affected our development, delegating new duties to our charge and establishing the numerous bureaus and divisions that now comprise the Department. As a major policy advisor to the President, the Secretary of the Treasury (Secretary) has primary responsibility for formulating and managing the domestic and international tax and financial policies of the U.S. government.
Further, the Secretary is responsible for recommending and implementing U.S. domestic and international economic and fiscal policy; governing the fiscal operations of the U.S. government; maintaining foreign assets control; managing the federal debt; collecting income and excise taxes; representing the United States on international monetary, trade, and investment issues; overseeing our overseas operations; and directing the manufacture of coins, currency, and other products for customer agencies and the public.
Our reporting entities include DO and seven operating bureaus. For financial reporting purposes, DO is composed of: Community Development Financial Institutions (CDFI) Fund, Office of D.C. Pensions (ODCP), Exchange Stabilization Fund (ESF), Federal Financing Bank (FFB), Government Sponsored Enterprises (GSE) Program, International Assistance Programs (IAP), Office of Financial Research (OFR), Office of Financial Stability (OFS), Office of Inspector General (OIG), Small Business Lending Fund (SBLF), Special Inspector General for the Troubled Asset Relief Program (SIGTARP), Treasury Forfeiture Fund (TFF), Treasury Inspector General for Tax Administration (TIGTA), and the DO policy offices.
Our seven operating bureaus are: Bureau of Engraving and Printing (BEP); Bureau of the Fiscal Service (Fiscal Service); Financial Crimes Enforcement Network (FinCEN); Internal Revenue Service (IRS); United States Mint (Mint); Office of the Comptroller of the Currency (OCC); and Alcohol and Tobacco Tax and Trade Bureau (TTB). Our consolidated financial statements reflect the reporting of our entity activities, comprising both our operating bureaus and DO. This includes appropriations received to conduct our operations and revenue generated from those operations. They also reflect the reporting of certain non-entity (custodial) functions we perform on behalf of the U.S. government and others. Non-entity activities include collecting certain federal revenue, servicing the federal debt, disbursing certain federal funds, and maintaining certain assets and liabilities for the U.S. government (refer to Notes 4 and 14), as well as for other federal entities. Our reporting entity does not include the General Fund of the U.S. government (General Fund), which maintains receipt, disbursement, and appropriation accounts for all federal agencies.
DEPAR TMEN T OF THE TREASURY 73
FINANCIAL SECTION | FY 2016 AGENCY FINANCIAL REPORT
Following generally accepted accounting principles (GAAP) for federal entities, we do not consolidate into our financial statements the assets, liabilities, or results of operations of any financial organization or commercial entity in which we hold either a direct or indirect majority equity investment, unless they constitute a part of the reporting entity per GAAP. Even though some of the equity investments are significant, these entities meet the criteria of “bailed out” entities under paragraph 50 of Statement of Federal Financial Accounting Concepts (SFFAC) No. 2, Entity and Display, which directs that such “bailout” investments should not be consolidated into the Financial Report of the U.S. government, either in part or as a whole.
B. BASIS OF ACCOUNTING AND PRESENTATION
The financial statements have been prepared from our accounting records in conformity with GAAP for federal entities, and OMB Circular No. A-136, Financial Reporting Requirements, as revised. Accounting principles generally accepted for federal entities are the standards prescribed by the Federal Accounting Standards Advisory Board (FASAB). The American Institute of Certified Public Accountants recognizes FASAB as the official accounting standards-setting body for the U.S. government.
These financial statements consist of the Consolidated Balance Sheets, the Consolidated Statements of Net Cost, the Consolidated Statements of Changes in Net Position, the Combined Statements of Budgetary Resources, and the Statements of Custodial Activity. The statements and the related notes are prepared in a comparative form to present both fiscal years 2016 and 2015 information.
To provide additional clarity to our financial statements, we have presented additional financial statement line items on the Consolidated Balance Sheets and Consolidated Statements of Changes in Net Position than are required by the guidance in OMB Circular No. A-136. The following summarizes how our additional financial statement line items relate to the financial statement guidelines of the OMB Circular No. A-136. For the Consolidated Balance Sheets: (i) Advances to the Unemployment Trust Fund and Due From the General Fund represent other intra-governmental assets; (ii) Gold and Silver Reserves and the Reserve Position in the International Monetary Fund (IMF) represent other monetary assets; (iii) Loans and Interest Receivable (non-intra-governmental) represents other assets; (iv) Liability for Restoration of Federal Debt Principal and Interest (intra-governmental) and Due To the General Fund represent other intra-governmental liabilities; (v) Liability for Restoration of Federal Debt Principal and Interest (non-intra-governmental), Certificates Issued to the Federal Reserve, Allocation of Special Drawing Rights, Gold Certificates Issued to the Federal Reserve, Refunds Payable, and the D.C. Federal Pension and Judicial Retirement Actuarial Liability represent other liabilities. For the Consolidated Statements of Changes in Net Position, Accrued Interest and Discount on Debt, Accrued Interest on Restoration of Federal Debt Principal, and Transfers to the General Fund and Other represent other non-exchange financing sources.
We have eliminated transactions and balances among our entities from the Consolidated Balance Sheets, Consolidated Statements of Net Cost, and Consolidated Statements of Changes in Net Position. We present the Statement of Budgetary Resources on a combined basis; therefore, intra-departmental transactions and balances have not been eliminated from these statements.
While these financial statements have been prepared from our accounting records in accordance with the formats prescribed by OMB, these financial statements are in addition to the financial reports used to monitor and control budgetary resources which are prepared from the same accounting records.
74 DEPARTMENT OF THE TREASURY
FY 2016 AGENCY FINANCIAL REPORT | FINANCIAL SECTION
Intra-governmental assets and liabilities are those due from or to other federal entities. Intra-governmental earned revenues are collections or accruals of revenue from other federal entities, and intra-governmental costs are payments or accruals of expenditures to other federal entities.
The financial statements should be read with the realization that we are a component of the U.S. government, a sovereign entity and, accordingly, our liabilities not covered by budgetary resources cannot be liquidated without the legislative enactment of an appropriation, and that the payment of all liabilities other than for contracts can be abrogated by the sovereign entity. Liabilities represent the probable and measurable future outflow or other sacrifice of resources as a result of past transactions or events. Liabilities covered by budgetary resources are those liabilities for which Congress has appropriated funds or funding is otherwise available to pay amounts due. Liabilities not covered by budgetary or other resources represent amounts owed in excess of available, congressionally appropriated funds or other amounts, and there is no certainty that the appropriations will be enacted.
We have reclassified certain fiscal year 2015 activity and balances presented on the financial statements to conform to the presentation in the current year, the effects of which are immaterial, including format and terminology changes we made to our Combined Statements of Budgetary Resources in accordance with OMB Circular A-136.
There are numerous acronyms used throughout the notes herein as well as other sections of this Agency Financial Report. Refer to the “Glossary of Acronyms” located in the Appendix of this report for a complete listing of these acronyms and their definitions.
C. FUND BALANCE
The Fund Balance is the aggregate amount of our accounts with the U.S. government’s central accounts from which we are authorized to make expenditures and pay liabilities. It is an asset because it represents our claim to the U.S. government’s resources. Fund balance is not equivalent to unexpended appropriations because it also includes non-appropriated revolving and enterprise funds, suspense accounts, and custodial funds such as deposit funds, special funds, and trust funds.
D. LOANS AND INTEREST RECEIVABLE
Intra-Governmental
Intra-governmental entity loans and interest receivable from other federal agencies represent the principal and related interest receivable on loans we issue, through FFB. We do not record loan loss allowance for credit reform subsidy costs for loans purchased from federal agencies or for guaranteed loans made to non-federal borrowers because those agencies guarantee the outstanding balances (interest and principal).
Intra-governmental non-entity loans and interest receivable from other federal agencies represent the principal and related interest receivable on loans we issue, through the Fiscal Service. We act as an intermediary issuing these loans because the agencies receiving these loans lend these funds to third parties to carry out various programs of the U.S. government. Because of our intermediary role in issuing these loans, we do not record a loan loss allowance related to these non-entity intra-governmental loans. Instead, the ultimate lender, the federal agency that issued the loans to the public, recognizes loan loss allowances and subsidy costs. We accrue interest revenue on intra-governmental loans when earned.
DEPAR TMEN T OF THE TREASURY 75
FINANCIAL SECTION | FY 2016 AGENCY FINANCIAL REPORT
Public
Public loans and interest receivable primarily represent supplemental borrowing arrangements between the United States and the IMF (refer to Note 7). These loans are denominated in Special Drawing Rights (SDRs) and recorded at the equivalent U.S. dollar amount (refer to the accounting policy below entitled “Special Drawing Rights”). We periodically adjust the value of these loans, due to fluctuations in the value of the U.S. dollar with respect to the SDR, to maintain the amount of these loans in dollar terms. We do not record a loan loss allowance for these loans as we do not anticipate any defaults on the repayment of these loans.
E. ADVANCES TO THE UNEMPLOYMENT TRUST FUND
The General Fund issues advances to the Department of Labor’s (DOL) Unemployment Trust Fund for states to pay unemployment benefits. The Fiscal Service accounts for the advances issued on behalf of the General Fund. As outlined in the United States Code (USC) 42 USC §1323, these advances bear an interest rate that is computed as the average interest rate as of the end of the calendar month preceding the issuance date of the advance for all interest-bearing obligations of the United States that form the public debt, to the nearest lower 1/8 of 1.0 percent. Interest on the advances is due on September 30th of each year. We repay advances when the Secretary, in consultation with the Secretary of the DOL, determines that the balance in the Unemployment Trust Fund is adequate to allow repayment.
F. CASH, FOREIGN CURRENCY, AND OTHER MONETARY ASSETS
Substantially all of our operating cash is non-entity government-wide cash held in depository institutions and Federal Reserve Bank (FRB) accounts. Agencies deposit funds that are submitted to them directly into either a Federal Reserve Treasury General Account (TGA) or a local TGA depositary. We transfer the balances in these TGA accounts into the Federal Reserve Bank of New York’s (FRBNY) TGA throughout the day.
Operating cash of the U.S. government represents balances from tax collections, customs duties, other revenue, federal debt receipts, and other various receipts, net of cash outflows for budget outlays and other payments held in the FRBs and in foreign and domestic financial institutions. Outstanding checks net against operating cash until they clear the Federal Reserve System.
The FRBNY maintains the TGA, which functions as the U.S. government’s checking account for deposits and disbursements of public funds. Cash in the TGA is restricted for government-wide operations.
We classify our foreign currency investments having original maturities of three months or less as cash equivalents. SDR holdings comprise most of the other monetary assets (refer to the accounting policy below entitled “Special Drawing Rights”).
G. TAXES, INTEREST, AND OTHER RECEIVABLES, NET
We do not accrue federal taxes receivable, net, and the corresponding liability due to the General Fund, until related tax returns are filed or assessments are made by the IRS and agreed to by either the taxpayer or the court. Additionally, prepayments are netted against liabilities. We make accruals to reflect penalties and interest on taxes receivable through the balance sheet date.
76 DEPARTMENT OF THE TREASURY
FY 2016 AGENCY FINANCIAL REPORT | FINANCIAL SECTION
Taxes receivable consist of unpaid assessments (taxes and associated penalties and interest) due from taxpayers. The existence of a receivable is supported by a taxpayer agreement, such as filing of a tax return without sufficient payment, or a court ruling in favor of the IRS. We record an allowance for doubtful accounts to reflect an estimate of the portion of total taxes receivable deemed to be uncollectible.
Compliance assessments are unpaid assessments which neither the taxpayer nor a court has affirmed the taxpayer owes to the U.S. government. Examples include assessments resulting from an IRS audit or examination in which the taxpayer does not agree with the results. Compliance assessment write-offs consist of unpaid assessments for which the IRS does not expect further collections due to factors such as taxpayers’ bankruptcy, insolvency, or death. We do not report compliance assessments and related write-offs on the balance sheet. Statutory provisions require the accounts to be maintained until the statute for collection expires.
H. CREDIT PROGRAM RECEIVABLES, NET
We account for all of our credit program receivables under the provisions of credit reform accounting pursuant to the Federal Credit Reform Act (FCRA). Credit programs include loans or equity securities associated with our state and local Housing Finance Agency (HFA) initiative programs, SBLF program, CDFI Fund programs, and the Troubled Asset Relief Program (TARP) (refer to Note 9).
To account for our credit program receivables, we apply the accounting provisions of Statement of Federal Financial Accounting Standards (SFFAS) No. 2, Accounting for Direct Loans and Loan Guarantees, as amended. SFFAS No. 2, as amended, requires measurement of the asset or liability at the net present value of the estimated future cash flows. The cash flow estimates for each credit program transaction reflect the actual structure of the instruments. For each of these instruments, we estimate cash inflows and outflows related to the program over the estimated term of the instrument. Further, each cash-flow estimate reflects the specific terms and conditions of the program, technical assumptions regarding the underlying assets, risk of default or other losses, and other factors as appropriate. The measurement of assets within these programs is primarily derived from inputs which generally represent market data and, when such data is not available, management’s best estimate of how a market participant would assess the risk inherent in the asset.
The primary purpose of the FCRA is to measure the cost of federal credit programs, and to place the cost of such credit programs on a basis equivalent with other federal spending. FCRA requires that the ultimate costs of a credit program be calculated and the budgetary resources be obtained before incurring the direct loan obligations. To accomplish this, we first predict or estimate the future performance of direct and guaranteed loans when preparing our annual budget. We re-estimate the data used for these budgetary estimates at the fiscal year-end to reflect changes in actual loan performance and actual interest rates in effect when the loans were issued. The re-estimated data reflect adjustments for market risks, asset performance, and other key variables and economic factors. We then use the re-estimated data to report the cost of the loans disbursed under the direct or guaranteed loan program as a “Program Cost” in our Consolidated Statements of Net Cost.
Cash flows associated with our credit programs generally include disbursements, repayments, repurchases, fees, recoveries, interest, dividends, proceeds from sales of instruments, borrowings from Treasury, negative subsidy, and the subsidy cost received from the program accounts. We draw security-level data and assumptions used as the basis for cash flow model forecasts and program performance from widely available market sources, as well as information published by investees. Key inputs and assumptions to the cash flow forecasts include, but are not limited to:
DEPAR TMEN T OF THE TREASURY 77
FINANCIAL SECTION | FY 2016 AGENCY FINANCIAL REPORT
• Security characteristics such as unpaid principal balance, coupon rate, weighted-average loan age, issued bond balance, credit rating, maturity date, sinking fund schedules, principal and interest payment schedules, and performance of underlying collateral
• Discount rate and Market Adjusted Discount Rate (MRADR) • Department actions, as well as changes in legislation • Forecast dividend payments, late payments, prepayment rates and default rates • Expected escrow conversion and return rates • Default and recovery reports published by Moody’s and Standard and Poor’s • Other third-party market sources
The recorded subsidy cost associated with each of our credit programs represents the difference between our projected costs of the program and the future cash flows we anticipate receiving. The subsidy allowance specifically takes into consideration projected repayments and defaults and the projected cost of borrowings. We amortize the allowance to reflect the difference between projected and actual financing costs.
Our actions, as well as changes in legislation, may impact estimated future cash flows and related subsidy costs. We recognize the cost or cost savings of a modification in subsidy costs when the terms of a program are modified. Workouts are actions taken to maximize repayments of existing credit programs, and the expected effects on cash flows are included in the original estimate and re-estimates of the subsidy cost. Subsidy costs are also impacted by re-estimates which may occur as a result of updates to the original program subsidy cost estimates to reflect actual cash flows experience, as well as changes in forecasts of estimated future cash flows associated with the credit program.
I. INVESTMENTS
Investments in GSEs
We hold senior preferred stock and warrants for the purchase of common stock of two GSEs, the Federal National Mortgage Association (Fannie Mae) and the Federal Home Loan Mortgage Corporation (Freddie Mac). We present these non-federal investment holdings at their fair value. We record changes in the valuation of these investments as non-entity exchange transactions on the Consolidated Statements of Net Cost. We also record dividends related to these investments as non-entity exchange transactions, and accrued when declared.
The GSE Senior Preferred Stock Purchase Agreements (SPSPAs), which we entered into with each GSE when the GSEs were placed under conservatorship, require that we increase our investment in the GSEs’ senior preferred stock if, at the end of any quarter, the Federal Housing Finance Agency (FHFA), acting as the conservator, determines that the liabilities of either GSE exceed its respective assets. Since funding to the GSEs to pay their excess liabilities is appropriated directly to us, we report such payments, as needed, as entity expenses within the Economic Program on the Consolidated Statements of Net Cost, and in the line item, “Cumulative Results of Operations,” on the Consolidated Balance Sheets. These payments also result in an increase to the non-entity investment in the GSEs’ senior preferred stock, with a corresponding increase to “Due To the General Fund”, as we hold the investment on behalf of the General Fund.
78 DEPARTMENT OF THE TREASURY
FY 2016 AGENCY FINANCIAL REPORT | FINANCIAL SECTION
Investments in Multilateral Development Banks
On behalf of the United States, we invest in Multilateral Development Banks (MDBs) to support poverty reduction, private sector development, transitions to market economies, and sustainable economic growth and development, thereby advancing U.S. economic, political, and commercial interests abroad. As a participating member country, we provide a portion of the capital base of the MDBs, through subscriptions to capital, which allows the MDBs to issue loans at market-based rates to middle-income developing countries. These paid-in capital investments are non-marketable equity investments valued at cost on our Consolidated Balance Sheets.
In addition, on behalf of the United States, we contribute funding to MDBs to finance grants and extend credit to poor countries at below market-based interest rates. We report these U.S. contributions, also referred to as “concessional window” contributions, as an expense within the Economic Program on our Consolidated Statements of Net Cost.
Other Investments and Related Interest
The ESF holds most of our foreign currency investments. We classify the ESF’s other foreign currency denominated assets and investment securities as either available-for-sale or trading securities recorded at fair value. These holdings are normally invested in interest-bearing securities issued or held through foreign governments or monetary authorities. We recognize interest on investments, amortization of premiums, and accretion of discounts on an accrual basis, and amortize or accrete premiums and discounts over the life of the related investment security as an adjustment to yield using a method which approximates the effective interest method.
J. PROPERTY, PLANT, AND EQUIPMENT, NET
General
Property, plant, and equipment (PP&E) is composed of capital assets used in providing goods or services. It also includes assets acquired through capital leases, which are initially recorded at the amount recognized as a liability for the capital lease at its inception. PP&E is stated at full cost, including costs related to acquisition, delivery, and installation, less accumulated depreciation. Major alterations and renovations, including leasehold and land improvements, are capitalized, while maintenance and repair costs are charged to expense as incurred. Costs for construction projects are recorded as construction-in-progress until completed, and are valued at actual (direct) cost plus applied overhead and other indirect costs.
Internal-use software encompasses software design, development, and testing of projects adding significant new functionality and long-term benefits. We accumulate costs for developing internal-use software in work-in-development until we place a project into service and testing and final acceptances are successfully completed. Once completed, we transfer the costs to depreciable property.
We lease land and buildings from the General Services Administration (GSA) to conduct most of our operations. We have no material leases that meet capital lease requirements for financial reporting purposes. GSA charges a standard level user fee which approximates commercial rental rates for similar properties.
DEPAR TMEN T OF THE TREASURY 79
FINANCIAL SECTION | FY 2016 AGENCY FINANCIAL REPORT
Our bureaus are diverse both in size and in operating environment. Accordingly, our capitalization policy provides minimum capitalization thresholds, which generally range from $25,000 to $50,000 for all property categories except for internal-use software. Minimum capitalization thresholds for internal-use software generally range from $50,000 to $250,000 (except for the IRS, for which minimum capitalization thresholds generally ranges from $10 million to $50 million). We also use a capitalization threshold for bulk purchases, which generally ranges from $50,000 to $500,000 for non-manufacturing bureaus, and $25,000 to $50,000 for manufacturing bureaus. Bureaus determine the individual items that comprise bulk purchases based on our guidance.
Depreciation is expensed on a straight-line basis over the estimated useful life of the asset with the exception of leasehold improvements and capital leases. We depreciate leasehold improvements over the term of the lease or the useful life of the improvement, whichever is shorter. We depreciate capital leases over the estimated life of the asset or term of the lease, whichever is shorter. Service life ranges (2 to 50 years) are wide due to our diversity of PP&E. We do not depreciate land and land improvements, construction-in-progress, and internal-use software in development. We record impairment costs related to a significant and permanent decline in the service utility of general PP&E and construction-in-progress in the period incurred.
Heritage Assets
Heritage assets are assets of historical significance. Multi-use heritage assets are those heritage assets for which the predominant use is general government operations. We capitalize all acquisition, reconstruction, and betterment costs for our multi-use heritage asset buildings as general PP&E, and depreciate these costs over their service life.
K. FEDERAL DEBT AND INTEREST PAYABLE
We issue federal debt in the form of Treasury securities. This debt relates to monies borrowed from the public and certain other federal agencies to fund the operations of the U.S. government. We issue certain federal debt at a discount or premium. We amortize these discounts and premiums over the term of the security using an interest method for all long-term securities and the straight-line method for short-term securities. Interest costs accrue as an expense as incurred and are reported on the Consolidated Statements of Net Cost as non-entity costs.
L. COMMITMENTS AND CONTINGENCIES
Through FFB, we make loan commitments with federal agencies, or private sector borrowers with loans guaranteed by federal agencies, to extend credit for their own use (refer to the accounting policy above entitled “Loans and Interest Receivable, Intra-Governmental”). We establish loan commitments when FFB and other parties fully execute promissory notes in which we become obligated to issue such loans immediately or at some future date. We reduce loan commitments when we issue the loans or when the commitments expire. Most of our obligations give a borrower the contractual right to a loan or loans immediately or at some point in the future within an agreed upon timeframe.
On behalf of the United States, we subscribe to capital for certain MDBs, portions of which are capital commitments which are callable under certain limited circumstances to meet the obligations of the respective MDB. The capital commitments become binding on the United States when we issue instruments of subscription stating our intention to subscribe to the U.S. portion of callable capital, subject to the amounts provided for in appropriations acts.
80 DEPARTMENT OF THE TREASURY
FY 2016 AGENCY FINANCIAL REPORT | FINANCIAL SECTION
Additionally, on behalf of the United States, we have established financial commitments through our participation in the IMF through a quota subscription and certain borrowing arrangements that supplement IMF resources. U.S. financial commitments to the IMF become binding when the United States consents to an increase in its participation as an IMF member country, and all other conditions to the increase have been met. The outstanding financial commitment in the U.S. quota decreases or increases when the IMF draws upon or repays funding obtained pursuant to a letter of credit established by the United States to make domestic currency available to the IMF as needed. The outstanding financial commitment in the supplemental borrowing arrangements decrease or increase when the IMF borrows and repays loans under this supplemental funding arrangement (refer to Note 7).
In accordance with SFFAS No. 5, Accounting for Liabilities of the Federal Government, we recognize material contingent liabilities meeting the following criteria:
• A past event or exchange transaction has occurred • A future cash outflow is probable • A future cash outflow is measurable
The estimated liability we record is either a specific amount or within a range of amounts. If some amount within the range is a better estimate than any other amount within the range, that amount is recognized. If no amount within the range is a better estimate than any other amount, we recognize the minimum amount in the range, and we disclose the range and a description of the nature of the contingency. We follow this policy in recording a contingent liability, if any, related to the GSE SPSPA program (refer to Note 10), and loss contingencies that may arise from claims, assessments, litigations, fines, penalties, and other sources (refer to Note 26).
If one or more, but not all, of the above criteria for recognition are met, and there is a reasonable possibility of loss, we will disclose, if material, the nature of the contingent liability, along with a range of possible loss, if estimable, and a description of the nature of the contingency.
M. SPECIAL DRAWING RIGHTS
The SDR is an international reserve asset created by the IMF to supplement its member countries’ official reserves. Under its Articles of Agreement, the IMF may allocate SDRs to member countries in proportion to their IMF quotas. Pursuant to the Special Drawing Rights Act of 1968, as amended, the ESF holds all SDRs allocated to or otherwise acquired by the United States.
Allocations and Holdings
We record the SDR holdings as part of “Cash, Foreign Currency, and Other Monetary Assets,” and we record the SDR allocations as a liability entitled “Allocation of Special Drawing Rights” when the IMF allocates SDRs to the Department. We carry this liability since the SDRs may be withdrawn as needed by the IMF unless the following occurs: a withdrawal by the United States from the IMF membership, cancellation of the SDRs, or liquidation of the IMF or SDR Department of the IMF.
DEPAR TMEN T OF THE TREASURY 81
FINANCIAL SECTION | FY 2016 AGENCY FINANCIAL REPORT
SDR holdings increase primarily as a result of IMF SDR allocations. We record SDR transactions as incurred, and include acquisitions and sales of SDRs, interest received on SDR holdings, interest charges on SDRs allocations, and valuation adjustments. The U.S. government also receives remuneration in SDRs from the IMF based on claims on the IMF as represented by the U.S. Reserve Position in the IMF and loans receivable from supplemental borrowing arrangements. We credit remuneration to the ESF, which transfers to the TGA account an equivalent amount of dollars plus nominal interest. The allocations and holdings are revalued monthly based on the SDR valuation rate as calculated by the IMF, resulting in the recognition of unrealized gains or losses on revaluation that are reported on the Consolidated Statements of Net Cost.
Certificates Issued to the Federal Reserve
The Special Drawing Rights Act of 1968 authorizes the Secretary to issue certificates, not to exceed the value of SDR holdings, to the FRB in return for dollar amounts equal to the face value of certificates issued. We issue certificates to finance the acquisition of SDRs from other countries or to provide U.S. dollar resources to finance other ESF operations. Certificates issued are redeemed by us at such times and in such amounts as the Secretary may determine, and do not bear interest. We report certificates issued to the FRB at their face value which approximates their carrying value since, under the terms of the agreement, there is no set repayment date and no interest accrued while certificates remain outstanding.
N. REFUNDS PAYABLE
Refunds payable arise in the normal course of tax administration when it is determined that taxpayers have paid more than the actual taxes they owe. We record amounts concluded to be valid refunds owed to taxpayers as a liability entitled “Refunds Payable” on the Consolidated Balance Sheets, with a corresponding receivable from the General Fund included in the line entitled “Due From the General Fund.”
O. FEDERAL EMPLOYEE BENEFITS PAYABLE – FECA ACTUARIAL LIABILITY
The Federal Employees’ Compensation Act (FECA) provides income and medical cost protection to covered federal civilian employees injured on the job, and employees who have incurred a work-related injury or occupational disease. The FECA program is administered by the DOL which pays valid claims and subsequently seeks reimbursements from us for these paid claims. Generally, we reimburse the DOL within two to three years once funds are appropriated. The FECA liability consists of two components. The first component is based on actual claims paid by the DOL but not yet reimbursed by us. The second component is the estimated liability for future workers compensation as a result of past events. We report both components in “Other Liabilities” on the Consolidated Balance Sheets. These future workers’ compensation estimates are generated by applying actuarial procedures developed to estimate the liability for FECA benefits. The actuarial liability estimates for FECA benefits include the expected liability for death, disability, medical, and miscellaneous costs for approved compensation cases.
P. ANNUAL, SICK, AND OTHER LEAVE
We report annual and compensatory leave earned by our employees, but not yet used, as an accrued liability. We adjust the accrued balance annually to reflect current pay rates. Any portion of the accrued leave for which funding is not available is recorded as an unfunded liability as reported in “Other Liabilities” on the Consolidated Balance Sheets. We expense sick and other leave as taken and do not record a liability for such amounts because employees do not vest in sick and other leave benefits.
82 DEPARTMENT OF THE TREASURY
FY 2016 AGENCY FINANCIAL REPORT | FINANCIAL SECTION
Q. PENSION COSTS, OTHER RETIREMENT BENEFITS, AND OTHER POST-EMPLOYMENT BENEFITS
Federal Pension Costs, Other Retirement Benefits, and Other Post-Employment Benefits
We recognize the full costs of our employees’ pension benefits, including recognizing imputed costs for the difference between the estimated service cost and our contributions. However, the Office of Personnel Management (OPM) rather than the Department recognizes the assets and liabilities associated with these benefits.
Most of our employees hired prior to January 1, 1984, participate in the Civil Service Retirement System (CSRS), and employees hired between January 1, 1984 and December 31, 1986 are covered under the CSRS Offset System, to which we contribute 7.0 percent and 7.5 percent of pay for regular and law enforcement employees, respectively. On January 1, 1987, the Federal Employees’ Retirement System (FERS) went into effect pursuant to Public Law (P.L.) 99-335. FERS is a three tiered retirement system consisting of a Basic Benefit Plan, Thrift Savings Plan (TSP), and Social Security Benefits. FERS and Social Security automatically cover employees hired after December 31, 1986. For the FERS Basic Benefit Plan, we contribute between 11.9 percent and 13.7 percent for regular employees, and between 28.4 percent and 30.1 percent for law enforcement officers. The TSP under FERS is a 401(k)-type savings plan in which we automatically contribute one percent of base pay and match any employee contributions up to an additional four percent of base pay. For most employees hired after December 31, 1983, we also contribute the employer’s matching share for Social Security.
Similar to federal retirement plans, OPM, rather than the Department, reports the assets and liability for future payments to retired employees who participate in the Federal Employees Health Benefits Program (FEHBP) and Federal Employees Group Life Insurance (FEGLI) Program. We report the full cost of providing other retirement benefits (ORB). We also recognize an expense and a liability for other post-employment benefits (OPEB), which includes all types of benefits, provided to former or inactive (but not retired) employees, their beneficiaries, and covered dependents. Additionally, one of our bureaus, OCC, separately sponsors a defined life insurance benefit plan for current and retired employees, and is the administrator for a private defined benefit retirement plan, the Pentegra Defined Benefit Plan (PDBP), that provides retirement, disability, and death benefits for certain retired employees who meet eligibility requirements. In addition to the TSP, the OCC separately sponsors a 401(k) plan.
District of Columbia Federal Pension and Judicial Retirement Plans
Pursuant to Title XI of the Balanced Budget Act of 1997, as amended, we became responsible for benefit payments to certain District of Columbia (D.C.) police officers, firefighters, teachers and judges under D.C. retirement plans (refer to Note 17). The actuarial cost method used to determine costs and actuarial liability for the retirement plans is the Individual Entry Age Normal Funding Method, which approximates the methodology specified by the Aggregate Entry Age Normal Actuarial Cost Method. The methodology bases actuarial liability on long-term economic assumptions. The pension benefit costs incurred by the plans are included on the Consolidated Statements of Net Cost.
The economic assumptions used for the valuation of the D.C. Federal Pension and Judicial retirement plans differ from those used by the OPM for the following reasons: (i) the annual rate of salary increase assumptions are based on different plan member experience; (ii) the annual rate of inflation and cost-of-living adjustment assumptions are based on different statutory requirements (applicable Consumer Price Index and period of calculation); and (iii) for the annual rate of investment return assumption, OPM and the D.C. Federal Pension and Judicial retirement plans use the same underlying yield curve but, unlike the D.C. Federal Pension plan, OPM converts to a single equivalent rate.
DEPAR TMEN T OF THE TREASURY 83
FINANCIAL SECTION | FY 2016 AGENCY FINANCIAL REPORT
R. REVENUE AND FINANCING SOURCES
Our activities are financed either through exchange revenue we receive from others or through non-exchange revenue and financing sources (such as appropriations provided by the Congress and penalties, fines, and certain user fees collected). User fees primarily include collections from the public for the IRS costs to process installment agreements, letter ruling and determinations, and income verification. We recognize exchange revenue when earned; i.e., goods are delivered or services are rendered. We recognize revenue from reimbursable agreements when providing services. We record non-exchange revenues when received or accrued when we have a legal claim through the respective collecting bureau. We recognize appropriations used as financing sources when related expenses are incurred or assets are purchased.
We also incur certain costs paid in total or in part by other federal entities, such as pension costs, the FEHBP, and any un-reimbursed payments made from the Treasury Judgment Fund on our behalf. We recognize these subsidized costs on the Consolidated Statements of Net Cost, and we recognize the imputed financing for these costs on the Consolidated Statements of Changes in Net Position. As a result, there is no effect on net position. We also recognize other non-exchange financing sources, such as donations and transfers of assets without reimbursements, for the period in which they occurred on the Consolidated Statements of Changes in Net Position.
We recognize revenue we receive from disposition of forfeited property as non-exchange revenue on the Consolidated Statements of Changes in Net Position. We report costs related to the Forfeiture Fund program on the Consolidated Statements of Net Cost. The TFF is the special fund account for depositing non-tax forfeiture proceeds received pursuant to laws enforced or administered by law enforcement bureaus that participate in the TFF. We report forfeited property balances in “Other Assets” on the Consolidated Balance Sheets.
S. CUSTODIAL REVENUES
Non-entity revenue reported on our Statements of Custodial Activity includes cash we collected, primarily from taxes. It does not include revenue collected by other federal agencies, such as user fees and other receipts, which are remitted for general operating purposes of the U.S. government or are dedicated for certain trust funds. We present the Statements of Custodial Activity on the “modified accrual basis.” We recognize revenues as cash is collected, and record a “non-cash accrual adjustment” representing the net increase or decrease during the reporting period in net revenue-related assets and liabilities, mainly taxes receivable.
T. APPROPRIATIONS AND OTHER BUDGETARY ACTIVITY
Combined Statement of Budgetary Resources Activity
We record appropriations when authorized by legislation. Incurred obligations of appropriations are recorded when we place an order or sign a contract for goods and services, award a grant, or take other actions that require us to make payments to the public or another federal entity. Outlays are recorded when disbursements are made.
84 DEPARTMENT OF THE TREASURY
FY 2016 AGENCY FINANCIAL REPORT | FINANCIAL SECTION
Permanent and Indefinite Appropriations
We use permanent and indefinite appropriations to disburse tax refunds, income tax credits, and child tax credits. We recognize refund payment funding as appropriations are used. Permanent indefinite authority for refund activity is available for an unlimited period of time in the amount necessary to cover the refund and/or credit. We report tax refunds and credits as a custodial activity of the Department, since they are, in substance, a custodial revenue-related activity resulting from taxpayer overpayments of their tax liabilities.
We also have two permanent and indefinite appropriations related to debt activity. One permanent and indefinite appropriation is used to pay interest on the public debt securities, and the other is used to redeem securities that are matured, called, or eligible for early redemption. These accounts are not annual appropriations and do not have refunds. We report debt redemption appropriations related to our liability on our Consolidated Balance Sheets. We record interest appropriations at the beginning of the fiscal year and again at mid-year, if necessary, and we return any unused authority to the General Fund at the end of the fiscal year. Permanent indefinite authority for debt redemptions and related interest is available for an unlimited period of time.
We also have permanent and indefinite appropriations to fund increases in the projected subsidy costs of credit programs as determined by the re-estimation process required by the FCRA, and to also cover our renewable energy project.
Additionally, we have other permanent and indefinite appropriations to make certain payments on behalf of the U.S. government. We receive these appropriations to make payments to the FRB for fiscal services provided, and to the financial institutions for services provided as financial agents of the U.S. government. They also include appropriations provided to make other disbursements on behalf of the U.S. government, including payments made to various parties as a result of certain claims and judgments rendered against the United States.
U. INCOME TAXES
As an agency of the U.S. government, we are exempt from all income taxes imposed by any governing body, whether it is a federal, state, commonwealth, local, or foreign government.
V. USE OF ESTIMATES
We have made certain estimates and assumptions relating to the reporting of assets, liabilities, revenues, expenses, and the disclosure of contingent liabilities to prepare our financial statements. Actual results may differ from these estimates. Adverse changes in the outlook for the key assumptions underlying management’s estimates may materially affect the results of our operations, cash flows and/or our financial position in future periods. Transactions subject to estimates principally include loan and credit program receivables, credit reform subsidy costs, investments in GSEs and other non-federal securities and related impairment, tax receivables, loan guarantees, depreciation, imputed costs, actuarial liabilities, cost and earned revenue allocations, as well as contingencies and any related recognized liabilities. The following is a discussion of certain significant transactions subject to estimation.
We account for all of our credit program receivables in accordance with credit reform accounting (refer to the accounting policy above entitled “Credit Program Receivables, Net” and Note 9). These receivables are derived using credit reform modeling which is subject to the use of estimates and forecasts that have inherent uncertainty. We recognize the sensitivity of credit reform modeling to slight changes in certain model assumptions such as general economic conditions, specific stock price volatility of the entities in which we have an equity interest, estimates of expected default, and prepayment rates.
DEPAR TMEN T OF THE TREASURY 85
FINANCIAL SECTION | FY 2016 AGENCY FINANCIAL REPORT
We use regular review of model factors, statistical modeling, and annual re-estimates to reflect the most accurate cost of the credit programs to the U.S. government. The purpose of re-estimates is to update original program subsidy cost estimates to reflect actual cash flow experience as well as changes in forecasts of future cash flows. We update forecasts of future cash flows based on actual program performance to date, additional information about the portfolio, additional publicly available relevant historical market data on securities performance, revised expectations for future economic conditions, and enhancements to cash flow projection methods.
We perform annual calculations, as of September 30, to assess our need for recording an estimated liability in accordance with SFFAS No. 5 related to our funding commitment to the GSEs under the SPSPAs. Liability recognition is predicated on the probable future occurrence of an excess of liabilities and minimum capital reserve amounts, as defined, over the assets of either GSE at the end of any reporting quarter. The occurrence of future GSE deficits, which ultimately determines our liability to the GSEs, is most sensitive to future changes in the housing price index and, to a lesser extent, future changes in guarantee fees received by the GSEs on single family mortgages.
The annual valuation performed as of September 30 on the preferred stock and warrants comprising the “Investments in Government Sponsored Enterprises” line item on the Consolidated Balance Sheets incorporates various forecasts, projections and cash flow analyses to develop an estimate of the asset’s fair value. The value of the senior preferred stock is estimated by first estimating the fair value of the total equity of each GSE (which, in addition to the senior preferred stock, is comprised of other equity instruments including common stock, common stock warrants, and junior preferred stock). The fair value of the total equity is based on a discounted cash flow valuation methodology, whereby the primary input is the present value of the projected quarterly dividend payments. The fair value of the GSE’s other equity instruments is then deducted from its total equity, with the remainder representing the fair value of the senior preferred stock. The primary input into the warrants valuation is the market value of the shares of common stock of the GSEs which, along with the junior preferred stock, are traded on the over-the-counter (OTC) Bulletin Board. We evaluate the need for adjusting our OTC market-based valuation of the warrants for the effects, if any, of significant events occurring after the close of the market but before the end of the measurement date. We record any changes in valuation, including impairment, and disclose changes in accordance with SFFAS No. 7, Accounting for Revenue and Other Financing Sources. Since the valuation is an annual process, we deem changes in valuation of the preferred stock and warrants as usual and recurring. Note 10 includes a detailed discussion of the results of the asset valuation and estimated liability assessment.
Estimation of such complex and long-duration receivables, investments, and contingencies is subject to uncertainty. It is possible that new developments will adversely impact the value of receivables, investments, and contingencies, as well as ultimate amounts we are required to fund. Except as expressly noted herein, we have not revalued or included in our estimates as of September 30, 2016 the effects of any new developments that may have occurred subsequent to September 30, 2016. Refer to the accounting policy entitled “Pension Costs, Other Retirement Benefits, and Other Post-Employment Benefits” above and Note 8 for additional discussion related to the estimation of actuarial liabilities and tax receivables, respectively.
W. OTHER-THAN-TEMPORARY IMPAIRMENTS
A decline in the market value (either due to credit, price or currency) of any investment below cost that is deemed to be other-than-temporary is accounted for as an impairment, and the carrying value is reduced to fair value for financial reporting purposes. To determine whether an impairment is other-than-temporary, we consider whether we have the ability and intent to hold the investment until a market price recovery, and consider whether evidence indicating the cost of the investment is recoverable outweighs evidence to the contrary.
86 DEPARTMENT OF THE TREASURY
FY 2016 AGENCY FINANCIAL REPORT | FINANCIAL SECTION
X. CREDIT, MARKET AND FOREIGN CURRENCY RISK
Credit risk is the potential, no matter how remote, for financial loss from a failure of a borrower or counterparty to perform in accordance with underlying contractual obligations. We take on possible credit risk when we make direct loans or guarantees to non-federal entities, provide credits to foreign entities, or become exposed to institutions which engage in financial transactions with foreign countries (refer to Note 12). Our following programs entail credit risk: monetary assets held; committed but undisbursed direct loans; funding commitment to the GSEs; GSE obligations obtained under the HFA initiative (the New Issue Bond Program); investments, loans, and other credit programs including the CDFI Fund programs, SBLF, and TARP.
Our activities generally focus on the underlying problems in the credit markets. We developed these programs to provide credit where borrowers are not able to get access to credit with reasonable terms and conditions. Because these programs attempt to correct for a market imperfection, it can expose us to potential costs and losses. Additional risk of costs and losses could result from terrorist attacks under the Terrorism Risk Insurance Program. The extent of the risk we assumed is described in more detail in the notes to the financial statements and, where applicable, is factored into credit reform models and reflected in fair value measurements (refer to Notes 9, 10, and 26).
For Emergency Economic Stabilization Act (EESA) programs, the statute requires calculation of budgetary costs of the troubled assets and guarantees of troubled assets by adjusting the discount rate for market risks. We adjust our cost estimates for the TARP programs based on a MRADR to reflect the additional return required by the market to compensate for variability around the expected losses reflected in the cash flows. Under SFFAS No. 2, including market risk in the cash flow estimates is consistent with the type of assets being valued. The inclusion of the MRADR is the mechanism for deriving a fair value of the assets.
We face certain risks and uncertainties as a result of holding securities denominated in foreign currency. The price of holdings of such securities may widely fluctuate as a result of volatility in foreign currency markets and changes in real and perceived credit risk of our counterparties.
Y. FUNDS FROM DEDICATED COLLECTIONS
We account for revenues and other financing sources for funds from dedicated collections (FDC) separately from other funds. Such funds are financed by specifically identified revenues provided to the U.S. government by non-federal sources, often supplemented by federal and other financing sources, which remain available over time. Statute requires use of these specifically identified revenues and other financing sources for designated activities, benefits, or purposes. We apply the following criteria for purposes of designating funds as dedicated collections: (i) a statute committing the U.S. government to use specifically identified revenues and/or other financing sources that are originally provided to the U.S. government by a non-federal source only for designated activities, benefits, or purposes; (ii) explicit authority for the fund to retain revenues and/or other financing sources not used in the current period for future use to finance the designated activities, benefits, or purposes; (iii) a requirement to account for and report on the receipt, use, and retention of the revenues and/or other financing sources that distinguishes the fund from the U.S. government’s general revenues; and (iv) for funds comprised of both federal and non-federal sources, such funding is predominantly non-federal, or the non-federal funding is material to our financial statements.
DEPAR TMEN T OF THE TREASURY 87
FINANCIAL SECTION | FY 2016 AGENCY FINANCIAL REPORT
Z. ALLOCATION TRANSFERS
We are a party to allocation transfers with other federal agencies as both a transferring (parent) entity and/or a receiving (child) entity. Allocation transfers are legal delegations by one department of its authority to obligate budget authority and outlay funds to another department. A separate fund account (allocation account) is created in Treasury as a subset of the parent fund account for tracking and reporting purposes. All allocation transfers of balances are credited to this account, and subsequent obligations and outlays incurred by the child entity are charged to this allocation account as they execute the delegated activity on behalf of the parent. Parent federal agencies report both the proprietary and budgetary activity and the child agency does not report any financial activity related to budget authority allocated from the parent federal agency to the child federal agency. However, OMB guidance requires the child to report the activity when we receive allocation transfers, as the child, from the Executive Office of the President (See Circular No. A-136, II.4.2, question 5 for three exceptions).
We allocate funds, as the parent, to the Department of Energy and Department of Health and Human Services (HHS). Also, we receive allocation transfers, as the child, from the Agency for International Development, HHS, Department of Transportation, Executive Office of the President, and General Services Administration.
AA. FIDUCIARY ACTIVITIES
Fiduciary activities are the collection or receipt, and the management, protection, accounting, investment, and disposition by the U.S. government of cash or other assets in which non-Federal individuals or entities have an ownership interest that the U.S. government must uphold. Fiduciary cash and other assets are not assets of the U.S. government. We do not report these activities in our consolidated financial statements, but instead are reported in Note 25.
AB. RELATED PARTIES AND OTHER ENTITIES
The primary “related parties” with whom we conduct business are other federal agencies, mainly through the normal lending activities of the Fiscal Service and the FFB. We disclose these activities in the consolidated financial statements. Additionally, the Secretary serves on the Federal Housing Finance Oversight Board, and consults with the Director of FHFA on matters involving Fannie Mae and Freddie Mac. This provides us with an advisory role in the FHFA’s actions as the conservator for Fannie Mae and Freddie Mac. We have no transactions with FHFA, but rather transact directly with the GSEs. We also utilize the services of the FRBs to execute a variety of transactions on behalf of the Fiscal Service and the ESF. Due to the magnitude and variety of services provided, the following provides an overview of the FRBs’ purpose, governance, and the various services provided on our behalf.
88 DEPARTMENT OF THE TREASURY
FY 2016 AGENCY FINANCIAL REPORT | FINANCIAL SECTION
Federal Reserve System
Congress, under the Federal Reserve Act of 1913, created the Federal Reserve System (FR System). The FR System consists of the Federal Reserve Board of Governors (Board), the Federal Open Market Committee (FOMC), and the FRBs. Collectively, the FR System serves as the nation’s central bank and is responsible for formulating and conducting monetary policy, issuing and distributing currency (Federal Reserve Notes), supervising and regulating financial institutions, providing nationwide payments systems (including large-dollar transfers of funds, automated clearinghouse (ACH) operations, and check collection), providing certain financial services to federal agencies and fiscal principals, and serving as the U.S. government’s bank. Monetary policy includes actions undertaken by the FR System that influence the availability and cost of money and credit as a means of helping to promote national economic goals. The FR System also conducts operations in foreign markets in order to counter disorderly conditions in exchange markets or to meet other needs specified by the FOMC to carry out its central bank responsibilities. The FR System is not included in the federal budget. The FR System is considered an independent central bank, and the executive branch of the U.S. government does not ratify its decisions.
We interact with the FRBs in a variety of ways, including the following:
• The FRBs serve as our fiscal agent and depositary, executing banking and other financial transactions on our behalf (refer to Note 5). We reimburse the FRBs for these services, the cost of which is included on the Consolidated Statements of Net Costs.
• The FRBs hold Treasury and other federal securities in the FRBs’ System Open Market Account (SOMA) for the purpose of conducting monetary policy (refer to Note 15).
• The FRBs hold gold certificates issued by the Department in which the certificates are collateralized by gold (refer to Note 6).
• The FRBs hold SDR certificates issued by the Department which are collateralized by SDRs (refer to Notes 5 and 7). • The FRBs are required by Board policy to transfer their excess earnings to us on behalf of the U.S. government (refer to
Notes 8 and 22).
We also consult with the FR System on matters affecting the economy and certain financial stability activities. We account for and disclose the above financial activities involving us in our consolidated financial statements. In accordance with SFFAC No. 2, Entity and Display, we do not consolidate the FR Systems’ assets, liabilities, and operations into our financial statements.
Federal Reserve System Structure
The Board is an independent organization governed by seven members appointed by the President and confirmed by the Senate. The full term of a Board member is 14 years, and the appointments are staggered so that one term expires on January 31 of each even-numbered year. The Board has a number of supervisory and regulatory responsibilities for institutions including, among others, state-chartered banks that are members of the FR System, bank holding companies, and savings and loan holding companies. In addition, the Board has general supervisory responsibilities for the 12 FRBs, and issues currency (Federal Reserve Notes) to the FRBs for distribution.
DEPAR TMEN T OF THE TREASURY 89
FINANCIAL SECTION | FY 2016 AGENCY FINANCIAL REPORT
The FOMC is comprised of the seven Board members and five of the 12 FRB presidents. FOMC formulates and conducts monetary policy primarily through open market operations (the purchase and sale of certain securities in the open market), the principal tool of national monetary policy. These operations affect the amount of reserve balances available to depository institutions, thereby influencing overall monetary and credit conditions. The 12 FRBs are chartered under the Federal Reserve Act, which requires each member bank to own the capital stock of its FRB. Each FRB has a board of directors that exercises supervision and control of each FRB, with three members appointed by the Board of Governors of the FR System, and six board members elected by their member banks.
The FRBs participate in formulating and conducting monetary policy, distribute currency and coin, and serve as our fiscal agent, as well as the fiscal agent for other federal agencies and fiscal principals. Additionally, the FRBs provide short-term loans to depository institutions and loans to participants in programs or facilities with broad-based eligibility in unusual and crucial circumstances when approved by the Board.
Federal Reserve System Assets and Liabilities
The FRBs hold Treasury and other securities in the SOMA for the purpose of conducting monetary policy. Treasury securities held by the FRBs totaled $1.8 trillion as of September 30, 2016 and 2015 (refer to Note 15). These assets are generally subject to the same market (principally interest-rate) and credit risks as other financial instruments. In the open market, the FR System purchases and sells Treasury securities as a mechanism for controlling the money supply.
The FRBs have deposit liabilities with Treasury and depository institutions. The FRBs issue Federal Reserve Notes, the circulating currency of the United States, which are collateralized by the Treasury securities and other assets held by the FRBs.
Financial and other information concerning the FR System, including financial statements for the Board and the FRBs, may be obtained from the FR System website.
FRB Residual Earnings Transferred to the Department
FRBs generate income from interest earned on securities, reimbursable services provided to federal agencies, and the provision of priced services to depository institutions as specified by the Monetary Control Act of 1980. Although the FRBs generate earnings from carrying out open market operations, via the earnings on securities held in the SOMA account, their execution of these operations is for the purpose of accomplishing monetary policy rather than generating earnings. Each FRB is required by Board policy to transfer to us its residual (or excess) earnings after providing for the cost of operations, payment of dividends, and surplus funds not to exceed an FRB’s allocated portion of an aggregate of $10 billion for all FRBs in accordance with the provisions of a new statute, Fixing America’s Surface Transportation Act of 2015 (P.L. 114-94), which became effective December 4, 2015. Prior to this statute, each FRB was required to maintain surplus funds equal to the amount of capital paid-in. The new statue limits the aggregate amount of surplus funds to $10 billion that all FRBs can maintain.
90 DEPARTMENT OF THE TREASURY
FY 2016 AGENCY FINANCIAL REPORT | FINANCIAL SECTION
FRBs’ residual earnings may vary due to, among other things, changes in the SOMA balance levels that may occur in conducting monetary policy. Under P.L. 114-94, if an FRB’s earnings for the year are not sufficient to provide for the cost of operations, payment of dividends, or allocated portion of the $10 billion aggregate surplus funds limitation, an FRB will suspend its payments to us until such earnings become sufficient. The FRB residual earnings of $115.7 billion and $96.5 billion for fiscal years ended September 30, 2016 and 2015, respectively, are reported as custodial revenues on our Statements of Custodial Activity. They constituted 3.3 percent and 2.8 percent of our total custodial revenues collected in fiscal years 2016 and 2015, respectively. “Taxes, Interest and Other Receivables, Net” includes a receivable for FRB’s residual earnings which represents the earnings due to us as of September 30, but not collected by us until after the end of the month (refer to Note 8).
AC. CHANGE IN BUDGETARY ACCOUNTING AND REPORTING
Effective October 1, 2015, in accordance with OMB guidance, we changed our budgetary accounting and reporting policy for transactions related to the United States’ participation in the IMF. Under this change in policy, IMF transactions – other than related interest earnings and cost estimates for U.S. quota and New Arrangements to Borrow adjustments – are no longer reported as budgetary resources and uses on our Combined Statement of Budgetary Resources. As a result of this change in budgetary accounting, we adjusted the beginning balances of “Unobligated” and “Unpaid Obligations” on our Combined Statement of Budgetary Resources for fiscal year 2016 to remove those balances associated with the IMF programs. This change in accounting policy and resulting budgetary beginning balance adjustments did not impact our proprietary accounts. Refer to Note 7 for a further discussion of this change in accounting and its related impact on our Combined Statement of Budgetary Resources for the fiscal year ended September 30, 2016.
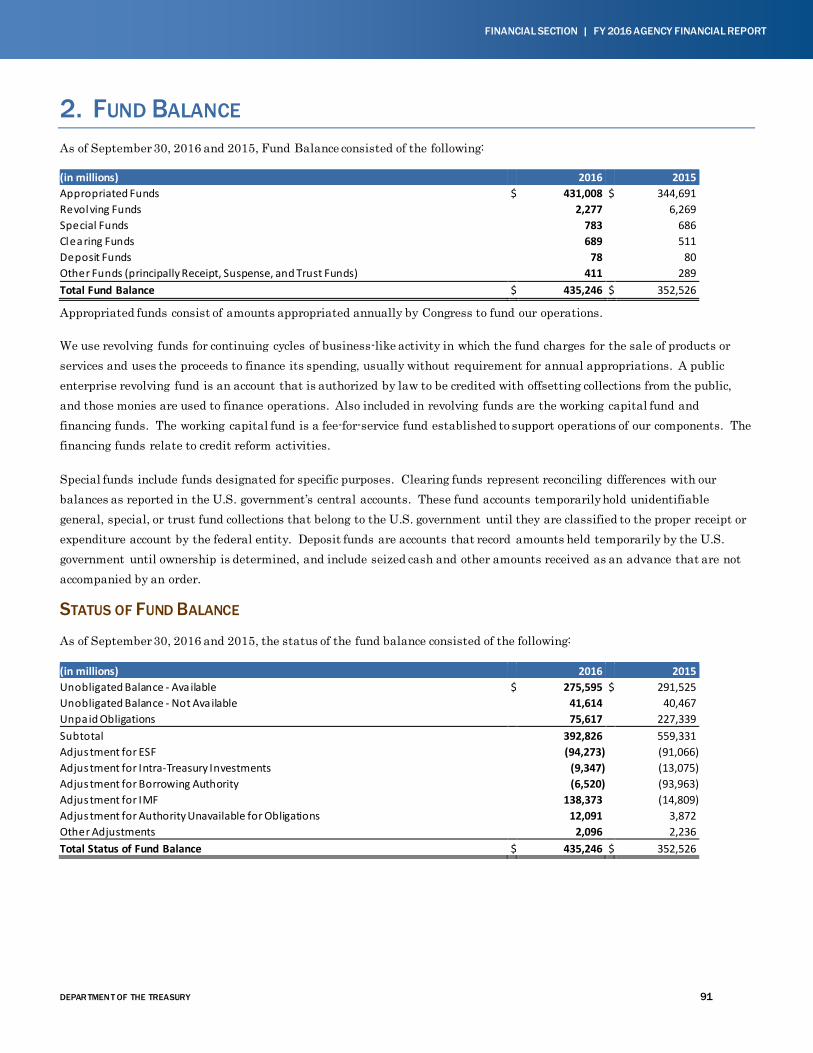
DEPAR TMEN T OF THE TREASURY 91
FINANCIAL SECTION | FY 2016 AGENCY FINANCIAL REPORT
2. FUND BALANCE As of September 30, 2016 and 2015, Fund Balance consisted of the following:
(in millions) 2016 2015 Appropriated Funds $ 431,008 $ 344,691 Revolving Funds 2,277 6,269 Special Funds 783 686 Clearing Funds 689 511 Deposit Funds 78 80 Other Funds (principally Receipt, Suspense, and Trust Funds) 411 289 Total Fund Balance $ 435,246 $ 352,526
Appropriated funds consist of amounts appropriated annually by Congress to fund our operations.
We use revolving funds for continuing cycles of business-like activity in which the fund charges for the sale of products or services and uses the proceeds to finance its spending, usually without requirement for annual appropriations. A public enterprise revolving fund is an account that is authorized by law to be credited with offsetting collections from the public, and those monies are used to finance operations. Also included in revolving funds are the working capital fund and financing funds. The working capital fund is a fee-for-service fund established to support operations of our components. The financing funds relate to credit reform activities.
Special funds include funds designated for specific purposes. Clearing funds represent reconciling differences with our balances as reported in the U.S. government’s central accounts. These fund accounts temporarily hold unidentifiable general, special, or trust fund collections that belong to the U.S. government until they are classified to the proper receipt or expenditure account by the federal entity. Deposit funds are accounts that record amounts held temporarily by the U.S. government until ownership is determined, and include seized cash and other amounts received as an advance that are not accompanied by an order.
STATUS OF FUND BALANCE
As of September 30, 2016 and 2015, the status of the fund balance consisted of the following:
(in millions) 2016 2015 Unobligated Balance - Ava ilable $ 275,595 $ 291,525 Unobligated Balance - Not Ava ilable 41,614 40,467 Unpaid Obligations 75,617 227,339 Subtotal 392,826 559,331 Adjustment for ESF (94,273) (91,066) Adjustment for Intra-Treasury Investments (9,347) (13,075) Adjustment for Borrowing Authority (6,520) (93,963) Adjustment for IMF 138,373 (14,809) Adjustment for Authority Unavailable for Obligations 12,091 3,872 Other Adjustments 2,096 2,236 Total Status of Fund Balance $ 435,246 $ 352,526
92 DEPARTMENT OF THE TREASURY
FY 2016 AGENCY FINANCIAL REPORT | FINANCIAL SECTION
Portions of the Unobligated Balance Not Available, as shown on the Combined Statement of Budgetary Resources, include amounts appropriated in prior fiscal years that are not available to fund new obligations. However, we may use such amounts for upward and downward adjustments for existing obligations in future years. The Unpaid Obligations represent amounts designated for payment of goods and services ordered but not received, or goods and services received but for which payment has not yet been made.
Since the following line items are either a component of Fund Balance or post to budgetary status accounts, the following adjustments are required to reconcile the budgetary status to the non-budgetary Fund Balance as reported on the Consolidated Balance Sheets:
• Adjustments for ESF – ESF investments in Treasury securities (which are eliminated on the Consolidated Balance Sheets), foreign investments, SDR holdings, and related balances that meet the criteria for reporting as part of budgetary resources are reported on the Combined Statements of Budgetary Resources; however, they are not a component of the Fund Balance as they represent invested funds.
• Adjustments for Intra-Treasury Investments – Budgetary resources include Treasury security investments; however, we have moved the money from the Fund Balance to Investments, which we eliminate on the Consolidated Balance Sheets.
• Adjustments for Borrowing Authority – Borrowing authority is in budgetary status reported on the Combined Statements of Budgetary Resources but not in the Fund Balance because we have not received the amounts. The significant decline in borrowing authority is related to new legislation effective in fiscal year 2016 which ended the application of FCRA guidelines to the IMF program involving the use of borrowing authority, and commenced the application of non-FCRA guidelines to the IMF program which involves obtaining an appropriation warrant to cover the full amount of the commitment made to the IMF (refer to Note 7).
• Adjustments for IMF – In accordance with OMB guidance, effective October 1, 2015, the IMF program transactions are no longer reported as budgetary resources and uses on our Combined Statement of Budgetary Resources; however, the funding received through appropriation warrants is reported as a component of Fund Balance (Refer to Note 1AC and 7). Prior to fiscal year 2016, the IMF program transactions that met the criteria for reporting as part of budgetary resources were reported on the Combined Statements of Budgetary Resources; however, they were not a component of the Fund Balance as they represented other monetary assets.
• Adjustment for Authority Unavailable for Obligations – Resources unavailable for obligations reduced the budgetary resources reported on the Combined Statements of Budgetary Resources; however, they do not impact the Fund Balance.
As of September 30, 2016 and 2015, we had no budgetary authority in the Fund Balance that was specifically withheld from apportionment by the OMB. We hold balances in non-entity funds, such as certain deposit funds (e.g., seized cash), for the public or for another federal entity, such as the General Fund. Such funds have an offsetting liability equal to the Fund Balance. Refer to Note 7 regarding restrictions related to the line of credit held on the U.S. quota in the IMF.
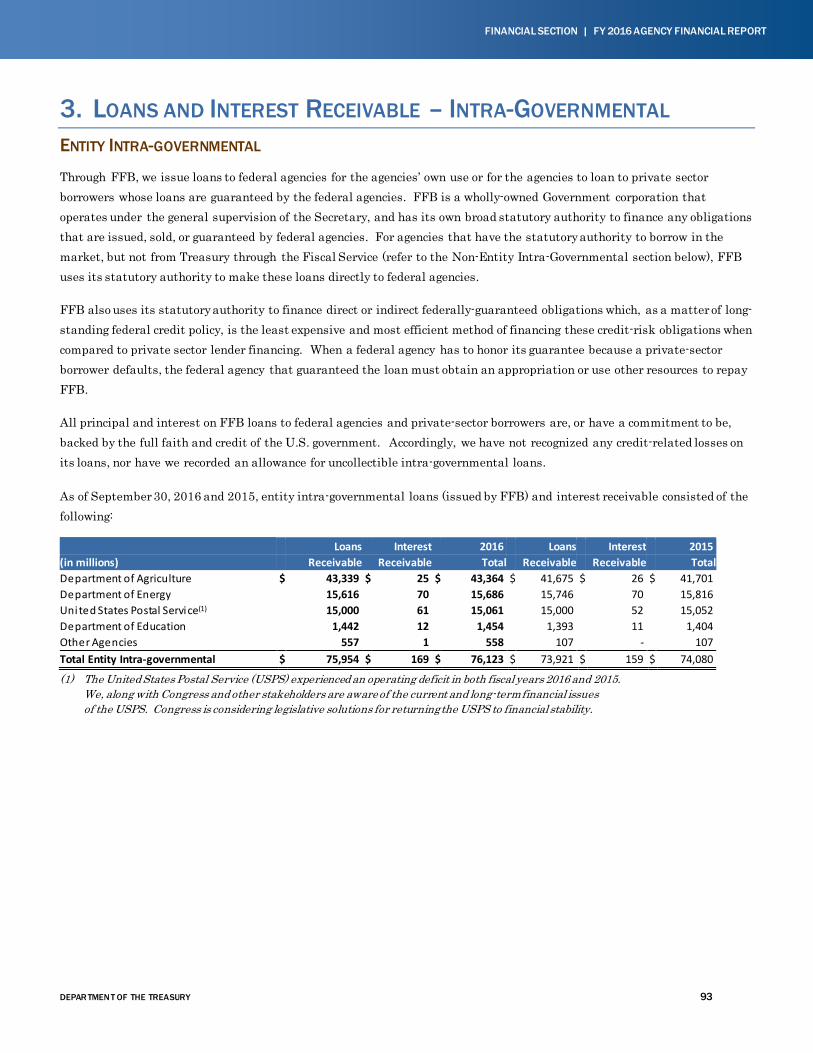
DEPAR TMEN T OF THE TREASURY 93
FINANCIAL SECTION | FY 2016 AGENCY FINANCIAL REPORT
3. LOANS AND INTEREST RECEIVABLE – INTRA-GOVERNMENTAL ENTITY INTRA-GOVERNMENTAL
Through FFB, we issue loans to federal agencies for the agencies’ own use or for the agencies to loan to private sector borrowers whose loans are guaranteed by the federal agencies. FFB is a wholly-owned Government corporation that operates under the general supervision of the Secretary, and has its own broad statutory authority to finance any obligations that are issued, sold, or guaranteed by federal agencies. For agencies that have the statutory authority to borrow in the market, but not from Treasury through the Fiscal Service (refer to the Non-Entity Intra-Governmental section below), FFB uses its statutory authority to make these loans directly to federal agencies.
FFB also uses its statutory authority to finance direct or indirect federally-guaranteed obligations which, as a matter of long-standing federal credit policy, is the least expensive and most efficient method of financing these credit-risk obligations when compared to private sector lender financing. When a federal agency has to honor its guarantee because a private-sector borrower defaults, the federal agency that guaranteed the loan must obtain an appropriation or use other resources to repay FFB.
All principal and interest on FFB loans to federal agencies and private-sector borrowers are, or have a commitment to be, backed by the full faith and credit of the U.S. government. Accordingly, we have not recognized any credit-related losses on its loans, nor have we recorded an allowance for uncollectible intra-governmental loans.
As of September 30, 2016 and 2015, entity intra-governmental loans (issued by FFB) and interest receivable consisted of the following:
Loans Interest 2016 Loans Interest 2015 (in millions) Receivable Receivable Total Receivable Receivable Total Department of Agriculture $ 43,339 $ 25 $ 43,364 $ 41,675 $ 26 $ 41,701 Department of Energy 15,616 70 15,686 15,746 70 15,816 United States Postal Service(1) 15,000 61 15,061 15,000 52 15,052 Department of Education 1,442 12 1,454 1,393 11 1,404 Other Agencies 557 1 558 107 - 107 Total Entity Intra-governmental $ 75,954 $ 169 $ 76,123 $ 73,921 $ 159 $ 74,080
(1) The United States Postal Service (USPS) experienced an operating deficit in both fiscal years 2016 and 2015. We, along with Congress and other stakeholders are aware of the current and long-term financial issues of the USPS. Congress is considering legislative solutions for returning the USPS to financial stability.
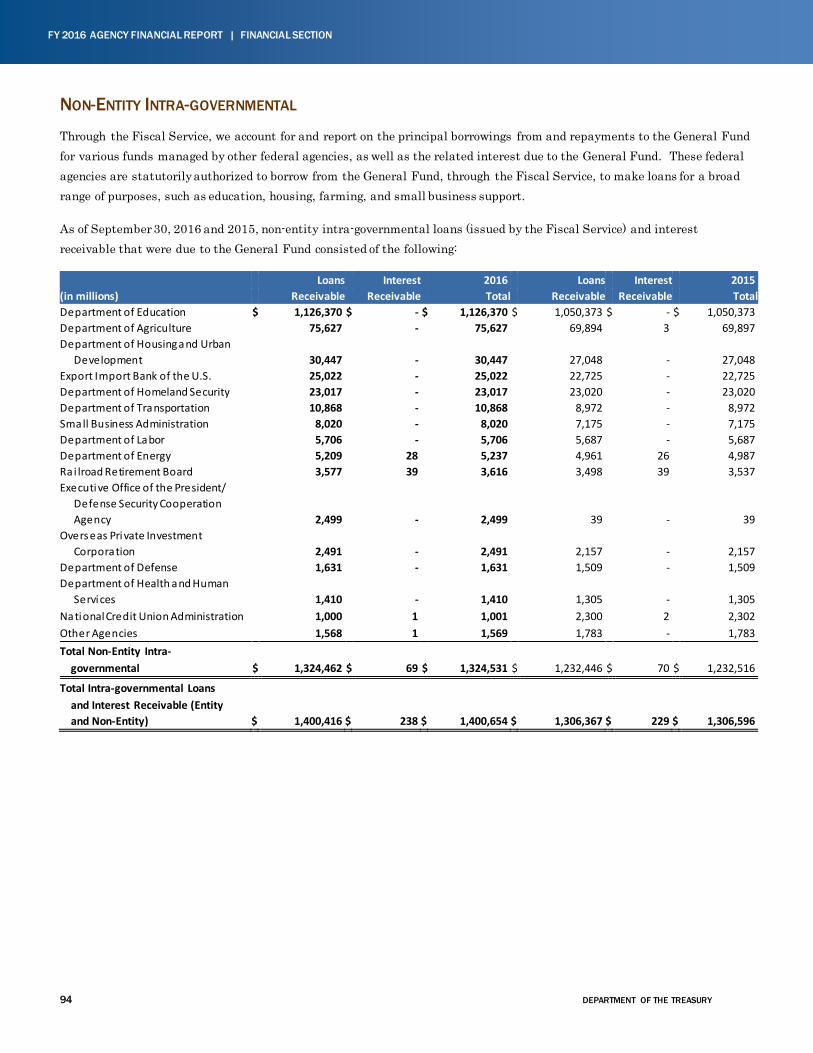
94 DEPARTMENT OF THE TREASURY
FY 2016 AGENCY FINANCIAL REPORT | FINANCIAL SECTION
NON-ENTITY INTRA-GOVERNMENTAL
Through the Fiscal Service, we account for and report on the principal borrowings from and repayments to the General Fund for various funds managed by other federal agencies, as well as the related interest due to the General Fund. These federal agencies are statutorily authorized to borrow from the General Fund, through the Fiscal Service, to make loans for a broad range of purposes, such as education, housing, farming, and small business support.
As of September 30, 2016 and 2015, non-entity intra-governmental loans (issued by the Fiscal Service) and interest receivable that were due to the General Fund consisted of the following:
Loans Interest 2016 Loans Interest 2015 (in millions) Receivable Receivable Total Receivable Receivable Total Department of Education $ 1,126,370 $ - $ 1,126,370 $ 1,050,373 $ - $ 1,050,373 Department of Agriculture 75,627 - 75,627 69,894 3 69,897 Department of Housing and Urban Development 30,447 - 30,447 27,048 - 27,048 Export Import Bank of the U.S. 25,022 - 25,022 22,725 - 22,725 Department of Homeland Security 23,017 - 23,017 23,020 - 23,020 Department of Transportation 10,868 - 10,868 8,972 - 8,972 Small Business Administration 8,020 - 8,020 7,175 - 7,175 Department of Labor 5,706 - 5,706 5,687 - 5,687 Department of Energy 5,209 28 5,237 4,961 26 4,987 Ra i lroad Retirement Board 3,577 39 3,616 3,498 39 3,537 Executive Office of the President/ Defense Security Cooperation Agency 2,499 - 2,499 39 - 39 Overseas Private Investment Corporation 2,491 - 2,491 2,157 - 2,157 Department of Defense 1,631 - 1,631 1,509 - 1,509 Department of Health and Human Services 1,410 - 1,410 1,305 - 1,305 National Credit Union Administration 1,000 1 1,001 2,300 2 2,302 Other Agencies 1,568 1 1,569 1,783 - 1,783 Total Non-Entity Intra- governmental $ 1,324,462 $ 69 $ 1,324,531 $ 1,232,446 $ 70 $ 1,232,516
Total Intra-governmental Loans and Interest Receivable (Entity and Non-Entity) $ 1,400,416 $ 238 $ 1,400,654 $ 1,306,367 $ 229 $ 1,306,596
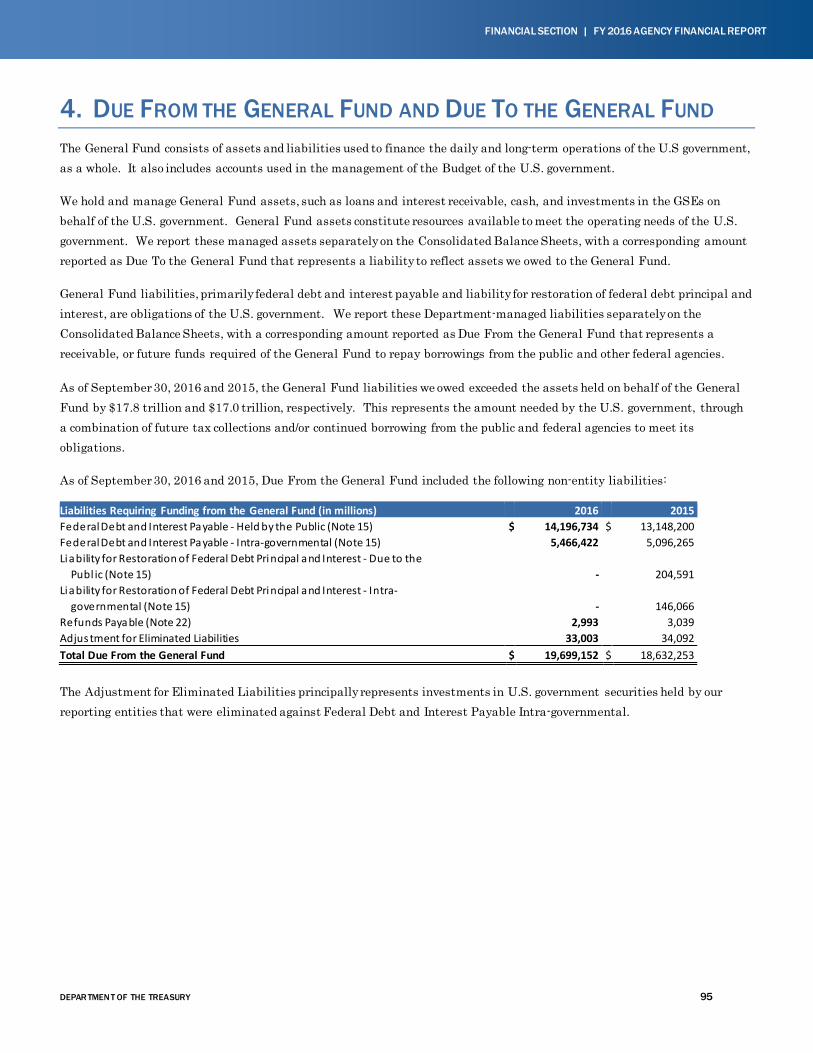
DEPAR TMEN T OF THE TREASURY 95
FINANCIAL SECTION | FY 2016 AGENCY FINANCIAL REPORT
4. DUE FROM THE GENERAL FUND AND DUE TO THE GENERAL FUND The General Fund consists of assets and liabilities used to finance the daily and long-term operations of the U.S government, as a whole. It also includes accounts used in the management of the Budget of the U.S. government.
We hold and manage General Fund assets, such as loans and interest receivable, cash, and investments in the GSEs on behalf of the U.S. government. General Fund assets constitute resources available to meet the operating needs of the U.S. government. We report these managed assets separately on the Consolidated Balance Sheets, with a corresponding amount reported as Due To the General Fund that represents a liability to reflect assets we owed to the General Fund.
General Fund liabilities, primarily federal debt and interest payable and liability for restoration of federal debt principal and interest, are obligations of the U.S. government. We report these Department-managed liabilities separately on the Consolidated Balance Sheets, with a corresponding amount reported as Due From the General Fund that represents a receivable, or future funds required of the General Fund to repay borrowings from the public and other federal agencies.
As of September 30, 2016 and 2015, the General Fund liabilities we owed exceeded the assets held on behalf of the General Fund by $17.8 trillion and $17.0 trillion, respectively. This represents the amount needed by the U.S. government, through a combination of future tax collections and/or continued borrowing from the public and federal agencies to meet its obligations.
As of September 30, 2016 and 2015, Due From the General Fund included the following non-entity liabilities:
Liabilities Requiring Funding from the General Fund (in millions) 2016 2015 Federal Debt and Interest Payable - Held by the Public (Note 15) $ 14,196,734 $ 13,148,200 Federal Debt and Interest Payable - Intra-governmental (Note 15) 5,466,422 5,096,265 Liability for Restoration of Federal Debt Principal and Interest - Due to the Publ ic (Note 15) - 204,591 Liability for Restoration of Federal Debt Principal and Interest - Intra- governmental (Note 15) - 146,066 Refunds Payable (Note 22) 2,993 3,039 Adjustment for Eliminated Liabilities 33,003 34,092 Total Due From the General Fund $ 19,699,152 $ 18,632,253 The Adjustment for Eliminated Liabilities principally represents investments in U.S. government securities held by our reporting entities that were eliminated against Federal Debt and Interest Payable Intra-governmental.
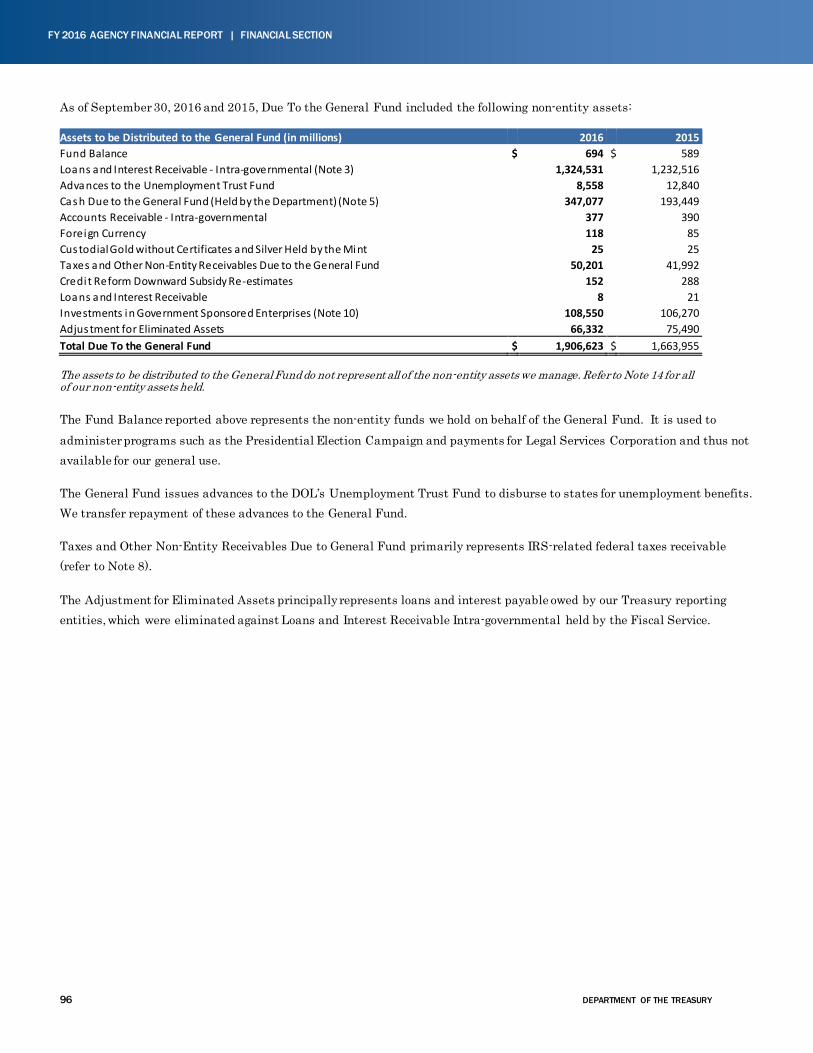
96 DEPARTMENT OF THE TREASURY
FY 2016 AGENCY FINANCIAL REPORT | FINANCIAL SECTION
As of September 30, 2016 and 2015, Due To the General Fund included the following non-entity assets:
Assets to be Distributed to the General Fund (in millions) 2016 2015 Fund Balance $ 694 $ 589 Loans and Interest Receivable - Intra-governmental (Note 3) 1,324,531 1,232,516 Advances to the Unemployment Trust Fund 8,558 12,840 Cash Due to the General Fund (Held by the Department) (Note 5) 347,077 193,449 Accounts Receivable - Intra-governmental 377 390 Foreign Currency 118 85 Custodial Gold without Certificates and Silver Held by the Mint 25 25 Taxes and Other Non-Entity Receivables Due to the General Fund 50,201 41,992 Credi t Reform Downward Subsidy Re-estimates 152 288 Loans and Interest Receivable 8 21 Investments in Government Sponsored Enterprises (Note 10) 108,550 106,270 Adjustment for Eliminated Assets 66,332 75,490 Total Due To the General Fund $ 1,906,623 $ 1,663,955
The assets to be distributed to the General Fund do not represent all of the non-entity assets we manage. Refer to Note 14 for all of our non-entity assets held.
The Fund Balance reported above represents the non-entity funds we hold on behalf of the General Fund. It is used to administer programs such as the Presidential Election Campaign and payments for Legal Services Corporation and thus not available for our general use.
The General Fund issues advances to the DOL’s Unemployment Trust Fund to disburse to states for unemployment benefits. We transfer repayment of these advances to the General Fund.
Taxes and Other Non-Entity Receivables Due to General Fund primarily represents IRS-related federal taxes receivable (refer to Note 8).
The Adjustment for Eliminated Assets principally represents loans and interest payable owed by our Treasury reporting entities, which were eliminated against Loans and Interest Receivable Intra-governmental held by the Fiscal Service.
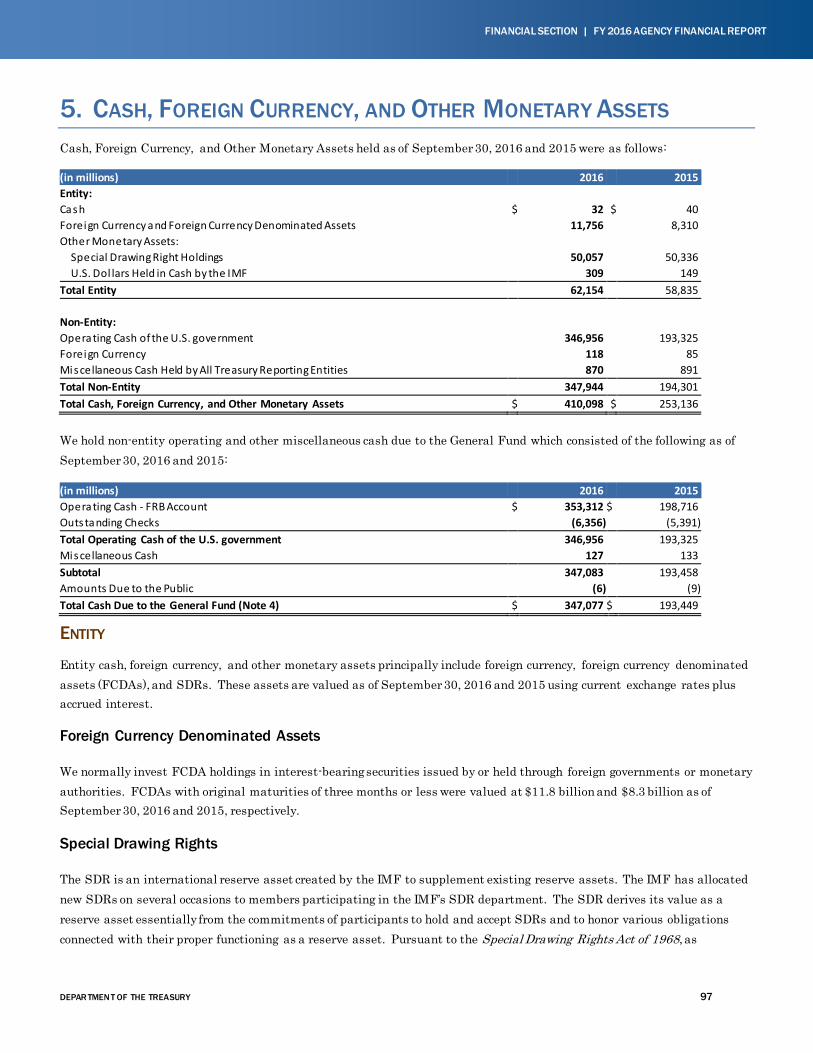
DEPAR TMEN T OF THE TREASURY 97
FINANCIAL SECTION | FY 2016 AGENCY FINANCIAL REPORT
5. CASH, FOREIGN CURRENCY, AND OTHER MONETARY ASSETS Cash, Foreign Currency, and Other Monetary Assets held as of September 30, 2016 and 2015 were as follows:
(in millions) 2016 2015 Entity: Cash $ 32 $ 40 Foreign Currency and Foreign Currency Denominated Assets 11,756 8,310 Other Monetary Assets: Special Drawing Right Holdings 50,057 50,336 U.S. Dol lars Held in Cash by the IMF 309 149 Total Entity 62,154 58,835 Non-Entity: Operating Cash of the U.S. government 346,956 193,325 Foreign Currency 118 85 Miscellaneous Cash Held by All Treasury Reporting Entities 870 891 Total Non-Entity 347,944 194,301 Total Cash, Foreign Currency, and Other Monetary Assets $ 410,098 $ 253,136 We hold non-entity operating and other miscellaneous cash due to the General Fund which consisted of the following as of September 30, 2016 and 2015:
(in millions) 2016 2015 Operating Cash - FRB Account $ 353,312 $ 198,716 Outstanding Checks (6,356) (5,391) Total Operating Cash of the U.S. government 346,956 193,325 Miscellaneous Cash 127 133 Subtotal 347,083 193,458 Amounts Due to the Public (6) (9) Total Cash Due to the General Fund (Note 4) $ 347,077 $ 193,449
ENTITY
Entity cash, foreign currency, and other monetary assets principally include foreign currency, foreign currency denominated assets (FCDAs), and SDRs. These assets are valued as of September 30, 2016 and 2015 using current exchange rates plus accrued interest.
Foreign Currency Denominated Assets
We normally invest FCDA holdings in interest-bearing securities issued by or held through foreign governments or monetary authorities. FCDAs with original maturities of three months or less were valued at $11.8 billion and $8.3 billion as of September 30, 2016 and 2015, respectively.
Special Drawing Rights
The SDR is an international reserve asset created by the IMF to supplement existing reserve assets. The IMF has allocated new SDRs on several occasions to members participating in the IMF’s SDR department. The SDR derives its value as a reserve asset essentially from the commitments of participants to hold and accept SDRs and to honor various obligations connected with their proper functioning as a reserve asset. Pursuant to the Special Drawing Rights Act of 1968, as
98 DEPARTMENT OF THE TREASURY
FY 2016 AGENCY FINANCIAL REPORT | FINANCIAL SECTION
amended, we issued certificates to the Federal Reserve, valued at $5.2 billion which were reported as a liability on the Consolidated Balance Sheets as of September 30, 2016 and 2015. The certificates were issued to finance the ESF’s acquisition of SDRs from other countries or to provide U.S. dollar resources for financing other ESF operations.
On a daily basis, the IMF calculates the value of the SDR using the currency exchange rate in terms of the U.S. dollar from weighted amounts of each of four freely usable currencies, as defined by the IMF. These currencies are the U.S. dollar, the European euro, the Japanese yen, the British pound sterling, and, effective October 1, 2016, the Chinese renminbi. We revalue the U.S. SDR holdings and allocations from the IMF monthly based on the SDR valuation rate calculated by the IMF.
Pursuant to the IMF Articles of Agreement, SDR holdings and allocations acquired by the United States are permanent resources or liabilities unless:
• cancelled by the Board of Governors pursuant to an 85.0 percent majority decision of the total voting power of IMF members;
• the SDR department of the IMF is liquidated; • the IMF is liquidated; or • the United States chooses to withdraw from the IMF or terminate its participation in the SDR department
Except for the payment of interest and charges on SDR allocations to the United States, the payment of the U.S. commitment related to SDR allocations is conditional on events listed above, in which the United States has a substantial or controlling voice. The United States has received no SDR allocations since 2009.
As of September 30, 2016 and 2015, the total amount of SDR holdings of the United States was the equivalent of $50.1 billion and $50.3 billion, respectively. As of September 30, 2016 and 2015, the total value of SDR allocations to the United States was the equivalent of $49.3 billion and $49.6 billion, respectively.
NON-ENTITY
We manage the non-entity cash, foreign currency, and other monetary assets principally included in the Operating Cash of the U.S. government. Also included is foreign currency maintained by various U.S. disbursing offices, miscellaneous cash such as seized monetary instruments, undistributed cash, and offers in compromises which are maintained as a result of our tax collecting responsibilities. The Operating Cash of the U.S. government represents balances from tax collections, other revenues, federal debt receipts, and other receipts, net of checks outstanding, which are held in the FRBNY.
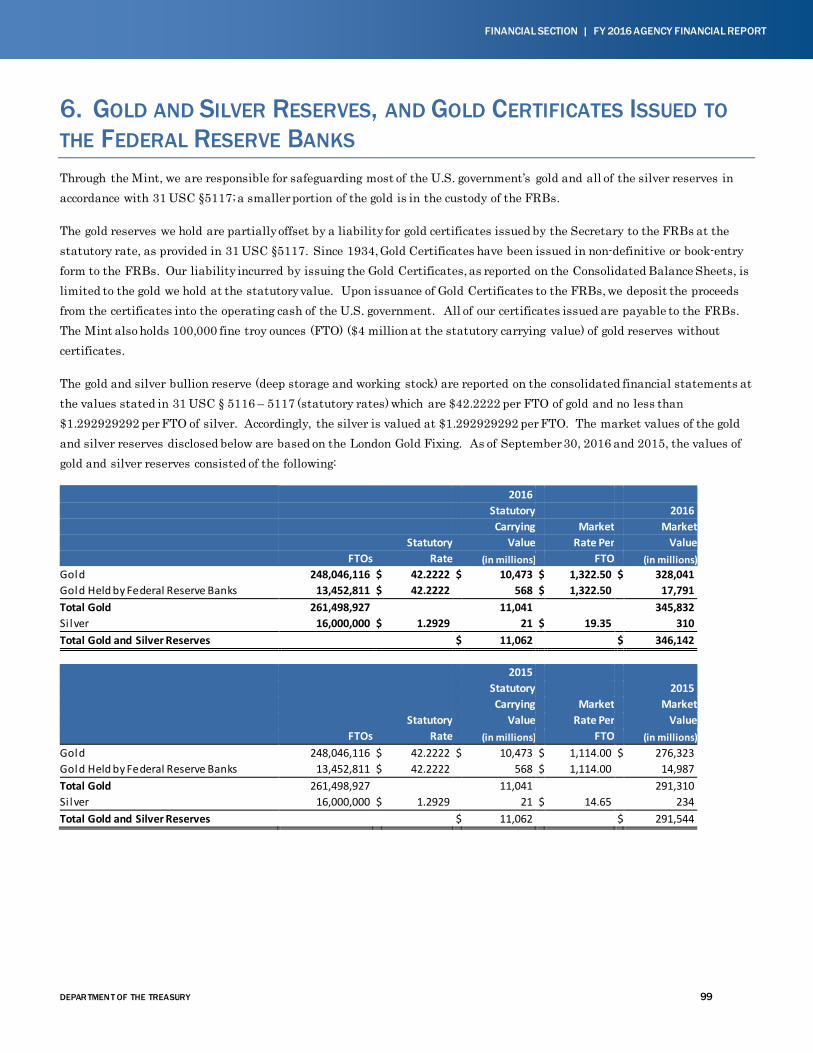
DEPAR TMEN T OF THE TREASURY 99
FINANCIAL SECTION | FY 2016 AGENCY FINANCIAL REPORT
6. GOLD AND SILVER RESERVES, AND GOLD CERTIFICATES ISSUED TO THE FEDERAL RESERVE BANKS Through the Mint, we are responsible for safeguarding most of the U.S. government’s gold and all of the silver reserves in accordance with 31 USC §5117; a smaller portion of the gold is in the custody of the FRBs.
The gold reserves we hold are partially offset by a liability for gold certificates issued by the Secretary to the FRBs at the statutory rate, as provided in 31 USC §5117. Since 1934, Gold Certificates have been issued in non-definitive or book-entry form to the FRBs. Our liability incurred by issuing the Gold Certificates, as reported on the Consolidated Balance Sheets, is limited to the gold we hold at the statutory value. Upon issuance of Gold Certificates to the FRBs, we deposit the proceeds from the certificates into the operating cash of the U.S. government. All of our certificates issued are payable to the FRBs. The Mint also holds 100,000 fine troy ounces (FTO) ($4 million at the statutory carrying value) of gold reserves without certificates.
The gold and silver bullion reserve (deep storage and working stock) are reported on the consolidated financial statements at the values stated in 31 USC § 5116 – 5117 (statutory rates) which are $42.2222 per FTO of gold and no less than $1.292929292 per FTO of silver. Accordingly, the silver is valued at $1.292929292 per FTO. The market values of the gold and silver reserves disclosed below are based on the London Gold Fixing. As of September 30, 2016 and 2015, the values of gold and silver reserves consisted of the following:
2016 Statutory 2016 Carrying Market Market Statutory Value Rate Per Value FTOs Rate (in millions) FTO (in millions) Gold 248,046,116 $ 42.2222 $ 10,473 $ 1,322.50 $ 328,041 Gold Held by Federal Reserve Banks 13,452,811 $ 42.2222 568 $ 1,322.50 17,791 Total Gold 261,498,927 11,041 345,832 Si lver 16,000,000 $ 1.2929 21 $ 19.35 310 Total Gold and Silver Reserves $ 11,062 $ 346,142
2015 Statutory 2015 Carrying Market Market Statutory Value Rate Per Value FTOs Rate (in millions) FTO (in millions) Gold 248,046,116 $ 42.2222 $ 10,473 $ 1,114.00 $ 276,323 Gold Held by Federal Reserve Banks 13,452,811 $ 42.2222 568 $ 1,114.00 14,987 Total Gold 261,498,927 11,041 291,310 Si lver 16,000,000 $ 1.2929 21 $ 14.65 234 Total Gold and Silver Reserves $ 11,062 $ 291,544
100 DEPARTMENT OF THE TREASURY
FY 2016 AGENCY FINANCIAL REPORT | FINANCIAL SECTION
7. RESERVE POSITION IN THE INTERNATIONAL MONETARY FUND AND RELATED LOANS AND INTEREST RECEIVABLE The United States participates in the IMF through a quota subscription and certain borrowing arrangements that supplement IMF resources.
LEGISLATIVE CHANGES
The Supplemental Appropriations Act of 2009 (P.L. 111-32) authorized and funded an increase of approximately SDR 5.0 billion (approximately $8.0 billion) in the U.S. quota in the IMF, as well as an increase in the United States’ participation in the New Arrangements to Borrow (NAB) up to the dollar equivalent of SDR 75 billion. This increase in the U.S. quota and NAB became effective in fiscal year 2011. P.L. 111-32 subjected the increases in both the U.S. quota and the NAB to the requirements of FCRA, and as such, all funding provided pursuant to P.L. 111-32, referred to as “FCRA funds,” was accounted for in accordance with credit reform accounting guidelines per SFFAS No. 2. A credit program receivable was established for FCRA fund amounts disbursed (refer to Note 9).
In fiscal year 2016, Congress passed the Consolidated Appropriations Act of 2016 (P.L. 114-113) which authorized and funded an SDR 40.9 billion (approximately $57 billion) increase in the U.S. quota in the IMF, and reduced the United States’ participation in the NAB by a corresponding amount. This resulted in no net change in the United States’ overall financial commitment to the IMF. The provisions of P.L. 114-113 also eliminated our use of FCRA, commencing in fiscal year 2016, for any U.S. funding to the IMF, including any funding disbursements made pursuant to P.L. 111-32.
The fiscal year 2016 legislation had the following significant impacts to the Department’s consolidated financial statements as of and for the fiscal year ended September 30, 2016. On the Consolidated Balance Sheet, the “Reserve Position in the IMF” and “Loans and Interest Receivable” increased by $1.3 billion and $4.4 billion, respectively, with a corresponding decrease of $5.7 billion in “Credit Program Receivables, Net” to reclassify those program funds previously presented in accordance with FCRA guidelines pursuant to P.L. 111-32. Furthermore, the “Unexpended Appropriations – Appropriations Received” line reported on our Consolidated Statement of Changes in Net Position for the fiscal year ended September 30, 2016 increased by $94.4 billion as a result of no longer applying FCRA guidelines to these programs. In connection with the IMF programs, P.L. 114-113 ended the application of FCRA guidelines which involved having borrowing authority, and commenced the application of non-FCRA guidelines which involves obtaining an appropriation warrant to cover the full amount of the commitment made to the IMF, with current indefinite authority to maintain the U.S. dollar equivalent of the SDR funding commitment levels. On our Combined Statement of Budgetary Resources for the 2016 fiscal year, we recorded recoveries of prior year unpaid obligations of $89.4 billion and other changes in unobligated balances for the withdrawal of borrowing authority of $87.5 billion related to the legislative termination of the FCRA program.
CHANGE IN BUDGETARY ACCOUNTING AND REPORTING
The fiscal year 2016 legislation caused OMB to reconsider its budgetary accounting policy for transactions related to the United States’ participation in the IMF. OMB mandated a change in policy, effective October 1, 2015, under which IMF transactions – other than related interest earnings and cost estimates for U.S. quota and NAB adjustments – are no longer reported as budgetary resources and uses on our Combined Statement of Budgetary Resources. For the fiscal year ended September 30, 2016, we adjusted our beginning balances of “Unobligated” and “Unpaid Obligations” on the Combined Statement of Budgetary Resources by $8.3 billion and $54.5 billion, respectively, to remove those balances associated with the IMF Quota and NAB programs combined. We made no adjustment to the prior year financial statement presentation.
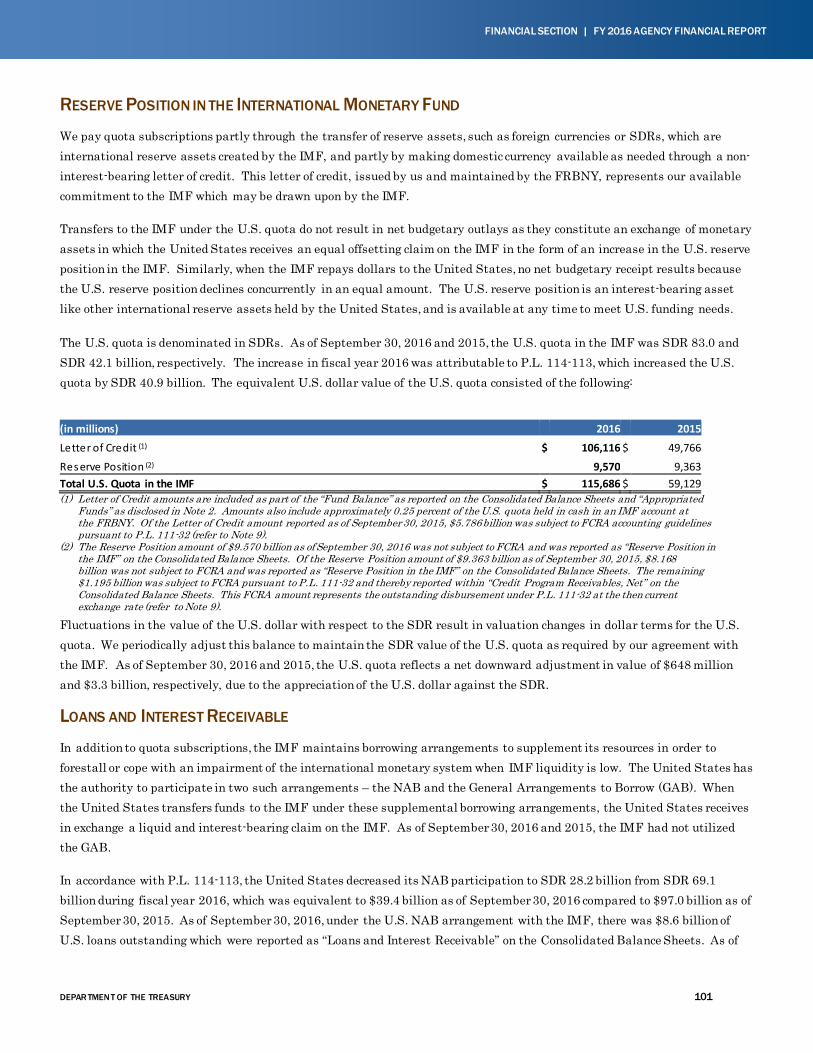
DEPAR TMEN T OF THE TREASURY 101
FINANCIAL SECTION | FY 2016 AGENCY FINANCIAL REPORT
RESERVE POSITION IN THE INTERNATIONAL MONETARY FUND
We pay quota subscriptions partly through the transfer of reserve assets, such as foreign currencies or SDRs, which are international reserve assets created by the IMF, and partly by making domestic currency available as needed through a non-interest-bearing letter of credit. This letter of credit, issued by us and maintained by the FRBNY, represents our available commitment to the IMF which may be drawn upon by the IMF.
Transfers to the IMF under the U.S. quota do not result in net budgetary outlays as they constitute an exchange of monetary assets in which the United States receives an equal offsetting claim on the IMF in the form of an increase in the U.S. reserve position in the IMF. Similarly, when the IMF repays dollars to the United States, no net budgetary receipt results because the U.S. reserve position declines concurrently in an equal amount. The U.S. reserve position is an interest-bearing asset like other international reserve assets held by the United States, and is available at any time to meet U.S. funding needs.
The U.S. quota is denominated in SDRs. As of September 30, 2016 and 2015, the U.S. quota in the IMF was SDR 83.0 and SDR 42.1 billion, respectively. The increase in fiscal year 2016 was attributable to P.L. 114-113, which increased the U.S. quota by SDR 40.9 billion. The equivalent U.S. dollar value of the U.S. quota consisted of the following:
(in millions) 2016 2015
Letter of Credit (1) $ 106,116 $ 49,766
Reserve Position (2) 9,570 9,363 Total U.S. Quota in the IMF $ 115,686 $ 59,129 (1) Letter of Credit amounts are included as part of the “Fund Balance” as reported on the Consolidated Balance Sheets and “Appropriated
Funds” as disclosed in Note 2. Amounts also include approximately 0.25 percent of the U.S. quota held in cash in an IMF account at the FRBNY. Of the Letter of Credit amount reported as of September 30, 2015, $5.786 billion was subject to FCRA accounting guidelines pursuant to P.L. 111-32 (refer to Note 9).
(2) The Reserve Position amount of $9.570 billion as of September 30, 2016 was not subject to FCRA and was reported as “Reserve Position in the IMF” on the Consolidated Balance Sheets. Of the Reserve Position amount of $9.363 billion as of September 30, 2015, $8.168 billion was not subject to FCRA and was reported as “Reserve Position in the IMF” on the Consolidated Balance Sheets. The remaining $1.195 billion was subject to FCRA pursuant to P.L. 111-32 and thereby reported within “Credit Program Receivables, Net” on the Consolidated Balance Sheets. This FCRA amount represents the outstanding disbursement under P.L. 111-32 at the then current exchange rate (refer to Note 9).
Fluctuations in the value of the U.S. dollar with respect to the SDR result in valuation changes in dollar terms for the U.S. quota. We periodically adjust this balance to maintain the SDR value of the U.S. quota as required by our agreement with the IMF. As of September 30, 2016 and 2015, the U.S. quota reflects a net downward adjustment in value of $648 million and $3.3 billion, respectively, due to the appreciation of the U.S. dollar against the SDR.
LOANS AND INTEREST RECEIVABLE
In addition to quota subscriptions, the IMF maintains borrowing arrangements to supplement its resources in order to forestall or cope with an impairment of the international monetary system when IMF liquidity is low. The United States has the authority to participate in two such arrangements – the NAB and the General Arrangements to Borrow (GAB). When the United States transfers funds to the IMF under these supplemental borrowing arrangements, the United States receives in exchange a liquid and interest-bearing claim on the IMF. As of September 30, 2016 and 2015, the IMF had not utilized the GAB.
In accordance with P.L. 114-113, the United States decreased its NAB participation to SDR 28.2 billion from SDR 69.1 billion during fiscal year 2016, which was equivalent to $39.4 billion as of September 30, 2016 compared to $97.0 billion as of September 30, 2015. As of September 30, 2016, under the U.S. NAB arrangement with the IMF, there was $8.6 billion of U.S. loans outstanding which were reported as “Loans and Interest Receivable” on the Consolidated Balance Sheets. As of
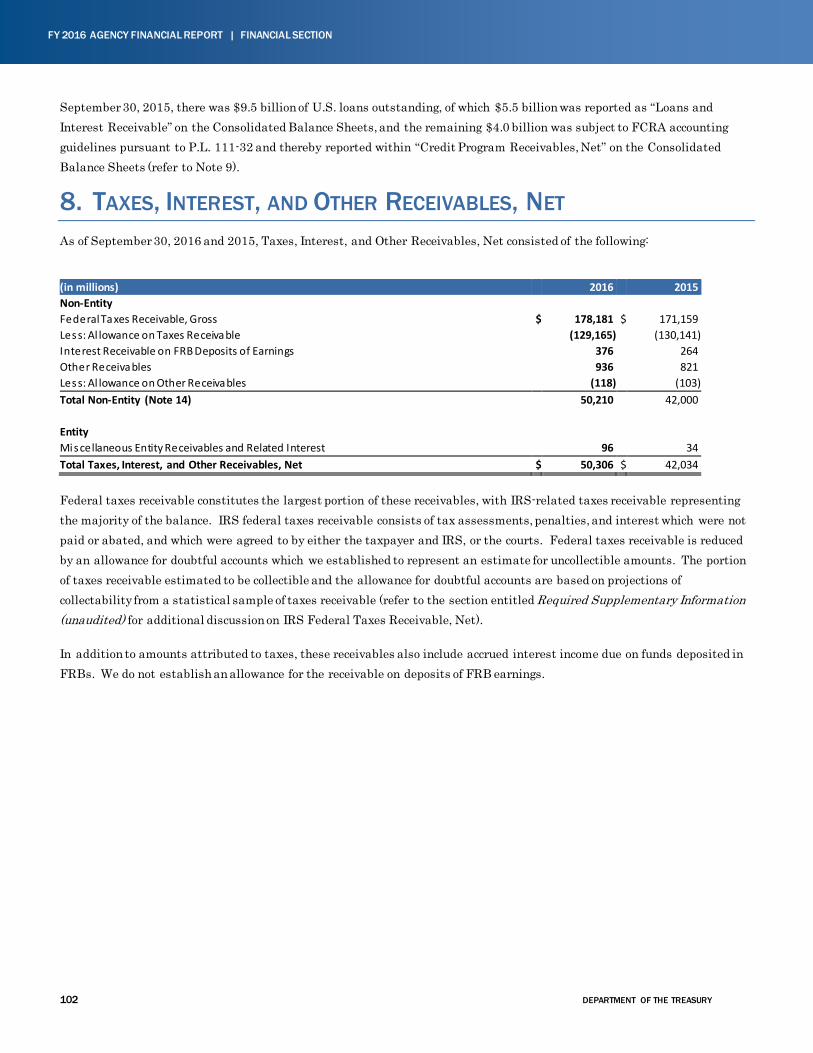
102 DEPARTMENT OF THE TREASURY
FY 2016 AGENCY FINANCIAL REPORT | FINANCIAL SECTION
September 30, 2015, there was $9.5 billion of U.S. loans outstanding, of which $5.5 billion was reported as “Loans and Interest Receivable” on the Consolidated Balance Sheets, and the remaining $4.0 billion was subject to FCRA accounting guidelines pursuant to P.L. 111-32 and thereby reported within “Credit Program Receivables, Net” on the Consolidated Balance Sheets (refer to Note 9).
8. TAXES, INTEREST, AND OTHER RECEIVABLES, NET As of September 30, 2016 and 2015, Taxes, Interest, and Other Receivables, Net consisted of the following:
(in millions) 2016 2015 Non-Entity Federal Taxes Receivable, Gross $ 178,181 $ 171,159 Less: Al lowance on Taxes Receivable (129,165) (130,141) Interest Receivable on FRB Deposits of Earnings 376 264 Other Receivables 936 821 Less: Al lowance on Other Receivables (118) (103) Total Non-Entity (Note 14) 50,210 42,000 Entity Miscellaneous Entity Receivables and Related Interest 96 34 Total Taxes, Interest, and Other Receivables, Net $ 50,306 $ 42,034
Federal taxes receivable constitutes the largest portion of these receivables, with IRS-related taxes receivable representing the majority of the balance. IRS federal taxes receivable consists of tax assessments, penalties, and interest which were not paid or abated, and which were agreed to by either the taxpayer and IRS, or the courts. Federal taxes receivable is reduced by an allowance for doubtful accounts which we established to represent an estimate for uncollectible amounts. The portion of taxes receivable estimated to be collectible and the allowance for doubtful accounts are based on projections of collectability from a statistical sample of taxes receivable (refer to the section entitled Required Supplementary Information (unaudited) for additional discussion on IRS Federal Taxes Receivable, Net).
In addition to amounts attributed to taxes, these receivables also include accrued interest income due on funds deposited in FRBs. We do not establish an allowance for the receivable on deposits of FRB earnings.
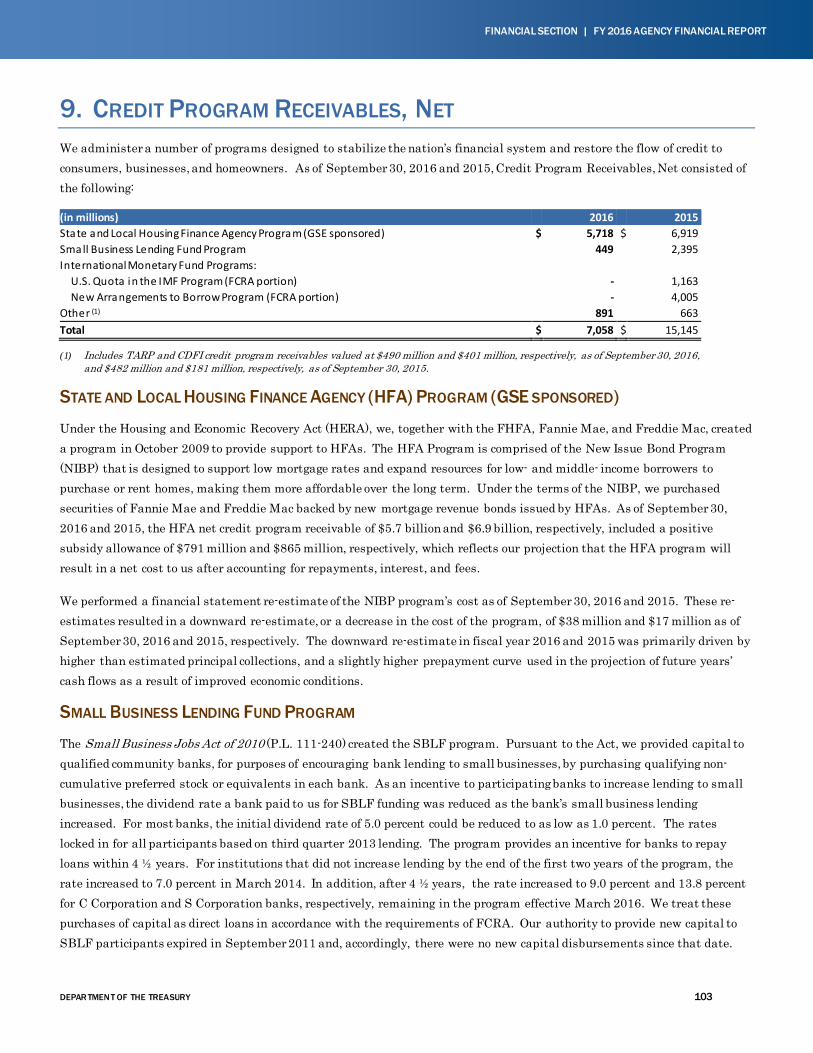
DEPAR TMEN T OF THE TREASURY 103
FINANCIAL SECTION | FY 2016 AGENCY FINANCIAL REPORT
9. CREDIT PROGRAM RECEIVABLES, NET We administer a number of programs designed to stabilize the nation’s financial system and restore the flow of credit to consumers, businesses, and homeowners. As of September 30, 2016 and 2015, Credit Program Receivables, Net consisted of the following:
(in millions) 2016 2015 State and Local Housing Finance Agency Program (GSE sponsored) $ 5,718 $ 6,919 Small Business Lending Fund Program 449 2,395 International Monetary Fund Programs:
U.S. Quota in the IMF Program (FCRA portion) - 1,163 New Arrangements to Borrow Program (FCRA portion) - 4,005 Other (1) 891 663 Total $ 7,058 $ 15,145
(1) Includes TARP and CDFI credit program receivables valued at $490 million and $401 million, respectively, as of September 30, 2016, and $482 million and $181 million, respectively, as of September 30, 2015.
STATE AND LOCAL HOUSING FINANCE AGENCY (HFA) PROGRAM (GSE SPONSORED)
Under the Housing and Economic Recovery Act (HERA), we, together with the FHFA, Fannie Mae, and Freddie Mac, created a program in October 2009 to provide support to HFAs. The HFA Program is comprised of the New Issue Bond Program (NIBP) that is designed to support low mortgage rates and expand resources for low- and middle- income borrowers to purchase or rent homes, making them more affordable over the long term. Under the terms of the NIBP, we purchased securities of Fannie Mae and Freddie Mac backed by new mortgage revenue bonds issued by HFAs. As of September 30, 2016 and 2015, the HFA net credit program receivable of $5.7 billion and $6.9 billion, respectively, included a positive subsidy allowance of $791 million and $865 million, respectively, which reflects our projection that the HFA program will result in a net cost to us after accounting for repayments, interest, and fees.
We performed a financial statement re-estimate of the NIBP program’s cost as of September 30, 2016 and 2015. These re-estimates resulted in a downward re-estimate, or a decrease in the cost of the program, of $38 million and $17 million as of September 30, 2016 and 2015, respectively. The downward re-estimate in fiscal year 2016 and 2015 was primarily driven by higher than estimated principal collections, and a slightly higher prepayment curve used in the projection of future years’ cash flows as a result of improved economic conditions.
SMALL BUSINESS LENDING FUND PROGRAM
The Small Business Jobs Act of 2010 (P.L. 111-240) created the SBLF program. Pursuant to the Act, we provided capital to qualified community banks, for purposes of encouraging bank lending to small businesses, by purchasing qualifying non-cumulative preferred stock or equivalents in each bank. As an incentive to participating banks to increase lending to small businesses, the dividend rate a bank paid to us for SBLF funding was reduced as the bank’s small business lending increased. For most banks, the initial dividend rate of 5.0 percent could be reduced to as low as 1.0 percent. The rates locked in for all participants based on third quarter 2013 lending. The program provides an incentive for banks to repay loans within 4 ½ years. For institutions that did not increase lending by the end of the first two years of the program, the rate increased to 7.0 percent in March 2014. In addition, after 4 ½ years, the rate increased to 9.0 percent and 13.8 percent for C Corporation and S Corporation banks, respectively, remaining in the program effective March 2016. We treat these purchases of capital as direct loans in accordance with the requirements of FCRA. Our authority to provide new capital to SBLF participants expired in September 2011 and, accordingly, there were no new capital disbursements since that date.
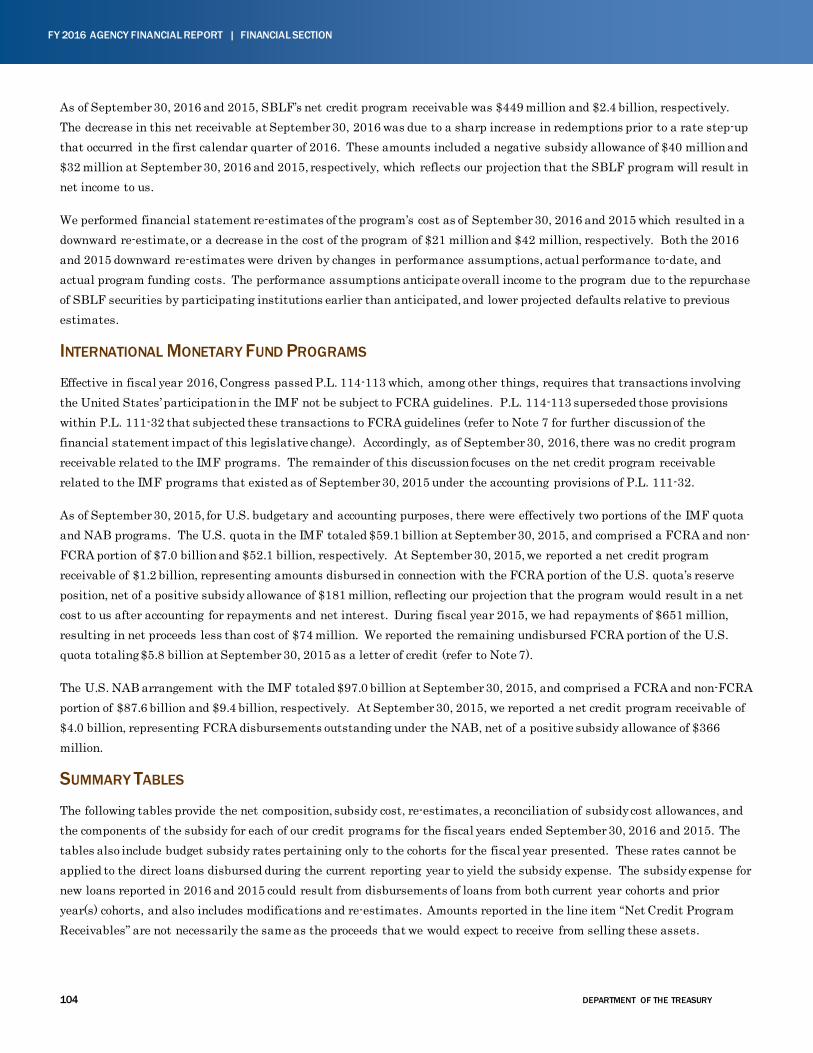
104 DEPARTMENT OF THE TREASURY
FY 2016 AGENCY FINANCIAL REPORT | FINANCIAL SECTION
As of September 30, 2016 and 2015, SBLF’s net credit program receivable was $449 million and $2.4 billion, respectively. The decrease in this net receivable at September 30, 2016 was due to a sharp increase in redemptions prior to a rate step-up that occurred in the first calendar quarter of 2016. These amounts included a negative subsidy allowance of $40 million and $32 million at September 30, 2016 and 2015, respectively, which reflects our projection that the SBLF program will result in net income to us.
We performed financial statement re-estimates of the program’s cost as of September 30, 2016 and 2015 which resulted in a downward re-estimate, or a decrease in the cost of the program of $21 million and $42 million, respectively. Both the 2016 and 2015 downward re-estimates were driven by changes in performance assumptions, actual performance to-date, and actual program funding costs. The performance assumptions anticipate overall income to the program due to the repurchase of SBLF securities by participating institutions earlier than anticipated, and lower projected defaults relative to previous estimates.
INTERNATIONAL MONETARY FUND PROGRAMS
Effective in fiscal year 2016, Congress passed P.L. 114-113 which, among other things, requires that transactions involving the United States’ participation in the IMF not be subject to FCRA guidelines. P.L. 114-113 superseded those provisions within P.L. 111-32 that subjected these transactions to FCRA guidelines (refer to Note 7 for further discussion of the financial statement impact of this legislative change). Accordingly, as of September 30, 2016, there was no credit program receivable related to the IMF programs. The remainder of this discussion focuses on the net credit program receivable related to the IMF programs that existed as of September 30, 2015 under the accounting provisions of P.L. 111-32.
As of September 30, 2015, for U.S. budgetary and accounting purposes, there were effectively two portions of the IMF quota and NAB programs. The U.S. quota in the IMF totaled $59.1 billion at September 30, 2015, and comprised a FCRA and non-FCRA portion of $7.0 billion and $52.1 billion, respectively. At September 30, 2015, we reported a net credit program receivable of $1.2 billion, representing amounts disbursed in connection with the FCRA portion of the U.S. quota’s reserve position, net of a positive subsidy allowance of $181 million, reflecting our projection that the program would result in a net cost to us after accounting for repayments and net interest. During fiscal year 2015, we had repayments of $651 million, resulting in net proceeds less than cost of $74 million. We reported the remaining undisbursed FCRA portion of the U.S. quota totaling $5.8 billion at September 30, 2015 as a letter of credit (refer to Note 7).
The U.S. NAB arrangement with the IMF totaled $97.0 billion at September 30, 2015, and comprised a FCRA and non-FCRA portion of $87.6 billion and $9.4 billion, respectively. At September 30, 2015, we reported a net credit program receivable of $4.0 billion, representing FCRA disbursements outstanding under the NAB, net of a positive subsidy allowance of $366 million.
SUMMARY TABLES
The following tables provide the net composition, subsidy cost, re-estimates, a reconciliation of subsidy cost allowances, and the components of the subsidy for each of our credit programs for the fiscal years ended September 30, 2016 and 2015. The tables also include budget subsidy rates pertaining only to the cohorts for the fiscal year presented. These rates cannot be applied to the direct loans disbursed during the current reporting year to yield the subsidy expense. The subsidy expense for new loans reported in 2016 and 2015 could result from disbursements of loans from both current year cohorts and prior year(s) cohorts, and also includes modifications and re-estimates. Amounts reported in the line item “Net Credit Program Receivables” are not necessarily the same as the proceeds that we would expect to receive from selling these assets.
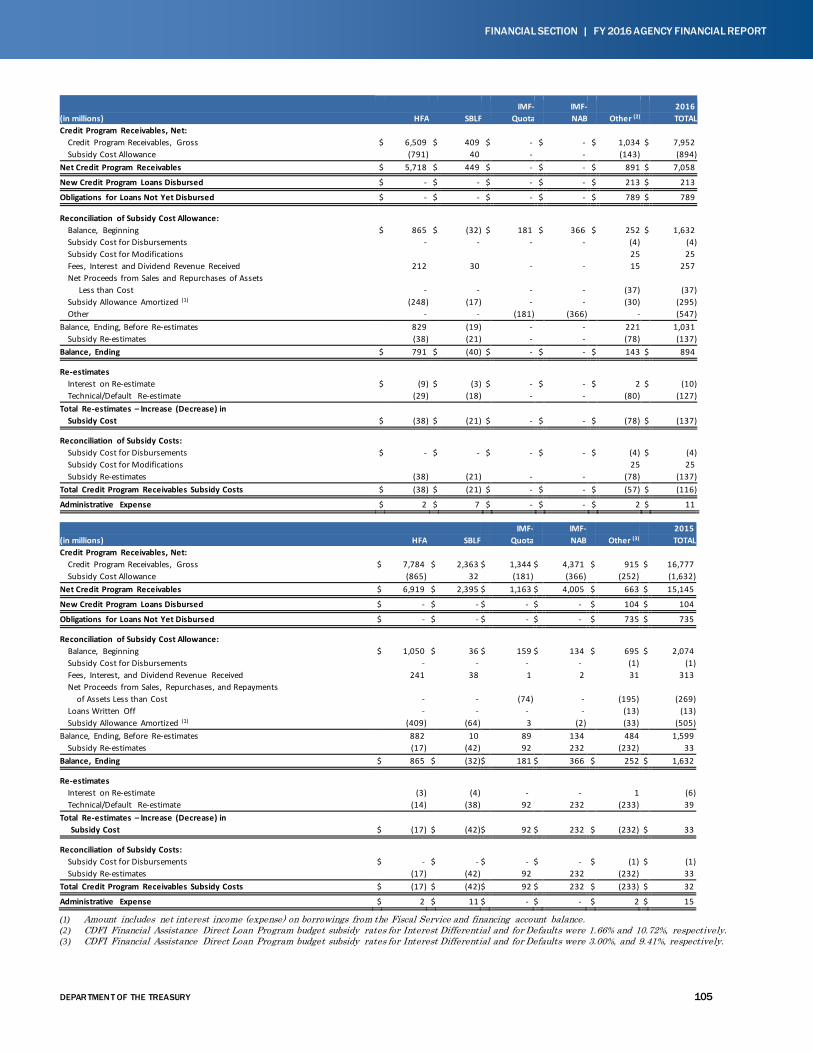
DEPAR TMEN T OF THE TREASURY 105
FINANCIAL SECTION | FY 2016 AGENCY FINANCIAL REPORT
IMF- IMF- 2016
(in millions) HFA SBLF Quota NAB Other (2) TOTAL
Credit Program Receivables, Net:
Credit Program Receivables, Gross $ 6,509 $ 409 $ - $ - $ 1,034 $ 7,952 Subsidy Cost Allowance (791) 40 - - (143) (894) Net Credit Program Receivables $ 5,718 $ 449 $ - $ - $ 891 $ 7,058
New Credit Program Loans Disbursed $ - $ - $ - $ - $ 213 $ 213
Obligations for Loans Not Yet Disbursed $ - $ - $ - $ - $ 789 $ 789
Reconciliation of Subsidy Cost Allowance:
Balance, Beginning $ 865 $ (32) $ 181 $ 366 $ 252 $ 1,632 Subsidy Cost for Disbursements - - - - (4) (4)
Subsidy Cost for Modifications 25 25
Fees, Interest and Dividend Revenue Received 212 30 - - 15 257 Net Proceeds from Sales and Repurchases of Assets
Less than Cost - - - - (37) (37)
Subsidy Allowance Amortized (1) (248) (17) - - (30) (295)
Other - - (181) (366) - (547)
Balance, Ending, Before Re-estimates 829 (19) - - 221 1,031
Subsidy Re-estimates (38) (21) - - (78) (137) Balance, Ending $ 791 $ (40) $ - $ - $ 143 $ 894
Re-estimates
Interest on Re-estimate $ (9) $ (3) $ - $ - $ 2 $ (10) Technical/Default Re-estimate (29) (18) - - (80) (127)
Total Re-estimates – Increase (Decrease) in
Subsidy Cost $ (38) $ (21) $ - $ - $ (78) $ (137)
Reconciliation of Subsidy Costs:
Subsidy Cost for Disbursements $ - $ - $ - $ - $ (4) $ (4) Subsidy Cost for Modifications 25 25
Subsidy Re-estimates (38) (21) - - (78) (137) Total Credit Program Receivables Subsidy Costs $ (38) $ (21) $ - $ - $ (57) $ (116)
Administrative Expense $ 2 $ 7 $ - $ - $ 2 $ 11
IMF- IMF- 2015
(in millions) HFA SBLF Quota NAB Other (3) TOTAL
Credit Program Receivables, Net:
Credit Program Receivables, Gross $ 7,784 $ 2,363 $ 1,344 $ 4,371 $ 915 $ 16,777 Subsidy Cost Allowance (865) 32 (181) (366) (252) (1,632) Net Credit Program Receivables $ 6,919 $ 2,395 $ 1,163 $ 4,005 $ 663 $ 15,145
New Credit Program Loans Disbursed $ - $ - $ - $ - $ 104 $ 104
Obligations for Loans Not Yet Disbursed $ - $ - $ - $ - $ 735 $ 735
Reconciliation of Subsidy Cost Allowance:
Balance, Beginning $ 1,050 $ 36 $ 159 $ 134 $ 695 $ 2,074 Subsidy Cost for Disbursements - - - - (1) (1)
Fees, Interest, and Dividend Revenue Received 241 38 1 2 31 313
Net Proceeds from Sales, Repurchases, and Repayments
of Assets Less than Cost - - (74) - (195) (269)
Loans Written Off - - - - (13) (13) Subsidy Allowance Amortized (1) (409) (64) 3 (2) (33) (505)
Balance, Ending, Before Re-estimates 882 10 89 134 484 1,599
Subsidy Re-estimates (17) (42) 92 232 (232) 33 Balance, Ending $ 865 $ (32) $ 181 $ 366 $ 252 $ 1,632
Re-estimates
Interest on Re-estimate (3) (4) - - 1 (6)
Technical/Default Re-estimate (14) (38) 92 232 (233) 39
Total Re-estimates – Increase (Decrease) in
Subsidy Cost $ (17) $ (42) $ 92 $ 232 $ (232) $ 33
Reconciliation of Subsidy Costs:
Subsidy Cost for Disbursements $ - $ - $ - $ - $ (1) $ (1) Subsidy Re-estimates (17) (42) 92 232 (232) 33 Total Credit Program Receivables Subsidy Costs $ (17) $ (42) $ 92 $ 232 $ (233) $ 32
Administrative Expense $ 2 $ 11 $ - $ - $ 2 $ 15
(1) Amount includes net interest income (expense) on borrowings from the Fiscal Service and financing account balance. (2) CDFI Financial Assistance Direct Loan Program budget subsidy rates for Interest Differential and for Defaults were 1.66% and 10.72%, respectively. (3) CDFI Financial Assistance Direct Loan Program budget subsidy rates for Interest Differential and for Defaults were 3.00%, and 9.41%, respectively.
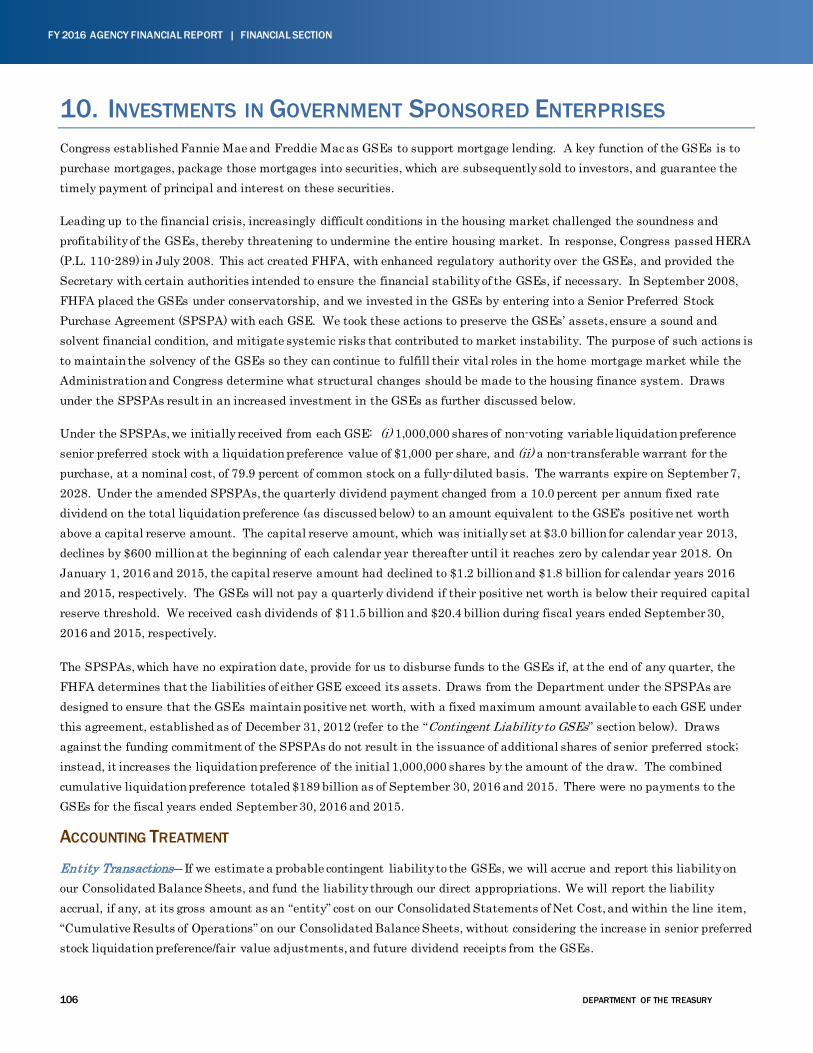
106 DEPARTMENT OF THE TREASURY
FY 2016 AGENCY FINANCIAL REPORT | FINANCIAL SECTION
10. INVESTMENTS IN GOVERNMENT SPONSORED ENTERPRISES Congress established Fannie Mae and Freddie Mac as GSEs to support mortgage lending. A key function of the GSEs is to purchase mortgages, package those mortgages into securities, which are subsequently sold to investors, and guarantee the timely payment of principal and interest on these securities.
Leading up to the financial crisis, increasingly difficult conditions in the housing market challenged the soundness and profitability of the GSEs, thereby threatening to undermine the entire housing market. In response, Congress passed HERA (P.L. 110-289) in July 2008. This act created FHFA, with enhanced regulatory authority over the GSEs, and provided the Secretary with certain authorities intended to ensure the financial stability of the GSEs, if necessary. In September 2008, FHFA placed the GSEs under conservatorship, and we invested in the GSEs by entering into a Senior Preferred Stock Purchase Agreement (SPSPA) with each GSE. We took these actions to preserve the GSEs’ assets, ensure a sound and solvent financial condition, and mitigate systemic risks that contributed to market instability. The purpose of such actions is to maintain the solvency of the GSEs so they can continue to fulfill their vital roles in the home mortgage market while the Administration and Congress determine what structural changes should be made to the housing finance system. Draws under the SPSPAs result in an increased investment in the GSEs as further discussed below.
Under the SPSPAs, we initially received from each GSE: (i) 1,000,000 shares of non-voting variable liquidation preference senior preferred stock with a liquidation preference value of $1,000 per share, and (ii) a non-transferable warrant for the purchase, at a nominal cost, of 79.9 percent of common stock on a fully-diluted basis. The warrants expire on September 7, 2028. Under the amended SPSPAs, the quarterly dividend payment changed from a 10.0 percent per annum fixed rate dividend on the total liquidation preference (as discussed below) to an amount equivalent to the GSE’s positive net worth above a capital reserve amount. The capital reserve amount, which was initially set at $3.0 billion for calendar year 2013, declines by $600 million at the beginning of each calendar year thereafter until it reaches zero by calendar year 2018. On January 1, 2016 and 2015, the capital reserve amount had declined to $1.2 billion and $1.8 billion for calendar years 2016 and 2015, respectively. The GSEs will not pay a quarterly dividend if their positive net worth is below their required capital reserve threshold. We received cash dividends of $11.5 billion and $20.4 billion during fiscal years ended September 30, 2016 and 2015, respectively.
The SPSPAs, which have no expiration date, provide for us to disburse funds to the GSEs if, at the end of any quarter, the FHFA determines that the liabilities of either GSE exceed its assets. Draws from the Department under the SPSPAs are designed to ensure that the GSEs maintain positive net worth, with a fixed maximum amount available to each GSE under this agreement, established as of December 31, 2012 (refer to the “Contingent Liability to GSEs” section below). Draws against the funding commitment of the SPSPAs do not result in the issuance of additional shares of senior preferred stock; instead, it increases the liquidation preference of the initial 1,000,000 shares by the amount of the draw. The combined cumulative liquidation preference totaled $189 billion as of September 30, 2016 and 2015. There were no payments to the GSEs for the fiscal years ended September 30, 2016 and 2015.
ACCOUNTING TREATMENT
Entity Transactions― If we estimate a probable contingent liability to the GSEs, we will accrue and report this liability on our Consolidated Balance Sheets, and fund the liability through our direct appropriations. We will report the liability accrual, if any, at its gross amount as an “entity” cost on our Consolidated Statements of Net Cost, and within the line item, “Cumulative Results of Operations” on our Consolidated Balance Sheets, without considering the increase in senior preferred stock liquidation preference/fair value adjustments, and future dividend receipts from the GSEs.
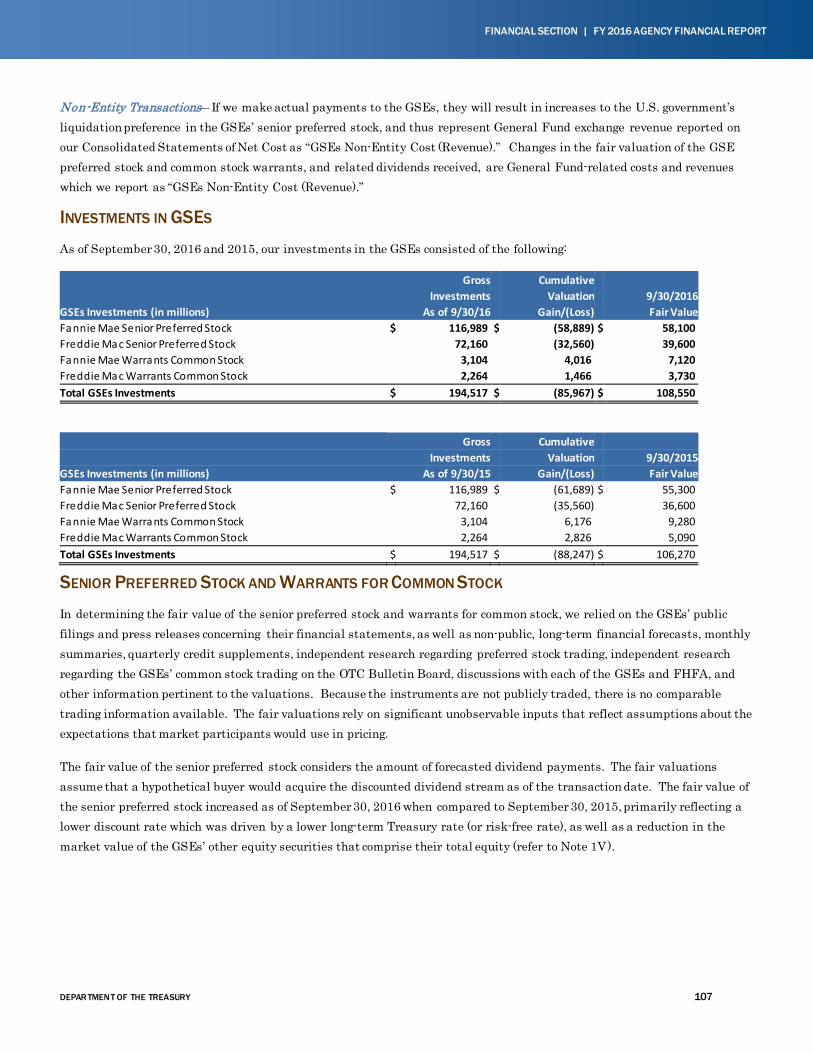
DEPAR TMEN T OF THE TREASURY 107
FINANCIAL SECTION | FY 2016 AGENCY FINANCIAL REPORT
Non-Entity Transactions― If we make actual payments to the GSEs, they will result in increases to the U.S. government’s liquidation preference in the GSEs’ senior preferred stock, and thus represent General Fund exchange revenue reported on our Consolidated Statements of Net Cost as “GSEs Non-Entity Cost (Revenue).” Changes in the fair valuation of the GSE preferred stock and common stock warrants, and related dividends received, are General Fund-related costs and revenues which we report as “GSEs Non-Entity Cost (Revenue).”
INVESTMENTS IN GSES
As of September 30, 2016 and 2015, our investments in the GSEs consisted of the following:
Gross Cumulative Investments Valuation 9/30/2016 GSEs Investments (in millions) As of 9/30/16 Gain/(Loss) Fair Value Fannie Mae Senior Preferred Stock $ 116,989 $ (58,889) $ 58,100 Freddie Mac Senior Preferred Stock 72,160 (32,560) 39,600 Fannie Mae Warrants Common Stock 3,104 4,016 7,120 Freddie Mac Warrants Common Stock 2,264 1,466 3,730 Total GSEs Investments $ 194,517 $ (85,967) $ 108,550 Gross Cumulative Investments Valuation 9/30/2015 GSEs Investments (in millions) As of 9/30/15 Gain/(Loss) Fair Value Fannie Mae Senior Preferred Stock $ 116,989 $ (61,689) $ 55,300 Freddie Mac Senior Preferred Stock 72,160 (35,560) 36,600 Fannie Mae Warrants Common Stock 3,104 6,176 9,280 Freddie Mac Warrants Common Stock 2,264 2,826 5,090 Total GSEs Investments $ 194,517 $ (88,247) $ 106,270
SENIOR PREFERRED STOCK AND WARRANTS FOR COMMON STOCK
In determining the fair value of the senior preferred stock and warrants for common stock, we relied on the GSEs’ public filings and press releases concerning their financial statements, as well as non-public, long-term financial forecasts, monthly summaries, quarterly credit supplements, independent research regarding preferred stock trading, independent research regarding the GSEs’ common stock trading on the OTC Bulletin Board, discussions with each of the GSEs and FHFA, and other information pertinent to the valuations. Because the instruments are not publicly traded, there is no comparable trading information available. The fair valuations rely on significant unobservable inputs that reflect assumptions about the expectations that market participants would use in pricing.
The fair value of the senior preferred stock considers the amount of forecasted dividend payments. The fair valuations assume that a hypothetical buyer would acquire the discounted dividend stream as of the transaction date. The fair value of the senior preferred stock increased as of September 30, 2016 when compared to September 30, 2015, primarily reflecting a lower discount rate which was driven by a lower long-term Treasury rate (or risk-free rate), as well as a reduction in the market value of the GSEs’ other equity securities that comprise their total equity (refer to Note 1V).
108 DEPARTMENT OF THE TREASURY
FY 2016 AGENCY FINANCIAL REPORT | FINANCIAL SECTION
Factors impacting the fair value of the warrants include the nominal exercise price and the large number of potential exercise shares, the market trading of the common stock that underlies the warrants as of September 30, the principal market, and the market participants. Other factors impacting the fair value include, among other things, the holding period risk related directly to the assumption of the amount of time that it will take to sell the exercised shares without depressing the market. The fair value of the warrants decreased at the end of fiscal year 2016, when compared to 2015, primarily due to decreases in the market price of the underlying common stock of each GSE.
CONTINGENT LIABILITY TO GSES
As part of the annual process undertaken by the Department, we prepare a series of long-term financial forecasts to assess, as of September 30, the likelihood and magnitude of future draws to be required by the GSEs under the SPSPAs within the forecast time horizon. We used 25-year financial forecasts prepared through years 2041 and 2040 in assessing if a contingent liability was required as of September 30, 2016 and 2015, respectively. If future payments under the SPSPAs are deemed to be probable within the forecast horizon, we will estimate and accrue a contingent liability to the GSEs to reflect the forecasted equity deficits of the GSEs. We will not discount this accrued contingent liability, nor will we take into account any of the offsetting dividends that we could receive, as the dividends, if any, would be owed directly to the General Fund. We will adjust such recorded accruals in subsequent years as new information develops or circumstances change.
Based on our annual assessment, we estimated there was no probable future funding draws as of September 30, 2016 and 2015, and thereby accrued no contingent liability. However, as of September 30, 2016, it is reasonably possible that volatility in interest rates and fair value losses could potentially cause the GSEs to generate quarterly losses and, therefore, result in future funding draws against our funding commitment. Due to challenges quantifying future volatility in interest rates and fair value losses, we could not estimate the total amount of this reasonably possible future funding liability as of September 30, 2016. At September 30, 2016 and 2015, the maximum remaining contractual commitment to the GSEs for the remaining life of the SPSPAs was $258.1 billion.
In assessing the need for an estimated contingent liability, we rely on the GSEs’ public filings and press releases concerning their financial statements, monthly summaries, and quarterly credit supplements, as well as non-public, long-term financial forecasts, the FHFA House Price Index, discussions with each of the GSEs and FHFA, and other information pertinent to the liability estimates. The forecasts prepared in assessing the need for an estimated contingent liability as of September 30, 2016 include three potential wind-down scenarios, with varying assumptions regarding the timing as to when the GSEs would cease issuing new guaranteed mortgage-backed securities. The forecasts also assume a continued gradual wind-down of the retained portfolios (and corresponding net interest income) through 2018, as directed under the amended SPSPAs for each GSE to reduce the maximum balance of its retained mortgage portfolio by 15.0 percent per annum beginning December 31, 2013. The maximum balance of the GSEs’ retained mortgage portfolio was initially set at $650 billion as of December 31, 2012, and the amended SPSPAs requires that we reduce this maximum balance to $250 billion by December 31, 2018.
ESTIMATION FACTORS
Our forecasts concerning the GSEs may differ from actual experience. Estimated senior preferred values and future draw amounts will depend on numerous factors that are difficult to predict including, but not limited to, changes in government policy with respect to the GSEs, the business cycle, inflation, home prices, unemployment rates, interest rates, changes in housing preferences, home financing alternatives, availability of debt financing, market rates of guarantee fees, outcomes of loan refinancings and modifications, new housing programs, and other applicable factors.
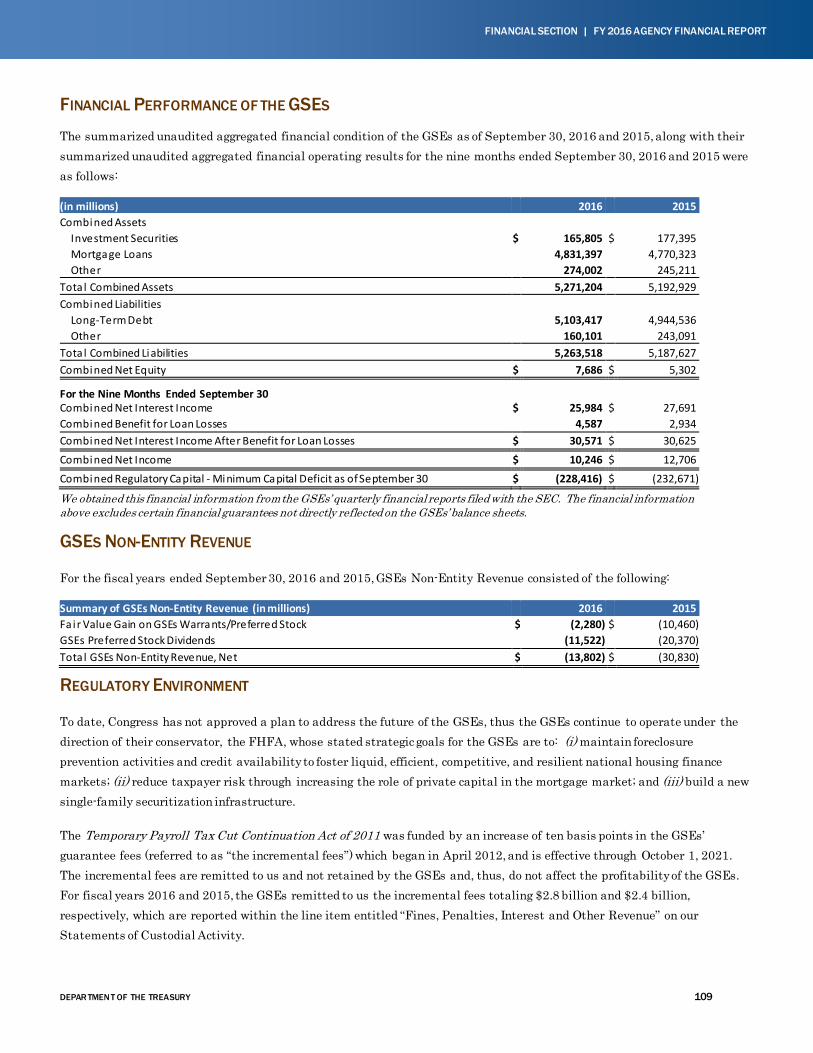
DEPAR TMEN T OF THE TREASURY 109
FINANCIAL SECTION | FY 2016 AGENCY FINANCIAL REPORT
FINANCIAL PERFORMANCE OF THE GSES
The summarized unaudited aggregated financial condition of the GSEs as of September 30, 2016 and 2015, along with their summarized unaudited aggregated financial operating results for the nine months ended September 30, 2016 and 2015 were as follows:
(in millions) 2016 2015 Combined Assets Investment Securities $ 165,805 $ 177,395 Mortgage Loans 4,831,397 4,770,323 Other 274,002 245,211 Tota l Combined Assets 5,271,204 5,192,929 Combined Liabilities Long-Term Debt 5,103,417 4,944,536 Other 160,101 243,091 Tota l Combined Liabilities 5,263,518 5,187,627 Combined Net Equity $ 7,686 $ 5,302
For the Nine Months Ended September 30 Combined Net Interest Income $ 25,984 $ 27,691 Combined Benefit for Loan Losses 4,587 2,934 Combined Net Interest Income After Benefit for Loan Losses $ 30,571 $ 30,625
Combined Net Income $ 10,246 $ 12,706
Combined Regulatory Capital - Minimum Capital Deficit as of September 30 $ (228,416) $ (232,671)
We obtained this financial information from the GSEs’ quarterly financial reports filed with the SEC. The financial information above excludes certain financial guarantees not directly reflected on the GSEs’ balance sheets.
GSES NON-ENTITY REVENUE
For the fiscal years ended September 30, 2016 and 2015, GSEs Non-Entity Revenue consisted of the following:
Summary of GSEs Non-Entity Revenue (in millions) 2016 2015 Fair Value Gain on GSEs Warrants/Preferred Stock $ (2,280) $ (10,460) GSEs Preferred Stock Dividends (11,522) (20,370) Tota l GSEs Non-Entity Revenue, Net $ (13,802) $ (30,830)
REGULATORY ENVIRONMENT
To date, Congress has not approved a plan to address the future of the GSEs, thus the GSEs continue to operate under the direction of their conservator, the FHFA, whose stated strategic goals for the GSEs are to: (i) maintain foreclosure prevention activities and credit availability to foster liquid, efficient, competitive, and resilient national housing finance markets; (ii) reduce taxpayer risk through increasing the role of private capital in the mortgage market; and (iii) build a new single-family securitization infrastructure.
The Temporary Payroll Tax Cut Continuation Act of 2011 was funded by an increase of ten basis points in the GSEs’ guarantee fees (referred to as “the incremental fees”) which began in April 2012, and is effective through October 1, 2021. The incremental fees are remitted to us and not retained by the GSEs and, thus, do not affect the profitability of the GSEs. For fiscal years 2016 and 2015, the GSEs remitted to us the incremental fees totaling $2.8 billion and $2.4 billion, respectively, which are reported within the line item entitled “Fines, Penalties, Interest and Other Revenue” on our Statements of Custodial Activity.
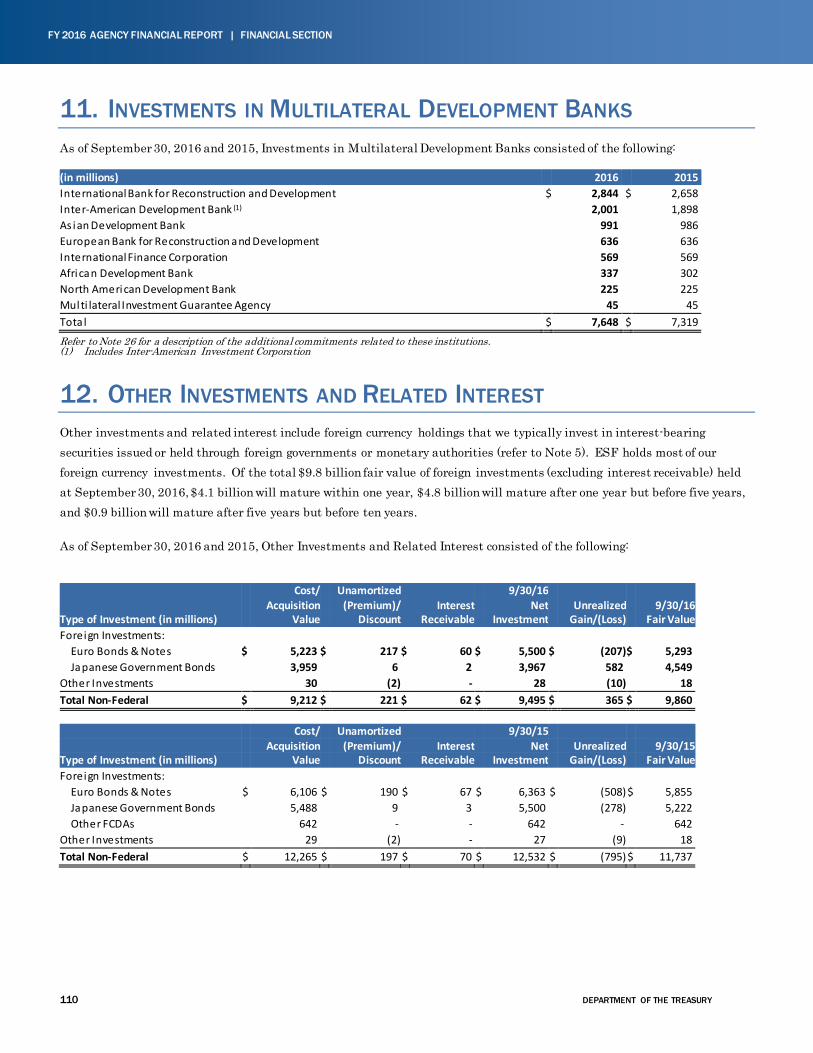
110 DEPARTMENT OF THE TREASURY
FY 2016 AGENCY FINANCIAL REPORT | FINANCIAL SECTION
11. INVESTMENTS IN MULTILATERAL DEVELOPMENT BANKS As of September 30, 2016 and 2015, Investments in Multilateral Development Banks consisted of the following:
(in millions) 2016 2015 International Bank for Reconstruction and Development $ 2,844 $ 2,658 Inter-American Development Bank (1) 2,001 1,898 As ian Development Bank 991 986 European Bank for Reconstruction and Development 636 636 International Finance Corporation 569 569 African Development Bank 337 302 North American Development Bank 225 225 Multi lateral Investment Guarantee Agency 45 45 Tota l $ 7,648 $ 7,319
Refer to Note 26 for a description of the additional commitments related to these institutions. (1) Includes Inter-American Investment Corporation
12. OTHER INVESTMENTS AND RELATED INTEREST Other investments and related interest include foreign currency holdings that we typically invest in interest-bearing securities issued or held through foreign governments or monetary authorities (refer to Note 5). ESF holds most of our foreign currency investments. Of the total $9.8 billion fair value of foreign investments (excluding interest receivable) held at September 30, 2016, $4.1 billion will mature within one year, $4.8 billion will mature after one year but before five years, and $0.9 billion will mature after five years but before ten years.
As of September 30, 2016 and 2015, Other Investments and Related Interest consisted of the following:
Cost/ Unamortized 9/30/16 Acquisition (Premium)/ Interest Net Unrealized 9/30/16 Type of Investment (in millions) Value Discount Receivable Investment Gain/(Loss) Fair Value Foreign Investments: Euro Bonds & Notes $ 5,223 $ 217 $ 60 $ 5,500 $ (207) $ 5,293 Japanese Government Bonds 3,959 6 2 3,967 582 4,549 Other Investments 30 (2) - 28 (10) 18 Total Non-Federal $ 9,212 $ 221 $ 62 $ 9,495 $ 365 $ 9,860
Cost/ Unamortized 9/30/15 Acquisition (Premium)/ Interest Net Unrealized 9/30/15 Type of Investment (in millions) Value Discount Receivable Investment Gain/(Loss) Fair Value Foreign Investments: Euro Bonds & Notes $ 6,106 $ 190 $ 67 $ 6,363 $ (508) $ 5,855 Japanese Government Bonds 5,488 9 3 5,500 (278) 5,222 Other FCDAs 642 - - 642 - 642 Other Investments 29 (2) - 27 (9) 18 Total Non-Federal $ 12,265 $ 197 $ 70 $ 12,532 $ (795) $ 11,737
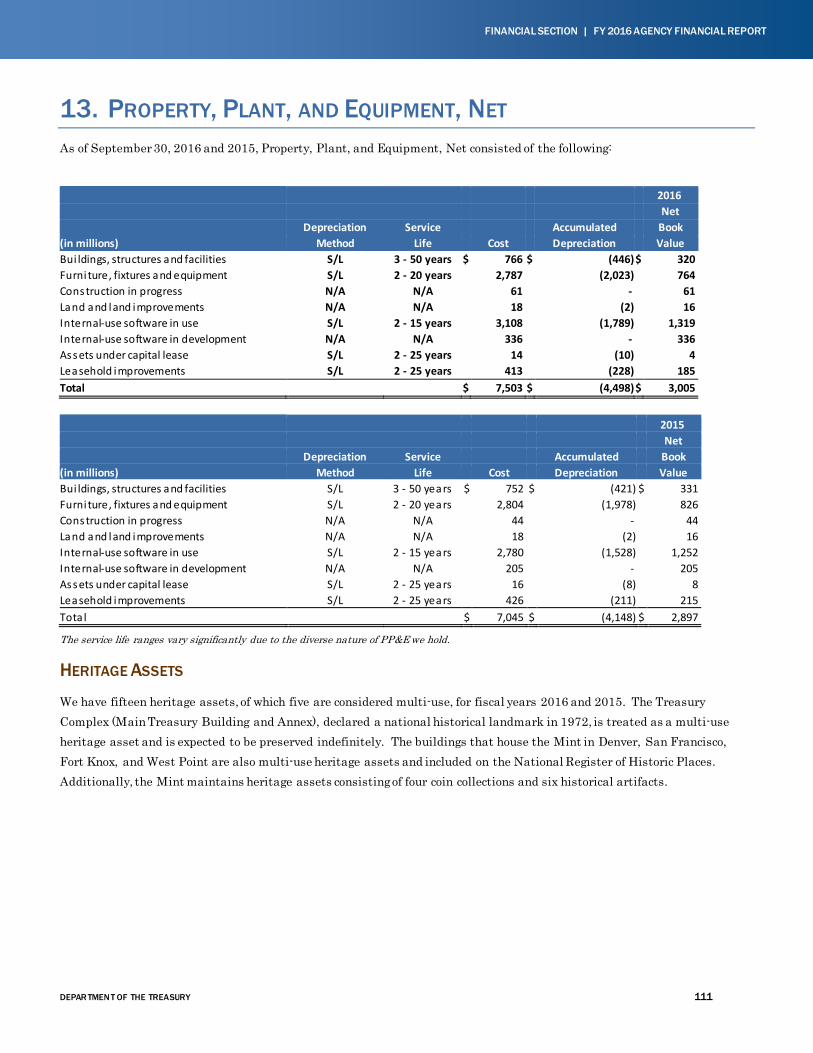
DEPAR TMEN T OF THE TREASURY 111
FINANCIAL SECTION | FY 2016 AGENCY FINANCIAL REPORT
13. PROPERTY, PLANT, AND EQUIPMENT, NET As of September 30, 2016 and 2015, Property, Plant, and Equipment, Net consisted of the following:
2016 Net Depreciation Service Accumulated Book (in millions) Method Life Cost Depreciation Value Bui ldings, structures and facilities S/L 3 - 50 years $ 766 $ (446) $ 320 Furni ture, fixtures and equipment S/L 2 - 20 years 2,787 (2,023) 764 Construction in progress N/A N/A 61 - 61 Land and land improvements N/A N/A 18 (2) 16 Internal-use software in use S/L 2 - 15 years 3,108 (1,789) 1,319 Internal-use software in development N/A N/A 336 - 336 Assets under capital lease S/L 2 - 25 years 14 (10) 4 Leasehold improvements S/L 2 - 25 years 413 (228) 185 Total $ 7,503 $ (4,498) $ 3,005
2015 Net Depreciation Service Accumulated Book (in millions) Method Life Cost Depreciation Value Bui ldings, structures and facilities S/L 3 - 50 years $ 752 $ (421) $ 331 Furni ture, fixtures and equipment S/L 2 - 20 years 2,804 (1,978) 826 Construction in progress N/A N/A 44 - 44 Land and land improvements N/A N/A 18 (2) 16 Internal-use software in use S/L 2 - 15 years 2,780 (1,528) 1,252 Internal-use software in development N/A N/A 205 - 205 Assets under capital lease S/L 2 - 25 years 16 (8) 8 Leasehold improvements S/L 2 - 25 years 426 (211) 215 Tota l $ 7,045 $ (4,148) $ 2,897
The service life ranges vary significantly due to the diverse nature of PP&E we hold.
HERITAGE ASSETS
We have fifteen heritage assets, of which five are considered multi-use, for fiscal years 2016 and 2015. The Treasury Complex (Main Treasury Building and Annex), declared a national historical landmark in 1972, is treated as a multi-use heritage asset and is expected to be preserved indefinitely. The buildings that house the Mint in Denver, San Francisco, Fort Knox, and West Point are also multi-use heritage assets and included on the National Register of Historic Places. Additionally, the Mint maintains heritage assets consisting of four coin collections and six historical artifacts.
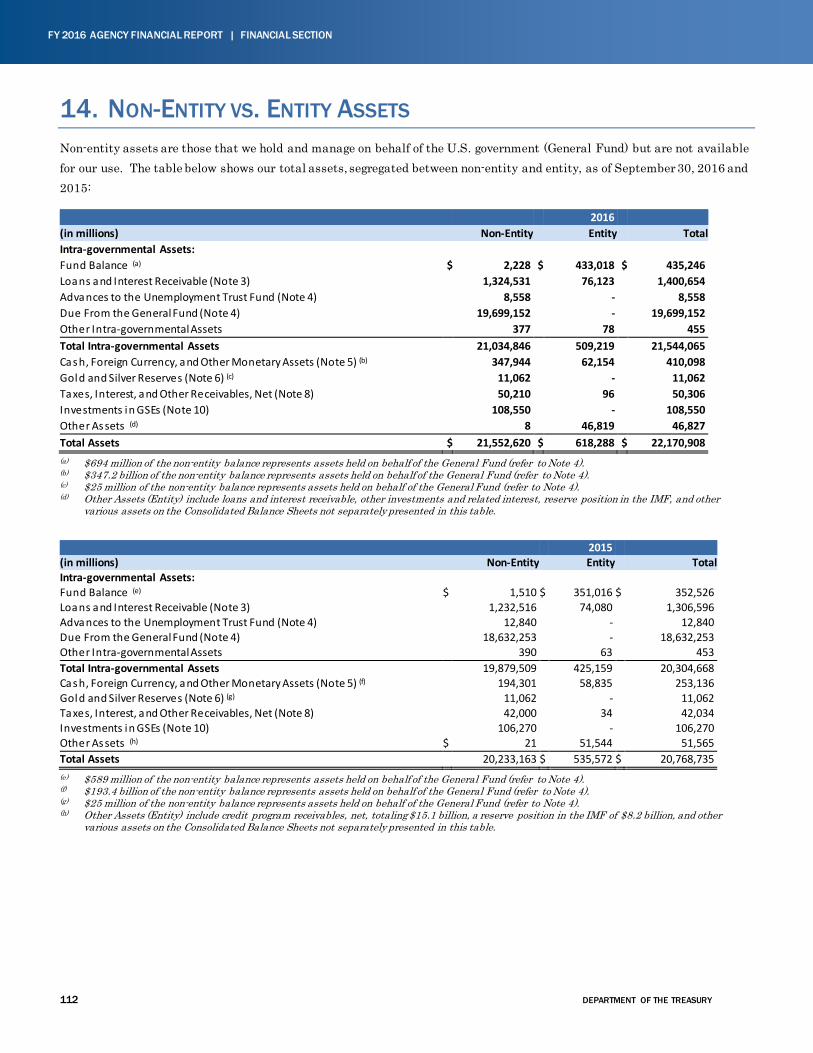
112 DEPARTMENT OF THE TREASURY
FY 2016 AGENCY FINANCIAL REPORT | FINANCIAL SECTION
14. NON-ENTITY VS. ENTITY ASSETS Non-entity assets are those that we hold and manage on behalf of the U.S. government (General Fund) but are not available for our use. The table below shows our total assets, segregated between non-entity and entity, as of September 30, 2016 and 2015:
2016 (in millions) Non-Entity Entity Total Intra-governmental Assets:
Fund Balance (a) $ 2,228 $ 433,018 $ 435,246 Loans and Interest Receivable (Note 3) 1,324,531 76,123 1,400,654 Advances to the Unemployment Trust Fund (Note 4) 8,558 - 8,558 Due From the General Fund (Note 4) 19,699,152 - 19,699,152 Other Intra-governmental Assets 377 78 455 Total Intra-governmental Assets 21,034,846 509,219 21,544,065 Cash, Foreign Currency, and Other Monetary Assets (Note 5) (b) 347,944 62,154 410,098 Gold and Silver Reserves (Note 6) (c) 11,062 - 11,062 Taxes, Interest, and Other Receivables, Net (Note 8) 50,210 96 50,306 Investments in GSEs (Note 10) 108,550 - 108,550 Other Assets (d) 8 46,819 46,827 Total Assets $ 21,552,620 $ 618,288 $ 22,170,908 (a) $694 million of the non-entity balance represents assets held on behalf of the General Fund (refer to Note 4). (b) $347.2 billion of the non-entity balance represents assets held on behalf of the General Fund (refer to Note 4). (c) $25 million of the non-entity balance represents assets held on behalf of the General Fund (refer to Note 4). (d) Other Assets (Entity) include loans and interest receivable, other investments and related interest, reserve position in the IMF, and other
various assets on the Consolidated Balance Sheets not separately presented in this table.
2015 (in millions) Non-Entity Entity Total Intra-governmental Assets:
Fund Balance (e) $ 1,510 $ 351,016 $ 352,526 Loans and Interest Receivable (Note 3) 1,232,516 74,080 1,306,596 Advances to the Unemployment Trust Fund (Note 4) 12,840 - 12,840 Due From the General Fund (Note 4) 18,632,253 - 18,632,253 Other Intra-governmental Assets 390 63 453 Total Intra-governmental Assets 19,879,509 425,159 20,304,668 Cash, Foreign Currency, and Other Monetary Assets (Note 5) (f) 194,301 58,835 253,136 Gold and Silver Reserves (Note 6) (g) 11,062 - 11,062 Taxes, Interest, and Other Receivables, Net (Note 8) 42,000 34 42,034 Investments in GSEs (Note 10) 106,270 - 106,270 Other Assets (h) $ 21 51,544 51,565 Total Assets 20,233,163 $ 535,572 $ 20,768,735 (e) $589 million of the non-entity balance represents assets held on behalf of the General Fund (refer to Note 4). (f) $193.4 billion of the non-entity balance represents assets held on behalf of the General Fund (refer to Note 4). (g) $25 million of the non-entity balance represents assets held on behalf of the General Fund (refer to Note 4). (h) Other Assets (Entity) include credit program receivables, net, totaling $15.1 billion, a reserve position in the IMF of $8.2 billion, and other
various assets on the Consolidated Balance Sheets not separately presented in this table.
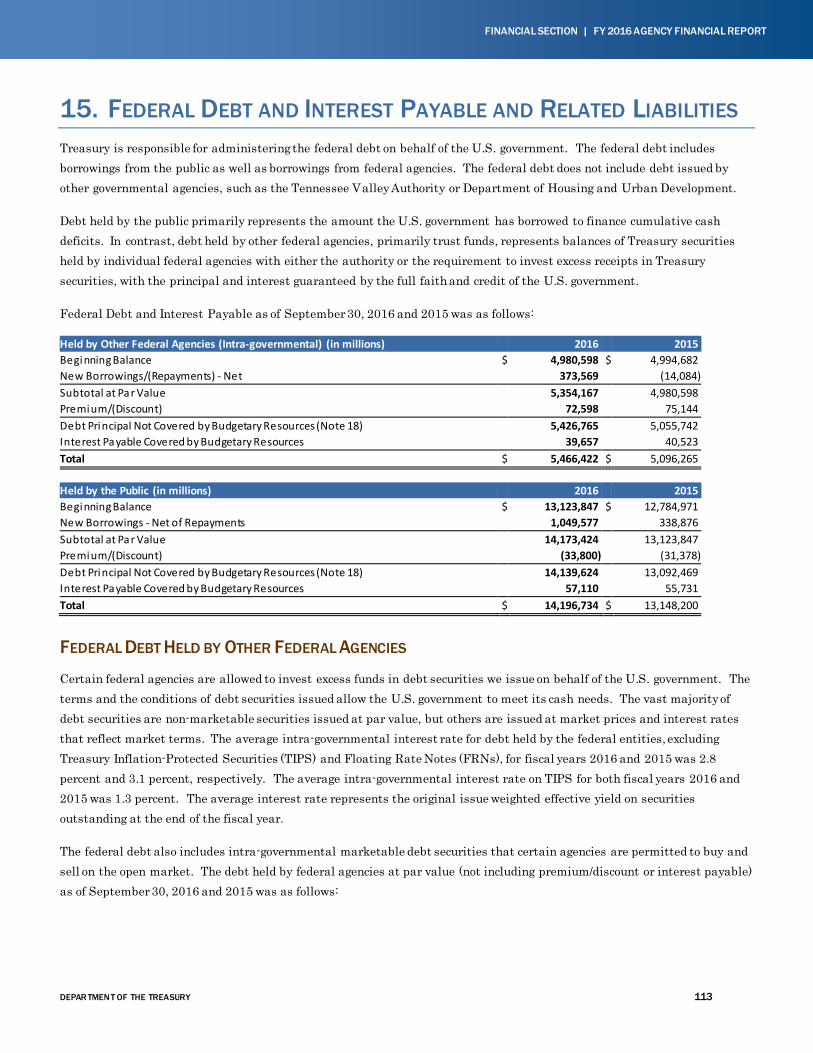
DEPAR TMEN T OF THE TREASURY 113
FINANCIAL SECTION | FY 2016 AGENCY FINANCIAL REPORT
15. FEDERAL DEBT AND INTEREST PAYABLE AND RELATED LIABILITIES Treasury is responsible for administering the federal debt on behalf of the U.S. government. The federal debt includes borrowings from the public as well as borrowings from federal agencies. The federal debt does not include debt issued by other governmental agencies, such as the Tennessee Valley Authority or Department of Housing and Urban Development.
Debt held by the public primarily represents the amount the U.S. government has borrowed to finance cumulative cash deficits. In contrast, debt held by other federal agencies, primarily trust funds, represents balances of Treasury securities held by individual federal agencies with either the authority or the requirement to invest excess receipts in Treasury securities, with the principal and interest guaranteed by the full faith and credit of the U.S. government.
Federal Debt and Interest Payable as of September 30, 2016 and 2015 was as follows:
Held by Other Federal Agencies (Intra-governmental) (in millions) 2016 2015 Beginning Balance $ 4,980,598 $ 4,994,682 New Borrowings/(Repayments) - Net 373,569 (14,084) Subtotal at Par Value 5,354,167 4,980,598 Premium/(Discount) 72,598 75,144 Debt Principal Not Covered by Budgetary Resources (Note 18) 5,426,765 5,055,742 Interest Payable Covered by Budgetary Resources 39,657 40,523 Total $ 5,466,422 $ 5,096,265 Held by the Public (in millions) 2016 2015 Beginning Balance $ 13,123,847 $ 12,784,971 New Borrowings - Net of Repayments 1,049,577 338,876 Subtotal at Par Value 14,173,424 13,123,847 Premium/(Discount) (33,800) (31,378) Debt Principal Not Covered by Budgetary Resources (Note 18) 14,139,624 13,092,469 Interest Payable Covered by Budgetary Resources 57,110 55,731 Total $ 14,196,734 $ 13,148,200
FEDERAL DEBT HELD BY OTHER FEDERAL AGENCIES
Certain federal agencies are allowed to invest excess funds in debt securities we issue on behalf of the U.S. government. The terms and the conditions of debt securities issued allow the U.S. government to meet its cash needs. The vast majority of debt securities are non-marketable securities issued at par value, but others are issued at market prices and interest rates that reflect market terms. The average intra-governmental interest rate for debt held by the federal entities, excluding Treasury Inflation-Protected Securities (TIPS) and Floating Rate Notes (FRNs), for fiscal years 2016 and 2015 was 2.8 percent and 3.1 percent, respectively. The average intra-governmental interest rate on TIPS for both fiscal years 2016 and 2015 was 1.3 percent. The average interest rate represents the original issue weighted effective yield on securities outstanding at the end of the fiscal year.
The federal debt also includes intra-governmental marketable debt securities that certain agencies are permitted to buy and sell on the open market. The debt held by federal agencies at par value (not including premium/discount or interest payable) as of September 30, 2016 and 2015 was as follows:
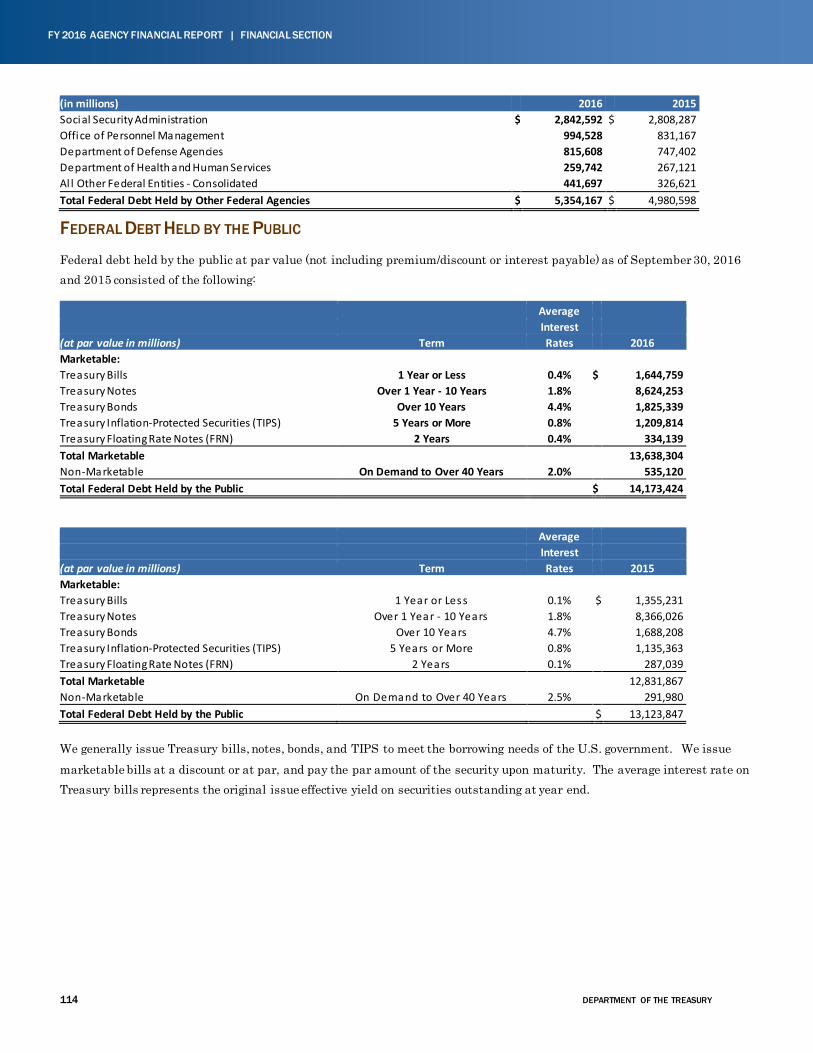
114 DEPARTMENT OF THE TREASURY
FY 2016 AGENCY FINANCIAL REPORT | FINANCIAL SECTION
(in millions) 2016 2015 Social Security Administration $ 2,842,592 $ 2,808,287 Office of Personnel Management 994,528 831,167 Department of Defense Agencies 815,608 747,402 Department of Health and Human Services 259,742 267,121 Al l Other Federal Entities - Consolidated 441,697 326,621 Total Federal Debt Held by Other Federal Agencies $ 5,354,167 $ 4,980,598
FEDERAL DEBT HELD BY THE PUBLIC
Federal debt held by the public at par value (not including premium/discount or interest payable) as of September 30, 2016 and 2015 consisted of the following:
Average Interest (at par value in millions) Term Rates 2016 Marketable: Treasury Bills 1 Year or Less 0.4% $ 1,644,759 Treasury Notes Over 1 Year - 10 Years 1.8% 8,624,253 Treasury Bonds Over 10 Years 4.4% 1,825,339 Treasury Inflation-Protected Securities (TIPS) 5 Years or More 0.8% 1,209,814 Treasury Floating Rate Notes (FRN) 2 Years 0.4% 334,139 Total Marketable 13,638,304 Non-Marketable On Demand to Over 40 Years 2.0% 535,120 Total Federal Debt Held by the Public $ 14,173,424 Average Interest (at par value in millions) Term Rates 2015 Marketable: Treasury Bills 1 Year or Less 0.1% $ 1,355,231 Treasury Notes Over 1 Year - 10 Years 1.8% 8,366,026 Treasury Bonds Over 10 Years 4.7% 1,688,208 Treasury Inflation-Protected Securities (TIPS) 5 Years or More 0.8% 1,135,363 Treasury Floating Rate Notes (FRN) 2 Years 0.1% 287,039 Total Marketable 12,831,867 Non-Marketable On Demand to Over 40 Years 2.5% 291,980 Total Federal Debt Held by the Public $ 13,123,847
We generally issue Treasury bills, notes, bonds, and TIPS to meet the borrowing needs of the U.S. government. We issue marketable bills at a discount or at par, and pay the par amount of the security upon maturity. The average interest rate on Treasury bills represents the original issue effective yield on securities outstanding at year end.
DEPAR TMEN T OF THE TREASURY 115
FINANCIAL SECTION | FY 2016 AGENCY FINANCIAL REPORT
We issue marketable notes and bonds as long-term securities that pay semi-annual interest based on the securities’ stated interest rates. We issue these securities at either par value or at an amount that reflects a discount or premium. The average interest rate on marketable notes and bonds represents the stated interest rate adjusted by any discount or premium on securities outstanding at year-end. We also issue TIPS that have interest and redemption payments tied to the Consumer Price Index (CPI) for all Urban Consumers, a widely used measurement of inflation. We adjust the principal for TIPS daily over the life of the security based on the CPI for all Urban Consumers. At maturity, TIPS are redeemed at the inflation-adjusted principal amount, or the original par value, whichever is greater. TIPS pay a semi-annual fixed rate of interest applied to the inflation-adjusted principal. The average interest rate on TIPS represents the stated interest rate on principal plus inflation, adjusted by any discount or premium on securities outstanding as of the end of the fiscal year. The inflation-adjusted TIPS principal balance of federal debt held by the public included inflation of $90.8 billion and $90.0 billion as of September 30, 2016 and 2015, respectively.
We also issue marketable FRNs which pay interest quarterly based on the interest rate at the time of payment. The interest rate of FRNs can change over time and indexed to the highest acceptable discount rate of the most recent 13-week marketable bill auction. Similar to marketable notes and bonds, we issue these securities at either par value or at an amount that reflects a discount or premium. The average interest rate on marketable FRNs represents the highest accepted discount rate of the most recent 13-week marketable auction as of September 30, adjusted by any discount or premium on securities outstanding as of that date.
Federal Debt Held by the Public includes federal debt held outside of the U.S. government by individuals, corporations, FRBs, state and local governments, foreign governments, and central banks. As of September 30, 2016, the FRBs had total holdings of $1.8 trillion which: (i) excluded $714 billion in Treasury securities used in overnight reverse repurchase transactions, and (ii) included a net of $0.7 billion in Treasury securities held by the FRB as collateral for securities lending activities. As of September 30, 2015, the FRBs had total holdings of $1.8 trillion which: (i) excluded $618 billion in Treasury securities used in overnight reverse repurchase transactions, and (ii) included a net of $1.8 billion in Treasury securities held by the FRB as collateral for securities lending activities. The FRB holds Treasury securities in the FRB System Open Market Account for the purpose of conducting monetary policy.
STATUTORY DEBT LIMIT
Congress provided us with statutory authority to take certain extraordinary measures in the event that Treasury debt nears the statutory debt limit and a delay in raising the statutory debt limit occurs. These measures authorize us to deviate from our normal debt management operations and exercise legal authorities to avoid exceeding the statutory debt limit.
During the period of the delay in raising the statutory debt limit, we may undertake the following extraordinary measures: (i) suspend new issuances of Treasury securities to the Government Securities Investment Fund of the Federal Employees’ Retirement System Thrift Savings Plan (TSP), the Civil Service Retirement and Disability Trust Fund (Civil Service Fund), the Postal Service Retiree Health Benefits Fund (Postal Benefits Fund), and the ESF as investments; (ii) redeem early a certain amount of Treasury securities held by the Civil Service Fund; (iii) suspend new issuances of State and Local Government Series (SLGS) securities; (iv) utilize FFB to exchange outstanding Treasury securities held by the Civil Service Fund for non-Treasury securities (refer to Note 16); and (v) issue cash management bills to manage short-term financing needs.
116 DEPARTMENT OF THE TREASURY
FY 2016 AGENCY FINANCIAL REPORT | FINANCIAL SECTION
When the period of delay in raising the statutory debt limit ends, we discontinue our use of extraordinary measures and resume our normal debt management operations. Furthermore, we are required by the relevant statutes, to restore the TSP, along with the OPM-administered Civil Service Fund and Postal Benefits Fund (the OPM funds), with the accumulated principal balance of Treasury securities that bears such interest rates and maturity dates necessary to replicate the investments the funds would have held had the delay not occurred (the uninvested principal). In addition, relevant statutes require us to pay these funds the related lost interest (foregone interest) on the uninvested principal. Relevant statutes do not require that we restore the ESF and state and local governments with uninvested principal or lost interest incurred during a period of delay.
A delay in raising the statutory debt limit occurred from March 16, 2015 until Friday, October 30, 2015. On Monday, November 2, 2015, Congress enacted the Bipartisan Budget Act of 2015 (P.L. 114-74) which temporarily suspended the debt limit through March 15, 2017. During the period March 16, 2015 through October 30, 2015, we undertook the extraordinary measures as described above (also refer to Note 16). On November 2, 2015, when Congress temporarily suspended the debt limit, we resumed normal debt management operations. On this date, we restored uninvested principal totaling $352.6 billion, of which $204.8 billion was restored to the TSP and $147.8 billion was restored to the two OPM funds. We also restored foregone interest totaling $2.7 billion, of which $1.7 billion was restored to the TSP on the next interest payment date of November 3, 2015 and $971 million was restored to the two OPM funds on the next semi-annual interest payment date of December 31, 2015. In addition, we authorized ESF and state and local governments to resume investments in Treasury securities.
Of the $2.7 billion of foregone interest paid in fiscal year 2016, $635 million is reported in fiscal year 2016 as a current year, non-entity expense within the line item, “Restoration of Foregone Federal Debt Interest,” and $2.1 billion was accrued in fiscal year 2015 as a non-entity expense within the line item, “Accrued Restoration of Foregone Federal Debt Interest” on our Consolidated Statements of Net Cost. In fiscal year 2015, we also reported the $2.1 billion of accrued foregone interest as part of other financing sources on the Consolidated Statement of Changes in Net Position, and subsequently reversed this amount in fiscal year 2016 in connection with the actual payment of interest.
Since the delay in raising the statutory debt limit did not end until November 2, 2015, none of the uninvested principal and foregone interest payable had been restored to the TSP and the two OPM funds as of September 30, 2015. Accordingly, we recorded a liability as of September 30, 2015 totaling $350.7 billion, comprised of uninvested principal owed to these three funds as of that date totaling $348.6 billion, and foregone interest payable to the funds for the period March 16, 2015 through September 30, 2015 totaling $2.1 billion. This liability for the uninvested principal and foregone interest payable as of September 30, 2015 was reported on our Consolidated Balance Sheets in the line item, “Liability for Restoration of Federal Debt Principal and Interest” of which $146.1 billion represented an intra-governmental liability of the combined principal and interest payable to the two OPM funds, and the remaining $204.6 billion represented the principal and interest payable to the TSP, a public liability. Corresponding amounts were reported in the “Due From the General Fund” line item on the Consolidated Balance Sheets for the total $350.7 billion of uninvested principal and foregone interest owed to the funds as of September 30, 2015 (refer to Note 4).
DEPAR TMEN T OF THE TREASURY 117
FINANCIAL SECTION | FY 2016 AGENCY FINANCIAL REPORT
16. OTHER DEBT AND INTEREST PAYABLE Through FFB, we have outstanding borrowings and related accrued interest owed to the Civil Service Fund. At September 30, 2016 and 2015, FFB had outstanding borrowings of $13.1 billion and $12.4 billion, inclusive of $101 million and $106 million of accrued interest payable, respectively. During fiscal years 2016 and 2015, FFB paid $2.0 billion and $1.3 billion in principal, respectively. The outstanding borrowings at September 30, 2016 had stated interest rates that ranged from 2.25 percent to 4.63 percent per annum, and an effective interest rate of 3.08 percent. The outstanding borrowings at September 30, 2015 had stated interest rates that ranged from 2.88 percent to 4.63 percent per annum, and an effective interest rate of 3.43 percent. Maturity dates ranged from June 30, 2017 to June 30, 2029 for outstanding borrowings at September 30, 2016, and from June 30, 2016 to June 30, 2024 for outstanding borrowings at September 30, 2015.
On October 15, 2015, FFB exchanged $2.7 billion of non-Treasury securities that did not count against the debt limit, for an equivalent amount of Treasury securities held by the Civil Service Fund that did count against the debt limit. FFB used the Treasury securities it had received from the Civil Service Fund to repay $2.1 billion of outstanding principal borrowings, including interest, owed to the Fiscal Service. The Fiscal Service then extinguished the Treasury securities it had received from FFB, which thereby helped us to remain below the statutory debt limit. These transactions resulted in a cumulative $13.1 billion outstanding debt obligation owed to the Civil Service Fund as of September 30, 2016, which was reported as an intra-governmental liability on our Consolidated Balance Sheets entitled “Other Debt and Interest Payable.”
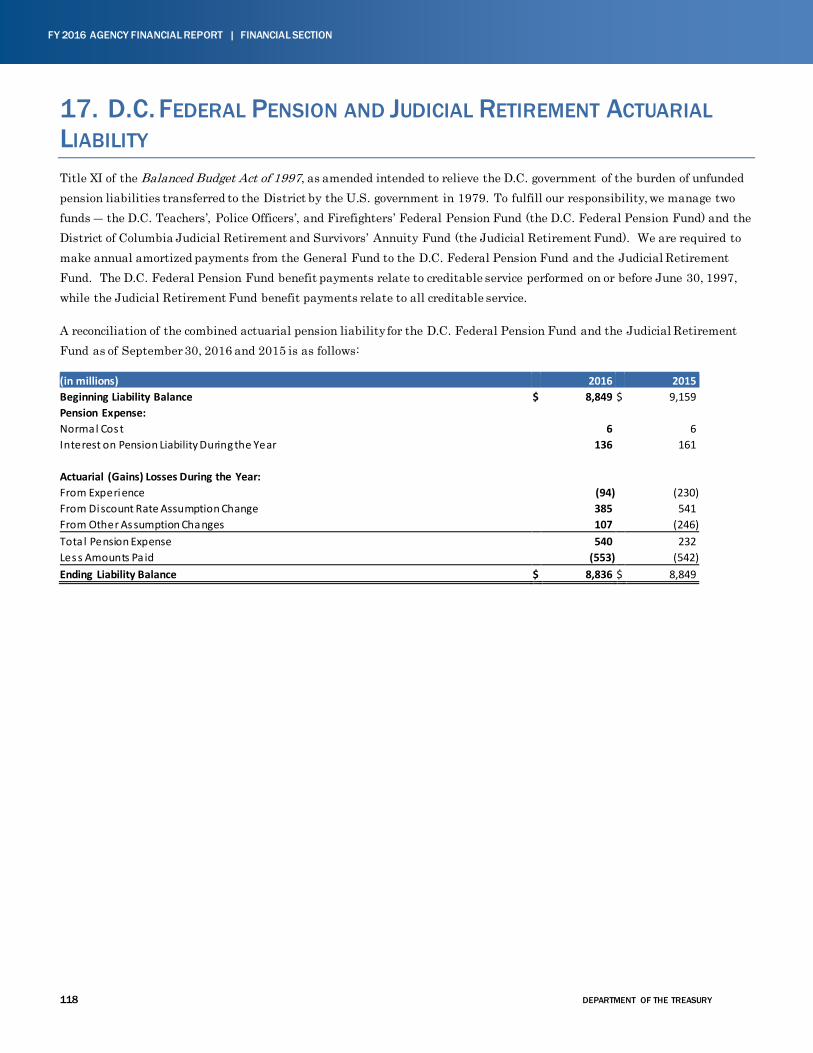
118 DEPARTMENT OF THE TREASURY
FY 2016 AGENCY FINANCIAL REPORT | FINANCIAL SECTION
17. D.C. FEDERAL PENSION AND JUDICIAL RETIREMENT ACTUARIAL LIABILITY Title XI of the Balanced Budget Act of 1997, as amended intended to relieve the D.C. government of the burden of unfunded pension liabilities transferred to the District by the U.S. government in 1979. To fulfill our responsibility, we manage two funds ― the D.C. Teachers’, Police Officers’, and Firefighters’ Federal Pension Fund (the D.C. Federal Pension Fund) and the District of Columbia Judicial Retirement and Survivors’ Annuity Fund (the Judicial Retirement Fund). We are required to make annual amortized payments from the General Fund to the D.C. Federal Pension Fund and the Judicial Retirement Fund. The D.C. Federal Pension Fund benefit payments relate to creditable service performed on or before June 30, 1997, while the Judicial Retirement Fund benefit payments relate to all creditable service.
A reconciliation of the combined actuarial pension liability for the D.C. Federal Pension Fund and the Judicial Retirement Fund as of September 30, 2016 and 2015 is as follows:
(in millions) 2016 2015 Beginning Liability Balance $ 8,849 $ 9,159 Pension Expense: Normal Cost 6 6 Interest on Pension Liability During the Year 136 161 Actuarial (Gains) Losses During the Year: From Experience (94) (230) From Discount Rate Assumption Change 385 541 From Other Assumption Changes 107 (246) Tota l Pension Expense 540 232 Less Amounts Pa id (553) (542) Ending Liability Balance $ 8,836 $ 8,849
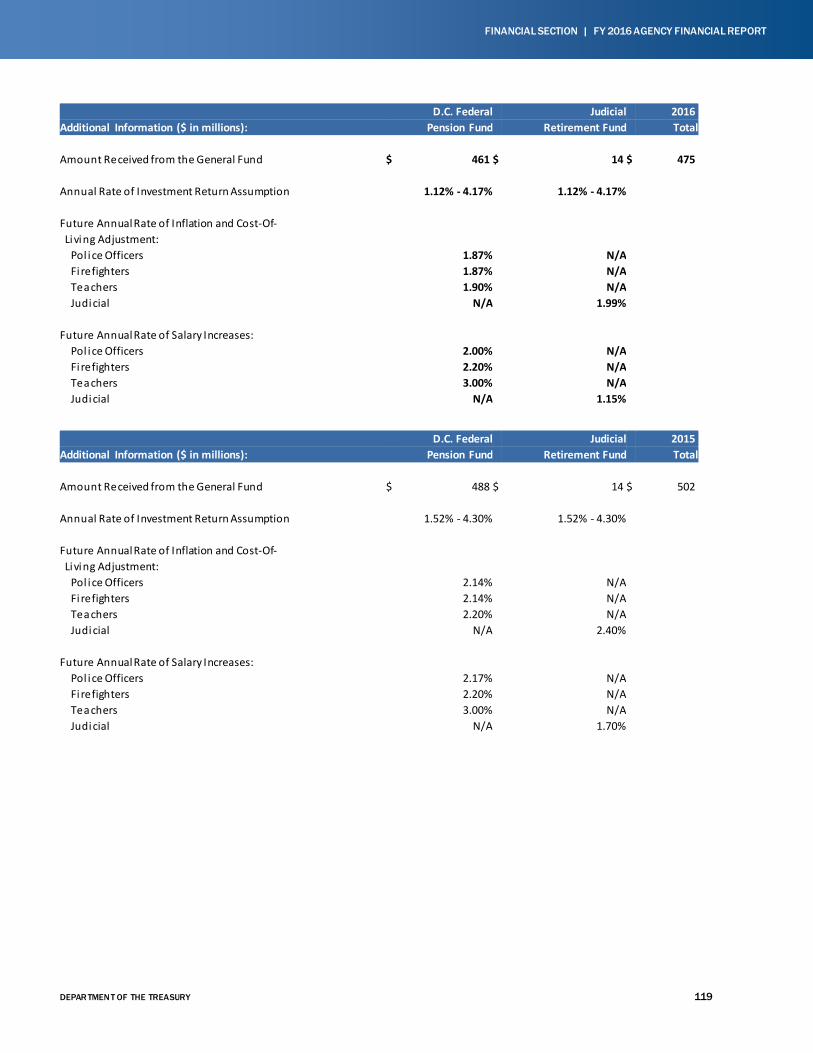
DEPAR TMEN T OF THE TREASURY 119
FINANCIAL SECTION | FY 2016 AGENCY FINANCIAL REPORT
D.C. Federal Judicial 2016 Additional Information ($ in millions): Pension Fund Retirement Fund Total Amount Received from the General Fund $ 461 $ 14 $ 475 Annual Rate of Investment Return Assumption 1.12% - 4.17% 1.12% - 4.17% Future Annual Rate of Inflation and Cost-Of- Living Adjustment: Pol ice Officers 1.87% N/A Fi refighters 1.87% N/A Teachers 1.90% N/A Judicial N/A 1.99% Future Annual Rate of Salary Increases: Pol ice Officers 2.00% N/A Fi refighters 2.20% N/A Teachers 3.00% N/A Judicial N/A 1.15% D.C. Federal Judicial 2015 Additional Information ($ in millions): Pension Fund Retirement Fund Total Amount Received from the General Fund $ 488 $ 14 $ 502 Annual Rate of Investment Return Assumption 1.52% - 4.30% 1.52% - 4.30% Future Annual Rate of Inflation and Cost-Of- Living Adjustment: Pol ice Officers 2.14% N/A Fi refighters 2.14% N/A Teachers 2.20% N/A Judicial N/A 2.40% Future Annual Rate of Salary Increases: Pol ice Officers 2.17% N/A Fi refighters 2.20% N/A Teachers 3.00% N/A Judicial N/A 1.70%
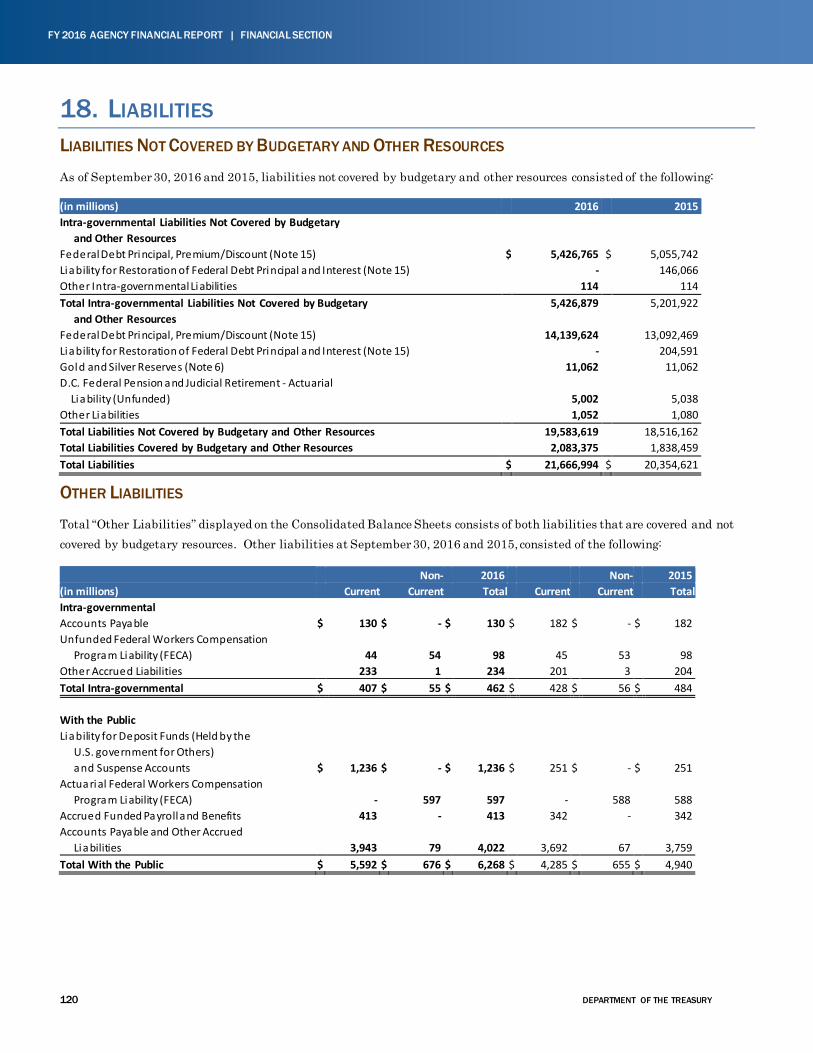
120 DEPARTMENT OF THE TREASURY
FY 2016 AGENCY FINANCIAL REPORT | FINANCIAL SECTION
18. LIABILITIES LIABILITIES NOT COVERED BY BUDGETARY AND OTHER RESOURCES
As of September 30, 2016 and 2015, liabilities not covered by budgetary and other resources consisted of the following:
(in millions) 2016 2015 Intra-governmental Liabilities Not Covered by Budgetary and Other Resources Federal Debt Principal, Premium/Discount (Note 15) $ 5,426,765 $ 5,055,742 Liability for Restoration of Federal Debt Principal and Interest (Note 15) - 146,066 Other Intra-governmental Liabilities 114 114 Total Intra-governmental Liabilities Not Covered by Budgetary 5,426,879 5,201,922 and Other Resources Federal Debt Principal, Premium/Discount (Note 15) 14,139,624 13,092,469 Liability for Restoration of Federal Debt Principal and Interest (Note 15) - 204,591 Gold and Silver Reserves (Note 6) 11,062 11,062 D.C. Federal Pension and Judicial Retirement - Actuarial Liability (Unfunded) 5,002 5,038 Other Liabilities 1,052 1,080 Total Liabilities Not Covered by Budgetary and Other Resources 19,583,619 18,516,162 Total Liabilities Covered by Budgetary and Other Resources 2,083,375 1,838,459 Total Liabilities $ 21,666,994 $ 20,354,621
OTHER LIABILITIES
Total “Other Liabilities” displayed on the Consolidated Balance Sheets consists of both liabilities that are covered and not covered by budgetary resources. Other liabilities at September 30, 2016 and 2015, consisted of the following:
Non- 2016 Non- 2015 (in millions) Current Current Total Current Current Total Intra-governmental Accounts Payable $ 130 $ - $ 130 $ 182 $ - $ 182 Unfunded Federal Workers Compensation Program Liability (FECA) 44 54 98 45 53 98 Other Accrued Liabilities 233 1 234 201 3 204 Total Intra-governmental $ 407 $ 55 $ 462 $ 428 $ 56 $ 484 With the Public Liability for Deposit Funds (Held by the U.S. government for Others) and Suspense Accounts $ 1,236 $ - $ 1,236 $ 251 $ - $ 251 Actuarial Federal Workers Compensation Program Liability (FECA) - 597 597 - 588 588 Accrued Funded Payroll and Benefits 413 - 413 342 - 342 Accounts Payable and Other Accrued Liabilities 3,943 79 4,022 3,692 67 3,759 Total With the Public $ 5,592 $ 676 $ 6,268 $ 4,285 $ 655 $ 4,940
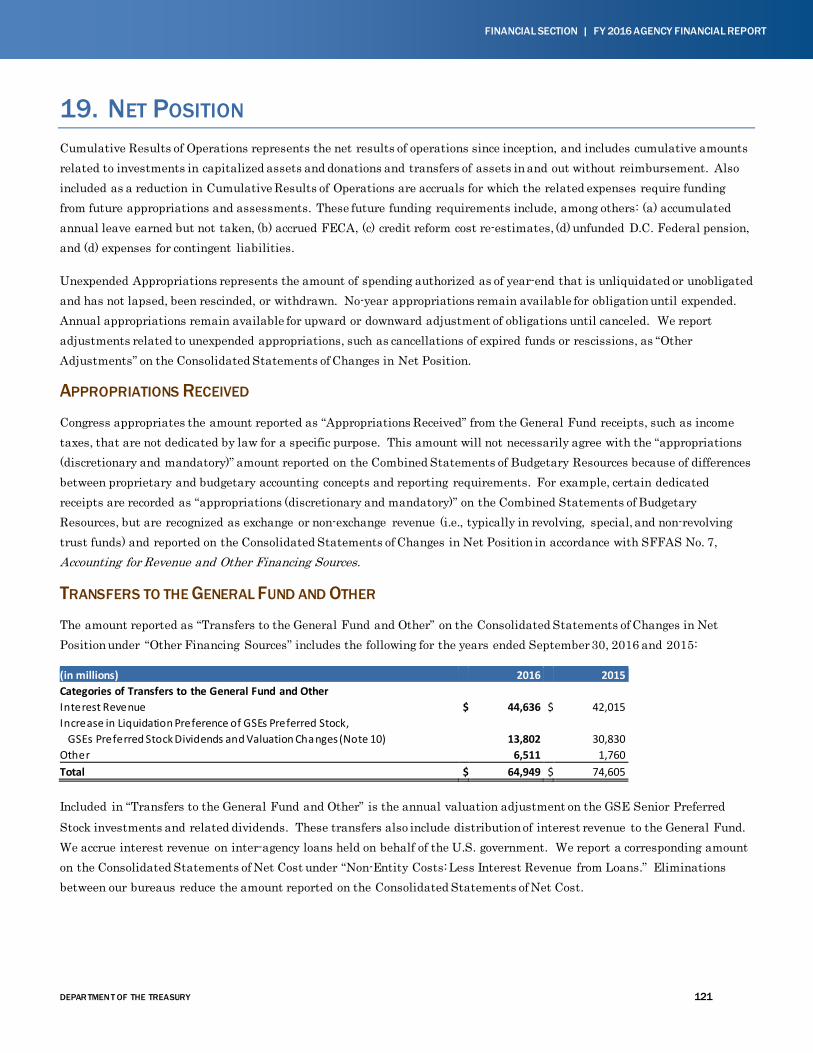
DEPAR TMEN T OF THE TREASURY 121
FINANCIAL SECTION | FY 2016 AGENCY FINANCIAL REPORT
19. NET POSITION Cumulative Results of Operations represents the net results of operations since inception, and includes cumulative amounts related to investments in capitalized assets and donations and transfers of assets in and out without reimbursement. Also included as a reduction in Cumulative Results of Operations are accruals for which the related expenses require funding from future appropriations and assessments. These future funding requirements include, among others: (a) accumulated annual leave earned but not taken, (b) accrued FECA, (c) credit reform cost re-estimates, (d) unfunded D.C. Federal pension, and (d) expenses for contingent liabilities.
Unexpended Appropriations represents the amount of spending authorized as of year-end that is unliquidated or unobligated and has not lapsed, been rescinded, or withdrawn. No-year appropriations remain available for obligation until expended. Annual appropriations remain available for upward or downward adjustment of obligations until canceled. We report adjustments related to unexpended appropriations, such as cancellations of expired funds or rescissions, as “Other Adjustments” on the Consolidated Statements of Changes in Net Position.
APPROPRIATIONS RECEIVED
Congress appropriates the amount reported as “Appropriations Received” from the General Fund receipts, such as income taxes, that are not dedicated by law for a specific purpose. This amount will not necessarily agree with the “appropriations (discretionary and mandatory)” amount reported on the Combined Statements of Budgetary Resources because of differences between proprietary and budgetary accounting concepts and reporting requirements. For example, certain dedicated receipts are recorded as “appropriations (discretionary and mandatory)” on the Combined Statements of Budgetary Resources, but are recognized as exchange or non-exchange revenue (i.e., typically in revolving, special, and non-revolving trust funds) and reported on the Consolidated Statements of Changes in Net Position in accordance with SFFAS No. 7, Accounting for Revenue and Other Financing Sources.
TRANSFERS TO THE GENERAL FUND AND OTHER
The amount reported as “Transfers to the General Fund and Other” on the Consolidated Statements of Changes in Net Position under “Other Financing Sources” includes the following for the years ended September 30, 2016 and 2015:
(in millions) 2016 2015 Categories of Transfers to the General Fund and Other Interest Revenue $ 44,636 $ 42,015 Increase in Liquidation Preference of GSEs Preferred Stock, GSEs Preferred Stock Dividends and Valuation Changes (Note 10) 13,802 30,830 Other 6,511 1,760 Total $ 64,949 $ 74,605
Included in “Transfers to the General Fund and Other” is the annual valuation adjustment on the GSE Senior Preferred Stock investments and related dividends. These transfers also include distribution of interest revenue to the General Fund. We accrue interest revenue on inter-agency loans held on behalf of the U.S. government. We report a corresponding amount on the Consolidated Statements of Net Cost under “Non-Entity Costs: Less Interest Revenue from Loans.” Eliminations between our bureaus reduce the amount reported on the Consolidated Statements of Net Cost.
122 DEPARTMENT OF THE TREASURY
FY 2016 AGENCY FINANCIAL REPORT | FINANCIAL SECTION
The “Other” line generally includes collections from other federal agencies for reimbursement of costs we incurred for our administration of trust funds established within the Social Security Act. We execute these administrative services as directed by statute. The fiscal year 2016 activity also includes a $3.8 billion transfer of forfeited assets to a Fiscal Service-managed miscellaneous receipt account. This line also includes Seigniorage and numismatic profits also are included in the “Other” line. Seigniorage is the face value of newly minted circulating coins less the cost of production. Numismatic profit is any profit on the sale of proof coins, uncirculated coins, commemorative coins, and related products and accessories. The Mint is required to distribute seigniorage and numismatic profits in excess of operating expenses to the General Fund (refer to Note 21). In any given year, the amount recognized as seigniorage may differ from the amount distributed to the General Fund by an insignificant amount due to timing differences. The “Other” line also includes the credit reform downward re-estimate subsidies transferred to the General Fund resulting from a change in forecasts of future cash flows.
20. CONSOLIDATED STATEMENTS OF NET COST AND NET COSTS OF TREASURY SUB-ORGANIZATIONS Our Consolidated Statements of Net Cost display information on a consolidated basis. We consist of DO and seven operating bureaus that we provide supporting schedules for Net Cost in the notes to the financial statements (refer to Note 1). These supporting schedules provide consolidating information, which fully displays the costs, revenues, and net cost of DO and each operating bureau.
The classification of sub-organizations has been determined in accordance with SFFAS No. 4, Managerial Cost Accounting Standards and Concepts for the Federal Government which states that the predominant factor is the reporting entity’s organization structure and existing responsibility components, such as bureaus, administrations, offices, and divisions within a department.
Each sub-organization is responsible for accumulating costs. The assignment of the costs to Department-wide programs is the result of using the following cost assignment methods: (1) direct costs, (2) cause and effect, and (3) cost allocation.
INTRA-DEPARTMENTAL COSTS/REVENUES
We report intra-departmental costs/revenues resulting from the provision of goods and/or services on a reimbursable basis among our sub-organizations as costs by providing sub-organizations and as revenues by receiving sub-organizations. We recognized intra-departmental imputed costs on the Consolidated Statements of Net Cost of $646 million and $596 million during fiscal years 2016 and 2015, respectively. Accordingly, we eliminated such costs or revenues in the consolidation process.
INTRA-GOVERNMENTAL COSTS
Intra-governmental costs relate to the source of goods and services we purchased and not to the classification of the related intra-governmental revenue.
In certain cases, other federal agencies incur costs that are directly identifiable to our operations. In accordance with SFFAS No. 30, Inter-Entity Cost Implementation Amending SFFAS No. 4, Managerial Cost Accounting Standards and Concepts, we recognize identified costs paid on our behalf by other agencies. The imputed inter-departmental financing sources we currently recognize include the actual cost of future benefits for the federal pension plans that other federal entities pay, the FEHB, and any un-reimbursed contract dispute payments made from the Treasury Judgment Fund on our behalf. We
DEPAR TMEN T OF THE TREASURY 123
FINANCIAL SECTION | FY 2016 AGENCY FINANCIAL REPORT
reflect the funding for these costs as costs on the Consolidated Statements of Net Cost, and as imputed financing sources on the Consolidated Statements of Changes in Net Position. Costs paid by other agencies on our behalf were $681 million and $669 million for the fiscal years ended September 30, 2016 and 2015, respectively.
CONSOLIDATED STATEMENTS OF NET COST PRESENTATION
OMB Circular No. A-136, Financial Reporting Requirements, as revised, requires that the presentation of the Consolidated Statements of Net Cost align directly with the goals and outcomes identified in the Strategic Plan. Accordingly, we have presented the gross costs and earned revenues by our major program categories as defined by the strategic goals reported in our fiscal years 2014 – 2017 Strategic Plan. The majority of our bureaus’ and reporting entities’ net cost information falls within a single program category in the Consolidated Statements of Net Cost. DO and TTB allocate costs and related revenues to multiple programs using a net cost percentage calculation. All of our management offices coordinate, on a Treasury-wide basis, their efforts to achieve the Management program-related strategic goals (refer to the Strategic Framework section of Management’s Discussion and Analysis). For financial statement presentation purposes, we combine the net costs associated with our Management program-related goals with the net costs associated with our Financial program-related strategic goals.
Our Consolidated Statements of Net Cost also present interest expense on the Federal Debt and other federal costs incurred on behalf of the U.S. government. We do not reflect these costs as program costs related to our strategic plan missions. We eliminate these costs in the consolidation process to the extent that they involve transactions with our sub-organizations.
Non-entity other federal costs shown on the Consolidated Statements of Net Cost for the fiscal years ended September 30, 2016 and 2015 consisted of the following:
(in millions) 2016 2015 Credit Reform Interest on Uninvested Funds (Intra-governmental) $ 7,349 $ 8,088 Judgment Claims and Contract Disputes 3,563 1,885 Resolution Funding Corporation 2,628 2,628 Corporation for Public Broadcasting 485 445 Al l Other Payments 529 555 Total $ 14,554 $ 13,601
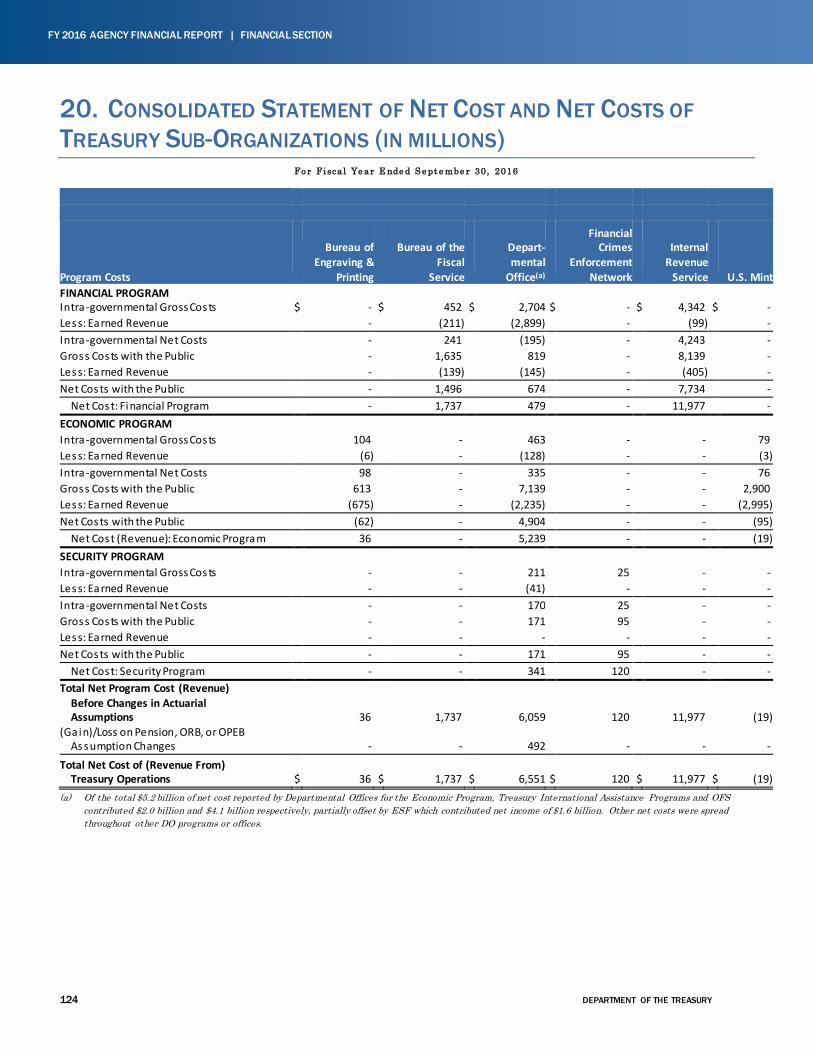
124 DEPARTMENT OF THE TREASURY
FY 2016 AGENCY FINANCIAL REPORT | FINANCIAL SECTION
20. CONSOLIDATED STATEMENT OF NET COST AND NET COSTS OF TREASURY SUB-ORGANIZATIONS (IN MILLIONS)
Fo r Fiscal Ye ar E nde d S e pt e mbe r 30, 2016
Program Costs
Bureau of Engraving &
Printing
Bureau of the Fiscal
Service
Depart- mental
Office(a)
Financial Crimes
Enforcement Network
Internal Revenue
Service U.S. Mint FINANCIAL PROGRAM
Intra-governmental Gross Costs $ - $ 452 $ 2,704 $ - $ 4,342 $ - Less: Earned Revenue - (211) (2,899) - (99) - Intra-governmental Net Costs - 241 (195) - 4,243 - Gross Costs with the Public - 1,635 819 - 8,139 - Less: Earned Revenue - (139) (145) - (405) - Net Costs with the Public - 1,496 674 - 7,734 - Net Cost: Financial Program - 1,737 479 - 11,977 - ECONOMIC PROGRAM
Intra-governmental Gross Costs 104 - 463 - - 79 Less: Earned Revenue (6) - (128) - - (3) Intra-governmental Net Costs 98 - 335 - - 76 Gross Costs with the Public 613 - 7,139 - - 2,900 Less: Earned Revenue (675) - (2,235) - - (2,995) Net Costs with the Public (62) - 4,904 - - (95) Net Cost (Revenue): Economic Program 36 - 5,239 - - (19) SECURITY PROGRAM
Intra-governmental Gross Costs - - 211 25 - - Less: Earned Revenue - - (41) - - - Intra-governmental Net Costs - - 170 25 - - Gross Costs with the Public - - 171 95 - - Less: Earned Revenue - - - - - - Net Costs with the Public - - 171 95 - - Net Cost: Security Program - - 341 120 - - Total Net Program Cost (Revenue) Before Changes in Actuarial Assumptions 36 1,737 6,059 120 11,977 (19) (Gain)/Loss on Pension, ORB, or OPEB Assumption Changes - - 492 - - -
Total Net Cost of (Revenue From) Treasury Operations $ 36 $ 1,737 $ 6,551 $ 120 $ 11,977 $ (19) (a) Of the total $5.2 billion of net cost reported by Departmental Offices for the Economic Program, Treasury International Assistance Programs and OFS
contributed $2.0 billion and $4.1 billion respectively, partially offset by ESF which contributed net income of $1.6 billion. Other net costs were spread throughout other DO programs or offices.
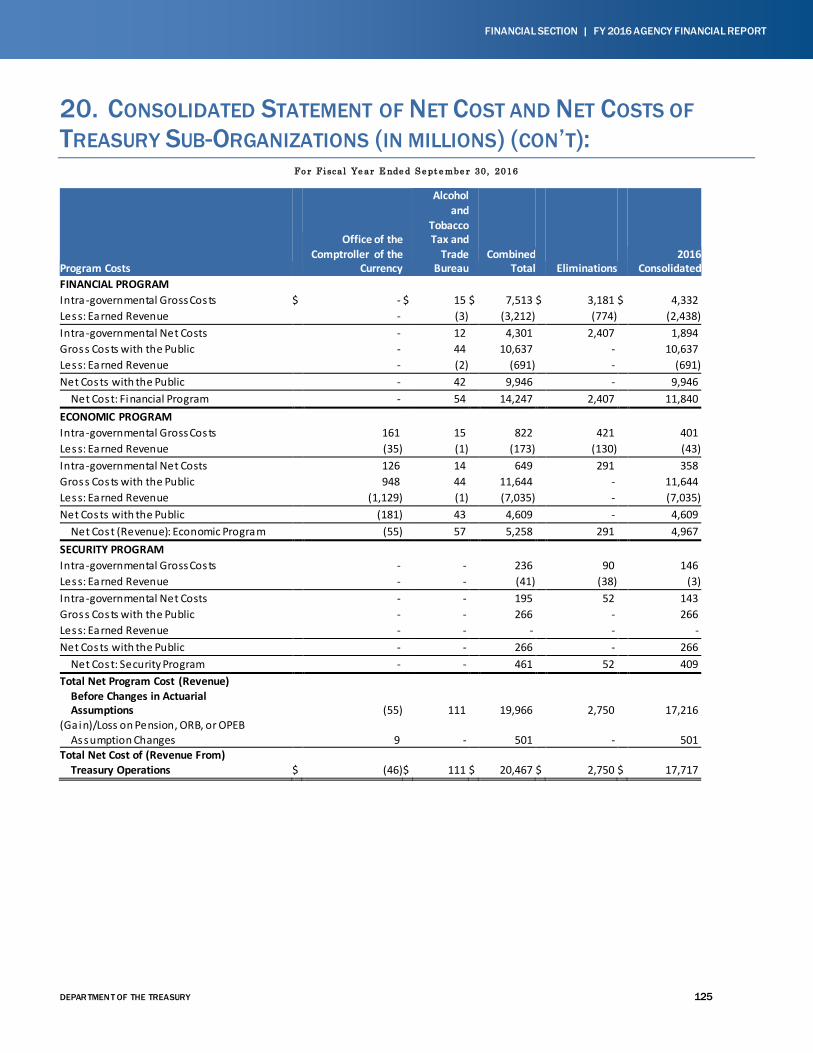
DEPAR TMEN T OF THE TREASURY 125
FINANCIAL SECTION | FY 2016 AGENCY FINANCIAL REPORT
20. CONSOLIDATED STATEMENT OF NET COST AND NET COSTS OF TREASURY SUB-ORGANIZATIONS (IN MILLIONS) (CON’T):
Fo r Fiscal Ye ar E nde d S e pt e mbe r 30, 2016
Program Costs
Office of the Comptroller of the
Currency
Alcohol and
Tobacco Tax and
Trade Bureau
Combined Total Eliminations
2016 Consolidated
FINANCIAL PROGRAM Intra-governmental Gross Costs $ - $ 15 $ 7,513 $ 3,181 $ 4,332 Less: Earned Revenue - (3) (3,212) (774) (2,438) Intra-governmental Net Costs - 12 4,301 2,407 1,894 Gross Costs with the Public - 44 10,637 - 10,637 Less: Earned Revenue - (2) (691) - (691) Net Costs with the Public - 42 9,946 - 9,946 Net Cost: Financial Program - 54 14,247 2,407 11,840 ECONOMIC PROGRAM Intra-governmental Gross Costs 161 15 822 421 401 Less: Earned Revenue (35) (1) (173) (130) (43) Intra-governmental Net Costs 126 14 649 291 358 Gross Costs with the Public 948 44 11,644 - 11,644 Less: Earned Revenue (1,129) (1) (7,035) - (7,035) Net Costs with the Public (181) 43 4,609 - 4,609 Net Cost (Revenue): Economic Program (55) 57 5,258 291 4,967 SECURITY PROGRAM Intra-governmental Gross Costs - - 236 90 146 Less: Earned Revenue - - (41) (38) (3) Intra-governmental Net Costs - - 195 52 143 Gross Costs with the Public - - 266 - 266 Less: Earned Revenue - - - - - Net Costs with the Public - - 266 - 266 Net Cost: Security Program - - 461 52 409 Total Net Program Cost (Revenue) Before Changes in Actuarial Assumptions (55) 111 19,966 2,750 17,216 (Gain)/Loss on Pension, ORB, or OPEB Assumption Changes 9 - 501 - 501 Total Net Cost of (Revenue From) Treasury Operations $ (46) $ 111 $ 20,467 $ 2,750 $ 17,717
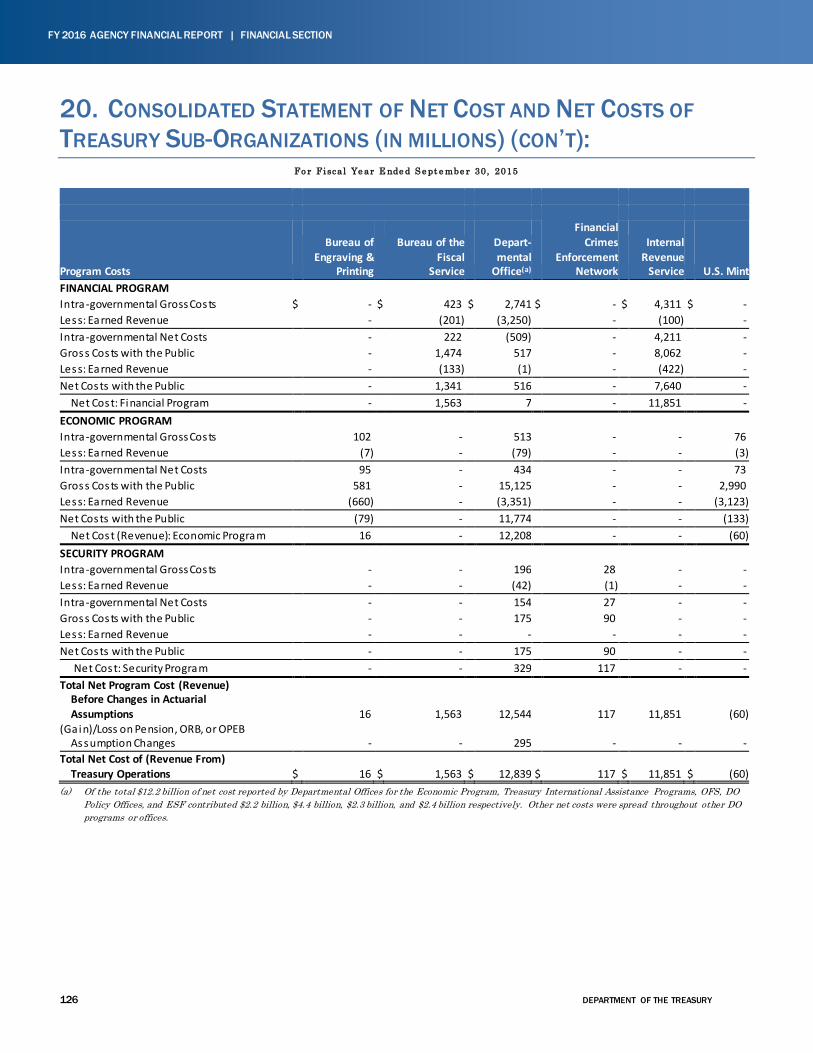
126 DEPARTMENT OF THE TREASURY
FY 2016 AGENCY FINANCIAL REPORT | FINANCIAL SECTION
20. CONSOLIDATED STATEMENT OF NET COST AND NET COSTS OF TREASURY SUB-ORGANIZATIONS (IN MILLIONS) (CON’T):
Fo r Fiscal Ye ar E nde d S e pt e mbe r 30, 2015
Program Costs
Bureau of Engraving &
Printing
Bureau of the Fiscal
Service
Depart- mental
Office(a)
Financial Crimes
Enforcement Network
Internal Revenue
Service U.S. Mint FINANCIAL PROGRAM
Intra-governmental Gross Costs $ - $ 423 $ 2,741 $ - $ 4,311 $ - Less: Earned Revenue - (201) (3,250) - (100) - Intra-governmental Net Costs - 222 (509) - 4,211 - Gross Costs with the Public - 1,474 517 - 8,062 - Less: Earned Revenue - (133) (1) - (422) - Net Costs with the Public - 1,341 516 - 7,640 - Net Cost: Financial Program - 1,563 7 - 11,851 - ECONOMIC PROGRAM
Intra-governmental Gross Costs 102 - 513 - - 76 Less: Earned Revenue (7) - (79) - - (3) Intra-governmental Net Costs 95 - 434 - - 73 Gross Costs with the Public 581 - 15,125 - - 2,990 Less: Earned Revenue (660) - (3,351) - - (3,123) Net Costs with the Public (79) - 11,774 - - (133) Net Cost (Revenue): Economic Program 16 - 12,208 - - (60) SECURITY PROGRAM
Intra-governmental Gross Costs - - 196 28 - - Less: Earned Revenue - - (42) (1) - - Intra-governmental Net Costs - - 154 27 - - Gross Costs with the Public - - 175 90 - - Less: Earned Revenue - - - - - - Net Costs with the Public - - 175 90 - - Net Cost: Security Program - - 329 117 - - Total Net Program Cost (Revenue) Before Changes in Actuarial Assumptions 16 1,563 12,544 117 11,851 (60) (Gain)/Loss on Pension, ORB, or OPEB Assumption Changes - - 295 - - - Total Net Cost of (Revenue From) Treasury Operations $ 16 $ 1,563 $ 12,839 $ 117 $ 11,851 $ (60) (a) Of the total $12.2 billion of net cost reported by Departmental Offices for the Economic Program, Treasury International Assistance Programs, OFS, DO
Policy Offices, and ESF contributed $2.2 billion, $4.4 billion, $2.3 billion, and $2.4 billion respectively. Other net costs were spread throughout other DO programs or offices.
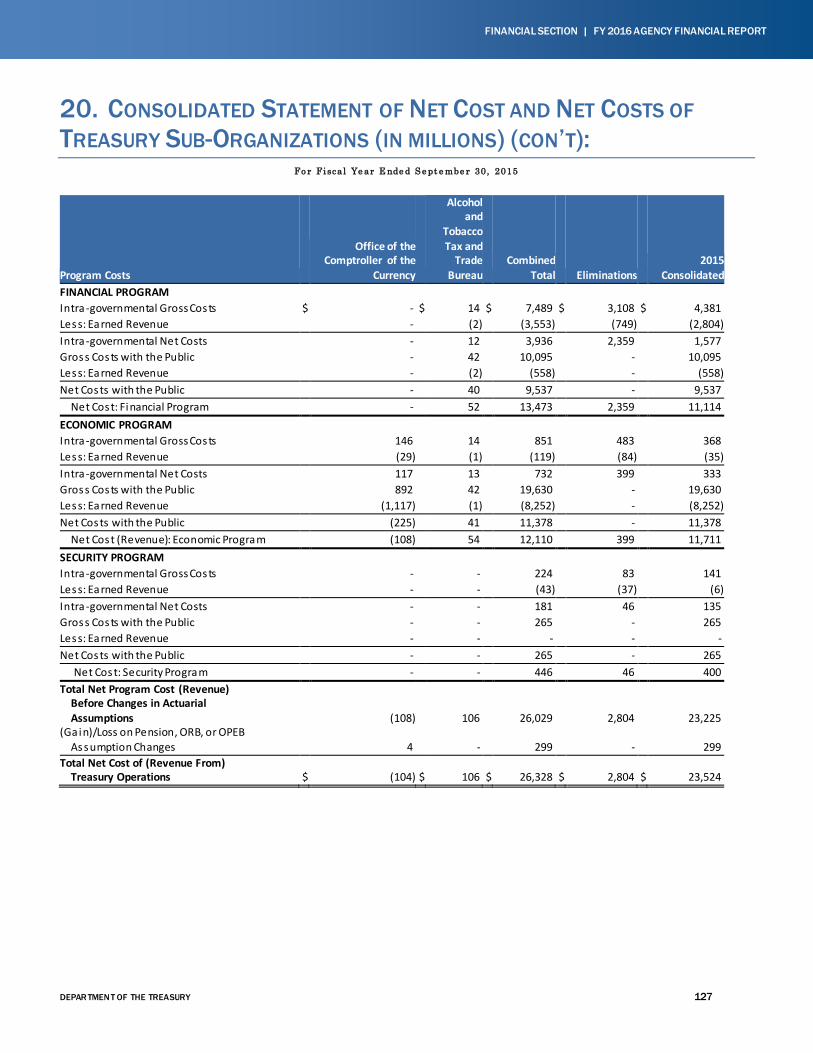
DEPAR TMEN T OF THE TREASURY 127
FINANCIAL SECTION | FY 2016 AGENCY FINANCIAL REPORT
20. CONSOLIDATED STATEMENT OF NET COST AND NET COSTS OF TREASURY SUB-ORGANIZATIONS (IN MILLIONS) (CON’T):
Fo r Fiscal Ye ar E nde d S e pt e mbe r 30, 2015
Program Costs
Office of the Comptroller of the
Currency
Alcohol and
Tobacco Tax and
Trade Bureau
Combined Total Eliminations
2015 Consolidated
FINANCIAL PROGRAM Intra-governmental Gross Costs $ - $ 14 $ 7,489 $ 3,108 $ 4,381 Less: Earned Revenue - (2) (3,553) (749) (2,804) Intra-governmental Net Costs - 12 3,936 2,359 1,577 Gross Costs with the Public - 42 10,095 - 10,095 Less: Earned Revenue - (2) (558) - (558) Net Costs with the Public - 40 9,537 - 9,537 Net Cost: Financial Program - 52 13,473 2,359 11,114 ECONOMIC PROGRAM Intra-governmental Gross Costs 146 14 851 483 368 Less: Earned Revenue (29) (1) (119) (84) (35) Intra-governmental Net Costs 117 13 732 399 333 Gross Costs with the Public 892 42 19,630 - 19,630 Less: Earned Revenue (1,117) (1) (8,252) - (8,252) Net Costs with the Public (225) 41 11,378 - 11,378 Net Cost (Revenue): Economic Program (108) 54 12,110 399 11,711 SECURITY PROGRAM Intra-governmental Gross Costs - - 224 83 141 Less: Earned Revenue - - (43) (37) (6) Intra-governmental Net Costs - - 181 46 135 Gross Costs with the Public - - 265 - 265 Less: Earned Revenue - - - - - Net Costs with the Public - - 265 - 265 Net Cost: Security Program - - 446 46 400 Total Net Program Cost (Revenue) Before Changes in Actuarial Assumptions (108) 106 26,029 2,804 23,225 (Gain)/Loss on Pension, ORB, or OPEB Assumption Changes 4 - 299 - 299 Total Net Cost of (Revenue From) Treasury Operations $ (104) $ 106 $ 26,328 $ 2,804 $ 23,524
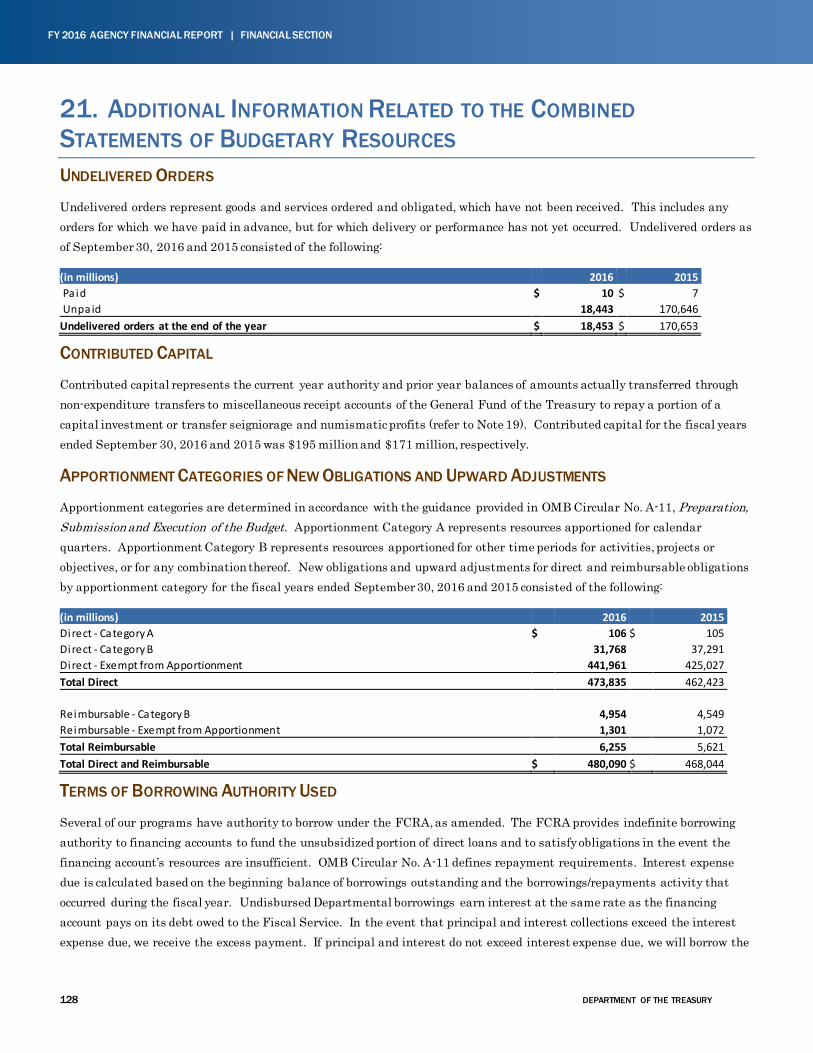
128 DEPARTMENT OF THE TREASURY
FY 2016 AGENCY FINANCIAL REPORT | FINANCIAL SECTION
21. ADDITIONAL INFORMATION RELATED TO THE COMBINED STATEMENTS OF BUDGETARY RESOURCES UNDELIVERED ORDERS
Undelivered orders represent goods and services ordered and obligated, which have not been received. This includes any orders for which we have paid in advance, but for which delivery or performance has not yet occurred. Undelivered orders as of September 30, 2016 and 2015 consisted of the following:
(in millions) 2016 2015 Pa id $ 10 $ 7 Unpaid 18,443 170,646 Undelivered orders at the end of the year $ 18,453 $ 170,653
CONTRIBUTED CAPITAL
Contributed capital represents the current year authority and prior year balances of amounts actually transferred through non-expenditure transfers to miscellaneous receipt accounts of the General Fund of the Treasury to repay a portion of a capital investment or transfer seigniorage and numismatic profits (refer to Note 19). Contributed capital for the fiscal years ended September 30, 2016 and 2015 was $195 million and $171 million, respectively.
APPORTIONMENT CATEGORIES OF NEW OBLIGATIONS AND UPWARD ADJUSTMENTS
Apportionment categories are determined in accordance with the guidance provided in OMB Circular No. A-11, Preparation, Submission and Execution of the Budget. Apportionment Category A represents resources apportioned for calendar quarters. Apportionment Category B represents resources apportioned for other time periods for activities, projects or objectives, or for any combination thereof. New obligations and upward adjustments for direct and reimbursable obligations by apportionment category for the fiscal years ended September 30, 2016 and 2015 consisted of the following:
(in millions) 2016 2015 Direct - Category A $ 106 $ 105 Di rect - Category B 31,768 37,291 Di rect - Exempt from Apportionment 441,961 425,027 Total Direct 473,835 462,423 Reimbursable - Category B 4,954 4,549 Reimbursable - Exempt from Apportionment 1,301 1,072 Total Reimbursable 6,255 5,621 Total Direct and Reimbursable $ 480,090 $ 468,044
TERMS OF BORROWING AUTHORITY USED
Several of our programs have authority to borrow under the FCRA, as amended. The FCRA provides indefinite borrowing authority to financing accounts to fund the unsubsidized portion of direct loans and to satisfy obligations in the event the financing account’s resources are insufficient. OMB Circular No. A-11 defines repayment requirements. Interest expense due is calculated based on the beginning balance of borrowings outstanding and the borrowings/repayments activity that occurred during the fiscal year. Undisbursed Departmental borrowings earn interest at the same rate as the financing account pays on its debt owed to the Fiscal Service. In the event that principal and interest collections exceed the interest expense due, we receive the excess payment. If principal and interest do not exceed interest expense due, we will borrow the
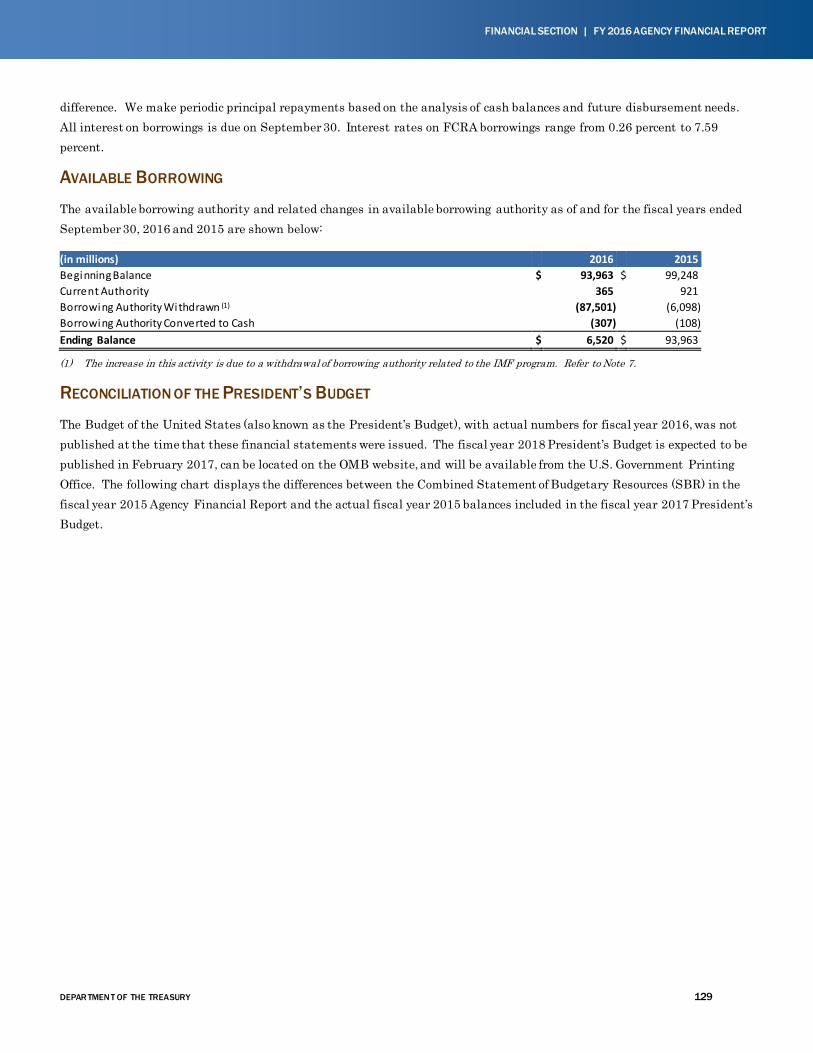
DEPAR TMEN T OF THE TREASURY 129
FINANCIAL SECTION | FY 2016 AGENCY FINANCIAL REPORT
difference. We make periodic principal repayments based on the analysis of cash balances and future disbursement needs. All interest on borrowings is due on September 30. Interest rates on FCRA borrowings range from 0.26 percent to 7.59 percent.
AVAILABLE BORROWING
The available borrowing authority and related changes in available borrowing authority as of and for the fiscal years ended September 30, 2016 and 2015 are shown below:
(in millions) 2016 2015 Beginning Balance $ 93,963 $ 99,248 Current Authority 365 921 Borrowing Authority Withdrawn (1) (87,501) (6,098) Borrowing Authority Converted to Cash (307) (108) Ending Balance $ 6,520 $ 93,963
(1) The increase in this activity is due to a withdrawal of borrowing authority related to the IMF program. Refer to Note 7.
RECONCILIATION OF THE PRESIDENT’S BUDGET
The Budget of the United States (also known as the President’s Budget), with actual numbers for fiscal year 2016, was not published at the time that these financial statements were issued. The fiscal year 2018 President’s Budget is expected to be published in February 2017, can be located on the OMB website, and will be available from the U.S. Government Printing Office. The following chart displays the differences between the Combined Statement of Budgetary Resources (SBR) in the fiscal year 2015 Agency Financial Report and the actual fiscal year 2015 balances included in the fiscal year 2017 President’s Budget.
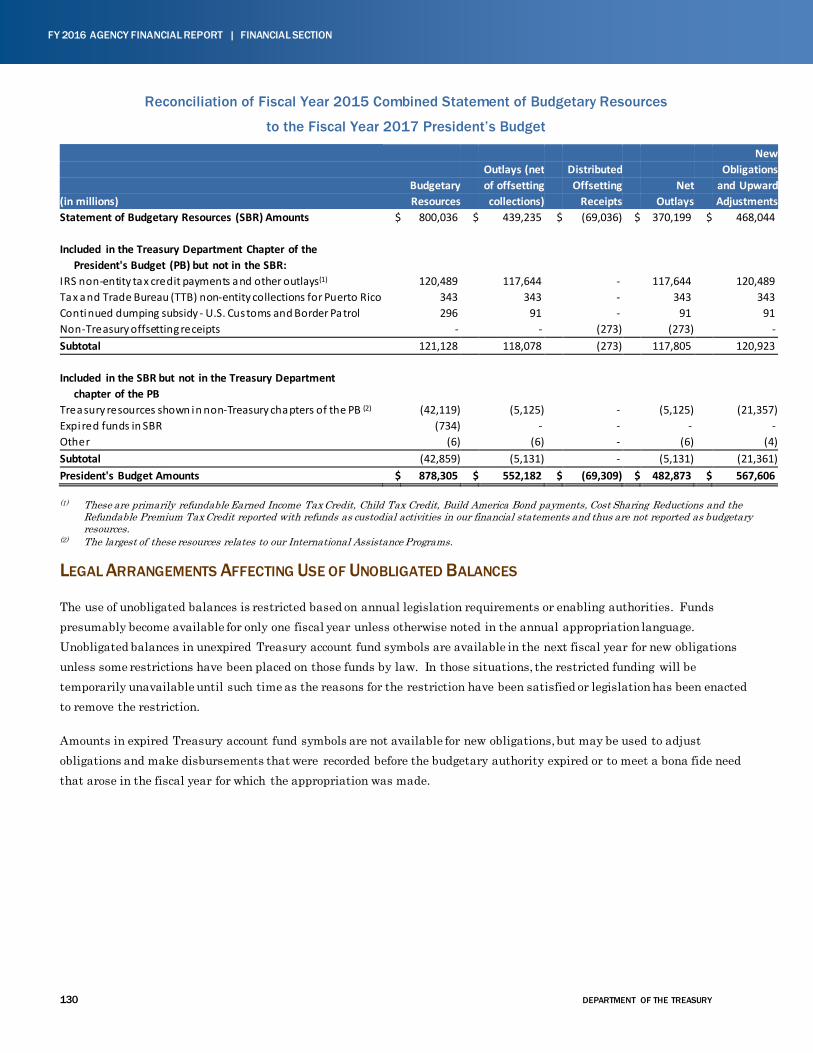
130 DEPARTMENT OF THE TREASURY
FY 2016 AGENCY FINANCIAL REPORT | FINANCIAL SECTION
Reconciliation of Fiscal Year 2015 Combined Statement of Budgetary Resources
to the Fiscal Year 2017 President’s Budget
New
Outlays (net Distributed Obligations Budgetary of offsetting Offsetting Net and Upward (in millions) Resources collections) Receipts Outlays Adjustments Statement of Budgetary Resources (SBR) Amounts $ 800,036 $ 439,235 $ (69,036) $ 370,199 $ 468,044
Included in the Treasury Department Chapter of the
President's Budget (PB) but not in the SBR:
IRS non-entity tax credit payments and other outlays(1) 120,489 117,644 - 117,644 120,489 Tax and Trade Bureau (TTB) non-entity collections for Puerto Rico 343 343 - 343 343 Continued dumping subsidy - U.S. Customs and Border Patrol 296 91 - 91 91 Non-Treasury offsetting receipts - - (273) (273) - Subtotal 121,128 118,078 (273) 117,805 120,923
Included in the SBR but not in the Treasury Department
chapter of the PB
Treasury resources shown in non-Treasury chapters of the PB (2) (42,119) (5,125) - (5,125) (21,357) Expired funds in SBR (734) - - - - Other (6) (6) - (6) (4) Subtotal (42,859) (5,131) - (5,131) (21,361) President's Budget Amounts $ 878,305 $ 552,182 $ (69,309) $ 482,873 $ 567,606
(1) These are primarily refundable Earned Income Tax Credit, Child Tax Credit, Build America Bond payments, Cost Sharing Reductions and the Refundable Premium Tax Credit reported with refunds as custodial activities in our financial statements and thus are not reported as budgetary resources.
(2) The largest of these resources relates to our International Assistance Programs.
LEGAL ARRANGEMENTS AFFECTING USE OF UNOBLIGATED BALANCES
The use of unobligated balances is restricted based on annual legislation requirements or enabling authorities. Funds presumably become available for only one fiscal year unless otherwise noted in the annual appropriation language. Unobligated balances in unexpired Treasury account fund symbols are available in the next fiscal year for new obligations unless some restrictions have been placed on those funds by law. In those situations, the restricted funding will be temporarily unavailable until such time as the reasons for the restriction have been satisfied or legislation has been enacted to remove the restriction.
Amounts in expired Treasury account fund symbols are not available for new obligations, but may be used to adjust obligations and make disbursements that were recorded before the budgetary authority expired or to meet a bona fide need that arose in the fiscal year for which the appropriation was made.
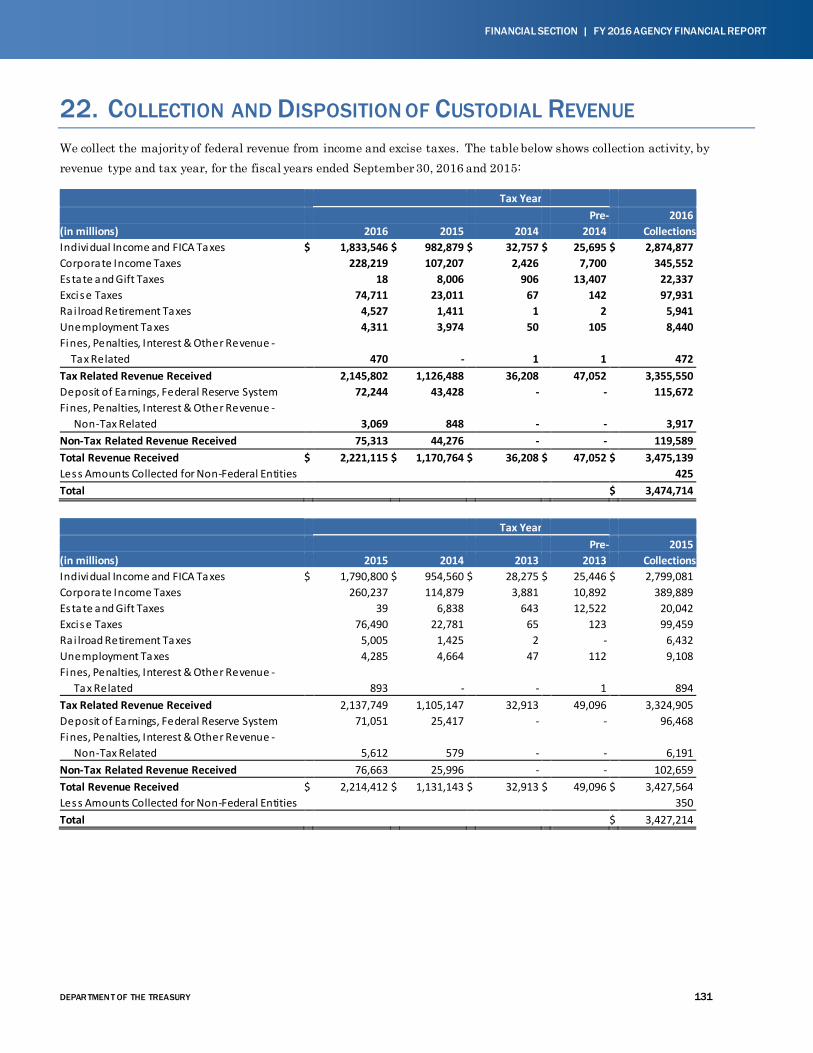
DEPAR TMEN T OF THE TREASURY 131
FINANCIAL SECTION | FY 2016 AGENCY FINANCIAL REPORT
22. COLLECTION AND DISPOSITION OF CUSTODIAL REVENUE We collect the majority of federal revenue from income and excise taxes. The table below shows collection activity, by revenue type and tax year, for the fiscal years ended September 30, 2016 and 2015:
Tax Year Pre- 2016 (in millions) 2016 2015 2014 2014 Collections Individual Income and FICA Taxes $ 1,833,546 $ 982,879 $ 32,757 $ 25,695 $ 2,874,877 Corporate Income Taxes 228,219 107,207 2,426 7,700 345,552 Estate and Gift Taxes 18 8,006 906 13,407 22,337 Excise Taxes 74,711 23,011 67 142 97,931 Rai lroad Retirement Taxes 4,527 1,411 1 2 5,941 Unemployment Taxes 4,311 3,974 50 105 8,440 Fines, Penalties, Interest & Other Revenue - Tax Related 470 - 1 1 472 Tax Related Revenue Received 2,145,802 1,126,488 36,208 47,052 3,355,550 Deposit of Earnings, Federal Reserve System 72,244 43,428 - - 115,672 Fines, Penalties, Interest & Other Revenue - Non-Tax Related 3,069 848 - - 3,917 Non-Tax Related Revenue Received 75,313 44,276 - - 119,589 Total Revenue Received $ 2,221,115 $ 1,170,764 $ 36,208 $ 47,052 $ 3,475,139 Less Amounts Collected for Non-Federal Entities 425 Total $ 3,474,714
Tax Year Pre- 2015 (in millions) 2015 2014 2013 2013 Collections Individual Income and FICA Taxes $ 1,790,800 $ 954,560 $ 28,275 $ 25,446 $ 2,799,081 Corporate Income Taxes 260,237 114,879 3,881 10,892 389,889 Es tate and Gift Taxes 39 6,838 643 12,522 20,042 Excise Taxes 76,490 22,781 65 123 99,459 Ra i lroad Retirement Taxes 5,005 1,425 2 - 6,432 Unemployment Taxes 4,285 4,664 47 112 9,108 Fines, Penalties, Interest & Other Revenue - Tax Related 893 - - 1 894 Tax Related Revenue Received 2,137,749 1,105,147 32,913 49,096 3,324,905 Deposit of Earnings, Federal Reserve System 71,051 25,417 - - 96,468 Fines, Penalties, Interest & Other Revenue - Non-Tax Related 5,612 579 - - 6,191 Non-Tax Related Revenue Received 76,663 25,996 - - 102,659 Total Revenue Received $ 2,214,412 $ 1,131,143 $ 32,913 $ 49,096 $ 3,427,564 Less Amounts Collected for Non-Federal Entities 350 Total $ 3,427,214
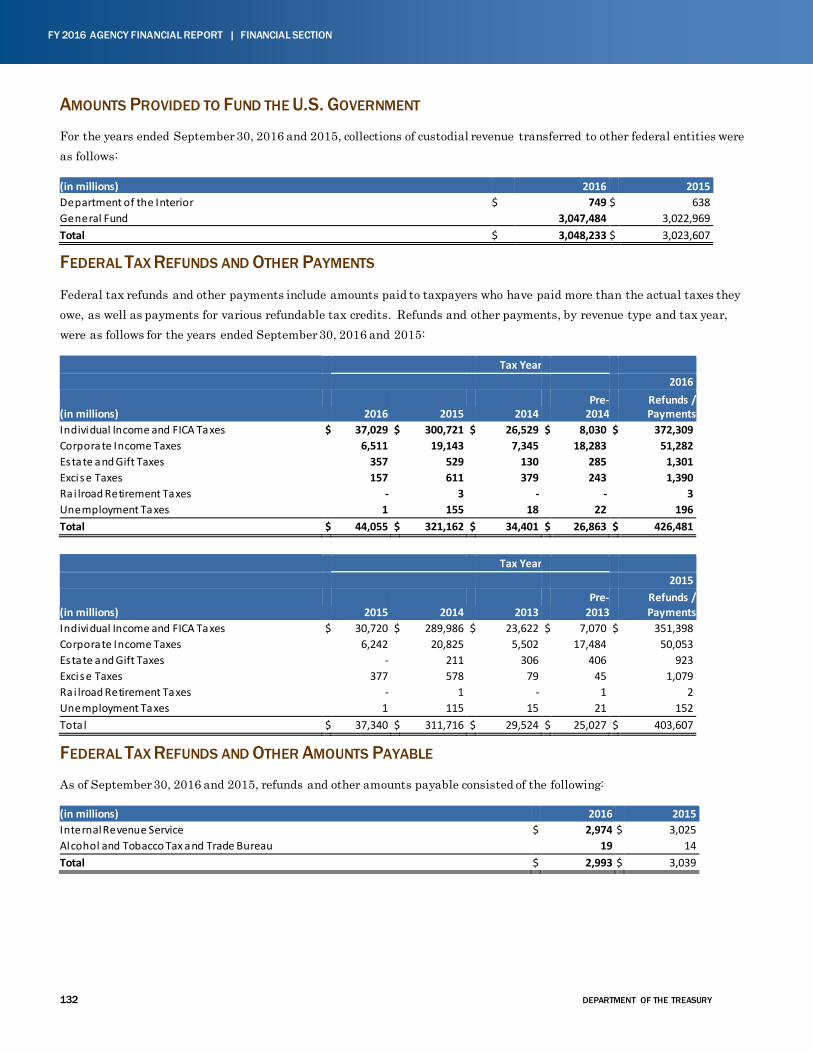
132 DEPARTMENT OF THE TREASURY
FY 2016 AGENCY FINANCIAL REPORT | FINANCIAL SECTION
AMOUNTS PROVIDED TO FUND THE U.S. GOVERNMENT
For the years ended September 30, 2016 and 2015, collections of custodial revenue transferred to other federal entities were as follows:
(in millions) 2016 2015 Department of the Interior $ 749 $ 638 General Fund 3,047,484 3,022,969 Total $ 3,048,233 $ 3,023,607
FEDERAL TAX REFUNDS AND OTHER PAYMENTS
Federal tax refunds and other payments include amounts paid to taxpayers who have paid more than the actual taxes they owe, as well as payments for various refundable tax credits. Refunds and other payments, by revenue type and tax year, were as follows for the years ended September 30, 2016 and 2015:
Tax Year 2016
(in millions) 2016 2015 2014 Pre-
2014 Refunds / Payments
Individual Income and FICA Taxes $ 37,029 $ 300,721 $ 26,529 $ 8,030 $ 372,309 Corporate Income Taxes 6,511 19,143 7,345 18,283 51,282 Estate and Gift Taxes 357 529 130 285 1,301 Excise Taxes 157 611 379 243 1,390 Rai lroad Retirement Taxes - 3 - - 3 Unemployment Taxes 1 155 18 22 196 Total $ 44,055 $ 321,162 $ 34,401 $ 26,863 $ 426,481
Tax Year 2015
(in millions) 2015 2014 2013 Pre-
2013 Refunds / Payments
Individual Income and FICA Taxes $ 30,720 $ 289,986 $ 23,622 $ 7,070 $ 351,398 Corporate Income Taxes 6,242 20,825 5,502 17,484 50,053 Es tate and Gift Taxes - 211 306 406 923 Excise Taxes 377 578 79 45 1,079 Ra i lroad Retirement Taxes - 1 - 1 2 Unemployment Taxes 1 115 15 21 152 Tota l $ 37,340 $ 311,716 $ 29,524 $ 25,027 $ 403,607
FEDERAL TAX REFUNDS AND OTHER AMOUNTS PAYABLE
As of September 30, 2016 and 2015, refunds and other amounts payable consisted of the following:
(in millions) 2016 2015 Internal Revenue Service $ 2,974 $ 3,025 Alcohol and Tobacco Tax and Trade Bureau 19 14 Total $ 2,993 $ 3,039
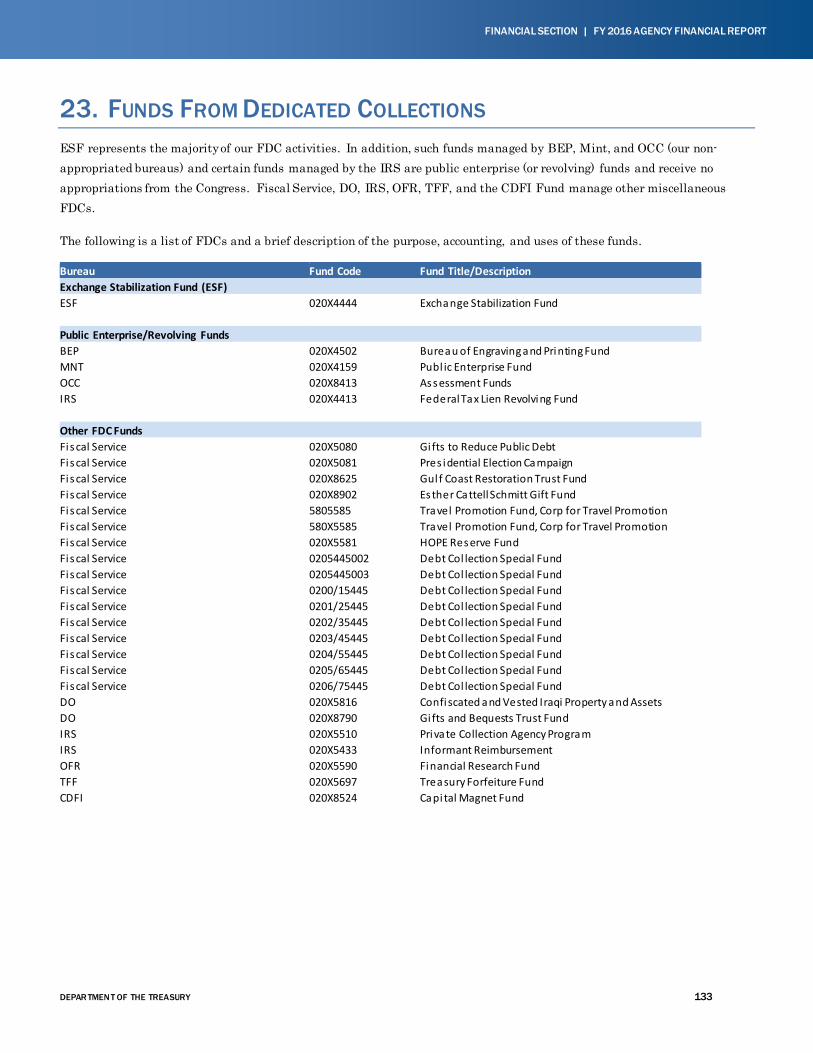
DEPAR TMEN T OF THE TREASURY 133
FINANCIAL SECTION | FY 2016 AGENCY FINANCIAL REPORT
23. FUNDS FROM DEDICATED COLLECTIONS ESF represents the majority of our FDC activities. In addition, such funds managed by BEP, Mint, and OCC (our non-appropriated bureaus) and certain funds managed by the IRS are public enterprise (or revolving) funds and receive no appropriations from the Congress. Fiscal Service, DO, IRS, OFR, TFF, and the CDFI Fund manage other miscellaneous FDCs.
The following is a list of FDCs and a brief description of the purpose, accounting, and uses of these funds.
Bureau Fund Code Fund Title/Description Exchange Stabilization Fund (ESF) ESF 020X4444 Exchange Stabilization Fund Public Enterprise/Revolving Funds BEP 020X4502 Bureau of Engraving and Printing Fund MNT 020X4159 Publ ic Enterprise Fund OCC 020X8413 Assessment Funds IRS 020X4413 Federal Tax Lien Revolving Fund Other FDC Funds Fiscal Service 020X5080 Gi fts to Reduce Public Debt Fiscal Service 020X5081 Pres idential Election Campaign Fiscal Service 020X8625 Gul f Coast Restoration Trust Fund Fiscal Service 020X8902 Esther Cattell Schmitt Gift Fund Fiscal Service 5805585 Travel Promotion Fund, Corp for Travel Promotion Fiscal Service 580X5585 Travel Promotion Fund, Corp for Travel Promotion Fiscal Service 020X5581 HOPE Reserve Fund Fiscal Service 0205445002 Debt Col lection Special Fund Fiscal Service 0205445003 Debt Col lection Special Fund Fiscal Service 0200/15445 Debt Col lection Special Fund Fiscal Service 0201/25445 Debt Col lection Special Fund Fiscal Service 0202/35445 Debt Col lection Special Fund Fiscal Service 0203/45445 Debt Col lection Special Fund Fi scal Service 0204/55445 Debt Col lection Special Fund Fiscal Service 0205/65445 Debt Col lection Special Fund Fiscal Service 0206/75445 Debt Col lection Special Fund DO 020X5816 Confiscated and Vested Iraqi Property and Assets DO 020X8790 Gi fts and Bequests Trust Fund IRS 020X5510 Private Collection Agency Program IRS 020X5433 Informant Reimbursement OFR 020X5590 Financial Research Fund TFF 020X5697 Treasury Forfeiture Fund CDFI 020X8524 Capital Magnet Fund
134 DEPARTMENT OF THE TREASURY
FY 2016 AGENCY FINANCIAL REPORT | FINANCIAL SECTION
Pursuant to the legal authority found in Section 10 of the Gold Reserve Act of 1934, as amended, the ESF may purchase or sell foreign currencies, hold U.S. foreign exchange and SDR assets, and may provide financing to foreign governments and foreign entities. The ESF accounts for and reports its holdings to the Fiscal Service on the Standard Form 224, “Statement of Transactions,” and provides other reports to Congress. Interest on SDRs in the IMF, investments in Treasury securities, and investments in foreign currency assets are ESF’s primary sources of revenue. The ESF’s earnings and realized gains on foreign currency assets represent inflows of resources to the government, and the interest revenues earned from U.S. Securities are the result of intra-Departmental flows.
The BEP, Mint, OCC, and IRS operate “public enterprise/revolving funds” to account for their respective revenues and expenses. 31 USC § 5142 established the revolving fund for BEP to account for revenue and expenses related to the currency printing activities. P.L. 104-52 (31 USC § 5136) established the Public Enterprise Fund for the Mint to account for all revenue and expenses related to the production and sale of numismatic products and circulating coinage. Revenues and other financing sources at the Mint are mainly from the sale of numismatic and bullion products and the sale of circulating coins to the FRB system. These revenues represent inflows of resources to the government. 12 USC § 481 established the Assessment Funds for OCC. Revenue and financing sources are from the bank examinations and assessments for the oversight of the national banks, savings associations, and savings and loan holding companies. These non-appropriated funds contribute to the inflows of resources to the government to specifically fund these entities’ operations. 26 USC § 7810 established the Federal Tax Lien Revolving Fund to account for revenue and expenses from the sale of property foreclosed upon by a holder of a lien. Such revenue represents inflows of resources to the federal government. There are minimal transactions with other government agencies.
There are other FDCs at several of our bureaus, such as donations to the Presidential Election Campaign Fund, gifts to reduce the public debt, and other enforcement related activities. Public laws and the U.S. Code established and authorized the use of these funds. Sources of revenues and other financing sources include contributions, cash and property forfeited in enforcement activities, public donations, and other allocations, all which represent inflows to the government.
INTRA-GOVERNMENTAL INVESTMENTS IN TREASURY SECURITIES
The U.S. government does not set aside assets to pay future benefits or other expenditures associated with FDCs. Our bureaus and other federal agencies invest some of the funds that they collect from the public, if they have the statutory authority to do so, in securities issued by the Fiscal Service. The Fiscal Service collects cash and makes deposits in the General Fund, which then uses the cash for general government purposes.
The investments provide our bureaus and other federal agencies with authority to draw upon the General Fund to make future benefit payments or other expenditures. When our bureaus or other federal agencies require redemption of these securities to make expenditures, the government finances those redemptions out of accumulated cash balances, by raising taxes or other receipts, by borrowing from the public or repaying less debt, or by curtailing other expenditures. This is the same way that the government finances all other expenditures.
The securities are an asset to our bureaus and other federal agencies and a liability of the Fiscal Service. The General Fund is liable to the Fiscal Service. Because our bureaus and other federal agencies are parts of the U.S. government, these assets and liabilities offset each other from the standpoint of the government as a whole. For this reason, they do not represent an asset or a liability in the U.S. government-wide financial statements.

DEPAR TMEN T OF THE TREASURY 135
FINANCIAL SECTION | FY 2016 AGENCY FINANCIAL REPORT
Our financial statements do not display the balances related to the investments made by our bureaus because the bureaus are subcomponents of the Department. However, the General Fund remains liable to the Fiscal Service for the invested balances and the Fiscal Service remains liable to the investing bureaus (refer to Note 4).
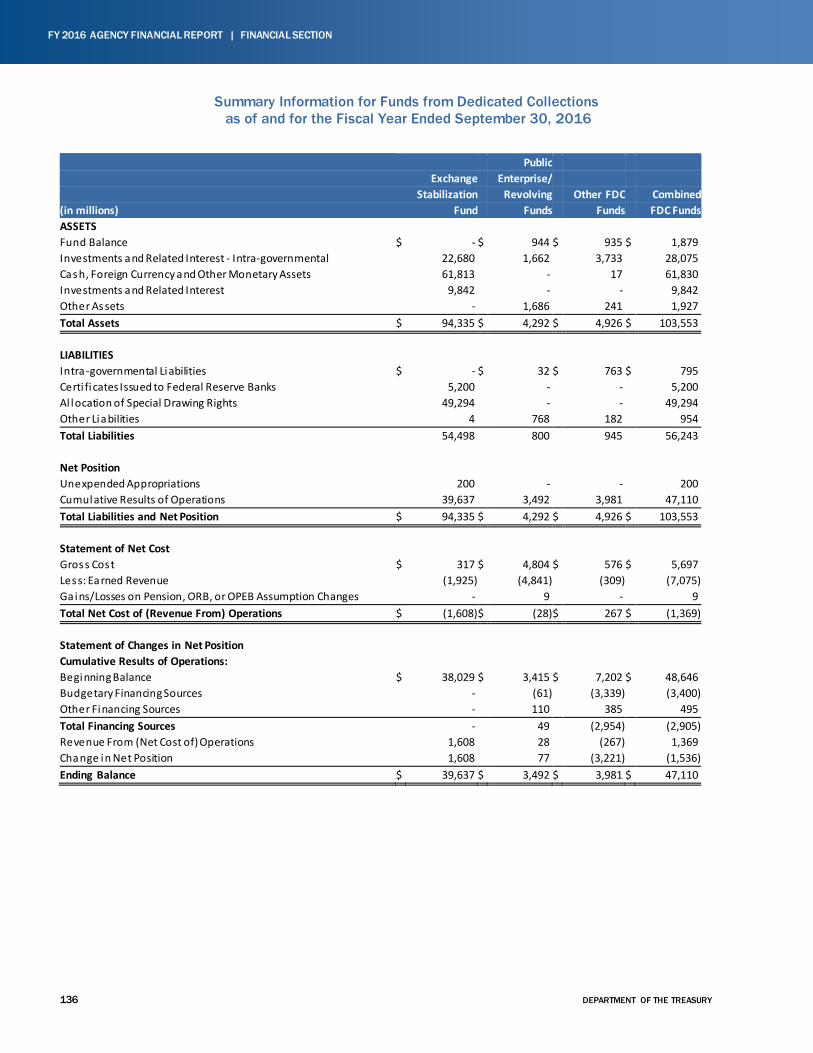
136 DEPARTMENT OF THE TREASURY
FY 2016 AGENCY FINANCIAL REPORT | FINANCIAL SECTION
Summary Information for Funds from Dedicated Collections as of and for the Fiscal Year Ended September 30, 2016
Public Exchange Enterprise/ Stabilization Revolving Other FDC Combined (in millions) Fund Funds Funds FDC Funds ASSETS Fund Balance $ - $ 944 $ 935 $ 1,879 Investments and Related Interest - Intra-governmental 22,680 1,662 3,733 28,075 Cash, Foreign Currency and Other Monetary Assets 61,813 - 17 61,830 Investments and Related Interest 9,842 - - 9,842 Other Assets - 1,686 241 1,927 Total Assets $ 94,335 $ 4,292 $ 4,926 $ 103,553 LIABILITIES Intra-governmental Liabilities $ - $ 32 $ 763 $ 795 Certi fi cates Issued to Federal Reserve Banks 5,200 - - 5,200 Al location of Special Drawing Rights 49,294 - - 49,294 Other Liabilities 4 768 182 954 Total Liabilities 54,498 800 945 56,243 Net Position Unexpended Appropriations 200 - - 200 Cumulative Results of Operations 39,637 3,492 3,981 47,110 Total Liabilities and Net Position $ 94,335 $ 4,292 $ 4,926 $ 103,553 Statement of Net Cost Gross Cost $ 317 $ 4,804 $ 576 $ 5,697 Less: Earned Revenue (1,925) (4,841) (309) (7,075) Gains/Losses on Pension, ORB, or OPEB Assumption Changes - 9 - 9 Total Net Cost of (Revenue From) Operations $ (1,608) $ (28) $ 267 $ (1,369) Statement of Changes in Net Position Cumulative Results of Operations: Beginning Balance $ 38,029 $ 3,415 $ 7,202 $ 48,646 Budgetary Financing Sources - (61) (3,339) (3,400) Other Financing Sources - 110 385 495 Total Financing Sources - 49 (2,954) (2,905) Revenue From (Net Cost of) Operations 1,608 28 (267) 1,369 Change in Net Position 1,608 77 (3,221) (1,536) Ending Balance $ 39,637 $ 3,492 $ 3,981 $ 47,110
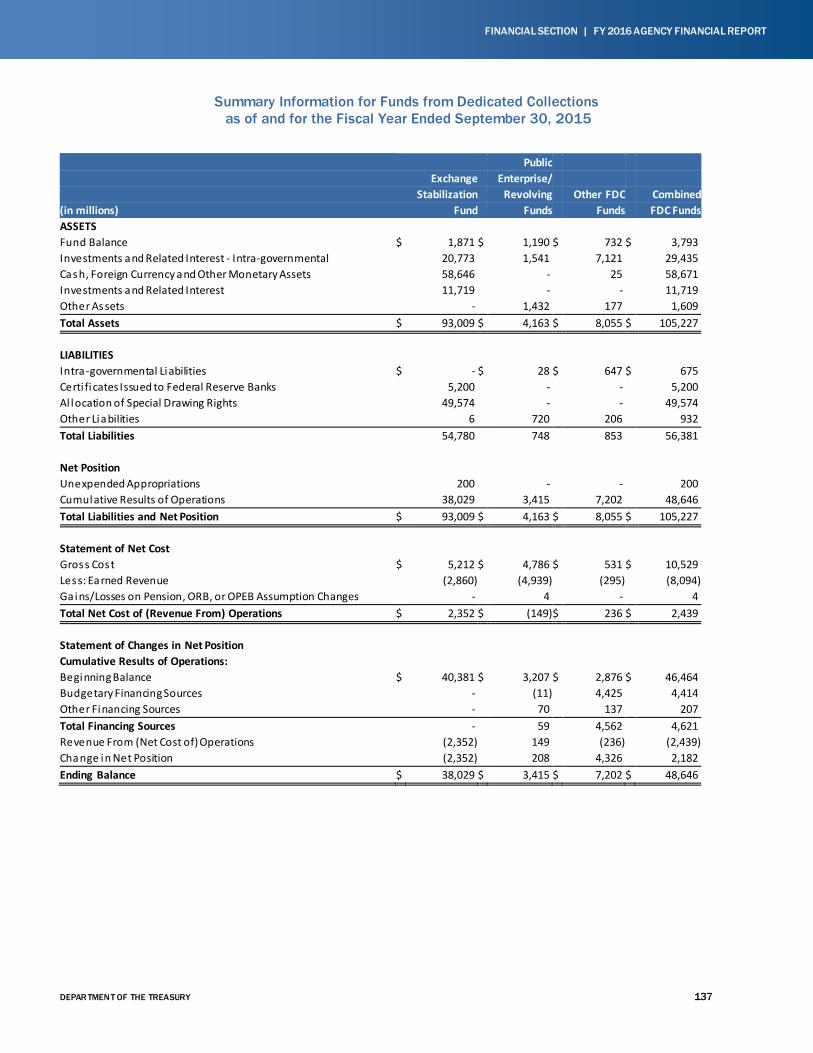
DEPAR TMEN T OF THE TREASURY 137
FINANCIAL SECTION | FY 2016 AGENCY FINANCIAL REPORT
Summary Information for Funds from Dedicated Collections as of and for the Fiscal Year Ended September 30, 2015
Public Exchange Enterprise/ Stabilization Revolving Other FDC Combined (in millions) Fund Funds Funds FDC Funds ASSETS Fund Balance $ 1,871 $ 1,190 $ 732 $ 3,793 Investments and Related Interest - Intra-governmental 20,773 1,541 7,121 29,435 Cash, Foreign Currency and Other Monetary Assets 58,646 - 25 58,671 Investments and Related Interest 11,719 - - 11,719 Other Assets - 1,432 177 1,609 Total Assets $ 93,009 $ 4,163 $ 8,055 $ 105,227 LIABILITIES Intra-governmental Liabilities $ - $ 28 $ 647 $ 675 Certi fi cates Issued to Federal Reserve Banks 5,200 - - 5,200 Al location of Special Drawing Rights 49,574 - - 49,574 Other Liabilities 6 720 206 932 Total Liabilities 54,780 748 853 56,381 Net Position Unexpended Appropriations 200 - - 200 Cumulative Results of Operations 38,029 3,415 7,202 48,646 Total Liabilities and Net Position $ 93,009 $ 4,163 $ 8,055 $ 105,227 Statement of Net Cost Gross Cost $ 5,212 $ 4,786 $ 531 $ 10,529 Less: Earned Revenue (2,860) (4,939) (295) (8,094) Gains/Losses on Pension, ORB, or OPEB Assumption Changes - 4 - 4 Total Net Cost of (Revenue From) Operations $ 2,352 $ (149) $ 236 $ 2,439 Statement of Changes in Net Position Cumulative Results of Operations: Beginning Balance $ 40,381 $ 3,207 $ 2,876 $ 46,464 Budgetary Financing Sources - (11) 4,425 4,414 Other Financing Sources - 70 137 207 Total Financing Sources - 59 4,562 4,621 Revenue From (Net Cost of) Operations (2,352) 149 (236) (2,439) Change in Net Position (2,352) 208 4,326 2,182 Ending Balance $ 38,029 $ 3,415 $ 7,202 $ 48,646
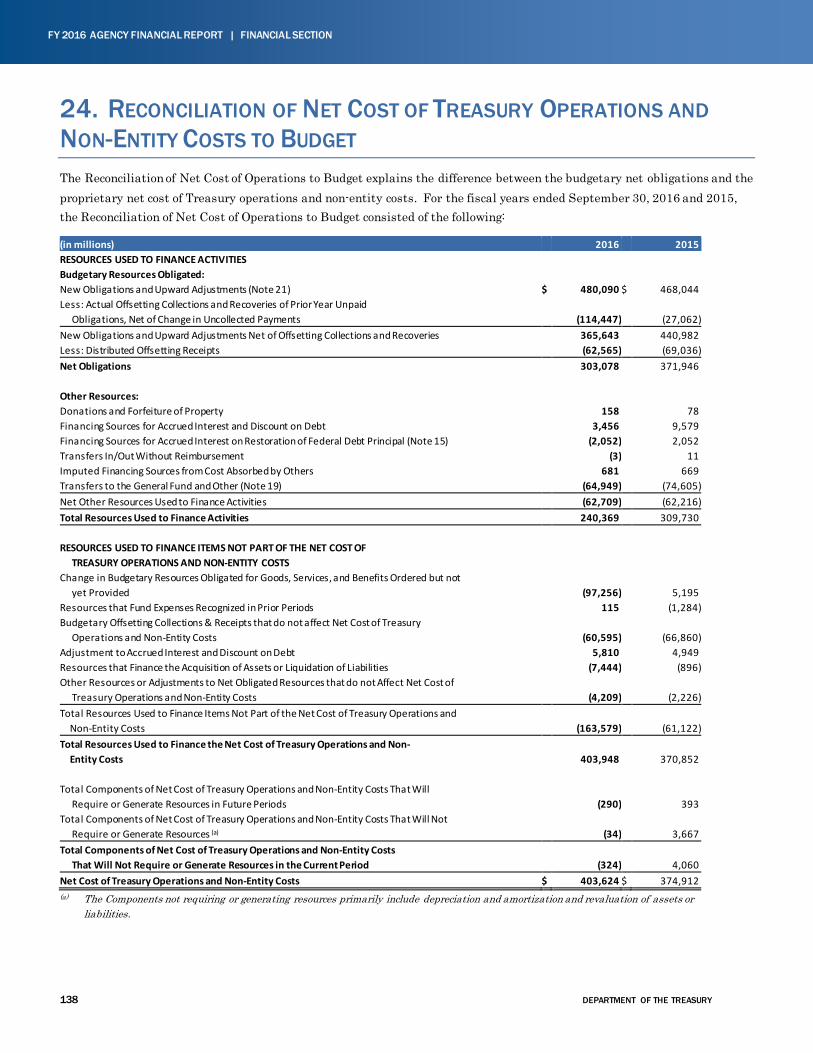
138 DEPARTMENT OF THE TREASURY
FY 2016 AGENCY FINANCIAL REPORT | FINANCIAL SECTION
24. RECONCILIATION OF NET COST OF TREASURY OPERATIONS AND NON-ENTITY COSTS TO BUDGET The Reconciliation of Net Cost of Operations to Budget explains the difference between the budgetary net obligations and the proprietary net cost of Treasury operations and non-entity costs. For the fiscal years ended September 30, 2016 and 2015, the Reconciliation of Net Cost of Operations to Budget consisted of the following:
(in millions) 2016 2015 RESOURCES USED TO FINANCE ACTIVITIES
Budgetary Resources Obligated:
New Obligations and Upward Adjustments (Note 21) $ 480,090 $ 468,044 Less: Actual Offsetting Collections and Recoveries of Prior Year Unpaid
Obligations, Net of Change in Uncollected Payments (114,447) (27,062) New Obligations and Upward Adjustments Net of Offsetting Collections and Recoveries 365,643 440,982 Less: Distributed Offsetting Receipts (62,565) (69,036) Net Obligations 303,078 371,946
Other Resources:
Donations and Forfeiture of Property 158 78 Financing Sources for Accrued Interest and Discount on Debt 3,456 9,579 Financing Sources for Accrued Interest on Restoration of Federal Debt Principal (Note 15) (2,052) 2,052 Transfers In/Out Without Reimbursement (3) 11 Imputed Financing Sources from Cost Absorbed by Others 681 669 Transfers to the General Fund and Other (Note 19) (64,949) (74,605) Net Other Resources Used to Finance Activities (62,709) (62,216) Total Resources Used to Finance Activities 240,369 309,730
RESOURCES USED TO FINANCE ITEMS NOT PART OF THE NET COST OF
TREASURY OPERATIONS AND NON-ENTITY COSTS
Change in Budgetary Resources Obligated for Goods, Services, and Benefits Ordered but not
yet Provided (97,256) 5,195 Resources that Fund Expenses Recognized in Prior Periods 115 (1,284) Budgetary Offsetting Collections & Receipts that do not affect Net Cost of Treasury
Operations and Non-Entity Costs (60,595) (66,860) Adjustment to Accrued Interest and Discount on Debt 5,810 4,949 Resources that Finance the Acquisition of Assets or Liquidation of Liabilities (7,444) (896) Other Resources or Adjustments to Net Obligated Resources that do not Affect Net Cost of
Treasury Operations and Non-Entity Costs (4,209) (2,226) Total Resources Used to Finance Items Not Part of the Net Cost of Treasury Operations and
Non-Entity Costs (163,579) (61,122) Total Resources Used to Finance the Net Cost of Treasury Operations and Non-
Entity Costs 403,948 370,852
Total Components of Net Cost of Treasury Operations and Non-Entity Costs That Will
Require or Generate Resources in Future Periods (290) 393 Total Components of Net Cost of Treasury Operations and Non-Entity Costs That Will Not
Require or Generate Resources (a) (34) 3,667 Total Components of Net Cost of Treasury Operations and Non-Entity Costs
That Will Not Require or Generate Resources in the Current Period (324) 4,060 Net Cost of Treasury Operations and Non-Entity Costs $ 403,624 $ 374,912 (a) The Components not requiring or generating resources primarily include depreciation and amortization and revaluation of assets or
liabilities.
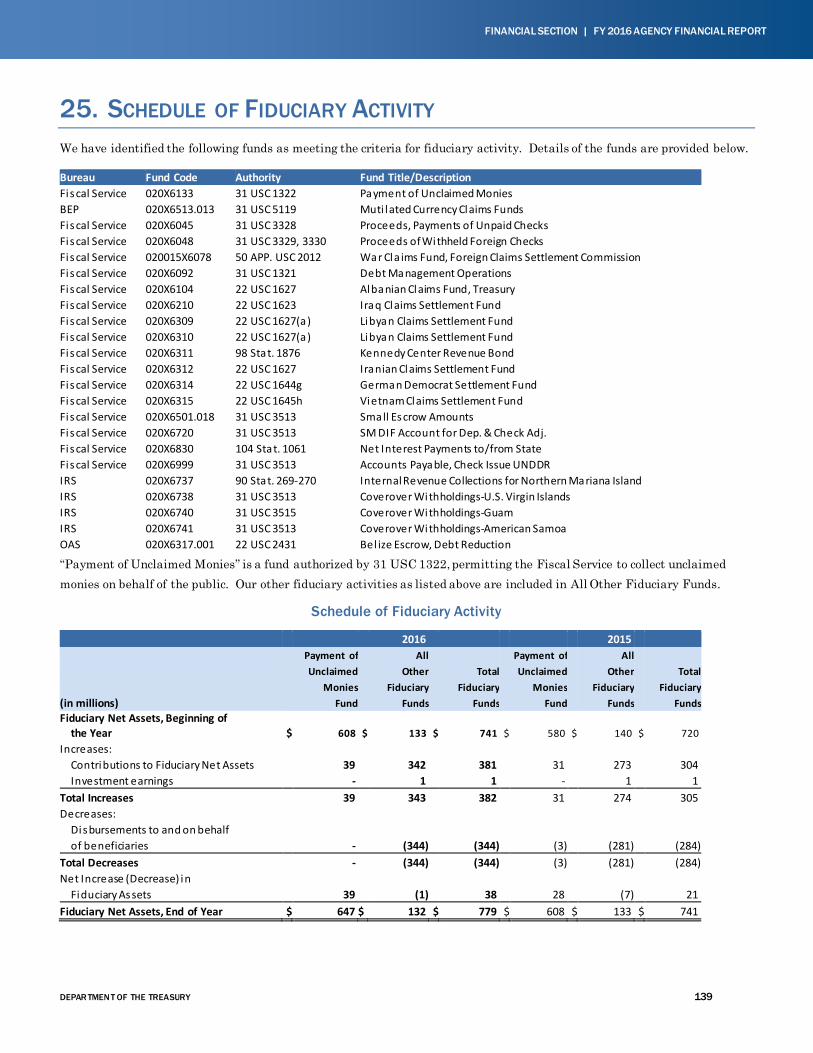
DEPAR TMEN T OF THE TREASURY 139
FINANCIAL SECTION | FY 2016 AGENCY FINANCIAL REPORT
25. SCHEDULE OF FIDUCIARY ACTIVITY We have identified the following funds as meeting the criteria for fiduciary activity. Details of the funds are provided below.
Bureau Fund Code Authority Fund Title/Description Fiscal Service 020X6133 31 USC 1322 Payment of Unclaimed Monies BEP 020X6513.013 31 USC 5119 Muti lated Currency Claims Funds Fiscal Service 020X6045 31 USC 3328 Proceeds, Payments of Unpaid Checks Fiscal Service 020X6048 31 USC 3329, 3330 Proceeds of Withheld Foreign Checks Fiscal Service 020015X6078 50 APP. USC 2012 War Cla ims Fund, Foreign Claims Settlement Commission Fiscal Service 020X6092 31 USC 1321 Debt Management Operations Fiscal Service 020X6104 22 USC 1627 Albanian Claims Fund, Treasury Fiscal Service 020X6210 22 USC 1623 Iraq Claims Settlement Fund Fiscal Service 020X6309 22 USC 1627(a) Libyan Claims Settlement Fund Fiscal Service 020X6310 22 USC 1627(a) Libyan Claims Settlement Fund Fiscal Service 020X6311 98 Stat. 1876 Kennedy Center Revenue Bond Fiscal Service 020X6312 22 USC 1627 Iranian Claims Settlement Fund Fiscal Service 020X6314 22 USC 1644g German Democrat Settlement Fund Fiscal Service 020X6315 22 USC 1645h Vietnam Claims Settlement Fund Fiscal Service 020X6501.018 31 USC 3513 Small Escrow Amounts Fiscal Service 020X6720 31 USC 3513 SM DIF Account for Dep. & Check Adj. Fi scal Service 020X6830 104 Stat. 1061 Net Interest Payments to/from State Fiscal Service 020X6999 31 USC 3513 Accounts Payable, Check Issue UNDDR IRS 020X6737 90 Stat. 269-270 Internal Revenue Collections for Northern Mariana Island IRS 020X6738 31 USC 3513 Coverover Withholdings-U.S. Virgin Islands IRS 020X6740 31 USC 3515 Coverover Withholdings-Guam IRS 020X6741 31 USC 3513 Coverover Withholdings-American Samoa OAS 020X6317.001 22 USC 2431 Bel ize Escrow, Debt Reduction
“Payment of Unclaimed Monies” is a fund authorized by 31 USC 1322, permitting the Fiscal Service to collect unclaimed monies on behalf of the public. Our other fiduciary activities as listed above are included in All Other Fiduciary Funds.
Schedule of Fiduciary Activity
2016 2015 Payment of All Payment of All Unclaimed Other Total Unclaimed Other Total Monies Fiduciary Fiduciary Monies Fiduciary Fiduciary (in millions) Fund Funds Funds Fund Funds Funds Fiduciary Net Assets, Beginning of the Year $ 608 $ 133 $ 741 $ 580 $ 140 $ 720 Increases: Contributions to Fiduciary Net Assets 39 342 381 31 273 304 Investment earnings - 1 1 - 1 1 Total Increases 39 343 382 31 274 305 Decreases: Disbursements to and on behalf of beneficiaries - (344) (344) (3) (281) (284) Total Decreases - (344) (344) (3) (281) (284) Net Increase (Decrease) in Fiduciary Assets 39 (1) 38 28 (7) 21 Fiduciary Net Assets, End of Year $ 647 $ 132 $ 779 $ 608 $ 133 $ 741
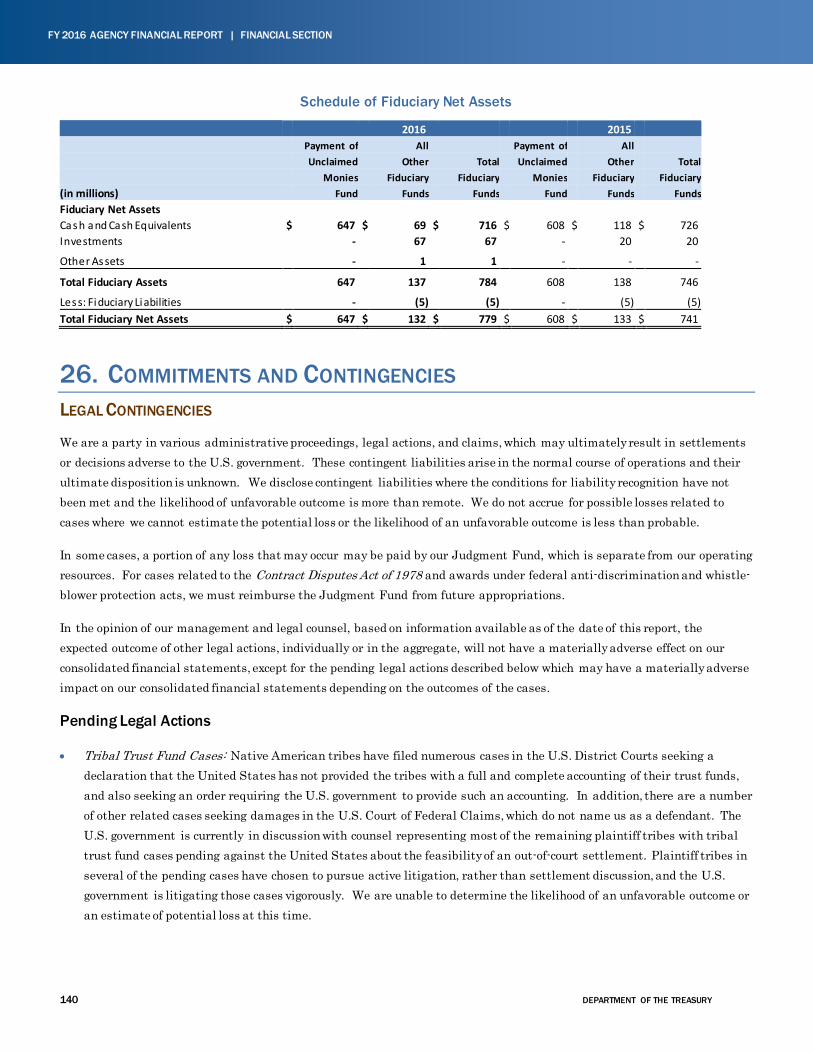
140 DEPARTMENT OF THE TREASURY
FY 2016 AGENCY FINANCIAL REPORT | FINANCIAL SECTION
Schedule of Fiduciary Net Assets
2016 2015 Payment of All Payment of All Unclaimed Other Total Unclaimed Other Total Monies Fiduciary Fiduciary Monies Fiduciary Fiduciary (in millions) Fund Funds Funds Fund Funds Funds Fiduciary Net Assets Cash and Cash Equivalents $ 647 $ 69 $ 716 $ 608 $ 118 $ 726 Investments - 67 67 - 20 20
Other Assets - 1 1 - - -
Total Fiduciary Assets 647 137 784 608 138 746
Less: Fiduciary Liabilities - (5) (5) - (5) (5) Total Fiduciary Net Assets $ 647 $ 132 $ 779 $ 608 $ 133 $ 741
26. COMMITMENTS AND CONTINGENCIES LEGAL CONTINGENCIES
We are a party in various administrative proceedings, legal actions, and claims, which may ultimately result in settlements or decisions adverse to the U.S. government. These contingent liabilities arise in the normal course of operations and their ultimate disposition is unknown. We disclose contingent liabilities where the conditions for liability recognition have not been met and the likelihood of unfavorable outcome is more than remote. We do not accrue for possible losses related to cases where we cannot estimate the potential loss or the likelihood of an unfavorable outcome is less than probable.
In some cases, a portion of any loss that may occur may be paid by our Judgment Fund, which is separate from our operating resources. For cases related to the Contract Disputes Act of 1978 and awards under federal anti-discrimination and whistle-blower protection acts, we must reimburse the Judgment Fund from future appropriations.
In the opinion of our management and legal counsel, based on information available as of the date of this report, the expected outcome of other legal actions, individually or in the aggregate, will not have a materially adverse effect on our consolidated financial statements, except for the pending legal actions described below which may have a materially adverse impact on our consolidated financial statements depending on the outcomes of the cases.
Pending Legal Actions
• Tribal Trust Fund Cases: Native American tribes have filed numerous cases in the U.S. District Courts seeking a declaration that the United States has not provided the tribes with a full and complete accounting of their trust funds, and also seeking an order requiring the U.S. government to provide such an accounting. In addition, there are a number of other related cases seeking damages in the U.S. Court of Federal Claims, which do not name us as a defendant. The U.S. government is currently in discussion with counsel representing most of the remaining plaintiff tribes with tribal trust fund cases pending against the United States about the feasibility of an out-of-court settlement. Plaintiff tribes in several of the pending cases have chosen to pursue active litigation, rather than settlement discussion, and the U.S. government is litigating those cases vigorously. We are unable to determine the likelihood of an unfavorable outcome or an estimate of potential loss at this time.
DEPAR TMEN T OF THE TREASURY 141
FINANCIAL SECTION | FY 2016 AGENCY FINANCIAL REPORT
• GSE Related Cases: A number of cases were filed in the U.S. Court of Federal Claims, the U.S. District Court for the District of Columbia, the U.S. District Court for the District of Delaware, the U.S. District Court for the Northern District of Illinois, the U.S. District Court for the Northern District of Iowa, the U.S. District Court for the Eastern District of Kentucky, and the U.S. District Court for the Southern District of Texas, in which the plaintiffs allege, among other things, that the U.S. government took their property and contractual rights as preferred and common stockholders when the third amendments to the SPSPAs between us and each GSE were executed in August 2012 (refer to Note 10). One case also alleges that the U.S. government took plaintiffs’ property and contractual rights when the GSEs were placed into conservatorship and entered into the SPSPAs with us in September 2008. In the Court of Federal Claims, the plaintiffs seek just compensation (damages) from the U.S. government. In the District Courts, the plaintiffs seek to set aside the third amendments to the SPSPAs as well as damages. On September 30, 2014, the D.C. District Court granted the defendants’ motions to dismiss four cases pending in that court, and the plaintiffs filed appeals in October 2014 which are still pending. An additional case is pending in the D.C. District Court. On September 9, 2016, the U.S. District Court for the Eastern District of Kentucky granted the defendants’ motion to dismiss, and the plaintiffs filed a notice of appeal on November 14, 2016. We are unable to determine the likelihood of an unfavorable outcome or an estimate of potential loss in the remaining cases at this time.
• Starr International Co., Inc. v. United States: The plaintiff, an American International Group, Inc. (AIG) shareholder, brought suit on behalf of two classes of shareholders. The suit alleges that the U.S. government violated the Fifth Amendment to the United States Constitution by illegally exacting or taking property without just compensation. One class, the Credit Agreement Class, claimed the U.S. government violated the Fifth Amendment when it conveyed a majority share of AIG’s equity and voting rights in connection with an $85 billion loan to AIG during the 2008 financial crisis. Starr also asserted a Fifth Amendment violation on behalf of the second class, the Reverse Stock Split Shareholder Class, alleging that a June 2009 reverse stock split constituted a taking of the common stockholders’ asserted right to a shareholder vote on whether to approve a reverse split of AIG’s common stock. The U.S. Court of Federal Claims held that the Credit Agreement Shareholder Class prevails on liability, but recovers no damages, and that the Reverse Stock Split Shareholder Class does not prevail on liability or damages. Both the Plaintiff and the United States have appealed. We are unable to determine the likelihood of an unfavorable outcome or make an estimate of potential loss at this time.
• Unredeemed Savings Bonds Related Cases: A number of plaintiffs filed claims in the U.S. Court of Federal Claims requesting that we redeem matured savings bonds not possessed by the applicable states, but which have registered owners with last known addresses in those states. We informed the applicable states we would not redeem these savings bonds since those states were not the registered owners of the bonds. On August 20, 2015, the court partially dismissed one claim and denied the U.S. government’s motion to dismiss with respect to other claims. We are unable to determine the likelihood of an unfavorable outcome or an estimate of potential loss at this time.
• Adam Steele, Brittany Montrois v. United States: The plaintiffs filed a class claim in the U.S. District Court for the District of Columbia seeking refunds of all user fees paid, plus interest, to obtain a preparer tax identification number (PTIN). Additionally, the plaintiffs seek to force us to cease charging a user fee to obtain a PTIN and asking for more information than is necessary to issue a PTIN. We are unable to determine the likelihood of an unfavorable outcome or an estimate of potential loss at this time.
• Anonymous Whistleblower Cases: A number of whistleblower cases were filed in the U.S. Tax Court under seal, appealing the denial of an award by the IRS Whistleblower Office. The anonymous claimants allegedly provided
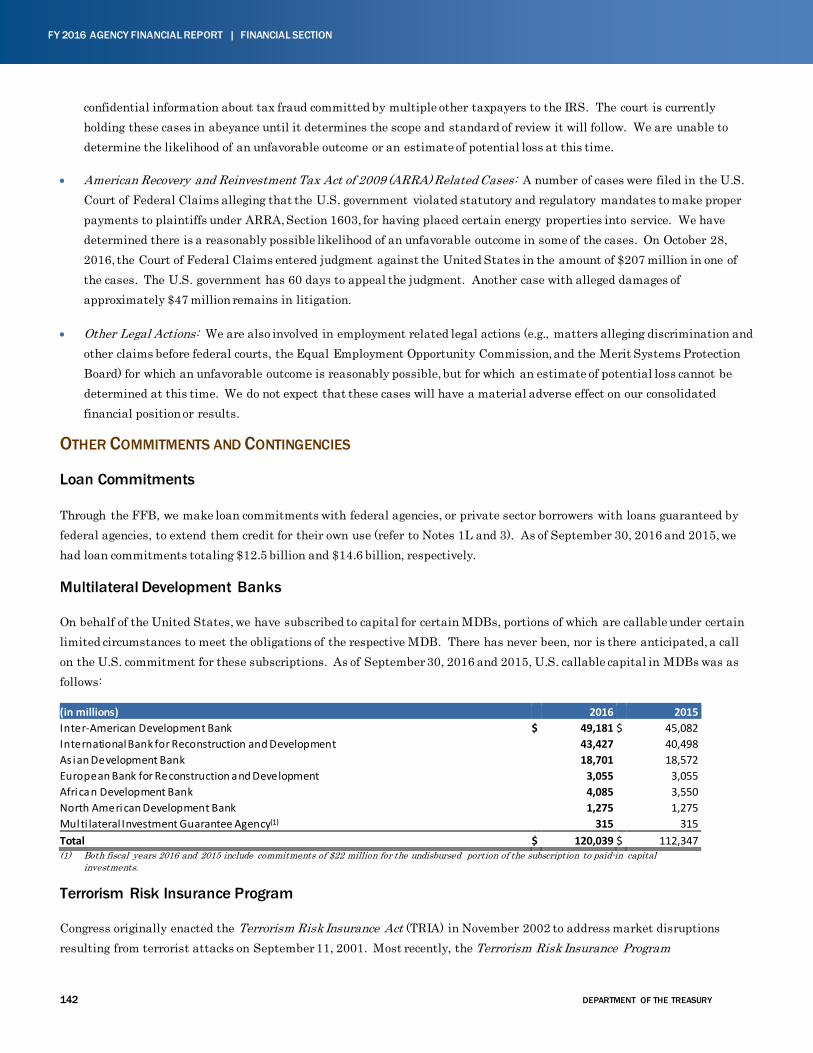
142 DEPARTMENT OF THE TREASURY
FY 2016 AGENCY FINANCIAL REPORT | FINANCIAL SECTION
confidential information about tax fraud committed by multiple other taxpayers to the IRS. The court is currently holding these cases in abeyance until it determines the scope and standard of review it will follow. We are unable to determine the likelihood of an unfavorable outcome or an estimate of potential loss at this time.
• American Recovery and Reinvestment Tax Act of 2009 (ARRA) Related Cases: A number of cases were filed in the U.S. Court of Federal Claims alleging that the U.S. government violated statutory and regulatory mandates to make proper payments to plaintiffs under ARRA, Section 1603, for having placed certain energy properties into service. We have determined there is a reasonably possible likelihood of an unfavorable outcome in some of the cases. On October 28, 2016, the Court of Federal Claims entered judgment against the United States in the amount of $207 million in one of the cases. The U.S. government has 60 days to appeal the judgment. Another case with alleged damages of approximately $47 million remains in litigation.
• Other Legal Actions: We are also involved in employment related legal actions (e.g., matters alleging discrimination and other claims before federal courts, the Equal Employment Opportunity Commission, and the Merit Systems Protection Board) for which an unfavorable outcome is reasonably possible, but for which an estimate of potential loss cannot be determined at this time. We do not expect that these cases will have a material adverse effect on our consolidated financial position or results.
OTHER COMMITMENTS AND CONTINGENCIES
Loan Commitments
Through the FFB, we make loan commitments with federal agencies, or private sector borrowers with loans guaranteed by federal agencies, to extend them credit for their own use (refer to Notes 1L and 3). As of September 30, 2016 and 2015, we had loan commitments totaling $12.5 billion and $14.6 billion, respectively.
Multilateral Development Banks
On behalf of the United States, we have subscribed to capital for certain MDBs, portions of which are callable under certain limited circumstances to meet the obligations of the respective MDB. There has never been, nor is there anticipated, a call on the U.S. commitment for these subscriptions. As of September 30, 2016 and 2015, U.S. callable capital in MDBs was as follows:
(in millions) 2016 2015 Inter-American Development Bank $ 49,181 $ 45,082 International Bank for Reconstruction and Development 43,427 40,498 As ian Development Bank 18,701 18,572 European Bank for Reconstruction and Development 3,055 3,055 African Development Bank 4,085 3,550 North American Development Bank 1,275 1,275 Multi lateral Investment Guarantee Agency(1) 315 315 Total $ 120,039 $ 112,347 (1) Both fiscal years 2016 and 2015 include commitments of $22 million for the undisbursed portion of the subscription to paid-in capital
investments.
Terrorism Risk Insurance Program
Congress originally enacted the Terrorism Risk Insurance Act (TRIA) in November 2002 to address market disruptions resulting from terrorist attacks on September 11, 2001. Most recently, the Terrorism Risk Insurance Program
DEPAR TMEN T OF THE TREASURY 143
FINANCIAL SECTION | FY 2016 AGENCY FINANCIAL REPORT
Reauthorization Act of 2015 extended the Terrorism Risk Insurance Program (TRIP) until December 31, 2020. The TRIP helps to ensure available and affordable commercial property and casualty insurance for terrorism risk, and simultaneously allows private markets to stabilize. The authority to pay claims under the TRIP is activated when the Secretary (in consultation with the Secretary of the Department of Homeland Security and the Attorney General of the United States) certifies an “act of terrorism.” In the event of certification of an “act of terrorism,” insurers may be eligible to receive reimbursement from the U.S. government for associated insured losses – assuming an aggregate insured loss threshold (“program trigger”) has been reached – once a particular insurer has satisfied its designated deductible amount. For calendar years 2016 and 2015, the program trigger amount was $120 million and $100 million, respectively. This amount will increase by $20 million annually through calendar year 2020. Insured losses above insurer deductibles will be shared between insurance companies and the U.S. government. The TRIP includes both mandatory and discretionary authority for us to recoup federal payments made under the TRIP through policyholder surcharges under certain circumstances, and contains provisions designed to manage litigation arising from or relating to a certified act of terrorism. There were no claims under the TRIP as of September 30, 2016 or 2015.
Exchange Stabilization Agreement
The North American Framework Agreement (NAFA), which we signed in 1994, includes the Exchange Stabilization Agreement (ESA) with Mexico. Through the ESF, we have a standing swap line for $3.0 billion with Mexico under the NAFA and its implementing ESA. The amounts and terms (including the assured source of repayment) of any borrowing under NAFA and ESA will have to be negotiated and agreed to before any actual drawing can occur. The ESA does provide sample clauses that state that transactions shall be exchange rate neutral for the ESF, and bear an interest rate based on that comparable to Treasury bills. There were no drawings outstanding on the ESF swap line as of September 30, 2016 and 2015.
IMF Commitments
The United States participates in the IMF through a quota subscription and the NAB which is a borrowing arrangement that supplements IMF resources. As of September 30, 2016 and 2015, the United States’ financial commitment under the U.S. quota was SDR 83.0 billion and SDR 42.1 billion, respectively, which was equivalent to $115.7 billion and $59.1 billion, respectively. Its financial commitment under the NAB arrangement was SDR 28.2 billion and SDR 69.1 billion as of September 30, 2016 and 2015, respectively, which was equivalent to $39.4 billion and $97.0 billion, respectively. The increase in the U.S. quota and decrease in the NAB commitment is attributable to the December 18, 2015 enactment of the Consolidated Appropriations Act 2016 (P.L. 114-113). This Act authorized an increase in the United States’ participation in the U.S. quota and a corresponding reduction in the NAB of SDR 40.9 billion (approximately $57 billion) (refer to Note 7).
Housing Programs Under TARP
We design housing programs under TARP to provide stability for both the housing market and homeowners. These programs assist homeowners who are experiencing financial hardships to remain in their homes until their financial position improves or they relocate to a more sustainable living situation, and to obtain other assistance designed to prevent foreclosures. As of September 30, 2016 and 2015, we had committed up to $37.5 billion for these programs. Outstanding commitments totaled $15.0 billion and $19.0 billion as of September 30, 2016 and 2015, respectively. For fiscal years 2016 and 2015, payments made on behalf of the housing programs under TARP totaled $4.3 billion and $4.2 billion, respectively, reported within the Economic Program on our Consolidated Statements of Net Cost.
144 DEPARTMENT OF THE TREASURY
FY 2016 AGENCY FINANCIAL REPORT | FINANCIAL SECTION
Commitment to GSEs
The SPSPA agreements between us and each GSE, which have no expiration date, provide for us to disburse funds to the GSEs if, at the end of any quarter, the FHFA determines that the liabilities exceed the GSE’s assets. At September 30, 2016 and 2015, our maximum remaining potential commitment to the GSEs was $258.1 billion. Refer to Note 10 for further information.
DEPAR TMEN T OF THE TREASURY 145
FINANCIAL SECTION | FY 2016 AGENCY FINANCIAL REPORT
REQUIRED SUPPLEMENTARY INFORMATION (UNAUDITED – SEE ACCOMPANYING
AUDITORS’ REPORT) INTRODUCTION
This section provides the Required Supplementary Information as prescribed by accounting standards.
OTHER CLAIMS FOR REFUNDS
We estimated that $7.1 billion and $4.8 billion as of September 30, 2016 and 2015, respectively, may be payable as other claims for tax refunds. This estimate represents amounts (principal and interest) that we may pay for claims pending judicial review by the federal courts or internally, by Appeals. In fiscal year 2016, the total estimated payout (including principal and interest) for claims pending judicial review by the federal courts and appeals courts is $4.8 billion and $2.3 billion, respectively. In fiscal year 2015, the total estimated payout (including principal and interest) for claims pending judicial review by the federal courts and appeals courts was $2.1 billion and $2.7 billion, respectively. To the extent judgments against the government in these cases prompt other similarly situated taxpayers to file similar refund claims, these amounts could become significantly greater.
IRS FEDERAL TAXES RECEIVABLE, NET
In accordance with SFFAS No. 7, Accounting for Revenue and Other Financing Sources and Concepts for Reconciling Budgetary and Financial Accounting, some unpaid tax assessments do not meet the criteria for financial statement recognition. Internal Revenue Code Section 6201 authorizes and requires us to make inquiries, determinations, and assessments of all taxes which taxpayers have not duly paid (including interest, additions to the tax, and assessable penalties) under the law. Unpaid assessments result from taxpayers filing returns without sufficient payment, as well as from tax compliance programs such as examination, under-reporter, substitute for return, and combined annual wage reporting. We also have authority to abate the paid or unpaid portion of an assessed tax, interest, and penalty. Abatements occur for a number of reasons and are a normal part of the tax administration process. Abatements may result in claims for refunds or a reduction of the unpaid assessed amount.
Under federal accounting standards, we consider unpaid assessments which require taxpayer or court agreement federal taxes receivable. We consider assessments not agreed to by taxpayers or the courts compliance assessments and not federal taxes receivable. Due to the lack of agreement, these compliance assessments are less likely to have future collection potential than those unpaid assessments that we consider federal taxes receivable.
We call assessments with little or no future collection potential write-offs. Write-offs principally consist of amounts owed by deceased, bankrupt, or defunct taxpayers, including many failed financial institutions liquidated by the FDIC and the former Resolution Trust Corporation (RTC). Write-offs have little or no future collection potential, but statutory provisions require that we maintain these assessments until the statute for collection expires.
Although we do not consider compliance assessments and write-offs receivables under federal accounting standards, they represent legally enforceable claims of the U.S. government.
The components of the total unpaid assessments at September 30, 2016 and 2015, were as follows:
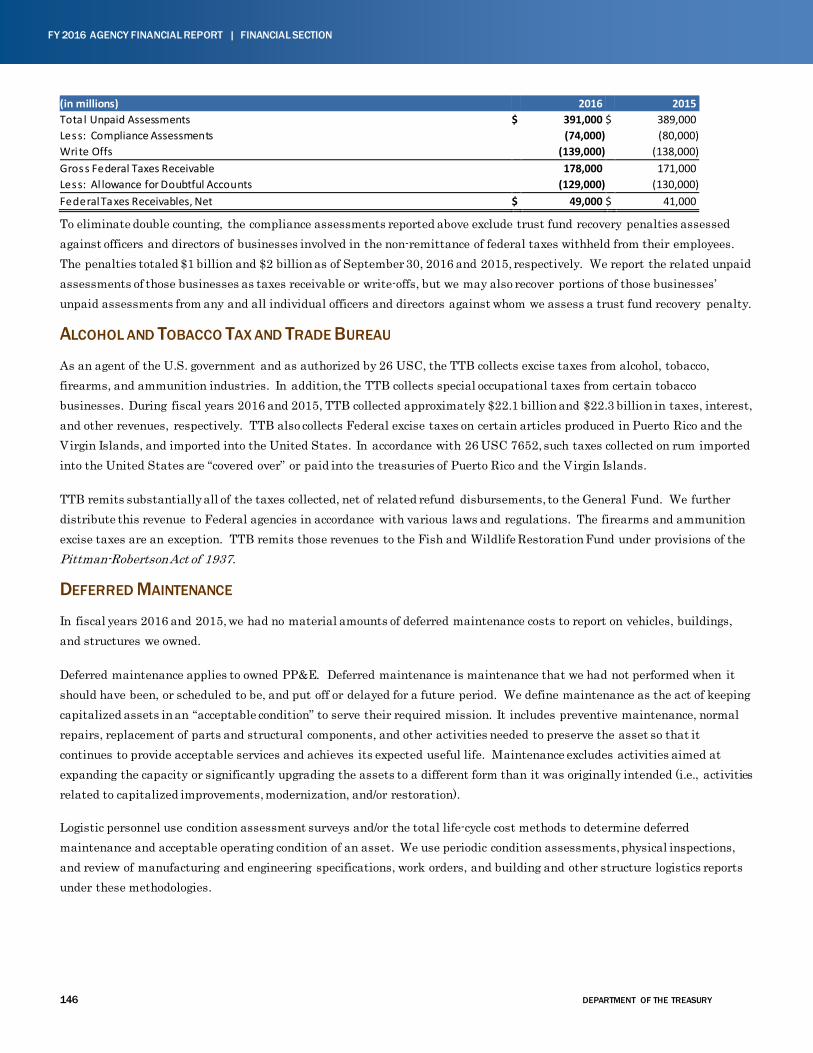
146 DEPARTMENT OF THE TREASURY
FY 2016 AGENCY FINANCIAL REPORT | FINANCIAL SECTION
(in millions) 2016 2015 Tota l Unpaid Assessments $ 391,000 $ 389,000 Less: Compliance Assessments (74,000) (80,000) Wri te Offs (139,000) (138,000) Gross Federal Taxes Receivable 178,000 171,000 Less: Al lowance for Doubtful Accounts (129,000) (130,000) Federal Taxes Receivables, Net $ 49,000 $ 41,000
To eliminate double counting, the compliance assessments reported above exclude trust fund recovery penalties assessed against officers and directors of businesses involved in the non-remittance of federal taxes withheld from their employees. The penalties totaled $1 billion and $2 billion as of September 30, 2016 and 2015, respectively. We report the related unpaid assessments of those businesses as taxes receivable or write-offs, but we may also recover portions of those businesses’ unpaid assessments from any and all individual officers and directors against whom we assess a trust fund recovery penalty.
ALCOHOL AND TOBACCO TAX AND TRADE BUREAU
As an agent of the U.S. government and as authorized by 26 USC, the TTB collects excise taxes from alcohol, tobacco, firearms, and ammunition industries. In addition, the TTB collects special occupational taxes from certain tobacco businesses. During fiscal years 2016 and 2015, TTB collected approximately $22.1 billion and $22.3 billion in taxes, interest, and other revenues, respectively. TTB also collects Federal excise taxes on certain articles produced in Puerto Rico and the Virgin Islands, and imported into the United States. In accordance with 26 USC 7652, such taxes collected on rum imported into the United States are “covered over” or paid into the treasuries of Puerto Rico and the Virgin Islands.
TTB remits substantially all of the taxes collected, net of related refund disbursements, to the General Fund. We further distribute this revenue to Federal agencies in accordance with various laws and regulations. The firearms and ammunition excise taxes are an exception. TTB remits those revenues to the Fish and Wildlife Restoration Fund under provisions of the Pittman-Robertson Act of 1937.
DEFERRED MAINTENANCE
In fiscal years 2016 and 2015, we had no material amounts of deferred maintenance costs to report on vehicles, buildings, and structures we owned.
Deferred maintenance applies to owned PP&E. Deferred maintenance is maintenance that we had not performed when it should have been, or scheduled to be, and put off or delayed for a future period. We define maintenance as the act of keeping capitalized assets in an “acceptable condition” to serve their required mission. It includes preventive maintenance, normal repairs, replacement of parts and structural components, and other activities needed to preserve the asset so that it continues to provide acceptable services and achieves its expected useful life. Maintenance excludes activities aimed at expanding the capacity or significantly upgrading the assets to a different form than it was originally intended (i.e., activities related to capitalized improvements, modernization, and/or restoration).
Logistic personnel use condition assessment surveys and/or the total life-cycle cost methods to determine deferred maintenance and acceptable operating condition of an asset. We use periodic condition assessments, physical inspections, and review of manufacturing and engineering specifications, work orders, and building and other structure logistics reports under these methodologies.
DEPAR TMEN T OF THE TREASURY 147
FINANCIAL SECTION | FY 2016 AGENCY FINANCIAL REPORT
STATEMENT OF BUDGETARY RESOURCES DISAGGREGATED BY TREASURY REPORTING ENTITY
The following tables provide the Statement of Budgetary Resources for the fiscal years ended September 30, 2016 and 2015 disaggregated by Treasury reporting entity rather than by Treasury major budget account, since we manage our budget at the reporting entity level.
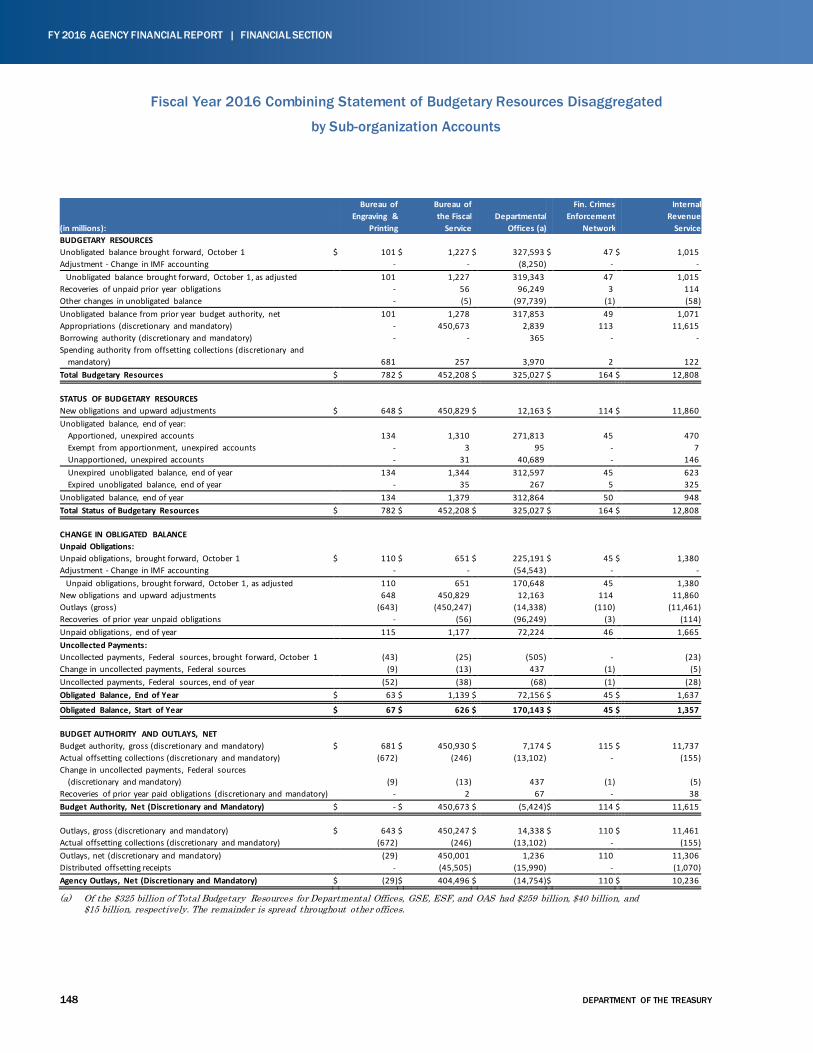
148 DEPARTMENT OF THE TREASURY
FY 2016 AGENCY FINANCIAL REPORT | FINANCIAL SECTION
Fiscal Year 2016 Combining Statement of Budgetary Resources Disaggregated
by Sub-organization Accounts
Bureau of Bureau of Fin. Crimes Internal Engraving & the Fiscal Departmental Enforcement Revenue (in millions): Printing Service Offices (a) Network Service BUDGETARY RESOURCES Unobligated balance brought forward, October 1 $ 101 $ 1,227 $ 327,593 $ 47 $ 1,015 Adjustment - Change in IMF accounting - - (8,250) - - Unobligated balance brought forward, October 1, as adjusted 101 1,227 319,343 47 1,015 Recoveries of unpaid prior year obligations - 56 96,249 3 114 Other changes in unobligated balance - (5) (97,739) (1) (58) Unobligated balance from prior year budget authority, net 101 1,278 317,853 49 1,071 Appropriations (discretionary and mandatory) - 450,673 2,839 113 11,615 Borrowing authority (discretionary and mandatory) - - 365 - - Spending authority from offsetting collections (discretionary and mandatory) 681 257 3,970 2 122 Total Budgetary Resources $ 782 $ 452,208 $ 325,027 $ 164 $ 12,808
STATUS OF BUDGETARY RESOURCES New obligations and upward adjustments $ 648 $ 450,829 $ 12,163 $ 114 $ 11,860 Unobligated balance, end of year: Apportioned, unexpired accounts 134 1,310 271,813 45 470 Exempt from apportionment, unexpired accounts - 3 95 - 7 Unapportioned, unexpired accounts - 31 40,689 - 146 Unexpired unobligated balance, end of year 134 1,344 312,597 45 623 Expired unobligated balance, end of year - 35 267 5 325 Unobligated balance, end of year 134 1,379 312,864 50 948 Total Status of Budgetary Resources $ 782 $ 452,208 $ 325,027 $ 164 $ 12,808
CHANGE IN OBLIGATED BALANCE Unpaid Obligations: Unpaid obligations, brought forward, October 1 $ 110 $ 651 $ 225,191 $ 45 $ 1,380 Adjustment - Change in IMF accounting - - (54,543) - - Unpaid obligations, brought forward, October 1, as adjusted 110 651 170,648 45 1,380 New obligations and upward adjustments 648 450,829 12,163 114 11,860 Outlays (gross) (643) (450,247) (14,338) (110) (11,461) Recoveries of prior year unpaid obligations - (56) (96,249) (3) (114) Unpaid obligations, end of year 115 1,177 72,224 46 1,665 Uncollected Payments: Uncollected payments, Federal sources, brought forward, October 1 (43) (25) (505) - (23) Change in uncollected payments, Federal sources (9) (13) 437 (1) (5) Uncollected payments, Federal sources, end of year (52) (38) (68) (1) (28) Obligated Balance, End of Year $ 63 $ 1,139 $ 72,156 $ 45 $ 1,637
Obligated Balance, Start of Year $ 67 $ 626 $ 170,143 $ 45 $ 1,357
BUDGET AUTHORITY AND OUTLAYS, NET Budget authority, gross (discretionary and mandatory) $ 681 $ 450,930 $ 7,174 $ 115 $ 11,737 Actual offsetting collections (discretionary and mandatory) (672) (246) (13,102) - (155) Change in uncollected payments, Federal sources (discretionary and mandatory) (9) (13) 437 (1) (5) Recoveries of prior year paid obligations (discretionary and mandatory) - 2 67 - 38 Budget Authority, Net (Discretionary and Mandatory) $ - $ 450,673 $ (5,424) $ 114 $ 11,615
Outlays, gross (discretionary and mandatory) $ 643 $ 450,247 $ 14,338 $ 110 $ 11,461 Actual offsetting collections (discretionary and mandatory) (672) (246) (13,102) - (155) Outlays, net (discretionary and mandatory) (29) 450,001 1,236 110 11,306 Distributed offsetting receipts - (45,505) (15,990) - (1,070) Agency Outlays, Net (Discretionary and Mandatory) $ (29) $ 404,496 $ (14,754) $ 110 $ 10,236
(a) Of the $325 billion of Total Budgetary Resources for Departmental Offices, GSE, ESF, and OAS had $259 billion, $40 billion, and $15 billion, respectively. The remainder is spread throughout other offices.
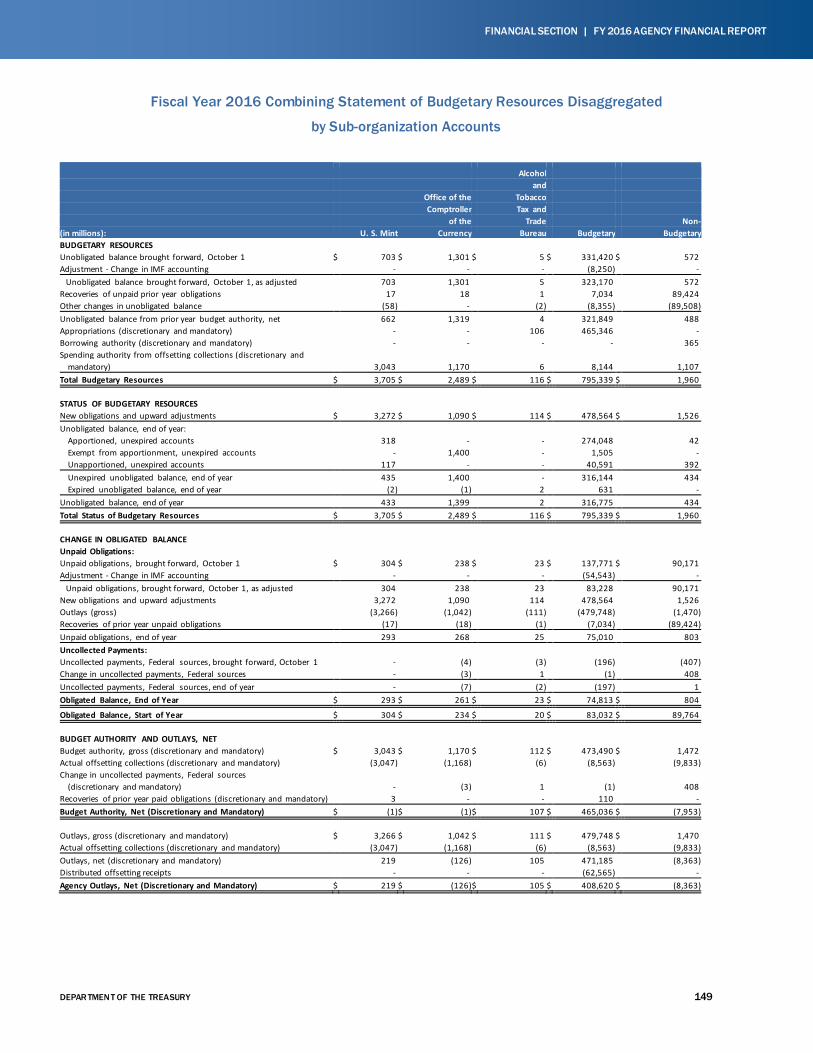
DEPAR TMEN T OF THE TREASURY 149
FINANCIAL SECTION | FY 2016 AGENCY FINANCIAL REPORT
Fiscal Year 2016 Combining Statement of Budgetary Resources Disaggregated
by Sub-organization Accounts
Alcohol and Office of the Tobacco Comptroller Tax and of the Trade Non- (in millions): U. S. Mint Currency Bureau Budgetary Budgetary BUDGETARY RESOURCES Unobligated balance brought forward, October 1 $ 703 $ 1,301 $ 5 $ 331,420 $ 572 Adjustment - Change in IMF accounting - - - (8,250) - Unobligated balance brought forward, October 1, as adjusted 703 1,301 5 323,170 572 Recoveries of unpaid prior year obligations 17 18 1 7,034 89,424 Other changes in unobligated balance (58) - (2) (8,355) (89,508) Unobligated balance from prior year budget authority, net 662 1,319 4 321,849 488 Appropriations (discretionary and mandatory) - - 106 465,346 - Borrowing authority (discretionary and mandatory) - - - - 365 Spending authority from offsetting collections (discretionary and mandatory) 3,043 1,170 6 8,144 1,107 Total Budgetary Resources $ 3,705 $ 2,489 $ 116 $ 795,339 $ 1,960 STATUS OF BUDGETARY RESOURCES New obligations and upward adjustments $ 3,272 $ 1,090 $ 114 $ 478,564 $ 1,526 Unobligated balance, end of year: Apportioned, unexpired accounts 318 - - 274,048 42 Exempt from apportionment, unexpired accounts - 1,400 - 1,505 - Unapportioned, unexpired accounts 117 - - 40,591 392 Unexpired unobligated balance, end of year 435 1,400 - 316,144 434 Expired unobligated balance, end of year (2) (1) 2 631 - Unobligated balance, end of year 433 1,399 2 316,775 434 Total Status of Budgetary Resources $ 3,705 $ 2,489 $ 116 $ 795,339 $ 1,960 CHANGE IN OBLIGATED BALANCE Unpaid Obligations: Unpaid obligations, brought forward, October 1 $ 304 $ 238 $ 23 $ 137,771 $ 90,171 Adjustment - Change in IMF accounting - - - (54,543) - Unpaid obligations, brought forward, October 1, as adjusted 304 238 23 83,228 90,171 New obligations and upward adjustments 3,272 1,090 114 478,564 1,526 Outlays (gross) (3,266) (1,042) (111) (479,748) (1,470) Recoveries of prior year unpaid obligations (17) (18) (1) (7,034) (89,424) Unpaid obligations, end of year 293 268 25 75,010 803 Uncollected Payments: Uncollected payments, Federal sources, brought forward, October 1 - (4) (3) (196) (407) Change in uncollected payments, Federal sources - (3) 1 (1) 408 Uncollected payments, Federal sources, end of year - (7) (2) (197) 1 Obligated Balance, End of Year $ 293 $ 261 $ 23 $ 74,813 $ 804
Obligated Balance, Start of Year $ 304 $ 234 $ 20 $ 83,032 $ 89,764 BUDGET AUTHORITY AND OUTLAYS, NET Budget authority, gross (discretionary and mandatory) $ 3,043 $ 1,170 $ 112 $ 473,490 $ 1,472 Actual offsetting collections (discretionary and mandatory) (3,047) (1,168) (6) (8,563) (9,833) Change in uncollected payments, Federal sources (discretionary and mandatory) - (3) 1 (1) 408 Recoveries of prior year paid obligations (discretionary and mandatory) 3 - - 110 - Budget Authority, Net (Discretionary and Mandatory) $ (1) $ (1) $ 107 $ 465,036 $ (7,953) Outlays, gross (discretionary and mandatory) $ 3,266 $ 1,042 $ 111 $ 479,748 $ 1,470 Actual offsetting collections (discretionary and mandatory) (3,047) (1,168) (6) (8,563) (9,833) Outlays, net (discretionary and mandatory) 219 (126) 105 471,185 (8,363) Distributed offsetting receipts - - - (62,565) - Agency Outlays, Net (Discretionary and Mandatory) $ 219 $ (126) $ 105 $ 408,620 $ (8,363)
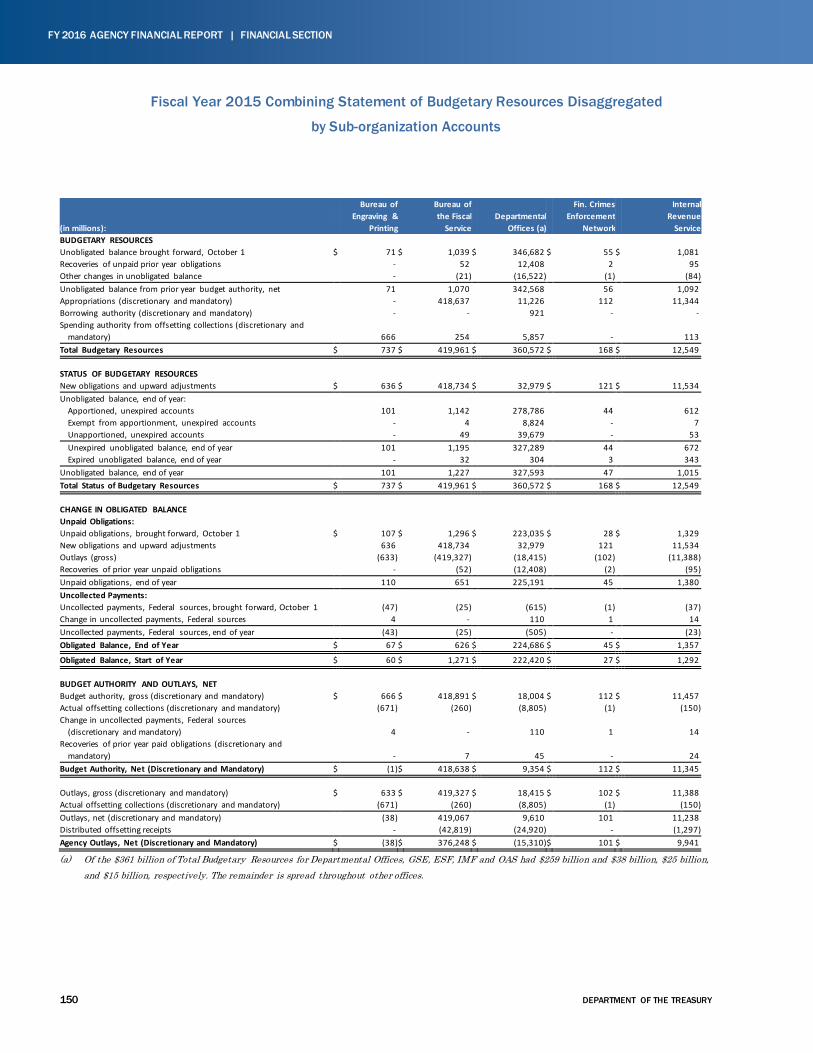
150 DEPARTMENT OF THE TREASURY
FY 2016 AGENCY FINANCIAL REPORT | FINANCIAL SECTION
Fiscal Year 2015 Combining Statement of Budgetary Resources Disaggregated
by Sub-organization Accounts
Bureau of Bureau of Fin. Crimes Internal Engraving & the Fiscal Departmental Enforcement Revenue (in millions): Printing Service Offices (a) Network Service BUDGETARY RESOURCES Unobligated balance brought forward, October 1 $ 71 $ 1,039 $ 346,682 $ 55 $ 1,081 Recoveries of unpaid prior year obligations - 52 12,408 2 95 Other changes in unobligated balance - (21) (16,522) (1) (84) Unobligated balance from prior year budget authority, net 71 1,070 342,568 56 1,092 Appropriations (discretionary and mandatory) - 418,637 11,226 112 11,344 Borrowing authority (discretionary and mandatory) - - 921 - - Spending authority from offsetting collections (discretionary and mandatory) 666 254 5,857 - 113 Total Budgetary Resources $ 737 $ 419,961 $ 360,572 $ 168 $ 12,549
STATUS OF BUDGETARY RESOURCES New obligations and upward adjustments $ 636 $ 418,734 $ 32,979 $ 121 $ 11,534 Unobligated balance, end of year: Apportioned, unexpired accounts 101 1,142 278,786 44 612 Exempt from apportionment, unexpired accounts - 4 8,824 - 7 Unapportioned, unexpired accounts - 49 39,679 - 53 Unexpired unobligated balance, end of year 101 1,195 327,289 44 672 Expired unobligated balance, end of year - 32 304 3 343 Unobligated balance, end of year 101 1,227 327,593 47 1,015 Total Status of Budgetary Resources $ 737 $ 419,961 $ 360,572 $ 168 $ 12,549
CHANGE IN OBLIGATED BALANCE Unpaid Obligations: Unpaid obligations, brought forward, October 1 $ 107 $ 1,296 $ 223,035 $ 28 $ 1,329 New obligations and upward adjustments 636 418,734 32,979 121 11,534 Outlays (gross) (633) (419,327) (18,415) (102) (11,388) Recoveries of prior year unpaid obligations - (52) (12,408) (2) (95) Unpaid obligations, end of year 110 651 225,191 45 1,380 Uncollected Payments: Uncollected payments, Federal sources, brought forward, October 1 (47) (25) (615) (1) (37) Change in uncollected payments, Federal sources 4 - 110 1 14 Uncollected payments, Federal sources, end of year (43) (25) (505) - (23) Obligated Balance, End of Year $ 67 $ 626 $ 224,686 $ 45 $ 1,357
Obligated Balance, Start of Year $ 60 $ 1,271 $ 222,420 $ 27 $ 1,292
BUDGET AUTHORITY AND OUTLAYS, NET Budget authority, gross (discretionary and mandatory) $ 666 $ 418,891 $ 18,004 $ 112 $ 11,457 Actual offsetting collections (discretionary and mandatory) (671) (260) (8,805) (1) (150) Change in uncollected payments, Federal sources (discretionary and mandatory) 4 - 110 1 14 Recoveries of prior year paid obligations (discretionary and mandatory) - 7 45 - 24 Budget Authority, Net (Discretionary and Mandatory) $ (1) $ 418,638 $ 9,354 $ 112 $ 11,345
Outlays, gross (discretionary and mandatory) $ 633 $ 419,327 $ 18,415 $ 102 $ 11,388 Actual offsetting collections (discretionary and mandatory) (671) (260) (8,805) (1) (150) Outlays, net (discretionary and mandatory) (38) 419,067 9,610 101 11,238 Distributed offsetting receipts - (42,819) (24,920) - (1,297) Agency Outlays, Net (Discretionary and Mandatory) $ (38) $ 376,248 $ (15,310) $ 101 $ 9,941
(a) Of the $361 billion of Total Budgetary Resources for Departmental Offices, GSE, ESF, IMF and OAS had $259 billion and $38 billion, $25 billion, and $15 billion, respectively. The remainder is spread throughout other offices.
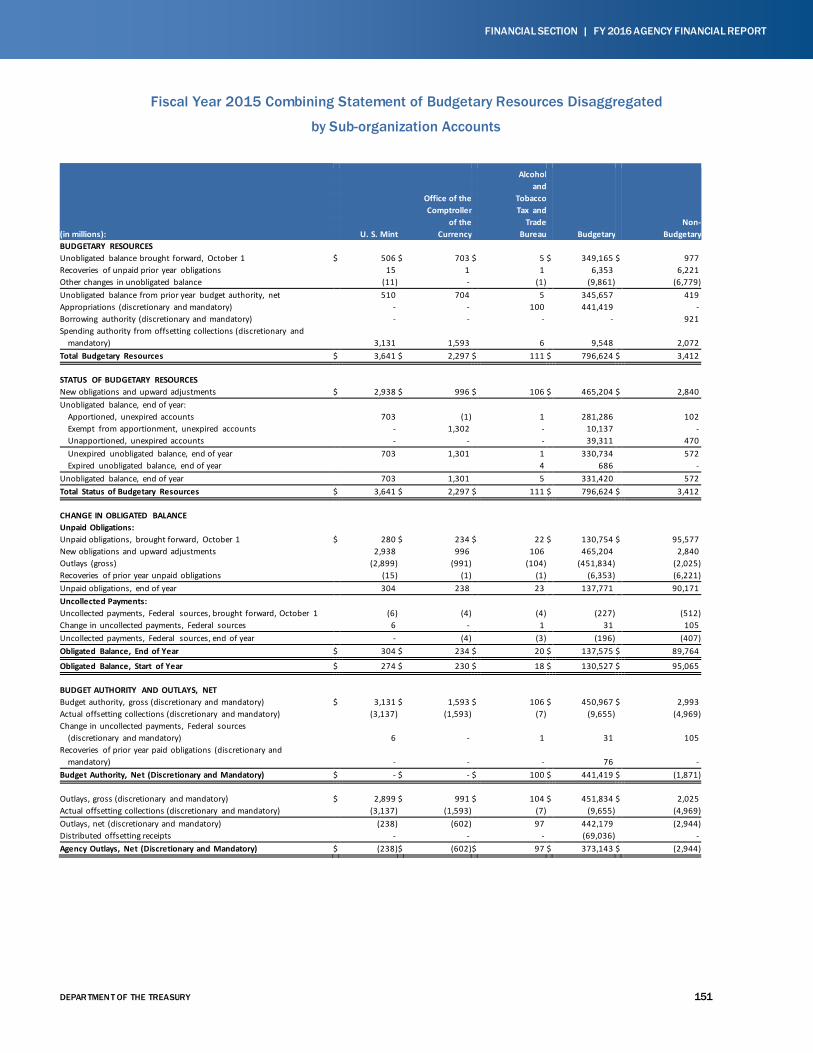
DEPAR TMEN T OF THE TREASURY 151
FINANCIAL SECTION | FY 2016 AGENCY FINANCIAL REPORT
Fiscal Year 2015 Combining Statement of Budgetary Resources Disaggregated
by Sub-organization Accounts
Alcohol and Office of the Tobacco Comptroller Tax and of the Trade Non- (in millions): U. S. Mint Currency Bureau Budgetary Budgetary BUDGETARY RESOURCES Unobligated balance brought forward, October 1 $ 506 $ 703 $ 5 $ 349,165 $ 977 Recoveries of unpaid prior year obligations 15 1 1 6,353 6,221 Other changes in unobligated balance (11) - (1) (9,861) (6,779) Unobligated balance from prior year budget authority, net 510 704 5 345,657 419 Appropriations (discretionary and mandatory) - - 100 441,419 - Borrowing authority (discretionary and mandatory) - - - - 921 Spending authority from offsetting collections (discretionary and mandatory) 3,131 1,593 6 9,548 2,072 Total Budgetary Resources $ 3,641 $ 2,297 $ 111 $ 796,624 $ 3,412
STATUS OF BUDGETARY RESOURCES New obligations and upward adjustments $ 2,938 $ 996 $ 106 $ 465,204 $ 2,840 Unobligated balance, end of year: Apportioned, unexpired accounts 703 (1) 1 281,286 102 Exempt from apportionment, unexpired accounts - 1,302 - 10,137 - Unapportioned, unexpired accounts - - - 39,311 470 Unexpired unobligated balance, end of year 703 1,301 1 330,734 572 Expired unobligated balance, end of year 4 686 - Unobligated balance, end of year 703 1,301 5 331,420 572 Total Status of Budgetary Resources $ 3,641 $ 2,297 $ 111 $ 796,624 $ 3,412
CHANGE IN OBLIGATED BALANCE Unpaid Obligations: Unpaid obligations, brought forward, October 1 $ 280 $ 234 $ 22 $ 130,754 $ 95,577 New obligations and upward adjustments 2,938 996 106 465,204 2,840 Outlays (gross) (2,899) (991) (104) (451,834) (2,025) Recoveries of prior year unpaid obligations (15) (1) (1) (6,353) (6,221) Unpaid obligations, end of year 304 238 23 137,771 90,171 Uncollected Payments: Uncollected payments, Federal sources, brought forward, October 1 (6) (4) (4) (227) (512) Change in uncollected payments, Federal sources 6 - 1 31 105 Uncollected payments, Federal sources, end of year - (4) (3) (196) (407) Obligated Balance, End of Year $ 304 $ 234 $ 20 $ 137,575 $ 89,764
Obligated Balance, Start of Year $ 274 $ 230 $ 18 $ 130,527 $ 95,065
BUDGET AUTHORITY AND OUTLAYS, NET Budget authority, gross (discretionary and mandatory) $ 3,131 $ 1,593 $ 106 $ 450,967 $ 2,993 Actual offsetting collections (discretionary and mandatory) (3,137) (1,593) (7) (9,655) (4,969) Change in uncollected payments, Federal sources (discretionary and mandatory) 6 - 1 31 105 Recoveries of prior year paid obligations (discretionary and mandatory) - - - 76 - Budget Authority, Net (Discretionary and Mandatory) $ - $ - $ 100 $ 441,419 $ (1,871)
Outlays, gross (discretionary and mandatory) $ 2,899 $ 991 $ 104 $ 451,834 $ 2,025 Actual offsetting collections (discretionary and mandatory) (3,137) (1,593) (7) (9,655) (4,969) Outlays, net (discretionary and mandatory) (238) (602) 97 442,179 (2,944) Distributed offsetting receipts - - - (69,036) - Agency Outlays, Net (Discretionary and Mandatory) $ (238) $ (602) $ 97 $ 373,143 $ (2,944)

[Page intentionally left blank]
1 DEPARTMENT OF THE TREASURY
SECTION A: COMBINED SCHEDULE OF SPENDING ..........155
SECTION B: TAX GAP AND TAX BURDEN .....................156
SECTION C: FREEZE THE FOOTPRINT ...........................164
SECTION D: MANAGEMENT AND PERFORMANCE CHALLENGES AND THE SECRETARY’S RESPONSES ............................................165
SECTION E: SUMMARY OF FINANCIAL STATEMENT AUDIT AND MANAGEMENT ASSURANCES ....216
SECTION F: IPIA (AS AMENDED BY IPERA AND IPERIA) REPORTING DETAILS....................220
SECTION G: CIVIL MONETARY PENALTIES INFLATION ADJUSTMENT ..........................239
APPENDIX: GLOSSARY OF ACRONYMS .........................245

[Type text]
DEPARTMENT OF THE TREASURY 2
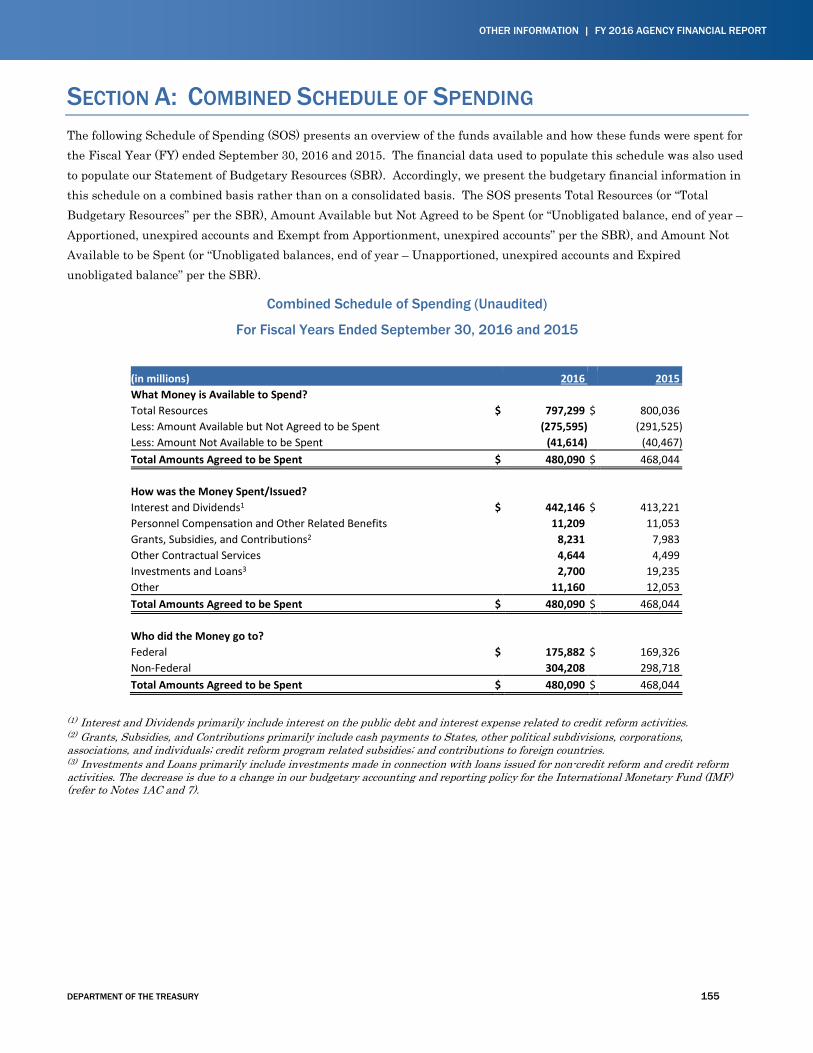
DEPARTMENT OF THE TREASURY 155
OTHER INFORMATION | FY 2016 AGENCY FINANCIAL REPORT
SECTION A: COMBINED SCHEDULE OF SPENDING The following Schedule of Spending (SOS) presents an overview of the funds available and how these funds were spent for the Fiscal Year (FY) ended September 30, 2016 and 2015. The financial data used to populate this schedule was also used to populate our Statement of Budgetary Resources (SBR). Accordingly, we present the budgetary financial information in this schedule on a combined basis rather than on a consolidated basis. The SOS presents Total Resources (or “Total Budgetary Resources” per the SBR), Amount Available but Not Agreed to be Spent (or “Unobligated balance, end of year – Apportioned, unexpired accounts and Exempt from Apportionment, unexpired accounts” per the SBR), and Amount Not Available to be Spent (or “Unobligated balances, end of year – Unapportioned, unexpired accounts and Expired unobligated balance” per the SBR).
Combined Schedule of Spending (Unaudited)
For Fiscal Years Ended September 30, 2016 and 2015
(in millions) 2016 2015 What Money is Available to Spend?
Total Resources $ 797,299 $ 800,036 Less: Amount Available but Not Agreed to be Spent (275,595) (291,525) Less: Amount Not Available to be Spent (41,614) (40,467) Total Amounts Agreed to be Spent $ 480,090 $ 468,044
How was the Money Spent/Issued?
Interest and Dividends1 $ 442,146 $ 413,221 Personnel Compensation and Other Related Benefits 11,209 11,053 Grants, Subsidies, and Contributions2 8,231 7,983 Other Contractual Services 4,644 4,499 Investments and Loans3 2,700 19,235 Other 11,160 12,053 Total Amounts Agreed to be Spent $ 480,090 $ 468,044
Who did the Money go to?
Federal $ 175,882 $ 169,326 Non-Federal 304,208 298,718 Total Amounts Agreed to be Spent $ 480,090 $ 468,044
(1) Interest and Dividends primarily include interest on the public debt and interest expense related to credit reform activities. (2) Grants, Subsidies, and Contributions primarily include cash payments to States, other political subdivisions, corporations, associations, and individuals; credit reform program related subsidies; and contributions to foreign countries. (3) Investments and Loans primarily include investments made in connection with loans issued for non-credit reform and credit reform activities. The decrease is due to a change in our budgetary accounting and reporting policy for the International Monetary Fund (IMF) (refer to Notes 1AC and 7).
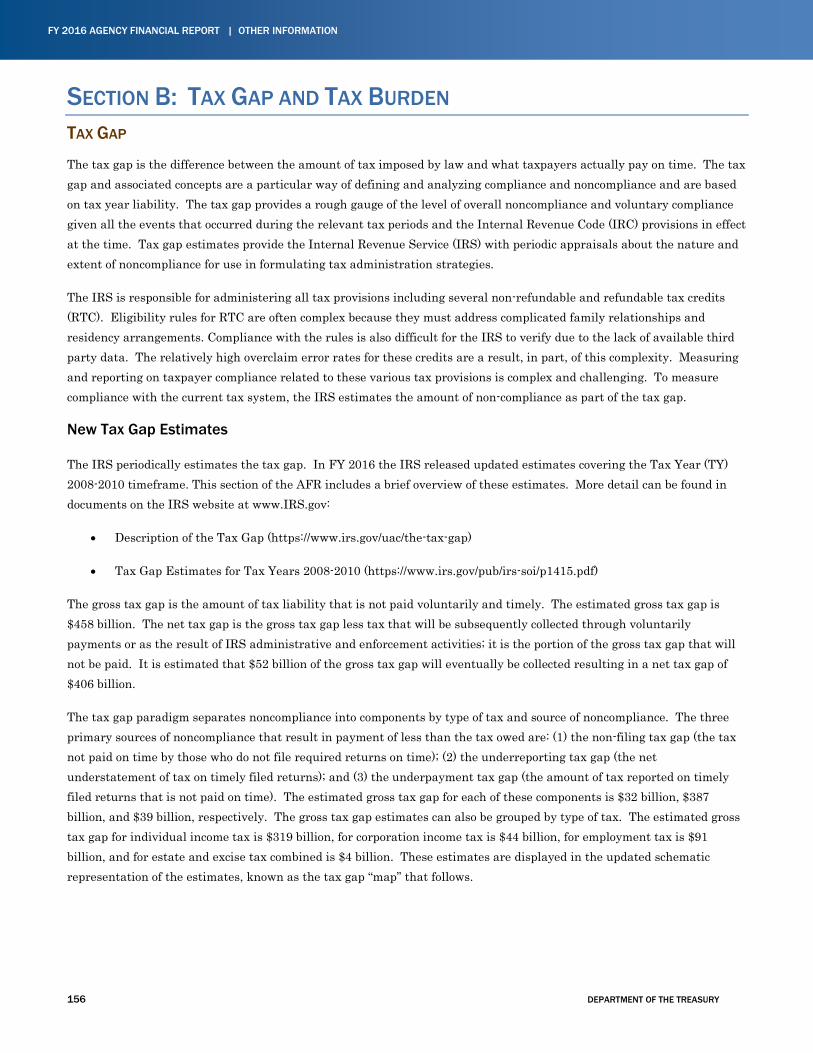
156 DEPARTMENT OF THE TREASURY
FY 2016 AGENCY FINANCIAL REPORT | OTHER INFORMATION
SECTION B: TAX GAP AND TAX BURDEN TAX GAP
The tax gap is the difference between the amount of tax imposed by law and what taxpayers actually pay on time. The tax gap and associated concepts are a particular way of defining and analyzing compliance and noncompliance and are based on tax year liability. The tax gap provides a rough gauge of the level of overall noncompliance and voluntary compliance given all the events that occurred during the relevant tax periods and the Internal Revenue Code (IRC) provisions in effect at the time. Tax gap estimates provide the Internal Revenue Service (IRS) with periodic appraisals about the nature and extent of noncompliance for use in formulating tax administration strategies.
The IRS is responsible for administering all tax provisions including several non-refundable and refundable tax credits (RTC). Eligibility rules for RTC are often complex because they must address complicated family relationships and residency arrangements. Compliance with the rules is also difficult for the IRS to verify due to the lack of available third party data. The relatively high overclaim error rates for these credits are a result, in part, of this complexity. Measuring and reporting on taxpayer compliance related to these various tax provisions is complex and challenging. To measure compliance with the current tax system, the IRS estimates the amount of non-compliance as part of the tax gap.
New Tax Gap Estimates
The IRS periodically estimates the tax gap. In FY 2016 the IRS released updated estimates covering the Tax Year (TY) 2008-2010 timeframe. This section of the AFR includes a brief overview of these estimates. More detail can be found in documents on the IRS website at www.IRS.gov:
• Description of the Tax Gap (https://www.irs.gov/uac/the-tax-gap)
• Tax Gap Estimates for Tax Years 2008-2010 (https://www.irs.gov/pub/irs-soi/p1415.pdf)
The gross tax gap is the amount of tax liability that is not paid voluntarily and timely. The estimated gross tax gap is $458 billion. The net tax gap is the gross tax gap less tax that will be subsequently collected through voluntarily payments or as the result of IRS administrative and enforcement activities; it is the portion of the gross tax gap that will not be paid. It is estimated that $52 billion of the gross tax gap will eventually be collected resulting in a net tax gap of $406 billion.
The tax gap paradigm separates noncompliance into components by type of tax and source of noncompliance. The three primary sources of noncompliance that result in payment of less than the tax owed are: (1) the non-filing tax gap (the tax not paid on time by those who do not file required returns on time); (2) the underreporting tax gap (the net understatement of tax on timely filed returns); and (3) the underpayment tax gap (the amount of tax reported on timely filed returns that is not paid on time). The estimated gross tax gap for each of these components is $32 billion, $387 billion, and $39 billion, respectively. The gross tax gap estimates can also be grouped by type of tax. The estimated gross tax gap for individual income tax is $319 billion, for corporation income tax is $44 billion, for employment tax is $91 billion, and for estate and excise tax combined is $4 billion. These estimates are displayed in the updated schematic representation of the estimates, known as the tax gap “map” that follows.
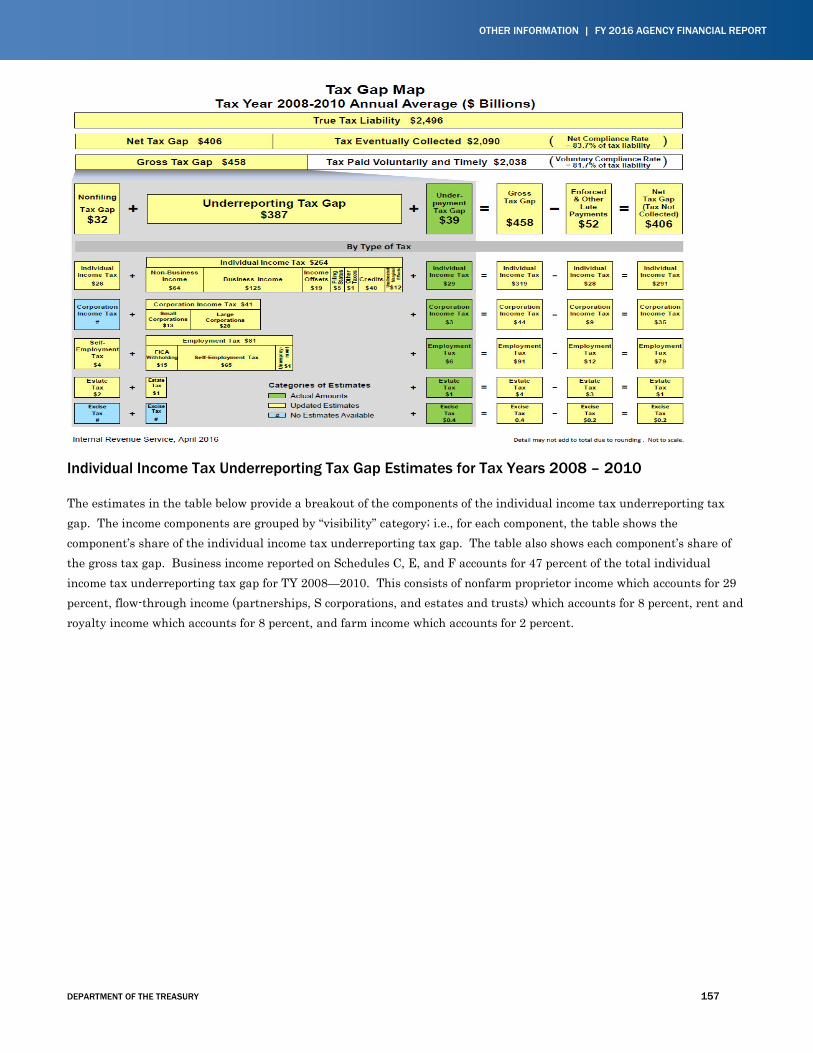
DEPARTMENT OF THE TREASURY 157
OTHER INFORMATION | FY 2016 AGENCY FINANCIAL REPORT
Individual Income Tax Underreporting Tax Gap Estimates for Tax Years 2008 – 2010
The estimates in the table below provide a breakout of the components of the individual income tax underreporting tax gap. The income components are grouped by “visibility” category; i.e., for each component, the table shows the component’s share of the individual income tax underreporting tax gap. The table also shows each component’s share of the gross tax gap. Business income reported on Schedules C, E, and F accounts for 47 percent of the total individual income tax underreporting tax gap for TY 2008—2010. This consists of nonfarm proprietor income which accounts for 29 percent, flow-through income (partnerships, S corporations, and estates and trusts) which accounts for 8 percent, rent and royalty income which accounts for 8 percent, and farm income which accounts for 2 percent.
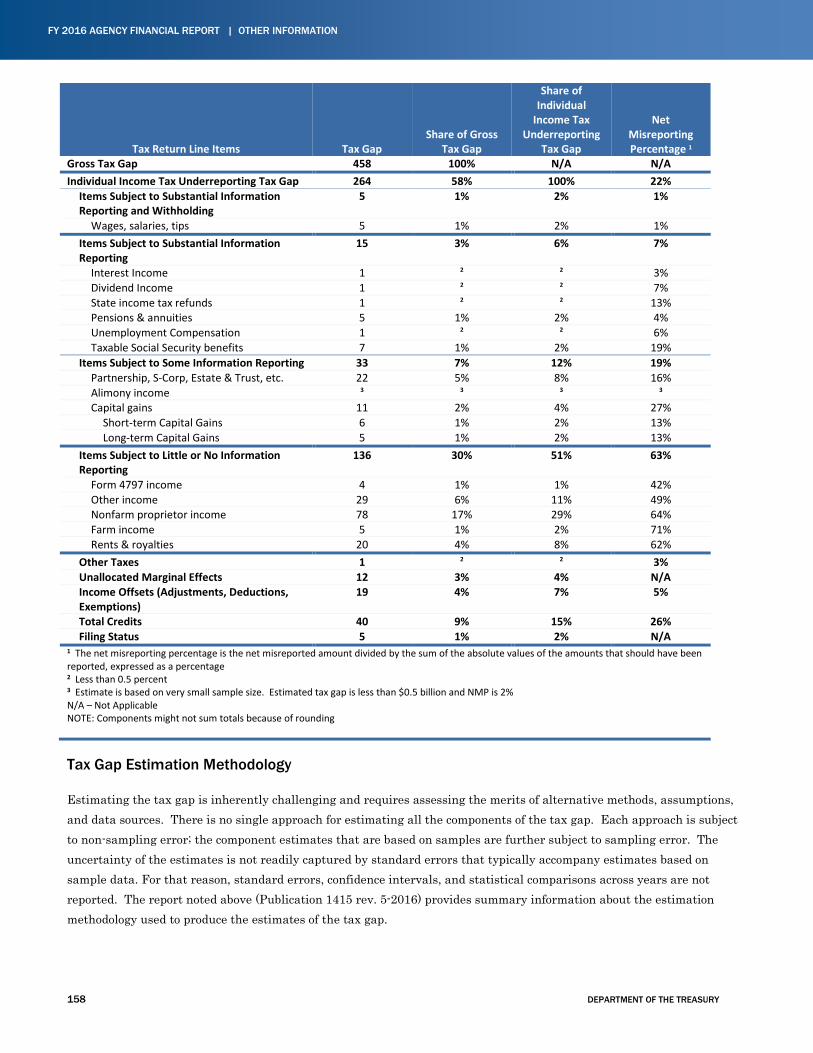
158 DEPARTMENT OF THE TREASURY
FY 2016 AGENCY FINANCIAL REPORT | OTHER INFORMATION
Tax Return Line Items Tax Gap Share of Gross
Tax Gap
Share of Individual
Income Tax Underreporting
Tax Gap
Net Misreporting Percentage 1
Gross Tax Gap 458 100% N/A N/A Individual Income Tax Underreporting Tax Gap 264 58% 100% 22%
Items Subject to Substantial Information Reporting and Withholding
5 1% 2% 1%
Wages, salaries, tips 5 1% 2% 1% Items Subject to Substantial Information Reporting
15 3% 6% 7%
Interest Income 1 2 2 3% Dividend Income 1 2 2 7% State income tax refunds 1 2 2 13% Pensions & annuities 5 1% 2% 4% Unemployment Compensation 1 2 2 6% Taxable Social Security benefits 7 1% 2% 19%
Items Subject to Some Information Reporting 33 7% 12% 19% Partnership, S-Corp, Estate & Trust, etc. 22 5% 8% 16% Alimony income 3 3 3 3
Capital gains 11 2% 4% 27% Short-term Capital Gains 6 1% 2% 13% Long-term Capital Gains 5 1% 2% 13%
Items Subject to Little or No Information Reporting
136 30% 51% 63%
Form 4797 income 4 1% 1% 42% Other income 29 6% 11% 49% Nonfarm proprietor income 78 17% 29% 64% Farm income 5 1% 2% 71% Rents & royalties 20 4% 8% 62%
Other Taxes 1 2 2 3% Unallocated Marginal Effects 12 3% 4% N/A Income Offsets (Adjustments, Deductions, Exemptions)
19 4% 7% 5%
Total Credits 40 9% 15% 26% Filing Status 5 1% 2% N/A
1 The net misreporting percentage is the net misreported amount divided by the sum of the absolute values of the amounts that should have been reported, expressed as a percentage 2 Less than 0.5 percent 3 Estimate is based on very small sample size. Estimated tax gap is less than $0.5 billion and NMP is 2% N/A – Not Applicable NOTE: Components might not sum totals because of rounding
Tax Gap Estimation Methodology
Estimating the tax gap is inherently challenging and requires assessing the merits of alternative methods, assumptions, and data sources. There is no single approach for estimating all the components of the tax gap. Each approach is subject to non-sampling error; the component estimates that are based on samples are further subject to sampling error. The uncertainty of the estimates is not readily captured by standard errors that typically accompany estimates based on sample data. For that reason, standard errors, confidence intervals, and statistical comparisons across years are not reported. The report noted above (Publication 1415 rev. 5-2016) provides summary information about the estimation methodology used to produce the estimates of the tax gap.
DEPARTMENT OF THE TREASURY 159
OTHER INFORMATION | FY 2016 AGENCY FINANCIAL REPORT
The IRS' National Research Program (NRP) is one important data source used to estimate the tax gap. The NRP involves conducting detailed audits of a random sample of taxpayers to measure compliance with all individual income tax provisions and focuses on assessing the effect of errors made during return filing. These errors include IRS processing errors, unintentional taxpayer mistakes, and intentional taxpayer noncompliance, and result in forgone revenue as well as potential refund payments that may not have been made in the correct amounts.
Unlike prior tax gap estimates that pertain to a single tax year, these estimates reflect an estimated average compliance rate and associated average annual tax gap for the TY 2008—2010 timeframe. This approach was motivated by the decision to pool multiple years of compliance data from the annual individual income tax reporting compliance component of the NRP to provide greater reliability of individual income tax underreporting tax gap estimates by sources of noncompliance. The individual income tax NRP reporting compliance studies are the foundation for the individual income tax underreporting tax gap estimates.
COMPLIANCE WITH INDIVIDUAL INCOME TAX CREDITS
In addition to informing the tax gap estimate, the NRP data are used to conduct in-depth analyses of tax compliance problems, to guide IRS enforcement strategies (such as by building models that predict the types of returns most likely to have errors), and to develop legislative proposals aimed at improving compliance with the tax laws and reducing the tax gap. NRP data are also used to estimate the Earned Income Tax Credit (EITC) improper payment rate.
Compliance Estimates
The IRS is responsible for administering 21 non-refundable and refundable individual income tax credits. These credits account for an estimated 15 percent of the individual income tax underreporting tax gap. EITC accounts for 10 percent of the individual income tax underreporting tax gap estimate, followed by the refundable and nonrefundable child tax credit (3 percent), and the refundable and non-refundable education credits (2 percent).
These credits generally have many rules that determine eligibility, which may differ based on personal family and living arrangements. This complexity can cause tax credit errors.
As noted in the IRS response to TIGTA’s required annual report of IRS' compliance with the reporting requirements contained in the Improper Payments Elimination and Recovery Improvement Act of 2012 (IPERIA) and related legislation and Executive Order 13520 (TIGTA 2016-40-036, Without Expanded Math Error Authority Billions of Dollars in Identified Potentially Erroneous Earned Income Credit Claims Will Continue to Go Unaddressed Each Year), the IRS stated that it plans further NRP analyses of Advanced Child Tax Credit (ACTC) and American Opportunity Tax Credit (AOTC) errors. In addition, compliance with Affordable Care Act (ACA) Premium Tax Credit (PTC) will be reported as part of the overall tax gap and in other compliance research, once data become available. TY 2014 represents the first year in which taxpayers received Advance Premium Tax Credit (APTC) payments, filed for PTC, and reconciled APTC payments and PTC amounts. NRP data for TY 2014 is expected to be available in late 2018.
160 DEPARTMENT OF THE TREASURY
FY 2016 AGENCY FINANCIAL REPORT | OTHER INFORMATION
Relationship of Tax Compliance Estimation to Improper Payments
The Improper Payments Elimination Recovery Act of 2010 (IPERA) requires certain reporting for payments programs determined to be susceptible to significant improper payments. The focus of IPERA, its subsequent amendments, and guidance documents, is on implementing internal controls to prevent and detect improper payments and does not take into consideration all aspects of administering tax provisions in a system that relies heavily on voluntary reporting. In keeping with IPERA requirements, the IRS has historically reported risk assessments for refundable credits and improper payment estimates for the EITC in the annual Agency Financial Report (AFR). The IRS has followed this practice largely because refundable credits may result in a payment in excess of tax liability. However, the distinction between the portion of a credit that offsets tax liability and the portion that is refundable is governed by multiple variables, including other return elements and information provided by the taxpayer, some of which are unrelated to the refundable credit in question. Evaluating only the refunded portion of a credit offers little insight into where tax compliance occurs or how the IRS should address compliance problems. In addition, the same features of the tax system and taxpayer behaviors that create the compliance problems with refundable credits also create the risk of noncompliance with other tax provisions. Furthermore, examining credits alone provides little guidance about how the IRS should allocate its scarce enforcement resources. The IRS reports on the EITC without regard to whether errors are the result of complexity in the tax code, taxpayer behavior, or IRS processes, and despite the fact that amounts of tax offset by the credit are currently considered negative revenue receipts.
Treasury and IRS analyses as well as audits by GAO and TIGTA have consistently found that payment errors for EITC and other tax credit programs are attributable to the complexity of the credits within the tax system, and not rooted in internal control weaknesses, financial management deficiencies, or financial reporting failures. Eligibility rules are complex and lead to high overclaim error rates for these credits.
Accountability for Administering Refundable Credits and Strengthening Program Integrity
Strengthening program integrity throughout the organization is a Departmental priority, extending to senior executives and program officials at each of our agencies and programs. As evidence of this focus, beginning with senior leadership and cascading down, performance plans contain strategic goals related to strengthening program integrity, protecting taxpayer resources, and reducing erroneous refunds from taxpayers’ overclaims. We evaluate senior executives and program officials as part of their semi-annual and annual performance evaluations on their progress toward achieving these goals.
TAX BURDEN
The IRC provides for progressive rates of tax, whereby higher incomes are generally subject to higher rates of tax. The following pages present in both graph and table format various income levels and their associated tax liabilities for individuals and corporations. This information is the most recent available for individuals (tax year 2014) and corporations (TY 2013). The graphs and charts are representative of more detailed data and analyses available from the IRS Statistics of Income office.
For individuals, the information illustrates, in both percentage and dollar terms, the tax burden borne by varying levels of Adjusted Gross Income. The corporate information illustrates, for varying corporate asset categories, the tax burden borne by these entities as a percentage of taxable income.
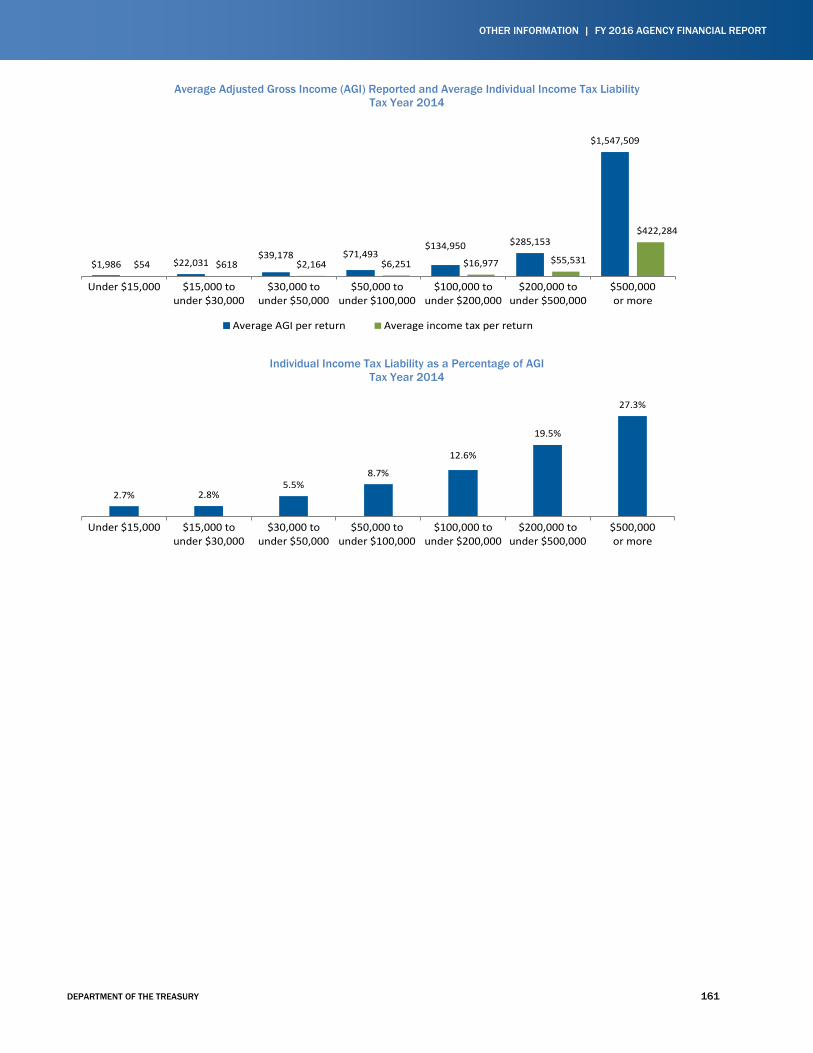
DEPARTMENT OF THE TREASURY 161
OTHER INFORMATION | FY 2016 AGENCY FINANCIAL REPORT
Average Adjusted Gross Income (AGI) Reported and Average Individual Income Tax Liability Tax Year 2014
Individual Income Tax Liability as a Percentage of AGI Tax Year 2014
$1,986 $22,031$39,178 $71,493
$134,950 $285,153
$1,547,509
$54 $618 $2,164 $6,251 $16,977 $55,531
$422,284
Under $15,000 $15,000 tounder $30,000
$30,000 tounder $50,000
$50,000 tounder $100,000
$100,000 tounder $200,000
$200,000 tounder $500,000
$500,000or more
Average AGI per return Average income tax per return
2.7% 2.8%5.5%
8.7%
12.6%
19.5%
27.3%
Under $15,000 $15,000 tounder $30,000
$30,000 tounder $50,000
$50,000 tounder $100,000
$100,000 tounder $200,000
$200,000 tounder $500,000
$500,000or more
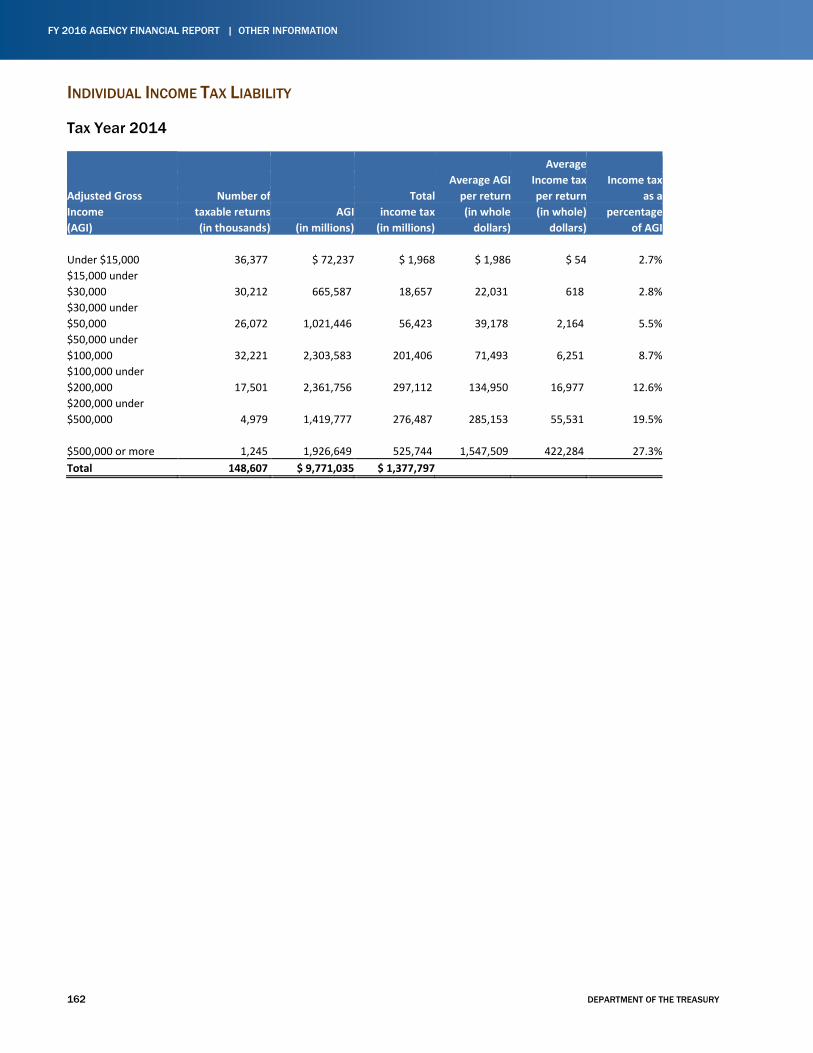
162 DEPARTMENT OF THE TREASURY
FY 2016 AGENCY FINANCIAL REPORT | OTHER INFORMATION
INDIVIDUAL INCOME TAX LIABILITY
Tax Year 2014
Average Average AGI Income tax Income tax Adjusted Gross Number of Total per return per return as a Income taxable returns AGI income tax (in whole (in whole) percentage (AGI) (in thousands) (in millions) (in millions) dollars) dollars) of AGI Under $15,000 36,377 $ 72,237 $ 1,968 $ 1,986 $ 54 2.7% $15,000 under $30,000 30,212 665,587 18,657 22,031 618 2.8% $30,000 under $50,000 26,072 1,021,446 56,423 39,178 2,164 5.5% $50,000 under $100,000 32,221 2,303,583 201,406 71,493 6,251 8.7% $100,000 under $200,000 17,501 2,361,756 297,112 134,950 16,977 12.6% $200,000 under $500,000 4,979 1,419,777 276,487 285,153 55,531 19.5% $500,000 or more 1,245 1,926,649 525,744 1,547,509 422,284 27.3% Total 148,607 $ 9,771,035 $ 1,377,797
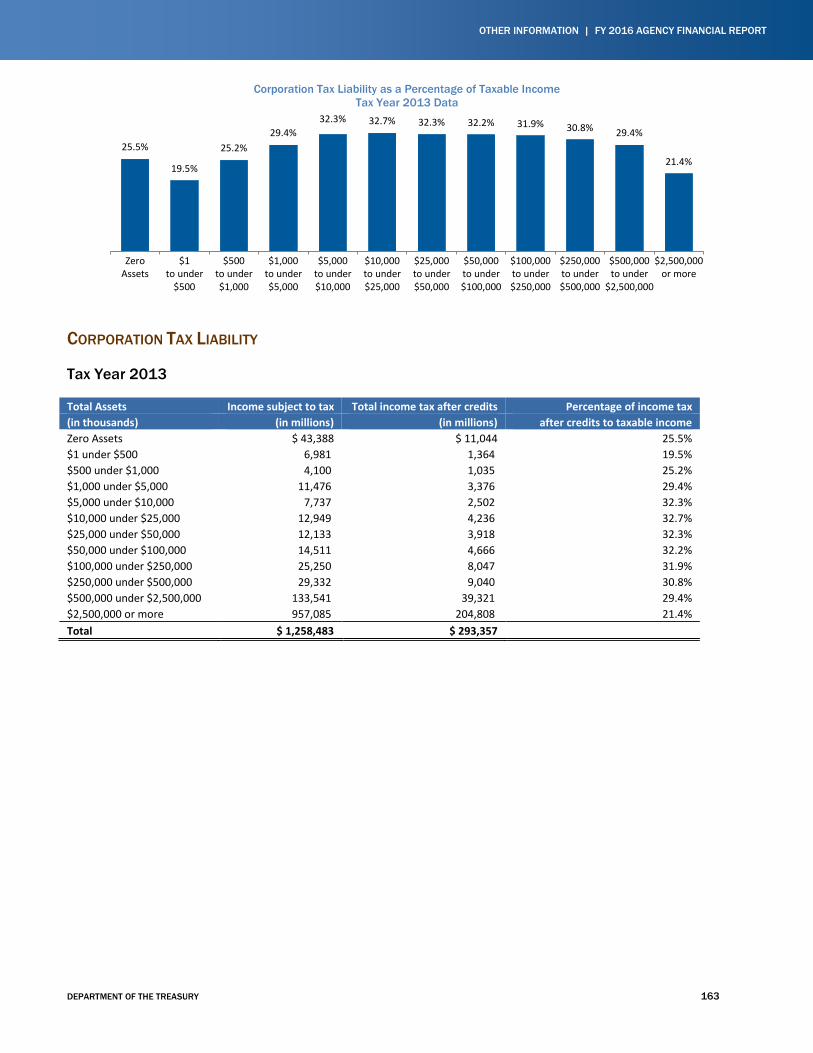
DEPARTMENT OF THE TREASURY 163
OTHER INFORMATION | FY 2016 AGENCY FINANCIAL REPORT
Corporation Tax Liability as a Percentage of Taxable Income Tax Year 2013 Data
CORPORATION TAX LIABILITY
Tax Year 2013
Total Assets Income subject to tax Total income tax after credits Percentage of income tax (in thousands) (in millions) (in millions) after credits to taxable income Zero Assets $ 43,388 $ 11,044 25.5% $1 under $500 6,981 1,364 19.5% $500 under $1,000 4,100 1,035 25.2% $1,000 under $5,000 11,476 3,376 29.4% $5,000 under $10,000 7,737 2,502 32.3% $10,000 under $25,000 12,949 4,236 32.7% $25,000 under $50,000 12,133 3,918 32.3% $50,000 under $100,000 14,511 4,666 32.2% $100,000 under $250,000 25,250 8,047 31.9% $250,000 under $500,000 29,332 9,040 30.8% $500,000 under $2,500,000 133,541 39,321 29.4% $2,500,000 or more 957,085 204,808 21.4% Total $ 1,258,483 $ 293,357
25.5%
19.5%
25.2%29.4%
32.3% 32.7% 32.3% 32.2% 31.9% 30.8% 29.4%
21.4%
ZeroAssets
$1to under
$500
$500to under$1,000
$1,000to under$5,000
$5,000to under$10,000
$10,000to under$25,000
$25,000to under$50,000
$50,000to under$100,000
$100,000to under$250,000
$250,000to under$500,000
$500,000to under
$2,500,000
$2,500,000or more
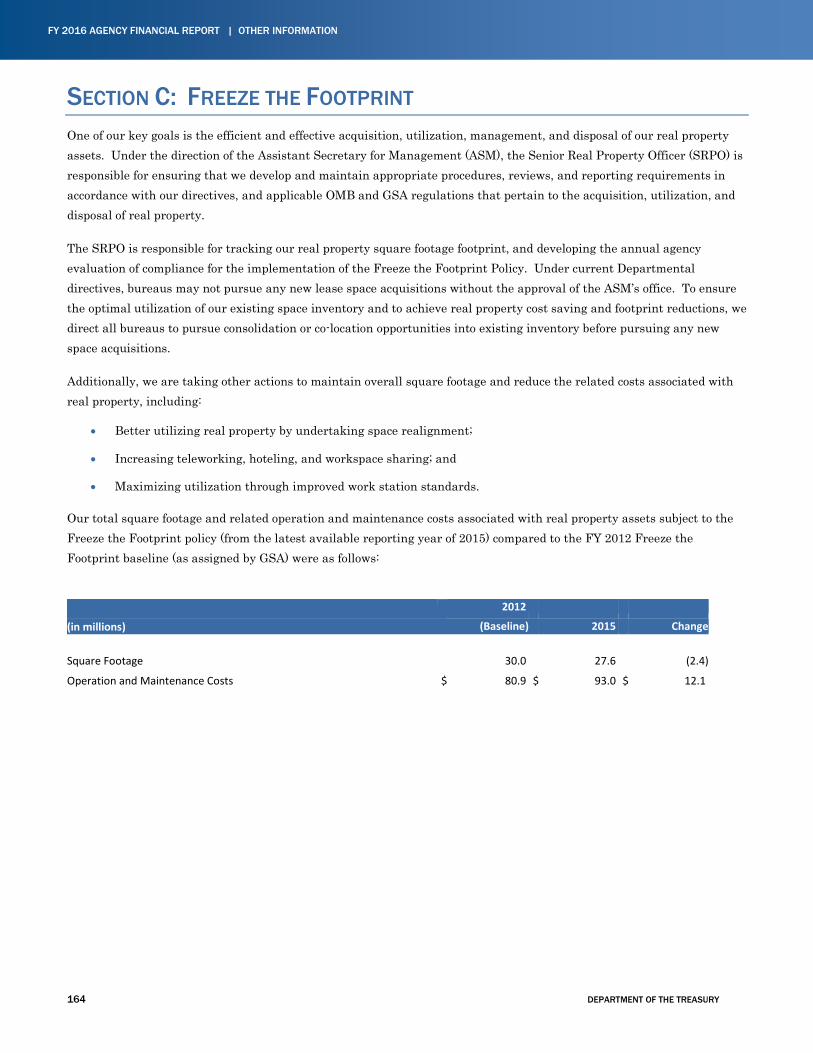
164 DEPARTMENT OF THE TREASURY
FY 2016 AGENCY FINANCIAL REPORT | OTHER INFORMATION
SECTION C: FREEZE THE FOOTPRINT One of our key goals is the efficient and effective acquisition, utilization, management, and disposal of our real property assets. Under the direction of the Assistant Secretary for Management (ASM), the Senior Real Property Officer (SRPO) is responsible for ensuring that we develop and maintain appropriate procedures, reviews, and reporting requirements in accordance with our directives, and applicable OMB and GSA regulations that pertain to the acquisition, utilization, and disposal of real property.
The SRPO is responsible for tracking our real property square footage footprint, and developing the annual agency evaluation of compliance for the implementation of the Freeze the Footprint Policy. Under current Departmental directives, bureaus may not pursue any new lease space acquisitions without the approval of the ASM’s office. To ensure the optimal utilization of our existing space inventory and to achieve real property cost saving and footprint reductions, we direct all bureaus to pursue consolidation or co-location opportunities into existing inventory before pursuing any new space acquisitions.
Additionally, we are taking other actions to maintain overall square footage and reduce the related costs associated with real property, including:
• Better utilizing real property by undertaking space realignment;
• Increasing teleworking, hoteling, and workspace sharing; and
• Maximizing utilization through improved work station standards.
Our total square footage and related operation and maintenance costs associated with real property assets subject to the Freeze the Footprint policy (from the latest available reporting year of 2015) compared to the FY 2012 Freeze the Footprint baseline (as assigned by GSA) were as follows:
2012
(in millions) (Baseline) 2015 Change Square Footage 30.0 27.6 (2.4)
Operation and Maintenance Costs $ 80.9 $ 93.0 $ 12.1
DEPARTMENT OF THE TREASURY 165
OTHER INFORMATION | FY 2016 AGENCY FINANCIAL REPORT
SECTION D: MANAGEMENT AND PERFORMANCE CHALLENGES AND THE SECRETARY’S RESPONSES In accordance with the Reports Consolidation Act of 2000, the Inspectors General are required to identify specific management and performance challenges facing the Department. At the end of each fiscal year, the Treasury Office of Inspector General (OIG) and Treasury Inspector General for Tax Administration (TIGTA) send an update of these management challenges to the Secretary and cite any new challenges for the upcoming fiscal year. The Special Inspector General for the Troubled Asset Relief Program (SIGTARP) did not identify any management or performance challenges for the Office of Financial Stability (OFS). This section contains the management and performance challenges reported by OIG and TIGTA.
166 DEPARTMENT OF THE TREASURY
FY 2016 AGENCY FINANCIAL REPORT | OTHER INFORMATION
DEPARTMENT OF THE TREASURY 167
OTHER INFORMATION | FY 2016 AGENCY FINANCIAL REPORT
168 DEPARTMENT OF THE TREASURY
FY 2016 AGENCY FINANCIAL REPORT | OTHER INFORMATION
DEPARTMENT OF THE TREASURY 169
OTHER INFORMATION | FY 2016 AGENCY FINANCIAL REPORT
170 DEPARTMENT OF THE TREASURY
FY 2016 AGENCY FINANCIAL REPORT | OTHER INFORMATION
DEPARTMENT OF THE TREASURY 171
OTHER INFORMATION | FY 2016 AGENCY FINANCIAL REPORT
172 DEPARTMENT OF THE TREASURY
FY 2016 AGENCY FINANCIAL REPORT | OTHER INFORMATION
DEPARTMENT OF THE TREASURY 173
OTHER INFORMATION | FY 2016 AGENCY FINANCIAL REPORT
174 DEPARTMENT OF THE TREASURY
FY 2016 AGENCY FINANCIAL REPORT | OTHER INFORMATION
DEPARTMENT OF THE TREASURY 175
OTHER INFORMATION | FY 2016 AGENCY FINANCIAL REPORT
176 DEPARTMENT OF THE TREASURY
FY 2016 AGENCY FINANCIAL REPORT | OTHER INFORMATION
DEPARTMENT OF THE TREASURY 177
OTHER INFORMATION | FY 2016 AGENCY FINANCIAL REPORT
178 DEPARTMENT OF THE TREASURY
FY 2016 AGENCY FINANCIAL REPORT | OTHER INFORMATION
DEPARTMENT OF THE TREASURY 179
OTHER INFORMATION | FY 2016 AGENCY FINANCIAL REPORT
180 DEPARTMENT OF THE TREASURY
FY 2016 AGENCY FINANCIAL REPORT | OTHER INFORMATION
DEPARTMENT OF THE TREASURY 181
OTHER INFORMATION | FY 2016 AGENCY FINANCIAL REPORT
182 DEPARTMENT OF THE TREASURY
FY 2016 AGENCY FINANCIAL REPORT | OTHER INFORMATION
DEPARTMENT OF THE TREASURY 183
OTHER INFORMATION | FY 2016 AGENCY FINANCIAL REPORT
184 DEPARTMENT OF THE TREASURY
FY 2016 AGENCY FINANCIAL REPORT | OTHER INFORMATION
DEPARTMENT OF THE TREASURY 185
OTHER INFORMATION | FY 2016 AGENCY FINANCIAL REPORT
186 DEPARTMENT OF THE TREASURY
FY 2016 AGENCY FINANCIAL REPORT | OTHER INFORMATION
DEPARTMENT OF THE TREASURY 187
OTHER INFORMATION | FY 2016 AGENCY FINANCIAL REPORT
188 DEPARTMENT OF THE TREASURY
FY 2016 AGENCY FINANCIAL REPORT | OTHER INFORMATION
DEPARTMENT OF THE TREASURY 189
OTHER INFORMATION | FY 2016 AGENCY FINANCIAL REPORT
190 DEPARTMENT OF THE TREASURY
FY 2016 AGENCY FINANCIAL REPORT | OTHER INFORMATION
DEPARTMENT OF THE TREASURY 191
OTHER INFORMATION | FY 2016 AGENCY FINANCIAL REPORT
192 DEPARTMENT OF THE TREASURY
FY 2016 AGENCY FINANCIAL REPORT | OTHER INFORMATION
DEPARTMENT OF THE TREASURY 193
OTHER INFORMATION | FY 2016 AGENCY FINANCIAL REPORT
194 DEPARTMENT OF THE TREASURY
FY 2016 AGENCY FINANCIAL REPORT | OTHER INFORMATION
DEPARTMENT OF THE TREASURY 195
OTHER INFORMATION | FY 2016 AGENCY FINANCIAL REPORT
196 DEPARTMENT OF THE TREASURY
FY 2016 AGENCY FINANCIAL REPORT | OTHER INFORMATION
DEPARTMENT OF THE TREASURY 197
OTHER INFORMATION | FY 2016 AGENCY FINANCIAL REPORT
FY 2016 AGENCY FINANCIAL REPORT | OTHER INFORMATION
198 DEPARTMENT OF THE TREASURY
MEMORANDUM FOR: Eric M. Thorson Treasury Inspector General J. Russell George Inspector General for Tax Administration FROM: Jacob J. Lew Secretary of the Treasury SUBJECT: FY 2016 Management and Performance Challenges reported by the
Treasury Inspector General and the Treasury Inspector General for Tax Administration
We reviewed the memoranda from the Treasury Inspector General (IG) and the Treasury Inspector General for Tax Administration (TIGTA), dated October 26, 2016 and October 6, 2016, respectively. The memoranda provide the IG’s and the TIGTA’s perspective on the most serious management and performance challenges facing the Department. The Special Inspector General for the Troubled Asset Relief Program (SIGTARP) did not report any management or performance challenges.
We appreciate the IG and the TIGTA’s work on this effort and value the insights and recommendations they have provided. We concur with the reported challenges and will remain committed to focusing resources on overcoming these challenges.
We continue to make progress on these challenges, but overcoming these challenges requires long-term strategies for ensuring stable operations as well as sustained management attention and resources. We have provided a more detailed report on the actions taken in FY 2016 and planned actions for FY 2017 and beyond in the following section.
We look forward to continuing to work with the IG and the TIGTA on these challenges.
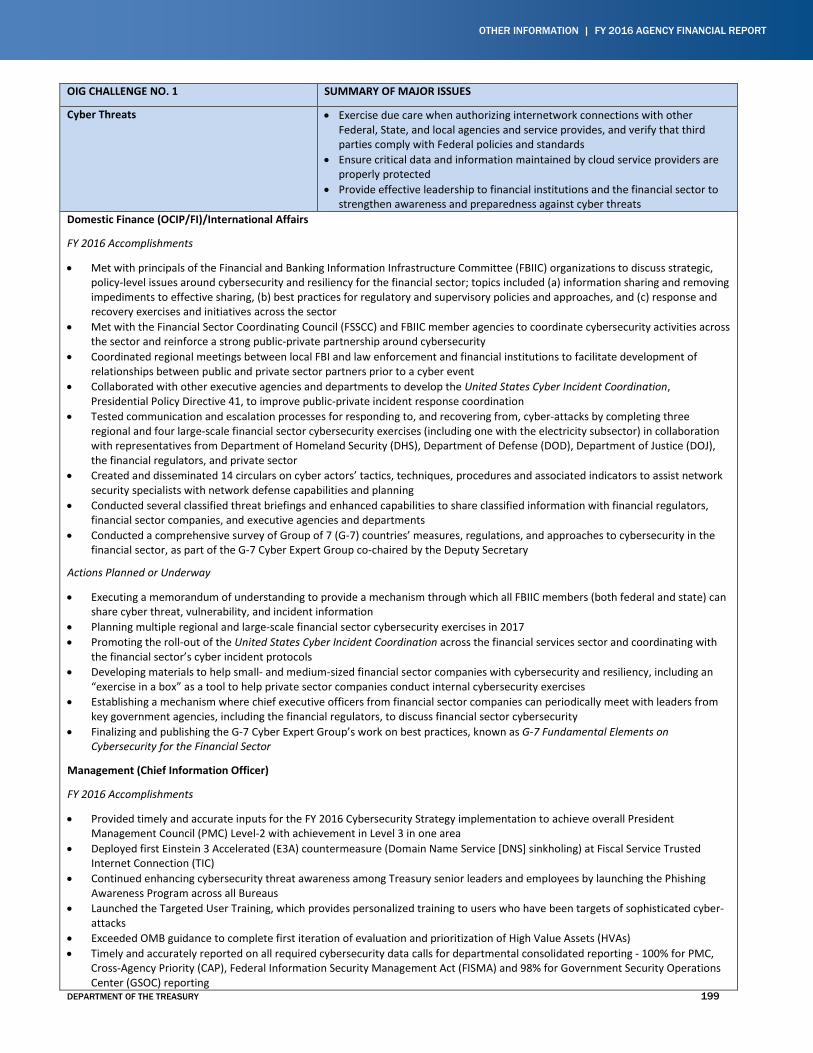
OTHER INFORMATION | FY 2016 AGENCY FINANCIAL REPORT
DEPARTMENT OF THE TREASURY 199
OIG CHALLENGE NO. 1 SUMMARY OF MAJOR ISSUES
Cyber Threats • Exercise due care when authorizing internetwork connections with other Federal, State, and local agencies and service provides, and verify that third parties comply with Federal policies and standards
• Ensure critical data and information maintained by cloud service providers are properly protected
• Provide effective leadership to financial institutions and the financial sector to strengthen awareness and preparedness against cyber threats
Domestic Finance (OCIP/FI)/International Affairs
FY 2016 Accomplishments
• Met with principals of the Financial and Banking Information Infrastructure Committee (FBIIC) organizations to discuss strategic, policy-level issues around cybersecurity and resiliency for the financial sector; topics included (a) information sharing and removing impediments to effective sharing, (b) best practices for regulatory and supervisory policies and approaches, and (c) response and recovery exercises and initiatives across the sector
• Met with the Financial Sector Coordinating Council (FSSCC) and FBIIC member agencies to coordinate cybersecurity activities across the sector and reinforce a strong public-private partnership around cybersecurity
• Coordinated regional meetings between local FBI and law enforcement and financial institutions to facilitate development of relationships between public and private sector partners prior to a cyber event
• Collaborated with other executive agencies and departments to develop the United States Cyber Incident Coordination, Presidential Policy Directive 41, to improve public-private incident response coordination
• Tested communication and escalation processes for responding to, and recovering from, cyber-attacks by completing three regional and four large-scale financial sector cybersecurity exercises (including one with the electricity subsector) in collaboration with representatives from Department of Homeland Security (DHS), Department of Defense (DOD), Department of Justice (DOJ), the financial regulators, and private sector
• Created and disseminated 14 circulars on cyber actors’ tactics, techniques, procedures and associated indicators to assist network security specialists with network defense capabilities and planning
• Conducted several classified threat briefings and enhanced capabilities to share classified information with financial regulators, financial sector companies, and executive agencies and departments
• Conducted a comprehensive survey of Group of 7 (G-7) countries’ measures, regulations, and approaches to cybersecurity in the financial sector, as part of the G-7 Cyber Expert Group co-chaired by the Deputy Secretary
Actions Planned or Underway
• Executing a memorandum of understanding to provide a mechanism through which all FBIIC members (both federal and state) can share cyber threat, vulnerability, and incident information
• Planning multiple regional and large-scale financial sector cybersecurity exercises in 2017 • Promoting the roll-out of the United States Cyber Incident Coordination across the financial services sector and coordinating with
the financial sector’s cyber incident protocols • Developing materials to help small- and medium-sized financial sector companies with cybersecurity and resiliency, including an
“exercise in a box” as a tool to help private sector companies conduct internal cybersecurity exercises • Establishing a mechanism where chief executive officers from financial sector companies can periodically meet with leaders from
key government agencies, including the financial regulators, to discuss financial sector cybersecurity • Finalizing and publishing the G-7 Cyber Expert Group’s work on best practices, known as G-7 Fundamental Elements on
Cybersecurity for the Financial Sector
Management (Chief Information Officer)
FY 2016 Accomplishments
• Provided timely and accurate inputs for the FY 2016 Cybersecurity Strategy implementation to achieve overall President Management Council (PMC) Level-2 with achievement in Level 3 in one area
• Deployed first Einstein 3 Accelerated (E3A) countermeasure (Domain Name Service [DNS] sinkholing) at Fiscal Service Trusted Internet Connection (TIC)
• Continued enhancing cybersecurity threat awareness among Treasury senior leaders and employees by launching the Phishing Awareness Program across all Bureaus
• Launched the Targeted User Training, which provides personalized training to users who have been targets of sophisticated cyber-attacks
• Exceeded OMB guidance to complete first iteration of evaluation and prioritization of High Value Assets (HVAs) • Timely and accurately reported on all required cybersecurity data calls for departmental consolidated reporting - 100% for PMC,
Cross-Agency Priority (CAP), Federal Information Security Management Act (FISMA) and 98% for Government Security Operations Center (GSOC) reporting
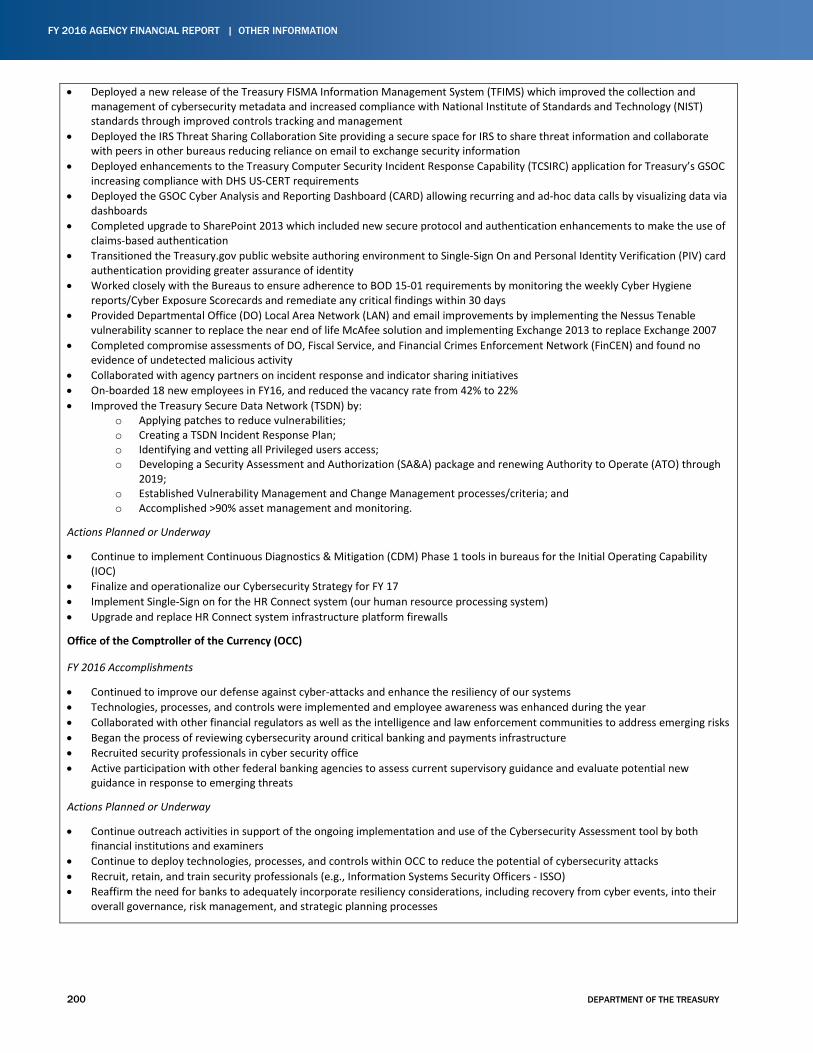
FY 2016 AGENCY FINANCIAL REPORT | OTHER INFORMATION
200 DEPARTMENT OF THE TREASURY
• Deployed a new release of the Treasury FISMA Information Management System (TFIMS) which improved the collection and management of cybersecurity metadata and increased compliance with National Institute of Standards and Technology (NIST) standards through improved controls tracking and management
• Deployed the IRS Threat Sharing Collaboration Site providing a secure space for IRS to share threat information and collaborate with peers in other bureaus reducing reliance on email to exchange security information
• Deployed enhancements to the Treasury Computer Security Incident Response Capability (TCSIRC) application for Treasury’s GSOC increasing compliance with DHS US-CERT requirements
• Deployed the GSOC Cyber Analysis and Reporting Dashboard (CARD) allowing recurring and ad-hoc data calls by visualizing data via dashboards
• Completed upgrade to SharePoint 2013 which included new secure protocol and authentication enhancements to make the use of claims-based authentication
• Transitioned the Treasury.gov public website authoring environment to Single-Sign On and Personal Identity Verification (PIV) card authentication providing greater assurance of identity
• Worked closely with the Bureaus to ensure adherence to BOD 15-01 requirements by monitoring the weekly Cyber Hygiene reports/Cyber Exposure Scorecards and remediate any critical findings within 30 days
• Provided Departmental Office (DO) Local Area Network (LAN) and email improvements by implementing the Nessus Tenable vulnerability scanner to replace the near end of life McAfee solution and implementing Exchange 2013 to replace Exchange 2007
• Completed compromise assessments of DO, Fiscal Service, and Financial Crimes Enforcement Network (FinCEN) and found no evidence of undetected malicious activity
• Collaborated with agency partners on incident response and indicator sharing initiatives • On-boarded 18 new employees in FY16, and reduced the vacancy rate from 42% to 22% • Improved the Treasury Secure Data Network (TSDN) by:
o Applying patches to reduce vulnerabilities; o Creating a TSDN Incident Response Plan; o Identifying and vetting all Privileged users access; o Developing a Security Assessment and Authorization (SA&A) package and renewing Authority to Operate (ATO) through
2019; o Established Vulnerability Management and Change Management processes/criteria; and o Accomplished >90% asset management and monitoring.
Actions Planned or Underway
• Continue to implement Continuous Diagnostics & Mitigation (CDM) Phase 1 tools in bureaus for the Initial Operating Capability (IOC)
• Finalize and operationalize our Cybersecurity Strategy for FY 17 • Implement Single-Sign on for the HR Connect system (our human resource processing system) • Upgrade and replace HR Connect system infrastructure platform firewalls
Office of the Comptroller of the Currency (OCC)
FY 2016 Accomplishments
• Continued to improve our defense against cyber-attacks and enhance the resiliency of our systems • Technologies, processes, and controls were implemented and employee awareness was enhanced during the year • Collaborated with other financial regulators as well as the intelligence and law enforcement communities to address emerging risks • Began the process of reviewing cybersecurity around critical banking and payments infrastructure • Recruited security professionals in cyber security office • Active participation with other federal banking agencies to assess current supervisory guidance and evaluate potential new
guidance in response to emerging threats
Actions Planned or Underway
• Continue outreach activities in support of the ongoing implementation and use of the Cybersecurity Assessment tool by both financial institutions and examiners
• Continue to deploy technologies, processes, and controls within OCC to reduce the potential of cybersecurity attacks • Recruit, retain, and train security professionals (e.g., Information Systems Security Officers - ISSO) • Reaffirm the need for banks to adequately incorporate resiliency considerations, including recovery from cyber events, into their
overall governance, risk management, and strategic planning processes
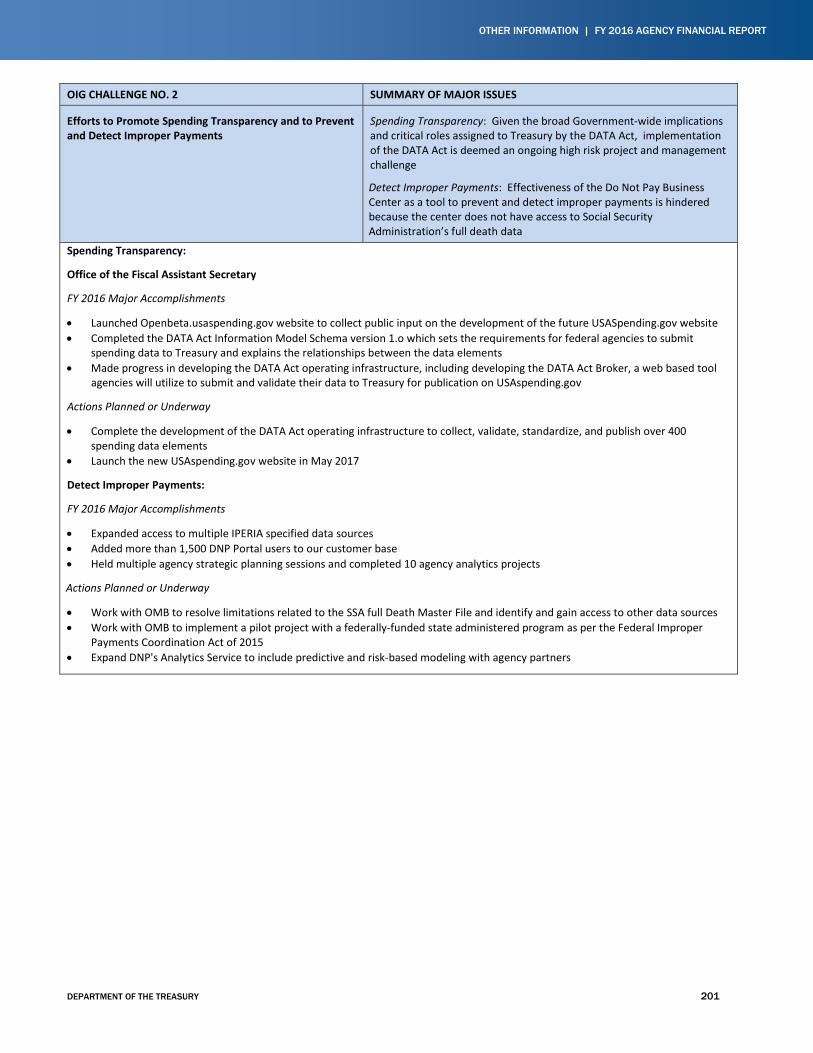
OTHER INFORMATION | FY 2016 AGENCY FINANCIAL REPORT
DEPARTMENT OF THE TREASURY 201
OIG CHALLENGE NO. 2 SUMMARY OF MAJOR ISSUES
Efforts to Promote Spending Transparency and to Prevent and Detect Improper Payments
Spending Transparency: Given the broad Government-wide implications and critical roles assigned to Treasury by the DATA Act, implementation of the DATA Act is deemed an ongoing high risk project and management challenge Detect Improper Payments: Effectiveness of the Do Not Pay Business Center as a tool to prevent and detect improper payments is hindered because the center does not have access to Social Security Administration’s full death data
Spending Transparency:
Office of the Fiscal Assistant Secretary
FY 2016 Major Accomplishments • Launched Openbeta.usaspending.gov website to collect public input on the development of the future USASpending.gov website • Completed the DATA Act Information Model Schema version 1.o which sets the requirements for federal agencies to submit
spending data to Treasury and explains the relationships between the data elements • Made progress in developing the DATA Act operating infrastructure, including developing the DATA Act Broker, a web based tool
agencies will utilize to submit and validate their data to Treasury for publication on USAspending.gov
Actions Planned or Underway
• Complete the development of the DATA Act operating infrastructure to collect, validate, standardize, and publish over 400 spending data elements
• Launch the new USAspending.gov website in May 2017
Detect Improper Payments:
FY 2016 Major Accomplishments
• Expanded access to multiple IPERIA specified data sources • Added more than 1,500 DNP Portal users to our customer base • Held multiple agency strategic planning sessions and completed 10 agency analytics projects
Actions Planned or Underway
• Work with OMB to resolve limitations related to the SSA full Death Master File and identify and gain access to other data sources • Work with OMB to implement a pilot project with a federally-funded state administered program as per the Federal Improper
Payments Coordination Act of 2015 • Expand DNP's Analytics Service to include predictive and risk-based modeling with agency partners
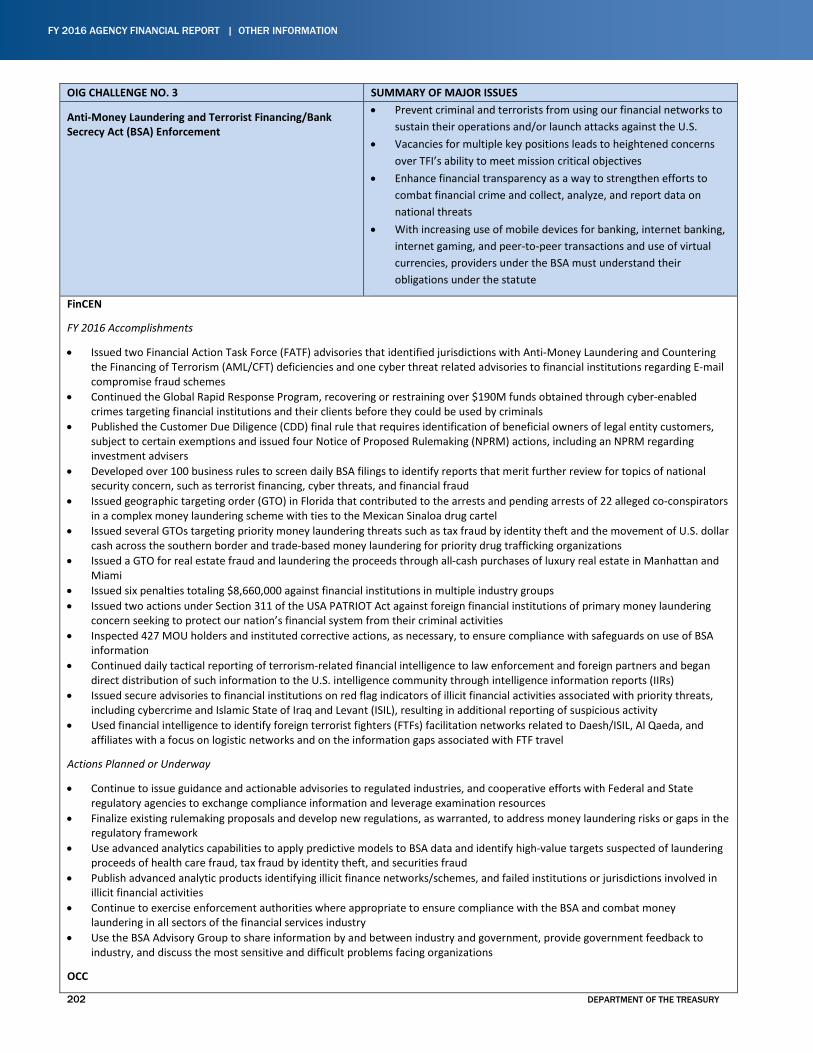
FY 2016 AGENCY FINANCIAL REPORT | OTHER INFORMATION
202 DEPARTMENT OF THE TREASURY
OIG CHALLENGE NO. 3 SUMMARY OF MAJOR ISSUES
Anti-Money Laundering and Terrorist Financing/Bank Secrecy Act (BSA) Enforcement
• Prevent criminal and terrorists from using our financial networks to sustain their operations and/or launch attacks against the U.S.
• Vacancies for multiple key positions leads to heightened concerns over TFI’s ability to meet mission critical objectives
• Enhance financial transparency as a way to strengthen efforts to combat financial crime and collect, analyze, and report data on national threats
• With increasing use of mobile devices for banking, internet banking, internet gaming, and peer-to-peer transactions and use of virtual currencies, providers under the BSA must understand their obligations under the statute
FinCEN
FY 2016 Accomplishments
• Issued two Financial Action Task Force (FATF) advisories that identified jurisdictions with Anti-Money Laundering and Countering the Financing of Terrorism (AML/CFT) deficiencies and one cyber threat related advisories to financial institutions regarding E-mail compromise fraud schemes
• Continued the Global Rapid Response Program, recovering or restraining over $190M funds obtained through cyber-enabled crimes targeting financial institutions and their clients before they could be used by criminals
• Published the Customer Due Diligence (CDD) final rule that requires identification of beneficial owners of legal entity customers, subject to certain exemptions and issued four Notice of Proposed Rulemaking (NPRM) actions, including an NPRM regarding investment advisers
• Developed over 100 business rules to screen daily BSA filings to identify reports that merit further review for topics of national security concern, such as terrorist financing, cyber threats, and financial fraud
• Issued geographic targeting order (GTO) in Florida that contributed to the arrests and pending arrests of 22 alleged co-conspirators in a complex money laundering scheme with ties to the Mexican Sinaloa drug cartel
• Issued several GTOs targeting priority money laundering threats such as tax fraud by identity theft and the movement of U.S. dollar cash across the southern border and trade-based money laundering for priority drug trafficking organizations
• Issued a GTO for real estate fraud and laundering the proceeds through all-cash purchases of luxury real estate in Manhattan and Miami
• Issued six penalties totaling $8,660,000 against financial institutions in multiple industry groups • Issued two actions under Section 311 of the USA PATRIOT Act against foreign financial institutions of primary money laundering
concern seeking to protect our nation’s financial system from their criminal activities • Inspected 427 MOU holders and instituted corrective actions, as necessary, to ensure compliance with safeguards on use of BSA
information • Continued daily tactical reporting of terrorism-related financial intelligence to law enforcement and foreign partners and began
direct distribution of such information to the U.S. intelligence community through intelligence information reports (IIRs) • Issued secure advisories to financial institutions on red flag indicators of illicit financial activities associated with priority threats,
including cybercrime and Islamic State of Iraq and Levant (ISIL), resulting in additional reporting of suspicious activity • Used financial intelligence to identify foreign terrorist fighters (FTFs) facilitation networks related to Daesh/ISIL, Al Qaeda, and
affiliates with a focus on logistic networks and on the information gaps associated with FTF travel
Actions Planned or Underway
• Continue to issue guidance and actionable advisories to regulated industries, and cooperative efforts with Federal and State regulatory agencies to exchange compliance information and leverage examination resources
• Finalize existing rulemaking proposals and develop new regulations, as warranted, to address money laundering risks or gaps in the regulatory framework
• Use advanced analytics capabilities to apply predictive models to BSA data and identify high-value targets suspected of laundering proceeds of health care fraud, tax fraud by identity theft, and securities fraud
• Publish advanced analytic products identifying illicit finance networks/schemes, and failed institutions or jurisdictions involved in illicit financial activities
• Continue to exercise enforcement authorities where appropriate to ensure compliance with the BSA and combat money laundering in all sectors of the financial services industry
• Use the BSA Advisory Group to share information by and between industry and government, provide government feedback to industry, and discuss the most sensitive and difficult problems facing organizations
OCC
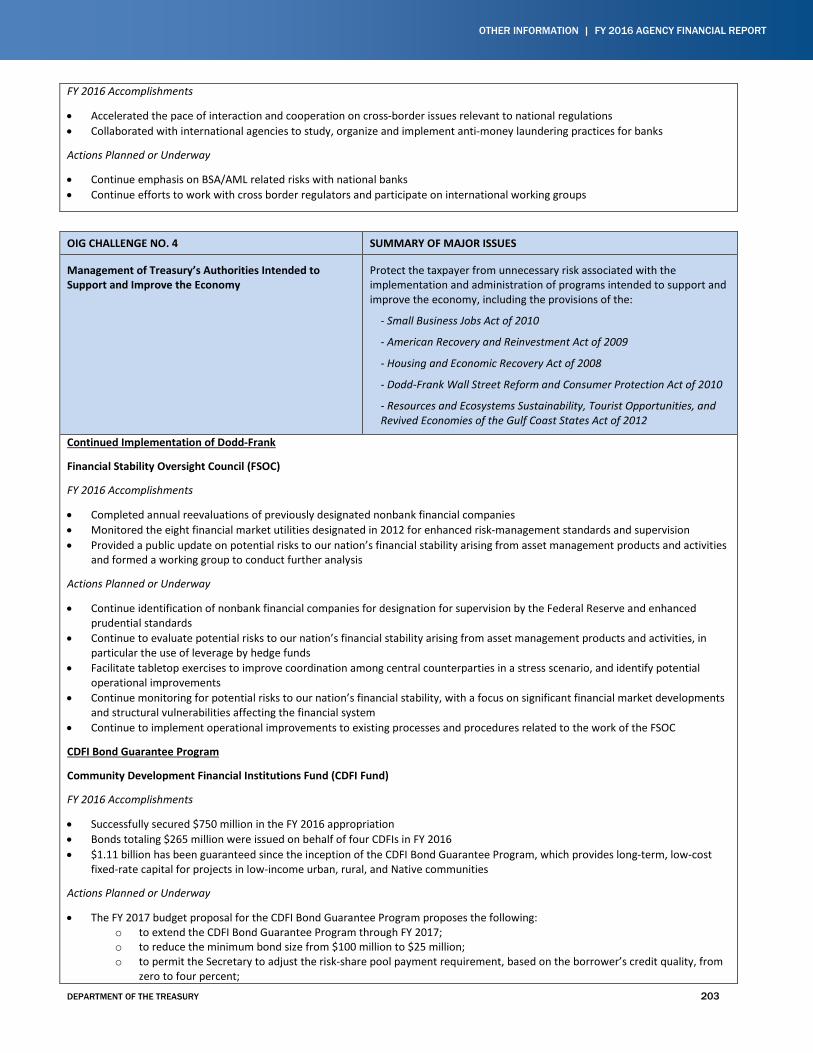
OTHER INFORMATION | FY 2016 AGENCY FINANCIAL REPORT
DEPARTMENT OF THE TREASURY 203
FY 2016 Accomplishments
• Accelerated the pace of interaction and cooperation on cross-border issues relevant to national regulations • Collaborated with international agencies to study, organize and implement anti-money laundering practices for banks
Actions Planned or Underway
• Continue emphasis on BSA/AML related risks with national banks • Continue efforts to work with cross border regulators and participate on international working groups
OIG CHALLENGE NO. 4 SUMMARY OF MAJOR ISSUES
Management of Treasury’s Authorities Intended to Support and Improve the Economy
Protect the taxpayer from unnecessary risk associated with the implementation and administration of programs intended to support and improve the economy, including the provisions of the:
- Small Business Jobs Act of 2010
- American Recovery and Reinvestment Act of 2009
- Housing and Economic Recovery Act of 2008
- Dodd-Frank Wall Street Reform and Consumer Protection Act of 2010
- Resources and Ecosystems Sustainability, Tourist Opportunities, and Revived Economies of the Gulf Coast States Act of 2012
Continued Implementation of Dodd-Frank
Financial Stability Oversight Council (FSOC)
FY 2016 Accomplishments
• Completed annual reevaluations of previously designated nonbank financial companies • Monitored the eight financial market utilities designated in 2012 for enhanced risk-management standards and supervision • Provided a public update on potential risks to our nation’s financial stability arising from asset management products and activities
and formed a working group to conduct further analysis
Actions Planned or Underway
• Continue identification of nonbank financial companies for designation for supervision by the Federal Reserve and enhanced prudential standards
• Continue to evaluate potential risks to our nation’s financial stability arising from asset management products and activities, in particular the use of leverage by hedge funds
• Facilitate tabletop exercises to improve coordination among central counterparties in a stress scenario, and identify potential operational improvements
• Continue monitoring for potential risks to our nation’s financial stability, with a focus on significant financial market developments and structural vulnerabilities affecting the financial system
• Continue to implement operational improvements to existing processes and procedures related to the work of the FSOC
CDFI Bond Guarantee Program
Community Development Financial Institutions Fund (CDFI Fund)
FY 2016 Accomplishments
• Successfully secured $750 million in the FY 2016 appropriation • Bonds totaling $265 million were issued on behalf of four CDFIs in FY 2016 • $1.11 billion has been guaranteed since the inception of the CDFI Bond Guarantee Program, which provides long-term, low-cost
fixed-rate capital for projects in low-income urban, rural, and Native communities
Actions Planned or Underway
• The FY 2017 budget proposal for the CDFI Bond Guarantee Program proposes the following: o to extend the CDFI Bond Guarantee Program through FY 2017; o to reduce the minimum bond size from $100 million to $25 million; o to permit the Secretary to adjust the risk-share pool payment requirement, based on the borrower’s credit quality, from
zero to four percent;
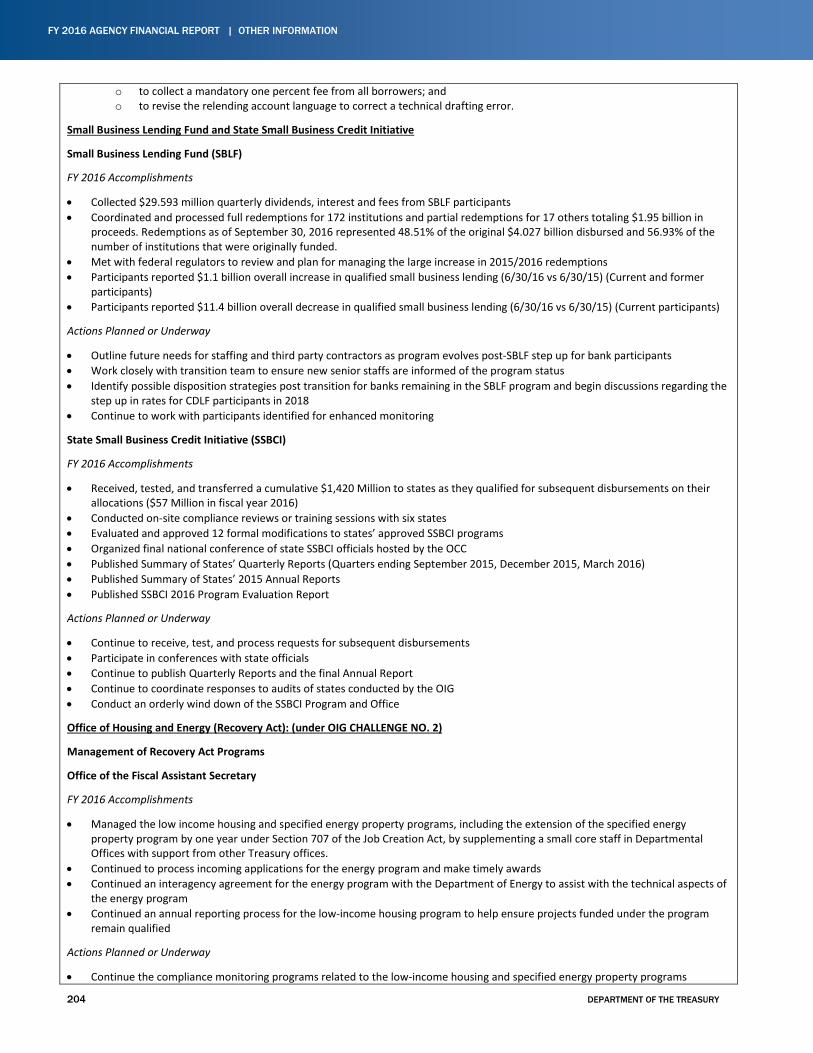
FY 2016 AGENCY FINANCIAL REPORT | OTHER INFORMATION
204 DEPARTMENT OF THE TREASURY
o to collect a mandatory one percent fee from all borrowers; and o to revise the relending account language to correct a technical drafting error.
Small Business Lending Fund and State Small Business Credit Initiative
Small Business Lending Fund (SBLF)
FY 2016 Accomplishments
• Collected $29.593 million quarterly dividends, interest and fees from SBLF participants • Coordinated and processed full redemptions for 172 institutions and partial redemptions for 17 others totaling $1.95 billion in
proceeds. Redemptions as of September 30, 2016 represented 48.51% of the original $4.027 billion disbursed and 56.93% of the number of institutions that were originally funded.
• Met with federal regulators to review and plan for managing the large increase in 2015/2016 redemptions • Participants reported $1.1 billion overall increase in qualified small business lending (6/30/16 vs 6/30/15) (Current and former
participants) • Participants reported $11.4 billion overall decrease in qualified small business lending (6/30/16 vs 6/30/15) (Current participants)
Actions Planned or Underway
• Outline future needs for staffing and third party contractors as program evolves post-SBLF step up for bank participants • Work closely with transition team to ensure new senior staffs are informed of the program status • Identify possible disposition strategies post transition for banks remaining in the SBLF program and begin discussions regarding the
step up in rates for CDLF participants in 2018 • Continue to work with participants identified for enhanced monitoring
State Small Business Credit Initiative (SSBCI)
FY 2016 Accomplishments
• Received, tested, and transferred a cumulative $1,420 Million to states as they qualified for subsequent disbursements on their allocations ($57 Million in fiscal year 2016)
• Conducted on-site compliance reviews or training sessions with six states • Evaluated and approved 12 formal modifications to states’ approved SSBCI programs • Organized final national conference of state SSBCI officials hosted by the OCC • Published Summary of States’ Quarterly Reports (Quarters ending September 2015, December 2015, March 2016) • Published Summary of States’ 2015 Annual Reports • Published SSBCI 2016 Program Evaluation Report
Actions Planned or Underway
• Continue to receive, test, and process requests for subsequent disbursements • Participate in conferences with state officials • Continue to publish Quarterly Reports and the final Annual Report • Continue to coordinate responses to audits of states conducted by the OIG • Conduct an orderly wind down of the SSBCI Program and Office
Office of Housing and Energy (Recovery Act): (under OIG CHALLENGE NO. 2)
Management of Recovery Act Programs
Office of the Fiscal Assistant Secretary
FY 2016 Accomplishments
• Managed the low income housing and specified energy property programs, including the extension of the specified energy property program by one year under Section 707 of the Job Creation Act, by supplementing a small core staff in Departmental Offices with support from other Treasury offices.
• Continued to process incoming applications for the energy program and make timely awards • Continued an interagency agreement for the energy program with the Department of Energy to assist with the technical aspects of
the energy program • Continued an annual reporting process for the low-income housing program to help ensure projects funded under the program
remain qualified
Actions Planned or Underway
• Continue the compliance monitoring programs related to the low-income housing and specified energy property programs
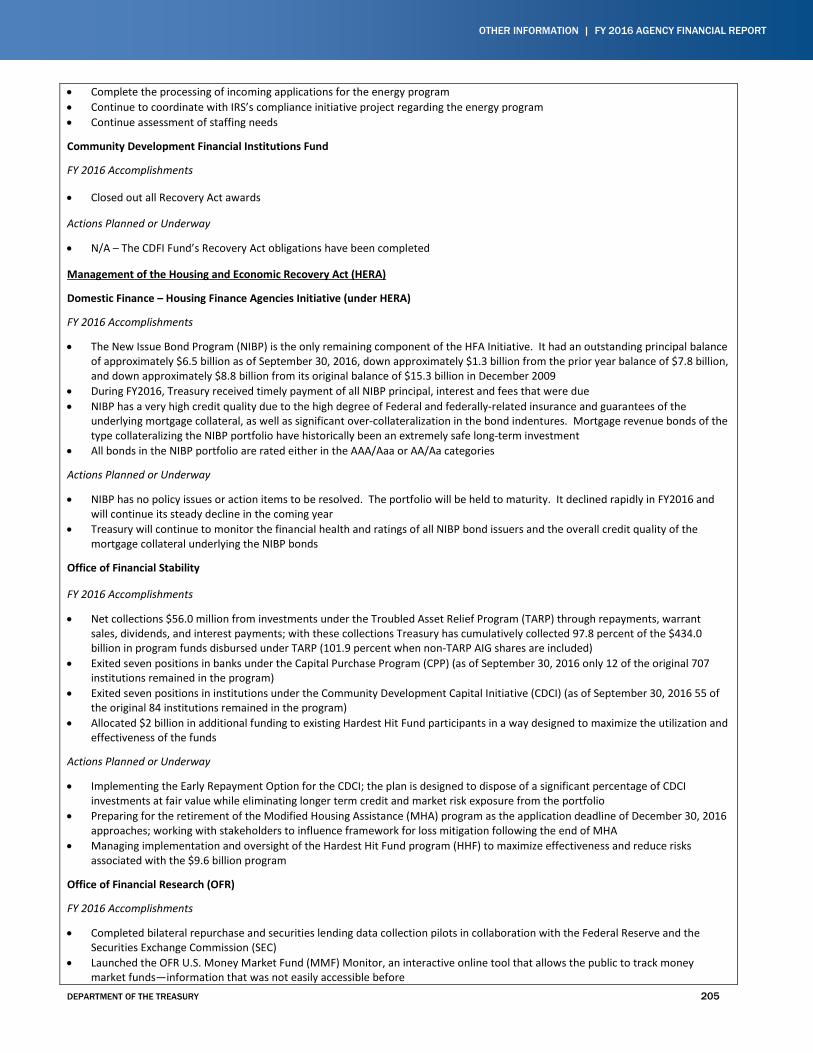
OTHER INFORMATION | FY 2016 AGENCY FINANCIAL REPORT
DEPARTMENT OF THE TREASURY 205
• Complete the processing of incoming applications for the energy program • Continue to coordinate with IRS’s compliance initiative project regarding the energy program • Continue assessment of staffing needs
Community Development Financial Institutions Fund
FY 2016 Accomplishments
• Closed out all Recovery Act awards
Actions Planned or Underway
• N/A – The CDFI Fund’s Recovery Act obligations have been completed
Management of the Housing and Economic Recovery Act (HERA)
Domestic Finance – Housing Finance Agencies Initiative (under HERA)
FY 2016 Accomplishments
• The New Issue Bond Program (NIBP) is the only remaining component of the HFA Initiative. It had an outstanding principal balance of approximately $6.5 billion as of September 30, 2016, down approximately $1.3 billion from the prior year balance of $7.8 billion, and down approximately $8.8 billion from its original balance of $15.3 billion in December 2009
• During FY2016, Treasury received timely payment of all NIBP principal, interest and fees that were due • NIBP has a very high credit quality due to the high degree of Federal and federally-related insurance and guarantees of the
underlying mortgage collateral, as well as significant over-collateralization in the bond indentures. Mortgage revenue bonds of the type collateralizing the NIBP portfolio have historically been an extremely safe long-term investment
• All bonds in the NIBP portfolio are rated either in the AAA/Aaa or AA/Aa categories
Actions Planned or Underway
• NIBP has no policy issues or action items to be resolved. The portfolio will be held to maturity. It declined rapidly in FY2016 and will continue its steady decline in the coming year
• Treasury will continue to monitor the financial health and ratings of all NIBP bond issuers and the overall credit quality of the mortgage collateral underlying the NIBP bonds
Office of Financial Stability
FY 2016 Accomplishments
• Net collections $56.0 million from investments under the Troubled Asset Relief Program (TARP) through repayments, warrant sales, dividends, and interest payments; with these collections Treasury has cumulatively collected 97.8 percent of the $434.0 billion in program funds disbursed under TARP (101.9 percent when non-TARP AIG shares are included)
• Exited seven positions in banks under the Capital Purchase Program (CPP) (as of September 30, 2016 only 12 of the original 707 institutions remained in the program)
• Exited seven positions in institutions under the Community Development Capital Initiative (CDCI) (as of September 30, 2016 55 of the original 84 institutions remained in the program)
• Allocated $2 billion in additional funding to existing Hardest Hit Fund participants in a way designed to maximize the utilization and effectiveness of the funds
Actions Planned or Underway
• Implementing the Early Repayment Option for the CDCI; the plan is designed to dispose of a significant percentage of CDCI investments at fair value while eliminating longer term credit and market risk exposure from the portfolio
• Preparing for the retirement of the Modified Housing Assistance (MHA) program as the application deadline of December 30, 2016 approaches; working with stakeholders to influence framework for loss mitigation following the end of MHA
• Managing implementation and oversight of the Hardest Hit Fund program (HHF) to maximize effectiveness and reduce risks associated with the $9.6 billion program
Office of Financial Research (OFR)
FY 2016 Accomplishments
• Completed bilateral repurchase and securities lending data collection pilots in collaboration with the Federal Reserve and the Securities Exchange Commission (SEC)
• Launched the OFR U.S. Money Market Fund (MMF) Monitor, an interactive online tool that allows the public to track money market funds—information that was not easily accessible before
FY 2016 AGENCY FINANCIAL REPORT | OTHER INFORMATION
206 DEPARTMENT OF THE TREASURY
• Enhanced the global Legal Entity Identifier (LEI) system, and launched phase 2 of the program, which will make information about complex ownership structures available to the public
• Evaluated vulnerabilities in central clearing and central counterparties • Launched a programmatic approach that aligns our priorities with our mission and that coordinates our work on data, research,
and analysis based on the needs of the OFR’s stakeholders and the mandates of the OFR under the Dodd-Frank Act
Actions Planned or Underway
• Partner with the Federal Reserve and the SEC to design and implement a permanent collection for bilateral repo and sec lending data
• Develop and publish additional monitors to track risks in hedge funds, asset-return correlations, and credit risks • Collect data and publish research evaluating vulnerabilities on shadow banking activities and other consequential threats to
financial stability • Partner with the Federal Reserve, the Federal Reserve Bank of New York, and industry to explore the creation of a reference rate
supporting critical financial market contracts • Expand the programmatic approach beyond the eight identified programs
RESTORE ACT
Office of the Fiscal Assistant Secretary
FY 2016 Accomplishments
• Published RESTORE Act final rule, followed by an amendment (interim final rule) to assist the Gulf Coast Ecosystem Restoration Council (Council) manage its administrative expenses effectively and efficiently
• Updated RESTORE Act funding opportunity announcements and frequently asked questions, and modified our OMB-approved forms to conform to the final rule and assist eligible entities apply for and receive grants
• Published trust fund estimate tables to reflect the 15-year civil penalty payment schedule, included in the BP consent decree arising from the Deepwater Horizon oil spill, to assist eligible entities, the Council, and NOAA plan for the use of trust fund deposits
• Conducted grants management training for 139 state and local staff in 43 of 48 eligible entities, and conducted initial reviews of internal controls for 32 of 48 entities and provided technical assistance to ten additional entities
Actions Planned or Underway
• Work with eligible entities to determine ways to plan for and implement projects for ecological and economic restoration in the Gulf Coast Region, given the 15-year BP civil penalty payment schedule
• Continue to offer training and technical assistance in various aspects of grants management to entities to assist them in applying for and managing grants
• Collaborate closely with the Fiscal Service on RESTORE Trust Fund allocation tables and Automated Standard Application for Payments (ASAP) accounts for Treasury RESTORE Act grants, consistent with established policies and procedures
OTHER INFORMATION | FY 2016 AGENCY FINANCIAL REPORT
DEPARTMENT OF THE TREASURY 207
Matters of Concern No. 1 SUMMARY OF MAJOR ISSUES
Currency and Coin Production • BEP needs to ensure that the design and production projects are adequately managed to avoid another instance of production deficiencies
• Mint should ensure comprehensive review of U.S. currency to include production and use of coins, the use of alternative metals, and the sustainability of Mint facilities for production
• BEP and Mint need to consider the effect of alternative payment methods and other technological advances on their respective business models, practices, future planning and interactions with customers and FRB
FY 2016 Accomplishments
Coin Production
• FY 2016 cost of production for the penny increased slightly to 1.50 cents compared to 1.43 cents in FY 2015, while nickel costs decreased to 6.32 cents from 7.44 cents. The cost reductions for the nickel were realized primarily due to the decline in the cost of metal, which decreased 21%. In spite of a decline in metal costs, penny and nickel costs continue to remain above face value for each denomination.
• Seigniorage (difference between the cost of producing a coin and its face value) has been returned to the general fund in the amount of $550 million for FY 2016. The second consecutive year of returns at this level.
• Since the second biennial report in December 2014, the Mint continued extensive testing of six different metal compositions, as well as initial testing of other materials that showed potential as either seamless or co-circulate alternatives.
Currency Production
• Single Note Inspection (SNI): Recovered more than 350 million series 2009 notes for a cost savings of $26 million • Retooling: The Federal Reserve Board and BEP agreed to modify the existing manufacturing process to eliminate the need to
package notes in serial number numeric sequence and to add a reclamation process to recover good notes from rejected sheets using SNI
• Raised Tactile Feature: Developed and tested six denomination schemes with the blind and visually-impaired community; selected a final denomination scheme (four-position, binary on/off rectangle)
• Western Currency Facility Expansion: Submitted a proposal to add approximately 250,000 square feet of new space to accommodate equipment to add new security features
• Human Capital Strategic Plan: Developed a framework and roadmap for six main areas: Competency Modeling, Workforce Planning, STEM Rotational Training, Apprenticeship and Upward Mobility, Leadership Development, and Knowledge Management
Banknote Design and Development Program
• All internal and external stakeholders approved detailed technical requirements for the next family of notes • Developed an integrated master schedule for the first note of the new family of notes, currently known as the Catalyst $10.= • Created “low fidelity” concepts for the Catalyst family; held stakeholder workshops to refine the concepts • Eight new security features moved into the Concept Development phase; three projects moved into the Test and Optimize phase • Awarded eight new contracts for security feature research and development moving three projects from the Feasibility phase into
full development
Actions Planned or Underway
Coin Production
• Continue efforts to increase efficiency and control or reduce the cost to manufacture the nation’s coinage • Issue the third biennial report to Congress on alternative coinage materials as required in December 2016
Currency Production
• SNI: Complete the SNI recovery effort of series 2009 notes in FY 2017; an additional 180 million notes are expected to be recovered for a cost savings of $14 million
• Implement the SNI reclamation process for both the NXG $100 note at the Western Currency Facility and the NXG $20 note at the Washington, DC facility; more than 100 million NXG $100 notes and 50 million NXG $20 notes are expected to be reclaimed in FY 2017 for a savings of more than $8 million
FY 2016 AGENCY FINANCIAL REPORT | OTHER INFORMATION
208 DEPARTMENT OF THE TREASURY
• Raised Tactile Feature: Final selection of the application method and the feature’s location on the note • Western Currency Facility Expansion: Start design efforts in 2017 with construction commencing in 2018 – 2019 • Human Capital Strategic Plan: Develop technical competency models for priority job series; implement BEP’s workforce planning
process within a selected Directorate (FY17); operationalize STEM and Career Development programs; establish management processes for all active apprenticeship programs
Banknote Design and Development Program
• Finalize low fidelity design concepts and advance into medium fidelity phase • The Catalyst $10 note remains targeted for production-readiness in 2020
Matters of Concern No. 2 SUMMARY OF MAJOR ISSUES
Documenting Key Activities and Decisions Promote an effective records management program to ensure Treasury management personnel remain aware and vigilant
Management (Privacy, Transparency, and Records)
FY 2016 Accomplishments
• Collaborated with the Office of the General Counsel (OGC) and the Office of the Assistant Secretary for Management (OASM) to process 29 Treasury Orders and Directives that were due for review
• Developed and delivered focused training and enhanced information management education to employees on core mission areas of Privacy, FOIA, and Records Management
• Provided training for 648 new and 260 departing DO employees in records management in FY 2016 • Collaborated with bureau privacy officers, took actions to ensure that 97 percent of all employees and contractors completed the
annual Privacy Awareness Training • Processed two requests for information from European Union (EU) citizens as required by the Terrorist Finance Tracking Program
agreement between Treasury and the EU • Reviewed, revised, and approved eight DO Privacy and Civil Liberties Impact Assessments, 17 DO Privacy Act Systems of Records
Notices, and 16 Computer Matching Agreements
Actions Planned or Underway
• Continue to collaborate with the OCIO on privacy and transparency issues; particularly in development, certification, and implementation of the Capstone email software system to meet the December 31, 2016 deadline for electronically managing email
• Continue to update our records management policies and processes to implement requirements of M-12-18 which include developing and issuing a records management strategic plan
• Continue to update Treasury Orders and Directives that are due for review in FY 2017 • Continue to update our FOIA policies and processes to incorporate recent changes to FOIA, including DOJ’s “Release to One,
Release to All” policy, expected January 2017 and Treasury’s FOIA regulations • Continue to focus on records management education for new and departing employees in FY 2017
OTHER INFORMATION | FY 2016 AGENCY FINANCIAL REPORT
DEPARTMENT OF THE TREASURY 209
Matters of Concern No. 3 SUMMARY OF MAJOR ISSUES
Enterprise Risk Management (ERM) • Implement guidance to establish a comprehensive and effective ERM program
• Implement an ERM capability to integrate strategic planning and review processes and internal control processes.
Office of Risk Management
FY 2016 Accomplishments
• Held regular discussions of major risk issues with senior leaders at the Treasury Risk Management Committee (co-chaired by the Deputy Secretary and the Chief Risk Officer (CRO) and members include Under Secretaries and Assistant Secretaries), that have led to follow-up work and deliverables to help mitigate the risks discussed
• Created a community of practice Treasury-wide through the Enterprise Risk Management Council (chaired by the CRO) to discuss ERM and share best practices across all the bureaus
• Worked closely with OMB on the development of Circular A-123 revisions to incorporate ERM • Lead in writing “Playbook: Enterprise Risk Management for the U.S. Federal Government”, a helpful guide for agencies to help
them implement ERM and the requirements of OMB Circular A-123 • Worked with Management to integrate a risk landscape slide discussion into the Quarterly Performance Reviews (QPR) • Worked with Management on the Strategic Objective Annual Review (SOAR) process • Worked with the CDFI Fund on model risk management as well as sitting on its Credit Review Board • Co-chaired the Fiscal High Value Asset Executive Oversight Council to provide oversight and counsel on our most important mission
critical functions. • Consulted with several offices in Treasury on specific risk management questions
Actions Planned or Underway
• Continue development of a Treasury-wide ERM Playbook • Continue working with offices to produce risk profiles which will be used to develop a Treasury-wide risk profile • Continue Treasury Risk Management Committee and ERM Council meetings in the next administration • Continue to work with other agencies to help them develop ERM programs by developing an interagency community of practice
for risk management who will meet on a bimonthly basis
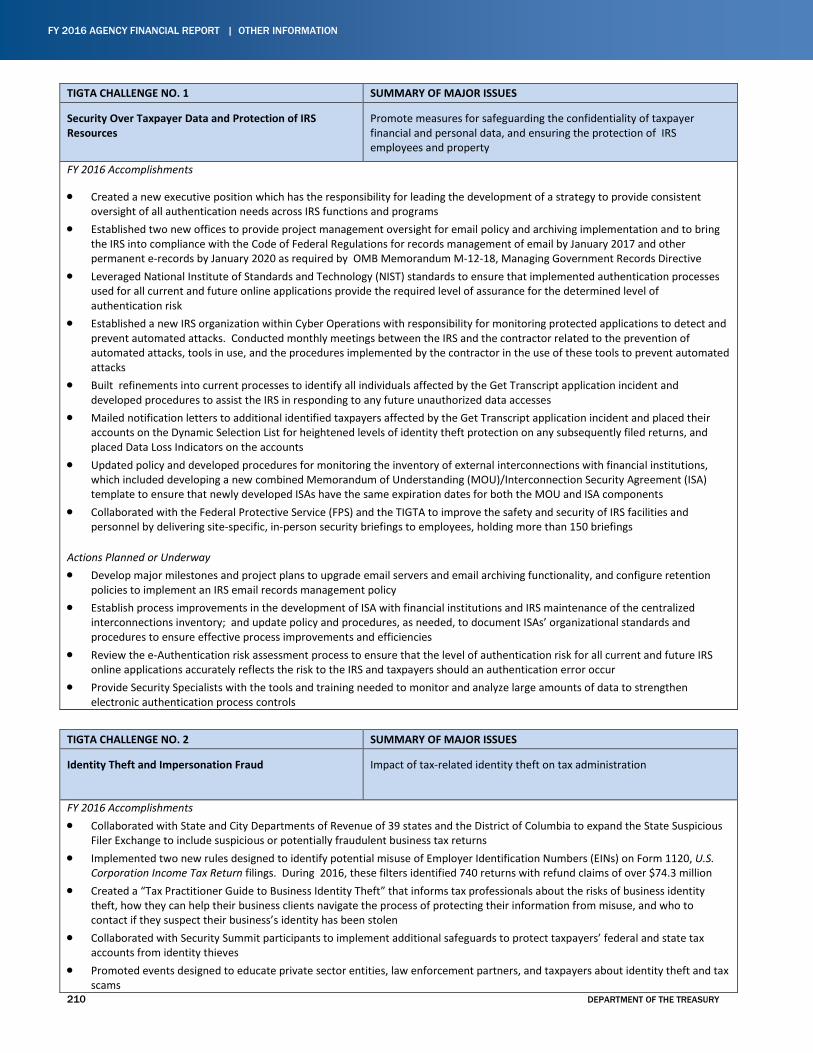
FY 2016 AGENCY FINANCIAL REPORT | OTHER INFORMATION
210 DEPARTMENT OF THE TREASURY
TIGTA CHALLENGE NO. 1 SUMMARY OF MAJOR ISSUES
Security Over Taxpayer Data and Protection of IRS Resources
Promote measures for safeguarding the confidentiality of taxpayer financial and personal data, and ensuring the protection of IRS employees and property
FY 2016 Accomplishments
• Created a new executive position which has the responsibility for leading the development of a strategy to provide consistent oversight of all authentication needs across IRS functions and programs
• Established two new offices to provide project management oversight for email policy and archiving implementation and to bring the IRS into compliance with the Code of Federal Regulations for records management of email by January 2017 and other permanent e-records by January 2020 as required by OMB Memorandum M-12-18, Managing Government Records Directive
• Leveraged National Institute of Standards and Technology (NIST) standards to ensure that implemented authentication processes used for all current and future online applications provide the required level of assurance for the determined level of authentication risk
• Established a new IRS organization within Cyber Operations with responsibility for monitoring protected applications to detect and prevent automated attacks. Conducted monthly meetings between the IRS and the contractor related to the prevention of automated attacks, tools in use, and the procedures implemented by the contractor in the use of these tools to prevent automated attacks
• Built refinements into current processes to identify all individuals affected by the Get Transcript application incident and developed procedures to assist the IRS in responding to any future unauthorized data accesses
• Mailed notification letters to additional identified taxpayers affected by the Get Transcript application incident and placed their accounts on the Dynamic Selection List for heightened levels of identity theft protection on any subsequently filed returns, and placed Data Loss Indicators on the accounts
• Updated policy and developed procedures for monitoring the inventory of external interconnections with financial institutions, which included developing a new combined Memorandum of Understanding (MOU)/Interconnection Security Agreement (ISA) template to ensure that newly developed ISAs have the same expiration dates for both the MOU and ISA components
• Collaborated with the Federal Protective Service (FPS) and the TIGTA to improve the safety and security of IRS facilities and personnel by delivering site-specific, in-person security briefings to employees, holding more than 150 briefings
Actions Planned or Underway • Develop major milestones and project plans to upgrade email servers and email archiving functionality, and configure retention
policies to implement an IRS email records management policy • Establish process improvements in the development of ISA with financial institutions and IRS maintenance of the centralized
interconnections inventory; and update policy and procedures, as needed, to document ISAs’ organizational standards and procedures to ensure effective process improvements and efficiencies
• Review the e-Authentication risk assessment process to ensure that the level of authentication risk for all current and future IRS online applications accurately reflects the risk to the IRS and taxpayers should an authentication error occur
• Provide Security Specialists with the tools and training needed to monitor and analyze large amounts of data to strengthen electronic authentication process controls
TIGTA CHALLENGE NO. 2 SUMMARY OF MAJOR ISSUES
Identity Theft and Impersonation Fraud
Impact of tax-related identity theft on tax administration
FY 2016 Accomplishments • Collaborated with State and City Departments of Revenue of 39 states and the District of Columbia to expand the State Suspicious
Filer Exchange to include suspicious or potentially fraudulent business tax returns • Implemented two new rules designed to identify potential misuse of Employer Identification Numbers (EINs) on Form 1120, U.S.
Corporation Income Tax Return filings. During 2016, these filters identified 740 returns with refund claims of over $74.3 million • Created a “Tax Practitioner Guide to Business Identity Theft” that informs tax professionals about the risks of business identity
theft, how they can help their business clients navigate the process of protecting their information from misuse, and who to contact if they suspect their business’s identity has been stolen
• Collaborated with Security Summit participants to implement additional safeguards to protect taxpayers’ federal and state tax accounts from identity thieves
• Promoted events designed to educate private sector entities, law enforcement partners, and taxpayers about identity theft and tax scams
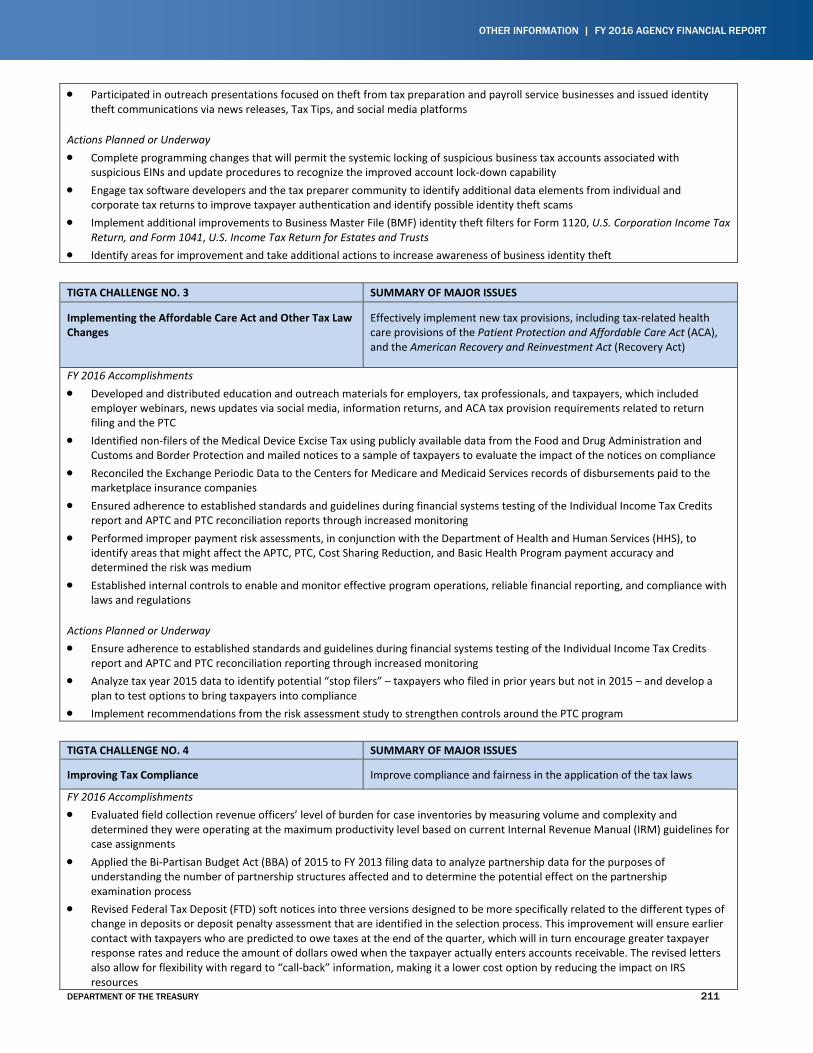
OTHER INFORMATION | FY 2016 AGENCY FINANCIAL REPORT
DEPARTMENT OF THE TREASURY 211
• Participated in outreach presentations focused on theft from tax preparation and payroll service businesses and issued identity theft communications via news releases, Tax Tips, and social media platforms
Actions Planned or Underway • Complete programming changes that will permit the systemic locking of suspicious business tax accounts associated with
suspicious EINs and update procedures to recognize the improved account lock-down capability • Engage tax software developers and the tax preparer community to identify additional data elements from individual and
corporate tax returns to improve taxpayer authentication and identify possible identity theft scams • Implement additional improvements to Business Master File (BMF) identity theft filters for Form 1120, U.S. Corporation Income Tax
Return, and Form 1041, U.S. Income Tax Return for Estates and Trusts • Identify areas for improvement and take additional actions to increase awareness of business identity theft
TIGTA CHALLENGE NO. 3 SUMMARY OF MAJOR ISSUES
Implementing the Affordable Care Act and Other Tax Law Changes
Effectively implement new tax provisions, including tax-related health care provisions of the Patient Protection and Affordable Care Act (ACA), and the American Recovery and Reinvestment Act (Recovery Act)
FY 2016 Accomplishments • Developed and distributed education and outreach materials for employers, tax professionals, and taxpayers, which included
employer webinars, news updates via social media, information returns, and ACA tax provision requirements related to return filing and the PTC
• Identified non-filers of the Medical Device Excise Tax using publicly available data from the Food and Drug Administration and Customs and Border Protection and mailed notices to a sample of taxpayers to evaluate the impact of the notices on compliance
• Reconciled the Exchange Periodic Data to the Centers for Medicare and Medicaid Services records of disbursements paid to the marketplace insurance companies
• Ensured adherence to established standards and guidelines during financial systems testing of the Individual Income Tax Credits report and APTC and PTC reconciliation reports through increased monitoring
• Performed improper payment risk assessments, in conjunction with the Department of Health and Human Services (HHS), to identify areas that might affect the APTC, PTC, Cost Sharing Reduction, and Basic Health Program payment accuracy and determined the risk was medium
• Established internal controls to enable and monitor effective program operations, reliable financial reporting, and compliance with laws and regulations
Actions Planned or Underway • Ensure adherence to established standards and guidelines during financial systems testing of the Individual Income Tax Credits
report and APTC and PTC reconciliation reporting through increased monitoring • Analyze tax year 2015 data to identify potential “stop filers” – taxpayers who filed in prior years but not in 2015 – and develop a
plan to test options to bring taxpayers into compliance • Implement recommendations from the risk assessment study to strengthen controls around the PTC program
TIGTA CHALLENGE NO. 4 SUMMARY OF MAJOR ISSUES
Improving Tax Compliance Improve compliance and fairness in the application of the tax laws
FY 2016 Accomplishments • Evaluated field collection revenue officers’ level of burden for case inventories by measuring volume and complexity and
determined they were operating at the maximum productivity level based on current Internal Revenue Manual (IRM) guidelines for case assignments
• Applied the Bi-Partisan Budget Act (BBA) of 2015 to FY 2013 filing data to analyze partnership data for the purposes of understanding the number of partnership structures affected and to determine the potential effect on the partnership examination process
• Revised Federal Tax Deposit (FTD) soft notices into three versions designed to be more specifically related to the different types of change in deposits or deposit penalty assessment that are identified in the selection process. This improvement will ensure earlier contact with taxpayers who are predicted to owe taxes at the end of the quarter, which will in turn encourage greater taxpayer response rates and reduce the amount of dollars owed when the taxpayer actually enters accounts receivable. The revised letters also allow for flexibility with regard to “call-back” information, making it a lower cost option by reducing the impact on IRS resources
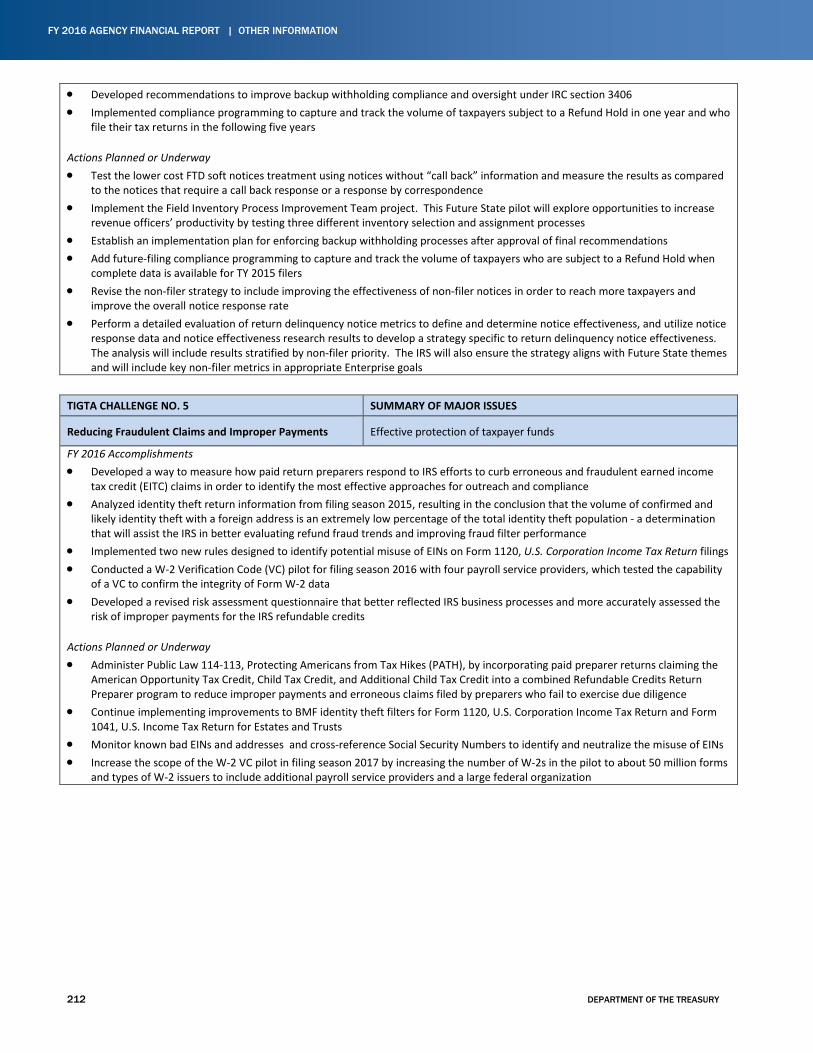
FY 2016 AGENCY FINANCIAL REPORT | OTHER INFORMATION
212 DEPARTMENT OF THE TREASURY
• Developed recommendations to improve backup withholding compliance and oversight under IRC section 3406 • Implemented compliance programming to capture and track the volume of taxpayers subject to a Refund Hold in one year and who
file their tax returns in the following five years
Actions Planned or Underway • Test the lower cost FTD soft notices treatment using notices without “call back” information and measure the results as compared
to the notices that require a call back response or a response by correspondence • Implement the Field Inventory Process Improvement Team project. This Future State pilot will explore opportunities to increase
revenue officers’ productivity by testing three different inventory selection and assignment processes • Establish an implementation plan for enforcing backup withholding processes after approval of final recommendations • Add future-filing compliance programming to capture and track the volume of taxpayers who are subject to a Refund Hold when
complete data is available for TY 2015 filers • Revise the non-filer strategy to include improving the effectiveness of non-filer notices in order to reach more taxpayers and
improve the overall notice response rate • Perform a detailed evaluation of return delinquency notice metrics to define and determine notice effectiveness, and utilize notice
response data and notice effectiveness research results to develop a strategy specific to return delinquency notice effectiveness. The analysis will include results stratified by non-filer priority. The IRS will also ensure the strategy aligns with Future State themes and will include key non-filer metrics in appropriate Enterprise goals
TIGTA CHALLENGE NO. 5 SUMMARY OF MAJOR ISSUES
Reducing Fraudulent Claims and Improper Payments Effective protection of taxpayer funds
FY 2016 Accomplishments • Developed a way to measure how paid return preparers respond to IRS efforts to curb erroneous and fraudulent earned income
tax credit (EITC) claims in order to identify the most effective approaches for outreach and compliance • Analyzed identity theft return information from filing season 2015, resulting in the conclusion that the volume of confirmed and
likely identity theft with a foreign address is an extremely low percentage of the total identity theft population - a determination that will assist the IRS in better evaluating refund fraud trends and improving fraud filter performance
• Implemented two new rules designed to identify potential misuse of EINs on Form 1120, U.S. Corporation Income Tax Return filings • Conducted a W-2 Verification Code (VC) pilot for filing season 2016 with four payroll service providers, which tested the capability
of a VC to confirm the integrity of Form W-2 data • Developed a revised risk assessment questionnaire that better reflected IRS business processes and more accurately assessed the
risk of improper payments for the IRS refundable credits
Actions Planned or Underway • Administer Public Law 114-113, Protecting Americans from Tax Hikes (PATH), by incorporating paid preparer returns claiming the
American Opportunity Tax Credit, Child Tax Credit, and Additional Child Tax Credit into a combined Refundable Credits Return Preparer program to reduce improper payments and erroneous claims filed by preparers who fail to exercise due diligence
• Continue implementing improvements to BMF identity theft filters for Form 1120, U.S. Corporation Income Tax Return and Form 1041, U.S. Income Tax Return for Estates and Trusts
• Monitor known bad EINs and addresses and cross-reference Social Security Numbers to identify and neutralize the misuse of EINs • Increase the scope of the W-2 VC pilot in filing season 2017 by increasing the number of W-2s in the pilot to about 50 million forms
and types of W-2 issuers to include additional payroll service providers and a large federal organization
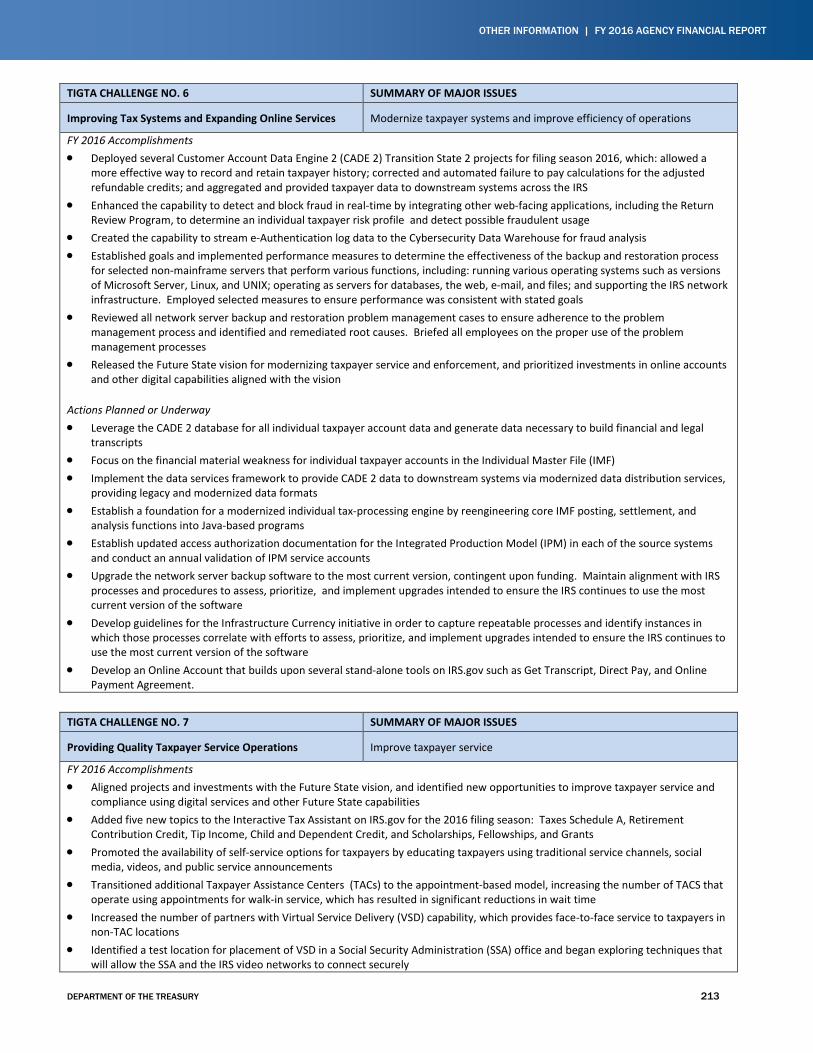
OTHER INFORMATION | FY 2016 AGENCY FINANCIAL REPORT
DEPARTMENT OF THE TREASURY 213
TIGTA CHALLENGE NO. 6 SUMMARY OF MAJOR ISSUES
Improving Tax Systems and Expanding Online Services Modernize taxpayer systems and improve efficiency of operations
FY 2016 Accomplishments • Deployed several Customer Account Data Engine 2 (CADE 2) Transition State 2 projects for filing season 2016, which: allowed a
more effective way to record and retain taxpayer history; corrected and automated failure to pay calculations for the adjusted refundable credits; and aggregated and provided taxpayer data to downstream systems across the IRS
• Enhanced the capability to detect and block fraud in real-time by integrating other web-facing applications, including the Return Review Program, to determine an individual taxpayer risk profile and detect possible fraudulent usage
• Created the capability to stream e-Authentication log data to the Cybersecurity Data Warehouse for fraud analysis • Established goals and implemented performance measures to determine the effectiveness of the backup and restoration process
for selected non-mainframe servers that perform various functions, including: running various operating systems such as versions of Microsoft Server, Linux, and UNIX; operating as servers for databases, the web, e-mail, and files; and supporting the IRS network infrastructure. Employed selected measures to ensure performance was consistent with stated goals
• Reviewed all network server backup and restoration problem management cases to ensure adherence to the problem management process and identified and remediated root causes. Briefed all employees on the proper use of the problem management processes
• Released the Future State vision for modernizing taxpayer service and enforcement, and prioritized investments in online accounts and other digital capabilities aligned with the vision
Actions Planned or Underway • Leverage the CADE 2 database for all individual taxpayer account data and generate data necessary to build financial and legal
transcripts • Focus on the financial material weakness for individual taxpayer accounts in the Individual Master File (IMF) • Implement the data services framework to provide CADE 2 data to downstream systems via modernized data distribution services,
providing legacy and modernized data formats • Establish a foundation for a modernized individual tax-processing engine by reengineering core IMF posting, settlement, and
analysis functions into Java-based programs • Establish updated access authorization documentation for the Integrated Production Model (IPM) in each of the source systems
and conduct an annual validation of IPM service accounts • Upgrade the network server backup software to the most current version, contingent upon funding. Maintain alignment with IRS
processes and procedures to assess, prioritize, and implement upgrades intended to ensure the IRS continues to use the most current version of the software
• Develop guidelines for the Infrastructure Currency initiative in order to capture repeatable processes and identify instances in which those processes correlate with efforts to assess, prioritize, and implement upgrades intended to ensure the IRS continues to use the most current version of the software
• Develop an Online Account that builds upon several stand-alone tools on IRS.gov such as Get Transcript, Direct Pay, and Online Payment Agreement.
TIGTA CHALLENGE NO. 7 SUMMARY OF MAJOR ISSUES
Providing Quality Taxpayer Service Operations Improve taxpayer service
FY 2016 Accomplishments • Aligned projects and investments with the Future State vision, and identified new opportunities to improve taxpayer service and
compliance using digital services and other Future State capabilities • Added five new topics to the Interactive Tax Assistant on IRS.gov for the 2016 filing season: Taxes Schedule A, Retirement
Contribution Credit, Tip Income, Child and Dependent Credit, and Scholarships, Fellowships, and Grants • Promoted the availability of self-service options for taxpayers by educating taxpayers using traditional service channels, social
media, videos, and public service announcements • Transitioned additional Taxpayer Assistance Centers (TACs) to the appointment-based model, increasing the number of TACS that
operate using appointments for walk-in service, which has resulted in significant reductions in wait time • Increased the number of partners with Virtual Service Delivery (VSD) capability, which provides face-to-face service to taxpayers in
non-TAC locations • Identified a test location for placement of VSD in a Social Security Administration (SSA) office and began exploring techniques that
will allow the SSA and the IRS video networks to connect securely
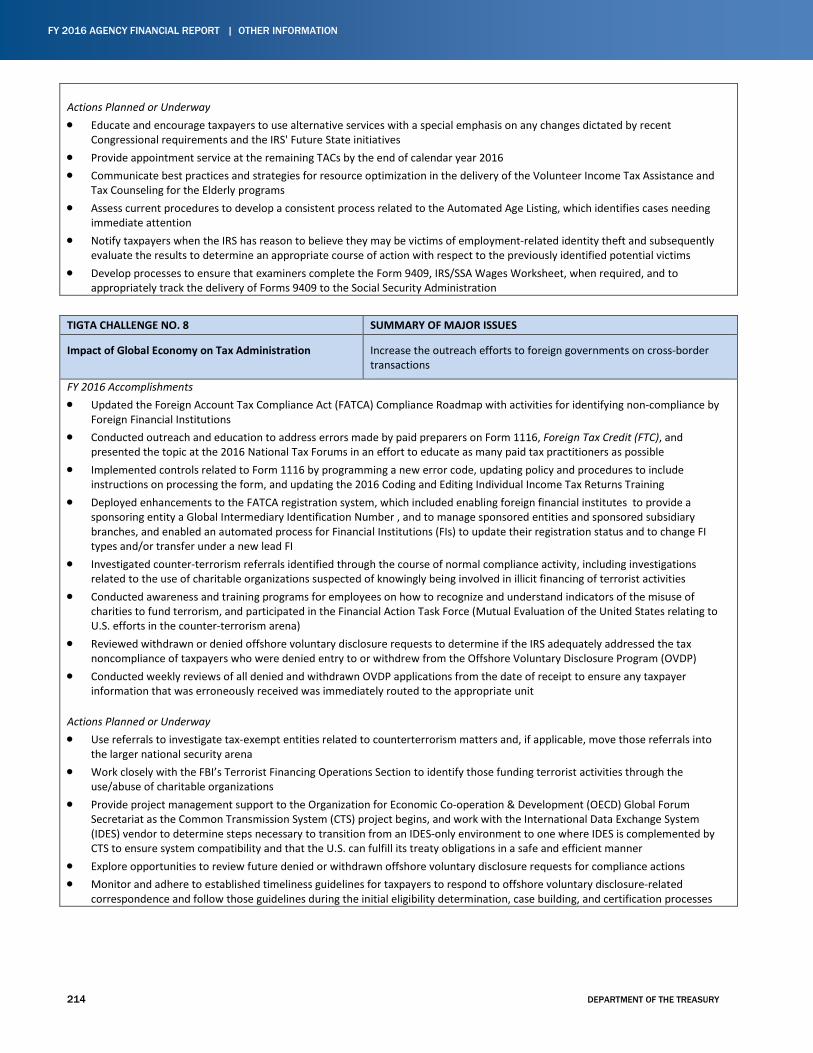
FY 2016 AGENCY FINANCIAL REPORT | OTHER INFORMATION
214 DEPARTMENT OF THE TREASURY
Actions Planned or Underway • Educate and encourage taxpayers to use alternative services with a special emphasis on any changes dictated by recent
Congressional requirements and the IRS' Future State initiatives • Provide appointment service at the remaining TACs by the end of calendar year 2016 • Communicate best practices and strategies for resource optimization in the delivery of the Volunteer Income Tax Assistance and
Tax Counseling for the Elderly programs • Assess current procedures to develop a consistent process related to the Automated Age Listing, which identifies cases needing
immediate attention • Notify taxpayers when the IRS has reason to believe they may be victims of employment-related identity theft and subsequently
evaluate the results to determine an appropriate course of action with respect to the previously identified potential victims • Develop processes to ensure that examiners complete the Form 9409, IRS/SSA Wages Worksheet, when required, and to
appropriately track the delivery of Forms 9409 to the Social Security Administration
TIGTA CHALLENGE NO. 8 SUMMARY OF MAJOR ISSUES
Impact of Global Economy on Tax Administration Increase the outreach efforts to foreign governments on cross-border transactions
FY 2016 Accomplishments • Updated the Foreign Account Tax Compliance Act (FATCA) Compliance Roadmap with activities for identifying non-compliance by
Foreign Financial Institutions • Conducted outreach and education to address errors made by paid preparers on Form 1116, Foreign Tax Credit (FTC), and
presented the topic at the 2016 National Tax Forums in an effort to educate as many paid tax practitioners as possible • Implemented controls related to Form 1116 by programming a new error code, updating policy and procedures to include
instructions on processing the form, and updating the 2016 Coding and Editing Individual Income Tax Returns Training • Deployed enhancements to the FATCA registration system, which included enabling foreign financial institutes to provide a
sponsoring entity a Global Intermediary Identification Number , and to manage sponsored entities and sponsored subsidiary branches, and enabled an automated process for Financial Institutions (FIs) to update their registration status and to change FI types and/or transfer under a new lead FI
• Investigated counter-terrorism referrals identified through the course of normal compliance activity, including investigations related to the use of charitable organizations suspected of knowingly being involved in illicit financing of terrorist activities
• Conducted awareness and training programs for employees on how to recognize and understand indicators of the misuse of charities to fund terrorism, and participated in the Financial Action Task Force (Mutual Evaluation of the United States relating to U.S. efforts in the counter-terrorism arena)
• Reviewed withdrawn or denied offshore voluntary disclosure requests to determine if the IRS adequately addressed the tax noncompliance of taxpayers who were denied entry to or withdrew from the Offshore Voluntary Disclosure Program (OVDP)
• Conducted weekly reviews of all denied and withdrawn OVDP applications from the date of receipt to ensure any taxpayer information that was erroneously received was immediately routed to the appropriate unit
Actions Planned or Underway • Use referrals to investigate tax-exempt entities related to counterterrorism matters and, if applicable, move those referrals into
the larger national security arena • Work closely with the FBI’s Terrorist Financing Operations Section to identify those funding terrorist activities through the
use/abuse of charitable organizations • Provide project management support to the Organization for Economic Co-operation & Development (OECD) Global Forum
Secretariat as the Common Transmission System (CTS) project begins, and work with the International Data Exchange System (IDES) vendor to determine steps necessary to transition from an IDES-only environment to one where IDES is complemented by CTS to ensure system compatibility and that the U.S. can fulfill its treaty obligations in a safe and efficient manner
• Explore opportunities to review future denied or withdrawn offshore voluntary disclosure requests for compliance actions • Monitor and adhere to established timeliness guidelines for taxpayers to respond to offshore voluntary disclosure-related
correspondence and follow those guidelines during the initial eligibility determination, case building, and certification processes
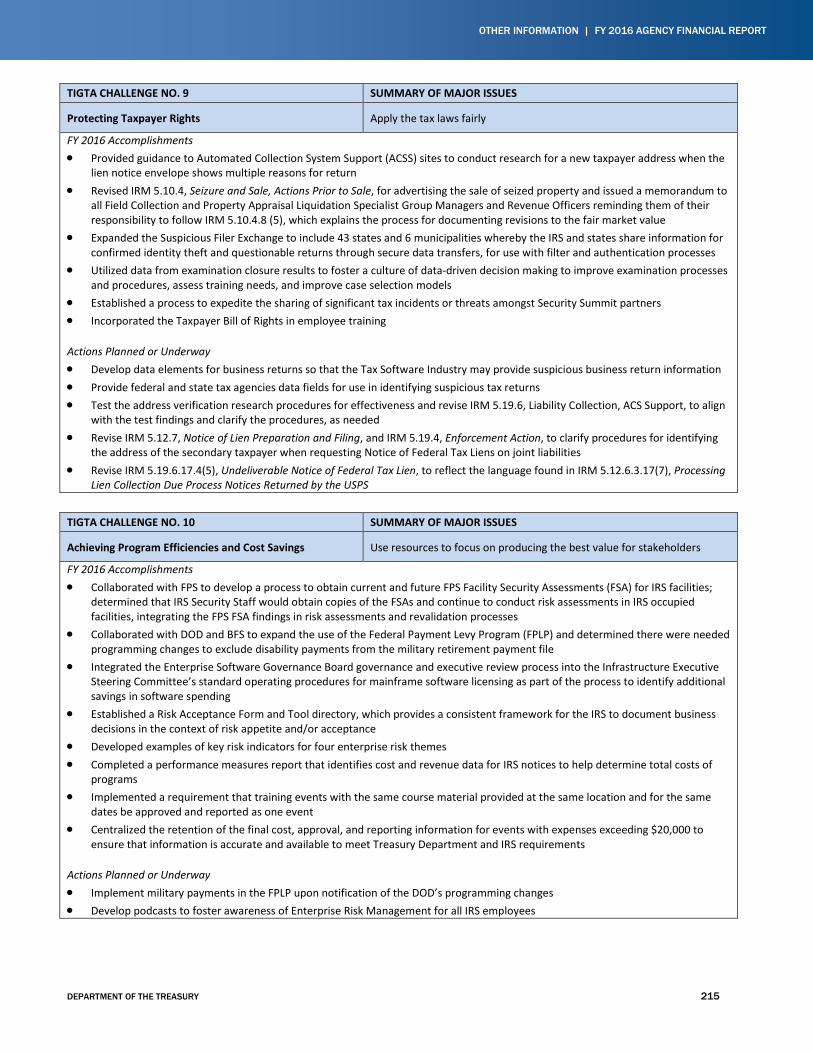
OTHER INFORMATION | FY 2016 AGENCY FINANCIAL REPORT
DEPARTMENT OF THE TREASURY 215
TIGTA CHALLENGE NO. 9 SUMMARY OF MAJOR ISSUES
Protecting Taxpayer Rights Apply the tax laws fairly
FY 2016 Accomplishments • Provided guidance to Automated Collection System Support (ACSS) sites to conduct research for a new taxpayer address when the
lien notice envelope shows multiple reasons for return • Revised IRM 5.10.4, Seizure and Sale, Actions Prior to Sale, for advertising the sale of seized property and issued a memorandum to
all Field Collection and Property Appraisal Liquidation Specialist Group Managers and Revenue Officers reminding them of their responsibility to follow IRM 5.10.4.8 (5), which explains the process for documenting revisions to the fair market value
• Expanded the Suspicious Filer Exchange to include 43 states and 6 municipalities whereby the IRS and states share information for confirmed identity theft and questionable returns through secure data transfers, for use with filter and authentication processes
• Utilized data from examination closure results to foster a culture of data-driven decision making to improve examination processes and procedures, assess training needs, and improve case selection models
• Established a process to expedite the sharing of significant tax incidents or threats amongst Security Summit partners • Incorporated the Taxpayer Bill of Rights in employee training
Actions Planned or Underway • Develop data elements for business returns so that the Tax Software Industry may provide suspicious business return information • Provide federal and state tax agencies data fields for use in identifying suspicious tax returns • Test the address verification research procedures for effectiveness and revise IRM 5.19.6, Liability Collection, ACS Support, to align
with the test findings and clarify the procedures, as needed • Revise IRM 5.12.7, Notice of Lien Preparation and Filing, and IRM 5.19.4, Enforcement Action, to clarify procedures for identifying
the address of the secondary taxpayer when requesting Notice of Federal Tax Liens on joint liabilities • Revise IRM 5.19.6.17.4(5), Undeliverable Notice of Federal Tax Lien, to reflect the language found in IRM 5.12.6.3.17(7), Processing
Lien Collection Due Process Notices Returned by the USPS
TIGTA CHALLENGE NO. 10 SUMMARY OF MAJOR ISSUES
Achieving Program Efficiencies and Cost Savings Use resources to focus on producing the best value for stakeholders
FY 2016 Accomplishments • Collaborated with FPS to develop a process to obtain current and future FPS Facility Security Assessments (FSA) for IRS facilities;
determined that IRS Security Staff would obtain copies of the FSAs and continue to conduct risk assessments in IRS occupied facilities, integrating the FPS FSA findings in risk assessments and revalidation processes
• Collaborated with DOD and BFS to expand the use of the Federal Payment Levy Program (FPLP) and determined there were needed programming changes to exclude disability payments from the military retirement payment file
• Integrated the Enterprise Software Governance Board governance and executive review process into the Infrastructure Executive Steering Committee’s standard operating procedures for mainframe software licensing as part of the process to identify additional savings in software spending
• Established a Risk Acceptance Form and Tool directory, which provides a consistent framework for the IRS to document business decisions in the context of risk appetite and/or acceptance
• Developed examples of key risk indicators for four enterprise risk themes • Completed a performance measures report that identifies cost and revenue data for IRS notices to help determine total costs of
programs • Implemented a requirement that training events with the same course material provided at the same location and for the same
dates be approved and reported as one event • Centralized the retention of the final cost, approval, and reporting information for events with expenses exceeding $20,000 to
ensure that information is accurate and available to meet Treasury Department and IRS requirements
Actions Planned or Underway • Implement military payments in the FPLP upon notification of the DOD’s programming changes • Develop podcasts to foster awareness of Enterprise Risk Management for all IRS employees
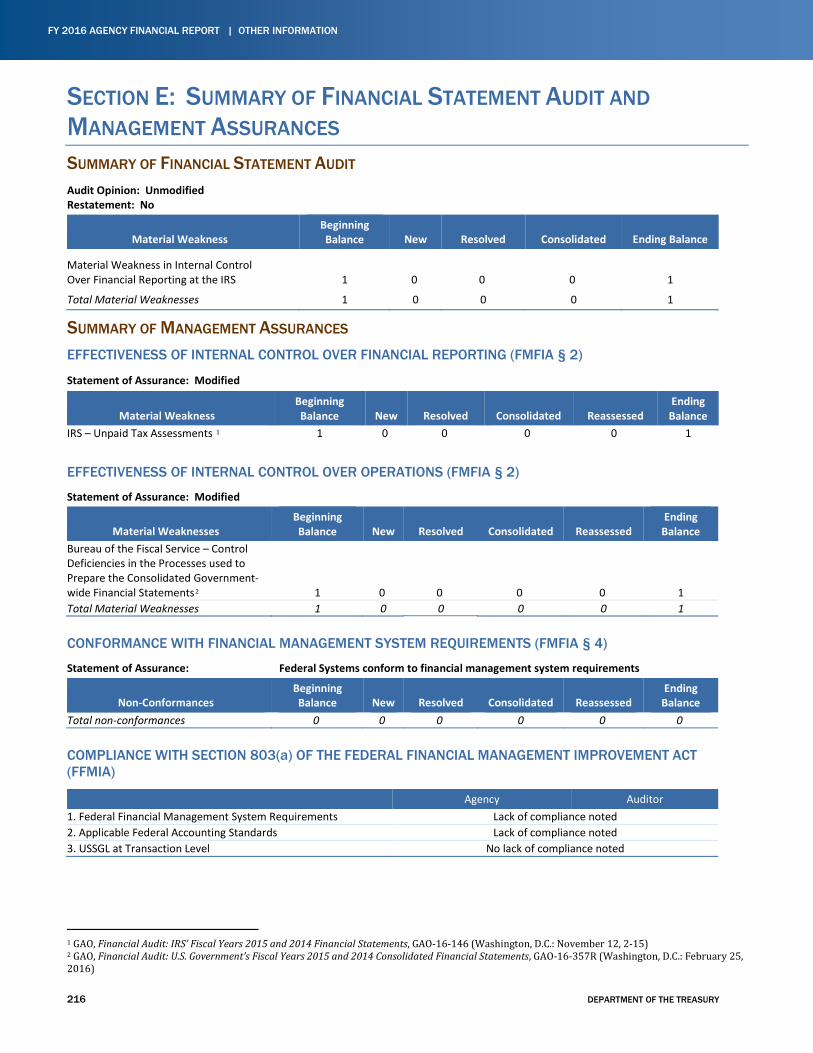
FY 2016 AGENCY FINANCIAL REPORT | OTHER INFORMATION
216 DEPARTMENT OF THE TREASURY
SECTION E: SUMMARY OF FINANCIAL STATEMENT AUDIT AND MANAGEMENT ASSURANCES SUMMARY OF FINANCIAL STATEMENT AUDIT Audit Opinion: Unmodified Restatement: No
Material Weakness Beginning Balance New Resolved Consolidated Ending Balance
Material Weakness in Internal Control Over Financial Reporting at the IRS 1 0 0 0 1
Total Material Weaknesses 1 0 0 0 1
SUMMARY OF MANAGEMENT ASSURANCES
EFFECTIVENESS OF INTERNAL CONTROL OVER FINANCIAL REPORTING (FMFIA § 2)
Statement of Assurance: Modified
Material Weakness Beginning Balance New Resolved Consolidated Reassessed
Ending Balance
IRS – Unpaid Tax Assessments 1 1 0 0 0 0 1
EFFECTIVENESS OF INTERNAL CONTROL OVER OPERATIONS (FMFIA § 2)
Statement of Assurance: Modified
Material Weaknesses Beginning Balance New Resolved Consolidated Reassessed
Ending Balance
Bureau of the Fiscal Service – Control Deficiencies in the Processes used to Prepare the Consolidated Government-wide Financial Statements2 1 0 0 0 0 1 Total Material Weaknesses 1 0 0 0 0 1
CONFORMANCE WITH FINANCIAL MANAGEMENT SYSTEM REQUIREMENTS (FMFIA § 4)
Statement of Assurance: Federal Systems conform to financial management system requirements
Non-Conformances Beginning Balance New Resolved Consolidated Reassessed
Ending Balance
Total non-conformances 0 0 0 0 0 0
COMPLIANCE WITH SECTION 803(a) OF THE FEDERAL FINANCIAL MANAGEMENT IMPROVEMENT ACT (FFMIA)
Agency Auditor 1. Federal Financial Management System Requirements Lack of compliance noted 2. Applicable Federal Accounting Standards Lack of compliance noted 3. USSGL at Transaction Level No lack of compliance noted
1 GAO, Financial Audit: IRS’ Fiscal Years 2015 and 2014 Financial Statements, GAO-16-146 (Washington, D.C.: November 12, 2-15) 2 GAO, Financial Audit: U.S. Government’s Fiscal Years 2015 and 2014 Consolidated Financial Statements, GAO-16-357R (Washington, D.C.: February 25, 2016)
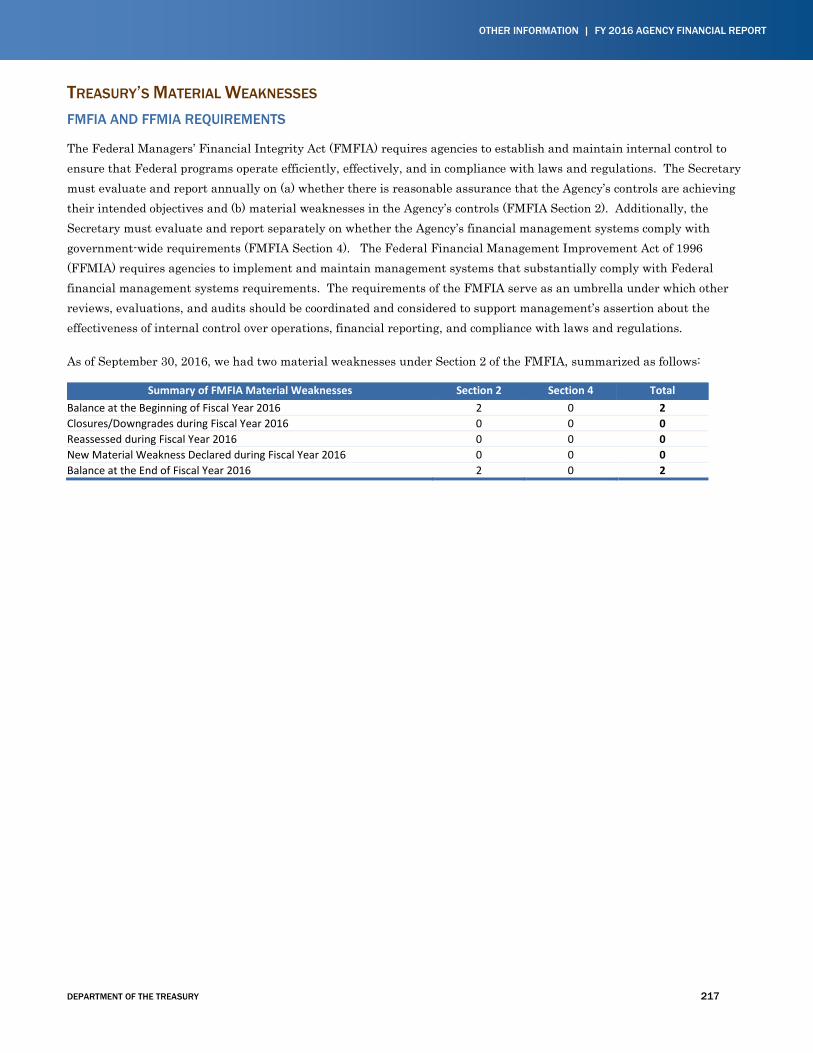
OTHER INFORMATION | FY 2016 AGENCY FINANCIAL REPORT
DEPARTMENT OF THE TREASURY 217
TREASURY’S MATERIAL WEAKNESSES FMFIA AND FFMIA REQUIREMENTS
The Federal Managers’ Financial Integrity Act (FMFIA) requires agencies to establish and maintain internal control to ensure that Federal programs operate efficiently, effectively, and in compliance with laws and regulations. The Secretary must evaluate and report annually on (a) whether there is reasonable assurance that the Agency’s controls are achieving their intended objectives and (b) material weaknesses in the Agency’s controls (FMFIA Section 2). Additionally, the Secretary must evaluate and report separately on whether the Agency’s financial management systems comply with government-wide requirements (FMFIA Section 4). The Federal Financial Management Improvement Act of 1996 (FFMIA) requires agencies to implement and maintain management systems that substantially comply with Federal financial management systems requirements. The requirements of the FMFIA serve as an umbrella under which other reviews, evaluations, and audits should be coordinated and considered to support management’s assertion about the effectiveness of internal control over operations, financial reporting, and compliance with laws and regulations.
As of September 30, 2016, we had two material weaknesses under Section 2 of the FMFIA, summarized as follows:
Summary of FMFIA Material Weaknesses Section 2 Section 4 Total Balance at the Beginning of Fiscal Year 2016 2 0 2 Closures/Downgrades during Fiscal Year 2016 0 0 0 Reassessed during Fiscal Year 2016 0 0 0 New Material Weakness Declared during Fiscal Year 2016 0 0 0 Balance at the End of Fiscal Year 2016 2 0 2
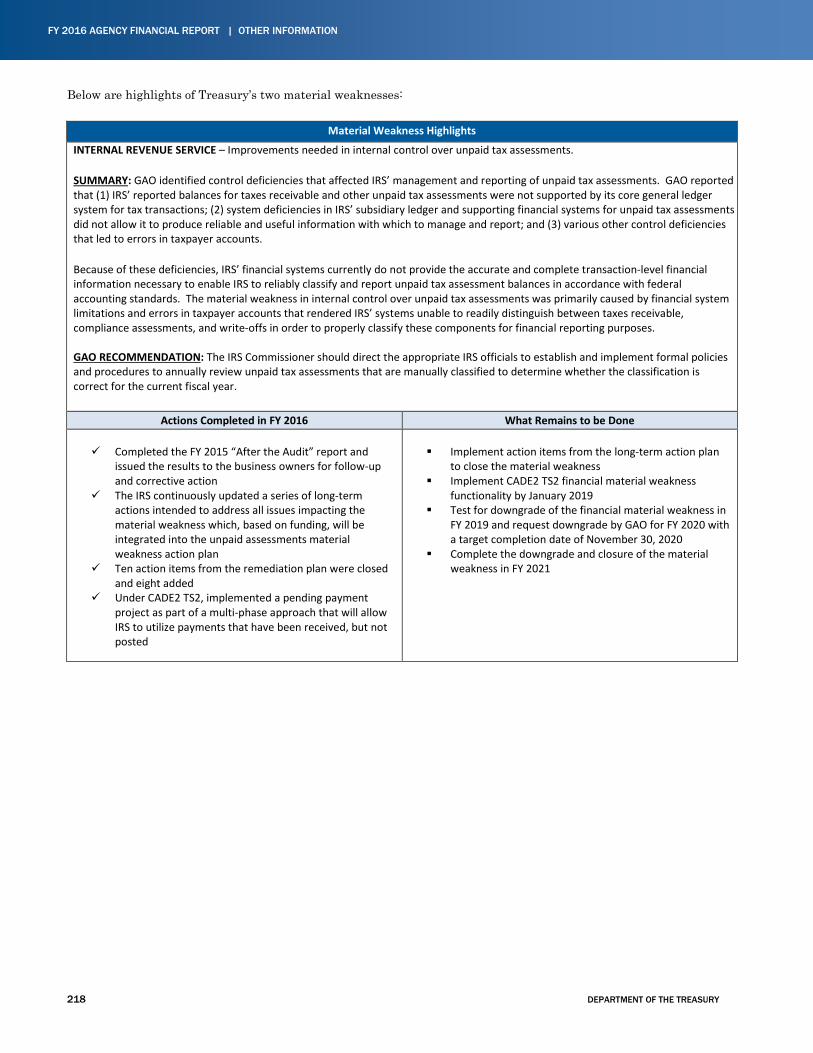
FY 2016 AGENCY FINANCIAL REPORT | OTHER INFORMATION
218 DEPARTMENT OF THE TREASURY
Below are highlights of Treasury’s two material weaknesses:
Material Weakness Highlights
INTERNAL REVENUE SERVICE – Improvements needed in internal control over unpaid tax assessments. SUMMARY: GAO identified control deficiencies that affected IRS’ management and reporting of unpaid tax assessments. GAO reported
that (1) IRS’ reported balances for taxes receivable and other unpaid tax assessments were not supported by its core general ledger system for tax transactions; (2) system deficiencies in IRS’ subsidiary ledger and supporting financial systems for unpaid tax assessments did not allow it to produce reliable and useful information with which to manage and report; and (3) various other control deficiencies that led to errors in taxpayer accounts.
Because of these deficiencies, IRS’ financial systems currently do not provide the accurate and complete transaction-level financial
information necessary to enable IRS to reliably classify and report unpaid tax assessment balances in accordance with federal accounting standards. The material weakness in internal control over unpaid tax assessments was primarily caused by financial system limitations and errors in taxpayer accounts that rendered IRS’ systems unable to readily distinguish between taxes receivable, compliance assessments, and write-offs in order to properly classify these components for financial reporting purposes. GAO RECOMMENDATION: The IRS Commissioner should direct the appropriate IRS officials to establish and implement formal policies and procedures to annually review unpaid tax assessments that are manually classified to determine whether the classification is correct for the current fiscal year.
Actions Completed in FY 2016 What Remains to be Done
Completed the FY 2015 “After the Audit” report and issued the results to the business owners for follow-up and corrective action
The IRS continuously updated a series of long-term actions intended to address all issues impacting the material weakness which, based on funding, will be integrated into the unpaid assessments material weakness action plan
Ten action items from the remediation plan were closed and eight added
Under CADE2 TS2, implemented a pending payment project as part of a multi-phase approach that will allow IRS to utilize payments that have been received, but not posted
Implement action items from the long-term action plan
to close the material weakness Implement CADE2 TS2 financial material weakness
functionality by January 2019 Test for downgrade of the financial material weakness in
FY 2019 and request downgrade by GAO for FY 2020 with a target completion date of November 30, 2020
Complete the downgrade and closure of the material weakness in FY 2021
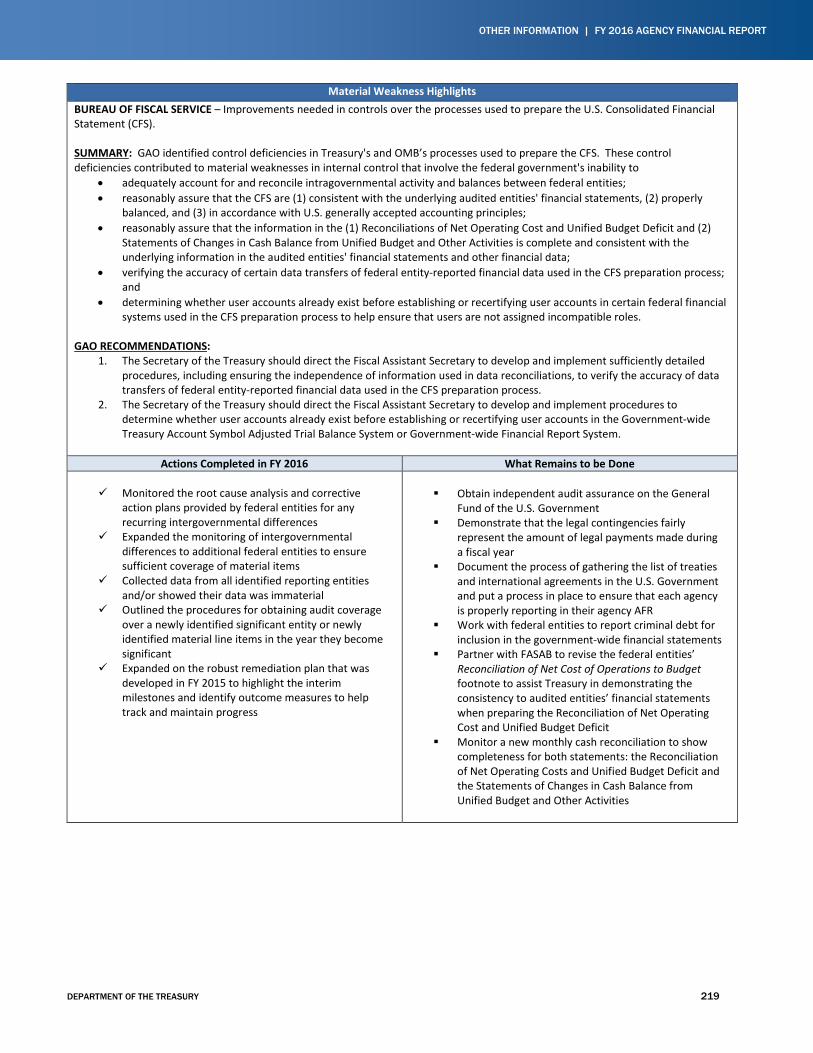
OTHER INFORMATION | FY 2016 AGENCY FINANCIAL REPORT
DEPARTMENT OF THE TREASURY 219
Material Weakness Highlights
BUREAU OF FISCAL SERVICE – Improvements needed in controls over the processes used to prepare the U.S. Consolidated Financial Statement (CFS). SUMMARY: GAO identified control deficiencies in Treasury's and OMB’s processes used to prepare the CFS. These control deficiencies contributed to material weaknesses in internal control that involve the federal government's inability to
• adequately account for and reconcile intragovernmental activity and balances between federal entities; • reasonably assure that the CFS are (1) consistent with the underlying audited entities' financial statements, (2) properly
balanced, and (3) in accordance with U.S. generally accepted accounting principles; • reasonably assure that the information in the (1) Reconciliations of Net Operating Cost and Unified Budget Deficit and (2)
Statements of Changes in Cash Balance from Unified Budget and Other Activities is complete and consistent with the underlying information in the audited entities' financial statements and other financial data;
• verifying the accuracy of certain data transfers of federal entity-reported financial data used in the CFS preparation process; and
• determining whether user accounts already exist before establishing or recertifying user accounts in certain federal financial systems used in the CFS preparation process to help ensure that users are not assigned incompatible roles.
GAO RECOMMENDATIONS: 1. The Secretary of the Treasury should direct the Fiscal Assistant Secretary to develop and implement sufficiently detailed
procedures, including ensuring the independence of information used in data reconciliations, to verify the accuracy of data transfers of federal entity-reported financial data used in the CFS preparation process.
2. The Secretary of the Treasury should direct the Fiscal Assistant Secretary to develop and implement procedures to determine whether user accounts already exist before establishing or recertifying user accounts in the Government-wide Treasury Account Symbol Adjusted Trial Balance System or Government-wide Financial Report System.
Actions Completed in FY 2016 What Remains to be Done
Monitored the root cause analysis and corrective action plans provided by federal entities for any recurring intergovernmental differences
Expanded the monitoring of intergovernmental differences to additional federal entities to ensure sufficient coverage of material items
Collected data from all identified reporting entities and/or showed their data was immaterial
Outlined the procedures for obtaining audit coverage over a newly identified significant entity or newly identified material line items in the year they become significant
Expanded on the robust remediation plan that was developed in FY 2015 to highlight the interim milestones and identify outcome measures to help track and maintain progress
Obtain independent audit assurance on the General
Fund of the U.S. Government Demonstrate that the legal contingencies fairly
represent the amount of legal payments made during a fiscal year
Document the process of gathering the list of treaties and international agreements in the U.S. Government and put a process in place to ensure that each agency is properly reporting in their agency AFR
Work with federal entities to report criminal debt for inclusion in the government-wide financial statements
Partner with FASAB to revise the federal entities’ Reconciliation of Net Cost of Operations to Budget footnote to assist Treasury in demonstrating the consistency to audited entities’ financial statements when preparing the Reconciliation of Net Operating Cost and Unified Budget Deficit
Monitor a new monthly cash reconciliation to show completeness for both statements: the Reconciliation of Net Operating Costs and Unified Budget Deficit and the Statements of Changes in Cash Balance from Unified Budget and Other Activities
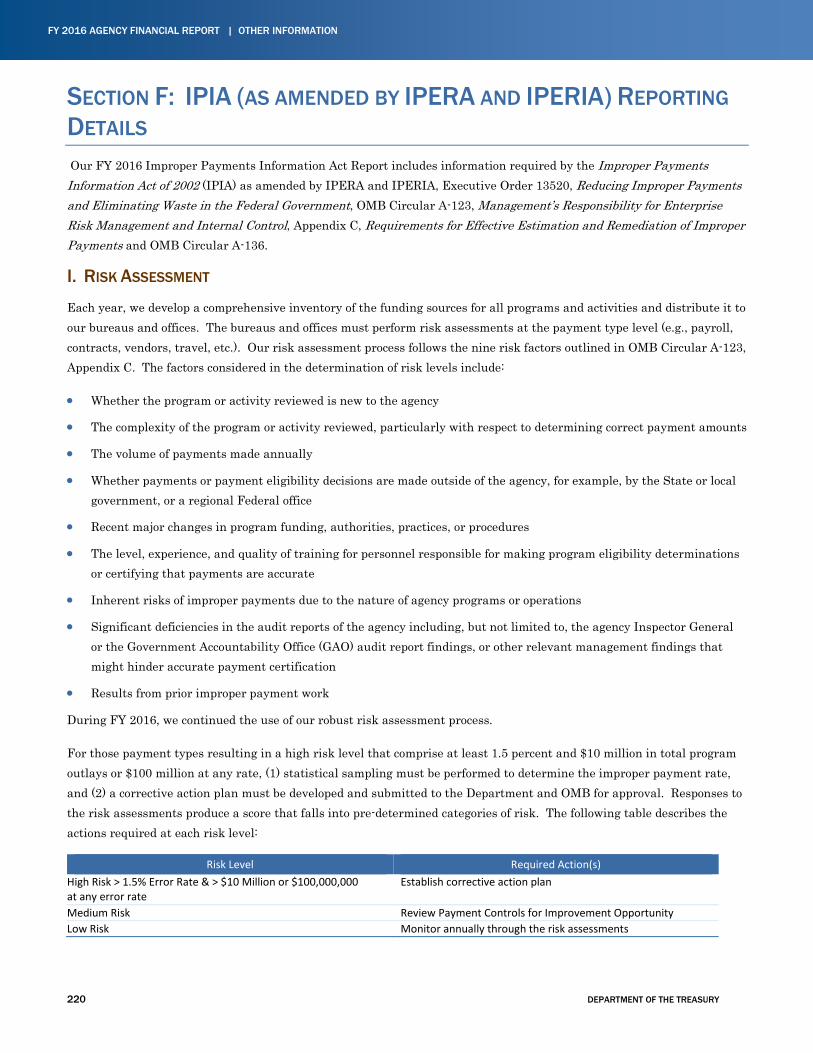
FY 2016 AGENCY FINANCIAL REPORT | OTHER INFORMATION
220 DEPARTMENT OF THE TREASURY
SECTION F: IPIA (AS AMENDED BY IPERA AND IPERIA) REPORTING DETAILS Our FY 2016 Improper Payments Information Act Report includes information required by the Improper Payments Information Act of 2002 (IPIA) as amended by IPERA and IPERIA, Executive Order 13520, Reducing Improper Payments and Eliminating Waste in the Federal Government, OMB Circular A-123, Management’s Responsibility for Enterprise Risk Management and Internal Control, Appendix C, Requirements for Effective Estimation and Remediation of Improper Payments and OMB Circular A-136.
I. RISK ASSESSMENT
Each year, we develop a comprehensive inventory of the funding sources for all programs and activities and distribute it to our bureaus and offices. The bureaus and offices must perform risk assessments at the payment type level (e.g., payroll, contracts, vendors, travel, etc.). Our risk assessment process follows the nine risk factors outlined in OMB Circular A-123, Appendix C. The factors considered in the determination of risk levels include:
• Whether the program or activity reviewed is new to the agency
• The complexity of the program or activity reviewed, particularly with respect to determining correct payment amounts
• The volume of payments made annually
• Whether payments or payment eligibility decisions are made outside of the agency, for example, by the State or local government, or a regional Federal office
• Recent major changes in program funding, authorities, practices, or procedures
• The level, experience, and quality of training for personnel responsible for making program eligibility determinations or certifying that payments are accurate
• Inherent risks of improper payments due to the nature of agency programs or operations
• Significant deficiencies in the audit reports of the agency including, but not limited to, the agency Inspector General or the Government Accountability Office (GAO) audit report findings, or other relevant management findings that might hinder accurate payment certification
• Results from prior improper payment work
During FY 2016, we continued the use of our robust risk assessment process.
For those payment types resulting in a high risk level that comprise at least 1.5 percent and $10 million in total program outlays or $100 million at any rate, (1) statistical sampling must be performed to determine the improper payment rate, and (2) a corrective action plan must be developed and submitted to the Department and OMB for approval. Responses to the risk assessments produce a score that falls into pre-determined categories of risk. The following table describes the actions required at each risk level:
Risk Level Required Action(s) High Risk > 1.5% Error Rate & > $10 Million or $100,000,000 at any error rate
Establish corrective action plan
Medium Risk Review Payment Controls for Improvement Opportunity Low Risk Monitor annually through the risk assessments
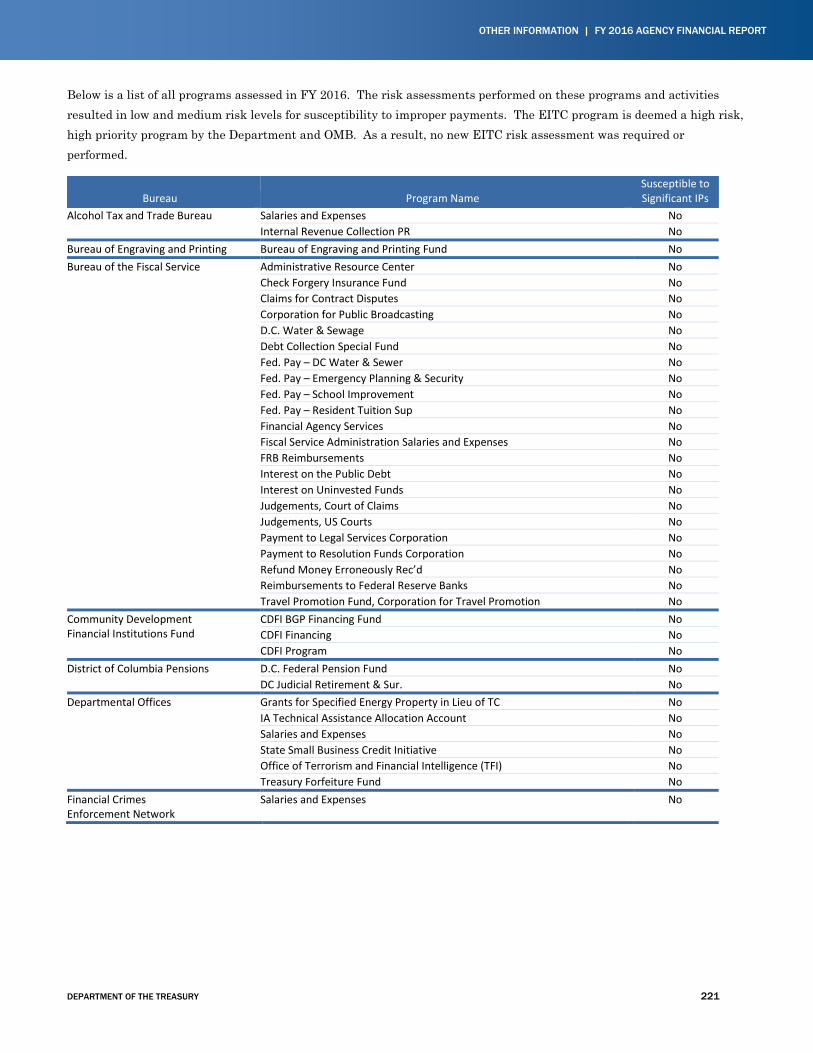
OTHER INFORMATION | FY 2016 AGENCY FINANCIAL REPORT
DEPARTMENT OF THE TREASURY 221
Below is a list of all programs assessed in FY 2016. The risk assessments performed on these programs and activities resulted in low and medium risk levels for susceptibility to improper payments. The EITC program is deemed a high risk, high priority program by the Department and OMB. As a result, no new EITC risk assessment was required or performed.
Bureau Program Name Susceptible to Significant IPs
Alcohol Tax and Trade Bureau Salaries and Expenses No Internal Revenue Collection PR No
Bureau of Engraving and Printing Bureau of Engraving and Printing Fund No Bureau of the Fiscal Service Administrative Resource Center No
Check Forgery Insurance Fund No Claims for Contract Disputes No Corporation for Public Broadcasting No D.C. Water & Sewage No Debt Collection Special Fund No Fed. Pay – DC Water & Sewer No Fed. Pay – Emergency Planning & Security No Fed. Pay – School Improvement No Fed. Pay – Resident Tuition Sup No Financial Agency Services No Fiscal Service Administration Salaries and Expenses No FRB Reimbursements No Interest on the Public Debt No Interest on Uninvested Funds No Judgements, Court of Claims No Judgements, US Courts No Payment to Legal Services Corporation No Payment to Resolution Funds Corporation No Refund Money Erroneously Rec’d No Reimbursements to Federal Reserve Banks No Travel Promotion Fund, Corporation for Travel Promotion No
Community Development Financial Institutions Fund
CDFI BGP Financing Fund No CDFI Financing No CDFI Program No
District of Columbia Pensions D.C. Federal Pension Fund No DC Judicial Retirement & Sur. No
Departmental Offices Grants for Specified Energy Property in Lieu of TC No IA Technical Assistance Allocation Account No Salaries and Expenses No State Small Business Credit Initiative No Office of Terrorism and Financial Intelligence (TFI) No Treasury Forfeiture Fund No
Financial Crimes Enforcement Network
Salaries and Expenses No
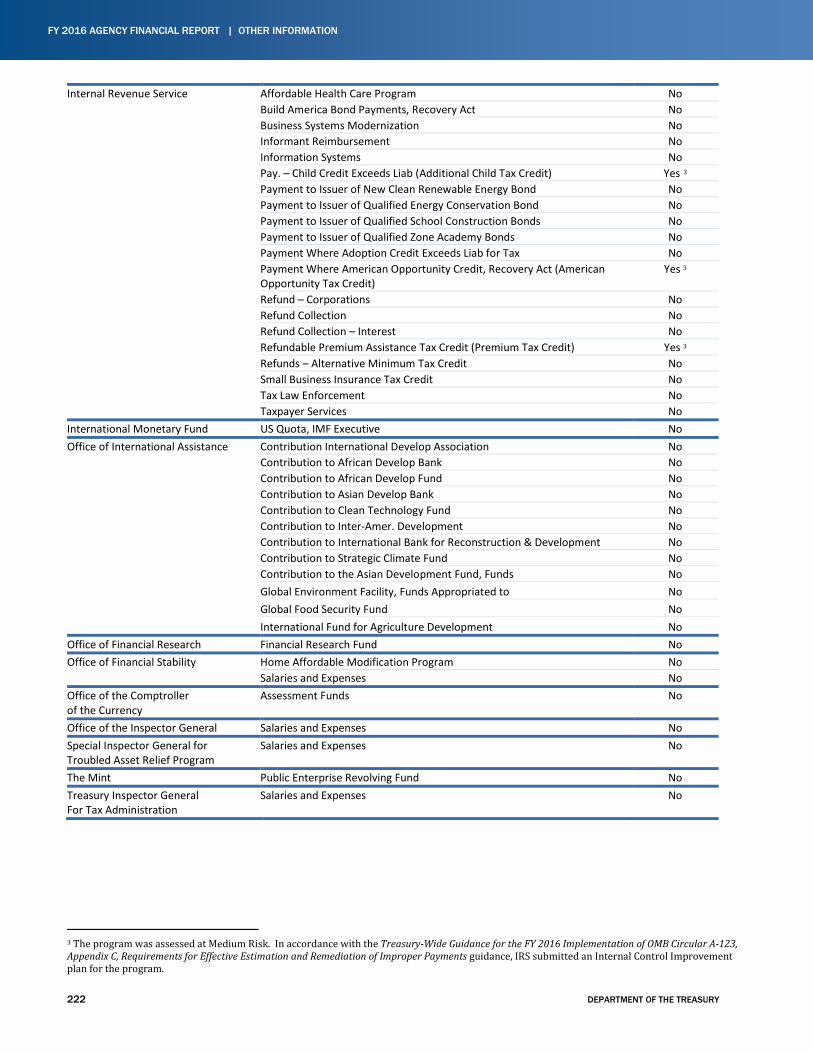
FY 2016 AGENCY FINANCIAL REPORT | OTHER INFORMATION
222 DEPARTMENT OF THE TREASURY
Internal Revenue Service Affordable Health Care Program No Build America Bond Payments, Recovery Act No Business Systems Modernization No Informant Reimbursement No Information Systems No Pay. – Child Credit Exceeds Liab (Additional Child Tax Credit) Yes 3 Payment to Issuer of New Clean Renewable Energy Bond No Payment to Issuer of Qualified Energy Conservation Bond No Payment to Issuer of Qualified School Construction Bonds No Payment to Issuer of Qualified Zone Academy Bonds No Payment Where Adoption Credit Exceeds Liab for Tax No Payment Where American Opportunity Credit, Recovery Act (American Opportunity Tax Credit)
Yes 3
Refund – Corporations No Refund Collection No Refund Collection – Interest No Refundable Premium Assistance Tax Credit (Premium Tax Credit) Yes 3 Refunds – Alternative Minimum Tax Credit No Small Business Insurance Tax Credit No Tax Law Enforcement No Taxpayer Services No
International Monetary Fund US Quota, IMF Executive No Office of International Assistance Contribution International Develop Association No
Contribution to African Develop Bank No Contribution to African Develop Fund No Contribution to Asian Develop Bank No Contribution to Clean Technology Fund No Contribution to Inter-Amer. Development No Contribution to International Bank for Reconstruction & Development No Contribution to Strategic Climate Fund No Contribution to the Asian Development Fund, Funds No Global Environment Facility, Funds Appropriated to No Global Food Security Fund No International Fund for Agriculture Development No
Office of Financial Research Financial Research Fund No Office of Financial Stability Home Affordable Modification Program No
Salaries and Expenses No Office of the Comptroller of the Currency
Assessment Funds No
Office of the Inspector General Salaries and Expenses No Special Inspector General for Troubled Asset Relief Program
Salaries and Expenses No
The Mint Public Enterprise Revolving Fund No Treasury Inspector General For Tax Administration
Salaries and Expenses No
3 The program was assessed at Medium Risk. In accordance with the Treasury-Wide Guidance for the FY 2016 Implementation of OMB Circular A-123, Appendix C, Requirements for Effective Estimation and Remediation of Improper Payments guidance, IRS submitted an Internal Control Improvement plan for the program.
OTHER INFORMATION | FY 2016 AGENCY FINANCIAL REPORT
DEPARTMENT OF THE TREASURY 223
In FY 2016, the IRS evaluated the ACTC and the AOTC as part of the risk assessment process using a qualitative risk assessment. The risk assessment determined the risk of ACTC and AOTC to be medium. Additionally, as noted in Part 1, the IRS also conducted an assessment of the PTC, which also resulted in a determination of a medium risk level. A risk assessment was not conducted for the EITC program, which has been deemed a high priority / high risk program by OMB. Estimating improper payments does not take into consideration all aspects of administering tax provisions in a system that relies heavily on voluntary reporting as well as statutory requirements that the IRS process tax returns and pay any related tax refunds within 45 days of receipt of the tax return or the tax return due date, whichever is later, or accrue and pay interest on the refund amount beyond this 45 day period to the taxpayer.
Reporting tax refunds under the tax gap section of the AFR allows for the appropriate discussion of misreporting errors and resources dedicated to the IRS' compliance strategy. For refund returns claiming multiple credits, the IRS reports noncompliance related to these credits as part of the estimation of tax gap. The tax gap estimates reveal a more accurate picture of taxpayer behavior than other types of reporting, so the IRS reports on the underreporting related to tax and refundable and non-refundable tax credits under tax gap in the Department’s AFR.
In order to maintain accountability for all refundable credit programs, we will continue to perform risk assessments on all IPERA-implicated refundable tax credit programs and will plan to estimate any that exceed the thresholds delineated in IPERA as part of the overall tax gap (e.g. NRP compliance studies and root cause analyses) estimation process, describing this determination in the AFR. In addition, consistent with recent reporting practice, we continue to report these results in the Improper Payments section of the AFR.
Corrective Actions for High-Priority Programs
Under Executive Order (EO) 13520 and its implementing guidance, OMB identifies programs that have more than $750 million in annual estimated improper payments and that contribute substantially to the government-wide improper payment estimate. These programs, known as high-priority programs, are required to perform certain activities, including: selecting Accountable Officials to oversee the agency’s improper payment efforts; posting improper payment information to www.PaymentAccuracy.gov; and developing supplemental measures in addition to the annual error rate measures.
EITC is the only program deemed by OMB as a high-priority program. Accordingly, the IRS has worked to meet the EO’s additional requirements for this high-risk program, and information on the IRS’ efforts may be found on www.PaymentAccuracy.gov. In addition, while root causes of errors in our programs can fluctuate from year to year, the IRS remains focused on reducing the annual error rates for all noncompliant behavior, and is taking many actions to prevent and reduce payment errors. For FY 2016, the Department continued to report on EITC including the Supplemental Measures and will evaluate with OMB reporting for FY 2017 and beyond.
II. SAMPLING AND ESTIMATION
EITC Program
The EITC is a refundable federal tax credit that offsets income taxes owed by low-income workers who qualify and provides a refund if the credit exceeds the amount of taxes owed.
FY 2016 AGENCY FINANCIAL REPORT | OTHER INFORMATION
224 DEPARTMENT OF THE TREASURY
As described below, the IRS engages in a number of activities to encourage voluntary compliance, performs certain automatic checks of all claims, and audits some claims before tax refunds are paid, all of which prevent improper payments. In addition, as with all tax provisions, IRS performs some examinations after refunds are paid, and subsequently recovers some improper payments. The improper payment amounts reported below include improper overclaims plus the absolute value of underpayments, less certain erroneous payments that are prevented or recovered. The error rate is the net improper payment amount divided by the total amount of EITC claimed.
In keeping with the requirements of IPERIA, we update the estimate of improper payments annually. The EITC improper payment rate is estimated using a statistically valid sample of about 2,700 returns audited through the IRS’ NRP. This sample is sufficient to estimate the improper payment rate with plus or minus 2.5 percentage point precision and 90 percent confidence. For TY 2012 (the most recent study completed), the estimated gross amount of improper payments was $17.7 billion and the total amount of EITC claimed was $64.0 billion. The amount of erroneous EITC payments prevented or recovered on tax year 2012 returns was $2.3 billion. This results in a net improper payment amount of $15.4 billion, or 24.0 percent of the total EITC claimed (or between 22.2 percent and 25.9 percent, accounting for sampling error). The current estimated error rate of 24.0 percent is consistent in magnitude with the five-year average error rate of about 24 percent.
Applying this rate estimated from data for TY 2012 to the estimated FY 2016 level of EITC claims ($69.8 billion) yields an estimated amount of improper payments for FY 2016 of $16.8 billion (or between $15.5 and $18.1 billion).
III. IMPROPER PAYMENTS REPORTING
EITC is our only high-risk program that is susceptible to improper payments. Although high-priority programs are generally required to report reduction targets, setting improper payment reduction targets for this program does not create meaningful goals for us. This is due to the complexity of the tax law around EITC, lack of independent data regarding EITC eligibility, and the significant annual turnover within the participating population. The following table provides the improper payment reduction outlook for the EITC:
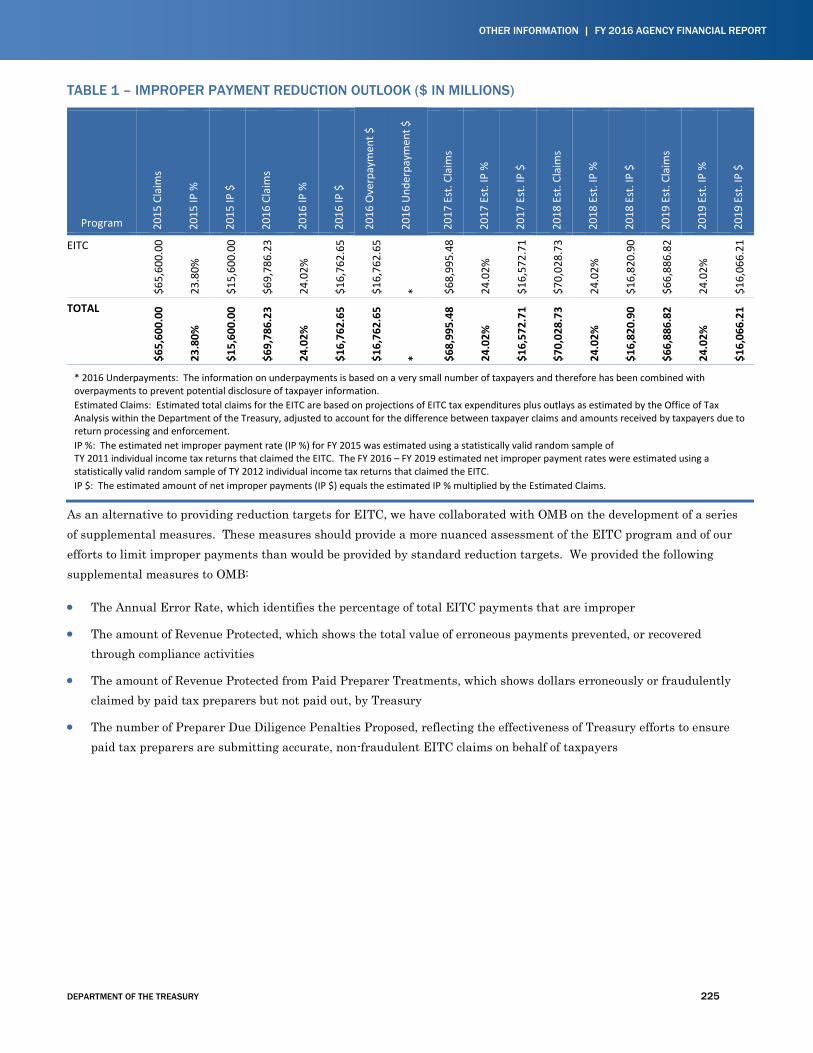
OTHER INFORMATION | FY 2016 AGENCY FINANCIAL REPORT
DEPARTMENT OF THE TREASURY 225
TABLE 1 – IMPROPER PAYMENT REDUCTION OUTLOOK ($ IN MILLIONS)
Program 2015
Cla
ims
2015
IP %
2015
IP $
2016
Cla
ims
2016
IP %
2016
IP $
2016
Ove
rpay
men
t $
2016
Und
erpa
ymen
t $
2017
Est
. Cla
ims
2017
Est
. IP
%
2017
Est
. IP
$
2018
Est
. Cla
ims
2018
Est
. IP
%
2018
Est
. IP
$
2019
Est
. Cla
ims
2019
Est
. IP
%
2019
Est
. IP
$
EITC
$65,
600.
00
23.8
0%
$15,
600.
00
$69,
786.
23
24.0
2%
$16,
762.
65
$16,
762.
65
* $68,
995.
48
24.0
2%
$16,
572.
71
$70,
028.
73
24.0
2%
$16,
820.
90
$66,
886.
82
24.0
2%
$16,
066.
21
TOTAL
$65,
600.
00
23.8
0%
$15,
600.
00
$69,
786.
23
24.0
2%
$16,
762.
65
$16,
762.
65
* $68,
995.
48
24.0
2%
$16,
572.
71
$70,
028.
73
24.0
2%
$16,
820.
90
$66,
886.
82
24.0
2%
$16,
066.
21
* 2016 Underpayments: The information on underpayments is based on a very small number of taxpayers and therefore has been combined with overpayments to prevent potential disclosure of taxpayer information. Estimated Claims: Estimated total claims for the EITC are based on projections of EITC tax expenditures plus outlays as estimated by the Office of Tax Analysis within the Department of the Treasury, adjusted to account for the difference between taxpayer claims and amounts received by taxpayers due to return processing and enforcement. IP %: The estimated net improper payment rate (IP %) for FY 2015 was estimated using a statistically valid random sample of TY 2011 individual income tax returns that claimed the EITC. The FY 2016 – FY 2019 estimated net improper payment rates were estimated using a statistically valid random sample of TY 2012 individual income tax returns that claimed the EITC. IP $: The estimated amount of net improper payments (IP $) equals the estimated IP % multiplied by the Estimated Claims.
As an alternative to providing reduction targets for EITC, we have collaborated with OMB on the development of a series of supplemental measures. These measures should provide a more nuanced assessment of the EITC program and of our efforts to limit improper payments than would be provided by standard reduction targets. We provided the following supplemental measures to OMB:
• The Annual Error Rate, which identifies the percentage of total EITC payments that are improper
• The amount of Revenue Protected, which shows the total value of erroneous payments prevented, or recovered through compliance activities
• The amount of Revenue Protected from Paid Preparer Treatments, which shows dollars erroneously or fraudulently claimed by paid tax preparers but not paid out, by Treasury
• The number of Preparer Due Diligence Penalties Proposed, reflecting the effectiveness of Treasury efforts to ensure paid tax preparers are submitting accurate, non-fraudulent EITC claims on behalf of taxpayers
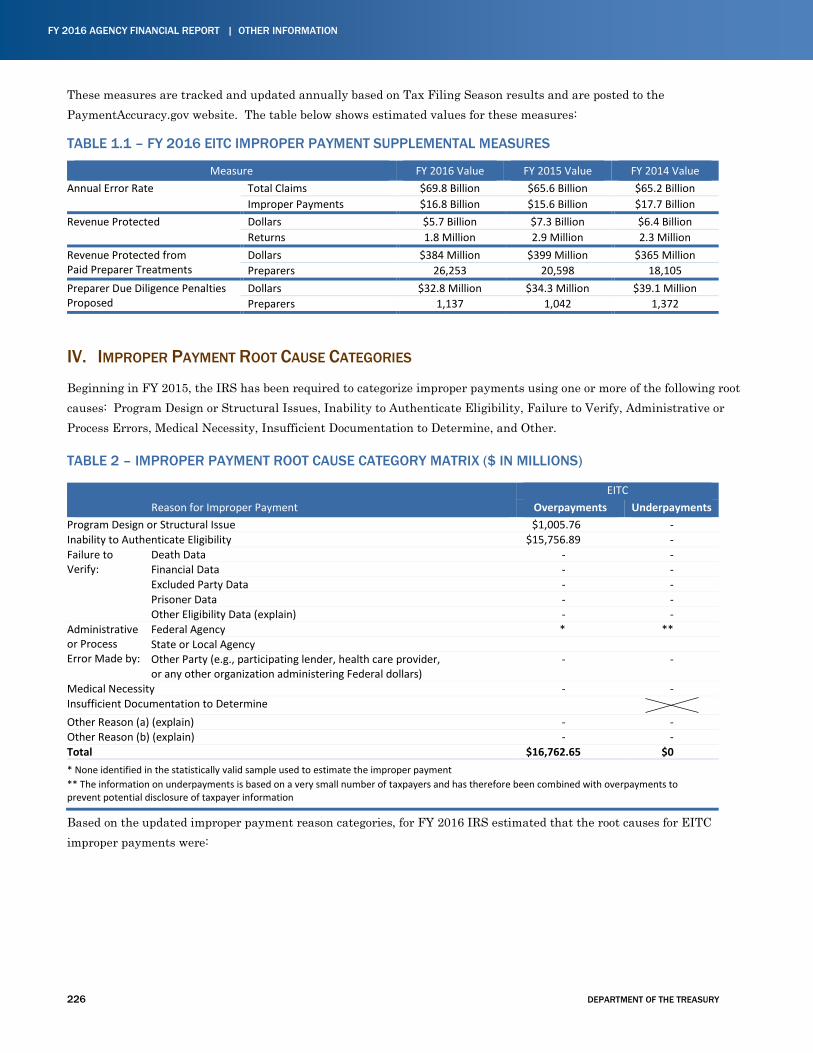
FY 2016 AGENCY FINANCIAL REPORT | OTHER INFORMATION
226 DEPARTMENT OF THE TREASURY
These measures are tracked and updated annually based on Tax Filing Season results and are posted to the PaymentAccuracy.gov website. The table below shows estimated values for these measures:
TABLE 1.1 – FY 2016 EITC IMPROPER PAYMENT SUPPLEMENTAL MEASURES
Measure FY 2016 Value FY 2015 Value FY 2014 Value Annual Error Rate Total Claims $69.8 Billion $65.6 Billion $65.2 Billion
Improper Payments $16.8 Billion $15.6 Billion $17.7 Billion Revenue Protected
Dollars $5.7 Billion $7.3 Billion $6.4 Billion Returns 1.8 Million 2.9 Million 2.3 Million
Revenue Protected from Paid Preparer Treatments
Dollars $384 Million $399 Million $365 Million Preparers 26,253 20,598 18,105
Preparer Due Diligence Penalties Proposed
Dollars $32.8 Million $34.3 Million $39.1 Million Preparers 1,137 1,042 1,372
IV. IMPROPER PAYMENT ROOT CAUSE CATEGORIES
Beginning in FY 2015, the IRS has been required to categorize improper payments using one or more of the following root causes: Program Design or Structural Issues, Inability to Authenticate Eligibility, Failure to Verify, Administrative or Process Errors, Medical Necessity, Insufficient Documentation to Determine, and Other.
TABLE 2 – IMPROPER PAYMENT ROOT CAUSE CATEGORY MATRIX ($ IN MILLIONS)
Reason for Improper Payment EITC
Overpayments Underpayments Program Design or Structural Issue $1,005.76 - Inability to Authenticate Eligibility $15,756.89 - Failure to Verify:
Death Data - - Financial Data - - Excluded Party Data - - Prisoner Data - - Other Eligibility Data (explain) - -
Administrative or Process Error Made by:
Federal Agency * ** State or Local Agency Other Party (e.g., participating lender, health care provider, or any other organization administering Federal dollars)
- -
Medical Necessity - - Insufficient Documentation to Determine
Other Reason (a) (explain) - - Other Reason (b) (explain) - - Total $16,762.65 $0 * None identified in the statistically valid sample used to estimate the improper payment ** The information on underpayments is based on a very small number of taxpayers and has therefore been combined with overpayments to prevent potential disclosure of taxpayer information
Based on the updated improper payment reason categories, for FY 2016 IRS estimated that the root causes for EITC improper payments were:
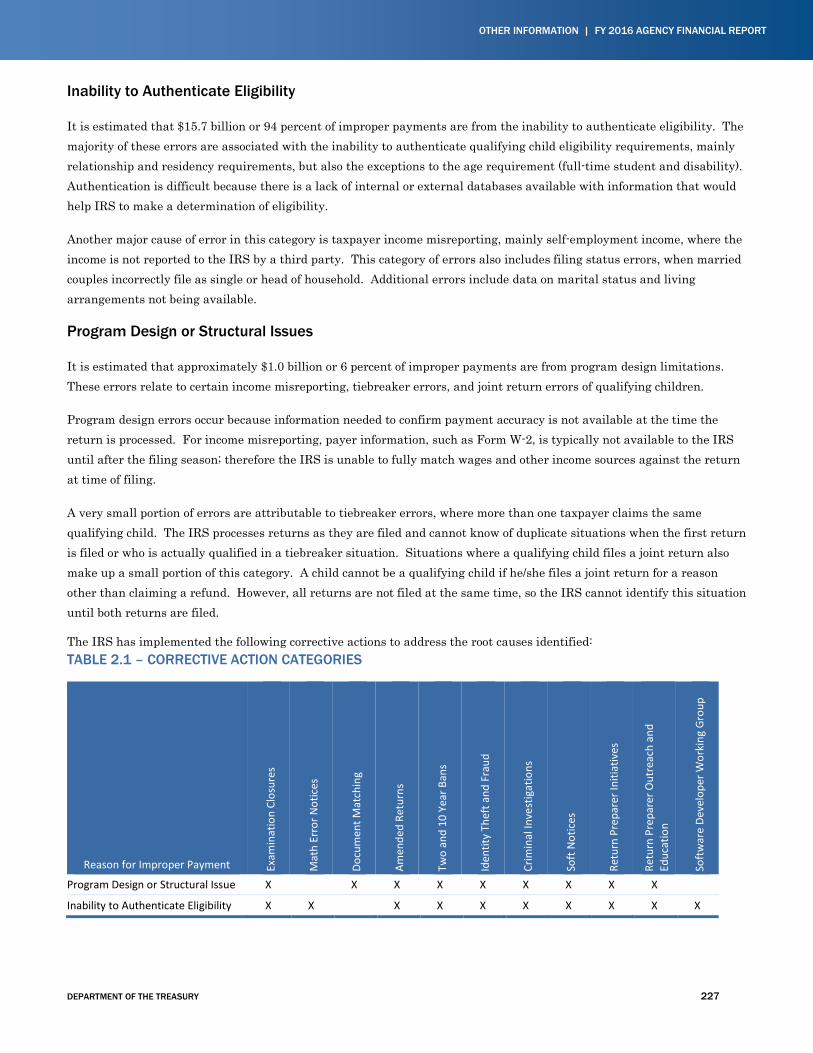
OTHER INFORMATION | FY 2016 AGENCY FINANCIAL REPORT
DEPARTMENT OF THE TREASURY 227
Inability to Authenticate Eligibility
It is estimated that $15.7 billion or 94 percent of improper payments are from the inability to authenticate eligibility. The majority of these errors are associated with the inability to authenticate qualifying child eligibility requirements, mainly relationship and residency requirements, but also the exceptions to the age requirement (full-time student and disability). Authentication is difficult because there is a lack of internal or external databases available with information that would help IRS to make a determination of eligibility.
Another major cause of error in this category is taxpayer income misreporting, mainly self-employment income, where the income is not reported to the IRS by a third party. This category of errors also includes filing status errors, when married couples incorrectly file as single or head of household. Additional errors include data on marital status and living arrangements not being available.
Program Design or Structural Issues
It is estimated that approximately $1.0 billion or 6 percent of improper payments are from program design limitations. These errors relate to certain income misreporting, tiebreaker errors, and joint return errors of qualifying children.
Program design errors occur because information needed to confirm payment accuracy is not available at the time the return is processed. For income misreporting, payer information, such as Form W-2, is typically not available to the IRS until after the filing season; therefore the IRS is unable to fully match wages and other income sources against the return at time of filing.
A very small portion of errors are attributable to tiebreaker errors, where more than one taxpayer claims the same qualifying child. The IRS processes returns as they are filed and cannot know of duplicate situations when the first return is filed or who is actually qualified in a tiebreaker situation. Situations where a qualifying child files a joint return also make up a small portion of this category. A child cannot be a qualifying child if he/she files a joint return for a reason other than claiming a refund. However, all returns are not filed at the same time, so the IRS cannot identify this situation until both returns are filed.
The IRS has implemented the following corrective actions to address the root causes identified: TABLE 2.1 – CORRECTIVE ACTION CATEGORIES
Reason for Improper Payment Exam
inat
ion
Clos
ures
Mat
h Er
ror N
otic
es
Docu
men
t Mat
chin
g
Amen
ded
Retu
rns
Two
and
10 Y
ear B
ans
Iden
tity
Thef
t and
Fra
ud
Crim
inal
Inve
stig
atio
ns
Soft
Not
ices
Retu
rn P
repa
rer I
nitia
tives
Retu
rn P
repa
rer O
utre
ach
and
Educ
atio
n
Soft
war
e De
velo
per W
orki
ng G
roup
Program Design or Structural Issue X X X X X X X X X
Inability to Authenticate Eligibility X X X X X X X X X X
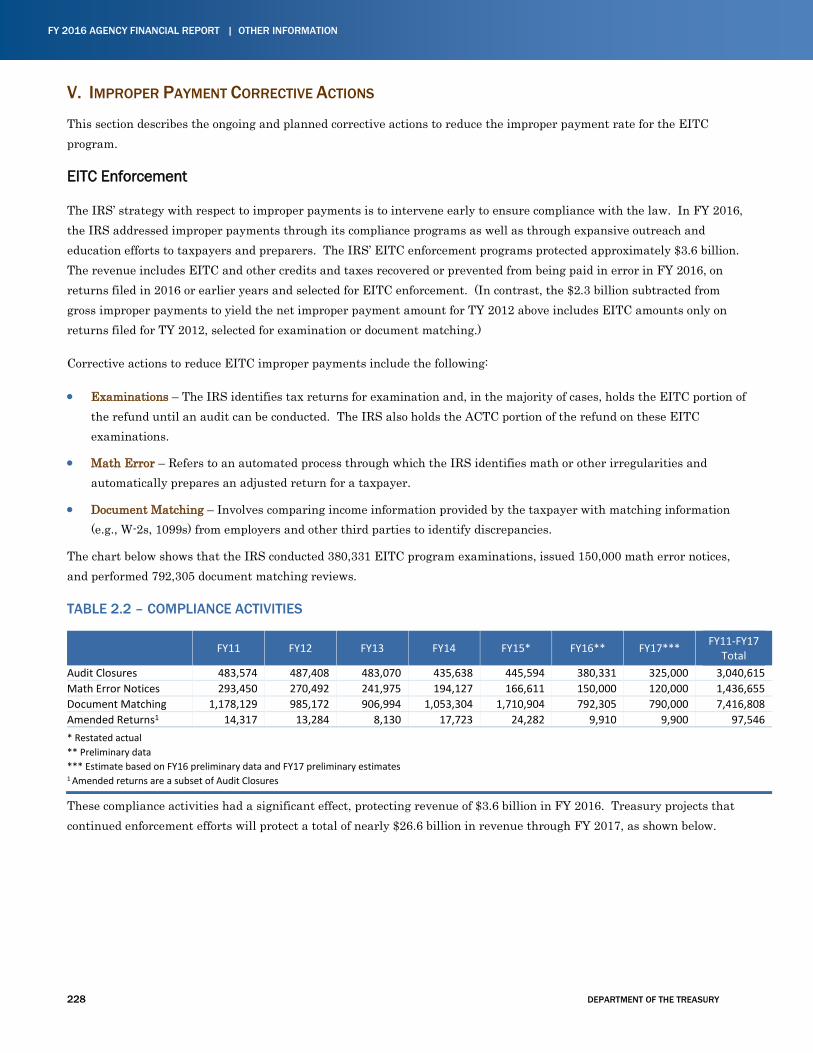
FY 2016 AGENCY FINANCIAL REPORT | OTHER INFORMATION
228 DEPARTMENT OF THE TREASURY
V. IMPROPER PAYMENT CORRECTIVE ACTIONS
This section describes the ongoing and planned corrective actions to reduce the improper payment rate for the EITC program.
EITC Enforcement
The IRS’ strategy with respect to improper payments is to intervene early to ensure compliance with the law. In FY 2016, the IRS addressed improper payments through its compliance programs as well as through expansive outreach and education efforts to taxpayers and preparers. The IRS’ EITC enforcement programs protected approximately $3.6 billion. The revenue includes EITC and other credits and taxes recovered or prevented from being paid in error in FY 2016, on returns filed in 2016 or earlier years and selected for EITC enforcement. (In contrast, the $2.3 billion subtracted from gross improper payments to yield the net improper payment amount for TY 2012 above includes EITC amounts only on returns filed for TY 2012, selected for examination or document matching.)
Corrective actions to reduce EITC improper payments include the following:
• Examinations – The IRS identifies tax returns for examination and, in the majority of cases, holds the EITC portion of the refund until an audit can be conducted. The IRS also holds the ACTC portion of the refund on these EITC examinations.
• Math Error – Refers to an automated process through which the IRS identifies math or other irregularities and automatically prepares an adjusted return for a taxpayer.
• Document Matching – Involves comparing income information provided by the taxpayer with matching information (e.g., W-2s, 1099s) from employers and other third parties to identify discrepancies.
The chart below shows that the IRS conducted 380,331 EITC program examinations, issued 150,000 math error notices, and performed 792,305 document matching reviews.
TABLE 2.2 – COMPLIANCE ACTIVITIES
FY11 FY12 FY13 FY14 FY15* FY16** FY17*** FY11-FY17 Total
Audit Closures 483,574 487,408 483,070 435,638 445,594 380,331 325,000 3,040,615 Math Error Notices 293,450 270,492 241,975 194,127 166,611 150,000 120,000 1,436,655 Document Matching 1,178,129 985,172 906,994 1,053,304 1,710,904 792,305 790,000 7,416,808 Amended Returns1 14,317 13,284 8,130 17,723 24,282 9,910 9,900 97,546 * Restated actual ** Preliminary data *** Estimate based on FY16 preliminary data and FY17 preliminary estimates 1 Amended returns are a subset of Audit Closures
These compliance activities had a significant effect, protecting revenue of $3.6 billion in FY 2016. Treasury projects that continued enforcement efforts will protect a total of nearly $26.6 billion in revenue through FY 2017, as shown below.

OTHER INFORMATION | FY 2016 AGENCY FINANCIAL REPORT
DEPARTMENT OF THE TREASURY 229
TABLE 2.3 – PROTECTED REVENUE FROM COMPLIANCE ACTIVITIES (IN MILLIONS)
FY11 FY12 FY13 FY14 FY15* FY16** FY17*** FY11-FY17 Total
Audit Closures 2,039.90 2,049.23 2,113.73 1,751.32 1,991.06 1,835.23 1,568.00 13,348.47 Math Error Notices 353.92 314.34 299.03 243.34 226.82 208.50 166.80 1,812.75 Document Matching 1,323.54 1,554.75 1,422.60 1,385.06 2,313.96 1,570.54 1,570.00 11,140.45 Amended Returns1 39.38 38.45 26.18 52.42 76.63 34.65 34.65 302.36 Total 3,756.74 3,956.77 3,861.54 3,432.14 4,608.47 3,648.92 3,339.45 26,604.03 * Restated actual. ** Preliminary data. *** Estimate based on fiscal year 2016 preliminary data.
Maximizing Current Business Processes
In addition to base compliance program efforts, the following efforts contributed to the IRS’ strategy of identifying and reducing improper EITC refund claims in FY 2016:
EITC IPERA Methodology and Estimate: Completed a new error rate estimate based on the EITC component of the Tax Year 2012 National Research Plan (NRP) study that meets IPIA standards for measuring and reporting on improper payments.
FY 2017 Action Plan and FY 2016 Root Cause Analysis Reports: Completed the FY 2017 action plan to reduce improper payments and a root cause analysis based on NRP data.
Compliance Studies: Continued analysis of the most recent compliance study and NRP data to inform our compliance strategy and amend EITC administration where feasible.
Two and 10 Year Bans: Imposed 601 two-year bans and 118 10-year bans for cases where the IRS determined during an EITC audit that the taxpayer intentionally disregarded the rules and regulations or committed fraud.
Identity Theft and Fraud: Detected and stopped almost 538,000 fraudulent returns through our fraud detection filters from being processed, preventing nearly $1.5 billion in improper EITC payments.
Criminal Investigations: Continued to stop fraudulent EITC refund claims through our Criminal Investigation (CI) division. Through September 2016, CI issued 254 EITC Questionable Refund Program (QRP) scheme indictments and 83 EITC Return Preparer indictments. CI also secured 240 and 91 convictions, respectively, on outstanding indictments.
Soft Notices: Sent more than 85,000 letters to alert taxpayers that a qualifying child for the EITC claimed on their returns had also been claimed by another person.
Dependent Database (DDb) Soft Notice Test: Issued 25,600 soft notices to taxpayers who appeared to have filed TY 2014 returns claiming EITC with either qualifying child or Schedule C income errors. The test population included previously untreated repeat DDb rule/Schedule C filter breakers and first time claimants who self-prepared their returns. The soft notices encourage taxpayers to self-correct their current year return (via an amended return), if needed and to file accurate returns in the future.
Return Preparer Initiatives: As a part of the FY 2016 EITC Return Preparer Strategy, the IRS completed activities associated with a suite of progressive EITC preparer treatments, addressing over 26,000 preparers (up from 21,000 in FY 2015) selected through our risk-based scoring model, before and during the filing season.
FY 2016 AGENCY FINANCIAL REPORT | OTHER INFORMATION
230 DEPARTMENT OF THE TREASURY
• The IRS completed 813 pre-filing season Due Diligence Visits (DDVs) with a penalty rate of 82% and more than $25 million in proposed penalties. Criminal investigation and/or revenue agents completed 164 educational Knock-and-Talk Visits (KTV). The IRS also mailed more than 18,000 educational notices and called more than 1,300 preparers before the FY 2016 filing season.
• The IRS closed 295 filing season DDVs with a penalty rate of 82% and over $4.4 million in proposed penalties. The IRS also proposed penalties of almost $249,000 on 19 of 28 DDVs completed as a follow-up for those preparers who received pre-filing season KTVs but did not improve their due diligence. The IRS mailed more than 9,400 educational notices and called over 2,200 preparers during the 2016 filing season.
• The analysis of the FY 2016 EITC Return Preparer Strategy revealed that, in addition to the proposed penalties described above, the preparer treatments protected more than $474 million ($384 million EITC and $90 million Child Tax Credit).
Return Preparer Penalties: Proposed almost $1 million in penalties to 78 TY 2015 EITC return preparers, and more than $2 million in penalties for 132 TY 2014 EITC return preparers, for failure to exercise due diligence by attaching Form 8867, Paid Preparer's Earned Income Credit Checklist, to taxpayer returns, as authorized by IRC §6695(g) and Treasury Regulation §1.6695–2. The IRS also sent more than 2,500 warning letters and 300 electronic alerts for TY 2015 to warn preparers that did not attach Form 8867 to taxpayer returns.
Return Preparer Outreach and Education: Focused outreach and education efforts on EITC return preparers to educate them on EITC and due diligence requirements. Almost 15,300 preparers received a certificate of completion for the English and Spanish interactive EITC Due Diligence Training module. Additionally, more than 6,900 preparers attended the Refundable Credits – New Rules, New Laws seminar and almost 4,900 preparers attended the Your Due Diligence Requirements: What’s New for You in 2017 seminar at the 2016 National Tax Forums.
Servicewide EITC Strategy: Continued activities to evaluate potential new solutions identified to address improper payments.
Supplemental Measures: Continued to report supplemental measures that capture key components of revenue protected through compliance activities and paid return preparer treatments, as well as paid return preparer due diligence penalties proposed.
Software Developer Working Group: Continued our partnership with members of key tax software associations to reduce EITC errors and assist preparers in meeting their EITC due diligence requirements.
Taxpayer Outreach and Education: The IRS conducted its EITC outreach campaign, including the tenth annual EITC Awareness Day, which centered on EITC underserved populations and included focused compliance messages. Through collaboration with IRS national, state, and local partners as well as Congressional and government officials, the IRS held more than 240 local events, resulting in media coverage that helped spread the word about the EITC tax credit. The IRS also held interviews in English and Spanish, resulting in more than 1,500 radio stations and 480,000 newspapers sharing the interviews. Social media outreach continued to expand with Twitter EITC messages reaching 5.8 million people and Thunderclap, a new tool for IRS this year, reaching almost 373,000 people. Also for the year, nearly 601,800 taxpayers visited the EITC Assistant on IRS.GOV, a tool that allows taxpayers to determine if they qualify for the credit.
Legislative Proposals: Include the following FY 2017 legislative proposals:
• Provide greater flexibility to address correctable errors to help the IRS deny certain erroneous EITC claims before paying refunds.
OTHER INFORMATION | FY 2016 AGENCY FINANCIAL REPORT
DEPARTMENT OF THE TREASURY 231
• Increase oversight of paid tax return preparers to help promote high quality services and improve voluntary compliance.
• Simplify the rules for claiming the EITC without a qualifying child for taxpayers who reside with a child that they do not claim as a dependent, in order to reduce taxpayer burden and improve EITC compliance.
Enterprise Research: Assessed the results of the FY 2016 enterprise research strategy and developed the FY 2017 strategy in partnership with internal organizations to better focus EITC compliance and outreach activities using research data.
EITC Summit: The IRS hosted an EITC Summit that was attended by numerous EITC stakeholders including tax industry professionals, representatives of state and federal agencies, consumer advocates, and representatives from non-government organizations. The objective was to obtain different perspectives on ways to reduce EITC errors, mitigate compliance risks, increase participation for eligible EITC populations, and ease taxpayer and government burden.
VI. INTERNAL CONTROL OVER PAYMENTS
IRS Internal Control Framework
EITC improper payments are not rooted in internal control weakness, financial management deficiencies, or financial reporting failures but through the inherent difficulty of delivering benefits through the tax system. Much of the difficulty administering the EITC derives from the complexity of its statutory eligibility requirements. Whether a taxpayer meets these eligibility rules may be difficult for the taxpayer to understand and cannot be independently confirmed by the IRS using third-party corroborating data. The computation of improper payments, as established by OMB, also does not take into consideration all internal control processes in place that stop erroneous returns from being processed. For example, the controls and filters in the IRS' fraud and identity theft programs stop EITC returns with billions of dollars in fraudulently claimed EITC.
The IRS has internal controls in place to verify eligibility when data are available. For example, the IRS may reject a return from processing or systemically adjust a return if a Social Security Number is incorrect, data on the return is not consistent with eligibility requirements, or the return contains mathematical errors. The IRS cannot verify that key EITC eligibility criteria are met in the absence of a burdensome tax audit. The IRS' internal controls include a sophisticated scoring and selection program for EITC examinations that identifies a significant number of high risk returns, but due to limited resources the IRS cannot examine all returns identified. For those that the IRS does examine, about 80 percent are examined in a pre-refund environment where the IRS holds the EITC refund until eligibility is verified by taxpayers.
The IRS has a strong internal control environment based on a risk assessment around EITC and other programs administered and make decisions based on overall cost-benefit considerations. The IRS annually reviews and enhances its compliance plan that addresses erroneous EITC. Each year the IRS updates its strategy using the most recent research findings (e.g. compliance studies and root cause analyses), prior year audit results, TIGTA/GAO audit findings, and legislative updates. The IRS also submits legislative proposals which, if approved by Congress, may further enhance efforts to address areas of risk and reduce improper payments.
The IRS reviews and updates Internal Revenue Manuals (IRMs) throughout the year and ensures that IRS employees who administer refundable credits receive annual training and have the requisite knowledge to address the evolving nature of improper payments and fraud. Employees are also encouraged to bring internal control problems to management’s attention. In fact, processes are in place to address internal control questions and concerns through the Service-wide Electronic Research Project (SERP) feedback application.
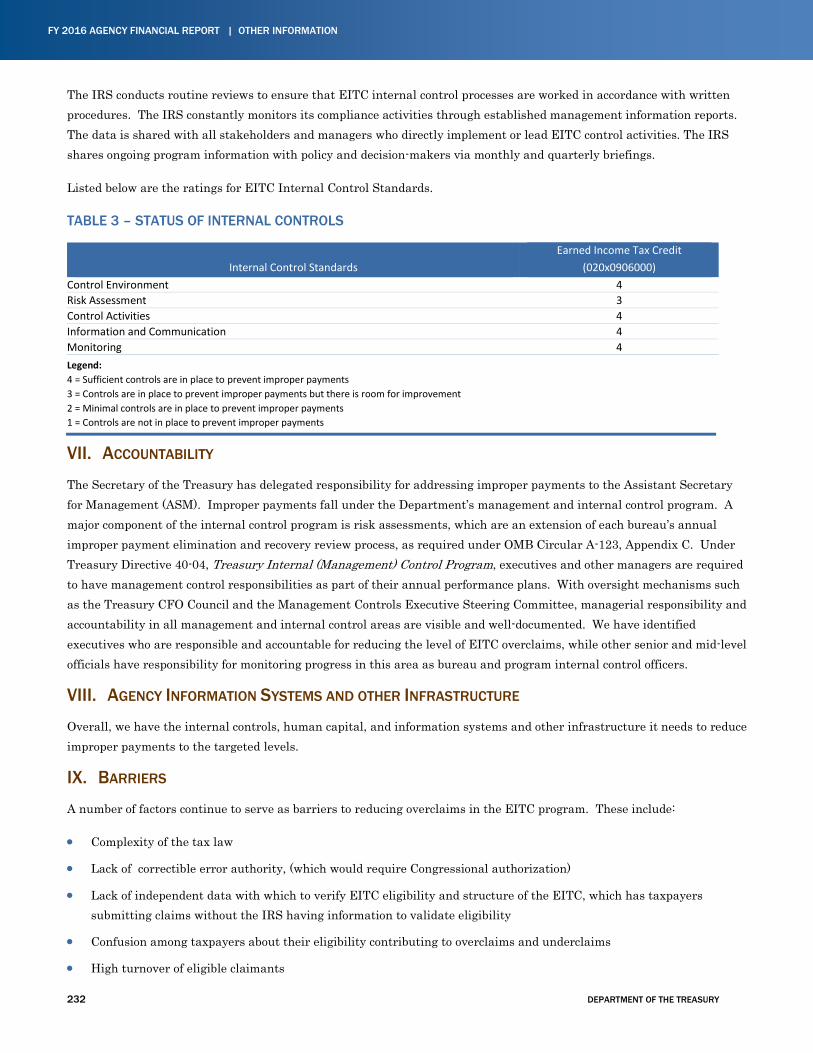
FY 2016 AGENCY FINANCIAL REPORT | OTHER INFORMATION
232 DEPARTMENT OF THE TREASURY
The IRS conducts routine reviews to ensure that EITC internal control processes are worked in accordance with written procedures. The IRS constantly monitors its compliance activities through established management information reports. The data is shared with all stakeholders and managers who directly implement or lead EITC control activities. The IRS shares ongoing program information with policy and decision-makers via monthly and quarterly briefings.
Listed below are the ratings for EITC Internal Control Standards.
TABLE 3 – STATUS OF INTERNAL CONTROLS
Internal Control Standards Earned Income Tax Credit
(020x0906000) Control Environment 4 Risk Assessment 3 Control Activities 4 Information and Communication 4 Monitoring 4 Legend: 4 = Sufficient controls are in place to prevent improper payments 3 = Controls are in place to prevent improper payments but there is room for improvement 2 = Minimal controls are in place to prevent improper payments 1 = Controls are not in place to prevent improper payments
VII. ACCOUNTABILITY
The Secretary of the Treasury has delegated responsibility for addressing improper payments to the Assistant Secretary for Management (ASM). Improper payments fall under the Department’s management and internal control program. A major component of the internal control program is risk assessments, which are an extension of each bureau’s annual improper payment elimination and recovery review process, as required under OMB Circular A-123, Appendix C. Under Treasury Directive 40-04, Treasury Internal (Management) Control Program, executives and other managers are required to have management control responsibilities as part of their annual performance plans. With oversight mechanisms such as the Treasury CFO Council and the Management Controls Executive Steering Committee, managerial responsibility and accountability in all management and internal control areas are visible and well-documented. We have identified executives who are responsible and accountable for reducing the level of EITC overclaims, while other senior and mid-level officials have responsibility for monitoring progress in this area as bureau and program internal control officers.
VIII. AGENCY INFORMATION SYSTEMS AND OTHER INFRASTRUCTURE
Overall, we have the internal controls, human capital, and information systems and other infrastructure it needs to reduce improper payments to the targeted levels.
IX. BARRIERS
A number of factors continue to serve as barriers to reducing overclaims in the EITC program. These include:
• Complexity of the tax law
• Lack of correctible error authority, (which would require Congressional authorization)
• Lack of independent data with which to verify EITC eligibility and structure of the EITC, which has taxpayers submitting claims without the IRS having information to validate eligibility
• Confusion among taxpayers about their eligibility contributing to overclaims and underclaims
• High turnover of eligible claimants
OTHER INFORMATION | FY 2016 AGENCY FINANCIAL REPORT
DEPARTMENT OF THE TREASURY 233
• Unscrupulous and/or incompetent return preparers
• Fraud
None of these factors can be considered the primary driver of program error. However, these barriers severely impede the IRS’ dual mission of issuing refunds to those who are entitled, while ensuring refunds are paid only to those who truly qualify for the credit.
Also, statutory requirements further constrain the IRS’ ability to ensure that EITC claims are valid before they are processed and paid. Since the EITC is administered through the Internal Revenue Code (IRC), it is claimed by taxpayers during the filing and processing of their tax returns. The IRC requires the IRS to process tax returns and pay any related tax refunds within 45 days of receipt of the tax return or the tax return due date, whichever is later. Beyond this 45 day period interest begins accruing on the refund amount, which must be paid along with the refund to the taxpayer. For the majority of EITC returns, which tend to be filed early in the filing season, the IRS does not receive information to verify income reporting accuracy or other data needed to validate these EITC claims at the time of filing or within a reasonable period thereafter in which a taxpayer would expect their refund. The IRS faces further challenges when attempting to validate the EITC claims of filers with non-wage income. The requirements, expectations, and data accessibility relative to the timely payment of refunds constrain the IRS’ ability to conduct up-front verification of claims. These conditions distinguish EITC and its administration through the tax system from the extensive validity checks conducted by agencies administering other federal programs that typically establish eligibility prior to the issuance of payments or benefits.
The IRS submitted legislative proposals in the FY 2017 Budget to help address EITC improper payments.
X. RECAPTURE OF IMPROPER PAYMENTS REPORTING
In accordance with IPERA and OMB Circular A-123, Appendix C, we perform and report annually on our payment recapture program. During FY 2016, we issued contracts and other reviewed payments totaling approximately $11 billion. The amended act expanded the payment types reviewed beyond just contracts to include grants, benefits, loans, and miscellaneous payments.
Our annual risk assessment process includes a review of pre-payment controls that minimize the likelihood and occurrence of improper payments. We require each bureau and office to conduct post-award audits and report on payment recapture activities, contracts issued, improper payments made, and recoveries achieved. Bureaus and offices may use payment recapture audit contingency firms to perform many of the steps in their payment recapture auditing program and identify candidates for payment recapture action. However, no Treasury bureaus used contractors to perform recapture activities for fiscal year 2016. Treasury employees performed this work.
We consider both pre- and post-reviews to identify payment errors a sound management practice that should be included among basic payment controls. All bureaus have a process in place to identify improper payments during pre- and post-reviews. When applicable, bureaus may use the results of the Treasury IGs and GAO reviews to help identify payment anomalies and target areas for improvement. However, we apply extensive payment controls at the time each payment is processed, making recapture activity minimal.
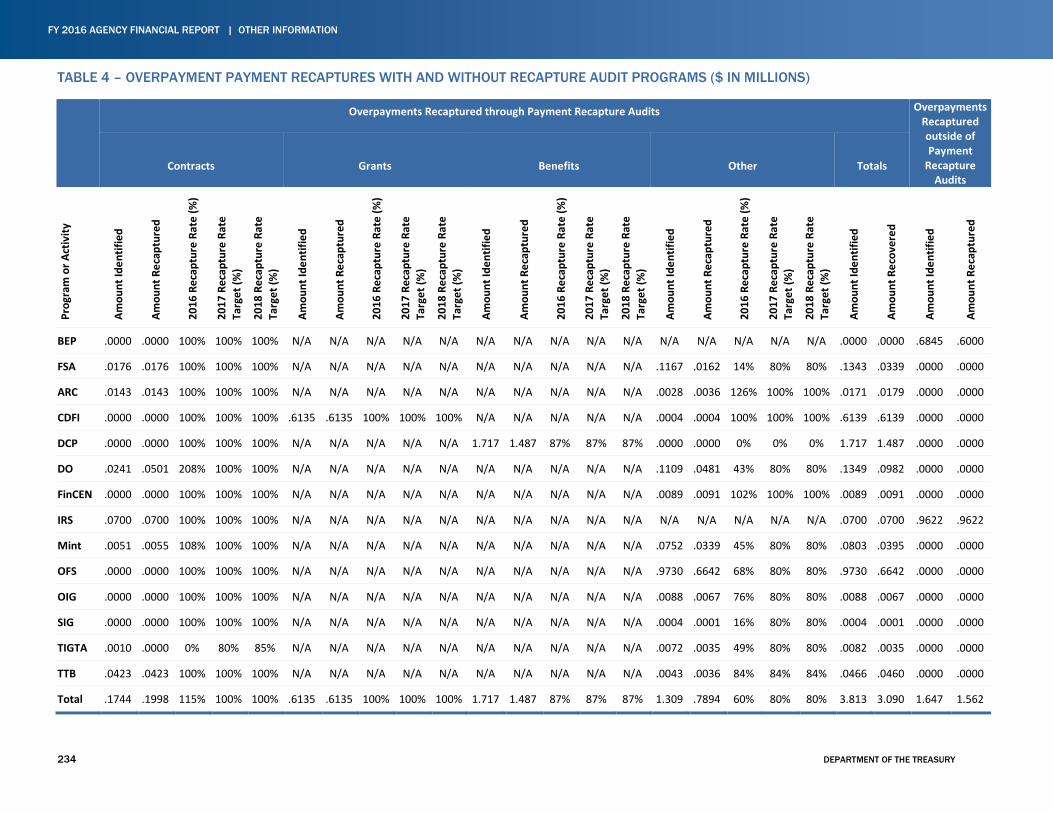
FY 2016 AGENCY FINANCIAL REPORT | OTHER INFORMATION
234 DEPARTMENT OF THE TREASURY
TABLE 4 – OVERPAYMENT PAYMENT RECAPTURES WITH AND WITHOUT RECAPTURE AUDIT PROGRAMS ($ IN MILLIONS)
Overpayments Recaptured through Payment Recapture Audits Overpayments Recaptured outside of Payment
Recapture Audits
Contracts Grants Benefits Other Totals
Prog
ram
or A
ctiv
ity
Amou
nt Id
entif
ied
Amou
nt R
ecap
ture
d
2016
Rec
aptu
re R
ate
(%)
2017
Rec
aptu
re R
ate
Targ
et (%
)
2018
Rec
aptu
re R
ate
Targ
et (%
)
Amou
nt Id
entif
ied
Amou
nt R
ecap
ture
d
2016
Rec
aptu
re R
ate
(%)
2017
Rec
aptu
re R
ate
Targ
et (%
)
2018
Rec
aptu
re R
ate
Targ
et (%
)
Amou
nt Id
entif
ied
Amou
nt R
ecap
ture
d
2016
Rec
aptu
re R
ate
(%)
2017
Rec
aptu
re R
ate
Targ
et (%
)
2018
Rec
aptu
re R
ate
Targ
et (%
)
Amou
nt Id
entif
ied
Amou
nt R
ecap
ture
d
2016
Rec
aptu
re R
ate
(%)
2017
Rec
aptu
re R
ate
Targ
et (%
)
2018
Rec
aptu
re R
ate
Targ
et (%
)
Amou
nt Id
entif
ied
Amou
nt R
ecov
ered
Amou
nt Id
entif
ied
Amou
nt R
ecap
ture
d
BEP .0000 .0000 100% 100% 100% N/A N/A N/A N/A N/A N/A N/A N/A N/A N/A N/A N/A N/A N/A N/A .0000 .0000 .6845 .6000
FSA .0176 .0176 100% 100% 100% N/A N/A N/A N/A N/A N/A N/A N/A N/A N/A .1167 .0162 14% 80% 80% .1343 .0339 .0000 .0000
ARC .0143 .0143 100% 100% 100% N/A N/A N/A N/A N/A N/A N/A N/A N/A N/A .0028 .0036 126% 100% 100% .0171 .0179 .0000 .0000
CDFI .0000 .0000 100% 100% 100% .6135 .6135 100% 100% 100% N/A N/A N/A N/A N/A .0004 .0004 100% 100% 100% .6139 .6139 .0000 .0000
DCP .0000 .0000 100% 100% 100% N/A N/A N/A N/A N/A 1.717 1.487 87% 87% 87% .0000 .0000 0% 0% 0% 1.717 1.487 .0000 .0000
DO .0241 .0501 208% 100% 100% N/A N/A N/A N/A N/A N/A N/A N/A N/A N/A .1109 .0481 43% 80% 80% .1349 .0982 .0000 .0000
FinCEN .0000 .0000 100% 100% 100% N/A N/A N/A N/A N/A N/A N/A N/A N/A N/A .0089 .0091 102% 100% 100% .0089 .0091 .0000 .0000
IRS .0700 .0700 100% 100% 100% N/A N/A N/A N/A N/A N/A N/A N/A N/A N/A N/A N/A N/A N/A N/A .0700 .0700 .9622 .9622
Mint .0051 .0055 108% 100% 100% N/A N/A N/A N/A N/A N/A N/A N/A N/A N/A .0752 .0339 45% 80% 80% .0803 .0395 .0000 .0000
OFS .0000 .0000 100% 100% 100% N/A N/A N/A N/A N/A N/A N/A N/A N/A N/A .9730 .6642 68% 80% 80% .9730 .6642 .0000 .0000
OIG .0000 .0000 100% 100% 100% N/A N/A N/A N/A N/A N/A N/A N/A N/A N/A .0088 .0067 76% 80% 80% .0088 .0067 .0000 .0000
SIG .0000 .0000 100% 100% 100% N/A N/A N/A N/A N/A N/A N/A N/A N/A N/A .0004 .0001 16% 80% 80% .0004 .0001 .0000 .0000
TIGTA .0010 .0000 0% 80% 85% N/A N/A N/A N/A N/A N/A N/A N/A N/A N/A .0072 .0035 49% 80% 80% .0082 .0035 .0000 .0000
TTB .0423 .0423 100% 100% 100% N/A N/A N/A N/A N/A N/A N/A N/A N/A N/A .0043 .0036 84% 84% 84% .0466 .0460 .0000 .0000
Total .1744 .1998 115% 100% 100% .6135 .6135 100% 100% 100% 1.717 1.487 87% 87% 87% 1.309 .7894 60% 80% 80% 3.813 3.090 1.647 1.562
OTHER INFORMATION | FY 2016 AGENCY FINANCIAL REPORT
DEPARTMENT OF THE TREASURY 235
In FY 2016, we determined that conducting a Payment Recapture Audit on the following six low risk programs was not cost-effective:
• Fiscal Service Debt Activity Programs
• Fiscal Service Treasury Managed Accounts
• Fiscal Service Trust Funds Management
• Treasury Executive Office for Asset Forfeiture
• Departmental Offices International Financial Institutions – International Assistance Programs
• The Office of the Comptroller of the Currency Assessment Funds
The Fiscal Service Debt Activity Programs, Treasury Managed Accounts disbursements, and Trust Funds Management programs continued to reflect a low risk level in nearly every group and payment type category assessed.
The Treasury Executive Office for Asset Forfeiture’s program payments were deemed low risk. However, based on the high dollar value requiring minimal resources, the Executive Office for Asset Forfeiture will continue to conduct internal contract audits on the payments.
The DO International Financial Institutions non-federal payments to the Multilateral Development Banks are submitted by either a voucher on a letter of credit administered by the Federal Reserve Bank of New York or through direct cash payments via the Fiscal Service Secure Payment System. Based on the volume of payments processed by OAS, it would not be cost effective to perform a payment recapture audit.
The OCC assessment funds risk assessment has resulted in a low risk rating each of the last five years for all rating categories.
Based on the above justifications, payment recapture audits for these programs were not deemed cost effective. We sent notifications on these justifications to OMB and the Treasury OIG in October 2016.
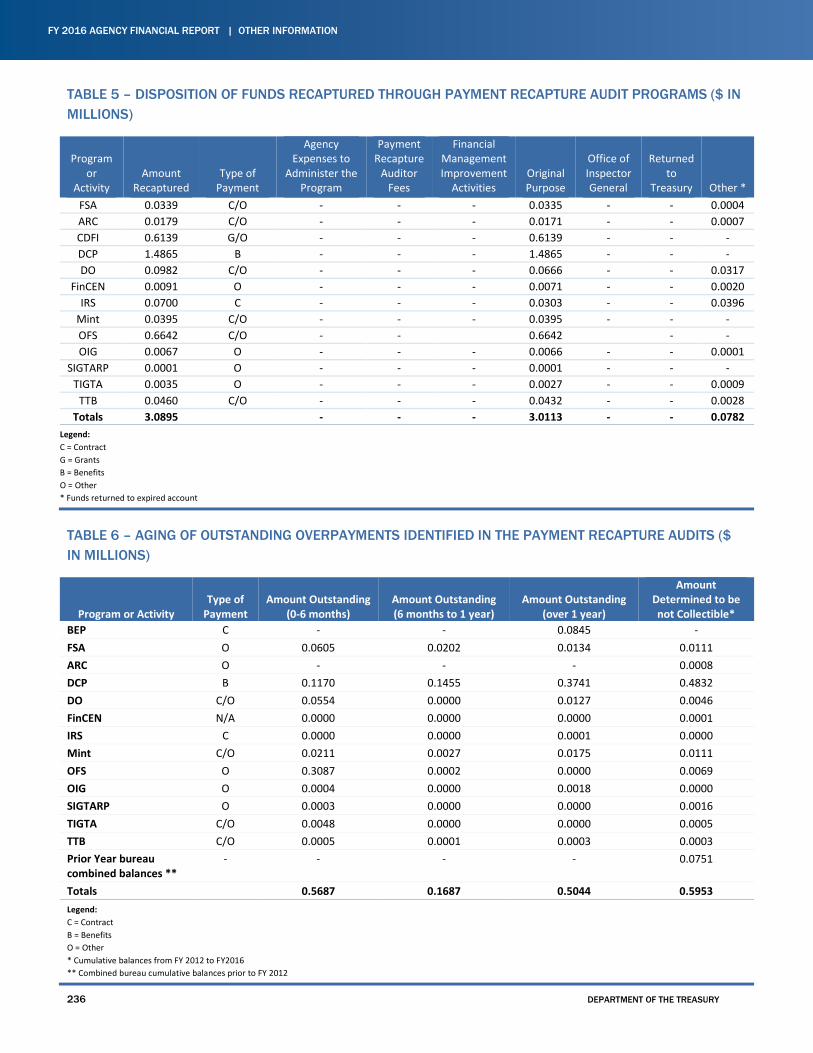
FY 2016 AGENCY FINANCIAL REPORT | OTHER INFORMATION
236 DEPARTMENT OF THE TREASURY
TABLE 5 – DISPOSITION OF FUNDS RECAPTURED THROUGH PAYMENT RECAPTURE AUDIT PROGRAMS ($ IN MILLIONS)
TABLE 6 – AGING OF OUTSTANDING OVERPAYMENTS IDENTIFIED IN THE PAYMENT RECAPTURE AUDITS ($ IN MILLIONS)
Program or Activity Type of
Payment Amount Outstanding
(0-6 months) Amount Outstanding (6 months to 1 year)
Amount Outstanding (over 1 year)
Amount Determined to be not Collectible*
BEP C - - 0.0845 - FSA O 0.0605 0.0202 0.0134 0.0111 ARC O - - - 0.0008 DCP B 0.1170 0.1455 0.3741 0.4832 DO C/O 0.0554 0.0000 0.0127 0.0046 FinCEN N/A 0.0000 0.0000 0.0000 0.0001 IRS C 0.0000 0.0000 0.0001 0.0000 Mint C/O 0.0211 0.0027 0.0175 0.0111 OFS O 0.3087 0.0002 0.0000 0.0069 OIG O 0.0004 0.0000 0.0018 0.0000 SIGTARP O 0.0003 0.0000 0.0000 0.0016 TIGTA C/O 0.0048 0.0000 0.0000 0.0005 TTB C/O 0.0005 0.0001 0.0003 0.0003 Prior Year bureau combined balances **
- - - - 0.0751
Totals 0.5687 0.1687 0.5044 0.5953 Legend: C = Contract B = Benefits O = Other * Cumulative balances from FY 2012 to FY2016 ** Combined bureau cumulative balances prior to FY 2012
Program or
Activity Amount
Recaptured Type of
Payment
Agency Expenses to
Administer the Program
Payment Recapture
Auditor Fees
Financial Management Improvement
Activities Original Purpose
Office of Inspector General
Returned to
Treasury
Other * FSA 0.0339 C/O - - - 0.0335 - - 0.0004 ARC 0.0179 C/O - - - 0.0171 - - 0.0007 CDFI 0.6139 G/O - - - 0.6139 - - - DCP 1.4865 B - - - 1.4865 - - - DO 0.0982 C/O - - - 0.0666 - - 0.0317
FinCEN 0.0091 O - - - 0.0071 - - 0.0020 IRS 0.0700 C - - - 0.0303 - - 0.0396
Mint 0.0395 C/O - - - 0.0395 - - - OFS 0.6642 C/O - - 0.6642 - - OIG 0.0067 O - - - 0.0066 - - 0.0001
SIGTARP 0.0001 O - - - 0.0001 - - - TIGTA 0.0035 O - - - 0.0027 - - 0.0009
TTB 0.0460 C/O - - - 0.0432 - - 0.0028 Totals 3.0895 - - - 3.0113 - - 0.0782
Legend: C = Contract G = Grants B = Benefits O = Other * Funds returned to expired account
OTHER INFORMATION | FY 2016 AGENCY FINANCIAL REPORT
DEPARTMENT OF THE TREASURY 237
Of the bureaus reporting an amount determined not to be collectible in the table above, we determined all of the write-off amounts to be immaterial, with the exception of the District of Columbia Pensions (DCP). The amount determined not to be collectible was based on individual debt cases deemed uncollectible after thorough reviews resulting in a determination to cease active collective actions.
XI. ADDITIONAL COMMENTS
In FY 2016, the OIG issued Report Number OIG-16-041, Treasury Was Not in Compliance with IPERA for Fiscal Year 2015 Due to High Improper Payment Rate for the Earned Income Tax Credit Program, which covered the IPERA program as presented in our FY 2015 Agency Financial Report. During FY 2016, we implemented corrective actions to address the findings and recommendations in the OIG report.
XII. AGENCY REDUCTION OF IMPROPER PAYMENTS WITH THE DO NOT PAY INITIATIVE
The IPERIA requires pre-payment and pre-award reviews to determine program or award eligibility and to prevent improper payments before the release of any Federal funds. This review must include the relevant databases as prescribed by IPERIA, including:
• the death records maintained by the Commissioner of Social Security;
• the General Services Administration’s Excluded Parties List System (EPLS), (or the updated System for Award Management (SAM));
• the Debt Check Database (Debt Check);
• the Credit Alert System or Credit Alert Interactive Voice Response System (CAIVRS) of the Department of Housing and Urban Development;
• the List of Excluded Individuals/Entities (LEIE) of the Office of Inspector General of the Department of Health and Human Services; and
• the Prisoner Update Processing System (PUPS) of the Social Security Administration, as added to IPERIA by the Bipartisan Budget Act of 2013, Pub. L. 113–67.
All bureaus have incorporated pre-payment and pre-award reviews, as mandated by IPERIA, through established internal control processes and procedures that require reviews against the databases consolidated within the Do Not Pay Business Center or through their own established databases. All Treasury non-tax payments are compared against the Death Master File (DMF) and SAM Exclusion Records at the time of payment via the Do Not Pay Business Center. Matches that occur are then reviewed by staff at the appropriate bureau to determine if the payment was proper or improper. No bureau has identified incorrect information within the original databases.
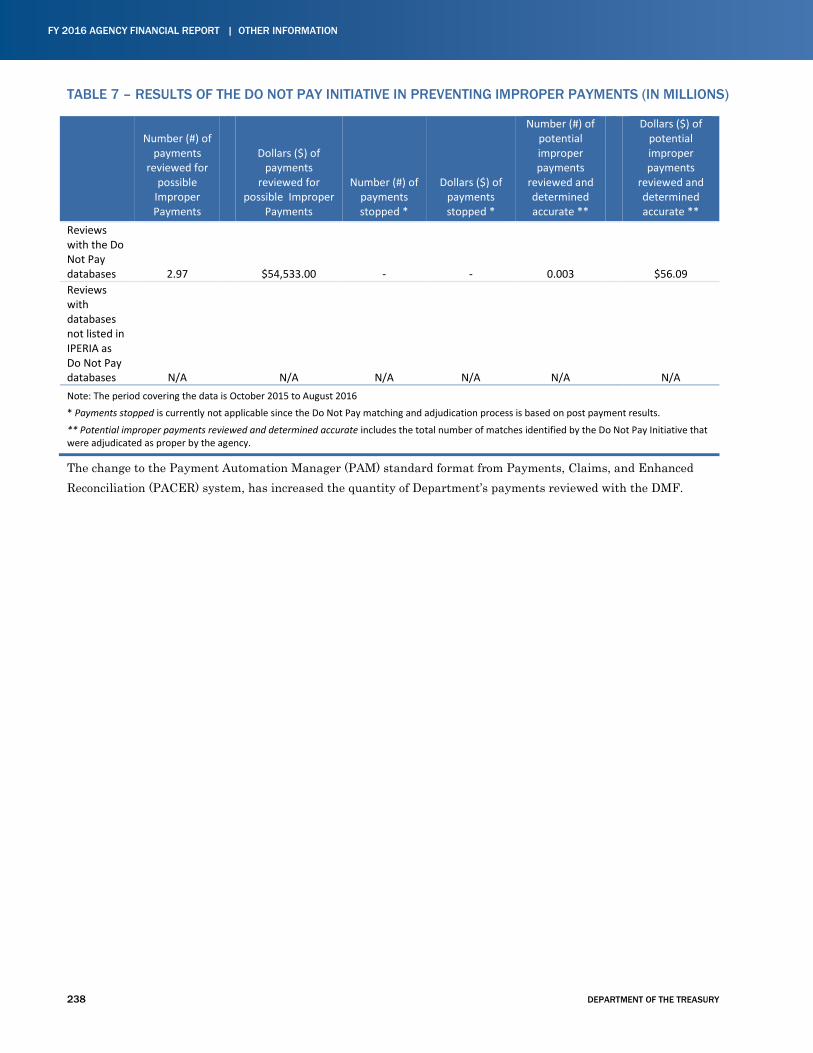
FY 2016 AGENCY FINANCIAL REPORT | OTHER INFORMATION
238 DEPARTMENT OF THE TREASURY
TABLE 7 – RESULTS OF THE DO NOT PAY INITIATIVE IN PREVENTING IMPROPER PAYMENTS (IN MILLIONS)
Number (#) of payments
reviewed for possible
Improper Payments
Dollars ($) of payments
reviewed for possible Improper
Payments
Number (#) of payments stopped *
Dollars ($) of payments stopped *
Number (#) of potential improper payments
reviewed and determined accurate **
Dollars ($) of potential improper payments
reviewed and determined accurate **
Reviews with the Do Not Pay databases 2.97 $54,533.00 - - 0.003 $56.09 Reviews with databases not listed in IPERIA as Do Not Pay databases N/A N/A N/A N/A N/A N/A Note: The period covering the data is October 2015 to August 2016
* Payments stopped is currently not applicable since the Do Not Pay matching and adjudication process is based on post payment results.
** Potential improper payments reviewed and determined accurate includes the total number of matches identified by the Do Not Pay Initiative that were adjudicated as proper by the agency.
The change to the Payment Automation Manager (PAM) standard format from Payments, Claims, and Enhanced Reconciliation (PACER) system, has increased the quantity of Department’s payments reviewed with the DMF.
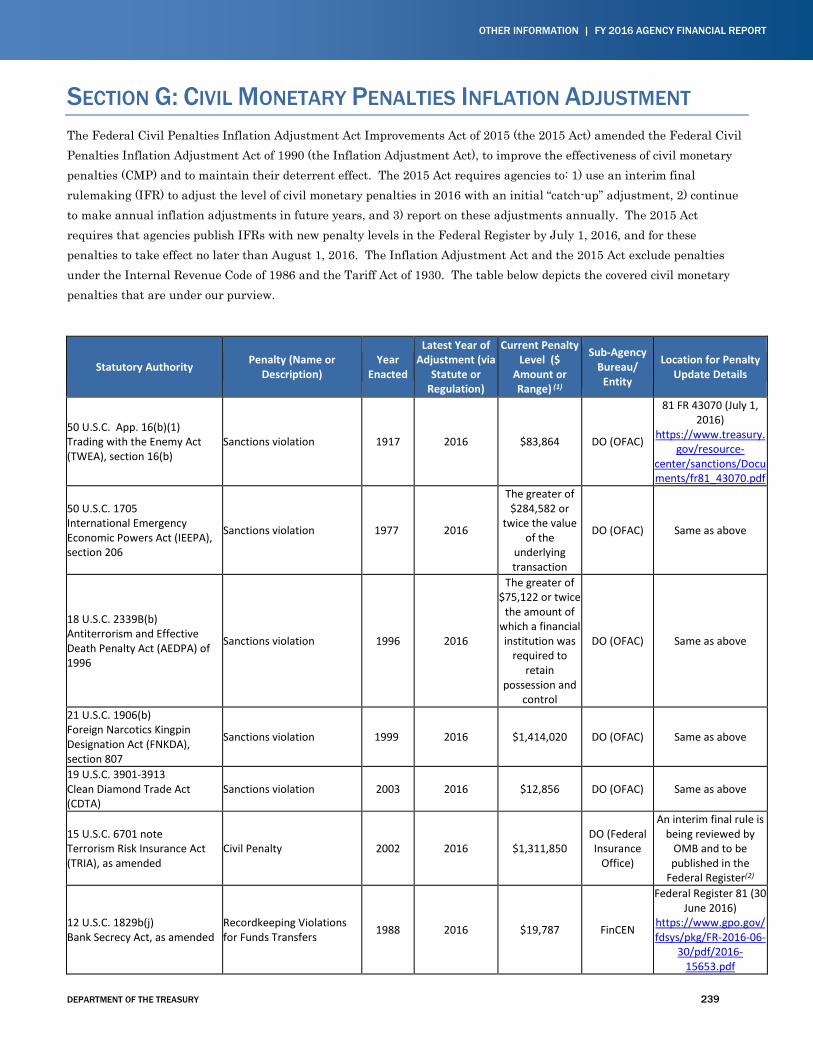
OTHER INFORMATION | FY 2016 AGENCY FINANCIAL REPORT
DEPARTMENT OF THE TREASURY 239
SECTION G: CIVIL MONETARY PENALTIES INFLATION ADJUSTMENT The Federal Civil Penalties Inflation Adjustment Act Improvements Act of 2015 (the 2015 Act) amended the Federal Civil Penalties Inflation Adjustment Act of 1990 (the Inflation Adjustment Act), to improve the effectiveness of civil monetary penalties (CMP) and to maintain their deterrent effect. The 2015 Act requires agencies to: 1) use an interim final rulemaking (IFR) to adjust the level of civil monetary penalties in 2016 with an initial “catch-up” adjustment, 2) continue to make annual inflation adjustments in future years, and 3) report on these adjustments annually. The 2015 Act requires that agencies publish IFRs with new penalty levels in the Federal Register by July 1, 2016, and for these penalties to take effect no later than August 1, 2016. The Inflation Adjustment Act and the 2015 Act exclude penalties under the Internal Revenue Code of 1986 and the Tariff Act of 1930. The table below depicts the covered civil monetary penalties that are under our purview.
Statutory Authority Penalty (Name or Description)
Year Enacted
Latest Year of Adjustment (via
Statute or Regulation)
Current Penalty Level ($
Amount or Range) (1)
Sub-Agency Bureau/
Entity
Location for Penalty Update Details
50 U.S.C. App. 16(b)(1) Trading with the Enemy Act (TWEA), section 16(b)
Sanctions violation 1917 2016 $83,864 DO (OFAC)
81 FR 43070 (July 1, 2016)
https://www.treasury.gov/resource-
center/sanctions/Documents/fr81_43070.pdf
50 U.S.C. 1705 International Emergency Economic Powers Act (IEEPA), section 206
Sanctions violation 1977 2016
The greater of $284,582 or
twice the value of the
underlying transaction
DO (OFAC) Same as above
18 U.S.C. 2339B(b) Antiterrorism and Effective Death Penalty Act (AEDPA) of 1996
Sanctions violation 1996 2016
The greater of $75,122 or twice
the amount of which a financial institution was
required to retain
possession and control
DO (OFAC) Same as above
21 U.S.C. 1906(b) Foreign Narcotics Kingpin Designation Act (FNKDA), section 807
Sanctions violation 1999 2016 $1,414,020 DO (OFAC) Same as above
19 U.S.C. 3901-3913 Clean Diamond Trade Act (CDTA)
Sanctions violation 2003 2016 $12,856 DO (OFAC) Same as above
15 U.S.C. 6701 note Terrorism Risk Insurance Act (TRIA), as amended
Civil Penalty 2002 2016 $1,311,850 DO (Federal Insurance
Office)
An interim final rule is being reviewed by
OMB and to be published in the
Federal Register(2)
12 U.S.C. 1829b(j) Bank Secrecy Act, as amended
Recordkeeping Violations for Funds Transfers 1988 2016 $19,787 FinCEN
Federal Register 81 (30 June 2016)
https://www.gpo.gov/fdsys/pkg/FR-2016-06-
30/pdf/2016-15653.pdf
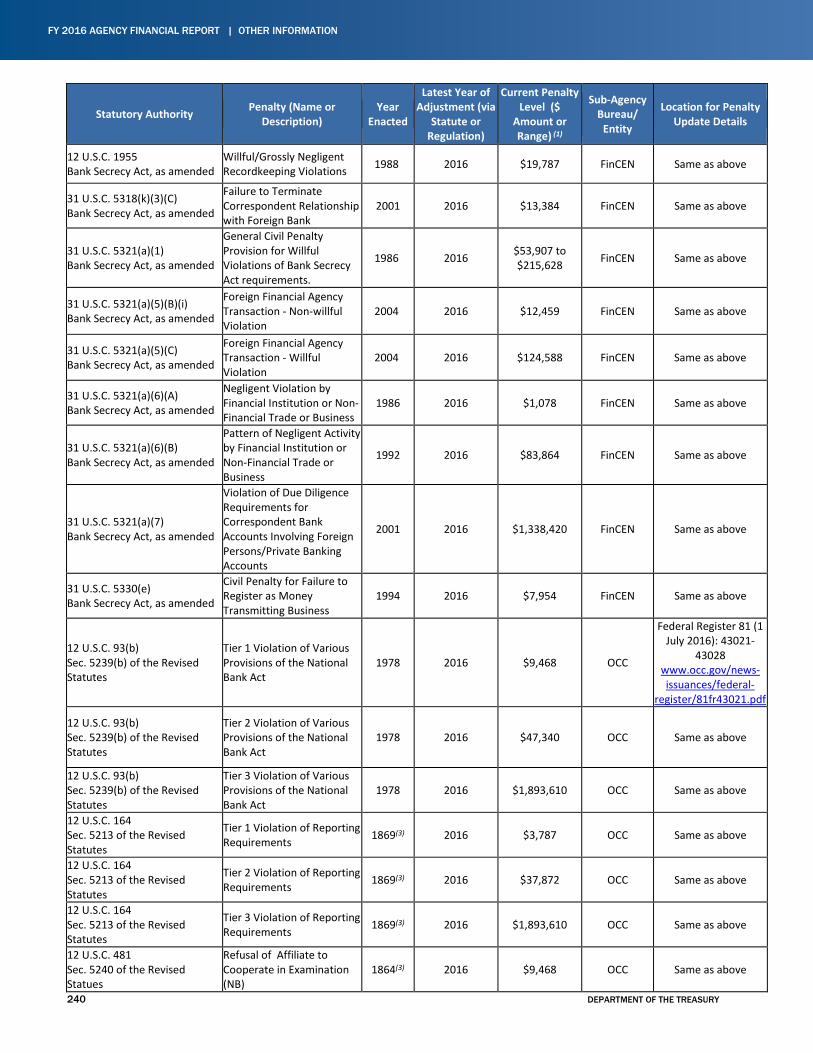
FY 2016 AGENCY FINANCIAL REPORT | OTHER INFORMATION
240 DEPARTMENT OF THE TREASURY
Statutory Authority Penalty (Name or Description)
Year Enacted
Latest Year of Adjustment (via
Statute or Regulation)
Current Penalty Level ($
Amount or Range) (1)
Sub-Agency Bureau/
Entity
Location for Penalty Update Details
12 U.S.C. 1955 Bank Secrecy Act, as amended
Willful/Grossly Negligent Recordkeeping Violations 1988 2016 $19,787 FinCEN Same as above
31 U.S.C. 5318(k)(3)(C) Bank Secrecy Act, as amended
Failure to Terminate Correspondent Relationship with Foreign Bank
2001 2016 $13,384 FinCEN Same as above
31 U.S.C. 5321(a)(1) Bank Secrecy Act, as amended
General Civil Penalty Provision for Willful Violations of Bank Secrecy Act requirements.
1986 2016 $53,907 to $215,628 FinCEN Same as above
31 U.S.C. 5321(a)(5)(B)(i) Bank Secrecy Act, as amended
Foreign Financial Agency Transaction - Non-willful Violation
2004 2016 $12,459 FinCEN Same as above
31 U.S.C. 5321(a)(5)(C) Bank Secrecy Act, as amended
Foreign Financial Agency Transaction - Willful Violation
2004 2016 $124,588 FinCEN Same as above
31 U.S.C. 5321(a)(6)(A) Bank Secrecy Act, as amended
Negligent Violation by Financial Institution or Non-Financial Trade or Business
1986 2016 $1,078 FinCEN Same as above
31 U.S.C. 5321(a)(6)(B) Bank Secrecy Act, as amended
Pattern of Negligent Activity by Financial Institution or Non-Financial Trade or Business
1992 2016 $83,864 FinCEN Same as above
31 U.S.C. 5321(a)(7) Bank Secrecy Act, as amended
Violation of Due Diligence Requirements for Correspondent Bank Accounts Involving Foreign Persons/Private Banking Accounts
2001 2016 $1,338,420 FinCEN Same as above
31 U.S.C. 5330(e) Bank Secrecy Act, as amended
Civil Penalty for Failure to Register as Money Transmitting Business
1994 2016 $7,954 FinCEN Same as above
12 U.S.C. 93(b) Sec. 5239(b) of the Revised Statutes
Tier 1 Violation of Various Provisions of the National Bank Act
1978 2016 $9,468 OCC
Federal Register 81 (1 July 2016): 43021-
43028 www.occ.gov/news-issuances/federal-
register/81fr43021.pdf
12 U.S.C. 93(b) Sec. 5239(b) of the Revised Statutes
Tier 2 Violation of Various Provisions of the National Bank Act
1978 2016 $47,340 OCC Same as above
12 U.S.C. 93(b) Sec. 5239(b) of the Revised Statutes
Tier 3 Violation of Various Provisions of the National Bank Act
1978 2016 $1,893,610 OCC Same as above
12 U.S.C. 164 Sec. 5213 of the Revised Statutes
Tier 1 Violation of Reporting Requirements 1869(3) 2016 $3,787 OCC Same as above
12 U.S.C. 164 Sec. 5213 of the Revised Statutes
Tier 2 Violation of Reporting Requirements 1869(3) 2016 $37,872 OCC Same as above
12 U.S.C. 164 Sec. 5213 of the Revised Statutes
Tier 3 Violation of Reporting Requirements 1869(3) 2016 $1,893,610 OCC Same as above
12 U.S.C. 481 Sec. 5240 of the Revised Statues
Refusal of Affiliate to Cooperate in Examination (NB)
1864(3) 2016 $9,468 OCC Same as above
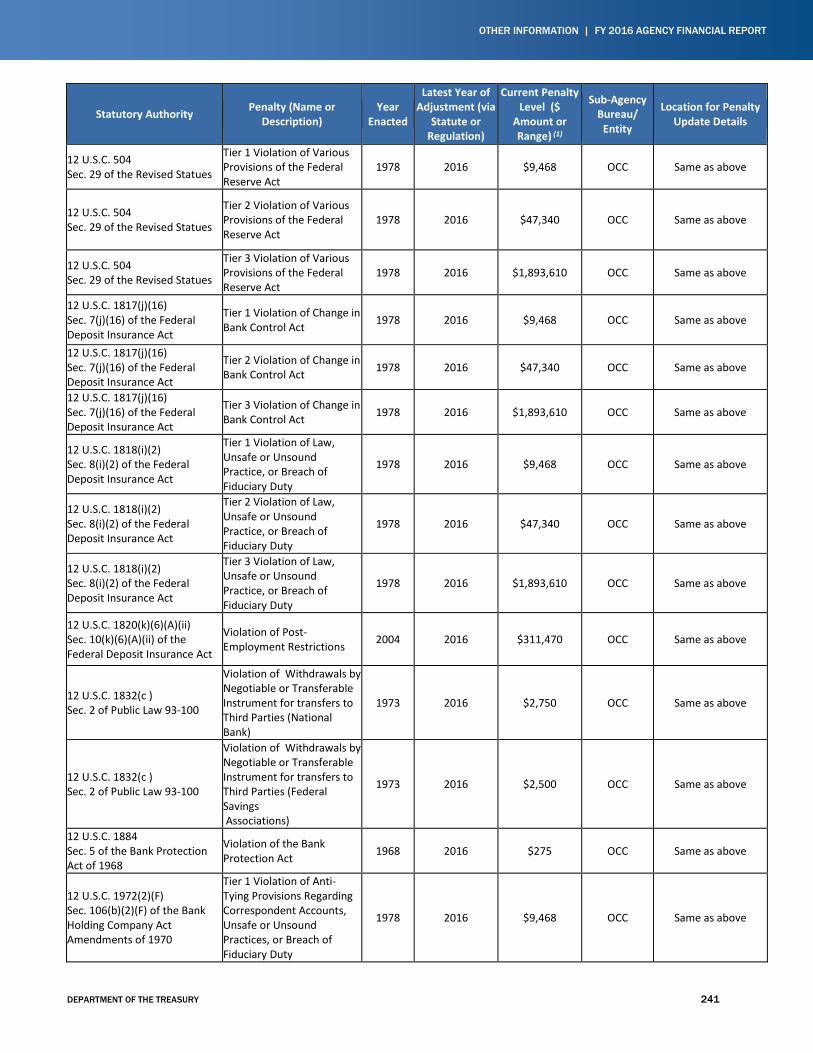
OTHER INFORMATION | FY 2016 AGENCY FINANCIAL REPORT
DEPARTMENT OF THE TREASURY 241
Statutory Authority Penalty (Name or Description)
Year Enacted
Latest Year of Adjustment (via
Statute or Regulation)
Current Penalty Level ($
Amount or Range) (1)
Sub-Agency Bureau/
Entity
Location for Penalty Update Details
12 U.S.C. 504 Sec. 29 of the Revised Statues
Tier 1 Violation of Various Provisions of the Federal Reserve Act
1978 2016 $9,468 OCC Same as above
12 U.S.C. 504 Sec. 29 of the Revised Statues
Tier 2 Violation of Various Provisions of the Federal Reserve Act
1978 2016 $47,340 OCC Same as above
12 U.S.C. 504 Sec. 29 of the Revised Statues
Tier 3 Violation of Various Provisions of the Federal Reserve Act
1978 2016 $1,893,610 OCC Same as above
12 U.S.C. 1817(j)(16) Sec. 7(j)(16) of the Federal Deposit Insurance Act
Tier 1 Violation of Change in Bank Control Act 1978 2016 $9,468 OCC Same as above
12 U.S.C. 1817(j)(16) Sec. 7(j)(16) of the Federal Deposit Insurance Act
Tier 2 Violation of Change in Bank Control Act 1978 2016 $47,340 OCC Same as above
12 U.S.C. 1817(j)(16) Sec. 7(j)(16) of the Federal Deposit Insurance Act
Tier 3 Violation of Change in Bank Control Act 1978 2016 $1,893,610 OCC Same as above
12 U.S.C. 1818(i)(2) Sec. 8(i)(2) of the Federal Deposit Insurance Act
Tier 1 Violation of Law, Unsafe or Unsound Practice, or Breach of Fiduciary Duty
1978 2016 $9,468 OCC Same as above
12 U.S.C. 1818(i)(2) Sec. 8(i)(2) of the Federal Deposit Insurance Act
Tier 2 Violation of Law, Unsafe or Unsound Practice, or Breach of Fiduciary Duty
1978 2016 $47,340 OCC Same as above
12 U.S.C. 1818(i)(2) Sec. 8(i)(2) of the Federal Deposit Insurance Act
Tier 3 Violation of Law, Unsafe or Unsound Practice, or Breach of Fiduciary Duty
1978 2016 $1,893,610 OCC Same as above
12 U.S.C. 1820(k)(6)(A)(ii) Sec. 10(k)(6)(A)(ii) of the Federal Deposit Insurance Act
Violation of Post-Employment Restrictions 2004 2016 $311,470 OCC Same as above
12 U.S.C. 1832(c ) Sec. 2 of Public Law 93-100
Violation of Withdrawals by Negotiable or Transferable Instrument for transfers to Third Parties (National Bank)
1973 2016 $2,750 OCC Same as above
12 U.S.C. 1832(c ) Sec. 2 of Public Law 93-100
Violation of Withdrawals by Negotiable or Transferable Instrument for transfers to Third Parties (Federal Savings Associations)
1973 2016 $2,500 OCC Same as above
12 U.S.C. 1884 Sec. 5 of the Bank Protection Act of 1968
Violation of the Bank Protection Act 1968 2016 $275 OCC Same as above
12 U.S.C. 1972(2)(F) Sec. 106(b)(2)(F) of the Bank Holding Company Act Amendments of 1970
Tier 1 Violation of Anti-Tying Provisions Regarding Correspondent Accounts, Unsafe or Unsound Practices, or Breach of Fiduciary Duty
1978 2016 $9,468 OCC Same as above
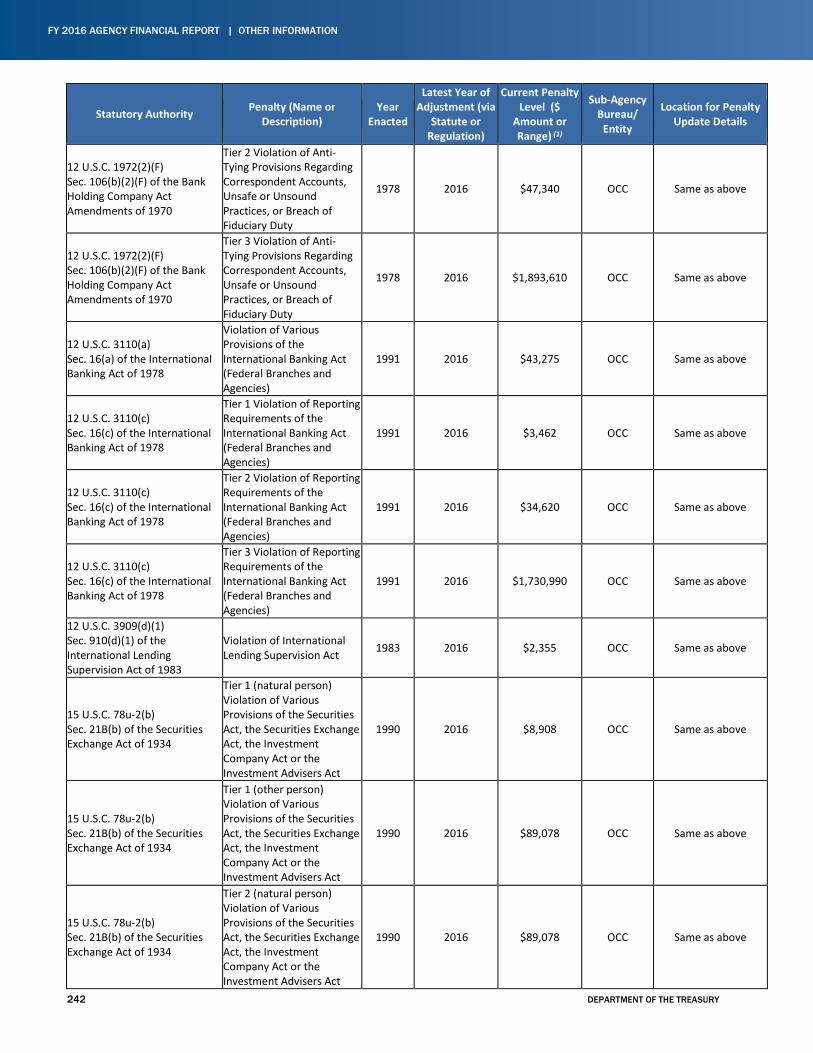
FY 2016 AGENCY FINANCIAL REPORT | OTHER INFORMATION
242 DEPARTMENT OF THE TREASURY
Statutory Authority Penalty (Name or Description)
Year Enacted
Latest Year of Adjustment (via
Statute or Regulation)
Current Penalty Level ($
Amount or Range) (1)
Sub-Agency Bureau/
Entity
Location for Penalty Update Details
12 U.S.C. 1972(2)(F) Sec. 106(b)(2)(F) of the Bank Holding Company Act Amendments of 1970
Tier 2 Violation of Anti-Tying Provisions Regarding Correspondent Accounts, Unsafe or Unsound Practices, or Breach of Fiduciary Duty
1978 2016 $47,340 OCC Same as above
12 U.S.C. 1972(2)(F) Sec. 106(b)(2)(F) of the Bank Holding Company Act Amendments of 1970
Tier 3 Violation of Anti-Tying Provisions Regarding Correspondent Accounts, Unsafe or Unsound Practices, or Breach of Fiduciary Duty
1978 2016 $1,893,610 OCC Same as above
12 U.S.C. 3110(a) Sec. 16(a) of the International Banking Act of 1978
Violation of Various Provisions of the International Banking Act (Federal Branches and Agencies)
1991 2016 $43,275 OCC Same as above
12 U.S.C. 3110(c) Sec. 16(c) of the International Banking Act of 1978
Tier 1 Violation of Reporting Requirements of the International Banking Act (Federal Branches and Agencies)
1991 2016 $3,462 OCC Same as above
12 U.S.C. 3110(c) Sec. 16(c) of the International Banking Act of 1978
Tier 2 Violation of Reporting Requirements of the International Banking Act (Federal Branches and Agencies)
1991 2016 $34,620 OCC Same as above
12 U.S.C. 3110(c) Sec. 16(c) of the International Banking Act of 1978
Tier 3 Violation of Reporting Requirements of the International Banking Act (Federal Branches and Agencies)
1991 2016 $1,730,990 OCC Same as above
12 U.S.C. 3909(d)(1) Sec. 910(d)(1) of the International Lending Supervision Act of 1983
Violation of International Lending Supervision Act 1983 2016 $2,355 OCC Same as above
15 U.S.C. 78u-2(b) Sec. 21B(b) of the Securities Exchange Act of 1934
Tier 1 (natural person) Violation of Various Provisions of the Securities Act, the Securities Exchange Act, the Investment Company Act or the Investment Advisers Act
1990 2016 $8,908 OCC Same as above
15 U.S.C. 78u-2(b) Sec. 21B(b) of the Securities Exchange Act of 1934
Tier 1 (other person) Violation of Various Provisions of the Securities Act, the Securities Exchange Act, the Investment Company Act or the Investment Advisers Act
1990 2016 $89,078 OCC Same as above
15 U.S.C. 78u-2(b) Sec. 21B(b) of the Securities Exchange Act of 1934
Tier 2 (natural person) Violation of Various Provisions of the Securities Act, the Securities Exchange Act, the Investment Company Act or the Investment Advisers Act
1990 2016 $89,078 OCC Same as above
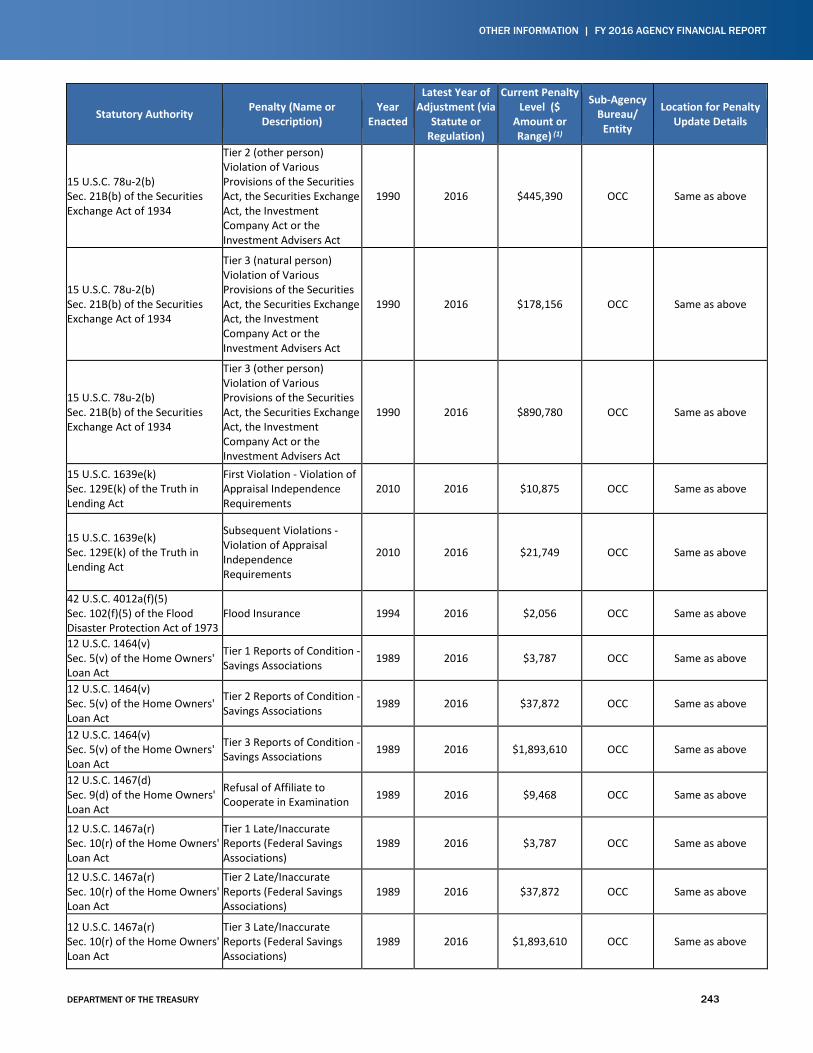
OTHER INFORMATION | FY 2016 AGENCY FINANCIAL REPORT
DEPARTMENT OF THE TREASURY 243
Statutory Authority Penalty (Name or Description)
Year Enacted
Latest Year of Adjustment (via
Statute or Regulation)
Current Penalty Level ($
Amount or Range) (1)
Sub-Agency Bureau/
Entity
Location for Penalty Update Details
15 U.S.C. 78u-2(b) Sec. 21B(b) of the Securities Exchange Act of 1934
Tier 2 (other person) Violation of Various Provisions of the Securities Act, the Securities Exchange Act, the Investment Company Act or the Investment Advisers Act
1990 2016 $445,390 OCC Same as above
15 U.S.C. 78u-2(b) Sec. 21B(b) of the Securities Exchange Act of 1934
Tier 3 (natural person) Violation of Various Provisions of the Securities Act, the Securities Exchange Act, the Investment Company Act or the Investment Advisers Act
1990 2016 $178,156 OCC Same as above
15 U.S.C. 78u-2(b) Sec. 21B(b) of the Securities Exchange Act of 1934
Tier 3 (other person) Violation of Various Provisions of the Securities Act, the Securities Exchange Act, the Investment Company Act or the Investment Advisers Act
1990 2016 $890,780 OCC Same as above
15 U.S.C. 1639e(k) Sec. 129E(k) of the Truth in Lending Act
First Violation - Violation of Appraisal Independence Requirements
2010 2016 $10,875 OCC Same as above
15 U.S.C. 1639e(k) Sec. 129E(k) of the Truth in Lending Act
Subsequent Violations - Violation of Appraisal Independence Requirements
2010 2016 $21,749 OCC Same as above
42 U.S.C. 4012a(f)(5) Sec. 102(f)(5) of the Flood Disaster Protection Act of 1973
Flood Insurance 1994 2016 $2,056 OCC Same as above
12 U.S.C. 1464(v) Sec. 5(v) of the Home Owners' Loan Act
Tier 1 Reports of Condition - Savings Associations 1989 2016 $3,787 OCC Same as above
12 U.S.C. 1464(v) Sec. 5(v) of the Home Owners' Loan Act
Tier 2 Reports of Condition - Savings Associations 1989 2016 $37,872 OCC Same as above
12 U.S.C. 1464(v) Sec. 5(v) of the Home Owners' Loan Act
Tier 3 Reports of Condition - Savings Associations 1989 2016 $1,893,610 OCC Same as above
12 U.S.C. 1467(d) Sec. 9(d) of the Home Owners' Loan Act
Refusal of Affiliate to Cooperate in Examination 1989 2016 $9,468 OCC Same as above
12 U.S.C. 1467a(r) Sec. 10(r) of the Home Owners' Loan Act
Tier 1 Late/Inaccurate Reports (Federal Savings Associations)
1989 2016 $3,787 OCC Same as above
12 U.S.C. 1467a(r) Sec. 10(r) of the Home Owners' Loan Act
Tier 2 Late/Inaccurate Reports (Federal Savings Associations)
1989 2016 $37,872 OCC Same as above
12 U.S.C. 1467a(r) Sec. 10(r) of the Home Owners' Loan Act
Tier 3 Late/Inaccurate Reports (Federal Savings Associations)
1989 2016 $1,893,610 OCC Same as above
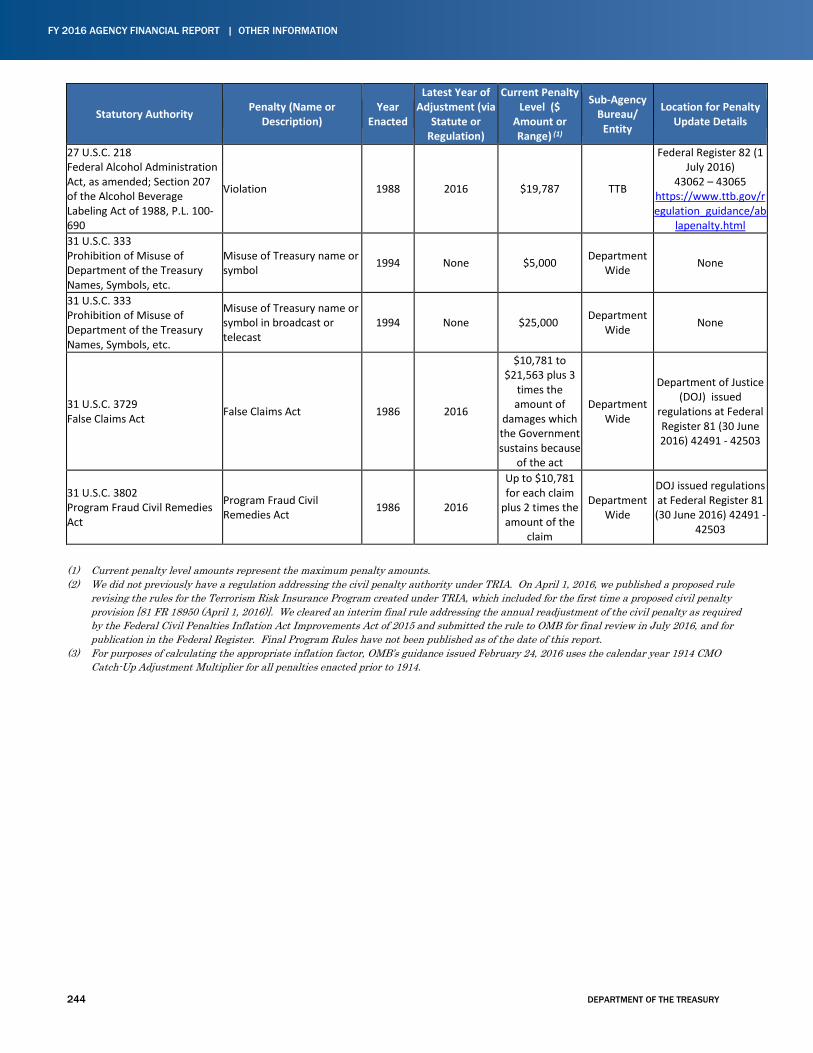
FY 2016 AGENCY FINANCIAL REPORT | OTHER INFORMATION
244 DEPARTMENT OF THE TREASURY
Statutory Authority Penalty (Name or Description)
Year Enacted
Latest Year of Adjustment (via
Statute or Regulation)
Current Penalty Level ($
Amount or Range) (1)
Sub-Agency Bureau/
Entity
Location for Penalty Update Details
27 U.S.C. 218 Federal Alcohol Administration Act, as amended; Section 207 of the Alcohol Beverage Labeling Act of 1988, P.L. 100-690
Violation 1988 2016 $19,787 TTB
Federal Register 82 (1 July 2016)
43062 – 43065 https://www.ttb.gov/regulation_guidance/ab
lapenalty.html 31 U.S.C. 333 Prohibition of Misuse of Department of the Treasury Names, Symbols, etc.
Misuse of Treasury name or symbol 1994 None $5,000 Department
Wide None
31 U.S.C. 333 Prohibition of Misuse of Department of the Treasury Names, Symbols, etc.
Misuse of Treasury name or symbol in broadcast or telecast
1994 None $25,000 Department Wide None
31 U.S.C. 3729 False Claims Act False Claims Act 1986 2016
$10,781 to $21,563 plus 3
times the amount of
damages which the Government sustains because
of the act
Department Wide
Department of Justice (DOJ) issued
regulations at Federal Register 81 (30 June 2016) 42491 - 42503
31 U.S.C. 3802 Program Fraud Civil Remedies Act
Program Fraud Civil Remedies Act 1986 2016
Up to $10,781 for each claim
plus 2 times the amount of the
claim
Department Wide
DOJ issued regulations at Federal Register 81 (30 June 2016) 42491 -
42503
(1) Current penalty level amounts represent the maximum penalty amounts. (2) We did not previously have a regulation addressing the civil penalty authority under TRIA. On April 1, 2016, we published a proposed rule
revising the rules for the Terrorism Risk Insurance Program created under TRIA, which included for the first time a proposed civil penalty provision [81 FR 18950 (April 1, 2016)]. We cleared an interim final rule addressing the annual readjustment of the civil penalty as required by the Federal Civil Penalties Inflation Act Improvements Act of 2015 and submitted the rule to OMB for final review in July 2016, and for publication in the Federal Register. Final Program Rules have not been published as of the date of this report.
(3) For purposes of calculating the appropriate inflation factor, OMB’s guidance issued February 24, 2016 uses the calendar year 1914 CMO Catch-Up Adjustment Multiplier for all penalties enacted prior to 1914.
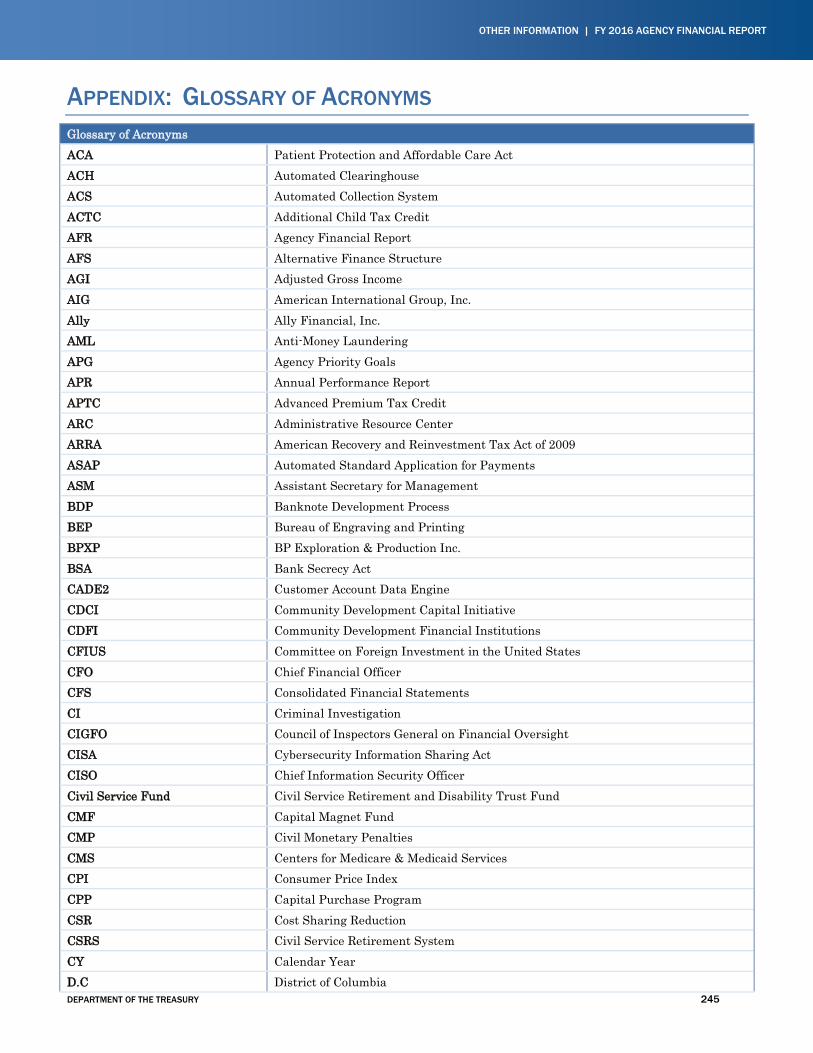
OTHER INFORMATION | FY 2016 AGENCY FINANCIAL REPORT
DEPARTMENT OF THE TREASURY 245
APPENDIX: GLOSSARY OF ACRONYMS Glossary of Acronyms ACA Patient Protection and Affordable Care Act ACH Automated Clearinghouse ACS Automated Collection System ACTC Additional Child Tax Credit AFR Agency Financial Report AFS Alternative Finance Structure AGI Adjusted Gross Income AIG American International Group, Inc. Ally Ally Financial, Inc. AML Anti-Money Laundering APG Agency Priority Goals APR Annual Performance Report APTC Advanced Premium Tax Credit ARC Administrative Resource Center ARRA American Recovery and Reinvestment Tax Act of 2009 ASAP Automated Standard Application for Payments ASM Assistant Secretary for Management BDP Banknote Development Process BEP Bureau of Engraving and Printing BPXP BP Exploration & Production Inc. BSA Bank Secrecy Act CADE2 Customer Account Data Engine CDCI Community Development Capital Initiative CDFI Community Development Financial Institutions CFIUS Committee on Foreign Investment in the United States CFO Chief Financial Officer CFS Consolidated Financial Statements CI Criminal Investigation CIGFO Council of Inspectors General on Financial Oversight CISA Cybersecurity Information Sharing Act CISO Chief Information Security Officer Civil Service Fund Civil Service Retirement and Disability Trust Fund CMF Capital Magnet Fund CMP Civil Monetary Penalties CMS Centers for Medicare & Medicaid Services CPI Consumer Price Index CPP Capital Purchase Program CSR Cost Sharing Reduction CSRS Civil Service Retirement System CY Calendar Year D.C District of Columbia
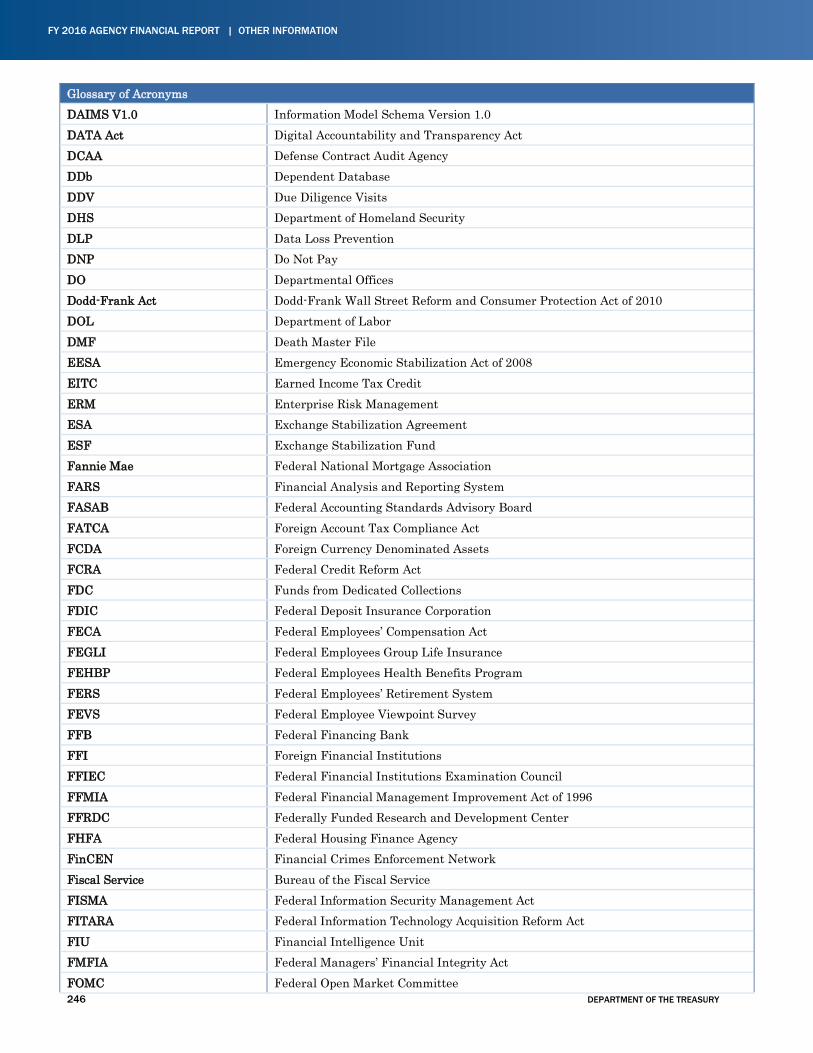
FY 2016 AGENCY FINANCIAL REPORT | OTHER INFORMATION
246 DEPARTMENT OF THE TREASURY
Glossary of Acronyms DAIMS V1.0 Information Model Schema Version 1.0 DATA Act Digital Accountability and Transparency Act DCAA Defense Contract Audit Agency DDb Dependent Database DDV Due Diligence Visits DHS Department of Homeland Security DLP Data Loss Prevention DNP Do Not Pay DO Departmental Offices Dodd-Frank Act Dodd-Frank Wall Street Reform and Consumer Protection Act of 2010 DOL Department of Labor DMF Death Master File EESA Emergency Economic Stabilization Act of 2008 EITC Earned Income Tax Credit ERM Enterprise Risk Management ESA Exchange Stabilization Agreement ESF Exchange Stabilization Fund Fannie Mae Federal National Mortgage Association FARS Financial Analysis and Reporting System FASAB Federal Accounting Standards Advisory Board FATCA Foreign Account Tax Compliance Act FCDA Foreign Currency Denominated Assets FCRA Federal Credit Reform Act FDC Funds from Dedicated Collections FDIC Federal Deposit Insurance Corporation FECA Federal Employees’ Compensation Act FEGLI Federal Employees Group Life Insurance FEHBP Federal Employees Health Benefits Program FERS Federal Employees’ Retirement System FEVS Federal Employee Viewpoint Survey FFB Federal Financing Bank FFI Foreign Financial Institutions FFIEC Federal Financial Institutions Examination Council FFMIA Federal Financial Management Improvement Act of 1996 FFRDC Federally Funded Research and Development Center FHFA Federal Housing Finance Agency FinCEN Financial Crimes Enforcement Network Fiscal Service Bureau of the Fiscal Service FISMA Federal Information Security Management Act FITARA Federal Information Technology Acquisition Reform Act FIU Financial Intelligence Unit FMFIA Federal Managers’ Financial Integrity Act FOMC Federal Open Market Committee
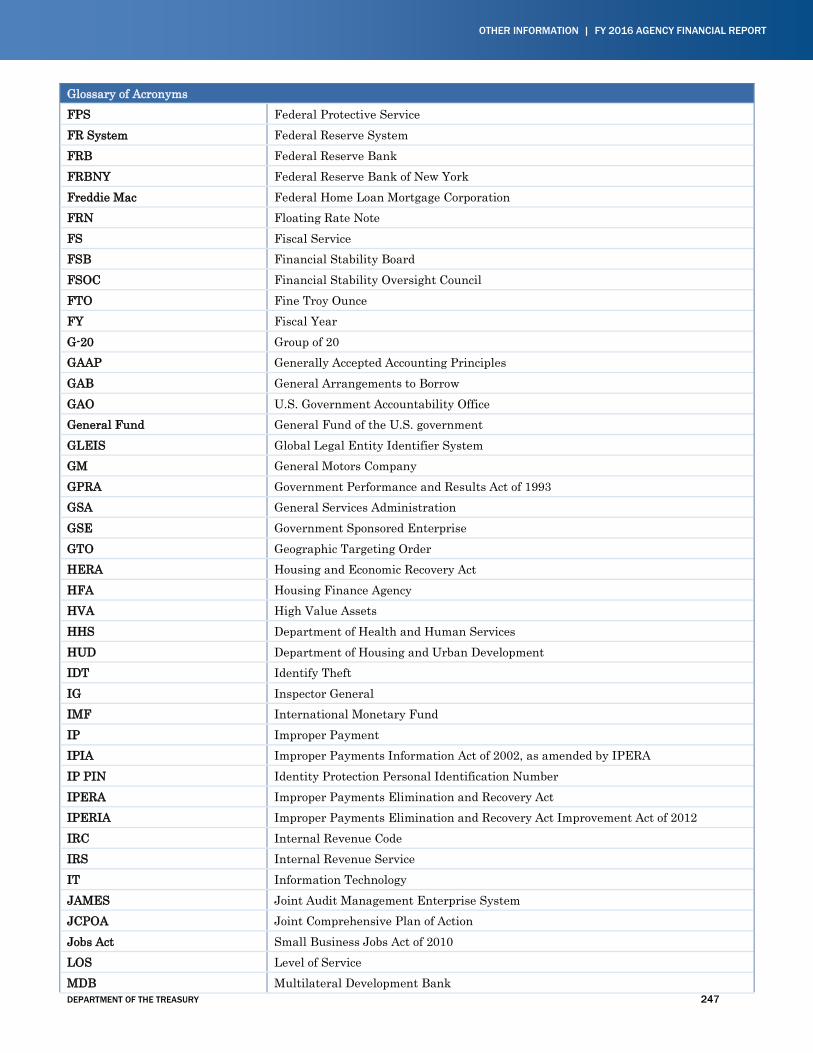
OTHER INFORMATION | FY 2016 AGENCY FINANCIAL REPORT
DEPARTMENT OF THE TREASURY 247
Glossary of Acronyms FPS Federal Protective Service FR System Federal Reserve System FRB Federal Reserve Bank FRBNY Federal Reserve Bank of New York Freddie Mac Federal Home Loan Mortgage Corporation FRN Floating Rate Note FS Fiscal Service FSB Financial Stability Board FSOC Financial Stability Oversight Council FTO Fine Troy Ounce FY Fiscal Year G-20 Group of 20 GAAP Generally Accepted Accounting Principles GAB General Arrangements to Borrow GAO U.S. Government Accountability Office General Fund General Fund of the U.S. government GLEIS Global Legal Entity Identifier System GM General Motors Company GPRA Government Performance and Results Act of 1993 GSA General Services Administration GSE Government Sponsored Enterprise GTO Geographic Targeting Order HERA Housing and Economic Recovery Act HFA Housing Finance Agency HVA High Value Assets HHS Department of Health and Human Services HUD Department of Housing and Urban Development IDT Identify Theft IG Inspector General IMF International Monetary Fund IP Improper Payment IPIA Improper Payments Information Act of 2002, as amended by IPERA IP PIN Identity Protection Personal Identification Number IPERA Improper Payments Elimination and Recovery Act IPERIA Improper Payments Elimination and Recovery Act Improvement Act of 2012 IRC Internal Revenue Code IRS Internal Revenue Service IT Information Technology JAMES Joint Audit Management Enterprise System JCPOA Joint Comprehensive Plan of Action Jobs Act Small Business Jobs Act of 2010 LOS Level of Service MDB Multilateral Development Bank
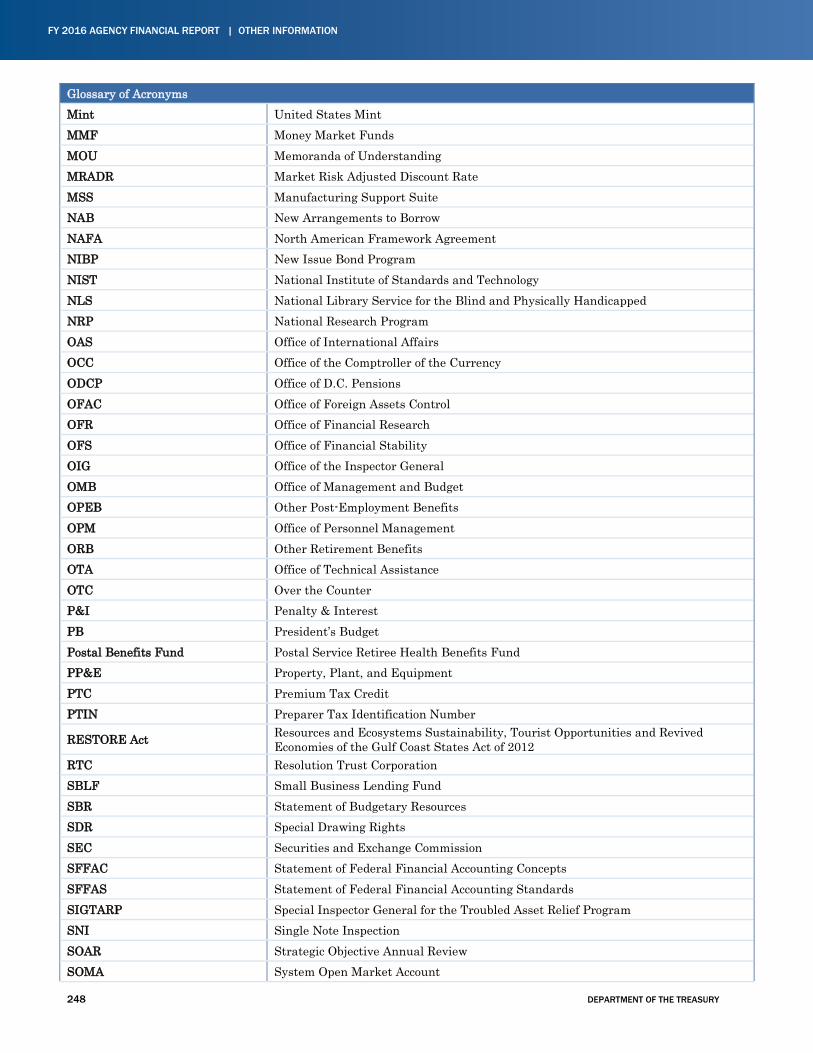
FY 2016 AGENCY FINANCIAL REPORT | OTHER INFORMATION
248 DEPARTMENT OF THE TREASURY
Glossary of Acronyms Mint United States Mint MMF Money Market Funds MOU Memoranda of Understanding MRADR Market Risk Adjusted Discount Rate MSS Manufacturing Support Suite NAB New Arrangements to Borrow NAFA North American Framework Agreement NIBP New Issue Bond Program NIST National Institute of Standards and Technology NLS National Library Service for the Blind and Physically Handicapped NRP National Research Program OAS Office of International Affairs OCC Office of the Comptroller of the Currency ODCP Office of D.C. Pensions OFAC Office of Foreign Assets Control OFR Office of Financial Research OFS Office of Financial Stability OIG Office of the Inspector General OMB Office of Management and Budget OPEB Other Post-Employment Benefits OPM Office of Personnel Management ORB Other Retirement Benefits OTA Office of Technical Assistance OTC Over the Counter P&I Penalty & Interest PB President’s Budget Postal Benefits Fund Postal Service Retiree Health Benefits Fund PP&E Property, Plant, and Equipment PTC Premium Tax Credit PTIN Preparer Tax Identification Number
RESTORE Act Resources and Ecosystems Sustainability, Tourist Opportunities and Revived Economies of the Gulf Coast States Act of 2012
RTC Resolution Trust Corporation SBLF Small Business Lending Fund SBR Statement of Budgetary Resources SDR Special Drawing Rights SEC Securities and Exchange Commission SFFAC Statement of Federal Financial Accounting Concepts SFFAS Statement of Federal Financial Accounting Standards SIGTARP Special Inspector General for the Troubled Asset Relief Program SNI Single Note Inspection SOAR Strategic Objective Annual Review SOMA System Open Market Account
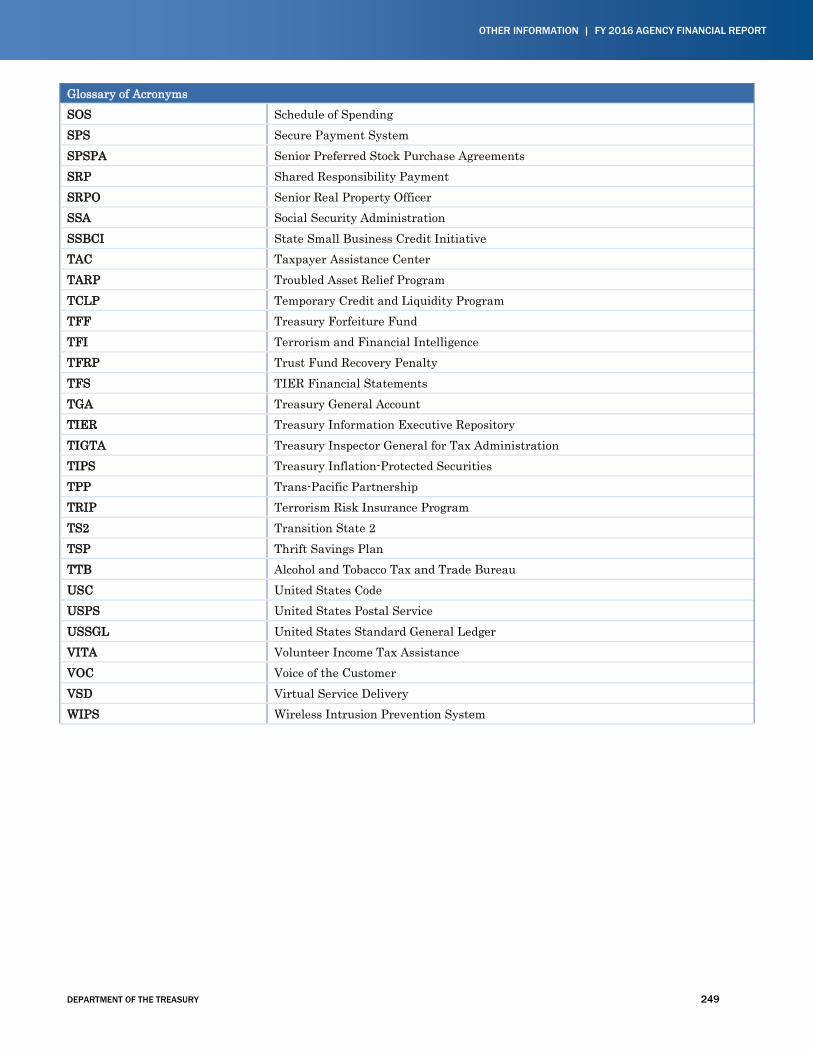
OTHER INFORMATION | FY 2016 AGENCY FINANCIAL REPORT
DEPARTMENT OF THE TREASURY 249
Glossary of Acronyms SOS Schedule of Spending SPS Secure Payment System SPSPA Senior Preferred Stock Purchase Agreements SRP Shared Responsibility Payment SRPO Senior Real Property Officer SSA Social Security Administration SSBCI State Small Business Credit Initiative TAC Taxpayer Assistance Center TARP Troubled Asset Relief Program TCLP Temporary Credit and Liquidity Program TFF Treasury Forfeiture Fund TFI Terrorism and Financial Intelligence TFRP Trust Fund Recovery Penalty TFS TIER Financial Statements TGA Treasury General Account TIER Treasury Information Executive Repository TIGTA Treasury Inspector General for Tax Administration TIPS Treasury Inflation-Protected Securities TPP Trans-Pacific Partnership TRIP Terrorism Risk Insurance Program TS2 Transition State 2 TSP Thrift Savings Plan TTB Alcohol and Tobacco Tax and Trade Bureau USC United States Code USPS United States Postal Service USSGL United States Standard General Ledger VITA Volunteer Income Tax Assistance VOC Voice of the Customer VSD Virtual Service Delivery WIPS Wireless Intrusion Prevention System

[Page intentionally left blank]
WEBSITE INFORMATION Treasury .......................................................................................................................................................................................... www.treasury.gov Alcohol and Tobacco Tax and Trade Bureau ............................................................................................................................. www.ttb.gov Bureau of Engraving & Printing ..................................................................................................................................................... www.bep.gov Fiscal Service..................................................................................................................................................................... www.fiscal.treasury.gov Community Development Financial Institutions Fund .............................................................................................. www.cdfifund.gov Financial Crimes Enforcement Network ............................................................................................................................... www.fincen.gov Internal Revenue Service .................................................................................................................................................................... www.irs.gov Office of the Comptroller of the Currency ...................................................................................................................................www.occ.gov U.S. Mint ............................................................................................................................................................................................. www.usmint.gov The Financial Stability Plan .................................................................................................................................. www.financialstability.gov Making Home Affordable Program ...................................................................................................... www.makinghomeaffordable.gov The Recovery Act ....................................................................................................................................................................... www.recovery.gov Office of Inspector General ............................................................................................................................................ www.treasury.gov/oig Treasury Inspector General for Tax Administration........................................................................................................... www.tigta.gov Special Inspector General for the Troubled Asset Relief Program .......................................................................... www.sigtarp.gov
CONNECT WITH US
Twitter www.twitter.com/ustreasury
Flickr www.flickr.com/photos/ustreasury
Facebook www.facebook.com/ustreasury
Youtube www.youtube.com/ustreasgov

Related Documents