www.trcsolutions.com Q1 Fiscal 2017 Investor Review Nov. 3, 2016 Chris Vincze Tom Bennet Chairman & CEO Chief Financial Officer TRR

Welcome message from author
This document is posted to help you gain knowledge. Please leave a comment to let me know what you think about it! Share it to your friends and learn new things together.
Transcript

www.trcsolutions.com
Q1 Fiscal 2017 Investor Review
Nov. 3, 2016Chris Vincze Tom BennetChairman & CEO Chief Financial Officer
T R R

Safe Harbor Statement
2
Certain statements in this presentation may be forward-looking statements within the meaning of Section 27A of the Securities Act of
1933 and Section 21E of the Securities Exchange Act of 1934. You can identify these statements by forward-looking words such as
"may," "expects," "plans," "anticipates," "believes," "estimates," or other words of similar import. You should consider statements that
contain these words carefully because they discuss TRC’s future expectations, contain projections of the Company’s future results of
operations or of its financial condition, or state other "forward-looking" information. TRC believes that it is important to communicate
its future expectations to its investors. However, there may be events in the future that the Company is not able to accurately predict
or control and that may cause its actual results to differ materially from the expectations described in its forward-looking statements.
Investors are cautioned that all forward-looking statements involve risks and uncertainties, and actual results may differ materially
from those discussed as a result of various factors, including, but not limited to, circumstances which could create large cash outflows,
such as contract losses, litigation, uncollectible receivables and income tax assessments; regulatory uncertainty; the availability of
funding for government projects; the level of demand for TRC’s services; product acceptance; industry-wide competitive factors; the
ability to continue to attract and retain highly skilled and qualified personnel; the availability and adequacy of insurance; capital
availability and project investment by our clients; and general political or economic conditions. Furthermore, market trends are subject
to changes which could adversely affect future results. See the risk factors and additional discussion in TRC’s Annual Report on Form
10-K for the fiscal year ended June 30, 2016, Quarterly Reports on Form 10-Q, and other factors detailed from time to time in the
Company’s other filings with the Securities and Exchange Commission.
These slides are intended as a visual aid to TRC’s commentary on the First Quarter Fiscal Year 2017 Financial Results Conference Call.
As such they should be considered in the full context of that commentary, the transcript of that conference call and TRC’s first quarter
Form 10-Q and financial results press release. Also, this presentation contains references to non-GAAP metrics such as EBITDA, gross
margin, free cash flow and various adjusted metrics. A reconciliation of GAAP to non-GAAP metrics can be found on slides 13-18.

Q1 Fiscal 2017 Overview
3
NSR1 increased 24% YOY to $124.3MPower +8%, Environmental -5%, Infrastructure +23%, Oil & Gas NSR of $21.3M
NSR backlog increased 10% YOY to $352MPower -2%, Environmental +2%, Infrastructure -3%, Oil & Gas backlog of $35M
(1) TRC believes net service revenue (gross revenue less subcontractor costs and other direct reimbursable charges) best reflects the value of services provided to its customers and is the most meaningful indicator of its revenue performance.
(2) Interest expense increase of $0.8M, less interest income increase of $0.3M.
Net income decreased 19% YOY to $3.6MAmortization expense increased $1.9M and net interest expense2 increased $0.5M
EBITDA increased 5% YOY to $10.5MAdjusted EBITDA declined 3% YOY
Operating cash flow of $(3.2)MCash used to support sequential revenue growth; six-day YOY DSO improvement

Envi
ronm
enta
l Seg
men
t
4
$51.6 $48.9
Q1 2016 Q1 2017
Net Service Revenue (in millions)
$10.0 $9.1
Q1 2016 Q1 2017
Segment Profit (in millions)
-5% -9%
NSR -5% YOY; primarily due to decrease in services to oil & gas clients
Segment profit -9% YOY
NSR backlog +2% YOY
Low oil & gas prices and challenging market conditions led to constrained capital spending
In addition to Power and Real Estate, state and municipal markets providing growth opportunities
Q1 Fiscal 2017 Results

Pow
er S
egm
ent
5
$34.3 $37.1
Q1 2016 Q1 2017
Net Service Revenue (in millions)
$7.3 $8.0
Q1 2016 Q1 2017
Segment Profit (in millions)
+9%+8%
NSR +8% YOY; driven by several large capital projects
Segment profit +9% YOY
NSR backlog -2% YOY
Growth in volume of significant EPC and program management opportunities
Continued demand for energy efficiency, testing and commissioning and distribution engineering services driving growth
Q1 Fiscal 2017 Results
Infr
astr
uctu
re S
egm
ent
6
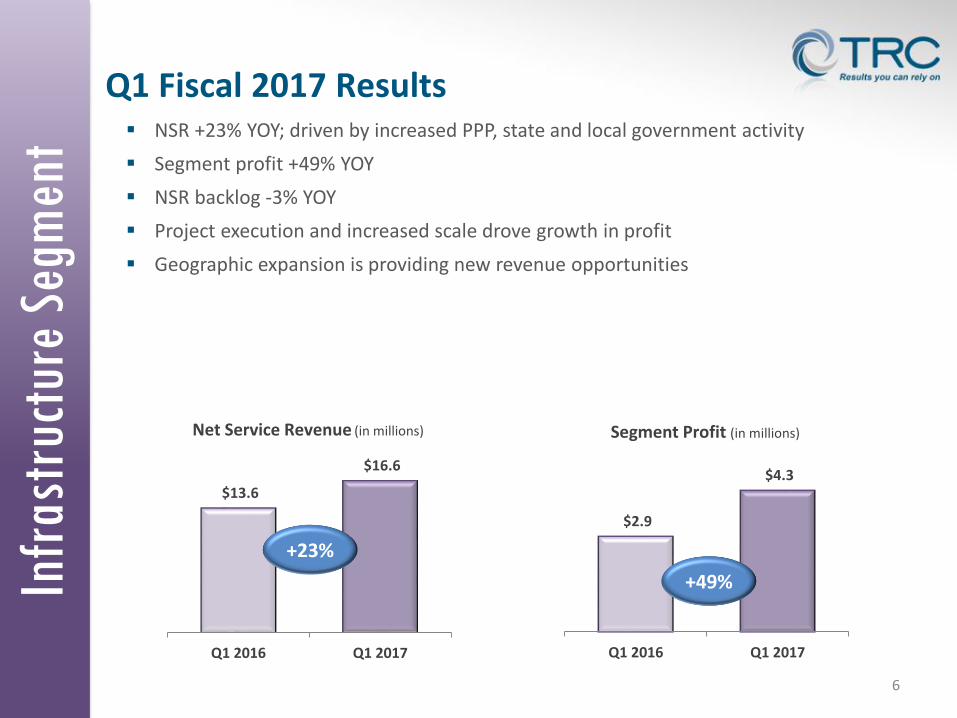
$13.6
$16.6
Q1 2016 Q1 2017
Net Service Revenue (in millions)
$2.9
$4.3
Q1 2016 Q1 2017
Segment Profit (in millions)
+23%
+49%
NSR +23% YOY; driven by increased PPP, state and local government activity
Segment profit +49% YOY
NSR backlog -3% YOY
Project execution and increased scale drove growth in profit
Geographic expansion is providing new revenue opportunities
Q1 Fiscal 2017 Results

Oil
& G
as S
egm
ent
7
NSR $21.3 million; continued uncertainty in oil and gas markets
Segment profit $1.4 million
NSR backlog $35 million
Integration activities are complete; focused on revenue synergies and sales
Segment profit driven by cost reduction initiatives
Integrity and technology-driven solutions seeing increased activity
$21.5 $20.8 $21.3
Q3 2016 Q4 2016 Q1 2017
Net Service Revenue (in millions)
Q1 Fiscal 2017 Results
$(3.1) $(3.2)
$1.4
Segment Profit (in millions)
Q1 2017Q3 2016 Q4 2016

$91 $91 $88
$98 $87 $96
$130 $141 $133
$48 $35
Q1 2016 Q4 2016 Q1 2017
Segment NSR Backlog
$352
NSR Backlog & New Project Wins
8
(in millions)
$319
$367
Power• Confidential Utility Client – $1.8M for transmission line
relocation• San Diego Association of Governments – $1.8M energy
engineering services to the cities in San Diego County
Environmental• LADWP – $14.6M for coal-plant decommissioning• US EPA – $11.5M 5-year contract to study effects of gas
and aerosol air pollutants on human health
Infrastructure
• Wellsburg Bridge Public-Private Partnership – $4.6M for sub-consulting
• Tennessee DOT – $2.5M for construction engineering and inspection services for various projects
Oil & Gas
• Confidential Client – $4.7M pipeline project in WV• Cascade Natural Gas – $2.0M TVC feature assessment
study
Recent Project Awards
Key Strategies and Market Outlook
9
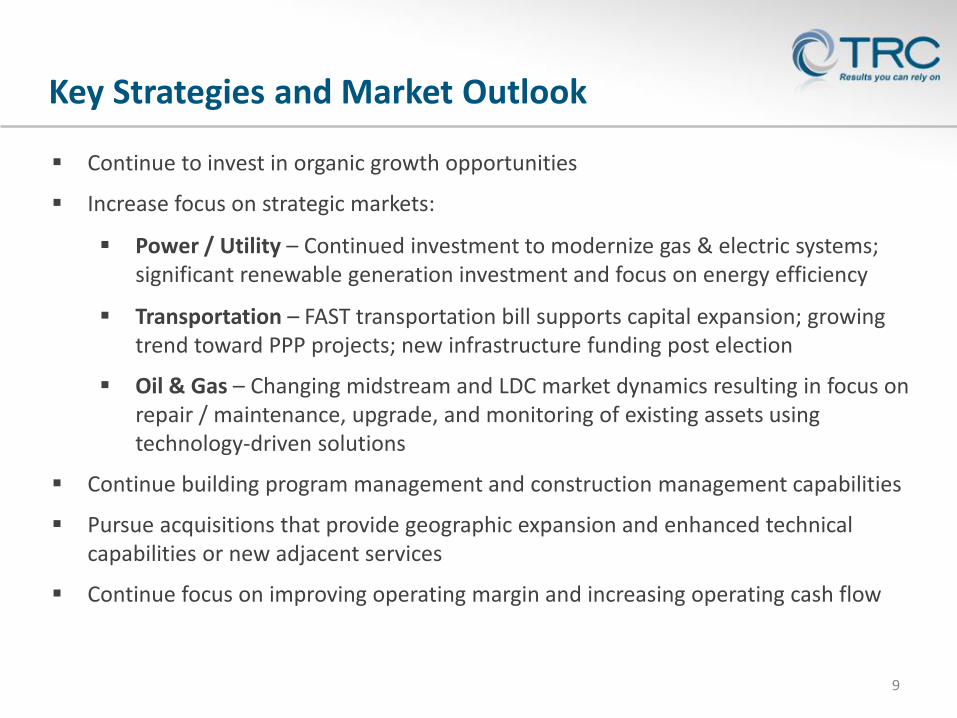
Continue to invest in organic growth opportunities
Increase focus on strategic markets:
Power / Utility – Continued investment to modernize gas & electric systems; significant renewable generation investment and focus on energy efficiency
Transportation – FAST transportation bill supports capital expansion; growing trend toward PPP projects; new infrastructure funding post election
Oil & Gas – Changing midstream and LDC market dynamics resulting in focus on repair / maintenance, upgrade, and monitoring of existing assets using technology-driven solutions
Continue building program management and construction management capabilities
Pursue acquisitions that provide geographic expansion and enhanced technical capabilities or new adjacent services
Continue focus on improving operating margin and increasing operating cash flow

$9.9 $10.5
Q1 2016 Q1 2017
EBITDA (in millions)
Quarterly Financial Results Overview
10
$100.2
$124.3
Q1 2016 Q1 2017
Net Service Revenue (in millions)
+24%
$10.8 $10.5
Q1 2016 Q1 2017
Adjusted EBITDA* (in millions)
-3%
*Excludes acquisition and integration expenses of $0.9 million for the three months ended September 25, 2015.
+5%
$4.5
$3.6
Q1 2016 Q1 2017
Net Income (in millions)
-19%

Q1 2016
$100.2
$0.7
$83.0
17.2%
$7.1
7.1%
$0.9
$7.7
$8.6
$9.9
9.9%
$10.8
10.8%
$4.5
$5.0
$0.14
$0.16
Q1 2017
$124.3
$0.6
$103.7
16.6%
$10.8
8.7%
--
$6.0
$6.0
$10.5
8.4%
$10.5
8.4%
$3.6
$3.6
$0.12
$0.12
11
(In millions, except per share data)
Quarterly Income Statement Highlights
82.8% 83.4%
Q1 2016 Q1 2017
Cost of Services as % of NSR
7.1%
8.7%
Q1 2016 Q1 2017
G&A Expenses as % of NSR
Net service revenue
Insurance recoverables and other income
Cost of services (COS)
Gross margin %
General and administrative expenses
G&A as % of NSR
Acquisition and integration expenses
Operating income
Adjusted operating income1
EBITDA
EBITDA as a % of NSR
Adjusted EBITDA1
Adjusted EBITDA as a % of NSR
Net income
Adjusted net income1, 2
Diluted earnings per common share
Adjusted diluted earnings per common share1, 2
1 Excludes acquisition and integration expenses of $0.9 million for the three months ended September 25, 2015. 2 Excludes acquisition-related expense in note 1, net of an income tax benefit of $0.4 million.

12
(In millions)
Balance Sheet and Cash Flow Highlights
Balance Sheet Highlights
Cash and cash equivalents
Days sales outstanding (DSO)
Acquisition-related debt repayment
Acquisition-related debt balance
Cash Flow Highlights
Cash flow from operations
Capital expenditures
Free cash flow
Q1 2016
$53.1
90
--
--
$14.3
$(2.0)
$12.3
Q1 2017
$12.7
84
$1.4
$69.7
$(3.2)
$(1.6)
$(4.8)
Operating Cash Flow Items
EBITDA
Sequential Gross
Revenue
Payroll Timing
Q1 2016
$9.9
$(13.6)
-
Q1 2017
$10.5
$11.3
$(12.2)
13
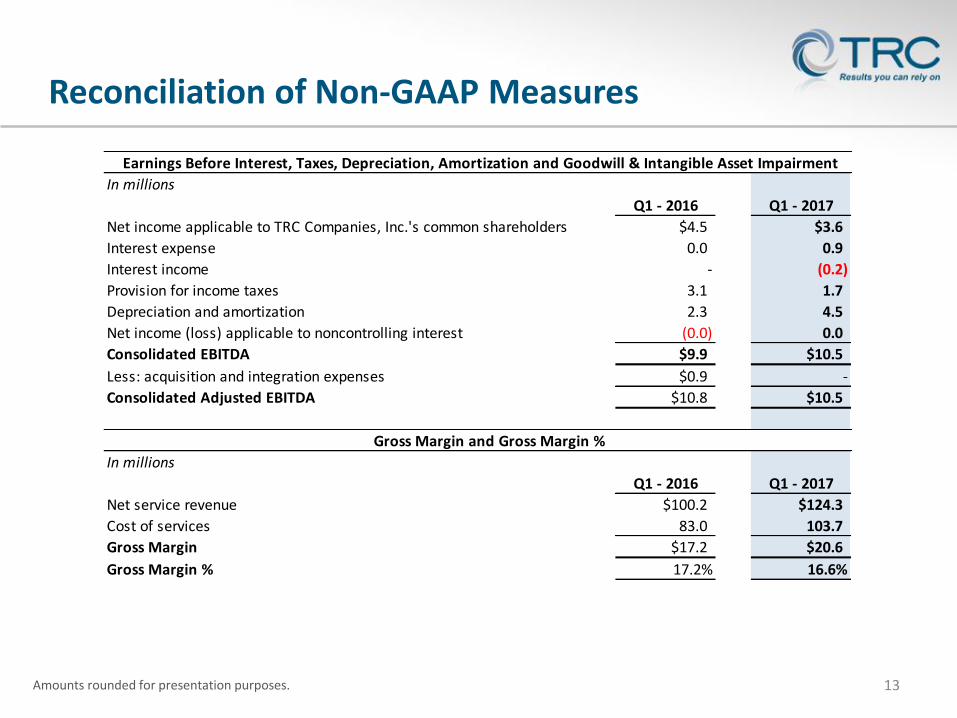
Earnings Before Interest, Taxes, Depreciation, Amortization and Goodwill & Intangible Asset Impairment
In millions
Q1 - 2016 Q1 - 2017
Net income applicable to TRC Companies, Inc.'s common shareholders $4.5 $3.6
Interest expense 0.0 0.9
Interest income - (0.2)
Provision for income taxes 3.1 1.7
Depreciation and amortization 2.3 4.5
Net income (loss) applicable to noncontrolling interest (0.0) 0.0
Consolidated EBITDA $9.9 $10.5
Less: acquisition and integration expenses $0.9 -
Consolidated Adjusted EBITDA $10.8 $10.5
In millions
Q1 - 2016 Q1 - 2017
Net service revenue $100.2 $124.3
Cost of services 83.0 103.7
Gross Margin $17.2 $20.6
Gross Margin % 17.2% 16.6%
Gross Margin and Gross Margin %
Reconciliation of Non-GAAP Measures
Amounts rounded for presentation purposes.

14
In millions
Q1 - 2016 Q1 - 2017
Net cash provided by operating activities $14.3 $(3.2)
Additions to property and equipment (2.0) (1.6)
Free Cash Flow $12.3 $(4.8)
Free Cash Flow
Reconciliation of Non-GAAP Measures
Amounts rounded for presentation purposes.
15
In millions
Q1 - 2016 Q1 - 2017
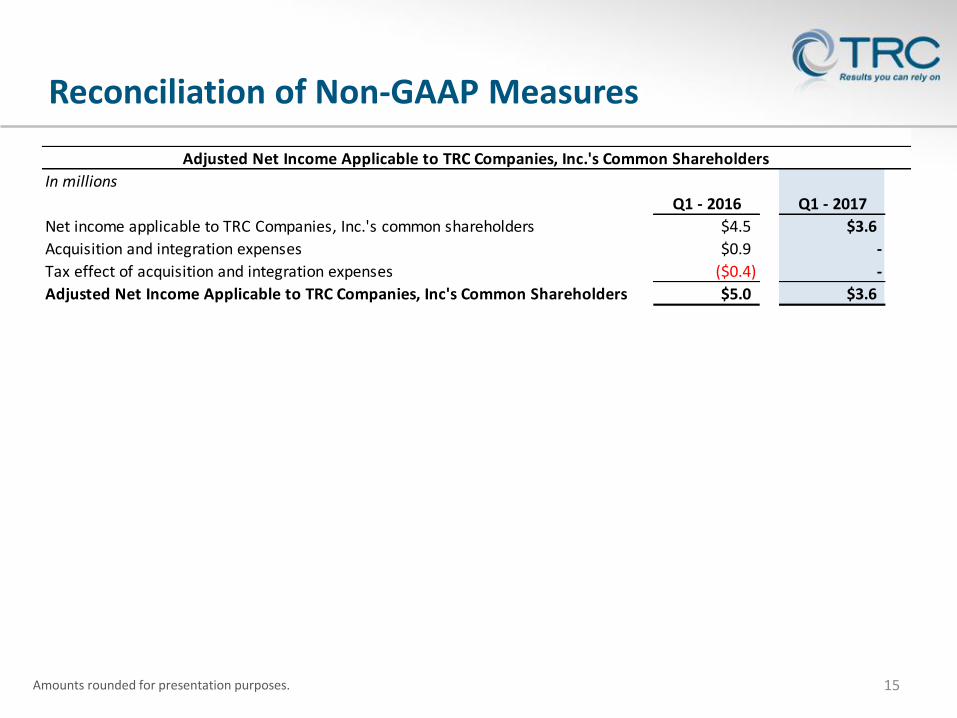
Net income applicable to TRC Companies, Inc.'s common shareholders $4.5 $3.6
Acquisition and integration expenses $0.9 -
Tax effect of acquisition and integration expenses ($0.4) -
Adjusted Net Income Applicable to TRC Companies, Inc's Common Shareholders $5.0 $3.6
Adjusted Net Income Applicable to TRC Companies, Inc.'s Common Shareholders
Reconciliation of Non-GAAP Measures
Amounts rounded for presentation purposes.

16
In millions
Q1 2016 Q1 2017
Operating income $7.7 $6.0
Acquisition and integration expenses $0.9 -
Adjusted operating income $8.6 $6.0
In millions
Q1 2016 Q1 2017
Net income applicable to TRC Companies, Inc.'s common shareholders $4.5 $3.6
Acquisition and integration expenses $0.9 -
Tax effect of acquisition and integration expenses ($0.4) -
Adjusted net income applicable to TRC Companies, Inc's common shareholders $5.0 $3.6
Diluted shares outstanding (as disclosed) 31.3 31.6
Adjusted diluted earnings per common share $0.16 $0.12
Adjusted Diluted Earnings per Common Share
Adjusted Operating Income
Reconciliation of Non-GAAP Measures
Amounts rounded for presentation purposes.
17
Earnings Before Interest, Taxes, Depreciation, Amortization (EBITDA)The Company presents EBITDA because it believes that it is a useful tool for the Company, its lenders and its investors to measure the Company’s ability to meet debt service, capital expenditure and working capital requirements. As used in the presentation, EBITDA is operating income plus depreciation and amortization.
Adjusted Earnings Before Interest, Taxes, Depreciation, Amortization (Adjusted EBITDA)As used in the presentation, Adjusted EBITDA is defined as EBITDA plus acquisition and integration expenses.
Gross Margin and Gross Margin %The Company presents Gross Margin and Gross Margin % to allow investors to better evaluate short-term and long-term profitability trends. The definition of Gross Margin is equal to Net Service Revenue less Cost of Services. Gross Margin % is equal to Gross Margin Divided by Net Service Revenue.
Free Cash FlowThe Company presents Free Cash Flow, and ratios based on it, to conduct and evaluate its business because, although it is similar to cash flow from operations, the Company believes it is a useful measure of cash flows since purchases of fixed assets are a necessary component of ongoing operations. The definition of Free Cash Flow is equal to net cash provided by (used in) operating activities plus additions to property and equipment.
Definitions for Non-GAAP Measures
18
Adjusted Operating IncomeThe Company presents Adjusted Operating Income because it believes that it is a useful tool for the Company, its lenders and its investors to measure the Company’s underlying operating performance. As used in the presentation, Adjusted Operating Income is defined as operating income plus acquisition and integration expenses.
Adjusted Net IncomeThe Company presents Adjusted Net Income because it believes that it is a useful tool for the Company, its lenders and its investors to measure the Company’s financial performance. As used in the presentation, Adjusted Net Income is defined as net income applicable to TRC Companies, Inc. plus the tax effected acquisition and integration expenses. The Company utilizes its effective tax rate for the period in calculating the tax effect.
Adjusted Diluted Earnings Per Share (Adjusted Diluted EPS)The Company presents Adjusted Diluted EPS because it believes that it is a useful tool for the Company, its lenders and its investors to measure the Company’s financial performance. As used in the presentation, Adjusted Diluted EPS is defined as Adjusted Net Income divided by diluted weighted average shares outstanding.
Definitions for Non-GAAP Measures
Related Documents