TRANSPLEX 2007 Freight Demand and Planning in Florida July 12, 2007

TRANSPLEX 2007 Freight Demand and Planning in Florida July 12, 2007.
Dec 11, 2015
Welcome message from author
This document is posted to help you gain knowledge. Please leave a comment to let me know what you think about it! Share it to your friends and learn new things together.
Transcript
TRANSPLEX 2007Freight Demand and Planning
in FloridaJuly 12, 2007
TRANSPLEX 2007Freight Demand and Planning
in FloridaJuly 12, 2007
22
Overview
Global Transportation Environment
CSX Network Strategy
Public Private Partnerships
33
Global Supply Chain – Key Drivers for Change
Constrained Infrastructure and Capacity
Evolving Security Requirements
Environmental Issues
Increasing Complexity
44
Constrained Capacity
Capacity is constrained globally Highway capacity has not kept pace with
transportation demand West coast ports experience congestion Rail ton miles have increased while the rail
network has shrunk Existing and anticipated choke points present
significant opportunities for rail growth
55
Heightened Security Concerns
Security focus on transportation is increasing New security measures could require significant
capital investments New guidelines for security of TIH rail shipments Recent federal government appropriations
included $1.2 billion for rail security
66
Environmental Focus on Transportation
New air emissions regulations target rail and ports New emissions controls can increase fuel costs NIMBY concerns with capacity expansions …But, rail has significant advantages in fuel
efficiency and environmental impact
77
Capacity and Demand Legacy rail system built for Northeast
manufacturing and population base Increasing imports and population shifts drive rail
growth along different corridors Highway congestion and trucking challenges
heighten need for rail Capacity constraints require new infrastructure
investment to keep pace AASHTO report highlights need for increased rail
capacity
88
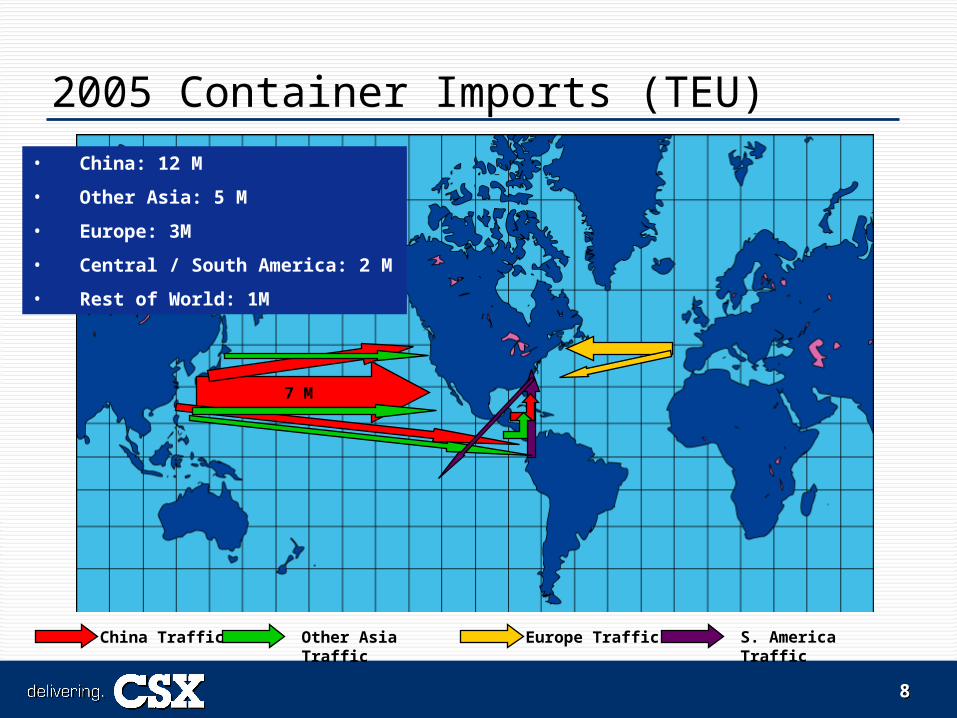
2005 Container Imports (TEU)
7 M
Europe TrafficChina Traffic Other Asia Traffic S. America Traffic
• China: 12 M
• Other Asia: 5 M
• Europe: 3M
• Central / South America: 2 M
• Rest of World: 1M
99
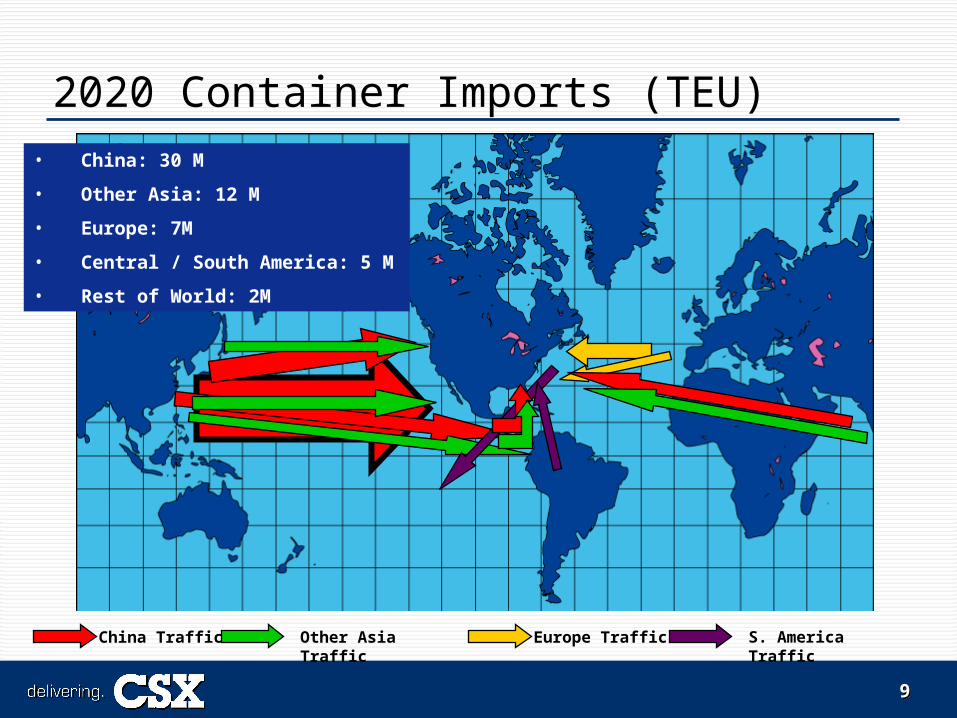
2020 Container Imports (TEU)
7 M
Europe TrafficChina Traffic Other Asia Traffic S. America Traffic
• China: 30 M
• Other Asia: 12 M
• Europe: 7M
• Central / South America: 5 M
• Rest of World: 2M
1010
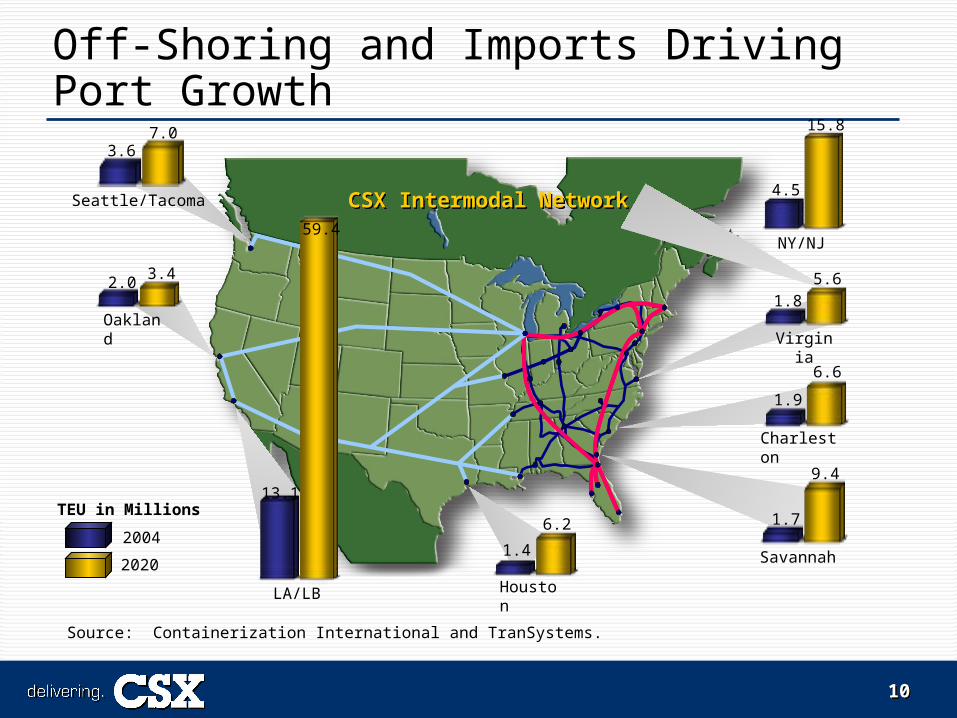
Off-Shoring and Imports Driving Port Growth
4.5
15.8
NY/NJ
1.85.6
Virginia
1.9
6.6
Charleston
1.7
9.4
Savannah1.4
6.2
Houston
TEU in Millions
2020
2004
Source: Containerization International and TranSystems.
CSX Intermodal NetworkCSX Intermodal Network
13.1
LA/LB
59.4
3.67.0
Seattle/Tacoma
2.0 3.4
Oakland
1111
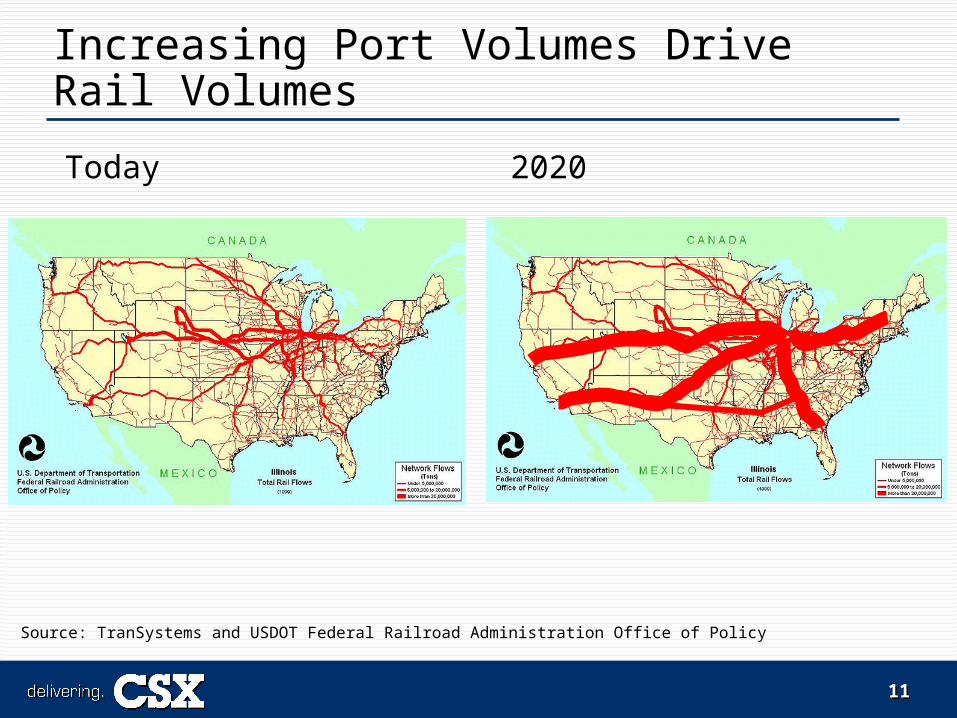
Increasing Port Volumes Drive Rail Volumes
Today 2020
Source: TranSystems and USDOT Federal Railroad Administration Office of Policy
1212
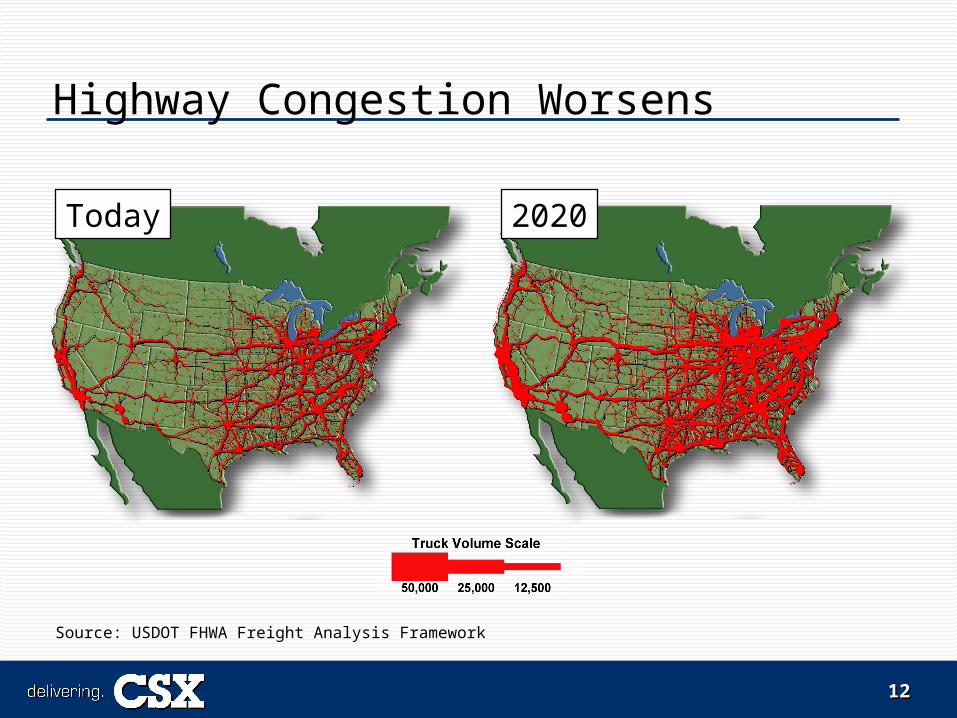
Highway Congestion Worsens
Source: USDOT FHWA Freight Analysis Framework
Today 2020
1313
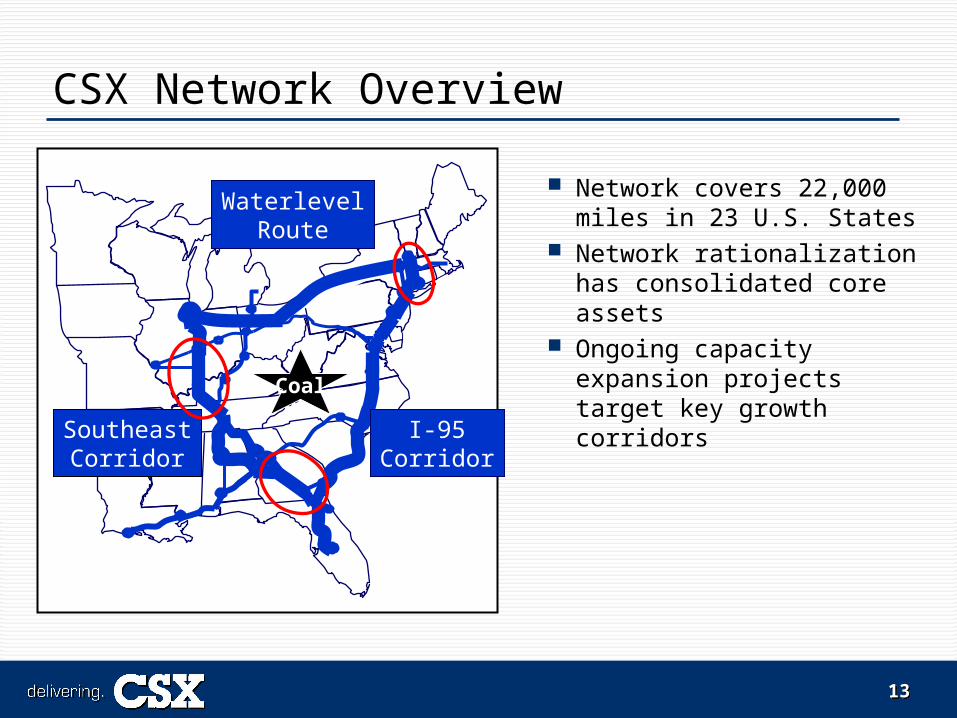
Coal
I-95Corridor
WaterlevelRoute
SoutheastCorridor
CSX Network Overview
Network covers 22,000 miles in 23 U.S. States
Network rationalization has consolidated core assets
Ongoing capacity expansion projects target key growth corridors
1414
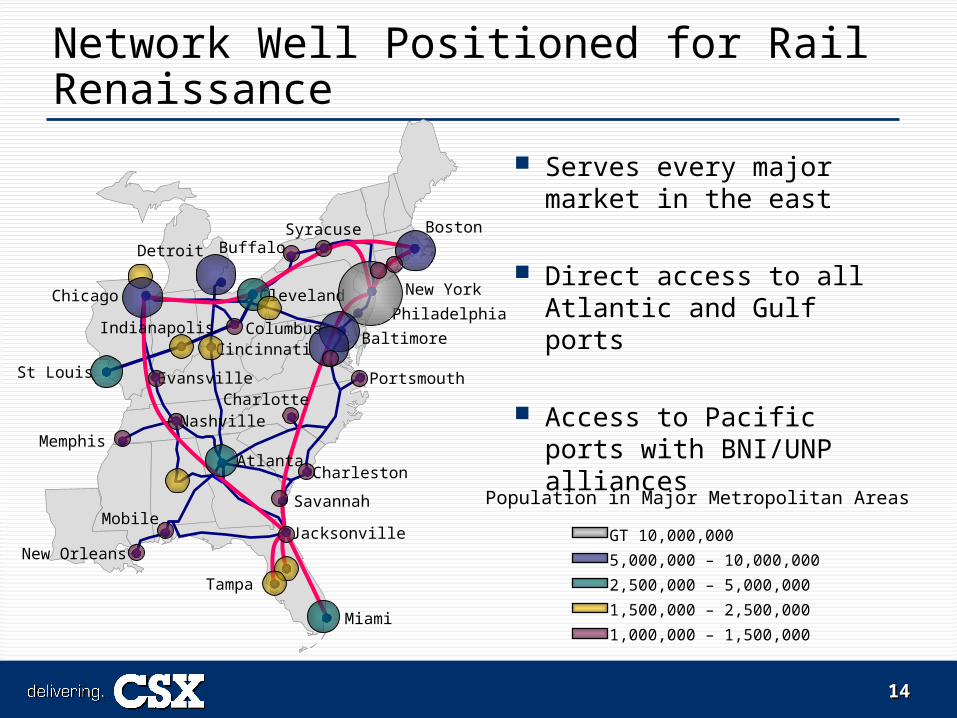
Network Well Positioned for Rail Renaissance
Serves every major market in the east
Direct access to all Atlantic and Gulf ports
Access to Pacific ports with BNI/UNP alliances
Miami
Chicago
Savannah
Charleston
Baltimore
Memphis
Charlotte
Mobile
Nashville
Atlanta
Detroit
Jacksonville
Tampa
BuffaloSyracuse
Cleveland
ColumbusCincinnati
Evansville
Boston
Philadelphia
New York
New Orleans
St Louis Portsmouth
Indianapolis
Population in Major Metropolitan Areas
GT 10,000,000
5,000,000 – 10,000,000
2,500,000 – 5,000,000
1,500,000 – 2,500,000
1,000,000 – 1,500,000
1515
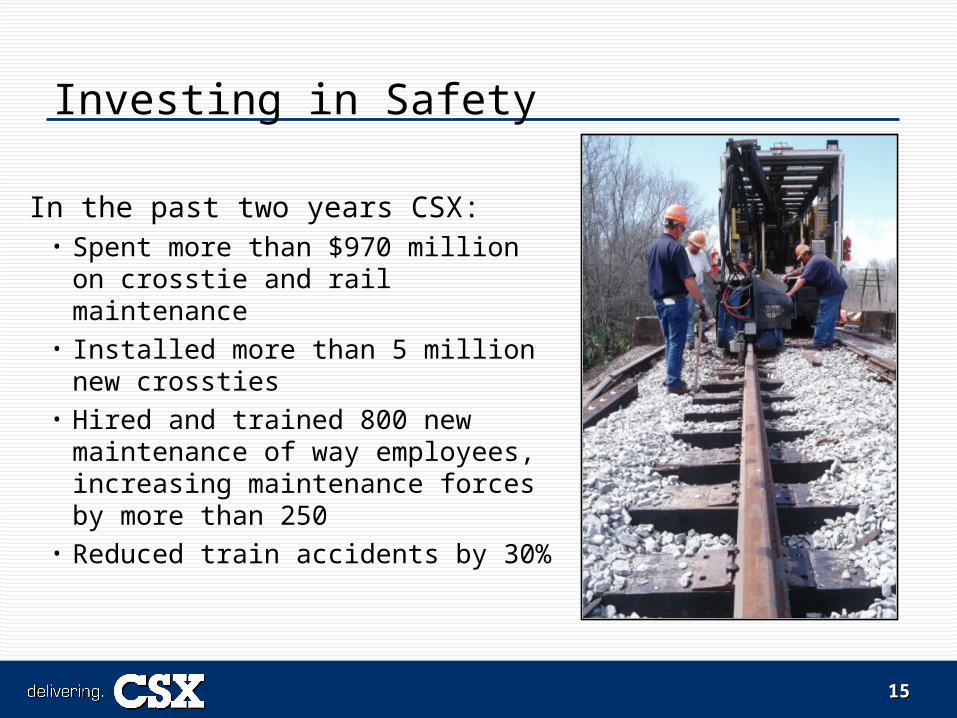
Investing in Safety
In the past two years CSX:• Spent more than $970 million on
crosstie and rail maintenance• Installed more than 5 million
new crossties• Hired and trained 800 new
maintenance of way employees, increasing maintenance forces by more than 250
• Reduced train accidents by 30%
1616
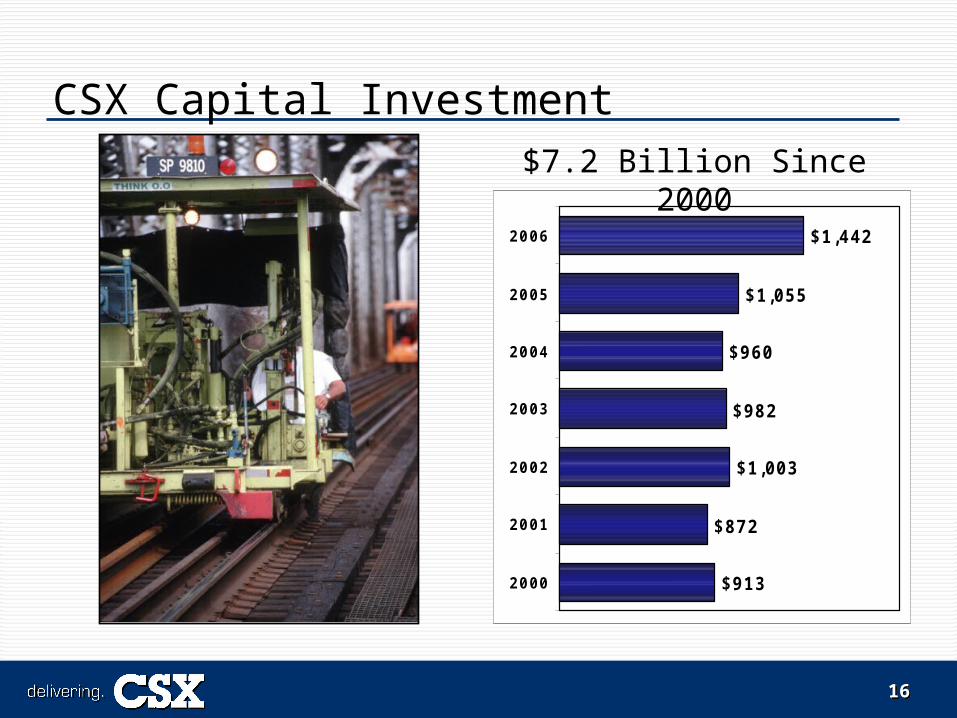
CSX Capital Investment
$913
$872
$1,003
$982
$960
$1,055
$1,442
2000
2001
2002
2003
2004
2005
2006
$7.2 Billion Since 2000
1717
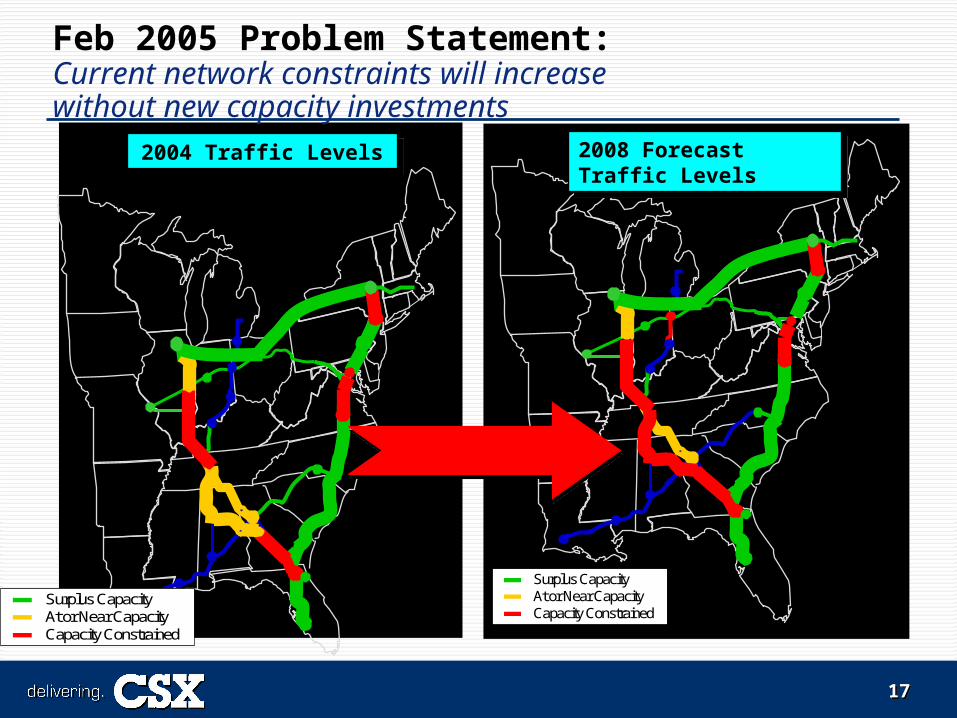
2004 Traffic Levels2004 Traffic Levels
Surplus CapacityAt or Near Capacity Capacity Constrained
2008 Forecast Traffic Levels2008 Forecast Traffic Levels
Surplus CapacityAt or Near Capacity Capacity Constrained
Feb 2005 Problem Statement:Current network constraints will increasewithout new capacity investments
1818
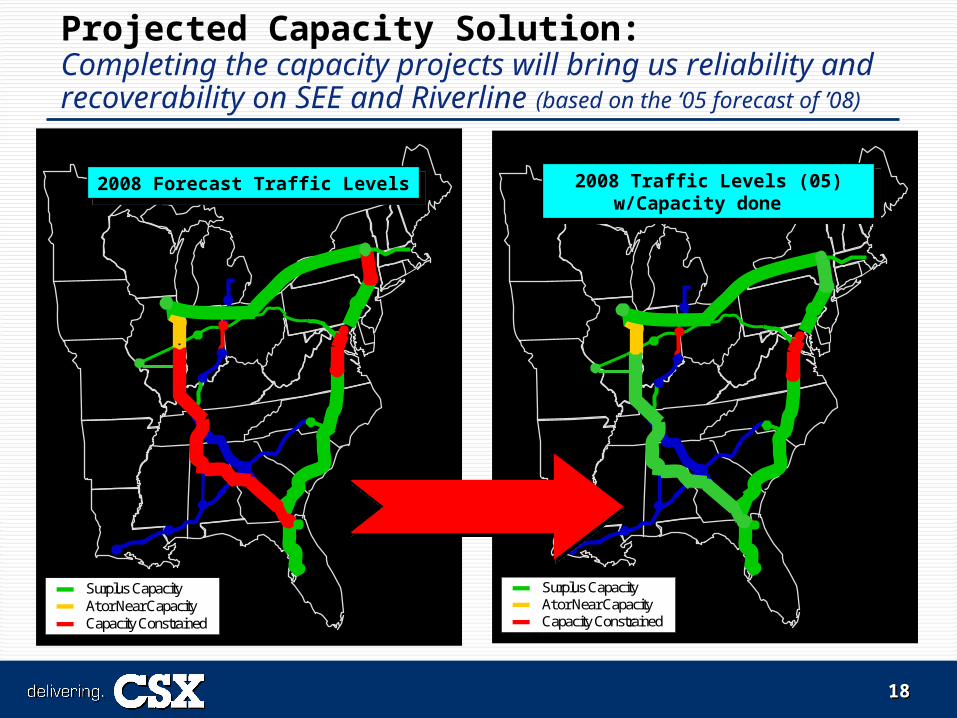
2008 Traffic Levels (05) w/Capacity done 2008 Traffic Levels (05) w/Capacity done
Surplus CapacityAt or Near Capacity Capacity Constrained
Projected Capacity Solution: Completing the capacity projects will bring us reliability and recoverability on SEE and Riverline (based on the ‘05 forecast of ’08)
2008 Forecast Traffic Levels2008 Forecast Traffic Levels
Surplus CapacityAt or Near Capacity Capacity Constrained
1919
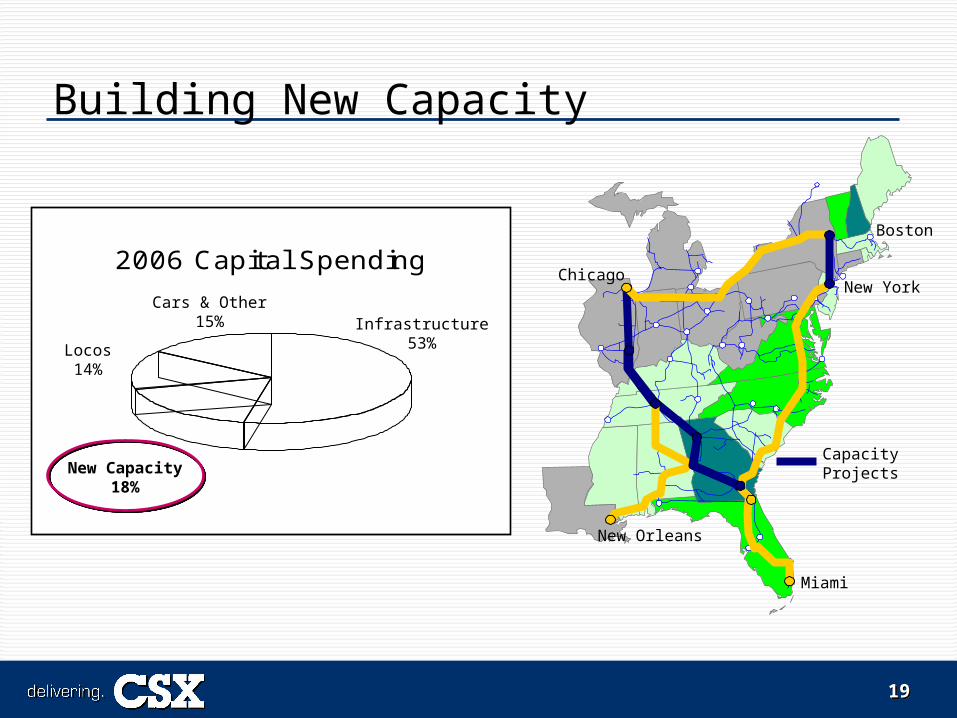
Building New Capacity
New Orleans
New YorkChicago
Boston
Miami
CapacityProjects
2006 Capital Spending
Infrastructure53%
New Capacity18%
Locos14%
Cars & Other15%
2020
Public Private Partnerships
CSX is responding to calls for expanded passenger rail in the cities we serve
Meeting the public demand for passenger rail requires expanded capacity
I-95 “Corridor of the Future” requires integrated freight and passenger expansion strategy
2121
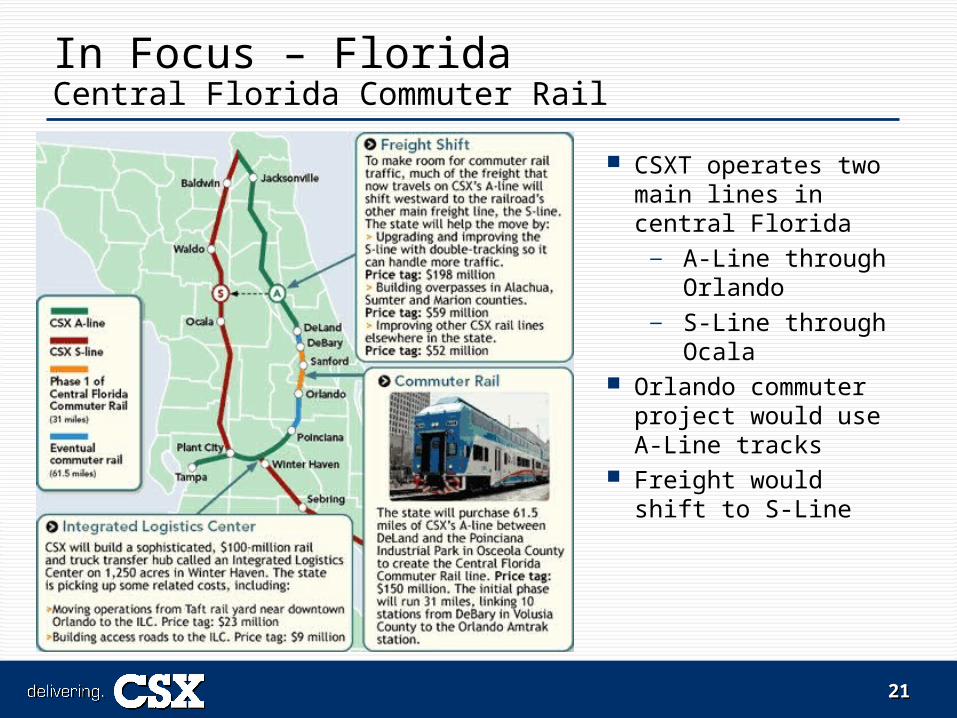
CSXT operates two main lines in central Florida
— A-Line through Orlando
— S-Line through Ocala
Orlando commuter project would use A-Line tracks
Freight would shift to S-Line
In Focus – FloridaCentral Florida Commuter Rail
2222
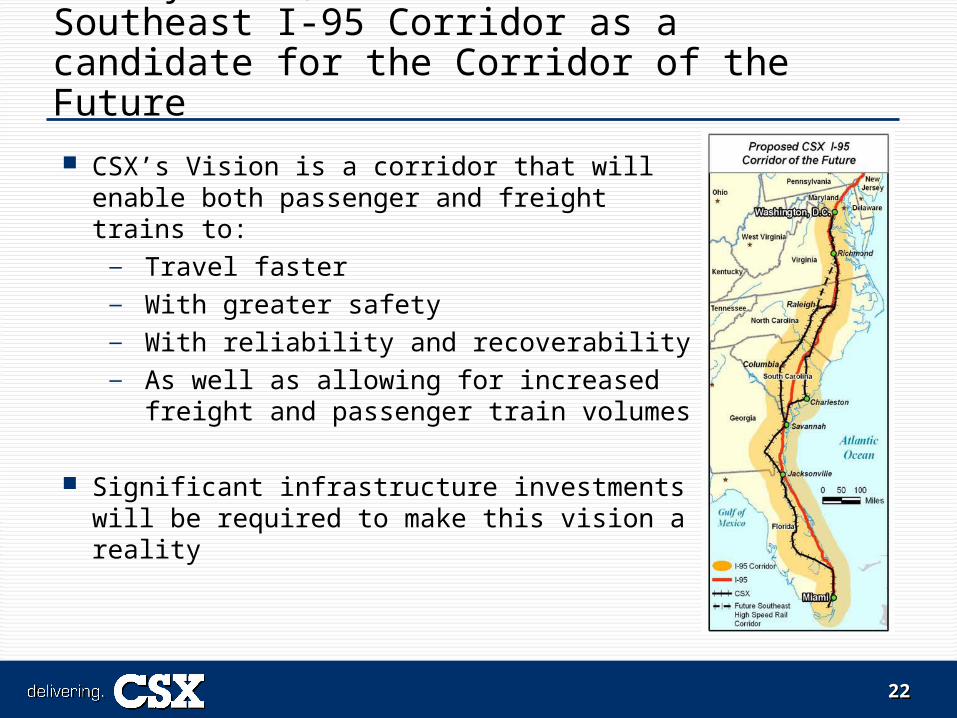
In May 2007, CSX submitted it’s Southeast I-95 Corridor as a candidate for the Corridor of the Future
CSX’s Vision is a corridor that will enable both passenger and freight trains to:
— Travel faster— With greater safety— With reliability and recoverability— As well as allowing for increased freight
and passenger train volumes
Significant infrastructure investments will be required to make this vision a reality
Related Documents