Freight Supply & Demand Analysis Page 1 INTRODUCTION In general, freight planning is often not a priority for Metropolitan Planning Organizations (MPO) or many Departments of Transportation (DOT). Trucks tend to represent a relatively small share of total traffic in many metropolitan areas, and the data needed to develop and validate freight analytical tools are expensive and difficult to collect. In addition, mandatory planning activities – long-range plans, Transportation Improvement Programs (TIP), air quality conformity determinations and special projects – often consume the majority of available resources, thus reducing the ability to commit adequate resources to freight planning activities. While the need for effective and efficient transportation systems to move freight is often recognized by many MPOs, few can accurately reflect the interactions of goods movements with passenger vehicles within their transportation models. Despite this constraint, more and more elected officials have acknowledged that the problem will not be resolved by simply documenting increasing commercial vehicle volumes and have pressed transportation professionals to do more to provide solutions before the anticipated volumes of freight overwhelm their systems. Freight- specific improvements often provide higher payoffs towards improving the overall transportation system as heavy single-unit and combination trucks disproportionately contribute to traffic congestion, infrastructure deterioration, incident effects and emission outputs as well as mitigation strategies are often more easily implemented than those affecting passenger vehicles. As part of its ongoing, long-range planning efforts, the Spartanburg Area Transportation Study (SPATS) initiated this freight supply and demand analysis to assess the impacts of goods movements within Spartanburg County. The analysis examines the movement of freight by truck, rail and air originating from, destined to or passing through the county in order to determine how SPATS can best help position itself to accommodate future freight growth, while minimizing adverse impacts on the county’s infrastructure and environment. It includes recommendations for future infrastructure investments and policies that will enable the county’s transportation system to continue to operate at the highest levels of efficiency and safety in the years ahead. The intent of this analysis is to help decision makers understand how freight fits into the overall planning framework and insure that freight-related issues are addressed and weighted appropriately in the selection of projects. This is an important step in informing the public and their elected leadership of the tradeoffs between various modes and investment strategies. The Freight Infrastructure chapter captures the “supply” side of the study. It inventories and analyzes both nationally and regionally significant freight infrastructure within the county to suggest how it is used or under-utilized in order to identify critical gaps, deficiencies and opportunities. The Freight Demand Profile provides a baseline understanding of the current movement of freight to, from and throughout the county. It is the study’s “demand” portion, where current patterns and future trends are examined to “tell the story” of goods movement. The Freight Capacity and Recommendations chapters explore options to solve current freight issues, to plan for future challenges and to lay out options that will shape strategic investments in the future.

Welcome message from author
This document is posted to help you gain knowledge. Please leave a comment to let me know what you think about it! Share it to your friends and learn new things together.
Transcript
Freight Supply & Demand Analysis
Page 1
INTRODUCTION
In general, freight planning is often not a priority for Metropolitan Planning Organizations (MPO) or many Departments of Transportation (DOT). Trucks tend to represent a relatively small share of total traffic in many metropolitan areas, and the data needed to develop and validate freight analytical tools are expensive and difficult to collect. In addition, mandatory planning activities – long-range plans, Transportation Improvement Programs (TIP), air quality conformity determinations and special projects – often consume the majority of available resources, thus reducing the ability to commit adequate resources to freight planning activities.
While the need for effective and efficient transportation systems to move freight is often recognized by many MPOs, few can accurately reflect the interactions of goods movements with passenger vehicles within their transportation models. Despite this constraint, more and more elected officials have acknowledged that the problem will not be resolved by simply documenting increasing commercial vehicle volumes and have pressed transportation professionals to do more to provide solutions before the anticipated volumes of freight overwhelm their systems. Freight-specific improvements often provide higher payoffs towards improving the overall transportation system as heavy single-unit and combination trucks disproportionately contribute to traffic congestion, infrastructure deterioration, incident effects and emission outputs as well as mitigation strategies are often more easily implemented than those affecting passenger vehicles.
As part of its ongoing, long-range planning efforts, the Spartanburg Area Transportation Study (SPATS) initiated this freight supply and demand analysis to assess the impacts of goods movements within Spartanburg County. The analysis examines the movement of freight by truck, rail and air originating from, destined to or passing through the county in order to determine how SPATS can best help position itself to accommodate future freight growth, while minimizing adverse impacts on the county’s infrastructure and environment. It includes recommendations for future infrastructure investments and policies that will enable the county’s transportation system to continue to operate at the highest levels of efficiency and safety in the years ahead.
The intent of this analysis is to help decision makers understand how freight fits into the overall planning framework and insure that freight-related issues are addressed and weighted appropriately in the selection of projects. This is an important step in informing the public and their elected leadership of the tradeoffs between various modes and investment strategies. The Freight Infrastructure chapter captures the “supply” side of the study. It inventories and analyzes both nationally and regionally significant freight infrastructure within the county to suggest how it is used or under-utilized in order to identify critical gaps, deficiencies and opportunities. The Freight Demand Profile provides a baseline understanding of the current movement of freight to, from and throughout the county. It is the study’s “demand” portion, where current patterns and future trends are examined to “tell the story” of goods movement. The Freight Capacity and Recommendations chapters explore options to solve current freight issues, to plan for future challenges and to lay out options that will shape strategic investments in the future.
Freight Supply & Demand Analysis
Page 3
DATA SOURCES
Freight movements are global and national in scale and scope; however, many local companies are managing worldwide production and distribution systems and expanding their geographic coverage to gain economic scale. Many of today’s businesses rely on manufacture-to-order and just-in-time inventories to meet customer demands, which makes reliability, speed and flexibility crucial to both maximize efficiencies and maintaining profit margins. An overarching theme of these developments has been the growth in the geographic scale of supply chains over time. Freight transportation processes are now so cost-efficient across different modes of transport that the close physical proximity of supply points (e.g., raw material sources, production facilities, etc.) to consumers no longer offers the advantages it once did, and may even be a detriment from an economic perspective.
This environment has created markets tied more to production and less observant to location, which alters not only the distribution of manufacturing and consumption, but accessibility to the data required to analyze regional freight patterns. Understanding how freight moves into, out of and through a region is an important first step towards resolving freight-related transportation infrastructure issues. Painting the picture of both current and future freight movements helps not only inform decision makers about the magnitude and trend of freight and its impact, but the overall effectiveness of programed alternatives. Yet there is not one single definitive source from which to paint the picture. Understanding and forecasting the movement of goods into, out of and through Spartanburg County required assembling information from a variety of sources.
The analysis was completed utilizing local socioeconomic data provided by SPATS, the South Carolina Department of Transportation (SCDOT), the Bureau of Labor Statistics, the Bureau of Transportation Statistics and the Federal Highway Administration (FHWA).
Spartanburg Area Transportation Study The socioeconomic data and local plans provided by SPATS were used to fill in data gaps to identify the location of current or future industrial and freight transfer centers, which is important to developers as efficient access to/from these high freight traffic areas can be a major contributor to future economic development, and to identify “hot spots” where truck traffic caused or entangled in traffic circulation breakdowns.
The 2004 and 2035 population and employment estimates provided the basis to perform simple regression analyses and likely growth scenarios for regional goods movement, which was used to perform “reasonableness” and sensitivity tests on the Freight Analysis Framework (FAF) and
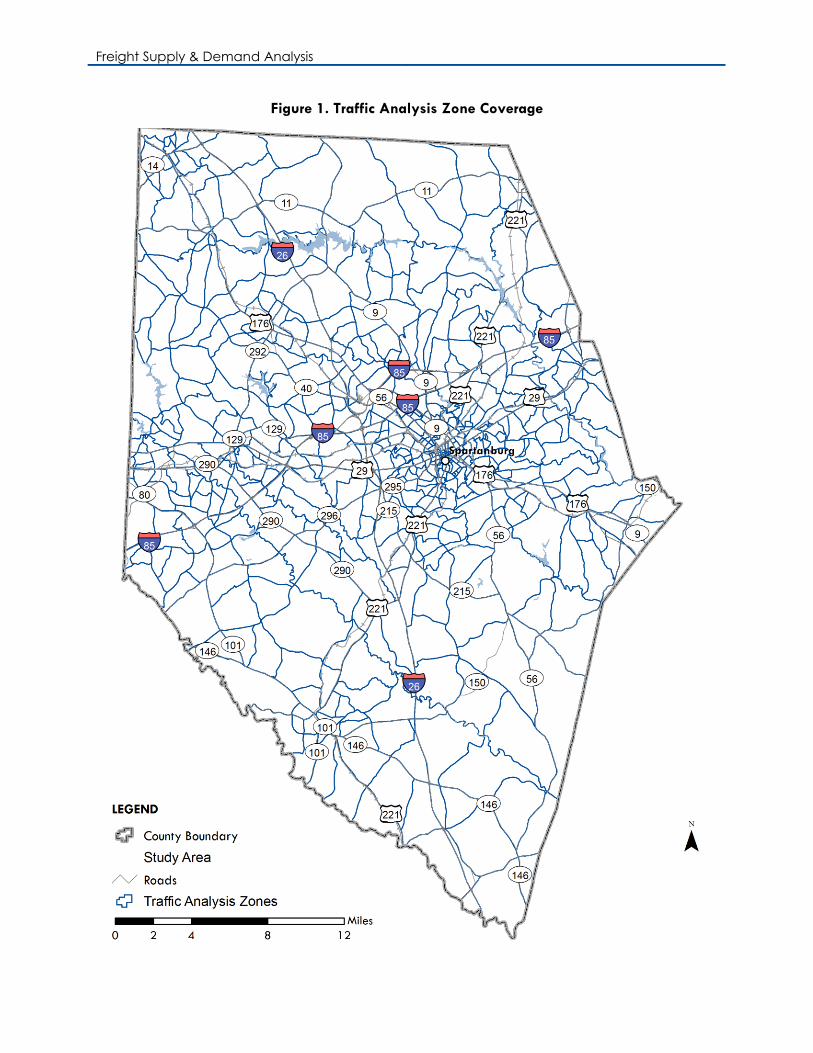
Transearch® databases. Considerations to changes in productivity rates were also examined, particularly on the local production forecast elements, which could not only affect longer term trends estimates, to control for aggregation errors in the national freight forecasts. Figure 1 presents a map of the study area as well as the Traffic Analysis Zone (TAZ) coverage, which served as the geography for the socioeconomic estimates.
Freight Supply & Demand Analysis
Figure 1. Traffic Analysis Zone Coverage
Data Sources
Page 5
South Carolina Department of Transportation SCDOT provided its statewide traffic count database and the recently purchased Transearch® database, both of which were used to develop the Freight Demand Profile. A brief explanation of each database follows.
Statewide Traffic Count Database SCDOT routinely collects or estimates traffic at a variety of locations on all state maintained roadways. Counts are derived through a variety of means, including direct observation (tube count or permanent count station), local studies and extrapolation of observed and historical data, to come up with an absolute value for each count location. While not all counts are collected every year, the estimates in the statewide traffic count database represent the most accurate total traffic and truck percentages for many corridors in Spartanburg County, including Interstates 26, 85 and 585 as well as US Highways 29, 176 and 221.
The traffic count data are kept in state plane meters and although the accuracy of the point locations is not well documented it generally seems to be within approximately 30 meters of the actual count location. As shown in Figure 2 on the next page, a little over 150 locations are maintained in Spartanburg County. Additional information on peaking (k factors) and directionality (d factors) will be included in future counts collected and should provide the basis for all ongoing regional model validation and calibration efforts.
Starting in 2011, SCDOT traffic volumes at Interstate locations for the following modes will be included in the database for both Average Annual Daily Traffic (AADT) and Average Annual Weekday Traffic (AAWDT):
Total Volume (all modes);
Percent 1 Axle Truck;
Percent 2+ Axle Truck;
Percent Truck with 1 Axle Trailer; and
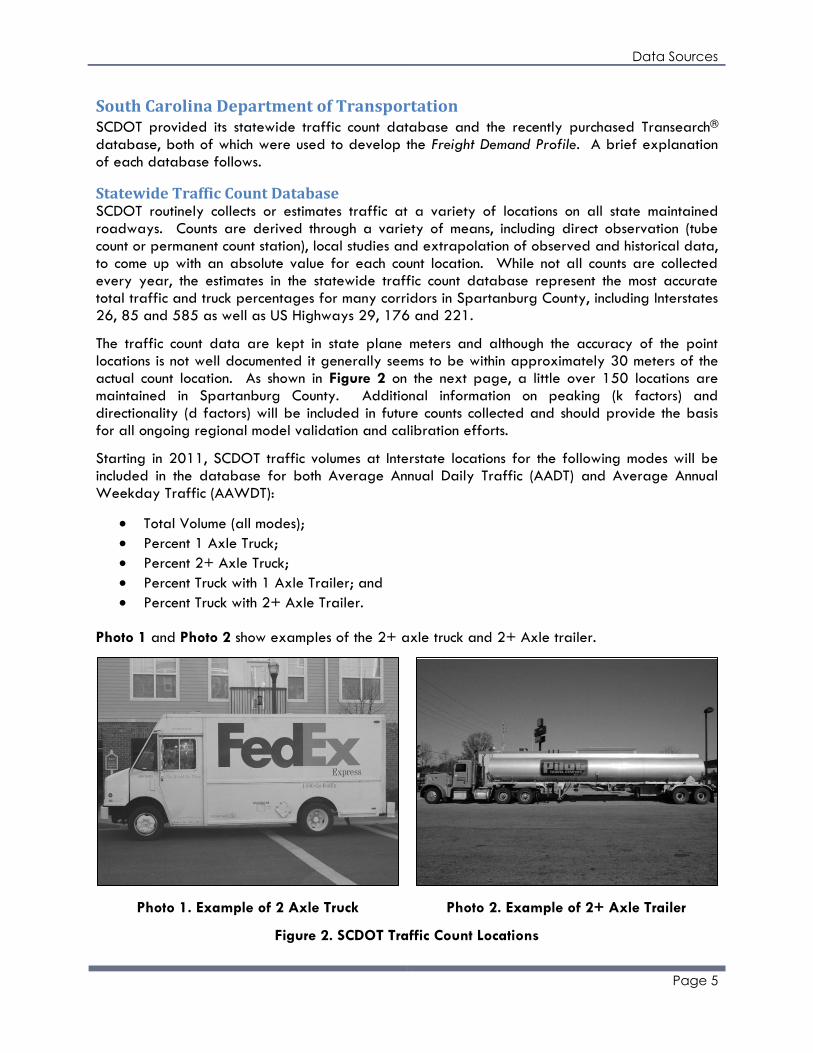
Percent Truck with 2+ Axle Trailer. Photo 1 and Photo 2 show examples of the 2+ axle truck and 2+ Axle trailer.
Photo 1. Example of 2 Axle Truck Photo 2. Example of 2+ Axle Trailer
Figure 2. SCDOT Traffic Count Locations

Freight Supply & Demand Analysis
Data Sources
Page 7
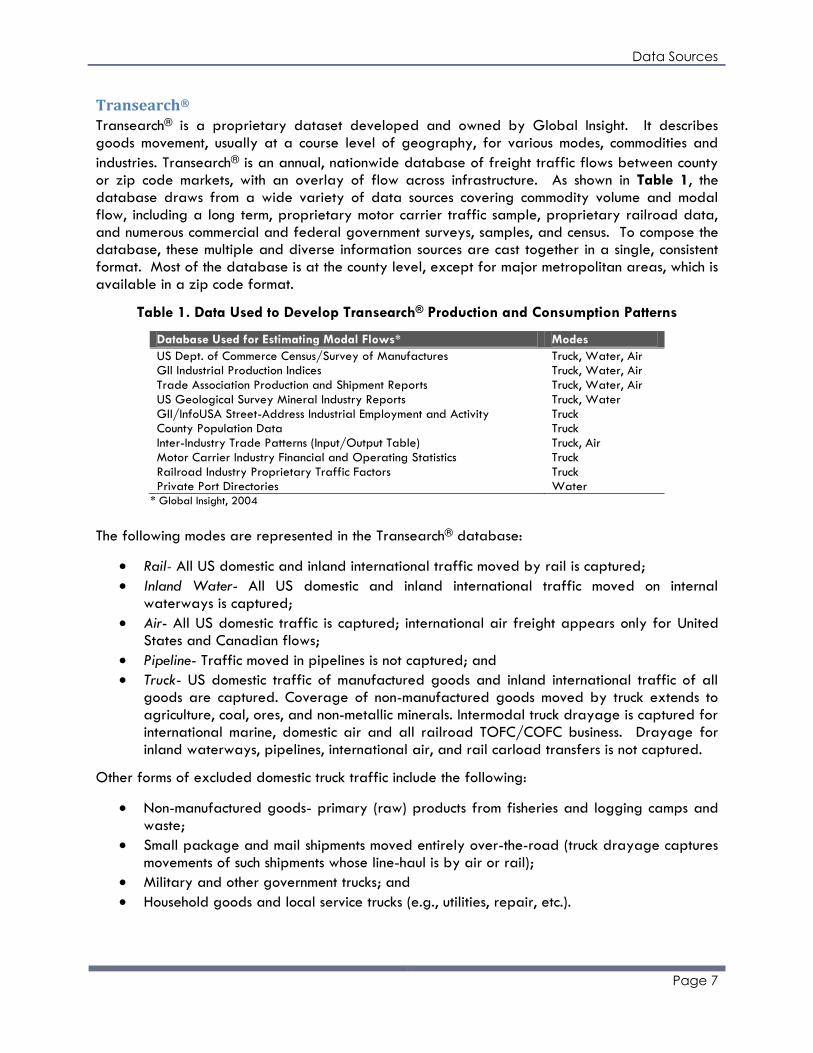
Transearch® Transearch® is a proprietary dataset developed and owned by Global Insight. It describes goods movement, usually at a course level of geography, for various modes, commodities and
industries. Transearch® is an annual, nationwide database of freight traffic flows between county or zip code markets, with an overlay of flow across infrastructure. As shown in Table 1, the database draws from a wide variety of data sources covering commodity volume and modal flow, including a long term, proprietary motor carrier traffic sample, proprietary railroad data, and numerous commercial and federal government surveys, samples, and census. To compose the database, these multiple and diverse information sources are cast together in a single, consistent format. Most of the database is at the county level, except for major metropolitan areas, which is available in a zip code format.
Table 1. Data Used to Develop Transearch® Production and Consumption Patterns
Database Used for Estimating Modal Flows* Modes
US Dept. of Commerce Census/Survey of Manufactures Truck, Water, Air GII Industrial Production Indices Truck, Water, Air Trade Association Production and Shipment Reports Truck, Water, Air US Geological Survey Mineral Industry Reports Truck, Water GII/InfoUSA Street-Address Industrial Employment and Activity Truck County Population Data Truck Inter-Industry Trade Patterns (Input/Output Table) Truck, Air Motor Carrier Industry Financial and Operating Statistics Truck Railroad Industry Proprietary Traffic Factors Truck Private Port Directories Water
* Global Insight, 2004
The following modes are represented in the Transearch® database:
Rail- All US domestic and inland international traffic moved by rail is captured;
Inland Water- All US domestic and inland international traffic moved on internal waterways is captured;
Air- All US domestic traffic is captured; international air freight appears only for United States and Canadian flows;
Pipeline- Traffic moved in pipelines is not captured; and
Truck- US domestic traffic of manufactured goods and inland international traffic of all goods are captured. Coverage of non-manufactured goods moved by truck extends to agriculture, coal, ores, and non-metallic minerals. Intermodal truck drayage is captured for international marine, domestic air and all railroad TOFC/COFC business. Drayage for inland waterways, pipelines, international air, and rail carload transfers is not captured.
Other forms of excluded domestic truck traffic include the following:
Non-manufactured goods- primary (raw) products from fisheries and logging camps and waste;
Small package and mail shipments moved entirely over-the-road (truck drayage captures movements of such shipments whose line-haul is by air or rail);
Military and other government trucks; and
Household goods and local service trucks (e.g., utilities, repair, etc.).

Freight Supply & Demand Analysis
As shown in Table 2, Transearch® provides a variety of summary levels of data for the two-digit Standard Transportation Commodity Code (STCC), which is the commonly accepted degree of resolution to understand the modal choice of certain commodities without getting too far into what might be suppressed proprietary data. Should more detail be desired for certain types of
analyses, the Transearch® does include the six-digit STCC codes for certain commodities.
Table 2. Two-digit Transearch® STCC Descriptions
Code Description
01 Agricultural Production and Livestock 08 Primary Forest Products 09 Fresh Fish or Marine Products 10 Metallic Ores 11 Coal 13 Crude Petroleum or Natural Gas
14 Nonmetallic Minerals 19 Ordnance or Accessories 20 Food or Kindred Products 21 Tobacco Products 22 Textile Mill Products 23 Apparel or Related Products 24 Lumber or Wood Products 25 Furniture or Fixtures 26 Pulp, Paper or Allied Products 27 Printed Matter 28 Chemicals or Allied Products 29 Petroleum or Coal Products 30 Rubber or Misc. Plastics 31 Leather or Leather Products 32 Clay, Concrete, Glass or Stone 33 Primary Metal Products 34 Fabricated Metal Products 35 Machinery 36 Electrical Equipment 37 Transportation Equipment 38 Instruments, Photo Equip. and Optical Equip. 39 Misc. Manufacturing Products 40 Waste or Scrap Materials 41 Misc. Freight Shipments 42 Shipping Trailers/Containers 43 Mail or Contract Traffic 44 Freight Forwarder Traffic 45 Shipper Association Traffic 46 Misc. Mixed Shipments 47 Small Packaged Freight Shipments 48 Waste Hazardous Materials 49 Hazardous Materials or Substances
50 Secondary Traffic

Data Sources
Page 9
Bureau of Transportation Statistics The Bureau of Transportation Statistics (BTS) provided the National Transportation Atlas Database (NTAD) and the Commodity Flow Survey (CFS) databases. The NTAD was used to develop the
Freight Infrastructure while the CFS was used in conjunction with the Transearch® to develop the Freight Demand Profile. A brief explanation of each database follows.
National Transportation Atlas Database The National Transportation Atlas Database (NTAD) is a set of nationwide geographic databases of transportation facilities, transportation networks, and associated infrastructure. As shown in Table 3, these datasets include spatial information for transportation modal networks and intermodal terminals, as well as the related attribute information for these features. Metadata documentation, as prescribed by the Federal Geographic Data Committee, is also provided for each database. The data supports research, analysis, and decision making across all modes of transportation. It is most useful at the national level, but has major applications at regional, state, and local scales.
Table 3. NTAD GIS Coverage
Data Type Coverage Description*
Points Public-Use Airports Alternative Fuels Stations Amtrak Stations Automatic Traffic Recorder Stations Highway-Rail Grade Crossings Intermodal Terminal Facilities National Bridge Inventory National Populated Places US Army Corps of Engineers Ports Weigh in Motion Stations Polylines Freight Analysis Network Hazardous Material Routes National Highway Planning Network Railway Network Public Use Airport Runways Fixed-Guideway Transit Facilities US Army Corps of Engineers Navigable Waterway Network Polygons Bureau of the Census Urbanized Area Boundaries The 110th Congressional Districts Boundaries US County Boundaries Hydrographic Features US Military Installations Metropolitan Planning Organization Core Based Statistical Areas Non-Attainment Areas National Park System Boundary Dataset US State Boundaries
* BTS, 2009
Most data are places within 80’ of their presumed location. Data are stored in a Latitude/Longitude format in an ESRI Shapefile (SHP) format and has basic attribute data added where appropriate such as common name, owner, etc.
Freight Supply & Demand Analysis
The following freight modes are considered in the NTAD:
Roadway (National Highway);
Railway; and
Public Use Airport.
Additionally, NTAD includes information on the following related transportation infrastructure:
Automated Traffic Counter Locations;
Highway/Rail At Grade Crossings;
Intermodal Terminal Locations;
National Bridge Inventory;
US Army Corps of Engineers Ports;
Weigh-in-Motion Station Locations;
Freight Analysis Network; and
Hazardous Materials Routes.
Much of the baseline data appropriate to the analysis was collected from the NTAD and reduced to cover just Spartanburg County in order to reduce file storage requirements; however, additional data may be downloaded directly from the BTS website.
Commodity Flow Survey The Commodity Flow Survey (CFS) is a primary source of national and state-level data on domestic freight shipments by United States’ establishments in mining, manufacturing, wholesale, auxiliaries, and selected retail industries. It is used in the development of the FAF, which is
described in the next section, and the Transearch® databases. Data are provided on the types, origins and destinations, values, weights, modes of transport, distance shipped, and ton-miles of commodities shipped. The CFS is a shipper-based survey and is conducted every five years as part of the Economic Census. It provides a modal picture of national freight flows, and is a publicly available source of commodity flow data. The CFS was conducted in 1993, 1997, 2002, and most recently in 2007. The final release of the 2007 CFS was released in December 2009.
The CFS does not include establishments classified in forestry, fishing, utilities, construction, transportation, and most retail and services industries. Farms and government-owned entities (except government-owned liquor stores) were also excluded. Foreign-based business importing to the United States are also excluded from the survey sample; however, in theory, domestic portions of imported shipments can be captured in the CFS once arriving at a United States’ based establishment (assuming it is an eligible shipping establishment included in the CFS). Most data are available, expanded and summarized at the national, state or county level depending on whether or not confidentiality might be an issue.
The following modes are considered and presented in the CFS:
Highway;
Railway;
Air; and
Pipeline.
Data Sources
Page 11
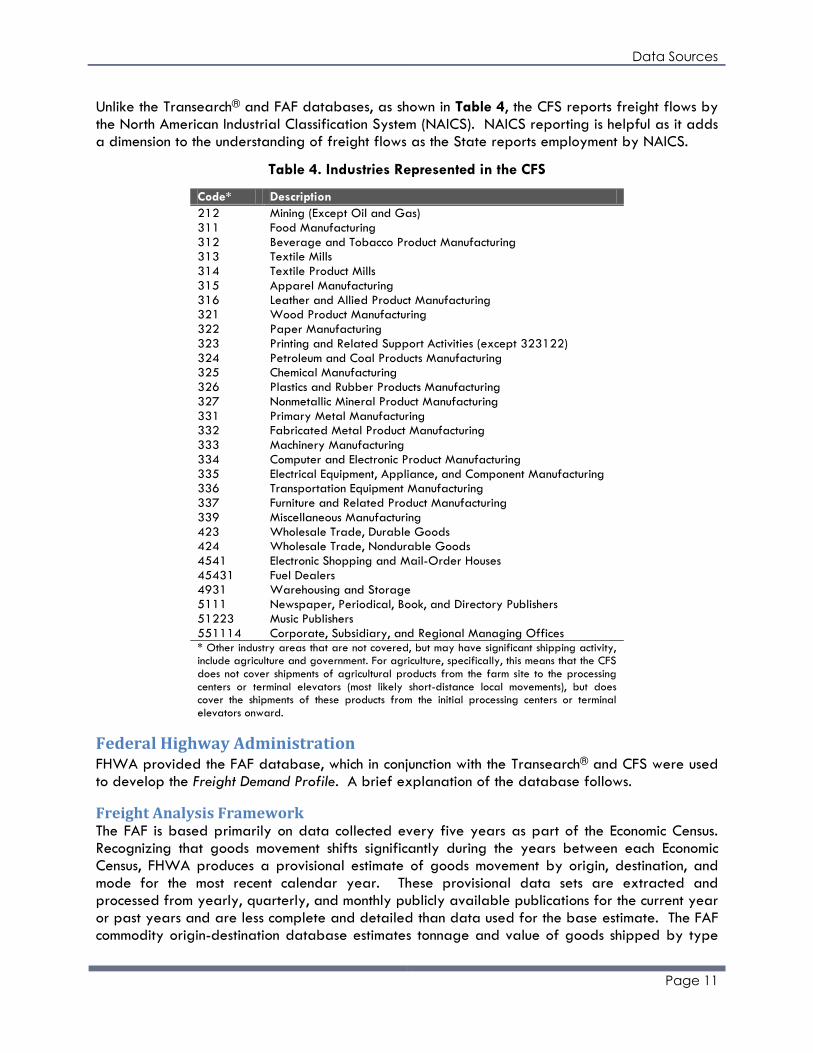
Unlike the Transearch® and FAF databases, as shown in Table 4, the CFS reports freight flows by the North American Industrial Classification System (NAICS). NAICS reporting is helpful as it adds a dimension to the understanding of freight flows as the State reports employment by NAICS.
Table 4. Industries Represented in the CFS
Code* Description
212 Mining (Except Oil and Gas) 311 Food Manufacturing 312 Beverage and Tobacco Product Manufacturing 313 Textile Mills 314 Textile Product Mills 315 Apparel Manufacturing 316 Leather and Allied Product Manufacturing 321 Wood Product Manufacturing 322 Paper Manufacturing
323 Printing and Related Support Activities (except 323122) 324 Petroleum and Coal Products Manufacturing 325 Chemical Manufacturing 326 Plastics and Rubber Products Manufacturing 327 Nonmetallic Mineral Product Manufacturing 331 Primary Metal Manufacturing 332 Fabricated Metal Product Manufacturing 333 Machinery Manufacturing 334 Computer and Electronic Product Manufacturing 335 Electrical Equipment, Appliance, and Component Manufacturing 336 Transportation Equipment Manufacturing 337 Furniture and Related Product Manufacturing 339 Miscellaneous Manufacturing 423 Wholesale Trade, Durable Goods 424 Wholesale Trade, Nondurable Goods 4541 Electronic Shopping and Mail-Order Houses 45431 Fuel Dealers 4931 Warehousing and Storage 5111 Newspaper, Periodical, Book, and Directory Publishers 51223 Music Publishers 551114 Corporate, Subsidiary, and Regional Managing Offices * Other industry areas that are not covered, but may have significant shipping activity, include agriculture and government. For agriculture, specifically, this means that the CFS does not cover shipments of agricultural products from the farm site to the processing centers or terminal elevators (most likely short-distance local movements), but does cover the shipments of these products from the initial processing centers or terminal elevators onward.
Federal Highway Administration FHWA provided the FAF database, which in conjunction with the Transearch® and CFS were used to develop the Freight Demand Profile. A brief explanation of the database follows.
Freight Analysis Framework The FAF is based primarily on data collected every five years as part of the Economic Census. Recognizing that goods movement shifts significantly during the years between each Economic Census, FHWA produces a provisional estimate of goods movement by origin, destination, and mode for the most recent calendar year. These provisional data sets are extracted and processed from yearly, quarterly, and monthly publicly available publications for the current year or past years and are less complete and detailed than data used for the base estimate. The FAF commodity origin-destination database estimates tonnage and value of goods shipped by type

Freight Supply & Demand Analysis
of commodity and mode of transportation among and within 114 areas. The 2002 estimate is based primarily on the CFS and other components of the Economic Census. Forecasts are included for 2010 to 2035 in 5 year increments.
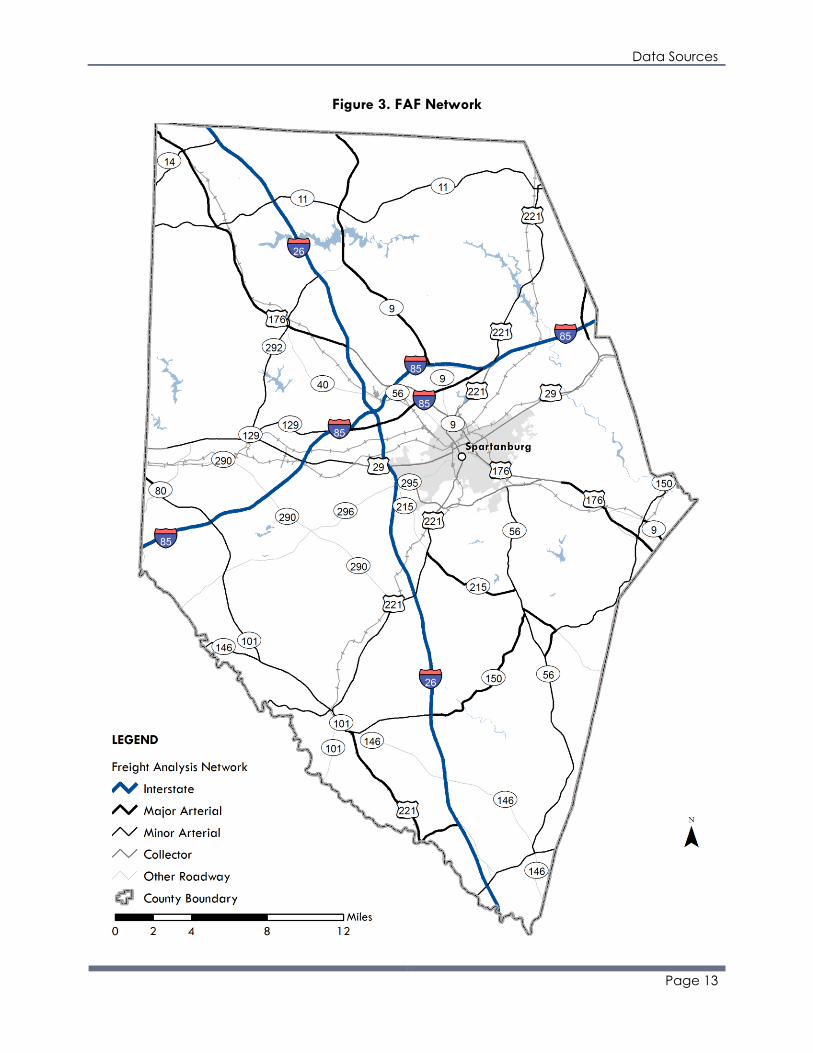
As shown in Figure 3 on the next page, the following FAF modes were analyzed:
Roadway;
Rail;
Air;
Water; and
Pipeline.
As shown in Table 5, the FAF summarizes data by the STCC2 codes and categories.
Table 5. Two-digit FAF STCC Descriptions
Code Description
01 Agricultural Production and Livestock 08 Primary Forest Products 09 Fresh Fish or Marine Products 10 Metallic Ores 11 Coal 13 Crude Petroleum or Natural Gas 14 Nonmetallic Minerals 19 Ordnance or Accessories 20 Food or Kindred Products 21 Tobacco Products 22 Textile Mill Products 23 Apparel or Related Products 24 Lumber or Wood Products 25 Furniture or Fixtures 26 Pulp, Paper or Allied Products 27 Printed Matter 28 Chemicals or Allied Products 29 Petroleum or Coal Products 30 Rubber or Misc. Plastics 31 Leather or Leather Products 32 Clay, Concrete, Glass or Stone 33 Primary Metal Products 34 Fabricated Metal Products 35 Machinery 36 Electrical Equipment 37 Transportation Equipment 38 Instruments, Photo Equip. and Optical Equip. 39 Misc. Manufacturing Products 40 Waste or Scrap Materials 41 Misc. Freight Shipments
42 Shipping Trailers/Containers 43 Mail or Contract Traffic 44 Freight Forwarder Traffic 45 Shipper Association Traffic 46 Misc. Mixed Shipments 47 Small Packaged Freight Shipments 48 Waste Hazardous Materials 49 Hazardous Materials or Substances 50 Secondary Traffic
Data Sources
Page 13
Figure 3. FAF Network

Freight Supply & Demand Analysis
Related Documents