PUBLIC SECTOR Economic & Political Weekly EPW JANUARY 31, 2015 vol l no 5 47 The Transformation of India’s Public Sector Political Economy of Growth and Change Sushil Khanna This paper examines the paradox of the diminishing institutional role of large central public sector enterprises despite rising profitability and investment as a result of their being efficient competitors in the new market environment. Under the neo-liberal regime of the last two decades, these CPSES, with large cash balances and improved profitability, have emerged as the main drivers of public savings and investment. But instead of enhancing their strategic role, the union government has been treating them as cash cows. A comparison of the performance of large private and public sector firms in the manufacturing sector shows that the CPSES have provided higher returns on capital employed. And, performance in terms of technical parameters is in no way inferior to that of their private counterparts. Yet the Modi government intends to either privatise these CPSES or sell a significant part of their equity shares, a decision that is devoid of both strategic and business sense. A s the new Bharatiya Janata Party (BJP) government settles down to its economic programme, “privatisation” is again on the agenda. The government immediately announced the sale of as many as 79 loss-making public sector enterprises ( PSEs ) 1 and has already set into motion the sale of the Central Inland Water Transport Corporation. 2 Several other units, like Tyre Corp, Scooters India, and so on, are to follow soon. The mid-year review of the new government has, however, emphasised the crucial role of public sector investment in reviving economic growth. The review emphasises that unlike the private sector, public investment has not declined substan- tially during the recent slowdown. Increased public invest- ment, it argues, can “crowd in private investment” ( GoI 2014). Increasing investment from non-departmental government enterprises has been a crucial factor behind the growth surge in the Indian economy during 2007-12. Even as the govern- ment’s increasing fiscal deficit has robbed it of the capacity to invest, PSEs have become the dominant players in financing investment, this from their own buoyant profits. This paper is an attempt to evaluate the new role and increasing capacity of PSEs to invest in several key sectors of the economy, despite regimes that emphasise efficiency of the private sector and the belief that privatising state-owned enterprises is the correct strategy. The increase in PSE surpluses at a time when the State cannot envisage any strate- gic role of PSEs in India’s development strategy is the mystery we attempt to probe in this paper. We delineate the industrial policy changes and response of PSE managers to the new regime of liberalisation and deregulation that was inaugurated in the early 1990s. This study traces the shifts in policy over the last two decades, including the period of partial listing of PSEs on the Indian stock exchanges and the period of extensive privatisation under a BJP-led government at the turn of the millennium. The decline of public support for privatisation and the changes in political economy that finally halted the sale of PSEs are briefly discussed along with the response of the PSEs to the changing policy. Questions about the relative efficiency and performance of the PSEs, doubts about their “strate- gic” roles, and their impact on growth and stagnation in the economy have dominated the Indian debates for almost two decades (Ghosh 1998). We revisit them briefly. We trace the impor- tant role PSEs have played in accumulation and acceleration of the rate of growth in India since 2004, along with their strategic role in acting as a countervailing force to private capital, both domestic and foreign. We compare the performance of PSEs in I am grateful to Mritiunjoy Mohanty for his detailed comments and suggestions. I am indebted to Vidhu Shekhar and Amit Baran for data analysis. However, all errors and omissions are entirely mine. Sushil Khanna ([email protected]) teaches economics and strategic management at the Indian Institute of Management Calcutta.

Welcome message from author
This document is posted to help you gain knowledge. Please leave a comment to let me know what you think about it! Share it to your friends and learn new things together.
Transcript
PUBLIC SECTOR
Economic & Political Weekly EPW JANUARY 31, 2015 vol l no 5 47
The Transformation of India’s Public Sector Political Economy of Growth and Change
Sushil Khanna
This paper examines the paradox of the diminishing
institutional role of large central public sector enterprises
despite rising profitability and investment as a result of
their being efficient competitors in the new market
environment. Under the neo-liberal regime of the last
two decades, these CPSES, with large cash balances and
improved profitability, have emerged as the main drivers
of public savings and investment. But instead of
enhancing their strategic role, the union government
has been treating them as cash cows. A comparison of
the performance of large private and public sector firms
in the manufacturing sector shows that the CPSES have
provided higher returns on capital employed. And,
performance in terms of technical parameters is in no
way inferior to that of their private counterparts. Yet the
Modi government intends to either privatise these CPSES
or sell a significant part of their equity shares, a decision
that is devoid of both strategic and business sense.
A s the new Bharatiya Janata Party (BJP) government settles down to its economic programme, “privatisation” is again on the agenda. The government immediately
announced the sale of as many as 79 loss-making public sector enterprises (PSEs)1 and has already set into motion the sale of the Central Inland Water Transport Corporation.2 Several other units, like Tyre Corp, Scooters India, and so on, are to follow soon. The mid-year review of the new government has, however, emphasised the crucial role of public sector investment in reviving economic growth. The review emphasises that unlike the private sector, public investment has not declined substan-tially during the recent slowdown. Increased public invest-ment, it argues, can “crowd in private investment” (GoI 2014).
Increasing investment from non-departmental government enterprises has been a crucial factor behind the growth surge in the Indian economy during 2007-12. Even as the govern-ment’s increasing fi scal defi cit has robbed it of the capacity to invest, PSEs have become the dominant players in fi nancing investment, this from their own buoyant profi ts.
This paper is an attempt to evaluate the new role and increasing capacity of PSEs to invest in several key sectors of the economy, despite regimes that emphasise effi ciency of the private sector and the belief that privatising state-owned enterprises is the correct strategy. The incr ease in PSE surpluses at a time when the State cannot envisage any strate-gic role of PSEs in India’s development strategy is the mystery we attempt to probe in this paper.
We delineate the industrial policy changes and response of PSE managers to the new regime of liberalisation and deregulation that was inaugurated in the early 1990s. This study traces the shifts in policy over the last two decades, including the period of partial listing of PSEs on the Indian stock exchanges and the period of extensive privatisation under a BJP-led government at the turn of the millennium. The decline of public support for privatisation and the changes in political economy that fi nally halted the sale of PSEs are briefl y discussed along with the response of the PSEs to the changing policy. Questions about the relative effi ciency and performance of the PSEs, doubts about their “strate-gic” roles, and their impact on growth and stagnation in the economy have dominated the Indian debates for almost two decades (Ghosh 1998). We revisit them briefl y. We trace the impor-tant role PSEs have played in accumulation and acceleration of the rate of growth in India since 2004, along with their strategic role in acting as a countervailing force to private capital, both domestic and foreign. We compare the performance of PSEs in
I am grateful to Mritiunjoy Mohanty for his detailed comments and suggestions. I am indebted to Vidhu Shekhar and Amit Baran for data analysis. However, all errors and omissions are entirely mine.
Sushil Khanna ([email protected]) teaches economics and strategic management at the Indian Institute of Management Calcutta.
PUBLIC SECTOR
JANUARY 31, 2015 vol l no 5 EPW Economic & Political Weekly48
manufacturing and non-fi nancial services and fi nd it to be superior (in terms of return on capital) to private sector fi rms. We muse over this paradox of rising “effi ciency” at a time when a bankrupt ruling class cannot even envisage a strategic role for these giant enterprises, once called the “temples of modern India”.
PSEs in the Era of Deregulation and Liberalisation
The PSEs have seen a dramatic change in their business and regulatory environment. As the country embarked on a new path of liberalisation and deregulation, state-owned enterprises (SOEs) began to be thought of as anachronistic institutions. In the early 1990s, they were considered to be the pariahs of the country, controlled by vested interests, ineffi cient and badly managed, with low returns on capital employed, ready to be privatised as the country embraced the mantras of “effi ciency” and “liberalisation” and shifted emphasis to the market (Ahluwalia et al 1993; Bhagwati and Srinivasan 1993). After the initial threats to privatise the PSEs, the Congress Party-led United Progressive Alliance government backed off; it was the BJP government that carried out the outright sale of PSEs to private parties during 2000-04.
The programme of reforms, economic liberalisation and deregulation – launched in 1991, in response to a balance of payments crisis, combined with a widening fi scal defi cit – undermined the role of the PSEs in the economy. Many observers put the blame for the crisis, on the shoulders of PSEs; public fi na nces, they argued, had deteriorated also as a result of wasteful investment in PSEs – while absorbing billions of rupees as investment, they provided very poor returns. The following quote from Bhagwati sums up the neo-liberal position:
The main elements of India’s policy framework that stifl ed effi ciency and growth until the 1970s, and somewhat less so during the 1980s as limited reforms began to be attempted, and whose surgical removal is, for the most part, the objective of the substantial reforms begun in mid-1991, are easily defi ned. I would divide them into three major groups: (1) extensive bureaucratic controls over production, investment and trade; (2) inward-looking trade and foreign investment policies; (3) a substantial public sector, going well beyond the conventional confi nes of public utilities and infrastructure. The former two adversely affected the private sector’s effi ciency. The last, with the ineffi cient functioning of public sector enterprises, additionally impaired the public sector enterprises’ contribution to the economy. Together, the three sets of policy decisions broadly set strict limits to what India could get out of its investment (1993: 46-47).
In response to these pressures, the Indian government announced a new industrial policy (NIP) that opened up most sectors of modern industry and services to private investment, including foreign investment. Simultaneously, there was a cry for complete dismantling of the public sector and disinvestment (Bhagwati and Srinivasan 1993).
Despite these demands and pressure from multilateral agencies like the World Bank, actual sale of PSEs was marginal. In the fi rst fi ve years (1991-96), only one enterprise (Maruti Udyog, a joint venture) was privatised. The government, however, threatened to cut off budgetary support to loss-making enterprises and asked them to shed excess human-power. It was only in 1998 that the cry for their dismantling and sale gathered strength as the right-wing BJP-led National
Democratic Alliance (NDA) government came to power and subsequently, many were sold off during 1998-2003 (GoI 2007b).
From this perception of being moribund, ineffi cient and loss-making units, an albatross on the nation, today there has been a dramatic transformation in the fi nances and perform-ance of the PSEs. Many PSEs have emerged as highly competitive and effi cient fi rms, rapidly growing economic entities, expand-ing their footprints not only in India but over the entire globe (Xu 2012). Several of them fi gure in the list of the world’s largest enterprises, and have emerged as the main drivers of public sector investment in the economy. They account for a signifi cant part of the investment outlays in industry and infrastructure in the fi ve-year plans and their collective invest-ment has been a major factor in the acceleration of the growth of industry, in particular, and the economy, in general.
The large PSEs are also cash rich with internal resources accounting for most of their investment. Collectively, the central PSEs have investable (cash and bank balances) exceed-ing Rs 2,80,000 crore, accounting for more than 3% of GDP (GoI, PES 2013; Chandrasekhar 2013). With profi ts exceeding Rs 2,40,000 crore, they provided to the central government dividends above Rs 45,000 crore. Currently, the retained earnings of India’s PSEs fi nance a large part of their Plan investments and provide a signifi cant part of the fi nance for the economy’s industrial investment.
These SOEs, called PSEs, have long dominated the industrial and commercial sectors in India. They have experienced a chequered history. During the last two decades, when the business environment witnessed dramatic changes that in many ways have few parallels in the world, these PSEs faced unpre cedented challenges and threats. Unlike China, where the private sector was largely absent and hence unable to infl uence policies that shaped competition, the Indian PSEs faced unprecedented pressures as the political economy shifted decidedly in favour of foreign capital and large business, the latter, mainly controlled by business families or groups. This shift means that private competitors could now infl uence the “controllers”, usually politicians and bureaucrats who shape policy as well as regulate and approve further investment and expansion of PSEs.
Despite the policy shift in favour of markets, competition and private incentives, the PSEs have not withered away. The shift in favour of the private sector has strengthened accumu-lation in sectors controlled by large business conglomerates, and the share of the public sector in the economy has relatively declined. Despite this change, PSEs still dominate the banking, insurance and several key manufacturing sectors, including, steel, aluminium, heavy machinery, mining and petroleum. What is more, they continue to play a major role in globalising India and are greatly responsible for the surge in growth rates since 2004. PSEs have signifi cantly shaped technological development; the public-sector pharmaceutical fi rms, by pro viding bulk drugs and assistance to small industries, actually helped establish a globally competitive Indian drugs industry (Chaudhuri 2006). They are also increasingly playing a role in social investment. And, as the Indian economy strug-gles to cope with a global economic crisis that is wrenching
PUBLIC SECTOR
Economic & Political Weekly EPW JANUARY 31, 2015 vol l no 5 49
apart many links in global private accumulation and appropri-ation, they may have a new and important role to play.
PSEs and Technological Self-reliance
The role envisaged for PSEs in India’s fi rst industrial policy (GoI 1956) is well known (IIC 1982; Ram Mohan 2005) and does not need detailed elucidation. It would be enough to underline a few key features of this policy. Strategically, PSEs were to make India self-reliant, technologically as well as in product markets, promote import-substituting industrialisation, develop the industrially backward regions, and prevent concentration of economic power in private monopolies. PSEs were expected to achieve these aims by investing in large industrial projects in core and basic industries like steel, non-ferrous metals, petroleum and petrochemicals, pharma-ceuticals, mining, heavy engineering and machine-building, etc. Infrastructure, electricity, railways and airlines, shipping as well as telecommunication were also envisaged as exclu-sively government enterprises. What is more signifi cant, the private sector was excluded from many of these sectors.
In the early decades after Independence, the savings rate in the Indian economy was rather low; moreover, banking and capital market were both underdeveloped. Financing capital-intensive industries therefore was a challenge. The earlier investment in PSEs was entirely funded from the central government’s budgetary resources. Enormous fi scal efforts were made by the central government to fi nance this investment drive (Chaudhuri 1978; Chakravarty 1987). And, given the low machine-building and technological capabilities, large-scale imports became imperative.
At the beginning of the First Five-Year Plan (1951-56), the country had only fi ve PSEs with a total investment of Rs 290 million. Starting with the Second Five-Year Plan (1956-61), which coincided with the announcement of the Industrial Policy of 1956, there was a spate of new PSEs that were estab-lished in several core and basic industries. Units producing steel, heavy engineering, fertiliser, electricity generation equipment, machine tools, etc, were set up, several of them with technological and fi nancial assistance of the Soviet Union and other East European countries, largely due to very restricted access from the western developed economies.
Subsequently, in the 1970s the government nationalised industries like coal, large commercial banks and all insurance companies. During that period, the central government also took over (and subsequently nationalised) a large number of private sector fi rms that were facing bankruptcy or fi nancial distress. These included dozens of textile fi rms, several engineer-ing fi rms in eastern India, and a few British-owned managing agency houses. As the west Asian oil producers took control over their petroleum resources and raised prices in the early 1970s, the hold of the foreign oil fi rms in the region was under-mined. The Indian government quickly nationalised foreign-owned petroleum refi ning and marketing companies (Kaul 1991).
The central government’s intervention in the economy spawned several organisational forms. First, there are departmental undertakings (railways, post and telecom, ordnance factories) and these follow government accounting standards; then there are
statutory corporations like Oil and Natural Gas Commission, Food Corp, etc; lastly there are a large number of companies under the Companies Act. The latter have emerged as the most favoured form and many statutory corporations have been converted into companies. The PSEs registered as companies also follow the accounting standards enshrined in the Companies Act. Our study is largely limited to PSEs registered under the Companies Act.
Political Economy of the Public Sector
It would be impossible to understand the formation of the public sector without a discussion, however brief, of its political-economy underpinnings. These “temples of modern India” were viewed by upper-middle-class professionals and even sections of the bourgeoisie as tools to building a modern successful nation state which was different from both the colonial and the traditional. The public sector, therefore, attracted at that point the best and the brightest who as engineers and managers worked under numerous constraints and acute shortages of imported inputs, forcing them to innovate and develop domestic sources and materials.
The rise of a large and expanding public sector, despite a thriv-ing market economy and large private sector, drew the attention of political economists to the evolving nature of Indian capital-ism. Though there were sharp differences in the debates on the characterisation of Indian development, several observers pointed to the special nature of the Indian society and economy.
First, it was characterised by a relatively large middle class that had played a leading role in the anti-colonial struggle. Second, it had succeeded in sweeping away the dominant feudal elements, namely, the princes and large landlords, though it failed to seize land from the larger capitalist peasants and those with superior tenancy rights. Along with the failure to redistribute land, the emergent class coalition also failed to secure tenancy rights for lower intermediaries and actual cultivators. This was partly because a signifi cant section of emergent middle class grew out of the upper section of the tenants and were also from the dominant castes (Misra 1978; Kalecki 1972; Myrdal 1968). The emergent coalition wanted to rapidly industrialise India and felt that the bourgeoisie and the fi rms operating under the British managing agency system were not up to the challenge (Chattopadhyay 1987).
Hence, the middle class took on the task of playing a central role in the industrial investment and modernisation of the economy. With the West declining to cooperate, the Soviet Union emerged as the main source of technology and fi nance. By the late 1960s, India had embarked on an ambitious programme of industrialisation led by the public sector, with increased levels of investment, fi nanced largely by fi scal savings but also with fi nancial aid from the Soviet Union. The Soviet Union also promoted the idea of an “independent” and socialist coalition of classes, which could shape a development state free of the tentacles of western imperialism (Chandra 2004).
Hamza Alavi described this coalition as a “bureaucratic military oligarchy” that derived its power from playing the three other social classes, namely the domestic bourgeoisie, feudal landlords/semi-feudal landholders and the rich peasantry,
PUBLIC SECTOR
JANUARY 31, 2015 vol l no 5 EPW Economic & Political Weekly50
and foreign capital against one another (Alavi 1972). As the indigenous bourgeoisie was weak and unable to subordinate the highly-developed colonial state apparatus that the country inherited, this “middle group” was able to establish its grip on the state apparatus and lay its hands on a large economic surplus that it deployed under state control.
In India, by the mid-1970s, the middle-class coalition, led by the state bureaucracy, had already succeeded in laying its hands on more than 50% of the economy’s surplus, and made the public sector the main site of capital accumulation. Nation-alisation of banks, insurance, mines and few key industries meant that key input prices paid by the private sector, includ-ing that of credit, were controlled by the bureaucracy. It is this fact that led many observers to assign a central role to the middle class in characterising Indian capitalism. Kalecki called it a regime led by the “intermediate classes” and the state under control of “intermediate regime” (Raj 1973).
The slowdown in industrial growth rates in the 1970-85 period, however, weakened this coalition. Simultaneously, there was the emergence of a new breed of entrepreneurs who were impatient with the tight control of the bureaucracy. The children of senior politicians and bureaucrats also emerged as new businessmen, often with dubious sources of initial capital and other sources of primitive accumulation (Khanna 1987). A large number of non-resident Indians (NRIs), who had done well in emerging industries like software and pharmaceuticals, were returning to India and wanted freedom to operate without the restrictive licensing and permits that characterised India of the 1970s.
Simultaneously, by the late 1980s the hegemony of the middle class-led bureaucratic capital was under siege. Collapse of the Soviet Union – a major source of technology, credit and capital goods for PSEs (Chandra 2004) – further damaged its prospects. By the early 1990s, India was ready for change, as bureaucratic capital stood discredited and unable to resolve the emerging contradictions.
The unresolved contradictions refl ected in a looming fi scal crisis which alongside the growth of new import-intensive consumer goods industries, and dependence on short-term borrowings, triggered a fi scal and balance of payments crisis. This short-term crisis was used by the increasingly differentiated middle class with transborder links to ally with the now expanded domestic bourgeoisie in alliance with transnational capital to push bureau-cratic capital into a corner. The most important and concrete outcome of this was the emasculation of the public sector.
PSEs on the Eve of Deregulation and Privatisation
The public sector in India is spread at many levels: central govern-ment enterprises, both departmental and non-departmental undertakings; state-level enterprises owned by state governments; a few jointly-owned by state and central governments; several enterprises jointly owned by the public and private sector; and a few owned by local governments (municipal corporations). As mentioned, for our analysis we call all companies registered under the Companies Act (“non-departmental commercial enter-prises” in national accounts – rechristened “Public Corporate Sector” by us) and having state control exceeding 50% as PSEs.
Till recently, there was little centralised information or details of the working of state-level enterprises. However, the Department of Public Enterprises (DPE) has tried to fi ll the gap by two major Surveys of State Level Enterprises (GoI 2007).
In the 1990s, the central government had about 332 PSEs (hitherto called central public sector enterprises, or CPSEs). Though the National Accounts classify these as “non- departmental commercial enterprises”, in reality only a small number may be classifi ed as “commercial”. A large number of CPSEs are actually sick private sector units; many others are actually promotional agencies, while others are mere organisational mechanisms to channel subsidies to backward regions or social groups.
The votaries of neo-liberal policies had long argued that India’s industrial strategy, based on import substitution and building of heavy industry and capital goods in the public sector, was enormously ineffi cient (Bhagwati and Desai 1970; Bhagwati et al 1975; World Bank 1990). The basic fl aw in the argument was that the “deemed” costs of domestic and imported inputs were artifi cially infl ated, reducing the domestic value added as shown by a number of scholars (Nambiar 1983; Chandrasekhar 1992). Chandra, who has repeatedly written on the issue of effi ciency of Indian industry, strongly refutes the argument that protection necessarily results in higher-cost or ineffi cient production. He shows that there is ample evidence that Indian products, especially capital goods, were far cheaper than those of their international competitors. To quote Chandra (2013):
A series of studies from the 1970s indicate that by this yardstick our industries have generally, with some important exceptions, been effi -cient. In particular, if one considers ‘short-run’ DRC [domestic resource cost] for fi rms that export only a small part of their output, Indian fi rms have been effi cient almost without exception. Most telling are two in-depth studies on India’s capital goods industries by the World Bank (1975 and 1984). For each study, large teams of engineers, acco-untants, and economists visited the plants and examined the balance sheets and other data. In textile machinery, the best Indian fi rms in 1975 had achieved global quality, and their prices were lower than abroad by 12-35%. Somewhat similar was the fi nding for fi ve major capital goods industries in the early 1980s.
Yet by 1991, India was at the mercy of multilateral institutions like the International Monetary Fund (IMF) and the World Bank, both of which provided large bailout packages. The domestic corporate lobbies, so far kept on leash by an assertive bureauc-racy and a vocal middle class, pushed for a regime change.
As the policy of liberalisation and deregulation gathered pace in the 1990s, along with policies to promote increasing integration of the Indian economy with the global economy, PSEs were robbed of their historic role. On 24 July 1991, an NIP, which opened up most sectors of the economy to private entry and investment, was announced. Simultaneously, foreign investment was welcomed; foreign-owned enter-prises could now hold 51% or more in the enterprises set up in the country (Joshi and Little 1996). Foreign institutional investors (FIIs) were allowed to invest in the Indian stock exchanges and restrictions on mergers and acquisitions were abolished. The NIP announced that the exclusive role of the public sector was to be limited to a few strategic sectors.
PUBLIC SECTOR
Economic & Political Weekly EPW JANUARY 31, 2015 vol l no 5 51
With the shift in public policy towards liberalisation and deregulation, the business environment of PSEs underwent a radical change. The most signifi cant of these changes are (Khanna 2012):(a) Free entry to private sector fi rms in industries reserved exclusively for PSEs. The most signifi cant of industries affected by this policy were telecommunications, petroleum (from extraction to refi ning and marketing), electricity generation and distribution, several basic goods industries like steel, aluminium, etc, mining and air transportation. (b) Disinvestment of a small part of the government’s share-holding (while still holding majority stocks) and listing of PSEs on the stock exchanges.(c) Ensuring that the listed PSEs follow the stock exchanges’ listing requirements including disclosure and governance regulations, appointment of independent directors, independ-ent remuneration and audit committees, etc.(d) Withholding or withdrawing budgetary support to loss-making (“sick”) PSEs. Subsequently, sick PSEs were denied permission to revise wages and salaries.(e) Loss-making PSEs were to be encouraged to lay off workers to seek commercial viability, failing which, they were to be closed down or privatised.
The radical shift in public policy was based on an ideologi-cal shift towards market-based reforms and neo-liberal ideol-ogy. The clamour for large-scale privatisation from foreign investors and several Indian and foreign advisors became pronounced. Privatisation was not directly stated in the government policy announcement, but was more clearly artic-ulated by the advisers appointed by the Indian government (GoI 1993; Bhagwati and Srinivasan 1993; Bhandari and Goswami 2000). PSEs were assumed to be “immensely ineffi -cient”. These advisers also called for renouncing the creation of new PSEs in areas where the private enterprises were willing to invest. Bhagwati and Srinivasan (1993), however, insisted that the sale of fractional equity on the stock exchange did not adequately signal to PSE managers that they should improve their effi ciency and productivity and they favoured “privatisa-tion” that transfers control and management to the private sector (Bhagawati and Srinivasan 1993: 50).
The advice of the World Bank (Seabright 1993) and neo- liberal economists (Bhagawati and Srinivasan 1993; Bhandari and Goswami 2000) was to restructure the PSEs with the aim of complete privatisation. Yet the actual evolution of the policy faced opposition and resistance, and took many years (Hall et al 2005). Almost all sales of PSEs by the BJP govern ment in the late 1990s invited sharp criticism from the Comptroller and Auditor General (CAG) (GoI 2006).
The sudden shift in the public policy and the business environ-ment of state enterprises had the potential to undermine the profi tability and economic viability of most enterprises. It was widely believed that the PSEs were ineffi cient and used resources badly and subjecting them to market forces and competition would help in restructuring them. With adequate support from the government and the National Renewal Fund, the latter, established with the assistance of the World Bank, the human
cost of PSE restructuring would be minimised. The government encouraged all the PSEs, but especially the loss-making enter-prises, to reduce their workforce wherever possible through a scheme of “voluntary retirement” (Roychowdhury 2003). It is estimated that approximately half a million workers were forced to leave.3
The dismantling of the public sector, in the name of reforms and deregulation, has gone through three distinct phases (Dhameja 2006), refl ecting the changing political coalitions and underlying political economy.
First Phase of Reforms, 1992-98: The Congress Party-led government embarked on a policy of divesting up to 20% of shares to mutual funds (fractional equity sale), the general public and workers. From 1993-94, FIIs were also allowed to bid for shares. However, despite the recommendation of the Rangarajan Committee (GoI 1993) to divest up to 74% of shares in non-strategic areas, only one CPSE was privatised – the automobile company Maruti Udyog was sold to the Japanese partner Suzuki. A few CPSEs were sold to other PSEs in the same sector. Thus, the petroleum marketing company IBP was sold to Indian Oil Corporation (IOC) (both CPSEs), which has a dominant position in the petroleum refi ning and marketing sector.
Along with the new industrial policy, the government decided to review the portfolio of investment in PSEs with the view to focus on enterprises in strategic, high-technology sectors and on essen-tial infrastructure. Moreover, restrictions on the private sector in areas that so far had been exclusively reserved for state invest-ment were withdrawn. Simultaneously, the PSEs were also to be allowed to enter any sector that was not earlier reserved for it.
In addition, the government announced that PSEs that were chronically sick and could not be turned around were to be referred to the Board for Industrial and Financial Restructuring (BIFR) or similar high-level institutions to be created for this purpose. A social security mechanism to protect the interest of workers likely to be retrenched or laid off was to be developed. The government also announced that to raise resources as well as encourage wider public participation, a part of the government’s shareholding in PSEs was to be offered to mutual funds, fi nancial institutions, workers and the public at large.
The boards of the PSEs were to be made more professional and given greater powers. Soon the government announced a list of companies, which were designated as Navratnas, where the company board would have substantially enhanced powers to undertake investments, acquire assets and compa-nies in India and abroad and enjoy greater autonomy. Such enterprises were usually the better managed and more profi t-able ones, often with a dominant position in a sector or a branch of industry. Over the years, the list of such enterprises was expanded with graded levels of autonomy.4
Second Phase of Reforms, 1998-2004: The government was now headed by a coalition led by the right-wing BJP, which decided on large-scale privatisation or strategic sale of a controlling stake to private parties as well as to better-perform-ing PSEs. In all, a dozen PSEs were privatised during this period
PUBLIC SECTOR
JANUARY 31, 2015 vol l no 5 EPW Economic & Political Weekly52
and in two cases the government-controlling block was sold to other PSEs in the same sector, realising a total of Rs 63.5 billion from such strategic sales. Amongst the major PSEs privatised were Indian Petrochemicals, VSNL (which had a monopoly on long-distance telecommunications traffi c and was the largest provider of internet services), Bharat Aluminium, and 18 hotels run by the Indian Tourism Development Corporation. In addition, the government stake of 4.5% in the Gas Authority of India was sold to ONGC and IOC, both of which were large and cash-rich PSEs in the petroleum sector.
Third Phase of Reforms, 2004-14: Once again the govern-ment was led by the Congress Party, in alliance with others, including the two communist parties. Until 2009 the government depended on the communist parties for support and during this period, privatisation was discontinued. Under pressure from the communist parties and trade unions, the government agreed to make serious efforts to revive the underperforming or “sick” CPSEs. It appointed a Board for Reconstruction of Public Sector Enterprises (BRPSE) with a mandate to undertake fi nancial restructuring and revival of sick PSEs. During this period, BRPSE recommended restructuring of 60 PSEs, the closure of two and the strategic sale of two other enterprises.
In 1997, the Disinvestment Commission pronounced that the government had failed to provide a “level playing fi eld” to PSEs. It stated that though the private sector had been granted full freedom to enter any industry, add capacities, enter sectors hitherto reserved for PSEs (such as telecommunications, gener-ation and distribution of electricity, petroleum extraction and refi ning), the public sector faced several handicaps while compet-ing against the private enterprises. The commission felt that despite the promise of greater autonomy to PSEs in the policy state-ments, they still had to obtain multilevel and time-consuming approval for decisions and were accountable to multiple agencies with varying mandates. “This lack of autonomy has created a somewhat unequal playing fi eld for the PSUs [PSEs] in an increasingly competitive environment” (GoI 1997: 7).
In response to these criticisms, as well as the reversal of the BJP’s privatisation programme, the Congress Party-led govern-ment appointed in 2004 a committee under Arjun Sengupta to look into ways of granting “full managerial and commercial autonomy” to central government PSEs, with a view to enhancing their ability to respond to market-based competition from private sector fi rms (GoI 2005). The committee recommen ded sweeping changes in the relationship between the controlling ministry and the PSEs, since it felt that the ministries’ numerous and detailed interventions in routine operations of PSEs were a serious erosion of their autonomy to carry out business. It wanted all major decisions, both strategic and operational, to be under the control of the board of directors, where at least half of the board members would be independent directors.
In case a ministry wanted to issue any instructions to a PSE, it should use the mechanism of a “Presidential Decree”, which would require the approval of the entire cabinet. It also sought to insulate PSEs from “Parliamentary interference” that could require PSEs to reveal commercially sensitive information that
could help its private sector competitors. It recommended a “negative list” where the government would have no say, inclu-ding decisions on pricing, distribution, import/export, appoint-ment of dealers and agents and promotion of employees. The powers of Navratnas to set up joint ventures or invest were to be enhanced. In addition, it recommended sector- specifi c super-visory bodies to review the performance of PSEs (GoI 2005).
Despite the break with the communist parties in 2009 and the formation of a new Congress-led coalition government, the policy of privatisation was not resumed. The government continued to sell small amounts of shares in the PSEs listed on the stock exchange with a view to raise resources to bridge the government’s rising defi cit. In recent years, it has also asked PSEs to increase the rate of dividend (ET 2014).
To sum up, despite strident demands from many economists and multilateral institutions, the Congress party-led govern-ment found it diffi cult to carry out any further privatisation or strategic sale of CPSEs. However, some SPSEs (PSEs owned by state/provincial governments) have been sold in some states. The central government, however, continued its policy of selling shares held by the government in enterprises to mutual funds, fi nancial institutions, workers and the public at large, but the sales (of fractional equity) have not resulted in change of control or privatisation (GoI 2007a).
The Narendra Modi government has, however, announced sale of chronically sick PSEs. How far it will go, and what will be the reaction of trade unions and public at large, is still to unfold. It is likely that closing or selling a few small units, often with obsolete products/technology (Hindustan Cables with lead clad cables, Tyre Corporation without radial tyre capacity, Inland Waterways Corp with obsolete fl eet and no service) may not generate much resistance. But “strategic” sale of profi t-making units to private moneybags may not go unchallenged.
Restructuring and Reconstitution of CPSEs/PSEs
Why did the successive governments in India fail to undertake large-scale privatisation? Why did the earlier National Demo cratic Alliance (NDA) government fail to carry out its plan to sell all PSEs in all industries, except units in the defence and atomic energy sectors, as the Disinvestment Commission had suggested? Will the Modi-led government be more successful? We turn to the political economy of the reforms programme.
First, though successive governments espoused their commit-ment to reforms and privatisation, there is overwhelming evidence that the majority of voters were opposed to the economic reforms, in general, and privatisations, in particular.5 Second, the governments that carried out these reforms faced resistance from trade unions and middle-class consumers, who were afraid of increased prices of goods, services, etc. Third, successive govern-ments were defeated in elections (India had fi ve governments during the 1991-99 period), forcing the political parties to be wary of the electoral costs of large-scale privatisation. Fourth, a number of cases of privatisation of PSEs by the BJP-led govern-ment during the period 2000-04 invited sharp criticism. Many fi rms and assets (e g, hotels) sold by the Vajpayee government were resold by the acquiring parties at substantially higher prices
PUBLIC SECTOR
Economic & Political Weekly EPW JANUARY 31, 2015 vol l no 5 53
(GoI 2006). There were allegations of large-scale corruption and the sale of valuable assets at low prices. Privatisation of PSEs and destruction of UTI was considered a factor in the defeat of the NDA in the 2004 elections. Lastly, given the large weight of PSEs in industrial assets and sales, large-scale privatisation could result in economic dislocation, jeopardising growth.
Indeed, as it became clear to the political establishment that privatisation was fraught with high risk, a new role for PSEs began to be envisaged. This was also possible due to signifi -cant changes in the governance structures and autonomy to managers, as well as substantial improvement in the profi ts and growth by PSEs. However, the acceleration in the growth trajectory of the economy from 2004, driven by increasing investment in the economy, was to change the role of both the private and public corporate sectors in the economy.
Changing Role of PSEs
The declining role of public sector and the rise of Indian private corporate sector as the leading site of accumulation in the 1990s are linked to the collapse of public fi nancing of investment and the growing fi scal crisis that seized the state apparatus. From the late 1980s, the growing fi scal crisis undermined the State’s capacity to fi nance investment as well as expanding defence expenditure.
The new Congress government that came to power in 1991, partly in response to conditionality imposed by the IMF to
meet a balance of payments crisis and partly due to domestic pressures, shifted the levers to provide a greater role for the market and increasing integration with the global economy. There began a period of gradual withdrawal of the state, with a clear shift in favour of the large bourgeoisie, the private corporate sector and global capital.
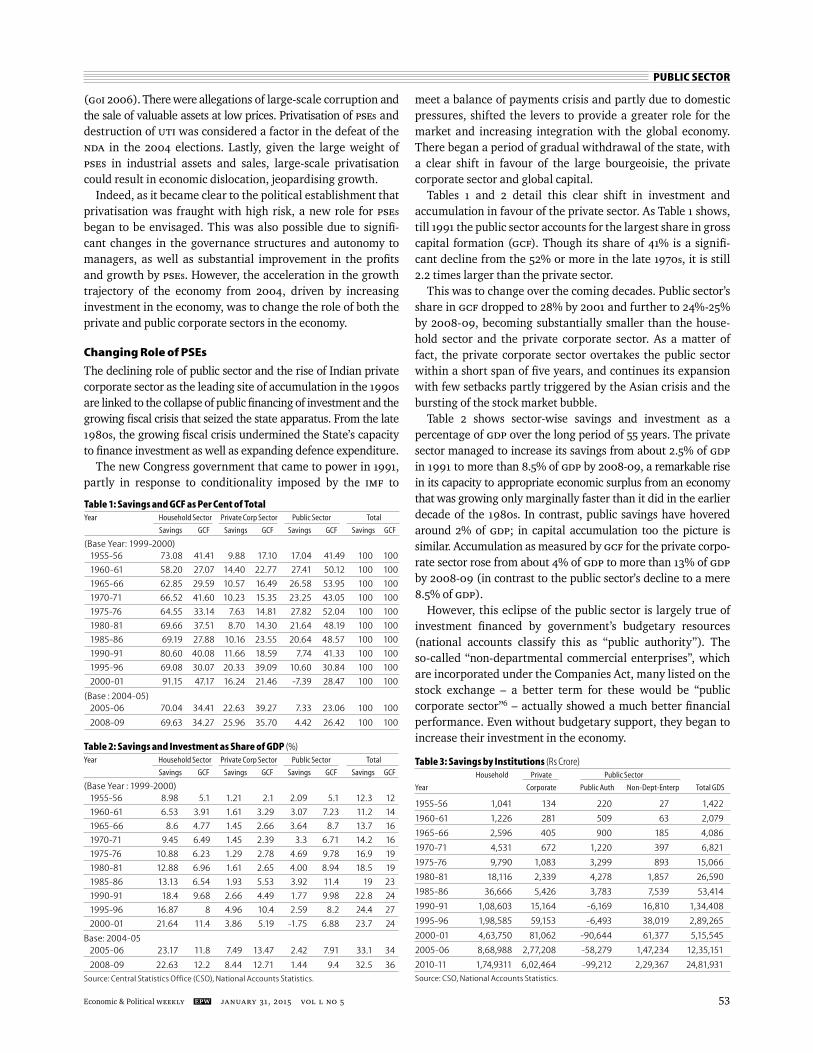
Tables 1 and 2 detail this clear shift in investment and accumulation in favour of the private sector. As Table 1 shows, till 1991 the public sector accounts for the largest share in gross capital formation (GCF). Though its share of 41% is a signifi -cant decline from the 52% or more in the late 1970s, it is still 2.2 times larger than the private sector.
This was to change over the coming decades. Public sector’s share in GCF dropped to 28% by 2001 and further to 24%-25% by 2008-09, becoming substantially smaller than the house-hold sector and the private corporate sector. As a matter of fact, the private corporate sector overtakes the public sector within a short span of fi ve years, and continues its expansion with few setbacks partly triggered by the Asian crisis and the bursting of the stock market bubble.
Table 2 shows sector-wise savings and investment as a percentage of GDP over the long period of 55 years. The private sector managed to increase its savings from about 2.5% of GDP in 1991 to more than 8.5% of GDP by 2008-09, a remarkable rise in its capacity to appropriate economic surplus from an economy that was growing only marginally faster than it did in the earlier decade of the 1980s. In contrast, public savings have hovered around 2% of GDP; in capital accumulation too the picture is similar. Accumulation as measured by GCF for the private corpo-rate sector rose from about 4% of GDP to more than 13% of GDP by 2008-09 (in contrast to the public sector’s decline to a mere 8.5% of GDP).
However, this eclipse of the public sector is largely true of investment fi nanced by government’s budgetary resources (national accounts classify this as “public authority”). The so-called “non-departmental commercial enterprises”, which are incorporated under the Companies Act, many listed on the stock exchange – a better term for these would be “public corporate sector”6 – actually showed a much better fi nancial performance. Even without budgetary support, they began to increase their investment in the economy.
Table 1: Savings and GCF as Per Cent of Total Year Household Sector Private Corp Sector Public Sector Total
Savings GCF Savings GCF Savings GCF Savings GCF
(Base Year: 1999-2000) 1955-56 73.08 41.41 9.88 17.10 17.04 41.49 100 100
1960-61 58.20 27.07 14.40 22.77 27.41 50.12 100 100
1965-66 62.85 29.59 10.57 16.49 26.58 53.95 100 100
1970-71 66.52 41.60 10.23 15.35 23.25 43.05 100 100
1975-76 64.55 33.14 7.63 14.81 27.82 52.04 100 100
1980-81 69.66 37.51 8.70 14.30 21.64 48.19 100 100
1985-86 69.19 27.88 10.16 23.55 20.64 48.57 100 100
1990-91 80.60 40.08 11.66 18.59 7.74 41.33 100 100
1995-96 69.08 30.07 20.33 39.09 10.60 30.84 100 100
2000-01 91.15 47.17 16.24 21.46 -7.39 28.47 100 100
(Base : 2004-05) 2005-06 70.04 34.41 22.63 39.27 7.33 23.06 100 100
2008-09 69.63 34.27 25.96 35.70 4.42 26.42 100 100
Table 2: Savings and Investment as Share of GDP (%)Year Household Sector Private Corp Sector Public Sector Total
Savings GCF Savings GCF Savings GCF Savings GCF
(Base Year : 1999-2000) 1955-56 8.98 5.1 1.21 2.1 2.09 5.1 12.3 12
1960-61 6.53 3.91 1.61 3.29 3.07 7.23 11.2 14
1965-66 8.6 4.77 1.45 2.66 3.64 8.7 13.7 16
1970-71 9.45 6.49 1.45 2.39 3.3 6.71 14.2 16
1975-76 10.88 6.23 1.29 2.78 4.69 9.78 16.9 19
1980-81 12.88 6.96 1.61 2.65 4.00 8.94 18.5 19
1985-86 13.13 6.54 1.93 5.53 3.92 11.4 19 23
1990-91 18.4 9.68 2.66 4.49 1.77 9.98 22.8 24
1995-96 16.87 8 4.96 10.4 2.59 8.2 24.4 27
2000-01 21.64 11.4 3.86 5.19 -1.75 6.88 23.7 24
Base: 2004-05 2005-06 23.17 11.8 7.49 13.47 2.42 7.91 33.1 34
2008-09 22.63 12.2 8.44 12.71 1.44 9.4 32.5 36
Source: Central Statistics Office (CSO), National Accounts Statistics.
Table 3: Savings by Institutions (Rs Crore) Household Private Public Sector
Year Corporate Public Auth Non-Dept-Enterp Total GDS
1955-56 1,041 134 220 27 1,422
1960-61 1,226 281 509 63 2,079
1965-66 2,596 405 900 185 4,086
1970-71 4,531 672 1,220 397 6,821
1975-76 9,790 1,083 3,299 893 15,066
1980-81 18,116 2,339 4,278 1,857 26,590
1985-86 36,666 5,426 3,783 7,539 53,414
1990-91 1,08,603 15,164 -6,169 16,810 1,34,408
1995-96 1,98,585 59,153 -6,493 38,019 2,89,265
2000-01 4,63,750 81,062 -90,644 61,377 5,15,545
2005-06 8,68,988 2,77,208 -58,279 1,47,234 12,35,151
2010-11 1,74,9311 6,02,464 -99,212 2,29,367 24,81,931
Source: CSO, National Accounts Statistics.
PUBLIC SECTOR
JANUARY 31, 2015 vol l no 5 EPW Economic & Political Weekly54
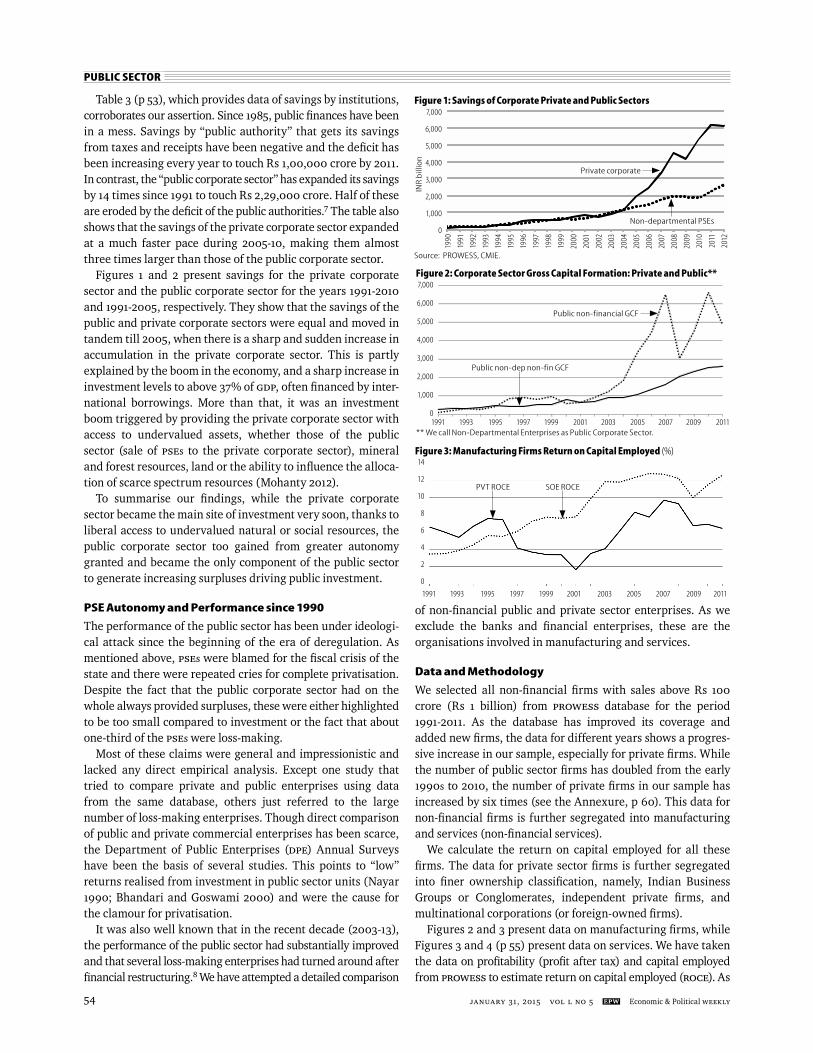
Table 3 (p 53), which provides data of savings by institutions, corroborates our assertion. Since 1985, public fi nances have been in a mess. Savings by “public authority” that gets its savings from taxes and receipts have been negative and the defi cit has been increasing every year to touch Rs 1,00,000 crore by 2011. In contrast, the “public corporate sector” has expanded its savings by 14 times since 1991 to touch Rs 2,29,000 crore. Half of these are eroded by the defi cit of the public authorities.7 The table also shows that the savings of the private corporate sector expanded at a much faster pace during 2005-10, making them almost three times larger than those of the public corporate sector.
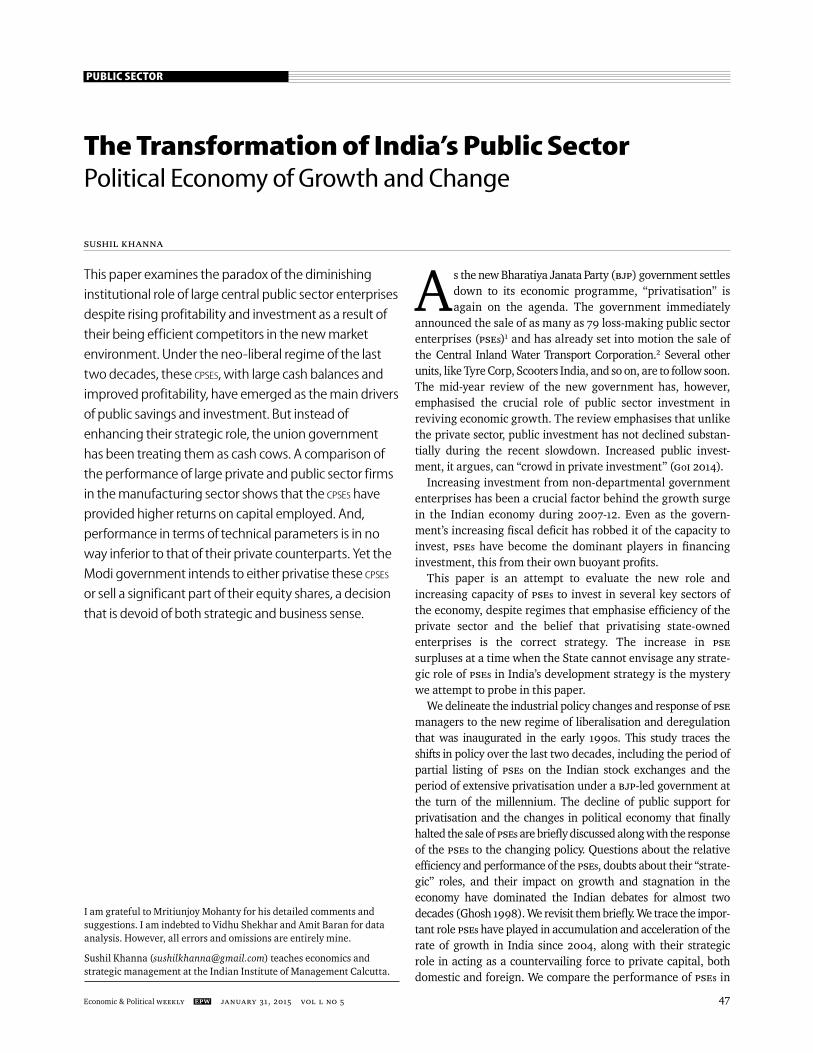
Figures 1 and 2 present savings for the private corporate sector and the public corporate sector for the years 1991-2010 and 1991-2005, respectively. They show that the savings of the public and private corporate sectors were equal and moved in tandem till 2005, when there is a sharp and sudden increase in accumulation in the private corporate sector. This is partly explained by the boom in the economy, and a sharp increase in investment levels to above 37% of GDP, often fi nanced by inter-national borrowings. More than that, it was an investment boom triggered by providing the private corporate sector with access to undervalued assets, whether those of the public sector (sale of PSEs to the private corporate sector), mineral and forest resources, land or the ability to infl uence the alloca-tion of scarce spectrum resources (Mohanty 2012).
To summarise our fi ndings, while the private corporate sector became the main site of investment very soon, thanks to liberal access to undervalued natural or social resources, the public corporate sector too gained from greater autonomy granted and became the only component of the public sector to generate increasing surpluses driving public investment.
PSE Autonomy and Performance since 1990
The performance of the public sector has been under ideologi-cal attack since the beginning of the era of deregulation. As mentioned above, PSEs were blamed for the fi scal crisis of the state and there were repeated cries for complete privatisation. Despite the fact that the public corporate sector had on the whole always provided surpluses, these were either highlighted to be too small compared to investment or the fact that about one-third of the PSEs were loss-making.
Most of these claims were general and impressionistic and lacked any direct empirical analysis. Except one study that tried to compare private and public enterprises using data from the same database, others just referred to the large number of loss-making enterprises. Though direct comparison of public and private commercial enterprises has been scarce, the Department of Public Enterprises (DPE) Annual Surveys have been the basis of several studies. This points to “low” returns realised from investment in public sector units (Nayar 1990; Bhandari and Goswami 2000) and were the cause for the clamour for privatisation.
It was also well known that in the recent decade (2003-13), the performance of the public sector had substantially improved and that several loss-making enterprises had turned around after fi nancial restructuring.8 We have attempted a detailed com parison
of non-fi nancial public and private sector enterprises. As we exclude the banks and fi nancial enterprises, these are the organisations involved in manufacturing and services.
Data and Methodology
We selected all non-fi nancial fi rms with sales above Rs 100 crore (Rs 1 billion) from PROWESS database for the period 1991-2011. As the database has improved its coverage and added new fi rms, the data for different years shows a progres-sive increase in our sample, especially for private fi rms. While the number of public sector fi rms has doubled from the early 1990s to 2010, the number of private fi rms in our sample has increased by six times (see the Annexure, p 60). This data for non-fi nancial fi rms is further segregated into manufacturing and services (non-fi nancial services).
We calculate the return on capital employed for all these fi rms. The data for private sector fi rms is further segregated into fi ner ownership classifi cation, namely, Indian Business Groups or Conglomerates, independent private fi rms, and multinational corporations (or foreign-owned fi rms).
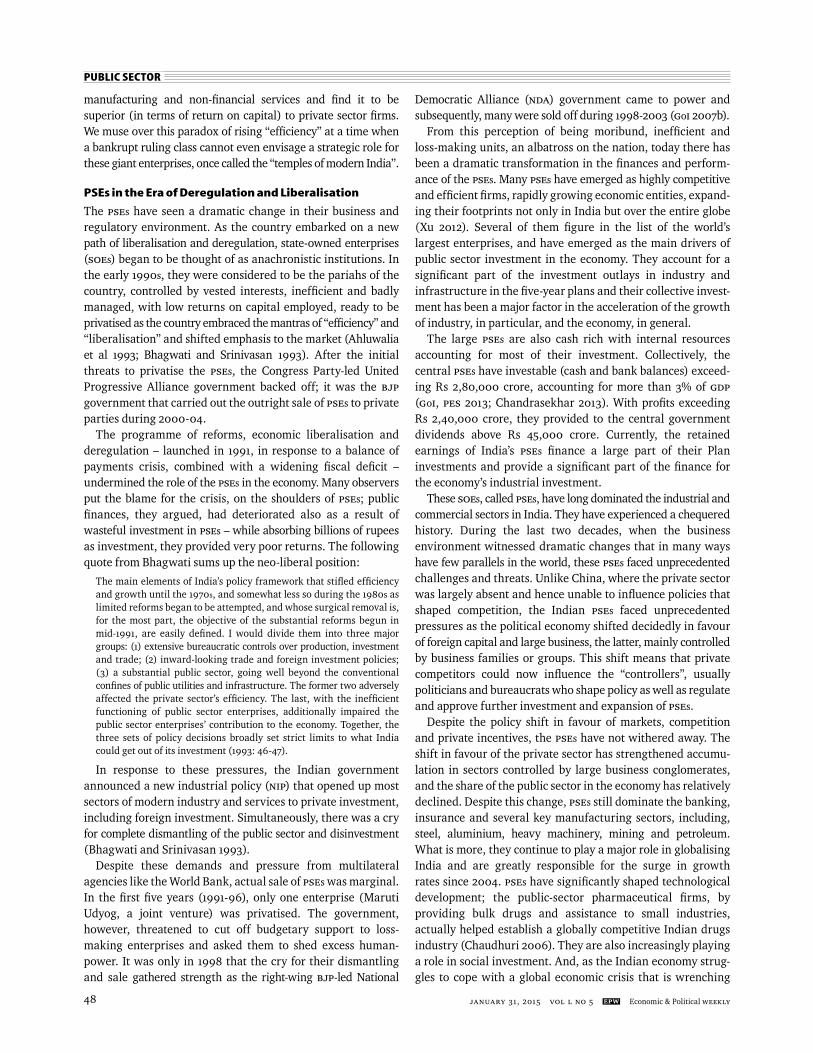
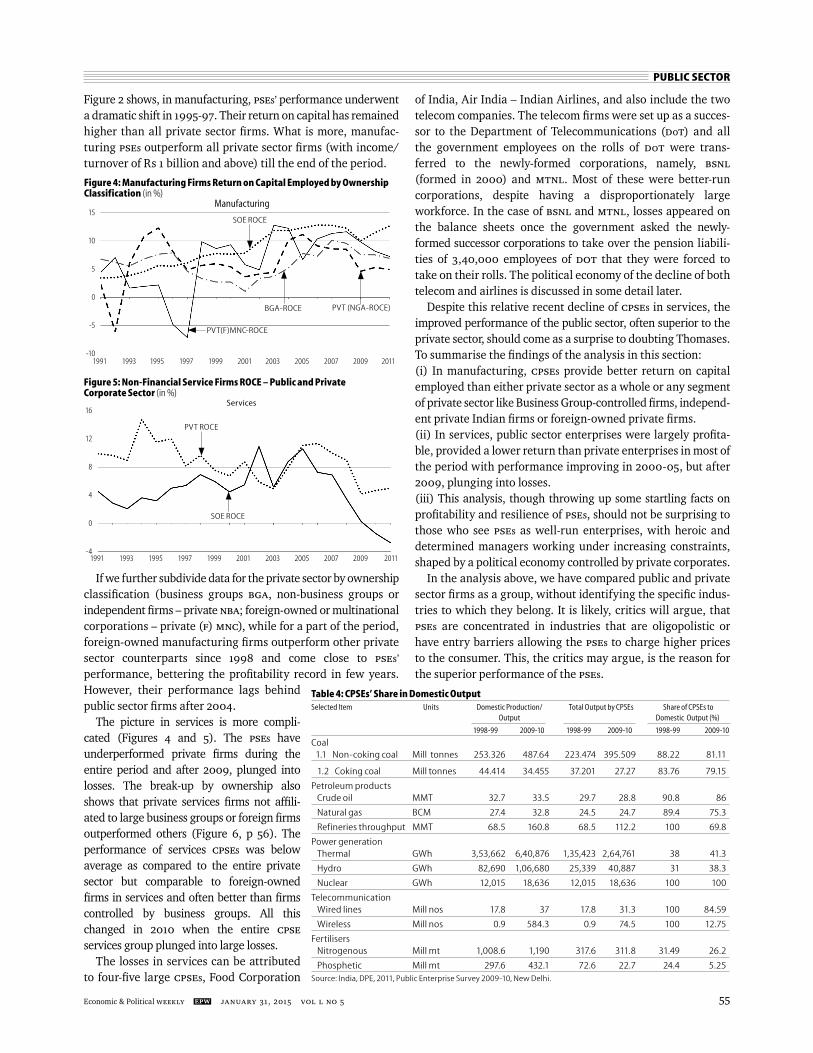
Figures 2 and 3 present data on manufacturing fi rms, while Figures 3 and 4 (p 55) present data on services. We have taken the data on profi tability (profi t after tax) and capital employed from PROWESS to estimate return on capital employed (ROCE). As
Figure 2: Corporate Sector Gross Capital Formation: Private and Public**
** We call Non-Departmental Enterprises as Public Corporate Sector.
7,000
6,000
5,000
4,000
3,000
2,000
1,000
0
Public non-dep non-fin GCF
Public non-financial GCF
1991 1993 1995 1997 1999 2001 2003 2005 2007 2009 2011
Figure 3: Manufacturing Firms Return on Capital Employed (%)14
12
10
8
6
4
2
0
PVT ROCE SOE ROCE
1991 1993 1995 1997 1999 2001 2003 2005 2007 2009 2011
Savings of Corporate Sector
INR
bill
ion
Figure 1: Savings of Corporate Private and Public Sectors
Source: PROWESS, CMIE.
7,000
6,000
5,000
4,000
3,000
2,000
1,000
0Non-departmental PSEs
Private corporate
1990
1991
1992
1993
1994
1995
1996
1997
1998
1999
2000
2001
2002
2003
2004
2005
2006
2007
2008
2009
2010
2011
2012
PUBLIC SECTOR
Economic & Political Weekly EPW JANUARY 31, 2015 vol l no 5 55
Figure 2 shows, in manufacturing, PSEs’ performance underwent a dramatic shift in 1995-97. Their return on capital has remained higher than all private sector fi rms. What is more, manufac-turing PSEs outperform all private sector fi rms (with income/turnover of Rs 1 billion and above) till the end of the period.
If we further subdivide data for the private sector by ownership classifi cation (business groups BGA, non-business groups or independent fi rms – private NBA; foreign-owned or multinational corporations – private (F) MNC), while for a part of the period, foreign-owned manufacturing fi rms outperform other private sector counterparts since 1998 and come close to PSEs’
pe rformance, bettering the profi tability record in few years. However, their performance lags behind public sector fi rms after 2004.
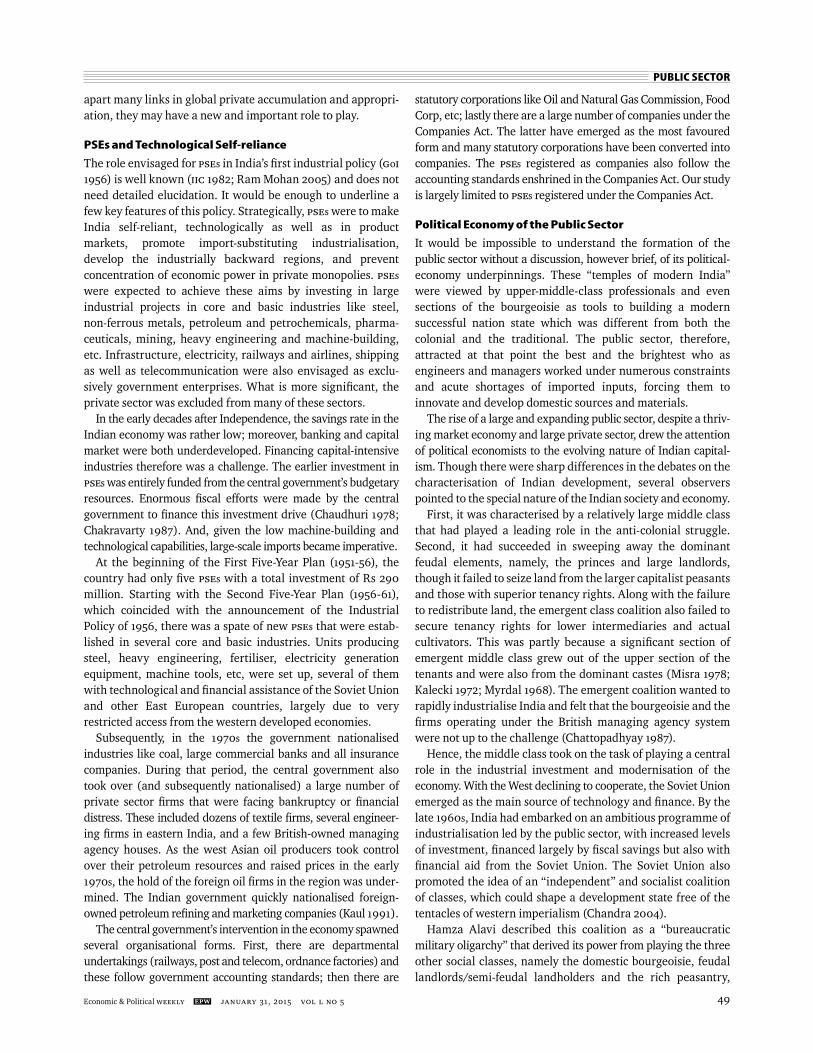
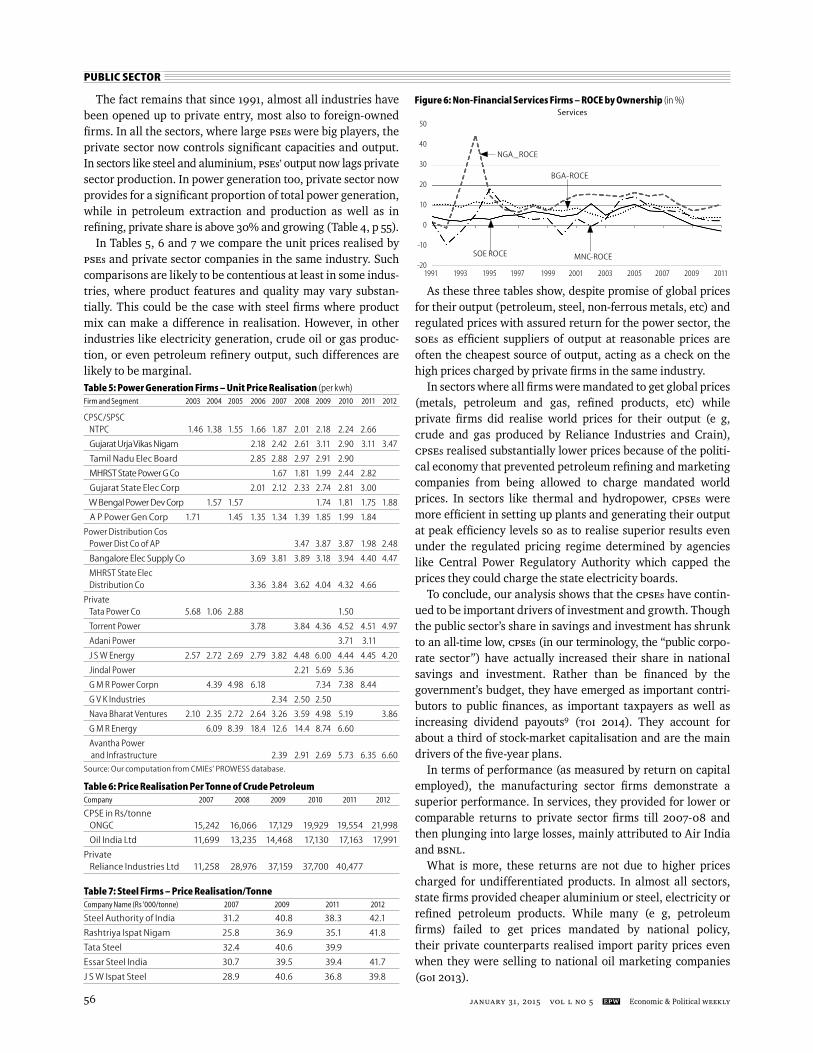
The picture in services is more compli-cated (Figures 4 and 5). The PSEs have underperformed private fi rms during the entire period and after 2009, plunged into losses. The break-up by ownership also shows that private services fi rms not affi li-ated to large business groups or foreign fi rms outperformed others (Figure 6, p 56). The performance of services CPSEs was below average as compared to the entire private sector but comparable to foreign-owned fi rms in services and often better than fi rms controlled by business groups. All this changed in 2010 when the entire CPSE
services group plunged into large losses.The losses in services can be attributed
to four-fi ve large CPSEs, Food Corporation
of India, Air India – Indian Airlines, and also include the two telecom companies. The telecom fi rms were set up as a succes-sor to the Department of Telecommunications (DoT) and all the government employees on the rolls of DoT were trans-ferred to the newly-formed corporations, namely, BSNL
(formed in 2000) and MTNL. Most of these were better-run corporations, despite having a disproportionately large workforce. In the case of BSNL and MTNL, losses appeared on the balance sheets once the government asked the newly-formed successor corporations to take over the pension liabili-ties of 3,40,000 employees of DOT that they were forced to take on their rolls. The political economy of the decline of both telecom and airlines is discussed in some detail later.
Despite this relative recent decline of CPSEs in services, the improved performance of the public sector, often superior to the private sector, should come as a surprise to doubting Thomases. To summarise the fi ndings of the analysis in this section: (i) In manufacturing, CPSEs provide better return on capital employed than either private sector as a whole or any segment of private sector like Business Group-controlled fi rms, independ-ent private Indian fi rms or foreign-owned private fi rms.(ii) In services, public sector enterprises were largely profi ta-ble, provided a lower return than private enterprises in most of the period with performance improving in 2000-05, but after 2009, plunging into losses. (iii) This analysis, though throwing up some startling facts on profi tability and resilience of PSEs, should not be surprising to those who see PSEs as well-run enterprises, with heroic and determined managers working under increasing constraints, shaped by a political economy controlled by private corporates.
In the analysis above, we have compared public and private sector fi rms as a group, without identifying the specifi c indus-tries to which they belong. It is likely, critics will argue, that PSEs are concentrated in industries that are oligopolistic or have entry barriers allowing the PSEs to charge higher prices to the consumer. This, the critics may argue, is the reason for the superior performance of the PSEs.
Figure 4: Manufacturing Firms Return on Capital Employed by Ownership Classification (in %)
15
10
5
0
-5
-10
PVT (NGA-ROCE)
PVT(F)MNC-ROCE
SOE ROCE
BGA-ROCE
1991 1993 1995 1997 1999 2001 2003 2005 2007 2009 2011
Manufacturing
Services
Figure 5: Non-Financial Service Firms ROCE – Public and Private Corporate Sector (in %)
PVT ROCE
SOE ROCE
1991 1993 1995 1997 1999 2001 2003 2005 2007 2009 2011
16
12
8
4
0
-4
Table 4: CPSEs’ Share in Domestic OutputSelected Item Units Domestic Production/ Total Output by CPSEs Share of CPSEs to Output Domestic Output (%)
1998-99 2009-10 1998-99 2009-10 1998-99 2009-10
Coal 1.1 Non-coking coal Mill tonnes 253.326 487.64 223.474 395.509 88.22 81.11
1.2 Coking coal Mill tonnes 44.414 34.455 37.201 27.27 83.76 79.15
Petroleum products Crude oil MMT 32.7 33.5 29.7 28.8 90.8 86
Natural gas BCM 27.4 32.8 24.5 24.7 89.4 75.3
Refineries throughput MMT 68.5 160.8 68.5 112.2 100 69.8
Power generation Thermal GWh 3,53,662 6,40,876 1,35,423 2,64,761 38 41.3
Hydro GWh 82,690 1,06,680 25,339 40,887 31 38.3
Nuclear GWh 12,015 18,636 12,015 18,636 100 100
Telecommunication Wired lines Mill nos 17.8 37 17.8 31.3 100 84.59
Wireless Mill nos 0.9 584.3 0.9 74.5 100 12.75
Fertilisers Nitrogenous Mill mt 1,008.6 1,190 317.6 311.8 31.49 26.2
Phosphetic Mill mt 297.6 432.1 72.6 22.7 24.4 5.25Source: India, DPE, 2011, Public Enterprise Survey 2009-10, New Delhi.
PUBLIC SECTOR
JANUARY 31, 2015 vol l no 5 EPW Economic & Political Weekly56
The fact remains that since 1991, almost all industries have been opened up to private entry, most also to foreign-owned fi rms. In all the sectors, where large PSEs were big players, the private sector now controls signifi cant capacities and output. In sectors like steel and aluminium, PSEs’ output now lags private sector production. In power generation too, private sector now provides for a signifi cant proportion of total power generation, while in petroleum extraction and production as well as in refi ning, private share is above 30% and growing (Table 4, p 55).
In Tables 5, 6 and 7 we compare the unit prices realised by PSEs and private sector companies in the same industry. Such comparisons are likely to be contentious at least in some indus-tries, where product features and quality may vary substan-tially. This could be the case with steel fi rms where product mix can make a difference in realisation. However, in other industries like electricity generation, crude oil or gas produc-tion, or even petroleum refi nery output, such differences are likely to be marginal.
As these three tables show, despite promise of global prices for their output (petroleum, steel, non-ferrous metals, etc) and regulated prices with assured return for the power sector, the SOEs as effi cient suppliers of output at reasonable prices are often the cheapest source of output, acting as a check on the high prices charged by private fi rms in the same industry.
In sectors where all fi rms were mandated to get global prices (metals, petroleum and gas, refi ned products, etc) while private fi rms did realise world prices for their output (e g, crude and gas produced by Reliance Industries and Crain), CPSEs realised substantially lower prices because of the politi-cal economy that prevented petroleum refi ning and marketing companies from being allowed to charge mandated world prices. In sectors like thermal and hydropower, CPSEs were more effi cient in setting up plants and generating their output at peak effi ciency levels so as to realise superior results even under the regulated pricing regime determined by agencies like Central Power Regulatory Authority which capped the prices they could charge the state electricity boards.
To conclude, our analysis shows that the CPSEs have contin-ued to be important drivers of investment and growth. Though the public sector’s share in savings and investment has shrunk to an all-time low, CPSEs (in our terminology, the “public corpo-rate sector”) have actually increased their share in national savings and investment. Rather than be fi nanced by the government’s budget, they have emerged as important contri-butors to public fi nances, as important taxpayers as well as increasing dividend payouts9 (TOI 2014). They account for about a third of stock-market capitalisation and are the main drivers of the fi ve-year plans.
In terms of performance (as measured by return on capital employed), the manufacturing sector fi rms demonstrate a superior performance. In services, they provided for lower or comparable returns to private sector fi rms till 2007-08 and then plunging into large losses, mainly attributed to Air India and BSNL.
What is more, these returns are not due to higher prices charged for undifferentiated products. In almost all sectors, state fi rms provided cheaper aluminium or steel, electricity or refi ned petroleum products. While many (e g, petroleum fi rms) failed to get prices mandated by national policy, their private counterparts realised import parity prices even when they were selling to national oil marketing companies (GoI 2013).
Table 5: Power Generation Firms – Unit Price Realisation (per kwh) Firm and Segment 2003 2004 2005 2006 2007 2008 2009 2010 2011 2012
CPSC/SPSC NTPC 1.46 1.38 1.55 1.66 1.87 2.01 2.18 2.24 2.66
Gujarat Urja Vikas Nigam 2.18 2.42 2.61 3.11 2.90 3.11 3.47
Tamil Nadu Elec Board 2.85 2.88 2.97 2.91 2.90
MHRST State Power G Co 1.67 1.81 1.99 2.44 2.82
Gujarat State Elec Corp 2.01 2.12 2.33 2.74 2.81 3.00
W Bengal Power Dev Corp 1.57 1.57 1.74 1.81 1.75 1.88
A P Power Gen Corp 1.71 1.45 1.35 1.34 1.39 1.85 1.99 1.84
Power Distribution Cos Power Dist Co of AP 3.47 3.87 3.87 1.98 2.48
Bangalore Elec Supply Co 3.69 3.81 3.89 3.18 3.94 4.40 4.47
MHRST State Elec Distribution Co 3.36 3.84 3.62 4.04 4.32 4.66
Private Tata Power Co 5.68 1.06 2.88 1.50
Torrent Power 3.78 3.84 4.36 4.52 4.51 4.97
Adani Power 3.71 3.11
J S W Energy 2.57 2.72 2.69 2.79 3.82 4.48 6.00 4.44 4.45 4.20
Jindal Power 2.21 5.69 5.36
G M R Power Corpn 4.39 4.98 6.18 7.34 7.38 8.44
G V K Industries 2.34 2.50 2.50
Nava Bharat Ventures 2.10 2.35 2.72 2.64 3.26 3.59 4.98 5.19 3.86
G M R Energy 6.09 8.39 18.4 12.6 14.4 8.74 6.60
Avantha Power and Infrastructure 2.39 2.91 2.69 5.73 6.35 6.60
Source: Our computation from CMIEs’ PROWESS database.
Table 6: Price Realisation Per Tonne of Crude PetroleumCompany 2007 2008 2009 2010 2011 2012
CPSE in Rs/tonne ONGC 15,242 16,066 17,129 19,929 19,554 21,998
Oil India Ltd 11,699 13,235 14,468 17,130 17,163 17,991
Private Reliance Industries Ltd 11,258 28,976 37,159 37,700 40,477
Table 7: Steel Firms – Price Realisation/TonneCompany Name (Rs '000/tonne) 2007 2009 2011 2012
Steel Authority of India 31.2 40.8 38.3 42.1
Rashtriya Ispat Nigam 25.8 36.9 35.1 41.8
Tata Steel 32.4 40.6 39.9
Essar Steel India 30.7 39.5 39.4 41.7
J S W Ispat Steel 28.9 40.6 36.8 39.8
Figure 6: Non-Financial Services Firms – ROCE by Ownership (in %)Services
BGA-ROCE
SOE ROCE
1991 1993 1995 1997 1999 2001 2003 2005 2007 2009 2011
50
40
30
20
10
0
-10
-20
NGA_ROCE
MNC-ROCE
PUBLIC SECTOR
Economic & Political Weekly EPW JANUARY 31, 2015 vol l no 5 57
However, as a limitation, our study has not compared CPSEs
with their private sector competitors in the same industry. It is likely that in such a comparison, private fi rms will outperform the CPSEs in profi tability and return on capital, simply given the fact that that our analysis has shown they charge higher prices for their output (and unless they are grossly ineffi cient, should realise higher returns). Where private fi rms are unable to charge higher prices, like in the airlines business, their performance is likely to be as dismal as their public-sector competitors.
Political Economy of Deregulation and the Public Sector
The superior performance of CPSEs and their emergence as important drivers of accumulation and growth in an atmos-phere where neo-liberal ideology strongly shapes the national discourse may look a little surprising to those sold on this ideology. Yet in theory, there is little reason to assume that SOEs will necessarily underperform private fi rms.10
With hindsight, relatively low returns from PSEs in the 1970s
and 1980s (and even in the fi rst half of 1990s) were due to very low product prices fi xed for their output. Often the so-called commercial enterprises were expected to perform a promo-tional role like support growth of handicrafts, exports, exhibi-tions of Indian products, development of backward regions, supporting regional language fi lms, etc. All these “promo-tional” activities obviously would not generate returns. Organ-isations specially meant to facilitate market access to more vulnerable groups should have been (and even today should be) directly supported by budgetary grants. In the absence of such grants, they would obviously show accounting losses, lowering the already low returns of all CPSEs (see various “PSE Annual Surveys”).
Even in sectors like petroleum and power generation – cur-rently the new stars of the stock market – the prices were kept low to subsidise consumers. The petroleum E&P (exploration and production) companies like ONGC and OIL received prices that were unrelated to world prices of crude oil and gas, making investment in offshore exploration risky or un-remunerative (GoI 1996). In petroleum refi ning and marketing, except petrol, almost all products were heavily subsidised. The refi ned product prices in 1995-97 were so low that 45% of profi ts of public sector refi nery/marketing companies’ profi ts came from the only decontrolled product in their portfolio – lubricants.11
With these low prices for refi ned fuels, Indian refi neries realised one of the lowest refi nery margins in the world (often as low as $1-1.25) (GoI 1996). This meant that new refi neries were going to be unviable or have low profi tability.
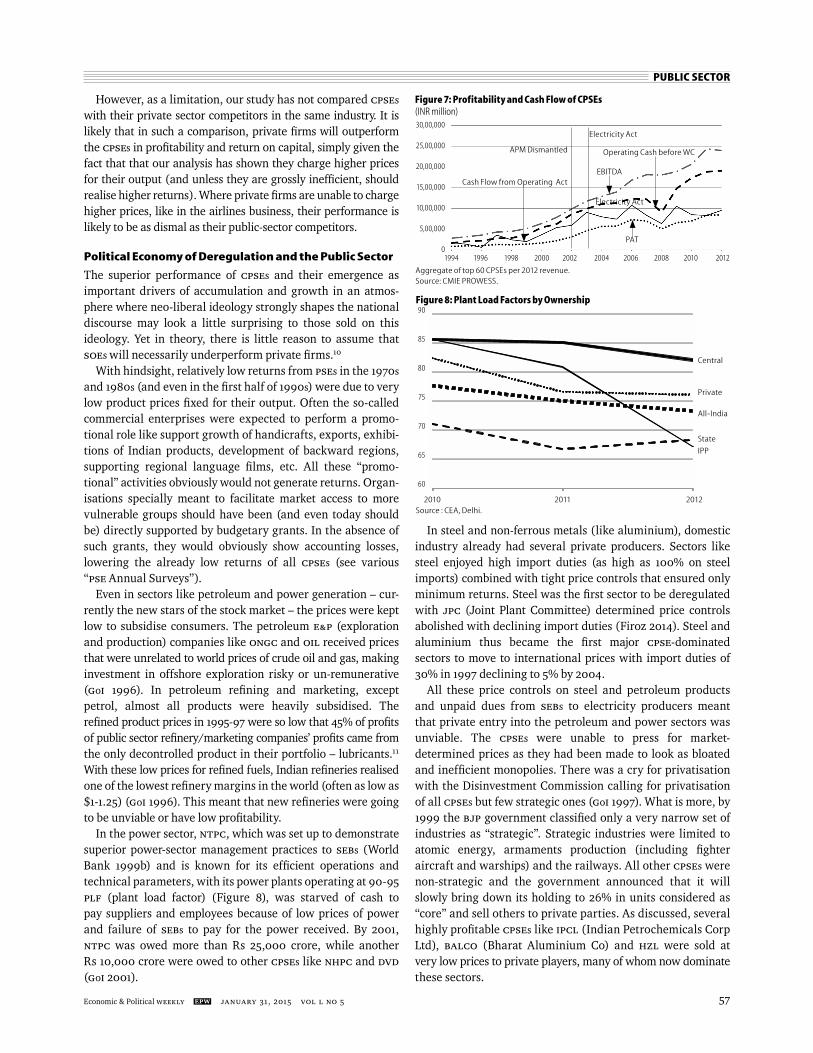
In the power sector, NTPC, which was set up to demonstrate superior power-sector management practices to SEBs (World Bank 1999b) and is known for its effi cient operations and technical parameters, with its power plants operating at 90-95 PLF (plant load factor) (Figure 8), was starved of cash to pay suppliers and employees because of low prices of power and failure of SEBs to pay for the power received. By 2001, NTPC was owed more than Rs 25,000 crore, while another Rs 10,000 crore were owed to other CPSEs like NHPC and DVD
(GoI 2001).
In steel and non-ferrous metals (like aluminium), domestic industry already had several private producers. Sectors like steel enjoyed high import duties (as high as 100% on steel imports) combined with tight price controls that ensured only minimum returns. Steel was the fi rst sector to be deregulated with JPC (Joint Plant Committee) determined price controls abolished with declining import duties (Firoz 2014). Steel and aluminium thus became the fi rst major CPSE-dominated sectors to move to international prices with import duties of 30% in 1997 declining to 5% by 2004.
All these price controls on steel and petroleum products and unpaid dues from SEBs to electricity producers meant that private entry into the petroleum and power sectors was unviable. The CPSEs were unable to press for market-determined prices as they had been made to look as bloated and ineffi cient monopolies. There was a cry for privatisation with the Disinvestment Commission calling for privatisation of all CPSEs but few strategic ones (GoI 1997). What is more, by 1999 the BJP government classifi ed only a very narrow set of industries as “strategic”. Strategic industries were limited to atomic energy, armaments production (including fi ghter aircraft and warships) and the railways. All other CPSEs were non-strategic and the government announced that it will slowly bring down its holding to 26% in units considered as “core” and sell others to private parties. As discussed, several highly profi table CPSEs like IPCL (Indian Petrochemicals Corp Ltd), BALCO (Bharat Aluminium Co) and HZL were sold at very low prices to private players, many of whom now dominate these sectors.
Figure 7: Profitability and Cash Flow of CPSEs (INR million)
EBITDA
1994 1996 1998 2000 2002 2004 2006 2008 2010 2012
30,00,000
25,00,000
20,00,000
15,00,000
10,00,000
5,00,000
0PAT
Cash Flow from Operating Act
Operating Cash before WC
Electricity Act
Electricity Act
APM Dismantled
Aggregate of top 60 CPSEs per 2012 revenue.Source: CMIE PROWESS.
90
85
80
75
70
65
60
Figure 8: Plant Load Factors by Ownership
Source : CEA, Delhi.
Central
Private
All-India
State
IPP
2010 2011 2012
PUBLIC SECTOR
JANUARY 31, 2015 vol l no 5 EPW Economic & Political Weekly58
With the announcement of the phasing out of the Adminis-tered Pricing Mechanism (APM) for petroleum products and the New Exploration Licensing Policy (NELP), all private and public sector producers were promised import (or trade) parity prices and refi nery gate prices to follow import price parity (IPP) norms. As the government failed to fully deregulate fi nal prices to consumers, the defi cit was borne by CPSE oil market-ing companies (OMCs) and later E&P companies were asked to share the burden of the oil marketing CPSEs. This has meant that where IPP worked (in petroleum and gas production), there has been partial private entry. Though private petroleum E&P companies like Reliance and Cairns get global prices for their output, CPSE E&P companies are forced to transfer their large surpluses to defi cit OMCs. With the result E&P companies have been getting about $56 per barrel of oil, while private players get above 100 dollars a barrel. However, with prices still regulated, private refi ners like Reliance and Essar have chosen to export their output and have withdrawn from marketing (GoI 2009).
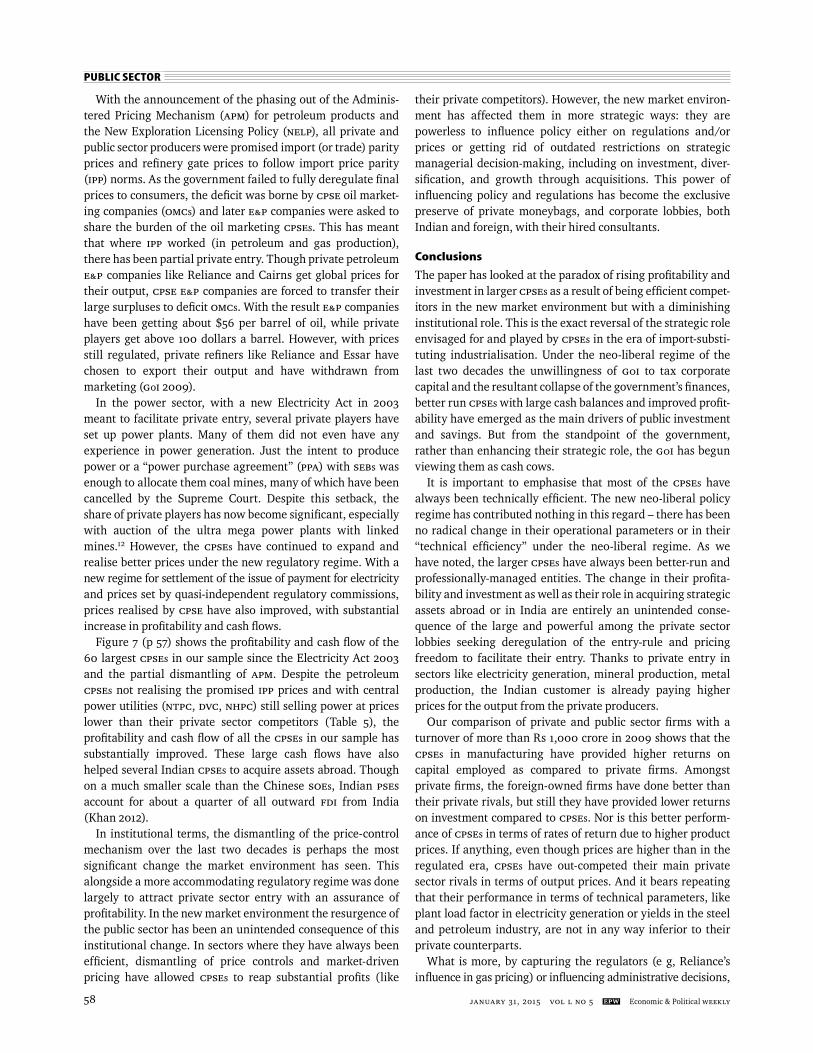
In the power sector, with a new Electricity Act in 2003 meant to facilitate private entry, several private players have set up power plants. Many of them did not even have any experience in power generation. Just the intent to produce power or a “power purchase agreement” (PPA) with SEBs was enough to allocate them coal mines, many of which have been cancelled by the Supreme Court. Despite this setback, the share of private players has now become signifi cant, especially with auction of the ultra mega power plants with linked mines.12 However, the CPSEs have continued to expand and realise better prices under the new regulatory regime. With a new regime for settlement of the issue of payment for electricity and prices set by quasi-independent regulatory commissions, prices realised by CPSE have also improved, with substantial increase in profi tability and cash fl ows.
Figure 7 (p 57) shows the profi tability and cash fl ow of the 60 largest CPSEs in our sample since the Electricity Act 2003 and the partial dismantling of APM. Despite the petroleum CPSEs not realising the promised IPP prices and with central power utilities (NTPC, DVC, NHPC) still selling power at prices lower than their private sector competitors (Table 5), the profi tability and cash fl ow of all the CPSEs in our sample has substantially improved. These large cash fl ows have also helped several Indian CPSEs to acquire assets abroad. Though on a much smaller scale than the Chinese SOEs, Indian PSEs account for about a quarter of all outward FDI from India (Khan 2012).
In institutional terms, the dismantling of the price-control mechanism over the last two decades is perhaps the most signifi cant change the market environment has seen. This alongside a more accommodating regulatory regime was done largely to attract private sector entry with an assurance of profi tability. In the new market environment the resurgence of the public sector has been an unintended consequence of this institutional change. In sectors where they have always been effi cient, dismantling of price controls and market-driven pricing have allowed CPSEs to reap substantial profi ts (like
their private competitors). However, the new market environ-ment has affected them in more strategic ways: they are powerless to infl uence policy either on regulations and/or prices or getting rid of outdated restrictions on strategic managerial decision-making, including on investment, diver-sifi cation, and growth through acquisitions. This power of infl uencing policy and regulations has become the exclusive preserve of private moneybags, and corporate lobbies, both Indian and foreign, with their hired consultants.
Conclusions
The paper has looked at the paradox of rising profi tability and investment in larger CPSEs as a result of being effi cient compet-itors in the new market environment but with a diminishing institutional role. This is the exact reversal of the strategic role envisaged for and played by CPSEs in the era of import-substi-tuting industrialisation. Under the neo-liberal regime of the last two decades the unwillingness of GOI to tax corporate capital and the resultant collapse of the government’s fi nances, better run CPSEs with large cash balances and improved profi t-ability have emerged as the main drivers of public investment and savings. But from the standpoint of the government, rather than enhancing their strategic role, the GOI has begun viewing them as cash cows.
It is important to emphasise that most of the CPSEs have always been technically effi cient. The new neo-liberal policy regime has contributed nothing in this regard – there has been no radical change in their operational parameters or in their “technical effi ciency” under the neo-liberal regime. As we have noted, the larger CPSEs have always been better-run and professionally-managed entities. The change in their profi ta-bility and investment as well as their role in acquiring strategic assets abroad or in India are entirely an unintended conse-quence of the large and powerful among the private sector lobbies seeking deregulation of the entry-rule and pricing freedom to facilitate their entry. Thanks to private entry in sectors like electricity generation, mineral production, metal production, the Indian customer is already paying higher prices for the output from the private producers.
Our comparison of private and public sector fi rms with a turnover of more than Rs 1,000 crore in 2009 shows that the CPSEs in manufacturing have provided higher returns on capital employed as compared to private fi rms. Amongst private fi rms, the foreign-owned fi rms have done better than their private rivals, but still they have provided lower returns on investment compared to CPSEs. Nor is this better perform-ance of CPSEs in terms of rates of return due to higher product prices. If anything, even though prices are higher than in the regulated era, CPSEs have out-competed their main private sector rivals in terms of output prices. And it bears repeating that their performance in terms of technical parameters, like plant load factor in electricity generation or yields in the steel and petroleum industry, are not in any way inferior to their private counterparts.
What is more, by capturing the regulators (e g, Reliance’s infl uence in gas pricing) or infl uencing administrative decisions,
PUBLIC SECTOR
Economic & Political Weekly EPW JANUARY 31, 2015 vol l no 5 59
private sector rivals were able to prevent both Air India and BSNL from adding to capacity, thus allowing the private rivals to capture the expanding market (Bhargava 2013).
Yet despite the heroic performance of the Maharatna and Navratna CPSEs, and the large dividends given by them, exceeding Rs 45,000 crore, to central government in 2013-14 (TOI 2014), the entire discussion in the pink press is how much the government can earn through selling the equity shares of the CPSEs. The Modi government intends to show its “effi ciency” by accelerating the sell-off of these CPSEs or their shares, a decision which lacks both strategic and business sense and is purely ideological.
Given such an ideological onslaught, often based on misrep-resentation of facts about CPSEs, the future of PSEs in India is bleak as they are unable to argue for their interests in the face of private lobbies. In contrast, private players are able to infl u-ence and shape public policy and capture regulators, often reneging on their commitments.
But all this would have mattered much less had private big business in India developed and enhanced the economy’s
technological capabilities. Recurrent current account defi cits and the pressures they exert on the macroeconomy are in large part, though not entirely, the result of this technological defi cit. And CPSEs were set up in part to make good this defi cit and may well have delivered had it not been for the changed policy paradigm. However, the neo-liberal policies pursued by both the Congress- and BJP-led governments have completely lost sight of this major strategic role to PSEs. This is particularly amazing and disappointing given the strategic role Chinese SOEs have successfully played in China’s policy of seeking technological independence, or in acquisition of essential raw materials (Xu 2012). Indian policymakers have not seen it important to give CPSEs this crucial strategic role despite the private sector’s demonstrated inability to meet the challenge.
There is a glimmer of hope in the exposure of the crony capitalism that has played a role in the change of government in Delhi. What role CPSEs will ultimately play in India’s attempt to forge an independent path of industrial development will depend on the outcome of the struggle to shape India’s political economy.
Notes
1 Business Standard, “Privatisation: 79 Sick PSUs Wait for Jaitley’s Next Move”, 7 November 2014, Mumbai.
2 Business Standard, “Cabinet Clears Road for CIWTC Sale”, 25 December 2014, New Delhi.
3 The Voluntary Retirement Scheme in Indian PSEs was entirely voluntary. If employees re-fused to accept the several severance packages and continue with their employment contract, they would be retrenched. However, the sala-ries and wages in loss-making PSEs were not revised. Many skilled workers, who could fi nd jobs in the private sector, left the PSEs.
4 By 2008 there were fi ve “Maha-Ratnas” (Great Jewels) with power to invest up to Rs 50 bil-lion, 16 “Navratnas” (New Jewels) with power to invest up to Rs 25 billion, and 66 “Mini- Ratnas” (Small Jewels) with lower powers. See Indian Department of Public Enterprises, web-site at http://dpe.nic. in/newsite/navmini.htm
5 For example, in February 2003, a speaker from the global consulting firm Deloitte noted a “growing political opposition to privatisation in emerging markets due to widespread per-ception that it does not serve the interests of the population at large”, which it attributed to a number of features of privatisation: “Pres-sures to increase tariffs and cut off non-payers; loss of jobs of vocal union members that will be hard to retrain; [and] the perception that only special interests are served – privatisation is seen as serving oligarchic domestic and foreign interests that profit at the expense of the country...”. (Hall, Lobina and de la Motte 2005, pp 287-88). India was part of the survey.
6 We defi ne the “Public Corporate Sector” to comprise all enterprises, registered under the Companies Act, parallel to the defi nition used by CSO for the “Private Corporate Sector” in National Accounts. The national accounts de-fi ne them as “Non-departmental Commercial Undertakings”, though as discussed above, not all are strictly commercial as they serve a mere promotional role.
7 Simultaneously it must be noted, that the pri-vate corporate sector has expanded its savings by 39 times over the period, 1991-2011.
8 DPE, “Metamorphosis: Turnaround Stories of CPSUs”, New Delhi, 2012.
9 The fi nance minister could extract more than Rs 1,00,000 crore from CPSEs. To quote The Times of India: “Though the budget has esti-mated the total dividend and profi t earning from public sector enterprises and other investments at Rs 91,630 crore the government was able to persuade them to shell out Rs 1,09,205 crore which was Rs 17,107 crore more than budgeted amount” (TOI 2014).
10 For an excellent review of the debate on privati-sation and ineffi ciency of public sector enterprises, see Ram Mohan (2005), especially Chapter 2.
11 Interview with Marketing Director, Indian Oil, April 1998.
12 The UMPP were auctioned with several private players like Tata Power and Reliance out-bid-ding public sector players like NTPC. Yet once the plants were ready, under several pretexts, private players have declared their inability to meet the condition of cheap power on grounds that coal prices have risen making their plants unviable. These private sector companies have been successful in getting tariff revised from CERC despite signing of memorandum of un-derstanding (MoU) with state utilities for long-term supply contracts. The concept of achiev-ing low tariffs through competitive bidding in Ultra Mega Power Projects (UMPP) has been completely defeated by changes in the terms of reference after award of contract by giving various concessions to successful bidders. Today their power is substantially more expen-sive than PSE units like NTPC.
References
Ahluwalia, I J, Rakesh Mohan and O Goswami (1997): Policy Reform in India (New Delhi: Ox-ford & IBH).
Alavi, Hamza (1972): “The State in Post-Colonial Societies: Pakistan and Bangladesh”, New Left Review.
Bhagwati, J N and P Desai (1970): India: Planning for Industrialisation (Paris: OECD).
Bhagwati, J N, T N Srinivasan and V Panchamukhi (1975): “Static Allocational and Effi ciency Impact on Growth” in J N Bhagwati and T N Srinivasan (ed.), Foreign Trade Regimes and Economic Development: India (New York: National Bureau of Economic Research).
Bhagwati, J N and T N Srinivasan (1993): India’s Economic Reforms (New Delhi: Ministry of Finance).
Bhandari, L and O Goswami (2000): “So Many Lost Years: The Public Sector Before and After Reforms”, NCAER, New Delhi.
Bhargava, J (2013): Descent of Air India (New Delhi: Bloomsbury Publishing).
Business Standard (2014): “Adani, Tata Get APTEL Nod for Rs 43,500-crore Boost”, 22 July (inter-net edition).
Chandra, N K (2004): “Relevance of Soviet Eco-nomic Model for Non-socialist Countries”, Eco-nomic & Political Weekly, 29 May.
– (2013): “Appraising Industrial Policies of India and China from Two Perspectives: Nationalist and Internationalist” in A K Bagchi and A D’Costa (ed.), Transformation and Develop-ment: The Political Economy of Transition in India and China (New Delhi: Oxford University Press).
Chandrasekhar, C P (1992): “Investment Behaviour, Economies of Scale and Effi ciency in an Import-Substituting Regime: A Study of Two Industries” in A Ghosh, K K Subrahmanian, M Eapen and H Drabu (ed.), Indian Industriali-sation: Structure and Policy Issues (New Delhi: Oxford University Press).
– (2013): “The Public Sector Cash Pile”, The Hindu, 28 March, Chennai.
Chakravarty, Sukhamoy (1987): Development Plan-ning: the Indian Experience (Oxford: Clarendon Press).
Chaudhuri, Pramit (1978): Indian Economy: Poverty and Development (London: Palgrave Macmillan).
Chaudhuri, Sudip (1994): “Public Enterprises and Private Purposes”, Economic & Political Weekly, 28 May.
Chaudhuri, S (2006): The WTO And India’s Phar-maceuticals Industry: Patent Protection, TRIPS, and Developing Countries (New Delhi: OUP).
Chattopadhyay, R (1987): “An Early British Govern-ment Initiative in the Genesis of Indian Plan-ning”, Economic & Political Weekly, 31 January.
Dhameja, Nand (2006): “Public Sector Disinvest-ment in India: Process and Policy: Changing Scenario”, Vision, Management Development Institute, Gurgaon.
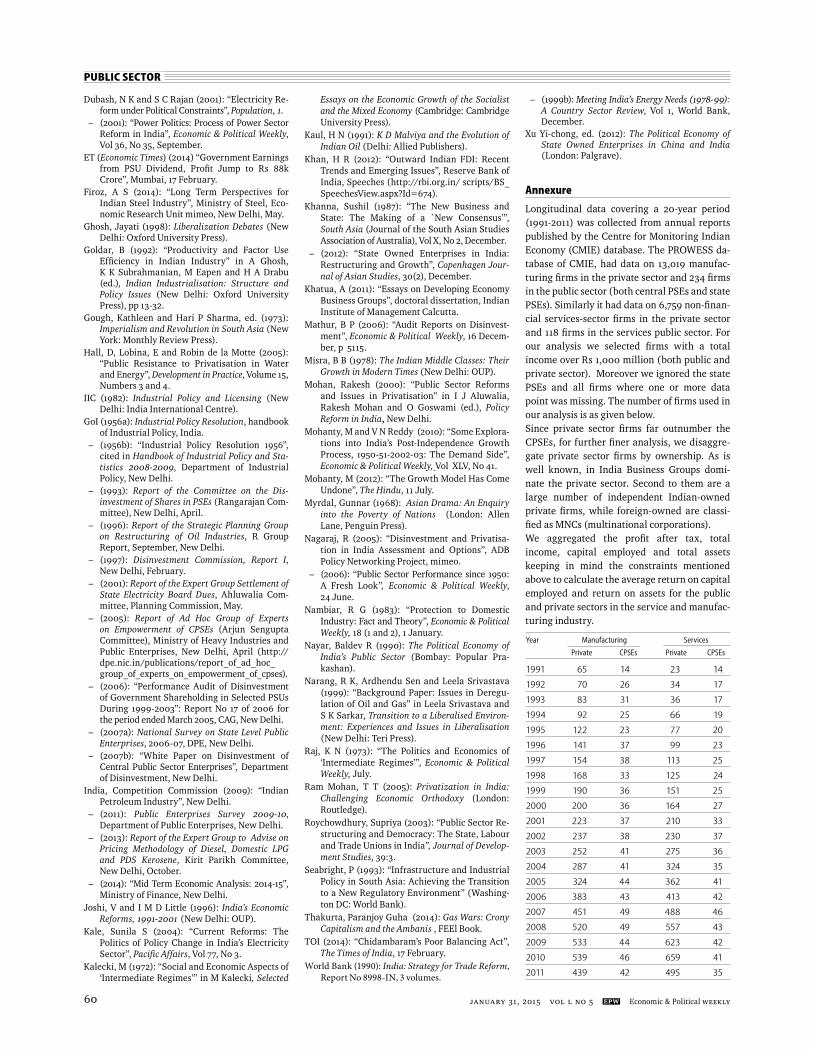
PUBLIC SECTOR
JANUARY 31, 2015 vol l no 5 EPW Economic & Political Weekly60
Dubash, N K and S C Rajan (2001): “Electricity Re-form under Political Constraints”, Population, 1.
– (2001): “Power Politics: Process of Power Sector Reform in India”, Economic & Political Weekly, Vol 36, No 35, September.
ET (Economic Times) (2014) “Government Earnings from PSU Dividend, Profi t Jump to Rs 88k Crore”, Mumbai, 17 February.
Firoz, A S (2014): “Long Term Perspectives for Indian Steel Industry”, Ministry of Steel, Eco-nomic Research Unit mimeo, New Delhi, May.
Ghosh, Jayati (1998): Liberalization Debates (New Delhi: Oxford University Press).
Goldar, B (1992): “Productivity and Factor Use Effi ciency in Indian Industry” in A Ghosh, K K Subrahmanian, M Eapen and H A Drabu (ed.), Indian Industrialisation: Structure and Policy Issues (New Delhi: Oxford University Press), pp 13-32.
Gough, Kathleen and Hari P Sharma, ed. (1973): Imperialism and Revolution in South Asia (New York: Monthly Review Press).
Hall, D, Lobina, E and Robin de la Motte (2005): “Public Resistance to Privatisation in Water and Energy”, Development in Practice, Volume 15, Numbers 3 and 4.
IIC (1982): Industrial Policy and Licensing (New Delhi: India International Centre).
GoI (1956a): Industrial Policy Resolution, handbook of Industrial Policy, India.
– (1956b): “Industrial Policy Resolution 1956”, cited in Handbook of Industrial Policy and Sta-tistics 2008-2009, Department of Industrial Policy, New Delhi.
– (1993): Report of the Committee on the Dis-investment of Shares in PSEs (Rangarajan Com-mittee), New Delhi, April.
– (1996): Report of the Strategic Planning Group on Restructuring of Oil Industries, R Group Report, September, New Delhi.
– (1997): Disinvestment Commission, Report I, New Delhi, February.
– (2001): Report of the Expert Group Settlement of State Electricity Board Dues, Ahluwalia Com-mittee, Planning Commission, May.
– (2005): Report of Ad Hoc Group of Experts on Empowerment of CPSEs (Arjun Sengupta Committee), Ministry of Heavy Industries and Public Enterprises, New Delhi, April (http://dpe.nic.in/publications/report_of_ad_hoc_group_of_experts_on_empowerment_of_cpses).
– (2006): “Performance Audit of Disinvestment of Government Shareholding in Selected PSUs During 1999-2003”: Report No 17 of 2006 for the period ended March 2005, CAG, New Delhi.
– (2007a): National Survey on State Level Public Enterprises, 2006-07, DPE, New Delhi.
– (2007b): “White Paper on Disinvestment of Central Public Sector Enterprises”, Department of Disinvestment, New Delhi.
India, Competition Commission (2009): “Indian Petroleum Industry”, New Delhi.
– (2011): Public Enterprises Survey 2009-10, Department of Public Enterprises, New Delhi.
– (2013): Report of the Expert Group to Advise on Pricing Methodology of Diesel, Domestic LPG and PDS Kerosene, Kirit Parikh Committee, New Delhi, October.
– (2014): “Mid Term Economic Analysis: 2014-15”, Ministry of Finance, New Delhi.
Joshi, V and I M D Little (1996): India’s Economic Reforms, 1991-2001 (New Delhi: OUP).
Kale, Sunila S (2004): “Current Reforms: The Politics of Policy Change in India’s Electricity Sector”, Pacifi c Affairs, Vol 77, No 3.
Kalecki, M (1972): “Social and Economic Aspects of ‘Intermediate Regimes’” in M Kalecki, Selected
Essays on the Economic Growth of the Socialist and the Mixed Economy (Cambridge: Cambridge University Press).
Kaul, H N (1991): K D Malviya and the Evolution of Indian Oil (Delhi: Allied Publishers).
Khan, H R (2012): “Outward Indian FDI: Recent Trends and Emerging Issues”, Reserve Bank of India, Speeches (http://rbi.org.in/ scripts/BS_SpeechesView.aspx?Id=674).
Khanna, Sushil (1987): “The New Business and State: The Making of a `New Consensus’”, South Asia (Journal of the South Asian Studies Association of Australia), Vol X, No 2, December.
– (2012): “State Owned Enterprises in India: Restructuring and Growth”, Copenhagen Jour-nal of Asian Studies, 30(2), December.
Khatua, A (2011): “Essays on Developing Economy Business Groups”, doctoral dissertation, Indian Institute of Management Calcutta.
Mathur, B P (2006): “Audit Reports on Disinvest-ment”, Economic & Political Weekly, 16 Decem-ber, p 5115.
Misra, B B (1978): The Indian Middle Classes: Their Growth in Modern Times (New Delhi: OUP).
Mohan, Rakesh (2000): “Public Sector Reforms and Issues in Privatisation” in I J Aluwalia, Rakesh Mohan and O Goswami (ed.), Policy Reform in India, New Delhi.
Mohanty, M and V N Reddy (2010): “Some Explora-tions into India’s Post-Independence Growth Process, 1950-51-2002-03: The Demand Side”, Economic & Political Weekly, Vol XLV, No 41.
Mohanty, M (2012): “The Growth Model Has Come Undone”, The Hindu, 11 July.
Myrdal, Gunnar (1968): Asian Drama: An Enquiry into the Poverty of Nations (London: Allen Lane, Penguin Press).
Nagaraj, R (2005): “Disinvestment and Privatisa-tion in India Assessment and Options”, ADB Policy Networking Project, mimeo.
– (2006): “Public Sector Performance since 1950: A Fresh Look”, Economic & Political Weekly, 24 June.
Nambiar, R G (1983): “Protection to Domestic Industry: Fact and Theory”, Economic & Political Weekly, 18 (1 and 2), 1 January.
Nayar, Baldev R (1990): The Political Economy of India’s Public Sector (Bombay: Popular Pra-kashan).
Narang, R K, Ardhendu Sen and Leela Srivastava (1999): “Background Paper: Issues in Deregu-lation of Oil and Gas” in Leela Srivastava and S K Sarkar, Transition to a Liberalised Environ-ment: Experiences and Issues in Liberalisation (New Delhi: Teri Press).
Raj, K N (1973): “The Politics and Economics of ‘Intermediate Regimes’”, Economic & Political Weekly, July.
Ram Mohan, T T (2005): Privatization in India: Challenging Economic Orthodoxy (London: Routledge).
Roychowdhury, Supriya (2003): “Public Sector Re-structuring and Democracy: The State, Labour and Trade Unions in India”, Journal of Develop-ment Studies, 39:3.
Seabright, P (1993): “Infrastructure and Industrial Policy in South Asia: Achieving the Transition to a New Regulatory Environment” (Washing-ton DC: World Bank).
Thakurta, Paranjoy Guha (2014): Gas Wars: Crony Capitalism and the Ambanis , FEEl Book.
TOI (2014): “Chidambaram’s Poor Balancing Act”, The Times of India, 17 February.
World Bank (1990): India: Strategy for Trade Reform, Report No 8998-IN, 3 volumes.
– (1999b): Meeting India’s Energy Needs (1978-99): A Country Sector Review, Vol 1, World Bank, December.
Xu Yi-chong, ed. (2012): The Political Economy of State Owned Enterprises in China and India (London: Palgrave).
Annexure
Longitudinal data covering a 20-year period (1991-2011) was collected from annual reports published by the Centre for Monitoring Indian Economy (CMIE) database. The PROWESS da-tabase of CMIE, had data on 13,019 manufac-turing fi rms in the private sector and 234 fi rms in the public sector (both central PSEs and state PSEs). Similarly it had data on 6,759 non-fi nan-cial services-sector fi rms in the private sector and 118 fi rms in the services public sector. For our analysis we selected fi rms with a total income over Rs 1,000 million (both public and private sector). Moreover we ignored the state PSEs and all fi rms where one or more data point was missing. The number of fi rms used in our analysis is as given below. Since private sector fi rms far outnumber the CPSEs, for further fi ner analysis, we disaggre-gate private sector fi rms by ownership. As is well known, in India Business Groups domi-nate the private sector. Second to them are a large number of independent Indian-owned private fi rms, while foreign-owned are classi-fi ed as MNCs (multinational corporations).We aggregated the profi t after tax, total income, capital employed and total assets keeping in mind the constraints mentioned above to calculate the average return on capital employed and return on assets for the public and private sectors in the service and manufac-turing industry.
Year Manufacturing Services
Private CPSEs Private CPSEs
1991 65 14 23 14
1992 70 26 34 17
1993 83 31 36 17
1994 92 25 66 19
1995 122 23 77 20
1996 141 37 99 23
1997 154 38 113 25
1998 168 33 125 24
1999 190 36 151 25
2000 200 36 164 27
2001 223 37 210 33
2002 237 38 230 37
2003 252 41 275 36
2004 287 41 324 35
2005 324 44 362 41
2006 383 43 413 42
2007 451 49 488 46
2008 520 49 557 43
2009 533 44 623 42
2010 539 46 659 41
2011 439 42 495 35
Related Documents